
Global Expression Profiling in Atopic Eczema Reveals Reciprocal Expression of Inflammatory and Lipid...
15
Global Expression Profiling in Atopic Eczema Reveals Reciprocal Expression of Inflammatory and Lipid Genes Annika M. Sa ¨a ¨f 1 *, Maria Tengvall-Linder 2 , Howard Y. Chang 3 , Adam S. Adler 3 , Carl-Fredrik Wahlgren 4 , Annika Scheynius 2 , Magnus Nordenskjo ¨ ld 1 , Maria Bradley 1,4 1 Department of Molecular Medicine and Surgery, Karolinska Institutet, Stockholm, Sweden, 2 Department of Medicine Solna, Clinical Allergy Research Unit, Karolinska Institutet, Stockholm, Sweden, 3 Programs in Epithelial Biology and Cancer Biology, Stanford University School of Medicine, Stanford, California, United States of America, 4 Department of Medicine Solna, Dermatology Unit, Karolinska Institutet, Stockholm, Sweden Abstract Background: Atopic eczema (AE) is a common chronic inflammatory skin disorder. In order to dissect the genetic background several linkage and genetic association studies have been performed. Yet very little is known about specific genes involved in this complex skin disease, and the underlying molecular mechanisms are not fully understood. Methodology/Findings: We used human DNA microarrays to identify a molecular picture of the programmed responses of the human genome to AE. The transcriptional program was analyzed in skin biopsy samples from lesional and patch-tested skin from AE patients sensitized to Malassezia sympodialis (M. sympodialis), and corresponding biopsies from healthy individuals. The most notable feature of the global gene-expression pattern observed in AE skin was a reciprocal expression of induced inflammatory genes and repressed lipid metabolism genes. The overall transcriptional response in M. sympodialis patch-tested AE skin was similar to the gene-expression signature identified in lesional AE skin. In the constellation of genes differentially expressed in AE skin compared to healthy control skin, we have identified several potential susceptibility genes that may play a critical role in the pathological condition of AE. Many of these genes, including genes with a role in immune responses, lipid homeostasis, and epidermal differentiation, are localized on chromosomal regions previously linked to AE. Conclusions/Significance: Through genome-wide expression profiling, we were able to discover a distinct reciprocal expression pattern of induced inflammatory genes and repressed lipid metabolism genes in skin from AE patients. We found a significant enrichment of differentially expressed genes in AE with cytobands associated to the disease, and furthermore new chromosomal regions were found that could potentially guide future region-specific linkage mapping in AE. The full data set is available at http://microarray-pubs.stanford.edu/eczema. Citation: Sa ¨a ¨ f AM, Tengvall-Linder M, Chang HY, Adler AS, Wahlgren C-F, et al. (2008) Global Expression Profiling in Atopic Eczema Reveals Reciprocal Expression of Inflammatory and Lipid Genes. PLoS ONE 3(12): e4017. doi:10.1371/journal.pone.0004017 Editor: Ben Lehner, Centre for Genomic Regulation, Spain Received September 19, 2008; Accepted November 18, 2008; Published December 24, 2008 Copyright: ß 2008 Sa ¨a ¨f et al. This is an open-access article distributed under the terms of the Creative Commons Attribution License, which permits unrestricted use, distribution, and reproduction in any medium, provided the original author and source are credited. Funding: This work was supported by the Swedish Research Council ‘‘Vetenskapsra ˚det’’ (A.S), the U.S. National Eczema Association for Science and Education, the Edward Welander-Finsen Foundation, the Swedish Asthma and Allergy Association and through the regional agreement on medical training and clinical research (ALF) between the Stockholm County Council and Karolinska Institutet. The funders had no role in study design, data collection and analysis, decision to publish, or preparation of the manuscript. Competing Interests: The authors have declared that no competing interests exist. * E-mail: [email protected] Introduction Atopic eczema (AE) (OMIM#603165) is a common skin disorder currently affecting 10–20% of children and 1–3% of adults in westernized countries [1,2]. Patients with AE suffer from itchy, dry and inflamed skin, often in combination with other atopic manifestations such as allergic asthma and allergic rhinoconjuncti- vitis. Twin studies indicate a strong genetic contribution in the development of AE [3,4], and to date four genome-wide linkage studies have been performed in Caucasian populations identifying several chromosomal regions linked to AE susceptibility [5–8]. However, a complete genomic picture of this complex disorder still remains to be defined, and importantly specific genes involved in the pathogenesis of AE have to be identified. Over the past decades, much research has been focused on advancing the knowledge about the role and action of immune competent cells and inflammatory molecules in AE pathogenesis. Activated T-helper cells, eosinophils, macrophages and mast cells are often found in AE skin [9,10]. In addition, there is an imbalance between T H 1 and T H 2 cells giving an increase in production of a T H 2 cytokine profile, at least in the early phases of the disease [11]. A network of cytokines/chemokines and their receptors that is characteristically expressed in patients with AE has been identified [12,13]. However, it is still not clear whether the inflammatory response found in AE skin is a primary basic cause of the disease, or if it is a secondary effect caused by other factors such as an impaired skin barrier. The importance of an impaired epidermal differentiation process and skin barrier dysfunction in the pathogenesis of AE has recently been emphasized when a set of so-called ‘‘epidermal differentiation genes’’, including S100A7, S100A8, loricrin and filaggrin (FLG), was found to be differentially expressed in AE patients compared to healthy control individuals [14]. In addition, genetic association studies have identified FLG to be a suscepti- PLoS ONE | www.plosone.org 1 December 2008 | Volume 3 | Issue 12 | e4017
Transcript of Global Expression Profiling in Atopic Eczema Reveals Reciprocal Expression of Inflammatory and Lipid...

Global Expression Profiling in Atopic Eczema RevealsReciprocal Expression of Inflammatory and Lipid GenesAnnika M. Saaf1*, Maria Tengvall-Linder2, Howard Y. Chang3, Adam S. Adler3, Carl-Fredrik Wahlgren4,
Annika Scheynius2, Magnus Nordenskjold1, Maria Bradley1,4
1 Department of Molecular Medicine and Surgery, Karolinska Institutet, Stockholm, Sweden, 2 Department of Medicine Solna, Clinical Allergy Research Unit, Karolinska
Institutet, Stockholm, Sweden, 3 Programs in Epithelial Biology and Cancer Biology, Stanford University School of Medicine, Stanford, California, United States of America,
4 Department of Medicine Solna, Dermatology Unit, Karolinska Institutet, Stockholm, Sweden
Abstract
Background: Atopic eczema (AE) is a common chronic inflammatory skin disorder. In order to dissect the geneticbackground several linkage and genetic association studies have been performed. Yet very little is known about specificgenes involved in this complex skin disease, and the underlying molecular mechanisms are not fully understood.
Methodology/Findings: We used human DNA microarrays to identify a molecular picture of the programmed responses ofthe human genome to AE. The transcriptional program was analyzed in skin biopsy samples from lesional and patch-testedskin from AE patients sensitized to Malassezia sympodialis (M. sympodialis), and corresponding biopsies from healthyindividuals. The most notable feature of the global gene-expression pattern observed in AE skin was a reciprocal expressionof induced inflammatory genes and repressed lipid metabolism genes. The overall transcriptional response in M. sympodialispatch-tested AE skin was similar to the gene-expression signature identified in lesional AE skin. In the constellation of genesdifferentially expressed in AE skin compared to healthy control skin, we have identified several potential susceptibility genesthat may play a critical role in the pathological condition of AE. Many of these genes, including genes with a role in immuneresponses, lipid homeostasis, and epidermal differentiation, are localized on chromosomal regions previously linked to AE.
Conclusions/Significance: Through genome-wide expression profiling, we were able to discover a distinct reciprocalexpression pattern of induced inflammatory genes and repressed lipid metabolism genes in skin from AE patients. Wefound a significant enrichment of differentially expressed genes in AE with cytobands associated to the disease, andfurthermore new chromosomal regions were found that could potentially guide future region-specific linkage mapping inAE. The full data set is available at http://microarray-pubs.stanford.edu/eczema.
Citation: Saaf AM, Tengvall-Linder M, Chang HY, Adler AS, Wahlgren C-F, et al. (2008) Global Expression Profiling in Atopic Eczema Reveals Reciprocal Expressionof Inflammatory and Lipid Genes. PLoS ONE 3(12): e4017. doi:10.1371/journal.pone.0004017
Editor: Ben Lehner, Centre for Genomic Regulation, Spain
Received September 19, 2008; Accepted November 18, 2008; Published December 24, 2008
Copyright: � 2008 Saaf et al. This is an open-access article distributed under the terms of the Creative Commons Attribution License, which permits unrestricteduse, distribution, and reproduction in any medium, provided the original author and source are credited.
Funding: This work was supported by the Swedish Research Council ‘‘Vetenskapsradet’’ (A.S), the U.S. National Eczema Association for Science and Education,the Edward Welander-Finsen Foundation, the Swedish Asthma and Allergy Association and through the regional agreement on medical training and clinicalresearch (ALF) between the Stockholm County Council and Karolinska Institutet. The funders had no role in study design, data collection and analysis, decision topublish, or preparation of the manuscript.
Competing Interests: The authors have declared that no competing interests exist.
* E-mail: [email protected]
Introduction
Atopic eczema (AE) (OMIM#603165) is a common skin disorder
currently affecting 10–20% of children and 1–3% of adults in
westernized countries [1,2]. Patients with AE suffer from itchy, dry
and inflamed skin, often in combination with other atopic
manifestations such as allergic asthma and allergic rhinoconjuncti-
vitis. Twin studies indicate a strong genetic contribution in the
development of AE [3,4], and to date four genome-wide linkage
studies have been performed in Caucasian populations identifying
several chromosomal regions linked to AE susceptibility [5–8].
However, a complete genomic picture of this complex disorder still
remains to be defined, and importantly specific genes involved in the
pathogenesis of AE have to be identified.
Over the past decades, much research has been focused on
advancing the knowledge about the role and action of immune
competent cells and inflammatory molecules in AE pathogenesis.
Activated T-helper cells, eosinophils, macrophages and mast cells
are often found in AE skin [9,10]. In addition, there is an
imbalance between TH1 and TH2 cells giving an increase in
production of a TH2 cytokine profile, at least in the early phases of
the disease [11]. A network of cytokines/chemokines and their
receptors that is characteristically expressed in patients with AE
has been identified [12,13]. However, it is still not clear whether
the inflammatory response found in AE skin is a primary basic
cause of the disease, or if it is a secondary effect caused by other
factors such as an impaired skin barrier.
The importance of an impaired epidermal differentiation
process and skin barrier dysfunction in the pathogenesis of AE
has recently been emphasized when a set of so-called ‘‘epidermal
differentiation genes’’, including S100A7, S100A8, loricrin and
filaggrin (FLG), was found to be differentially expressed in AE
patients compared to healthy control individuals [14]. In addition,
genetic association studies have identified FLG to be a suscepti-
PLoS ONE | www.plosone.org 1 December 2008 | Volume 3 | Issue 12 | e4017

bility gene for AE, further supporting the importance of epidermal
differentiation genes in AE (reviewed in [15]). An impaired skin
barrier function in AE patients may also be an effect of changes in
the lipid composition [16,17]. However, the precise role of various
molecules and a detailed underlying mechanism to skin barrier
dysfunction in AE patients is still far from understood.
AE results from a complex interplay between genetic and
environmental factors. For example, it is known that allergens such
as house dust mite and bacteria such as staphylococci are
aggravating factors in AE [9,18]. Members of the lipophilic
Malassezia yeast family are part of the normal microflora on
human skin. However, Malassezia has been associated with AE and
other skin diseases such as seborrhoeic dermatitis and pityriasis
versicolor [19]. Malassezia-specific IgE antibodies are often found
in adult AE patients, but not in other allergic diseases or among
healthy individuals [20]. Application of Malassezia sympodialis (M.
sympodialis) extract on non-lesional skin of AE patients, referred to
as an atopy patch test (APT), triggers immunological changes in
the skin similar to acute lesional eczema [19,21,22]. It is unknown
why AE patients are hypersensitive to M. sympodialis, nor is it
known if M. sympodialis has a major effect on transcript levels in
eczema skin.
In this study, we used cDNA microarrays representing
approximately 24,500 unique genes to identify a detailed
molecular picture of the programmed responses of the human
genome to AE. The transcriptional program was analyzed in skin
biopsy samples from lesional and patch-tested skin from AE
patients sensitized to M. sympodialis, and corresponding biopsies
from healthy individuals. A set of genes identified by the
microarrays was selected for further analysis by immunohisto-
chemistry and immunofluorence staining to confirm and explore
corresponding protein levels and cell type expression in skin. We
found that non-lesional skin from AE patients that was patch-
tested with a PBS negative control has a predisposed genetic
program different from normal healthy skin. Furthermore, we
show that the global transcriptional response to M. sympodialis
patch-test in non-lesional AE skin is very similar to the gene-
signature identified in lesional AE skin. The most notable feature
of the global gene-expression pattern observed in AE skin was a
reciprocal expression of induced inflammatory genes and
repressed lipid metabolism genes. Genes encoding key enzymes
and structural proteins involved in assembly of the cornified layer
also demonstrated altered expression in AE skin.
Results
Global portrait of altered expression profiles in AEcDNA microarrays representing approximately 24,500 unique
genes were used to identify the global gene-signature in lesional
and patch-tested skin from AE patients, and control skin samples
from healthy individuals. A multi-group Significance Analysis of
Microarrays (SAM) approach [23] was undertaken to select a set
of ,4000 genes that were consistently differentially expressed
between AE and healthy skin with a false discovery rate (FDR)
,0.003. The full list of genes identified by the SAM approach to
be consistently up- or down-regulated in AE skin as compared to
healthy control skin is provided as Supplementary Table S1.
Hierarchical clustering was used to group these genes based on
similarity in expression across the samples and to group individuals
on the basis of similarities in gene-expression patterns (Figure 1A).
Each column in Figure 1A represents a group of skin biopsy
samples and not a single array experiment. The same set of genes
was next used to extract the patterns of gene-expression from each
individual biopsy sample. Hierarchical clustering of these genes, in
both gene and sample dimension, are displayed in Figure 1B. The
clustering analysis clearly separates AE and normal healthy skin
samples into two distinct branches. We found that the global
transcriptional response to M. sympodialis extract in AE skin is very
similar to that found in lesional AE skin. The healthy control
group did not respond to the M. sympodialis or the PBS patch-test,
neither on a transcriptional level nor as a visible reaction on the
skin. The patients with AE also had no visible skin reaction to the
PBS control patch-test. However, the gene-expression program
observed in non-lesional PBS tested AE skin was more similar to
the gene-signature identified in lesional AE skin than to that found
in the skin of healthy individuals.
The most notable feature of the observed gene-expression
program was a reciprocal expression pattern found for immune/
inflammatory genes (up-regulated in AE skin), and genes involved
in lipid metabolism (down-regulated in AE skin) (Figures 1A and
B). Using the ‘‘gene module map method’’ [24] to identify
significantly enriched Gene Ontology (GO) terms [25], we found
that ‘‘immune response’’ was the most significantly enriched GO
term in up-regulated AE genes (P,10273) and ‘‘lipid metabolism’’
was the most significantly enriched GO term in down-regulated
AE genes (P,10233) (full list of enriched GO terms is provided in
Supplementary Table S2).
The induced expression of immune and inflammatory genes,
such as interleukins, cell surface antigens, and genes induced by
interferon, were especially prominent in M. sympodialis AE skin. We
also identified genes encoding structural components and enzymes
with a key role in terminal keratinocyte differentiation and
cornified envelope assembly that were significantly different in AE
skin as compared to healthy control skin. Notably is that many of
these potential AE candidate genes are localized to chromosomal
regions that previously have been linked to AE (Table 1).
Representative genes from different clusters in Figure 1 (Cluster
I, II and III) are further described below.
Induced expression of inflammatory and immune relatedgenes in AE skin
The most prominently up-regulated genes in AE skin as
compared to healthy control skin are genes involved in immune
and inflammatory responses (Figure 2A). In general, we found the
immune response cluster of genes more highly expressed in M.
sympodialis patch-test reactive AE skin, as compared to lesional and
non-involved/PBS patch tested AE skin and normal healthy skin,
which supports the role of inflammatory molecules in active AE
skin lesions. Among the genes identified in the ‘‘immune cluster’’
are chemokine family members including CCL18, CCL21 and
CXCL1 (Figure 2) and members of the interleukin receptor family
such as IL-2R(c), IL-4R and IL-10RA (Figure 2). Genes encoding
cell surface antigens, such as CD5, CD6, CD28, CD37, CD53 and
CD86 are also among the genes over-expressed in AE skin
(Figure 2). Notably is that many genes identified in the ‘‘immune
cluster’’ are localized on chromosomal regions previously linked to
AE (Figure 2 and Table 1). Furthermore, we identified a group of
coordinately over-expressed genes encoding components (C1R,
C1S and C1QB) and regulatory proteins (SERPING1 and CFH)
of the classical pathway of complement in AE skin (Figure 2 and
Supplementary Table S1). Other interesting genes identified
within this cluster are FCER1G (1q23), encoding the high-affinity
IgE receptor gamma subunit, TRAa, encoding the T-cell alpha
locus, and THY1, encoding a major cell surface glycoprotein
characteristic for T-cells (Figure 2 and Supplementary Table S1).
FCER1G, TRAa and THY1 are located on previous described AE
loci (11q23.3 and 14q11.2).
Genomic Portrait of Eczema
PLoS ONE | www.plosone.org 2 December 2008 | Volume 3 | Issue 12 | e4017

Figure 1. Global comparison between the gene-expression patterns underlying AE pathogenesis to those identified in normalhealthy skin. (A) Thumbnail overview of ,4000 array elements selected for differential expression in skin from AE patients and healthy individualsby a multi-group significance analysis of microarrays (SAM) approach. Hierarchical clustering analysis was performed in both the gene (row) andexperiment (column) dimension. Note that each column represents a group of skin samples. The ‘‘contrast value’’ for each gene is shown, e.g. thestandardized mean difference between the gene’s expression in the class, versus its overall expression. (B) The SAM gene list of approximately 4000array elements was used to extract patterns of gene expression from each AE patient and healthy control individual (indicated by separate numbers).Note that each column here is represented by one array experiment. Transcript levels determined by microarray analysis are shown relative to areference pool of human mRNAs. Expression levels of each gene relative to its mean expression level over the sample set are displayed in a log2 scale.Expression levels are represented by a color bar, where red is representing the highest levels and green is representing the lowest levels ofexpression. Highlighted clusters (I–III) are described in detail below in Figures 2, 5 and 6. The full data set can be found at the SMD database http://microarray-pubs.stanford.edu/eczema and at the NCBI GEO database (GEO accession: GSE12511).doi:10.1371/journal.pone.0004017.g001
Genomic Portrait of Eczema
PLoS ONE | www.plosone.org 3 December 2008 | Volume 3 | Issue 12 | e4017
Cell specific elevated expression of the Socs3 protein inAE skin
SOCS3, located in an AE candidate chromosomal region
(17q25), was among the genes more highly expressed in AE skin
as compared to healthy skin (Figure 2B). To identify in vivo patterns
of Socs3 protein expression in the skin, we used immunohisto-
chemistry and double immunofluorescent staining methods. Socs3
expression was increased and spread to several layers in epidermis
in AE lesional skin (Figure 3A), while in non-lesional AE skin
(Figure 3B) and normal healthy skin (Figure 3C) it was
predominately in the basal epidermal layer. We next performed
double immunofluorescent staining to determine if other cell types
besides keratinocytes expressed Socs3 protein in AE epidermis
(Figure 4). A Socs3 antibody was co-applied with antibodies for
various cell types on AE lesional skin biopsy sections: CD1a for
dendritic cells, CD3 for T-cells, and CD68 for monocytes/
macrophages. We found that Socs3 was expressed by CD1a+
dendritic cells (Figure 4A–C), but not by CD3+ T-cells or CD68+
cells in AE lesional skin (data not shown).
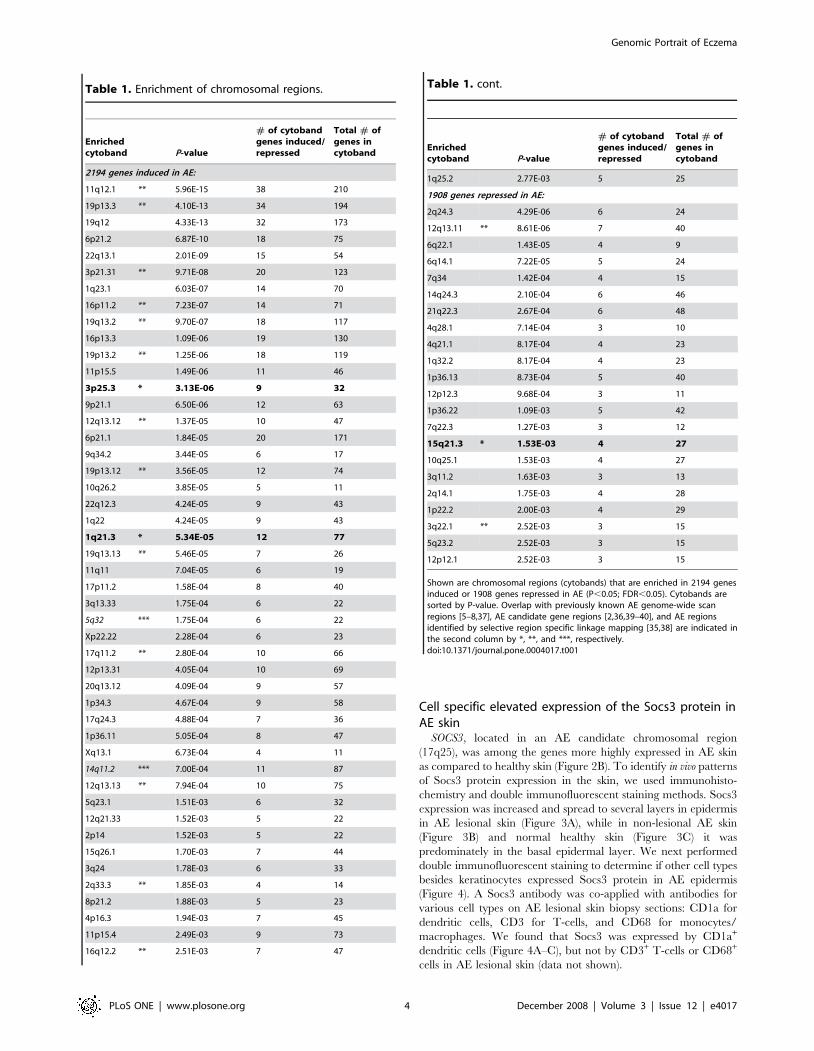
Table 1. Enrichment of chromosomal regions.
Enrichedcytoband P-value
# of cytobandgenes induced/repressed
Total # ofgenes incytoband
2194 genes induced in AE:
11q12.1 ** 5.96E-15 38 210
19p13.3 ** 4.10E-13 34 194
19q12 4.33E-13 32 173
6p21.2 6.87E-10 18 75
22q13.1 2.01E-09 15 54
3p21.31 ** 9.71E-08 20 123
1q23.1 6.03E-07 14 70
16p11.2 ** 7.23E-07 14 71
19q13.2 ** 9.70E-07 18 117
16p13.3 1.09E-06 19 130
19p13.2 ** 1.25E-06 18 119
11p15.5 1.49E-06 11 46
3p25.3 * 3.13E-06 9 32
9p21.1 6.50E-06 12 63
12q13.12 ** 1.37E-05 10 47
6p21.1 1.84E-05 20 171
9q34.2 3.44E-05 6 17
19p13.12 ** 3.56E-05 12 74
10q26.2 3.85E-05 5 11
22q12.3 4.24E-05 9 43
1q22 4.24E-05 9 43
1q21.3 * 5.34E-05 12 77
19q13.13 ** 5.46E-05 7 26
11q11 7.04E-05 6 19
17p11.2 1.58E-04 8 40
3q13.33 1.75E-04 6 22
5q32 *** 1.75E-04 6 22
Xp22.22 2.28E-04 6 23
17q11.2 ** 2.80E-04 10 66
12p13.31 4.05E-04 10 69
20q13.12 4.09E-04 9 57
1p34.3 4.67E-04 9 58
17q24.3 4.88E-04 7 36
1p36.11 5.05E-04 8 47
Xq13.1 6.73E-04 4 11
14q11.2 *** 7.00E-04 11 87
12q13.13 ** 7.94E-04 10 75
5q23.1 1.51E-03 6 32
12q21.33 1.52E-03 5 22
2p14 1.52E-03 5 22
15q26.1 1.70E-03 7 44
3q24 1.78E-03 6 33
2q33.3 ** 1.85E-03 4 14
8p21.2 1.88E-03 5 23
4p16.3 1.94E-03 7 45
11p15.4 2.49E-03 9 73
16q12.2 ** 2.51E-03 7 47
Enrichedcytoband P-value
# of cytobandgenes induced/repressed
Total # ofgenes incytoband
1q25.2 2.77E-03 5 25
1908 genes repressed in AE:
2q24.3 4.29E-06 6 24
12q13.11 ** 8.61E-06 7 40
6q22.1 1.43E-05 4 9
6q14.1 7.22E-05 5 24
7q34 1.42E-04 4 15
14q24.3 2.10E-04 6 46
21q22.3 2.67E-04 6 48
4q28.1 7.14E-04 3 10
4q21.1 8.17E-04 4 23
1q32.2 8.17E-04 4 23
1p36.13 8.73E-04 5 40
12p12.3 9.68E-04 3 11
1p36.22 1.09E-03 5 42
7q22.3 1.27E-03 3 12
15q21.3 * 1.53E-03 4 27
10q25.1 1.53E-03 4 27
3q11.2 1.63E-03 3 13
2q14.1 1.75E-03 4 28
1p22.2 2.00E-03 4 29
3q22.1 ** 2.52E-03 3 15
5q23.2 2.52E-03 3 15
12p12.1 2.52E-03 3 15
Shown are chromosomal regions (cytobands) that are enriched in 2194 genesinduced or 1908 genes repressed in AE (P,0.05; FDR,0.05). Cytobands aresorted by P-value. Overlap with previously known AE genome-wide scanregions [5–8,37], AE candidate gene regions [2,36,39–40], and AE regionsidentified by selective region specific linkage mapping [35,38] are indicated inthe second column by *, **, and ***, respectively.doi:10.1371/journal.pone.0004017.t001
Table 1. cont.
Genomic Portrait of Eczema
PLoS ONE | www.plosone.org 4 December 2008 | Volume 3 | Issue 12 | e4017

Figure 2. Transcriptional levels of immune and inflammatory genes in AE skin measured using DNA microarrays. (A) A zoomed inpicture of the hierarchical cluster analysis showing examples of immune and inflammatory genes that was found to be coordinately over-expressedin AE skin as compared to healthy skin. A detailed list of the genes represented in this cluster is shown in the table (right). Genes localized in genome-
Genomic Portrait of Eczema
PLoS ONE | www.plosone.org 5 December 2008 | Volume 3 | Issue 12 | e4017

Altered lipogenic gene-expression program identified inAE skin
The most prominent feature of the AE down-regulated gene
cluster is a set of genes with a well-defined role in lipid
homeostasis. These include genes that are dedicated to the
synthesis and uptake of cholesterol and fatty acids such as ATP-
Citrate lyase (ACL1), Acyl-CoA synthase (ACSL1, ACSL3), HMG-
CoA synthetase (HMGCS1, HMGCS2) and HMG-CoA reductase
(HMGCR) (Figure 5 and Supplementary Table S1). Furthermore,
genes encoding key enzymes in the poly-unsaturated fatty acid
(PUFA) pathway (FADS1, FADS2 and ELOVL5), and an acyl-
transferase (AGPAT3) with a key role in the phospholipid pathway,
were identified in the same gene cluster (Figures 5A and B).
Genes encoding eicosanoid lipid messengers and processing
enzymes also showed significantly different expression levels in AE
skin as compared to the healthy skin. For example, we observed
that prostaglandin processing enzymes including PTGES (Prosta-
glandin E synthetase), PTGIS (Prostaglandin I2) and PTGER3
(Prostaglandin E receptor) were more highly expressed in AE skin
as compared to healthy control skin (Supplementary Table S1).
Furthermore, genes involved in arachidonic acid metabolism, e.g.
genes required for leukotriene synthesis, such as ALOX5AP,
ALOX12 and ALOX15B, were differentially expressed in AE skin
as compared to healthy skin (Supplementary Table S1).
Among the lipid genes down-regulated in AE skin were
transcripts encoding hydroxy steroid dehydrogenase family
members and members of the cytochrome P450 family that are
essential for steroid hormone biosynthesis [26] (data not shown).
Furthermore, among the down-regulated genes in AE skin was
lipin-1 (LPIN1; Figures 5A and C), which encodes a transcription
factor with a suggested role during normal adipose tissue
development [27]. The lipin-1 gene was isolated and characterized
in 2001 as the gene responsible for fatty liver dystrophy (fld) in
mouse [28]. Interestingly, we also found a member of the SREBP
family, which is a well-described transcription factor with a major
role in regulating genes involved in fatty acid and cholesterol
Figure 3. Increased expression of Socs3 on keratinocytes in lesional AE skin. Immunohistochemical staining showing Socs3 expression (A)in lesional AE skin, (B) non-lesional AE skin, and (C) normal skin from a healthy control. Sections were counterstained with hematoxylin to visualize thenucleus.doi:10.1371/journal.pone.0004017.g003
wide linkage eczema regions or in AE associated loci are highlighted in blue and yellow, respectively. (B) The SOCS3 gene was identifiedby the SAMapproach to be significantly over-expressed in AE skin as compared to healthy skin. The ‘‘contrast value’’ generated by the SAM program for theSOCS3 gene is displayed in the graph (y-axis). Each bar represents SOCS3 transcriptional levels in a group of samples. AE patients: lesional skin (AE Ln = 7), M. sympodialis (AE M n = 6) and PBS patch-tested skin (AE P n = 5). Healthy control individuals: normal skin (H n = 4), M. sympodialis (H M n = 4)and PBS patch-tested skin (H P n = 4).doi:10.1371/journal.pone.0004017.g002
Figure 4. Socs3 is expressed on CD1a+ dendritic cells in epidermis. Double immunofluorescensce stainings of lesional AE skin showing (A)expression of Socs3 on keratinocytes and on epidermal dendritic cells, (B) CD1a expression on dendritic cells and (C) co-localisation of Socs3 andCD1a in epidermis. Dendritic cells are indicated by arrows. Scale bar = 50 mm.doi:10.1371/journal.pone.0004017.g004
Genomic Portrait of Eczema
PLoS ONE | www.plosone.org 6 December 2008 | Volume 3 | Issue 12 | e4017

Genomic Portrait of Eczema
PLoS ONE | www.plosone.org 7 December 2008 | Volume 3 | Issue 12 | e4017

metabolism [29], to be down-regulated in AE skin as compared to
healthy skin (SREBF1; Figure 5C).
Altered expression of epidermal barrier function genes inAE skin
We found alterations in expression of a set of genes encoding
structural components and key enzymes involved in forming the
cornified envelope in AE skin. Two transcripts encoding members
of the transglutaminase family (TGM1 and TGM3) had consistently
elevated expression in AE skin as compared to healthy skin
(Figures 6A and B). Transglutaminases are key enzymes that
catalyze the cross-linking of epidermal proteins during formation
of the stratum corneum. A similar expression pattern, as observed
for the TGM genes, was found for CALML5 (alias CLSP), which
encodes a calmodulin-like skin protein that previously has been
shown to associate with the TGM3 protein [30]. Furthermore, as
seen in Figure 6A, CDSN, which encodes a desmosomal-associated
protein expressed during terminal keratinocyte differentiation
[31], was co-expresed with the TGM transcripts. Desmosomes are
cell–cell adhesion sites that provide mechanical integrity to the
tissues by anchoring keratin filaments to the site of cell–cell
adhesion. The hypothesis that constituents of the desmosomal
cell–cell junctions may have altered expression in the epidermal
layers of AE skin is further supported by consistently lower
expression of DSG2 in AE skin as compared to healthy skin
(Supplementary Table S1). DSG2 encodes a membrane spanning
glycoprotein of the desmosome, and is localized to chromosome 18
in a locus previously linked to AE (18q12.1 [7]). Furthermore, we
identified elevated expression of the corneum chymotryptic
enzyme (SCCE/KLK7) in AE skin (Supplementary Table S1).
This result is supported by recent work from Komatsu et al. (2007)
that reported elevated expression of several kallikrein family
members in the stratum corneum from AE patients [32], and
furthermore by work from Vasilopoulos that identified genetic
association between the corneum chymotryptic enzyme (SCCE/
KLK7) and AE [33].
Genes encoding molecules critical for the extracellular matrix
(ECM) architecture (COL6A1, COL6A2 and COL6A3) and
ECM re-modeling enzymes (TIMP1 and TIMP2) were differen-
tially expressed in AE skin (Figure 6A and Supplementary Table
S1). Many of these genes with an important role in constructing
the skin barrier, as well as genes encoding cell adhesion and ECM
molecules, are localized on chromosomal regions previously linked
or associated to AE (Figure 6 and Table 1) suggesting that they
serve as potential AE candidate genes.
Elevated expression and localization of the TGase1protein in AE skin
TGM1, which is localized in a chromosomal region (14q12)
previously linked to eczema [34], was among the epidermal
differentiation genes found to be over-expressed in lesional AE skin
as compared to healthy skin. By immunohistochemistry, we
confirmed that epidermal transglutaminase 1 (TGase1) protein
expression is increased in AE skin (Figure 7). We found that both
expression and the localization of TGase1 were altered in lesional
AE skin. TGase1 was localized to several cell layers and spread
down deep in epidermis in lesional AE skin (Figure 7A), while in
non-lesional PBS patch-tested AE skin (Figure 7C) and normal
healthy skin (Figure 7D) it was expressed as a sharp line in the
outermost layer of epidermis. As illustrated in Figure 7, TGM1
protein levels could be induced by the application of M. sympodialis
to non-involved AE skin.
Enrichment of AE related chromosomal regionsWe noticed that many of the genes that were found by the array
experiments to be consistently differentially expressed in AE and
healthy skin are localized to previously described AE susceptibility
chromosomal regions (reviewed in [2]). To further test this
hypothesis, we used the previously described ‘‘gene module map
method’’ [24] to identify significantly enriched cytobands in the
AE microarray data set. The set of ,4,000 AE genes were
analyzed for their enrichment in 624 gene sets composed of
human cytoband regions [35]. As illustrated in Table 1, we found
70 cytobands that were significantly enriched in the AE data set
(P,0.05; FDR,0.05). Interestingly, 20 of these significantly
enriched cytobands represent chromosomal regions previously
described to be linked or associated to AE either by genome-wide
linkage studies, selective region-specific linkage mapping or
candidate gene studies in AE [2,34,36–40]. The observation that
20 AE-linked cytobands were found in the top 70 hits is highly
significant (P,1028, hypergeometric distribution, with 624 total
cytobands in the genome), whereas only 2 cytobands are expected
to overlap by chance alone. Notably, we found that genes induced
in AE are more enriched from AE-linked cytobands (17 of 20) than
genes repressed in AE (3 of 20).
Among the enriched AE-linked cytobands identified are 1q21,
3p25.3 and 15q21.3, which all previously have been identified as
AE susceptibility regions in genome-wide linkage analyses [5–
7,38]. The 1q21 region encodes several epidermal differentiation
genes including the FLG gene that recently has been linked to AE
susceptibility [15]. However, genes from the 3p25.3 and 15q21.3
regions have not been identified or systematically tested for a role
in AE. Furthermore, among the significantly enriched cytobands
were several AE gene candidate regions previously described in
the literature to be associated to AE [2], including chromosomal
region 2q33 (CTLA4), 3p21 (TLR9), 5q32 (the cytokine cluster),
11q12 (FCERIb), 12q13 (TIM1), 14q11 (MCC), 16p11 (IL4R) and
19q13 (SCCE and TGFB1) (Table 1).
The microarrays also identified significantly enriched cytobands
that were previously not linked to AE (Table 1). Interestingly
though, some of these chromosomal regions have been linked to
other diseases. For example, we found an enrichment of cytobands
in the AE data set that overlap with chromosomal regions
previously identified to be associated with psoriasis (1q21;PSORS4
and 6p21;PSORS1) and asthma (5q23-32, 6p21, 11p15 and
19q13). In fact, 6p21.2 was among the most significantly enriched
cytobands identified in the AE data set (P,1029, Table 1). The
Figure 5. Global down-regulation of a lipogenic expression program identified in AE skin. (A) A zoomed in picture of the hierarchicalcluster analysis illustrating a large set of genes involved in lipid metabolism and homeostasis that was found to be coordinately down regulated in AEskin (left). A detailed list of the genes represented in this cluster is shown in the table (right). Genes localized in genome-wide linkage eczema regionsor an AE associated loci are highlighted in blue and yellow, respectively. (B) Schematic of enzymes involved in the PUFA pathway. (C) SREBF1 andLPIN1 transcript levels were lower in AE skin compared to healthy control skin. The ‘‘contrast values’’ generated by the SAM program for the SREBF1and the LPIN1 gene are displayed in the graph (y-axis). Each bar represents transcriptional levels in a group of samples. AE patients: lesional skin (AE Ln = 7), M. sympodialis (AE M n = 6) and PBS patch-tested skin (AE P n = 5). Healthy control individuals: normal skin (H n = 4), M. sympodialis (H M n = 4)and PBS patch-tested skin (H P n = 4).doi:10.1371/journal.pone.0004017.g005
Genomic Portrait of Eczema
PLoS ONE | www.plosone.org 8 December 2008 | Volume 3 | Issue 12 | e4017

Figure 6. Genes involved in skin barrier function differentially expressed in skin from AE patients as compared to healthy controlindividuals. (A) A zoomed in picture of the hierarchical cluster analysis illustrating genes involved in skin barrier function that were foundcoordinately over-expressed in AE skin as compared to healthy skin (left). A detailed list of the genes represented in this cluster is shown in the table(right). Genes localized in genome-wide linkage eczema regions or an AE associated loci are highlighted in blue and yellow, respectively. (B) Members
Genomic Portrait of Eczema
PLoS ONE | www.plosone.org 9 December 2008 | Volume 3 | Issue 12 | e4017

6p21 region (PSORS1) contains multiple genes in tight linkage
disequilibrium, including the HLA gene cluster and the CDSN
gene.
All specific genes in AE susceptibility chromosomal regions have
not yet been identified or systematically tested for a role in AE.
Examples of genes identified by the microarrays to be consistently
differentially expressed between AE and healthy skin and localized
within significantly enriched cytobands are shown in Supplemen-
tary Table S3. In summary, we found that there is a significant
enrichment of differentially expressed genes in AE with cytobands
associated to the disease, and furthermore new chromosomal
regions were found that could potentially guide future region-
specific linkage mapping in AE.
Discussion
AE is a chronic inflammatory skin disorder that results from a
complex interaction of genetic and environmental factors [9].
Although several chromosomal regions have been identified that
are linked to AE susceptibility, it is yet not fully understood what
specific genes and mechanisms underlie the development of AE.
The DNA microarray technique [41] has recently been utilized
successfully in the search for new candidate genes in complex
diseases. Large–scale expression profiling of chronic inflammatory
skin disorders such as eczema and psoriasis have previously been
performed using the Affymetrix GeneChip [12,14,42–44]. Al-
though previous expression profiling studies have highlighted sub-
groups of genes such as a set of innate immunity genes [12] and
Figure 7. Increased TGM1 protein expression in AE skin. Immunohistochemical staining of TGM1 expression in lesional AE skin (A) and inpositive APT reaction to M. sympodialis extract (B), non-lesional PBS patch-tested AE skin (C) and normal healthy skin (D). Sections werecounterstained with hematoxylin to visualize the nucleus.doi:10.1371/journal.pone.0004017.g007
of the transglutaminase family (TGM1, TGM3) and CDSN were among the cornified envelope genes identified by the multi-group SAM approach to beconsistently over-expressed in AE skin as compared to healthy skin. The ‘‘contrast value’’ generated by the SAM program for these genes is displayedin the graphs (y-axis). Each bar represents transcriptional levels in a group of samples. AE patients: lesional skin (AE L n = 7), M. sympodialis (AE Mn = 6) and PBS patch-tested skin (AE P n = 5). Healthy control individuals: normal skin (H n = 4), M. sympodialis (H M n = 4) and PBS patch-tested skin (HP n = 4).doi:10.1371/journal.pone.0004017.g006
Genomic Portrait of Eczema
PLoS ONE | www.plosone.org 10 December 2008 | Volume 3 | Issue 12 | e4017

the ‘‘epidermal differentiation cluster’’ [14], or potential gene
candidates including NELL2, CCL18, AQP3 and tenascin-C [42–
44] that are deregulated in AE, the complete genome-wide picture
of AE is still far from understood. To further advance the
understanding of genes underlying the development of AE, and to
test the impact allergens may have on the global expression
pattern in AE skin, we used cDNA microarrays to characterize the
global gene-signature in lesional skin and patch-tested skin from
eczema patients and corresponding skin from healthy individuals.
Our analysis provides striking evidence for global differences in the
transcriptional program between skin from AE patients and
healthy individuals. The most prominent feature of the gene-
signature identified in AE skin was a reciprocal pattern of induced
inflammatory genes and reduced lipid genes. Among the genes
identified in this study are many that are localized to chromosomal
regions previously associated with AE and thus are new potential
AE candidate genes.
The large set of coordinately up-regulated immune and
inflammatory related genes identified in AE skin includes genes
encoding cytokines, chemokins and cell-surface antigens. The
increased expression of inflammatory genes can be explained both
by increased numbers of infiltrating cells, mainly T-cells and
dendritic cells, and by activation of these cells. For example, among
the most consistently highly expressed chemokines in AE skin was
CCL18 that is known from previous work to be highly expressed in
AE skin by dendritic cells [42,45]. A novel finding in our study was
that components and regulatory proteins of the classical pathway of
complement were coordinately over-expresed in AE skin. Comple-
ment is an essential component of the immune system and is of
relevance for the destruction of invading microorganisms. However,
excessive complement activation contributes to undesired tissue
damage and the role of complement in other inflammatory diseases
has previously been reported [46].
SOCS3 was also among the inflammatory genes found to be
more abundant in AE lesions as compared to healthy skin. This
gene encodes a suppressor of cytokine signaling and is localized in
an AE candidate chromosomal region (17q25). It has previously
been reported that SOCS3 is predominantly expressed in TH2-like
cells and has an important role in regulating the onset and
maintenance of TH2-mediated responses [47]. In contrast to the
report from Seki et al. (2003), we did not find T-cells expressing
Socs3 in AE skin. However, keratinocytes and CD1a+ dendritic
cells in the skin expressed the protein in AE lesional skin. The
Socs3 protein was also expressed by basal keratinocytes in normal
healthy skin. Whether SOCS3 plays an immunoregulatory role in
keratinocytes, or if it might be involved in regulating keratinocyte
cell proliferation and differentiation [48] needs to be further
investigated. It is unknown what precise role SOCS3 plays in
different cell types in the skin. Its increased expression in AE
epidermis may play a role in developing the disease, or it may be a
secondary effect of the inflammatory condition of the skin. While
Socs3 protein levels are found to be up-regulated in AE skin, the
reverse pattern was observed in psoriatic skin [49], which is a
chronic inflammatory TH1-related skin disease. It has been
proposed that microRNAs (mir-203) acting in the SOCS3
39UTR are the regulators of reduced Socs3 protein expression
observed in psoriatic skin [49]. It is unclear how Socs3 expression
is regulated in AE skin. However, a recent genetic study has
demonstrated an association between a haplotype in the SOCS3
59region and AE, which suggest that molecules acting in the
59region may alter Socs3 expression in AE skin [50].
We demonstrate here that by applying M. sympodialis extract to
non-lesional AE skin in M. sympodialis sensitized patients, a global
expression signature can be induced that is remarkably similar to
that identified in lesional AE skin. The M. sympodialis induced
transcripts are dominated by immune related genes such as the IL-
4 receptor, which previously has been described in AE [51]. The
IL-4 signaling pathway are among the candidates considered for
the treatment of allergic inflammation [52]. Data presented here
supports the hypothesis that M. sympodialis can act as an
aggravating factor in AE pathogenesis. It is still unclear, however,
why AE patients can be hypersensitive to a fungi that is part of the
normal human skin microflora. One hypothesis is that a defective
skin barrier in AE patients allows allergens to penetrate and trigger
an immunological response in the skin [1].
We found a large set of down-regulated genes in AE skin with a
well-defined role in lipid homeostasis. Among these genes are
classical genes encoding enzymes involved in fatty acid and
cholesterol metabolism, but also genes encoding enzymes involved
in poly-unsaturated fatty acid (PUFA) metabolism. The role of
lipids in AE pathogenesis has previously been discussed. For
example, it has been shown that ceramide levels are reduced in AE
skin compared to healthy skin, and furthermore altered expression
of ceramide processing enzymes has been seen in AE skin [17].
However, this is the first time that a global reduced lipogenic
expression program has been demonstrated in AE skin. Coordi-
nate down-regulation of a large set of lipid processing genes in AE
skin could explain an impaired lipid balance previously observed
in these patients, which may be a key factor underlying the cause
of a disrupted skin barrier in AE patients. Of particular interest is
the reduced expression of genes encoding PUFA processing
enzymes, delta-5-desaturse (FADS2) and delta-6-desaturse
(FADS1), identified here in AE skin. PUFAs are important
constituents of phospholipids in cell membranes, assuring the
correct environment for membrane protein function, maintaining
membrane fluidity, and moreover PUFAs have been described to
play a role in regulating gene transcription [53]. In addition, some
PUFAs, particularly arachidonic acid, act as substrates for the
synthesis of eicosanoids (i.e. prostaglandins and leukotrienes),
which are involved in regulating inflammatory processes and
immune cell responses. A disrupted PUFA balance may thus have
a large impact on various cellular processes. Interestingly, there
are a number of observations in AE patients with significantly
higher levels of the first substrate of the PUFA pathway, linoleic
acid, and significantly lower levels of the downstream metabolites,
c-linolenic, dihomo-c-linolenic, and arachidonic acids in eczema
[16,54,55]. Furthermore, levels of linoleic acid metabolites have
been correlated with transepidermal water loss in children with
eczema [55]. To date there has been two mutually exclusive
hypotheses regarding the altered PUFA composition observed in
AE patients [56]. Our results clearly supports the hypothesis that
lower levels of PUFA metabolites are due to impaired desaturase
enzyme activity and thus impaired synthesis of these molecules,
and not that low levels of PUFA metabolites are due to increased
consumption in inflammatory processes. Genetic variants in the
FADS1 and FADS2 genes have recently been associated with fatty
acid composition in phospholipids [57]. Since the FADS gene
cluster are located on 11q12-q13.1, a chromosomal region
previously linked with allergic diseases [34], it would be intriguing
to test if FADS polymorphisms are associated with AE.
It is currently unclear what controls the well-coordinated
regulation of lipid processing enzymes in AE skin. It is intriguing
to speculate that members of the SREBP transcription factor
family, which has a well-described role in regulating genes
involved in fatty acid and cholesterol metabolism, may play a
key role in the global down-regulation of lipid genes in AE
patients. In fact, we found SREBP1 to be less expressed in skin
from AE patients as compared to healthy controls. Another
Genomic Portrait of Eczema
PLoS ONE | www.plosone.org 11 December 2008 | Volume 3 | Issue 12 | e4017

tempting hypothesis is that nuclear receptors, such as LXR and
RXR, may have an influence on the observed reciprocal gene-
expression program of inflammatory and lipid genes in AE skin.
Members of the liver-X-receptor family have previously been
described in regulating reciprocal expression of inflammatory and
lipid genes on a large scale [58].
The hypothesis that barrier dysfunction is a key factor in the
pathogenesis of AE was recently strengthened by work from
Palmer et al. (2006), demonstrating that filaggrin (FLG) is an AE
susceptibility gene [59]. This study and work from others spread
light on structural proteins of the cornified envelope (CE),
including filaggrin and loricrin, and their role in altered barrier
function in AE patients [14,15]. We report here that TGM genes,
which encode enzymes critical for constructing the cornified cell
envelope architecture, are differentially expressed in skin from AE
patients and healthy control individuals. TGM proteins catalyse
the cross-linking of structural proteins of the CE and lipids. This
process is important in the terminal differentiation of the
epidermis, and thus critical for the formation of the stratum
corneum, the outermost layer of the skin [60,61]. Interestingly, the
same loss-of-function mutation in TGM1 and TGM5 have been
shown to cause lamellar ichthyosis, a disease characterized by
excessive scaling and shedding of the outer epidermis, and peeling
skin syndrome, respectively [62–64]. The glycine residue respon-
sible for this loss-of function mutation (G113C) is conserved in all
known TGMs and lies close to the catalytic domain of the enzyme
[62]. Interestingly, all epidermal TGMs map in genomic regions
that have previously been linked to AE susceptibility
(TGM1;14q12, TGM3;20p13 and TGM5;15q15) [5,6,34]. It has
not been investigated if TGMs are genetically associated to AE, nor
is it known if polymorphisms or mutations near the enzymatic
active site may affect TG activity in AE patients. Notably, filaggrin
and loricrin, which encode two important structural proteins of the
CE and identified by Sugiura et. al. (2005) to be differentially
expressed in AE skin [14], were not included on the microarrays
used in this study and thus the transcript levels for these genes are
not reported in our patient material.
Skin barrier dysfunction could possibly also be explained by
altered cell–cell adhesion function in the skin. We found genes
encoding common constituents of the desmosome complex, such
as CDSN, to be differentially expressed in AE skin. Desmosomes
are cell–cell adhesion sites that provide mechanical integrity to
tissues by anchoring keratin filaments to the site of cell–cell
adhesion. Changes in transcriptional levels of CDSN, which
encodes a desmosomal-associated protein expressed during
terminal keratinocyte differentiation, may lead to skin disease. In
fact, the CDSN gene has recently been associated to psoriasis
(reviewed in [65]), but has not been associated with AE. The data
presented here support the hypothesis that genes involved in
forming the outermost protective layer of the skin, the stratum
corneum, play a critical role in AE pathogenesis. Furthermore we
identified altered expression of stratum corneum proteases in AE
skin suggesting that not only the construction of the cornified
envelope is altered in AE skin, but also that abnormal renewal and
removal of corneocytes (the so called ‘‘desquamation process’’)
may be crucial for skin barrier dysfunction in AE skin.
Finally, we asked the questions what cytobands were enriched in
the microarray data set, and if these cytobands may represent
previously known AE susceptibility regions. Interestingly, we were
able to discover correspondence of differentially expressed genes in
AE and disease susceptibility regions. Enrichment was also found
for cytobands representing chromosomal regions not previously
described in the disease that could potentially guide future region-
specific linkage mapping in AE.
In conclusion, we have used human DNA microarrays to
identify a molecular picture of the programmed responses of the
genome to AE. The most prominent feature of the global
expression program identified in AE skin was a reciprocal pattern
of induced immune response genes and reduced expression of lipid
metabolism genes. Furthermore, we identified transglutaminases,
key enzymes involved in cornified envelope assembly, to be
enhanced in AE skin compared to healthy skin. Alterations in
genes involved in cornified envelope formation and lipid
homeostasis in AE skin support the hypothesis that skin barrier
dysfunction is crucially involved in the pathogenesis of AE [66].
We believe that further understanding of these gene candidates
may lead to new therapeutic strategies for AE patients in the
future.
Materials and Methods
Subjects for microarray analysisSeven patients with AE, recruited and investigated at the
Karolinska University Hospital, Solna (Table 2), and four healthy
controls were included in the study. The healthy controls had no
clinical symptoms or history of allergy or skin diseases and were
PhadiatopH (Phadia AB, Uppsala, Sweden) negative. Inclusion
criteria for the AE patients were diagnosis according to the UK
working party criteria [67]. Also, the eczema lesion had to be
present in other regions than only the hands. The eczema started
before the age of one year in 6/7 patients. They all had an
exacerbation of symptoms lasting for more than six months before
the investigation. All patients suffered from allergic symptoms in the
airways, 5/7 with ongoing symptoms at the time of examination.
Exclusion criteria were other skin diseases than AE, autoimmune
diseases, immune deficiencies, malignant diseases, pregnancy or
lactation, immunosuppressive treatment, and age below 18 or above
55 years. Systemic glucocorticoids, systemic antifungal treatment or
UV therapy was not allowed for 2 months before the investigation
and topical glucocorticoids were not allowed on the test sites for one
week before the study. Antihistamines were withdrawn 5 days
before the investigation. All participants gave their informed
consent. The participant consent was written. The study was
approved by the Regional Ethics Committee.
Skin prick test and atopy patch testSkin prick test (SPT) and atopy patch test (APT) were performed
with extract of the yeast M. sympodialis prepared from strain
no. 42132, American Type Culture Collection (ATCC) as previ-
ously described [68]. For SPT the protein concentration of the
extract was 100 mg/mL. Histamine dihydrochloride (10 mg/mL,
ALK, Hørsholm, Denmark) was used as a positive and PBS as a
negative control. APT was performed on healthy individuals and
non-lesional, tape-stripped skin of the back of AE patients. The M.
sympodialis extract (20 mL, 5 mg/mL) was applied on paper discs in
Finn chambers (8 mm; Epitest Ltd Oy, Tuusula, Finland). The tests
were evaluated after 48 h under coded conditions (See Table 2).
PBS (Phosphate Buffered Saline) was used as a negative control.
Skin biopsy collection and RNA preparationSkin biopsies were collected from two groups of individuals: AE
patients sensitized to M. sympodialis (Table 2) and non-atopic
healthy individuals. Punch biopsies (4 mm) were taken from M.
sympodialis extract and PBS patch tested skin after 48 h from both
AE patients and healthy controls, and from lesional skin in AE
patients and normal skin from healthy control individuals. The
skin biopsies were snap frozen on dry ice and stored at 280uC.
Total RNA was extracted from each skin biopsy using Trizol
Genomic Portrait of Eczema
PLoS ONE | www.plosone.org 12 December 2008 | Volume 3 | Issue 12 | e4017

(Invitrogen, Carlsbad, CA, USA), and total RNA was linearly
amplified according to the Ambion MessageAmp procedure (Cat
#1750). This amplification procedure is based on antisense RNA
(aRNA) amplification first described by Van Gelder and Eberwine
[69]. The amplified RNA was used as template for reverse
transcription in the presence of CyDye-labeled dNTPs to generate
labeled cDNA for microarray analysis. Due to technical reasons,
RNA from 3 biopsies did not get further processed for microarray
hybridization.
cDNA microarrays, hybridization, data filtering andanalysis
Human cDNA microarrays were used containing 41,792
elements that represents approximately 24,500 unique genes
(based on Unigene clusters) manufactured in the Stanford
Microarray Facility (www.microarray.org). Fluorescently labeled
cDNA prepared from amplified RNA was hybridized to the array
in a two-color comparative format, with AE patient- or healthy
control samples labeld with Cy-5, and a reference pool of human
mRNAs (Stratagene) derived from ten cell lines labeled with Cy-3.
Array images were scanned by using an Axon Scanner 4000B
(Axon Instruments, Union City, CA), and data was analyzed by
using GenePix 3.0 (Axon Instruments). Data was normalized and
retrieved as the log2 ratio of fluorescence intensities of the sample
(Cy5) and the reference (Cy3). We next filtered the data to exclude
elements that did not have at least a 2-fold intensity over
background ratio, in at least 80% of the arrays. These filtered
genes were analyzed by the multi-class Significance Analysis of
Microarrays (SAM) algorithm [23] to select a set of ,4000 genes
that were consistently differently expressed between skin from AE
patients and control individuals, with a false discovery rate less
than 0.26% (Supplementary Table S1). An overview of the skin
tissue samples used for the multi-class SAM microarray analysis
are shown in Supplementary Table S4. The abundance of each
transcript measured in a skin biopsy specimen relative to the
common reference is represented in Figures 1, 2, 5 and 6 by color;
red for expression levels above the mean for that gene and green
for expression levels below the mean. The multi-group SAM
approach calculates a ‘‘contrast value’’ for each gene, e.g. the
standardized mean difference between the genes expression in the
class, versus its overall expression. ‘‘Contrast values’’ for 4102
genes are displayed in Figure 1A and the contrast for SOCS3,
SREBF1, LPIN1, TGM1, TGM3 and CDSN, are illustrated in the
graphs in Figures 2, 5 and 6.
The full microarray data set described in this manuscript is
available at the Stanford Microarray Database (SMD) http://
microarray-pubs.stanford.edu/eczema and at the NCBI Gene
Expression Omnibus (GEO) database http://www.ncbi.nlm.nih.
gov/geo/info/linking.html (GEO accession: GSE12511).
Identification of significantly enriched cytoband regionsand Gene Ontology terms in the microarray data set
2194 genes induced and 1908 genes repressed in AE (as is
illustrated in Figure 1) were analyzed for their enrichment in 624
gene sets composed of human cytoband regions [35] and 1665
gene sets composed of Gene Ontology (GO) terms [25].
Significant enrichment of AE-associated genes (P,0.05; corrected
for multiple hypotheses using FDR) was determined using the
‘‘gene module map method’’ implemented in Genomica [24]. To
test the overlap of cytobands discovered by altered gene expression
levels by microarray versus cytobands identified by genetic studies
of AE, we scored for identical cytobands between the Genomica
output versus AE-linked or associated cytobands described in the
literature [2,37–40]. Among 70 cytobands that showed coordinate
mRNA level changes in AE, 20 were previously linked or
associated to AE by genetic studies (28% overlap), whereas only
2 cytobands (3% overlap) were expected by chance alone
(P,1028, hypergeometric distribution). Not all cytobands genet-
ically linked to AE have been discovered, which might increase the
pre-test probability of the overlap and decrease the significance of
the above findings. We note that even assuming a pretest
probability of 10% overlap (i.e. discovery of three times more
genetic loci linked to AE), the overlap between microarray and
genetic cytobands is highly significant at 1026.
Immunohistochemical and double immunofluorescencestaining of skin biopsies
Skin biopsy specimens from an independent set of AE patients
and healthy control individuals were used for immunohistochem-
istry. Staining results from a selected set of AE patients (n = 3) and
healthy controls (n = 2) are illustrated in Figure 3, 4 and 7. The
inclusion and exclusion criteria were the same for these individuals
as is described above. Six mm thick cryo sections were prepared
Table 2. Characterization of the AE patients.
No Gender Age (years) Asthma/Rhinitis SCORADa s-IgE kU/Lb Phadiatopc M. sympodialis specific IgE kU/Ld SPTe mm APTf
1 M 21 + 57 5700 + 16 5 +
2 F 28 + 57 5300 + 4,8 4,5 +
3 F 34 0 24 98 0 ,0,35 6 ++
4 F 35 + 25 7000 + 15 5 ++
5 F 22 + 22 140 + 1,6 6 +
6 M 43 + 78 4710 + 2,4 6,5 +++
7 F 31 + 48 59 + 2,6 4,5 ++
aSCORAD [70].bImmunoCAPTM (Phadia AB, Uppsala, Sweden), reference range 1.6–122 kU/L.cPhadiatopH (Phadia AB), serum IgE to any of 11 common aeroallergens.dSpecific serum IgE for M. sympodialis ATCC strain 42132, ImmunoCAPTM (m70, Phadia AB).eSPT = skin prick test evaluated after 15 min and graded as mean diameter (mm) of the wheal. A reaction of 3 mm or more was considered positive.fAPT = atopy patch test evaluated after 48 h, + = erythema, infiltration, few papules; ++ = erythema, infiltration, papules and small vesicles; +++ = erythema, infiltration,papules and large vesicles [22].
F = female, M = male.doi:10.1371/journal.pone.0004017.t002
Genomic Portrait of Eczema
PLoS ONE | www.plosone.org 13 December 2008 | Volume 3 | Issue 12 | e4017
and put on glass slides, fixed in acetone and used for the ABC-
ELITE (Vector Laboratories Inc. Burlingame, CA, USA)
immunohistochemical staining method according to the manu-
facturer’s instructions. The sections were incubated with rabbit
anti-Socs3 antibodies (dilution 1/100 from Santa Cruz Biotech-
nology Inc, Santa Cruz, CA, USA) followed by a biotinylated
goat-anti-rabbit secondary antibody (1/200, Vector Laboratories
Inc.), or a monoclonal mouse antibody against transglutaminase 1
(1/250, Biogenesis Ltd, Poole, UK) followed by a biotinylated
horse-anti-mouse secondary antibody (1/400, Vector Laboratories
Inc., Inc., Burlingame, CA, USA). The specimens then were
allowed to react with preformed avidin-biotin-enzyme complex
(ABC-ELITE reagent, Vector Laboratories Inc.) for 30 min. The
developing step was incubation with 3-amino-9-ethylcarbazole
(AEC) substrate for 15 min. The slides were counterstained with
Mayer’s haematoxylin. Irrelevant mouse Ig or normal rabbit
serum, respectively, were used as negative control and gave no
staining.
For double immunofluorescence stainings, the skin sections
were incubated with rabbit anti-Socs3 antibodies (1/100) from
Santa Cruz Biotechnology Inc and the monoclonal antibodies
against CD1a (dilution 1/10), CD3 (dilution 1/5) or CD68
(dilution 1/25), all from BD Biosciences Pharmingen, San Jose,
CA, USA. Sections were next incubated with Alexa Fluor 488 goat
anti-rabbit (green fluorescence, 1/500) and Alexa Fluor 546 goat
anti-mouse (red fluorescence, 1/500) from Invitrogen, Eugene,
OR, USA. The sections were evaluated using a Leica TCS SP2
confocal laser scanning microscope system, equipped with an
inverted Leica DM IRBE microscope, an argon laser, and two
HeNe lasers (Leica Microsystems, Germany). Leica confocal
software was used to acquire and visualize the data. Staining
was not observed when irrelevant isotype-matched mouse
antibodies were used or when primary antibodies were omitted.
Supporting Information
Table S1 Genes differentially expressed between skin from AE
patients and healthy control individuals. Shown are a detailed list
of ,4,000 genes identified by the multi-group SAM approach to
be consistently differentially expressed between AE and healthy
skin (FDR,0.003). This set of genes is the same genes that are
shown in Figure 1.
Found at: doi:10.1371/journal.pone.0004017.s001 (0.74 MB
PDF)
Table S2 Enriched GO terms. Shown are Gene Ontology (GO)
terms significantly enriched in 2181 genes induced (Gene Set 1) or
1896 genes repressed (Gene Set 2) in AE (P,0.05; FDR,0.05).
Found at: doi:10.1371/journal.pone.0004017.s002 (0.05 MB
PDF)
Table S3 Genes located in enriched AE-linked chromosomal
regions. Shown are differentially expressed AE genes located
within disease susceptibility chromosomal regions (cytobands) that
are enriched in 2194 genes induced (Gene Set 1) or 1908 genes
repressed (Gene Set 2) in AE (P,0.05; FDR,0.05).
Found at: doi:10.1371/journal.pone.0004017.s003 (0.06 MB
PDF)
Table S4 Overview of skin biopsy samples that were used in the
SAM approach to identify differentially expressed genes in AE and
healthy skin. Shown are six groups of samples representing skin
from atopic eczema patients (SAM group 1-3: AE-L, AE-M, AE-P)
and healthy control individuals (SAM group 4-6: H-N, H-M, H-
P). Corresponding microarray slide name are given for each
sample using the same nomenclature as is used in the Stanford
Microarray Database (SMD).
Found at: doi:10.1371/journal.pone.0004017.s004 (0.05 MB
PDF)
Acknowledgments
We sincerely wish to thank Patrick O. Brown and members of the Brown
laboratory for grateful research support and helpful discussions, and Sigrid
Sahlen for excellent assistance and technical help. We also want to thank
Michael Fero and the Stanford Functional Genomics Facility (SFGF) who
manufactured the cDNA microarrays used in this study, and Janos
Demeter and the other members of the Stanford Microarray Database
(SMD) for their excellent help and advice.
Author Contributions
Conceived and designed the experiments: AS MTL HYC CFW AS MN
MB. Performed the experiments: AS MTL. Analyzed the data: AS ASA.
Contributed reagents/materials/analysis tools: MTL HYC CFW AS MN
MB. Wrote the paper: AS.
References
1. Bieber T (2008) Atopic dermatitis. N Engl J Med 358: 1483–1494.
2. Morar N, Willis-Owen SA, Moffatt MF, Cookson WO (2006) The genetics of
atopic dermatitis. J Allergy Clin Immunol 118: 24–34; quiz 35–26.
3. Larsen FS, Holm NV, Henningsen K (1986) Atopic dermatitis. A genetic-
epidemiologic study in a population-based twin sample. J Am Acad Dermatol
15: 487–494.
4. Schultz Larsen F (1993) Atopic dermatitis: a genetic-epidemiologic study in a
population-based twin sample. J Am Acad Dermatol 28: 719–723.
5. Bradley M, Soderhall C, Luthman H, Wahlgren CF, Kockum I, et al. (2002)
Susceptibility loci for atopic dermatitis on chromosomes 3, 13, 15, 17 and 18 in a
Swedish population. Hum Mol Genet 11: 1539–1548.
6. Cookson WO, Ubhi B, Lawrence R, Abecasis GR, Walley AJ, et al. (2001)
Genetic linkage of childhood atopic dermatitis to psoriasis susceptibility loci. Nat
Genet 27: 372–373.
7. Haagerup A, Borglum AD, Binderup HG, Kruse TA (2004) Fine-scale mapping
of type I allergy candidate loci suggests central susceptibility genes on
chromosomes 3q, 4q and Xp. Allergy 59: 88–94.
8. Lee YA, Wahn U, Kehrt R, Tarani L, Businco L, et al. (2000) A major
susceptibility locus for atopic dermatitis maps to chromosome 3q21. Nat Genet
26: 470–473.
9. Akdis CA, Akdis M, Bieber T, Bindslev-Jensen C, Boguniewicz M, et al. (2006)
Diagnosis and treatment of atopic dermatitis in children and adults: European
Academy of Allergology and Clinical Immunology/American Academy of
Allergy, Asthma and Immunology/PRACTALL Consensus Report. Allergy 61:
969–987.
10. Jarvikallio A, Naukkarinen A, Harvima IT, Aalto ML, Horsmanheimo M (1997)
Quantitative analysis of tryptase- and chymase-containing mast cells in atopic
dermatitis and nummular eczema. Br J Dermatol 136: 871–877.
11. Leung DY, Boguniewicz M, Howell MD, Nomura I, Hamid QA (2004) New
insights into atopic dermatitis. J Clin Invest 113: 651–657.
12. Nomura I, Goleva E, Howell MD, Hamid QA, Ong PY, et al. (2003) Cytokine
milieu of atopic dermatitis, as compared to psoriasis, skin prevents induction of
innate immune response genes. J Immunol 171: 3262–3269.
13. Pivarcsi A, Homey B (2005) Chemokine networks in atopic dermatitis: traffic
signals of disease. Curr Allergy Asthma Rep 5: 284–290.
14. Sugiura H, Ebise H, Tazawa T, Tanaka K, Sugiura Y, et al. (2005) Large-scale
DNA microarray analysis of atopic skin lesions shows overexpression of an
epidermal differentiation gene cluster in the alternative pathway and lack of
protective gene expression in the cornified envelope. Br J Dermatol 152: 146–149.
15. Irvine AD (2007) Fleshing out filaggrin phenotypes. J Invest Dermatol 127:
504–507.
16. Calder PC, Miles EA (2000) Fatty acids and atopic disease. Pediatr Allergy
Immunol 11 Suppl 13: 29–36.
17. Choi MJ, Maibach HI (2005) Role of ceramides in barrier function of healthy
and diseased skin. Am J Clin Dermatol 6: 215–223.
18. Lin YT, Wang CT, Chiang BL (2007) Role of bacterial pathogens in atopic
dermatitis. Clin Rev Allergy Immunol 33: 167–177.
19. Scheynius A, Johansson C, Buentke E, Zargari A, Linder MT (2002) Atopic
eczema/dermatitis syndrome and Malassezia. Int Arch Allergy Immunol 127:
161–169.
Genomic Portrait of Eczema
PLoS ONE | www.plosone.org 14 December 2008 | Volume 3 | Issue 12 | e4017

20. Casagrande BF, Fluckiger S, Linder MT, Johansson C, Scheynius A, et al. (2006)
Sensitization to the yeast Malassezia sympodialis is specific for extrinsic andintrinsic atopic eczema. J Invest Dermatol 126: 2414–2421.
21. Schmid-Grendelmeier P, Scheynius A, Crameri R (2006) The role of
sensitization to Malassezia sympodialis in atopic eczema. Chem ImmunolAllergy 91: 98–109.
22. Tengvall Linder M, Johansson C, Scheynius A, Wahlgren C (2000) Positiveatopy patch test reactions to Pityrosporum orbiculare in atopic dermatitis
patients. Clin Exp Allergy 30: 122–131.
23. Tusher VG, Tibshirani R, Chu G (2001) Significance analysis of microarraysapplied to the ionizing radiation response. Proc Natl Acad Sci U S A 98:
5116–5121.24. Segal E, Friedman N, Koller D, Regev A (2004) A module map showing
conditional activity of expression modules in cancer. Nat Genet 36: 1090–1098.25. Ashburner M, Ball CA, Blake JA, Botstein D, Butler H, et al. (2000) Gene
ontology: tool for the unification of biology. The Gene Ontology Consortium.
Nat Genet 25: 25–29.26. Payne AH, Hales DB (2004) Overview of steroidogenic enzymes in the pathway
from cholesterol to active steroid hormones. Endocr Rev 25: 947–970.27. Reue K, Zhang P (2008) The lipin protein family: dual roles in lipid biosynthesis
and gene expression. FEBS Lett 582: 90–96.
28. Peterfy M, Phan J, Xu P, Reue K (2001) Lipodystrophy in the fld mouse resultsfrom mutation of a new gene encoding a nuclear protein, lipin. Nat Genet 27:
121–124.29. Horton JD, Shah NA, Warrington JA, Anderson NN, Park SW, et al. (2003)
Combined analysis of oligonucleotide microarray data from transgenic andknockout mice identifies direct SREBP target genes. Proc Natl Acad Sci U S A
100: 12027–12032.
30. Mehul B, Bernard D, Simonetti L, Bernard MA, Schmidt R (2000) Identificationand cloning of a new calmodulin-like protein from human epidermis. J Biol
Chem 275: 12841–12847.31. Simon M, Montezin M, Guerrin M, Durieux JJ, Serre G (1997) Characteriza-
tion and purification of human corneodesmosin, an epidermal basic glycoprotein
associated with corneocyte-specific modified desmosomes. J Biol Chem 272:31770–31776.
32. Komatsu N, Saijoh K, Kuk C, Liu AC, Khan S, et al. (2007) Human tissuekallikrein expression in the stratum corneum and serum of atopic dermatitis
patients. Exp Dermatol 16: 513–519.33. Vasilopoulos Y, Cork MJ, Murphy R, Williams HC, Robinson DA, et al. (2004)
Genetic association between an AACC insertion in the 39UTR of the stratum
corneum chymotryptic enzyme gene and atopic dermatitis. J Invest Dermatol123: 62–66.
34. Soderhall C, Bradley M, Kockum I, Wahlgren CF, Luthman H, et al. (2001)Linkage and association to candidate regions in Swedish atopic dermatitis
families. Hum Genet 109: 129–135.
35. Karolchik D, Baertsch R, Diekhans M, Furey TS, Hinrichs A, et al. (2003) TheUCSC Genome Browser Database. Nucleic Acids Res 31: 51–54.
36. Beyer K, Nickel R, Freidhoff L, Bjorksten B, Huang SK, et al. (2000) Associationand linkage of atopic dermatitis with chromosome 13q12-14 and 5q31-33
markers. J Invest Dermatol 115: 906–908.37. Christensen U, Haagerup A, Binderup HG, Vestbo J, Kruse TA, et al. (2006)
Family based association analysis of the IL2 and IL15 genes in allergic disorders.
Eur J Hum Genet 14: 227–235.38. Enomoto H, Noguchi E, Iijima S, Takahashi T, Hayakawa K, et al. (2007)
Single nucleotide polymorphism-based genome-wide linkage analysis inJapanese atopic dermatitis families. BMC Dermatol 7: 5.
39. Soderhall C, Marenholz I, Kerscher T, Ruschendorf F, Esparza-Gordillo J, et al.
(2007) Variants in a novel epidermal collagen gene (COL29A1) are associatedwith atopic dermatitis. PLoS Biol 5: e242.
40. Takahashi N, Akahoshi M, Matsuda A, Ebe K, Inomata N, et al. (2005)Association of the IL12RB1 promoter polymorphisms with increased risk of
atopic dermatitis and other allergic phenotypes. Hum Mol Genet 14:
3149–3159.41. Schena M, Shalon D, Davis RW, Brown PO (1995) Quantitative monitoring of
gene expression patterns with a complementary DNA microarray. Science 270:467–470.
42. Nomura I, Gao B, Boguniewicz M, Darst MA, Travers JB, et al. (2003) Distinctpatterns of gene expression in the skin lesions of atopic dermatitis and psoriasis: a
gene microarray analysis. J Allergy Clin Immunol 112: 1195–1202.
43. Ogawa K, Ito M, Takeuchi K, Nakada A, Heishi M, et al. (2005) Tenascin-C isupregulated in the skin lesions of patients with atopic dermatitis. J Dermatol Sci
40: 35–41.44. Olsson M, Broberg A, Jernas M, Carlsson L, Rudemo M, et al. (2006) Increased
expression of aquaporin 3 in atopic eczema. Allergy 61: 1132–1137.
45. Pivarcsi A, Gombert M, Dieu-Nosjean MC, Lauerma A, Kubitza R, et al. (2004)
CC chemokine ligand 18, an atopic dermatitis-associated and dendritic cell-derived chemokine, is regulated by staphylococcal products and allergen
exposure. J Immunol 173: 5810–5817.
46. Mizuno M (2006) A review of current knowledge of the complement system andthe therapeutic opportunities in inflammatory arthritis. Curr Med Chem 13:
1707–1717.47. Seki Y, Inoue H, Nagata N, Hayashi K, Fukuyama S, et al. (2003) SOCS-3
regulates onset and maintenance of T(H)2-mediated allergic responses. Nat Med
9: 1047–1054.48. Goren I, Linke A, Muller E, Pfeilschifter J, Frank S (2006) The suppressor of
cytokine signaling-3 is upregulated in impaired skin repair: implications forkeratinocyte proliferation. J Invest Dermatol 126: 477–485.
49. Sonkoly E, Wei T, Janson PC, Saaf A, Lundeberg L, et al. (2007) MicroRNAs:novel regulators involved in the pathogenesis of Psoriasis? PLoS ONE 2: e610.
50. Ekelund E, Saaf A, Tengvall-Linder M, Melen E, Link J, et al. (2006) Elevated
expression and genetic association links the SOCS3 gene to atopic dermatitis.Am J Hum Genet 78: 1060–1065.
51. Oiso N, Fukai K, Ishii M (2000) Interleukin 4 receptor alpha chainpolymorphism Gln551Arg is associated with adult atopic dermatitis in Japan.
Br J Dermatol 142: 1003–1006.
52. Colgan J, Rothman P (2007) Manipulation of signaling to control allergicinflammation. Curr Opin Allergy Clin Immunol 7: 51–56.
53. Jump DB (2002) Dietary polyunsaturated fatty acids and regulation of genetranscription. Curr Opin Lipidol 13: 155–164.
54. Laitinen K, Sallinen J, Linderborg K, Isolauri E (2006) Serum, cheek cell andbreast milk fatty acid compositions in infants with atopic and non-atopic eczema.
Clin Exp Allergy 36: 166–173.
55. Yen CH, Dai YS, Yang YH, Wang LC, Lee JH, et al. (2008) Linoleic acidmetabolite levels and transepidermal water loss in children with atopic
dermatitis. Ann Allergy Asthma Immunol 100: 66–73.56. Calder PC (2006) Abnormal fatty acid profiles occur in atopic dermatitis but
what do they mean? Clin Exp Allergy 36: 138–141.
57. Schaeffer L, Gohlke H, Muller M, Heid IM, Palmer LJ, et al. (2006) Commongenetic variants of the FADS1 FADS2 gene cluster and their reconstructed
haplotypes are associated with the fatty acid composition in phospholipids. HumMol Genet 15: 1745–1756.
58. Joseph SB, Castrillo A, Laffitte BA, Mangelsdorf DJ, Tontonoz P (2003)Reciprocal regulation of inflammation and lipid metabolism by liver X
receptors. Nat Med 9: 213–219.
59. Palmer CN, Irvine AD, Terron-Kwiatkowski A, Zhao Y, Liao H, et al. (2006)Common loss-of-function variants of the epidermal barrier protein filaggrin are a
major predisposing factor for atopic dermatitis. Nat Genet 38: 441–446.60. Candi E, Schmidt R, Melino G (2005) The cornified envelope: a model of cell
death in the skin. Nat Rev Mol Cell Biol 6: 328–340.
61. Kalinin AE, Kajava AV, Steinert PM (2002) Epithelial barrier function:assembly and structural features of the cornified cell envelope. Bioessays 24:
789–800.62. Cassidy AJ, van Steensel MA, Steijlen PM, van Geel M, van der Velden J, et al.
(2005) A homozygous missense mutation in TGM5 abolishes epidermaltransglutaminase 5 activity and causes acral peeling skin syndrome. Am J Hum
Genet 77: 909–917.
63. Huber M, Rettler I, Bernasconi K, Frenk E, Lavrijsen SP, et al. (1995)Mutations of keratinocyte transglutaminase in lamellar ichthyosis. Science 267:
525–528.64. Russell LJ, DiGiovanna JJ, Rogers GR, Steinert PM, Hashem N, et al. (1995)
Mutations in the gene for transglutaminase 1 in autosomal recessive lamellar
ichthyosis. Nat Genet 9: 279–283.65. Kere J (2005) Mapping and identifying genes for asthma and psoriasis. Philos
Trans R Soc Lond B Biol Sci 360: 1551–1561.66. Elias PM, Steinhoff M (2008) ‘‘Outside-to-inside’’ (and now back to ‘‘outside’’)
pathogenic mechanisms in atopic dermatitis. J Invest Dermatol 128: 1067–1070.
67. Williams HC, Burney PG, Pembroke AC, Hay RJ (1994) The U.K. WorkingParty’s Diagnostic Criteria for Atopic Dermatitis. III. Independent hospital
validation. Br J Dermatol 131: 406–416.68. Zargari A, Harfast B, Johansson S, Johansson SG, Scheynius A (1994)
Identification of allergen components of the opportunistic yeast Pityrosporumorbiculare by monoclonal antibodies. Allergy 49: 50–56.
69. Van Gelder RN, von Zastrow ME, Yool A, Dement WC, Barchas JD, et al.
(1990) Amplified RNA synthesized from limited quantities of heterogeneouscDNA. Proc Natl Acad Sci U S A 87: 1663–1667.
70. (1993) Severity scoring of atopic dermatitis: the SCORAD index. ConsensusReport of the European Task Force on Atopic Dermatitis. Dermatology 186:
23–31.
Genomic Portrait of Eczema
PLoS ONE | www.plosone.org 15 December 2008 | Volume 3 | Issue 12 | e4017