Global Estimates of the Impact of Income Support during the ...
53
UNITED NATIONS DEVELOPMENT PROGRAMME Mitigating Poverty: Global Estimates of the Impact of Income Support during the Pandemic by Johanna Fajardo-Gonzalez, George Gray Molina, María Montoya-Aguirre, Eduardo Ortiz-Juarez DEVELOPMENT FUTURES SERIES WORKING PAPERS UNDP GLOBAL POLICY NETWORK
-
Upload
khangminh22 -
Category
Documents
-
view
1 -
download
0
Transcript of Global Estimates of the Impact of Income Support during the ...
U N I T E D N AT I O N S D E V E LO P M E N T P R O G R A M M E
Mitigating Poverty:
Global Estimates of the Impact of Income Support during the Pandemic by Johanna Fajardo-Gonzalez, George Gray Molina, María Montoya-Aguirre, Eduardo Ortiz-Juarez
D E V E L O P M E N T F U T U R E S S E R I E S W O R K I N G P A P E R S
UNDP GLOBAL POLICY NETWORK
Mitigating Poverty:
Global Estimates of the Impact of Income Support during the
Pandemic
by Johanna Fajardo-Gonzalez, George Gray Molina, Maria Montoya-Aguirre and Eduardo Ortiz-Juarez
UNDP is the leading United Nations organization fighting to end the injustice of poverty, inequality and
climate change. Working with our broad network of experts and partners in 170 countries, we help nations
to build integrated, lasting solutions for people and planet. Learn more at undp.org or follow at @UNDP.
The views expressed in this publication are those of the author(s) and do not necessarily represent those
of the United Nations, including UNDP, or the UN Member States.
Copyright © UNDP July 2021
All rights reserved
United Nations Development Programme
1 UN Plaza, New York, NY 10075, USA
Mitigating Poverty:
Global Estimates of the Impact of Income Support during the Pandemic
by Johanna Fajardo-Gonzalez ([email protected]), George Gray Molina
([email protected]), Maria Montoya-Aguirre ([email protected]) and
Eduardo Ortiz-Juarez ([email protected]) 1
Abstract This paper reconstructs the full welfare distributions from household surveys of 160 countries, covering
96.5 percent of the global population, to estimate the pandemic-induced increases in global poverty and
provide information on the potential short-term effects of income-support programmes on mitigating
such increases. Crucially, the analysis performs a large-scale simulation by combining the welfare
distributions with the database of social protection measures of Gentilini et al. (2021) and estimates such
effects from 72 actual income-support programmes planned or implemented across 41 countries. The
paper reports three findings: First, the projection of additional extreme poverty, in the absence of income
support, ranges between 117 million people under a distributive-neutral projection and 168 million
people under a distributive-regressive projection —which may better reflect how the shock impacted
poor and vulnerable households. Second, a simulation of the hypothetical effects of a temporary basic
income with an investment of 0.5 percent of developing countries’ GDP, spread over six months, finds
that this amount would mitigate to a large extent, at least temporarily, the increase in global poverty at
both the $1.90- and $3.20-a-day thresholds, although poverty would still increase significantly in the
poorest regions of the world. Third, the analysis of income-support programmes in 41 countries suggests
that they may have mitigated, at least temporarily, the overall increase in poverty in upper-middle income
countries but may have been insufficient to mitigate the increase in poverty at any poverty line in low-
income countries. Income support likely mitigated 60 percent of the increase in poverty at the $3.20-a-
day threshold and 20 percent at the $5.50-a-day threshold among lower-middle-income countries. This
pattern is correlated with the amount of social assistance and social insurance per capita payments made
in each country.
1 Johanna Fajardo-Gonzalez is Policy Specialist, Economist at the Strategic Policy Engagement Unit (SPE) at the UNDP
Bureau for Policy and Programme Support (BPPS); George Gray Molina is the Head of Strategic Engagement and Chief
Economist at BPPS; Maria Montoya-Aguirre is Economic Analyst at SPE-BPPS; and Eduardo Ortiz-Juarez is Economist at
SPE-BPPS and Researcher at King’s College London.
The authors are grateful to Jacob Assa, Nathalie Bouche, Lars Jensen, Luis F. Lopez-Calva, Marcela Melendez, Mansour
Ndiaye, Christian Oldiges and the RBLAC Chief Economist Office for their valuable feedback. Special thanks to Anna
Ortubia, Dylan Lowthian, Lesley Wright and Samantha Happ for their expert work on communications. The findings,
interpretations and conclusions expressed in this paper are entirely those of the authors.

1. Introduction
A key question arising from the pandemic policy response is: Was it robust enough to mitigate income and
jobs losses around the world? While it is still early to adequately assess the welfare effects of multiple
policy measures, this paper provides estimates of the potential influence of income support in mitigating,
at least temporarily, increases in poverty headcount rates vis-à-vis a pure pandemic-induced shock
scenario.2 Clearly, policy responses around the world included more than income support—they included
tax deferrals, service payment waivers and loans and guarantees, as well as various work furlough and
employment insurance programmes, among other measures. But it is also evident that income support
programmes were ubiquitous and made up a significant portion of the response.
Twelve months ago, two of the co-authors of this paper analysed the costs and implementation challenges
of a temporary basic income (TBI) targeting poor and vulnerable people across the developing world (Gray
Molina and Ortiz-Juarez, 2020). This paper revisits that exercise and provides counterfactual information
on the potential short-term effects that income support has on mitigating the increase in poverty, and the
associated financial costs, had countries implemented TBI schemes in response to the shock. To estimate
the pandemic-induced increase in poverty and perform the simulations, the analysis retrieves the
distributions of per capita income and consumption from household surveys in 160 countries (128
developing countries and 32 advanced economies) that covered about 96.5 percent of the world’s population
in 2019–2020. But the paper also dives into the actual response. Specifically, the analysis exploits these
welfare distributions and the database of social protection measures of Gentilini et al. (2021) to undertake
a systematic, large-scale assessment of the potential short-term effects on mitigating the increase in poverty
of 72 cash-based programmes across 41 countries, which together concentrate a fourth of the global
population and represent a fifth of the total number of countries that have planned or implemented income-
support measures since March 2020.
There are three main findings derived from the simulations. First, spending equivalent to 0.5 percent of
developing countries’ GDP, for a monthly total of $58.1 billion (2011 PPP) spread over six months, would
have sufficed to mitigate, at least temporarily, the increases in global poverty at the $1.90- and $3.20-a-day
poverty lines. Despite the aggregate mitigation, the number of people pushed below these poverty lines
because of the crisis could still be significant within the poorest regions of the world. It is important to
emphasize that the estimates rely on a distribution-neutral economic contraction. This seems unlikely, and
2 While this paper focuses on monetary poverty, it acknowledges that other dimensions of poverty such as education,
employment, food security or safety are likely sensitive to the existence and timing of the income support provision.

it might well be that the incomes of some segments of the population contracted more than proportionally
during the crisis; e.g., low- and middle-skill workers, women, or the informally employed (see, e.g., ILO
2020, 2021; IMF, 2021a). Although there is no consistent information available on the incidence of the
income contraction across households, the analysis also simulated the mitigating effects of TBI schemes
under an ad hoc regressive contraction that hits proportionally harder the bottom 60 percent of each
country’s population, which concentrates, on average across-countries, most of those living in poverty and
at high-risk of falling into poverty (see section 4). The results suggest that the above investment could have
helped to mitigate an important share of the increase in poverty, but certainly not all of it.
Second, actual income support programmes potentially mitigated the short-term increase in poverty in a
sample of 41 countries. Although this result is driven by upper-middle-income countries that were able to
roll out generous income support, the estimations suggest that low- and lower-middle-income countries
may not have provided transfers large enough to fully mitigate the shock-induced increase in poverty and
even experienced short-term increases in their headcount rates. Finally, although there has been substantial
heterogeneity in the generosity and coverage of the social protection response across countries, mostly
conditional on fiscal capacity and budget adaptation, the limited effectiveness observed in some poorer
countries suggests that there is room for action even under significant constraints. Yet, again, the success
of these moderate interventions in mitigating the increase in poverty is likely fragile under a scenario in
which the income contraction is harder on those at the bottom.
Although with important caveats, the results presented in this paper provide some initial benchmarks on
how the pandemic shock likely impacted poor and vulnerable households around the world, but also how
important policy choices were in potentially mitigating those effects. The remainder of the paper is
organized as follows. Section 2 reviews the evidence on the socioeconomic impacts of the COVID-19
pandemic and introduces the income support measures implemented as part of the governments’ policy
response to this crisis. Section 3 discusses the construction of the distributions of per capita income or
consumption and measures the increases in poverty at different poverty lines. Section 4 estimates the
potential magnitude of the mitigation of poverty increase from hypothetical and actual emergency income
support around the world. Finally, Section 5 discusses some policy implications and provides a conclusion.
2. Looking back at the first pandemic year
At the onset of the pandemic, most developing countries were riven by pre-existing inequalities that would
eventually threaten the lives and livelihoods of their most vulnerable citizens. A large share of workers in
informal3 and at-risk service sectors (construction, transportation, retail, tourism and hospitality), combined
with absent safety nets, would soon reveal that any social distancing measures would prevent many people
from earning their usual income or earning an income at all. Indeed, following the implementation of the
first lockdowns, the earnings of informal workers were estimated to have contracted by 60 percent globally
in the first month of the crisis, reaching an average contraction of 80 percent among the poorest countries,
whereas estimates covering the whole of 2020 suggest that, relative to 2019, the loss of labour incomes had
reached US$3.7 trillion globally as a result of working-hour losses (equivalent to more than 220 million
full-time jobs), with lower-middle-income countries being the hardest hit (ILO, 2020a; ILO, 2021).
The rapid progression of the pandemic across developing countries and the immediate stringent disruptions
to people’s livelihoods that followed sounded the alarms of a potential immediate increase in global extreme
poverty rates (see, e.g., Mahler et al., 2020a, 2020b; Sumner, Hoy and Ortiz-Juarez, 2020; Valensisi, 2020).
While increased poverty is perhaps the most salient and visible negative economic consequence of the
COVID-19 pandemic, and the focus of this paper, other critical, related indicators of social progress have
also worsened. For starters, the pandemic-induced crisis has left more people food insecure worldwide.
Some estimates suggests that it has pushed the number of acutely food insecure people to 270 million in
2020, an 82 percent increase compared to pre-pandemic projections (WFP, 2020). Studies using household
survey data from developing countries suggest that the main reason for this increase in food insecurity is
the loss of incomes resulting from strict lockdowns and restrictions to mobility,4 while such an effect is
compounded by disruptions to global and domestic markets and food value chains (see, e.g., Aggarwal et
al., 2020; Amjath-Babu et al., 2020; Khan et al., 2021; Mahajan and Tomar, 2021).
Other analyses suggest that the effects of the pandemic are likely to exert important adverse effects on
gender equality. More women than men lost their jobs or experienced a disproportionate decline in their
incomes, resulting in a widening of gaps in labour market outcomes and opportunities (see, e.g., Adams-
Prassl et al., 2020; Foucault and Galasso, 2020; Dang and Viet Nguyen, 2021; Montoya-Aguirre, Ortiz-
Juarez and Santiago, 2021). There are at least two factors behind this disparity. First, in contrast with
previous crises, the coronavirus pandemic has particularly affected sectors with high female employment
shares (Alon et al., 2020; ILO, 2020b). Second, the demand for childcare has increased. In response to
closures of schools and day-care centres, more mothers than fathers have reduced their working hours or
shifted to unemployment or even inactivity (see, e.g., Andrew et al., 2020; Blundell et al., 2020; Collins et
al., 2021; Sen, Zhengyun and Hao, 2020; Oreffice and Quintana-Domeque, 2021; Reichelt, Makovi and
3 About 60 percent of total workers in developing countries make a living in non-agricultural informal markets (70 percent when
including agriculture) (ILO, 2018; p 14). 4 See, for example, evidence for China (Wang et al., 2021), Guatemala (Ceballos, Hernandez and Paz, 2021), Ethiopia (Hirvonen,
de Brauw and Abate, 2021), Nigeria (Amare et al., 2020) and South Africa (Arndt et al., 2020).
Sargsyan, 2021); indeed, estimates suggest that the loss of women’s jobs in 2020 could reach 64 million
globally, with 86 percent moving completely into inactivity (ILO, 2021). A critical gendered outcome is
that domestic violence against women was also exacerbated during the pandemic, with its rise being mainly
associated to lack of employment, low social support, substance abuse, increased stress and poor mental
health (see, e.g., Peterman and O’Donnell, 2020).
There are also potentially harmful, long-lasting consequences on human capital accumulation. Children
have experienced learning losses across a range of subjects, grade levels and geographical regions due to
school closures.5 There is evidence that children have devoted less time to schoolwork, even though parents
and schools are providing resources to support their learning process during the pandemic (see, e.g., Bacher-
Hicks, Goodman and Mulhern, 2021; Jæger and Blaabæk, 2020; Maldonado and De Witte, 2020). Learning
losses have also been amplified due to inadequate access to technical equipment for online schooling (see,
e.g., Andrew et al., 2020b; Huber and Helm, 2020). Furthermore, learning delays are much more
pronounced for primary-school students and students from low-income households, implying that
educational inequalities may persist in the long term (see, e.g., Engzell, Frey and Verhagen, 2020; Gore et
al., 2021; Tomasik, Helbling and Moser, 2020).
Finally, in terms of health-related indicators, some estimates suggest that the less advantaged groups of the
population are likely to suffer high COVID-19-related infections and mortality rates in the future as they
often lack access to basic services and good-quality health care, and they tend to live in contexts with
persistent conditions of indoor and outdoor pollution and where malnutrition, infectious diseases and other
comorbidities are more prevalent (see, e.g., Alkire et al., 2020; Brown, Ravallion and van de Walle, 2020;
Walker et al., 2020). There are also indirect health effects that are yet to be fully addressed. Access to
essential health services has been severely disrupted, presenting major threats to meeting general and
special health-care needs. Krubiner et al. (2021) summarize the evidence and report that most providers
diverted to COVID-19 activities and supply chains were seriously affected. For instance, focusing on HIV
services, studies report that disruptions to treatment may increase HIV deaths by 10 percent over the next
five years, with Sub-Saharan Africa being particularly affected (Hogan et al., 2020; Jewell et al., 2020).
Maternal health services have been negatively affected, as well. Antenatal care visits and institutional
deliveries declined markedly in Sub-Saharan Africa due to lockdowns (Shapira et al., 2021), while in some
Asian countries the quality of intra- and post-partum care and immunization rates experienced major
reductions following the containment measures (Headey et al., 2020; KC et al., 2020).
5 Patrinos and Donnelly (2021) provide a systematic review of the evidence available for developed countries.
2.1 How did the world respond?
Since the start of the pandemic, an ever-increasing number of countries and territories embarked on an
aggressive social protection response comprised by social assistance, social insurance and labour market
measures. Data from the comprehensive tracker compiled by Gentilini et al. (2021) shows that by the end
of March 2020, a total of 283 social protection measures were planned or implemented across 84 countries
and territories, whereas by December 2020 their cumulative numbers had reached 1,414 and 215,
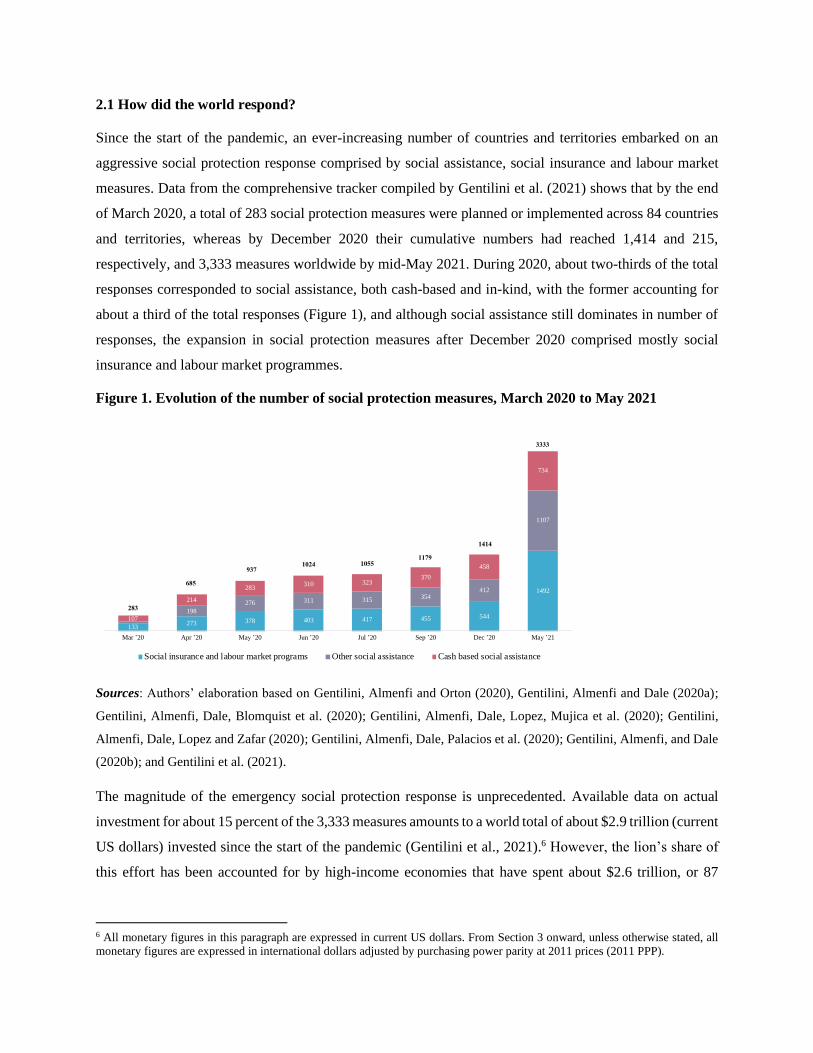
respectively, and 3,333 measures worldwide by mid-May 2021. During 2020, about two-thirds of the total
responses corresponded to social assistance, both cash-based and in-kind, with the former accounting for
about a third of the total responses (Figure 1), and although social assistance still dominates in number of
responses, the expansion in social protection measures after December 2020 comprised mostly social
insurance and labour market programmes.
Figure 1. Evolution of the number of social protection measures, March 2020 to May 2021
Sources: Authors’ elaboration based on Gentilini, Almenfi and Orton (2020), Gentilini, Almenfi and Dale (2020a);
Gentilini, Almenfi, Dale, Blomquist et al. (2020); Gentilini, Almenfi, Dale, Lopez, Mujica et al. (2020); Gentilini,
Almenfi, Dale, Lopez and Zafar (2020); Gentilini, Almenfi, Dale, Palacios et al. (2020); Gentilini, Almenfi, and Dale
(2020b); and Gentilini et al. (2021).
The magnitude of the emergency social protection response is unprecedented. Available data on actual
investment for about 15 percent of the 3,333 measures amounts to a world total of about $2.9 trillion (current
US dollars) invested since the start of the pandemic (Gentilini et al., 2021).6 However, the lion’s share of
this effort has been accounted for by high-income economies that have spent about $2.6 trillion, or 87
6 All monetary figures in this paragraph are expressed in current US dollars. From Section 3 onward, unless otherwise stated, all
monetary figures are expressed in international dollars adjusted by purchasing power parity at 2011 prices (2011 PPP).
133273 378 403 417 455 544
1492
198
276 311 315 354412
1107
107
214
283310 323
370
458
734
283
685
9371024 1055
1179
1414
Mar ’20 Apr ’20 May ’20 Jun ’20 Jul ’20 Sep ’20 Dec ’20 May ’21
Social insurance and labour market programs Other social assistance Cash based social assistance
3333
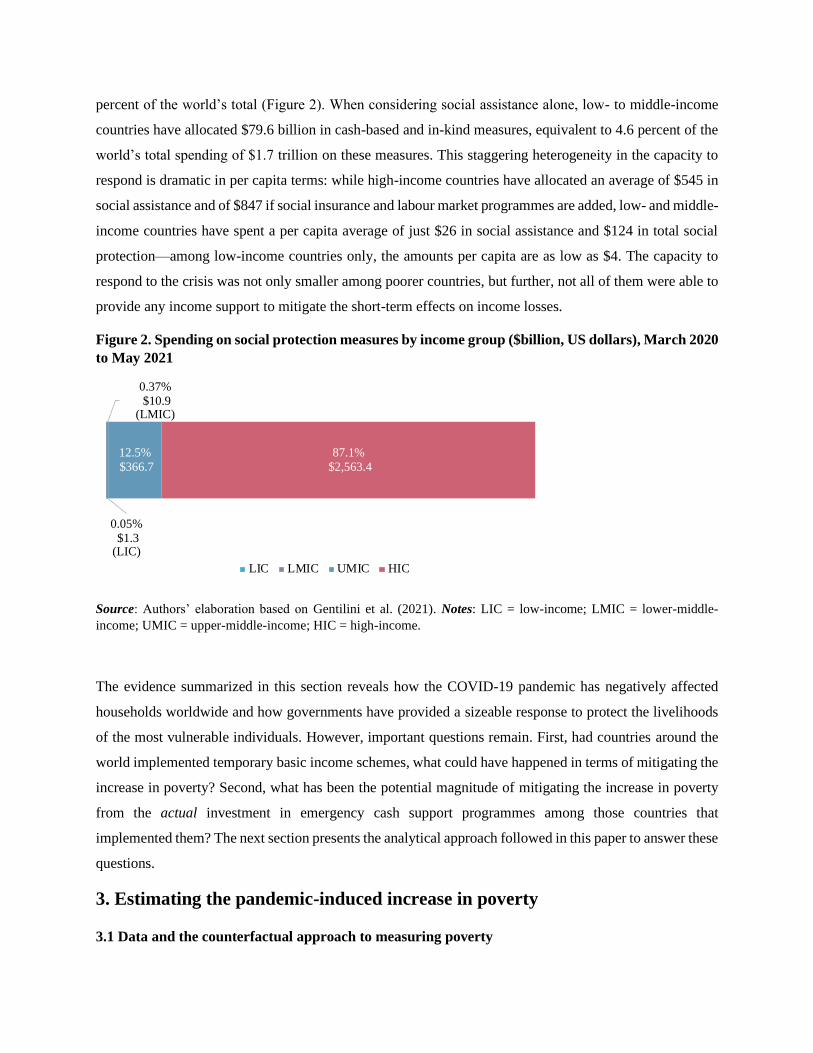
percent of the world’s total (Figure 2). When considering social assistance alone, low- to middle-income
countries have allocated $79.6 billion in cash-based and in-kind measures, equivalent to 4.6 percent of the
world’s total spending of $1.7 trillion on these measures. This staggering heterogeneity in the capacity to
respond is dramatic in per capita terms: while high-income countries have allocated an average of $545 in
social assistance and of $847 if social insurance and labour market programmes are added, low- and middle-
income countries have spent a per capita average of just $26 in social assistance and $124 in total social
protection—among low-income countries only, the amounts per capita are as low as $4. The capacity to
respond to the crisis was not only smaller among poorer countries, but further, not all of them were able to
provide any income support to mitigate the short-term effects on income losses.
Figure 2. Spending on social protection measures by income group ($billion, US dollars), March 2020
to May 2021
Source: Authors’ elaboration based on Gentilini et al. (2021). Notes: LIC = low-income; LMIC = lower-middle-
income; UMIC = upper-middle-income; HIC = high-income.
The evidence summarized in this section reveals how the COVID-19 pandemic has negatively affected
households worldwide and how governments have provided a sizeable response to protect the livelihoods
of the most vulnerable individuals. However, important questions remain. First, had countries around the
world implemented temporary basic income schemes, what could have happened in terms of mitigating the
increase in poverty? Second, what has been the potential magnitude of mitigating the increase in poverty
from the actual investment in emergency cash support programmes among those countries that
implemented them? The next section presents the analytical approach followed in this paper to answer these
questions.
3. Estimating the pandemic-induced increase in poverty
3.1 Data and the counterfactual approach to measuring poverty
0.05%
$1.3 (LIC)
0.37%
$10.9 (LMIC)
12.5%
$366.7
87.1%
$2,563.4
LIC LMIC UMIC HIC
To address the questions presented at the end of the last section, this paper built a cross-country comparable
dataset to estimate the potential magnitude of the increase in poverty headcount rates resulting from the
economic shock induced by the COVID-19 pandemic. To do so, the analysis exploited the latest version of
the World Bank’s online dataset of harmonized household income and consumption surveys, which is the
main data source to report comparable indicators of monetary-based poverty at the regional and global
levels (Arayavechkit et al., 2021).7 The user of this dataset cannot observe per capita income or
consumption at the household level, but rather can retrieve the distributions of those indicators for each
country and year (see, e.g., Dykstra, Dykstra and Sandefur, 2014) using an algorithm applied to the dataset’s
application programming interface (Castaneda Aguilar et al., 2019; Zhao, 2019).8
Specifically, the analysis focused on the most recent household surveys for 160 countries containing about
96.5 percent of the world’s population in 2019–2020.9 To retrieve each country’s distribution, the algorithm
computed the cumulative share of the population with per capita income or consumption below an array of
poverty lines that change in value every $0.10 a day per person (2011 PPP),10 starting from $0.10 up to a
maximum value that covers 99.9 percent of the population. From these cumulative shares, individuals
within each $0.10-bin were isolated and then assigned the middle value of their bin as their daily amount
of per capita income or consumption. That is, for those individuals located within the interval [$0, $0.10],
each one holds $0.05; for those within the interval [$0.10, $0.20], each one holds $0.15, and so on. Since
not all household surveys were collected in a year that is common to all 160 countries, a distribution-neutral
extrapolation of per capita income or consumption, while adjusting for population growth, was performed
between each distribution’s actual year and the year 2019, just before the start of the pandemic, in those
countries where data collection occurred before this year.
The extrapolation follows the approach of Prydz et al. (2019),11 in which each value of the distribution is
multiplied by a factor (𝑛𝑡+1
𝑛𝑡) that represents the annual per capita growth rate between the years 𝑡 and 𝑡 + 1
at constant prices of two potential indicators from national accounts: household final consumption
expenditure per capita (HFCE) and gross domestic product (GDP) per capita. Notice that applying the same
7 PovcalNet March 2021 global poverty update. Household income or consumption surveys are collected on a country-by-country
basis and tend to differ in key methodological aspects as well as in the criteria for open access. The World Bank has led the task of
homogenizing national surveys for consistent and comparable cross-country analyses on monetary-based poverty. 8 The code, written in the R software, is available from the authors upon request. 9 The average and median years among these surveys are 2015 and 2017, respectively. In the dataset, 114 surveys covering 70
percent of the population are for the period 2015-2019; 37 surveys covering 29 percent of the population are for the period 2010-
2014, and the remaining 9 surveys covering 1 percent of the population are for before 2010. See the Appendix for further details
and the list of countries included in the analysis. 10 From here onward and unless otherwise stated, all monetary figures are expressed in international dollars adjusted by purchasing
power parity at 2011 prices (2011 PPP). 11 See also World Bank (2018a), Appendix A, and World Bank (2020), Chapter 1. The latter presents specific details on the
extrapolation of per capita consumption in India, as captured by the latest available survey from 2011. This country is included in
the analysis of this paper.
annual growth rate to each value of the country’s distribution changes its mean value only, while holding
its shape constant; i.e., there are no changes in income or consumption inequality. As noted in Prydz et al.
(2019), HFCE is conceptually closest to the households’ economic activity captured by surveys and, hence,
it is adopted as the preferred source for extrapolation in all countries with the available indicator. In
countries where HFCE is scarce or not available, mainly in Sub-Saharan Africa, the extrapolation uses the
annual growth rate of GDP per capita. To verify the quality and consistency of this exercise, Figure A1 in
the Appendix plots the extrapolated means in each country’s retrieved distribution against the
corresponding survey means extrapolated by the World Bank, suggesting a virtually perfect match between
the two exercises.
By pooling together the 160 distributions lined up to 2019, poverty headcount rates can be estimated
globally and by groups of countries (Table 1) simply by comparing the monetary values associated with
each bin with typical international thresholds, using the size of the population within each bin as weights.
In particular, an individual is identified as poor if her daily per capita income or consumption is below the
following poverty lines per person: $1.90 a day, equivalent to the median value of the national poverty lines
among low-income countries (LIC) and used for global estimates and comparisons of extreme poverty, and
$3.20 and $5.50 a day, or the median values of the national poverty lines among, respectively, lower-
middle-income (LMIC) and upper-middle-income countries (UMIC) (for further details on these lines, see
Jolliffe and Prydz, 2016). Additionally, the analysis identifies those people living below a vulnerability
threshold of $13 a day per person, which is associated with a low probability, 10 percent or less, to fall into
poverty at the $5.50 poverty line.12
Table 1. Number of countries in the dataset and their combined population by aggregates
12 This threshold of $13 a day per person is the updated value (2011 PPP) of the cut-off of $10 a day per person (2005 PPP)
identified by Lopez-Calva and Ortiz-Juarez (2014) as the dividing line between vulnerability to poverty and economic security in
three Latin American countries (Chile, Mexico and Peru) and is consistent with the value estimated for countries in Europe and
Central Asia by Bussolo et al. (2018).
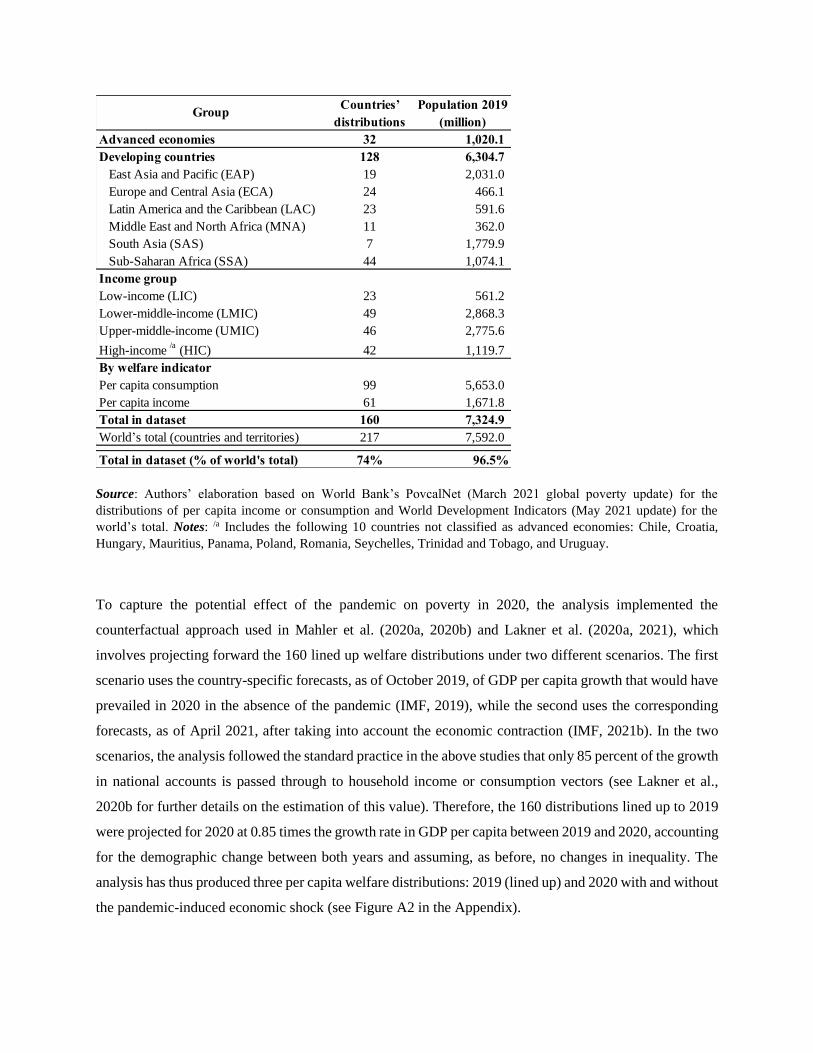
Source: Authors’ elaboration based on World Bank’s PovcalNet (March 2021 global poverty update) for the
distributions of per capita income or consumption and World Development Indicators (May 2021 update) for the
world’s total. Notes: /a Includes the following 10 countries not classified as advanced economies: Chile, Croatia,
Hungary, Mauritius, Panama, Poland, Romania, Seychelles, Trinidad and Tobago, and Uruguay.
To capture the potential effect of the pandemic on poverty in 2020, the analysis implemented the
counterfactual approach used in Mahler et al. (2020a, 2020b) and Lakner et al. (2020a, 2021), which
involves projecting forward the 160 lined up welfare distributions under two different scenarios. The first
scenario uses the country-specific forecasts, as of October 2019, of GDP per capita growth that would have
prevailed in 2020 in the absence of the pandemic (IMF, 2019), while the second uses the corresponding
forecasts, as of April 2021, after taking into account the economic contraction (IMF, 2021b). In the two
scenarios, the analysis followed the standard practice in the above studies that only 85 percent of the growth
in national accounts is passed through to household income or consumption vectors (see Lakner et al.,
2020b for further details on the estimation of this value). Therefore, the 160 distributions lined up to 2019
were projected for 2020 at 0.85 times the growth rate in GDP per capita between 2019 and 2020, accounting
for the demographic change between both years and assuming, as before, no changes in inequality. The
analysis has thus produced three per capita welfare distributions: 2019 (lined up) and 2020 with and without
the pandemic-induced economic shock (see Figure A2 in the Appendix).
Advanced economies 32 1,020.1
Developing countries 128 6,304.7
East Asia and Pacific (EAP) 19 2,031.0
Europe and Central Asia (ECA) 24 466.1
Latin America and the Caribbean (LAC) 23 591.6
Middle East and North Africa (MNA) 11 362.0
South Asia (SAS) 7 1,779.9
Sub-Saharan Africa (SSA) 44 1,074.1
Income group
Low-income (LIC) 23 561.2
Lower-middle-income (LMIC) 49 2,868.3
Upper-middle-income (UMIC) 46 2,775.6
High-income /a (HIC) 42 1,119.7
By welfare indicator
Per capita consumption 99 5,653.0
Per capita income 61 1,671.8
Total in dataset 160 7,324.9
World’s total (countries and territories) 217 7,592.0
Total in dataset (% of world's total) 74% 96.5%
Countries’
distributions
Population 2019
(million)Group
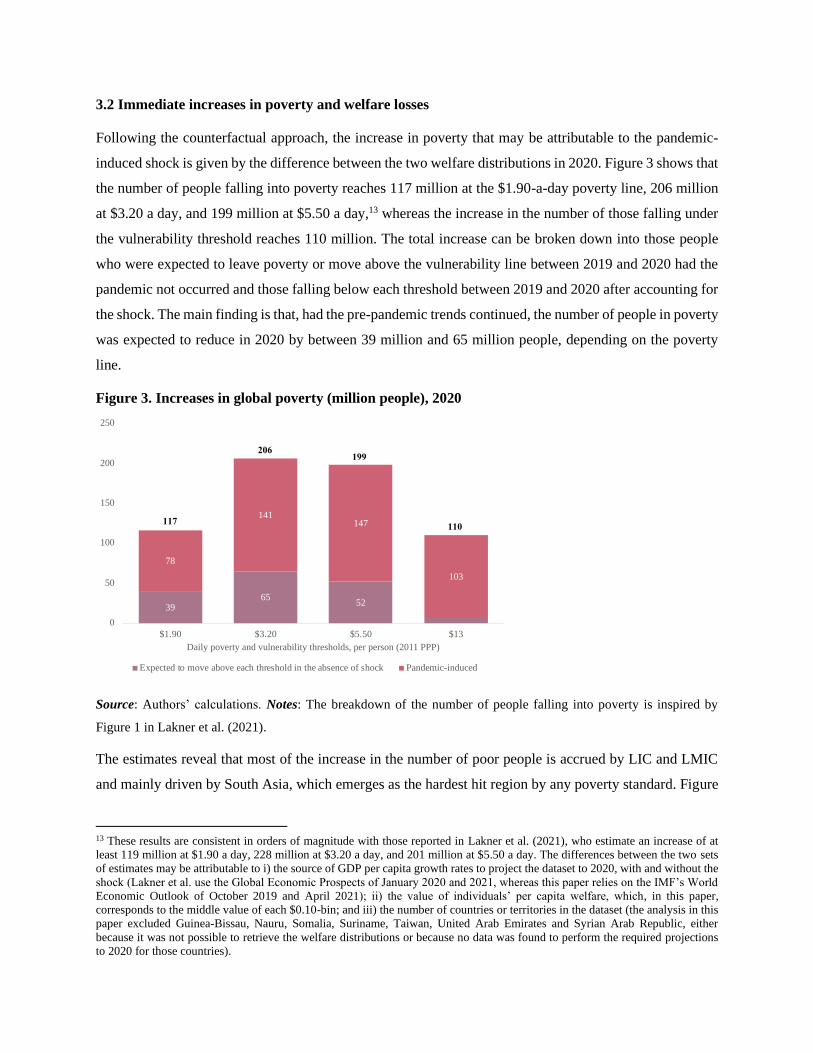
3.2 Immediate increases in poverty and welfare losses
Following the counterfactual approach, the increase in poverty that may be attributable to the pandemic-
induced shock is given by the difference between the two welfare distributions in 2020. Figure 3 shows that
the number of people falling into poverty reaches 117 million at the $1.90-a-day poverty line, 206 million
at $3.20 a day, and 199 million at $5.50 a day,13 whereas the increase in the number of those falling under
the vulnerability threshold reaches 110 million. The total increase can be broken down into those people
who were expected to leave poverty or move above the vulnerability line between 2019 and 2020 had the
pandemic not occurred and those falling below each threshold between 2019 and 2020 after accounting for
the shock. The main finding is that, had the pre-pandemic trends continued, the number of people in poverty
was expected to reduce in 2020 by between 39 million and 65 million people, depending on the poverty
line.
Figure 3. Increases in global poverty (million people), 2020
Source: Authors’ calculations. Notes: The breakdown of the number of people falling into poverty is inspired by
Figure 1 in Lakner et al. (2021).
The estimates reveal that most of the increase in the number of poor people is accrued by LIC and LMIC
and mainly driven by South Asia, which emerges as the hardest hit region by any poverty standard. Figure
13 These results are consistent in orders of magnitude with those reported in Lakner et al. (2021), who estimate an increase of at
least 119 million at $1.90 a day, 228 million at $3.20 a day, and 201 million at $5.50 a day. The differences between the two sets
of estimates may be attributable to i) the source of GDP per capita growth rates to project the dataset to 2020, with and without the
shock (Lakner et al. use the Global Economic Prospects of January 2020 and 2021, whereas this paper relies on the IMF’s World
Economic Outlook of October 2019 and April 2021); ii) the value of individuals’ per capita welfare, which, in this paper,
corresponds to the middle value of each $0.10-bin; and iii) the number of countries or territories in the dataset (the analysis in this
paper excluded Guinea-Bissau, Nauru, Somalia, Suriname, Taiwan, United Arab Emirates and Syrian Arab Republic, either
because it was not possible to retrieve the welfare distributions or because no data was found to perform the required projections
to 2020 for those countries).
3965
52
78
141147
103
0
50
100
150
200
250
$1.90 $3.20 $5.50 $13
Daily poverty and vulnerability thresholds, per person (2011 PPP)
Expected to move above each threshold in the absence of shock Pandemic-induced
117
206199
110
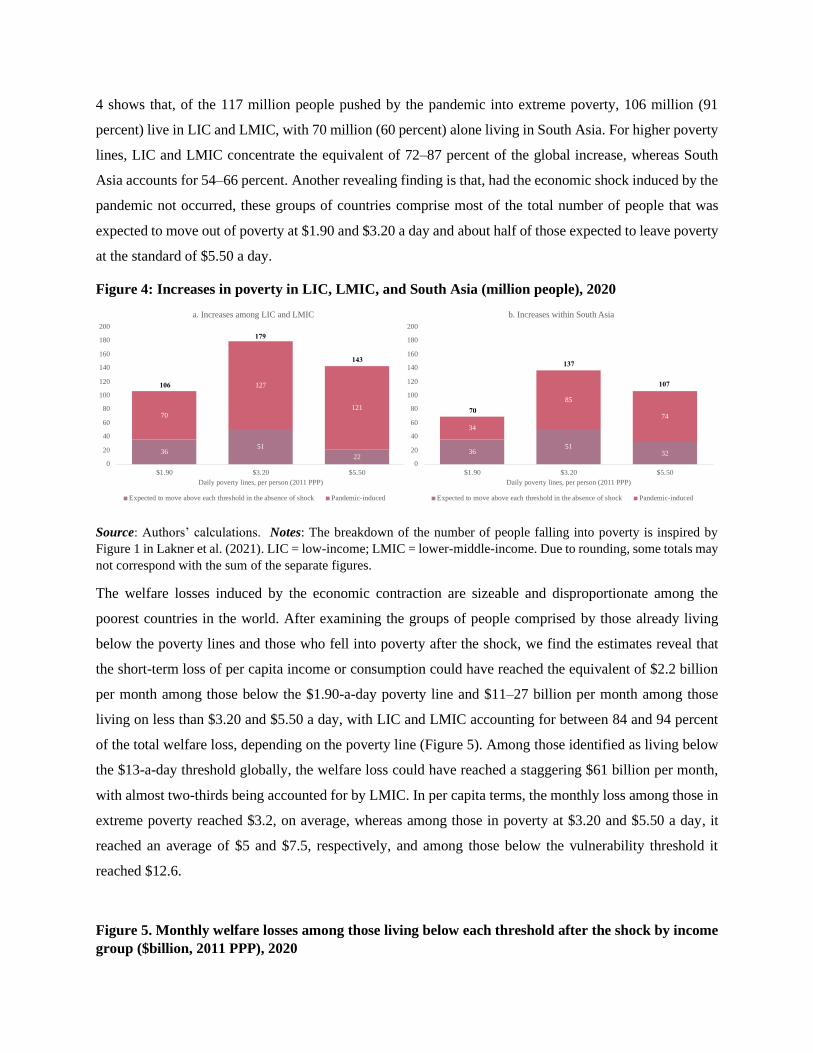
4 shows that, of the 117 million people pushed by the pandemic into extreme poverty, 106 million (91
percent) live in LIC and LMIC, with 70 million (60 percent) alone living in South Asia. For higher poverty
lines, LIC and LMIC concentrate the equivalent of 72–87 percent of the global increase, whereas South
Asia accounts for 54–66 percent. Another revealing finding is that, had the economic shock induced by the
pandemic not occurred, these groups of countries comprise most of the total number of people that was
expected to move out of poverty at $1.90 and $3.20 a day and about half of those expected to leave poverty
at the standard of $5.50 a day.
Figure 4: Increases in poverty in LIC, LMIC, and South Asia (million people), 2020
Source: Authors’ calculations. Notes: The breakdown of the number of people falling into poverty is inspired by
Figure 1 in Lakner et al. (2021). LIC = low-income; LMIC = lower-middle-income. Due to rounding, some totals may
not correspond with the sum of the separate figures.
The welfare losses induced by the economic contraction are sizeable and disproportionate among the
poorest countries in the world. After examining the groups of people comprised by those already living
below the poverty lines and those who fell into poverty after the shock, we find the estimates reveal that
the short-term loss of per capita income or consumption could have reached the equivalent of $2.2 billion
per month among those below the $1.90-a-day poverty line and $11–27 billion per month among those
living on less than $3.20 and $5.50 a day, with LIC and LMIC accounting for between 84 and 94 percent
of the total welfare loss, depending on the poverty line (Figure 5). Among those identified as living below
the $13-a-day threshold globally, the welfare loss could have reached a staggering $61 billion per month,
with almost two-thirds being accounted for by LMIC. In per capita terms, the monthly loss among those in
extreme poverty reached $3.2, on average, whereas among those in poverty at $3.20 and $5.50 a day, it
reached an average of $5 and $7.5, respectively, and among those below the vulnerability threshold it
reached $12.6.
Figure 5. Monthly welfare losses among those living below each threshold after the shock by income
group ($billion, 2011 PPP), 2020
3651
22
70
127
121
0
20
40
60
80
100
120
140
160
180
200
$1.90 $3.20 $5.50
Daily poverty lines, per person (2011 PPP)
a. Increases among LIC and LMIC
Expected to move above each threshold in the absence of shock Pandemic-induced
106
179
143
3651
32
34
85
74
0
20
40
60
80
100
120
140
160
180
200
$1.90 $3.20 $5.50
Daily poverty lines, per person (2011 PPP)
b. Increases within South Asia
Expected to move above each threshold in the absence of shock Pandemic-induced
70
137
107
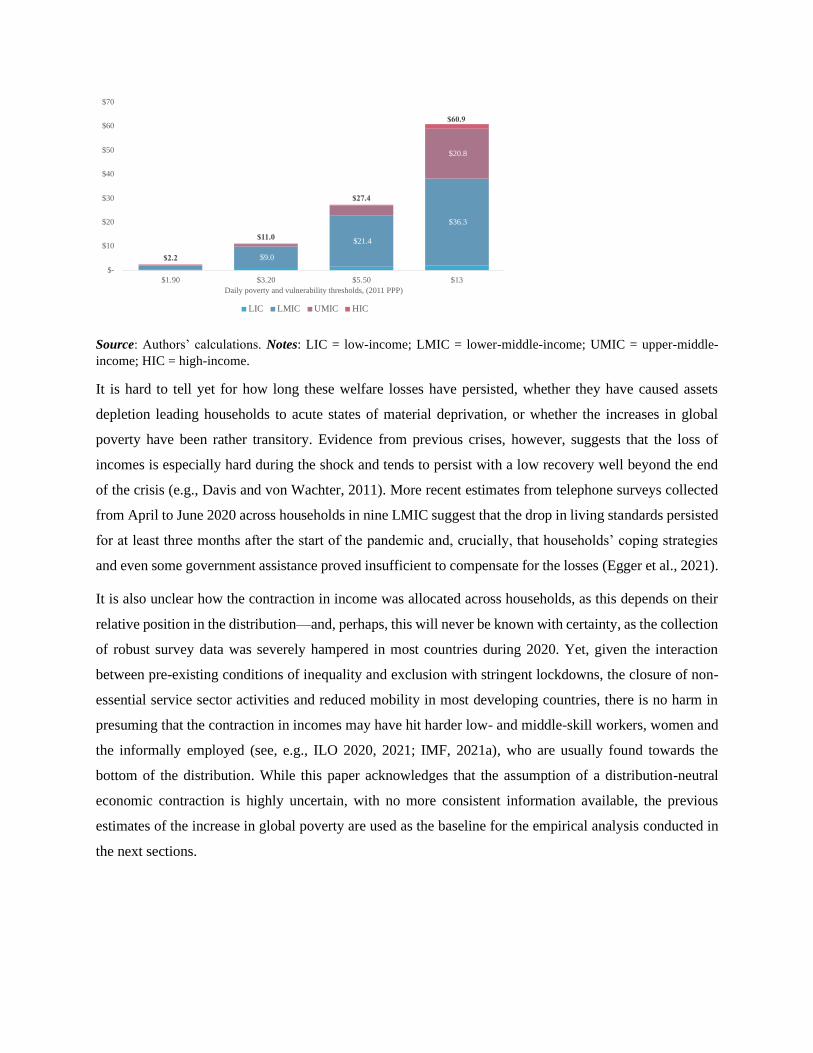
Source: Authors’ calculations. Notes: LIC = low-income; LMIC = lower-middle-income; UMIC = upper-middle-
income; HIC = high-income.
It is hard to tell yet for how long these welfare losses have persisted, whether they have caused assets
depletion leading households to acute states of material deprivation, or whether the increases in global
poverty have been rather transitory. Evidence from previous crises, however, suggests that the loss of
incomes is especially hard during the shock and tends to persist with a low recovery well beyond the end
of the crisis (e.g., Davis and von Wachter, 2011). More recent estimates from telephone surveys collected
from April to June 2020 across households in nine LMIC suggest that the drop in living standards persisted
for at least three months after the start of the pandemic and, crucially, that households’ coping strategies
and even some government assistance proved insufficient to compensate for the losses (Egger et al., 2021).
It is also unclear how the contraction in income was allocated across households, as this depends on their
relative position in the distribution—and, perhaps, this will never be known with certainty, as the collection
of robust survey data was severely hampered in most countries during 2020. Yet, given the interaction
between pre-existing conditions of inequality and exclusion with stringent lockdowns, the closure of non-
essential service sector activities and reduced mobility in most developing countries, there is no harm in
presuming that the contraction in incomes may have hit harder low- and middle-skill workers, women and
the informally employed (see, e.g., ILO 2020, 2021; IMF, 2021a), who are usually found towards the
bottom of the distribution. While this paper acknowledges that the assumption of a distribution-neutral
economic contraction is highly uncertain, with no more consistent information available, the previous
estimates of the increase in global poverty are used as the baseline for the empirical analysis conducted in
the next sections.
$9.0
$21.4
$36.3
$20.8
$2.2
$11.0
$27.4
$60.9
$-
$10
$20
$30
$40
$50
$60
$70
$1.90 $3.20 $5.50 $13
Daily poverty and vulnerability thresholds, (2011 PPP)
LIC LMIC UMIC HIC
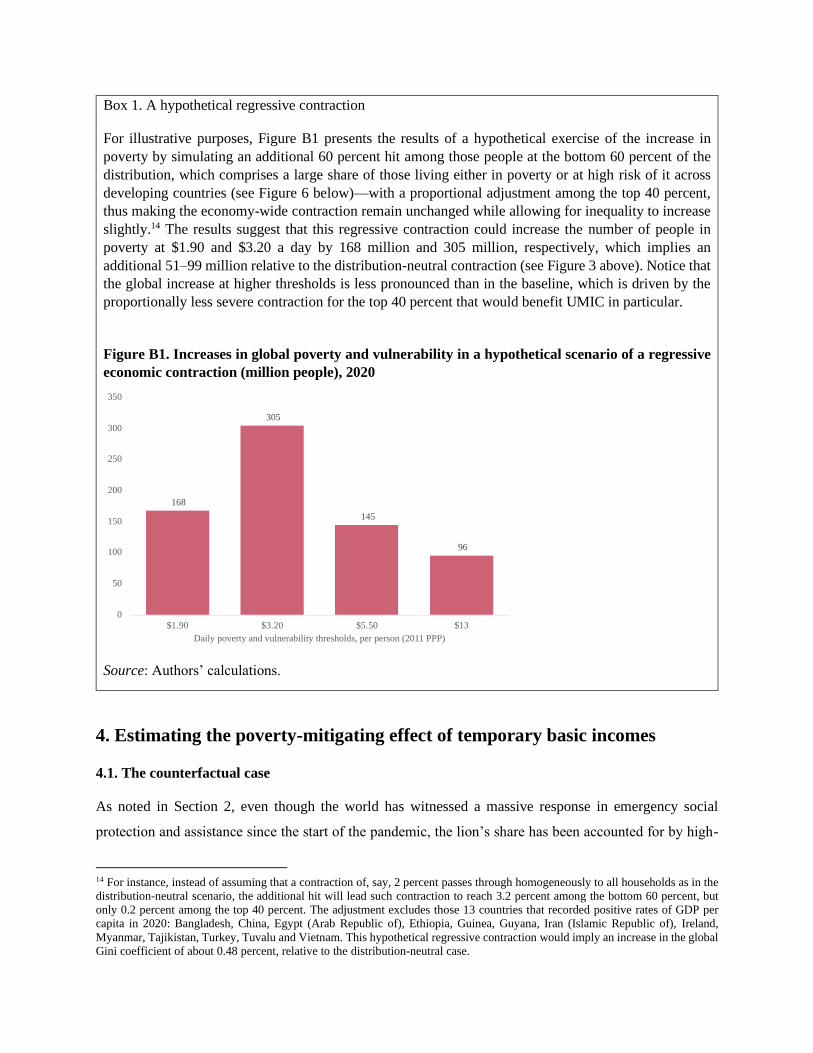
Box 1. A hypothetical regressive contraction
For illustrative purposes, Figure B1 presents the results of a hypothetical exercise of the increase in
poverty by simulating an additional 60 percent hit among those people at the bottom 60 percent of the
distribution, which comprises a large share of those living either in poverty or at high risk of it across
developing countries (see Figure 6 below)—with a proportional adjustment among the top 40 percent,
thus making the economy-wide contraction remain unchanged while allowing for inequality to increase
slightly.14 The results suggest that this regressive contraction could increase the number of people in
poverty at $1.90 and $3.20 a day by 168 million and 305 million, respectively, which implies an
additional 51–99 million relative to the distribution-neutral contraction (see Figure 3 above). Notice that
the global increase at higher thresholds is less pronounced than in the baseline, which is driven by the
proportionally less severe contraction for the top 40 percent that would benefit UMIC in particular.
Figure B1. Increases in global poverty and vulnerability in a hypothetical scenario of a regressive
economic contraction (million people), 2020
Source: Authors’ calculations.
4. Estimating the poverty-mitigating effect of temporary basic incomes
4.1. The counterfactual case
As noted in Section 2, even though the world has witnessed a massive response in emergency social
protection and assistance since the start of the pandemic, the lion’s share has been accounted for by high-
14 For instance, instead of assuming that a contraction of, say, 2 percent passes through homogeneously to all households as in the
distribution-neutral scenario, the additional hit will lead such contraction to reach 3.2 percent among the bottom 60 percent, but
only 0.2 percent among the top 40 percent. The adjustment excludes those 13 countries that recorded positive rates of GDP per
capita in 2020: Bangladesh, China, Egypt (Arab Republic of), Ethiopia, Guinea, Guyana, Iran (Islamic Republic of), Ireland,
Myanmar, Tajikistan, Turkey, Tuvalu and Vietnam. This hypothetical regressive contraction would imply an increase in the global
Gini coefficient of about 0.48 percent, relative to the distribution-neutral case.
168
305
145
96
0
50
100
150
200
250
300
350
$1.90 $3.20 $5.50 $13
Daily poverty and vulnerability thresholds, per person (2011 PPP)
income countries, which have invested a per capita amount in social assistance that is more than 20 times
larger, on average, than the amount spent by developing countries. Not all developing countries, which
account for 99–100 percent of the increase in poverty depending on the poverty line, were able to either
deliver cash support or to provide it for an extended period, considering the duration of the crisis, while
others were able to roll out only in-kind assistance or waivers on utility bills. The pressing question is: Had
developing countries implemented schemes of temporary basic incomes (TBI), what could have been the
magnitude of the mitigation effect on poverty-increase and its fiscal cost?
In a paper released four months into the pandemic, Gray Molina and Ortiz-Juarez (2020) discussed the
implementation challenges and costs of TBI schemes that may have had the potential to benefit up to 2.8
billion people based on varying scenarios of per capita transfers, including top-ups up to a minimum income
threshold and even a share of countries’ median income. While the authors argued for the affordability of
some of those schemes, depending on the duration of the assistance and each country’s living standards,
the progression of the pandemic would have eventually exhausted health systems and severely limited fiscal
space in some contexts, making the delivery of relatively generous cash support schemes prohibitive,
especially in poorer and populous countries. More than one year after the outbreak of COVID-19, instead
of simulating the poverty-mitigating effect of those TBI schemes, the analysis in this subsection focuses on
schemes whose total cost is equivalent to a portion of GDP that is homogeneous across countries and,
arguably, proportional to each country’s fiscal capacity. Similar to Gray Molina and Ortiz-Juarez (2020), it
is assumed that such schemes are delivered on an individual basis, regardless of household composition.
The target population for the TBI is those living below vulnerability thresholds, which change in value
depending on each country’s income level. For starters, the $13-a-day threshold was originally computed
in UMIC contexts (see, e.g., Lopez-Calva and Ortiz-Juarez, 2014; Bussolo et al., 2018), where poverty is
typically measured with the $5.50-a-day poverty line. While such a threshold may be as informative for
global comparisons as measuring poverty with the $1.90-a-day poverty line even in high-income countries
(HIC), it may be very demanding in both LIC and LMIC for targeting purposes. In some countries of the
latter group, where the typical poverty line equals $3.20 a day, a recent estimate suggests that $5.50 a day
is associated with a low vulnerability to poverty (World Bank, 2018b), which is adopted in this paper as the
threshold among all LMIC. As for LIC, where poverty is typically measured at $1.90 a day and with no
known information of an associated vulnerability threshold, it is simply assumed that those at high risk of
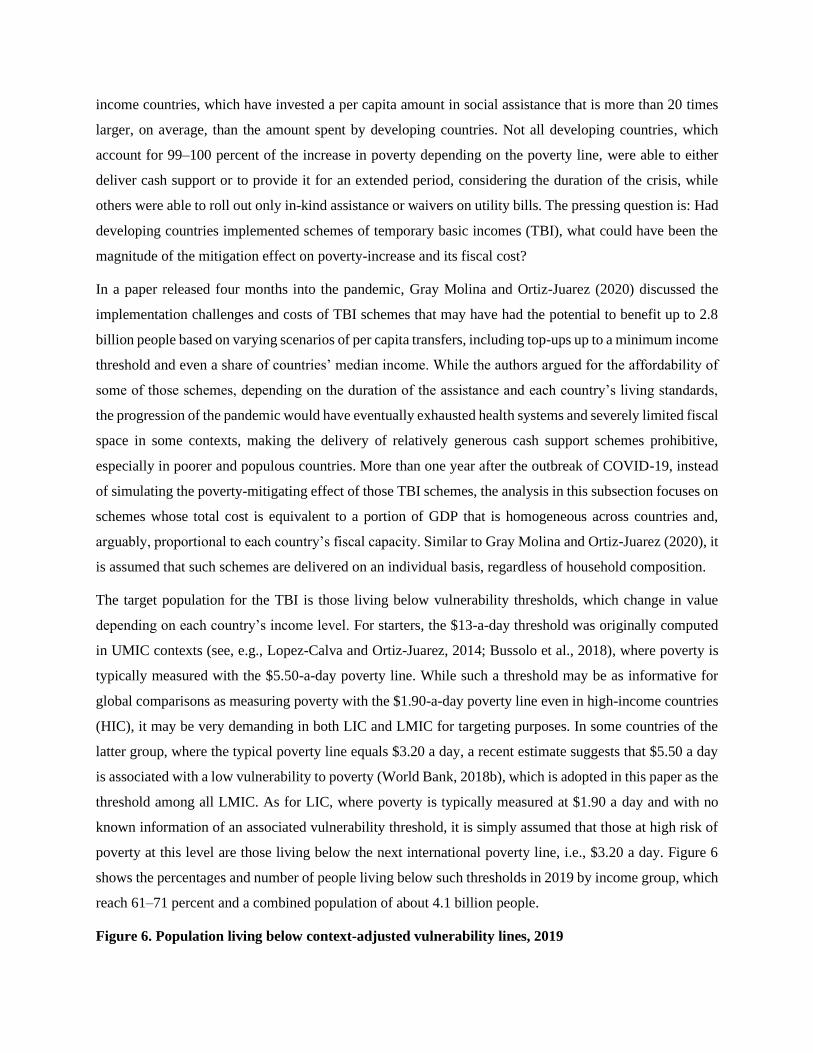
poverty at this level are those living below the next international poverty line, i.e., $3.20 a day. Figure 6
shows the percentages and number of people living below such thresholds in 2019 by income group, which
reach 61–71 percent and a combined population of about 4.1 billion people.
Figure 6. Population living below context-adjusted vulnerability lines, 2019
Source: Authors’ calculations. Notes: The vulnerability threshold per day, per person, used among LIC equals $3.20,
among LMIC equals $5.50 and among UMIC equals $13. The latter group includes the following 10 developing
countries classified as HIC: Chile, Croatia, Hungary, Mauritius, Panama, Poland, Romania, Seychelles, Trinidad and
Tobago, Uruguay. LIC = low-income; LMIC = lower-middle-income; UMIC = upper-middle-income.
In all the simulated schemes, the monthly costs of TBI are derived under the assumption that all developing
countries deliver cash support for at least six months, backed by the above evidence of welfare loss
persistence and slow recovery, with no TBI schemes implemented in advanced economies. The focus on
developing countries is intended to capture the magnitude of the mitigation of poverty increases driven by
these countries only, given the low participation of advanced economies in global poverty rates: less than
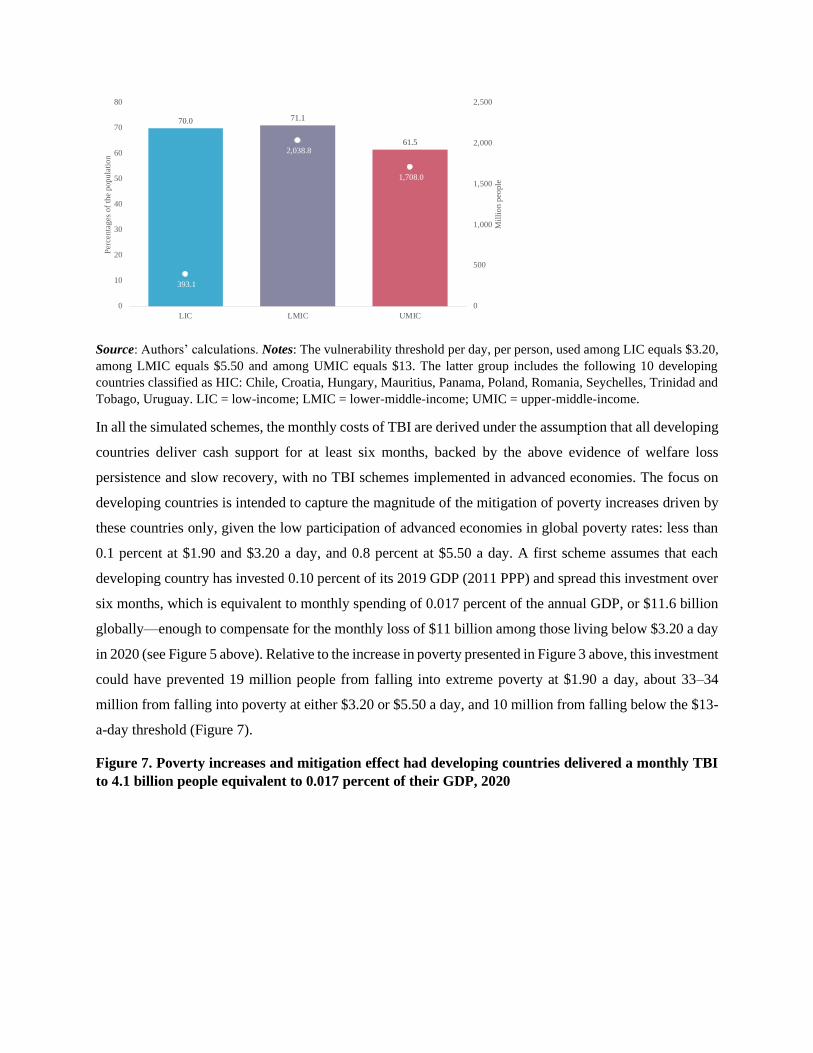
0.1 percent at $1.90 and $3.20 a day, and 0.8 percent at $5.50 a day. A first scheme assumes that each
developing country has invested 0.10 percent of its 2019 GDP (2011 PPP) and spread this investment over
six months, which is equivalent to monthly spending of 0.017 percent of the annual GDP, or $11.6 billion
globally—enough to compensate for the monthly loss of $11 billion among those living below $3.20 a day
in 2020 (see Figure 5 above). Relative to the increase in poverty presented in Figure 3 above, this investment
could have prevented 19 million people from falling into extreme poverty at $1.90 a day, about 33–34
million from falling into poverty at either $3.20 or $5.50 a day, and 10 million from falling below the $13-
a-day threshold (Figure 7).
Figure 7. Poverty increases and mitigation effect had developing countries delivered a monthly TBI
to 4.1 billion people equivalent to 0.017 percent of their GDP, 2020
70.0 71.1
61.5
393.1
2,038.8
1,708.0
0
500
1,000
1,500
2,000
2,500
0
10
20
30
40
50
60
70
80
LIC LMIC UMIC
Mil
lio
n p
eople
Per
cen
tag
es o
f th
e p
op
ula
tio
n
Source: Authors’ calculations. Notes: The figures in panel a correspond to the increases in poverty after accounting
for the pandemic-induced shock and the delivery of a monthly TBI equivalent to 0.017 percent of developing
countries’ GDP ($11.6 billion)—or 0.10 percent of GDP ($69.8 billion) over a period of six months. The figures in
panel b are the corresponding differences between the increases in panel a and those presented in Figure 3. Due to
rounding, some totals may not correspond with the sum of the separate figures.
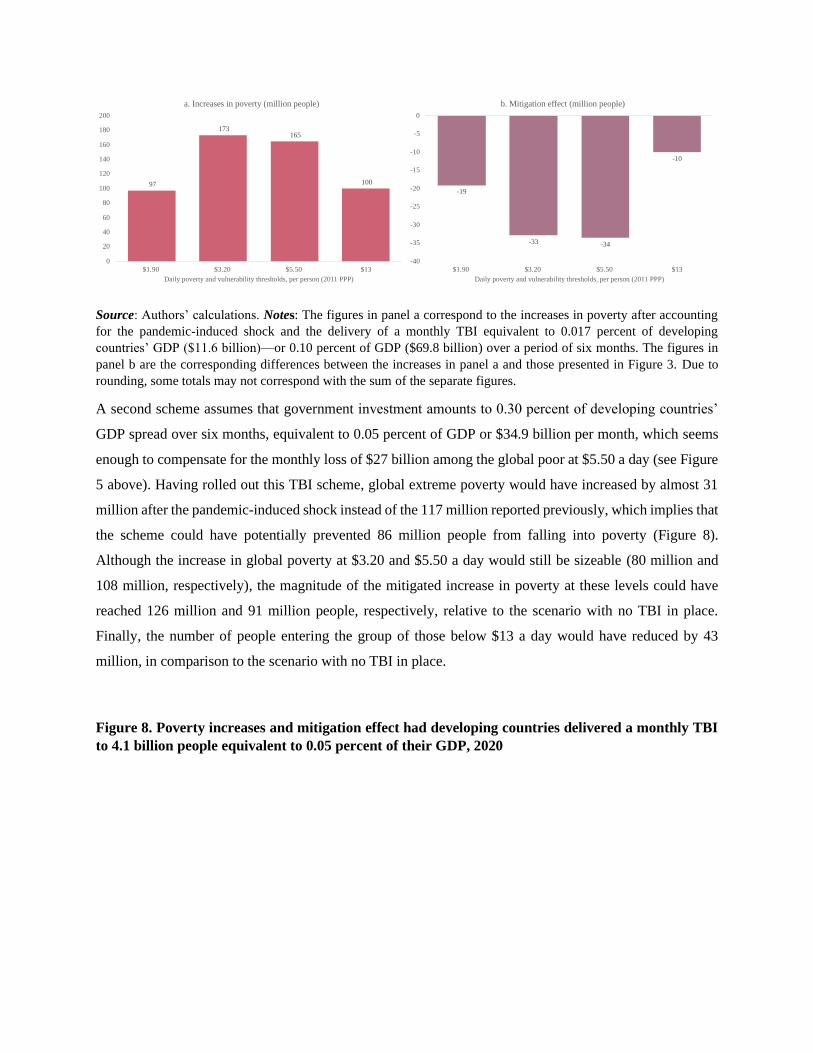
A second scheme assumes that government investment amounts to 0.30 percent of developing countries’
GDP spread over six months, equivalent to 0.05 percent of GDP or $34.9 billion per month, which seems
enough to compensate for the monthly loss of $27 billion among the global poor at $5.50 a day (see Figure
5 above). Having rolled out this TBI scheme, global extreme poverty would have increased by almost 31
million after the pandemic-induced shock instead of the 117 million reported previously, which implies that
the scheme could have potentially prevented 86 million people from falling into poverty (Figure 8).
Although the increase in global poverty at $3.20 and $5.50 a day would still be sizeable (80 million and
108 million, respectively), the magnitude of the mitigated increase in poverty at these levels could have
reached 126 million and 91 million people, respectively, relative to the scenario with no TBI in place.
Finally, the number of people entering the group of those below $13 a day would have reduced by 43
million, in comparison to the scenario with no TBI in place.
Figure 8. Poverty increases and mitigation effect had developing countries delivered a monthly TBI
to 4.1 billion people equivalent to 0.05 percent of their GDP, 2020
97
173 165
100
0
20
40
60
80
100
120
140
160
180
200
$1.90 $3.20 $5.50 $13
Daily poverty and vulnerability thresholds, per person (2011 PPP)
a. Increases in poverty (million people)
-19
-33 -34
-10
-40
-35
-30
-25
-20
-15
-10
-5
0
$1.90 $3.20 $5.50 $13
Daily poverty and vulnerability thresholds, per person (2011 PPP)
b. Mitigation effect (million people)
Source: Authors’ calculations. Notes: The figures in panel a correspond to the increases in poverty after accounting
for the pandemic-induced shock and the delivery of a monthly TBI equivalent to 0.05 percent of developing countries’
GDP ($34.9 billion)—or 0.30 percent of GDP ($209.3 billion) over a period of six months. The figures in panel b are
the corresponding differences between the increases in panel a and those presented in Figure 3. Due to rounding, some
totals may not correspond with the sum of the separate figures.
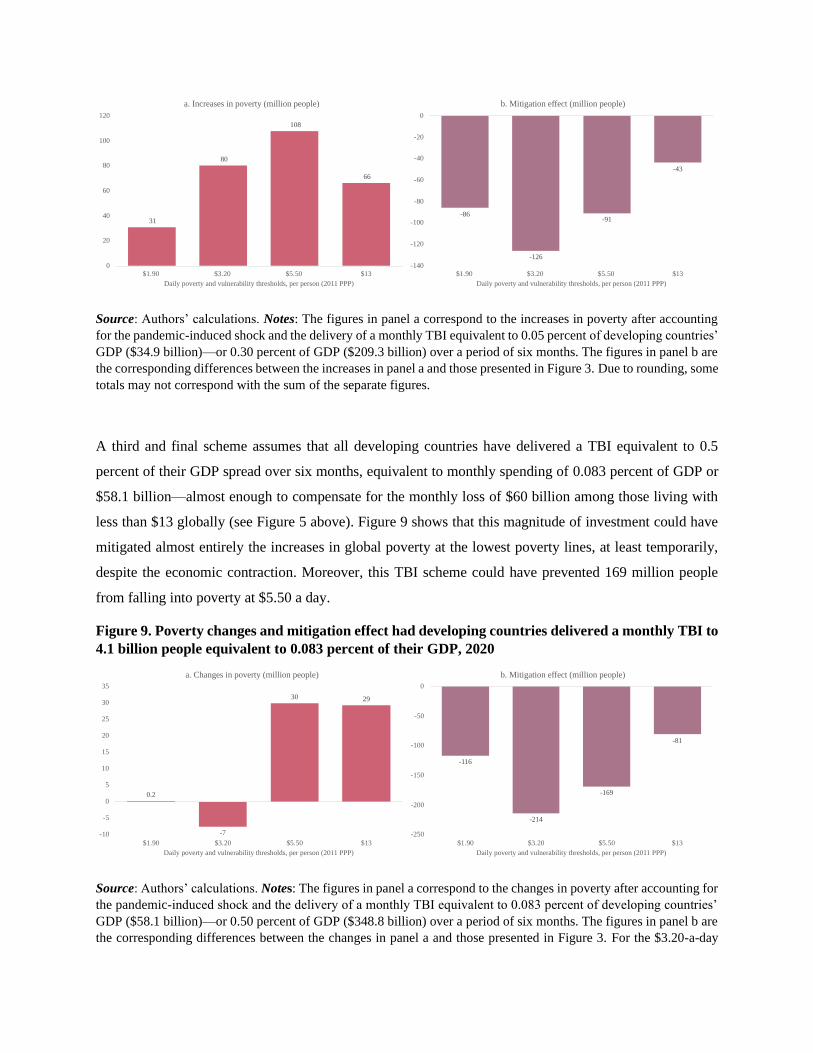
A third and final scheme assumes that all developing countries have delivered a TBI equivalent to 0.5
percent of their GDP spread over six months, equivalent to monthly spending of 0.083 percent of GDP or
$58.1 billion—almost enough to compensate for the monthly loss of $60 billion among those living with
less than $13 globally (see Figure 5 above). Figure 9 shows that this magnitude of investment could have
mitigated almost entirely the increases in global poverty at the lowest poverty lines, at least temporarily,
despite the economic contraction. Moreover, this TBI scheme could have prevented 169 million people
from falling into poverty at $5.50 a day.
Figure 9. Poverty changes and mitigation effect had developing countries delivered a monthly TBI to
4.1 billion people equivalent to 0.083 percent of their GDP, 2020
Source: Authors’ calculations. Notes: The figures in panel a correspond to the changes in poverty after accounting for
the pandemic-induced shock and the delivery of a monthly TBI equivalent to 0.083 percent of developing countries’
GDP ($58.1 billion)—or 0.50 percent of GDP ($348.8 billion) over a period of six months. The figures in panel b are
the corresponding differences between the changes in panel a and those presented in Figure 3. For the $3.20-a-day
31
80
108
66
0
20
40
60
80
100
120
$1.90 $3.20 $5.50 $13
Daily poverty and vulnerability thresholds, per person (2011 PPP)
a. Increases in poverty (million people)
-86
-126
-91
-43
-140
-120
-100
-80
-60
-40
-20
0
$1.90 $3.20 $5.50 $13
Daily poverty and vulnerability thresholds, per person (2011 PPP)
b. Mitigation effect (million people)
0.2
-7
30 29
-10
-5
0
5
10
15
20
25
30
35
$1.90 $3.20 $5.50 $13
Daily poverty and vulnerability thresholds, per person (2011 PPP)
a. Changes in poverty (million people)
-116
-214
-169
-81
-250
-200
-150
-100
-50
0
$1.90 $3.20 $5.50 $13
Daily poverty and vulnerability thresholds, per person (2011 PPP)
b. Mitigation effect (million people)
threshold, the figure of -214 million people in panel b results from the sum of the mitigated increase of 206 million
people (Figure 3) and additional poverty reduction impact of 7 million people (panel a). Due to rounding, some totals
may not correspond with the sum of the separate figures.
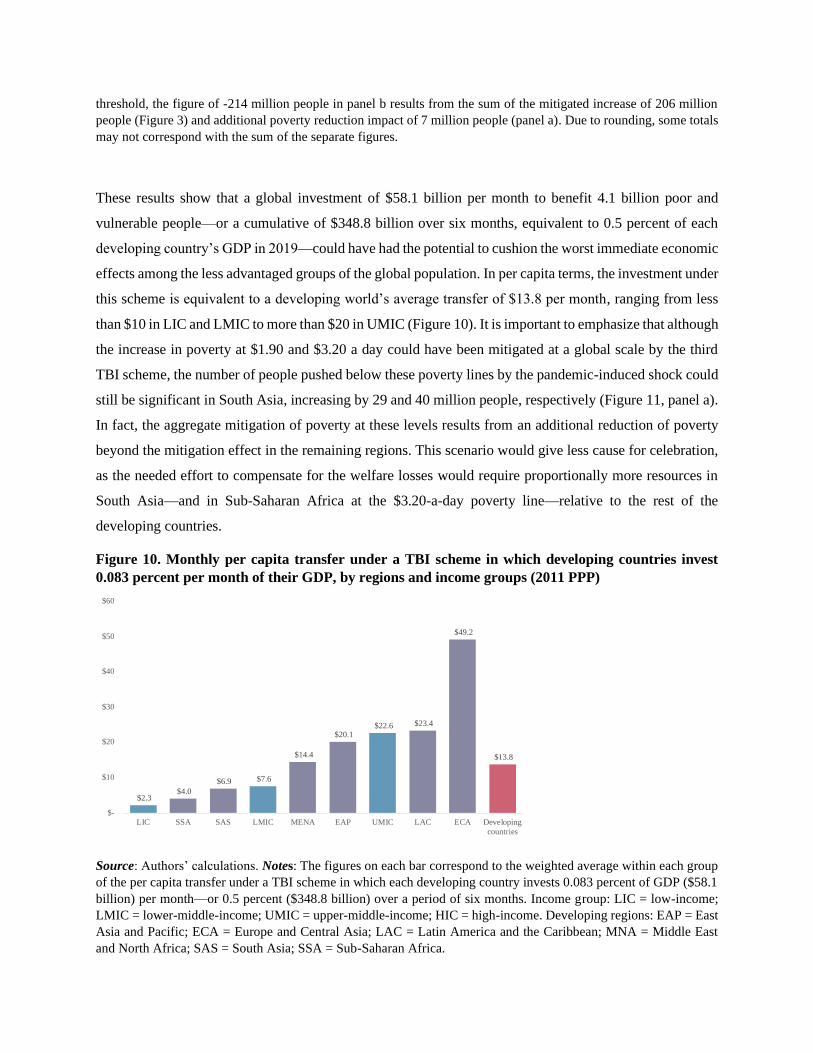
These results show that a global investment of $58.1 billion per month to benefit 4.1 billion poor and
vulnerable people—or a cumulative of $348.8 billion over six months, equivalent to 0.5 percent of each
developing country’s GDP in 2019—could have had the potential to cushion the worst immediate economic
effects among the less advantaged groups of the global population. In per capita terms, the investment under
this scheme is equivalent to a developing world’s average transfer of $13.8 per month, ranging from less
than $10 in LIC and LMIC to more than $20 in UMIC (Figure 10). It is important to emphasize that although
the increase in poverty at $1.90 and $3.20 a day could have been mitigated at a global scale by the third
TBI scheme, the number of people pushed below these poverty lines by the pandemic-induced shock could
still be significant in South Asia, increasing by 29 and 40 million people, respectively (Figure 11, panel a).
In fact, the aggregate mitigation of poverty at these levels results from an additional reduction of poverty
beyond the mitigation effect in the remaining regions. This scenario would give less cause for celebration,
as the needed effort to compensate for the welfare losses would require proportionally more resources in
South Asia—and in Sub-Saharan Africa at the $3.20-a-day poverty line—relative to the rest of the
developing countries.
Figure 10. Monthly per capita transfer under a TBI scheme in which developing countries invest
0.083 percent per month of their GDP, by regions and income groups (2011 PPP)
Source: Authors’ calculations. Notes: The figures on each bar correspond to the weighted average within each group
of the per capita transfer under a TBI scheme in which each developing country invests 0.083 percent of GDP ($58.1
billion) per month—or 0.5 percent ($348.8 billion) over a period of six months. Income group: LIC = low-income;
LMIC = lower-middle-income; UMIC = upper-middle-income; HIC = high-income. Developing regions: EAP = East
Asia and Pacific; ECA = Europe and Central Asia; LAC = Latin America and the Caribbean; MNA = Middle East
and North Africa; SAS = South Asia; SSA = Sub-Saharan Africa.
$2.3 $4.0
$6.9 $7.6
$14.4
$20.1 $22.6 $23.4
$49.2
$13.8
$-
$10
$20
$30
$40
$50
$60
LIC SSA SAS LMIC MENA EAP UMIC LAC ECA Developing
countries
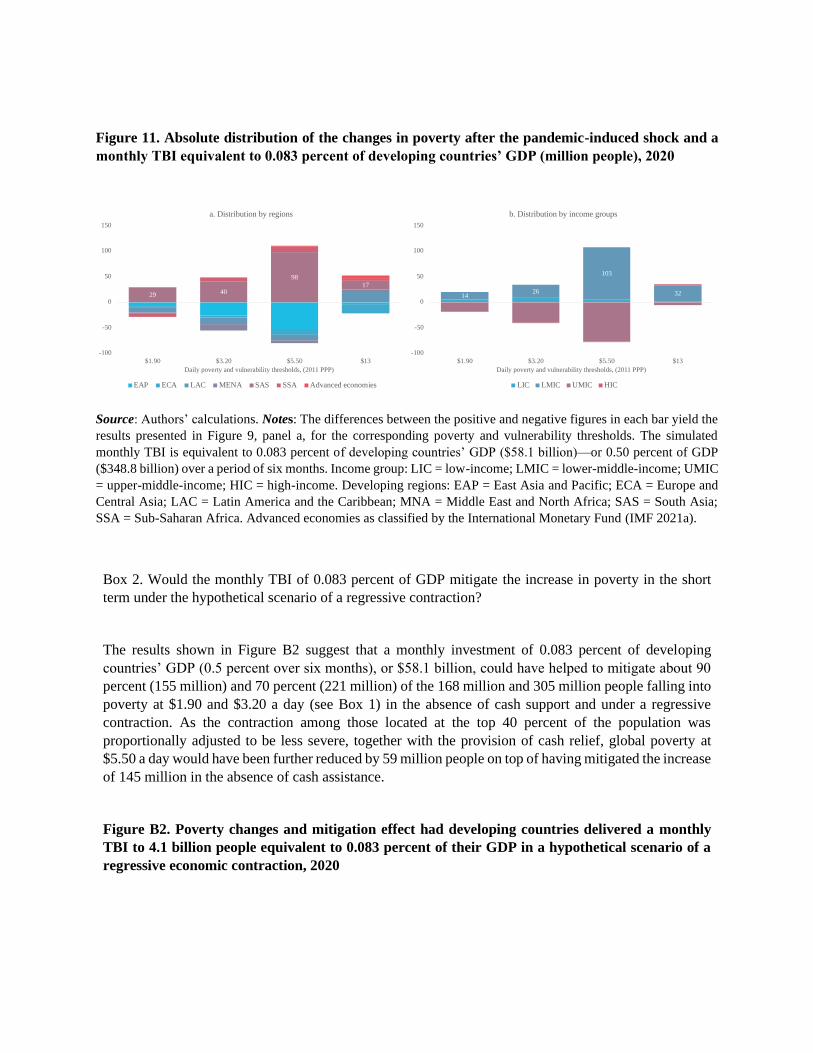
Figure 11. Absolute distribution of the changes in poverty after the pandemic-induced shock and a
monthly TBI equivalent to 0.083 percent of developing countries’ GDP (million people), 2020
Source: Authors’ calculations. Notes: The differences between the positive and negative figures in each bar yield the
results presented in Figure 9, panel a, for the corresponding poverty and vulnerability thresholds. The simulated
monthly TBI is equivalent to 0.083 percent of developing countries’ GDP ($58.1 billion)—or 0.50 percent of GDP
($348.8 billion) over a period of six months. Income group: LIC = low-income; LMIC = lower-middle-income; UMIC
= upper-middle-income; HIC = high-income. Developing regions: EAP = East Asia and Pacific; ECA = Europe and
Central Asia; LAC = Latin America and the Caribbean; MNA = Middle East and North Africa; SAS = South Asia;
SSA = Sub-Saharan Africa. Advanced economies as classified by the International Monetary Fund (IMF 2021a).
Box 2. Would the monthly TBI of 0.083 percent of GDP mitigate the increase in poverty in the short
term under the hypothetical scenario of a regressive contraction?
The results shown in Figure B2 suggest that a monthly investment of 0.083 percent of developing
countries’ GDP (0.5 percent over six months), or $58.1 billion, could have helped to mitigate about 90
percent (155 million) and 70 percent (221 million) of the 168 million and 305 million people falling into
poverty at $1.90 and $3.20 a day (see Box 1) in the absence of cash support and under a regressive
contraction. As the contraction among those located at the top 40 percent of the population was
proportionally adjusted to be less severe, together with the provision of cash relief, global poverty at
$5.50 a day would have been further reduced by 59 million people on top of having mitigated the increase
of 145 million in the absence of cash assistance.
Figure B2. Poverty changes and mitigation effect had developing countries delivered a monthly
TBI to 4.1 billion people equivalent to 0.083 percent of their GDP in a hypothetical scenario of a
regressive economic contraction, 2020
29 40
98
17
-100
-50
0
50
100
150
$1.90 $3.20 $5.50 $13
Daily poverty and vulnerability thresholds, (2011 PPP)
a. Distribution by regions
EAP ECA LAC MENA SAS SSA Advanced economies
1426
103
32
-100
-50
0
50
100
150
$1.90 $3.20 $5.50 $13
Daily poverty and vulnerability thresholds, (2011 PPP)
b. Distribution by income groups
LIC LMIC UMIC HIC
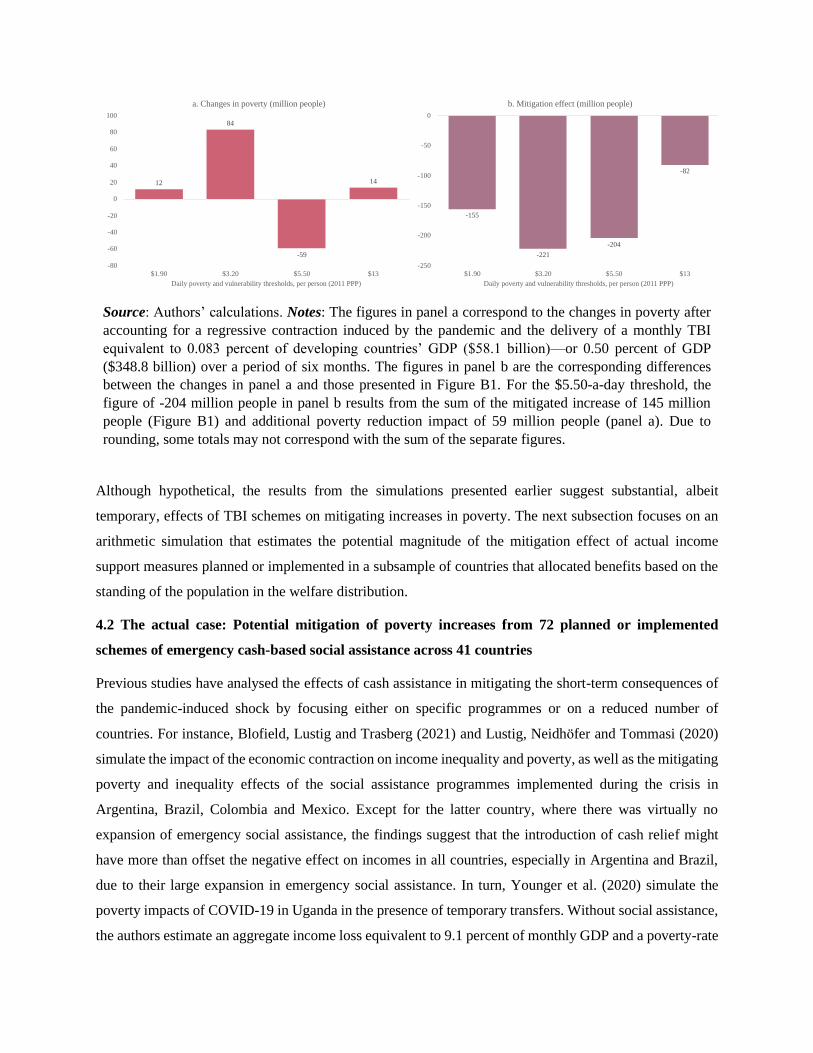
Source: Authors’ calculations. Notes: The figures in panel a correspond to the changes in poverty after
accounting for a regressive contraction induced by the pandemic and the delivery of a monthly TBI
equivalent to 0.083 percent of developing countries’ GDP ($58.1 billion)—or 0.50 percent of GDP
($348.8 billion) over a period of six months. The figures in panel b are the corresponding differences
between the changes in panel a and those presented in Figure B1. For the $5.50-a-day threshold, the
figure of -204 million people in panel b results from the sum of the mitigated increase of 145 million
people (Figure B1) and additional poverty reduction impact of 59 million people (panel a). Due to
rounding, some totals may not correspond with the sum of the separate figures.
Although hypothetical, the results from the simulations presented earlier suggest substantial, albeit
temporary, effects of TBI schemes on mitigating increases in poverty. The next subsection focuses on an
arithmetic simulation that estimates the potential magnitude of the mitigation effect of actual income
support measures planned or implemented in a subsample of countries that allocated benefits based on the
standing of the population in the welfare distribution.
4.2 The actual case: Potential mitigation of poverty increases from 72 planned or implemented
schemes of emergency cash-based social assistance across 41 countries
Previous studies have analysed the effects of cash assistance in mitigating the short-term consequences of
the pandemic-induced shock by focusing either on specific programmes or on a reduced number of
countries. For instance, Blofield, Lustig and Trasberg (2021) and Lustig, Neidhofer and Tommasi (2020)
simulate the impact of the economic contraction on income inequality and poverty, as well as the mitigating
poverty and inequality effects of the social assistance programmes implemented during the crisis in
Argentina, Brazil, Colombia and Mexico. Except for the latter country, where there was virtually no
expansion of emergency social assistance, the findings suggest that the introduction of cash relief might
have more than offset the negative effect on incomes in all countries, especially in Argentina and Brazil,
due to their large expansion in emergency social assistance. In turn, Younger et al. (2020) simulate the
poverty impacts of COVID-19 in Uganda in the presence of temporary transfers. Without social assistance,
the authors estimate an aggregate income loss equivalent to 9.1 percent of monthly GDP and a poverty-rate
12
84
-59
14
-80
-60
-40
-20
0
20
40
60
80
100
$1.90 $3.20 $5.50 $13
Daily poverty and vulnerability thresholds, per person (2011 PPP)
a. Changes in poverty (million people)
-155
-221
-204
-82
-250
-200
-150
-100
-50
0
$1.90 $3.20 $5.50 $13
Daily poverty and vulnerability thresholds, per person (2011 PPP)
b. Mitigation effect (million people)
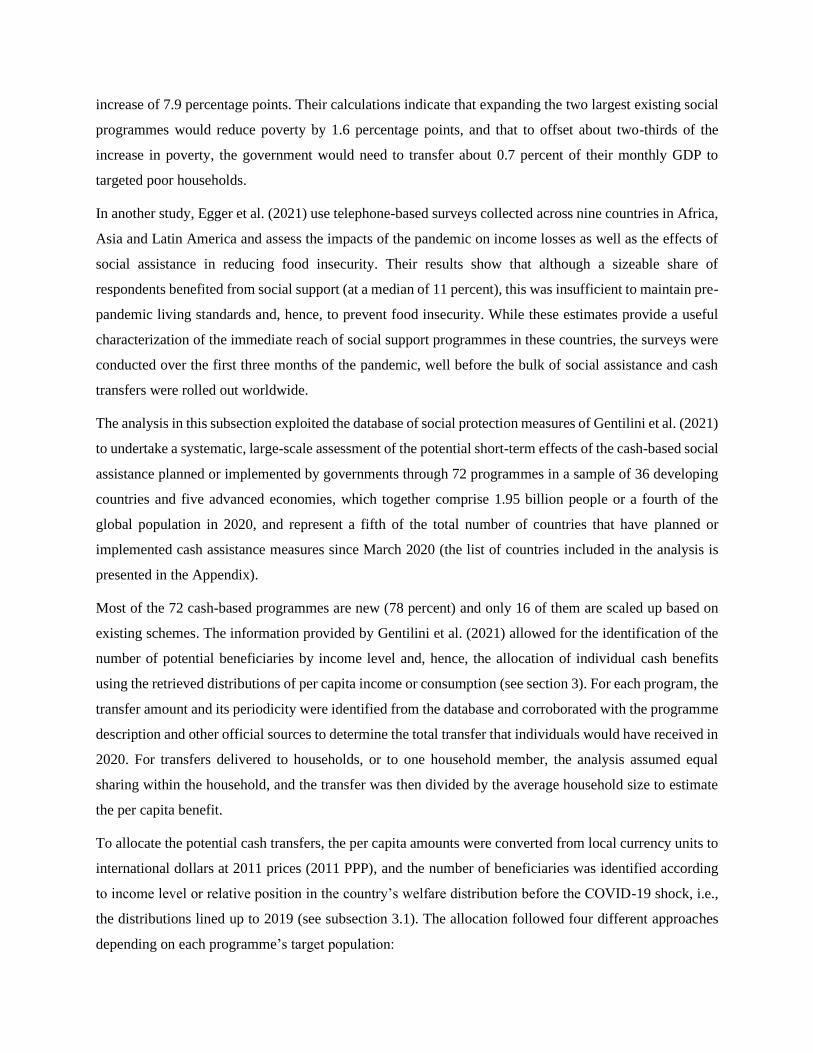
increase of 7.9 percentage points. Their calculations indicate that expanding the two largest existing social
programmes would reduce poverty by 1.6 percentage points, and that to offset about two-thirds of the
increase in poverty, the government would need to transfer about 0.7 percent of their monthly GDP to
targeted poor households.
In another study, Egger et al. (2021) use telephone-based surveys collected across nine countries in Africa,
Asia and Latin America and assess the impacts of the pandemic on income losses as well as the effects of
social assistance in reducing food insecurity. Their results show that although a sizeable share of
respondents benefited from social support (at a median of 11 percent), this was insufficient to maintain pre-
pandemic living standards and, hence, to prevent food insecurity. While these estimates provide a useful
characterization of the immediate reach of social support programmes in these countries, the surveys were
conducted over the first three months of the pandemic, well before the bulk of social assistance and cash
transfers were rolled out worldwide.
The analysis in this subsection exploited the database of social protection measures of Gentilini et al. (2021)
to undertake a systematic, large-scale assessment of the potential short-term effects of the cash-based social
assistance planned or implemented by governments through 72 programmes in a sample of 36 developing
countries and five advanced economies, which together comprise 1.95 billion people or a fourth of the
global population in 2020, and represent a fifth of the total number of countries that have planned or
implemented cash assistance measures since March 2020 (the list of countries included in the analysis is
presented in the Appendix).
Most of the 72 cash-based programmes are new (78 percent) and only 16 of them are scaled up based on
existing schemes. The information provided by Gentilini et al. (2021) allowed for the identification of the
number of potential beneficiaries by income level and, hence, the allocation of individual cash benefits
using the retrieved distributions of per capita income or consumption (see section 3). For each program, the
transfer amount and its periodicity were identified from the database and corroborated with the programme
description and other official sources to determine the total transfer that individuals would have received in
2020. For transfers delivered to households, or to one household member, the analysis assumed equal
sharing within the household, and the transfer was then divided by the average household size to estimate
the per capita benefit.
To allocate the potential cash transfers, the per capita amounts were converted from local currency units to
international dollars at 2011 prices (2011 PPP), and the number of beneficiaries was identified according
to income level or relative position in the country’s welfare distribution before the COVID-19 shock, i.e.,
the distributions lined up to 2019 (see subsection 3.1). The allocation followed four different approaches
depending on each programme’s target population:
1. Universal transfers were assigned to all individuals irrespective of their income level.
2. Transfers targeted to people living in poverty, or to beneficiaries of existing social assistance
programmes, were allocated from the bottom tail of the distribution and upward until the total number
of beneficiaries was reached.
3. Programmes that explicitly exclude beneficiaries of existing social assistance schemes but are still
aimed at low-income people were allocated to individuals just above the corresponding poverty line
(depending on country’s income level) and upward until the total number of beneficiaries was
reached.
4. Those transfers targeting self-employed, informal workers or other vulnerable groups that are not
necessarily poor were assigned to individuals just below the context-specific vulnerability thresholds
(see previous subsection) and downward until the total number of beneficiaries was reached.15
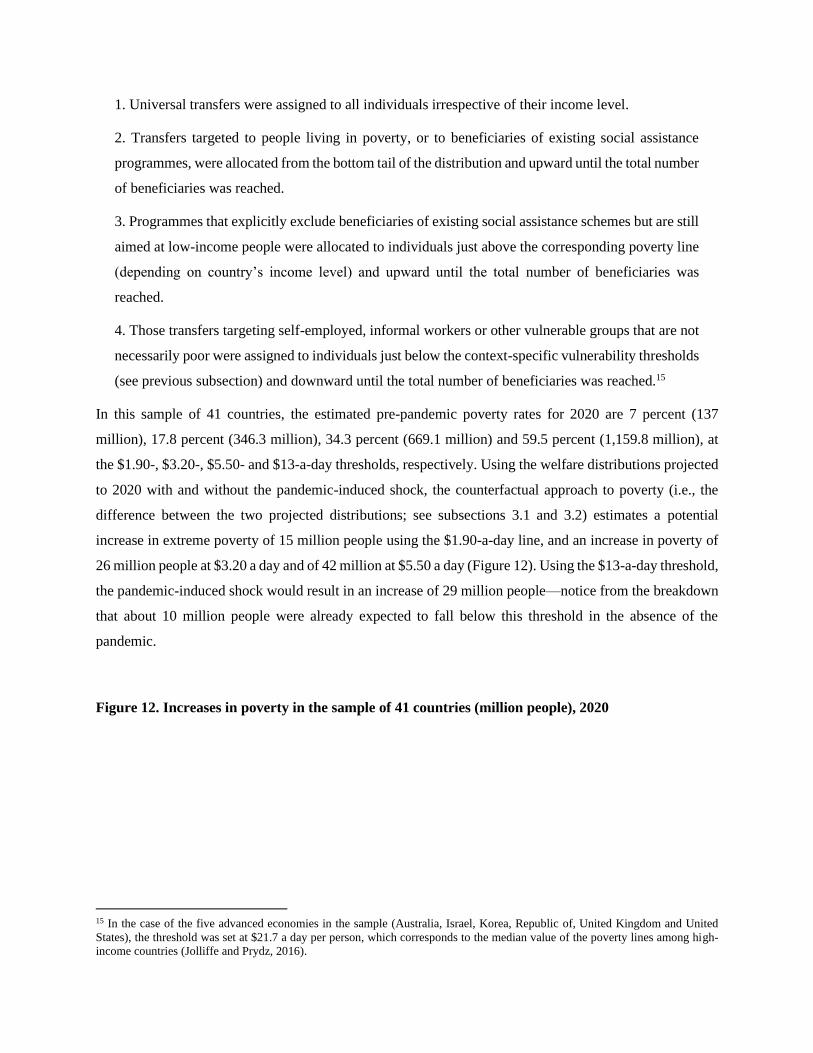
In this sample of 41 countries, the estimated pre-pandemic poverty rates for 2020 are 7 percent (137
million), 17.8 percent (346.3 million), 34.3 percent (669.1 million) and 59.5 percent (1,159.8 million), at
the $1.90-, $3.20-, $5.50- and $13-a-day thresholds, respectively. Using the welfare distributions projected
to 2020 with and without the pandemic-induced shock, the counterfactual approach to poverty (i.e., the
difference between the two projected distributions; see subsections 3.1 and 3.2) estimates a potential
increase in extreme poverty of 15 million people using the $1.90-a-day line, and an increase in poverty of
26 million people at $3.20 a day and of 42 million at $5.50 a day (Figure 12). Using the $13-a-day threshold,
the pandemic-induced shock would result in an increase of 29 million people—notice from the breakdown
that about 10 million people were already expected to fall below this threshold in the absence of the
pandemic.
Figure 12. Increases in poverty in the sample of 41 countries (million people), 2020
15 In the case of the five advanced economies in the sample (Australia, Israel, Korea, Republic of, United Kingdom and United
States), the threshold was set at $21.7 a day per person, which corresponds to the median value of the poverty lines among high-
income countries (Jolliffe and Prydz, 2016).
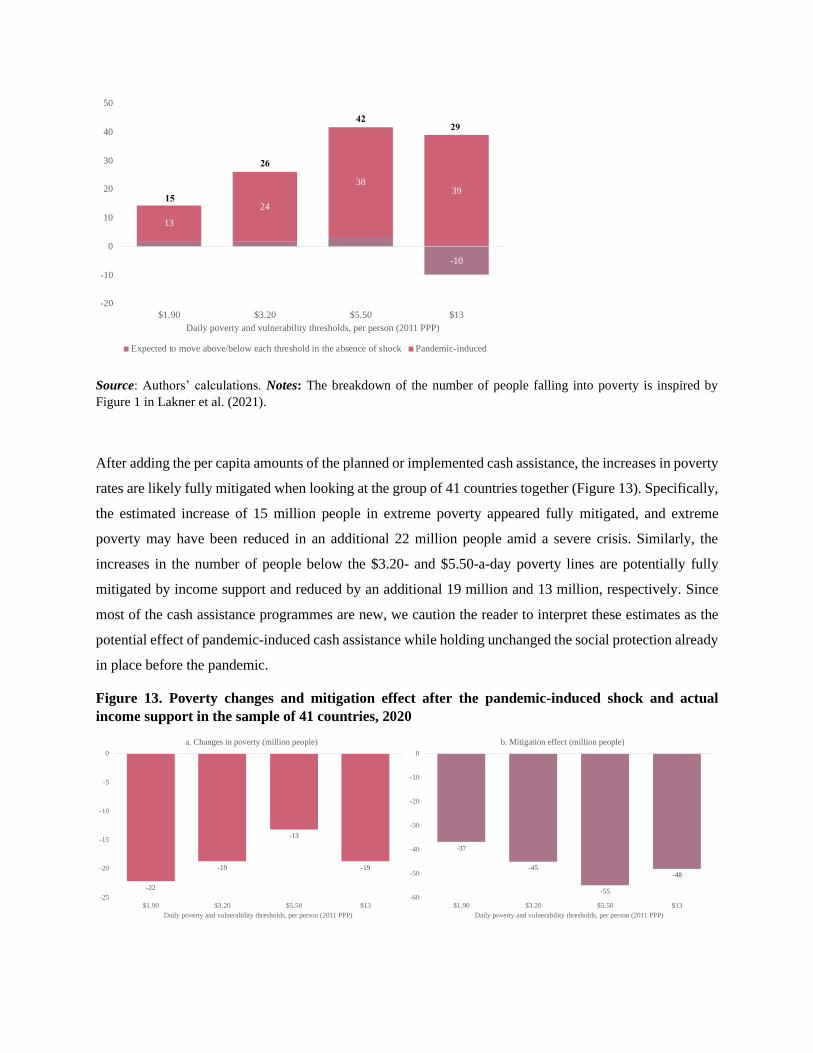
Source: Authors’ calculations. Notes: The breakdown of the number of people falling into poverty is inspired by
Figure 1 in Lakner et al. (2021).
After adding the per capita amounts of the planned or implemented cash assistance, the increases in poverty
rates are likely fully mitigated when looking at the group of 41 countries together (Figure 13). Specifically,
the estimated increase of 15 million people in extreme poverty appeared fully mitigated, and extreme
poverty may have been reduced in an additional 22 million people amid a severe crisis. Similarly, the
increases in the number of people below the $3.20- and $5.50-a-day poverty lines are potentially fully
mitigated by income support and reduced by an additional 19 million and 13 million, respectively. Since
most of the cash assistance programmes are new, we caution the reader to interpret these estimates as the
potential effect of pandemic-induced cash assistance while holding unchanged the social protection already
in place before the pandemic.
Figure 13. Poverty changes and mitigation effect after the pandemic-induced shock and actual
income support in the sample of 41 countries, 2020
-10
13
24
3839
-20
-10
0
10
20
30
40
50
$1.90 $3.20 $5.50 $13
Daily poverty and vulnerability thresholds, per person (2011 PPP)
Expected to move above/below each threshold in the absence of shock Pandemic-induced
15
26
4229
-22
-19
-13
-19
-25
-20
-15
-10
-5
0
$1.90 $3.20 $5.50 $13
Daily poverty and vulnerability thresholds, per person (2011 PPP)
a. Changes in poverty (million people)
-37
-45
-55
-48
-60
-50
-40
-30
-20
-10
0
$1.90 $3.20 $5.50 $13
Daily poverty and vulnerability thresholds, per person (2011 PPP)
b. Mitigation effect (million people)

Source: Authors’ calculations. Notes: The figures in panel a correspond to the changes in poverty after accounting for
the pandemic-induced shock and the delivery of income support. The figures in panel b are the corresponding sums
of additional poverty reduction (panel a) and the mitigated increases in poverty (those in Figure 12). For the $1.90-a-
day threshold, for instance, the figure of -37 million people in panel b results from the sum of the mitigated increase
of 15 million people (Figure 12) and additional poverty reduction impact of 22 million people (panel a). Due to
rounding, some totals may not correspond with the sum of the separate figures.
Yet, this potential effect of mitigating the aggregate increase in poverty in the whole sample is driven by a
few countries where income support was or was planned to be so generous that it further lifted a significant
share of their population out of poverty, at least temporarily, thus likely mitigating the poverty increases in
countries where transfers were smaller. Indeed, looking at the absolute distribution of changes in poverty,
Figure 14 reveals that, while the number of people below each threshold is significantly reduced in the
UMIC and HIC in the sample, it potentially increased among the LIC and LMIC in the sample, even after
the delivery of income support. Among the LIC, poverty at $1.90 and $3.20 a day increased by about 3
million and 1.3 million people, respectively, whereas among LMIC, poverty at $5.50 a day increased by 10
million people.
Figure 14. Absolute distribution of the changes in poverty and vulnerability after the pandemic-
induced shock and actual income support in the sample of 41 countries (million people), 2020
Source: Authors’ calculations. Notes: The differences between the positive and negative figures in each bar yield the
results presented in Figure 13, panel a. LIC = low-income; LMIC = lower-middle-income; UMIC = upper-middle-
income; HIC = high-income.
Furthermore, a breakdown of the changes in the number of people below the poverty thresholds after the
shock and income support reveals that cash assistance in LIC was likely insufficient to mitigate the increase
in poverty at any poverty line (Figure 15). Cash relief among LMIC, on the other hand, possibly prevented
3
1.310
6
-21-17
-22 -22
-30
-25
-20
-15
-10
-5
0
5
10
15
$1.90 $3.20 $5.50 $13
Daily poverty and vulnerability thresholds, (2011 PPP)
LIC LMIC UMIC HIC

all the pandemic-induced increases in extreme poverty and poverty at $3.20 a day, although it was less
effective at the higher poverty line of $5.50 a day. The generosity and poverty-reducing effect of planned
or implemented cash assistance in UMIC is notable: it appeared to have mitigated all the pandemic-induced
increase in poverty by more than twice, regardless of the poverty line. The same is true for HIC, although
the increase in poverty they experienced during the pandemic is of a much smaller magnitude than that in
UMIC.
Figure 15. Breakdown of the changes in poverty after the pandemic-induced shock and actual income
support in the sample of 41 countries (million people), 2020
Source: Authors’ calculations. Notes: LIC = low-income; LMIC = lower-middle-income; UMIC = upper-middle-
income; HIC = high-income.
The impressive results of potential poverty reduction for the aggregate of the sample (see Figure 13) are
not surprising given the magnitude of the planned or implemented cash assistance. The population who
benefited from the transfers, directly and indirectly, amounts to almost 835 million people, equivalent to
43 percent of the population in the sample. Moreover, the monthly per capita transfer averaged $64 (2011
PPP), which is more than the monthly equivalent of the $1.90-a-day poverty line ($57.8). Nonetheless, there
is substantial heterogeneity in the size and coverage of cash support across countries (Figure 16)—and even
within income groups, except for LIC where transfers are distinctively minimal.
Figure 16. Transfer generosity and coverage of actual income support in the sample of 41 countries,
2020
0.0
-4.4
-28.7
-3.7
2.7
3.8
8.0
0.1
-35 -30 -25 -20 -15 -10 -5 0 5 10
LIC
LMIC
UMIC
HIC
$1.90 a day
Mitigation effect Pandemic-induced poverty
0.0
-7.8
-35.0
-2.1
1.3
6.9
17.8
0.2
-40 -30 -20 -10 0 10 20 30
LIC
LMIC
UMIC
HIC
$3.20 a day
Mitigation effect Pandemic-induced poverty
0.0
-2.4
-49.8
-2.7
0.7
12.1
27.7
1.3
-60 -50 -40 -30 -20 -10 0 10 20 30 40
LIC
LMIC
UMIC
HIC
$5.50 a day
Mitigation effect Pandemic-induced poverty
0.0
-0.1
-42.0
-6.0
0.1
5.8
19.8
3.7
-50 -40 -30 -20 -10 0 10 20 30
LIC
LMIC
UMIC
HIC
$13 a day
Mitigation effect Pandemic-induced poverty
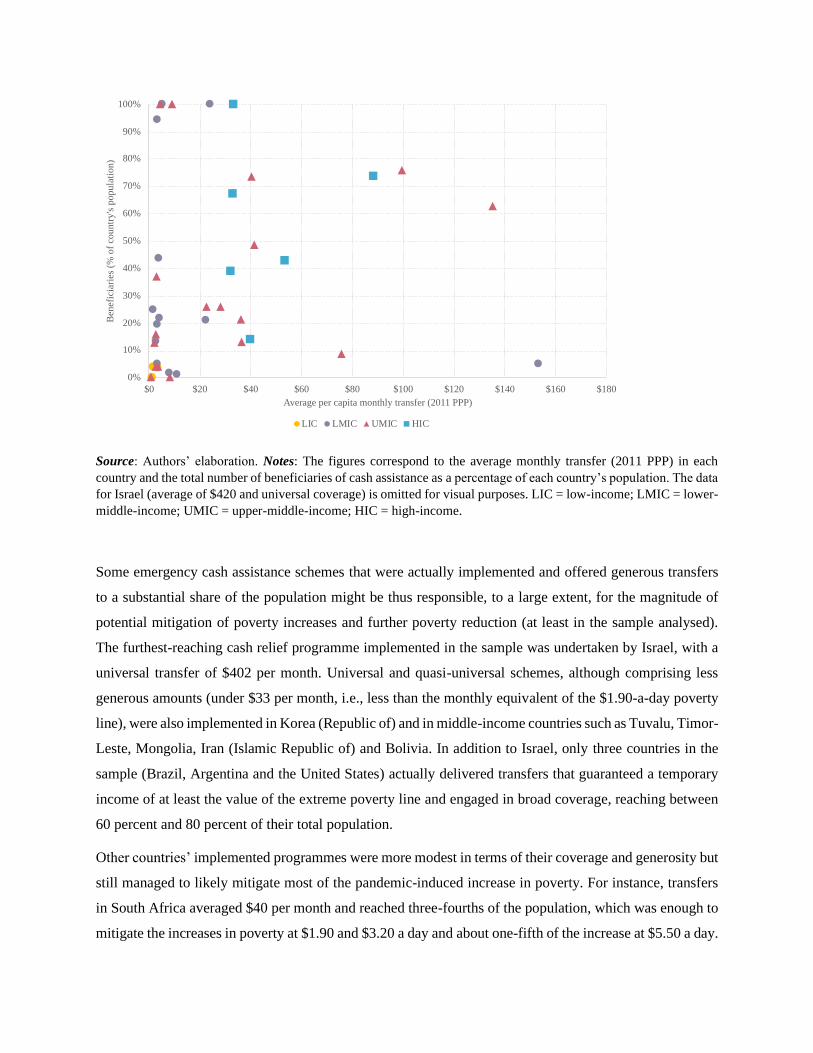
Source: Authors’ elaboration. Notes: The figures correspond to the average monthly transfer (2011 PPP) in each
country and the total number of beneficiaries of cash assistance as a percentage of each country’s population. The data
for Israel (average of $420 and universal coverage) is omitted for visual purposes. LIC = low-income; LMIC = lower-
middle-income; UMIC = upper-middle-income; HIC = high-income.
Some emergency cash assistance schemes that were actually implemented and offered generous transfers
to a substantial share of the population might be thus responsible, to a large extent, for the magnitude of
potential mitigation of poverty increases and further poverty reduction (at least in the sample analysed).
The furthest-reaching cash relief programme implemented in the sample was undertaken by Israel, with a
universal transfer of $402 per month. Universal and quasi-universal schemes, although comprising less
generous amounts (under $33 per month, i.e., less than the monthly equivalent of the $1.90-a-day poverty
line), were also implemented in Korea (Republic of) and in middle-income countries such as Tuvalu, Timor-
Leste, Mongolia, Iran (Islamic Republic of) and Bolivia. In addition to Israel, only three countries in the
sample (Brazil, Argentina and the United States) actually delivered transfers that guaranteed a temporary
income of at least the value of the extreme poverty line and engaged in broad coverage, reaching between
60 percent and 80 percent of their total population.
Other countries’ implemented programmes were more modest in terms of their coverage and generosity but
still managed to likely mitigate most of the pandemic-induced increase in poverty. For instance, transfers
in South Africa averaged $40 per month and reached three-fourths of the population, which was enough to
mitigate the increases in poverty at $1.90 and $3.20 a day and about one-fifth of the increase at $5.50 a day.
0%
10%
20%
30%
40%
50%
60%
70%
80%
90%
100%
$0 $20 $40 $60 $80 $100 $120 $140 $160 $180
Ben
efic
iari
es (
% o
f co
un
try
's p
op
ula
tio
n)
Average per capita monthly transfer (2011 PPP)
LIC LMIC UMIC HIC

Similarly, Chile delivered a relatively modest transfer of $53 per month for about 43 of the population, but
it contributed to mitigating, at least temporarily, all the poverty increases caused by the pandemic at all
thresholds, except for the $13 vulnerability line, for which it prevented only about 31 percent of the increase.
Interventions in other countries were significantly narrower in scope, although they worked well to
potentially mitigate increases in poverty. For instance, Colombia, Panama and the Dominican Republic
benefited less than half of their populations with monthly transfers of around $30, and this was enough to
temporarily mitigate all poverty increases at $1.90 and $3.20 a day, and even a sizeable share of the increase
at $5.50 a day. Finally, although cash transfers in Algeria reached only about 5 percent of the population,
they still managed to mitigate the entire increase in extreme poverty at $1.90 a day.
When contrasting the short-term mitigation effect of the actual income support vis-à-vis the TBI schemes
simulated in subsection 4.1 for the sample of 41 countries, the results show a substantial variation across
both countries and poverty lines. Table 2 compares the magnitudes of the estimated mitigation of poverty
increases and highlights the heterogeneity in fiscal constraints and the impact of the shock across countries.
It shows that countries that rolled out (or planned to roll out) the most generous programmes, mostly UMIC,
likely achieved a more significant magnitude of short-term mitigation and further short-term poverty
reduction in comparison to what they would have achieved with the largest TBI scheme, suggesting a non-
trivial investment in emergency relief. By contrast, among the LIC in the sample, both their actual income
support and the most generous TBI scheme would have had virtually no impact on short-term poverty
mitigation.
Table 2. Short-term poverty mitigation (and further short-term poverty reduction) with hypothetical
TBI schemes and actual income support in the sample of 41 countries (million people)
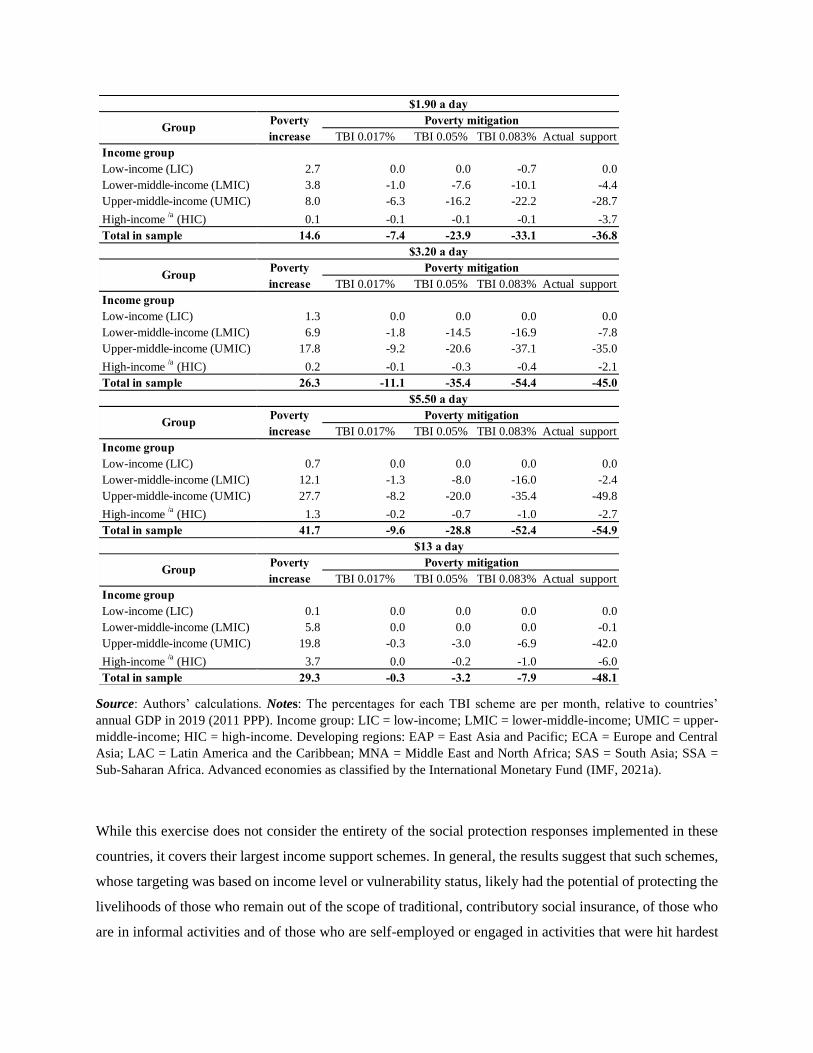
Source: Authors’ calculations. Notes: The percentages for each TBI scheme are per month, relative to countries’
annual GDP in 2019 (2011 PPP). Income group: LIC = low-income; LMIC = lower-middle-income; UMIC = upper-
middle-income; HIC = high-income. Developing regions: EAP = East Asia and Pacific; ECA = Europe and Central
Asia; LAC = Latin America and the Caribbean; MNA = Middle East and North Africa; SAS = South Asia; SSA =
Sub-Saharan Africa. Advanced economies as classified by the International Monetary Fund (IMF, 2021a).
While this exercise does not consider the entirety of the social protection responses implemented in these
countries, it covers their largest income support schemes. In general, the results suggest that such schemes,
whose targeting was based on income level or vulnerability status, likely had the potential of protecting the
livelihoods of those who remain out of the scope of traditional, contributory social insurance, of those who
are in informal activities and of those who are self-employed or engaged in activities that were hit hardest
TBI 0.017% TBI 0.05% TBI 0.083% Actual support
Income group
Low-income (LIC) 2.7 0.0 0.0 -0.7 0.0
Lower-middle-income (LMIC) 3.8 -1.0 -7.6 -10.1 -4.4
Upper-middle-income (UMIC) 8.0 -6.3 -16.2 -22.2 -28.7
High-income /a
(HIC) 0.1 -0.1 -0.1 -0.1 -3.7
Total in sample 14.6 -7.4 -23.9 -33.1 -36.8
TBI 0.017% TBI 0.05% TBI 0.083% Actual support
Income group
Low-income (LIC) 1.3 0.0 0.0 0.0 0.0
Lower-middle-income (LMIC) 6.9 -1.8 -14.5 -16.9 -7.8
Upper-middle-income (UMIC) 17.8 -9.2 -20.6 -37.1 -35.0
High-income /a
(HIC) 0.2 -0.1 -0.3 -0.4 -2.1
Total in sample 26.3 -11.1 -35.4 -54.4 -45.0
TBI 0.017% TBI 0.05% TBI 0.083% Actual support
Income group
Low-income (LIC) 0.7 0.0 0.0 0.0 0.0
Lower-middle-income (LMIC) 12.1 -1.3 -8.0 -16.0 -2.4
Upper-middle-income (UMIC) 27.7 -8.2 -20.0 -35.4 -49.8
High-income /a
(HIC) 1.3 -0.2 -0.7 -1.0 -2.7
Total in sample 41.7 -9.6 -28.8 -52.4 -54.9
TBI 0.017% TBI 0.05% TBI 0.083% Actual support
Income group
Low-income (LIC) 0.1 0.0 0.0 0.0 0.0
Lower-middle-income (LMIC) 5.8 0.0 0.0 0.0 -0.1
Upper-middle-income (UMIC) 19.8 -0.3 -3.0 -6.9 -42.0
High-income /a
(HIC) 3.7 0.0 -0.2 -1.0 -6.0
Total in sample 29.3 -0.3 -3.2 -7.9 -48.1
GroupPoverty
increase
Poverty mitigation
$1.90 a day
GroupPoverty
increase
Poverty mitigation
$3.20 a day
GroupPoverty
increase
Poverty mitigation
$5.50 a day
GroupPoverty
increase
Poverty mitigation
$13 a day
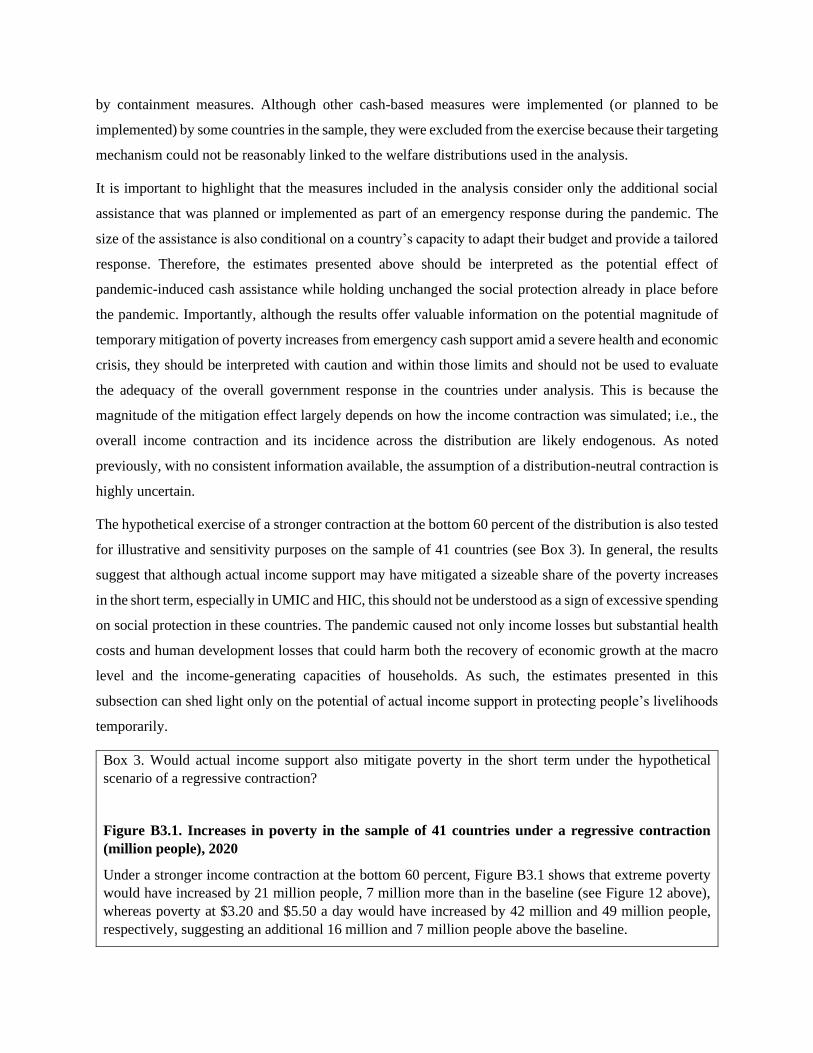
by containment measures. Although other cash-based measures were implemented (or planned to be
implemented) by some countries in the sample, they were excluded from the exercise because their targeting
mechanism could not be reasonably linked to the welfare distributions used in the analysis.
It is important to highlight that the measures included in the analysis consider only the additional social
assistance that was planned or implemented as part of an emergency response during the pandemic. The
size of the assistance is also conditional on a country’s capacity to adapt their budget and provide a tailored
response. Therefore, the estimates presented above should be interpreted as the potential effect of
pandemic-induced cash assistance while holding unchanged the social protection already in place before
the pandemic. Importantly, although the results offer valuable information on the potential magnitude of
temporary mitigation of poverty increases from emergency cash support amid a severe health and economic
crisis, they should be interpreted with caution and within those limits and should not be used to evaluate
the adequacy of the overall government response in the countries under analysis. This is because the
magnitude of the mitigation effect largely depends on how the income contraction was simulated; i.e., the
overall income contraction and its incidence across the distribution are likely endogenous. As noted
previously, with no consistent information available, the assumption of a distribution-neutral contraction is
highly uncertain.
The hypothetical exercise of a stronger contraction at the bottom 60 percent of the distribution is also tested
for illustrative and sensitivity purposes on the sample of 41 countries (see Box 3). In general, the results
suggest that although actual income support may have mitigated a sizeable share of the poverty increases
in the short term, especially in UMIC and HIC, this should not be understood as a sign of excessive spending
on social protection in these countries. The pandemic caused not only income losses but substantial health
costs and human development losses that could harm both the recovery of economic growth at the macro
level and the income-generating capacities of households. As such, the estimates presented in this
subsection can shed light only on the potential of actual income support in protecting people’s livelihoods
temporarily.
Box 3. Would actual income support also mitigate poverty in the short term under the hypothetical
scenario of a regressive contraction?
Figure B3.1. Increases in poverty in the sample of 41 countries under a regressive contraction
(million people), 2020
Under a stronger income contraction at the bottom 60 percent, Figure B3.1 shows that extreme poverty
would have increased by 21 million people, 7 million more than in the baseline (see Figure 12 above),
whereas poverty at $3.20 and $5.50 a day would have increased by 42 million and 49 million people,
respectively, suggesting an additional 16 million and 7 million people above the baseline.
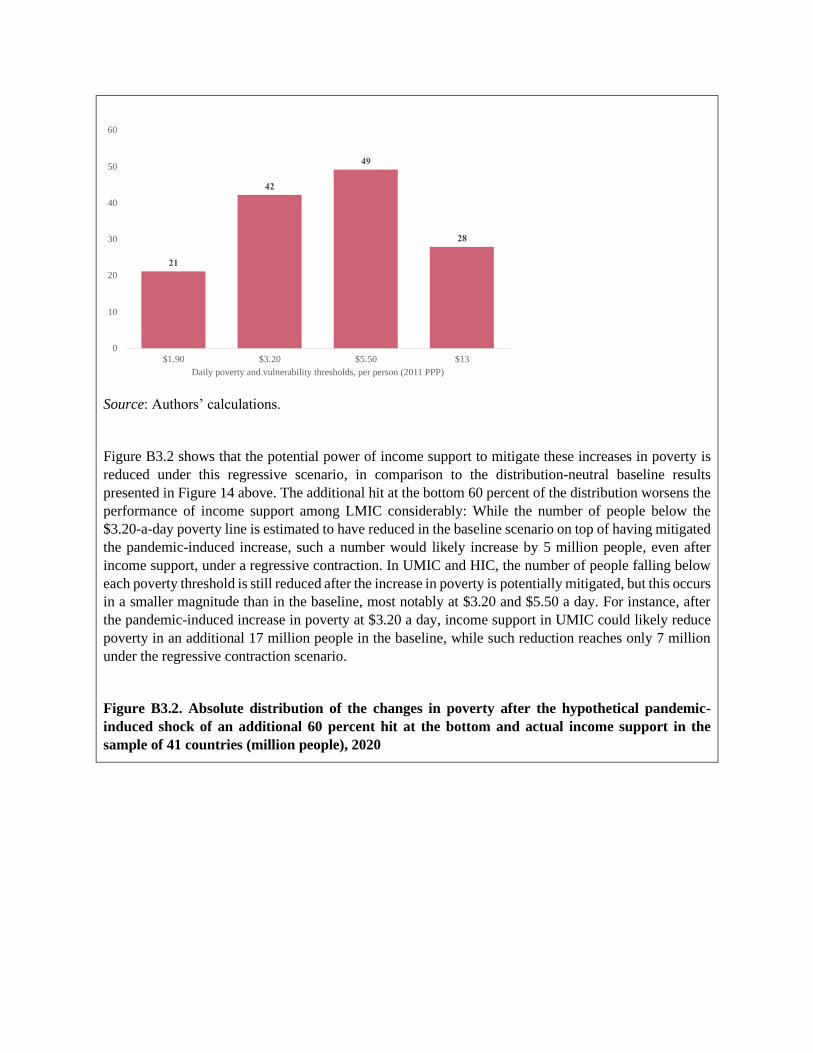
Source: Authors’ calculations.
Figure B3.2 shows that the potential power of income support to mitigate these increases in poverty is
reduced under this regressive scenario, in comparison to the distribution-neutral baseline results
presented in Figure 14 above. The additional hit at the bottom 60 percent of the distribution worsens the
performance of income support among LMIC considerably: While the number of people below the
$3.20-a-day poverty line is estimated to have reduced in the baseline scenario on top of having mitigated
the pandemic-induced increase, such a number would likely increase by 5 million people, even after
income support, under a regressive contraction. In UMIC and HIC, the number of people falling below
each poverty threshold is still reduced after the increase in poverty is potentially mitigated, but this occurs
in a smaller magnitude than in the baseline, most notably at $3.20 and $5.50 a day. For instance, after
the pandemic-induced increase in poverty at $3.20 a day, income support in UMIC could likely reduce
poverty in an additional 17 million people in the baseline, while such reduction reaches only 7 million
under the regressive contraction scenario.
Figure B3.2. Absolute distribution of the changes in poverty after the hypothetical pandemic-
induced shock of an additional 60 percent hit at the bottom and actual income support in the
sample of 41 countries (million people), 2020
21
42
49
28
0
10
20
30
40
50
60
$1.90 $3.20 $5.50 $13
Daily poverty and vulnerability thresholds, per person (2011 PPP)

Source: Authors’ calculations. Notes: LIC = low-income; LMIC = lower-middle-income; UMIC = upper-
middle-income; HIC = high-income.
Figure B3.3 presents the breakdown of the changes in the number of people falling below each threshold,
suggesting that cash assistance in LMIC in the sample may not be enough to mitigate the totality of the
pandemic-induced increases in extreme poverty and poverty at $3.20 a day, although it could have been
sufficient in the baseline scenario (see Figure 15 above). The magnitude of the potential mitigation of
poverty-increase as a result of the generous (planned or implemented) income support in HIC and UMIC
in the sample is still larger in the regressive scenario; however, such a magnitude is significantly smaller
than that estimated in the baseline scenario, most notably at $3.20 a day for UMIC and $13 a day for
HIC.
Figure B3.3. Breakdown of the changes in poverty after the hypothetical pandemic-induced shock
of an additional 60 percent hit at the bottom after income support in the sample of 41 countries
(million people), 2020
2
510
3
-20
-7
-16
-24
-30
-25
-20
-15
-10
-5
0
5
10
15
$1.90 $3.20 $5.50 $13
Daily poverty and vulnerability thresholds, per person (2011 PPP)
LIC LMIC UMIC HIC
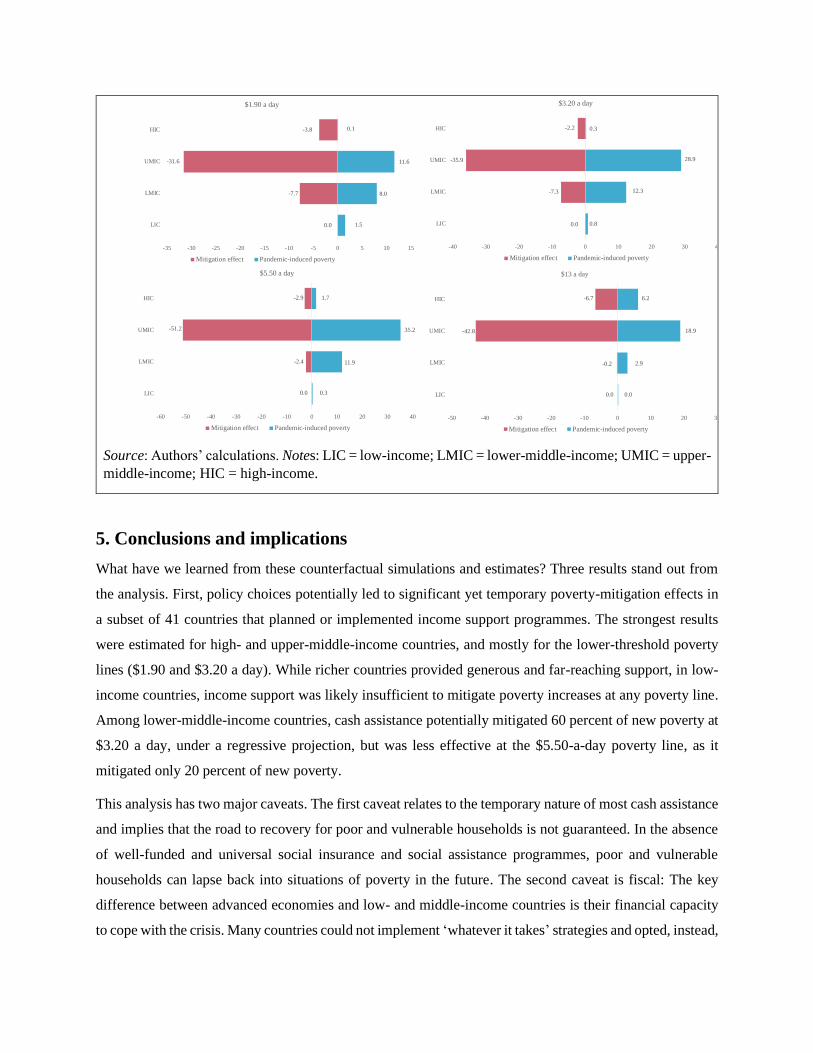
Source: Authors’ calculations. Notes: LIC = low-income; LMIC = lower-middle-income; UMIC = upper-
middle-income; HIC = high-income.
5. Conclusions and implications
What have we learned from these counterfactual simulations and estimates? Three results stand out from
the analysis. First, policy choices potentially led to significant yet temporary poverty-mitigation effects in
a subset of 41 countries that planned or implemented income support programmes. The strongest results
were estimated for high- and upper-middle-income countries, and mostly for the lower-threshold poverty
lines ($1.90 and $3.20 a day). While richer countries provided generous and far-reaching support, in low-
income countries, income support was likely insufficient to mitigate poverty increases at any poverty line.
Among lower-middle-income countries, cash assistance potentially mitigated 60 percent of new poverty at
$3.20 a day, under a regressive projection, but was less effective at the $5.50-a-day poverty line, as it
mitigated only 20 percent of new poverty.
This analysis has two major caveats. The first caveat relates to the temporary nature of most cash assistance
and implies that the road to recovery for poor and vulnerable households is not guaranteed. In the absence
of well-funded and universal social insurance and social assistance programmes, poor and vulnerable
households can lapse back into situations of poverty in the future. The second caveat is fiscal: The key
difference between advanced economies and low- and middle-income countries is their financial capacity
to cope with the crisis. Many countries could not implement ‘whatever it takes’ strategies and opted, instead,
0.0
-7.7
-31.6
-3.8
1.5
8.0
11.6
0.1
-35 -30 -25 -20 -15 -10 -5 0 5 10 15
LIC
LMIC
UMIC
HIC
$1.90 a day
Mitigation effect Pandemic-induced poverty
0.0
-7.3
-35.9
-2.2
0.8
12.3
28.9
0.3
-40 -30 -20 -10 0 10 20 30 40
LIC
LMIC
UMIC
HIC
$3.20 a day
Mitigation effect Pandemic-induced poverty
0.0
-2.4
-51.2
-2.9
0.3
11.9
35.2
1.7
-60 -50 -40 -30 -20 -10 0 10 20 30 40
LIC
LMIC
UMIC
HIC
$5.50 a day
Mitigation effect Pandemic-induced poverty
0.0
-0.2
-42.8
-6.7
0.0
2.9
18.9
6.2
-50 -40 -30 -20 -10 0 10 20 30
LIC
LMIC
UMIC
HIC
$13 a day
Mitigation effect Pandemic-induced poverty

to maximize the impact of their programmes under difficult budget constraints. While the analysis presented
in this paper does not delve into the likely multiplier effects of the actual cash assistance provided during
the pandemic, it acknowledges that income support programmes may well have had indirect effects on the
economy, in addition to their direct effects on household income. With high fiscal multipliers and high
productive capacity, public spending, even in the short run, increases aggregate demand, thus raising
consumption and private investment, which in turn increases employment and income. Also, in terms of
fiscal space, as aggregate demand rises, tax revenues increase and new opportunities to spend emerge. We
argue, therefore, that the poverty-increase in low-income countries was not mitigated likely because of both
low fiscal multipliers and limited fiscal space, in contrast with higher-income countries. Further country-
specific evidence is yet to be provided.
A second result is borne out by the counterfactual simulations for 160 countries that indicate that an
investment of 0.5 percent of developing countries’ GDP, spread over six months, would have sufficed to
mitigate, at least temporarily, the increase in global poverty at both $1.90 and $3.20 a day—but not equally
everywhere. While the simulations illustrate the powerful effects of a quasi-universal and far-reaching
policy, the poorer, hardest hit regions of the world would require additional financial effort, beyond their
fiscal capacities, to compensate for the welfare losses relative to the rest of the developing countries. The
simulations also illustrate the real-world constraints faced by actual social assistance programmes that face
administrative and digital constraints in enrolling new benefit holders, expanding their administrative
registries and setting up digital payment systems for largely invisible informal sector workers as well as
unpaid care and domestic workers. This is a real-world challenge for countries around the developing world.
A third result is that the size of the pandemic was massive and threatened to push between 117 million
people and 168 million people back into extreme poverty. Distributive assumptions are crucial for this
reassessment. Early evidence on distributive impact suggests that the distribution of the COVID-19 shock
on jobs and incomes was neither random nor neutral—it impacted the poor and vulnerable in
disproportionate numbers. We will understand the true poverty and income effects only in a few years, as
official poverty statistics are normally standardized with a two-year lag. An added caveat is that for some
countries, we may never understand the true impact of the pandemic because of the difficulty of deploying
accurate household surveys during the lockdown period itself. It is important to note that there is no simple
arithmetic rule that would have mitigated the increase in poverty: The depth of income losses was
idiosyncratic and left many households in negative numbers. In other words, incomes losses were higher
than available income, which could only be compensated through borrowing, selling assets or deploying
other income-smoothing strategies. This paper has tried to capture some of these non-trivial effects on
income.
There are some additional caveats and considerations to bear in mind. First, our initial set of estimates of
pandemic-induced poverty (117 million new poor people) relied on a distribution-neutral economic
contraction, which we then corrected for a distribution-regressive scenario (168 million new poor people).
Neutrality is unlikely, and it might well be that the incomes of some segments of the population contracted
more than proportionally (e.g., workers in the non-essential services sector), whereas in other segments,
incomes did not seem especially affected (e.g., workers who were able to transition to work-from-home
arrangements). To begin with, distribution-neutrality is particularly restrictive for the extrapolation of the
welfare distributions used in the analysis, from the actual year of survey data collection to 2019 (see section
3). Although most household surveys are relatively recent (67 of the 160 surveys are for 2018 and 2019,
while 114 are for the period 2015-2019), the assumption that inequality has remained unchanged over time
within countries is, at least, highly uncertain. Second, for the simulation exercise, the cost of TBI schemes
is assumed to be equivalent to a proportion of a country’s GDP but ignores issues related to institutional
capacity in implementation or delivery, and whether the population has access to bank or mobile money
accounts. Third, for the estimation of the mitigation effects on poverty increases of actual social assistance
programmes, the analysis assumes that the targeting of such programmes is solely based on relative income.
A more careful calculation would require detailed household and individual information for each country
to fully account for other characteristics of beneficiaries. Fourth, the effects estimated in this paper are
likely short-lasting, and it is unclear whether poverty will revert to its pre-pandemic levels once the crisis
has subsided. Finally, the only dimension of poverty considered in this study is monetary. Potential effects
of social assistance and protection measures on multidimensional poverty are yet to be uncovered.
What are the key implications looking forward? A first implication is empirical. As more actual data
becomes available, researchers will be able to dive deeper into actual cases and also discern more
counterfactual simulations across the distribution. If anything, we have learned that the impacts of large-
scale shocks are not bound by the arbitrary thresholds used to measure poverty or well-being. We need to
understand how shocks affect the full distribution of income, above and beyond $1.90 a day or even $13 a
day, as well as across other human development metrics. The links to future research on climate change
mitigation and adaptation are evident. Some of the most difficult development problems for a carbon-
neutral transition are distributive. There is much to learn from this historic—but probably not unique—set
of shocks.
A second implication is policy-oriented, with effects on labour markets and social protection systems. This
paper’s opening question asks: What difference did income support make? The unqualified answer is ‘a big
difference’. By both TBI counterfactual simulation and measured impact of actual cash assistance, income
support policies that extended vertically (with higher payments) and horizontally (to more people) likely
mitigated poverty increases across various poverty lines—and were most effective at the bottom of the
distribution. Looking forward, countries face choices on how to move beyond temporary income support
programmes: They can either strengthen existing social insurance or social assistance programmes or
extend their policy ambition to universal basic income policies or universal job guarantees. Most countries
will supplement their existing social protection programmes with state-contingent social insurance, thus
adding a counter-cyclical mechanism to a typical life-cycle welfare system.
Policy choices mattered during the COVID-19 pandemic. Although we still need to unearth the unexpected
effects and quantify the welfare impacts on poor and vulnerable households more precisely, temporary
income support schemes mitigated poverty increases; looking forward, social protection systems will need
to evolve to incorporate these lessons into a robust and successful policy response.
References
Adams-Prassl, Abi, and others (2020). Inequality in the impact of the coronavirus shock: evidence from
real time surveys. Journal of Public Economics, vol. 189 (September).
Aggarwal, Shilpa, and others (2020). Did COVID-19 market disruptions disrupt food security? Evidence
from households in rural Liberia and Malawi. NBER Working Paper, No. 27932.
Alkire, S., and others (2020). Multidimensional poverty and COVID-19 risk factors: A rapid overview of
interlinked deprivations across 5.7 billion people. OPHI Briefing No. 53, Oxford Poverty and Human
Development Initiative. Oxford: University of Oxford.
Alon, Titan, and others (2020). The impact of COVID-19 on gender equality. National Bureau of Economic
Research Working Paper, Series 26947.
Amare, M., and others (2020). Impacts of Covid-19 on food security: panel data evidence from Nigeria.
IFPRI Discussion Paper, No. 01956. Washington, D.C.
Amjath-Babu, T. S., and others (2020). Key Indicators for monitoring food system disruptions caused by
the COVID-19 pandemic: insights from Bangladesh towards effective response. Food Security, vol.
12, No. 4, pp. 761–68.
Andrew, Alison, and others (2020a). The gendered division of paid and domestic work under lockdown.
IZA Discussion Paper, No. 13500.
——— (2020b). Inequalities in children’s experiences of home learning during the COVID-19 lockdown
in England. Fiscal Studies, vol. 41, No. 3, pp. 653–83.
Arayavechkit, Tanida, and others (2021). March 2021 PovcalNet update: what’s new. Global Poverty
Monitoring Technical Note 15. Washington, D.C.
Arndt, Channing, and others (2020). Covid-19 lockdowns, income distribution, and food security: an
analysis for South Africa. Global Food Security, vol. 26 (September).
Bacher-Hicks, Andrew, Joshua Goodman and Christine Mulhern (2021). Inequality in household adaptation
to schooling shocks: Covid-induced online learning engagement in real time. Journal of Public
Economics, vol. 193 (January).
Blofield, Merike, Nora Lustig and Mart Trasberg (2021). Social protection during the pandemic: Argentina,
Brazil, Colombia, and Mexico. CEQ Working Paper, No. 104.
Blundell, Richard, and others (2020). COVID-19 and inequalities. Fiscal Studies, vol. 41, No. 2, pp. 291–
319.
Brown, C. S., M. Ravallion and D. van de Walle (2020). Can the world’s poor protect themselves from the
new coronavirus? NBER Working Paper, No. 27200.
Bussolo, Maurizio, and others (2018). Toward a New Social Contract: Taking on Distributional Tensions
in Europe and Central Asia. Washington, D.C.: World Bank.
Castaneda Aguilar, and others (2019). Estimating global poverty in stata: the Povcalnet command. Global
Poverty Monitoring Technical Note 9. Washington, D.C.
Ceballos, Francisco, Manuel A Hernandez and Cynthia Paz (2021). Short-term impacts of COVID-19 on
food security and nutrition in rural Guatemala: phone-based farm household survey evidence.
Agricultural Economics, vol. 52, No. 3, pp. 477–94.
Collins, Caitlyn, and others (2021). COVID-19 and the gender gap in work hours. Gender, Work &
Organization, vol. 28, No. S1, pp. 101–12.

Dang, Hai-Anh H., and Cuong Viet Nguyen (2021). Gender inequality during the COVID-19 pandemic:
income, expenditure, savings, and job loss. World Development, vol. 140 (April).
Davis, Steven J., and Till M. von Wachter (2011). Recessions and the cost of job loss. National Bureau of
Economic Research Working Paper Series, No. 17638.
Dykstra, Sarah, Benjamin Dykstra, and Justin Sandefur (2014). We just ran twenty-three million queries of
the World Bank’s website. CGD Working Paper, No. 362. Washington, D.C.
Egger, Dennis, and others (2021). Falling living standards during the COVID-19 crisis: quantitative
evidence from nine developing countries. Science Advances, vol. 7, No. 6.
Engzell, Per, Arun Frey and Mark D. Verhagen (2020). Learning loss due to school closures during the
COVID-19 pandemic. SocArXiv (29 October).
Foucault, M., and V. Galasso (2020). Working after Covid-19: cross country evidence from real-time
survey data. Science Po CEVIPOF Research Note 9.
Gentilini, Ugo, and others (2021). Social protection and jobs responses to COVID-19: a real-time review
of country measures. World Bank Living Paper, Version 15 (14 May). Washington, D.C.: World
Bank.
Gentilini, Ugo, Mohamed Almenfi, an Pamela Dale (2020a). Social protection and jobs responses to
COVID-19: a real-time review of country measures. World Bank Living Paper, Version 6 (24 April).
Washington, D.C.: World Bank.
——— (2020b). Social protection and jobs responses to COVID-19: a real-time review of country
measures. World Bank Living Paper, Version 14 (11 December). Washington, D.C.: World Bank.
Gentilini, Ugo, Mohamed Almenfi, Pamela Dale, John Blomquist and others (2020). Social protection and
jobs responses to COVID-19: a real-time review of country measures. World Bank Living Paper,
Version 10 (22 May). Washington, D.C.: World Bank.
Gentilini, Ugo, Mohamed Almenfi, Pamela Dale, Ana Veronica Lopez, Ingrid Veronica Mujica and others
(2020). Social protection and jobs responses to COVID-19: a real-time review of country measures.
World Bank Living Paper, Version 11 (12 June). Washington, D.C.: World Bank.
Gentilini, Ugo, Mohamed Almenfi, Pamela Dale, Ana Veronica Lopez and Usama Zafar (2020). Social
protection and jobs responses to COVID-19: a real-time review of country measures. World Bank
Living Paper, Version 12 (10 July). Washington, D.C.: World Bank.
Gentilini, Ugo, Mohamed Almenfi, Pamela Dale, Robert Palacios and others (2020). Social protection and
jobs responses to COVID-19: a real-time review of country measures. World Bank Living Paper,
Version 13 (18 September). Washington, D.C.: World Bank.
Gentilini, Ugo, Mohamed Almenfi and Ian Orton (2020). Social protection and jobs responses to covid-19:
a real-time review of country measures. World Bank Living Paper, Version 2 (27 March).
Washington, D.C.: World Bank.
Gore, Jennifer, and others (2021). The impact of COVID-19 on student learning in New South Wales
primary schools: an empirical study. The Australian Educational Researcher (12 March).
Gray Molina, George, and Eduardo Ortiz-Juarez (2020). Temporary basic income: protecting poor and
vulnerable people in developing countries. UNDP Transition Series Working Papers.
Headey, D., and others (2020). The impacts of the COVID-19 crisis on maternal and child malnutrition in
Myanmar. IFPRI Strategy Support Program Policy Note 14. Washington, D.C.
Hirvonen, Kalle, Alan de Brauw and Gashaw T Abate (2021). Food consumption and food security during
the COVID-19 pandemic in Addis Ababa. American Journal of Agricultural Economics, vol. 103,
No. 3, pp. 772–789.
Hogan, Alexandra B., and others (2020). Potential impact of the COVID-19 pandemic on HIV, tuberculosis,
and malaria in low-income and middle-income countries: a modelling study. The Lancet Global
Health, vol. 8, No. 9.
Huber, Stephan Gerhard, and Christoph Helm (2020). COVID-19 and schooling: evaluation, assessment
and accountability in times of crises—reacting quickly to explore key issues for policy, practice and
research with the school barometer. Educational Assessment, Evaluation and Accountability, vol. 32,
No. 2, pp. 237–270.
ILO (2018). Women and men in the informal economy: A statistical picture. Third edition. Geneva: ILO.
ILO (2020a). ILO Monitor: COVID-19 and the world of work, third edition. Geneva.
——— (2020b). The Covid-19 response: getting gender equality right for a better future for women at
work. Geneva.
——— (2021). ILO Monitor: COVID-19 and the world of work, seventh edition. Geneva.
IMF, International Monetary Fund (2019). World Economic Outlook Database. Available at
https://www.imf.org/en/Publications/WEO/weo-database/2019/October.
——— (2021a). World Economic Outlook: Managing Divergent Recoveries. Washington, D.C.:
International Monetary Fund.
——— (2021b). World Economic Outlook Database. Available at
https://www.imf.org/en/Publications/WEO/weo-database/2021/April. Accessed April 2021.
Jæger, Mads Meier, and Ea Hoppe Blaabæk (2020). Inequality in learning opportunities during Covid-19:
evidence from library takeout. Research in Social Stratification and Mobility, vol. 68.
Jewell, Britta L., and others (2020). Potential effects of disruption to HIV programmes in Sub-Saharan
Africa caused by COVID-19: results from multiple mathematical models. The Lancet HIV, vol. 7, No.
9, pp. e629–640.
Jolliffe, Dean, and Espen Beer Prydz (2016). Estimating international poverty lines from comparable
national thresholds. The Journal of Economic Inequality, vol. 14, No. 2, pp. 185–198.
KC, Ashish, and others (2020). Effect of the COVID-19 pandemic response on intrapartum care, stillbirth,
and neonatal mortality outcomes in Nepal: a prospective observational study. The Lancet Global
Health, vol. 8, No. 10, pp. e1273–1281.
Khan, Syed Abdul Rehman, and others (2021). Disruption in food supply chain and undernourishment
challenges: an empirical study in the context of Asian countries. Socio-Economic Planning Sciences.
Krubiner, C., and others (2021). Addressing the COVID-19 crisis’s indirect health impacts for women and
girls. CGD Working Papers, No. 577. Washington, D.C.
Lakner, Christoph, and others (2020a). Updated estimates of the impact of covid-19 on global poverty: the
effect of new data. World Bank Blogs.
Lakner, Christoph, and others (2020b). How much does reducing inequality matter for global poverty?
Global Poverty Monitoring Technical Note 13. Washington, D.C.
Lakner, Christoph, and others (2021). Updated estimates of the impact of COVID-19 on global poverty:
looking back at 2020 and the outlook for 2021. World Bank Blogs.
Lopez-Calva, Luis F,, and Eduardo Ortiz-Juarez (2014). A vulnerability approach to the definition of the
middle class. The Journal of Economic Inequality, vol. 12, No. 1, pp. 23–47.
Lustig, Nora, Guido Neidhofer and Mariano Tommasi (2020). Short and long-run distributional impacts of
COVID-19 in Latin America. CEQ Working Paper 96.
Mahajan, Kanika, and Shekhar Tomar (2021). COVID-19 and supply chain disruption: evidence from food
markets in India†. American Journal of Agricultural Economics, vol. 103, No. 1, pp. 35–52.
Mahler, Daniel Gerszon, and others (2020a). The impact of COVID-19 (coronavirus) on global poverty:
why Sub-Saharan Africa might be the region hardest hit. World Bank Blogs.
——— (2020b). Updated estimates of the impact of COVID-19 on global poverty. World Bank Blogs.
Maldonado, Joana, and Kristof De Witte (2020). The effect of school closures on standardised student test
outcomes. KU Leuven, Discussion Paper Series DPS20.17.
Montoya-Aguirre, M., E. Ortiz-Juarez and A. Santiago (2021). Protecting women’s livelihoods in times of
pandemic: temporary basic income and the road to gender equality. UNDP Global Policy Network
Brief, Transition Series. New York.
Oreffice, Sonia, and Climent Quintana-Domeque (2021). Gender inequality in COVID-19 times: evidence
from UK prolific participants. Journal of Demographic Economics, vol. 87, No. 2, pp. 261–287.
Patrinos, Harry, and Robin Donnelly (2021). Learning loss during COVID-19: an early systematic review.
CEPR COVID Economics, Issue 77.
Peterman, Amber, and Megan O’Donnell (2020). COVID-19 and violence against women and children: a
third research round up for the 16 days of activism. CGD Notes. Washington, D.C.
Prydz, Espen Beer, and others (2019). National accounts data used in global poverty measurement. Global
Poverty Monitoring Technical Note 8. Washington, D.C.
Reichelt, Malte, Kinga Makovi and Anahit Sargsyan (2021). The impact of COVID-19 on gender inequality
in the labor market and gender-role attitudes. European Societies, vol. 23, sup1, pp. S228–245.
Sen, Ma, Sun Zhengyun and Xue Hao (2020). Childcare needs and parents’ labor supply: evidence from
the COVID-19 lockdown. SSRN, No. 3630842.
Shapira, Gil, and others (2021). Disruptions in maternal and child health service utilization during COVID-
19: analysis from eight Sub-Saharan African countries. Health Policy and Planning (June).
Sumner, Andy, Chris Hoy and Eduardo Ortiz-Juarez (2020). Estimates of the impact of COVID-19 on
global poverty. WIDER Working Paper, No. 43. Helsinki, Finland: UNU-WIDER.
Tomasik, Martin J, Laura A Helbling and Urs Moser (2020). Educational gains of in-person vs. distance
learning in primary and secondary schools: a natural experiment during the COVID-19 pandemic
school closures in Switzerland. International Journal of Psychology (24 November).
Valensisi, Giovanni (2020). COVID-19 and global poverty: are LDCs being left behind? The European
Journal of Development Research, vol. 32, No. 5, pp. 1535–1557.
Walker, Patrick G. T., and others (2020). The impact of COVID-19 and strategies for mitigation and
suppression in low- and middle-income countries. Science, vol. 369, No. 6502, pp. 413–422.
Wang, Huan, and others (2021). Health, economic, and social implications of COVID-19 for China’s rural
population. Agricultural Economics, vol. 52, No. 3, pp. 495–504.
World Bank (2018a). Poverty and Shared Prosperity 2018: Piecing Together the Poverty Puzzle.
Washington, D.C.: World Bank.
——— (2018b). Riding the Wave: An East Asian Miracle for the 21st Century. World Bank East Asia and
Pacific Regional Report. Washington, D.C.: World Bank.
——— (2020). Poverty and Shared Prosperity 2020: Reversals of Fortune. Washington, D.C.: World
Bank.
Younger, S., and others (2020). Estimating income losses and consequences of the COVID-19 crisis in
Uganda. CEQ Working Paper, No. 110.
Zhao, Qinghua (2019). PovcalNet API. World Bank. Washington, D.C.
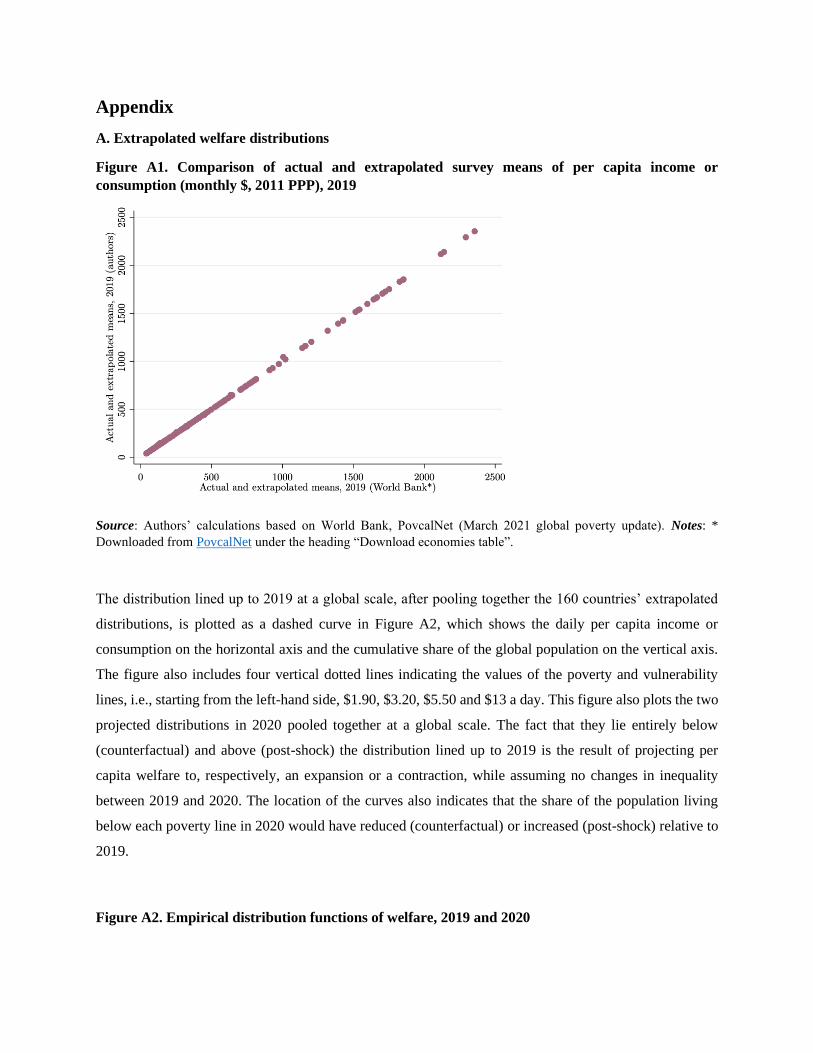
Appendix
A. Extrapolated welfare distributions
Figure A1. Comparison of actual and extrapolated survey means of per capita income or
consumption (monthly $, 2011 PPP), 2019
Source: Authors’ calculations based on World Bank, PovcalNet (March 2021 global poverty update). Notes: *
Downloaded from PovcalNet under the heading “Download economies table”.
The distribution lined up to 2019 at a global scale, after pooling together the 160 countries’ extrapolated
distributions, is plotted as a dashed curve in Figure A2, which shows the daily per capita income or
consumption on the horizontal axis and the cumulative share of the global population on the vertical axis.
The figure also includes four vertical dotted lines indicating the values of the poverty and vulnerability
lines, i.e., starting from the left-hand side, $1.90, $3.20, $5.50 and $13 a day. This figure also plots the two
projected distributions in 2020 pooled together at a global scale. The fact that they lie entirely below
(counterfactual) and above (post-shock) the distribution lined up to 2019 is the result of projecting per
capita welfare to, respectively, an expansion or a contraction, while assuming no changes in inequality
between 2019 and 2020. The location of the curves also indicates that the share of the population living
below each poverty line in 2020 would have reduced (counterfactual) or increased (post-shock) relative to
2019.
Figure A2. Empirical distribution functions of welfare, 2019 and 2020
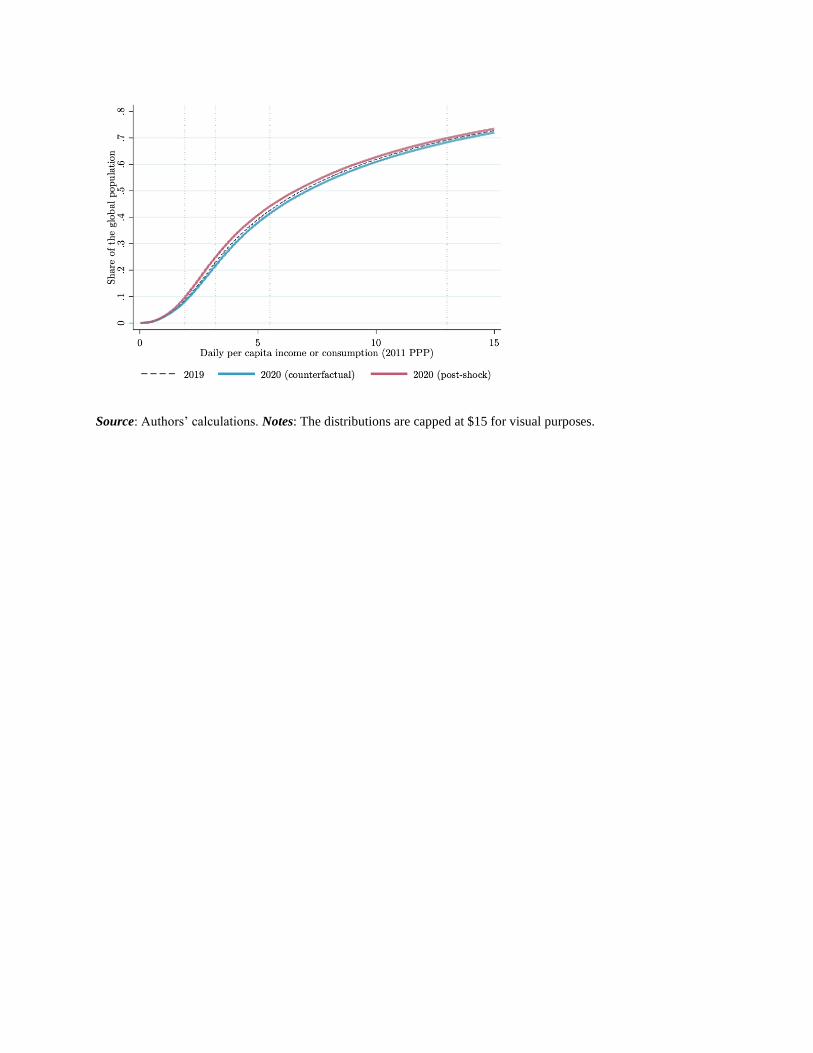
Source: Authors’ calculations. Notes: The distributions are capped at $15 for visual purposes.

B. Countries for which the welfare distribution was retrieved
Developing countries
Albania UMIC ECA Consumption 2017
Algeria LMIC MNA Consumption 2011
Angola LMIC SSA Consumption 2018
Argentina UMIC LAC Income 2019
Armenia UMIC ECA Consumption 2019
Azerbaijan UMIC ECA Consumption 2005
Bangladesh LMIC SAS Consumption 2016
Belarus UMIC ECA Consumption 2019
Belize UMIC LAC Income 1999
Benin LMIC SSA Consumption 2015
Bhutan LMIC SAS Consumption 2017
Bolivia LMIC LAC Income 2019
Bosnia and Herzegovina UMIC ECA Consumption 2011
Botswana UMIC SSA Consumption 2016
Brazil UMIC LAC Income 2019
Bulgaria UMIC ECA Income 2018
Burkina Faso LIC SSA Consumption 2014
Burundi LIC SSA Consumption 2014
Cabo Verde LMIC SSA Consumption 2015
Cameroon LMIC SSA Consumption 2014
Central African Republic LIC SSA Consumption 2008
Chad LIC SSA Consumption 2011
Chile HIC LAC Income 2017
China UMIC EAP Consumption 2016
Colombia UMIC LAC Income 2019
Comoros LMIC SSA Consumption 2014
Congo, Democratic Republic of LIC SSA Consumption 2012
Congo, Republic of LMIC SSA Consumption 2011
Costa Rica UMIC LAC Income 2019
Cote d'Ivoire LMIC SSA Consumption 2015
Croatia HIC ECA Income 2018
Djibouti LMIC MNA Consumption 2017
Dominican Republic UMIC LAC Income 2019
Ecuador UMIC LAC Income 2019
Egypt, Arab Republic of LMIC MNA Consumption 2018
El Salvador LMIC LAC Income 2019
Eswatini LMIC SSA Consumption 2016
Ethiopia LIC SSA Consumption 2016
Fiji UMIC EAP Consumption 2013
Gabon UMIC SSA Consumption 2017
Gambia, The LIC SSA Consumption 2015
Georgia UMIC ECA Consumption 2019
Ghana LMIC SSA Consumption 2017
Guatemala UMIC LAC Income 2014
Country Income groupDeveloping
region
Welfare
measureSurvey year
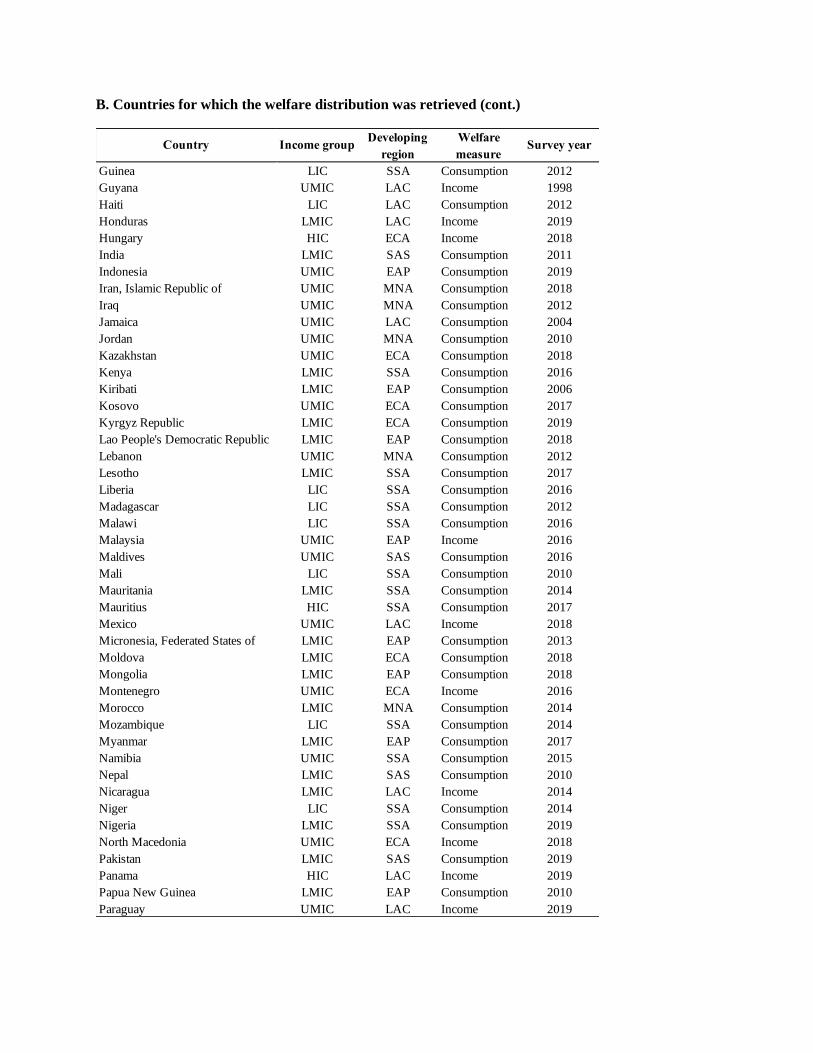
B. Countries for which the welfare distribution was retrieved (cont.)
Guinea LIC SSA Consumption 2012
Guyana UMIC LAC Income 1998
Haiti LIC LAC Consumption 2012
Honduras LMIC LAC Income 2019
Hungary HIC ECA Income 2018
India LMIC SAS Consumption 2011
Indonesia UMIC EAP Consumption 2019
Iran, Islamic Republic of UMIC MNA Consumption 2018
Iraq UMIC MNA Consumption 2012
Jamaica UMIC LAC Consumption 2004
Jordan UMIC MNA Consumption 2010
Kazakhstan UMIC ECA Consumption 2018
Kenya LMIC SSA Consumption 2016
Kiribati LMIC EAP Consumption 2006
Kosovo UMIC ECA Consumption 2017
Kyrgyz Republic LMIC ECA Consumption 2019
Lao People's Democratic Republic LMIC EAP Consumption 2018
Lebanon UMIC MNA Consumption 2012
Lesotho LMIC SSA Consumption 2017
Liberia LIC SSA Consumption 2016
Madagascar LIC SSA Consumption 2012
Malawi LIC SSA Consumption 2016
Malaysia UMIC EAP Income 2016
Maldives UMIC SAS Consumption 2016
Mali LIC SSA Consumption 2010
Mauritania LMIC SSA Consumption 2014
Mauritius HIC SSA Consumption 2017
Mexico UMIC LAC Income 2018
Micronesia, Federated States of LMIC EAP Consumption 2013
Moldova LMIC ECA Consumption 2018
Mongolia LMIC EAP Consumption 2018
Montenegro UMIC ECA Income 2016
Morocco LMIC MNA Consumption 2014
Mozambique LIC SSA Consumption 2014
Myanmar LMIC EAP Consumption 2017
Namibia UMIC SSA Consumption 2015
Nepal LMIC SAS Consumption 2010
Nicaragua LMIC LAC Income 2014
Niger LIC SSA Consumption 2014
Nigeria LMIC SSA Consumption 2019
North Macedonia UMIC ECA Income 2018
Pakistan LMIC SAS Consumption 2019
Panama HIC LAC Income 2019
Papua New Guinea LMIC EAP Consumption 2010
Paraguay UMIC LAC Income 2019
Country Income groupDeveloping
region
Welfare
measureSurvey year
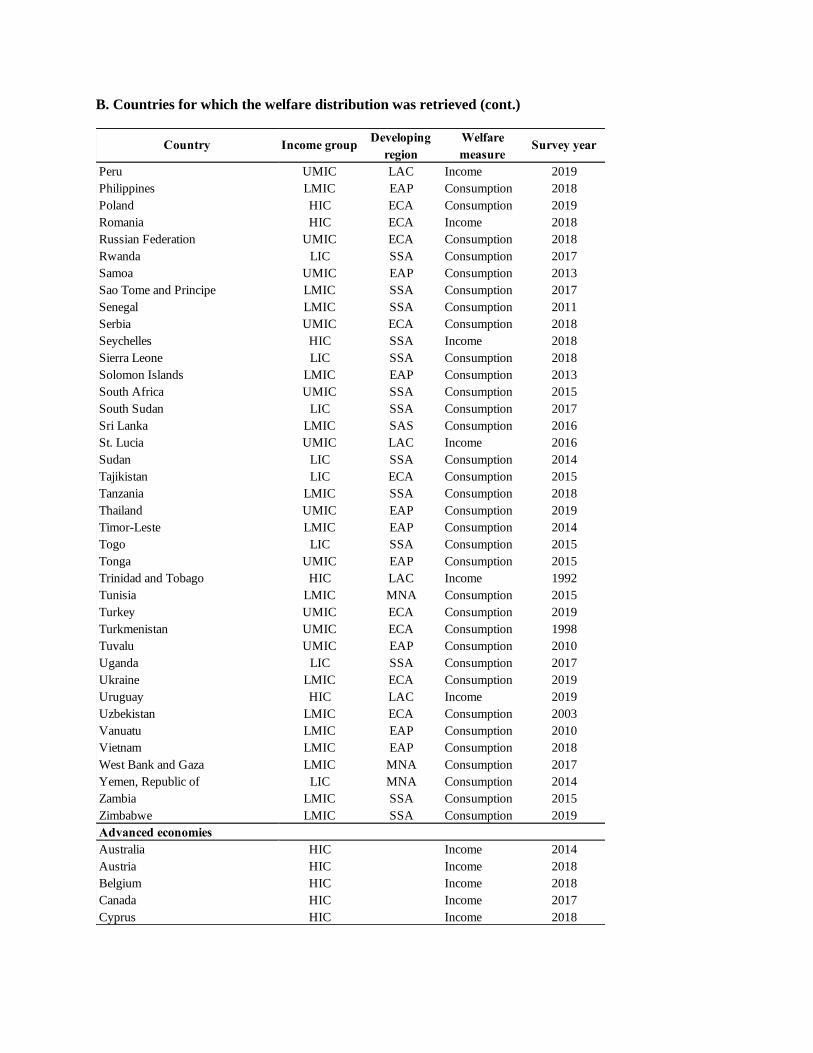
B. Countries for which the welfare distribution was retrieved (cont.)
Peru UMIC LAC Income 2019
Philippines LMIC EAP Consumption 2018
Poland HIC ECA Consumption 2019
Romania HIC ECA Income 2018
Russian Federation UMIC ECA Consumption 2018
Rwanda LIC SSA Consumption 2017
Samoa UMIC EAP Consumption 2013
Sao Tome and Principe LMIC SSA Consumption 2017
Senegal LMIC SSA Consumption 2011
Serbia UMIC ECA Consumption 2018
Seychelles HIC SSA Income 2018
Sierra Leone LIC SSA Consumption 2018
Solomon Islands LMIC EAP Consumption 2013
South Africa UMIC SSA Consumption 2015
South Sudan LIC SSA Consumption 2017
Sri Lanka LMIC SAS Consumption 2016
St. Lucia UMIC LAC Income 2016
Sudan LIC SSA Consumption 2014
Tajikistan LIC ECA Consumption 2015
Tanzania LMIC SSA Consumption 2018
Thailand UMIC EAP Consumption 2019
Timor-Leste LMIC EAP Consumption 2014
Togo LIC SSA Consumption 2015
Tonga UMIC EAP Consumption 2015
Trinidad and Tobago HIC LAC Income 1992
Tunisia LMIC MNA Consumption 2015
Turkey UMIC ECA Consumption 2019
Turkmenistan UMIC ECA Consumption 1998
Tuvalu UMIC EAP Consumption 2010
Uganda LIC SSA Consumption 2017
Ukraine LMIC ECA Consumption 2019
Uruguay HIC LAC Income 2019
Uzbekistan LMIC ECA Consumption 2003
Vanuatu LMIC EAP Consumption 2010
Vietnam LMIC EAP Consumption 2018
West Bank and Gaza LMIC MNA Consumption 2017
Yemen, Republic of LIC MNA Consumption 2014
Zambia LMIC SSA Consumption 2015
Zimbabwe LMIC SSA Consumption 2019
Advanced economies
Australia HIC Income 2014
Austria HIC Income 2018
Belgium HIC Income 2018
Canada HIC Income 2017
Cyprus HIC Income 2018
Country Income groupDeveloping
region
Welfare
measureSurvey year
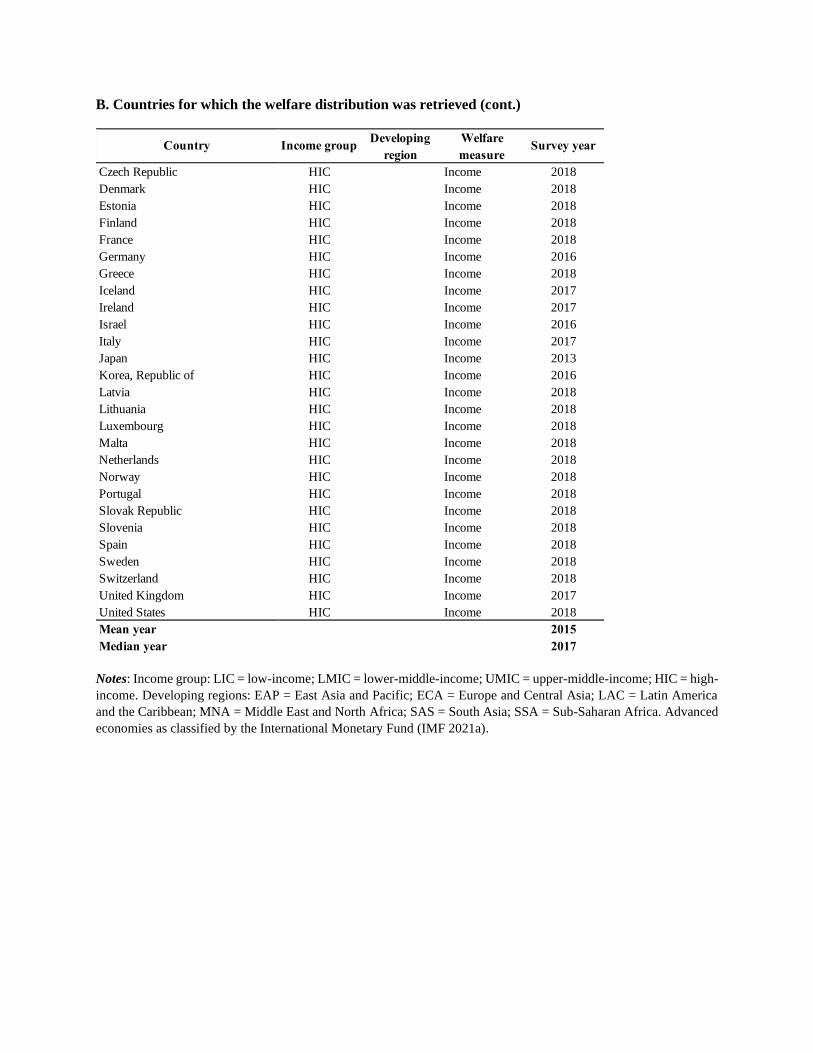
B. Countries for which the welfare distribution was retrieved (cont.)
Notes: Income group: LIC = low-income; LMIC = lower-middle-income; UMIC = upper-middle-income; HIC = high-
income. Developing regions: EAP = East Asia and Pacific; ECA = Europe and Central Asia; LAC = Latin America
and the Caribbean; MNA = Middle East and North Africa; SAS = South Asia; SSA = Sub-Saharan Africa. Advanced
economies as classified by the International Monetary Fund (IMF 2021a).
Czech Republic HIC Income 2018
Denmark HIC Income 2018
Estonia HIC Income 2018
Finland HIC Income 2018
France HIC Income 2018
Germany HIC Income 2016
Greece HIC Income 2018
Iceland HIC Income 2017
Ireland HIC Income 2017
Israel HIC Income 2016
Italy HIC Income 2017
Japan HIC Income 2013
Korea, Republic of HIC Income 2016
Latvia HIC Income 2018
Lithuania HIC Income 2018
Luxembourg HIC Income 2018
Malta HIC Income 2018
Netherlands HIC Income 2018
Norway HIC Income 2018
Portugal HIC Income 2018
Slovak Republic HIC Income 2018
Slovenia HIC Income 2018
Spain HIC Income 2018
Sweden HIC Income 2018
Switzerland HIC Income 2018
United Kingdom HIC Income 2017
United States HIC Income 2018
Mean year 2015
Median year 2017
Country Income groupDeveloping
region
Welfare
measureSurvey year
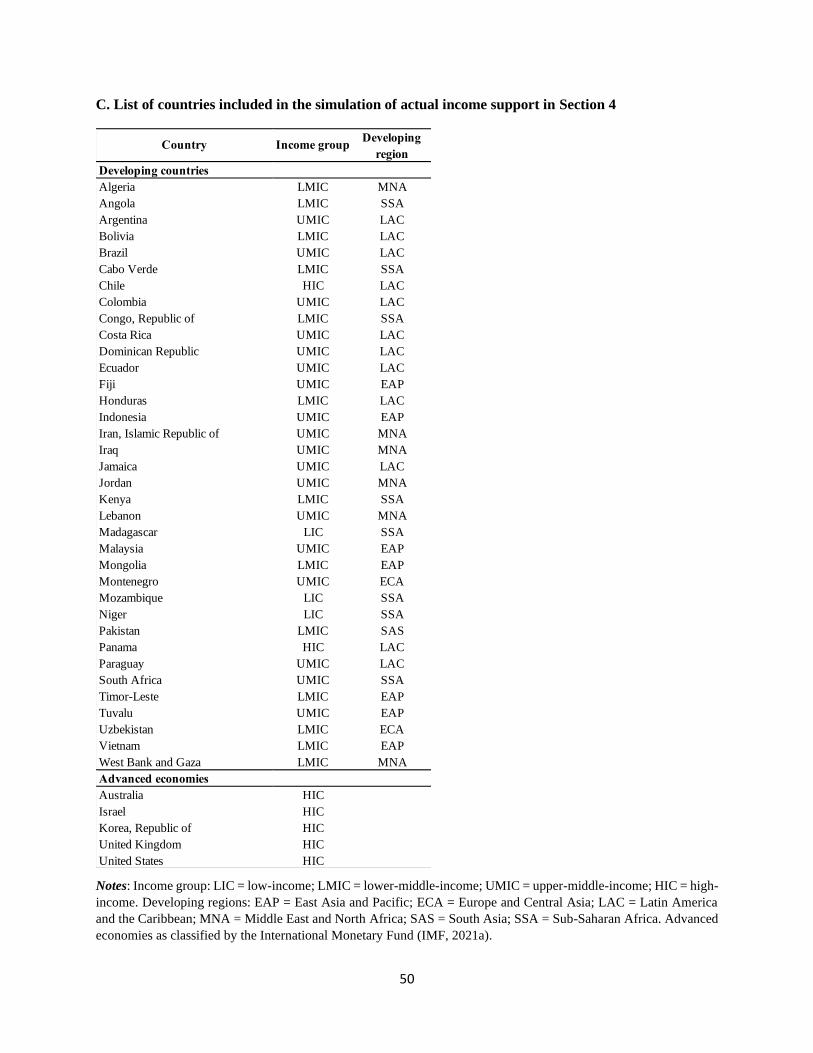
50
C. List of countries included in the simulation of actual income support in Section 4
Notes: Income group: LIC = low-income; LMIC = lower-middle-income; UMIC = upper-middle-income; HIC = high-
income. Developing regions: EAP = East Asia and Pacific; ECA = Europe and Central Asia; LAC = Latin America
and the Caribbean; MNA = Middle East and North Africa; SAS = South Asia; SSA = Sub-Saharan Africa. Advanced
economies as classified by the International Monetary Fund (IMF, 2021a).
Developing countries
Algeria LMIC MNA
Angola LMIC SSA
Argentina UMIC LAC
Bolivia LMIC LAC
Brazil UMIC LAC
Cabo Verde LMIC SSA
Chile HIC LAC
Colombia UMIC LAC
Congo, Republic of LMIC SSA
Costa Rica UMIC LAC
Dominican Republic UMIC LAC
Ecuador UMIC LAC
Fiji UMIC EAP
Honduras LMIC LAC
Indonesia UMIC EAP
Iran, Islamic Republic of UMIC MNA
Iraq UMIC MNA
Jamaica UMIC LAC
Jordan UMIC MNA
Kenya LMIC SSA
Lebanon UMIC MNA
Madagascar LIC SSA
Malaysia UMIC EAP
Mongolia LMIC EAP
Montenegro UMIC ECA
Mozambique LIC SSA
Niger LIC SSA
Pakistan LMIC SAS
Panama HIC LAC
Paraguay UMIC LAC
South Africa UMIC SSA
Timor-Leste LMIC EAP
Tuvalu UMIC EAP
Uzbekistan LMIC ECA
Vietnam LMIC EAP
West Bank and Gaza LMIC MNA
Advanced economies
Australia HIC
Israel HIC
Korea, Republic of HIC
United Kingdom HIC
United States HIC
Country Income groupDeveloping
region
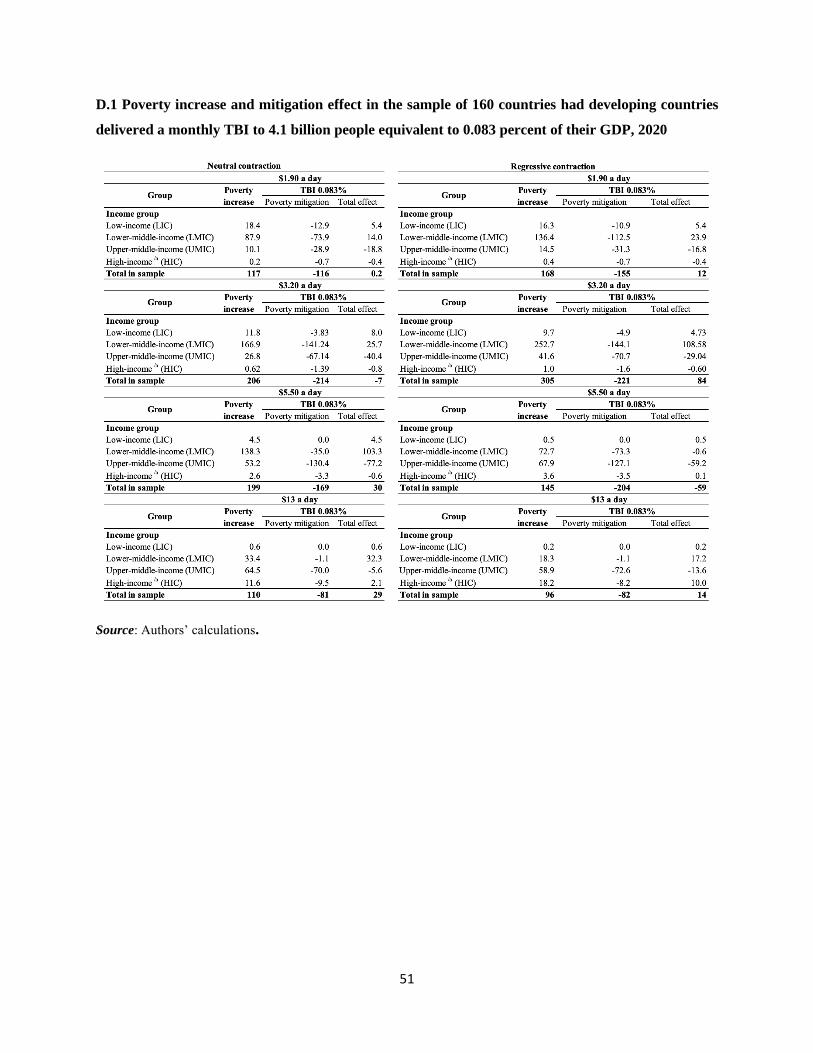
51
D.1 Poverty increase and mitigation effect in the sample of 160 countries had developing countries
delivered a monthly TBI to 4.1 billion people equivalent to 0.083 percent of their GDP, 2020
Source: Authors’ calculations.
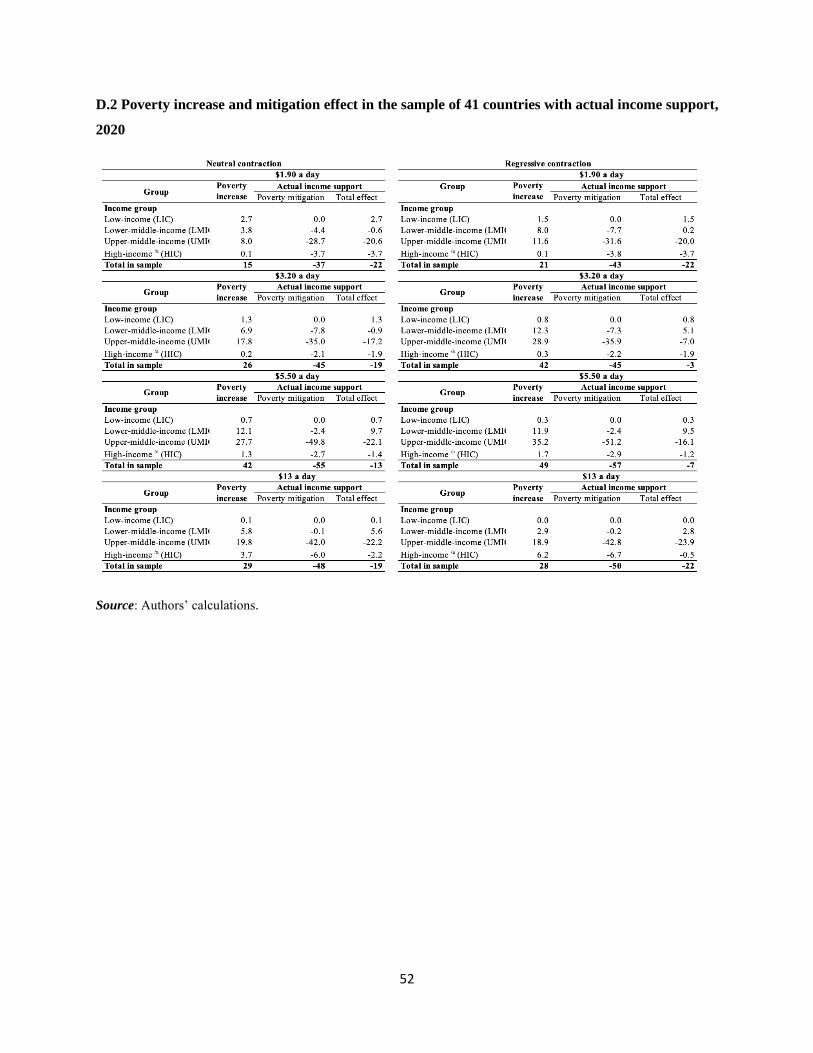
52
D.2 Poverty increase and mitigation effect in the sample of 41 countries with actual income support,
2020
Source: Authors’ calculations.