
Global Entrepreneurship Index 201 7
89
Zoltán J. Ács László Szerb Ainsley Lloyd 2018
-
Upload
khangminh22 -
Category
Documents
-
view
0 -
download
0
Transcript of Global Entrepreneurship Index 201 7

Zoltaacuten J Aacutecs Laacuteszloacute Szerb Ainsley Lloyd
The Global Entrepreneurship Index
lsquofocuses on high-growth companies It tries to measure the ambition of entrepreneurs as well as the prevalence of start-ups It presents its results in ways that are designed to capture the attention of policymakers It also identifies bottlenecks that prevent countries from doing better
-The Economist
lsquois a unique measure of entrepreneurship and its supporting conditions worldwide ndash and a key source of policy relevant information for all those working in private sector development (PSD)rsquo
-The Donor Committee for Enterprise Development
BY THE NUMBERS | GLOBAL ENTREPRENEURSHIP
The Best Country to Start a Business and other facts you probably didnt know about entrepreneurship around the world
-The Wall Street Journal
lsquoprovides a detailed analysis of the factors present in dozens of countries that encourage or dampen entrepreneurial activityrsquo
-Forbes Magazine
________________________________________________________________________
Zoltan J Acs is Professorial Fellow at the London School of Economics and Political Science UK and University Professor in the School of Public Policy at George Mason University USA Laszlo Szerb is University Professor and Director of the Department of Business and Management Studies in the Faculty of Business and Economics at the University of Pecs Hungary Erkko Autio is Chair in Technology Venturing and Entrepreneurship and Director of the Doctoral Programme at Imperial College London Business School UK and Ainsley Lloyd is the Global Operations Coordinator at GEDI
Glo
ba
l En
trep
ren
eu
rship
Ind
ex 2
01
7Aacute
csmiddot Szerb middot A
utio middot Lloyd
2018
i
The Global Entrepreneurship Index 2018
Zoltaacuten J Aacutecs
University Professor and Director of the Center for Entrepreneurship and Public Policy Schar School George Mason University Arlington Virginia USA and Visiting Professor Imperial College Business School London UK
Laacuteszloacute Szerb
University Professor and Director of the Department of Business and Management Studies in the Faculty of Business and Economics at the University of Pecs Hungary
Ainsley Lloyd
Executive Director The Global Entrepreneurship and Development Institute Washington DC USA
copy 2017 The Global Entrepreneurship and Development Institute Washington DC USA
ii
About The Global Entrepreneurship and Development Institute
Zoltaacuten J Aacutecs Founder and President The GEDI Institute
The Global Entrepreneurship and Development Institute (The GEDI Institute) is the leading research organization advancing knowledge on the relationship between entrepreneurship economic development and prosperity The Institute headquartered in Washington DC was founded by leading entrepreneurship scholars from George Mason University the University of Peacutecs
Imperial College London and the London School of Economics The Institutersquos flagship project is the Global Entrepreneurship Index (GEI) a breakthrough advance in measuring the quality and dynamics of entrepreneurship ecosystems at a national and regional level The GEI methodology on which the data in this report is based has been validated by rigorous academic peer review and has been widely reported in the media including in The Economist The Wall Street Journal Financial Times and Forbes The Institutersquos research has been funded by the European Union The World Bank and major corporations and banks around the world
2
Contents The 2018 Global Entrepreneurship Index Executive Summary 3
Why does entrepreneurship matter How do entrepreneurs contribute 3 What is the Global Entrepreneurship Index 3 What do this yearrsquos results show 4 Global Infographic 2018 5 Regional results Asia ndash Pacific 6 Regional results Europe 8 Regional results Middle East and North Africa 9 Regional results North America 10 Regional results SouthCentral America and the Caribbean 11 Regional results Sub-Saharan Africa 12 What can I do to improve the entrepreneurship ecosystem 13
Frequently Asked Questions 16 The Entrepreneurial Ecosystem 17
Introduction 17 What is Entrepreneurship 17 Entrepreneurial Ecosystem Elements 18 The Global Entrepreneurship Ecosystem 19 Agents 23 Institutions 23 The System 24 Ecosystem Services 24 Ecosystem Management 24
The Entrepreneurial Ecosystem and Global Prosperity 25 Introduction 25 Country-level Productivity and the Entrepreneurial Ecosystem 25
The Global Entrepreneurship Index In depth 30 The Global State of Entrepreneurship 30 Top Ten Countries 30 Regional Performance 31 Biggest Gains 31 Biggest Declines 32
Country-level results infographics 44
Figure 1 The Entrepreneurial Ecosystem Configuration 19 Table 1 The correlations between GEI total factor productivity and its components 26 Figure 2 GEI and total factor productivity 27 Figure 3 GEI and the productivity effect 28 Figure 4 GEI and the innovation effect 29 Table 2 Top Ten Countries in the GEI 30 Figure 5 Confidence Intervals for Top Ten Scores 30 Table 3 Top Scores by Region 31 Table 4 Biggest Gains in GEI Score 31 Table 5 Biggest Declines in GEI Score (among countries with decreases in GEI score) 32 Figure 6 The Structure of the Global Entrepreneurship Index 32 Table 6 The Global Entrepreneurship Index Rank of All Countries 2018 37 Table 7 The Global Entrepreneurship Index and Sub-Index Ranks of the First 25 Countries 2018 39 Table 8 Entrepreneurial Attitudes Sub-Index and Pillar Values for the First 25 Countries 2018 40 Table 9 Entrepreneurial Abilities Sub-Index and Pillar Values for the First 25 Countries 2018 41 Table 10 Entrepreneurial Aspirations Sub-Index and Pillar Values for the First 25 Countries 2018 42
3
The 2018 Global Entrepreneurship Index Executive Summary
Why does entrepreneurship matter How do entrepreneurs contribute
Entrepreneurs improve economies and peoplersquos lives by creating jobs developing new solutions to problems creating technology that improves efficiency and exchanging ideas globally Many of the conditions that help entrepreneurs also help the economy as a whole providing even broader gains from supporting entrepreneurship
What is the Global Entrepreneurship Index
The Global Entrepreneurship Index is a composite indicator of the health of the entrepreneurship ecosystem in a given country
The GEI measures both the quality of entrepreneurship and the extent and depth of the supporting entrepreneurial ecosystem Wersquove identified the 14 components that we believe are important for the health of entrepreneurial ecosystems identified data to capture each and used this data to calculate three levels of scores for a given country the overall GEI score scores for Individuals and Institutions and pillar level
1 For more detail on the contents of these pillars see ldquoThe Global Entrepreneurship Index 2018 in depthrdquo section of this report For additional detail on our methodology see the 2018 GEI Technical Annex available at wwwthegediorg
scores (which measure the quality of each of our 14 components) The questions that we seek to answer using the variables wersquove selected for each pillar are
Component of the entrepreneurship ecosystem1
What does it measure
Pillar 1 Opportunity Perception
Can the population identify opportunities to start a business and does the institutional environment make it possible to act on those opportunities
Pillar 2 Startup Skills
Does the population have the skills necessary to start a business based on their own perceptions and the availability of tertiary education
4
Component of the entrepreneurship ecosystem1
What does it measure
Pillar 3 Risk Acceptance
Are individuals willing to take the risk of starting a business Is the environment relatively low risk or do unstable institutions add additional risk to starting a business
Pillar 4 Networking Do entrepreneurs know each other and how geographically concentrated are their networks
Pillar 5 Cultural Support
How does the country view entrepreneurship Is it easy to choose entrepreneurship or does corruption make entrepreneurship difficult relative to other career paths
Pillar 6 Opportunity Perception
Are entrepreneurs motivated by opportunity rather than necessity and does governance make the choice to be an entrepreneur easy
Pillar 7 Technology Absorption
Is the technology sector large and can businesses rapidly absorb new technology
Component of the entrepreneurship ecosystem1
What does it measure
Pillar 8 Human Capital
Are entrepreneurs highly educated well trained in business and able to move freely in the labor market
Pillar 9 Competition
Are entrepreneurs creating unique products and services and able to enter the market with them
Pillar 10 Product Innovation
Is the country able to develop new products and integrate new technology
Pillar 11 Process Innovation
Do businesses use new technology and are they able access high quality human capital in STEM fields
Pillar 12 High Growth
Do businesses intend to grow and have the strategic capacity to achieve this growth
Pillar 13 Internationalization
Do entrepreneurs want to enter global markets and is the economy complex enough to produce ideas that are valuable globally
Pillar 14 Risk Capital
Is capital available from both individual and institutional investors
What do this yearrsquos results show
The map below shows the overall GEI score for each of the 137 countries in the 2018 Global Entrepreneurship Index
5
bull Globally GEI scores have improved by 3 onaverage since last yearrsquos Index
bull In the 2018 GEI the Asia-Pacific region onaverage scores best (and is improving) inProduct Innovation The region is also strong inHuman Capital
bull Europe shows stable high scores in TechnologyAbsorption and Internationalization andregionrsquos average score on Startup Skills hasrecently climbed into the same league
bull The Middle East and North Africa regiondemonstrates strength inProduct Innovation and RiskCapital
bull North Americarsquos strongestareas are OpportunityPerception and RiskAcceptance
bull South Central America andthe Caribbean is strongest inthe areas of Startup Skills andProduct Innovation
bull Sub-Saharan Africa showsgreatest strength inOpportunity Perception
bull Globally wersquove seen a 22increase in Product Innovationscores since the 2017 GEI andan 11 increase in StartupSkills scores since the 2017GEI This suggests that theglobal population is becomingmore educated and identifyingmore opportunities to createnew products
bull Small declines (less than 2)since the 2017 GEI were seenacross five areas Culturalsupport Human capitalCompetitionInternationalization and Risk
Capital This indicates that the overall environment has in some ways become slightly less friendly to entrepreneurship
The conclusion ndash certain aspects of being an entrepreneur have become a bit harder but entrepreneurs are more than meeting this challenge with new skill acquisition and improvements in innovation capacity
The table below shows the rank of each country in the 2018 Index
6
7
Regional results Asia ndash Pacific
The Asia-Pacific region shows greatest strength in Human Capital and Product Innovation ndash on average countries in the Asia-Pacific region have highly educated populations that are well trained in business and able to move freely in the labor market They are also producing products that are new to customers and integrating new technology The regionrsquos lowest scores on average are in the area of Risk Acceptance If countries in the region improve their overall risk profile as well as the populationsrsquo attitudes
towards taking risks it is likely that the entrepreneurship ecosystems in the Asia-Pacific region will gain ground Tech giants dominate the regionrsquos top ranks while lower income agriculture and manufacturing-dependent economies are found closer to the bottom Emerging hotspots for the digital economy are found near the middle of regional ranks China and South Korea saw the largest gains in the region on overall GEI score since the 2017 GEI
8
Regional results Europe
European nations post high average scores on Startup Skills owing to a legacy of broadly available tertiary education and a populace that largely posesses the skills necessary to start a business The regionrsquos biggest weakness is in Networking though it still scores above the global average in this area Overall Europersquos scores are relatively balanced across all components of the GEI suggesting that a broader mix of policy is likely to have a larger impact on overall performance than focusing on single policy area might
Northern European nations are found in the regionrsquos top ranks while Eastern European nations are found at the bottom Seven of the GEIrsquos top ten countries are in the European region The United Kingdom Bulgaria Italy Poland and Ireland all improved their overall GEI scores by at least 35 points over their 2017 GEI scores placing them among the top ten biggest gains in score globally
9
Regional results Middle East and North Africa
The MENA region shows greatest strength in the areas of Product Innovation and Risk Capital The region is bringing new products to market and integrating new technology while also providing the capital to help businesses grow The regionrsquos lowest average scores are in the areas of Competition and Risk Acceptance as large firms dominate many economies in the region and businesses face higher risks in many MENA countries than in other areas
Open economies that have embraced global trade and created attractive investment climates score near the top of the region while countries that have seen economic and political instability rank nearer the bottom
Both Israel and Iran saw overall score improvements of more than four points over the previous GEI and are among the top ten biggest gains in score globally for the 2018 GEI
10
Regional results North America
The US and Canada drive most high average regional scores for North America while Mexico contributes top scores in the area of Networking The regionrsquos overall greatest strengths are in Opportunity Perception and Product Innovation ndash the regionrsquos population is able to spot and act on good opportunities for starting a business and is able to bring new products to market and integrate new technology The region struggles most
in the area of High Growth ndash an indication that entrepreneurs in North America are not as motivated to grow and scale their businesses as their other component scores would suggest
Canada ranks among the top ten biggest score improvements in the 2018 GEI
11
Regional results SouthCentral America and the Caribbean
The SouthCentral America and the Caribbean region scores highest on average on Startup Skills and Product Innovation Entrepreneurs benefit from broadly available tertiary education and a high levels of business skill They are also creating products that are new to markets and integrating new technology into their businesses
Unlike regions with more balanced performance this region has an opportunity to create significant improvements by focusing on a small number of key bottlenecks Process Innovation and Risk Capital
Similar to previous years Chile far outperforms the rest of the region with a score forty percent higher than the regionrsquos second highest score
12
Regional results Sub-Saharan Africa
Sub-Saharan Africarsquos greatest strength is in the area of Opportunity Perception Entrepreneurs in the region are able to spot opportunities around them for starting businesses The regionrsquos lowest average scores are in the areas of Startup Skills Risk Acceptance and Risk Capital Tertiary education is not as broadly accessible as in other regions and entreprenuerial skills are less common The general risk climate is not as favorable in the region as in other areas and the capital availability lags behind other regions
There is significant opportunity for improvement however as Sub-Saharan Africa can look to the examples of regional leaders Botswana and South Africa Both countries demonstrate the possiblity for great change and substantial improvement on relatively short time scales Further the region has a few clear bottlenecks which if addressed could quickly yield overall improvements in entrepreneurial ecosystems and the economy as a whole
13
What can I do to improve the entrepreneurship ecosystem
The Global Entrepreneurship Index covers 14 areas (what we call pillars) of the entrepreneurship ecosystem Each country has one (or several) critical areas that are holding back the ecosystem and different actions can be taken to generate improvements in each of these areas With the help of three experts ndash Professor Richard Saouma Venture Capitalist Ken Krull and Researcher Ainsley Lloyd - wersquove generated the following (non-exhaustive) list of example actions that one might take to impact each of the 14 areas measured by the GEI We donrsquot endorse all of these actions for all contexts but instead hope that this list helps start the conversation around improving the bottleneck issues in your entrepreneurship ecosystem
Area of the entrepreneurship ecosystem
What does it measure What can I do if Irsquom a(n)hellip
Entrepreneur Large company Policymaker
OPPORTUNITY PERCEPTION
Can the population identify opportunities to start a business and does the institutional environment make it possible to act on those opportunities
bull Expose yourself to new experiences to boost creative thinking bull Start a side hustle to test a business concept
bull Market and promote partnerships with entrepreneurial firms bull Create an intrepreneurship culture bull Create a policy of paid side project time (like Google) bull Bring attention to the entrepreneurial qualities of employees and how the firm empowers them to create value bull Show how the firm has partnered with entrepreneurs to help them launch a businesses
bull Lower tax rates bull Promote entrepreneurial successes within economic development initiatives bull Advertise the success of local entrepreneurs who played by the book
STARTUP SKILLS Does the population have the skills necessary to start a business based on their own perceptions and the availability of tertiary education
bull Ask entrepreneurs around you how they have developed the skills that have helped them be successful bull Participate in continuing education bull Learn a new skill bull Take an online course
bull Reimburse or match for continuing education bull Incorporate educational childcare and after school care programs for working parents bull Sponsor skill building with local associations bull Emphasize the importance of entrepreneurship skills in collegiate recruitment programs at the pre-internship stage
bull Expand access to tertiary education to a broader portion of the population bull Offer tax credits for educational expenses bull Implement tax exempt educational savings plans bull Create a policy to reduce the child workforce bull Make high school business education mandatory including the identification and capture of value bull Fund regional initiatives to encourage student entrepreneurship and make sure to prioritize under-funded initiatives bull Offer funding with no strings attached to the student entrepreneur who gets the most traction on the least amount of resources
14
Area of the entrepreneurship ecosystem
What does it measure What can I do if Irsquom a(n)hellip
Entrepreneur Large company Policymaker
RISK ACCEPTANCE Are individuals willing to take the risk of starting a business Is the environment relatively low risk or do unstable institutions add additional risk to starting a business
bull Run the smallest possible test you can run to validate your idea bull Predefine successful outcomes bull Recruit critical advisors willing to kill concepts that dont fit bull Realize that not all ideas can be implemented today or have a valid skillset match for the entrepreneur bull Identify external dependencies on your ideas success
bull Create an ok to fail culture bull Reward appropriate risk taking behavior bull Help employees plan their efforts and log outcomes The documentation process will help them realize that they take risk every day and while they remember the failures there are myriad daily wins
bull Improve institutional and regulatory stability and ensure absence of conflict bull Create simple and consistent personal and corporate bankruptcy processes bull Change the communication around social safety nets to highlight the fact that they are a great resource for potential entrepreneurs because they mitigate damages for those who fail
NETWORKING Do entrepreneurs know each other and how geographically concentrated are their networks
bull Find places where other entrepreneurs gather and engage (eg Kauffman Foundations one million cups) bull Join a forum club association or other group related to your concept
bull Sponsor formal networking functions as corporate recruiting bull Encourage mentorship bull Build formal intern and apprenticeship programs bull Host social events with entrepreneurs where entrepreneurs can learn what are the real pain points faced by companies how they can add value andor what fish are too small for the large firm to fry
bull Improve ICT access and infrastructure bull Promote vertical associations networking activities bull Sponsor an entrepreneurship week every two months Showcase the work of startups in your area and invite the public bull Create incubation space in economically depressed areas - empty cargo containers a room with 4 walls - that is available to would be entrepreneurs open 247
CULTURAL SUPPORT How does the country view entrepreneurship Is it easy to choose entrepreneurship or does corruption make entrepreneurship difficult relative to other career paths
bull Encourage and support entrepreneurs around you bull Create a blog or other appropriate social media around the developing of your entrepreneurial concept
bull Market intrepreneurship as formal company PR bull Sponsor recognition programs promoting entrepreneurship like Entrepreneur of the Year programs bull Ensure that HR highlights the importance of entrepreneurial spirit to the entire pipeline of potential future employees starting in high schools
bull Reduce and prevent corruption bull Track formal statistics on entrepreneurship and its effect on GDP and other institutional metrics bull Make it easy for firms to plug into communities to announce their values (entrepreneurship) in eg high schools by structuring formal slots or entrepreneurship days with the school system
OPPORTUNITY STARTUP
Are entrepreneurs motivated by opportunity rather than necessity and does governance make the choice to be an entrepreneur easy
bull Mentor or contribute to best practices in interacting with government and administrative overhead
bull Allow spinouts of corporate developed ideas that the company cant pursue
bull Reduce the administrative burden of paying taxes and improve the capacity of the government to create and implement sound policies bull Lower the administrative overhead of incorporating and managing a business
15
Area of the entrepreneurship ecosystem
What does it measure What can I do if Irsquom a(n)hellip
Entrepreneur Large company Policymaker
TECHNOLOGY ABSORPTION
Is the technology sector large and can businesses rapidly absorb new technology
bull Keep abreast of current technology and trends bull Invest in technology that furthers your business
bull Educate employees in current technology and trends bull Invest in technology partnerships that businesses align bull Sponsor after school programming or similar STEM resources
bull Sponsor leading technologist at ecosystem events bull Promote local technologies and technologists bull Provide tax breaks for preferred industries Sponsor STEM school programs
HUMAN CAPITAL Are entrepreneurs highly educated well trained in business and able to move freely in the labor market
bull Invest in formal and informal continuing education
bull Reimburse or match for continuing education bull Incorporate educational childcare and after school care programs for working parents bull Sponsor skill building with local associations
bull Foster a flexible labor market in which businesses can easily hire employees bull Sponsor students who leave home to pursue a better education and tie the debt forgiveness to them returning just like firms do with pre-MBA hires bull Sponsor free access to online learning platforms bull Provide tax breaks for education costs incurred by firms
COMPETITION Are entrepreneurs creating unique products and services and able to enter the market with them
bull Identify opportunities within your market that are underserved or unique
bull Break up monopolies and police anticompetitive practices
PRODUCT INNOVATION
Is the country able to develop new products and integrate new technology
bull Create products and services that are new to the market
bull Invest in RampD bull Foster collaboration in research between universities and industry and the protection of intellectual property
PROCESS INNOVATION
Do businesses use new technology and are they able access high quality human capital in STEM fields
bull Adopt new technology that improves your businessrsquo functioning
bull Improve the quality of scientific institutions and the availability of scientists and engineers
HIGH GROWTH Do businesses intend to grow and have the strategic capacity to achieve this growth
bull Set ambitious goals for hiring and profits
bull Reduce the barriers to obtaining equity financing
INTERNATIONAL-IZATION
Do entrepreneurs want to enter global markets and is the economy complex enough to produce ideas that are valuable globally
bull Identify opportunities to export your productsservices to new markets
bull Facilitate the interaction of individuals in increasingly complex networks in order to make products
RISK CAPITAL Is capital available from both individual and institutional investors
bull Support other entrepreneurs with seed funding
bull Support entrepreneurs in corporate philanthropy impact and social responsibility initiatives
bull Reduce the barriers to providing venture capital and private equity financing
16
Frequently Asked Questions
Why do you use both individual data and institutional data
It takes both highly motivated individuals and a supporting institutional environment for entrepreneurship to flourish Without measuring both we donrsquot get an accurate representation of the ecosystem
Why donrsquot the individual and institutional scores add up to the final GEI score
These two ecosystem components donrsquot exist independently of each other ndash rather they influence each other For this reason our methodology is closer to a multiplication than an addition of the two components Further the fourteen pillars we capture influence each other too which accounts for the additional difference
How can I get my country into the GEI
We depend on several sources of data that are consistent across countries If your country is missing from the GEI itrsquos because we lack data in one of our major index data sources The best way to remedy this is to work directly with these data collection entities to produce the necessary data for your country
Can I supply the missing data myself
In order to maintain the comparability of our dataset across countries we have to use a single source of data for each indicator Because methodology can differ when different parties collect the same data we canrsquot accept data substitutions from other sources
Do you use estimated data Why
Wersquove always felt that it is important to use our expertise to help where we can and sometimes this means estimating data so that at least a blurry picture of a country can be seen rather than none at all
In order to include a larger number of countries in our GEI analysis we estimate the individual-level variables for missing countries by using similar peers Based on our experience when a country eventually produces actual individual level data the results tend to be very similar to our estimates Certainly there are inconsistencies but
we donrsquot believe in making the perfect the enemy of the good we believe that so long as one is transparent about missing data imputation the value of the resulting analyses is worth the imperfection For detailed information on which countries wersquove estimated see the 2018 GEI Technical Annex available at wwwthegediorg
Further missing data imputation is common practice within and outside of index building across globally recognized institutions the World Economic Forumrsquos Global Gender Gap Report the World Health Organizationrsquos Global Burden of Disease the Yale Environmental Performance Index and Transparency Internationalrsquos Corruption Perceptions Index all impute some data for some countries and disclose these imputations like we do
What ecosystem pillarcomponent should we work on improving first
Focusing on improving the weakest pillar first will produce the greatest gains Think of it like baking a cake where each pillar is one of the ingredients If you donrsquot have enough eggs adding more flour wonrsquot help you bake a better cake You need to add more eggs before you start to see an improvement
I disagree with the results ndash what I see in my country is different than the picture you paint
We produce the Global Entrepreneurship Index as a starting point for discussion around improving entrepreneurial ecosystems We use the best data available that covers the most countries possible in order to produce a globally comparable picture of where different countries stand The GEI isnrsquot a solution in itself itrsquos a road map that points you towards the strengths and weaknesses of your country so that your efforts can be focused on digging deeper into these issues Wersquore happy to have these discussions and even happier to facilitate them Additional information on our ecosystem improvement facilitation is available on our website wwwthegediorg
17
The Entrepreneurial Ecosystem Introduction
When the unemployment rate in the United States was 10 percent during the great recession it was considered a catastrophe However the unemployment rate in most MENA countries is close to 30 percent and even higher in some other countries This is a disaster for many parts of the world It leads to desperation and violence as millions of youth struggle to survive The world needs to create a billion jobs in the very near future to create global peace and prosperity Entrepreneurship creates jobs and generates economic growth - the underpinning of a stable and civil society But before we get into how this works we need to discuss what kind of entrepreneurship we are talking about Who is an entrepreneur We are not talking about the basket weaver solo entrepreneur we are not talking about rural microcredit We are talking about Silicon Valley Bill Gates Sam Walton FedEx and Starbucks What is Entrepreneurship
An entrepreneur is a person with the vision to see an innovation and the ability to bring it to market Most small business owners on main-street in the United States or in the markets of most cities around the world are not entrepreneurs according to this definition If you walk down the streets of Seventh Avenue in New York City you will see street vendors selling the fare of every country in the world nail shops and small grocery stores Few of these establishments are entrepreneurial by our definition because there is nothing new about them Most of these people are traders or shop owners performing a sort of small business management Now these people are important donrsquot get us wrong they create jobs and income for their families But we want to make a distinction here between the small business owner who replicates what others are doing and an entrepreneur who innovates The Global Entrepreneurship Monitor refers to most of the former category of people as necessity entrepreneurs They have no other option in the labor market for making money That is why the TEA (total early-stage entrepreneurial activity) is negatively correlated with economic growth economic freedom and global competitiveness The greater TEA the worse
your economy is - Uganda has the highest TEA rate in the world but few would argue that Uganda is more entrepreneurial than the United States The TEA therefore does not measure entrepreneurship quality but rather entrepreneurship quantity and in so doing captures primarily self-employment We are concerned with entrepreneurship quality the opportunity driven entrepreneur who generates commercial success Our definition of entrepreneurship is about high growth scalability and serious job creation This point is not new It has been made by Daniel Eisenberg Peter Drucker William Baumol and Schumpeter more than a century ago Entrepreneurship is about job creation and growth through innovation Good policy can only be generated through focusing the discussion on innovative growth-oriented entrepreneurship not the self-employment captured by GEMrsquos TEA rate Our definition of entrepreneurship is driven not by necessity entrepreneurship but by opportunity Opportunity entrepreneurship is positively correlated with economic growth Entrepreneurs envision scalable high-growth businesses They also possess the ability to make those visions a reality They get things done They go over under and around obstacles This is borne out in the relationship observed between regulation and these two categories of entrepreneurs regulation holds back replicative entrepreneurs but does not have the same impact on opportunity entrepreneurs Entrepreneurs are the bridge between invention and commercialization Invention without entrepreneurship stays in the university lab or the RampD facility Entrepreneurs like Steve Jobs and Bill Gates commercialize other peoplersquos inventions This vision of entrepreneurship actually delivers a product to customers While we have drawn a rather narrow definition of the entrepreneur someone who innovates and gets things done it is actually very broad Entrepreneurs are everywhere in every society in rich and poor neighborhoods they are Christians Muslims and Jews male and female gay and straight They are people of color Entrepreneurs can be high tech or low tech or even no tech All over the world entrepreneurs work in all sorts of conditions against great odds - in the slums of Kibera Bombay and Jakarta They find ways to innovate and bring products to market Just because entrepreneurs donrsquot have access to finance intellectual property protection or a trained staff does not mean that entrepreneurs do not exist and cannot succeed For
18
Example Beleza Natural which started with a single salon in 1993 in San Paulo Brazil currently operates 29 salons and a cosmetics research lab produces a full line of hair-care products and employs 1400 people In 2012 the companyrsquos revenue was more than $30 million Beleza Natural is interesting because it focused its activities on the demand of an overlooked group in this case low-income women at the bottom of the pyramid By offering ldquoaffordable luxuriesrdquo in the form of hair treatment and the salon experience Beleza Natural was tapping into the so-called ldquolipstick economyrdquo However as is the case for other successful female entrepreneurs Beleza Natural aspired to provide greater benefits to its clients and employees The companys business objectives extend to broader social and environmental benefits1 A second aspect of our definition of entrepreneurship regards the level of technology In the West innovation is used synonymously with technology The heroes in the West are Zuckerberg Jobs and other Silicon Valley stalwarts Our definition is open to non tech innovators like Oprah and Bowker Starbucks serves a centuries old drink coffee but it introduced a coffee shop experience that is now in every corner of the world When you go into Starbucks and there is a long line it disappears in just a few minutes That is process innovation and very much an example of a non tech entrepreneur McDonalds did the same for the hamburger Enterprise Rent a Car did it for car rentals and today employs thousands of people worldwide Uber did it for taxicabs They did not invent taxis They have been around forever They invented a new process What low tech entrepreneurship does is increase efficiency how quickly you can serve a cup of coffee Entrepreneurial Ecosystem Elements
Ever since the time of Schumpeter the concepts of entrepreneurship and innovation have been intertwined with economic development The Global Entrepreneurship Index is an important tool to help countries accurately assess and evaluate their ecosystem to create more jobs The entrepreneurial ecosystem is a new way to contextualize the increasingly complex and interdependent social systems being created2 While the academic literature kept agency institutions and systems in separate silos the real communities that practitioners worked in had no such silos and the different building blocks all built upon each other in a
single unified structure Business books such as Brad Feldrsquos Start-up communities Building an entrepreneurial ecosystem in your city Daniel Isenbergrsquos Harvard Business Review article What an entrepreneurship ecosystem actually is and Steven Koltai Peace through Entrepreneurship Investing in a Start-up Culture for Security and Development started to suggest that reality was nuanced In order to better understand entrepreneurial ecosystems letrsquos start with a few definitions3 A system is an organized set of interacting and interdependent subsystems that function together as a whole to achieve a purpose In general an ecosystem is a purposeful collaborating network of dynamic interacting systems and subsystems that have an ever-changing set of dependencies within a given context4 First an ecosystem as opposed to a system has both living and non-living components Otherwise itrsquos a system like national systems of innovation In addition there are outcomes of the ecosystem that the literature calls ecosystem services and there is ecosystem management The point of this line of research is that it is not just the abundance or endowment of particular key factors of production or resources that shape economic performance it is also the manner in which that economic activity is configured or organized within geographic space The most carefully worked out approach to entrepreneurial ecosystems is associated with Acs Szerb and Autio This line of research recognizes that it is not just the abundance or endowment of particular key factors of production or resources that shape economic performance it is also the manner in which that economic activity is configured or organized within geographic space and the role of entrepreneurship in bringing it to life While the entrepreneurial ecosystem literature does not challenge the efficacy of these other dimensions of spatial organization and structure such as clusters specialization diversity market power or localized competition it suggests that entrepreneurship is also a key dimension enhancing economic performance Entrepreneurial ecosystems are composed of sub-systems (pillars) that are aggregated into systems (sub- indices) that can be optimized for system performance at the ecosystem level There is a growing recognition in the entrepreneurship literature that entrepreneurship
19
theory focused only on the entrepreneur may be too narrow The concept of systems of entrepreneurship is based on three important premises that provide an appropriate platform for analyzing entrepreneurial ecosystems First entrepreneurship is fundamentally an action undertaken and driven by agents on the basis of incentives Second the individual action is affected by an institutional framework conditions Third entrepreneurship ecosystems are complex multifaceted structures in which many elements interact to produce systems performance thus the index method needs to allow the constituent elements to interact However because the elements are different in each case there is no one size fits all solution Each one is bespoke The Global Entrepreneurship Ecosystem
We define entrepreneurial ecosystems at the socio-economic level having properties of self-organization scalability and sustainability as ldquohellipdynamic institutionally embedded interaction between entrepreneurial attitudes abilities and aspirations by individuals which drives the allocation of resources through the creation and operation of new venturesrdquo 5 Entrepreneurial Ecosystems are complex socioeconomic structures that
are brought to life by individual-level-action Much of the knowledge relevant for entrepreneurial action is embedded in ecosystem structures and requires individual-level-action to extract it 6 The structure of the entrepreneurial ecosystem is illustrated in Figure 1 Nascent and new entrepreneurs are at the heart of the system Nascent entrepreneurs are individuals in the process of launching a new venture These entrepreneurs represent a sub-set of the adult population in a given country The attitudes that prevail within the wider population influence who chooses to become an entrepreneur The nascent and new entrepreneurs are characterized by varying degrees of ability and entrepreneurial aspirations It is the entrepreneurs who drive the trial and error dynamic This means entrepreneurs start businesses to pursue opportunities that they themselves perceive However entrepreneurs canrsquot tell in advance if opportunities are real or not The only way to validate an opportunity is to pursue it The outcome is a trial and error process
Figure 1 The Entrepreneurial Ecosystem Configuration
The entrepreneurial framework conditions matter because they regulate first who chooses to become an entrepreneur and second to what extent the resulting
new ventures are able to fulfill their growth potential The first aspectmdashentrepreneurial choicemdashis regulated mostly by soft framework conditions such as social
Entre-preneurs
23
norms and cultural preferences The degree to which new ventures are able to fulfill their potential is regulated by a range of entrepreneurial framework conditions such as government research and development education infrastructure financial sector and the corporate sector A healthy entrepreneurial ecosystem will drive resource allocation towards productive uses It will also drive total factor productivity through process innovation (Starbucks) The greater total factor productivity the greater the economyrsquos capacity to create jobs and wealth Agents
The first component of entrepreneurial ecosystems is agency The entrepreneur drives the system The entrepreneur is someone who makes judgment-based decisions about the coordination of scarce resources The term ldquosomeonerdquo is defined as the individual and the term ldquojudgment-based decisionsrdquo are decisions for which no obviously correct procedure exists Judgement is not the routine application of a standard rule As we discussed above we distinguish two types of entrepreneurial activity at one pole there is routine entrepreneurship which is really a type of management and for the rest of the spectrum we have high growth entrepreneurship By routine entrepreneurship we mean the activities involved in coordinating and executing a well-established ongoing concern in which the parts of the production function in use are well known and that operates in well-established and clearly defined way This includes the self-employment and small business owner It is the next taco stand garage or hair dresser It is certainly the case that replicative entrepreneurs can be of great social value However these types of firms are not what we mean by ecosystem services7 By high-impact entrepreneurship we mean the activities necessary to create an innovative high-growth venture where not all the markets are well established or clearly defined and in which the relative parts of the production function are not completely known Innovative entrepreneurs ensure that utilization of invention contributes to increased productivity and facilitates and contributes to economic growth The gap-filling and input-completing capacities are the unique characteristics of the entrepreneur
Institutions
The second fundamental component of Entrepreneurial Ecosystems is institutionsmdashthe rules of the game Of particular importance to entrepreneurship are the economic institutions in society such as the structure of property rights and the presence of effective market frameworks (North 1990) Economic institutions are important because they influence the structure of economic incentives Without property rights individuals will not have the incentive to invest in physical or human capital or adopt more efficient technologies Economic institutions are also important because they help to allocate resources to their most efficient uses they determine who gets profits revenues and residual rights of control When markets were highly restricted and institutions sent the wrong signals there is little substitution between labor and capital and technological change is minimal Institutions create incentives and that the entrepreneurial talent is allocated to activities with the highest private return which need not have the highest social returns Universal welfare-enhancing outcomes do not automatically follow from entrepreneurial activity indeed such activities can generate questionable or undesirable effects Entrepreneurial talent can be allocated among a range of choices with varying effects from wealth-creation to destruction of economic welfare If the same actor can become engaged in such alternative activities then the mechanism through which talent is allocated has important implications for economic outcomes and the quality of this mechanism is the key criterion in evaluating a given set of institutions with respect to growth We follow many others for example Hayek in proposing that the answer rests upon the institutional system and the incentives that it creates for agents yet we differ in simultaneously stressing the role of entrepreneurs In the United States institutions of private property and contract enforcement gives entrepreneurs the incentive to invest in physical and human capital to combine inputs in ways to create new production functions and to complete markets It is entrepreneurs operating in supportive institutional environments that provide the transmission mechanism from knowledge to economic growth by raising productivity
24
The System
The third component of entrepreneurial ecosystems is the systems When we look at systems for example systems of innovation or clusters we have a theory of how the system functions as it produces outputs Porterrsquos Diamond comes to mind When we move to an ecosystem we also need to have a theory of how the ecosystem functions How does an entrepreneurial ecosystem function It is not enough to have a laundry list of the institutions that might be important markets human capital supports culture finance and policy While all of these may be important how they work as an ecosystem is missing in much of this literature Building on the Systems of Innovation literature and the Global Entrepreneurship Monitor methodology we develop an entrepreneurial ecosystem that integrates both institutions and agency and introduce an ecosystem of coherent patterns in a simple intuitive and powerful way The key ideas are the relationships the complementary across the systems and subsystems and the importance of bottleneck factors The concept of complementary in its simplest way is the interaction of two variables Two choice variables are complements when doing more of one of them increases the returns to doing more of the other Ecosystem Services
While many think of the output of ecosystems as more startups like GEM this is wrong and misleading The dual service created by entrepreneurial ecosystems is (1) resource allocation towards productive uses and (2) the innovative high-growth ventures that drive this process The entrepreneurship literature frequently talks about opportunity recognition and the need to assemble resources However from a performance perspective the key issue is about resource allocation from existing activities to new ones The allocation of resources to productive uses will result in high growth high value new firms The nutrient in the ecosystem is resourcesmdashventure capital Without nutrients the ecosystem will die For example the launch of Uber and AirBnB early this decade and the earlier success of Google Amazon Facebook Twitter Skype WhatsApp Craigrsquos List created a new breed of company The billion-dollar tech startup was once the stuff of myth but now they seem to be everywhere backed by a bull market readily available venture capital and a new generation of disruptive technology8
Ecosystem Management
In the ecological literatures the practice of managing and enhancing ecosystem benefits is referred to as ecosystem management Because ecosystem services is created through a myriad of localized interactions between stakeholders it is not easy to trace gaps in system performance back to specific well-defined market and structural failures that could be addressed in a top-down mode 9 Strengthening the entrepreneurial ecosystem can be done by public private partnerships banks universities foundations governments and aid agencies The Global Entrepreneurial Ecosystem Roadmap (GEER) focuses on the first aspect of this project that is (1) identifying the holes in the global entrepreneurship ecosystem (2) laying out a roadmap for how to fill in the holes and (3) measuring our progress The goal of a well-functioning ecosystem is to improve the chances of success for entrepreneurs all over the world And ultimately reduce unemployment and bring peace to the world
25
The Entrepreneurial Ecosystem and Global Prosperity Introduction
While a focus on the entrepreneurial ecosystem may seem a novel approach to development it is consistent with and even complementary to older more traditional development strategies As developing economies move from centralized economies to market economies enterprise and entrepreneurship become important ldquoThe emerging world long a source of cheap labor now rivals developed countries for business innovation Developing countries are becoming hotbeds of business innovation in much the same way as Japan did from the 1950s onwardsrdquo10 Entrepreneurship is considered an important mechanism that promotes economic development through employment innovation and welfare but it does not appear like manna from heaven as a country moves through the stages of development Rather it plays a role in all development stages and is a process that continues over many years Economists have come to recognize the ldquoinput-competingrdquo and ldquogap-fillingrdquo capacities of entrepreneurial activity in development11 In other words someone has to create the technology for new products and create the markets where people will buy them Two points are important when thinking about entrepreneurship and development First contrary to popular belief the most entrepreneurial countries in the world are not those that have the most entrepreneurs This notion is in fact misleading In fact the highest self-employment rates are in low-income countries such as Zambia and Nigeria This is because low-income economies lack the human capital and infrastructure needed to create high-quality jobs The result is that many people sell soft drinks and fruit on street corners but there are few innovative high-growth startups Nor do these street vendors represent business ownership as defined in many developed countries In entrepreneurship quality matters more than quantity To be entrepreneurial a country needs to have the best entrepreneurs not necessarily the most What the ldquobest and the brightestrdquo do is important and to support their efforts a country needs a well-functioning entrepreneurial ecosystem (watch the video)12 The path to development is to create efficient organizations able
to harness technology to increase output and improve the lives of millions Second entrepreneurship comes in productive unproductive and destructive forms While productive entrepreneurship makes both entrepreneurs and society better off unproductive and destructive entrepreneurship make entrepreneurs better off but leave society in worse condition The GEI strives to measure only productive entrepreneurship that both creates wealth and is scalable Entrepreneurial ecosystems support innovative productive and rapidly growing new ventures They consist of multiple interactive elements all of which need to be in sync in order for innovative and high-growth firms to prosper Such firms also need skilled employees They need access to technology They need a well-functioning infrastructure They need specialized advice and support They need access to finance They need business premises They need a supportive regulatory framework Country-level Productivity and the Entrepreneurial Ecosystem
Economic growth does not equal to productivity Economic growth basically refers to the capacity of countries to produce more goods and services irrespective of how higher production is achieved The positive variations in GDP or employment over time are the usual suspects among those interested in studying economic growth figures mostly because they represent the desired objective of most policy makers as a measure of economic prosperity Productivity is a more complex concept At the country level total factor productivity (TFP) deals with two highly interconnected economic aspects First TFP has to do with the capacity of countries to allocate and exploit available resources efficiently (P = productivity effect) The notion that markets are good at directing resources is a good catch-all explanation concept but for many businesses it is hard to find all that is required to perform in the market and to keep the pace of industrial and digital revolutions that not only equip businesses with newmdashoften more technologically advancedmdashresources but also change the ways to exploit them
26
The second component of TFP deal with the capacity of organizations to channel innovations to the economy (I = innovation effect) that consequently translate into higher levels of output per input unit (in the case of countries GDP per worker) Maybe we all are too used to link innovation to technological inventions that are successfully commercialized However our definition of innovation is not restricted to engineering (such as the driverless car) or to medical advances (such as nerve stimulation or non-invasive procedures) and is open to other equally valuable types of non-technological innovations related to product and processes Letrsquos start with the productivity effect (P) The efficient allocation of resources available in the economy is an important part of the productivity function The productivity effect is linked to how well new and existing businesses use different resources including labor capital equipment knowledge and technology-based inputs The capacity of Amazon to amalgamate technologies brought from other industries (for example ICTs drones) to increase the productivity of its operations (delivery Amazon Fresh or Amazon Prime Air) is a good example13 From the perspective of the entrepreneurship ecosystem better institutions backing entrepreneurial activities and an efficient interaction between individual actions and the institutional setting governing entrepreneurial decisions are key ingredients necessary to facilitate the creation of businesses with a greater capacity to generate jobs and help incumbent businesses to take advantage of better market conditions For example in many European countries entrepreneurs have strong incentives to invest in physical and human capital and to promote the exploitation of resources in an effort to improve the functioning of their businesses In this case the supportive institutional environment creates the conditions to promote operational improvements In other words entrepreneurial ventures have incentives to lsquodo things betterrsquo that is to improve their productivity To sum up a healthy entrepreneurial ecosystem contributes to national productivity by enhancing market efficiency levels and by promoting the efficient exploitation of resources through new and incumbent businesses14
The second effectmdashinnovation (I)mdashis strictly linked to the Schumpeterian approach to entrepreneurship (creative destruction)15 For Schumpeter entrepreneurs play a decisive role in the economy by creating and implementing radical innovations that are conducive to economic progress In this tradition entrepreneurship is critical to spark economic development by promoting innovations in our terminology lsquocreate new things or find new ways to do thingsrsquo Progress translates in the expansion of the countriesrsquo production possibilities that materializes in a shift of the global frontier But at this point is worth questioning how can radical innovations foster such progress Moreover how does the entrepreneurial ecosystem contribute to this progress It seems logical to argue that inventions are worthless is they do not turn into commercialized innovations and that the economic impact of such innovations will turn sterile if the market and individuals cannot fully incorporate these innovations in their day-to-day routines For Schumpeter entrepreneurs nurture the economy with innovations and the entrepreneurial ecosystem is critical for the development of this economic function lsquocreate new things or find new ways to do thingsrsquo If countries enjoy a healthy entrepreneurial ecosystem the efforts of innovative entrepreneurs will materialize in new value-adding combinations of resources that will expand the countriesrsquo productive capacity and the global production frontier We found a significant relatively strong positive correlation between entrepreneurship and total factor productivity (035) We also noted that entrepreneurship correlates weakly positively with the productivity effect (009) (Table 11) Table 1 The correlations between GEI total factor productivity and its components
Variables Correlation GEI vs total factor productivity 03513 GEI vs productivity effect 00930 GEI vs innovation effect 03882
The strongest positive correlation was found between entrepreneurship and the innovation effect (039) This result is not surprising if we think a little harder Just like we cannot imagine progress in the 19th century without the creation and development of steam engines it is hard to imagine entrepreneurship in the 21st century without the power of technology-driven inventions With
27
the new millennium industries and markets from all around the globe are witnessing drastic transformations that are the result of a digital revolution in which entrepreneurs are taking an active role by creating new businesses that are responsible of this revolution The result is a good sign that reinforces our argument that the creation of lsquonew things or new ways to do thingsrsquo definitely constitutes the vital force driving economic development Figure 2 plots the GEI score and the computed total factor productivity values The correlation between TFP
and GEI is 035 and the sign is positive (see Table 1) From the Figure 2 we verify that the quality of the entrepreneurial ecosystem (GEI scores) and TFP move in the same direction Countries with a low-quality entrepreneurial ecosystem tend to show negative TFP values below unity On contrary all developed economies with supportive entrepreneurial ecosystems improve their total factor productivity either by productivity or innovation effects
Figure 2 GEI and total factor productivity
Figures 13 and 14 plot the relationship between the GEI index and the productivity and innovation effects respectively There is a positive association between entrepreneurship and the productivity effect (correlation = 009) however this relationship is less pronounced than that found for the TFP This result may well be partly explained by the differentiating impact of entrepreneurship over the productivity effect across economies We observe that the correlation between
entrepreneurship and the productivity effect scores the highest among factor driven countries (047 in Table 43) Also from Figure 13 we note that in many underdeveloped and developing territories with low- and mid-level entrepreneurial ecosystem the productivity effect is positive while the result of the productivity effect for some developed economies is negative
10 20 30 40 50 60 70 80 90
GEI
094
096
098
1
102
104
106
108
TFP
Denmark
Canada
USA
UK
Singapore
Uganda
China
Ghana
IndiaPeru
Germany
NetherlandsFrance
Angola
Zambia
Malawi Guatemala
Hungary
Japan
Korea
Finland
Norway
Sweden
LithuaniaR-square = 01234
28
Thus our results suggest that in developing economies the entrepreneurial ecosystem plays a much more decisive role on TFP via productivity improvements that
is helping new and established businesses in developing economies to better exploit their limited resources that is lsquoto lsquodo things betterrsquo
Figure 3 GEI and the productivity effect
The picture is quite different when we look at the results for the innovation effect The data in Table 13 show how the correlation between entrepreneurship and the innovation effect progressively increases as we move from factor-driven (correlation = -041) to innovation-driven economies (correlation = 033) Similarly the impact of the innovation effect is much more potent in innovation-driven economies (155) than in efficiency-driven (117) and in factor-driven economies (-059) This trend is corroborated by the results in Figure 44 in which we observe a steeper relationship between the
GEI scores and the innovation effect In contrast to the stronger effect of the entrepreneurial ecosystem over productivity in developing countries we found that the positive influence of a healthy entrepreneurial ecosystem over the innovative capacity of new and established businesses is much more powerful in developed economies With the exception of Turkey the innovation effect linked to the efficient commercialization of innovations and new technologies is positive in all economies with high quality entrepreneurial ecosystems (GEIgt 50)
10 20 30 40 50 60 70 80 90
GEI
092
094
096
098
1
102
104
106
Prod
uctiv
ity e
ffect
Uganda
Malawi Guatemala
Ghana
Angola
Peru
China
Macedonia
Hungary
Japan
Korea
Finland
Norway
Netherlands
Germany
France
Singapore
Lithuania
UK
USA
Denmark
Sweden
India
Trinidad amp Tobago
Botswana R-square = 00486
Zambia
Canada
29
Figure 4 GEI and the innovation effect
Based on the relationships reported above the improvement of the entrepreneurial ecosystem (GEI scores) may well yield to improvements in total factor productivity via the enhanced capacity of businesses to use their available resources (productivity effect) and to exploit the market potential of new technologies and
innovations As a result if every of the 64 analyzed countries raised its GEI score by 10 the global total factor productivity will increase 022 TFP points which represents an estimated improvement of 158016
10 20 30 40 50 60 70 80 90
GEI
094
096
098
1
102
104
106
Inno
vatio
n ef
fect
R-square = 01507
Uganda
Malawi
Guatemala
Angola
India
China
Botswana
HungaryJapan
Korea
Lithuania
Finland
Singapore
UK
Sweden
Denmark
USA
Canada
Norway
Netherlands
Zambia Peru
Ghana
Germany
30
The Global Entrepreneurship Index In depth
The Global State of Entrepreneurship
The GEI measures both the quality of entrepreneurship in a country and the extent and depth of the supporting entrepreneurial ecosystem
The top ten countries for 2018 show a pattern similar to last yearrsquosmdashhigh-income mostly European nations The top countries are the United States Switzerland Canada
the United Kingdom Australia Denmark Iceland Ireland Sweden and France The major surprise this year is the movement of the UK from 8th place to 4th place and the movement of Sweden from 4th place to 9th place Because the scores in the highest range are so close small changes in score from one year to the next can produce a relatively large shift in ranks among the top ten For this reason we present confidence intervals for the top ten
Top Ten Countries
Table 2 Top Ten Countries in the GEI
Country GEI 2018 lower limit
GEI 2018 upper limit
GEI 2018 Rank 2018
GEI Rank 2017
United States 775 897 836 1 1
Switzerland 725 884 804 2 2
Canada 739 846 792 3 3
United Kingdom 736 819 778 4 8
Australia 690 820 755 5 7
Denmark 648 838 743 6 5
Iceland 636 847 742 7 6
Ireland 668 806 737 8 9
Sweden 671 791 731 9 4
France 599 771 685 10 13
Figure 5 Confidence Intervals for Top Ten Scores
The results show that the No 1 rank could have gone to any of the top ten nations with the exception of France We see that Switzerland has a confidence
interval similar to the United States
599671668
636648
690736739
725775
771791806
847838
820819
846884897
00 200 400 600 800 1000
FranceSwedenIrelandIceland
DenmarkAustralia
United KingdomCanada
SwitzerlandUnited States
31
Regional Performance
For many countries a regional benchmark is more relevant for identifying best practices for fostering entrepreneurship This year we have several important
changes in Europe Sub-Saharan Africa and the MENA countries Below we present the top performer in each region along with individual and institutional score summaries
Table 3 Top Scores by Region
World rank Country Region GDP per capita PPP Individual variables Institutional variables GEI
1 United States North America $52676 930 785 836
2 Switzerland Europe $54933 938 715 804
5 Australia Asia-Pacific $42149 822 743 755
16 Israel Middle East North Africa $31092 809 727 654
19 Chile South and Central America Caribbean $21302 689 759 585
52 Botswana Sub-Saharan Africa $15286 477 660 349
The United States leads the world in entrepreneurship and is first in the North American region just ahead of peer Canada Australia ranks first in the Asia-Pacific region ahead of economic powerhouses China Singapore Hong Kong and Japan Switzerland which ranked fourth in the European region and eighth overall last year now comes in first in Europe Chile ranks first in
South and Central America and the Caribbean (19th overall) 22 places ahead of the next highest scorer in the regionmdashPuerto Rico at 41st Israel is 16th overall and tops the MENA region just ahead of Qatar at 22nd In Sub-Saharan Africa Botswana is the leader at 52nd ranking ahead of nine European nations
Biggest Gains
Table 4 Biggest Gains in GEI Score
Country Score 2018 Score 2017 Difference in Score Difference in Rank
United Kingdom 778 712 65 4
Israel 654 594 60 1
Bulgaria 278 227 51 13
China 411 361 50 5
Iran 268 221 47 13
Italy 414 371 43 4
Poland 504 465 39 1
Canada 792 755 37 0
Ireland 737 702 35 1
Korea 542 507 35 3
Note The table above includes only those countries that have participated in the GEM survey and do not have estimated individual data
32
Biggest Declines
Table 5 Biggest Declines in GEI Score (among countries with decreases in GEI score)
Country Score 2018 Score 2017 Difference in Score Difference in Rank
Latvia 405 430 -25 -6
Sweden 731 752 -21 -5
Taiwan 595 610 -15 -2
Malaysia 327 334 -07 -4
Ecuador 205 209 -04 -5
Chile 585 589 -04 -1
Kazakhstan 297 300 -03 -2
Indonesia 210 211 -01 -4
Note The above table includes only those countries that have participated in the GEM survey and do not have estimated individual data
The 14 Pillars of an Entrepreneurial Ecosystem
The pillars of entrepreneurship in the ecosystem are many and complex While a widely accepted definition of entrepreneurship is lacking there is general agreement that the concept has numerous dimensions17 We take this into account in creating the entrepreneurship index Some businesses have a larger impact on markets create more new jobs and grow faster and become larger than others We also take into account the fact that entrepreneurship plays a different role at different stages of development18 Considering all of these possibilities and limitations we define entrepreneurship as ldquothe dynamic institutionally embedded interaction between entrepreneurial attitudes entrepreneurial abilities and entrepreneurial aspirations by individuals which drives the allocation of resources through the creation and operation of new venturesrdquo
The GEI is composed of three building blocks or sub-indicesmdashwhat we call the 3As entrepreneurial attitudes entrepreneurial abilities and entrepreneurial
aspirations Entrepreneurial attitudes are about how a country thinks about entrepreneurship In fact what does your mother think about it The second sub index
GLO
BAL
ENTR
EPRE
NEU
RSH
IP IN
DEX
Sub-indexes Pillars Variables (individual institutional)
ATTITUDES SUB-INDEX
OPPORTUNITY PERCEPTION
OPPORTUNITY RECOGNITION FREEDOM (ECONOMIC FREEDOM PROPERTY RIGHTS)
STARTUP SKILLS SKILL PERCEPTION EDUCATION (TERTIARY EDUCATIONQUALITY OF EDUCATION)
RISK ACCEPTANCE RISK PERCEPTION COUNTRY RISK
NETWORKING KNOW ENTREPRENEURS AGGLOMERATION (URBANIZATIONINFRASTUCTURE )
CULTURAL SUPPORT CAREER STATUS CORRUPTION
ABILITIES SUB-INDEX
OPPORTUNITY STARTUP OPPORTUNITY MOTIVATION GOVERNANCE (TAXATIONGOOD GOVERNANCE)
TECHNOLOGY ABSORPTION
TECHNOLOGY LEVEL TECHNOLOGY ABSORPTION
HUMAN CAPITAL EDUCATIONAL LEVEL LABOR MARKET (STAFF TRAININGLABOUR FREEDOM)
COMPETITION COMPETITORS COMPETETIVNESS (MARKET DOMINANCEREGULATION)
ASPIRATION SUB-INDEX
PRODUCT INNOVATION NEW PRODUCT TECH TRANSFER
PROCESS INNOVATION
NEW TECHLOLOGY SCIENCE (GERD(AVERAGEQUALITY OF SCIENTIFICAL INSTITUTIONS +AVAILABILITY OF SCIENTISTS AND ENGENEERS))
HIGH GROWTH GAZELLE FINANCE AND STRATEGY (VENTURE CAPITALBUSINESS SOPHISTICATION)
INTERNATIONALIZATION EXPORT ECONOMIC COMPLEXITY
RISK CAPITAL INFORMAL INVESTMENT DEPTH OF CAPITAL MARKET
Figure 6 The Structure of the Global Entrepreneurship Index
33
is about abilities Can you do it Do you have the skills The third sub index is about aspirations Do you want to build a billion-dollar company These three sub-indices stand on 14 pillars each of which contains an individual and an institutional variable that corresponds to the micro- and the macro-level aspects of entrepreneurship Unlike other indexes that incorporate only institutional or individual variables the pillars of the GEI include both These pillars are an attempt to capture the open-ended nature of entrepreneurship analyzing them can provide an in-depth view of the strengths and weaknesses of those listed in the Index We now describe the 14 pillars of entrepreneurship
Entrepreneurial Attitudes Pillars
Pillar 1 Opportunity Perception This pillar captures the potential ldquoopportunity perceptionrdquo of a population by considering the state of property rights and the regulatory burden that could limit the real exploitation of the recognized entrepreneurial opportunity Within this pillar is the individual variable Opportunity Recognition which measures the percentage of the population that can identify good opportunities to start a business in the area where they live However the value of these opportunities also depends on the size of the market The institutional variable Freedom and Property consists of two smaller variables economic freedom (Economic Freedom) and property rights (Property Rights) Business Freedom ndash one sub-index of the Index of Economic Freedom variable ndash is appropriate for capturing the overall burden of regulation as well as the governmentrsquos regulatory efficiency in influencing startups and operating businesses ldquoThe property rights element is an assessment of the ability of individuals to accumulate private property secured by clear laws that are fully enforced by the staterdquo or in other words enforced property rights guarantee that individuals have the right to harvest the fruits of successful opportunity exploitation and no one is confiscating or stealing their property or business19 Both institutional components are vital for individuals to become entrepreneurs and not employees of another business or the state 20
Pillar 2 Startup Skills Launching a successful venture requires the potential entrepreneur to have the necessary startup skills Skill Perception measures the percentage of the population who believe they have adequate startup skills Most people in developing countries think they have the skills needed to start a
business but their skills were usually acquired through workplace trial and error in relatively simple business activities In developed countries business formation operation management etc require skills that are acquired through formal education and training Hence education especially postsecondary education plays a vital role in teaching and developing entrepreneurial skills Today there are 150 million students enrolled in some kind of education beyond high school a 53 percent increase in less than a decade People all over the world see education as a pathway out of poverty 21
Pillar 3 Risk Acceptance Of the personal entrepreneurial traits fear of failure is one of the most important obstacles to a startup Aversion to high-risk enterprises can retard nascent entrepreneurship Risk Perception is defined as the percentage of the population who do not believe that fear of failure would prevent them from starting a business Country Risk reflects to transfer and convertibility risk of a country and believed to closely correlate to business 22
Pillar 4 Networking Networking combines an entrepreneurrsquos personal knowledge with their ability to connect to others in a country and the whole world This combination serves as a proxy for networking which is also an important ingredient of successful venture creation and entrepreneurship Entrepreneurs who have better networks are more successful can identify more viable opportunities and can access more and better resources We define the basic networking potential of a possible entrepreneur by the percentage of the population who personally know an entrepreneur who started a business within two years (Know Entrepreneurs) The connectivity variable has two components One that measures the urbanization (Urbanization) of the country and the other measuring the quality of the transport infrastructure (Infrastructure)23
Pillar 5 Cultural Support This pillar is a combined measure of how a countryrsquos inhabitants view entrepreneurs in terms of status and career choice and how the level of corruption in that country affects this view Without strong cultural support the best and brightest do not want to be responsible entrepreneurs and they decide to enter a traditional profession Career Status is the average percentage of the population age 18-64 who say that entrepreneurship is a good career choice and enjoys high status The associated
34
institutional variable measures the level of corruption High levels of corruption can undermine the high status and steady career paths of legitimate entrepreneurs24
Entrepreneurial Abilities Pillars
Pillar 6 Opportunity Startup This is a measure of startups by people who are motivated by opportunity but face red tape and tax payment An entrepreneurrsquos motivation for starting a business is an important signal of quality Opportunity entrepreneurs are believed to be better prepared to have superior skills and to earn more than what we call necessity entrepreneurs Opportunity Motivation is defined as the percentage of the Total Entrepreneurial Activity (TEA) businesses started to exploit a good opportunity to increase income or to fulfill personal aims in contrast to those started by people who have no other options for work The overall effectiveness of the government services is measured by the Good Governance variable and the cost of the governance is by the level of overall taxation (Taxation) The variable is a combination of these two components government service quality and costs25
Pillar 7 Technology Absorption In the modern knowledge economy information and communication technologies (ICT) play a crucial role in economic development Not all sectors provide the same chances for businesses to survive and or their potential for growth The Technology Level variable is a measure of the businesses that are in technology sectors The institutional variable Tech Absorption is a measure of a countryrsquos capacity for firm-level technology absorption as reported by the World Economic Forum The diffusion of new technology and the capability to absorb it is vital for innovative firms with high growth potential26
Pillar 8 Human Capital The prevalence of high-quality human capital is vitally important for ventures that are highly innovative and require an educated experienced and healthy workforce to continue to grow An important feature of a venture with high growth potential is the entrepreneurrsquos level of education The Educational Level variable captures the quality of entrepreneurs it is widely held that entrepreneurs with higher education degrees are more capable and willing to start and manage high-growth businesses The labor market possibilities and the capability to easily hire quality employees also have an impact on business development innovation and growth potential The
institutional variable Labor Market has two components Labor Freedom measures the freedom of the labor from the regulatory perspective and Staff Training is a countryrsquos level of investment in business training and employee development It can be expected that heavy investment in employees pays off and that training increases employee quality27
Pillar 9 Competition Competition is a measure of a businessrsquos product or market uniqueness combined with the market power of existing businesses and business groups and the effectiveness of anti-monopoly regulation The variable Competitors is defined as the percentage of TEA businesses that have only a few competitors offering the same product or service However market entry can be prevented or made more difficult if powerful business groups are dominating the market The extent of market dominance by a few business groups is measured by the variable Market Dominance a variable reported by the World Economic Forum The effectiveness of the regulatory bodies (Regulation) could also influence the level of competition in a country The Competition institutional variable is the combination of Regulation and Market Dominance28
Entrepreneurial Aspirations Pillars
Pillar 10 Product Innovation New products play a crucial role in the economy of all countries While countries were once the source of most new products today developing countries are producing products that are dramatically cheaper than their Western equivalents New Product is a measure of a countryrsquos potential to generate new products and to adopt or imitate existing products In order to quantify the potential for new product innovation an institutional variable related to technology and innovation transfer seems to be relevant Technology Transfer is a complex measure of whether a business environment allows the application of innovations for developing new products29
Pillar 11 Process Innovation Applying andor creating new technology is another important feature of businesses with high-growth potential New Tech is defined as the percentage of businesses whose principal underlying technology is less than five years old However most entrepreneurial businesses do not just apply new technology they create it The problem is similar to the New Product variable whereas many businesses in developing countries may apply the latest
35
technology they tend to buy or copy it An appropriate institutional variable applied here is complex measure combining research and development (RampD) the quality of scientific institutions in a country (Scientific Institutions) and the availability of scientists and engineers (Availability of Scientist) Gross Domestic Expenditure on Research and Development (GERD) is the RampD percentage of GDP as reported by OECD While RampD alone does not guarantee successful growth it is clear that without systematic research activity the development and the implementation of new technologiesmdashand therefore future growthmdashwill be inhibited The Science institutional variable combines together RampD potential with physical scientific infrastructure and science oriented human capital 30
Pillar 12 High Growth High Growth is a combined measure of the percentage of high-growth businesses that intend to employ at least 10 people and plan to grow more than 50 percent in five years (Gazelle variable) with business strategy sophistication (Business Strategy variable) and venture capital financing possibility (Venture Capital) It might be argued that a shortcoming of the Gazelle variable is that growth is not an actual but an expected rate However a measure of expected growth is in fact a more appropriate measure of aspiration than a measure of realized growth Business Strategy refers to ldquothe ability of companies to pursue distinctive strategies which involves differentiated positioning and innovative means of production and service deliveryrdquo High Growth combines high growth potential with a sophisticated strategy and growth specific venture capital finance31
Pillar 13 Internationalization Internationalization is believed to be a major determinant of growth A widely applied proxy for internationalization is exporting Exporting demands capabilities beyond those needed by businesses that produce only for domestic markets However the institutional dimension is also important a countryrsquos openness to international entrepreneursmdashthat is the potential for internationalizationmdashcan be estimated by its degree of complexityrdquo The complexity of an economy is related to the multiplicity of useful knowledge embedded in it Because individuals are limited in what they know the only way societies can expand their knowledge base is by facilitating the interaction of individuals in increasingly complex networks in order to make products We can measure economic complexity by the mix of these products that
countries are able to makerdquo The internationalization pillar is designed to capture the degree to which a countryrsquos entrepreneurs are internationalized as measured by the exporting potential of businesses controlling for the extent to which the country is able to produce complex products32
Pillar 14 Risk Capital The availability of risk finance particularly equity rather than debt is an essential precondition for fulfilling entrepreneurial aspirations that are beyond an individual entrepreneurrsquos personal financial resources33 Here we combine two kinds of finance the informal investment (Informal Investment) and the institutional depth of capital market (DCM) Informal Investment is defined as the percentage of informal investors in the population age 18-64 multiplied by the average size of individualsrsquo investment in other peoplersquos new businesses While the rate of informal investment is high in factor-driven economies the amount of informal investment is considerably larger in efficiency- and innovation-driven countries combining them balances these two effects Our institutional variable here is DCM one of the six sub-indices of the Venture Capital and Private Equity Index This variable is a complex measure of the size and liquidity of the stock market level of IPO MampA and debt and credit market activity which encompass seven aspects of a countryrsquos debt and capital market
The Global Entrepreneurship Index 2018 Rankings
In this section we report the rankings of the 137 countries on the Global Entrepreneurship Index and its three sub-indices We also provide confidence intervals for the GEIrsquos The confidence intervals calculations are based on the Global Entrepreneurship Monitor (GEM) Total Early-Phased Entrepreneurial Activity (TEA) confidence intervals Note that these confidence intervals only partially represent the potential measurement errors as we do not know the full error term In addition we do not have information about the confidence intervals of the 34 countries where we use estimated data In these cases the upper and the lower limits are the same
We present the rankings in terms of country development as measured by per capita GDP The overall ranking of the countries on the GEI is shown in Table 16 Like previous years Anglo-Saxon Nordic and Western European countries in the innovation-driven
36
stage of development are in the front ranks The United States Switzerland and Canada lead the rankings Three of the five Nordic countries Denmark Iceland and Sweden are in the top ten and effectively tied with the United States Hong Kong the highest Asian country is in 13th place and Taiwan is 18th Besides their high entrepreneurial performance these countries represent high income levels
Of the most populous EU countries only the United Kingdom and France place among the top 10 countries (4th and 10th) The other large European countries rank in the middle Germany is 15th Spain is 34th followed by Italy in 42nd place While the UK France and Germany are relatively well balanced over the 14 pillars
Poland Spain and Italy are entrepreneurially less efficient A likely explanation for the EU countriesrsquo relatively weak economic performance over the last decade is their low level of entrepreneurship the same applies to Japan which took 28th place Europe is still struggling to create new billion dollar companies
Factor-driven countries with low GDPs such as Pakistan Bangladesh Uganda and other poor African countries are at the bottom of the entrepreneurship ranking as expected At the same time these countriesrsquo entrepreneurial performance is the least unbalanced However some countriesmdashincluding two former socialist countries Serbia and Russia innovation-driven Italy and two South American countries Brazil and Trinidad and Tobagomdashshould have higher levels of entrepreneurship as implied by their development trend lines and more efficient use of entrepreneurial resources
37
Table 6 The Global Entrepreneurship Index Rank of All Countries 2018
Global rank Country Score
1 United States 836 2 Switzerland 804 3 Canada 792 4 United Kingdom 778 5 Australia 755 6 Denmark 743 7 Iceland 742 8 Ireland 737 9 Sweden 731
10 France 685 11 Netherlands 681 12 Finland 679 13 Hong Kong 673 14 Austria 660 15 Germany 659 16 Israel 654 17 Belgium 637 18 Taiwan 595 19 Chile 585 20 Luxembourg 582 21 Norway 566 22 Qatar 550 23 Estonia 548 24 Korea 542 25 Slovenia 538
26 United Arab Emirates 535
27 Singapore 527 28 Japan 515 29 Lithuania 511 30 Poland 504 31 Portugal 488 32 Cyprus 480 33 Oman 469 34 Spain 453 35 Bahrain 451 36 Slovakia 449 37 Turkey 445 38 Czech Republic 434 39 Kuwait 428 40 Tunisia 424 41 Puerto Rico 421 42 Italy 414 43 China 411 44 Latvia 405 45 Saudi Arabia 402 46 Romania 382 47 Colombia 382 48 Greece 371 49 Jordan 365 50 Hungary 364 51 Uruguay 350 52 Botswana 349 53 Brunei Darussalam 343
Global rank Country Score
54 Croatia 340 55 Barbados 336 56 Costa Rica 333 57 South Africa 329 58 Malaysia 327 59 Lebanon 315 60 Montenegro 312 61 Namibia 311 62 Azerbaijan 305 63 Belize 300 64 Kazakhstan 297 65 Morocco 292 66 Macedonia 291 67 Peru 284 68 India 284 69 Bulgaria 278 70 Panama 277 71 Thailand 274 72 Iran 268 73 Ukraine 268 74 Serbia 264 75 Mexico 264 76 Egypt 259 77 Georgia 258 78 Russia 252 79 Gabon 250 80 Algeria 247 81 Trinidad amp Tobago 244 82 Dominican Republic 243 83 Albania 242 84 Philippines 241 85 Argentina 240 86 Swaziland 238 87 Vietnam 232 88 Armenia 228 89 Jamaica 222 90 Sri Lanka 219 91 Rwanda 215 92 Moldova 212 93 Ghana 210 94 Indonesia 207
95 Bosnia and Herzegovina 207
96 Ecuador 205 97 Bolivia 204 98 Brazil 203 99 Tajikistan 200
100 Kyrgyz Republic 198 101 Nigeria 197 102 Zambia 196 103 Senegal 192 104 Libya 189 105 Cocircte drsquoIvoire 189 106 Paraguay 187
Global rank Country Score
107 Honduras 187 108 Guatemala 185 109 Kenya 184 110 Ethiopia 183 111 Suriname 181 112 Lao PDR 178 113 Cambodia 176 114 El Salvador 167 115 Tanzania 164 116 Guyana 164 117 Gambia The 161 118 Mali 159 119 Liberia 157 120 Pakistan 156 121 Cameroon 154 122 Nicaragua 147 123 Angola 144 124 Mozambique 140 125 Madagascar 140 126 Venezuela 138 127 Myanmar 136 128 Benin 133 129 Burkina Faso 132 130 Guinea 129 131 Uganda 129 132 Sierra Leone 123 133 Malawi 122 134 Bangladesh 118 135 Burundi 118 136 Mauritania 109 137 Chad 90
38
The Ranking of the 3As
By definition the GEI is a three-component index that takes into account the different aspects of the entrepreneurial ecosystem However all three components called sub-indices are in themselves complex measures that include various characteristics of entrepreneurial attitudes entrepreneurial abilities and entrepreneurial aspirations
Entrepreneurial attitudes are societiesrsquo attitudes toward entrepreneurship which we define as a populationrsquos general feelings about recognizing opportunities knowing entrepreneurs personally endowing entrepreneurs with high status accepting the risks associated with business startups and having the skills to launch a business successfully The benchmark individuals are those who can recognize valuable business opportunities and have the skills to exploit them who attach high status to entrepreneurs who can bear and handle startup risks who know other entrepreneurs personally (ie have a network or role models) and who can generate future entrepreneurial activities
Moreover these people can provide the cultural support financial resources and networking potential to those who are already entrepreneurs or want to start a business Entrepreneurial attitudes are important because they express the general feeling of the population toward entrepreneurs and entrepreneurship Countries need people who can recognize valuable business opportunities and who perceive that they have the required skills to exploit these opportunities Moreover if national attitudes toward entrepreneurship are positive it will generate cultural support financial support and networking benefits for those who want to start businesses
Entrepreneurial abilities refer to the entrepreneursrsquo characteristics and those of their businesses Different types of entrepreneurial abilities can be distinguished within the realm of new business efforts Creating businesses may vary by industry sector the legal form of organization and demographicsmdashage education etc We define entrepreneurial abilities as startups in the medium- or high-technology sectors that are initiated by educated entrepreneurs and launched because of a person being motivated by an opportunity in an environment that is not overly competitive In order to calculate the opportunity startup rate we use the GEM
TEA Opportunity Index TEA captures new startups not only as the creation of new ventures but also as startups within existing businesses such as a spinoff or other entrepreneurial effort Differences in the quality of startups are quantified by the entrepreneurrsquos education levelmdashthat is if they have a postsecondary educationmdashand the uniqueness of the product or service as measured by the level of competition Moreover it is generally maintained that opportunity motivation is a sign of better planning a more sophisticated strategy and higher growth expectations than ldquonecessityrdquo motivation in startups
Entrepreneurial aspiration reflects the quality aspects of startups and new businesses Some people just dislike their currently employment situation and want to be their own boss while others want to create the next Microsoft Entrepreneurial aspiration is defined as the early-stage entrepreneurrsquos effort to introduce new products andor services develop new production processes penetrate foreign markets substantially increase their companyrsquos staff and finance their business with formal andor informal venture capital Product and process innovation internationalization and high growth are considered the key characteristics of entrepreneurship Here we added a finance variable to capture the informal and formal venture capital potential that is vital for innovative startups and high-growth firms
Each of these three building blocks of entrepreneurship influences the other two For example entrepreneurial attitudes influence entrepreneurial abilities and entrepreneurial aspirations while entrepreneurial aspirations and abilities also influence entrepreneurial attitudes
Table 7 shows the ranking of the first 25 countries in the GEI and the rank of the sub-index The sub-index points and rankings for all 137 countries can be found in the Appendix The United States is first in the overall Index and also in one out of the three sub-indices Switzerland is 11th in attitudes first in aspirations and first in abilities as it is more interested in high-impact entrepreneurship than in replicative activities Chile represents a more unbalanced case ranking 19th in the overall Index slipping three places tenth in attitudes 27th in abilities and 30th in aspirations This is a huge challenge for Chile and many other Latin American economies Generally countries that rank at the bottom of the GEI also rank at the bottom of the three sub-
39
indices Israel ranks 16th in the overall Index but performs poorly in attitudes and abilities However it ranks 7th in Aspirations despite having poorer attitudes and abilities
For the ldquostartup nationrdquo it has an overall poor ranking in startup skills ndash at the bottom of the top 25 countries
Table 7 The Global Entrepreneurship Index and Sub-Index Ranks of the First 25 Countries 2018
Countries GEI GEI rank ATT ATT rank ABT ABT rank ASP ASP rank
United States 836 1 800 2 860 2 849 2
Switzerland 804 2 695 11 864 1 855 1
Canada 792 3 779 5 799 5 799 3
United Kingdom 778 4 736 7 833 4 763 4
Australia 755 5 792 3 760 8 712 8
Denmark 743 6 719 8 845 3 665 16
Iceland 742 7 823 1 699 9 703 9
Ireland 737 8 672 14 789 6 750 5
Sweden 731 9 711 9 787 7 695 13
France 685 10 614 17 697 10 744 6
Netherlands 681 11 774 6 653 14 617 22
Finland 679 12 790 4 629 16 618 21
Hong Kong 673 13 694 12 625 17 702 10
Austria 660 14 673 13 664 13 644 17
Germany 659 15 611 18 672 12 694 14
Israel 654 16 633 16 608 20 722 7
Belgium 637 17 538 23 678 11 695 12
Taiwan 595 18 540 22 548 24 696 11
Chile 585 19 703 10 509 27 543 30
Luxembourg 582 20 492 28 629 15 626 18
Norway 566 21 661 15 609 19 428 44
Qatar 550 22 484 29 545 25 622 19
Estonia 548 23 576 19 557 22 510 35
Korea 542 24 556 20 501 29 568 27
Slovenia 538 25 544 21 550 23 521 33
40
ENTREPRENEURIAL ATTITUDES
As stated earlier entrepreneurial attitude is defined as the general attitude of a countryrsquos population toward recognizing opportunities knowing entrepreneurs personally attaching high status to entrepreneurs accepting the risks associated with a business startup and having the skills to successfully launch businesses Entrepreneurial attitudes are important because they express the populationrsquos general feelings toward entrepreneurs and entrepreneurship
The benchmark individuals are those who can (1) recognize valuable business opportunities (2) have the necessary skills to exploit these opportunities (3) attach high status to and respect entrepreneurs (4) handle startup risk and (5) know entrepreneurs personally (ie have a network or role models) Moreover these people can provide the cultural support financial resources and networking potential to those who are already entrepreneurs or want to start a business
Table 8 Entrepreneurial Attitudes Sub-Index and Pillar Values for the First 25 Countries 2018
Countries Attitudes Sub-index
Opportunity Perception
Startup Skills Risk
Acceptance Networking
Cultural Support
Iceland 823 0947 1000 0917 1000 0633
United States 800 0864 1000 0969 0569 0816
Australia 792 0947 1000 0717 0698 0782
Finland 790 0954 0986 0782 0833 0885
Canada 779 0981 0795 0708 0626 0975
Netherlands 774 0898 0887 0877 0800 1000
United Kingdom 736 0810 0573 0876 0619 0928
Denmark 719 1000 0690 0748 0634 0918
Sweden 711 1000 0472 0704 0740 0896
Chile 703 0821 0903 1000 0709 0628
Switzerland 695 0776 0719 0879 0533 0673
Hong Kong 694 1000 0581 0610 1000 0680
Austria 673 0780 0953 0672 0552 0683
Ireland 672 0766 0966 0801 0390 0780
Norway 661 1000 0540 0999 0473 1000
Israel 633 0738 0598 0481 1000 0738
France 614 0502 0558 0751 0673 0641
Germany 611 0775 0627 0657 0380 0842
Estonia 576 0896 0800 0622 0493 0563
Korea 556 0457 0774 0905 0765 0272
Slovenia 544 0349 1000 0843 0331 0504
Taiwan 540 0517 0526 0587 0644 0580
Belgium 538 0679 0677 0559 0349 0568
Saudi Arabia 536 0611 0933 0436 1000 0477
Spain 513 0407 0807 0692 0640 0339 Pillar values are the normalized pillar scores and after the average pillar correction
Iceland leads in the Attitudes sub index followed by the United States Australia Finland Canada Netherlands United Kingdom Denmark Sweden and Chile Chilersquos tenth place is a very strong showing for a South American country Factor-driven African and Asian
countries including Swaziland Mali Sierra Leone Ethiopia Bangladesh Pakistan Malawi Chad and Burundi are at the bottom
41
ENTREPRENEURIAL ABILITIES
High entrepreneurial abilities are associated with startups in the medium- or high-technology sectors that are initiated by educated entrepreneurs and launched because of opportunity motivation in a not too
competitive environment Quality differences in startups are quantified by the motivation and education level of the entrepreneur and by the uniqueness of the product or service as measured by the level of competition
Table 9 Entrepreneurial Abilities Sub-Index and Pillar Values for the First 25 Countries 2018
Countries Abilities Sub-index
Opportunity Startup
Technology Absorption
Human Capital Competition
Switzerland 864 0966 1000 0789 1000
United States 860 0849 0814 1000 1000
Denmark 845 1000 1000 1000 0989
United Kingdom 833 0925 1000 0742 0848
Canada 799 0999 0779 0912 0676
Ireland 789 1000 0769 0851 1000
Sweden 787 0976 0946 0644 0869
Australia 760 0871 0780 0950 0567
Iceland 699 1000 1000 0506 0501
France 697 0683 0840 0625 0739
Belgium 678 0543 0852 0778 0850
Germany 672 0759 0863 0482 0848
Austria 664 0808 0941 0399 0761
Netherlands 653 0935 0835 0365 0786
Luxembourg 629 1000 0839 0551 0857
Finland 629 1000 0826 0495 0415
Hong Kong 625 0800 0643 0894 0381
Japan 611 0588 0902 0983 0594
Norway 609 1000 0752 0419 0671
Israel 608 0647 1000 0811 0317
Singapore 586 1000 0739 1000 0655
Estonia 557 0635 0773 0540 0606
Slovenia 550 0604 0744 0500 0485
Taiwan 548 0651 0705 0701 0317
Qatar 545 0754 0339 0882 0603 Pillar values are the normalized pillar scores and after the average pillar correction
Switzerland ranks number one on the Entrepreneurial Abilities sub-index The US ranks second and is relatively weak in Opportunity Startup and Technology Absorption Switzerland is stronger than the US in two pillars Opportunity Startups and Technology Absorption but very weak in Human Capital The United Kingdom ranks fourth with a significantly lower Entrepreneurial Abilities score than Denmark the United States and Switzerland Canada is strong in Opportunity Startup and Technology Absorption but low on Human Capital and Competition
The first five countries are followed by Ireland Sweden Australia Iceland and France
42
ENTREPRENEURIAL ASPIRATIONS
Entrepreneurial aspiration is the early-stage entrepreneurrsquos effort to introduce new products andor services develop new production processes penetrate foreign markets substantially increase the firmrsquos staff and finance a business with formal andor informal venture capital In other words the effort to start new companies that will generate wealth and can be scaled Product and process innovation internationalization and high growth are considered characteristics of
entrepreneurship The benchmark entrepreneurs are those whose businesses (1) produce and sell productsservices considered to be new to at least some customers (2) use a technology less than five years old (3) have sales in foreign markets (4) plan to employ at least ten people and (5) have greater than 50 percent growth over the next five years The Finance variable captures the informal venture capital potential as well as the development of capital venture capital and credit markets which is vital for innovative startups and high-growth firms
Table 10 Entrepreneurial Aspirations Sub-Index and Pillar Values for the First 25 Countries 2018
Countries Aspirations Sub-index
Product Innovation
Process Innovation
High Growth
Internationalization Risk
Capital Switzerland 855 0834 0902 0882 1000 1000 United States 849 0733 0902 1000 1000 0876 Canada 799 0991 0758 0559 0936 1000 United Kingdom 763 0924 0701 0850 0824 0649 Ireland 750 1000 0822 0884 0970 0568 France 744 0801 0941 0644 0764 0768 Israel 722 0997 1000 0851 0601 0788 Australia 712 0592 0786 0658 0633 1000 Iceland 703 0602 0838 0699 0952 0588 Hong Kong 702 0884 0409 1000 0679 1000 Taiwan 696 0972 0696 0895 0536 0935 Belgium 695 0913 0963 0551 0887 0627 Sweden 695 0666 0899 0557 0816 0721 Germany 694 0667 0840 0662 0874 0760 United Arab Emirates 681 1000 0626 0899 0901 0979 Denmark 665 0988 0723 0594 0390 1000 Austria 644 0724 0818 0403 0901 0630 Luxembourg 626 1000 0612 0545 1000 0902 Qatar 622 0856 0516 1000 0529 0956 Japan 621 0788 1000 1000 0606 0547 Finland 618 0617 0795 0675 0647 0497 Netherlands 617 0652 0769 0596 0562 0715 Singapore 616 0763 1000 1000 1000 0796 China 600 1000 0759 0871 0310 1000 Lithuania 592 0708 0502 0636 0736 0641
Pillar values are the normalized pillar scores after the average pillar correction
The Switzerland leads in the Entrepreneurial Aspirations sub-index While showing some weakness in Product Innovation and High Growth it is very strong in Internationalization and Risk Capital The United States is second with a strong showing in High Growth and Internationalization followed by Canada the United Kingdom Ireland France Israel Australia Iceland and Hong Kong which round out the top ten
43
Summaries and Conclusion Entrepreneurship is similar to other social creatures in that it is a multidimensional phenomenon whose exact meaning is difficult to identify There is only one thing more difficult how to measure this vaguely defined creature Over the decades researchers have created several entrepreneurship indicators but none has been able to reflect the complex nature of entrepreneurship
References 1 Acs Z and P Correa 2014 The World Bank and GEDI Identifying the Obstacles to High-Impact Entrepreneurship in Latin America and the Caribbean 2 Stam 2015 Stam and Spiegel 2015 Szerb L Acs Z J Ortega-Argileacutes R and Komlosi E 2014 Acs Autio and Szerb 2014a Autio et al 2014 Autio and Levie 2015 Autio et al 2012 3 Moore 1993 4 (Mathews and Brueggemann 2015 Chapter 14) 5 Acs Szerb and Autio National Systems of Entrepreneurship Measurement and Policy Research Policy (2014b479) 6 Stakeholder engagement is central for multi-polar policy-making and implementation Deep stakeholder engagement can tap knowledge within the ecosystem and uncover hidden interactions and cause-effect chains 7 While there is a small literature on entrepreneurship and economic growth our view is that high-impact firms cause economic growth because they shift the production function and replicative entrepreneurship is caused by economic growth and creates employment by replicating the existing production function 8 This trend is reflected in the continuing decline in the cost of computing the rise of open-source software the move to the lsquocloudrsquo and the emergence of huge datacenters where companies such as Amazon Google and Facebook are designing their own approaches 9 Autio and Levie 2015 10 Woolridge 2009 11 Leibenstein 1968 12 httpswwwyoutubecomwatchv=hjNc_BScn-s 13 The Wall Street Journal (2014) lsquoAmazon Reports Loss Despite Strong Sales Growthrsquo Available at httponlinewsjcomarticlesamazon-reports-another-loss-despite-strong-sales-growth-1406233529 14 Acs ZJ Autio E Szerb L (2014) National systems of entrepreneurship Measurement issues and policy implications Research Policy 43 (3) 476-494
and provide a plausible explanation of its role in development The Global Entrepreneurship Index is the first and presently the only complex measure of the national-level entrepreneurship ecosystem that reflects the multifaceted nature of entrepreneurship
15 Schumpeter JA (1934) The Theory of Economic Development An Inquiry into Profits Capital Credit Interest and the Business Cycle Cambridge MA Harvard University Press 16 We agree that correlation and basic regression coefficients are not enough to determine causation which is why we say that a 10 global increase in GEI could improve global productivity 022 points But it should be kept in mind that the said change in the GEI and the changes to institutions that it represents could add this amount to global productivity since the institutions that support entrepreneurship also support a variety of other economic and non-economic activities 17 Gartner (1990) Davidsson (2004) Wennekers and Thurik (1999)) and Godin Clemens and Veldhuis (2008) Zahra et al (2014) Gupta and Gupta (2015) all identify several dimensions of entrepreneurship 18 Baumol 1990 Vivarelly 2013 Thurik et al 2013 19Bjoslashrnskov amp Foss 2010 Goel et al 2015 20 Bhola Verheul Thurik amp Grilo 2006 Tumasjan amp Braun 2012 Autio et al (2014) 21 Papagiannidis amp Li 2005 Dutta amp Merenda 2011 Ibrahim amp Masrsquoud 2016 22 Caliendo Fossen amp Kritikos 2009 Vieider et al 2015 23 Shane amp Cable 2003 Mian and Hattab 2013 Audretsch et al 2015 24 Guiso Sapienza amp Zingales 2006 Lee et al 2011 Dutta amp Sobel 2016 25 Da Rin et al 2011 Asoni amp Sanandaji 2014 Belitski et al 2016 26 Coad amp Rao 2008 Garciacutea-Morales et al 2014 27 Bates 1990 Qian 2016 28 Baumol Litan amp Schramm 2007 Calcagno amp Sobel 2014 29 Autio et al 2014 Grimpe amp Hussinger 2013 Audretsch et al 2014b 30 Stam amp Wennberg 2009 Audretsch et al 2014a Garud et al 2014 31 Acs Parsons amp Tracy 2008 Gompers amp Lerner 2004 Croce et al 2013 Wright amp Stigliani 2013 32 De Clercq Sapienza amp Crijns 2005 McDougall-Covin et al 2014 33 Groh Liechtenstein amp Lieser 2012 Lee et al 2015
How to read these pages
0 10 20 30 40 50 60 70
1 Opportunity Perception2 Startup Skills3 Risk Acceptance4 Networking5 Cultural Support6 Opportunity Startup7 Technology Absorption8 Human Capital9 Competition10 Product Innovation11 Process Innovation12 High Growth13 Internationalization14 Risk Capital
2468
2228
1643
3022
3116
3323
18
6
Component scores
Individual score entrepreneurial qualities of the people in the ecosystem
24
0 100Scores
Institutional scorequality of the institutionsthat supportentrepreneurship
3857
Albania
m
Overall GEI score
Global Rank83 of 137
n
Strongest area Weakest areaStartup Skills Risk Acceptance
Country name What rank is this country out of the 137 countries in the 2018 GEI Lower ranks indicate beerperformance
Which of the 14 ecosystem components does this country do the best at
Which of the 14 ecosystem components should the country focus on first to improve the fastest
How does the country score on each of the 14 entrepreneurshipecosystem components Longer bars represent higher scores All scores are shown as percentages
What is the countryrsquos overall GEI score Higher scores are beer and are shown in more intense green All scores are shown as percentages
How does the country score on the half of GEI indicators that represent individuals Higher scores are beer and are shown in more intense green All scores are shown as percentages
How does the country score on the half of GEI indicators that represent instuons
What do the shades of green represent More intense green indicates beer scores
What does each component measure
1 Opportunity Percepon - Can the populaon idenfy opportunies to start a business and does the instuonal environment make it possible to act on those opportunies2 Startup Skills - Does the populaon have the skills necessary to start a business based on their own percepons and the availability of terary educaon3 Risk Acceptance - Are individuals willing to take the risk of starng a business Is the environment relavely low risk or do unstable instuons add addional risk to starng a business4 Networking - Do entrepreneurs know each other and how geographically concentrated are their networks5 Cultural Support - How does the country view entrepreneurship Is it easy to choose entrepreneurship or does corrupon make entrepreneurship difficult relave to other career paths6 Opportunity Percepon - Are entrepreneurs movated by opportunity rather than necessity and does governance make the choice to be an entrepreneur easy7 Technology Absorpon - Is the technology sector large and can businesses rapidly absorb new technology8 Human Capital - Are entrepreneurs highly educated well trained in business and able to move freely in the labor market9 Compeon - Are entrepreneurs creang unique products and services and able to enter the market with them10 Product Innovaon - Is the country able to develop new products and integrate new technology11 Process Innovaon - Do businesses use new technology and are they able access high quality human capital in STEM fields12 High Growth - Do businesses intend to grow and have the strategic capacity to achieve this growth13 Internaonalizaon - Do entrepreneurs want to enter global markets and is the economy complex enough to produce ideas that are valuable globally14 Risk Capital - Is capital available from both individual and instuonal investors
- About The Global Entrepreneurship and Development Institute
- Forward A Compass for Strengthening Entrepreneurship Ecosystems
- The table below shows the rank of each country in the 2018 Index
- The Asia-Pacific region shows greatest strength in Human Capital and Product Innovation ndash on average countries in the Asia-Pacific region have highly educated populations that are well trained in business and able to move freely in the labor market
- The regionrsquos lowest scores on average are in the area of Risk Acceptance If countries in the region improve their overall risk profile as well as the populationsrsquo attitudes towards taking risks it is likely that the entrepreneurship ecosystems in th
- Tech giants dominate the regionrsquos top ranks while lower income agriculture and manufacturing-dependent economies are found closer to the bottom Emerging hotspots for the digital economy are found near the middle of regional ranks China and South K
-
- The pillars of entrepreneurship in the ecosystem are many and complex While a widely accepted definition of entrepreneurship is lacking there is general agreement that the concept has numerous dimensions17F We take this into account in creating th
-
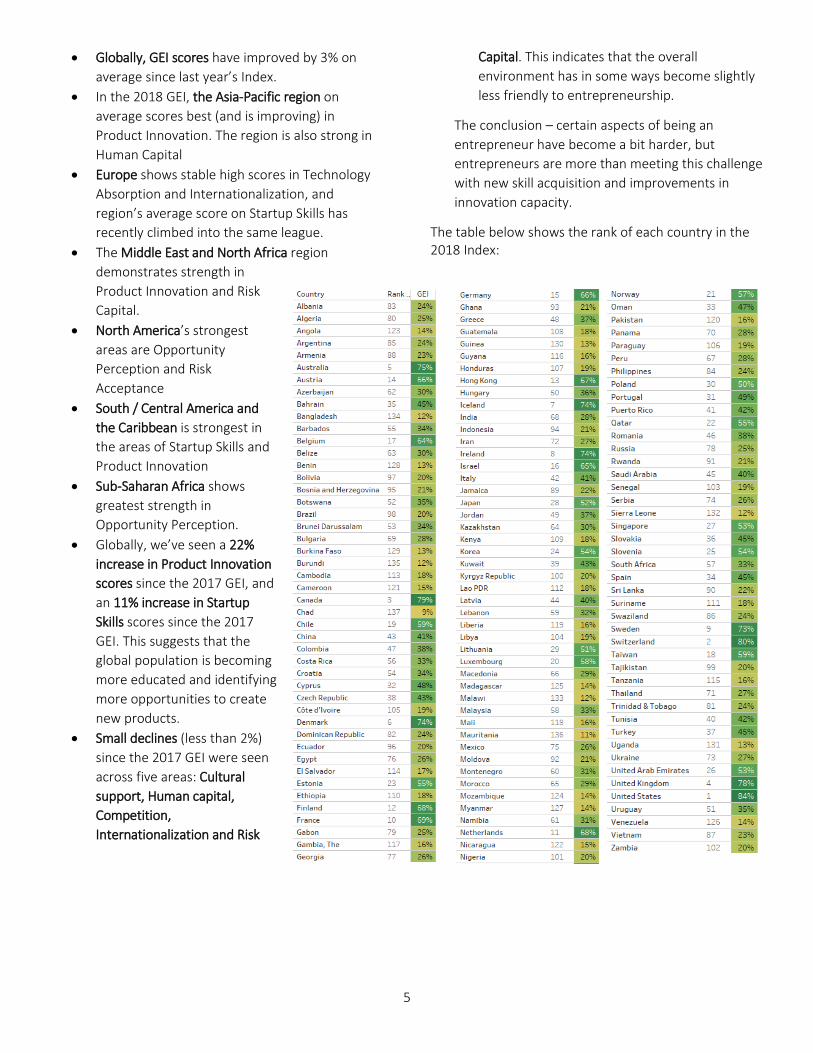

6
7
Regional results Asia ndash Pacific
The Asia-Pacific region shows greatest strength in Human Capital and Product Innovation ndash on average countries in the Asia-Pacific region have highly educated populations that are well trained in business and able to move freely in the labor market They are also producing products that are new to customers and integrating new technology The regionrsquos lowest scores on average are in the area of Risk Acceptance If countries in the region improve their overall risk profile as well as the populationsrsquo attitudes
towards taking risks it is likely that the entrepreneurship ecosystems in the Asia-Pacific region will gain ground Tech giants dominate the regionrsquos top ranks while lower income agriculture and manufacturing-dependent economies are found closer to the bottom Emerging hotspots for the digital economy are found near the middle of regional ranks China and South Korea saw the largest gains in the region on overall GEI score since the 2017 GEI
8
Regional results Europe
European nations post high average scores on Startup Skills owing to a legacy of broadly available tertiary education and a populace that largely posesses the skills necessary to start a business The regionrsquos biggest weakness is in Networking though it still scores above the global average in this area Overall Europersquos scores are relatively balanced across all components of the GEI suggesting that a broader mix of policy is likely to have a larger impact on overall performance than focusing on single policy area might
Northern European nations are found in the regionrsquos top ranks while Eastern European nations are found at the bottom Seven of the GEIrsquos top ten countries are in the European region The United Kingdom Bulgaria Italy Poland and Ireland all improved their overall GEI scores by at least 35 points over their 2017 GEI scores placing them among the top ten biggest gains in score globally
9
Regional results Middle East and North Africa
The MENA region shows greatest strength in the areas of Product Innovation and Risk Capital The region is bringing new products to market and integrating new technology while also providing the capital to help businesses grow The regionrsquos lowest average scores are in the areas of Competition and Risk Acceptance as large firms dominate many economies in the region and businesses face higher risks in many MENA countries than in other areas
Open economies that have embraced global trade and created attractive investment climates score near the top of the region while countries that have seen economic and political instability rank nearer the bottom
Both Israel and Iran saw overall score improvements of more than four points over the previous GEI and are among the top ten biggest gains in score globally for the 2018 GEI
10
Regional results North America
The US and Canada drive most high average regional scores for North America while Mexico contributes top scores in the area of Networking The regionrsquos overall greatest strengths are in Opportunity Perception and Product Innovation ndash the regionrsquos population is able to spot and act on good opportunities for starting a business and is able to bring new products to market and integrate new technology The region struggles most
in the area of High Growth ndash an indication that entrepreneurs in North America are not as motivated to grow and scale their businesses as their other component scores would suggest
Canada ranks among the top ten biggest score improvements in the 2018 GEI
11
Regional results SouthCentral America and the Caribbean
The SouthCentral America and the Caribbean region scores highest on average on Startup Skills and Product Innovation Entrepreneurs benefit from broadly available tertiary education and a high levels of business skill They are also creating products that are new to markets and integrating new technology into their businesses
Unlike regions with more balanced performance this region has an opportunity to create significant improvements by focusing on a small number of key bottlenecks Process Innovation and Risk Capital
Similar to previous years Chile far outperforms the rest of the region with a score forty percent higher than the regionrsquos second highest score
12
Regional results Sub-Saharan Africa
Sub-Saharan Africarsquos greatest strength is in the area of Opportunity Perception Entrepreneurs in the region are able to spot opportunities around them for starting businesses The regionrsquos lowest average scores are in the areas of Startup Skills Risk Acceptance and Risk Capital Tertiary education is not as broadly accessible as in other regions and entreprenuerial skills are less common The general risk climate is not as favorable in the region as in other areas and the capital availability lags behind other regions
There is significant opportunity for improvement however as Sub-Saharan Africa can look to the examples of regional leaders Botswana and South Africa Both countries demonstrate the possiblity for great change and substantial improvement on relatively short time scales Further the region has a few clear bottlenecks which if addressed could quickly yield overall improvements in entrepreneurial ecosystems and the economy as a whole
13
What can I do to improve the entrepreneurship ecosystem
The Global Entrepreneurship Index covers 14 areas (what we call pillars) of the entrepreneurship ecosystem Each country has one (or several) critical areas that are holding back the ecosystem and different actions can be taken to generate improvements in each of these areas With the help of three experts ndash Professor Richard Saouma Venture Capitalist Ken Krull and Researcher Ainsley Lloyd - wersquove generated the following (non-exhaustive) list of example actions that one might take to impact each of the 14 areas measured by the GEI We donrsquot endorse all of these actions for all contexts but instead hope that this list helps start the conversation around improving the bottleneck issues in your entrepreneurship ecosystem
Area of the entrepreneurship ecosystem
What does it measure What can I do if Irsquom a(n)hellip
Entrepreneur Large company Policymaker
OPPORTUNITY PERCEPTION
Can the population identify opportunities to start a business and does the institutional environment make it possible to act on those opportunities
bull Expose yourself to new experiences to boost creative thinking bull Start a side hustle to test a business concept
bull Market and promote partnerships with entrepreneurial firms bull Create an intrepreneurship culture bull Create a policy of paid side project time (like Google) bull Bring attention to the entrepreneurial qualities of employees and how the firm empowers them to create value bull Show how the firm has partnered with entrepreneurs to help them launch a businesses
bull Lower tax rates bull Promote entrepreneurial successes within economic development initiatives bull Advertise the success of local entrepreneurs who played by the book
STARTUP SKILLS Does the population have the skills necessary to start a business based on their own perceptions and the availability of tertiary education
bull Ask entrepreneurs around you how they have developed the skills that have helped them be successful bull Participate in continuing education bull Learn a new skill bull Take an online course
bull Reimburse or match for continuing education bull Incorporate educational childcare and after school care programs for working parents bull Sponsor skill building with local associations bull Emphasize the importance of entrepreneurship skills in collegiate recruitment programs at the pre-internship stage
bull Expand access to tertiary education to a broader portion of the population bull Offer tax credits for educational expenses bull Implement tax exempt educational savings plans bull Create a policy to reduce the child workforce bull Make high school business education mandatory including the identification and capture of value bull Fund regional initiatives to encourage student entrepreneurship and make sure to prioritize under-funded initiatives bull Offer funding with no strings attached to the student entrepreneur who gets the most traction on the least amount of resources
14
Area of the entrepreneurship ecosystem
What does it measure What can I do if Irsquom a(n)hellip
Entrepreneur Large company Policymaker
RISK ACCEPTANCE Are individuals willing to take the risk of starting a business Is the environment relatively low risk or do unstable institutions add additional risk to starting a business
bull Run the smallest possible test you can run to validate your idea bull Predefine successful outcomes bull Recruit critical advisors willing to kill concepts that dont fit bull Realize that not all ideas can be implemented today or have a valid skillset match for the entrepreneur bull Identify external dependencies on your ideas success
bull Create an ok to fail culture bull Reward appropriate risk taking behavior bull Help employees plan their efforts and log outcomes The documentation process will help them realize that they take risk every day and while they remember the failures there are myriad daily wins
bull Improve institutional and regulatory stability and ensure absence of conflict bull Create simple and consistent personal and corporate bankruptcy processes bull Change the communication around social safety nets to highlight the fact that they are a great resource for potential entrepreneurs because they mitigate damages for those who fail
NETWORKING Do entrepreneurs know each other and how geographically concentrated are their networks
bull Find places where other entrepreneurs gather and engage (eg Kauffman Foundations one million cups) bull Join a forum club association or other group related to your concept
bull Sponsor formal networking functions as corporate recruiting bull Encourage mentorship bull Build formal intern and apprenticeship programs bull Host social events with entrepreneurs where entrepreneurs can learn what are the real pain points faced by companies how they can add value andor what fish are too small for the large firm to fry
bull Improve ICT access and infrastructure bull Promote vertical associations networking activities bull Sponsor an entrepreneurship week every two months Showcase the work of startups in your area and invite the public bull Create incubation space in economically depressed areas - empty cargo containers a room with 4 walls - that is available to would be entrepreneurs open 247
CULTURAL SUPPORT How does the country view entrepreneurship Is it easy to choose entrepreneurship or does corruption make entrepreneurship difficult relative to other career paths
bull Encourage and support entrepreneurs around you bull Create a blog or other appropriate social media around the developing of your entrepreneurial concept
bull Market intrepreneurship as formal company PR bull Sponsor recognition programs promoting entrepreneurship like Entrepreneur of the Year programs bull Ensure that HR highlights the importance of entrepreneurial spirit to the entire pipeline of potential future employees starting in high schools
bull Reduce and prevent corruption bull Track formal statistics on entrepreneurship and its effect on GDP and other institutional metrics bull Make it easy for firms to plug into communities to announce their values (entrepreneurship) in eg high schools by structuring formal slots or entrepreneurship days with the school system
OPPORTUNITY STARTUP
Are entrepreneurs motivated by opportunity rather than necessity and does governance make the choice to be an entrepreneur easy
bull Mentor or contribute to best practices in interacting with government and administrative overhead
bull Allow spinouts of corporate developed ideas that the company cant pursue
bull Reduce the administrative burden of paying taxes and improve the capacity of the government to create and implement sound policies bull Lower the administrative overhead of incorporating and managing a business
15
Area of the entrepreneurship ecosystem
What does it measure What can I do if Irsquom a(n)hellip
Entrepreneur Large company Policymaker
TECHNOLOGY ABSORPTION
Is the technology sector large and can businesses rapidly absorb new technology
bull Keep abreast of current technology and trends bull Invest in technology that furthers your business
bull Educate employees in current technology and trends bull Invest in technology partnerships that businesses align bull Sponsor after school programming or similar STEM resources
bull Sponsor leading technologist at ecosystem events bull Promote local technologies and technologists bull Provide tax breaks for preferred industries Sponsor STEM school programs
HUMAN CAPITAL Are entrepreneurs highly educated well trained in business and able to move freely in the labor market
bull Invest in formal and informal continuing education
bull Reimburse or match for continuing education bull Incorporate educational childcare and after school care programs for working parents bull Sponsor skill building with local associations
bull Foster a flexible labor market in which businesses can easily hire employees bull Sponsor students who leave home to pursue a better education and tie the debt forgiveness to them returning just like firms do with pre-MBA hires bull Sponsor free access to online learning platforms bull Provide tax breaks for education costs incurred by firms
COMPETITION Are entrepreneurs creating unique products and services and able to enter the market with them
bull Identify opportunities within your market that are underserved or unique
bull Break up monopolies and police anticompetitive practices
PRODUCT INNOVATION
Is the country able to develop new products and integrate new technology
bull Create products and services that are new to the market
bull Invest in RampD bull Foster collaboration in research between universities and industry and the protection of intellectual property
PROCESS INNOVATION
Do businesses use new technology and are they able access high quality human capital in STEM fields
bull Adopt new technology that improves your businessrsquo functioning
bull Improve the quality of scientific institutions and the availability of scientists and engineers
HIGH GROWTH Do businesses intend to grow and have the strategic capacity to achieve this growth
bull Set ambitious goals for hiring and profits
bull Reduce the barriers to obtaining equity financing
INTERNATIONAL-IZATION
Do entrepreneurs want to enter global markets and is the economy complex enough to produce ideas that are valuable globally
bull Identify opportunities to export your productsservices to new markets
bull Facilitate the interaction of individuals in increasingly complex networks in order to make products
RISK CAPITAL Is capital available from both individual and institutional investors
bull Support other entrepreneurs with seed funding
bull Support entrepreneurs in corporate philanthropy impact and social responsibility initiatives
bull Reduce the barriers to providing venture capital and private equity financing
16
Frequently Asked Questions
Why do you use both individual data and institutional data
It takes both highly motivated individuals and a supporting institutional environment for entrepreneurship to flourish Without measuring both we donrsquot get an accurate representation of the ecosystem
Why donrsquot the individual and institutional scores add up to the final GEI score
These two ecosystem components donrsquot exist independently of each other ndash rather they influence each other For this reason our methodology is closer to a multiplication than an addition of the two components Further the fourteen pillars we capture influence each other too which accounts for the additional difference
How can I get my country into the GEI
We depend on several sources of data that are consistent across countries If your country is missing from the GEI itrsquos because we lack data in one of our major index data sources The best way to remedy this is to work directly with these data collection entities to produce the necessary data for your country
Can I supply the missing data myself
In order to maintain the comparability of our dataset across countries we have to use a single source of data for each indicator Because methodology can differ when different parties collect the same data we canrsquot accept data substitutions from other sources
Do you use estimated data Why
Wersquove always felt that it is important to use our expertise to help where we can and sometimes this means estimating data so that at least a blurry picture of a country can be seen rather than none at all
In order to include a larger number of countries in our GEI analysis we estimate the individual-level variables for missing countries by using similar peers Based on our experience when a country eventually produces actual individual level data the results tend to be very similar to our estimates Certainly there are inconsistencies but
we donrsquot believe in making the perfect the enemy of the good we believe that so long as one is transparent about missing data imputation the value of the resulting analyses is worth the imperfection For detailed information on which countries wersquove estimated see the 2018 GEI Technical Annex available at wwwthegediorg
Further missing data imputation is common practice within and outside of index building across globally recognized institutions the World Economic Forumrsquos Global Gender Gap Report the World Health Organizationrsquos Global Burden of Disease the Yale Environmental Performance Index and Transparency Internationalrsquos Corruption Perceptions Index all impute some data for some countries and disclose these imputations like we do
What ecosystem pillarcomponent should we work on improving first
Focusing on improving the weakest pillar first will produce the greatest gains Think of it like baking a cake where each pillar is one of the ingredients If you donrsquot have enough eggs adding more flour wonrsquot help you bake a better cake You need to add more eggs before you start to see an improvement
I disagree with the results ndash what I see in my country is different than the picture you paint
We produce the Global Entrepreneurship Index as a starting point for discussion around improving entrepreneurial ecosystems We use the best data available that covers the most countries possible in order to produce a globally comparable picture of where different countries stand The GEI isnrsquot a solution in itself itrsquos a road map that points you towards the strengths and weaknesses of your country so that your efforts can be focused on digging deeper into these issues Wersquore happy to have these discussions and even happier to facilitate them Additional information on our ecosystem improvement facilitation is available on our website wwwthegediorg
17
The Entrepreneurial Ecosystem Introduction
When the unemployment rate in the United States was 10 percent during the great recession it was considered a catastrophe However the unemployment rate in most MENA countries is close to 30 percent and even higher in some other countries This is a disaster for many parts of the world It leads to desperation and violence as millions of youth struggle to survive The world needs to create a billion jobs in the very near future to create global peace and prosperity Entrepreneurship creates jobs and generates economic growth - the underpinning of a stable and civil society But before we get into how this works we need to discuss what kind of entrepreneurship we are talking about Who is an entrepreneur We are not talking about the basket weaver solo entrepreneur we are not talking about rural microcredit We are talking about Silicon Valley Bill Gates Sam Walton FedEx and Starbucks What is Entrepreneurship
An entrepreneur is a person with the vision to see an innovation and the ability to bring it to market Most small business owners on main-street in the United States or in the markets of most cities around the world are not entrepreneurs according to this definition If you walk down the streets of Seventh Avenue in New York City you will see street vendors selling the fare of every country in the world nail shops and small grocery stores Few of these establishments are entrepreneurial by our definition because there is nothing new about them Most of these people are traders or shop owners performing a sort of small business management Now these people are important donrsquot get us wrong they create jobs and income for their families But we want to make a distinction here between the small business owner who replicates what others are doing and an entrepreneur who innovates The Global Entrepreneurship Monitor refers to most of the former category of people as necessity entrepreneurs They have no other option in the labor market for making money That is why the TEA (total early-stage entrepreneurial activity) is negatively correlated with economic growth economic freedom and global competitiveness The greater TEA the worse
your economy is - Uganda has the highest TEA rate in the world but few would argue that Uganda is more entrepreneurial than the United States The TEA therefore does not measure entrepreneurship quality but rather entrepreneurship quantity and in so doing captures primarily self-employment We are concerned with entrepreneurship quality the opportunity driven entrepreneur who generates commercial success Our definition of entrepreneurship is about high growth scalability and serious job creation This point is not new It has been made by Daniel Eisenberg Peter Drucker William Baumol and Schumpeter more than a century ago Entrepreneurship is about job creation and growth through innovation Good policy can only be generated through focusing the discussion on innovative growth-oriented entrepreneurship not the self-employment captured by GEMrsquos TEA rate Our definition of entrepreneurship is driven not by necessity entrepreneurship but by opportunity Opportunity entrepreneurship is positively correlated with economic growth Entrepreneurs envision scalable high-growth businesses They also possess the ability to make those visions a reality They get things done They go over under and around obstacles This is borne out in the relationship observed between regulation and these two categories of entrepreneurs regulation holds back replicative entrepreneurs but does not have the same impact on opportunity entrepreneurs Entrepreneurs are the bridge between invention and commercialization Invention without entrepreneurship stays in the university lab or the RampD facility Entrepreneurs like Steve Jobs and Bill Gates commercialize other peoplersquos inventions This vision of entrepreneurship actually delivers a product to customers While we have drawn a rather narrow definition of the entrepreneur someone who innovates and gets things done it is actually very broad Entrepreneurs are everywhere in every society in rich and poor neighborhoods they are Christians Muslims and Jews male and female gay and straight They are people of color Entrepreneurs can be high tech or low tech or even no tech All over the world entrepreneurs work in all sorts of conditions against great odds - in the slums of Kibera Bombay and Jakarta They find ways to innovate and bring products to market Just because entrepreneurs donrsquot have access to finance intellectual property protection or a trained staff does not mean that entrepreneurs do not exist and cannot succeed For
18
Example Beleza Natural which started with a single salon in 1993 in San Paulo Brazil currently operates 29 salons and a cosmetics research lab produces a full line of hair-care products and employs 1400 people In 2012 the companyrsquos revenue was more than $30 million Beleza Natural is interesting because it focused its activities on the demand of an overlooked group in this case low-income women at the bottom of the pyramid By offering ldquoaffordable luxuriesrdquo in the form of hair treatment and the salon experience Beleza Natural was tapping into the so-called ldquolipstick economyrdquo However as is the case for other successful female entrepreneurs Beleza Natural aspired to provide greater benefits to its clients and employees The companys business objectives extend to broader social and environmental benefits1 A second aspect of our definition of entrepreneurship regards the level of technology In the West innovation is used synonymously with technology The heroes in the West are Zuckerberg Jobs and other Silicon Valley stalwarts Our definition is open to non tech innovators like Oprah and Bowker Starbucks serves a centuries old drink coffee but it introduced a coffee shop experience that is now in every corner of the world When you go into Starbucks and there is a long line it disappears in just a few minutes That is process innovation and very much an example of a non tech entrepreneur McDonalds did the same for the hamburger Enterprise Rent a Car did it for car rentals and today employs thousands of people worldwide Uber did it for taxicabs They did not invent taxis They have been around forever They invented a new process What low tech entrepreneurship does is increase efficiency how quickly you can serve a cup of coffee Entrepreneurial Ecosystem Elements
Ever since the time of Schumpeter the concepts of entrepreneurship and innovation have been intertwined with economic development The Global Entrepreneurship Index is an important tool to help countries accurately assess and evaluate their ecosystem to create more jobs The entrepreneurial ecosystem is a new way to contextualize the increasingly complex and interdependent social systems being created2 While the academic literature kept agency institutions and systems in separate silos the real communities that practitioners worked in had no such silos and the different building blocks all built upon each other in a
single unified structure Business books such as Brad Feldrsquos Start-up communities Building an entrepreneurial ecosystem in your city Daniel Isenbergrsquos Harvard Business Review article What an entrepreneurship ecosystem actually is and Steven Koltai Peace through Entrepreneurship Investing in a Start-up Culture for Security and Development started to suggest that reality was nuanced In order to better understand entrepreneurial ecosystems letrsquos start with a few definitions3 A system is an organized set of interacting and interdependent subsystems that function together as a whole to achieve a purpose In general an ecosystem is a purposeful collaborating network of dynamic interacting systems and subsystems that have an ever-changing set of dependencies within a given context4 First an ecosystem as opposed to a system has both living and non-living components Otherwise itrsquos a system like national systems of innovation In addition there are outcomes of the ecosystem that the literature calls ecosystem services and there is ecosystem management The point of this line of research is that it is not just the abundance or endowment of particular key factors of production or resources that shape economic performance it is also the manner in which that economic activity is configured or organized within geographic space The most carefully worked out approach to entrepreneurial ecosystems is associated with Acs Szerb and Autio This line of research recognizes that it is not just the abundance or endowment of particular key factors of production or resources that shape economic performance it is also the manner in which that economic activity is configured or organized within geographic space and the role of entrepreneurship in bringing it to life While the entrepreneurial ecosystem literature does not challenge the efficacy of these other dimensions of spatial organization and structure such as clusters specialization diversity market power or localized competition it suggests that entrepreneurship is also a key dimension enhancing economic performance Entrepreneurial ecosystems are composed of sub-systems (pillars) that are aggregated into systems (sub- indices) that can be optimized for system performance at the ecosystem level There is a growing recognition in the entrepreneurship literature that entrepreneurship
19
theory focused only on the entrepreneur may be too narrow The concept of systems of entrepreneurship is based on three important premises that provide an appropriate platform for analyzing entrepreneurial ecosystems First entrepreneurship is fundamentally an action undertaken and driven by agents on the basis of incentives Second the individual action is affected by an institutional framework conditions Third entrepreneurship ecosystems are complex multifaceted structures in which many elements interact to produce systems performance thus the index method needs to allow the constituent elements to interact However because the elements are different in each case there is no one size fits all solution Each one is bespoke The Global Entrepreneurship Ecosystem
We define entrepreneurial ecosystems at the socio-economic level having properties of self-organization scalability and sustainability as ldquohellipdynamic institutionally embedded interaction between entrepreneurial attitudes abilities and aspirations by individuals which drives the allocation of resources through the creation and operation of new venturesrdquo 5 Entrepreneurial Ecosystems are complex socioeconomic structures that
are brought to life by individual-level-action Much of the knowledge relevant for entrepreneurial action is embedded in ecosystem structures and requires individual-level-action to extract it 6 The structure of the entrepreneurial ecosystem is illustrated in Figure 1 Nascent and new entrepreneurs are at the heart of the system Nascent entrepreneurs are individuals in the process of launching a new venture These entrepreneurs represent a sub-set of the adult population in a given country The attitudes that prevail within the wider population influence who chooses to become an entrepreneur The nascent and new entrepreneurs are characterized by varying degrees of ability and entrepreneurial aspirations It is the entrepreneurs who drive the trial and error dynamic This means entrepreneurs start businesses to pursue opportunities that they themselves perceive However entrepreneurs canrsquot tell in advance if opportunities are real or not The only way to validate an opportunity is to pursue it The outcome is a trial and error process
Figure 1 The Entrepreneurial Ecosystem Configuration
The entrepreneurial framework conditions matter because they regulate first who chooses to become an entrepreneur and second to what extent the resulting
new ventures are able to fulfill their growth potential The first aspectmdashentrepreneurial choicemdashis regulated mostly by soft framework conditions such as social
Entre-preneurs
23
norms and cultural preferences The degree to which new ventures are able to fulfill their potential is regulated by a range of entrepreneurial framework conditions such as government research and development education infrastructure financial sector and the corporate sector A healthy entrepreneurial ecosystem will drive resource allocation towards productive uses It will also drive total factor productivity through process innovation (Starbucks) The greater total factor productivity the greater the economyrsquos capacity to create jobs and wealth Agents
The first component of entrepreneurial ecosystems is agency The entrepreneur drives the system The entrepreneur is someone who makes judgment-based decisions about the coordination of scarce resources The term ldquosomeonerdquo is defined as the individual and the term ldquojudgment-based decisionsrdquo are decisions for which no obviously correct procedure exists Judgement is not the routine application of a standard rule As we discussed above we distinguish two types of entrepreneurial activity at one pole there is routine entrepreneurship which is really a type of management and for the rest of the spectrum we have high growth entrepreneurship By routine entrepreneurship we mean the activities involved in coordinating and executing a well-established ongoing concern in which the parts of the production function in use are well known and that operates in well-established and clearly defined way This includes the self-employment and small business owner It is the next taco stand garage or hair dresser It is certainly the case that replicative entrepreneurs can be of great social value However these types of firms are not what we mean by ecosystem services7 By high-impact entrepreneurship we mean the activities necessary to create an innovative high-growth venture where not all the markets are well established or clearly defined and in which the relative parts of the production function are not completely known Innovative entrepreneurs ensure that utilization of invention contributes to increased productivity and facilitates and contributes to economic growth The gap-filling and input-completing capacities are the unique characteristics of the entrepreneur
Institutions
The second fundamental component of Entrepreneurial Ecosystems is institutionsmdashthe rules of the game Of particular importance to entrepreneurship are the economic institutions in society such as the structure of property rights and the presence of effective market frameworks (North 1990) Economic institutions are important because they influence the structure of economic incentives Without property rights individuals will not have the incentive to invest in physical or human capital or adopt more efficient technologies Economic institutions are also important because they help to allocate resources to their most efficient uses they determine who gets profits revenues and residual rights of control When markets were highly restricted and institutions sent the wrong signals there is little substitution between labor and capital and technological change is minimal Institutions create incentives and that the entrepreneurial talent is allocated to activities with the highest private return which need not have the highest social returns Universal welfare-enhancing outcomes do not automatically follow from entrepreneurial activity indeed such activities can generate questionable or undesirable effects Entrepreneurial talent can be allocated among a range of choices with varying effects from wealth-creation to destruction of economic welfare If the same actor can become engaged in such alternative activities then the mechanism through which talent is allocated has important implications for economic outcomes and the quality of this mechanism is the key criterion in evaluating a given set of institutions with respect to growth We follow many others for example Hayek in proposing that the answer rests upon the institutional system and the incentives that it creates for agents yet we differ in simultaneously stressing the role of entrepreneurs In the United States institutions of private property and contract enforcement gives entrepreneurs the incentive to invest in physical and human capital to combine inputs in ways to create new production functions and to complete markets It is entrepreneurs operating in supportive institutional environments that provide the transmission mechanism from knowledge to economic growth by raising productivity
24
The System
The third component of entrepreneurial ecosystems is the systems When we look at systems for example systems of innovation or clusters we have a theory of how the system functions as it produces outputs Porterrsquos Diamond comes to mind When we move to an ecosystem we also need to have a theory of how the ecosystem functions How does an entrepreneurial ecosystem function It is not enough to have a laundry list of the institutions that might be important markets human capital supports culture finance and policy While all of these may be important how they work as an ecosystem is missing in much of this literature Building on the Systems of Innovation literature and the Global Entrepreneurship Monitor methodology we develop an entrepreneurial ecosystem that integrates both institutions and agency and introduce an ecosystem of coherent patterns in a simple intuitive and powerful way The key ideas are the relationships the complementary across the systems and subsystems and the importance of bottleneck factors The concept of complementary in its simplest way is the interaction of two variables Two choice variables are complements when doing more of one of them increases the returns to doing more of the other Ecosystem Services
While many think of the output of ecosystems as more startups like GEM this is wrong and misleading The dual service created by entrepreneurial ecosystems is (1) resource allocation towards productive uses and (2) the innovative high-growth ventures that drive this process The entrepreneurship literature frequently talks about opportunity recognition and the need to assemble resources However from a performance perspective the key issue is about resource allocation from existing activities to new ones The allocation of resources to productive uses will result in high growth high value new firms The nutrient in the ecosystem is resourcesmdashventure capital Without nutrients the ecosystem will die For example the launch of Uber and AirBnB early this decade and the earlier success of Google Amazon Facebook Twitter Skype WhatsApp Craigrsquos List created a new breed of company The billion-dollar tech startup was once the stuff of myth but now they seem to be everywhere backed by a bull market readily available venture capital and a new generation of disruptive technology8
Ecosystem Management
In the ecological literatures the practice of managing and enhancing ecosystem benefits is referred to as ecosystem management Because ecosystem services is created through a myriad of localized interactions between stakeholders it is not easy to trace gaps in system performance back to specific well-defined market and structural failures that could be addressed in a top-down mode 9 Strengthening the entrepreneurial ecosystem can be done by public private partnerships banks universities foundations governments and aid agencies The Global Entrepreneurial Ecosystem Roadmap (GEER) focuses on the first aspect of this project that is (1) identifying the holes in the global entrepreneurship ecosystem (2) laying out a roadmap for how to fill in the holes and (3) measuring our progress The goal of a well-functioning ecosystem is to improve the chances of success for entrepreneurs all over the world And ultimately reduce unemployment and bring peace to the world
25
The Entrepreneurial Ecosystem and Global Prosperity Introduction
While a focus on the entrepreneurial ecosystem may seem a novel approach to development it is consistent with and even complementary to older more traditional development strategies As developing economies move from centralized economies to market economies enterprise and entrepreneurship become important ldquoThe emerging world long a source of cheap labor now rivals developed countries for business innovation Developing countries are becoming hotbeds of business innovation in much the same way as Japan did from the 1950s onwardsrdquo10 Entrepreneurship is considered an important mechanism that promotes economic development through employment innovation and welfare but it does not appear like manna from heaven as a country moves through the stages of development Rather it plays a role in all development stages and is a process that continues over many years Economists have come to recognize the ldquoinput-competingrdquo and ldquogap-fillingrdquo capacities of entrepreneurial activity in development11 In other words someone has to create the technology for new products and create the markets where people will buy them Two points are important when thinking about entrepreneurship and development First contrary to popular belief the most entrepreneurial countries in the world are not those that have the most entrepreneurs This notion is in fact misleading In fact the highest self-employment rates are in low-income countries such as Zambia and Nigeria This is because low-income economies lack the human capital and infrastructure needed to create high-quality jobs The result is that many people sell soft drinks and fruit on street corners but there are few innovative high-growth startups Nor do these street vendors represent business ownership as defined in many developed countries In entrepreneurship quality matters more than quantity To be entrepreneurial a country needs to have the best entrepreneurs not necessarily the most What the ldquobest and the brightestrdquo do is important and to support their efforts a country needs a well-functioning entrepreneurial ecosystem (watch the video)12 The path to development is to create efficient organizations able
to harness technology to increase output and improve the lives of millions Second entrepreneurship comes in productive unproductive and destructive forms While productive entrepreneurship makes both entrepreneurs and society better off unproductive and destructive entrepreneurship make entrepreneurs better off but leave society in worse condition The GEI strives to measure only productive entrepreneurship that both creates wealth and is scalable Entrepreneurial ecosystems support innovative productive and rapidly growing new ventures They consist of multiple interactive elements all of which need to be in sync in order for innovative and high-growth firms to prosper Such firms also need skilled employees They need access to technology They need a well-functioning infrastructure They need specialized advice and support They need access to finance They need business premises They need a supportive regulatory framework Country-level Productivity and the Entrepreneurial Ecosystem
Economic growth does not equal to productivity Economic growth basically refers to the capacity of countries to produce more goods and services irrespective of how higher production is achieved The positive variations in GDP or employment over time are the usual suspects among those interested in studying economic growth figures mostly because they represent the desired objective of most policy makers as a measure of economic prosperity Productivity is a more complex concept At the country level total factor productivity (TFP) deals with two highly interconnected economic aspects First TFP has to do with the capacity of countries to allocate and exploit available resources efficiently (P = productivity effect) The notion that markets are good at directing resources is a good catch-all explanation concept but for many businesses it is hard to find all that is required to perform in the market and to keep the pace of industrial and digital revolutions that not only equip businesses with newmdashoften more technologically advancedmdashresources but also change the ways to exploit them
26
The second component of TFP deal with the capacity of organizations to channel innovations to the economy (I = innovation effect) that consequently translate into higher levels of output per input unit (in the case of countries GDP per worker) Maybe we all are too used to link innovation to technological inventions that are successfully commercialized However our definition of innovation is not restricted to engineering (such as the driverless car) or to medical advances (such as nerve stimulation or non-invasive procedures) and is open to other equally valuable types of non-technological innovations related to product and processes Letrsquos start with the productivity effect (P) The efficient allocation of resources available in the economy is an important part of the productivity function The productivity effect is linked to how well new and existing businesses use different resources including labor capital equipment knowledge and technology-based inputs The capacity of Amazon to amalgamate technologies brought from other industries (for example ICTs drones) to increase the productivity of its operations (delivery Amazon Fresh or Amazon Prime Air) is a good example13 From the perspective of the entrepreneurship ecosystem better institutions backing entrepreneurial activities and an efficient interaction between individual actions and the institutional setting governing entrepreneurial decisions are key ingredients necessary to facilitate the creation of businesses with a greater capacity to generate jobs and help incumbent businesses to take advantage of better market conditions For example in many European countries entrepreneurs have strong incentives to invest in physical and human capital and to promote the exploitation of resources in an effort to improve the functioning of their businesses In this case the supportive institutional environment creates the conditions to promote operational improvements In other words entrepreneurial ventures have incentives to lsquodo things betterrsquo that is to improve their productivity To sum up a healthy entrepreneurial ecosystem contributes to national productivity by enhancing market efficiency levels and by promoting the efficient exploitation of resources through new and incumbent businesses14
The second effectmdashinnovation (I)mdashis strictly linked to the Schumpeterian approach to entrepreneurship (creative destruction)15 For Schumpeter entrepreneurs play a decisive role in the economy by creating and implementing radical innovations that are conducive to economic progress In this tradition entrepreneurship is critical to spark economic development by promoting innovations in our terminology lsquocreate new things or find new ways to do thingsrsquo Progress translates in the expansion of the countriesrsquo production possibilities that materializes in a shift of the global frontier But at this point is worth questioning how can radical innovations foster such progress Moreover how does the entrepreneurial ecosystem contribute to this progress It seems logical to argue that inventions are worthless is they do not turn into commercialized innovations and that the economic impact of such innovations will turn sterile if the market and individuals cannot fully incorporate these innovations in their day-to-day routines For Schumpeter entrepreneurs nurture the economy with innovations and the entrepreneurial ecosystem is critical for the development of this economic function lsquocreate new things or find new ways to do thingsrsquo If countries enjoy a healthy entrepreneurial ecosystem the efforts of innovative entrepreneurs will materialize in new value-adding combinations of resources that will expand the countriesrsquo productive capacity and the global production frontier We found a significant relatively strong positive correlation between entrepreneurship and total factor productivity (035) We also noted that entrepreneurship correlates weakly positively with the productivity effect (009) (Table 11) Table 1 The correlations between GEI total factor productivity and its components
Variables Correlation GEI vs total factor productivity 03513 GEI vs productivity effect 00930 GEI vs innovation effect 03882
The strongest positive correlation was found between entrepreneurship and the innovation effect (039) This result is not surprising if we think a little harder Just like we cannot imagine progress in the 19th century without the creation and development of steam engines it is hard to imagine entrepreneurship in the 21st century without the power of technology-driven inventions With
27
the new millennium industries and markets from all around the globe are witnessing drastic transformations that are the result of a digital revolution in which entrepreneurs are taking an active role by creating new businesses that are responsible of this revolution The result is a good sign that reinforces our argument that the creation of lsquonew things or new ways to do thingsrsquo definitely constitutes the vital force driving economic development Figure 2 plots the GEI score and the computed total factor productivity values The correlation between TFP
and GEI is 035 and the sign is positive (see Table 1) From the Figure 2 we verify that the quality of the entrepreneurial ecosystem (GEI scores) and TFP move in the same direction Countries with a low-quality entrepreneurial ecosystem tend to show negative TFP values below unity On contrary all developed economies with supportive entrepreneurial ecosystems improve their total factor productivity either by productivity or innovation effects
Figure 2 GEI and total factor productivity
Figures 13 and 14 plot the relationship between the GEI index and the productivity and innovation effects respectively There is a positive association between entrepreneurship and the productivity effect (correlation = 009) however this relationship is less pronounced than that found for the TFP This result may well be partly explained by the differentiating impact of entrepreneurship over the productivity effect across economies We observe that the correlation between
entrepreneurship and the productivity effect scores the highest among factor driven countries (047 in Table 43) Also from Figure 13 we note that in many underdeveloped and developing territories with low- and mid-level entrepreneurial ecosystem the productivity effect is positive while the result of the productivity effect for some developed economies is negative
10 20 30 40 50 60 70 80 90
GEI
094
096
098
1
102
104
106
108
TFP
Denmark
Canada
USA
UK
Singapore
Uganda
China
Ghana
IndiaPeru
Germany
NetherlandsFrance
Angola
Zambia
Malawi Guatemala
Hungary
Japan
Korea
Finland
Norway
Sweden
LithuaniaR-square = 01234
28
Thus our results suggest that in developing economies the entrepreneurial ecosystem plays a much more decisive role on TFP via productivity improvements that
is helping new and established businesses in developing economies to better exploit their limited resources that is lsquoto lsquodo things betterrsquo
Figure 3 GEI and the productivity effect
The picture is quite different when we look at the results for the innovation effect The data in Table 13 show how the correlation between entrepreneurship and the innovation effect progressively increases as we move from factor-driven (correlation = -041) to innovation-driven economies (correlation = 033) Similarly the impact of the innovation effect is much more potent in innovation-driven economies (155) than in efficiency-driven (117) and in factor-driven economies (-059) This trend is corroborated by the results in Figure 44 in which we observe a steeper relationship between the
GEI scores and the innovation effect In contrast to the stronger effect of the entrepreneurial ecosystem over productivity in developing countries we found that the positive influence of a healthy entrepreneurial ecosystem over the innovative capacity of new and established businesses is much more powerful in developed economies With the exception of Turkey the innovation effect linked to the efficient commercialization of innovations and new technologies is positive in all economies with high quality entrepreneurial ecosystems (GEIgt 50)
10 20 30 40 50 60 70 80 90
GEI
092
094
096
098
1
102
104
106
Prod
uctiv
ity e
ffect
Uganda
Malawi Guatemala
Ghana
Angola
Peru
China
Macedonia
Hungary
Japan
Korea
Finland
Norway
Netherlands
Germany
France
Singapore
Lithuania
UK
USA
Denmark
Sweden
India
Trinidad amp Tobago
Botswana R-square = 00486
Zambia
Canada
29
Figure 4 GEI and the innovation effect
Based on the relationships reported above the improvement of the entrepreneurial ecosystem (GEI scores) may well yield to improvements in total factor productivity via the enhanced capacity of businesses to use their available resources (productivity effect) and to exploit the market potential of new technologies and
innovations As a result if every of the 64 analyzed countries raised its GEI score by 10 the global total factor productivity will increase 022 TFP points which represents an estimated improvement of 158016
10 20 30 40 50 60 70 80 90
GEI
094
096
098
1
102
104
106
Inno
vatio
n ef
fect
R-square = 01507
Uganda
Malawi
Guatemala
Angola
India
China
Botswana
HungaryJapan
Korea
Lithuania
Finland
Singapore
UK
Sweden
Denmark
USA
Canada
Norway
Netherlands
Zambia Peru
Ghana
Germany
30
The Global Entrepreneurship Index In depth
The Global State of Entrepreneurship
The GEI measures both the quality of entrepreneurship in a country and the extent and depth of the supporting entrepreneurial ecosystem
The top ten countries for 2018 show a pattern similar to last yearrsquosmdashhigh-income mostly European nations The top countries are the United States Switzerland Canada
the United Kingdom Australia Denmark Iceland Ireland Sweden and France The major surprise this year is the movement of the UK from 8th place to 4th place and the movement of Sweden from 4th place to 9th place Because the scores in the highest range are so close small changes in score from one year to the next can produce a relatively large shift in ranks among the top ten For this reason we present confidence intervals for the top ten
Top Ten Countries
Table 2 Top Ten Countries in the GEI
Country GEI 2018 lower limit
GEI 2018 upper limit
GEI 2018 Rank 2018
GEI Rank 2017
United States 775 897 836 1 1
Switzerland 725 884 804 2 2
Canada 739 846 792 3 3
United Kingdom 736 819 778 4 8
Australia 690 820 755 5 7
Denmark 648 838 743 6 5
Iceland 636 847 742 7 6
Ireland 668 806 737 8 9
Sweden 671 791 731 9 4
France 599 771 685 10 13
Figure 5 Confidence Intervals for Top Ten Scores
The results show that the No 1 rank could have gone to any of the top ten nations with the exception of France We see that Switzerland has a confidence
interval similar to the United States
599671668
636648
690736739
725775
771791806
847838
820819
846884897
00 200 400 600 800 1000
FranceSwedenIrelandIceland
DenmarkAustralia
United KingdomCanada
SwitzerlandUnited States
31
Regional Performance
For many countries a regional benchmark is more relevant for identifying best practices for fostering entrepreneurship This year we have several important
changes in Europe Sub-Saharan Africa and the MENA countries Below we present the top performer in each region along with individual and institutional score summaries
Table 3 Top Scores by Region
World rank Country Region GDP per capita PPP Individual variables Institutional variables GEI
1 United States North America $52676 930 785 836
2 Switzerland Europe $54933 938 715 804
5 Australia Asia-Pacific $42149 822 743 755
16 Israel Middle East North Africa $31092 809 727 654
19 Chile South and Central America Caribbean $21302 689 759 585
52 Botswana Sub-Saharan Africa $15286 477 660 349
The United States leads the world in entrepreneurship and is first in the North American region just ahead of peer Canada Australia ranks first in the Asia-Pacific region ahead of economic powerhouses China Singapore Hong Kong and Japan Switzerland which ranked fourth in the European region and eighth overall last year now comes in first in Europe Chile ranks first in
South and Central America and the Caribbean (19th overall) 22 places ahead of the next highest scorer in the regionmdashPuerto Rico at 41st Israel is 16th overall and tops the MENA region just ahead of Qatar at 22nd In Sub-Saharan Africa Botswana is the leader at 52nd ranking ahead of nine European nations
Biggest Gains
Table 4 Biggest Gains in GEI Score
Country Score 2018 Score 2017 Difference in Score Difference in Rank
United Kingdom 778 712 65 4
Israel 654 594 60 1
Bulgaria 278 227 51 13
China 411 361 50 5
Iran 268 221 47 13
Italy 414 371 43 4
Poland 504 465 39 1
Canada 792 755 37 0
Ireland 737 702 35 1
Korea 542 507 35 3
Note The table above includes only those countries that have participated in the GEM survey and do not have estimated individual data
32
Biggest Declines
Table 5 Biggest Declines in GEI Score (among countries with decreases in GEI score)
Country Score 2018 Score 2017 Difference in Score Difference in Rank
Latvia 405 430 -25 -6
Sweden 731 752 -21 -5
Taiwan 595 610 -15 -2
Malaysia 327 334 -07 -4
Ecuador 205 209 -04 -5
Chile 585 589 -04 -1
Kazakhstan 297 300 -03 -2
Indonesia 210 211 -01 -4
Note The above table includes only those countries that have participated in the GEM survey and do not have estimated individual data
The 14 Pillars of an Entrepreneurial Ecosystem
The pillars of entrepreneurship in the ecosystem are many and complex While a widely accepted definition of entrepreneurship is lacking there is general agreement that the concept has numerous dimensions17 We take this into account in creating the entrepreneurship index Some businesses have a larger impact on markets create more new jobs and grow faster and become larger than others We also take into account the fact that entrepreneurship plays a different role at different stages of development18 Considering all of these possibilities and limitations we define entrepreneurship as ldquothe dynamic institutionally embedded interaction between entrepreneurial attitudes entrepreneurial abilities and entrepreneurial aspirations by individuals which drives the allocation of resources through the creation and operation of new venturesrdquo
The GEI is composed of three building blocks or sub-indicesmdashwhat we call the 3As entrepreneurial attitudes entrepreneurial abilities and entrepreneurial
aspirations Entrepreneurial attitudes are about how a country thinks about entrepreneurship In fact what does your mother think about it The second sub index
GLO
BAL
ENTR
EPRE
NEU
RSH
IP IN
DEX
Sub-indexes Pillars Variables (individual institutional)
ATTITUDES SUB-INDEX
OPPORTUNITY PERCEPTION
OPPORTUNITY RECOGNITION FREEDOM (ECONOMIC FREEDOM PROPERTY RIGHTS)
STARTUP SKILLS SKILL PERCEPTION EDUCATION (TERTIARY EDUCATIONQUALITY OF EDUCATION)
RISK ACCEPTANCE RISK PERCEPTION COUNTRY RISK
NETWORKING KNOW ENTREPRENEURS AGGLOMERATION (URBANIZATIONINFRASTUCTURE )
CULTURAL SUPPORT CAREER STATUS CORRUPTION
ABILITIES SUB-INDEX
OPPORTUNITY STARTUP OPPORTUNITY MOTIVATION GOVERNANCE (TAXATIONGOOD GOVERNANCE)
TECHNOLOGY ABSORPTION
TECHNOLOGY LEVEL TECHNOLOGY ABSORPTION
HUMAN CAPITAL EDUCATIONAL LEVEL LABOR MARKET (STAFF TRAININGLABOUR FREEDOM)
COMPETITION COMPETITORS COMPETETIVNESS (MARKET DOMINANCEREGULATION)
ASPIRATION SUB-INDEX
PRODUCT INNOVATION NEW PRODUCT TECH TRANSFER
PROCESS INNOVATION
NEW TECHLOLOGY SCIENCE (GERD(AVERAGEQUALITY OF SCIENTIFICAL INSTITUTIONS +AVAILABILITY OF SCIENTISTS AND ENGENEERS))
HIGH GROWTH GAZELLE FINANCE AND STRATEGY (VENTURE CAPITALBUSINESS SOPHISTICATION)
INTERNATIONALIZATION EXPORT ECONOMIC COMPLEXITY
RISK CAPITAL INFORMAL INVESTMENT DEPTH OF CAPITAL MARKET
Figure 6 The Structure of the Global Entrepreneurship Index
33
is about abilities Can you do it Do you have the skills The third sub index is about aspirations Do you want to build a billion-dollar company These three sub-indices stand on 14 pillars each of which contains an individual and an institutional variable that corresponds to the micro- and the macro-level aspects of entrepreneurship Unlike other indexes that incorporate only institutional or individual variables the pillars of the GEI include both These pillars are an attempt to capture the open-ended nature of entrepreneurship analyzing them can provide an in-depth view of the strengths and weaknesses of those listed in the Index We now describe the 14 pillars of entrepreneurship
Entrepreneurial Attitudes Pillars
Pillar 1 Opportunity Perception This pillar captures the potential ldquoopportunity perceptionrdquo of a population by considering the state of property rights and the regulatory burden that could limit the real exploitation of the recognized entrepreneurial opportunity Within this pillar is the individual variable Opportunity Recognition which measures the percentage of the population that can identify good opportunities to start a business in the area where they live However the value of these opportunities also depends on the size of the market The institutional variable Freedom and Property consists of two smaller variables economic freedom (Economic Freedom) and property rights (Property Rights) Business Freedom ndash one sub-index of the Index of Economic Freedom variable ndash is appropriate for capturing the overall burden of regulation as well as the governmentrsquos regulatory efficiency in influencing startups and operating businesses ldquoThe property rights element is an assessment of the ability of individuals to accumulate private property secured by clear laws that are fully enforced by the staterdquo or in other words enforced property rights guarantee that individuals have the right to harvest the fruits of successful opportunity exploitation and no one is confiscating or stealing their property or business19 Both institutional components are vital for individuals to become entrepreneurs and not employees of another business or the state 20
Pillar 2 Startup Skills Launching a successful venture requires the potential entrepreneur to have the necessary startup skills Skill Perception measures the percentage of the population who believe they have adequate startup skills Most people in developing countries think they have the skills needed to start a
business but their skills were usually acquired through workplace trial and error in relatively simple business activities In developed countries business formation operation management etc require skills that are acquired through formal education and training Hence education especially postsecondary education plays a vital role in teaching and developing entrepreneurial skills Today there are 150 million students enrolled in some kind of education beyond high school a 53 percent increase in less than a decade People all over the world see education as a pathway out of poverty 21
Pillar 3 Risk Acceptance Of the personal entrepreneurial traits fear of failure is one of the most important obstacles to a startup Aversion to high-risk enterprises can retard nascent entrepreneurship Risk Perception is defined as the percentage of the population who do not believe that fear of failure would prevent them from starting a business Country Risk reflects to transfer and convertibility risk of a country and believed to closely correlate to business 22
Pillar 4 Networking Networking combines an entrepreneurrsquos personal knowledge with their ability to connect to others in a country and the whole world This combination serves as a proxy for networking which is also an important ingredient of successful venture creation and entrepreneurship Entrepreneurs who have better networks are more successful can identify more viable opportunities and can access more and better resources We define the basic networking potential of a possible entrepreneur by the percentage of the population who personally know an entrepreneur who started a business within two years (Know Entrepreneurs) The connectivity variable has two components One that measures the urbanization (Urbanization) of the country and the other measuring the quality of the transport infrastructure (Infrastructure)23
Pillar 5 Cultural Support This pillar is a combined measure of how a countryrsquos inhabitants view entrepreneurs in terms of status and career choice and how the level of corruption in that country affects this view Without strong cultural support the best and brightest do not want to be responsible entrepreneurs and they decide to enter a traditional profession Career Status is the average percentage of the population age 18-64 who say that entrepreneurship is a good career choice and enjoys high status The associated
34
institutional variable measures the level of corruption High levels of corruption can undermine the high status and steady career paths of legitimate entrepreneurs24
Entrepreneurial Abilities Pillars
Pillar 6 Opportunity Startup This is a measure of startups by people who are motivated by opportunity but face red tape and tax payment An entrepreneurrsquos motivation for starting a business is an important signal of quality Opportunity entrepreneurs are believed to be better prepared to have superior skills and to earn more than what we call necessity entrepreneurs Opportunity Motivation is defined as the percentage of the Total Entrepreneurial Activity (TEA) businesses started to exploit a good opportunity to increase income or to fulfill personal aims in contrast to those started by people who have no other options for work The overall effectiveness of the government services is measured by the Good Governance variable and the cost of the governance is by the level of overall taxation (Taxation) The variable is a combination of these two components government service quality and costs25
Pillar 7 Technology Absorption In the modern knowledge economy information and communication technologies (ICT) play a crucial role in economic development Not all sectors provide the same chances for businesses to survive and or their potential for growth The Technology Level variable is a measure of the businesses that are in technology sectors The institutional variable Tech Absorption is a measure of a countryrsquos capacity for firm-level technology absorption as reported by the World Economic Forum The diffusion of new technology and the capability to absorb it is vital for innovative firms with high growth potential26
Pillar 8 Human Capital The prevalence of high-quality human capital is vitally important for ventures that are highly innovative and require an educated experienced and healthy workforce to continue to grow An important feature of a venture with high growth potential is the entrepreneurrsquos level of education The Educational Level variable captures the quality of entrepreneurs it is widely held that entrepreneurs with higher education degrees are more capable and willing to start and manage high-growth businesses The labor market possibilities and the capability to easily hire quality employees also have an impact on business development innovation and growth potential The
institutional variable Labor Market has two components Labor Freedom measures the freedom of the labor from the regulatory perspective and Staff Training is a countryrsquos level of investment in business training and employee development It can be expected that heavy investment in employees pays off and that training increases employee quality27
Pillar 9 Competition Competition is a measure of a businessrsquos product or market uniqueness combined with the market power of existing businesses and business groups and the effectiveness of anti-monopoly regulation The variable Competitors is defined as the percentage of TEA businesses that have only a few competitors offering the same product or service However market entry can be prevented or made more difficult if powerful business groups are dominating the market The extent of market dominance by a few business groups is measured by the variable Market Dominance a variable reported by the World Economic Forum The effectiveness of the regulatory bodies (Regulation) could also influence the level of competition in a country The Competition institutional variable is the combination of Regulation and Market Dominance28
Entrepreneurial Aspirations Pillars
Pillar 10 Product Innovation New products play a crucial role in the economy of all countries While countries were once the source of most new products today developing countries are producing products that are dramatically cheaper than their Western equivalents New Product is a measure of a countryrsquos potential to generate new products and to adopt or imitate existing products In order to quantify the potential for new product innovation an institutional variable related to technology and innovation transfer seems to be relevant Technology Transfer is a complex measure of whether a business environment allows the application of innovations for developing new products29
Pillar 11 Process Innovation Applying andor creating new technology is another important feature of businesses with high-growth potential New Tech is defined as the percentage of businesses whose principal underlying technology is less than five years old However most entrepreneurial businesses do not just apply new technology they create it The problem is similar to the New Product variable whereas many businesses in developing countries may apply the latest
35
technology they tend to buy or copy it An appropriate institutional variable applied here is complex measure combining research and development (RampD) the quality of scientific institutions in a country (Scientific Institutions) and the availability of scientists and engineers (Availability of Scientist) Gross Domestic Expenditure on Research and Development (GERD) is the RampD percentage of GDP as reported by OECD While RampD alone does not guarantee successful growth it is clear that without systematic research activity the development and the implementation of new technologiesmdashand therefore future growthmdashwill be inhibited The Science institutional variable combines together RampD potential with physical scientific infrastructure and science oriented human capital 30
Pillar 12 High Growth High Growth is a combined measure of the percentage of high-growth businesses that intend to employ at least 10 people and plan to grow more than 50 percent in five years (Gazelle variable) with business strategy sophistication (Business Strategy variable) and venture capital financing possibility (Venture Capital) It might be argued that a shortcoming of the Gazelle variable is that growth is not an actual but an expected rate However a measure of expected growth is in fact a more appropriate measure of aspiration than a measure of realized growth Business Strategy refers to ldquothe ability of companies to pursue distinctive strategies which involves differentiated positioning and innovative means of production and service deliveryrdquo High Growth combines high growth potential with a sophisticated strategy and growth specific venture capital finance31
Pillar 13 Internationalization Internationalization is believed to be a major determinant of growth A widely applied proxy for internationalization is exporting Exporting demands capabilities beyond those needed by businesses that produce only for domestic markets However the institutional dimension is also important a countryrsquos openness to international entrepreneursmdashthat is the potential for internationalizationmdashcan be estimated by its degree of complexityrdquo The complexity of an economy is related to the multiplicity of useful knowledge embedded in it Because individuals are limited in what they know the only way societies can expand their knowledge base is by facilitating the interaction of individuals in increasingly complex networks in order to make products We can measure economic complexity by the mix of these products that
countries are able to makerdquo The internationalization pillar is designed to capture the degree to which a countryrsquos entrepreneurs are internationalized as measured by the exporting potential of businesses controlling for the extent to which the country is able to produce complex products32
Pillar 14 Risk Capital The availability of risk finance particularly equity rather than debt is an essential precondition for fulfilling entrepreneurial aspirations that are beyond an individual entrepreneurrsquos personal financial resources33 Here we combine two kinds of finance the informal investment (Informal Investment) and the institutional depth of capital market (DCM) Informal Investment is defined as the percentage of informal investors in the population age 18-64 multiplied by the average size of individualsrsquo investment in other peoplersquos new businesses While the rate of informal investment is high in factor-driven economies the amount of informal investment is considerably larger in efficiency- and innovation-driven countries combining them balances these two effects Our institutional variable here is DCM one of the six sub-indices of the Venture Capital and Private Equity Index This variable is a complex measure of the size and liquidity of the stock market level of IPO MampA and debt and credit market activity which encompass seven aspects of a countryrsquos debt and capital market
The Global Entrepreneurship Index 2018 Rankings
In this section we report the rankings of the 137 countries on the Global Entrepreneurship Index and its three sub-indices We also provide confidence intervals for the GEIrsquos The confidence intervals calculations are based on the Global Entrepreneurship Monitor (GEM) Total Early-Phased Entrepreneurial Activity (TEA) confidence intervals Note that these confidence intervals only partially represent the potential measurement errors as we do not know the full error term In addition we do not have information about the confidence intervals of the 34 countries where we use estimated data In these cases the upper and the lower limits are the same
We present the rankings in terms of country development as measured by per capita GDP The overall ranking of the countries on the GEI is shown in Table 16 Like previous years Anglo-Saxon Nordic and Western European countries in the innovation-driven
36
stage of development are in the front ranks The United States Switzerland and Canada lead the rankings Three of the five Nordic countries Denmark Iceland and Sweden are in the top ten and effectively tied with the United States Hong Kong the highest Asian country is in 13th place and Taiwan is 18th Besides their high entrepreneurial performance these countries represent high income levels
Of the most populous EU countries only the United Kingdom and France place among the top 10 countries (4th and 10th) The other large European countries rank in the middle Germany is 15th Spain is 34th followed by Italy in 42nd place While the UK France and Germany are relatively well balanced over the 14 pillars
Poland Spain and Italy are entrepreneurially less efficient A likely explanation for the EU countriesrsquo relatively weak economic performance over the last decade is their low level of entrepreneurship the same applies to Japan which took 28th place Europe is still struggling to create new billion dollar companies
Factor-driven countries with low GDPs such as Pakistan Bangladesh Uganda and other poor African countries are at the bottom of the entrepreneurship ranking as expected At the same time these countriesrsquo entrepreneurial performance is the least unbalanced However some countriesmdashincluding two former socialist countries Serbia and Russia innovation-driven Italy and two South American countries Brazil and Trinidad and Tobagomdashshould have higher levels of entrepreneurship as implied by their development trend lines and more efficient use of entrepreneurial resources
37
Table 6 The Global Entrepreneurship Index Rank of All Countries 2018
Global rank Country Score
1 United States 836 2 Switzerland 804 3 Canada 792 4 United Kingdom 778 5 Australia 755 6 Denmark 743 7 Iceland 742 8 Ireland 737 9 Sweden 731
10 France 685 11 Netherlands 681 12 Finland 679 13 Hong Kong 673 14 Austria 660 15 Germany 659 16 Israel 654 17 Belgium 637 18 Taiwan 595 19 Chile 585 20 Luxembourg 582 21 Norway 566 22 Qatar 550 23 Estonia 548 24 Korea 542 25 Slovenia 538
26 United Arab Emirates 535
27 Singapore 527 28 Japan 515 29 Lithuania 511 30 Poland 504 31 Portugal 488 32 Cyprus 480 33 Oman 469 34 Spain 453 35 Bahrain 451 36 Slovakia 449 37 Turkey 445 38 Czech Republic 434 39 Kuwait 428 40 Tunisia 424 41 Puerto Rico 421 42 Italy 414 43 China 411 44 Latvia 405 45 Saudi Arabia 402 46 Romania 382 47 Colombia 382 48 Greece 371 49 Jordan 365 50 Hungary 364 51 Uruguay 350 52 Botswana 349 53 Brunei Darussalam 343
Global rank Country Score
54 Croatia 340 55 Barbados 336 56 Costa Rica 333 57 South Africa 329 58 Malaysia 327 59 Lebanon 315 60 Montenegro 312 61 Namibia 311 62 Azerbaijan 305 63 Belize 300 64 Kazakhstan 297 65 Morocco 292 66 Macedonia 291 67 Peru 284 68 India 284 69 Bulgaria 278 70 Panama 277 71 Thailand 274 72 Iran 268 73 Ukraine 268 74 Serbia 264 75 Mexico 264 76 Egypt 259 77 Georgia 258 78 Russia 252 79 Gabon 250 80 Algeria 247 81 Trinidad amp Tobago 244 82 Dominican Republic 243 83 Albania 242 84 Philippines 241 85 Argentina 240 86 Swaziland 238 87 Vietnam 232 88 Armenia 228 89 Jamaica 222 90 Sri Lanka 219 91 Rwanda 215 92 Moldova 212 93 Ghana 210 94 Indonesia 207
95 Bosnia and Herzegovina 207
96 Ecuador 205 97 Bolivia 204 98 Brazil 203 99 Tajikistan 200
100 Kyrgyz Republic 198 101 Nigeria 197 102 Zambia 196 103 Senegal 192 104 Libya 189 105 Cocircte drsquoIvoire 189 106 Paraguay 187
Global rank Country Score
107 Honduras 187 108 Guatemala 185 109 Kenya 184 110 Ethiopia 183 111 Suriname 181 112 Lao PDR 178 113 Cambodia 176 114 El Salvador 167 115 Tanzania 164 116 Guyana 164 117 Gambia The 161 118 Mali 159 119 Liberia 157 120 Pakistan 156 121 Cameroon 154 122 Nicaragua 147 123 Angola 144 124 Mozambique 140 125 Madagascar 140 126 Venezuela 138 127 Myanmar 136 128 Benin 133 129 Burkina Faso 132 130 Guinea 129 131 Uganda 129 132 Sierra Leone 123 133 Malawi 122 134 Bangladesh 118 135 Burundi 118 136 Mauritania 109 137 Chad 90
38
The Ranking of the 3As
By definition the GEI is a three-component index that takes into account the different aspects of the entrepreneurial ecosystem However all three components called sub-indices are in themselves complex measures that include various characteristics of entrepreneurial attitudes entrepreneurial abilities and entrepreneurial aspirations
Entrepreneurial attitudes are societiesrsquo attitudes toward entrepreneurship which we define as a populationrsquos general feelings about recognizing opportunities knowing entrepreneurs personally endowing entrepreneurs with high status accepting the risks associated with business startups and having the skills to launch a business successfully The benchmark individuals are those who can recognize valuable business opportunities and have the skills to exploit them who attach high status to entrepreneurs who can bear and handle startup risks who know other entrepreneurs personally (ie have a network or role models) and who can generate future entrepreneurial activities
Moreover these people can provide the cultural support financial resources and networking potential to those who are already entrepreneurs or want to start a business Entrepreneurial attitudes are important because they express the general feeling of the population toward entrepreneurs and entrepreneurship Countries need people who can recognize valuable business opportunities and who perceive that they have the required skills to exploit these opportunities Moreover if national attitudes toward entrepreneurship are positive it will generate cultural support financial support and networking benefits for those who want to start businesses
Entrepreneurial abilities refer to the entrepreneursrsquo characteristics and those of their businesses Different types of entrepreneurial abilities can be distinguished within the realm of new business efforts Creating businesses may vary by industry sector the legal form of organization and demographicsmdashage education etc We define entrepreneurial abilities as startups in the medium- or high-technology sectors that are initiated by educated entrepreneurs and launched because of a person being motivated by an opportunity in an environment that is not overly competitive In order to calculate the opportunity startup rate we use the GEM
TEA Opportunity Index TEA captures new startups not only as the creation of new ventures but also as startups within existing businesses such as a spinoff or other entrepreneurial effort Differences in the quality of startups are quantified by the entrepreneurrsquos education levelmdashthat is if they have a postsecondary educationmdashand the uniqueness of the product or service as measured by the level of competition Moreover it is generally maintained that opportunity motivation is a sign of better planning a more sophisticated strategy and higher growth expectations than ldquonecessityrdquo motivation in startups
Entrepreneurial aspiration reflects the quality aspects of startups and new businesses Some people just dislike their currently employment situation and want to be their own boss while others want to create the next Microsoft Entrepreneurial aspiration is defined as the early-stage entrepreneurrsquos effort to introduce new products andor services develop new production processes penetrate foreign markets substantially increase their companyrsquos staff and finance their business with formal andor informal venture capital Product and process innovation internationalization and high growth are considered the key characteristics of entrepreneurship Here we added a finance variable to capture the informal and formal venture capital potential that is vital for innovative startups and high-growth firms
Each of these three building blocks of entrepreneurship influences the other two For example entrepreneurial attitudes influence entrepreneurial abilities and entrepreneurial aspirations while entrepreneurial aspirations and abilities also influence entrepreneurial attitudes
Table 7 shows the ranking of the first 25 countries in the GEI and the rank of the sub-index The sub-index points and rankings for all 137 countries can be found in the Appendix The United States is first in the overall Index and also in one out of the three sub-indices Switzerland is 11th in attitudes first in aspirations and first in abilities as it is more interested in high-impact entrepreneurship than in replicative activities Chile represents a more unbalanced case ranking 19th in the overall Index slipping three places tenth in attitudes 27th in abilities and 30th in aspirations This is a huge challenge for Chile and many other Latin American economies Generally countries that rank at the bottom of the GEI also rank at the bottom of the three sub-
39
indices Israel ranks 16th in the overall Index but performs poorly in attitudes and abilities However it ranks 7th in Aspirations despite having poorer attitudes and abilities
For the ldquostartup nationrdquo it has an overall poor ranking in startup skills ndash at the bottom of the top 25 countries
Table 7 The Global Entrepreneurship Index and Sub-Index Ranks of the First 25 Countries 2018
Countries GEI GEI rank ATT ATT rank ABT ABT rank ASP ASP rank
United States 836 1 800 2 860 2 849 2
Switzerland 804 2 695 11 864 1 855 1
Canada 792 3 779 5 799 5 799 3
United Kingdom 778 4 736 7 833 4 763 4
Australia 755 5 792 3 760 8 712 8
Denmark 743 6 719 8 845 3 665 16
Iceland 742 7 823 1 699 9 703 9
Ireland 737 8 672 14 789 6 750 5
Sweden 731 9 711 9 787 7 695 13
France 685 10 614 17 697 10 744 6
Netherlands 681 11 774 6 653 14 617 22
Finland 679 12 790 4 629 16 618 21
Hong Kong 673 13 694 12 625 17 702 10
Austria 660 14 673 13 664 13 644 17
Germany 659 15 611 18 672 12 694 14
Israel 654 16 633 16 608 20 722 7
Belgium 637 17 538 23 678 11 695 12
Taiwan 595 18 540 22 548 24 696 11
Chile 585 19 703 10 509 27 543 30
Luxembourg 582 20 492 28 629 15 626 18
Norway 566 21 661 15 609 19 428 44
Qatar 550 22 484 29 545 25 622 19
Estonia 548 23 576 19 557 22 510 35
Korea 542 24 556 20 501 29 568 27
Slovenia 538 25 544 21 550 23 521 33
40
ENTREPRENEURIAL ATTITUDES
As stated earlier entrepreneurial attitude is defined as the general attitude of a countryrsquos population toward recognizing opportunities knowing entrepreneurs personally attaching high status to entrepreneurs accepting the risks associated with a business startup and having the skills to successfully launch businesses Entrepreneurial attitudes are important because they express the populationrsquos general feelings toward entrepreneurs and entrepreneurship
The benchmark individuals are those who can (1) recognize valuable business opportunities (2) have the necessary skills to exploit these opportunities (3) attach high status to and respect entrepreneurs (4) handle startup risk and (5) know entrepreneurs personally (ie have a network or role models) Moreover these people can provide the cultural support financial resources and networking potential to those who are already entrepreneurs or want to start a business
Table 8 Entrepreneurial Attitudes Sub-Index and Pillar Values for the First 25 Countries 2018
Countries Attitudes Sub-index
Opportunity Perception
Startup Skills Risk
Acceptance Networking
Cultural Support
Iceland 823 0947 1000 0917 1000 0633
United States 800 0864 1000 0969 0569 0816
Australia 792 0947 1000 0717 0698 0782
Finland 790 0954 0986 0782 0833 0885
Canada 779 0981 0795 0708 0626 0975
Netherlands 774 0898 0887 0877 0800 1000
United Kingdom 736 0810 0573 0876 0619 0928
Denmark 719 1000 0690 0748 0634 0918
Sweden 711 1000 0472 0704 0740 0896
Chile 703 0821 0903 1000 0709 0628
Switzerland 695 0776 0719 0879 0533 0673
Hong Kong 694 1000 0581 0610 1000 0680
Austria 673 0780 0953 0672 0552 0683
Ireland 672 0766 0966 0801 0390 0780
Norway 661 1000 0540 0999 0473 1000
Israel 633 0738 0598 0481 1000 0738
France 614 0502 0558 0751 0673 0641
Germany 611 0775 0627 0657 0380 0842
Estonia 576 0896 0800 0622 0493 0563
Korea 556 0457 0774 0905 0765 0272
Slovenia 544 0349 1000 0843 0331 0504
Taiwan 540 0517 0526 0587 0644 0580
Belgium 538 0679 0677 0559 0349 0568
Saudi Arabia 536 0611 0933 0436 1000 0477
Spain 513 0407 0807 0692 0640 0339 Pillar values are the normalized pillar scores and after the average pillar correction
Iceland leads in the Attitudes sub index followed by the United States Australia Finland Canada Netherlands United Kingdom Denmark Sweden and Chile Chilersquos tenth place is a very strong showing for a South American country Factor-driven African and Asian
countries including Swaziland Mali Sierra Leone Ethiopia Bangladesh Pakistan Malawi Chad and Burundi are at the bottom
41
ENTREPRENEURIAL ABILITIES
High entrepreneurial abilities are associated with startups in the medium- or high-technology sectors that are initiated by educated entrepreneurs and launched because of opportunity motivation in a not too
competitive environment Quality differences in startups are quantified by the motivation and education level of the entrepreneur and by the uniqueness of the product or service as measured by the level of competition
Table 9 Entrepreneurial Abilities Sub-Index and Pillar Values for the First 25 Countries 2018
Countries Abilities Sub-index
Opportunity Startup
Technology Absorption
Human Capital Competition
Switzerland 864 0966 1000 0789 1000
United States 860 0849 0814 1000 1000
Denmark 845 1000 1000 1000 0989
United Kingdom 833 0925 1000 0742 0848
Canada 799 0999 0779 0912 0676
Ireland 789 1000 0769 0851 1000
Sweden 787 0976 0946 0644 0869
Australia 760 0871 0780 0950 0567
Iceland 699 1000 1000 0506 0501
France 697 0683 0840 0625 0739
Belgium 678 0543 0852 0778 0850
Germany 672 0759 0863 0482 0848
Austria 664 0808 0941 0399 0761
Netherlands 653 0935 0835 0365 0786
Luxembourg 629 1000 0839 0551 0857
Finland 629 1000 0826 0495 0415
Hong Kong 625 0800 0643 0894 0381
Japan 611 0588 0902 0983 0594
Norway 609 1000 0752 0419 0671
Israel 608 0647 1000 0811 0317
Singapore 586 1000 0739 1000 0655
Estonia 557 0635 0773 0540 0606
Slovenia 550 0604 0744 0500 0485
Taiwan 548 0651 0705 0701 0317
Qatar 545 0754 0339 0882 0603 Pillar values are the normalized pillar scores and after the average pillar correction
Switzerland ranks number one on the Entrepreneurial Abilities sub-index The US ranks second and is relatively weak in Opportunity Startup and Technology Absorption Switzerland is stronger than the US in two pillars Opportunity Startups and Technology Absorption but very weak in Human Capital The United Kingdom ranks fourth with a significantly lower Entrepreneurial Abilities score than Denmark the United States and Switzerland Canada is strong in Opportunity Startup and Technology Absorption but low on Human Capital and Competition
The first five countries are followed by Ireland Sweden Australia Iceland and France
42
ENTREPRENEURIAL ASPIRATIONS
Entrepreneurial aspiration is the early-stage entrepreneurrsquos effort to introduce new products andor services develop new production processes penetrate foreign markets substantially increase the firmrsquos staff and finance a business with formal andor informal venture capital In other words the effort to start new companies that will generate wealth and can be scaled Product and process innovation internationalization and high growth are considered characteristics of
entrepreneurship The benchmark entrepreneurs are those whose businesses (1) produce and sell productsservices considered to be new to at least some customers (2) use a technology less than five years old (3) have sales in foreign markets (4) plan to employ at least ten people and (5) have greater than 50 percent growth over the next five years The Finance variable captures the informal venture capital potential as well as the development of capital venture capital and credit markets which is vital for innovative startups and high-growth firms
Table 10 Entrepreneurial Aspirations Sub-Index and Pillar Values for the First 25 Countries 2018
Countries Aspirations Sub-index
Product Innovation
Process Innovation
High Growth
Internationalization Risk
Capital Switzerland 855 0834 0902 0882 1000 1000 United States 849 0733 0902 1000 1000 0876 Canada 799 0991 0758 0559 0936 1000 United Kingdom 763 0924 0701 0850 0824 0649 Ireland 750 1000 0822 0884 0970 0568 France 744 0801 0941 0644 0764 0768 Israel 722 0997 1000 0851 0601 0788 Australia 712 0592 0786 0658 0633 1000 Iceland 703 0602 0838 0699 0952 0588 Hong Kong 702 0884 0409 1000 0679 1000 Taiwan 696 0972 0696 0895 0536 0935 Belgium 695 0913 0963 0551 0887 0627 Sweden 695 0666 0899 0557 0816 0721 Germany 694 0667 0840 0662 0874 0760 United Arab Emirates 681 1000 0626 0899 0901 0979 Denmark 665 0988 0723 0594 0390 1000 Austria 644 0724 0818 0403 0901 0630 Luxembourg 626 1000 0612 0545 1000 0902 Qatar 622 0856 0516 1000 0529 0956 Japan 621 0788 1000 1000 0606 0547 Finland 618 0617 0795 0675 0647 0497 Netherlands 617 0652 0769 0596 0562 0715 Singapore 616 0763 1000 1000 1000 0796 China 600 1000 0759 0871 0310 1000 Lithuania 592 0708 0502 0636 0736 0641
Pillar values are the normalized pillar scores after the average pillar correction
The Switzerland leads in the Entrepreneurial Aspirations sub-index While showing some weakness in Product Innovation and High Growth it is very strong in Internationalization and Risk Capital The United States is second with a strong showing in High Growth and Internationalization followed by Canada the United Kingdom Ireland France Israel Australia Iceland and Hong Kong which round out the top ten
43
Summaries and Conclusion Entrepreneurship is similar to other social creatures in that it is a multidimensional phenomenon whose exact meaning is difficult to identify There is only one thing more difficult how to measure this vaguely defined creature Over the decades researchers have created several entrepreneurship indicators but none has been able to reflect the complex nature of entrepreneurship
References 1 Acs Z and P Correa 2014 The World Bank and GEDI Identifying the Obstacles to High-Impact Entrepreneurship in Latin America and the Caribbean 2 Stam 2015 Stam and Spiegel 2015 Szerb L Acs Z J Ortega-Argileacutes R and Komlosi E 2014 Acs Autio and Szerb 2014a Autio et al 2014 Autio and Levie 2015 Autio et al 2012 3 Moore 1993 4 (Mathews and Brueggemann 2015 Chapter 14) 5 Acs Szerb and Autio National Systems of Entrepreneurship Measurement and Policy Research Policy (2014b479) 6 Stakeholder engagement is central for multi-polar policy-making and implementation Deep stakeholder engagement can tap knowledge within the ecosystem and uncover hidden interactions and cause-effect chains 7 While there is a small literature on entrepreneurship and economic growth our view is that high-impact firms cause economic growth because they shift the production function and replicative entrepreneurship is caused by economic growth and creates employment by replicating the existing production function 8 This trend is reflected in the continuing decline in the cost of computing the rise of open-source software the move to the lsquocloudrsquo and the emergence of huge datacenters where companies such as Amazon Google and Facebook are designing their own approaches 9 Autio and Levie 2015 10 Woolridge 2009 11 Leibenstein 1968 12 httpswwwyoutubecomwatchv=hjNc_BScn-s 13 The Wall Street Journal (2014) lsquoAmazon Reports Loss Despite Strong Sales Growthrsquo Available at httponlinewsjcomarticlesamazon-reports-another-loss-despite-strong-sales-growth-1406233529 14 Acs ZJ Autio E Szerb L (2014) National systems of entrepreneurship Measurement issues and policy implications Research Policy 43 (3) 476-494
and provide a plausible explanation of its role in development The Global Entrepreneurship Index is the first and presently the only complex measure of the national-level entrepreneurship ecosystem that reflects the multifaceted nature of entrepreneurship
15 Schumpeter JA (1934) The Theory of Economic Development An Inquiry into Profits Capital Credit Interest and the Business Cycle Cambridge MA Harvard University Press 16 We agree that correlation and basic regression coefficients are not enough to determine causation which is why we say that a 10 global increase in GEI could improve global productivity 022 points But it should be kept in mind that the said change in the GEI and the changes to institutions that it represents could add this amount to global productivity since the institutions that support entrepreneurship also support a variety of other economic and non-economic activities 17 Gartner (1990) Davidsson (2004) Wennekers and Thurik (1999)) and Godin Clemens and Veldhuis (2008) Zahra et al (2014) Gupta and Gupta (2015) all identify several dimensions of entrepreneurship 18 Baumol 1990 Vivarelly 2013 Thurik et al 2013 19Bjoslashrnskov amp Foss 2010 Goel et al 2015 20 Bhola Verheul Thurik amp Grilo 2006 Tumasjan amp Braun 2012 Autio et al (2014) 21 Papagiannidis amp Li 2005 Dutta amp Merenda 2011 Ibrahim amp Masrsquoud 2016 22 Caliendo Fossen amp Kritikos 2009 Vieider et al 2015 23 Shane amp Cable 2003 Mian and Hattab 2013 Audretsch et al 2015 24 Guiso Sapienza amp Zingales 2006 Lee et al 2011 Dutta amp Sobel 2016 25 Da Rin et al 2011 Asoni amp Sanandaji 2014 Belitski et al 2016 26 Coad amp Rao 2008 Garciacutea-Morales et al 2014 27 Bates 1990 Qian 2016 28 Baumol Litan amp Schramm 2007 Calcagno amp Sobel 2014 29 Autio et al 2014 Grimpe amp Hussinger 2013 Audretsch et al 2014b 30 Stam amp Wennberg 2009 Audretsch et al 2014a Garud et al 2014 31 Acs Parsons amp Tracy 2008 Gompers amp Lerner 2004 Croce et al 2013 Wright amp Stigliani 2013 32 De Clercq Sapienza amp Crijns 2005 McDougall-Covin et al 2014 33 Groh Liechtenstein amp Lieser 2012 Lee et al 2015
How to read these pages
0 10 20 30 40 50 60 70
1 Opportunity Perception2 Startup Skills3 Risk Acceptance4 Networking5 Cultural Support6 Opportunity Startup7 Technology Absorption8 Human Capital9 Competition10 Product Innovation11 Process Innovation12 High Growth13 Internationalization14 Risk Capital
2468
2228
1643
3022
3116
3323
18
6
Component scores
Individual score entrepreneurial qualities of the people in the ecosystem
24
0 100Scores
Institutional scorequality of the institutionsthat supportentrepreneurship
3857
Albania
m
Overall GEI score
Global Rank83 of 137
n
Strongest area Weakest areaStartup Skills Risk Acceptance
Country name What rank is this country out of the 137 countries in the 2018 GEI Lower ranks indicate beerperformance
Which of the 14 ecosystem components does this country do the best at
Which of the 14 ecosystem components should the country focus on first to improve the fastest
How does the country score on each of the 14 entrepreneurshipecosystem components Longer bars represent higher scores All scores are shown as percentages
What is the countryrsquos overall GEI score Higher scores are beer and are shown in more intense green All scores are shown as percentages
How does the country score on the half of GEI indicators that represent individuals Higher scores are beer and are shown in more intense green All scores are shown as percentages
How does the country score on the half of GEI indicators that represent instuons
What do the shades of green represent More intense green indicates beer scores
What does each component measure
1 Opportunity Percepon - Can the populaon idenfy opportunies to start a business and does the instuonal environment make it possible to act on those opportunies2 Startup Skills - Does the populaon have the skills necessary to start a business based on their own percepons and the availability of terary educaon3 Risk Acceptance - Are individuals willing to take the risk of starng a business Is the environment relavely low risk or do unstable instuons add addional risk to starng a business4 Networking - Do entrepreneurs know each other and how geographically concentrated are their networks5 Cultural Support - How does the country view entrepreneurship Is it easy to choose entrepreneurship or does corrupon make entrepreneurship difficult relave to other career paths6 Opportunity Percepon - Are entrepreneurs movated by opportunity rather than necessity and does governance make the choice to be an entrepreneur easy7 Technology Absorpon - Is the technology sector large and can businesses rapidly absorb new technology8 Human Capital - Are entrepreneurs highly educated well trained in business and able to move freely in the labor market9 Compeon - Are entrepreneurs creang unique products and services and able to enter the market with them10 Product Innovaon - Is the country able to develop new products and integrate new technology11 Process Innovaon - Do businesses use new technology and are they able access high quality human capital in STEM fields12 High Growth - Do businesses intend to grow and have the strategic capacity to achieve this growth13 Internaonalizaon - Do entrepreneurs want to enter global markets and is the economy complex enough to produce ideas that are valuable globally14 Risk Capital - Is capital available from both individual and instuonal investors
- About The Global Entrepreneurship and Development Institute
- Forward A Compass for Strengthening Entrepreneurship Ecosystems
- The table below shows the rank of each country in the 2018 Index
- The Asia-Pacific region shows greatest strength in Human Capital and Product Innovation ndash on average countries in the Asia-Pacific region have highly educated populations that are well trained in business and able to move freely in the labor market
- The regionrsquos lowest scores on average are in the area of Risk Acceptance If countries in the region improve their overall risk profile as well as the populationsrsquo attitudes towards taking risks it is likely that the entrepreneurship ecosystems in th
- Tech giants dominate the regionrsquos top ranks while lower income agriculture and manufacturing-dependent economies are found closer to the bottom Emerging hotspots for the digital economy are found near the middle of regional ranks China and South K
-
- The pillars of entrepreneurship in the ecosystem are many and complex While a widely accepted definition of entrepreneurship is lacking there is general agreement that the concept has numerous dimensions17F We take this into account in creating th
-

18
Example Beleza Natural which started with a single salon in 1993 in San Paulo Brazil currently operates 29 salons and a cosmetics research lab produces a full line of hair-care products and employs 1400 people In 2012 the companyrsquos revenue was more than $30 million Beleza Natural is interesting because it focused its activities on the demand of an overlooked group in this case low-income women at the bottom of the pyramid By offering ldquoaffordable luxuriesrdquo in the form of hair treatment and the salon experience Beleza Natural was tapping into the so-called ldquolipstick economyrdquo However as is the case for other successful female entrepreneurs Beleza Natural aspired to provide greater benefits to its clients and employees The companys business objectives extend to broader social and environmental benefits1 A second aspect of our definition of entrepreneurship regards the level of technology In the West innovation is used synonymously with technology The heroes in the West are Zuckerberg Jobs and other Silicon Valley stalwarts Our definition is open to non tech innovators like Oprah and Bowker Starbucks serves a centuries old drink coffee but it introduced a coffee shop experience that is now in every corner of the world When you go into Starbucks and there is a long line it disappears in just a few minutes That is process innovation and very much an example of a non tech entrepreneur McDonalds did the same for the hamburger Enterprise Rent a Car did it for car rentals and today employs thousands of people worldwide Uber did it for taxicabs They did not invent taxis They have been around forever They invented a new process What low tech entrepreneurship does is increase efficiency how quickly you can serve a cup of coffee Entrepreneurial Ecosystem Elements
Ever since the time of Schumpeter the concepts of entrepreneurship and innovation have been intertwined with economic development The Global Entrepreneurship Index is an important tool to help countries accurately assess and evaluate their ecosystem to create more jobs The entrepreneurial ecosystem is a new way to contextualize the increasingly complex and interdependent social systems being created2 While the academic literature kept agency institutions and systems in separate silos the real communities that practitioners worked in had no such silos and the different building blocks all built upon each other in a
single unified structure Business books such as Brad Feldrsquos Start-up communities Building an entrepreneurial ecosystem in your city Daniel Isenbergrsquos Harvard Business Review article What an entrepreneurship ecosystem actually is and Steven Koltai Peace through Entrepreneurship Investing in a Start-up Culture for Security and Development started to suggest that reality was nuanced In order to better understand entrepreneurial ecosystems letrsquos start with a few definitions3 A system is an organized set of interacting and interdependent subsystems that function together as a whole to achieve a purpose In general an ecosystem is a purposeful collaborating network of dynamic interacting systems and subsystems that have an ever-changing set of dependencies within a given context4 First an ecosystem as opposed to a system has both living and non-living components Otherwise itrsquos a system like national systems of innovation In addition there are outcomes of the ecosystem that the literature calls ecosystem services and there is ecosystem management The point of this line of research is that it is not just the abundance or endowment of particular key factors of production or resources that shape economic performance it is also the manner in which that economic activity is configured or organized within geographic space The most carefully worked out approach to entrepreneurial ecosystems is associated with Acs Szerb and Autio This line of research recognizes that it is not just the abundance or endowment of particular key factors of production or resources that shape economic performance it is also the manner in which that economic activity is configured or organized within geographic space and the role of entrepreneurship in bringing it to life While the entrepreneurial ecosystem literature does not challenge the efficacy of these other dimensions of spatial organization and structure such as clusters specialization diversity market power or localized competition it suggests that entrepreneurship is also a key dimension enhancing economic performance Entrepreneurial ecosystems are composed of sub-systems (pillars) that are aggregated into systems (sub- indices) that can be optimized for system performance at the ecosystem level There is a growing recognition in the entrepreneurship literature that entrepreneurship
19
theory focused only on the entrepreneur may be too narrow The concept of systems of entrepreneurship is based on three important premises that provide an appropriate platform for analyzing entrepreneurial ecosystems First entrepreneurship is fundamentally an action undertaken and driven by agents on the basis of incentives Second the individual action is affected by an institutional framework conditions Third entrepreneurship ecosystems are complex multifaceted structures in which many elements interact to produce systems performance thus the index method needs to allow the constituent elements to interact However because the elements are different in each case there is no one size fits all solution Each one is bespoke The Global Entrepreneurship Ecosystem
We define entrepreneurial ecosystems at the socio-economic level having properties of self-organization scalability and sustainability as ldquohellipdynamic institutionally embedded interaction between entrepreneurial attitudes abilities and aspirations by individuals which drives the allocation of resources through the creation and operation of new venturesrdquo 5 Entrepreneurial Ecosystems are complex socioeconomic structures that
are brought to life by individual-level-action Much of the knowledge relevant for entrepreneurial action is embedded in ecosystem structures and requires individual-level-action to extract it 6 The structure of the entrepreneurial ecosystem is illustrated in Figure 1 Nascent and new entrepreneurs are at the heart of the system Nascent entrepreneurs are individuals in the process of launching a new venture These entrepreneurs represent a sub-set of the adult population in a given country The attitudes that prevail within the wider population influence who chooses to become an entrepreneur The nascent and new entrepreneurs are characterized by varying degrees of ability and entrepreneurial aspirations It is the entrepreneurs who drive the trial and error dynamic This means entrepreneurs start businesses to pursue opportunities that they themselves perceive However entrepreneurs canrsquot tell in advance if opportunities are real or not The only way to validate an opportunity is to pursue it The outcome is a trial and error process
Figure 1 The Entrepreneurial Ecosystem Configuration
The entrepreneurial framework conditions matter because they regulate first who chooses to become an entrepreneur and second to what extent the resulting
new ventures are able to fulfill their growth potential The first aspectmdashentrepreneurial choicemdashis regulated mostly by soft framework conditions such as social
Entre-preneurs
23
norms and cultural preferences The degree to which new ventures are able to fulfill their potential is regulated by a range of entrepreneurial framework conditions such as government research and development education infrastructure financial sector and the corporate sector A healthy entrepreneurial ecosystem will drive resource allocation towards productive uses It will also drive total factor productivity through process innovation (Starbucks) The greater total factor productivity the greater the economyrsquos capacity to create jobs and wealth Agents
The first component of entrepreneurial ecosystems is agency The entrepreneur drives the system The entrepreneur is someone who makes judgment-based decisions about the coordination of scarce resources The term ldquosomeonerdquo is defined as the individual and the term ldquojudgment-based decisionsrdquo are decisions for which no obviously correct procedure exists Judgement is not the routine application of a standard rule As we discussed above we distinguish two types of entrepreneurial activity at one pole there is routine entrepreneurship which is really a type of management and for the rest of the spectrum we have high growth entrepreneurship By routine entrepreneurship we mean the activities involved in coordinating and executing a well-established ongoing concern in which the parts of the production function in use are well known and that operates in well-established and clearly defined way This includes the self-employment and small business owner It is the next taco stand garage or hair dresser It is certainly the case that replicative entrepreneurs can be of great social value However these types of firms are not what we mean by ecosystem services7 By high-impact entrepreneurship we mean the activities necessary to create an innovative high-growth venture where not all the markets are well established or clearly defined and in which the relative parts of the production function are not completely known Innovative entrepreneurs ensure that utilization of invention contributes to increased productivity and facilitates and contributes to economic growth The gap-filling and input-completing capacities are the unique characteristics of the entrepreneur
Institutions
The second fundamental component of Entrepreneurial Ecosystems is institutionsmdashthe rules of the game Of particular importance to entrepreneurship are the economic institutions in society such as the structure of property rights and the presence of effective market frameworks (North 1990) Economic institutions are important because they influence the structure of economic incentives Without property rights individuals will not have the incentive to invest in physical or human capital or adopt more efficient technologies Economic institutions are also important because they help to allocate resources to their most efficient uses they determine who gets profits revenues and residual rights of control When markets were highly restricted and institutions sent the wrong signals there is little substitution between labor and capital and technological change is minimal Institutions create incentives and that the entrepreneurial talent is allocated to activities with the highest private return which need not have the highest social returns Universal welfare-enhancing outcomes do not automatically follow from entrepreneurial activity indeed such activities can generate questionable or undesirable effects Entrepreneurial talent can be allocated among a range of choices with varying effects from wealth-creation to destruction of economic welfare If the same actor can become engaged in such alternative activities then the mechanism through which talent is allocated has important implications for economic outcomes and the quality of this mechanism is the key criterion in evaluating a given set of institutions with respect to growth We follow many others for example Hayek in proposing that the answer rests upon the institutional system and the incentives that it creates for agents yet we differ in simultaneously stressing the role of entrepreneurs In the United States institutions of private property and contract enforcement gives entrepreneurs the incentive to invest in physical and human capital to combine inputs in ways to create new production functions and to complete markets It is entrepreneurs operating in supportive institutional environments that provide the transmission mechanism from knowledge to economic growth by raising productivity
24
The System
The third component of entrepreneurial ecosystems is the systems When we look at systems for example systems of innovation or clusters we have a theory of how the system functions as it produces outputs Porterrsquos Diamond comes to mind When we move to an ecosystem we also need to have a theory of how the ecosystem functions How does an entrepreneurial ecosystem function It is not enough to have a laundry list of the institutions that might be important markets human capital supports culture finance and policy While all of these may be important how they work as an ecosystem is missing in much of this literature Building on the Systems of Innovation literature and the Global Entrepreneurship Monitor methodology we develop an entrepreneurial ecosystem that integrates both institutions and agency and introduce an ecosystem of coherent patterns in a simple intuitive and powerful way The key ideas are the relationships the complementary across the systems and subsystems and the importance of bottleneck factors The concept of complementary in its simplest way is the interaction of two variables Two choice variables are complements when doing more of one of them increases the returns to doing more of the other Ecosystem Services
While many think of the output of ecosystems as more startups like GEM this is wrong and misleading The dual service created by entrepreneurial ecosystems is (1) resource allocation towards productive uses and (2) the innovative high-growth ventures that drive this process The entrepreneurship literature frequently talks about opportunity recognition and the need to assemble resources However from a performance perspective the key issue is about resource allocation from existing activities to new ones The allocation of resources to productive uses will result in high growth high value new firms The nutrient in the ecosystem is resourcesmdashventure capital Without nutrients the ecosystem will die For example the launch of Uber and AirBnB early this decade and the earlier success of Google Amazon Facebook Twitter Skype WhatsApp Craigrsquos List created a new breed of company The billion-dollar tech startup was once the stuff of myth but now they seem to be everywhere backed by a bull market readily available venture capital and a new generation of disruptive technology8
Ecosystem Management
In the ecological literatures the practice of managing and enhancing ecosystem benefits is referred to as ecosystem management Because ecosystem services is created through a myriad of localized interactions between stakeholders it is not easy to trace gaps in system performance back to specific well-defined market and structural failures that could be addressed in a top-down mode 9 Strengthening the entrepreneurial ecosystem can be done by public private partnerships banks universities foundations governments and aid agencies The Global Entrepreneurial Ecosystem Roadmap (GEER) focuses on the first aspect of this project that is (1) identifying the holes in the global entrepreneurship ecosystem (2) laying out a roadmap for how to fill in the holes and (3) measuring our progress The goal of a well-functioning ecosystem is to improve the chances of success for entrepreneurs all over the world And ultimately reduce unemployment and bring peace to the world
25
The Entrepreneurial Ecosystem and Global Prosperity Introduction
While a focus on the entrepreneurial ecosystem may seem a novel approach to development it is consistent with and even complementary to older more traditional development strategies As developing economies move from centralized economies to market economies enterprise and entrepreneurship become important ldquoThe emerging world long a source of cheap labor now rivals developed countries for business innovation Developing countries are becoming hotbeds of business innovation in much the same way as Japan did from the 1950s onwardsrdquo10 Entrepreneurship is considered an important mechanism that promotes economic development through employment innovation and welfare but it does not appear like manna from heaven as a country moves through the stages of development Rather it plays a role in all development stages and is a process that continues over many years Economists have come to recognize the ldquoinput-competingrdquo and ldquogap-fillingrdquo capacities of entrepreneurial activity in development11 In other words someone has to create the technology for new products and create the markets where people will buy them Two points are important when thinking about entrepreneurship and development First contrary to popular belief the most entrepreneurial countries in the world are not those that have the most entrepreneurs This notion is in fact misleading In fact the highest self-employment rates are in low-income countries such as Zambia and Nigeria This is because low-income economies lack the human capital and infrastructure needed to create high-quality jobs The result is that many people sell soft drinks and fruit on street corners but there are few innovative high-growth startups Nor do these street vendors represent business ownership as defined in many developed countries In entrepreneurship quality matters more than quantity To be entrepreneurial a country needs to have the best entrepreneurs not necessarily the most What the ldquobest and the brightestrdquo do is important and to support their efforts a country needs a well-functioning entrepreneurial ecosystem (watch the video)12 The path to development is to create efficient organizations able
to harness technology to increase output and improve the lives of millions Second entrepreneurship comes in productive unproductive and destructive forms While productive entrepreneurship makes both entrepreneurs and society better off unproductive and destructive entrepreneurship make entrepreneurs better off but leave society in worse condition The GEI strives to measure only productive entrepreneurship that both creates wealth and is scalable Entrepreneurial ecosystems support innovative productive and rapidly growing new ventures They consist of multiple interactive elements all of which need to be in sync in order for innovative and high-growth firms to prosper Such firms also need skilled employees They need access to technology They need a well-functioning infrastructure They need specialized advice and support They need access to finance They need business premises They need a supportive regulatory framework Country-level Productivity and the Entrepreneurial Ecosystem
Economic growth does not equal to productivity Economic growth basically refers to the capacity of countries to produce more goods and services irrespective of how higher production is achieved The positive variations in GDP or employment over time are the usual suspects among those interested in studying economic growth figures mostly because they represent the desired objective of most policy makers as a measure of economic prosperity Productivity is a more complex concept At the country level total factor productivity (TFP) deals with two highly interconnected economic aspects First TFP has to do with the capacity of countries to allocate and exploit available resources efficiently (P = productivity effect) The notion that markets are good at directing resources is a good catch-all explanation concept but for many businesses it is hard to find all that is required to perform in the market and to keep the pace of industrial and digital revolutions that not only equip businesses with newmdashoften more technologically advancedmdashresources but also change the ways to exploit them
26
The second component of TFP deal with the capacity of organizations to channel innovations to the economy (I = innovation effect) that consequently translate into higher levels of output per input unit (in the case of countries GDP per worker) Maybe we all are too used to link innovation to technological inventions that are successfully commercialized However our definition of innovation is not restricted to engineering (such as the driverless car) or to medical advances (such as nerve stimulation or non-invasive procedures) and is open to other equally valuable types of non-technological innovations related to product and processes Letrsquos start with the productivity effect (P) The efficient allocation of resources available in the economy is an important part of the productivity function The productivity effect is linked to how well new and existing businesses use different resources including labor capital equipment knowledge and technology-based inputs The capacity of Amazon to amalgamate technologies brought from other industries (for example ICTs drones) to increase the productivity of its operations (delivery Amazon Fresh or Amazon Prime Air) is a good example13 From the perspective of the entrepreneurship ecosystem better institutions backing entrepreneurial activities and an efficient interaction between individual actions and the institutional setting governing entrepreneurial decisions are key ingredients necessary to facilitate the creation of businesses with a greater capacity to generate jobs and help incumbent businesses to take advantage of better market conditions For example in many European countries entrepreneurs have strong incentives to invest in physical and human capital and to promote the exploitation of resources in an effort to improve the functioning of their businesses In this case the supportive institutional environment creates the conditions to promote operational improvements In other words entrepreneurial ventures have incentives to lsquodo things betterrsquo that is to improve their productivity To sum up a healthy entrepreneurial ecosystem contributes to national productivity by enhancing market efficiency levels and by promoting the efficient exploitation of resources through new and incumbent businesses14
The second effectmdashinnovation (I)mdashis strictly linked to the Schumpeterian approach to entrepreneurship (creative destruction)15 For Schumpeter entrepreneurs play a decisive role in the economy by creating and implementing radical innovations that are conducive to economic progress In this tradition entrepreneurship is critical to spark economic development by promoting innovations in our terminology lsquocreate new things or find new ways to do thingsrsquo Progress translates in the expansion of the countriesrsquo production possibilities that materializes in a shift of the global frontier But at this point is worth questioning how can radical innovations foster such progress Moreover how does the entrepreneurial ecosystem contribute to this progress It seems logical to argue that inventions are worthless is they do not turn into commercialized innovations and that the economic impact of such innovations will turn sterile if the market and individuals cannot fully incorporate these innovations in their day-to-day routines For Schumpeter entrepreneurs nurture the economy with innovations and the entrepreneurial ecosystem is critical for the development of this economic function lsquocreate new things or find new ways to do thingsrsquo If countries enjoy a healthy entrepreneurial ecosystem the efforts of innovative entrepreneurs will materialize in new value-adding combinations of resources that will expand the countriesrsquo productive capacity and the global production frontier We found a significant relatively strong positive correlation between entrepreneurship and total factor productivity (035) We also noted that entrepreneurship correlates weakly positively with the productivity effect (009) (Table 11) Table 1 The correlations between GEI total factor productivity and its components
Variables Correlation GEI vs total factor productivity 03513 GEI vs productivity effect 00930 GEI vs innovation effect 03882
The strongest positive correlation was found between entrepreneurship and the innovation effect (039) This result is not surprising if we think a little harder Just like we cannot imagine progress in the 19th century without the creation and development of steam engines it is hard to imagine entrepreneurship in the 21st century without the power of technology-driven inventions With
27
the new millennium industries and markets from all around the globe are witnessing drastic transformations that are the result of a digital revolution in which entrepreneurs are taking an active role by creating new businesses that are responsible of this revolution The result is a good sign that reinforces our argument that the creation of lsquonew things or new ways to do thingsrsquo definitely constitutes the vital force driving economic development Figure 2 plots the GEI score and the computed total factor productivity values The correlation between TFP
and GEI is 035 and the sign is positive (see Table 1) From the Figure 2 we verify that the quality of the entrepreneurial ecosystem (GEI scores) and TFP move in the same direction Countries with a low-quality entrepreneurial ecosystem tend to show negative TFP values below unity On contrary all developed economies with supportive entrepreneurial ecosystems improve their total factor productivity either by productivity or innovation effects
Figure 2 GEI and total factor productivity
Figures 13 and 14 plot the relationship between the GEI index and the productivity and innovation effects respectively There is a positive association between entrepreneurship and the productivity effect (correlation = 009) however this relationship is less pronounced than that found for the TFP This result may well be partly explained by the differentiating impact of entrepreneurship over the productivity effect across economies We observe that the correlation between
entrepreneurship and the productivity effect scores the highest among factor driven countries (047 in Table 43) Also from Figure 13 we note that in many underdeveloped and developing territories with low- and mid-level entrepreneurial ecosystem the productivity effect is positive while the result of the productivity effect for some developed economies is negative
10 20 30 40 50 60 70 80 90
GEI
094
096
098
1
102
104
106
108
TFP
Denmark
Canada
USA
UK
Singapore
Uganda
China
Ghana
IndiaPeru
Germany
NetherlandsFrance
Angola
Zambia
Malawi Guatemala
Hungary
Japan
Korea
Finland
Norway
Sweden
LithuaniaR-square = 01234
28
Thus our results suggest that in developing economies the entrepreneurial ecosystem plays a much more decisive role on TFP via productivity improvements that
is helping new and established businesses in developing economies to better exploit their limited resources that is lsquoto lsquodo things betterrsquo
Figure 3 GEI and the productivity effect
The picture is quite different when we look at the results for the innovation effect The data in Table 13 show how the correlation between entrepreneurship and the innovation effect progressively increases as we move from factor-driven (correlation = -041) to innovation-driven economies (correlation = 033) Similarly the impact of the innovation effect is much more potent in innovation-driven economies (155) than in efficiency-driven (117) and in factor-driven economies (-059) This trend is corroborated by the results in Figure 44 in which we observe a steeper relationship between the
GEI scores and the innovation effect In contrast to the stronger effect of the entrepreneurial ecosystem over productivity in developing countries we found that the positive influence of a healthy entrepreneurial ecosystem over the innovative capacity of new and established businesses is much more powerful in developed economies With the exception of Turkey the innovation effect linked to the efficient commercialization of innovations and new technologies is positive in all economies with high quality entrepreneurial ecosystems (GEIgt 50)
10 20 30 40 50 60 70 80 90
GEI
092
094
096
098
1
102
104
106
Prod
uctiv
ity e
ffect
Uganda
Malawi Guatemala
Ghana
Angola
Peru
China
Macedonia
Hungary
Japan
Korea
Finland
Norway
Netherlands
Germany
France
Singapore
Lithuania
UK
USA
Denmark
Sweden
India
Trinidad amp Tobago
Botswana R-square = 00486
Zambia
Canada
29
Figure 4 GEI and the innovation effect
Based on the relationships reported above the improvement of the entrepreneurial ecosystem (GEI scores) may well yield to improvements in total factor productivity via the enhanced capacity of businesses to use their available resources (productivity effect) and to exploit the market potential of new technologies and
innovations As a result if every of the 64 analyzed countries raised its GEI score by 10 the global total factor productivity will increase 022 TFP points which represents an estimated improvement of 158016
10 20 30 40 50 60 70 80 90
GEI
094
096
098
1
102
104
106
Inno
vatio
n ef
fect
R-square = 01507
Uganda
Malawi
Guatemala
Angola
India
China
Botswana
HungaryJapan
Korea
Lithuania
Finland
Singapore
UK
Sweden
Denmark
USA
Canada
Norway
Netherlands
Zambia Peru
Ghana
Germany
30
The Global Entrepreneurship Index In depth
The Global State of Entrepreneurship
The GEI measures both the quality of entrepreneurship in a country and the extent and depth of the supporting entrepreneurial ecosystem
The top ten countries for 2018 show a pattern similar to last yearrsquosmdashhigh-income mostly European nations The top countries are the United States Switzerland Canada
the United Kingdom Australia Denmark Iceland Ireland Sweden and France The major surprise this year is the movement of the UK from 8th place to 4th place and the movement of Sweden from 4th place to 9th place Because the scores in the highest range are so close small changes in score from one year to the next can produce a relatively large shift in ranks among the top ten For this reason we present confidence intervals for the top ten
Top Ten Countries
Table 2 Top Ten Countries in the GEI
Country GEI 2018 lower limit
GEI 2018 upper limit
GEI 2018 Rank 2018
GEI Rank 2017
United States 775 897 836 1 1
Switzerland 725 884 804 2 2
Canada 739 846 792 3 3
United Kingdom 736 819 778 4 8
Australia 690 820 755 5 7
Denmark 648 838 743 6 5
Iceland 636 847 742 7 6
Ireland 668 806 737 8 9
Sweden 671 791 731 9 4
France 599 771 685 10 13
Figure 5 Confidence Intervals for Top Ten Scores
The results show that the No 1 rank could have gone to any of the top ten nations with the exception of France We see that Switzerland has a confidence
interval similar to the United States
599671668
636648
690736739
725775
771791806
847838
820819
846884897
00 200 400 600 800 1000
FranceSwedenIrelandIceland
DenmarkAustralia
United KingdomCanada
SwitzerlandUnited States
31
Regional Performance
For many countries a regional benchmark is more relevant for identifying best practices for fostering entrepreneurship This year we have several important
changes in Europe Sub-Saharan Africa and the MENA countries Below we present the top performer in each region along with individual and institutional score summaries
Table 3 Top Scores by Region
World rank Country Region GDP per capita PPP Individual variables Institutional variables GEI
1 United States North America $52676 930 785 836
2 Switzerland Europe $54933 938 715 804
5 Australia Asia-Pacific $42149 822 743 755
16 Israel Middle East North Africa $31092 809 727 654
19 Chile South and Central America Caribbean $21302 689 759 585
52 Botswana Sub-Saharan Africa $15286 477 660 349
The United States leads the world in entrepreneurship and is first in the North American region just ahead of peer Canada Australia ranks first in the Asia-Pacific region ahead of economic powerhouses China Singapore Hong Kong and Japan Switzerland which ranked fourth in the European region and eighth overall last year now comes in first in Europe Chile ranks first in
South and Central America and the Caribbean (19th overall) 22 places ahead of the next highest scorer in the regionmdashPuerto Rico at 41st Israel is 16th overall and tops the MENA region just ahead of Qatar at 22nd In Sub-Saharan Africa Botswana is the leader at 52nd ranking ahead of nine European nations
Biggest Gains
Table 4 Biggest Gains in GEI Score
Country Score 2018 Score 2017 Difference in Score Difference in Rank
United Kingdom 778 712 65 4
Israel 654 594 60 1
Bulgaria 278 227 51 13
China 411 361 50 5
Iran 268 221 47 13
Italy 414 371 43 4
Poland 504 465 39 1
Canada 792 755 37 0
Ireland 737 702 35 1
Korea 542 507 35 3
Note The table above includes only those countries that have participated in the GEM survey and do not have estimated individual data
32
Biggest Declines
Table 5 Biggest Declines in GEI Score (among countries with decreases in GEI score)
Country Score 2018 Score 2017 Difference in Score Difference in Rank
Latvia 405 430 -25 -6
Sweden 731 752 -21 -5
Taiwan 595 610 -15 -2
Malaysia 327 334 -07 -4
Ecuador 205 209 -04 -5
Chile 585 589 -04 -1
Kazakhstan 297 300 -03 -2
Indonesia 210 211 -01 -4
Note The above table includes only those countries that have participated in the GEM survey and do not have estimated individual data
The 14 Pillars of an Entrepreneurial Ecosystem
The pillars of entrepreneurship in the ecosystem are many and complex While a widely accepted definition of entrepreneurship is lacking there is general agreement that the concept has numerous dimensions17 We take this into account in creating the entrepreneurship index Some businesses have a larger impact on markets create more new jobs and grow faster and become larger than others We also take into account the fact that entrepreneurship plays a different role at different stages of development18 Considering all of these possibilities and limitations we define entrepreneurship as ldquothe dynamic institutionally embedded interaction between entrepreneurial attitudes entrepreneurial abilities and entrepreneurial aspirations by individuals which drives the allocation of resources through the creation and operation of new venturesrdquo
The GEI is composed of three building blocks or sub-indicesmdashwhat we call the 3As entrepreneurial attitudes entrepreneurial abilities and entrepreneurial
aspirations Entrepreneurial attitudes are about how a country thinks about entrepreneurship In fact what does your mother think about it The second sub index
GLO
BAL
ENTR
EPRE
NEU
RSH
IP IN
DEX
Sub-indexes Pillars Variables (individual institutional)
ATTITUDES SUB-INDEX
OPPORTUNITY PERCEPTION
OPPORTUNITY RECOGNITION FREEDOM (ECONOMIC FREEDOM PROPERTY RIGHTS)
STARTUP SKILLS SKILL PERCEPTION EDUCATION (TERTIARY EDUCATIONQUALITY OF EDUCATION)
RISK ACCEPTANCE RISK PERCEPTION COUNTRY RISK
NETWORKING KNOW ENTREPRENEURS AGGLOMERATION (URBANIZATIONINFRASTUCTURE )
CULTURAL SUPPORT CAREER STATUS CORRUPTION
ABILITIES SUB-INDEX
OPPORTUNITY STARTUP OPPORTUNITY MOTIVATION GOVERNANCE (TAXATIONGOOD GOVERNANCE)
TECHNOLOGY ABSORPTION
TECHNOLOGY LEVEL TECHNOLOGY ABSORPTION
HUMAN CAPITAL EDUCATIONAL LEVEL LABOR MARKET (STAFF TRAININGLABOUR FREEDOM)
COMPETITION COMPETITORS COMPETETIVNESS (MARKET DOMINANCEREGULATION)
ASPIRATION SUB-INDEX
PRODUCT INNOVATION NEW PRODUCT TECH TRANSFER
PROCESS INNOVATION
NEW TECHLOLOGY SCIENCE (GERD(AVERAGEQUALITY OF SCIENTIFICAL INSTITUTIONS +AVAILABILITY OF SCIENTISTS AND ENGENEERS))
HIGH GROWTH GAZELLE FINANCE AND STRATEGY (VENTURE CAPITALBUSINESS SOPHISTICATION)
INTERNATIONALIZATION EXPORT ECONOMIC COMPLEXITY
RISK CAPITAL INFORMAL INVESTMENT DEPTH OF CAPITAL MARKET
Figure 6 The Structure of the Global Entrepreneurship Index
33
is about abilities Can you do it Do you have the skills The third sub index is about aspirations Do you want to build a billion-dollar company These three sub-indices stand on 14 pillars each of which contains an individual and an institutional variable that corresponds to the micro- and the macro-level aspects of entrepreneurship Unlike other indexes that incorporate only institutional or individual variables the pillars of the GEI include both These pillars are an attempt to capture the open-ended nature of entrepreneurship analyzing them can provide an in-depth view of the strengths and weaknesses of those listed in the Index We now describe the 14 pillars of entrepreneurship
Entrepreneurial Attitudes Pillars
Pillar 1 Opportunity Perception This pillar captures the potential ldquoopportunity perceptionrdquo of a population by considering the state of property rights and the regulatory burden that could limit the real exploitation of the recognized entrepreneurial opportunity Within this pillar is the individual variable Opportunity Recognition which measures the percentage of the population that can identify good opportunities to start a business in the area where they live However the value of these opportunities also depends on the size of the market The institutional variable Freedom and Property consists of two smaller variables economic freedom (Economic Freedom) and property rights (Property Rights) Business Freedom ndash one sub-index of the Index of Economic Freedom variable ndash is appropriate for capturing the overall burden of regulation as well as the governmentrsquos regulatory efficiency in influencing startups and operating businesses ldquoThe property rights element is an assessment of the ability of individuals to accumulate private property secured by clear laws that are fully enforced by the staterdquo or in other words enforced property rights guarantee that individuals have the right to harvest the fruits of successful opportunity exploitation and no one is confiscating or stealing their property or business19 Both institutional components are vital for individuals to become entrepreneurs and not employees of another business or the state 20
Pillar 2 Startup Skills Launching a successful venture requires the potential entrepreneur to have the necessary startup skills Skill Perception measures the percentage of the population who believe they have adequate startup skills Most people in developing countries think they have the skills needed to start a
business but their skills were usually acquired through workplace trial and error in relatively simple business activities In developed countries business formation operation management etc require skills that are acquired through formal education and training Hence education especially postsecondary education plays a vital role in teaching and developing entrepreneurial skills Today there are 150 million students enrolled in some kind of education beyond high school a 53 percent increase in less than a decade People all over the world see education as a pathway out of poverty 21
Pillar 3 Risk Acceptance Of the personal entrepreneurial traits fear of failure is one of the most important obstacles to a startup Aversion to high-risk enterprises can retard nascent entrepreneurship Risk Perception is defined as the percentage of the population who do not believe that fear of failure would prevent them from starting a business Country Risk reflects to transfer and convertibility risk of a country and believed to closely correlate to business 22
Pillar 4 Networking Networking combines an entrepreneurrsquos personal knowledge with their ability to connect to others in a country and the whole world This combination serves as a proxy for networking which is also an important ingredient of successful venture creation and entrepreneurship Entrepreneurs who have better networks are more successful can identify more viable opportunities and can access more and better resources We define the basic networking potential of a possible entrepreneur by the percentage of the population who personally know an entrepreneur who started a business within two years (Know Entrepreneurs) The connectivity variable has two components One that measures the urbanization (Urbanization) of the country and the other measuring the quality of the transport infrastructure (Infrastructure)23
Pillar 5 Cultural Support This pillar is a combined measure of how a countryrsquos inhabitants view entrepreneurs in terms of status and career choice and how the level of corruption in that country affects this view Without strong cultural support the best and brightest do not want to be responsible entrepreneurs and they decide to enter a traditional profession Career Status is the average percentage of the population age 18-64 who say that entrepreneurship is a good career choice and enjoys high status The associated
34
institutional variable measures the level of corruption High levels of corruption can undermine the high status and steady career paths of legitimate entrepreneurs24
Entrepreneurial Abilities Pillars
Pillar 6 Opportunity Startup This is a measure of startups by people who are motivated by opportunity but face red tape and tax payment An entrepreneurrsquos motivation for starting a business is an important signal of quality Opportunity entrepreneurs are believed to be better prepared to have superior skills and to earn more than what we call necessity entrepreneurs Opportunity Motivation is defined as the percentage of the Total Entrepreneurial Activity (TEA) businesses started to exploit a good opportunity to increase income or to fulfill personal aims in contrast to those started by people who have no other options for work The overall effectiveness of the government services is measured by the Good Governance variable and the cost of the governance is by the level of overall taxation (Taxation) The variable is a combination of these two components government service quality and costs25
Pillar 7 Technology Absorption In the modern knowledge economy information and communication technologies (ICT) play a crucial role in economic development Not all sectors provide the same chances for businesses to survive and or their potential for growth The Technology Level variable is a measure of the businesses that are in technology sectors The institutional variable Tech Absorption is a measure of a countryrsquos capacity for firm-level technology absorption as reported by the World Economic Forum The diffusion of new technology and the capability to absorb it is vital for innovative firms with high growth potential26
Pillar 8 Human Capital The prevalence of high-quality human capital is vitally important for ventures that are highly innovative and require an educated experienced and healthy workforce to continue to grow An important feature of a venture with high growth potential is the entrepreneurrsquos level of education The Educational Level variable captures the quality of entrepreneurs it is widely held that entrepreneurs with higher education degrees are more capable and willing to start and manage high-growth businesses The labor market possibilities and the capability to easily hire quality employees also have an impact on business development innovation and growth potential The
institutional variable Labor Market has two components Labor Freedom measures the freedom of the labor from the regulatory perspective and Staff Training is a countryrsquos level of investment in business training and employee development It can be expected that heavy investment in employees pays off and that training increases employee quality27
Pillar 9 Competition Competition is a measure of a businessrsquos product or market uniqueness combined with the market power of existing businesses and business groups and the effectiveness of anti-monopoly regulation The variable Competitors is defined as the percentage of TEA businesses that have only a few competitors offering the same product or service However market entry can be prevented or made more difficult if powerful business groups are dominating the market The extent of market dominance by a few business groups is measured by the variable Market Dominance a variable reported by the World Economic Forum The effectiveness of the regulatory bodies (Regulation) could also influence the level of competition in a country The Competition institutional variable is the combination of Regulation and Market Dominance28
Entrepreneurial Aspirations Pillars
Pillar 10 Product Innovation New products play a crucial role in the economy of all countries While countries were once the source of most new products today developing countries are producing products that are dramatically cheaper than their Western equivalents New Product is a measure of a countryrsquos potential to generate new products and to adopt or imitate existing products In order to quantify the potential for new product innovation an institutional variable related to technology and innovation transfer seems to be relevant Technology Transfer is a complex measure of whether a business environment allows the application of innovations for developing new products29
Pillar 11 Process Innovation Applying andor creating new technology is another important feature of businesses with high-growth potential New Tech is defined as the percentage of businesses whose principal underlying technology is less than five years old However most entrepreneurial businesses do not just apply new technology they create it The problem is similar to the New Product variable whereas many businesses in developing countries may apply the latest
35
technology they tend to buy or copy it An appropriate institutional variable applied here is complex measure combining research and development (RampD) the quality of scientific institutions in a country (Scientific Institutions) and the availability of scientists and engineers (Availability of Scientist) Gross Domestic Expenditure on Research and Development (GERD) is the RampD percentage of GDP as reported by OECD While RampD alone does not guarantee successful growth it is clear that without systematic research activity the development and the implementation of new technologiesmdashand therefore future growthmdashwill be inhibited The Science institutional variable combines together RampD potential with physical scientific infrastructure and science oriented human capital 30
Pillar 12 High Growth High Growth is a combined measure of the percentage of high-growth businesses that intend to employ at least 10 people and plan to grow more than 50 percent in five years (Gazelle variable) with business strategy sophistication (Business Strategy variable) and venture capital financing possibility (Venture Capital) It might be argued that a shortcoming of the Gazelle variable is that growth is not an actual but an expected rate However a measure of expected growth is in fact a more appropriate measure of aspiration than a measure of realized growth Business Strategy refers to ldquothe ability of companies to pursue distinctive strategies which involves differentiated positioning and innovative means of production and service deliveryrdquo High Growth combines high growth potential with a sophisticated strategy and growth specific venture capital finance31
Pillar 13 Internationalization Internationalization is believed to be a major determinant of growth A widely applied proxy for internationalization is exporting Exporting demands capabilities beyond those needed by businesses that produce only for domestic markets However the institutional dimension is also important a countryrsquos openness to international entrepreneursmdashthat is the potential for internationalizationmdashcan be estimated by its degree of complexityrdquo The complexity of an economy is related to the multiplicity of useful knowledge embedded in it Because individuals are limited in what they know the only way societies can expand their knowledge base is by facilitating the interaction of individuals in increasingly complex networks in order to make products We can measure economic complexity by the mix of these products that
countries are able to makerdquo The internationalization pillar is designed to capture the degree to which a countryrsquos entrepreneurs are internationalized as measured by the exporting potential of businesses controlling for the extent to which the country is able to produce complex products32
Pillar 14 Risk Capital The availability of risk finance particularly equity rather than debt is an essential precondition for fulfilling entrepreneurial aspirations that are beyond an individual entrepreneurrsquos personal financial resources33 Here we combine two kinds of finance the informal investment (Informal Investment) and the institutional depth of capital market (DCM) Informal Investment is defined as the percentage of informal investors in the population age 18-64 multiplied by the average size of individualsrsquo investment in other peoplersquos new businesses While the rate of informal investment is high in factor-driven economies the amount of informal investment is considerably larger in efficiency- and innovation-driven countries combining them balances these two effects Our institutional variable here is DCM one of the six sub-indices of the Venture Capital and Private Equity Index This variable is a complex measure of the size and liquidity of the stock market level of IPO MampA and debt and credit market activity which encompass seven aspects of a countryrsquos debt and capital market
The Global Entrepreneurship Index 2018 Rankings
In this section we report the rankings of the 137 countries on the Global Entrepreneurship Index and its three sub-indices We also provide confidence intervals for the GEIrsquos The confidence intervals calculations are based on the Global Entrepreneurship Monitor (GEM) Total Early-Phased Entrepreneurial Activity (TEA) confidence intervals Note that these confidence intervals only partially represent the potential measurement errors as we do not know the full error term In addition we do not have information about the confidence intervals of the 34 countries where we use estimated data In these cases the upper and the lower limits are the same
We present the rankings in terms of country development as measured by per capita GDP The overall ranking of the countries on the GEI is shown in Table 16 Like previous years Anglo-Saxon Nordic and Western European countries in the innovation-driven
36
stage of development are in the front ranks The United States Switzerland and Canada lead the rankings Three of the five Nordic countries Denmark Iceland and Sweden are in the top ten and effectively tied with the United States Hong Kong the highest Asian country is in 13th place and Taiwan is 18th Besides their high entrepreneurial performance these countries represent high income levels
Of the most populous EU countries only the United Kingdom and France place among the top 10 countries (4th and 10th) The other large European countries rank in the middle Germany is 15th Spain is 34th followed by Italy in 42nd place While the UK France and Germany are relatively well balanced over the 14 pillars
Poland Spain and Italy are entrepreneurially less efficient A likely explanation for the EU countriesrsquo relatively weak economic performance over the last decade is their low level of entrepreneurship the same applies to Japan which took 28th place Europe is still struggling to create new billion dollar companies
Factor-driven countries with low GDPs such as Pakistan Bangladesh Uganda and other poor African countries are at the bottom of the entrepreneurship ranking as expected At the same time these countriesrsquo entrepreneurial performance is the least unbalanced However some countriesmdashincluding two former socialist countries Serbia and Russia innovation-driven Italy and two South American countries Brazil and Trinidad and Tobagomdashshould have higher levels of entrepreneurship as implied by their development trend lines and more efficient use of entrepreneurial resources
37
Table 6 The Global Entrepreneurship Index Rank of All Countries 2018
Global rank Country Score
1 United States 836 2 Switzerland 804 3 Canada 792 4 United Kingdom 778 5 Australia 755 6 Denmark 743 7 Iceland 742 8 Ireland 737 9 Sweden 731
10 France 685 11 Netherlands 681 12 Finland 679 13 Hong Kong 673 14 Austria 660 15 Germany 659 16 Israel 654 17 Belgium 637 18 Taiwan 595 19 Chile 585 20 Luxembourg 582 21 Norway 566 22 Qatar 550 23 Estonia 548 24 Korea 542 25 Slovenia 538
26 United Arab Emirates 535
27 Singapore 527 28 Japan 515 29 Lithuania 511 30 Poland 504 31 Portugal 488 32 Cyprus 480 33 Oman 469 34 Spain 453 35 Bahrain 451 36 Slovakia 449 37 Turkey 445 38 Czech Republic 434 39 Kuwait 428 40 Tunisia 424 41 Puerto Rico 421 42 Italy 414 43 China 411 44 Latvia 405 45 Saudi Arabia 402 46 Romania 382 47 Colombia 382 48 Greece 371 49 Jordan 365 50 Hungary 364 51 Uruguay 350 52 Botswana 349 53 Brunei Darussalam 343
Global rank Country Score
54 Croatia 340 55 Barbados 336 56 Costa Rica 333 57 South Africa 329 58 Malaysia 327 59 Lebanon 315 60 Montenegro 312 61 Namibia 311 62 Azerbaijan 305 63 Belize 300 64 Kazakhstan 297 65 Morocco 292 66 Macedonia 291 67 Peru 284 68 India 284 69 Bulgaria 278 70 Panama 277 71 Thailand 274 72 Iran 268 73 Ukraine 268 74 Serbia 264 75 Mexico 264 76 Egypt 259 77 Georgia 258 78 Russia 252 79 Gabon 250 80 Algeria 247 81 Trinidad amp Tobago 244 82 Dominican Republic 243 83 Albania 242 84 Philippines 241 85 Argentina 240 86 Swaziland 238 87 Vietnam 232 88 Armenia 228 89 Jamaica 222 90 Sri Lanka 219 91 Rwanda 215 92 Moldova 212 93 Ghana 210 94 Indonesia 207
95 Bosnia and Herzegovina 207
96 Ecuador 205 97 Bolivia 204 98 Brazil 203 99 Tajikistan 200
100 Kyrgyz Republic 198 101 Nigeria 197 102 Zambia 196 103 Senegal 192 104 Libya 189 105 Cocircte drsquoIvoire 189 106 Paraguay 187
Global rank Country Score
107 Honduras 187 108 Guatemala 185 109 Kenya 184 110 Ethiopia 183 111 Suriname 181 112 Lao PDR 178 113 Cambodia 176 114 El Salvador 167 115 Tanzania 164 116 Guyana 164 117 Gambia The 161 118 Mali 159 119 Liberia 157 120 Pakistan 156 121 Cameroon 154 122 Nicaragua 147 123 Angola 144 124 Mozambique 140 125 Madagascar 140 126 Venezuela 138 127 Myanmar 136 128 Benin 133 129 Burkina Faso 132 130 Guinea 129 131 Uganda 129 132 Sierra Leone 123 133 Malawi 122 134 Bangladesh 118 135 Burundi 118 136 Mauritania 109 137 Chad 90
38
The Ranking of the 3As
By definition the GEI is a three-component index that takes into account the different aspects of the entrepreneurial ecosystem However all three components called sub-indices are in themselves complex measures that include various characteristics of entrepreneurial attitudes entrepreneurial abilities and entrepreneurial aspirations
Entrepreneurial attitudes are societiesrsquo attitudes toward entrepreneurship which we define as a populationrsquos general feelings about recognizing opportunities knowing entrepreneurs personally endowing entrepreneurs with high status accepting the risks associated with business startups and having the skills to launch a business successfully The benchmark individuals are those who can recognize valuable business opportunities and have the skills to exploit them who attach high status to entrepreneurs who can bear and handle startup risks who know other entrepreneurs personally (ie have a network or role models) and who can generate future entrepreneurial activities
Moreover these people can provide the cultural support financial resources and networking potential to those who are already entrepreneurs or want to start a business Entrepreneurial attitudes are important because they express the general feeling of the population toward entrepreneurs and entrepreneurship Countries need people who can recognize valuable business opportunities and who perceive that they have the required skills to exploit these opportunities Moreover if national attitudes toward entrepreneurship are positive it will generate cultural support financial support and networking benefits for those who want to start businesses
Entrepreneurial abilities refer to the entrepreneursrsquo characteristics and those of their businesses Different types of entrepreneurial abilities can be distinguished within the realm of new business efforts Creating businesses may vary by industry sector the legal form of organization and demographicsmdashage education etc We define entrepreneurial abilities as startups in the medium- or high-technology sectors that are initiated by educated entrepreneurs and launched because of a person being motivated by an opportunity in an environment that is not overly competitive In order to calculate the opportunity startup rate we use the GEM
TEA Opportunity Index TEA captures new startups not only as the creation of new ventures but also as startups within existing businesses such as a spinoff or other entrepreneurial effort Differences in the quality of startups are quantified by the entrepreneurrsquos education levelmdashthat is if they have a postsecondary educationmdashand the uniqueness of the product or service as measured by the level of competition Moreover it is generally maintained that opportunity motivation is a sign of better planning a more sophisticated strategy and higher growth expectations than ldquonecessityrdquo motivation in startups
Entrepreneurial aspiration reflects the quality aspects of startups and new businesses Some people just dislike their currently employment situation and want to be their own boss while others want to create the next Microsoft Entrepreneurial aspiration is defined as the early-stage entrepreneurrsquos effort to introduce new products andor services develop new production processes penetrate foreign markets substantially increase their companyrsquos staff and finance their business with formal andor informal venture capital Product and process innovation internationalization and high growth are considered the key characteristics of entrepreneurship Here we added a finance variable to capture the informal and formal venture capital potential that is vital for innovative startups and high-growth firms
Each of these three building blocks of entrepreneurship influences the other two For example entrepreneurial attitudes influence entrepreneurial abilities and entrepreneurial aspirations while entrepreneurial aspirations and abilities also influence entrepreneurial attitudes
Table 7 shows the ranking of the first 25 countries in the GEI and the rank of the sub-index The sub-index points and rankings for all 137 countries can be found in the Appendix The United States is first in the overall Index and also in one out of the three sub-indices Switzerland is 11th in attitudes first in aspirations and first in abilities as it is more interested in high-impact entrepreneurship than in replicative activities Chile represents a more unbalanced case ranking 19th in the overall Index slipping three places tenth in attitudes 27th in abilities and 30th in aspirations This is a huge challenge for Chile and many other Latin American economies Generally countries that rank at the bottom of the GEI also rank at the bottom of the three sub-
39
indices Israel ranks 16th in the overall Index but performs poorly in attitudes and abilities However it ranks 7th in Aspirations despite having poorer attitudes and abilities
For the ldquostartup nationrdquo it has an overall poor ranking in startup skills ndash at the bottom of the top 25 countries
Table 7 The Global Entrepreneurship Index and Sub-Index Ranks of the First 25 Countries 2018
Countries GEI GEI rank ATT ATT rank ABT ABT rank ASP ASP rank
United States 836 1 800 2 860 2 849 2
Switzerland 804 2 695 11 864 1 855 1
Canada 792 3 779 5 799 5 799 3
United Kingdom 778 4 736 7 833 4 763 4
Australia 755 5 792 3 760 8 712 8
Denmark 743 6 719 8 845 3 665 16
Iceland 742 7 823 1 699 9 703 9
Ireland 737 8 672 14 789 6 750 5
Sweden 731 9 711 9 787 7 695 13
France 685 10 614 17 697 10 744 6
Netherlands 681 11 774 6 653 14 617 22
Finland 679 12 790 4 629 16 618 21
Hong Kong 673 13 694 12 625 17 702 10
Austria 660 14 673 13 664 13 644 17
Germany 659 15 611 18 672 12 694 14
Israel 654 16 633 16 608 20 722 7
Belgium 637 17 538 23 678 11 695 12
Taiwan 595 18 540 22 548 24 696 11
Chile 585 19 703 10 509 27 543 30
Luxembourg 582 20 492 28 629 15 626 18
Norway 566 21 661 15 609 19 428 44
Qatar 550 22 484 29 545 25 622 19
Estonia 548 23 576 19 557 22 510 35
Korea 542 24 556 20 501 29 568 27
Slovenia 538 25 544 21 550 23 521 33
40
ENTREPRENEURIAL ATTITUDES
As stated earlier entrepreneurial attitude is defined as the general attitude of a countryrsquos population toward recognizing opportunities knowing entrepreneurs personally attaching high status to entrepreneurs accepting the risks associated with a business startup and having the skills to successfully launch businesses Entrepreneurial attitudes are important because they express the populationrsquos general feelings toward entrepreneurs and entrepreneurship
The benchmark individuals are those who can (1) recognize valuable business opportunities (2) have the necessary skills to exploit these opportunities (3) attach high status to and respect entrepreneurs (4) handle startup risk and (5) know entrepreneurs personally (ie have a network or role models) Moreover these people can provide the cultural support financial resources and networking potential to those who are already entrepreneurs or want to start a business
Table 8 Entrepreneurial Attitudes Sub-Index and Pillar Values for the First 25 Countries 2018
Countries Attitudes Sub-index
Opportunity Perception
Startup Skills Risk
Acceptance Networking
Cultural Support
Iceland 823 0947 1000 0917 1000 0633
United States 800 0864 1000 0969 0569 0816
Australia 792 0947 1000 0717 0698 0782
Finland 790 0954 0986 0782 0833 0885
Canada 779 0981 0795 0708 0626 0975
Netherlands 774 0898 0887 0877 0800 1000
United Kingdom 736 0810 0573 0876 0619 0928
Denmark 719 1000 0690 0748 0634 0918
Sweden 711 1000 0472 0704 0740 0896
Chile 703 0821 0903 1000 0709 0628
Switzerland 695 0776 0719 0879 0533 0673
Hong Kong 694 1000 0581 0610 1000 0680
Austria 673 0780 0953 0672 0552 0683
Ireland 672 0766 0966 0801 0390 0780
Norway 661 1000 0540 0999 0473 1000
Israel 633 0738 0598 0481 1000 0738
France 614 0502 0558 0751 0673 0641
Germany 611 0775 0627 0657 0380 0842
Estonia 576 0896 0800 0622 0493 0563
Korea 556 0457 0774 0905 0765 0272
Slovenia 544 0349 1000 0843 0331 0504
Taiwan 540 0517 0526 0587 0644 0580
Belgium 538 0679 0677 0559 0349 0568
Saudi Arabia 536 0611 0933 0436 1000 0477
Spain 513 0407 0807 0692 0640 0339 Pillar values are the normalized pillar scores and after the average pillar correction
Iceland leads in the Attitudes sub index followed by the United States Australia Finland Canada Netherlands United Kingdom Denmark Sweden and Chile Chilersquos tenth place is a very strong showing for a South American country Factor-driven African and Asian
countries including Swaziland Mali Sierra Leone Ethiopia Bangladesh Pakistan Malawi Chad and Burundi are at the bottom
41
ENTREPRENEURIAL ABILITIES
High entrepreneurial abilities are associated with startups in the medium- or high-technology sectors that are initiated by educated entrepreneurs and launched because of opportunity motivation in a not too
competitive environment Quality differences in startups are quantified by the motivation and education level of the entrepreneur and by the uniqueness of the product or service as measured by the level of competition
Table 9 Entrepreneurial Abilities Sub-Index and Pillar Values for the First 25 Countries 2018
Countries Abilities Sub-index
Opportunity Startup
Technology Absorption
Human Capital Competition
Switzerland 864 0966 1000 0789 1000
United States 860 0849 0814 1000 1000
Denmark 845 1000 1000 1000 0989
United Kingdom 833 0925 1000 0742 0848
Canada 799 0999 0779 0912 0676
Ireland 789 1000 0769 0851 1000
Sweden 787 0976 0946 0644 0869
Australia 760 0871 0780 0950 0567
Iceland 699 1000 1000 0506 0501
France 697 0683 0840 0625 0739
Belgium 678 0543 0852 0778 0850
Germany 672 0759 0863 0482 0848
Austria 664 0808 0941 0399 0761
Netherlands 653 0935 0835 0365 0786
Luxembourg 629 1000 0839 0551 0857
Finland 629 1000 0826 0495 0415
Hong Kong 625 0800 0643 0894 0381
Japan 611 0588 0902 0983 0594
Norway 609 1000 0752 0419 0671
Israel 608 0647 1000 0811 0317
Singapore 586 1000 0739 1000 0655
Estonia 557 0635 0773 0540 0606
Slovenia 550 0604 0744 0500 0485
Taiwan 548 0651 0705 0701 0317
Qatar 545 0754 0339 0882 0603 Pillar values are the normalized pillar scores and after the average pillar correction
Switzerland ranks number one on the Entrepreneurial Abilities sub-index The US ranks second and is relatively weak in Opportunity Startup and Technology Absorption Switzerland is stronger than the US in two pillars Opportunity Startups and Technology Absorption but very weak in Human Capital The United Kingdom ranks fourth with a significantly lower Entrepreneurial Abilities score than Denmark the United States and Switzerland Canada is strong in Opportunity Startup and Technology Absorption but low on Human Capital and Competition
The first five countries are followed by Ireland Sweden Australia Iceland and France
42
ENTREPRENEURIAL ASPIRATIONS
Entrepreneurial aspiration is the early-stage entrepreneurrsquos effort to introduce new products andor services develop new production processes penetrate foreign markets substantially increase the firmrsquos staff and finance a business with formal andor informal venture capital In other words the effort to start new companies that will generate wealth and can be scaled Product and process innovation internationalization and high growth are considered characteristics of
entrepreneurship The benchmark entrepreneurs are those whose businesses (1) produce and sell productsservices considered to be new to at least some customers (2) use a technology less than five years old (3) have sales in foreign markets (4) plan to employ at least ten people and (5) have greater than 50 percent growth over the next five years The Finance variable captures the informal venture capital potential as well as the development of capital venture capital and credit markets which is vital for innovative startups and high-growth firms
Table 10 Entrepreneurial Aspirations Sub-Index and Pillar Values for the First 25 Countries 2018
Countries Aspirations Sub-index
Product Innovation
Process Innovation
High Growth
Internationalization Risk
Capital Switzerland 855 0834 0902 0882 1000 1000 United States 849 0733 0902 1000 1000 0876 Canada 799 0991 0758 0559 0936 1000 United Kingdom 763 0924 0701 0850 0824 0649 Ireland 750 1000 0822 0884 0970 0568 France 744 0801 0941 0644 0764 0768 Israel 722 0997 1000 0851 0601 0788 Australia 712 0592 0786 0658 0633 1000 Iceland 703 0602 0838 0699 0952 0588 Hong Kong 702 0884 0409 1000 0679 1000 Taiwan 696 0972 0696 0895 0536 0935 Belgium 695 0913 0963 0551 0887 0627 Sweden 695 0666 0899 0557 0816 0721 Germany 694 0667 0840 0662 0874 0760 United Arab Emirates 681 1000 0626 0899 0901 0979 Denmark 665 0988 0723 0594 0390 1000 Austria 644 0724 0818 0403 0901 0630 Luxembourg 626 1000 0612 0545 1000 0902 Qatar 622 0856 0516 1000 0529 0956 Japan 621 0788 1000 1000 0606 0547 Finland 618 0617 0795 0675 0647 0497 Netherlands 617 0652 0769 0596 0562 0715 Singapore 616 0763 1000 1000 1000 0796 China 600 1000 0759 0871 0310 1000 Lithuania 592 0708 0502 0636 0736 0641
Pillar values are the normalized pillar scores after the average pillar correction
The Switzerland leads in the Entrepreneurial Aspirations sub-index While showing some weakness in Product Innovation and High Growth it is very strong in Internationalization and Risk Capital The United States is second with a strong showing in High Growth and Internationalization followed by Canada the United Kingdom Ireland France Israel Australia Iceland and Hong Kong which round out the top ten
43
Summaries and Conclusion Entrepreneurship is similar to other social creatures in that it is a multidimensional phenomenon whose exact meaning is difficult to identify There is only one thing more difficult how to measure this vaguely defined creature Over the decades researchers have created several entrepreneurship indicators but none has been able to reflect the complex nature of entrepreneurship
References 1 Acs Z and P Correa 2014 The World Bank and GEDI Identifying the Obstacles to High-Impact Entrepreneurship in Latin America and the Caribbean 2 Stam 2015 Stam and Spiegel 2015 Szerb L Acs Z J Ortega-Argileacutes R and Komlosi E 2014 Acs Autio and Szerb 2014a Autio et al 2014 Autio and Levie 2015 Autio et al 2012 3 Moore 1993 4 (Mathews and Brueggemann 2015 Chapter 14) 5 Acs Szerb and Autio National Systems of Entrepreneurship Measurement and Policy Research Policy (2014b479) 6 Stakeholder engagement is central for multi-polar policy-making and implementation Deep stakeholder engagement can tap knowledge within the ecosystem and uncover hidden interactions and cause-effect chains 7 While there is a small literature on entrepreneurship and economic growth our view is that high-impact firms cause economic growth because they shift the production function and replicative entrepreneurship is caused by economic growth and creates employment by replicating the existing production function 8 This trend is reflected in the continuing decline in the cost of computing the rise of open-source software the move to the lsquocloudrsquo and the emergence of huge datacenters where companies such as Amazon Google and Facebook are designing their own approaches 9 Autio and Levie 2015 10 Woolridge 2009 11 Leibenstein 1968 12 httpswwwyoutubecomwatchv=hjNc_BScn-s 13 The Wall Street Journal (2014) lsquoAmazon Reports Loss Despite Strong Sales Growthrsquo Available at httponlinewsjcomarticlesamazon-reports-another-loss-despite-strong-sales-growth-1406233529 14 Acs ZJ Autio E Szerb L (2014) National systems of entrepreneurship Measurement issues and policy implications Research Policy 43 (3) 476-494
and provide a plausible explanation of its role in development The Global Entrepreneurship Index is the first and presently the only complex measure of the national-level entrepreneurship ecosystem that reflects the multifaceted nature of entrepreneurship
15 Schumpeter JA (1934) The Theory of Economic Development An Inquiry into Profits Capital Credit Interest and the Business Cycle Cambridge MA Harvard University Press 16 We agree that correlation and basic regression coefficients are not enough to determine causation which is why we say that a 10 global increase in GEI could improve global productivity 022 points But it should be kept in mind that the said change in the GEI and the changes to institutions that it represents could add this amount to global productivity since the institutions that support entrepreneurship also support a variety of other economic and non-economic activities 17 Gartner (1990) Davidsson (2004) Wennekers and Thurik (1999)) and Godin Clemens and Veldhuis (2008) Zahra et al (2014) Gupta and Gupta (2015) all identify several dimensions of entrepreneurship 18 Baumol 1990 Vivarelly 2013 Thurik et al 2013 19Bjoslashrnskov amp Foss 2010 Goel et al 2015 20 Bhola Verheul Thurik amp Grilo 2006 Tumasjan amp Braun 2012 Autio et al (2014) 21 Papagiannidis amp Li 2005 Dutta amp Merenda 2011 Ibrahim amp Masrsquoud 2016 22 Caliendo Fossen amp Kritikos 2009 Vieider et al 2015 23 Shane amp Cable 2003 Mian and Hattab 2013 Audretsch et al 2015 24 Guiso Sapienza amp Zingales 2006 Lee et al 2011 Dutta amp Sobel 2016 25 Da Rin et al 2011 Asoni amp Sanandaji 2014 Belitski et al 2016 26 Coad amp Rao 2008 Garciacutea-Morales et al 2014 27 Bates 1990 Qian 2016 28 Baumol Litan amp Schramm 2007 Calcagno amp Sobel 2014 29 Autio et al 2014 Grimpe amp Hussinger 2013 Audretsch et al 2014b 30 Stam amp Wennberg 2009 Audretsch et al 2014a Garud et al 2014 31 Acs Parsons amp Tracy 2008 Gompers amp Lerner 2004 Croce et al 2013 Wright amp Stigliani 2013 32 De Clercq Sapienza amp Crijns 2005 McDougall-Covin et al 2014 33 Groh Liechtenstein amp Lieser 2012 Lee et al 2015
How to read these pages
0 10 20 30 40 50 60 70
1 Opportunity Perception2 Startup Skills3 Risk Acceptance4 Networking5 Cultural Support6 Opportunity Startup7 Technology Absorption8 Human Capital9 Competition10 Product Innovation11 Process Innovation12 High Growth13 Internationalization14 Risk Capital
2468
2228
1643
3022
3116
3323
18
6
Component scores
Individual score entrepreneurial qualities of the people in the ecosystem
24
0 100Scores
Institutional scorequality of the institutionsthat supportentrepreneurship
3857
Albania
m
Overall GEI score
Global Rank83 of 137
n
Strongest area Weakest areaStartup Skills Risk Acceptance
Country name What rank is this country out of the 137 countries in the 2018 GEI Lower ranks indicate beerperformance
Which of the 14 ecosystem components does this country do the best at
Which of the 14 ecosystem components should the country focus on first to improve the fastest
How does the country score on each of the 14 entrepreneurshipecosystem components Longer bars represent higher scores All scores are shown as percentages
What is the countryrsquos overall GEI score Higher scores are beer and are shown in more intense green All scores are shown as percentages
How does the country score on the half of GEI indicators that represent individuals Higher scores are beer and are shown in more intense green All scores are shown as percentages
How does the country score on the half of GEI indicators that represent instuons
What do the shades of green represent More intense green indicates beer scores
What does each component measure
1 Opportunity Percepon - Can the populaon idenfy opportunies to start a business and does the instuonal environment make it possible to act on those opportunies2 Startup Skills - Does the populaon have the skills necessary to start a business based on their own percepons and the availability of terary educaon3 Risk Acceptance - Are individuals willing to take the risk of starng a business Is the environment relavely low risk or do unstable instuons add addional risk to starng a business4 Networking - Do entrepreneurs know each other and how geographically concentrated are their networks5 Cultural Support - How does the country view entrepreneurship Is it easy to choose entrepreneurship or does corrupon make entrepreneurship difficult relave to other career paths6 Opportunity Percepon - Are entrepreneurs movated by opportunity rather than necessity and does governance make the choice to be an entrepreneur easy7 Technology Absorpon - Is the technology sector large and can businesses rapidly absorb new technology8 Human Capital - Are entrepreneurs highly educated well trained in business and able to move freely in the labor market9 Compeon - Are entrepreneurs creang unique products and services and able to enter the market with them10 Product Innovaon - Is the country able to develop new products and integrate new technology11 Process Innovaon - Do businesses use new technology and are they able access high quality human capital in STEM fields12 High Growth - Do businesses intend to grow and have the strategic capacity to achieve this growth13 Internaonalizaon - Do entrepreneurs want to enter global markets and is the economy complex enough to produce ideas that are valuable globally14 Risk Capital - Is capital available from both individual and instuonal investors
- About The Global Entrepreneurship and Development Institute
- Forward A Compass for Strengthening Entrepreneurship Ecosystems
- The table below shows the rank of each country in the 2018 Index
- The Asia-Pacific region shows greatest strength in Human Capital and Product Innovation ndash on average countries in the Asia-Pacific region have highly educated populations that are well trained in business and able to move freely in the labor market
- The regionrsquos lowest scores on average are in the area of Risk Acceptance If countries in the region improve their overall risk profile as well as the populationsrsquo attitudes towards taking risks it is likely that the entrepreneurship ecosystems in th
- Tech giants dominate the regionrsquos top ranks while lower income agriculture and manufacturing-dependent economies are found closer to the bottom Emerging hotspots for the digital economy are found near the middle of regional ranks China and South K
-
- The pillars of entrepreneurship in the ecosystem are many and complex While a widely accepted definition of entrepreneurship is lacking there is general agreement that the concept has numerous dimensions17F We take this into account in creating th
-

24
The System
The third component of entrepreneurial ecosystems is the systems When we look at systems for example systems of innovation or clusters we have a theory of how the system functions as it produces outputs Porterrsquos Diamond comes to mind When we move to an ecosystem we also need to have a theory of how the ecosystem functions How does an entrepreneurial ecosystem function It is not enough to have a laundry list of the institutions that might be important markets human capital supports culture finance and policy While all of these may be important how they work as an ecosystem is missing in much of this literature Building on the Systems of Innovation literature and the Global Entrepreneurship Monitor methodology we develop an entrepreneurial ecosystem that integrates both institutions and agency and introduce an ecosystem of coherent patterns in a simple intuitive and powerful way The key ideas are the relationships the complementary across the systems and subsystems and the importance of bottleneck factors The concept of complementary in its simplest way is the interaction of two variables Two choice variables are complements when doing more of one of them increases the returns to doing more of the other Ecosystem Services
While many think of the output of ecosystems as more startups like GEM this is wrong and misleading The dual service created by entrepreneurial ecosystems is (1) resource allocation towards productive uses and (2) the innovative high-growth ventures that drive this process The entrepreneurship literature frequently talks about opportunity recognition and the need to assemble resources However from a performance perspective the key issue is about resource allocation from existing activities to new ones The allocation of resources to productive uses will result in high growth high value new firms The nutrient in the ecosystem is resourcesmdashventure capital Without nutrients the ecosystem will die For example the launch of Uber and AirBnB early this decade and the earlier success of Google Amazon Facebook Twitter Skype WhatsApp Craigrsquos List created a new breed of company The billion-dollar tech startup was once the stuff of myth but now they seem to be everywhere backed by a bull market readily available venture capital and a new generation of disruptive technology8
Ecosystem Management
In the ecological literatures the practice of managing and enhancing ecosystem benefits is referred to as ecosystem management Because ecosystem services is created through a myriad of localized interactions between stakeholders it is not easy to trace gaps in system performance back to specific well-defined market and structural failures that could be addressed in a top-down mode 9 Strengthening the entrepreneurial ecosystem can be done by public private partnerships banks universities foundations governments and aid agencies The Global Entrepreneurial Ecosystem Roadmap (GEER) focuses on the first aspect of this project that is (1) identifying the holes in the global entrepreneurship ecosystem (2) laying out a roadmap for how to fill in the holes and (3) measuring our progress The goal of a well-functioning ecosystem is to improve the chances of success for entrepreneurs all over the world And ultimately reduce unemployment and bring peace to the world
25
The Entrepreneurial Ecosystem and Global Prosperity Introduction
While a focus on the entrepreneurial ecosystem may seem a novel approach to development it is consistent with and even complementary to older more traditional development strategies As developing economies move from centralized economies to market economies enterprise and entrepreneurship become important ldquoThe emerging world long a source of cheap labor now rivals developed countries for business innovation Developing countries are becoming hotbeds of business innovation in much the same way as Japan did from the 1950s onwardsrdquo10 Entrepreneurship is considered an important mechanism that promotes economic development through employment innovation and welfare but it does not appear like manna from heaven as a country moves through the stages of development Rather it plays a role in all development stages and is a process that continues over many years Economists have come to recognize the ldquoinput-competingrdquo and ldquogap-fillingrdquo capacities of entrepreneurial activity in development11 In other words someone has to create the technology for new products and create the markets where people will buy them Two points are important when thinking about entrepreneurship and development First contrary to popular belief the most entrepreneurial countries in the world are not those that have the most entrepreneurs This notion is in fact misleading In fact the highest self-employment rates are in low-income countries such as Zambia and Nigeria This is because low-income economies lack the human capital and infrastructure needed to create high-quality jobs The result is that many people sell soft drinks and fruit on street corners but there are few innovative high-growth startups Nor do these street vendors represent business ownership as defined in many developed countries In entrepreneurship quality matters more than quantity To be entrepreneurial a country needs to have the best entrepreneurs not necessarily the most What the ldquobest and the brightestrdquo do is important and to support their efforts a country needs a well-functioning entrepreneurial ecosystem (watch the video)12 The path to development is to create efficient organizations able
to harness technology to increase output and improve the lives of millions Second entrepreneurship comes in productive unproductive and destructive forms While productive entrepreneurship makes both entrepreneurs and society better off unproductive and destructive entrepreneurship make entrepreneurs better off but leave society in worse condition The GEI strives to measure only productive entrepreneurship that both creates wealth and is scalable Entrepreneurial ecosystems support innovative productive and rapidly growing new ventures They consist of multiple interactive elements all of which need to be in sync in order for innovative and high-growth firms to prosper Such firms also need skilled employees They need access to technology They need a well-functioning infrastructure They need specialized advice and support They need access to finance They need business premises They need a supportive regulatory framework Country-level Productivity and the Entrepreneurial Ecosystem
Economic growth does not equal to productivity Economic growth basically refers to the capacity of countries to produce more goods and services irrespective of how higher production is achieved The positive variations in GDP or employment over time are the usual suspects among those interested in studying economic growth figures mostly because they represent the desired objective of most policy makers as a measure of economic prosperity Productivity is a more complex concept At the country level total factor productivity (TFP) deals with two highly interconnected economic aspects First TFP has to do with the capacity of countries to allocate and exploit available resources efficiently (P = productivity effect) The notion that markets are good at directing resources is a good catch-all explanation concept but for many businesses it is hard to find all that is required to perform in the market and to keep the pace of industrial and digital revolutions that not only equip businesses with newmdashoften more technologically advancedmdashresources but also change the ways to exploit them
26
The second component of TFP deal with the capacity of organizations to channel innovations to the economy (I = innovation effect) that consequently translate into higher levels of output per input unit (in the case of countries GDP per worker) Maybe we all are too used to link innovation to technological inventions that are successfully commercialized However our definition of innovation is not restricted to engineering (such as the driverless car) or to medical advances (such as nerve stimulation or non-invasive procedures) and is open to other equally valuable types of non-technological innovations related to product and processes Letrsquos start with the productivity effect (P) The efficient allocation of resources available in the economy is an important part of the productivity function The productivity effect is linked to how well new and existing businesses use different resources including labor capital equipment knowledge and technology-based inputs The capacity of Amazon to amalgamate technologies brought from other industries (for example ICTs drones) to increase the productivity of its operations (delivery Amazon Fresh or Amazon Prime Air) is a good example13 From the perspective of the entrepreneurship ecosystem better institutions backing entrepreneurial activities and an efficient interaction between individual actions and the institutional setting governing entrepreneurial decisions are key ingredients necessary to facilitate the creation of businesses with a greater capacity to generate jobs and help incumbent businesses to take advantage of better market conditions For example in many European countries entrepreneurs have strong incentives to invest in physical and human capital and to promote the exploitation of resources in an effort to improve the functioning of their businesses In this case the supportive institutional environment creates the conditions to promote operational improvements In other words entrepreneurial ventures have incentives to lsquodo things betterrsquo that is to improve their productivity To sum up a healthy entrepreneurial ecosystem contributes to national productivity by enhancing market efficiency levels and by promoting the efficient exploitation of resources through new and incumbent businesses14
The second effectmdashinnovation (I)mdashis strictly linked to the Schumpeterian approach to entrepreneurship (creative destruction)15 For Schumpeter entrepreneurs play a decisive role in the economy by creating and implementing radical innovations that are conducive to economic progress In this tradition entrepreneurship is critical to spark economic development by promoting innovations in our terminology lsquocreate new things or find new ways to do thingsrsquo Progress translates in the expansion of the countriesrsquo production possibilities that materializes in a shift of the global frontier But at this point is worth questioning how can radical innovations foster such progress Moreover how does the entrepreneurial ecosystem contribute to this progress It seems logical to argue that inventions are worthless is they do not turn into commercialized innovations and that the economic impact of such innovations will turn sterile if the market and individuals cannot fully incorporate these innovations in their day-to-day routines For Schumpeter entrepreneurs nurture the economy with innovations and the entrepreneurial ecosystem is critical for the development of this economic function lsquocreate new things or find new ways to do thingsrsquo If countries enjoy a healthy entrepreneurial ecosystem the efforts of innovative entrepreneurs will materialize in new value-adding combinations of resources that will expand the countriesrsquo productive capacity and the global production frontier We found a significant relatively strong positive correlation between entrepreneurship and total factor productivity (035) We also noted that entrepreneurship correlates weakly positively with the productivity effect (009) (Table 11) Table 1 The correlations between GEI total factor productivity and its components
Variables Correlation GEI vs total factor productivity 03513 GEI vs productivity effect 00930 GEI vs innovation effect 03882
The strongest positive correlation was found between entrepreneurship and the innovation effect (039) This result is not surprising if we think a little harder Just like we cannot imagine progress in the 19th century without the creation and development of steam engines it is hard to imagine entrepreneurship in the 21st century without the power of technology-driven inventions With
27
the new millennium industries and markets from all around the globe are witnessing drastic transformations that are the result of a digital revolution in which entrepreneurs are taking an active role by creating new businesses that are responsible of this revolution The result is a good sign that reinforces our argument that the creation of lsquonew things or new ways to do thingsrsquo definitely constitutes the vital force driving economic development Figure 2 plots the GEI score and the computed total factor productivity values The correlation between TFP
and GEI is 035 and the sign is positive (see Table 1) From the Figure 2 we verify that the quality of the entrepreneurial ecosystem (GEI scores) and TFP move in the same direction Countries with a low-quality entrepreneurial ecosystem tend to show negative TFP values below unity On contrary all developed economies with supportive entrepreneurial ecosystems improve their total factor productivity either by productivity or innovation effects
Figure 2 GEI and total factor productivity
Figures 13 and 14 plot the relationship between the GEI index and the productivity and innovation effects respectively There is a positive association between entrepreneurship and the productivity effect (correlation = 009) however this relationship is less pronounced than that found for the TFP This result may well be partly explained by the differentiating impact of entrepreneurship over the productivity effect across economies We observe that the correlation between
entrepreneurship and the productivity effect scores the highest among factor driven countries (047 in Table 43) Also from Figure 13 we note that in many underdeveloped and developing territories with low- and mid-level entrepreneurial ecosystem the productivity effect is positive while the result of the productivity effect for some developed economies is negative
10 20 30 40 50 60 70 80 90
GEI
094
096
098
1
102
104
106
108
TFP
Denmark
Canada
USA
UK
Singapore
Uganda
China
Ghana
IndiaPeru
Germany
NetherlandsFrance
Angola
Zambia
Malawi Guatemala
Hungary
Japan
Korea
Finland
Norway
Sweden
LithuaniaR-square = 01234
28
Thus our results suggest that in developing economies the entrepreneurial ecosystem plays a much more decisive role on TFP via productivity improvements that
is helping new and established businesses in developing economies to better exploit their limited resources that is lsquoto lsquodo things betterrsquo
Figure 3 GEI and the productivity effect
The picture is quite different when we look at the results for the innovation effect The data in Table 13 show how the correlation between entrepreneurship and the innovation effect progressively increases as we move from factor-driven (correlation = -041) to innovation-driven economies (correlation = 033) Similarly the impact of the innovation effect is much more potent in innovation-driven economies (155) than in efficiency-driven (117) and in factor-driven economies (-059) This trend is corroborated by the results in Figure 44 in which we observe a steeper relationship between the
GEI scores and the innovation effect In contrast to the stronger effect of the entrepreneurial ecosystem over productivity in developing countries we found that the positive influence of a healthy entrepreneurial ecosystem over the innovative capacity of new and established businesses is much more powerful in developed economies With the exception of Turkey the innovation effect linked to the efficient commercialization of innovations and new technologies is positive in all economies with high quality entrepreneurial ecosystems (GEIgt 50)
10 20 30 40 50 60 70 80 90
GEI
092
094
096
098
1
102
104
106
Prod
uctiv
ity e
ffect
Uganda
Malawi Guatemala
Ghana
Angola
Peru
China
Macedonia
Hungary
Japan
Korea
Finland
Norway
Netherlands
Germany
France
Singapore
Lithuania
UK
USA
Denmark
Sweden
India
Trinidad amp Tobago
Botswana R-square = 00486
Zambia
Canada
29
Figure 4 GEI and the innovation effect
Based on the relationships reported above the improvement of the entrepreneurial ecosystem (GEI scores) may well yield to improvements in total factor productivity via the enhanced capacity of businesses to use their available resources (productivity effect) and to exploit the market potential of new technologies and
innovations As a result if every of the 64 analyzed countries raised its GEI score by 10 the global total factor productivity will increase 022 TFP points which represents an estimated improvement of 158016
10 20 30 40 50 60 70 80 90
GEI
094
096
098
1
102
104
106
Inno
vatio
n ef
fect
R-square = 01507
Uganda
Malawi
Guatemala
Angola
India
China
Botswana
HungaryJapan
Korea
Lithuania
Finland
Singapore
UK
Sweden
Denmark
USA
Canada
Norway
Netherlands
Zambia Peru
Ghana
Germany
30
The Global Entrepreneurship Index In depth
The Global State of Entrepreneurship
The GEI measures both the quality of entrepreneurship in a country and the extent and depth of the supporting entrepreneurial ecosystem
The top ten countries for 2018 show a pattern similar to last yearrsquosmdashhigh-income mostly European nations The top countries are the United States Switzerland Canada
the United Kingdom Australia Denmark Iceland Ireland Sweden and France The major surprise this year is the movement of the UK from 8th place to 4th place and the movement of Sweden from 4th place to 9th place Because the scores in the highest range are so close small changes in score from one year to the next can produce a relatively large shift in ranks among the top ten For this reason we present confidence intervals for the top ten
Top Ten Countries
Table 2 Top Ten Countries in the GEI
Country GEI 2018 lower limit
GEI 2018 upper limit
GEI 2018 Rank 2018
GEI Rank 2017
United States 775 897 836 1 1
Switzerland 725 884 804 2 2
Canada 739 846 792 3 3
United Kingdom 736 819 778 4 8
Australia 690 820 755 5 7
Denmark 648 838 743 6 5
Iceland 636 847 742 7 6
Ireland 668 806 737 8 9
Sweden 671 791 731 9 4
France 599 771 685 10 13
Figure 5 Confidence Intervals for Top Ten Scores
The results show that the No 1 rank could have gone to any of the top ten nations with the exception of France We see that Switzerland has a confidence
interval similar to the United States
599671668
636648
690736739
725775
771791806
847838
820819
846884897
00 200 400 600 800 1000
FranceSwedenIrelandIceland
DenmarkAustralia
United KingdomCanada
SwitzerlandUnited States
31
Regional Performance
For many countries a regional benchmark is more relevant for identifying best practices for fostering entrepreneurship This year we have several important
changes in Europe Sub-Saharan Africa and the MENA countries Below we present the top performer in each region along with individual and institutional score summaries
Table 3 Top Scores by Region
World rank Country Region GDP per capita PPP Individual variables Institutional variables GEI
1 United States North America $52676 930 785 836
2 Switzerland Europe $54933 938 715 804
5 Australia Asia-Pacific $42149 822 743 755
16 Israel Middle East North Africa $31092 809 727 654
19 Chile South and Central America Caribbean $21302 689 759 585
52 Botswana Sub-Saharan Africa $15286 477 660 349
The United States leads the world in entrepreneurship and is first in the North American region just ahead of peer Canada Australia ranks first in the Asia-Pacific region ahead of economic powerhouses China Singapore Hong Kong and Japan Switzerland which ranked fourth in the European region and eighth overall last year now comes in first in Europe Chile ranks first in
South and Central America and the Caribbean (19th overall) 22 places ahead of the next highest scorer in the regionmdashPuerto Rico at 41st Israel is 16th overall and tops the MENA region just ahead of Qatar at 22nd In Sub-Saharan Africa Botswana is the leader at 52nd ranking ahead of nine European nations
Biggest Gains
Table 4 Biggest Gains in GEI Score
Country Score 2018 Score 2017 Difference in Score Difference in Rank
United Kingdom 778 712 65 4
Israel 654 594 60 1
Bulgaria 278 227 51 13
China 411 361 50 5
Iran 268 221 47 13
Italy 414 371 43 4
Poland 504 465 39 1
Canada 792 755 37 0
Ireland 737 702 35 1
Korea 542 507 35 3
Note The table above includes only those countries that have participated in the GEM survey and do not have estimated individual data
32
Biggest Declines
Table 5 Biggest Declines in GEI Score (among countries with decreases in GEI score)
Country Score 2018 Score 2017 Difference in Score Difference in Rank
Latvia 405 430 -25 -6
Sweden 731 752 -21 -5
Taiwan 595 610 -15 -2
Malaysia 327 334 -07 -4
Ecuador 205 209 -04 -5
Chile 585 589 -04 -1
Kazakhstan 297 300 -03 -2
Indonesia 210 211 -01 -4
Note The above table includes only those countries that have participated in the GEM survey and do not have estimated individual data
The 14 Pillars of an Entrepreneurial Ecosystem
The pillars of entrepreneurship in the ecosystem are many and complex While a widely accepted definition of entrepreneurship is lacking there is general agreement that the concept has numerous dimensions17 We take this into account in creating the entrepreneurship index Some businesses have a larger impact on markets create more new jobs and grow faster and become larger than others We also take into account the fact that entrepreneurship plays a different role at different stages of development18 Considering all of these possibilities and limitations we define entrepreneurship as ldquothe dynamic institutionally embedded interaction between entrepreneurial attitudes entrepreneurial abilities and entrepreneurial aspirations by individuals which drives the allocation of resources through the creation and operation of new venturesrdquo
The GEI is composed of three building blocks or sub-indicesmdashwhat we call the 3As entrepreneurial attitudes entrepreneurial abilities and entrepreneurial
aspirations Entrepreneurial attitudes are about how a country thinks about entrepreneurship In fact what does your mother think about it The second sub index
GLO
BAL
ENTR
EPRE
NEU
RSH
IP IN
DEX
Sub-indexes Pillars Variables (individual institutional)
ATTITUDES SUB-INDEX
OPPORTUNITY PERCEPTION
OPPORTUNITY RECOGNITION FREEDOM (ECONOMIC FREEDOM PROPERTY RIGHTS)
STARTUP SKILLS SKILL PERCEPTION EDUCATION (TERTIARY EDUCATIONQUALITY OF EDUCATION)
RISK ACCEPTANCE RISK PERCEPTION COUNTRY RISK
NETWORKING KNOW ENTREPRENEURS AGGLOMERATION (URBANIZATIONINFRASTUCTURE )
CULTURAL SUPPORT CAREER STATUS CORRUPTION
ABILITIES SUB-INDEX
OPPORTUNITY STARTUP OPPORTUNITY MOTIVATION GOVERNANCE (TAXATIONGOOD GOVERNANCE)
TECHNOLOGY ABSORPTION
TECHNOLOGY LEVEL TECHNOLOGY ABSORPTION
HUMAN CAPITAL EDUCATIONAL LEVEL LABOR MARKET (STAFF TRAININGLABOUR FREEDOM)
COMPETITION COMPETITORS COMPETETIVNESS (MARKET DOMINANCEREGULATION)
ASPIRATION SUB-INDEX
PRODUCT INNOVATION NEW PRODUCT TECH TRANSFER
PROCESS INNOVATION
NEW TECHLOLOGY SCIENCE (GERD(AVERAGEQUALITY OF SCIENTIFICAL INSTITUTIONS +AVAILABILITY OF SCIENTISTS AND ENGENEERS))
HIGH GROWTH GAZELLE FINANCE AND STRATEGY (VENTURE CAPITALBUSINESS SOPHISTICATION)
INTERNATIONALIZATION EXPORT ECONOMIC COMPLEXITY
RISK CAPITAL INFORMAL INVESTMENT DEPTH OF CAPITAL MARKET
Figure 6 The Structure of the Global Entrepreneurship Index
33
is about abilities Can you do it Do you have the skills The third sub index is about aspirations Do you want to build a billion-dollar company These three sub-indices stand on 14 pillars each of which contains an individual and an institutional variable that corresponds to the micro- and the macro-level aspects of entrepreneurship Unlike other indexes that incorporate only institutional or individual variables the pillars of the GEI include both These pillars are an attempt to capture the open-ended nature of entrepreneurship analyzing them can provide an in-depth view of the strengths and weaknesses of those listed in the Index We now describe the 14 pillars of entrepreneurship
Entrepreneurial Attitudes Pillars
Pillar 1 Opportunity Perception This pillar captures the potential ldquoopportunity perceptionrdquo of a population by considering the state of property rights and the regulatory burden that could limit the real exploitation of the recognized entrepreneurial opportunity Within this pillar is the individual variable Opportunity Recognition which measures the percentage of the population that can identify good opportunities to start a business in the area where they live However the value of these opportunities also depends on the size of the market The institutional variable Freedom and Property consists of two smaller variables economic freedom (Economic Freedom) and property rights (Property Rights) Business Freedom ndash one sub-index of the Index of Economic Freedom variable ndash is appropriate for capturing the overall burden of regulation as well as the governmentrsquos regulatory efficiency in influencing startups and operating businesses ldquoThe property rights element is an assessment of the ability of individuals to accumulate private property secured by clear laws that are fully enforced by the staterdquo or in other words enforced property rights guarantee that individuals have the right to harvest the fruits of successful opportunity exploitation and no one is confiscating or stealing their property or business19 Both institutional components are vital for individuals to become entrepreneurs and not employees of another business or the state 20
Pillar 2 Startup Skills Launching a successful venture requires the potential entrepreneur to have the necessary startup skills Skill Perception measures the percentage of the population who believe they have adequate startup skills Most people in developing countries think they have the skills needed to start a
business but their skills were usually acquired through workplace trial and error in relatively simple business activities In developed countries business formation operation management etc require skills that are acquired through formal education and training Hence education especially postsecondary education plays a vital role in teaching and developing entrepreneurial skills Today there are 150 million students enrolled in some kind of education beyond high school a 53 percent increase in less than a decade People all over the world see education as a pathway out of poverty 21
Pillar 3 Risk Acceptance Of the personal entrepreneurial traits fear of failure is one of the most important obstacles to a startup Aversion to high-risk enterprises can retard nascent entrepreneurship Risk Perception is defined as the percentage of the population who do not believe that fear of failure would prevent them from starting a business Country Risk reflects to transfer and convertibility risk of a country and believed to closely correlate to business 22
Pillar 4 Networking Networking combines an entrepreneurrsquos personal knowledge with their ability to connect to others in a country and the whole world This combination serves as a proxy for networking which is also an important ingredient of successful venture creation and entrepreneurship Entrepreneurs who have better networks are more successful can identify more viable opportunities and can access more and better resources We define the basic networking potential of a possible entrepreneur by the percentage of the population who personally know an entrepreneur who started a business within two years (Know Entrepreneurs) The connectivity variable has two components One that measures the urbanization (Urbanization) of the country and the other measuring the quality of the transport infrastructure (Infrastructure)23
Pillar 5 Cultural Support This pillar is a combined measure of how a countryrsquos inhabitants view entrepreneurs in terms of status and career choice and how the level of corruption in that country affects this view Without strong cultural support the best and brightest do not want to be responsible entrepreneurs and they decide to enter a traditional profession Career Status is the average percentage of the population age 18-64 who say that entrepreneurship is a good career choice and enjoys high status The associated
34
institutional variable measures the level of corruption High levels of corruption can undermine the high status and steady career paths of legitimate entrepreneurs24
Entrepreneurial Abilities Pillars
Pillar 6 Opportunity Startup This is a measure of startups by people who are motivated by opportunity but face red tape and tax payment An entrepreneurrsquos motivation for starting a business is an important signal of quality Opportunity entrepreneurs are believed to be better prepared to have superior skills and to earn more than what we call necessity entrepreneurs Opportunity Motivation is defined as the percentage of the Total Entrepreneurial Activity (TEA) businesses started to exploit a good opportunity to increase income or to fulfill personal aims in contrast to those started by people who have no other options for work The overall effectiveness of the government services is measured by the Good Governance variable and the cost of the governance is by the level of overall taxation (Taxation) The variable is a combination of these two components government service quality and costs25
Pillar 7 Technology Absorption In the modern knowledge economy information and communication technologies (ICT) play a crucial role in economic development Not all sectors provide the same chances for businesses to survive and or their potential for growth The Technology Level variable is a measure of the businesses that are in technology sectors The institutional variable Tech Absorption is a measure of a countryrsquos capacity for firm-level technology absorption as reported by the World Economic Forum The diffusion of new technology and the capability to absorb it is vital for innovative firms with high growth potential26
Pillar 8 Human Capital The prevalence of high-quality human capital is vitally important for ventures that are highly innovative and require an educated experienced and healthy workforce to continue to grow An important feature of a venture with high growth potential is the entrepreneurrsquos level of education The Educational Level variable captures the quality of entrepreneurs it is widely held that entrepreneurs with higher education degrees are more capable and willing to start and manage high-growth businesses The labor market possibilities and the capability to easily hire quality employees also have an impact on business development innovation and growth potential The
institutional variable Labor Market has two components Labor Freedom measures the freedom of the labor from the regulatory perspective and Staff Training is a countryrsquos level of investment in business training and employee development It can be expected that heavy investment in employees pays off and that training increases employee quality27
Pillar 9 Competition Competition is a measure of a businessrsquos product or market uniqueness combined with the market power of existing businesses and business groups and the effectiveness of anti-monopoly regulation The variable Competitors is defined as the percentage of TEA businesses that have only a few competitors offering the same product or service However market entry can be prevented or made more difficult if powerful business groups are dominating the market The extent of market dominance by a few business groups is measured by the variable Market Dominance a variable reported by the World Economic Forum The effectiveness of the regulatory bodies (Regulation) could also influence the level of competition in a country The Competition institutional variable is the combination of Regulation and Market Dominance28
Entrepreneurial Aspirations Pillars
Pillar 10 Product Innovation New products play a crucial role in the economy of all countries While countries were once the source of most new products today developing countries are producing products that are dramatically cheaper than their Western equivalents New Product is a measure of a countryrsquos potential to generate new products and to adopt or imitate existing products In order to quantify the potential for new product innovation an institutional variable related to technology and innovation transfer seems to be relevant Technology Transfer is a complex measure of whether a business environment allows the application of innovations for developing new products29
Pillar 11 Process Innovation Applying andor creating new technology is another important feature of businesses with high-growth potential New Tech is defined as the percentage of businesses whose principal underlying technology is less than five years old However most entrepreneurial businesses do not just apply new technology they create it The problem is similar to the New Product variable whereas many businesses in developing countries may apply the latest
35
technology they tend to buy or copy it An appropriate institutional variable applied here is complex measure combining research and development (RampD) the quality of scientific institutions in a country (Scientific Institutions) and the availability of scientists and engineers (Availability of Scientist) Gross Domestic Expenditure on Research and Development (GERD) is the RampD percentage of GDP as reported by OECD While RampD alone does not guarantee successful growth it is clear that without systematic research activity the development and the implementation of new technologiesmdashand therefore future growthmdashwill be inhibited The Science institutional variable combines together RampD potential with physical scientific infrastructure and science oriented human capital 30
Pillar 12 High Growth High Growth is a combined measure of the percentage of high-growth businesses that intend to employ at least 10 people and plan to grow more than 50 percent in five years (Gazelle variable) with business strategy sophistication (Business Strategy variable) and venture capital financing possibility (Venture Capital) It might be argued that a shortcoming of the Gazelle variable is that growth is not an actual but an expected rate However a measure of expected growth is in fact a more appropriate measure of aspiration than a measure of realized growth Business Strategy refers to ldquothe ability of companies to pursue distinctive strategies which involves differentiated positioning and innovative means of production and service deliveryrdquo High Growth combines high growth potential with a sophisticated strategy and growth specific venture capital finance31
Pillar 13 Internationalization Internationalization is believed to be a major determinant of growth A widely applied proxy for internationalization is exporting Exporting demands capabilities beyond those needed by businesses that produce only for domestic markets However the institutional dimension is also important a countryrsquos openness to international entrepreneursmdashthat is the potential for internationalizationmdashcan be estimated by its degree of complexityrdquo The complexity of an economy is related to the multiplicity of useful knowledge embedded in it Because individuals are limited in what they know the only way societies can expand their knowledge base is by facilitating the interaction of individuals in increasingly complex networks in order to make products We can measure economic complexity by the mix of these products that
countries are able to makerdquo The internationalization pillar is designed to capture the degree to which a countryrsquos entrepreneurs are internationalized as measured by the exporting potential of businesses controlling for the extent to which the country is able to produce complex products32
Pillar 14 Risk Capital The availability of risk finance particularly equity rather than debt is an essential precondition for fulfilling entrepreneurial aspirations that are beyond an individual entrepreneurrsquos personal financial resources33 Here we combine two kinds of finance the informal investment (Informal Investment) and the institutional depth of capital market (DCM) Informal Investment is defined as the percentage of informal investors in the population age 18-64 multiplied by the average size of individualsrsquo investment in other peoplersquos new businesses While the rate of informal investment is high in factor-driven economies the amount of informal investment is considerably larger in efficiency- and innovation-driven countries combining them balances these two effects Our institutional variable here is DCM one of the six sub-indices of the Venture Capital and Private Equity Index This variable is a complex measure of the size and liquidity of the stock market level of IPO MampA and debt and credit market activity which encompass seven aspects of a countryrsquos debt and capital market
The Global Entrepreneurship Index 2018 Rankings
In this section we report the rankings of the 137 countries on the Global Entrepreneurship Index and its three sub-indices We also provide confidence intervals for the GEIrsquos The confidence intervals calculations are based on the Global Entrepreneurship Monitor (GEM) Total Early-Phased Entrepreneurial Activity (TEA) confidence intervals Note that these confidence intervals only partially represent the potential measurement errors as we do not know the full error term In addition we do not have information about the confidence intervals of the 34 countries where we use estimated data In these cases the upper and the lower limits are the same
We present the rankings in terms of country development as measured by per capita GDP The overall ranking of the countries on the GEI is shown in Table 16 Like previous years Anglo-Saxon Nordic and Western European countries in the innovation-driven
36
stage of development are in the front ranks The United States Switzerland and Canada lead the rankings Three of the five Nordic countries Denmark Iceland and Sweden are in the top ten and effectively tied with the United States Hong Kong the highest Asian country is in 13th place and Taiwan is 18th Besides their high entrepreneurial performance these countries represent high income levels
Of the most populous EU countries only the United Kingdom and France place among the top 10 countries (4th and 10th) The other large European countries rank in the middle Germany is 15th Spain is 34th followed by Italy in 42nd place While the UK France and Germany are relatively well balanced over the 14 pillars
Poland Spain and Italy are entrepreneurially less efficient A likely explanation for the EU countriesrsquo relatively weak economic performance over the last decade is their low level of entrepreneurship the same applies to Japan which took 28th place Europe is still struggling to create new billion dollar companies
Factor-driven countries with low GDPs such as Pakistan Bangladesh Uganda and other poor African countries are at the bottom of the entrepreneurship ranking as expected At the same time these countriesrsquo entrepreneurial performance is the least unbalanced However some countriesmdashincluding two former socialist countries Serbia and Russia innovation-driven Italy and two South American countries Brazil and Trinidad and Tobagomdashshould have higher levels of entrepreneurship as implied by their development trend lines and more efficient use of entrepreneurial resources
37
Table 6 The Global Entrepreneurship Index Rank of All Countries 2018
Global rank Country Score
1 United States 836 2 Switzerland 804 3 Canada 792 4 United Kingdom 778 5 Australia 755 6 Denmark 743 7 Iceland 742 8 Ireland 737 9 Sweden 731
10 France 685 11 Netherlands 681 12 Finland 679 13 Hong Kong 673 14 Austria 660 15 Germany 659 16 Israel 654 17 Belgium 637 18 Taiwan 595 19 Chile 585 20 Luxembourg 582 21 Norway 566 22 Qatar 550 23 Estonia 548 24 Korea 542 25 Slovenia 538
26 United Arab Emirates 535
27 Singapore 527 28 Japan 515 29 Lithuania 511 30 Poland 504 31 Portugal 488 32 Cyprus 480 33 Oman 469 34 Spain 453 35 Bahrain 451 36 Slovakia 449 37 Turkey 445 38 Czech Republic 434 39 Kuwait 428 40 Tunisia 424 41 Puerto Rico 421 42 Italy 414 43 China 411 44 Latvia 405 45 Saudi Arabia 402 46 Romania 382 47 Colombia 382 48 Greece 371 49 Jordan 365 50 Hungary 364 51 Uruguay 350 52 Botswana 349 53 Brunei Darussalam 343
Global rank Country Score
54 Croatia 340 55 Barbados 336 56 Costa Rica 333 57 South Africa 329 58 Malaysia 327 59 Lebanon 315 60 Montenegro 312 61 Namibia 311 62 Azerbaijan 305 63 Belize 300 64 Kazakhstan 297 65 Morocco 292 66 Macedonia 291 67 Peru 284 68 India 284 69 Bulgaria 278 70 Panama 277 71 Thailand 274 72 Iran 268 73 Ukraine 268 74 Serbia 264 75 Mexico 264 76 Egypt 259 77 Georgia 258 78 Russia 252 79 Gabon 250 80 Algeria 247 81 Trinidad amp Tobago 244 82 Dominican Republic 243 83 Albania 242 84 Philippines 241 85 Argentina 240 86 Swaziland 238 87 Vietnam 232 88 Armenia 228 89 Jamaica 222 90 Sri Lanka 219 91 Rwanda 215 92 Moldova 212 93 Ghana 210 94 Indonesia 207
95 Bosnia and Herzegovina 207
96 Ecuador 205 97 Bolivia 204 98 Brazil 203 99 Tajikistan 200
100 Kyrgyz Republic 198 101 Nigeria 197 102 Zambia 196 103 Senegal 192 104 Libya 189 105 Cocircte drsquoIvoire 189 106 Paraguay 187
Global rank Country Score
107 Honduras 187 108 Guatemala 185 109 Kenya 184 110 Ethiopia 183 111 Suriname 181 112 Lao PDR 178 113 Cambodia 176 114 El Salvador 167 115 Tanzania 164 116 Guyana 164 117 Gambia The 161 118 Mali 159 119 Liberia 157 120 Pakistan 156 121 Cameroon 154 122 Nicaragua 147 123 Angola 144 124 Mozambique 140 125 Madagascar 140 126 Venezuela 138 127 Myanmar 136 128 Benin 133 129 Burkina Faso 132 130 Guinea 129 131 Uganda 129 132 Sierra Leone 123 133 Malawi 122 134 Bangladesh 118 135 Burundi 118 136 Mauritania 109 137 Chad 90
38
The Ranking of the 3As
By definition the GEI is a three-component index that takes into account the different aspects of the entrepreneurial ecosystem However all three components called sub-indices are in themselves complex measures that include various characteristics of entrepreneurial attitudes entrepreneurial abilities and entrepreneurial aspirations
Entrepreneurial attitudes are societiesrsquo attitudes toward entrepreneurship which we define as a populationrsquos general feelings about recognizing opportunities knowing entrepreneurs personally endowing entrepreneurs with high status accepting the risks associated with business startups and having the skills to launch a business successfully The benchmark individuals are those who can recognize valuable business opportunities and have the skills to exploit them who attach high status to entrepreneurs who can bear and handle startup risks who know other entrepreneurs personally (ie have a network or role models) and who can generate future entrepreneurial activities
Moreover these people can provide the cultural support financial resources and networking potential to those who are already entrepreneurs or want to start a business Entrepreneurial attitudes are important because they express the general feeling of the population toward entrepreneurs and entrepreneurship Countries need people who can recognize valuable business opportunities and who perceive that they have the required skills to exploit these opportunities Moreover if national attitudes toward entrepreneurship are positive it will generate cultural support financial support and networking benefits for those who want to start businesses
Entrepreneurial abilities refer to the entrepreneursrsquo characteristics and those of their businesses Different types of entrepreneurial abilities can be distinguished within the realm of new business efforts Creating businesses may vary by industry sector the legal form of organization and demographicsmdashage education etc We define entrepreneurial abilities as startups in the medium- or high-technology sectors that are initiated by educated entrepreneurs and launched because of a person being motivated by an opportunity in an environment that is not overly competitive In order to calculate the opportunity startup rate we use the GEM
TEA Opportunity Index TEA captures new startups not only as the creation of new ventures but also as startups within existing businesses such as a spinoff or other entrepreneurial effort Differences in the quality of startups are quantified by the entrepreneurrsquos education levelmdashthat is if they have a postsecondary educationmdashand the uniqueness of the product or service as measured by the level of competition Moreover it is generally maintained that opportunity motivation is a sign of better planning a more sophisticated strategy and higher growth expectations than ldquonecessityrdquo motivation in startups
Entrepreneurial aspiration reflects the quality aspects of startups and new businesses Some people just dislike their currently employment situation and want to be their own boss while others want to create the next Microsoft Entrepreneurial aspiration is defined as the early-stage entrepreneurrsquos effort to introduce new products andor services develop new production processes penetrate foreign markets substantially increase their companyrsquos staff and finance their business with formal andor informal venture capital Product and process innovation internationalization and high growth are considered the key characteristics of entrepreneurship Here we added a finance variable to capture the informal and formal venture capital potential that is vital for innovative startups and high-growth firms
Each of these three building blocks of entrepreneurship influences the other two For example entrepreneurial attitudes influence entrepreneurial abilities and entrepreneurial aspirations while entrepreneurial aspirations and abilities also influence entrepreneurial attitudes
Table 7 shows the ranking of the first 25 countries in the GEI and the rank of the sub-index The sub-index points and rankings for all 137 countries can be found in the Appendix The United States is first in the overall Index and also in one out of the three sub-indices Switzerland is 11th in attitudes first in aspirations and first in abilities as it is more interested in high-impact entrepreneurship than in replicative activities Chile represents a more unbalanced case ranking 19th in the overall Index slipping three places tenth in attitudes 27th in abilities and 30th in aspirations This is a huge challenge for Chile and many other Latin American economies Generally countries that rank at the bottom of the GEI also rank at the bottom of the three sub-
39
indices Israel ranks 16th in the overall Index but performs poorly in attitudes and abilities However it ranks 7th in Aspirations despite having poorer attitudes and abilities
For the ldquostartup nationrdquo it has an overall poor ranking in startup skills ndash at the bottom of the top 25 countries
Table 7 The Global Entrepreneurship Index and Sub-Index Ranks of the First 25 Countries 2018
Countries GEI GEI rank ATT ATT rank ABT ABT rank ASP ASP rank
United States 836 1 800 2 860 2 849 2
Switzerland 804 2 695 11 864 1 855 1
Canada 792 3 779 5 799 5 799 3
United Kingdom 778 4 736 7 833 4 763 4
Australia 755 5 792 3 760 8 712 8
Denmark 743 6 719 8 845 3 665 16
Iceland 742 7 823 1 699 9 703 9
Ireland 737 8 672 14 789 6 750 5
Sweden 731 9 711 9 787 7 695 13
France 685 10 614 17 697 10 744 6
Netherlands 681 11 774 6 653 14 617 22
Finland 679 12 790 4 629 16 618 21
Hong Kong 673 13 694 12 625 17 702 10
Austria 660 14 673 13 664 13 644 17
Germany 659 15 611 18 672 12 694 14
Israel 654 16 633 16 608 20 722 7
Belgium 637 17 538 23 678 11 695 12
Taiwan 595 18 540 22 548 24 696 11
Chile 585 19 703 10 509 27 543 30
Luxembourg 582 20 492 28 629 15 626 18
Norway 566 21 661 15 609 19 428 44
Qatar 550 22 484 29 545 25 622 19
Estonia 548 23 576 19 557 22 510 35
Korea 542 24 556 20 501 29 568 27
Slovenia 538 25 544 21 550 23 521 33
40
ENTREPRENEURIAL ATTITUDES
As stated earlier entrepreneurial attitude is defined as the general attitude of a countryrsquos population toward recognizing opportunities knowing entrepreneurs personally attaching high status to entrepreneurs accepting the risks associated with a business startup and having the skills to successfully launch businesses Entrepreneurial attitudes are important because they express the populationrsquos general feelings toward entrepreneurs and entrepreneurship
The benchmark individuals are those who can (1) recognize valuable business opportunities (2) have the necessary skills to exploit these opportunities (3) attach high status to and respect entrepreneurs (4) handle startup risk and (5) know entrepreneurs personally (ie have a network or role models) Moreover these people can provide the cultural support financial resources and networking potential to those who are already entrepreneurs or want to start a business
Table 8 Entrepreneurial Attitudes Sub-Index and Pillar Values for the First 25 Countries 2018
Countries Attitudes Sub-index
Opportunity Perception
Startup Skills Risk
Acceptance Networking
Cultural Support
Iceland 823 0947 1000 0917 1000 0633
United States 800 0864 1000 0969 0569 0816
Australia 792 0947 1000 0717 0698 0782
Finland 790 0954 0986 0782 0833 0885
Canada 779 0981 0795 0708 0626 0975
Netherlands 774 0898 0887 0877 0800 1000
United Kingdom 736 0810 0573 0876 0619 0928
Denmark 719 1000 0690 0748 0634 0918
Sweden 711 1000 0472 0704 0740 0896
Chile 703 0821 0903 1000 0709 0628
Switzerland 695 0776 0719 0879 0533 0673
Hong Kong 694 1000 0581 0610 1000 0680
Austria 673 0780 0953 0672 0552 0683
Ireland 672 0766 0966 0801 0390 0780
Norway 661 1000 0540 0999 0473 1000
Israel 633 0738 0598 0481 1000 0738
France 614 0502 0558 0751 0673 0641
Germany 611 0775 0627 0657 0380 0842
Estonia 576 0896 0800 0622 0493 0563
Korea 556 0457 0774 0905 0765 0272
Slovenia 544 0349 1000 0843 0331 0504
Taiwan 540 0517 0526 0587 0644 0580
Belgium 538 0679 0677 0559 0349 0568
Saudi Arabia 536 0611 0933 0436 1000 0477
Spain 513 0407 0807 0692 0640 0339 Pillar values are the normalized pillar scores and after the average pillar correction
Iceland leads in the Attitudes sub index followed by the United States Australia Finland Canada Netherlands United Kingdom Denmark Sweden and Chile Chilersquos tenth place is a very strong showing for a South American country Factor-driven African and Asian
countries including Swaziland Mali Sierra Leone Ethiopia Bangladesh Pakistan Malawi Chad and Burundi are at the bottom
41
ENTREPRENEURIAL ABILITIES
High entrepreneurial abilities are associated with startups in the medium- or high-technology sectors that are initiated by educated entrepreneurs and launched because of opportunity motivation in a not too
competitive environment Quality differences in startups are quantified by the motivation and education level of the entrepreneur and by the uniqueness of the product or service as measured by the level of competition
Table 9 Entrepreneurial Abilities Sub-Index and Pillar Values for the First 25 Countries 2018
Countries Abilities Sub-index
Opportunity Startup
Technology Absorption
Human Capital Competition
Switzerland 864 0966 1000 0789 1000
United States 860 0849 0814 1000 1000
Denmark 845 1000 1000 1000 0989
United Kingdom 833 0925 1000 0742 0848
Canada 799 0999 0779 0912 0676
Ireland 789 1000 0769 0851 1000
Sweden 787 0976 0946 0644 0869
Australia 760 0871 0780 0950 0567
Iceland 699 1000 1000 0506 0501
France 697 0683 0840 0625 0739
Belgium 678 0543 0852 0778 0850
Germany 672 0759 0863 0482 0848
Austria 664 0808 0941 0399 0761
Netherlands 653 0935 0835 0365 0786
Luxembourg 629 1000 0839 0551 0857
Finland 629 1000 0826 0495 0415
Hong Kong 625 0800 0643 0894 0381
Japan 611 0588 0902 0983 0594
Norway 609 1000 0752 0419 0671
Israel 608 0647 1000 0811 0317
Singapore 586 1000 0739 1000 0655
Estonia 557 0635 0773 0540 0606
Slovenia 550 0604 0744 0500 0485
Taiwan 548 0651 0705 0701 0317
Qatar 545 0754 0339 0882 0603 Pillar values are the normalized pillar scores and after the average pillar correction
Switzerland ranks number one on the Entrepreneurial Abilities sub-index The US ranks second and is relatively weak in Opportunity Startup and Technology Absorption Switzerland is stronger than the US in two pillars Opportunity Startups and Technology Absorption but very weak in Human Capital The United Kingdom ranks fourth with a significantly lower Entrepreneurial Abilities score than Denmark the United States and Switzerland Canada is strong in Opportunity Startup and Technology Absorption but low on Human Capital and Competition
The first five countries are followed by Ireland Sweden Australia Iceland and France
42
ENTREPRENEURIAL ASPIRATIONS
Entrepreneurial aspiration is the early-stage entrepreneurrsquos effort to introduce new products andor services develop new production processes penetrate foreign markets substantially increase the firmrsquos staff and finance a business with formal andor informal venture capital In other words the effort to start new companies that will generate wealth and can be scaled Product and process innovation internationalization and high growth are considered characteristics of
entrepreneurship The benchmark entrepreneurs are those whose businesses (1) produce and sell productsservices considered to be new to at least some customers (2) use a technology less than five years old (3) have sales in foreign markets (4) plan to employ at least ten people and (5) have greater than 50 percent growth over the next five years The Finance variable captures the informal venture capital potential as well as the development of capital venture capital and credit markets which is vital for innovative startups and high-growth firms
Table 10 Entrepreneurial Aspirations Sub-Index and Pillar Values for the First 25 Countries 2018
Countries Aspirations Sub-index
Product Innovation
Process Innovation
High Growth
Internationalization Risk
Capital Switzerland 855 0834 0902 0882 1000 1000 United States 849 0733 0902 1000 1000 0876 Canada 799 0991 0758 0559 0936 1000 United Kingdom 763 0924 0701 0850 0824 0649 Ireland 750 1000 0822 0884 0970 0568 France 744 0801 0941 0644 0764 0768 Israel 722 0997 1000 0851 0601 0788 Australia 712 0592 0786 0658 0633 1000 Iceland 703 0602 0838 0699 0952 0588 Hong Kong 702 0884 0409 1000 0679 1000 Taiwan 696 0972 0696 0895 0536 0935 Belgium 695 0913 0963 0551 0887 0627 Sweden 695 0666 0899 0557 0816 0721 Germany 694 0667 0840 0662 0874 0760 United Arab Emirates 681 1000 0626 0899 0901 0979 Denmark 665 0988 0723 0594 0390 1000 Austria 644 0724 0818 0403 0901 0630 Luxembourg 626 1000 0612 0545 1000 0902 Qatar 622 0856 0516 1000 0529 0956 Japan 621 0788 1000 1000 0606 0547 Finland 618 0617 0795 0675 0647 0497 Netherlands 617 0652 0769 0596 0562 0715 Singapore 616 0763 1000 1000 1000 0796 China 600 1000 0759 0871 0310 1000 Lithuania 592 0708 0502 0636 0736 0641
Pillar values are the normalized pillar scores after the average pillar correction
The Switzerland leads in the Entrepreneurial Aspirations sub-index While showing some weakness in Product Innovation and High Growth it is very strong in Internationalization and Risk Capital The United States is second with a strong showing in High Growth and Internationalization followed by Canada the United Kingdom Ireland France Israel Australia Iceland and Hong Kong which round out the top ten
43
Summaries and Conclusion Entrepreneurship is similar to other social creatures in that it is a multidimensional phenomenon whose exact meaning is difficult to identify There is only one thing more difficult how to measure this vaguely defined creature Over the decades researchers have created several entrepreneurship indicators but none has been able to reflect the complex nature of entrepreneurship
References 1 Acs Z and P Correa 2014 The World Bank and GEDI Identifying the Obstacles to High-Impact Entrepreneurship in Latin America and the Caribbean 2 Stam 2015 Stam and Spiegel 2015 Szerb L Acs Z J Ortega-Argileacutes R and Komlosi E 2014 Acs Autio and Szerb 2014a Autio et al 2014 Autio and Levie 2015 Autio et al 2012 3 Moore 1993 4 (Mathews and Brueggemann 2015 Chapter 14) 5 Acs Szerb and Autio National Systems of Entrepreneurship Measurement and Policy Research Policy (2014b479) 6 Stakeholder engagement is central for multi-polar policy-making and implementation Deep stakeholder engagement can tap knowledge within the ecosystem and uncover hidden interactions and cause-effect chains 7 While there is a small literature on entrepreneurship and economic growth our view is that high-impact firms cause economic growth because they shift the production function and replicative entrepreneurship is caused by economic growth and creates employment by replicating the existing production function 8 This trend is reflected in the continuing decline in the cost of computing the rise of open-source software the move to the lsquocloudrsquo and the emergence of huge datacenters where companies such as Amazon Google and Facebook are designing their own approaches 9 Autio and Levie 2015 10 Woolridge 2009 11 Leibenstein 1968 12 httpswwwyoutubecomwatchv=hjNc_BScn-s 13 The Wall Street Journal (2014) lsquoAmazon Reports Loss Despite Strong Sales Growthrsquo Available at httponlinewsjcomarticlesamazon-reports-another-loss-despite-strong-sales-growth-1406233529 14 Acs ZJ Autio E Szerb L (2014) National systems of entrepreneurship Measurement issues and policy implications Research Policy 43 (3) 476-494
and provide a plausible explanation of its role in development The Global Entrepreneurship Index is the first and presently the only complex measure of the national-level entrepreneurship ecosystem that reflects the multifaceted nature of entrepreneurship
15 Schumpeter JA (1934) The Theory of Economic Development An Inquiry into Profits Capital Credit Interest and the Business Cycle Cambridge MA Harvard University Press 16 We agree that correlation and basic regression coefficients are not enough to determine causation which is why we say that a 10 global increase in GEI could improve global productivity 022 points But it should be kept in mind that the said change in the GEI and the changes to institutions that it represents could add this amount to global productivity since the institutions that support entrepreneurship also support a variety of other economic and non-economic activities 17 Gartner (1990) Davidsson (2004) Wennekers and Thurik (1999)) and Godin Clemens and Veldhuis (2008) Zahra et al (2014) Gupta and Gupta (2015) all identify several dimensions of entrepreneurship 18 Baumol 1990 Vivarelly 2013 Thurik et al 2013 19Bjoslashrnskov amp Foss 2010 Goel et al 2015 20 Bhola Verheul Thurik amp Grilo 2006 Tumasjan amp Braun 2012 Autio et al (2014) 21 Papagiannidis amp Li 2005 Dutta amp Merenda 2011 Ibrahim amp Masrsquoud 2016 22 Caliendo Fossen amp Kritikos 2009 Vieider et al 2015 23 Shane amp Cable 2003 Mian and Hattab 2013 Audretsch et al 2015 24 Guiso Sapienza amp Zingales 2006 Lee et al 2011 Dutta amp Sobel 2016 25 Da Rin et al 2011 Asoni amp Sanandaji 2014 Belitski et al 2016 26 Coad amp Rao 2008 Garciacutea-Morales et al 2014 27 Bates 1990 Qian 2016 28 Baumol Litan amp Schramm 2007 Calcagno amp Sobel 2014 29 Autio et al 2014 Grimpe amp Hussinger 2013 Audretsch et al 2014b 30 Stam amp Wennberg 2009 Audretsch et al 2014a Garud et al 2014 31 Acs Parsons amp Tracy 2008 Gompers amp Lerner 2004 Croce et al 2013 Wright amp Stigliani 2013 32 De Clercq Sapienza amp Crijns 2005 McDougall-Covin et al 2014 33 Groh Liechtenstein amp Lieser 2012 Lee et al 2015
How to read these pages
0 10 20 30 40 50 60 70
1 Opportunity Perception2 Startup Skills3 Risk Acceptance4 Networking5 Cultural Support6 Opportunity Startup7 Technology Absorption8 Human Capital9 Competition10 Product Innovation11 Process Innovation12 High Growth13 Internationalization14 Risk Capital
2468
2228
1643
3022
3116
3323
18
6
Component scores
Individual score entrepreneurial qualities of the people in the ecosystem
24
0 100Scores
Institutional scorequality of the institutionsthat supportentrepreneurship
3857
Albania
m
Overall GEI score
Global Rank83 of 137
n
Strongest area Weakest areaStartup Skills Risk Acceptance
Country name What rank is this country out of the 137 countries in the 2018 GEI Lower ranks indicate beerperformance
Which of the 14 ecosystem components does this country do the best at
Which of the 14 ecosystem components should the country focus on first to improve the fastest
How does the country score on each of the 14 entrepreneurshipecosystem components Longer bars represent higher scores All scores are shown as percentages
What is the countryrsquos overall GEI score Higher scores are beer and are shown in more intense green All scores are shown as percentages
How does the country score on the half of GEI indicators that represent individuals Higher scores are beer and are shown in more intense green All scores are shown as percentages
How does the country score on the half of GEI indicators that represent instuons
What do the shades of green represent More intense green indicates beer scores
What does each component measure
1 Opportunity Percepon - Can the populaon idenfy opportunies to start a business and does the instuonal environment make it possible to act on those opportunies2 Startup Skills - Does the populaon have the skills necessary to start a business based on their own percepons and the availability of terary educaon3 Risk Acceptance - Are individuals willing to take the risk of starng a business Is the environment relavely low risk or do unstable instuons add addional risk to starng a business4 Networking - Do entrepreneurs know each other and how geographically concentrated are their networks5 Cultural Support - How does the country view entrepreneurship Is it easy to choose entrepreneurship or does corrupon make entrepreneurship difficult relave to other career paths6 Opportunity Percepon - Are entrepreneurs movated by opportunity rather than necessity and does governance make the choice to be an entrepreneur easy7 Technology Absorpon - Is the technology sector large and can businesses rapidly absorb new technology8 Human Capital - Are entrepreneurs highly educated well trained in business and able to move freely in the labor market9 Compeon - Are entrepreneurs creang unique products and services and able to enter the market with them10 Product Innovaon - Is the country able to develop new products and integrate new technology11 Process Innovaon - Do businesses use new technology and are they able access high quality human capital in STEM fields12 High Growth - Do businesses intend to grow and have the strategic capacity to achieve this growth13 Internaonalizaon - Do entrepreneurs want to enter global markets and is the economy complex enough to produce ideas that are valuable globally14 Risk Capital - Is capital available from both individual and instuonal investors
- About The Global Entrepreneurship and Development Institute
- Forward A Compass for Strengthening Entrepreneurship Ecosystems
- The table below shows the rank of each country in the 2018 Index
- The Asia-Pacific region shows greatest strength in Human Capital and Product Innovation ndash on average countries in the Asia-Pacific region have highly educated populations that are well trained in business and able to move freely in the labor market
- The regionrsquos lowest scores on average are in the area of Risk Acceptance If countries in the region improve their overall risk profile as well as the populationsrsquo attitudes towards taking risks it is likely that the entrepreneurship ecosystems in th
- Tech giants dominate the regionrsquos top ranks while lower income agriculture and manufacturing-dependent economies are found closer to the bottom Emerging hotspots for the digital economy are found near the middle of regional ranks China and South K
-
- The pillars of entrepreneurship in the ecosystem are many and complex While a widely accepted definition of entrepreneurship is lacking there is general agreement that the concept has numerous dimensions17F We take this into account in creating th
-