City Commission Annual Retreat January 13, 2021 - Board Docs
Glacier retreat during the recent eruptive period ofPopocatepetl volcano, Mexico
Nuria ANDRES,1 Jose J. ZAMORANO,2 Jose J. SANJOSE,3 Alan ATKINSON,3
David PALACIOS1
1Universidad Complutense de Madrid, Departamento de Geografıa Fısica, 28040 Madrid, SpainE-mail: [email protected]
2Universidad Nacional Autonoma de Mexico, Instituto de Geografıa, 04510 D.F., Mexico3Universidad de Extremadura, Escuela Politecnica, 10071 Caceres, Spain
ABSTRACT. Popocatepetl (19802’N, 98862’W; 5424m) is one of the largest active stratovolcanoes inthe Transmexican Volcanic Belt. A glacier located on the north side has undergone severe ablation sincethe volcano reinitiated eruptive activity in December 1994. In our study, we calculate the extent of theglacier recession and the loss in glacial mass balance during the period of greatest laharic activity(1994–2002), using photogrammetric treatment of 20 pairs of aerial photographs. The results indicatethat from November 1997 to December 2002, the glacier released approximately 3 967000m3 of water.A period of intense glacier melting occurred from 4 November 2000 to 15 March 2001 during whichtime 717000m3 of water was released. Much of the melting was attributed to the pyroclastic flow thattook place on 22 January 2001 and produced a 14.2 km lahar with 68 000m3 of water. Among the manytypes of volcanic events, pyroclastic flows were the most effective in causing sudden snowmelt,although small explosions were also effective since they deposited incandescent material on the glacier.The collapse of the plinian columns covered the glacier with pyroclasts and increased its volume. Theexistence of control points for georeferencing and a knowledge of the topography underlying the glacierprevious to the eruption would have provided more accurate and useful results for hazard prevention.
INTRODUCTION
Popocatepetl is a large stratovolcano (5472m) located inthe centre of the Transmexican Volcanic Belt (198020 N,988620 W), approximately 70 km southeast of Mexico City(Fig. 1).
The volcanic morphology of Popocatepetl’s present conedates from 1200–1100 yr BP (Robin, 1984) after the lastplinian and effusive eruption (Macıas, 2005). In the 16thcentury, Spanish explorers reported the existence of a glacier(Rojas, 1984) on the north face. Volcanic activity occurredfrom the mid 17th century to the early 18th century(Guzman, 1968). Morainic deposits indicate that at max-imum extension, the glacier reached an altitude of 4150m(White, 1981). At the end of the 19th century, travellersnoted that the glacier ice was directly pushing thesemoraines (Palacios, 1996). In 1906, the glacier terminuswas located at 4250m (from interpretation of photograph byAnderson, 1917). Eruptive activity resumed in 1919 con-tinuing until 1927 (Murillo, 1939). A 1945 aerial photograph(World Data Center, USA), shows the terminus at 4650m,but at the end of the 1950s the glacier terminus had moved40m upslope (Lorenzo, 1964). From 1968–78, the glacieradvanced about 100m (Delgado, 1997). During the 1980sthe glacier retreated: the glacial snout in 1983 was at4630m and in 1989 at 4680m (according to aerial photo-graphs from Mexico State). In February 1994, the terminuswas situated at 4702m (Palacios, 1996; Palacios andMarcos, 1998).
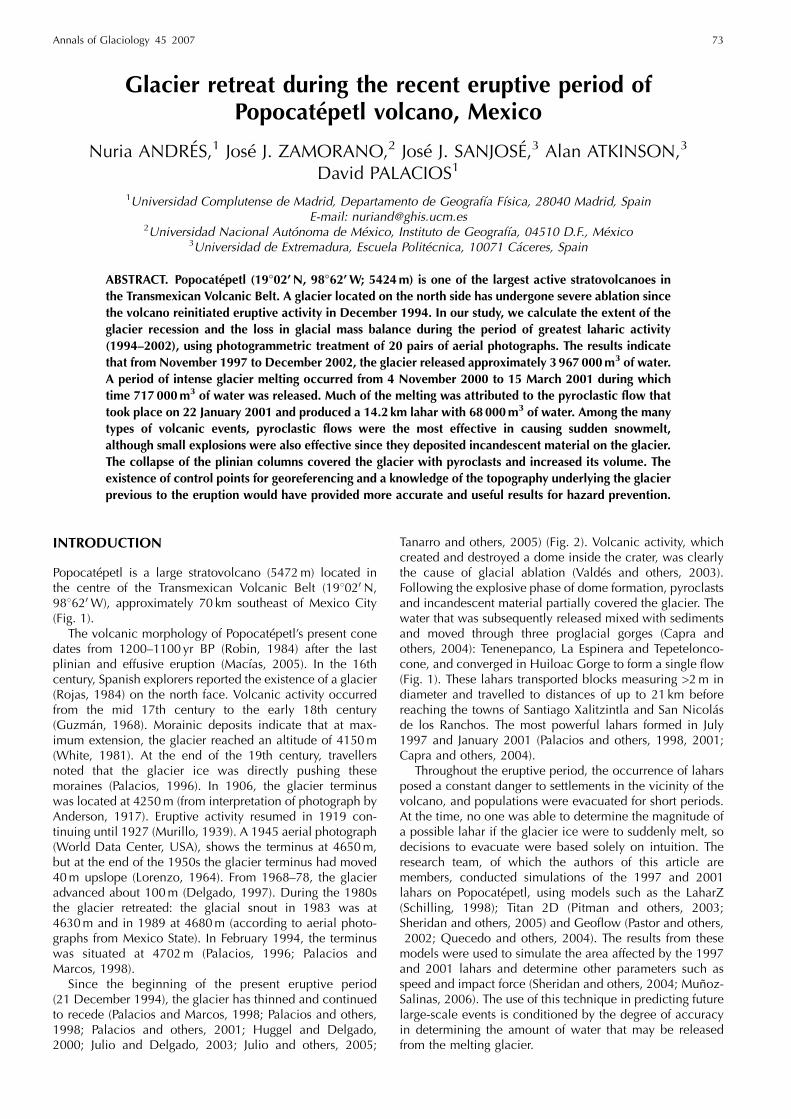
Since the beginning of the present eruptive period(21 December 1994), the glacier has thinned and continuedto recede (Palacios and Marcos, 1998; Palacios and others,1998; Palacios and others, 2001; Huggel and Delgado,2000; Julio and Delgado, 2003; Julio and others, 2005;
Tanarro and others, 2005) (Fig. 2). Volcanic activity, whichcreated and destroyed a dome inside the crater, was clearlythe cause of glacial ablation (Valdes and others, 2003).Following the explosive phase of dome formation, pyroclastsand incandescent material partially covered the glacier. Thewater that was subsequently released mixed with sedimentsand moved through three proglacial gorges (Capra andothers, 2004): Tenenepanco, La Espinera and Tepetelonco-cone, and converged in Huiloac Gorge to form a single flow(Fig. 1). These lahars transported blocks measuring >2m indiameter and travelled to distances of up to 21 km beforereaching the towns of Santiago Xalitzintla and San Nicolasde los Ranchos. The most powerful lahars formed in July1997 and January 2001 (Palacios and others, 1998, 2001;Capra and others, 2004).
Throughout the eruptive period, the occurrence of laharsposed a constant danger to settlements in the vicinity of thevolcano, and populations were evacuated for short periods.At the time, no one was able to determine the magnitude ofa possible lahar if the glacier ice were to suddenly melt, sodecisions to evacuate were based solely on intuition. Theresearch team, of which the authors of this article aremembers, conducted simulations of the 1997 and 2001lahars on Popocatepetl, using models such as the LaharZ(Schilling, 1998); Titan 2D (Pitman and others, 2003;Sheridan and others, 2005) and Geoflow (Pastor and others,2002; Quecedo and others, 2004). The results from thesemodels were used to simulate the area affected by the 1997and 2001 lahars and determine other parameters such asspeed and impact force (Sheridan and others, 2004; Munoz-Salinas, 2006). The use of this technique in predicting futurelarge-scale events is conditioned by the degree of accuracyin determining the amount of water that may be releasedfrom the melting glacier.
Annals of Glaciology 45 2007 73

There is a void in scientific literature regarding therecommended methods for determining the amount of wateravailable during an eruptive period on a volcano covered byglaciers. For this reason it is important to develop andvalidate methods that should be accurate and reasonablyaffordable to civil defence agencies with limited budgets.Mexico’s CENAPRED (Centro Nacional de Prevencion deDesastres – National Hazard Prevention Centre) commis-sioned the Secretariat of Communications and Transport(SCT) of the Mexican government to carry out monthlyphotogrammetric reconnaissance flights over Popocatepetlduring its most active phases to monitor activity inside thecrater. This was the only information available to us on theconditions of the glacier, since access to the volcano by landwas prohibited.
The objective of this study is to apply a quick andinexpensive photogrammetric method to obtain informationon the amount of glacial ice available on an active volcanoduring an eruptive stage. If the application of the methodwere to yield positive results, it would enable civil defenceauthorities to determine the magnitude of a lahar at anygiven time and to adopt the corresponding safety measures.In our study, we used aerial photographs of Popocatepetlfrom 1995 to 2002, which were commissioned by CEN-APRED. Also included in this period are photos taken priorto the eruptive stage.
Other researchers have applied photogrammetric meth-ods to Popocatepetl glacier using different types of instru-ments and techniques, but with the same objective (Huggeland Delgado, 2000; Julio and Delgado, 2003; Julio andothers, 2005; Tanarro and others, 2005) and their resultswere also inconclusive. The present study seeks more usefulresults by increasing the range of dates for the analyses andenhancing imagery.
METHODOLOGYThe first difficulty we encountered in using photogrammetrictechniques to determine the glacier ice mass was that we had
no knowledge of the topography of the glacial bedrock or ofthe approximate thickness of the glacier during the pre-eruptive stage. Most of the INEGI’s (Instituto Nacional deEstadıstica, Geografıa e Informatica – National Institute forStatistics, Geography and Informatics) geodesic controlpoints near the volcano had been lost or destroyed, and formost of the eruptive period, the Mexican army had blockedaccess to the upper cone even for scientific expeditions. Onlyoccasionally were restrictions to other areas lifted, andduring one of these periods we obtained permission to accessthe glacier where we recorded GPS points, measured thedensity and thickness of the ice and confirmed the bound-aries of the glacier covered by ash.
Twenty pairs of aerial photographs taken from November1982 to August 2003, which included shots before and afterthe major volcanic events, were used for the photogram-metric work (Table 1). Traditional aerial photograph inter-pretation provided a method for delimiting the glacieralthough this was complicated by the fact that the surfacewas covered by a thick mantle of pyroclasts and the mostrecent glacier photographs displayed a ruiniform morph-ology similar to that of the surrounding rocky areas. Theseconditions made it necessary to conduct onsite observationsand obtain oblique photographs of the escarpments andcrevasses that were free of ash.
ArcGis-ArcInfo georeferencing tool was used to geo-metrically rectify the photographs and maps. Thirteen UTMcontrol points were selected from existing topographic maps(INEGI, 2000), and several of these points had been GPSgeoreferenced based on geodesic markers from the MexicanNational Network. During the georeferencing process, thecontrol points marked on the photographs were matched totheir corresponding UTM coordinates. The geometric trans-formation was accomplished using a third order polynomialfunction. Following geometric rectification, the area of theglaciers was calculated for each date.
Accurate DEMs had to be generated before calculating thevariation in the volume of the glacier. Only 7 of the 20 pairsof aerial photographs were suitable for photogrammetric
Fig. 1. Location of the Popocatepetl Glacier.
Andres and others: Glacier retreat during recent eruptive period of Popocatepetl74
restitution, which has the following requirements: goodclarity and contrast, similar groundcover, scale and flightaltitude and complete technical data such as cameracertification, fiducial marks and focal length, etc. The 7 datesselected were 17 November 1997; 2 December 1998;20 June 1999; 2 November 2000; 15 March 2001; 17 June2002 and 22 December 2002.
The photographs were scanned using Vexcel UltraScan5000 (21 mm) and digitally rectified with Photopol software.The same 13 control points selected for the ArcGisgeometric transformation were used.
The DEM obtained by digital restitution (topographiccartography to 1:5000 scale, with 10m equidistant contourlines) and the glacier boundary measurements were used tocalculate the change in volume for each pair of dates. Two
different software applications and methods were used tocompare the results and detect possible errors. The first stepwas to calculate the differences between two layers ofaltitudinal data using AutoCad and three distinct methods:(1) altitudinal difference between two layers in grid format;(2) differences between two TIN grids and (3) differencesbetween transversal profiles drawn along a defined axis ontwo compared DEMs.
In the second step we employed the Cut/Fill tool ofArcGis-ArcInfo to calculate the differences in volumebetween two layers in raster format. The final results werederived from the mean values of the estimates obtained fromboth procedures.
The volume of water released by glacier (water equiva-lent) was determined by multiplying the volume of ice lost
Fig. 2. North face of the Popocatepetl volcano in July 2002: the glacier is still visible close to the crater.
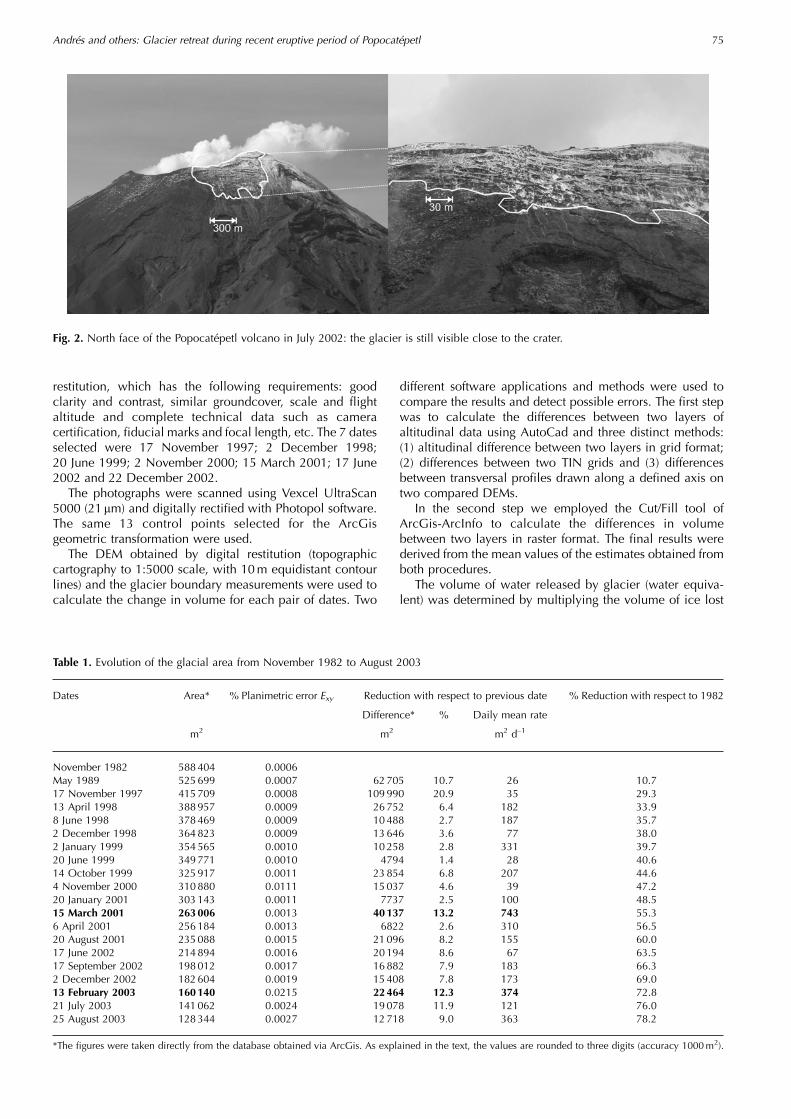
Table 1. Evolution of the glacial area from November 1982 to August 2003
Dates Area* % Planimetric error Exy Reduction with respect to previous date % Reduction with respect to 1982
Difference* % Daily mean rate
m2 m2 m2 d–1
November 1982 588404 0.0006May 1989 525699 0.0007 62705 10.7 26 10.717 November 1997 415709 0.0008 109990 20.9 35 29.313 April 1998 388957 0.0009 26752 6.4 182 33.98 June 1998 378469 0.0009 10488 2.7 187 35.72 December 1998 364823 0.0009 13646 3.6 77 38.02 January 1999 354565 0.0010 10258 2.8 331 39.720 June 1999 349771 0.0010 4794 1.4 28 40.614 October 1999 325917 0.0011 23854 6.8 207 44.64 November 2000 310880 0.0111 15037 4.6 39 47.220 January 2001 303143 0.0011 7737 2.5 100 48.515 March 2001 263006 0.0013 40137 13.2 743 55.36 April 2001 256184 0.0013 6822 2.6 310 56.520 August 2001 235088 0.0015 21096 8.2 155 60.017 June 2002 214894 0.0016 20194 8.6 67 63.517 September 2002 198012 0.0017 16882 7.9 183 66.32 December 2002 182604 0.0019 15408 7.8 173 69.013 February 2003 160140 0.0215 22464 12.3 374 72.821 July 2003 141062 0.0024 19078 11.9 121 76.025 August 2003 128344 0.0027 12718 9.0 363 78.2
*The figures were taken directly from the database obtained via ArcGis. As explained in the text, the values are rounded to three digits (accuracy 1000m2).
Andres and others: Glacier retreat during recent eruptive period of Popocatepetl 75
by 868 kgm–3. This value is the average of the densitiescalculated for several samples obtained from the authors’fieldwork.
Three types of errors were considered in the method-ology: planimetric, altimetric and errors associated with thedelineation of the glacier perimeter. Planimetric error Exy isthe function of two independent errors: absolute orientationused in photogrammetric procedures E1 (�2.5m) and geo-referencing error associated with the photographs and theglacier perimeter E2, which in turn is a function of:
E3, error in photo acquisition determined by the quality ofthe photo resolution. 7100 lines cm–1 is equivalent to0.007mm (0.035m terrain scale).
E4, error in digitization. Photographs were scanned at300 dpi (¼ 118 points cm–1), which translates to0.04mm (0.2m terrain scale).
E5, error in the geometric rectification of the photographsand the glacier perimeter. The average of the RMSEsprocessed using ArcGis is �2.34m. A minimum of12 control points was consistently used to obtain properadjustment.
Thus, the georeferencing error can be calculated as follows:
E2 ¼ffiffiffiffiffiffiffiffiffiffiffiffiffiffiffiffiffiffiffiffiffiffiffiffiffiffiffiE23 þ E2
4 þ E25
q
¼ffiffiffiffiffiffiffiffiffiffiffiffiffiffiffiffiffiffiffiffiffiffiffiffiffiffiffiffiffiffiffiffiffiffiffiffiffiffiffiffiffiffiffiffiffiffiffiffiffi0:00352 þ 0:22 þ 2:342
p
¼ 2:36m:
The total planimetric error is derived from:
Exy ¼ffiffiffiffiffiffiffiffiffiffiffiffiffiffiffiffiE21 þ E2
2
q
¼ffiffiffiffiffiffiffiffiffiffiffiffiffiffiffiffiffiffiffiffiffiffiffiffiffiffi2:52 þ 2:362
p
¼ 3:44m:
The maximum estimated planimetric error is �3.44m(Table 1).
The altimetric error Ez is interpreted as the maximumpossible and takes into account the irregular terrain and theabrupt changes in scale for each photograph. Based on thework scale (1/5000) used in the study, the maximum error isEz ¼ �3.3m (Table 2).
The error associated with the delineation of the glacierperimeter was minimized in accordance with recommenda-tions established by Bolstad and others (1990). The perimeterwas digitized at least 7 times for each date. The error
between boundary differences never exceeded �0.01% ofthe total glacier surface, so the accuracy in determiningthese measurements was considered adequate for the study.
RESULTSGlacial recessionOnce the area analysis of the 20 aerial photographs wascompleted, we quantified the decrease in glacial surfacearea (Table 1). According to the results, the area shrank from588000m2 in November 1982 to 128 000m2 by the end ofAugust 2003, representing a loss of 78.2%. The mostspectacular reduction occurred in less than 6 years fromApril 1998 (389 000m2) to August 2003, and produced a66.7% decrease in surface area (Figure 3 and Table 1).
Variation in glacial volumeThe difference between the November 1977 and December2002 DEMs indicates that the glacier lost 4 570 000m3,equivalent to a thickness of 11.2m and gained 4000m3 nearthe crater during isolated incidents. If we assume that all thelosses were attributed to meltwater, then the equivalentvolume in water would be 3 967000m3. The comparisonsbetween the 7 DEMs (Figure 4 and Table 2) provide a moredetailed explanation of the changes in the glacier during thisperiod. The greatest losses (1 850 000m3) occurred fromNovember 1997 to December 1998. During the 13monthperiod, the thickness of the glacier was reduced by anaverage of 4.34m. The highest daily rate of loss (6000m3 d–1)coincides with the period from November 2000 to March2001, during which time the thickness of the ice was reducedby an average of 2.50m.
The mass balance was positive from June 1999 toNovember 2000, and the thickness increased by an averageof 0.86m. The rate of loss was at its lowest during this period(400m3).
The sum of all the glacial mass lost for each of the periodsstudied totals 4 863 000m3 (4 211000m3 liquid water). Thedifference in mass between this data and that derived from acomparison of the most recent (December 2002) and oldest(November 1998) DEMs was caused by large accumulationsof pyroclasts that occurred throughout the period.
Impact of volcanic activity on glacial recessionVolcanic activity resumed in December 1994, althoughsome small explosions took place on 25 February 1993. Theglacier losses from November 1982 to May 1989 were
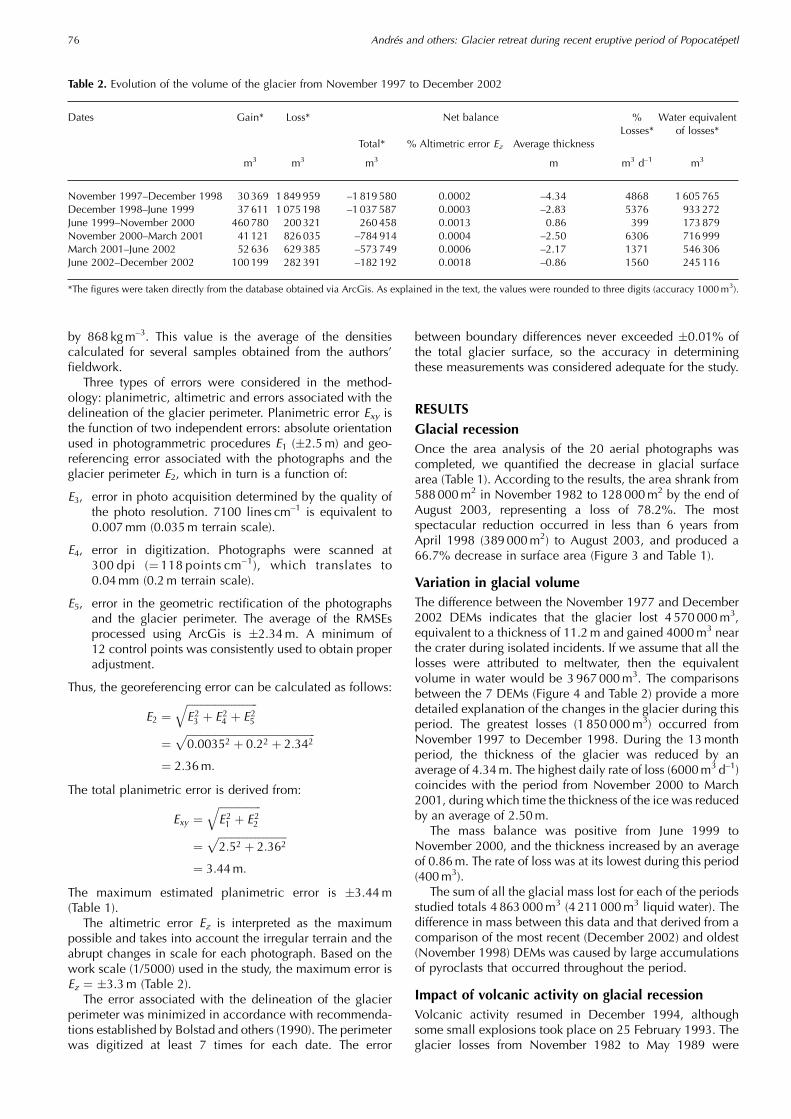
Table 2. Evolution of the volume of the glacier from November 1997 to December 2002
Dates Gain* Loss* Net balance %Losses*
Water equivalentof losses*
Total* % Altimetric error Ez Average thickness
m3 m3 m3 m m3 d–1 m3
November 1997–December 1998 30369 1 849959 –1819580 0.0002 –4.34 4868 1 605765December 1998–June 1999 37611 1 075198 –1037587 0.0003 –2.83 5376 933272June 1999–November 2000 460780 200321 260458 0.0013 0.86 399 173879November 2000–March 2001 41121 826035 –784914 0.0004 –2.50 6306 716999March 2001–June 2002 52636 629385 –573749 0.0006 –2.17 1371 546306June 2002–December 2002 100199 282391 –182192 0.0018 –0.86 1560 245116
*The figures were taken directly from the database obtained via ArcGis. As explained in the text, the values were rounded to three digits (accuracy 1000m3).
Andres and others: Glacier retreat during recent eruptive period of Popocatepetl76

therefore not due to volcanic activity, but to climatic causesas was true of other glaciers in Mexico (Lozano-Garcıa andVazquez-Selem, 2005; Lachniet and Vazquez-Selem, 2005).This tendency continued until the definitive start of volcanicactivity in 1994 (Palacios, 1996; Palacios and Marcos, 1998).
A comparison of the information on volcanic activityprovided by CENAPRED (Valdes and others, 2003) and theresults of our study reveal how this activity interfered withthe evolution of the glacier (Fig. 5).
Unfortunately, restitution from a DEM was impossible forthe period from the start of activity and to the formation ofthe largest recent lahar that occurred on Popocatepetl on
1 July 1997. This flow travelled 21 km through the HuiloacGorge and the authors, members of our lahar research team,estimated that 185 000m3 of material were displaced(Munoz-Salinas and others, 2007). According to Capra andothers (2004), the lahar behaved like a hyperconcentratedflow as it travelled over gradients of up to 6.58, but as thegradient increased to 118 it changed to a debris flow. Onslopes steeper than 118, the lahar transformed to a hyper-concentrated flow. If hyperconcentrated flows are composedof 50% water and debris flows comprise 30% water(Beverage and Cuthbertson, 1964; Pierson and Scott, 1985;Pierson and Costa, 1987; Thouret and Lavigne, 2000), then
Fig. 3. Evolution of the surface of Popocatepetl glacier during present eruptive period. The arrows indicate the date of the aerial photographused in mapping the glacier perimeter (a) from November 1982 to June 1998; (b) from June 1998 to November 2000; (c) from November2000 to June 2002; (d) from June 2002 to August 2003.
Andres and others: Glacier retreat during recent eruptive period of Popocatepetl 77

the lahar would have displaced 150 000m3 of water(Munoz-Salinas, 2007). However, the area lost from May1989 to November 1997, although substantial, is notsignificant if we consider the time elapsed and the influenceof climatic tendencies. The diminished thickness of the icefor this period had to be significant, especially after the greatexplosion of 30 June 1997.
Volcanic activity from November 1997 to December1998 (Tables 1 and 2) was characterized by the constructionof a great dome in December 1997, and its ultimatedestruction during the great explosions of January and March1998. Several small lahars were detected at the time of theseevents. A period of calm began in June, but was interruptedby violent events that took place in November and Decem-ber 1998. On 2 December, the glacial mass balance wasnegative in comparison to November 1997 (Table 2). Theretreating glacier uncovered a large area particularly duringthe first half of the year. The northwest tongue disappeared(Fig. 3a) and the glacier thickness was reduced by 15m. Thetongue in the central sector receded and lost 20m of thick-ness. By April of 1998, the glacier had radically transformedand rapid melting was occurring in the crevasses.
From 2 December 1998 and 20 June 1999 (Tables 1and 2), volcanic activity consisted of great explosions inDecember accompanied by the formation of small lahars.Low intensity explosive activity occurred at the beginning of1999, and by March and April, it had increased (Fig. 5).
Small lahars formed in May and June. The 2 January 1999photo reveals the destructive effects of the previous month’sactivity. The rate of recession is the third highest found inthis study, and the glacier appears to be completely coveredby ash. The June 1999 DEM indicates a negative glaciermass with respect to December. The photo shows that theglacier has lost much of its covering of pyroclasts. The DEMsreveal a significant loss in thickness of >10m in the uppercentral sector of the glacier, near the crater. This wasprobably caused by abrasion from the December 1998pyroclastic explosions.
Volcanic activity from 20 June 1999 and 4 November2000 (Tables 1 and 2) was weak but continuous. The October1999 photograph shows the extent to which the glacier hadretreated. The crevasses are wide open and the body of theglacier is divided into steps that are almost all separated. TheNovember 2000 photograph depicts the glacier havingretreated only slightly more than in October of the previousyear. The glacier is completely blanketed by pyroclasts. TheDEM for this date indicates a positive balance with respect toJune 1999 (Table 2). The continuous but weak volcanicactivity produced a deep layer of pyroclasts that covered theglacier and protected it from melting. The largest accumula-tions of pyroclasts are found near the crater in the eastern halfof the glacier. The increase in volume also occurred in areaswhere the glacier had disappeared. The average increase inglacier thickness was 0.86m although the far western sector
Fig. 4. Evolution of the volume of the Popocatepetl glacier during present eruptive period.
Andres and others: Glacier retreat during recent eruptive period of Popocatepetl78
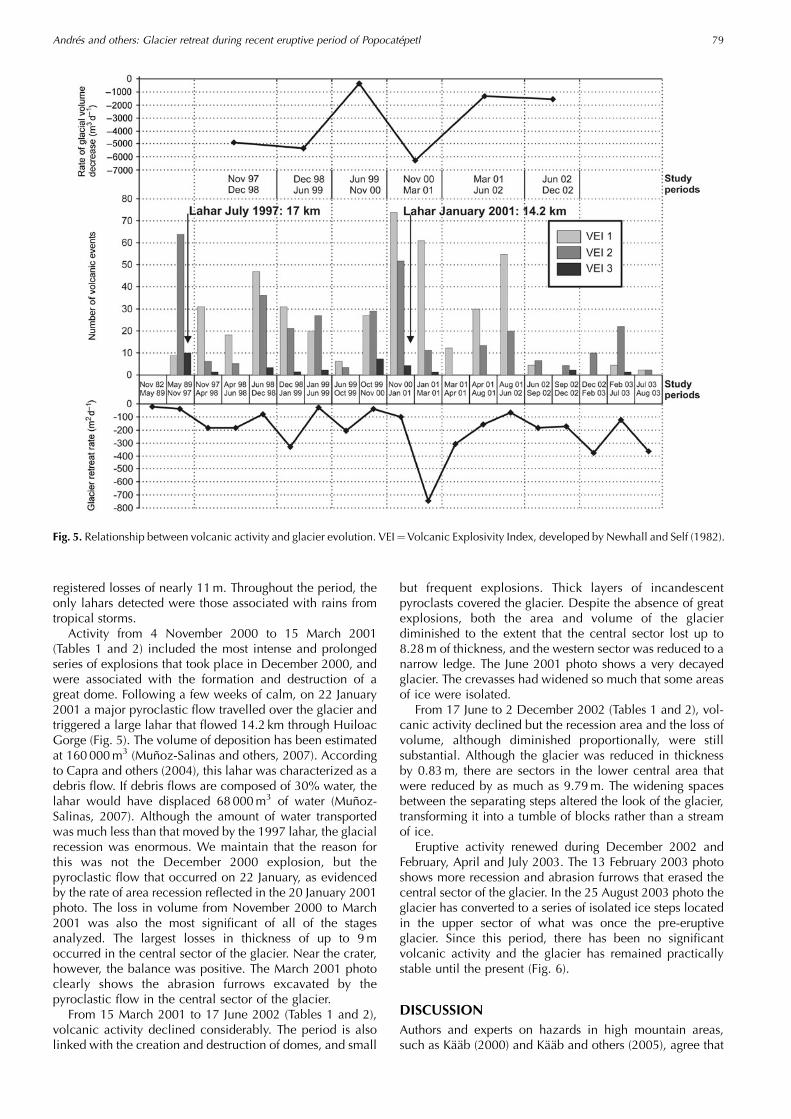
registered losses of nearly 11m. Throughout the period, theonly lahars detected were those associated with rains fromtropical storms.
Activity from 4 November 2000 to 15 March 2001(Tables 1 and 2) included the most intense and prolongedseries of explosions that took place in December 2000, andwere associated with the formation and destruction of agreat dome. Following a few weeks of calm, on 22 January2001 a major pyroclastic flow travelled over the glacier andtriggered a large lahar that flowed 14.2 km through HuiloacGorge (Fig. 5). The volume of deposition has been estimatedat 160 000m3 (Munoz-Salinas and others, 2007). Accordingto Capra and others (2004), this lahar was characterized as adebris flow. If debris flows are composed of 30% water, thelahar would have displaced 68 000m3 of water (Munoz-Salinas, 2007). Although the amount of water transportedwas much less than that moved by the 1997 lahar, the glacialrecession was enormous. We maintain that the reason forthis was not the December 2000 explosion, but thepyroclastic flow that occurred on 22 January, as evidencedby the rate of area recession reflected in the 20 January 2001photo. The loss in volume from November 2000 to March2001 was also the most significant of all of the stagesanalyzed. The largest losses in thickness of up to 9moccurred in the central sector of the glacier. Near the crater,however, the balance was positive. The March 2001 photoclearly shows the abrasion furrows excavated by thepyroclastic flow in the central sector of the glacier.
From 15 March 2001 to 17 June 2002 (Tables 1 and 2),volcanic activity declined considerably. The period is alsolinked with the creation and destruction of domes, and small
but frequent explosions. Thick layers of incandescentpyroclasts covered the glacier. Despite the absence of greatexplosions, both the area and volume of the glacierdiminished to the extent that the central sector lost up to8.28m of thickness, and the western sector was reduced to anarrow ledge. The June 2001 photo shows a very decayedglacier. The crevasses had widened so much that some areasof ice were isolated.
From 17 June to 2 December 2002 (Tables 1 and 2), vol-canic activity declined but the recession area and the loss ofvolume, although diminished proportionally, were stillsubstantial. Although the glacier was reduced in thicknessby 0.83m, there are sectors in the lower central area thatwere reduced by as much as 9.79m. The widening spacesbetween the separating steps altered the look of the glacier,transforming it into a tumble of blocks rather than a streamof ice.
Eruptive activity renewed during December 2002 andFebruary, April and July 2003. The 13 February 2003 photoshows more recession and abrasion furrows that erased thecentral sector of the glacier. In the 25 August 2003 photo theglacier has converted to a series of isolated ice steps locatedin the upper sector of what was once the pre-eruptiveglacier. Since this period, there has been no significantvolcanic activity and the glacier has remained practicallystable until the present (Fig. 6).
DISCUSSIONAuthors and experts on hazards in high mountain areas,such as Kaab (2000) and Kaab and others (2005), agree that
Fig. 5. Relationship between volcanic activity and glacier evolution. VEI¼Volcanic Explosivity Index, developed by Newhall and Self (1982).
Andres and others: Glacier retreat during recent eruptive period of Popocatepetl 79

DEMs provide essential information for quantifying naturalhazards and mapping sensitive areas for emergency re-sponse plans. In environments that are inaccessible ordangerous, DEMs are the only source of information. In ourstudy, DEMs enabled us to determine changes in glaciervolume during a period of time, although they did notdistinguish between types of material (ice or pyroclasts) orindicate the actual amount of ice volume lost in instanceswhen some of the ice volume was later recovered. Due tothese restrictions, we were unable to accurately calculatethe volume of glacial meltwater. Furthermore, the quality ofthe photographs and the difficulties in delimiting theboundaries of the glacier through photo-interpretation mayhave produced serious errors in the data. As a result, ourfindings differed from those of other authors.
Julio and Delgado (2003) used photogrammetric tech-niques to determine the glacial area for 16 December 2000,and calculated the planimetric area to be 209138m2. Incontrast, our study yielded higher areas: 311 000m2 for4 November 2000 and 303000m2 for 20 January 2001.These calculations were for a larger area of the glacier (48.6–44.9% more than the area used by Julio and Delgado). Thediscrepancy in the results is probably due to very differentmethods of photo-interpretation. For example, the 16 De-cember 2000 photo shows the glacier and the entire northslope of Popocatepetl covered by a thick layer of pryroclaststhat had fallen a few days before the photo was taken(Valdes and others, 2003). Such widespread depositionmakes it very difficult to delimit the boundaries of theglacier. The above authors recorded the real area to be255310m2 for 16 December 2000 using 358 mean slope,while our measurements yielded 383000m2 for November2000 which represents 50.1% more surface. Our meanslope according to ArcInfo was 36.068.
Julio and others (2005) calculated the volume of waterreleased for the formation of the largest lahar to occur onPopocatepetl during the most recent eruptive period(22 January 2001), by comparing the area and the volumeof the glacier from 20 January 2001 to 21 February 2001.According to these authors, the area of the glacier was280 357m2 on the first day of the period and 252262m2 onthe last, for a total glacial mass loss of 1 109 800m3. Thearticle does not clarify if these are planimetric or real areas. If
they are planimetric areas, then the results are similar toours. Calculations for our study for 20 January 2001 are only8% higher. We chose 15 March 2001 rather than 21 February2002 for the second date, and the value for surface area wassomewhat greater (4.2%). If the authors refer to the real area,our results for 15 March would be 29.9% higher than theirareas for 21 February. In terms of volume, we calculated aloss of 826 000m3 for the period 4 November 2000 to March2001, which is 284 000m3 less than the other study’s resultsfor the period 20 January to 21 February 2001. The disparityin the findings is difficult to explain, even after taking intoaccount differences in scanning resolutions and software.
Tanarro and others (2005) used photogrammetric tech-niques and traditional photo-interpretation of photographsthat had been geometrically rectified with CADMicroStation(Descartes model) to calculate the glacier surface for only10 dates. Even though the dates of most of the photos weredifferent from those of the 20 pairs used in this study, there islittle discrepancy between our results and theirs. In fact,although our data shows 4800m2 more glacial area forNovember 1982 and June 1999 and 3300m2 less for April1998, the results differ by only �38m2 for the other dates.From these results, it would appear that using differentsoftware (MicroStation and ArcGis-ArcInfo) did not creatediscrepancies in the area calculations.
It is impossible to calculate the total volume of the glacierat any given time without prior knowledge of the topographyof the glacial bedrock. Julio and Delgado (2003) estimatethat the average thickness of the glacier in December 2000was 15m. If we were to use this data to calculate the volumeof the glacier in November 2000 and increase or decrease itdepending on the average thicknesses obtained by GIS forearlier and later dates, the results would not coincide withthe balances obtained through DEMs. At various timesthroughout the study we took field measurements at severallocations on the glacier to determine its average thickness,but despite our careful sampling, the step-like of the bedrockand ruiniform morphology of the glacier were real obstaclesto obtaining accurate results.
CONCLUSIONSIt is essential to know how much water is released by theglacier to quantify inputs for lahar flow simulation models.Volcanic activity makes it very difficult to obtain data for thisparameter, however, because access to areas for onsitemeasurements is impossible. To avoid this problem, ourstudy of Popocatepetl used Digital Terrain Models based onaerial photographs and detailed topographic maps andaccurately tracked the evolution of the glacier using controlpoints. These useful tools enabled us to minimize calculationerrors in our methodology by using precision DEMs, precisegeometric rectifications and powerful software (AutoCad andArcGis). Despite this, errors are inevitable. Our estimates forchanges in volume refer to the overall area contained withinthe glacier boundaries, and do not discriminate betweensnow, ice and pyroclasts. When converting the loss involume to loss of water, a certain amount of volcanicmaterial is mixed with the ice that is released on the slopeand this contributes to an overestimation of water loss. Incontrast, the values for the volume of melted ice may beunderestimated, because pyroclasts accumulated during agiven period may have replaced some of the ice. It is possiblethat these errors may compensate for each other.
Fig. 6. Popocatepetl Glacier on 17 February 2006. The morphologyshown in this photograph has remained stable since August 2003.
Andres and others: Glacier retreat during recent eruptive period of Popocatepetl80
Another problem is that the thickness and surface of theglacier does not change uniformly as the ice recedes. In fact,the greatest melting takes place in the crevasses and seracs.The glacier tends to separate into islets of ice as the crevasseswiden. Occasionally, however, large amounts of pyroclastswill accumulate inside the crevasses thus compensating forthe loss of ice until it is removed by ice melt or a pyroclasticflow. These processes are detectable through detailed photoand fieldwork interpretation but not through DEMs, and theyare almost impossible to quantify.
Despite the errors, the results clearly show that variationsin the volume of the glacier for each period are linked to thetype of volcanic activity occurring at the time. Pyroclastsfrom moderate columns do not have an aggressive effect onthe glacier and, in some cases, may protect it and produce anapparent increase in mass. In contrast, small exhalations arevery aggressive, because the ejecta are still hot when theydescend on the glacier. They also only partially cover thesurface, which lowers albedo. Pyroclastic flows that crossthe glacier are, by far, the volcanic mechanism most capableof abrading the glacier and triggering powerful lahars.
The most significant piece of data obtained was thevolume of water released from November 1997 to December2002: 3 967000m3. Although the period spans five years, themelting occurred in a short interval after important volcanicevents such as the pyroclastic flow that took place on22 January 2001. If events of this type had occurredconsecutively and at short intervals, the amount of waterreleased would have triggered enormous lahars. It is reason-able to assume that such circumstances would constitute anextreme situation and therefore could be considered a worst-case scenario in predicting a major laharic event. If there hadbeen a good network of control points for geoferencing andprior knowledge of the topography of the glacial bedrock, itwould have been possible to quickly and inexpensivelydetermine the amount of water released for every pair ofphotos and dates. For future reference and for volcanoes inother locations, we recommend that this kind of informationbe obtained before eruptions occur.
ACKNOWLEDGEMENTSThe research was funded by a grant from the Spanish Ministryof Education and Science (REN 2003–06388). The authorsthank the Instituto de Geografia, Universidad NacionalAutonoma de Mexico, for financing the fieldwork and forits institutional support. Special thanks go to the Instituto’sgrantees whose research assistance was fundamental to thestudy. The authors also thank G. Sanchez Bocanegro,engineer, and the Departamento de Fotogrametrıa, DireccionGeneral de Carreteras, Secretarıa de Comunicaciones yTransporte of Mexico for providing aerial photographs andCENAPRED for additional aerial photographs and valuablefield information. The authors thank S. Schilling, C. Huggel,J. Walder, G. Clark and an anonymous referee for reviewingthe manuscript and suggesting fundamental improvements.Finally, our appreciation is extended to A. Ferrero for theEnglish translation of this text.
REFERENCESAnderson, T. 1917. Volcanic studies in many lands. London, John
Murray.Beverage, J.P. and J.K. Cuthbertson. 1964. Hyperconcentration of
suspended sediment. J. Hydraul. Eng. ASCE, 90(HY6), 117–126.
Bolstad, P.V., P. Gessler and T.M. Lillesand. 1990. Positionaluncertainty in manually digitized map data. Int. J. Geogr. Inf.Syst., 4(4), 399–412.
Capra, L., M.A. Poblete and R. Alvarado. 2004. The 1997 and 2001lahars of Popocatepetl volcano (Central Mexico): Textural andsedimentological constraints on their origin and hazards.J. Volcan. Geotherm. Res., 131(3–4), 351–369.
Delgado, H. 1997. The glaciers of Popocatepetl Volcano (Mexico):changes and causes. Quaterrnary Int., 43–44(1), 53–60.
Guzman, M. 1968. Las montanas de Mexico. El testimonio de loscronistas. 1980. Mexico, Costa Amic.
Huggel, C. and H. Delgado. 2000. Glacier monitoring atPopocatepetl volcano, Mexico: Glacier shrinkage and possiblecauses. In Hegg, C. and D. Vonder Muhll, eds. Beitrage zurGeomorphologie – Proceedings der Fachtagung der Schweizer-ischen Geomorphologischen Gesellschaft. Birmensdorf, WSL,97–106.
Instituto Nacional de Estadıstica, Geografıa e Informatica INEGI.2000. Huejotzingo. Map no. E14B42. 1:50,000.
Julio Miranda, P. and H. Delgado Granados. 2003. Fast hazardevaluation employing digital photogrammetry: Popocatepetlglaciers, Mexico. Geofis. Int., 42(2), 275–283.
Julio Miranda, P., A.E. Gonzalez-Huesca, H. Delgado Granadosand A. Kaab. 2005. Glacier melting and lahar formation duringJanuary 22, 2005 eruption, Popocatepetl volcano (Mexico).Z. Geomorph. N. P., 140, 93–102.
Kaab, A. 2000. Photogrammetry for early recognition of highmountain hazards: new techniques and applications. Phys.Chem. Earth, 25(9), 765–770.
Kaab, A. and 11 others. 2005. Remote sensing of glacier- andpermafrost-related hazards in high mountains: an overview.Natur. Hazards Earth Syst. Sci. (NHESS), 5, 527–554.
Lachniet, M.S. and L. Vazquez-Selem. 2005. Last Glacial Maximumequilibrium line altitudes in the circum-Caribbean (Mexico,Guatemala, Costa Rica, Colombia, and Venezuela). Quat. Int.,138–139, 129–144.
Lorenzo, J.L. 1964. Los glaciares de Mexico. First edition.Monografıas del Instituto de Geofısica. 1. Mexico, UniversidadNacional Autonoma de Mexico.
Lozano-Garcia, S. and L. Vazquez-Selem. 2005. A high-elevationHolocene pollen record from Iztaccuhuatl volcano, centralMexico. The Holocene, 15(3), 329–338.
Macıas, J.L. 2005. Geologıa e historia eruptiva de algunos de losgrandes volcanes activos de Mexico. Bol. Soc. Geol. Mexicana,LVII(3), 379–424.
Munoz-Salinas, E. 2007. Los lahares del Popocatepetl: tratamientode la informaci’n para la prevenci’n de catastrofes. (PhD thesis,Universidad Complutense de Madrid.)
Munoz-Salinas, E., C.S. Renschler and D. Palacios. 2007. Proposedmethodology for calculating the volume of lahar deposits onPopocatepetl Volcano (Mexico). Geomorphology, In press.
Murillo, G. 1939. La actividad del Popocatepetl. Mexico, Polis.Newhall, C.G. and S. Self. 1982. The volcanic explosivity index
(VEI): an estimate of explosive magnitude for historical volcan-ism. J. Geophys. Res., 87(C2), 1231–1238.
Palacios, D. 1996. The glacio-volcanic evolution of Popocatepetlvolcano: geomorphologic consequences. Geomorphology,16(4), 319–335.
Palacios, D. and J. Marcos. 1998. Glacial retreat and itsgeomorphologic effects on Mexico’s active volcanoes, 1994–95. J. Glaciol., 44(146), 63–67.
Palacios, D., J.J. Zamorano and G. Parrilla. 1998. Proglacial debrisflows in Popocatepetl North Face and their relation to 1995eruption. Z. Geomorph. N. P., 42(3), 273–295.
Palacios, D., J.J. Zamorano and A. Gomez. 2001. The impact ofpresent lahars on the geomorphologic evolution of proglacialgorges: Popocatepetl, Mexico. Geomorphology, 37(1–2), 15–42.
Pastor, M., M. Quecedo, J.A. Fernadez Merodo, M.I. Herreros,E. Gonzalez and P. Mira. 2002. Modelling tailings dams andmine waste dumps failures. Geotechnique, 52(8), 579–591.
Andres and others: Glacier retreat during recent eruptive period of Popocatepetl 81
Pierson, T.C. and K.M. Scott. 1985. Downstream dilution of a lahar:transition from debris flow to hyperconcentrated streamflow.Water Resour. Res., 21(10), 1211–1524.
Pierson, T.C. and J.E. Costa. 1987. A rheologic classification ofsubaerial sediment-water flows. In Costa, J.E. and G.F. Wieczor-ek, eds. Debris flows / avalanches: process, recognition andmitigation. Boulder, CO, Geological Society of America, 1–12.(Reviews in Engineering Geology 7.)
Pitman, E.B., C.C. Nichita, A. Patra, A. Bauer, M. Sheridan andM. Bursik. 2003. Computing granular avalanches and landslides.Phys. Fluids, 15(12), 3638–3646.
Quecedo, M., M. Pastor, M.I. Herreros and J.A. Fernadez Merodo.2004. Numerical modelling of the propagation of fast landslidesusing the finite element method. Int. J. Num. Meth. Eng., 59(6),755–794.
Robin, C. 1984. Le volcan Popocatepetl (Mexique): structure,evolution petrologique et risques. Bull. Volcanol., 47(1), 1–23.
Rojas, G. 1985. Relacion de Cholula. In Acuna, R., ed. RelacionesGeograficas del Siglo XVI: Tlaxcala. UNAM, Mexico. 135–136.
Schilling, S.P. 1998. LAHARZ: GIS Programs for automated map-ping of lahar-inundation hazard zones. U.S. Geological SurveyOpen-File Report 98–638.
Sheridan, M., C. Renschler, L. Mamikawua, E. Munoz andD. Palacios. 2004. Popocatepetl lahars: modeling and fieldobservation contrast. I Conf. Eur. Geophys. Union. Nice, France,231–237.
Sheridan, M.F., A.J. Stinton, A. Patra, E.B. Pitman, A. Bauer andC.C. Nichita. 2005. Evaluating Titan2D mass-flow model usingthe 1963 Little Tahoma Peak avalanches, Mount Rainier,Washington. J. Volcan. Geotherm. Res., 139(1–2), 89–102.
Tanarro, L.M., J.J. Zamorano and D. Palacios. 2005. Glacierdegradation and lahar formation on the Popocatepetl volcano(Mexico) during the last eruptive period (1994–2003). Z. Geo-morph. N. P., 140, 73–92.
Thouret, J.C. and F. Lavigne. 2000. Lahars: occurrence, depositsand behaviour of volcano-hydrologic flows. In Montenat, C., ed.Volcaniclastic Rocks from Magmas to Sediments. Amsterdam,Gordon and Breach Science Publishers, 151–174.
Valdes, C., S. De La Cruz, R. Quaas, E. Guevara, A. Martınez andG. Castelan. 2003. Resumen de la actividad del volcanPopocatepetl. CENAPRED, http://www.cenapred.unam.mx/mvolcan.html
White, S.E. 1981. Neoglacial to recent glacier fluctuations on thevolcano Popocatepetl, Mexico. J. Glaciol., 27(96), 359–363.
Andres and others: Glacier retreat during recent eruptive period of Popocatepetl82
Copyright © 2022 FDOKUMEN