
Ghana's Economic and Agricultural Transformation - Oapen
310
-
Upload
khangminh22 -
Category
Documents
-
view
2 -
download
0
Transcript of Ghana's Economic and Agricultural Transformation - Oapen


Ghana’s Economic and AgriculturalTransformation
OUP CORRECTED PROOF – FINAL, 30/7/2019, SPi

OUP CORRECTED PROOF – FINAL, 30/7/2019, SPi

Ghana’s Economicand AgriculturalTransformation
Past Performance and Future Prospects
Edited by
XINSHEN DIAO, PETER HAZELL,
SHASHIDHARA KOLAVALLI,
AND DANIELLE RESNICK
1
OUP CORRECTED PROOF – FINAL, 30/7/2019, SPi

3Great Clarendon Street, Oxford, OX2 6DP,
United Kingdom
Oxford University Press is a department of the University of Oxford.It furthers the University’s objective of excellence in research, scholarship,
and education by publishing worldwide. Oxford is a registered trade mark ofOxford University Press in the UK and in certain other countries
© International Food Policy Research Institute (IFPRI) 2019
The moral rights of the authors have been asserted
First Edition published in 2019Impression: 1
Some rights reserved. No part of this publication may be reproduced, stored ina retrieval system, or transmitted, in any form or by any means, for commercial purposes,
without the prior permission in writing of Oxford University Press, or as expresslypermitted by law, by licence or under terms agreed with the appropriate
reprographics rights organization.
This is an open access publication, available online and distributed under the terms of aCreative Commons Attribution – Non Commercial 4.0
International licence (CC BY-NC 4.0), a copy of which is available athttp://creativecommons.org/licenses/by-nc/4.0/.
Enquiries concerning reproduction outside the scope of this licenceshould be sent to the Rights Department, Oxford University Press, at the
address above
Published in the United States of America by Oxford University Press198 Madison Avenue, New York, NY 10016, United States of America
British Library Cataloguing in Publication DataData available
Library of Congress Control Number: 2019938558
ISBN 978–0–19–884534–8
Printed and bound in Great Britain byClays Ltd, Elcograf S.p.A.
Links to third party websites are provided by Oxford in good faith andfor information only. Oxford disclaims any responsibility for the materials
contained in any third party website referenced in this work.
Any opinions stated in the book are those of the author(s) andare not necessarily representative of or endorsed by IFPRI.
OUP CORRECTED PROOF – FINAL, 30/7/2019, SPi

Preface
Economic growth accelerated across much of sub-Saharan African (hereinaftercalled Africa) in recent years, and although outpaced by Asia, the rates ofgrowth achieved were nevertheless unprecedented for many countries. This ledto a period of euphoria among many experts who believed African economiesseemed finally to be taking off. Some African countries were even characterizedas African “lions”, counterparts to the so-called Asian “tigers”. However, unlikethe economic transformations of the Asian tigers, rapid urbanization and themovement of workers out of agriculture has not been accompanied by anysignificant growth in industry or export manufacturing, nor has there been anagricultural green revolution. Rather, workers have moved primarily into aburgeoning but low-productivity service sector, and agriculture has remainedlargely traditional with only modest growth in land productivity. There aregrowing concerns that this pattern of transformation may be unsustainable,and at best can lead to only moderate rates of economic growth.
This book explores these issues using Ghana as a case study. Ghana isunusual by African standards in that it is blessed with minerals, favorableagricultural conditions, and easy access to international shipping. The countryhas also been successful in terms of growth in per capita income (PCI) andagricultural output, reductions in poverty, and the achievement of middle-income status and a broadly democratic and peaceful society. Per capitaincomes have grown consistently since the mid-1980s, but at 2.8 percent peryear on average its growth has been less than half of what China and someother East Asian tigers experienced at similar stages of their economic trans-formation and offers only a slow path to greater prosperity. And despite all ofGhana’s latent advantages, the structural changes in the national economyhave been typical of much of Africa, with rapid urbanization without agrowing industrial sector, and a rapidly growing services sector.
This book aims to explain why Ghana has not transformed its economymore substantially, why its agriculture sector—beyond cocoa—has not playeda greater role and explores options for the country’s future transformation.Answering these puzzles and looking prospectively requires both political andeconomic analysis to ensure that potential technical options are also politicallyfeasible.
OUP CORRECTED PROOF – FINAL, 30/7/2019, SPi

The Ghana experience shows that while enabling policies appear necessaryfor achieving and sustaining rapid economic growth, they are not sufficient. Aslate developers, African countries face limited opportunities for export manu-facturing so must depend more on their domestic and regional markets toabsorb increases in output. Since demand in these markets is generally lesselastic than in world markets, sector growth rates are constrained by growth indemand, which in turn depend on growth in national income and its distri-bution. This calls for a more balanced growth strategy than was the case in thetiger economies, with broad support for productivity growth within all sectors,freeing up regional trade within Africa, and overcoming many market andinstitutional failures that constrain private sector development and the effect-iveness of market solutions. Governments need to play more proactive roles inpromoting and guiding their economic transformations, much as happened inthe Asian tigers. However, the ability of governments to play more proactiveroles is constrained by their political and institutional contexts.
With very few exceptions, African government policies towards agricultureover recent decades have ranged from half-hearted to detrimental, despiteenormous opportunities to grow the sector through productivity-enhancingtechnologies. Ghana, for example, spends very little on agricultural develop-ment beyond its cocoa sector, and changing this political dynamic is not easy,complicated by the varying agendas and off budget projects of both successiveexecutives and different donors that undermine a more coherent strategy.Even where political factors are more enabling, public sector capabilities totake more proactive approaches are limiting, the result of years of institutionalneglect by governments and donors. For example, Ghana’s few attempts topartner with the private sector to fix market failures along important valuechains for some promising manufacturing and agriculture commodities havenot been particularly successful.
In the end, whether countries like Ghana can sustain or even increase theirpast rates of economic growth will come down to government effectiveness infinding solutions to the bottlenecks in key segments of the industrial andagricultural sectors. It will also require government willingness to engage morewidely with the private sector, and the development of innovative institutionalarrangements for moving the agenda forward despite remaining weak publicsector capacities and market failures.
OUP CORRECTED PROOF – FINAL, 30/7/2019, SPi
vi

Acknowledgments
This book draws on the extensive work undertaken by IFPRI’s Ghana StrategySupport Program (GSSP) since 2005. The idea of a book emerged from aconference on Transforming Agriculture held in Accra, November 8–9, 2012.It soon became evident, however, that additional research was needed beyondthe conference papers to fully address Ghana’s transformation issues, and thisled to a concerted research effort over the subsequent five years. The authorsare very grateful to all the contributors to this book for fitting this work intotheir already busy schedules. They are also grateful to Alejandro Nin-Pratt forproviding an update of his earlier work on the relationship between popula-tion density and the purchase of modern inputs and the value of output/ha indifferent ecological zones in Ghana, which is included in Chapter 4. Specialmention must also be made to Peixun Fang and Jane Lole for the excellentresearch support they provided for various chapters. The authors thankSpringer for allowing the re-printing of a map in chapter 4 that originallyappeared in Agriculture and Human Values (“Changes in Ghanaian farmingsystems: stagnation or a quiet transformation?”) and Elsevier for agreeingto re-print some material in chapter 5 that previously appeared in WorldDevelopment (“Cities and rural transformation: A spatial analysis of rurallivelihoods in Ghana”).
This book would not have been possible without the sustained fundingsupport for the GSSP provided by USAID (from both the Ghana countrymission and the Bureau for Food Security (BFS) in Washington, DC), andfrom IFPRI and the CGIAR’s Research Program of Policies, Institutions andMarkets (PIM).
Finally, we would like to dedicate this book to the memory of EduardoMagalhaes who sadly and prematurely passed away in August 2017. Inaddition to contributing as an author of Chapter 4, Eduardo provided out-standing statistical support for much of the research underlying this book. Hewill be greatly missed.
OUP CORRECTED PROOF – FINAL, 30/7/2019, SPi

OUP CORRECTED PROOF – FINAL, 30/7/2019, SPi

Contents
List of Figures and Map xiList of Tables xiiiList of Contributors xvii
1. Introduction 1Xinshen Diao, Peter Hazell, Shashidhara Kolavalli, andDanielle Resnick
I . GHANA ’S ECONOMIC TRANSFORMATION
2. Ghana’s Economy-wide Transformation: Past Patterns andFuture Prospects 19Xinshen Diao and Peter Hazell
3. Strong Democracy, Weak State: The Political Economy ofGhana’s Stalled Structural Transformation 49Danielle Resnick
II . AGRICULTURE ’S ROLE IN GHANA ’STRANSFORMATION
4. Ghana’s Agricultural Transformation: Past Patterns andSources of Change 97Peter Hazell, Xinshen Diao, and Eduardo Magalhaes
5. Urbanization and its Impact on Ghana’s Rural Transformation 121Xinshen Diao, Eduardo Magalhaes, and Jed Silver
6. Agricultural Transformation in the Savannah: Perspectivesfrom the Village 142Michael Johnson, Nazaire Houssou, Shashidhara Kolavalli,and Peter Hazell
7. Public Expenditure on Agriculture and its Impact 170Samuel Benin
8. Developing Agricultural Value Chains 210Shashidhara Kolavalli
OUP CORRECTED PROOF – FINAL, 30/7/2019, SPi

9. Unleashing the Power of Mechanization 241Xinshen Diao, Frances Cossar, Nazaire Houssou, andShashidhara Kolavalli
10. Future Prospects 257Xinshen Diao, Peter Hazell, Shashidhara Kolavalli, andDanielle Resnick
Index 277
OUP CORRECTED PROOF – FINAL, 30/7/2019, SPi
x

List of Figures and Map
Figures
1.1a. GDP shares of agriculture, manufacturing, and services in thenational economy, Africa averages and Ghana (%) 2
1.1b. Employment shares of agriculture, industry, and services in totalemployment, Africa averages and Ghana (%) 2
2.1. Sector shares of GDP 21
2.2. Annual growth rates of value-added per worker and GDPper capita in 1984–2011 (%) 24
2.3. Sector allocation of increased employment 27
3.1. Average nominal rates of assistance for all agriculture in Ghana (%) 63
3.2. Shifts in sectoral public expenditures, 1980–2007 65
3.3. Trends in Ghana’s governance profile, 2000–14 70
3.4. Domestic credit to the private sector (average % of GDP) 75
4.1. Distribution of increases in food crop areas and annual growth ratesby region 103
4.2. Trends in land and labor productivity, 1991–2011 106
4.3a. Patterns of intensification against population density in theforest zone comparing full sample with least and most cost-efficientfarmers 116
4.3b. Patterns of intensification against population density in the savannahzone comparing full sample with least and most cost-efficient farmers 117
5.1. Annual growth rate in the population between census years,and urban population share in census years, 1960–2010 122
5.2. Annual growth rate in employment between census years andagricultural share of total employment in census years, 1960–2010 123
5.3. Ghana map showing the different types of districts 125
5.4. Shares of no-land households and households with cultivated landless than 2 ha by types of district groups 128
5.5. Average farm size (ha) by farm size group, rural households, 2005/6and 2012/13 133
6.1. Changes in labor and land productivity by farm size, representativevillage in the transition zone, 1990–2010 157
OUP CORRECTED PROOF – FINAL, 30/7/2019, SPi

6A.1. Crop rotations between maize and legume (groundnuts or cowpeas)for a one-acre plot example and between two growing seasonsin the Ejura area 165
6A.2. Gross margins and annual price trends in Ejura, 1980–2015(constant 2015 US$/kg) 168
7.1. Agricultural public expenditure in Ghana by subsector, 1961–2012 172
7.2. Agricultural output per hectare by subsector in Ghana, 1961–2012 172
7.3. Ratio of agricultural public expenditure to output by subsectorin Ghana, 1961–2012 173
7.4. Government recurrent and developmental expenditures inagriculture (2000 GHS, millions) 182
9.1. Tractor imports, 2003 to 2012 242
9.2. R-value measure of farming system evolution in Ghana, 1961–2011 244
Map
4.1. Ecological zones of Ghana 101
OUP CORRECTED PROOF – FINAL, 30/7/2019, SPi
xii

List of Tables
2.1. Countries with uninterrupted per capita GDP growth for thirty years 20
2.2. Changes in sector GDPs and sector shares over 1975–2016, selectedyears 22
2.3. Growth in per capita GDP, labor productivity, and total factorproductivity (%) 25
2.4. Annualized growth rate in employment for Ghana and by sector (%) 26
2.5a. Employment structure of private non-agriculture by formal/informal,rural/urban, and industry in 2000 28
2.5b. Employment structure of private non-agriculture by formal/informal,rural/urban, and industry in 2010 29
2.6. Contribution of the informal and formal sectors to the national increasein total employment over 2000 to 2010; by sector and rural and urban (%) 30
2.7. A typology of growth strategies, growth patterns, and outcomes 32
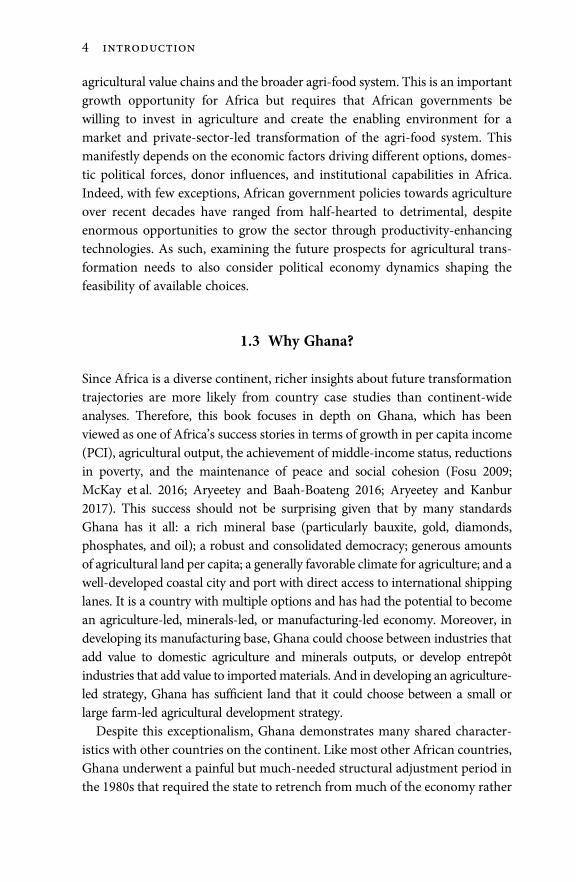
2.8. Key model coefficients: Sector-wise labor productivity,and GDP and employment shares, 1984, 2000, and 2011 35
2.9. Decomposition of Ghana’s economy-wide labor productivitygrowth in 1984–2011 and 2000–11 (results sum to total growthrate for economy each period) 36
2.10. Contributions of each sector to Ghana’s economy-wide laborproductivity growth in 1984–2011 and 2000–11 (% shares) 38
2.11. Shares of value-added and employment and labor productivity forthree groups of manufacturing firms in Ghana 42
3.1. Timeline of political regimes and governments since Ghana’sIndependence 59
3.2. Comparisons of public management across selected Africancountries (Ibrahim Index of African Governance, ranging from 0–100) 71
3.3. Comparisons of domestic credit to the private sector (% of GDP), 2014 75
3.4. Sources of communal conflict in Ghana 77
4.1. Annualized growth rates of value of output by commodity groups,1994–2013 98
4.2. Composition of crop agriculture, 2012 99
4.3. Growth in crop area, output, and yield, by period (%/year) 100
OUP CORRECTED PROOF – FINAL, 30/7/2019, SPi

4.4. Growth in value added/ha and crop area, by commodity,1995–2013 (%/year) 100
4.5. Production of major food crops by agroecological zone, 2010–12averages 102
4.6. Fertilizer use (tons of nutrients) 103
4.7. Share of rural households using modern inputs and hired labor (%) 104
4.8. Growth in national and agricultural labor forces 105
4.9. Agricultural wages in Ghana, 1991–2012, by type of work (new cedis,deflated by CPI) 105
4.10. Changes in the size distribution of farms amongst rural households (%) 106
4.11. Distribution of farms and operated area by farm size groups,1992 and 2012 107
4.12. Composition of farm household by type of livelihood strategy 108
4.13. Changes in household and per capita expenditure, 2005/6 and2012/13 109
4.14. Annualized growth rates in crop prices, 1998–2012 (%) 111
4.15. Annualized growth rates in input prices, 1998–2012 (%) 111
4.16. Changes in rural population density, 1991–2013 114
5.1. Population densities by district group, 2000 and 2010 (people/km²) 126
5.2. Distribution of rural households by agricultural, nonagricultural,and mixed occupations across district groups (each type ofdistrict’s total rural households = 100) 127
5.3. Types of primary employment amongst non-agriculture-onlyhouseholds, by district type, 2000 and 2010 129
5.4. Rural poverty rate in the north and south across district groups 130
5.5a. Shares of rural households by farm size and district group, 2005/6 132
5.5b. Shares of rural households by farm size and district group, 2012/13 132
5.6. Share of rural farm households using organic and inorganicfertilizer, 2012/13 134
5.7. Share of rural farm households using herbicides or insecticides,2012/13 135
5.8. Share of rural households using mechanization, 2012/13 135
5.9. Probit model regressions for input use, pooled data of GLSS5and GLSS6 137
6.1. Location and names of the selected villages 143
6.2. Changes in village population, 2000 to 2010 144
6.3. Changes in cultivated farm size distribution (%) 145
OUP CORRECTED PROOF – FINAL, 30/7/2019, SPi
xiv

6.4. Trends in the share of farmers renting mechanical equipment,by farm size 148
6.5. Selected farm input costs (% of total crop expenditure) 150
6.6. Trends in maize yields (t/ha) 150
6.7. Value of agricultural production, income, and consumptionexpenditures (real US$) 151
6.8. Model results for the average farm in the representative transitionzone village, 1990, 2000, and 2010 154
6.9. Selected model results by farm size group, representative villagein the transition zone, 1990, 2000, and 2010 156
6.10. Decomposition of changes in selected variables by farmsize group, representative village in the transition zone, 1990–2010 159
6A.1. Summary description of model parameters and variables 162
6A.2. Percent shares in the type of land available by farm type and foreach decade (1990–2010) 164
6A.3. Maize yields by type of seed and responses to fertilizer 167
7.1. Data sources for public spending and agricultural output, 1961–2012 171
7.2. Agricultural expenditure and output per hectare by subsectorin Ghana, 1961–2012 173
7.3. Government expenditures on agriculture and rural development(2000 GHS, millions) 181
7.4. Government expenditures, by sector 182
7.5. Description and summary statistics of variables, 1961–2012annual average 187
7A.1. Data and sources on public expenditures in Ghana, 1961–2012 196
7A.2. Sources of data for the variables used in the regression analysis,1961–2012 198
7B.1. Stationarity test results for level and first difference of dependentvariables, 1961–2012 200
7B.2a. Determinants of agricultural expenditure on cocoa and noncocoasubsectors in Ghana (with total agricultural output), 1961–2012 202
7B.2b. Effect of agricultural expenditure on total agricultural outputin Ghana, 1961–2012 203
7B.3a. Determinants of agricultural expenditure on cocoa and noncocoasubsectors in Ghana (with subsector agricultural output), 1961–2012 204
7B.3b. Effect of subsector agricultural expenditure on subsectoragricultural output in Ghana, 1961–2012 205
8.1. Requirements for improving quality in selected value chains 228
9.1. Share of rural households using mechanization (percent) 243
OUP CORRECTED PROOF – FINAL, 30/7/2019, SPi
xv

9.2. Crop area per rural person, by region, 2000 and 2010 246
9.3. Changes in the farm size distribution, 2005/6 and 2012/13 247
9.4. Summary of Ghana’s current supply models for agriculturalmechanization 253
OUP CORRECTED PROOF – FINAL, 30/7/2019, SPi
xvi

List of Contributors
Samuel Benin is the deputy director for IFPRI’s Africa Regional Office.
Frances Cossar is a post-doctoral researcher in land use and food security at theUniversity of Edinburgh and former research analyst at IFPRI.
Xinshen Diao is a senior research fellow and deputy division director of the Devel-opment Strategy and Governance division at IFPRI.
Peter Hazell is an independent researcher, and former director of the DevelopmentStrategy and Governance division at IFPRI.
Nazaire Houssou is an Economic Growth Specialist at USAID-Benin and was a formerresearch fellow for IFPRI’s Ghana Strategy Support Program.
Michael Johnson is the director of agriculture science, technology, and innovation atthe Foundation for a Smoke-Free World.
Shashidhara Kolavalli is an independent researcher. He also was the former countryleader for IFPRI’s Ghana Strategy Support Program.
Eduardo Magalhaes was an independent consultant and former research analyst atIFPRI.
Danielle Resnick is a senior research fellow and governance theme leader in theDevelopment Strategy and Governance division at IFPRI.
Jed Silver is PhD student at the University of California, Berkeley and a former seniorresearch assistant at IFPRI.
OUP CORRECTED PROOF – FINAL, 30/7/2019, SPi

OUP CORRECTED PROOF – FINAL, 30/7/2019, SPi

1Introduction
Xinshen Diao, Peter Hazell, Shashidhara Kolavalli,and Danielle Resnick
1.1 Introduction
Economic growth accelerated across much of sub-Saharan African (herein-after called Africa) during 2005–15 (Badiane and Makombe 2014; Rodrik2018). Although outpaced by Asia, the rates of growth achieved were never-theless unprecedented for many African countries and led to a period ofeuphoria among many experts who believed African economies seemed finallyto be taking off. During this period, a number of African countries graduatedto “lower-middle-income” status and excitement grew about the rise ofAfrica’s expanding middle class (Ncube and Lufumpa 2015; Shimeles andNcube 2015). As should be expected, this growth was accompanied by struc-tural changes in the composition of national economies (Rodrik 2018). Agri-culture shrank as a share of both national GDP and the total labor force, andurbanization proceeded rapidly. Already, nearly 40 percent of the populationin Africa is urbanized, and the UN projects that by 2050 the urban populationshare will reach 56 percent (UN 2014).
However, unlike most of today’s rich countries, and many Asian and LatinAmerican countries, this growth was not driven by workers moving intoindustry. Rather, inmuch of Africa, industry at large, includingmanufacturing,has remained flat while workers have moved into a burgeoning services sector.The services sector is now the largest sector in Africa, and already accounts forover half of Africa’s total GDP (Figure 1.1). Yet an economic transformationbased predominantly on services is problematic because much of the sectorcomprises informal, labor-intensive activities, with labor productivity that islittle, if any, better than traditional agriculture. These kinds of services do notoffer realistic pathways to creating the number and types of productive jobsneeded to raise living standards for most Africans (McMillan, Rodrik, andSepúlveda 2017). For that, it is necessary to grow the industrial sector, ideallyexport manufacturing, which can absorb large numbers of semi-skilled workers,
OUP CORRECTED PROOF – FINAL, 29/7/2019, SPi

and/or grow the more productive parts of the agricultural sector, such asnontraditional exports. Moreover, unlike manufacturing or nontraditional agri-culture, whose outputs can be exported, services are mainly consumed in thedomestic market and their growth is constrained by growth in national demand.
0.0
10.0
20.0
30.0
40.0
50.0
60.0
1984 1986 1988 1990 1992 1994 1996 1998 2000 2002 2004 2006 2008 2010 2012 2014 2016
Ag, SSA Ag, GHAMfg, SSA Mfg, GHASer, SSA Ser, GHA
Figure 1.1a. GDP shares of agriculture, manufacturing, and services in thenational economy, Africa averages and Ghana (%)Note: SSA is a simple average of shares for thirty-three SSA countries with data available in all years forall the three sectors in World Development Indicators, excluding South Africa.
Source: Authors’ calculation using data from World Development Indicators.
0.0
10.0
20.0
30.0
40.0
50.0
60.0
70.0
1991 1993 1995 1997 1999 2001 2003 2005 2007 2009 2011 2013 2015 2017
Ag, SSAInd, SSASer, SSA
Ag, GHAInd, GHASer, GHA
Figure 1.1b. Employment shares of agriculture, industry, and services in totalemployment, Africa averages and Ghana (%)Note: SSA is a simple average of shares for thirty-seven SSA countries with data available in all years forall the three sectors in World Development Indicators, excluding South Africa.
Source: Authors’ calculation using data from World Development Indicators.
OUP CORRECTED PROOF – FINAL, 29/7/2019, SPi
2

Thus, service-led transformation can only take African countries so far, and willat best lead to modest rates of national economic growth (Rodrik 2018;McMillan, Rodrik, and Sepúlveda 2017).
Why have African economies developed in this way and why has industri-alization been so difficult to achieve? And if industrialization is going to bedifficult to achieve for African countries, what viable policy options exist togenerate sustainable structural transformations in the region? To tackle theseimportant questions in a tractable manner, this book focuses on the experienceof one country—Ghana—and examines the country’s overall economic per-formance since it went through a major Structural Adjustment Program (SAP)in the early 1980s and provides a detailed analysis of the performance of theagricultural sector. In so doing, the book aims to explain why Ghana has nottransformed its economy more substantially, why its agriculture sector—beyond cocoa—has not played a greater role, and what it must do in the futureif it is to continue with a successful transformation. Addressing these puzzlesrequires integrating economic and political analyses. Finally, the book con-siders what the rest of Africa can learn from Ghana’s experience.
1.2 Why Agriculture?
If, as much economic opinion suggests, it is going to be a difficult and slowprocess for Africa to become amajor manufacturing hub like Asia (Kormawa andJerome 2014), then exploiting opportunities for promoting growth of productivejobs outside manufacturing will be essential. One of the more promising optionslies in transforming agriculture because it is still the dominant employer in Africaand faces a rapidly growing market at both country and continental levels.Africa’s demand for food is growing fast and is projected to more than doubleby 2050 (Badiane and Ulimwengu 2017), driven by population growth, risingincomes, rapid urbanization, changes in national diets towards greater consump-tion of higher value fresh and processed foods, and more open intra-regionaltrade policies. Moreover, agricultural growth helps leverage rapid growth in thelarger agri-food system, including agro-processing and trading. The World Bank(2014) estimates that African agribusiness (defined to include all aspects of theagri-food system except on-farm production) could become a $1 trillion marketby 2030 (in 2010 prices), and that does not include the value of the additionalagricultural production that will be needed to support growth in agribusiness.
Exploiting this potential will require a major shift from traditional to moreproductive and market-driven farming practices, as well as the development of
OUP CORRECTED PROOF – FINAL, 29/7/2019, SPi
3
agricultural value chains and the broader agri-food system. This is an importantgrowth opportunity for Africa but requires that African governments bewilling to invest in agriculture and create the enabling environment for amarket and private-sector-led transformation of the agri-food system. Thismanifestly depends on the economic factors driving different options, domes-tic political forces, donor influences, and institutional capabilities in Africa.Indeed, with few exceptions, African government policies towards agricultureover recent decades have ranged from half-hearted to detrimental, despiteenormous opportunities to grow the sector through productivity-enhancingtechnologies. As such, examining the future prospects for agricultural trans-formation needs to also consider political economy dynamics shaping thefeasibility of available choices.
1.3 Why Ghana?
Since Africa is a diverse continent, richer insights about future transformationtrajectories are more likely from country case studies than continent-wideanalyses. Therefore, this book focuses in depth on Ghana, which has beenviewed as one of Africa’s success stories in terms of growth in per capita income(PCI), agricultural output, the achievement of middle-income status, reductionsin poverty, and the maintenance of peace and social cohesion (Fosu 2009;McKay et al. 2016; Aryeetey and Baah-Boateng 2016; Aryeetey and Kanbur2017). This success should not be surprising given that by many standardsGhana has it all: a rich mineral base (particularly bauxite, gold, diamonds,phosphates, and oil); a robust and consolidated democracy; generous amountsof agricultural land per capita; a generally favorable climate for agriculture; and awell-developed coastal city and port with direct access to international shippinglanes. It is a country with multiple options and has had the potential to becomean agriculture-led, minerals-led, or manufacturing-led economy. Moreover, indeveloping its manufacturing base, Ghana could choose between industries thatadd value to domestic agriculture and minerals outputs, or develop entrepôtindustries that add value to importedmaterials. And in developing an agriculture-led strategy, Ghana has sufficient land that it could choose between a small orlarge farm-led agricultural development strategy.
Despite this exceptionalism, Ghana demonstrates many shared character-istics with other countries on the continent. Like most other African countries,Ghana underwent a painful but much-needed structural adjustment period inthe 1980s that required the state to retrench from much of the economy rather
OUP CORRECTED PROOF – FINAL, 29/7/2019, SPi
4

than take a proactive role. In the 1990s, Ghana was part of the “third wave” ofdemocratization (Huntington 1991) that swept the region, which elevated therole of voter preferences and non-state actors, including civil society organ-izations, in the policy arena. Around the same time, Ghana also embraceddecentralization and, like Kenya, Zambia, and other countries, increasinglyhas devolved subnational agricultural functions to locally elected govern-ments. Collectively, these processes have resulted in more pressures and actorsinvolved in the broader economy and the agricultural sector.
In addition, just as unemployment is one of the most pressing concerns forAfrica, the lack of productive jobs for a large share of workers is problematic inGhana, especially as there are growing concerns about its future growthprospects (Aryeetey and Kanbur 2017). Per capita incomes have grown con-sistently since the mid-1980s; but, at 2.8 percent per year on average, itsgrowth is much lower than achieved in many Asian countries that started atsimilar levels of per capita incomes in the 1960s. Moreover, despite all ofGhana’s latent advantages, the structural changes in the national economyhave been typical of much of Africa, with “urbanization without industrializa-tion” (Gollin et al. 2016), and a rapidly growing services sector (see Figure 1.1again). Although Ghana has done well with its minerals and cocoa exports, ithas been less effective at producing more manufactured and nontraditionalagricultural exports for the world and West African regional markets. In fact,the country seems unable to compete more effectively with imports like rice,poultry, processed foods, or manufactured consumer goods that are taking largeshares of its rapidly growing domestic markets. Enhancing exports or importsubstitutes in these areas promise to create many jobs, boost national per capitaincome, absorb a growing labor force, and enable more workers to shift out oftraditional agriculture.
In other words, the Ghanaian experience is typical of the broader Africanstruggle for sustainable structural change. Agriculture offers options for improv-ing transformation, and this book contextualizes the viability of those optionsgiven political economy constraints, past investment decisions, and the broaderglobal environment in which Ghana, and much of Africa, must now compete.
1.4 Overview
The book is organized in two parts. Part I focuses on Ghana’s overall economicdevelopment, describing the economic transformation that has occurred sinceIndependence in 1957, the political forces that have shaped it, and the
OUP CORRECTED PROOF – FINAL, 29/7/2019, SPi
5

prospects for future growth. Part II is concerned with the role played by theagricultural sector in Ghana’s transformation, the reasons why the sector hasnot been more of a driving force in Ghana’s economic transformation, andagain the prospects for future growth.
1.4.1 The National Economic Transformation
Following Independence, Ghana launched a state-led program of industrial-ization and large-scale state-owned farming, and a series of heavily subsidizedprograms of support for smallholder production of prioritized food staples.Most of these initiatives failed or became financially unsustainable, contributingto a turbulent period of economic and political crises, during which time theeconomy shrank by nearly one third. In 1984, a new revolutionary governmentled by Jerry Rawlings began to implement a series of major economic reforms aspart of a Structural Adjustment Program (SAP) supported by the IMF andWorld Bank. Together with a return to democratically elected government in1992, the SAP helped turn the economy around and embed a basic market-leddevelopment strategy in which the government focused primarily on creating anenabling economic environment rather than trying to promote specific lines ofeconomic activity. While many other countries also adopted a similar SAP,Ghana implemented its reform program more comprehensively than most. Theeconomy began to grow almost immediately after the SAP was launched, andGhana has succeeded in achieving uninterrupted growth in annual per capitaincome (PCI) for more than thirty years, an achievement matched by only fiveother developing countries in the developing world, including just two in Africa(Botswana and Mauritius).
This growth was accompanied by significant changes in the economicstructure of the country. However, as noted above, while agriculture’s relativeimportance in national GDP and employment shrank, it was not replaced inrelative importance by a rapidly growing industrial or manufacturing sector.Rather it was the services sector that took off, and today accounts for morethan half of national GDP and 45 percent of national employment. At thesame time the industrial sector stagnated, and its manufacturing componentshrank from 12 percent of national GDP in 1985 to a mere 5 percent in 2014.Ghana has also rapidly urbanized, and today more than half the populationlives in urban areas. Gollin et al. (2016) have characterized the rapid growth ofGhana’s urban centers with their heavy economic reliance on services as“consumption cities”.
OUP CORRECTED PROOF – FINAL, 29/7/2019, SPi
6

What have been the predominant sources of labor productivity growth inGhana to explain these patterns? And is this productivity growth sustainable?Since labor productivity is a key determinant of national per capita income(PCI), Chapter 2 addresses these questions in detail. Average PCI has grownby 2.8 percent per annum on average since 1984, a rate fast enough to doublethe PCI every twenty-five years. This correlates highly with the gains in laborproductivity over the same period. Using an analytical framework developedby Rodrik (2014), Chapter 2 shows that the predominant source of laborproductivity growth in Ghana has come from productivity increases withinsectors, with the agricultural sector showing a particularly strong performance.Rodrik attributes this source of growth to what he calls “fundamental capabil-ities,” or the longer-term benefits from investments in better institutions,healthier and better educated workers, technologies, and more enabling pol-icies. Another source of productivity growth arises from the movement ofworkers from low to higher productivity sectors, (e.g., from traditional agricul-ture to manufacturing). Rodrik calls this the gains from “structural change,”which result from changes in the relative importance of different sectors innational income and employment.
In Ghana, about 75 percent of total growth in labor productivity between1984 and 2011 was attributable to within-sector labor productivity growth andonly 25 percent to structural change. This not only is very different from thepattern observed in many Asian countries, but also is even unusual by Africanstandards, where the movement of workers to higher productivity sectors isusually an important source of labor productivity growth during the earlystages of a country’s economic transformation. The reason for the low gain inlabor productivity from structural change in Ghana is that so many workershave moved from agriculture to the services sector, and the labor productivityof many services is not much higher than in traditional agriculture. In somecases it is even lower, meaning that the movement of a worker from traditionalagriculture to such a low-productivity service sector actually detracts from thenation’s average labor productivity.
A key challenge for Ghana’s ongoing pattern of economic transformation isthat it may be hard to sustain, let alone accelerate, growth in PCI. Whilewithin-sector labor productivities will continue to benefit from past andongoing improvements in fundamentals, these promise at best a modest ifsteady contribution to PCI growth. Their contribution may also slow as someimportant past sources of past productivity growth run out of steam. Forexample, growth in labor productivity within the agricultural sector, whichChapter 2 shows accounted for 40 percent of the increase in national labor
OUP CORRECTED PROOF – FINAL, 29/7/2019, SPi
7

productivity over 1984–2011, will slow as the land frontier is exploited andfuture growth will need to come from agricultural intensification.
Ghana will need to do a better job of tapping into the benefits of structuralchange, and this requires policies that can generate more rapid growth ofsectors that can achieve a) high levels of labor productivity relative to trad-itional agriculture, and b) absorb lots of workers from lower productivitysectors like traditional agriculture. The most promising possibilities for creat-ing productive employment lie in agricultural intensification and the growthof modern industries, such as agro-industries. There is not only a growingnational demand that offers market opportunities in these sectors, but alsoincreasing regional economic cooperation, which should allow Ghana toincrease its exports into the West Africa regional market. But this will requiremore effective strategies for overcoming some of the market failure problemsalong key manufacturing and agricultural value chains, and the eventualuptake of agricultural intensification strategies.
Does the government have the incentives and capacity to pursue suchstrategies? Addressing this question is the main focus of Chapter 3. In otherareas of the world, economic transformation has required pro-active inter-ventions by a capable state. Historically, the Asian tigers were guided by a“developmental state” characterized by a well-trained and meritocratic bur-eaucracy led by leaders with long-term economic strategies operating inauthoritarian regimes. This confluence of circumstances briefly occurred inGhana under Rawlings between 1983 and 1992 when strong national leader-ship and a cadre of highly competent economists drove the economic reformsunder the SAP. A developmental state approach was less viable when Ghanatransitioned to democracy in 1992 when responsiveness to citizen demandsbecame a primary concern of the government. Despite several attempts tostrengthen Ghana’s civil services and public institutions under the FourthRepublic, public sector capacity is a notable weakness among the country’sgovernance successes.
Consequently, the governance setting has been more conducive to provid-ing an enabling investment and policy environment (i.e., Rodrik’s “fundamen-tals”), including in the agricultural sector, than to proactively identifying andimplementing state-guided economic activities. Therefore, some areas of theeconomy that are fraught with market failure problems have remained under-developed, and this has contributed to the limited growth of higher product-ivity sectors, and hence the low gains in productivity growth from structuralchange. This limitation is especially true of some manufacturing and agricul-tural value chains, such as those for nontraditional exports like pineapples, and
OUP CORRECTED PROOF – FINAL, 29/7/2019, SPi
8

commodities that must compete with imported foods like rice, poultry, tomatopaste, processed foods, and many manufactured consumer goods. Severalexamples are given in Chapter 3, especially of missed opportunities by thestate to better support agro-industries. Like many other African countries, akey challenge is how to achieve a more proactive public development role toovercome some of the market failures in key value chains like manufacturingand nontraditional agricultural exports. These issues recur in Part II and in theconcluding chapter of the book.
1.4.2 The Agricultural Transformation
Part II of the book is concerned with the role played by the agricultural sectorin Ghana’s transformation. Overall, the sector has performed successfullysince the 1980s in several dimensions, but it has not exploited its potentialto become a more important source of export earnings beyond cocoa, or toreduce the country’s growing dependence on many imported foods. Given theimportance of agriculture in the Ghanaian economy, Chapters 4–9 provide acomprehensive review of the agricultural transformation that has occurred,and seek to answer why it has evolved the way it has, what is holding it back,and identify options for future growth.
Chapter 4 describes the main features of the agricultural transformationthat have occurred since the policy reforms of the 1980s, and provides regionalas well as national insights. In the north, substantial increases in farm pro-duction and incomes have come more from increases in the cropped area andcrop mix than from increases in yields. Land productivity has increased onlymodestly, but labor productivity has increased substantially in line with wages.In the south, farm households have taken advantage of growth in urban–rurallinkages to diversify into nonagricultural sources of income, and farms havebecome smaller and more part-time at the expense of larger farms. Theselivelihood patterns seem likely to sustain into the future as long as thenonagricultural economy, especially in middle- and small-sized towns, con-tinues to flourish, and as long as farmers can successfully adapt to a shrinkingland frontier, especially in the northern region.
Chapter 4 then investigates three underlying factors that explain agricul-tural performance. One is government policy. While the government has donea good job in creating and sustaining an enabling economic environment forfarmers and private investment along agricultural value chains, apart fromcocoa it has not done enough on public investment or on supportive policies to
OUP CORRECTED PROOF – FINAL, 29/7/2019, SPi
9

help overcome market failures along many value chains, especially those forexport crops, import substitutes, and agroprocessing. Rural population growthis a second driver. In many other contexts, this might be expected to lead tomore intensive agricultural practices. However, in Ghana, an elastic landfrontier, and the pull of higher wages in the nonfarm economy, have easedthe pressure of the land constraint. Instead of induced innovation leading tohigher land productivity, the pressure has been on farmers to adopt labor-saving technologies that increase labor productivity in line with wages. Third,urbanization has had a major impact on rural livelihood patterns, especially indistricts containing urban centers. Urbanization has led to more part-timefarming and considerable income diversification, which is the focus of Chapter 5.Yet, despite having greater access to urban markets, services, infrastructure, andan increasing population pressure on the land base, there is little evidence ofagricultural intensification leading to higher land productivity even in the moreurbanized areas.
Given the powerful impact urbanization has had on agriculture, Chapter 5explores the issue in more depth and asks how urbanization in Ghana hasaffected rural employment, farm size distribution, and the use of moderninputs. Recognizing that urbanization has not affected agriculture equallythroughout the country, the chapter develops a spatial typology of ruralareas by the 2000 and 2010 National Censuses of Population and Housing.Seven types of districts are identified based on their city population size andlocation in the north or south of the country. In turn, both the 2000 and 2010Censuses and the two rounds of Ghana Living Standards Surveys’ data areused to calculate the share of households employed in agriculture, non-agriculture, or both across these seven different district types. The findingsillustrate that urbanization is increasing the share of rural households in thenonfarm economy. It has also contributed to an increase in the share of small,part-time farms in urbanized areas, and a shift towards more medium-sizedfarms in the agriculturally important areas of the north. The chapter furthertests the induced innovation hypothesis, which predicts that urbanization andassociated increases in population density and market access should lead tomore intensive farming practices. The findings show though that while therehas been substantial uptake of fertilizers, herbicides, and mechanization inrecent years, there is only limited support that this has been driven byurbanization other than through its influence on rural wages.
To complement the secondary data used in the previous chapters andobtain a deeper understanding of the changes that have occurred at farmand village levels, Chapter 6 draws on primary data collected by authors in
OUP CORRECTED PROOF – FINAL, 29/7/2019, SPi
10

four representative villages in the northern part of the country. In doing so, thechapter asks what major changes in farming practices and household liveli-hood strategies occurred from the 1980s to the present? The chapter alsoaddresses several key questions. What were the key driving factors that drovefarmers’ adaptation decisions, and why, despite continuing rural populationgrowth, did they generally choose to adopt technologies and farming practicesthat increase labor productivity relative to land productivity? Also, whathappens once options for bringing more land into production becomeexhausted? As discussed in Chapter 4, how well farmers adjust to increasingland scarcity will be critical for the future sustainability of agricultural growthin Ghana.
The surveyed villages span two agro-ecological zones in the country, namelythe transition and savannah zones, which were chosen for study because thesezones grow the predominant share of the country’s cereal and legume crops,and until recently still had an ample supply of new land available for farming.However, because the land frontier is finally becoming exhausted in someareas, one village was selected in each zone that has reached its land frontierand one that still has virgin land left, in order to obtain insights into howfarmers and villages are adjusting to emerging land scarcities. The datacollection drew on focus group discussions and individual interviews withselected farmers, village leaders, and local extension and government officialsin 2015. The detailed narratives provided in the chapter are complemented bya farm model analysis to better understand the economic factors drivingchanges on small, medium, and large-sized farms in the villages, and toquantify some of their impacts. The findings show that over the last threedecades, farmers have been adept at adjusting to increasing population pres-sure, changing household needs and expanding market opportunities byincreasing the size of their operated farms and growing more market-orientedcrops. This adjustment has been complicated by an increasing scarcity ofvirgin land, which has compelled farmers to reduce fallow periods or acquireland in other more distant communities that still have a virgin land frontier.With shortened fallow periods, there has been a decline in soil fertility, andfarmers have had to adjust by using inorganic fertilizer—essentially to main-tain rather than increase yields, introduce soil fertility management practiceslike legume–cereal rotations, and adopt new crops and crop varieties that aremore tolerant of less fertile soils and to changing rainfall patterns. Anotherfactor complicating farmers’ adaptation has been the increasing cost of laborand difficulties in accessing it at critical times of the agricultural season.Farmers have adjusted to this problem by adopting labor-saving technologies
OUP CORRECTED PROOF – FINAL, 29/7/2019, SPi
11

like tractors and herbicides, and by growing crops that require less labor. As aresult of all their adaptations, farmers have managed to substantially increasetheir farm incomes and labor productivity, but land productivity has increasedonly modestly. A key issue is how far these farmers can go in further adjustingto increasing land and labor scarcities without having to switch to moreintensive farming practices.
There are many aspects of the agricultural transformation that mightwarrant detailed analysis in a book of this nature, but we focus on three topicsthat emerge as especially important from the discussions in Chapters 2through 4. One is the crucial role of public investment in agriculture. Anotheris the problem of market and institutional failures along key agricultural valuechains, and the need for more proactive public sector solutions. A third is theneed for more effective public–private partnerships in agriculture and agri-business. Public investment is taken up in Chapter 7, while value chains andsome aspects of public–private partnership issues are taken up in Chapter 8.Finally, Chapter 9 focuses on agricultural mechanization. Not only is mech-anization an important topic in its own right at a time of increasing laborcosts, but the government’s current interventions in the supply of mechaniza-tion services in competition with the private sector is an important example ofthe problems that arise when the government fails to adequately support andpartner with the private sector.
Along with the creation of enabling policies, public investment in agricul-ture plays a crucial role in promoting agricultural growth and conditioning itsdistributional outcomes. Chapter 7 asks whether Ghana has invested enoughresources in agriculture and how the patterns of investment in the sector haveimpacted agricultural productivity growth. Specifically, the chapter examinestrends in public agricultural spending over the period 1961–2012, and disag-gregates that spending into the cocoa and noncocoa sectors. The majority oftotal spending has gone into the cocoa subsector, while the noncocoa sub-sector, which includes all the country’s food staples, has been neglected. Thegovernment’s public spending on agriculture has fallen short of 10 percent ofits total expenditure in most years since 1961, and in recent times the share hasaveraged only 2 to 3 percent, which is low even by African standards. Thegovernment has also spent relatively little on complementary investments inrural roads and other essential rural infrastructure. More detailed insights areprovided by looking at the types of spending within the agricultural sectorand their regional allocation. Two econometric analyses then estimate theimpact of public spending on agricultural productivity growth, and providesome useful insights into the marginal returns to public investments in the
OUP CORRECTED PROOF – FINAL, 29/7/2019, SPi
12

cocoa and noncocoa subsectors, and by type of public investment. This isfollowed by a discussion of some of the government’s recent attempts topromote noncocoa agricultural growth through several new subsidy andinvestment programs.
Strengthening agricultural value chains are critical for enhancing Ghana’sdomestic market and export potential. But how can agricultural value chainsbe further developed in Ghana given prevailing market failure problems thatconstrain the private sector from playing a greater role? Can the governmentplay a greater role in developing value chains for priority commodities,particularly nontraditional export commodities and import substitutes, ashas been done for cocoa or in regions such as South East Asia? These arethe central questions of Chapter 8. While Ghana remains relatively self-sufficient in basic staples, the composition of agricultural output has notadequately changed to reflect the growth in domestic demand for higher-income elastic foods like rice, poultry, and tomatoes, nor has agro-processingexpanded to meet a growing urban demand for processed and pre-cookedfoods. One consequence has been rapid growth in the importation of rice,poultry meat, and processed tomato paste, while nontraditional agriculturalexports like pineapples have languished.
As such, the chapter first recognizes the successful, decades-long publicinterventions in the cocoa subsector through the Ghana Cocoa Board. Usingthis experience as a benchmark, the chapter evaluates how interventionsin three other value chains compare: pineapples, rice, and tomatoes. Theselatter three crops have under-exploited opportunities because of the inabilityof farmers to produce sufficient amounts of high-quality farm products thatmeet urban market, agroprocessor, and export demands. In turn, this is due toa lack of better seed varieties, an absence of quality control through gradingand pricing along value chains, inadequate post-harvest handling (especiallytransport, and cold storage and modern processing facilities), and few large-scale agribusinesses willing or able to take the lead in developing new exportmarkets. The findings reveal opportunities and constraints along the valuechains of these commodities, identifies the roles that the public sector shouldideally play and, in turn, analyzes whether it has the capacity to feasibly do so.
Finally, Chapter 9 turns to agricultural mechanization and asks how thegovernment could more effectively engage with the private sector to enhancethe development of agricultural mechanization. Agricultural mechanization,both in the form of animal and tractor power, has expanded markedly sincethe early 2000s with about one third of Ghana’s farmers reporting to use someform of mechanization for land preparation. Yet in 2007, with a belief that
OUP CORRECTED PROOF – FINAL, 29/7/2019, SPi
13

mechanization services to smallholders cannot be left to the private sectoralone through its own importation of tractors, of which most are second-hand,the government started to directly engage in the importation of tractors, whichwere given to the so-called Agricultural Mechanization Services Centers(AMSECs) at heavily subsidized prices. The AMSEC was one of the fourinitiatives included in the country’s agricultural development strategy in 2007.
After reviewing recent developments in the uptake of agricultural mechan-ization in Ghana, and the factors that are driving the growth in farmers’demand, the chapter then discusses possible supply-side constraints, andevaluates AMSEC’s impact on existing private sector mechanization alterna-tives. The chapter concludes that such interventions often lead to marketdistortions in machinery prices, encouraging rent-seeking behavior, and dis-couraging the development of a private sector supply system. The programsare also unnecessarily costly to the public sector. Instead, the governmentwould be more effective in achieving its goals if it were to withdraw from theAMSEC program and instead play a more complementary and supporting roleto the private sector. This might include funding appropriate mechanizationresearch, technical training of young mechanics, and ensuring that financialinstitutions can provide the longer-term lending needed by private agents andfarmers in the mechanization supply chain.
Chapter 10 concludes the book by looking to the future. It reviews keyfindings from each of the preceding chapters and then considers the implica-tions given future trends and Ghana’s policy environment. The chapterhighlights the need to develop a broader swath of high-productivity industrialand agricultural activities if Ghana is to succeed in sustaining or evenaccelerating its rate of growth in per capita income. To this end, the chapteridentifies considerable opportunities within the agriculture sector andbroader food system, including meeting a rapidly growing domestic demandfor higher-value foods like fruits, vegetables, and livestock products, and forprocessed and pre-cooked foods. There are also substantial import substitu-tion opportunities for commodities such as rice, poultry, and tomatoes, as wellas for many imported processed foods, and opportunities for developingnontraditional agricultural exports to the West African regional market andbeyond. To meet these demands, the required supply response will need to bemarket driven with the private sector taking the lead. However, the govern-ment has key roles to play in removing some of the constraints holding backboth the speed and scope of the transformation, and helping to ensure that it isinclusive of small farms and of the many small and medium-sized enterprises(SMEs) that operate along agricultural value chains and within the food
OUP CORRECTED PROOF – FINAL, 29/7/2019, SPi
14

system more generally. Creating the necessary enabling policy environmentwill require the development of more effective state–private sector relation-ships, including with large businesses, SMEs and small traders. Other key areasfor further attention include land policy reforms, infrastructure, agriculturalresearch and extension, seed systems, fertilizer, soil management, irrigation,mechanization, financial services, regulation of farm inputs and outputs,coordination along value chains, and linking small farms to value chains.Importantly, the chapter acknowledges that the feasibility of addressing allof these areas requires a consideration of the political and policy environment,and more effective public–private partnerships than has been evident in thepast. The chapter also provides an update on the government’s most recentinitiative—Planting for Food and Jobs (PFJ)—and contrasts this with thevision of a market-and-private-sector-led transformation of the agri-foodsystem previously discussed. The chapter concludes with some broader impli-cations of Ghana’s experience for other African countries.
References
Aryeetey, Ernest and William Baah-Boateng. 2016. “Ghana: A Successful GrowthStory with Job Creation Concerns,” in Haroon Bhorat and Fin Tarp (eds),African Lions: Growth Traps and Opportunities for Six African Economies.Washington DC: Brookings Institution Press, 77–108.
Aryeetey, Ernest and Ravi Kanbur. 2017. The Economy of Ghana Sixty Years afterIndependence. Oxford: Oxford University Press.
Badiane, O., and T. Makombe (eds). 2014. “Beyond a Middle Income Africa:Transforming African Economies for Sustained Growth with Rising Employ-ment and Incomes.” ReSAKSS Annual Trends and Outlook Report 2014.Washington, DC: International Food Policy Research Institute.
Badiane, O., and J. Ulimwengu. 2017. “Business Pathways to the Future ofSmallholder Farming in the Context of Transforming Value Chains,” in AfricanAgriculture Status Report 2017: The Business of Smallholder Agriculture in Sub-Saharan Africa. Nairobi: AGRA.
Fosu, Augustin Kwasi. 2009. “Country Role Models for Development Success: TheGhana Case.” Research Paper No. 2009/42. Helsinki: UNU-WIDER.
Gollin, D., R. Jedwab, and D. Vollrath. 2016. “Urbanization with and withoutIndustrialization.” Journal of Economic Growth 21(1): 35–70.
Huntington, Samuel. 1991. The Third Wave: Democratization in the Late Twen-tieth Century. Norman, OK: University of Oklahoma Press.
OUP CORRECTED PROOF – FINAL, 29/7/2019, SPi
15

Kormawa, Patrick, and Afeikhena Jerome. 2014. “Renewing IndustrializationStrategies in Africa,” in: Beyond a Middle Income Africa: TransformingAfrican Economies for Sustained Growth with Rising Employment and Incomes.ReSAKSS Annual Trends and Outlook Report 2014. Washington, DC: Inter-national Food Policy Research Institute.
McKay, Andy, Jukka Pirttilä, and Finn Tarp. 2016. “Ghana: Poverty Reductionover Thirty Years,” in C. Arndt, A. McKay, and F. Tarp (eds), Growth andPoverty in Sub-Saharan Africa, UNU-WIDER Studies in Development Eco-nomics. Oxford : Oxford University Press, 69–88.
McMillan, Margaret, Dani Rodrik, and Claudia Sepúlveda (eds.). 2017. StructuralChange, Fundamentals, and Growth: A Framework and Case Studies. IFPRI,Washington DC.
Ncube, Mthuli, and Charles Lufumpa (eds). 2015. The Emerging Middle Class inAfrica. Abidjan and London: African Development Bank and Routledge.
Rodrik, D. 2014. “The Past, Present, and Future of Economic Growth,” in FranklinAllen et al., Towards a Better Global Economy: Policy Implications for CitizensWorldwide in the 21st Century. Oxford: Oxford University Press, 70–137.
Rodrik, D. 2018. “An African Growth Miracle?” Journal of African Economies27(1): 10–27.
Shimeles, Abebe, and Mthuli Ncube. 2015. “The Making of the Middle-Class inAfrica: Evidence from DHS Data,” Journal of Development Studies 51(2):178–93.
United Nations (UN). 2014. World Urbanization Prospects: 2014 Revision.New York: Department of Economic and Social Affairs, UN.
OUP CORRECTED PROOF – FINAL, 29/7/2019, SPi
16

PART I
GHANA ’S ECONOMICTRANSFORMATION
OUP CORRECTED PROOF – FINAL, 31/7/2019, SPi

OUP CORRECTED PROOF – FINAL, 31/7/2019, SPi

2Ghana’s Economy-wide Transformation
Past Patterns and Future Prospects
Xinshen Diao and Peter Hazell
2.1 Introduction
Ghana has experienced a successful economic and political transformationsince its Structural Adjustment Program (SAP) of the 1980s, and is one of thefew African countries to have attained lower-middle-income status, or to haveachieved the Millennium Development Goal (MDG) of halving poverty by2015. This chapter describes the economy-wide transformation that hasoccurred, and uses a growth decomposition framework to identify the mainsources of economic growth. It is found that while Ghana has benefited fromsignificant growth in labor productivity within important sectors, and therehave been structural changes in the sense that agriculture has shrunk as a shareof national GDP and employment while other sectors have grown faster,still there has been relatively little progress in moving workers out of low-productivity sectors like traditional agriculture into more productive sectorslike manufacturing or modern services. We question whether this pattern oftransformation is sustainable in the future, and explore alternative options thatmay be needed. Chapter 3 provides a complementary analysis of the politicaltransformation that has occurred in Ghana, and thence the political andgovernance challenges facing the country as it seeks to adopt a more sustain-able type of transformation.
The chapter is structured as follows. Section 2.2 describes the patterns ofgrowth that have occurred in Ghana since the country launched its SAP in1983, including the growth in national and per capita incomes, the changingsector composition of the economy, and the changes in employment. InSection 2.3 we present a conceptual framework developed by Rodrik (2014,2018) and use it to decompose the sources of growth in labor productivity andidentify the relative importance of within-sector productivity growth com-pared to the structural shifting of workers from low to higher productivity
OUP CORRECTED PROOF – FINAL, 31/7/2019, SPi

sectors. This leads in Section 2.4 to a discussion of the sustainability of the pastpattern of growth, and of future growth opportunities and challenges. Finally,Section 2.5 concludes.
2.2 Ghana’s Economic Transformation since the 1980s
2.2.1 Growth in National Per Capita Income
Ghana started its SAP¹ in 1983 (see Chapter 3 for further details), earlier thanmost other African countries that eventually went through a similar IMF- andWorld Bank-guided reform process. GDP per capita has grown modestly butsteadily since the mid-1980s. In fact, over the thirty-four years 1984 to 2017,Ghana experienced positive per capita GDP growth every single year, and thisdespite population growth of 2.5 to 2.8 percent per annum, and rainfall-induced fluctuations in the output of its largest sector—agriculture. Onlyfive other developing countries in the world have managed to achieve uninter-rupted growth in per capita GDP over thirty or more years since 1960. Thesefive countries include two in Africa and three in Asia (Table 2.1). If we alsoconsider countries with just one year’s interruption over thirty years, thenthere are three other Asian countries that can be included: two are past Asiangrowth miracles, Korea and Singapore, plus India (Table 2.1).
Table 2.1. Countries with uninterrupted per capita GDP growth for thirty years
Growth period Number ofgrowth yearsuninterrupted
With oneyear growthinterruption
Average annual percapita GDP growthrate within thegrowth periodb
Ghana 1984–2017 37 2.8Botswana 1961–92 32 7.7Mauritius 1984–2016 33 4.3China 1977–2017 41 8.5Thailand 1961–96 36 5.4Vietnama 1985–2017 33 4.9India 1980–2017 38 4.5Korea 1961–97 37 7.5Singapore 1965–97 33 6.7
Note: a Vietnam’s data available since 1985.b Based on simple average.
Source: Authors’ calculation using data of World Development Indicators (WDI), World Bank (2017).
¹ Also known as the Economic Reform Program (ERP).
OUP CORRECTED PROOF – FINAL, 31/7/2019, SPi
20 ’ -

Another remarkable feature of Ghana’s experience is that the economybegan to grow almost immediately after it implemented its SAP, whereasmany other countries that adopted similar reform programs went throughpainful adjustment periods, sometimes characterized as “lost decades,” beforetheir economies bounced back.
2.2.2 Structural Change
Ghana differs in one important respect from the other countries in Table 2.1that have experienced uninterrupted growth over many years, and that is Ghana’saverage annual growth in per capita GDP has been slowest. An important reasonfor this is that the other countries have experienced more rapid industrialization,often leading to periods of very rapid growth (Rodrik 2014). In Ghana, however,despite achieving low-middle-income country by 2008,² there has been very littleindustrialization while services have grown rapidly (Figure 2.1).
Ghana rebased its national accounts in 2007–10, which makes comparisonsof the structure of GDP at different periods more difficult. When the nationalaccounts were revised in 2006, significant adjustments were made to both the
0
10
20
30
40
50
60
70
1965 1970 1975 1980 1986 1991 1996 2001 2006 2011 2016
AgricultureManufacturingServices
Figure 2.1. Sector shares of GDPSource: Authors’ calculation using World Development Indicators, World Bank (2017).
² As measured by the gross national income (GNI) per capita at current US$, using the World BankAtlas method.
OUP CORRECTED PROOF – FINAL, 31/7/2019, SPi
21

level and structure of GDP compared to prior 2006 estimates based on a 1993reference year. GDP in the newly rebased national account was 60 percenthigher than that in the old estimate, and about 70 percent of this increase was dueto the inclusion of service activities that were simply not covered under the oldsystem (GSS 2010). The sudden jump in the service share in 2006 from about30 percent of GDP to nearly 50 percent reflects this rebasing result (Figure 2.1).
Despite the complications arising from this rebasing, it is clear fromFigure 2.1 that the structure of Ghanaian economy changed significantlyover 1965–2016. Table 2.2 provides some additional details for the period1975–2016. The period from 1975 to 1983 shows how badly Ghana’s economysuffered prior to the SAP that began in 1983. Measured in constant US dollars,GDP in 1983 was only 79 percent of the level attained in 1975 (Table 2.2).Moreover, while all sectors were producing less in 1983 than in 1975, somesectors had suffered far more than others. Industry, which includes manufac-turing, tumbled the most, and industrial GDP in 1983 was only about half its1975 value. Agriculture contracted by about 19 percent in this period, whileservices fell the least, declining by only 6 percent (Table 2.2).
During 1983 to 1993, national economic growth quickly recovered withimplementation of the SAP, and by 1988 national GDP in constant terms hadreturned to its 1974 level. Again, there were important differences by sector.Agricultural GDP only recovered to its 1975 level by 1993, while industry’sGDP was still 14 percent below its 1975 level even in 1993. Manufacturing dideven worse; its GDP was not much higher in 1993 than in 1983, at about halfits 1975 level. The poor performance of manufacturing is explained by theindustrialization policies pursued in the 1960s and 1970s, involving stateownership and centralized planning. As in other countries following similarindustrialization policies, this created state-owned, overstaffed, inefficient, and
Table 2.2. Changes in sector GDPs and sector shares over 1975–2016, selectedyears
GDP (constant 2000 US$) GDP relative to 1975 (1975 = 1.00) Sector share of GDP
1983 1984 1985 1988 1993 1985 1993 2006 2016
National 0.79 0.85 0.90 1.05 1.30Agriculture GDP 0.81 0.88 0.89 0.95 1.04 48.4 41.4 31.1 19.6Industry GDP 0.49 0.54 0.63 0.81 0.86 18.0 27.8 21.3 28.2Manufacturing GDP 0.49 0.55 0.68 0.87 0.54 12.4 10.5 10.5 5.6Services GDP 0.94 1.01 1.08 1.36 2.05 33.6 30.8 47.6 52.2
Source: Authors’ calculation using World Development Indicators, World Bank (2006 and 2017)
OUP CORRECTED PROOF – FINAL, 31/7/2019, SPi
22 ’ -

politicized firms. These had become a major burden on government financesby 1983, and were crowding out the private sector (Leite et al. 2000). Althoughthe government was committed to reforming the state enterprises as part ofthe SAP, actual progress was slow (Leite et al. 2000). There were still wide-spread doubts in some policy circles about the benefits of large-scale privat-ization (Friedrich Ebert Foundation 1994: 9–17). Moreover, an overall policyenvironment conducive to private-sector-led development had yet to be fullyestablished, and privatizing or otherwise reforming some 350 state enterpriseswas inevitably a slow process.
Unlike industry, the service sector proved more resilient during 1975–83. ItsGDP share was only down 6 percent in 1983, and it recovered quickly with theSAP reforms. By 1984 it had already recovered to its 1975 level of GDP, and by1993 its GDP had virtually doubled.
During the period 1993–2016, the same pattern of structural change con-tinued, led by the service sector. The GDP share of services changed littlebetween 1993 and 2006 under the old 1993 based accounting system(Figure 2.1), but many new types of service activities were growing that werenot being captured in the national accounts. When the national accounts wererebased in 2006, services jumped from 32 percent to 48 percent of nationalGDP, and had reached more than 50 percent by 2016. During this sub-period,agriculture’s share in GDP continued to decline, and industry’s shareremained flat. Manufacturing, however, plummeted and only accounted for5.6 percent of national GDP in 2016.
2.2.3 Aggregate Productivity Growth
Increases in productivity are essential for sustained growth in per capita incomes.There are several ways of measuring productivity growth, all of which arevulnerable to weak data, so we report and compare several different productivitymeasures in this section. The most direct measure is labor productivity for theeconomy as a whole. Figure 2.2 compares annual growth rates of labor product-ivity measured by value-added per worker and GDP per capita.³
Given that the growth rates for employment and the total population weresimilar (averaging 2.7 percent annually over 1984 to 2010), and that totalvalue-added differs from GDP only by the government’s net indirect tax
³ Value-added for the total economy was obtained from Gronigen Growth and Development Centre(GGDC), University of Gronigen (Timmer et al. 2015).
OUP CORRECTED PROOF – FINAL, 31/7/2019, SPi
23

revenue (which is included in GDP), then we should expect to find similartrends in the growth of GDP per capita and value-added per capita. Figure 2.2generally confirms this expectation.⁴ Both productivity and PCI measuresfluctuated during the SAP period 1984–94 because of the shocks induced byan array of policy changes, and again in the late 2000s after the economy wasshocked again by the discovery of oil and the development of oil exports.
A problem with labor productivity is that its growth can result fromresource expansion (e.g., land expansion in agriculture), or capital deepeningin industry, as well as from increases in the productivity of the resources thatare used. In principle, total factor productivity (TFP) is a better productivityindicator because it avoids this problem, but its use depends critically on thecalculation of the capital stock and capital services, which are difficult toquantify. Moreover, when a Cobb-Douglas production function for GDP isassumed for growth accounting purposes, the shares of labor and capital inGDP are also difficult to measure and have to be assumed. Keeping theselimitations in mind, we have compiled alternative estimates of growth in TFPusing two major data sources. One is the Conference Board Total EconomyDatabase (TED)⁵which provides growth accounting and total factor productivitymeasures for many countries, including Ghana, for 1990–2011. Another source is
0.0
1.0
2.0
3.0
4.0
5.0
6.0
7.0
8.0
1984 1986 1988 1990 1992 1994 1996 1998 2000 2002 2004 2006 2008 2010
12.4
Value-added (excluding tax revenue), per workerGDP (including tax revenue), per capita
Figure 2.2. Annual growth rates of value-added per worker and GDP per capitain 1984–2011 (%)Source: Authors’ calculation using data of GGDC (Timmer et al. 2015) for labor productivity andWorld Development Indicators, World Bank (2017) for per capita GDP.
⁴ The fluctuations in the gap between the two trends are mainly due to fluctuations in net indirecttax revenue as a proportion of the GDP but not in the economy’s total value-added.⁵ The Conference Board Total Economy Database, January 2014, http://www.conference-board.org/
data/economydatabase/.
OUP CORRECTED PROOF – FINAL, 31/7/2019, SPi
24 ’ -

the United Nations Industrial Development Organization (UNIDO), which hasdeveloped a World Productivity Database (WPD) containing information onlevels and growth of aggregate total factor productivity (TFP) for 112 countries,including Ghana, for 1960–2000.⁶ Both databases provide crude estimates giventhe limited information available for most African countries including Ghana.
Table 2.3 reports the various estimates of TFP growth in Ghana for1984–2010 and 1990–2011, and compares them to the labor productivitymeasures used to calculate Figure 2.2. We also include a separate estimate oflabor productivity using TED data. Despite their differences, there is consid-erable agreement amongst the various productivity estimates, and average TFPgrowth over 1984–2010 was similar in magnitude to the growth in laborproductivity as measured by GDP per worker. This implies that the lion’sshare of the growth in living standards in Ghana has been due to TFP growthrather than resource expansion (land) or capital deepening.
Table 2.3. Growth in per capita GDP, labor productivity, and total factorproductivity (%)
GDPpercapita
Laborproductivity
Total factor productivity (TFP)
UNSD GGDC TED TED WDP
ΔTFP_K06 ΔTFP_K13 ΔTFP_Keff ΔTFP_Ks
1984–2011 2.8 2.91984–2010 2.4 2.9 2.2 1.9 2.4 2.21990–2011 2.8 2.9 3.1 3.41990–2000 1.6 3.2 3.0 3.7 1.4 0.7 1.4 1.4
Notes: ¹ Labor force data is the same between GGDC and TED.² Growth accounting method is used by TED for TFP estimates and share of labor and capital is the same(0.5) in the estimation.³ We chose growth accounting-Hick neutral measure in WDP. There are four different TFP estimates(ΔTFP_K06, ΔTFP_K13, ΔTFP_Keff, and ΔTFP_Ks) in WDP based on alternative estimates or assump-tions of initial capital stock and depreciation rate which lead to different capital stocks (i.e., K06, K13, Ksand Keff ). Depreciation rate is assumed to be constant over time at 6 percent or 13.3 percent, respectively,for K06 and K13, and ten years of investment is used as an adequate proxy for the initial capital stockestimation in both cases. For the case of Ks the initial capital stock is computed based on the assumptionthat the country is at its steady state capital-output ratio, and deprecation rate is at 6 percent and constantover time. The time-varying depreciation rate is used for computing capital stock in the case of Keff.
Sources: GDP per capita is fromWorld bank Indicators, World Bank (2017); labor productivity GGDCis from Timmer et al. (2015); labor productivity TED and TFP TED are from The Conference BoardTotal Economy Database (2014); and four TFP measures of WDP are from UNIDO (2014).
⁶ Isaksson (2007). “World Productivity Database: A Technical Description,” Staff Working PaperNo. 10/2007, Research and Statistics Branch, UNIDO.
OUP CORRECTED PROOF – FINAL, 31/7/2019, SPi
25

2.2.4 Changes in Employment
Table 2.4 shows the average annual growth rates in employment by sector, andfor time periods determined by the years in which population censuses wereconducted. Prior to the SAP (1960–84) employment grew at about 3.2 percentper annum in agriculture, manufacturing, and for the economy in total.Employment in services grew a little faster (3.8 percent per year), mostly infinance and government services. However, employment in “other” industry(mining, utilities, and construction) actually shrank by 1.4 percent per yearduring this period. Growth in employment slowed across the economy during1985–2000 as the country adjusted to the SAP reforms, except for otherindustry (including mining and construction) where employment reboundedto grow at 8.2 percent per year. During 2000-2010, growth in total employ-ment recovered to 3.3 percent per year, driven by accelerated growth ofemployment in services (6.8 percent) and manufacturing (3.5 percent). Withinservices, employment grew fastest in trade, finance, and other services. Growthin agricultural employment slowed further to 0.7 percent per year during thisperiod, reflecting in part the rapid pace of urbanization in the country and thegrowth of rural nonfarm activity (see Chapter 5).
Table 2.4. Annualized growth rate in employment for Ghana and by sector (%)
Total economy Agriculture Manufacturing Other industry Services
1960–84 3.2 3.2 3.1 –1.4 3.81984–2000 2.0 1.2 1.8 8.2 3.02000–10 3.3 0.7 3.5 2.2 6.81960–2010 2.8 2.0 2.8 2.3 4.1
Within other industry
Mining Utilities Construction
1960–84 –2.3 0.4 –1.21984–2000 10.5 3.2 7.92000–10 –1.6 4.6 3.71960–2010 1.7 2.1 2.6
Within services
Trade Transport Finance Government Others
1960–84 3.3 2.6 5.8 5.3 4.91984–2000 3.0 3.6 8.9 0.9 5.02000–10 7.0 5.4 8.3 5.7 7.71960–2010 3.9 3.4 7.3 4.0 5.5
Source: Authors’ calculation using GGDC data (Timmer et al. 2015).
OUP CORRECTED PROOF – FINAL, 31/7/2019, SPi
26 ’ -

Figure 2.3 shows more starkly the growing importance of service sectoremployment in Ghana. Of all the jobs created in the national economy during2000–10, about three quarters were created in the service sector. This was almostdouble the share of additional jobs created in services during 1984–2000.By contrast, agriculture’s contribution to additional employment has shrunkdramatically, adding only 10 percent of all jobs in 2000–10, down from abouta third in 1984–2000. Industry, including manufacturing, created slightly morejobs than agriculture during 2000–10, but its share of new jobs was lower than in1984–2000. A glimmer of good news is that manufacturing created more jobs in2000–10 than 1984–2000, but the share involved is still small and, given thatmanufacturing’s share of GDP declined between 2006 and 2016, raises questionsabout the productivity of the manufacturing jobs that were created.
Another distinctive feature of the employment patterns in Ghana is theimportance of the informal economy rather than the formal economy in creatingnonagricultural employment. The available census data classify employmentstatus into seven groups: (a) self-employed with employees, (b) self-employedwithout employees, (c) paid wage/salary worker, (d) domestic worker, (e) unpaidfamily worker, (f) unpaid apprentice, and (g) other; and six choices in institu-tions: (a) public, (b) formal private, (c) individual/family enterprise, (d) public–private mixed or parastatal, (e) foreign and international, (g) others. We defineformal sector employment as primary occupations in public, parastatal, andforeign/international entities, or in the private sector when renumerated throughregular wages or a salary. The remaining occupation groups are defined asinformal employment.We netted out public sector and agricultural employment,disaggregated by rural and urban locations, and tabulated the results by privatesector for 2000 and 2010 (Table 2.5a and 2.5b).
–5.010.025.040.055.070.085.0
100.0
1960–84 1984–2000 2000–10 1960–2010
Increased total employed population in each period = 100
Agriculture Manufacturing Industry Services
Figure 2.3. Sector allocation of increased employmentSource: Authors’ calculation using GGDC data (Timmer et al. 2015).
OUP CORRECTED PROOF – FINAL, 31/7/2019, SPi
27

Table 2.5a. Employment structure of private non-agriculture by formal/informal, rural/urban, and industry in 2000
Total private nonagricultural employment for the country is 100
2000 Rural 2000 Urban 2000 National
Formal Informal Total rural Formal Informal Total urban Formal Informal Total national
Mining 0.5 1.0 1.4 0.9 1.0 1.9 1.4 1.9 3.3Manufacturing 0.8 8.4 9.2 3.5 13.3 16.8 4.3 21.7 26.0Utilities 0.1 0.3 0.3 0.3 0.2 0.5 0.3 0.5 0.9Construction 0.5 1.6 2.0 1.6 3.6 5.2 2.1 5.2 7.3Trade services 0.7 9.2 9.9 4.2 28.2 32.5 4.9 37.5 42.3Transport services 0.6 1.1 1.7 2.9 2.9 5.8 3.5 3.9 7.5Business services 0.3 0.5 0.8 1.9 1.0 2.9 2.1 1.5 3.7Personal services 0.4 2.2 2.6 1.9 4.6 6.5 2.3 6.8 9.1
Total 3.8 24.2 28.0 17.2 54.8 72.0 21.0 79.0 100
Each sector in rural is 100
2000 Rural 2000 Urban 2000 National
Formal Informal Total rural Formal Informal Total urban Formal Informal Total national
Mining 32.1 67.9 100 49.3 50.7 100 42.0 58.0 100Manufacturing 8.9 91.1 100 20.7 79.3 100 16.5 83.5 100Utilities 20.3 79.7 100 55.0 45.0 100 41.1 58.9 100Construction 22.8 77.2 100 31.2 68.8 100 28.8 71.2 100Trade services 6.6 93.4 100 13.1 86.9 100 11.5 88.5 100Transport services 37.2 62.8 100 50.3 49.7 100 47.3 52.7 100Business services 35.4 64.6 100 64.3 35.7 100 58.4 41.6 100Personal services 15.7 84.3 100 29.6 70.4 100 25.6 74.4 100
Total 13.5 86.5 100 23.9 76.1 100 21.0 79.0 100
Source: Authors’ calculation using Census data of 2000 (GSS 2003).
OUPCORRECTED
PROOF–FIN
AL,
31/7/2019,SP
i

Table 2.5b. Employment structure of private non-agriculture by formal/informal, rural/urban, and industry in 2010
Total private nonagricultural employment for the country is 100
2010 Rural 2010 Urban 2010 National
Formal Informal Total rural Formal Informal Total urban Formal Informal Total national
Mining 0.7 0.5 1.3 0.6 0.3 0.9 1.3 0.9 2.2Manufacturing 0.5 6.9 7.5 2.7 10.7 13.3 3.2 17.6 20.8Utilities 0.1 0.0 0.2 0.5 0.1 0.6 0.7 0.1 0.8Construction 0.4 1.1 1.5 1.3 3.1 4.3 1.7 4.2 5.9Trade services 0.8 10.3 11.1 4.9 30.9 35.8 5.7 41.3 46.9Transport services 0.8 1.0 1.7 3.3 2.5 5.9 4.1 3.5 7.6Business services 0.2 0.2 0.5 1.8 0.9 2.7 2.0 1.2 3.2Personal services 0.7 2.3 3.0 3.4 6.2 9.6 4.1 8.5 12.6
Total 4.3 22.5 26.8 18.5 54.7 73.2 22.8 77.2 100.0
Each sector in rural is 100
2010 Rural 2010 Urban 2010 National
Formal Informal Total rural Formal Informal Total urban Formal Informal Total national
Mining 58.7 41.3 100 62.7 37.3 100 60.4 39.6 100Manufacturing 7.2 92.8 100 20.0 80.0 100 15.4 84.6 100Utilities 91.8 8.2 100 90.0 10.0 100 90.4 9.6 100Construction 26.1 73.9 100 29.1 70.9 100 28.3 71.7 100Trade services 6.9 93.1 100 13.6 86.4 100 12.0 88.0 100Transport services 43.9 56.1 100 56.9 43.1 100 53.9 46.1 100Business services 48.0 52.0 100 66.1 33.9 100 63.4 36.6 100Personal services 23.0 77.0 100 35.6 64.4 100 32.5 67.5 100
Total 16.0 84.0 100 25.2 74.8 100 22.8 77.2 100
Source: Authors’ calculation using Census data of 2010 (GSS 2013).
OUPCORRECTED
PROOF–FIN
AL,
31/7/2019,SP
i

Table 2.6. Contribution of the informal and formal sectors to the national increase in total employment over 2000 to 2010; by sectorand rural and urban (%)
Rural Urban National
Formal Informal Total rural Formal Informal Total urban Formal Informal Total national
Mining 1.2 –0.1 1.1 0.0 –0.5 –0.5 1.2 –0.6 0.6Manufacturing 0.2 4.9 5.1 1.6 7.0 8.6 1.7 12.0 13.7Utilities 0.3 –0.3 –0.1 0.9 –0.2 0.7 1.2 –0.5 0.6Construction 0.3 0.5 0.8 0.8 2.4 3.2 1.1 2.9 4.0Trade services 0.9 11.9 12.8 5.8 34.7 40.5 6.7 46.6 53.3Transport services 0.9 0.8 1.8 3.9 2.1 6.0 4.9 2.9 7.8Business services 0.2 –0.1 0.1 1.7 0.8 2.5 1.9 0.7 2.6Personal services 1.1 2.5 3.6 5.4 8.4 13.8 6.5 10.9 17.5
Total 5.0 20.2 25.2 20.2 54.6 74.8 25.2 74.8 100
Source: Authors’ calculation using data of Census 2000 and 2010 (GSS 2003, 2013).
OUPCORRECTED
PROOF–FIN
AL,
31/7/2019,SP
i

Nationally, 77.2 percent of all private sector, nonagricultural employment in2010 was in the informal sector, and this share was higher in rural (84 percent)than in urban (74.8 percent) areas. Most of the private informal sectoremployment in 2010 was in manufacturing and trade services (17.6 percentand 41.3 percent, respectively), but more so in urban than rural areas. Between2000 and 2010, the share of employment in formal manufacturing furtherdeclined while the share in trade services increased slightly, and this happenedin both rural and urban areas.
Within individual nonagricultural sectors, informal employment was dom-inant in manufacturing, construction, trade services, and personal services inboth rural and urban areas. It also dominated transport and business servicesin rural areas. Formal employment only dominated in mining in both ruraland urban, and in utilities, transport and business services in urban areas. Aswe shall see in Section 2.3, labor productivity is generally higher in the formalthan informal sectors, so the high shares of informal employment in keysectors like manufacturing and trade that provide most of the employmentdo not bode well for labor productivity.
Another perspective on the changes in employment can be obtained bycomputing the contributions informal and formal employment made to theincrease in total employment between 2000 and 2010. This is reported bysector and separately for rural and urban areas in Table 2.6.
2.3 Source of Growth in Productivity
2.3.1 Conceptual Framework
In order to identify the main sources of growth in per capita income (PCI), weuse a conceptual framework developed by Dani Rodrik in his papers on “ThePast, Present and Future of Economic Growth” (Rodrik 2014), and morerecently for Africa, in “An African Growth Miracle?” (Rodrik 2018).⁷ Rodrikidentifies two broad development challenges: the “fundamentals” challenge,and the “structural transformation” challenge. Growth in productivity andPCI arises “within” sectors as a result of overcoming “fundamental” challengesby building fundamental capabilities, such as better institutions, healthier and
⁷ Rodrick’s framework draws on the neoclassical growth theories of Solow (1956), Grossman andHelpman (1991), and Aghion and Howitt (1992), which essentially focus on the growth process withinmodern sectors, and the dual-economy theory initially formalized by Lewis (1954) and expanded uponby Ranis and Fei (1961) that focuses on relationships and flows among sectors. McMillan, Rodrik, andSepúlveda (2016) further discuss the inter-connection of these two schools of economic theories indetail (see page 5 of McMillan et al. (2016)).
OUP CORRECTED PROOF – FINAL, 31/7/2019, SPi
31

better-educated workers, improved technologies, and more enabling policies.These are longer-term investments that are essential for sustaining economicgrowth over the long term, but which may have slow payoffs and contributerelatively little to short-term growth. Growth that arises from structuralchange involves investing in the rise of modern, highly productive industrieslike export manufacturing, and shifting workers from low-productivity sectorslike traditional agriculture into the modern industrial and service sectors. Thisstrategy requires significant capital and political investment, but can lead tomore visible short- to medium-term benefits as well as setting the stage forlonger-term growth. The two strategies can be summarized as in Table 2.7.
The rapid growth of China and several other Asian countries occurred atrelatively low levels of fundamental capability, but with governments taking astrong proactive development state approach to promoting modern industry,especially export manufacturing, and facilitating the mass movement of workersfrom agriculture to industry. These countries have generally fallen into cell (2) inTable 2.1, experiencing rapid but episodic growth, andwhich if it is to be sustained,now requires more attention to complementary investments in fundamentalcapabilities. InGhana, on the other hand, and as argued inChapter 3, the emphasissince the Structural Adjustment Program (SAP) of the early 1980s has been moreon investing in fundamental capabilities, with a rather benign state neglect ofindustry and the structural transformation issues. This has placed the country incell (3), with a consistent pattern of slow growth and limited industrialization.
2.3.2 Applying the Framework
Rodrik formulized his two sources of growth into a growth decompositionmodel (Rodrik 2014). To apply this model to Ghana, we made several adap-tations to better capture the reality of Ghana’s recent structural transform-ation. We present these changes in two steps.
Table 2.7. A typology of growth strategies, growth patterns, and outcomesStrategy focusing on structural transformation
Slow Rapid
Strategy focusingon investment in
Low No or very little growth Episodic growth
fundamentals High (3) Slow growth (4) Rapid, sustained growth
Source: Rodrik (2014).
OUP CORRECTED PROOF – FINAL, 31/7/2019, SPi
32 ’ -

The first step is conceptual, and involves changes to the model structure.First, we introduced agriculture as a separate sector in the model to reflect thefact that far from being a stagnant traditional sector, it has actually experi-enced significant productivity growth in recent years in Ghana, and part of thisproductivity growth in agriculture can be attributed to fundamentals. Second,we redefine the traditional sector without agriculture as the informal sector (I)and explicitly model labor mobility from agriculture into informal activities.Note that if labor productivity in agriculture should happen to exceed itsproductivity in the informal sector, then any structural change resultingfrom the movement of labor from agriculture to the informal sector wouldbecome growth-reducing instead of growth-enhancing.
The modified version of Rodrik’s model we use is as follows:
y ¼ αMyM þ αSyS þ αI yI þ ð1� αM � αS � αI ÞyA ; ð1Þ
y ¼ ðαMπM þ αSπS þ αIπI þ αAπAÞγðlny*ðΘÞ � lnyÞ ð2ÞðAÞ
þ αMπMβðlny*M � lnyMÞ ðBÞ
þ ðπM � πAÞdαM ðCÞ
þ ðπS � πAÞdαS ðDÞ
þ ðπI � πAÞdαI ðEÞ
where y is the economy’s aggregate labor productivity, and a “∧” over avariable denotes proportional changes (x ¼ dx=x). y
M, y
S, y
I, and y
Aare,
respectively, value-added per worker for manufacturing, services, the informaleconomy and agriculture, πM , πS , πI and πA are the relative labor productivities(yi/y) for the same sectors, and αM , αS and αI are the employment shares ofmanufacturing, services and the informal sector, respectively.
Equation (2) identifies distinct channels for growth. First, there is a processof convergence that accompanies the accumulation of fundamental capabil-ities, such as skills and improved governance and institutions (A). Rodrik callsthis the “fundamentals” channel, as it depends on broad-based investments inhuman capital and institutional arrangements. Second, there are the forces ofunconditional convergence operating within manufacturing (B). These twodynamic effects are potentially augmented by two reallocation-of-labor effects,from agriculture to higher-productivity manufacturing (C) and modern
OUP CORRECTED PROOF – FINAL, 31/7/2019, SPi
33

services (D), but are also potentially negatively affected by reallocation of laborfrom agriculture to the informal economy (E) if the productivity in theinformal economy is lower than agriculture.
The second step involved empirical adjustments to the model to fit theavailable data. We had sufficient data to disaggregate the economy into tensectors. Let Yi denote the i
th sector’s GDP at constant prices, and let y and yidenote to the economy’s GDP per worker and ith sector’s GDP per worker,respectively. Equation (1) thus can be rewritten as follows:
y ¼X10
iαiyi;
X10
iαi ¼ 1: ð3Þ
Let i¼10 represent the agricultural sector, and i ¼ 1, 2, . . . . , 9 be the ninenonagricultural sectors. Totally differentiating equation (3), dividing throughby y and rearranging terms, we obtain the following equation similar to (2):
y ¼X10
iαiπiy i þ
X9
iðπi � π10Þdαi ð4Þ
The first term in the right-hand side of equation (4) differs slightly from the firsttwo terms of (2) in the following ways. First, we no longer explicitly distinguishthe productivity growth that arises as a result of unconditional convergencein the modern manufacturing sector (Channel (B) in equation (2)). Modernmanufacturing in Ghana counts for only a small component of the manufac-turing sector defined in the national account, and the growth contribution of itsso-called unconditional convergence in manufacturing seems not to have beenimportant. In addition, there is not enough data to allow us to define a modernmanufacturing separately in equation (4). Second, y i in equation (4) whichmeasures the change in within-sector’s labor productivity, can be differentacross sectors. This is a modification from equation (2) in which γ is the samefor all sectors. This modification allows equation (4) to be flexible enough inmeasuring the actual change in a sector’s labor productivity. The second termsin the right-hand side of equation (4) is to capture the structural-change-ledgrowth, which is the combination of Channels (C) to (E) in equation (2) inwhich the economy is aggregated into four sectors.
2.3.3 Results
The model was applied to Ghana using sector-level data obtained from GGDC(2015) for the period 1984 to 2011. Table 2.8 shows the key model coefficientsused; namely, the relative labor productivity of each sector (πi in equation (4)),
OUP CORRECTED PROOF – FINAL, 31/7/2019, SPi
34 ’ -
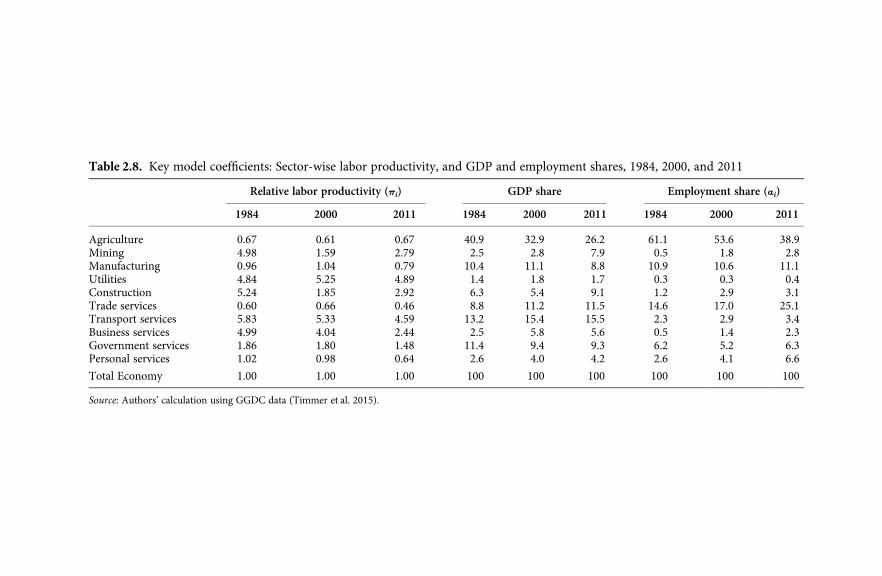
Table 2.8. Key model coefficients: Sector-wise labor productivity, and GDP and employment shares, 1984, 2000, and 2011
Relative labor productivity (πi) GDP share Employment share (αi)
1984 2000 2011 1984 2000 2011 1984 2000 2011
Agriculture 0.67 0.61 0.67 40.9 32.9 26.2 61.1 53.6 38.9Mining 4.98 1.59 2.79 2.5 2.8 7.9 0.5 1.8 2.8Manufacturing 0.96 1.04 0.79 10.4 11.1 8.8 10.9 10.6 11.1Utilities 4.84 5.25 4.89 1.4 1.8 1.7 0.3 0.3 0.4Construction 5.24 1.85 2.92 6.3 5.4 9.1 1.2 2.9 3.1Trade services 0.60 0.66 0.46 8.8 11.2 11.5 14.6 17.0 25.1Transport services 5.83 5.33 4.59 13.2 15.4 15.5 2.3 2.9 3.4Business services 4.99 4.04 2.44 2.5 5.8 5.6 0.5 1.4 2.3Government services 1.86 1.80 1.48 11.4 9.4 9.3 6.2 5.2 6.3Personal services 1.02 0.98 0.64 2.6 4.0 4.2 2.6 4.1 6.6
Total Economy 1.00 1.00 1.00 100 100 100 100 100 100
Source: Authors’ calculation using GGDC data (Timmer et al. 2015).
OUPCORRECTED
PROOF–FIN
AL,
31/7/2019,SP
i

and the employment shares (αi in equation (4)), as well the sector shares inGDP, for 1984, 2000 and 2011. Key observations here are: a) the low laborproductivity of agriculture relative to all sectors except trade services in 1984and 2011 and, in 2011, personal services; and b) the employment shares for allsectors except agriculture either increased over 1984–2011 or remainedunchanged (utilities and government services). Clearly, there has been anet outflow of migrants from agriculture to most other sectors, which isconsistent with structural change. However, whether this structural changecontributed to raising national labor productivity depends on whether or notworkers moved from agriculture to sectors with higher labor productivities.The last panel in Table 2.8 provides a cautionary note: the sectors whoseemployment shares grew the most over 1984–2011 were trade and personalservices, yet these sectors had similar or lower labor productivities thanagriculture. The movement of workers from agriculture to these sectorswould have made a negative contribution to growth in national laborproductivity, and this would have reduced the overall gain from structuralchange. The model decomposition results in Tables 2.9 and 2.10 clarify thesituation.
The last panel of Table 2.9 shows the annual growth rates in labor prod-uctivity by sector, and for the total economy (which is the weighted sum ofgrowth rates in labor productivity across sectors) for the periods of 1984–2011and 2000–11. These growth rates are then disaggregated by sector to show the
Table 2.9. Decomposition of Ghana’s economy-wide labor productivity growth in1984–2011 and 2000–11 (results sum to total growth rate for economy each period)
Within sector(αiπiy i)
Structural change[ðπi � π10Þdαi]
Total growth[αiπiy i þ ðπi � π10Þdαi]
1984–2011 2000–11 1984–2011 2000–11 1984–2011 2000–11
Agriculture 1.03 1.11 – – 1.03 1.11Mining 0.02 0.19 0.20 0.22 0.22 0.41Manufacturing 0.24 0.04 0.01 0.01 0.25 0.06Utilities 0.06 0.04 0.00 0.00 0.06 0.04Construction 0.07 0.41 0.16 0.07 0.23 0.48Trade services 0.17 –0.04 –0.03 –0.07 0.14 –0.10Transport services 0.30 0.22 0.20 0.21 0.51 0.43Business services –0.01 –0.10 0.23 0.22 0.22 0.11Government services 0.21 0.10 –0.03 0.10 0.19 0.20Personal services 0.05 –0.04 0.03 0.03 0.08 –0.01
Total Economy 2.14 1.93 0.78 0.80 2.93 2.73
Source: Authors’ calculation using GGDC data (Timmer et al. 2015).
OUP CORRECTED PROOF – FINAL, 31/7/2019, SPi
36 ’ -

part due to within-sector growth (panel 1), and the part due to structuralchange (panel 2). Table 2.10 shows the same results in percentage share form(taking the economy-wide labor productivity growth rate as 100).
A key result for the economy as a whole is that while labor productivitygrew by 2.93 percent per year over 1984–2011, 73.2 percent of this was due togrowth in “within-sector” labor productivity, while “structural change” con-tributed only 26.8 percent. These shares were little changed even in the morerecent period 2000–11 (70.8 percent and 29.2 percent, respectively). Ourfinding is similar to that of Osei and Jedwab (2016), who used a similar dataset but a slightly different decomposition approach.
In Rodrik’s terminology, growth in Ghana has been predominantly led bythe fundamentals rather than structural change, and this is unusual even incomparison to other African countries. Indeed, comparing Ghana’s growthpattern with seven other low-income African countries available in the GGDCdataset, the contribution of structural change to the overall labor productivitygrowth in Ghana is among the lowest. For the eight low-income Africancountries together, structural change contributed 56 percent of economy-wide productivity growth in 2000–10, and it contributed more than 90 percentin four of the eight countries in the GGDC dataset (Diao, Harttgen, andMcMillan 2017).
The reason for Ghana’s poor performance on structural change has alreadybeen anticipated in our discussion of Table 2.8. The sectors that absorbed mostof the labor that moved out of agriculture over 1984–2011, namely, tradeservices and personal services, had low labor productivities even compared toagriculture, hence the movements of labor to these sectors contributed little tothe growth in national labor productivity. In fact, because labor productivity intrade services was lower than in agriculture, the movement of labor to thissector made a negative (–2.5 percent) contribution to aggregate labor prod-uctivity in 2000–10 (panel 2 of Table 2.10).
Another striking result in Tables 2.9 and 2.10 is that labor productivity inagriculture grew more than in any other sector, accounting for the lion’s shareof the increase in the within-sector labor productivity of the entire economy,and for 35.3 percent of the increase in national labor productivity over1984–2011. Labor productivity also grew in some nonagricultural sectors,but in most cases the growth was very modest, especially during 2000–11.Labor productivity even fell in trade, business and personal services in thislater period. Thus, the overall gains from within-sector productivity slowed inthe economy as a whole, led by a slowdown in most nonagricultural sectorsduring 2000–11. The most alarming decline was in manufacturing, whose
OUP CORRECTED PROOF – FINAL, 31/7/2019, SPi
37

growth in within-sector labor productivity slowed from 0.24 percent during1984–2011 to 0.04 percent during 2000–11.
Labor productivity in Ghana would have grown faster if more workers hadmoved into the highest productivity sectors. Why did this not happen? Thereare four non-traded nonagricultural sectors (utilities, construction, transportservices, and business services), which all have labor productivities that arethree to four times higher than the economy’s average (Table 2.8). However,the expansion of these high-productivity sectors has been rather modest.Together they increased their employment share by less than 5 percentagepoints over 1984–2011. Their expansion is constrained by the fact that theyproduce mostly nontradables outputs/services, and hence their growthdepends on growth in the rest of the economy.
Mining is another sector that has a much high labor productivity relativeto the national average (Table 2.8), and which contributes significantly toGhana’s exports. However, large-scale modern mines, which dominate thesector, are extremely capital intensive and do not employ much labor, whileinformal small-scale mining is labor intensive but has low labor productivity.The emerging oil sector is also capital intensive and requires few workers.
One might expect manufacturing to have a relatively high labor productivity,but as shown in Table 2.8, it productivity was not much higher than agriculturein 2011. During 1984–2011, manufacturing also experienced little growth in itswithin-sector productivity (Table 2.9), or its employment share (Table 2.8), andits total contribution to the increase in national labor productivity was a mere
Table 2.10. Contributions of each sector to Ghana’s economy-wide laborproductivity growth in 1984–2011 and 2000–11 (% shares)
Within sector Structural change Total growth
1984–2011 2000–11 1984–2011 2000–11 1984–2011 2000–11
Agriculture 35.3 40.6 – – 35.3 40.6Mining 0.7 7.0 7.0 8.2 7.6 15.1Manufacturing 8.0 1.6 0.5 0.5 8.5 2.1Utilities 1.9 1.5 0.1 0.2 2.0 1.6Construction 2.5 15.0 5.3 2.5 7.8 17.5Trade services 5.9 –1.4 –1.1 –2.5 4.8 –3.8Transport services 10.4 8.2 6.9 7.6 17.3 15.8Business services –0.5 –3.8 7.9 7.9 7.4 4.2Government services 7.3 3.5 –1.0 3.8 6.3 7.3Personal services 1.7 –1.4 1.1 1.0 2.8 –0.3
Total Economy 73.2 70.8 26.8 29.2 100 100
Source: Authors’ calculation using GGDC data (Timmer et al. 2015).
OUP CORRECTED PROOF – FINAL, 31/7/2019, SPi
38 ’ -

8.5 percent in 1984–2011. This contribution fell to only 2.1 percent in 2000–11(Table 2.10). The problem is that while there are some formal manufacturingfirms in Ghana that have reasonably high labor productivity, the sector is stilldominated by many small and informal enterprises that have very low laborproductivities. Ghana has not yet been able to achieve any significant growth inits formal manufacturing sector, nor in its manufacturing exports.
2.4 Future Prospects
Section 2.3 has shown that Ghana’s economic growth since the SAP of the 1980shas been driven primarily by improvements in Rodrik’s “fundamentals”, whichled to steady but modest growth in within-sector labor productivities, especiallyfor agriculture, and thence steady but modest growth in national GDP percapita. Structural change has played only a modest role in raising labor prod-uctivity. Although there has been a significant shift of workers out of agriculture,they have mostly moved to jobs in informal services and manufacturing,where labor productivity is similar to or even lower than in agriculture. A shiftto these kinds of jobs does little to raise average labor productivity, and in onecase (movement to trade services), has even made a negative contribution.
Looking to the future, Ghana can expect to continue to gain from thelonger-term impacts of past and ongoing improvements in its fundamentals,but these promise at best a modest if steady contribution to growth in GDP percapita. Their contribution may also slow as some important past sources ofproductivity growth run out of steam. For example, labor productivity growthin agriculture has depended on land expansion, but the land frontier is nowapproaching its limits, and unless other sources of productivity growth can betapped, agriculture’s labor productivity growth rate will slow (see Chapter 4).
How can Ghana sustain its current average annual GDP per capita growthrate of 2.8 percent? Better still, are there ways for Ghana to accelerate its growthrate to new highs? Additional growth of within-sector productivities will need toplay a key role, and this requires a continued emphasis on fundamentals innational policy. But for faster growth, Ghana also needs to do a better job oftapping into the benefits of structural change, and this requires policies that cangenerate more rapid growth of modern sectors that can achieve a) high levels oflabor productivity relative to agriculture, and b) absorb lots of workers fromlower productivity sectors like agriculture. It is likely that the oil and miningsectors will provide an important, if volatile, source of GDP growth, but despitetheir high labor productivities, they are not likely to create much additional
OUP CORRECTED PROOF – FINAL, 31/7/2019, SPi
39

employment. More promising possibilities for creating productive employmentlie in growing the more productive parts of the agricultural, manufacturing, andservices sectors, and these options are reviewed below.
2.4.1 Agriculture
As shown in Section 2.3.2,the agricultural sector contributed the most togrowth in economy-wide labor productivity during 1984–2011. This is asignificant achievement given that agriculture is still the largest employer,and most of its workers are traditional, often poor, smallholders. However,the sector’s labor productivity is still only about 60 percent of the nationalaverage (Table 2.8), which is lower than the productivity of all nonagriculturalsectors except trade and personal services. This is good news in the sense thatthere ought to be significant opportunities to achieve greater productivitygains. There are also good prospects for growth in the demand for agriculturalproducts in the national, West African regional, and world markets. A challengeis that past increases in labor productivity have come mainly from expandingthe total crop area, which has been possible because Ghana was a relatively land-abundant country. But this option is running out, and future productivitygrowth will increasingly depend on technology, management, and land-usechanges that accelerate the growth in land as well as labor productivity. Theseissues are discussed in Part II of this book, where they are analyzed in somedepth. An important finding is that while the agricultural sector has benefitedfrom an enabling policy environment that has encouraged farmers to invest inexpanding their production, still the sector has been constrained by low levels ofpublic investment and, apart from cocoa, by limited success in developing thevalue chains for nontraditional export crops, or import substituting crops andlivestock products like rice, tomatoes, and chicken. Had the government beenmore effective in partnering with the private sector, then perhaps there wouldhave been a greater shift by now to faster growth in land productivity in Ghana,and an even faster rate of labor productivity growth.
2.4.2 Manufacturing
2.4.2.1 Background
Manufacturing played a crucial role in the development of China and mostSouth East Asian economies, and as argued by Rodrik (2014), offers a shortcut
OUP CORRECTED PROOF – FINAL, 31/7/2019, SPi
40 ’ -

for a developing country like Ghana to achieve rapid growth. The sector hastwo key advantages: a) it faces an elastic demand for its output, either throughexports or import substitution, and b) it is relatively easy for modern manu-facturing firms to achieve high levels of efficiency and labor productivitythrough the adoption of internationally available technologies and know-how. Manufacturing can thus grow and expand rapidly in environmentswhere the economy-wide capabilities in terms of human capital and institu-tions are still very limited. Manufacturing can also absorb a large number ofless skilled workers coming directly out of agriculture, which makes the sectorthe most desirable destination for a majority of poor rural migrants, leading tolarge-scale structural changes and growth of economy-wide productivity.Sadly, the manufacturing sector has yet to play an important role in Ghana’seconomic development.
Ghana inherited a small manufacturing sector at Independence that com-prised mostly small informal enterprises serving the domestic market(Rimmer 1992). Developing a formal industrial sector was an early govern-ment priority, and Ghana pursued a state-led industrialization programfocused mainly on import-substitution industrialization (ISI). The result wasa rapid expansion of the modern manufacturing sector in the 1960s and early1970s, with many state-owned firms being set up (Steel 1972). But the sectornever became that big in terms of its shares in national GDP or employment,and despite the many state-owned firms that were set up, the vast majorityof manufacturing jobs remained in small, informal manufacturing units(Friedrich Ebert Foundation 1994: 53; Ball (1998: 87)). As shown inTable 2.6b, this is still the pattern; in 2010, 84.6 percent of total manufacturingjobs were in the informal sector.
As in many other countries that pursued similar industrialization pol-icies, the ISI strategy was not a success. To promote industrialization in theformal sector, the government invested heavily in setting up state-ownedmanufacturing firms, and engaged in policies that protected and favoredtheir development, such as trade protection, and privileged access to foreignexchange and finance. Most state-owned firms proved costly and inefficient,and were never able to compete with imports on a fair footing, or expandinto export markets. Not only did the ISI waste resources in the state-owned sector, it crowded out the private sector, distorted the economy, andimpeded growth, contributing importantly to the economic crises of theearly 1980s.
Correcting the legacy of ISI was a major priority of the SAP reforms, whichinvolved unwinding the policy distortions, and privatizing most state enterprises.
OUP CORRECTED PROOF – FINAL, 31/7/2019, SPi
41

Even so, the manufacturing sector failed to take off and its share in nationalGDPwas only 5.6 percent in 2016, down from 10.5 percent in 2006 (Table 2.3).It also remains a low-productivity sector. In 2011, labor productivity inmanufacturing was only 80 percent of the national average (Table 2.8), andits within-sector labor productivity only grew by 0.24 percent per year over1984–2011. Even then, most of this gain occurred during and immediatelyafter the SAP reforms; its within-sector labor productivity grew by a mere0.04 percent per year during 2000–11 (Table 2.9).
2.4.2.2 A bifurcated sector
One reason for the poor performance of the manufacturing sector is because ofthe split between a relatively small number of large-sized firms in the formalsector, and a much larger number of small and informal units, including manyhousehold enterprises and micro firms. Some insights into the relative prod-uctivity of formal and informal enterprises can be gleaned from an NIC reportpublished by the government (GSS 2006), which provides value-added andemployment information by firm size groups (Table 2.11).
The average firm size is about 164 workers for the medium and large (� 30workers) firm size group, and 17.1 and 4.8 workers for the two smaller firmsize groups. The larger firms provide 84 percent of the total manufacturingvalue-added in this NIC sample, but only 38 percent of total employment.The ratio of these two numbers provides an estimate of the relative laborproductivity of the different firm size groups. Normalizing the averagelabor productivity for the entire sample to 1.0, the relative labor productivityof the larger firms is 2.2, but only 0.3 and 0.2 for the two smaller firms. That is
Table 2.11. Shares of value-added and employment and labor productivity forthree groups of manufacturing firms in Ghana
Large firms(employee number � 30)
Small firmsEmployees number
10–29 1–9
Share of value-added (%) 83.8 6.7 9.5Share of employment (%) 38.2 21.8 40.0Average firm size (person/per firm) 163.9 17.1 4.8Relative labor productivity (totalmanufacturing’s labor productivity = 1.0)
2.2 0.3 0.2
Ratio to the smallest firm group (smallfirms with employees 1–9 = 1.0)
9.3 1.3 1.0
Source: Authors’ calculation using data of 2003 NIC (GSS 2006).
OUP CORRECTED PROOF – FINAL, 31/7/2019, SPi
42 ’ -

to say, an average worker in a larger firm is about eight times more productivethan an average worker in small manufacturing firms (Table 2.11).⁸
Although larger manufacturing units achieve higher labor productivities,they also require more capital, and that could affect their competitiveness.Again, insights can be gained from the published NIC report, which providesestimates of the value of fixed capital at the beginning of 2003 for individualindustries and by two firm size groups (firms with more than ten employees,and those with less). Using such information, we can calculate capital andlabor ratios across industrial sectors and by size group.⁹ At the national level,for all the manufacturers covered by the NIC, the average value of fixed capitalis $7,155 per worker, while for the larger firms (� 10 workers) it is $11,908,and for the small firms (less than ten workers) it is only $25.4 per worker.Thus, although the labor productivity of small firms (1–9 workers) is only1/9th that of the larger firms (Table 2.11), they are achieving this level ofproductivity using only 0.02 percent as much capital per worker as the largefirms. Another problem is that the large firms pay much higher wages thansmall firms, which is in line with their higher labor productivity. But giventhan Ghana is now a relatively high-wage economy, this does undermine theircompetitiveness when competing against low-wage Asian competitors inGhana’s domestic or potential export markets.
2.4.2.3 What is holding back manufacturing?
Much has been written about the constraints on the manufacturing sector inGhana. These include the business environment (see Chapter 3), high trans-port costs, inadequate and costly port facilities, unreliable power supplies,inadequate access to finance, difficulties in obtaining land rights, high laborcosts, weak or ineffective industrial policies, and state–business relations, etc.(World Bank 2014; Owoo and Page 2017). These constraints appear to bemore binding on the formal than informal sector, making it difficult for formalmanufacturing firms to achieve a competitive edge against international com-petitors. On the other hand, the informal sector faces a more binding marketconstraint, because it produces mostly nontradables, the demand for which isconstrained by growth in national demand. Demand for the products of the
⁸ Many workers in the small firms are not regular employees. For example, the regular employeesaccounted for 21 percent of total employment in the small firm group with employees 1–9. Thus, whenall workers are treated equal, as we did in Table 2.11, it could significantly underestimate the laborproductivity for small firms. Keeping this caveat in mind, the labor productivity gaps between smallfirms and large firms should still be significant.⁹ According to 2003 NIC, value of fixed capital assets at the beginning the survey year include values
of land, buildings, machinery and equipment (GSS 2006).
OUP CORRECTED PROOF – FINAL, 31/7/2019, SPi
43
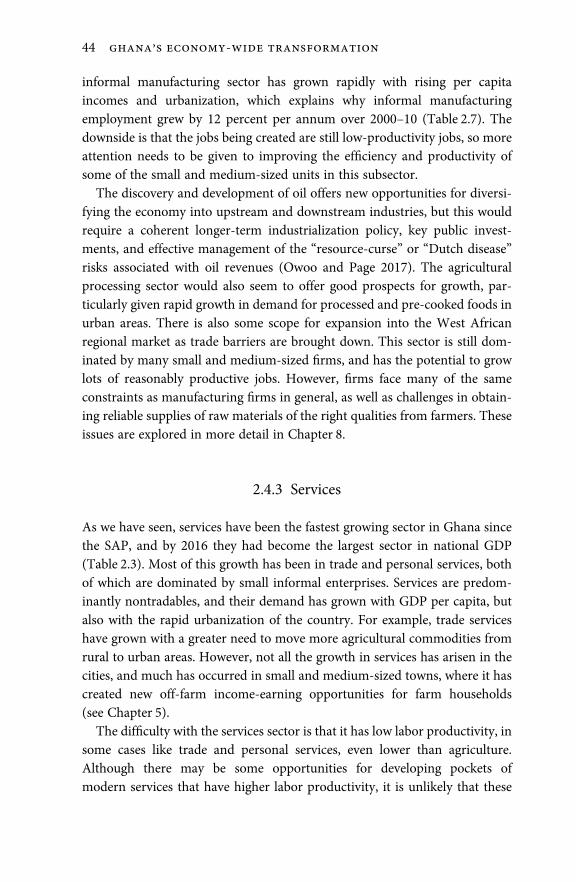
informal manufacturing sector has grown rapidly with rising per capitaincomes and urbanization, which explains why informal manufacturingemployment grew by 12 percent per annum over 2000–10 (Table 2.7). Thedownside is that the jobs being created are still low-productivity jobs, so moreattention needs to be given to improving the efficiency and productivity ofsome of the small and medium-sized units in this subsector.
The discovery and development of oil offers new opportunities for diversi-fying the economy into upstream and downstream industries, but this wouldrequire a coherent longer-term industrialization policy, key public invest-ments, and effective management of the “resource-curse” or “Dutch disease”risks associated with oil revenues (Owoo and Page 2017). The agriculturalprocessing sector would also seem to offer good prospects for growth, par-ticularly given rapid growth in demand for processed and pre-cooked foods inurban areas. There is also some scope for expansion into the West Africanregional market as trade barriers are brought down. This sector is still dom-inated by many small and medium-sized firms, and has the potential to growlots of reasonably productive jobs. However, firms face many of the sameconstraints as manufacturing firms in general, as well as challenges in obtain-ing reliable supplies of raw materials of the right qualities from farmers. Theseissues are explored in more detail in Chapter 8.
2.4.3 Services
As we have seen, services have been the fastest growing sector in Ghana sincethe SAP, and by 2016 they had become the largest sector in national GDP(Table 2.3). Most of this growth has been in trade and personal services, bothof which are dominated by small informal enterprises. Services are predom-inantly nontradables, and their demand has grown with GDP per capita, butalso with the rapid urbanization of the country. For example, trade serviceshave grown with a greater need to move more agricultural commodities fromrural to urban areas. However, not all the growth in services has arisen in thecities, and much has occurred in small and medium-sized towns, where it hascreated new off-farm income-earning opportunities for farm households(see Chapter 5).
The difficulty with the services sector is that it has low labor productivity, insome cases like trade and personal services, even lower than agriculture.Although there may be some opportunities for developing pockets ofmodern services that have higher labor productivity, it is unlikely that these
OUP CORRECTED PROOF – FINAL, 31/7/2019, SPi
44 ’ -

can substitute for the development of more productive manufacturing andagricultural activities if Ghana is to benefit more from structural change.
2.5 Conclusions
Ghana’s economic growth since the SAP reforms of the 1980s has been drivenprimarily by improvements in “fundamentals,” which led to steady butmodest growth in within-sector labor productivities, and thence steady butmodest growth in national GDP per capita. Structural change has played onlya modest role in raising labor productivity. While many workers have left agricul-ture, many of them have moved to sectors with similar or even lower laborproductivity, so this has contributed little to raising the average labor productivity.
Ghana can expect to continue to gain from the longer-term impacts of pastand ongoing improvements in its fundamentals, but these promise at best amodest if steady contribution to growth in GDP per capita. Their contributionmay also slow as some important past sources of productivity growth run outof steam as, for example, the possibilities for further land expansion foragriculture. If Ghana is to sustain or even accelerate its average annual GDPper capita growth rate of 2.8 percent, then the country will need to do a betterjob of tapping into the benefits of structural change, and this requires policiesthat can generate more rapid growth of sectors that can achieve a) high levelsof labor productivity relative to traditional agriculture, and b) absorb lots ofworkers from lower productivity sectors like traditional agriculture. While theoil and mining sectors will provide an important, if volatile, source of GDPgrowth, and they have high labor productivities, they are not likely to createmuch additional employment on their own. Although with the right industrialpolicies and investments, there is scope to use these sectors to help diversifythe economy into more upstream and downstream industries. Other promis-ing possibilities for creating productive employment lie in expanding andimproving the more productive parts of the agricultural, manufacturing, andservices sectors. Not only is there a growing national demand that offers newmarket opportunities in these sectors, but with increasing regional economiccooperation, Ghana should be able to increase its exports into the WestAfrican regional market.
In Rodrik’s scheme of things, structural change led by improving suchsectors requires a more proactive development state approach to drive it,and not just a focus on fundamentals. Ghana’s earlier attempts to developspecific sectors through government-led initiatives like the ISI industrialization
OUP CORRECTED PROOF – FINAL, 31/7/2019, SPi
45
program failed badly. The relevant questions now are: a) whether there arebetter policies available today that might successfully drive lead sectors, and b) ifso, does the government have the inclination or capacity to deliver on such anagenda? These questions are addressed in subsequent chapters, with specialemphasis on the agricultural and food sectors.
References
Aghion, P., and P. Howitt. 1992. “A Model of Growth through Creative Destruc-tion.” Econometrica 60(2): 323–51.
Ball, Rajiv. 1998. “The ‘Long Depression’ and the Growth of Small-scale Industriesin Ghana, 1970–mid1980s,” in Gareth Austin (ed.), Industrial Growth in theThird Word, 1870–1990. LSE Working Papers in Economic History, 44/98.London: LSE, 73–87.
Collier, Paul, and Anthony J. Venables. 2007. “Rethinking Trade Preferences:How Africa Can Diversify its Exports.” The World Economy 30(8): 1326–45.
Diao, X., K. Harttgen, and M. McMillan. 2017. “The Changing Structure ofAfrica’s Economies.” NBER Working Paper No. 23021. Cambridge, MA:National Bureau of Economic Research.
Friedrich Ebert Foundation. 1994. “Privatization of State-owned Enterprises inGhana: Proceedings of a Workshop Organized for Members of the Finance Com-mittee of Parliament on 18–20 of November.” Accra: Friedrich Ebert Foundation.
Gollin, D., R. Jedwab, and D. Vollrath. 2016. “Urbanization with and withoutIndustrialization.” Journal of Economic Growth 21(1): 35–70.
Grossman, G., and E. Helpman. 1991. Innovation and Growth in the GlobalEconomy. Cambridge, MA: MIT Press.
GSS (Ghana Statistical Service). 2003. “Population and Housing Census 2000.”Census data. Accra.
GSS (Ghana Statistical Service). 2006. “National Industrial Census 2003.” Accra.
GSS (Ghana Statistical Service). 2010. “Rebasing of Ghana’s National Accounts toReference Year 2006.” Accra.
GSS (Ghana Statistical Service). 2013. “Population and Housing Census 2010.”Census data. Accra.
Japan External Trade Organization (JETRO). 2009. “Kakkoku Chiiki Betsu Joho”(information by country/region). Available at: http://www.go.jp/world/search/compare.
Leite, Sergio Pereira, Anthony Pellechio, Luisa Zanforlin et al. 2000. “Ghana:Economic Development in a Democratic Environment.” Occasional PaperNo. 199. Washington, DC: International Monetary Fund.
OUP CORRECTED PROOF – FINAL, 31/7/2019, SPi
46 ’ -

Lewis, W. A. 1954. “Economic Development with Unlimited Supplies of Labor.”Manchester School of Economic and Social Studies 22(2): 139–91.
McMillan, Rodrik and Claudia Sepúlveda (eds). 2016. Structural Change, Funda-mentals, and Growth: A Framework and Case Studies. Washington, DC: Inter-national Food Policy Research Institute.
Ministry of Trade and Industry (MoTI). 2002. “Study of the Textile Sub-sector, aReport Prepared by Brucks & Associates for MoTI.” November. Accra: MoTI.
Mottaleb, Khondoker Abdul and Tetsushi Sonobe. 2011. “An Inquiry into theRapid Growth of the Garment Industry in Bangladesh.” Economic Developmentand Cultural Change 60(1): 67–89.
Osei, Robert Darko and Rémi Jedwab. 2016. “Structural Change in a Poor AfricanCountry: New Historical Evidence from Ghana,” in Margaret McMillan, DaniRodrick, and Claudia Sepúlveda (eds). 2016. Structural Change, Fundamentals,and Growth: A Framework and Case Studies. Washington, DC: InternationalFood Policy Research Institute.
Owoo, Nkechi and John Page. 2017. “Industrial Policy in Ghana: From DominantState to Resource Abundance,” in E. Aryeetey and R. Kanbur (eds), TheEconomy of Ghana Sixty Years after Independence. Oxford: Oxford UniversityPress, 176–91.
Quartey, P. 2006. “The Textile and Clothing Industry in Ghana,” in H. Jauch andR. Traub-Marz (eds), The Future of the Textile and Clothing Industry in Sub-Saharan Africa. Buchdruckerei: Bub Bonner University, 135–16.
Ranis, G., and J. C. Fei. 1961. “A Theory of Economic Development.” AmericanEconomic Review 51(4): 533–58.
Rimmer, Douglas. 1992. Staying Poor: Ghana’s Political Economy, 1950–1990.Oxford: Pergamon Press.
Rodrik, D. 2013. “Unconditional Convergence in Manufacturing.” QuarterlyJournal of Economics 128(1):165–204.
Rodrik, D. 2014. “The Past, Present, and Future of Economic Growth,” in FranklinAllen et al., Towards a Better Global Economy: Policy Implications for CitizensWorldwide in the 21st Century. Oxford: Oxford University Press, 70–133.
Rodrik, D. 2018. “An African Growth Miracle?” Journal of African Economies27(1): 10–27.
Steel, William F. 1972. “Import Substitution and Excess Capacity in Ghana.”Oxford Economic Papers 24(2): 212–40.
Solow, R. M. 1956. “A Contribution to the Theory of Economic Growth.” Quar-terly Journal of Economics 70(1): 65–94.
Timmer, M. P., G. J. de Vries, and K. de Vries. 2015. “Patterns of StructuralChange in Developing Countries,” in J. Weiss and M. Tribe (eds), Handbook ofIndustry and Development. London: Routledge, 65–83.
OUP CORRECTED PROOF – FINAL, 31/7/2019, SPi
47

World Bank. 2006. World Development Indicators. Available at: http://data.worldbank.org/indicator in 2006.
World Bank. 2014. “Ghana: Country Profile 2013”. Enterprise Surveys. Washington,DC: World Bank.
World Bank. 2017. World Development Indicators. Available at: http://data.worldbank.org/indicator in 2017.
OUP CORRECTED PROOF – FINAL, 31/7/2019, SPi
48 ’ -
3Strong Democracy, Weak State
The Political Economy of Ghana’s StalledStructural Transformation
Danielle Resnick
3.1 Introduction
What are the political and institutional factors that enable governments topursue policies to promote economic and agricultural transformation? Sus-taining growth, achieving inclusive development, and promoting structuraltransformation require qualitatively different, albeit not necessarily mutuallydistinct, economic policy interventions. In particular, respecting propertyrights, investing in broad-based public goods, such as infrastructure, education,and health, and adhering to macroeconomic stability, can be critical “funda-mentals” for, or enablers of, sustainable growth, but they do not necessarilyresult in structural transformation (see Chapter 2 of this book, and Rodrik2014). Instead, the latter may bemore likely when specific industries are favored,firms are incentivized, and market failures within and across sectors are over-come (see Sen 2015). Hausmann et al. (2008) identify three different types ofmarket failures that need to be overcome in order to achieve transformation:self-discovery externalities (identifying new products that can be producedprofitably), coordination externalities (engaging in simultaneous investmentsupstream and downstream), and missing public inputs (legislation, accredit-ation, and infrastructure). Structural transformation therefore requires moreactivist government policies beyond providing an enabling environment.
However, some of the economic policy levers that are available for address-ing these market failures may be more viable in certain political and institu-tional settings than others. By investing in the economic “fundamentals,”peaceful, democratic societies are typically better at sustaining growth thanconflict-ridden, autocratic ones (e.g., Acemoglu and Robinson 2012; Feng1997; Gerring et al. 2005; Przeworski et al. 2000; Rodrik 2000). Yet, thesesame political virtues may not always be associated with the institutional
OUP CORRECTED PROOF – FINAL, 30/7/2019, SPi

environment and economic policies needed to generate structural transform-ation. Historically, structural transformation has not been uncommon inclosed political regimes, ranging from Bismarkian Germany of the late1800s, to the 1970s period of dictatorship in Brazil and South Korea, to one-party regimes in Ethiopia and Rwanda from the 2000s onward (e.g., Holden2012; Kelsall 2013; Kohli 2004; Leftwich 1995; Poulton 2014; Schneider 1999).
This chapter therefore argues that Ghana’s sustained economic growth inrecent decades reflects a concerted commitment to maintaining politicalfundamentals. Ghana is broadly lauded for its environment of political plur-alism, respect for human rights, free and fair elections, and vocal civil society.According to multiple indicators, including Freedom House, the IbrahimIndex of African Governance (IIAG), and Polity IV, Ghana ranks near thetop of the African region. A genuinely competitive multi-party system hasresulted in the alternation of political parties in office and has classified thecountry as one of only a handful on the continent to have achieved democraticconsolidation according to Huntington’s (1991) two-turnover test. In fact, thetwo main political parties, the National Democratic Congress (NDC) and theNew Patriotic Party (NPP), peacefully have handed over power to each otherin 2000, 2008, and 2016. Party institutionalization and respect for the rule oflaw meant that the death in office of President John Atta Mills in 2012 did notresult in the power vacuum or political chaos witnessed recently in Africancountries that have faced a similar fate, such as Malawi and Zambia. Despitethe presence of ethnic divisions, they have not undermined the country’sunity, and no group has ever attempted to secede (see Oduro et al. 2014).Indeed, while neighboring countries with similar economies, such as Côted’Ivoire, were plunged into ethnic and religious conflict in recent years, Ghanahas remained peaceful and avoided local conflicts from exploding into regionalor national conflagrations. When Ghana became the only sub-Saharan Africancountry besides South Africa to launch a $750 million Eurobond in 2007, itwas four times oversubscribed with political stability repeatedly identified byinternational investors as one reason for its success (Chung 2007; Rao 2007).¹
Yet, despite these virtues, and as shown in Chapter 2, Ghana has beenunable to achieve substantial structural transformation in the sense of accel-erating the growth of high labor productivity sectors and shifting labor tothem from low-productivity sectors, like traditional agriculture (see alsoJebwab and Osei 2012; Killick 2000; Powell and Round 2000). Moreover, the
¹ Indeed, despite the country’s growing external debt and ambiguity about oil reserves, the countryhas successfully launched three additional Eurobonds.
OUP CORRECTED PROOF – FINAL, 30/7/2019, SPi
50 ,

country appears to face recurrent lapses of fiscal management. Public sectorcapacity and financial management indicators are often volatile, with a strongdeviation from economic prudence close to elections. Public opinion surveysindicate low levels of trust in the government to deliver on its promises whileconstrained relationships between successive governments and the domesticbusiness community have impeded long-term strategizing on priorities forgrowth and development.
Consequently, Ghana is strongly democratic but plagued by weak statecapacity, and these politico-institutional characteristics have shaped the eco-nomic policies pursued, including in the agricultural sector, and the resultantdevelopment trajectory. Specifically, Rawlings, who oversaw the transitionfrom the economic crisis years of the early 1980s, combined aspects ofdevelopmental neo-patrimonialism with a small but technocratic financialteam to push through structural adjustment policies that helped stabilizethe macro economy. After the country’s democratic transition in the early1990s, Ghana has witnessed broad investment in public goods and socialwelfare due to its competitive party system. However, this chapter arguesthat three political economy factors have undermined its ability to achievesubstantive structural transformation. First, democracy has enabled abroader range of interest groups to permeate policymaking decisions, oftenresulting in policy backtracking and volatility as well as fiscal deficits aroundelections that, among other things, stifle credit access for domestic businessthrough high interest rates. Secondly, public sector reforms were not pursuedwith the same vigor as macroeconomic reforms, meaning that the state haslacked the capacity typically necessary to identify winning industries or toactively facilitate the transition to higher value-added sectors. Thirdly, suc-cessive governments, regardless of party, have failed to actively invest inbuilding strong, productive relationships with the private sector, which is alegacy of Rawlings’ strong distrust and alienation of the sector during histenure in office.
The chapter expounds on these arguments by first reviewing in Section 3.2the extant scholarship on the linkages between governance, economic growthand structural transformation. Section 3.3 explores Ghana’s initial investmentsin economic fundamentals before turning in Section 3.4 to the challenge ofmaintaining these fundamentals as the country democratized and as disparateinterest group pressures became more pronounced. Then, Section 3.5 elabor-ates on the capacity constraints of Ghana’s bureaucracy, which can be tracedto insufficient attention to much-needed public sector reforms in recentdecades. Weak business–state relationships are analyzed in Section 3.6 before
OUP CORRECTED PROOF – FINAL, 30/7/2019, SPi
51

exploring the broader implications of these political and governance dynamicsfor agricultural transformation. The final section concludes by discussing whatthis combination of a strong democracy and a weak state implies for feasiblepolicy options in agriculture and beyond.
3.2 Governance, Growth, andTransformation: Regime or State?
The political and institutional characteristics that define countries can bebroadly aligned according to the type of political regime and the capacity ofthe state. Regimes fall along a wide continuum, ranging from completelyauthoritarian with no space for competition to liberal democracy with multi-party competition, freedom of association, and rule of law (see Howard andRoessler 2006; Levitsky and Way 2010).
Regime types are not always correlated with state capacity. The archetypicalview on state capacity originates from Weber (1978) who argued that arational-legal bureaucracy guided by meritocracy, high levels of expertise,and respect for the law was most likely to promote prosperity. According toSen (2015), the two main elements of state capacity are bureaucratic power(i.e., the ability of the state to implement policy decisions) and infrastructuralpower (i.e., the capacity of the state to exert full authority over nationalterritory). In a cross-country analysis using proxies for Weberian state struc-tures in thirty-five developing countries, Evans and Rauch (1999) find thatmeritocratic recruitment and career mobility are associated with higher eco-nomic growth, even after controlling for human capital and initial levels ofGDP per capita (see also Rauch and Evans 2000).
The Weberian ideal is typically contrasted to patrimonial rule wherebygovernment officials are driven more by allegiances and informal ties than byexpertise. Van de Walle (2001) has used the term “neo-patrimonial” to referto states with the outward trappings of a Weberian bureaucracy with rules,regulations, and formal procedures but are internally governed by clientelistpractices. He refers to African administrations whereby “the top technocratsmay be very competent and well trained, but they lead underfinanced statestructures with very little data gathering, planning, and policy analysiscapabilities” (van de Walle 2001: 55). The literature suggests that regimetype plays an important role in determining investment in economic funda-mentals while state capacity may play a larger part in shaping economictransformation.
OUP CORRECTED PROOF – FINAL, 30/7/2019, SPi
52 ,

3.2.1 Democracy
Democratic governments may have an incentive to provide a more equitabledistribution of resources (Acemoglu and Robinson 2006; Boix 2003), andinvest more in public than private goods (Bueno de Mesquita et al. 2005;Baum and Lake 2003). In addition, research suggests that they spend moreon education and social welfare (Ansell 2008; Brown and Hunter 1999;Huber et al. 2008), and do better than autocracies on important measures ofwell-being such as life expectancy and calorie consumption (Besley andKudamatsu 2006; Blaydes and Kayser 2011). Bates and Block (2013) evenfind that the introduction of competitive presidential elections in Africa sincethe 1990s is correlated with improvements in total factor productivity in theagricultural sector.
There are various causal mechanisms underlying these relationships. Meltzerand Richard (1981) argued that where the median income is lower than themean income, the majority of voters are poorer than their compatriots. In a poordemocracy, politicians are therefore motivated to adopt policies favoring the lesswell-off in order to increase their chances at re-election. Lake and Baum (2001)further suggest that the accountability of the electoral process forces democra-cies to improve human capital as broadly as possible (see also Stasavage 2005).Rodrik (1999) emphasizes the value of political participation, arguing thatdemocracies have higher manufacturing wages because they allow greaterfreedom of association and collective bargaining.
On the other hand, there have been suggestions that an emphasis ondemocracy can be counter-productive for development (e.g., Collier 2009;Sachs 2005) and that democracy can foment clientelism and undermine theeffective delivery of services (see Booth 2012). Ross (2006) finds that socialwelfare spending in democracies disproportionately benefits middle- andupper-income groups, supporting other scholars’ observations that electionsresult in targeted spending for organized constituents rather than broadwelfare spending (see Keefer 2007 and Karakoc 2010). In the African agricul-tural sector in particular, Poulton (2014) suggests that democratization hasresulted in governments favoring short-term policy options, especially inputsubsidy programs, rather than more long-term investments in research anddevelopment or extension.
Relatedly, the political budget cycle plays an important role in democracies.This view suggests that fiscal policy, especially government transfers forcertain goods and services, is manipulated before elections by opportunisticincumbents (see Rogoff 1990). The pattern is especially strong in developing
OUP CORRECTED PROOF – FINAL, 30/7/2019, SPi
53

countries (see Brender and Drazen 2005). For instance, based on a sample offorty-four African countries, Block (2002) finds that a government’s budgetdeficit increases by 1.2 percentage points in an election.
The collective implication from this literature is that the opportunities forpolitical participation and accountability that accompany democracy can forcegovernments to invest in economic fundamentals. However, economic policiesmay also favor those constituencies that are most powerful, either in numericalor material terms. This may result in policies that are not necessarily condu-cive to long-term growth or to achieving strategic development objectives.
3.2.2 Developmental States
The fact that democracies can become hostage to interest group pressures, andthereby distract from long-term strategic planning, has long bolstered thearguments of “developmental state” scholars. Historically, the term “develop-mental state” referred to those states, including Japan, Taiwan, South Korea,Singapore, and Hong Kong that engineered a transition from agrarian econ-omies or island trading centers to industrial economies through industrialpolicy (see Evans 1995; Johnson 1982). Johnson’s (1982) main insight from thestudy of the Japanese miracle was that economic development is plagued bymarket failures and depends on the government’s ability to facilitate coordin-ation of the private sector, offer selective and conditional support to particularfirms through subsidies, and intervene in markets when necessary.
Solving these coordination problems required a specific set of political andinstitutional characteristics. Politically, these transformations occurred underauthoritarian regimes that avoided capture by societal demands. Althoughthese governments invested in education, their repression of labor allowed forexport-oriented growth based on low wages and flexibility in hiring and firing(Deyo 1989; Haggard 1990). Institutionally, these developmental states werecharacterized by technocratic policymaking, the concentration of decision-making authority in just a few ministries or pilot agencies, and key reforms tobureaucratic routines and norms (see Amsden 1989; Chang 1994; Haggard1990; Cheng et al. 1998; Wade 1990). Recruitment and compensation based onmerit and career mobility were other key factors that precluded rent-seekingthat might otherwise undermine commitment to long-term developmentstrategies.
More recent studies have looked at the developmental state argument inother contexts, demonstrating that it may not have a natural affinity for a
OUP CORRECTED PROOF – FINAL, 30/7/2019, SPi
54 ,

particular regime type. For example, Mauritius is frequently portrayed as ademocratic developmental state (see Bräutigam 1997; Sandbrook 2005).Rodrik (2008) also discusses notable cases of state-led industrial policy indemocracies, including South Africa and Uruguay. Botswana represents amore muted example whereby a capable state led by a cattle-elite was com-mitted to development (Acemoglu et al. 2003). But repeated attempts todiversify the economy, even through multiple industrial policy plans, hasfailed to generate significant structural change since the 1990s (see McCaiget al. 2015). Notably, Mauritius’ major period of transformation occurredduring the thirty-four-year rule of same political party while both Botswanaand South Africa’s democratic periods have been one-party dominant.²
There are, however, critiques of the developmental state approach. Somehave noted that there has been an overemphasis on successful cases ofindustrial policy (see Geddes 2003; Robinson 2009). The failed cases of ISIindustrial policy in much of Latin America are an important caveat wherebygovernments did selectively intervene to favor an inward, rather than export-oriented, strategy. In other words, even states that have all the institutionalprerequisites to oversee a long-term strategy may still choose policies thatgenerate neither growth nor transformation. Secondly, developmental statescannot be shaped overnight to respond to development strategy imperativesbut rather the product of long-term historical processes, including coloniallineages (Kohli 2004). A third critique, elaborated on more below, is that atechnocratic Weberian state may be necessary but insufficient for transform-ation and that more attention is needed on the nature of the relationshipsbetween states and business.
3.2.3 State Business Coalitions
Relationships between the bureaucracy and the private sector need to behoned over time, generating credible commitments and trust, facilitating theflow of information and learning, and adapting to changing economic cir-cumstances (e.g., Leftwich 2010; Maxfield and Schneider 1997). Consequently,some have claimed that complex and close networks between the public andprivate sector are the linchpin for economic transformation. In the context ofexplaining the East Asian miracle, Evans (1995: 59) coined the concept of
² From independence in 1968 until 1982, the Mauritian Labor Party was dominant in parliamentand its leader, Sir Seewoosagur Ramgoolam, remained prime minister for those thirty-four years.
OUP CORRECTED PROOF – FINAL, 30/7/2019, SPi
55

“embedded autonomy,” referring to the bureaucracy’s ability to be embeddedin society through “a concrete set of connections that link the state intimatelyand aggressively to particular social groups with whom the state shares a jointproject of transformation.”
Deliberation councils, which are consultative fora of business and govern-ment that discuss policy options and make recommendations to executiveagencies, were one way of facilitating this relationship in Asia (see Camposand Root 1996). In assessing different “varieties of capitalism,” Hall andSoskice (2001) observe a similar modality in the coordinated market econ-omies of northern Europe whereby government, business, and labor fre-quently engage in a corporatist arrangement. Such corporatism has beenbased in turn on peak business associations having the ability to enforcecommitments among their members to effect cooperation that helps addresscoordination failures (Katzenstein 1985). Schneider (2013) elaborates on theelements for the success in such councils, including smaller numbers ofparticipants balanced across relevant stakeholders, frequent meetings thatraise expectations of repeated interaction, high-level representation from thegovernment, and clear mandates. Rodrik (2008) also concurs that the imple-mentation of industrial policies requires governments to engage in “embed-dedness” through not only deliberation councils but also public-privatedialogue, or sectoral roundtables. Bräutigam et al. (2002) suggest that state–business relationships transform into growth coalitions when three criteria aremet: equal capacity between the state and private sector, broad representationof business associations, and allocation of non-public benefits, such as exportquotas, to selective members of the private sector.
The political context is not insignificant in shaping dynamics with theprivate sector. While authoritarian contexts can be much more predictable forthe private sector than volatile democratic transitions, business groups canquickly resettle and adapt to a new status quo in consolidated democracies(see Schneider 2010). Schneider (2013) though, cautions that governmentsshould not be hijacked by business interests. He makes the distinctionbetween passive and active industrial policies, with the former referring tolowering business costs by removing red tape and the latter referring to publicsubsidies aimed at altering firms’ incentives to export or focus on researchand development. To ensure that activist policies aimed at transformationbenefit society rather than just government or business alone, Rodrik (2008)emphasizes the need for not only incentives but also “sticks” through con-ditionalities and sunset clauses as well as accountability mechanisms forperformance.
OUP CORRECTED PROOF – FINAL, 30/7/2019, SPi
56 ,

In the African context, the nature of the business–state relationship oftenhas wavered between crony capitalism, whereby the private sector is co-optedby ruling parties, and marginalization through active repression or passivedisengagement with the business community. These patterns are particularlyrelevant to the African domestic private sector rather than to multi-nationalcorporations, which may have more flexibility in their choice of governmentpartners. According to Taylor, the nature of these relationships often dependshow diversified the economy is, the relative contribution business makes to theeconomy, and the institutional strength of business vis-à-vis that of the state(Taylor 2007). For instance, Handley (2008) notes that Mauritius’ export-ledgrowth orientation was facilitated by a strong degree of organization amongbusiness associations clustered around sugar, export-processing zones (EPZs),and tourism. This facilitated a corporatist mode of policymaking that includedgovernment, business, and labor. Rodrik (2007) likewise documents howSouth Africa’s Department of Trade and Industry worked with private sectorassociations to develop Customized Sector Programs to formulate policies forindividual sectors and help expand into non-traditional areas.
3.2.4 Neo-patrimonial Developmental State
If strong states and a strong business sector are critical for transformation,then is there any option for countries that lack these ingredients? Those whobelieve that there is a neo-patrimonial developmental state model claim thatthere is room to be optimistic. In this model, states may be weak andcharacterized by clientelist practices but guided by a strong and visionaryleader who prefers long-term, pro-capitalist policies and creates pockets oftechnocratic efficiency to achieve them. Rents, or excessive profits typicallyfrom monopoly trading or corruption (see Khan 2000), are managed centrallyand directed to productive purposes. This view builds on Olson’s (1993)distinction between roving and stationary bandits, whereby the latter refer toleaders who recognize that rents can be maximized in the long term if theeconomy is allowed to grow.
This stream of scholarship has been strongly influenced by a set of Africancases.³ Booth and Golooba-Mutebi (2014) point to the Rwanda case underPaul Kagame and the Rwandan Patriotic Front (RPF). The RPF’s war reserves
³ Much of the argument about neopatrimonial developmental states has emerged from the AfricanPower and Politics Program at the Overseas Development Institute.
OUP CORRECTED PROOF – FINAL, 30/7/2019, SPi
57

were initially used in 1994 to rehabilitate state finances and institutionalizedinto the party’s investment arm, currently known as Crystal Ventures, whichinvests in agro-processing, mobile phones, construction, road-building, andfurniture. The company plays a significant role in campaign contributionsduring elections to prop up the RPF. Despite this obvious conflation of partyand business interests, Kagame has remained committed to using CrystalVentures and other public resources to achieve economic and social develop-ment via Rwanda Vision 2020 rather than padding the wallets of politicians.A similar dynamic has been observed in the Ethiopian context under the lateMeles Zenawi and the EPRDF (see Berhanu and Poulton 2014). Otherexamples include Malawi under Hastings Banda’s early tenure (1964–79)and Bingu wa Mutharika, as well as Côte d’Ivoire under the early years ofHouphouët-Boigny (see Cammack et al. 2010; Kelsall 2011). The notableelement under all these cases were that political leaders provided the leader-ship to guide specifically pro-rural development strategies.
The notable caveat of the developmental patrimonialism school of thoughtis that it is highly dependent on a particular leader or a well-organizeddominant party. The contributors to this scholarship have not explainedwhether the visionary and long-term leadership that maintains this precariousbalance between predation and development can be institutionalized when(and if) the leader or party is ousted.
3.3 Ghana’s Initial Investment in Economic Fundamentals
How do these various schools of thought relate to Ghana’s developmenttrajectory? In many ways, Ghana’s positive and sustained growth since theStructural Adjustment period starting in the 1980s validates the alternatingimportance of strong leadership to enforce commitment to economic funda-mentals as well as the role of democracy in generating political incentives toinvest in broad-based infrastructure and other public goods. Historically,however, neither of those features were prominent.
Shortly after Independence in 1957, Ghana descended into a repeated cycleof civilian government, military coups, and dictatorship for three decades (seeTable 3.1). The political instability resulted in macroeconomic chaos as eachsuccessive regime reversed their predecessors’ policies and attempted to charta new economic course. For instance, Kwame Nkrumah’s attempts at Big Pushmodernization relied on an import-substitution industrialization approachthat resulted in overvaluing the exchange rate, lacked planning, and involved
OUP CORRECTED PROOF – FINAL, 30/7/2019, SPi
58 ,

negligible engagement from the private sector. Under Busia’s tenure, therewere disproportionate investments in Asante-dominated regions of Ashanti andBrong-Ahafo and the expulsion of migrant cocoa workers on sharecroppingcontracts under the Alien Compliance Orders Act, which severely underminedcocoa production. Under Colonel Acheampong, more than 20 million cedis wereallocated to Operation Feed Yourself to increase production of rice, maize, andother goods for domestic consumption. Bad rains coupled with the overvaluedexchange rate and a collapse in the cocoa sector mean that by 1975, food actuallyhad to be imported, but there was a lack of foreign exchange to do so.
The turning point, both politically and economically, emerged in 1983, twoyears after Flight Lieutenant Jerry Rawlings took over in a coup and estab-lished the Provisional National Defense Council (PNDC). A severe droughtand the expulsion of more than one million Ghanaians from Nigeriaprompted Rawlings to agree to an Economic Recovery Program (ERP) withthe IMF that year. Between 1983 and 1992, Ghana’s structural adjustmentexperience was actually characterized by six IMF programs.⁴ The first
Table 3.1. Timeline of political regimes and governments since Ghana’sIndependence
Government Political regime Ruling party Leader
1957–64 Civilian democracy Convention People’s Party Kwame Nkrumah1964–6 One-party state Convention People’s Party Kwame Nkrumah1966–9 “Caretaker”
military regimeNational LiberationCouncil
Joseph Ankrah (1966–9);Akwasi Afrifa (1969)
1969–72 Civilian democracy Progress Party Kofi Busia1972–9 Military regime National Redemption
CouncilIgnatious Acheampong
1979–81 Civilian democracy Convention People’s Party Hilla Limann1981–3 Military regime Provisional National
Defense CouncilJerry Rawlings
1983–92 One-party state Provisional NationalDefense Council
Jerry Rawlings
1992–2000 Civilian democracy National DemocraticCongress
Jerry Rawlings
2000–8 Civilian democracy New Patriotic Party John Kufuor2008–16 Civilian democracy National Democratic
CongressJohn Atta Mills (2008–11);John Mahama (2011–16)
2016–present
Civilian democracy New Patriotic Party Nana Akufo-Addo
⁴ These included three standby agreements (1984, 1985, 1986), an Extended Fund Facility combinedwith a Structural Adjustment Facility (SAF) (1987) an enhanced SAF (1988–91), and a Fund Moni-tored Program from 1992 (see Martin 1993).
OUP CORRECTED PROOF – FINAL, 30/7/2019, SPi
59

program, the ERPI, was signed in 1983 and implemented in 1984–7 understandby agreements. The ERPI focused on “getting the prices right” throughstabilization policies aimed at halting the decline in Ghana’s industrial pro-duction and commodity exports. The emphasis of the IMF was on restoringexternal balances by rehabilitating exports via devaluation through a foreignexchange auction and creating a private foreign exchange bureau (Kraus1991). Other key aspects of policy conditionality involved increasing theproducer price of cocoa by lowering the export tax, reducing the marketingcosts of Cocobod, removing subsidies and price controls, restricting payincreases for public sector employees, liberalizing trade, divesting from state-owned enterprises, and introducing cost recovery in health and educationsectors through user fees (e.g., Bawumia 1998; Rimmer 1992). About thirty-two state-owned enterprises were put up for sale and the government claimedit would accept bids on any of the 185 SOEs, except for eighteen that wereconsidered “strategic” (Rothchild 1991).⁵
The second phase of the Economic Recovery Plan, ERPII, launched in1987–91, aimed to deepen these policies and further stimulate economicdevelopment (Nugent 1995). To do so, the government received net aiddisbursements ranging from $370 million in 1984 to $488 million by 1990,which were targeted at, among other things, rehabilitating the cocoa, mining,and timber industries (Kraus 1991; Nugent 1995). By 1990, the Ghana StockExchange opened in order to mobilize greater domestic resources for capitalinvestment and to attract foreign direct investment, a new investment codewas established, and more restrictive decrees were repealed (Aryeetey andHarrigan 2000).⁶
With respect to agriculture, the World Bank and other donors supportedthe Agricultural Services Rehabilitation Project under ERPI and helped estab-lish the Policy Planning, Monitoring and Evaluation Directorate in the Ministryof Agriculture to improve the ministry’s capacity to design and implementagricultural projects. Through the Public Investment Program launched in1984, an emphasis was placed on improving roads, highways, water, andelectricity, with a particular concentration on export-producing rural regions(see Bawumia 1998). As part of the ERPII, the minimum guaranteed price formaize and rice was increased and the supply of agricultural inputs temporarilyimproved, even as subsidies for fertilizers and machinery gradually were
⁵ Nugent (1995) notes however that while about forty companies had been removed from the publicdomain by mid-1991, only seventeen of those had actually been sold to private investors.⁶ For instance, the 1971 Manufacturing Industries Act, the 1974 Price Control Decree, and the 1976
Control of Sale of Specific Goods Decree were all removed.
OUP CORRECTED PROOF – FINAL, 30/7/2019, SPi
60 ,

reduced. The cocoa sector Rehabilitation Project aimed to improve efficiencyin marketing and production in the sector and an Agricultural PolicyCoordinating Committee was established to help bring together all thevarious institutions dealing with agricultural policy (see Nyanteng andSeini 2000).
While many other African governments also pursued such programs at thetime, Rawlings’ government actually remained committed to the program andavoided the half-hearted implementation that exacerbated economic condi-tions in countries such as Malawi, Senegal, and Zambia (see Devarajan et al.2001; Martin 1993). Indeed, as Herbst (1993: 30–1) observed, other Africangovernments that faced economic crisis simply “limped by” while Ghanaunderwent a major economic overhaul. Rawlings’ ability to stay committedto economic reform relied on a careful balancing act between technocraticimplementation and authoritarian practices.
This approach manifested in a number of ways. First, interest groupdemands did not hijack the government’s reform agenda. A number ofscholars observed that the state’s autonomy from interest group pressureswere a key feature of this era (see Jeffries 1992; MacLean 2010; Rothchild1991). For instance, anti-austerity opponents within the PNDC were expelledby Rawlings (Martin 1993). In addition, while the ERPs’ short-term impactsmade livelihoods more difficult for all strata of society, it is widely believed thatthey were more beneficial to the rural sector than to urbanites (see Callaghy1990; Herbst 1993; Mikell 1989). Agricultural producers concentrated inexport crop production, especially cocoa, benefited from the currency devalu-ation and improved producer prices. In 1984, the party published a RuralManifesto that emphasized the importance of accelerating rural developmentin the country (Gyimah and Jeffries 2000). In 1986, the PNDC also tried topromote the registration of agricultural titles in order to secure tenants’ landrights (Boone 2014).
By contrast, urbanites, who had actually been Rawlings’main supporters in1981, suffered from the rising cost of imports, lower wages, retrenchments,and the introduction of user service fees. By 1989, the PNDC had retrenchedapproximately 53,000 civil servants (Rothchild 1991). Some urban discontentmanifested in clashes on university campuses and protests by the Trade UnionCongress (TUC) and urban workers. However, government repression of thelabor unions deterred large-scale urban protests (see Herbst 1993). In add-ition, those who were hurt most by the reforms had become relatively disor-ganized and leaderless, lacking clear lobbying channels as a consequence of somuch policy and political instability in the preceding decades (Martin 1993).
OUP CORRECTED PROOF – FINAL, 30/7/2019, SPi
61

As Callaghy (1990: 277) notes, “A key characteristic of the Rawlings regimewas its relatively narrow organizational base . . . Insulation from importantsociopolitical veto groups, themselves weakened by the shredding of theprevious fifteen years, allowed the PNDC to do more than other moreconstrained regimes.”
Secondly, Ghana benefited from a relatively well-trained and capabletechnocratic team, led by the minister of finance and university professor,Dr. Kwesi Botchwey, Dr. Joseph Abbey, and the head of cabinet, P. V. Obeng.Unlike Nkrumah, Rawlings did not meddle in the economic policymaking ofhis technocratic team. Critically, much of this economic team remained intactthroughout the structural adjustment period, allowing for policy continuity,credibility with the donors, and implementation experience (e.g., Jeffries 1992;Kraus 1991). A majority of the policy making structure was concentratedaround this core economic team and a few pragmatic military leaders, com-pared with a much more complex policymaking structure at the time ofcountries such as Zambia (see Martin 1993). Thirdly, the PNDC could capit-alize on being a rather new government that needed to rectify the abuses andmismanagement of previous regimes. Ruling governments in countries such asTanzania and Zambia, which essentially had been under one-party rule fordecades, could not as easily defer blame (Martin 1993).
During this period, Ghana witnessed a growth in foreign direct investment(FDI) that was facilitated by the promulgation of an Investment Code in 1985and restructuring of the Ashanti Goldfields Company, which opened upopportunities for joint ventures with foreign investors in the mining sector(Tsikata 1995). FDI increased from only $2 million in 1984 to $22.5 million adecade later (Tsikata et al. 2000). Gold production increased fivefold in thedecade after 1984, leading it to supersede cocoa in exports (Nugent 2004).Inflation declined from 123 percent in 1983 to 10 percent a decade later, whileaverage GDP per capita growth reversed from hovering around negative 3.5percent between 1973 and 1983, to 2.2 in the ten years after the ERP began(WDI 2016). At the same time, as seen in Figure 3.1, the level of taxation ofagriculture decreased substantially during the latter half of Rawlings’ tenure.Despite receiving large shares of foreign aid, including to agriculture, duringthis period, Wiggins and Leturque (2011: 17) strongly credit economic reformfor this revival: “Funding to agriculture (narrowly defined), however, may notbe quite the point: much of what benefited the farmers, and cocoa growers inparticular, came from economic reform, macroeconomic stability and publicinvestments in highways—rather than from programs implemented by theMinistry of Food and Agriculture.”
OUP CORRECTED PROOF – FINAL, 30/7/2019, SPi
62 ,

By investing in the economic fundamentals that benefited a large portion ofthe rural population, Rawlings felt comfortable enough to allow multi-partyelections in 1992. As LeVan (2015: 190–1) notes, the ultimate success of thisstructural adjustment period was the ability to hold elections and debate policyoutcomes. By the time of the democratic transition in 1992, policy change nolonger required regime change. Notably, in the elections that year, the PNDCtransformed into the National Democratic Congress (NDC) and Rawlings wasthe party’s candidate. He won 58.3 percent of the vote compared with 30.4percent for the main opposition candidate, Professor Adju Boahen of the NewPatriotic Party. One distinct pattern to the election outcomes was that Rawl-ings’ share of votes was higher in all rural constituencies than urban ones inalmost every region, emphasizing that he had established a rural support baseas a consequence of the orientation of many of the structural adjustmentpolicies (see Bawumia 1998; Gyimah-Boadi and Jeffries 2000).⁷
3.4 Democracy’s Double-edged Sword
Much like Rawlings’ acquiescence to the ERP in 1983, Ghana’s transition todemocracy in the early 1990s represented a critical juncture in the country’spolitical economy that shifted incentive structures and interest group dynamics.On the one hand, the need to attract votes every four years in a highly
–7.4
–17.6
–26.5
–3.6 –2.5 –2.4
–30.0
–25.0
–20.0
–15.0
–10.0
–5.0
0.01955–65 1966–74 1975–82 1983–92 1993–2002 2001–10
Figure 3.1. Average nominal rates of assistance for all agriculture in Ghana (%)Notes: These rates indicate net taxation levels and obscure differences in protection and taxation acrossimports and exports and among products.
Source: Anderson, Kym, and Signe Nelgen (2013).
⁷ He had also obtained an overwhelming majority in the Volta region, reflecting support from hisown regional stronghold and Ewe constituents.
OUP CORRECTED PROOF – FINAL, 30/7/2019, SPi
63

competitive two-party system has had positive impacts on the welfare ofcitizens through the provision of public goods.⁸ On the other hand, cateringto a broad array of pluralist pressures has had some negative implications forgovernment coffers and indirectly hurt the domestic private sector.
As much of the democratization literature discussed earlier has posited,Ghana observers find that political parties and elites now provide publicgoods, such as rural roads, that benefit large constituencies rather thannarrowly targeted private goods (e.g., Gyimah-Boadi and Prempeh 2012;Harding 2015; Weghorst and Lindberg 2009). A key reason for this is thatelections between the NDC and NPP are always incredibly close, especially inkey regions of the country, and therefore winning votes requires courting abroad range of voters. Williams (2009: 144) argues that political motivationsalso explain why the government has continued to support producer prices forcocoa under the Fourth Republic: “Given the large share of Ghanaiansinvolved in the cocoa industry, cocoa interests have noticeable political weightin democratic politics. The producer price is frequently an issue of discussionof Ghana’s main political parties. Thus, Ghana’s democracy has helped toprotect the producer price increases over time.”
In addition, Ghana has demonstrated impressive progress towards meetingkey development objectives since transitioning to democracy. These maypartially be attributed to its formal commitment to the Millennium Develop-ment Goals (MDGs) in 2001, which were subsequently integrated into theGhana Poverty Reduction Strategy (2003–5) and the Growth and PovertyReduction Strategy (2006–9). In turn, Ghana benefited from financial assist-ance through HIPC, Multilateral Debt Relief Initiative, MDBS, as well asinitiatives such as the United States Millennium Challenge Account (UNDP2015). Figure 3.2 illustrates that commitment to the MDGs corresponded withgreater expenditures in the education and health sectors, as a share of GDP,from 2000 onwards. By contrast, infrastructure investment in communica-tions and transportation and as well as agricultural expenditures were muchmore modest (see also Chapter 5).
The MDGs were an important policy driver in many countries regardlessof political regime type. But, Ghana has been a top performer in Africa withregards to its progress towards achieving the MDG targets, particularly withrespect to the poverty and social welfare targets. For instance, literacy rosefrom 58 to 71 percent of the population between 1999 and 2014 while net
⁸ In the 2000, 2008, and 2012 elections, the margins of victory in the presidential elections for thefirst (or only) round were 4, 2, and 3 percentage points, respectively.
OUP CORRECTED PROOF – FINAL, 30/7/2019, SPi
64 ,

female enrollment in primary school increased from 60 to 89 percent duringthe same period. The equivalent increase for secondary school was 32 to 54.The share of the population now having access to an improved water sourcesis particularly notable, increasing from 56 percent in 1992 to 87 percentby 2015.⁹
Beyond the impetus of the MDGs, successive democratic regimes in Ghanainvested in a number of broad-based social welfare schemes. Notable amongthese includes the National Health Insurance Scheme, which was establishedin 2003 and represents one of Africa’s few attempts to implement a universalhealthcare program (Blanchet et al. 2012). In 2005, the government alsoabolished primary school fees and provided schools with a small grant (capi-tation grant) for each pupil enrolled. Another example includes the LivelihoodEmpowerment Against Poverty Program (LEAP), which was launched in 2008and now expanded to all ten regions of the country with more than 70,000beneficiaries. LEAP is a cash transfer program that provides beneficiaries withdirect cash payments and free health insurance (Handa et al. 2013). While allthree programs began under the NPP, they were scaled up under the NDCtenure of Presidents Mills and Mahama, indicating a broad consensus acrossparties about their importance.
–
0.50
1.00
1.50
2.00
2.50
3.00
3.50
4.00
4.50
1980 1985 1990 1995 2000 2005
Shar
e of G
DP
(in 2
005
pric
es),
%
Agriculture Education Health Communication & Transport
Figure 3.2. Shifts in sectoral public expenditures, 1980–2007
Source: Calculated from Statistics for Public Expenditure for Economic Development (SPEED)database, available at: http://dx.doi.org/10.7910/DVN/INZ3QK.
⁹ Data is from the World Bank’s World Development Indicators.
OUP CORRECTED PROOF – FINAL, 30/7/2019, SPi
65

However, these and other programs clearly can be manipulated for politicalgain, especially for the incumbent party. For instance, Rawlings and the NDCpublicly rejected becoming a HIPC country in 1999. When the NPP came topower, it reversed this policy and agreed to join HIPC. Subsequently, theconstruction of schools and public toilets were clearly labeled “HIPC Benefits”as a visual reminder to voters that these public goods were the consequence ofthe NPP’s actions (see Abdulai and Hulme 2014). Likewise, Ghana abolishedprimary school fees in 2004 (World Bank 2009), which Stasavage (2005) hasattributed to an effort to win over rural voters.
At the same time, democracy has enabled a broader range of interest groupsto permeate policymaking decisions compared with the PNDC. While the useof repression significantly weakened protest activity during the one-partyregime of Rawlings’ PNDC, the transition to a multi-party democracy createdthe space for popular resistance, and elections every four years generated anincentive for politicians to respond. Thus, when the government attempted tointroduce a 17 percent value-added tax (VAT) in 1995, industrial workers andcivil servants launched the Kume Preko (“You Might as Well Kill Me”)demonstrations in Accra and Kumasi. A component of its economic reformprogram with the IMF, the VAT was intended to replace sales tax and providethe government with a much more reliable and equitable revenue source. But acoalition of interest groups, led by Nana Akufo-Addo of the opposition NPP,forced the government to reverse the policy (Osei 2000).¹⁰ A similar set ofpolicy reversals was witnessed with respect to increasing petrol and electricityprices in the wake of popular protests in urban areas (Hutchful 2002).
Catering to particularly urban interest groups was also reflected in the“political budget cycle.” As noted earlier, the political business cycle refers tothe expansion of spending in the run-up to an election in order for anincumbent party to improve its chances at re-election, only to reduce spendingafter the election period has ended (see Rogoff 1990). Ghana has activelyfollowed this cycle since democratization, with observers claiming that the1992, 1996, and 2008 elections were especially destabilizing (see Mosley andChiripanhura 2016; Prempeh and Kroon 2012) and that the four increases inthe wage bill have been suspiciously timed to take effect around elections(STAR-Ghana 2011).¹¹
¹⁰ The government was though then able to successfully implement the VAT in 1998 and this hassince provided a significant share of revenue (see Williams 2009, footnote 20).¹¹ The introduction of the Single Spine Salary Structure in 2010 was actually intended to stop the
tendency of labor strikes among different unions to mobilize for higher pay increases in response to thedemands of other unions (see STAR-Ghana 2011).
OUP CORRECTED PROOF – FINAL, 30/7/2019, SPi
66 ,

More specifically, in 1991, Ghana had a surplus of 1.5 percent of GDP butby 1992, the year of the elections, it then had a fiscal deficit of 5 percent of GDP(Block 2002). As the 1996 elections approached, additional fiscal “slippages”were apparent as the NDC increased capital spending in rural areas on roadsand hospitals to maintain the support it gained from the previous electionswhile responding with salary increases after a set of successive strikes bydoctors, nurses, workers of the Cocoa Board, railway employees, and civilservants (see Leite et al. 2000). In fact, Kwesi Botchwey, the technocraticfinance minister who helped oversee Ghana’s structural adjustment, resignedfrom cabinet as a result of disagreeing with Rawlings over the use of publicfinances to win the 1996 elections (Africa Confidential 2016). The overall fiscaldeficit amounted to 9.5 percent of GDP that year, and the IMF and WorldBank temporarily halted their aid disbursements (Tsikata 2001).¹² A WorldBank’s (2011) public expenditure review also emphasized that fiscal deficits asa share of GDP were found to be significantly higher during election years.
By around 2000, the gains from the ERPs had been eroded and the govern-ment began negotiations for debt forgiveness under the Heavily Indebted PoorCountries Initiative (HIPC). But, the political budget cycle fueled by Ghana’sintensely close democratic competitions did not cease with the NDC andcontinued under the NPP. During its 2000–8 tenure, the NPP also backtrackedon removing subsidies from public utilities and petroleum products, as well asreducing the public sector wage bill (Gyimah-Boadi 2009). As the 2008elections drew near, the government provided higher wages and salaries tocivil servants, increased energy sector subsidies, and invested in a set of highlyvisible prestige projects (see Whitfield 2010). After the 2012 elections, thegovernment announced a deficit of 12 percent of GDP, exceeding its originalprojection of 6 percent (Oduro et al. 2014). These deficits have contributed tohigh interest rates ranging around 16 to 19 percent between 2009 onwards thatmake credit costly and deter domestic private sector investment (see Quarteyand Afful-Mensah 2014).¹³
By the end of 2016, Ghana’s debt stock was 74 percent of GDP and the fiscaldeficit estimated at 9 percent of GDP (IMF 2017). Poor macroeconomicmanagement, coupled with frequent electricity outages, are both creditedwith the defeat of the NDC in the December 2016 elections. Nana Akufo-Addo of the NPP was elected president with some of the largest vote margins
¹² They resumed disbursements, even though Ghana was still off track with its macroeconomic indica-tors, due to pressure from three bilaterals: the United Kingdom, Canada, and Japan (see Tsikata 2001).¹³ Quartey and Afful-Mensah (2014) find that the spread between lending and savings rates
averaged at least 20 percent between 1997 and 2012, which discouraged both savings and investment.
OUP CORRECTED PROOF – FINAL, 30/7/2019, SPi
67

in the country’s history of democratic elections. While President Akufo-Addoacknowledged the dire situation of the economy in his First State of the Nationaddress, he also promised large-scale programs that would put additionalpressure on the already limited fiscal space. These included offering freesecondary school education to all Ghanaians, creating four new regions outof the current ten, building a new factory in every one of the country’s 254districts under the “One District, One Factory” policy, and a campaign entitled“Planting for Food and Jobs” that intended to expand agricultural extensionserves and increase the availability and accessibility of improved seed andfertilizer (Akufo-Addo 2017).
3.5 Ghana’s Lame Leviathan: Limitationsto Public Sector Reform
In addition to regime dynamics, relatively weak state capacity, measured bypublic sector management and civil service, is a second political economyfactor that has undermined Ghana’s structural transformation.¹⁴ As Boothet al. (2005) observe, “Everyone seems to agree that the public service, par-ticularly the civil service, has reached a very low ebb. Incentive structureswithin the civil service actively discourage initiative and pro-activity. Forindividuals, the way to move up the system is to avoid mistakes, maintain alow profile and let seniority work its magic.” Likewise, Whitfield (2010: 735)observes that “the result today is a public administration system that does notwork and which severely reduces the ability of the government to implementreforms and programs.” The complete decimation of the quality civil serviceduring the politically volatile decades preceding Rawlings’ tenure, combinedwith the overwhelming influence and dependence on the donors and theirparallel institutional structures in the two subsequent decades, are key reasonsfor these outcomes (see Whitfield and Jones 2009).
This state of affairs is even more disappointing given how much effort hasbeen invested into public sector reform. The weakness of the public sector wasidentified as one of the bottlenecks to better implementation of Ghana’sstabilization policies in the 1980s. In fact, in 1987, the World Bank provideda $100 million credit for a Structural Adjustment Institutional Support Project(SAIS) in order to reform public sector management through improving themanagement and policy capacities of key ministries. The project resulted in
¹⁴ The term “lame leviathan” was coined by Callaghy (1987).
OUP CORRECTED PROOF – FINAL, 30/7/2019, SPi
68 ,

the retrenchment of approximately 50,000 civil servants (IMF 1999). Whenthe project end in 1993, auditors concluded that SAIS had had little impact oneconomic policy planning and the government had resisted change (seeHutchful 2002). Around the same time, a Civil Service Reform Program wasimplemented with the aim of re-examining the salary structure while alsoimproving motivation and performance. By 1997, Ghana had one of thehighest ratios of civil servants to population, with 84,000 in central govern-ment and 123,000 in local government (IMF 1999).
A series of other programs then followed, facilitated by a Ministry of PublicSector Reform that was established in 2005 to coordinate all of these reformefforts. These included the Civil Service Performance Improvement Program(CSPIP), which ran from 1995 until 2006 and involved senior bureaucratswithin ministries, departments, and agencies signing performance contractswith the president (Larbi 1999). This too failed to transform the public sector’sorganizational culture, with insufficient incentives, lack of political will, andhigh levels of institutional fragmentation representing some of the mainhindrances (Ohemeng 2011).
Around the same time in the mid-1990s, the Public Services Commissionbegan reviewing the salary structure to assess and address wage disparities. In1997, the government also aimed to improve budgetary planning and imple-mentation through the Public Financial Management Reform Program (PUF-MARP). In the same year, it also attempted to implement a ten-year strategyentitled the Public Sector Reinvention and Modernization Strategy (PUSER-MOS) that intended to, among other objectives, reduce the civil service to just2,500 staff by reallocating most staff either to the Metropolitan, Municipal,and District Assemblies (MMDAs) or to subvented agencies, such as univer-sities, health services, and the highways authority (IMF 1999). An EconomicManagement Capacity Building Project—Public Sector Reform Program from2005 to 2011 funded by the World Bank and DfID was also rated “unsatis-factory” by its conclusion (World Bank 2010). Public sector reform was againon the agenda in 2010 with a proposed Presidential Delivery Unit Model (seeWorld Bank 2010) as well as in 2014 as Ghana began negotiating with the IMFto secure financial assistance (Bigg and Kpodo 2014).
A number of indicators confirm that Ghana’s state capacity, measured bypublic sector performance and management, remains sub-standard. Forinstance, Figure 3.3 focuses on some of the governance variables underlyingthe Ibrahim Index of African Governance (IIAG). Although there are manygovernance datasets, the advantage of the IIAG is that it builds on more thanthirty independent African and global databases, including from the World
OUP CORRECTED PROOF – FINAL, 30/7/2019, SPi
69

Bank and the African Development Bank. Using a scale ranging from 0 to 100,with higher scores indicating better performance, Ghana’s does well withrespect to participation and human rights, confirming the country’s demo-cratic strengths. Moreover, as already noted, there have been clear improve-ments in education, health, and social protection throughout the 2000s, whichaccounts for the positive “human development” performance. While thebusiness environment and infrastructure are lower, the most striking trendis with regards to “public management,” which is the only indicator that hasactually declined over the last fourteen years.¹⁵
Table 3.2 below also indicates that Ghana performs worse on this indicatorthan a number of other Africa countries. The Table includes a mixture of well-recognized high-capacity African countries (e.g., Botswana, Rwanda, andSouth Africa), countries that underwent democratic transitions in the early1990s (e.g., Benin, Senegal), countries that underwent SAPs at the same timeas Ghana (e.g., Malawi, Tanzania, Uganda, Zambia), and other West Africaneconomies (e.g., Côte d’Ivoire, Nigeria). As of 2014, Ghana was the worstranked for this indicator among this sample. Moreover, Ghana was only one of
Public management
Businessenvironment
Infrastructure
Participation & human rights
Human development
0.0
10.0
20.0
30.0
40.0
50.0
60.0
70.0
80.0
2000 2001 2002 2003 2004 2005 2006 2007 2008 2009 2010 2011 2012 2013 2014
Ibra
him
Gov
erna
nce
Inde
x (0
to 1
00)
Figure 3.3. Trends in Ghana’s governance profile, 2000–14
Source: Mo Ibrahim Foundation, Ibrahim Index of African Governance (IIAG). Available at: http://mo.ibrahim.foundation/iiag/downloads/.
¹⁵ “Public management” includes statistical capacity, budget management, ratios of revenues toexpenditures, fiscal policy, external debt service to exports, revenue collection, access to financialrecords of state companies, and quality of public administration according to the extent to whichcivilian government is structured to design and implement government policy effectively. When thelatter category is disaggregated even more, this captures policy coordination and responsiveness,service delivery and operational efficiency, merit and ethics, pay adequacy, and management of thewage bill (see the metadata explanations found at the Mo Ibrahim Foundation IIAG website: http://mo.ibrahim.foundation/iiag/).
OUP CORRECTED PROOF – FINAL, 30/7/2019, SPi
70 ,

two countries to have experienced a decline in its public sector managementbetween 2000 and 2014.¹⁶
This is particularly notable given that Ghana’s civil service is relatively largecompared with other African countries. For instance, based on the 2000census, the number of public employees in administration, defense, education,and health as a share of the population was 2.1 percent while the equivalentaverage for the African region was 1 percent (see also WB 2011). A decadelater, the number of people working in the formal public sector had doubledfrom 388,020 to 639,260 people, equivalent to approximately 1 public servantfor every 40.6 people.¹⁷ According to a World Bank public expenditure review,a large share of expenditures in the social sectors, including up to 80 percent inthe education sector, was actually allocated to personal emoluments andadministration (WB 2011).
Why is this important? One key reason is that stronger public sectormanagement can provide a bulwark against corruption and misuse of public
Table 3.2. Comparisons of public management across selected Africancountries (Ibrahim Index of African Governance, ranging from 0–100)
Country IIAG Index
2000 2014 Change
Benin 53.5 55.9 2.4Botswana 66.5 67.6 1.1Côte d’Ivoire 37.6 47.0 9.4Ghana 48.9 45.1 –3.8Kenya 51.9 56.5 4.6Malawi 39.6 47.9 8.3Mozambique 42.3 56.6 14.4Nigeria 42.8 51.8 9.0Rwanda 45.2 60.7 15.5Senegal 56.8 58.7 1.9South Africa 74.7 71.6 –3.1Tanzania 53.5 55.3 1.8Uganda 45.7 49.2 3.5Zambia 38.1 51.3 13.2
Source: Mo Ibrahim Foundation, Ibrahim Index of African Governance (IIAG). Availableat: http://mo.ibrahim.foundation/iiag/downloads/.
¹⁶ Ghana has performed relatively well in raising taxes as a share of GDP. However, the main taxagencies, including the National Revenue Secretariat, the Customs, Excise, and Preventive Services(CEPS), and the Internal Revenue Service have recruitment, training, and promotion policies that areseparate from those used in the main civil service (see Terkper 1995).¹⁷ This was calculated from the 2010 Census population, which was 24,658,823.
OUP CORRECTED PROOF – FINAL, 30/7/2019, SPi
71

resources that could be better invested in stimulating productive economicactivities, including infrastructure. A second reason is that it is reflective ofthe degree of policy coordination within the civil service, which can helpdetermine whether there are large gaps between policy formulation andimplementation. In addition to these oversight and coordination roles, thedevelopmental state literature discussed earlier emphasized the importance ofa more capable bureaucracy for proactively selecting sectors and industries toprioritize in order to generate economic transformation.
3.6 Weak State–Business Relationships
A third governance hindrance to structural transformation in Ghana is thepersistent inability of the government to engage with the private sector in amanner that in other contexts has facilitated the identification of sectoralpriorities and helped overcome bottlenecks to performance (see, e.g.,Maxfield and Schneider 1997; Rodrik 2008). Under Rawlings’ PNDC regime,the government ignored the private sector and during the first decade ofdemocracy, he actively politicized it through the selective distribution ofSOEs. While the NPP rhetorically committed to a more interactive relation-ship with business, signified by President Kufuor’s call for a Golden Age ofBusiness, observers suggest that this ultimately resulted in more superficialovertures than substantive outcomes.
More specifically, during the PNDC’s regime from 1983 to 1992, business-men in sectors as diverse as textiles, timber, tobacco, and pharmaceuticalsactively were harassed and targeted for arrest or property confiscation sinceany sign of capital accumulation suggested potential violation of state regula-tion of the economy (Kraus 2002). In fact, many businessmen had beencharged with economic sabotage before the National Public Tribunal, whichis outside the normal judicial system (Tangri 1999). As Opoku (2010: 86)notes, “One reason for the lack of consultation between government andbusiness between 1983 and 1991 was Rawlings’ self-proclaimed role as thedefender of the ‘common man’; his need to periodically reaffirm his commit-ment to the poor gave rise to continuing denunciations of business.” In fact,Rawlings even refused to meet publicly with private sector representativesuntil 1988, five years after the ERP had been signed (Handley 2007). Thegovernment provided little support to businesses that had to repay loans toforeign banks even as the ERP was causing the currency to devalue. Inaddition, the stabilization policies involved tight credit and high interest
OUP CORRECTED PROOF – FINAL, 30/7/2019, SPi
72 ,

rates, which resulted in denying capital to the indigenous private sector despitethe protests of Ghanaian business associations (Kraus 2002). Trade liberaliza-tion exacerbated the weakness of the private sector, contributing to thecollapse of 1,200 local industries between 1983 and 1992 and an additional400 each year between 1995 and 1999 (Nugent 2004; Opoku 2010).¹⁸
The onset of democracy facilitated greater interaction between the NDCand the private sector. For instance, in 1995, the Private Enterprise Founda-tion (PEF) was established with members from the Federation of Associationsof Ghana Exporters, Ghana Chamber of Mines, and the Association of GhanaIndustries and it had credible levels of engagement with the government.When the NDC published its development strategy document in 1995, entitledGhana Vision 2020, it emphasized that poverty reduction and transformationto middle-income status needed to rely on agro-processing and light manu-facturing (Aryeetey and Fosu 2007). Soon thereafter, an act of parliamentestablished the Ghana Free Zones Board (GFZB) to promote economicdevelopment.
On the other hand, Rawlings’ democratic tenure also coincided with apartisan bias in economic decision-making. When the World Bank beganpushing divestiture of SOEs, the government ensured that many of thebeneficiaries from these sales were NDC party members (see Gyimah-Boadi1997; Handley 2008; Kraus 2002; Opoku 2010). In fact, the Divestiture Imple-mentation Committee was almost completely staffed by NDC loyalists(Pitcher 2012), and all final sales had to be approved by the President’s Office(see Leite et al. 2000). While the NDC established the Council of IndependentBusiness Associations, it was regarded as a “creature of government” aimed atdistributing patronage to partisan supporters (see Opoku 2010). More gener-ally, the NDC preferred engaging with multinational business, which wasconsidered apolitical, rather than the domestic private sector, which wasassumed to be more aligned with supporting the avowedly pro-businessNPP (see Kraus 2002).¹⁹
When the NPP acceded to the presidency under the leadership of JohnKufuor, the new administration attempted to reverse some of the key policiesand tendencies of the NDC. For instance, it rejected Ghana Vision 2020.
¹⁸ Indeed, over the course of the reforms in the 1980s, the rate of growth in manufacturing value-added had fallen from 13 to 1 percent (Opoku 2010).¹⁹ The NPP is the modern incarnation of the liberal and elitist political traditions of Kofi Busia and
J. B. Danquah who in turn came from the Ashanti region and established the United Gold CoastConvention in 1947. The prominence of cocoa and timber sectors in Ashanti resulted in Akan-speakershaving a relatively large presence in the modern-day business community.
OUP CORRECTED PROOF – FINAL, 30/7/2019, SPi
73

Instead, it inserted its own priorities from the NPP manifesto into the PovertyReduction Strategy (PRS) needed to access HIPC support at the time, includ-ing an emphasis on modernizing agriculture, promoting agro-processing andstrengthening the private sector through access to long-term credit (seeWhitfield and Jones 2009). Moreover, in 2001, Kufour established a Ministryof Private Sector Development (MPSD) that was tasked with catalyzing a“Golden Age of Business” by providing a liberalized trade and investmentenvironment as well as promoting an industrial policy to attract manufactur-ers and establish value-added jobs. The MPSD was also tasked with creating aCaptains of Industry program to match university students with Ghanaianbusinessmen and women. In addition, the NPP government reinforced theexport zones approached initiated by the NDC by establishing an ExportDevelopment and Investment Fund (EDIF) in 2001 in order to develop andpromote the country’s exports (Asem et al. 2013).
During the same year, the Kufour launched the President’s Special Initia-tives (PSIs), which were aimed at boosting investment in targeted areas such ascassava starch, salt, textiles, garments, and oil palm (Arthur 2006). Anothercontrast from the Rawlings’ era was that Kufuor held biannual meetings withthe Ghana Investors Agency Council, which consisted of members of variousbusiness associations. These meetings allowed the business community toprovide feedback on how policies affected the investor climate, with oneconcrete outcome being the reduction of corporate taxes in 2003 (Arthur2006). In addition, under Kufuor, the private sector was often given theopportunity to review the annual proposed budget and provide input accord-ingly before it was presented to parliament (see Ackah et al. 2010).
Figure 3.4 provides one indication that the Kufuor regime signaled a morepositive policy environment for the business community in at least one regard,i.e., domestic credit. As a share of GDP, this measure captures whetherfinancial institutions provide resources to the private sector through, forexample, loans and trade credits, and its generally used as a measure of thesize and health of the private sector. Under the NPP, domestic credit to theprivate sector almost doubled from the time of Rawlings’ presidency and wasfour times higher than under his one-party regime.
Nevertheless, Table 3.3 still suggests that from a comparative standpoint,Ghana ranks relatively poorly on this measure both within Africa and from aglobal perspective. In fact, as recently as 2010, major fruit-processing andagricultural-export companies faced interest rates as high as 32 percent whenseeking loans from commercial banks in Ghana (see McMillan 2013). Accord-ing to Ghana’s most recent enterprise survey, which surveyed 720 private
OUP CORRECTED PROOF – FINAL, 30/7/2019, SPi
74 ,

0.0
2.0
4.0
6.0
8.0
10.0
12.0
14.0
16.0
18.0
1960–1970 1971–1981 1982–1991 1992–2000 2001–2008 2009–2014
Rawlings (PNDC)
Rawlings (NDC)
Kufuor (NPP)
Atta Mills &Mahama (NDC)
Nkrumah & Busia Acheampong
& Limann
Figure 3.4. Domestic credit to the private sector (average % of GDP)Notes: The best score on the index is a 100. See descriptions of what the indicators encompass in thefootnote 15, this chapter.
Source: Calculated from World Development Indicators database (2016).
Table 3.3. Comparisons of domestic credit to the privatesector (% of GDP), 2014
Category Country 2014
Africa Benin 22.9Botswana 31.9Ghana 19.9Kenya 34.4Malawi 16.2Mozambique 31.8Nigeria 14.5Senegal 33.2Tanzania 13.8Uganda 14.4Zambia 17.1
Emerging Markets Brazil 62.6China 130.0Mexico 27.6South Africa 151.5Turkey 57.9
High Income Germany 83.5Japan 178.4United Kingdom 165.4United States 180.7
Source: World Development Indicators database, 2016.
OUP CORRECTED PROOF – FINAL, 30/7/2019, SPi
75

sector firms, access to finance was overwhelmingly identified as the mainobstacle to growth (World Bank 2014).
More generally, despite the efforts of the NPP, the anticipated expansion ofthe private sector and transformation of the economy did not materialize to asignificant degree. One challenge was that the PSI Secretariat, which wastasked with implementing the PSIs, received minimal public financing inpractice. Whitfield et al. (2015) note that the minister of finance at the timeopposed the PSIs because he felt such an undertaking should be insteadfinanced by the private sector rather than the government. This, along withcompeting demands for several other government programs and an energycrisis reduced the budgets requested for it by the Ministry of Trade andIndustry.²⁰ The PSIs, along with a strategy to modernize agriculture throughsupport from the Millennium Challenge Corporation, were never informed bysignificant input from key actors within the industry, undermining the sub-stantive commitment of the government to involve the private sector(Whitfield 2010). Perhaps as a consequence of the Rawlings’ era legacy,Booth et al. (2005) found that under the NPP, the business communityincreasingly preferred to lobby for special treatment through informal chan-nels with individual politicians rather than to press for better conditions forthe private sector more broadly via institutionalized business associations.
3.7 Implications for Agricultural Transformation
The dynamics noted above, including a preoccupation with the short-termgoal of winning votes, insufficient public sector capacity, and politically biasedlinkages with the private sector, have had an impact not only on the broadeconomic transformation but also on Ghana’s repeated attempts to pursuehigh value-added agriculture. This has manifested in at least four ways.
First, the government hesitates to pursue reforms that could alienate stake-holders who are powerful in either financial or political terms. For instance,there has been reluctance to tackle land reform, which would have substantialimplications for the government’s relationship with powerful traditionalauthorities. Typically, the central government, whether NDC or NPP, hasfollowed a policy of non-interference in chieftancy affairs, particularly over
²⁰ There may have also been a political motive as well since both the minister of finance and the headof the PSI secretariat were competing against each other in the 2004 NPP party primaries (seeWhitfieldet al. 2015).
OUP CORRECTED PROOF – FINAL, 30/7/2019, SPi
76 ,

land allocation under customary tenure, which is the tenancy system forapproximately 80 percent of Ghana’s land (Lavers and Boamah 2016; Ubink2008). One key reason is that chiefs in many parts of Ghana can mobilize largenumbers of rural voters during election periods (see Bonoff 2016). Neverthe-less, land tenure security is a major constraint in Ghana. As seen in Table 3.4,land disputes are the overriding cause of conflict in Ghanaian communities.When further disaggregated by regions, land disputes are the top source ofconflict in six of Ghana’s regions (Central, Greater Accra, Volta, Eastern,Upper East, and Upper West). Goldstein and Udry (2008) find that insecureland rights in Ghana have significant effects on discouraging smallholders toinvest in soil fertility. In the aftermath of the 2008 food crisis, when approxi-mately twenty foreign companies attempted to acquire land in Ghana toproduce jatropha and sugarcane for biofuels, the lack of clarity on land tenurecreated a very confusing environment for both smallholders and foreigninvestors (see Ahwoi 2010; Boamah 2014; Schoneveld et al. 2010).
More generally, Throup et al. (2014) observe that large-scale commercialfarming investment, by both domestic and foreign investors, will not proceedat scale in Ghana until investors are assured that no new stakeholders willemerge to claim the land after a deal is completed. This is a critical observationgiven that the government views enhancing commercial agriculture andstrengthening value chains as a major route towards modernizing agriculture,evidenced by the Ghana Commercial Agricultural Project launched in 2012.²¹
Table 3.4. Sources of communal conflict in Ghana
What is the major source of conflict in your community? Percentage
Indebtedness 4.5Ethnic/tribal conflict 9.9Political differences 9.5Marriage 6.2Land disputes 31.9Chieftancy 30.9Religion 0.7Other 6.4
Total observations 1,410
Notes: The sample is only for those who noted that there is tension/conflict in theirrespective communities
Source: GLSS 6, conducted in 2012–13.
²¹ See: http://mofa.gov.gh/site/?page_id=7036.
OUP CORRECTED PROOF – FINAL, 30/7/2019, SPi
77

For instance, Amanor (2013) points to a number of delays for agro-processinginvestors linked to ongoing land disputes between chiefs or held up in thecourts. McMillan (2013) also points to the challenge of land tenure insecurityfor the Blue Skies processed-fruit company in Ghana. Due to land tenuredisputes, many commercial investors prefer to rely on outgrower schemes ornucleus schemes with smallholders rather than invest in new land, but thesearrangements are also fraught with risks (Throup et al. 2014). The governmentcertainly recognizes the problem of tenure insecurity, and even noted this as abinding constraint within its Food and Agriculture Sector Development Policy(FASDEP II). Yet, some of the modalities for addressing the challenge, such asthe introduction of Customary Land Secretariats, have not gone far enoughin achieving good land governance (see Biitir and Nara 2016; Lavers andBoamah 2016).
Secondly and relatedly, the government hesitates to pursue the preferencesof those actors who are numerically small and insignificant for winningelections, even if they have essential technical and business knowledge. Thishas been apparent in a number of cases. For instance, the NPP governmentactively tried to push Ghana into cocoa processing rather than just cocoaproduction. Thus, it reached out to various multinational cocoa processorsand promised them a 20 percent discount on “light” cocoa beans, which aresmaller beans from a second harvest, in exchange for establishing processingfacilities in Ghana. Three firms, Cargill, Callebaut, and Archer Daniels Mid-land accepted the offer, which in turn also spurred domestic investments inprocessing factories. Due to low output in the 2000s, Cocobod often was unableto uphold its contract for light beans to processors. Since Cocobod sells itsbeans on forward contracts, losing a portion of its output to the processors canhurt its ability to finance the management of the company as well as eat intothe resources it uses to stabilize the producer price for smallholders. Whileprocessing coincided with the NPP’s belief in economic nationalism, itdecided that it would be politically suicidal to alienate the interests of thou-sands of smallholders in favor of the demands of just a handful of processors(see Whitfield and Buur 2014).
A similar dynamic was apparent with respect to the Palm Oil PSI, whichbegan in 2002. Domestic demand was rising for palm oil and domesticproduction appeared a possible solution for decreasing imports. In addition,a senior NPP member was aware of the success of Felda in Malaysia, one of theworld’s largest palm oil estates, and encouraged Kufuor to visit that country tolearn how to strengthen the sector back in Ghana (Whitfield et al. 2015).A palm oil committee was established by the PSI secretariat, which included
OUP CORRECTED PROOF – FINAL, 30/7/2019, SPi
78 ,

individuals experienced in the sector as well as representatives from Ghana’sexisting palm oil estates. They emphasized that the PSI would need to involveinvestments in infrastructure and energy, incentive schemes to encourageprivate investment, and various land tenure reform modalities to expandexisting plantations. However, the PSI Secretariat ultimately decided to followthe policy design recommendations of a small coterie of NPP politicians ratherthan the sector experts and estate owners, an outcome that Whitfield et al.(2015) attribute to the latter’s small numbers and weak influence.²² Morebroadly, an extensive in-depth study of agro-processing firms in Ghanarevealed that successful agro-enterprises were more likely to be politicallyconnected, resulting in unfair information advantages and disproportionatecredit opportunities (see Brüntrup et al. 2014).
The experience of the oil palm PSI is also reflective of a third dynamic, which isa lack of long-term commitment to initiatives that require a high level ofimplementation capacity. Oil palm production typically involves large tracts ofcontiguous land, which was not possible to organize in Ghana due to overlappingclaims to land tenure. Instead, smallholders were aggregated into larger plots,known as Corporate Village Enterprises (COVEs), in various locations. Twenty-nine nurseries were also established to produce oil palm seedlings that would thenbe bought by the Secretariat and distributed to COVEs (Asante 2012). Creditinitially was provided to smallholders in order for them to hire labor on theselarger plots. Yet, despite the anticipated 300,000 hectares of land that were to bedevoted to oil palm, only 30,000 hectares were under cultivation by 2008.Moreover, by the time the PSIs were shut down, very few of the nurseries weresustainable. Asante (2012) found that smallholders were overstretched aftergovernment financial support to hire labor had dried up, resulting in oil palmthat could not be cultivated, and that the drip irrigation system used in thenurseries broke down frequently and was not replaced by the government. Theonly successful nurseries were those that belonged to already established estatesthat had installed a different type of irrigation system.
Finally, the government has shied away from taking on a more proactiveand anticipatory role in promoting particular agro-industrial sectors. The caseof pineapples is instructive in this regard. In the 1980s, a handful of Ghanaianinvestors, who were mostly urban professionals or public sector workers,recognized the potential of pineapple exports to Europe based on the successin this sector by neighboring Côte d’Ivoire. As Ghana began to demonstrate
²² There were only four large-scale oil palm estates and four medium-sized private estates(Asante 2012).
OUP CORRECTED PROOF – FINAL, 30/7/2019, SPi
79

success in the industry, these investors focused on meeting volume demandsand gave minimal attention to production processes that improve quality or toinstitutionalizing formal quality control measures. They accorded little regardfor investing in technological innovation, skilled labor, infrastructure, andexport marketing, and they failed to engage in collective action to ensurenational competitiveness within the sector. Aside from a few ad hoc programs,neither the government nor the donors gave much support to the industry dueto their preferred interest in supporting smallholder production (Whitfield2012). While pineapples remain one of Ghana’s major horticultural exports,the country’s export potential has declined over the 2000s, from a zenith of71,000 tons in 2004 to approximately 35,000 per year since then. The weaknessof the sector is attributed to the inability of Ghana to quickly adapt a newvariety, MD2, which was developed by Costa Rica and is now the preferenceamong European consumers (Fisher 2013). Whitfield (2012: 319) contrasts theGhanaian experience with Costa Rica’s where the government supported thepineapple industry by providing tax credits, export incentives, access to land,and investment in agricultural research and development: “The pineapple caseshows that competitive horticulture export industries cannot be made fromthe efforts of individual entrepreneurs alone.”
The exception proves the norm, and this is perhaps most apparent withrespect to cassava. The Cassava PSI model from the mid-2000s focused oncreating a cassava starch industry for export. Consequently, a starch process-ing factory was built and an outgrower model was used for smallholder cassavaproducers to supply it with raw cassava. However, smallholders reneged ontheir contracts whenever prices in traditional domestic markets were high(Gatune 2016). Moreover, since the raw cassava needed to be sent for pro-cessing within twenty-four hours after being uprooted, having only onefactory (in the Central Region) proved insufficient given the state of roadinfrastructure, resulting in a huge littering of cultivated cassava on the coun-try’s roadways (Arthur 2006). The Cassava PSI was “liquidated” and shutdown in 2006 (Asante 2012). However, in 2012, the government sought torevive cassava processing by providing a 10 percent reduction in excise taxes tocompanies that used raw material inputs. Guinnness Ghana Breweries Limitedtook advantage of this incentive to create a beer based on cassava (OxfordBusiness Group 2013).²³ In this case, the government pursued activist policiesfor attracting business that require relatively low maintenance or outlays ofscarce resources. This proved more successful than simply launching a highly
²³ This is called Ruut Extra Premium Beer.
OUP CORRECTED PROOF – FINAL, 30/7/2019, SPi
80 ,

visible and political initiative, such as the PSIs, which had minimal privatesector input in design and implementation.
3.8 Conclusions
This chapter has shown that Ghana’s reputation for upholding political rightsand civil liberties since the country’s democratic transition in 1992 is welldeserved. As Africa’s only institutionalized two-party system, competitiveelections have enforced a commitment to the poor and a broad swathe ofvoters, evidenced by an impressive national health insurance scheme and anextensive social transfer program. Resources also have been heavily invested inhealth and education, resulting in substantial improvements in social outcomes.Foreign direct investment is attracted by the country’s political stability andopenness. Compared to the country’s years of political instability prior to the1980s, when ideological differences resulted in high levels of policy volatility,substantive partisan differences between the NDC and NPP have narrowed onkey issues. As Throup et al. (2014: 155) note with respect to agriculture, there isnow a bi-partisan consensus on key policies: “the peasantry must be encouraged,nontraditional crops must be promoted, development must be brought to theNorth [through the Savannah Accelerated Development Authority], and invest-ment on infrastructure should be prioritized.”
At the same time, the imperative of winning elections has sometimesresulted in a layering of new priorities onto existing development strategiesin order for the party in office to show its imprint, as witnessed with the NPP’sdisposal of Vision 2020 and the creation of the PSIs. Moreover, deficit spend-ing around elections has often increased interest rates, weakened the currency,and increased the cost of credit which, along with the absence of reliableelectricity, all undermine private sector activity (see Arze del Granado andDaal 2014). Whitfield (2010: 734) further argues that the absence of strongcoalitions for structural transformation, in agriculture and more broadly, hasreduced successive government’s incentive to prioritize facilitating policies:
General voter concerns also place stress on the provision of social servicesand infrastructure much more than on agricultural policies, except forrequests for fertilizer subsidies. In contrast, not much pressure is exertedon government by organized interest groups, and especially not in the area ofproductive sector policies . . . In an economy where much of the economicelite are in construction, real estate, financial services, and trading (importand distribution), there are few large and organized trade associations . . .
OUP CORRECTED PROOF – FINAL, 30/7/2019, SPi
81

Thus there has not been a big pull within society to deliver a strategy foreconomic transformation.
While the public may want the government to provide more employment,there is little popular understanding or pressure for the types of policies thatwould facilitate that outcome.
To achieve more substantive transformation in general and within theagricultural sector in particular, the government needs to learn from its ownhistory and from some of the positive lessons of developmental states in otherregions of the world. Under Rawlings’ tenure of the 1980s, a technocratic set ofbureaucrats in the Ministry of Finance was insulated from popular pressuresand able to push through difficult reforms with long-term gains but short-term challenges. The authoritarian regime may have facilitated these dynamicsbut given the disastrous outcomes under previous autocratic presidents inGhana, the more essential component was Rawlings’ leadership and commit-ment. Both authoritarian and democratic developmental states in East Asia,Mauritius, South Africa, and Botswana, have been characterized by a muchbroader degree of technocratic capacity throughout the public sector and ahigher level of “embedded autonomy” vis-à-vis the business community. Thelatter two qualities have been largely absent in Ghana, despite repeated effortsat public sector reform and rhetorical commitments to the private sector.
Consequently, achieving transformation in Ghana will require more activisteconomic policies within the confines of the state’s capacity, without forfeitingcommitments to human rights and free and fair political competition. Theseoptions may address at least two of Hausmann et al.’s (2008) three marketfailures, namely addressing coordination externalities and providing missingpublic inputs while leaving the task of addressing self-discovery externalitiesfor high capacity contexts. Concretely, this may translate into providing taxincentives, credit support schemes to key sectors, land tenure reforms, andinstitutional modalities to help solve coordination problems that inhibitGhana’s competitiveness in promising industries. To be effective, these pol-icies would need to depart from past tendencies to favor partisan private sectoractors and instead prioritize efficiency and innovation.
References
Abdulai, Abdul-Gafaru, and David Hulme. 2014. “The Politics of Regional Inequalityin Ghana: State Elites, Donors and PRSPs.” Effective States and Inclusive Devel-opment (ESID) Working Paper No. 41, University of Manchester.
OUP CORRECTED PROOF – FINAL, 30/7/2019, SPi
82 ,

Acemoglu, Daron, and James Robinson. 2006. Economic Origins of Dictatorshipand Democracy. New York: Cambridge University Press.
Acemoglu, Daron, and James Robinson. 2012. Why Nations Fail: The Origins ofPower, Prosperity, and Poverty. New York: Crown Publishers.
Acemoglu, Daron, Simon Johnson, and James Robinson. 2003. “An AfricanSuccess Story: Botswana,” in Dani Rodrik (ed.), In Search of Prosperity: AnalyticNarratives on Economic Growth. Princeton, NJ: Princeton University Press,80–120.
Ackah, Charles, Ernest Aryeetey, Joseph Ayee, and Ezekiel Clottey. 2010. “State–Business Relations and Economic Performance in Ghana.” Institutions for Pro-poor Growth (IPPG) Discussion Paper Series No. 35. University of Manchester.
Africa Confidential. 2016. “It’s the Contract Election.” March 4. Available at:http://www.africa-confidential.com.
Ahwoi, Kwesi. 2010. “Government’s Role in Attracting Viable Agricultural Invest-ment: Experiences from Ghana.” Paper presented at the World Bank AnnualConference on Land Policy and Administration, April 26–27, Washington, DC.
Akufo-Addo, Nana. 2017. “Message on the State of the Nation by the President ofthe Republic, Nana Addo Dankwa Akufo-Addo, on the Occasion of the StateOpening of Parliament on Tuesday, February 21, 2017.” Available at: https://www.ghanabusinessnews.com/wp-content/uploads/2017/02/State-of-the-Nation-Address_2017.pdf.
Amanor, Kojo Sebastian. 2013. “Expanding Agri-business: China and Brazil inGhanaian Agriculture.” IDS Bulletin 44(4): 80–90.
Amsden, Alice. 1989. Asia’s Next Giant: South Korea and Late Industrialization.Oxford: Oxford University Press.
Anderson, Kym and Signe Nelson. 2013. “Updated Database of National andGlobal Distortions to Agricultural Incentives, 1955–2011.” Available at: www.worldbank.org/agdistortions.
Ansell, Ben. 2008. “Traders, Teachers, and Tyrants: Democracy, Globalization, andPublic Investment in Education.” International Organization 62(2): 289–322.
Arthur, Peter. 2006. “The State, Private Sector Development, and Ghana’s ‘GoldenAge of Business.’ ” African Studies Revie. 49(1): 31–50.
Aryeetey, Ernest, and Augustin Fosu. 2007. “Economic Growth in Ghana,1960–2000,” in Benno Ndulu, Stephen O’Connell, Jean-Paul Azam et al. (eds),The Political Economy of Economic Growth in Africa, 1960–2000, Volume 2:Country Case Studies. New York: Cambridge University Press, 289–321.
Aryeetey, Ernest, and Jane Harrigan. 2000. “Macroeconomic and Sectoral Devel-opment since 1970,” in Ernest Aryeetey, Jane Harrigan, and Machiko Nissanke(eds), Economic Reforms in Ghana: The Myth and the Mirage. Trenton, NJ:Africa World Press, 5–31.
OUP CORRECTED PROOF – FINAL, 30/7/2019, SPi
83

Arze del Granado, Francisco Javier, and Wendell Daal. 2014. “High Twin DeficitsPose Risks to Ghana’s Growth Outlook.” IMF Survey Magazine, May 13.
Asante, Elizabeth. 2012. “The Case of Ghana’s President’s Special Initiative on OilPalm (PSI-Oil Palm).” DIIS Working Paper 2012: 11. Danish Institute forInternational Studies, Copenhagen, Denmark.
Asem, Freda, Matthias Busse, Robert Osei, and Magdalene Silberberger. 2013.“Private Sector Development and Governance in Ghana.” International GrowthCentre Working Paper.
Bates, Robert, and Steven Block. 2013. “Revisiting African Agriculture: Institu-tional Change and Productivity Growth.” Journal of Politics 75(2): 372–84.
Baum, Matthew, and David Lake. 2003. “The Political Economy of Growth:Democracy and Human Capital.” American Journal of Political Science 47(2):333–47.
Bawumia, Mahamudu. 1998. “Understanding the Rural-Urban Voting Patterns inthe 1992 Ghanaian Presidential Election: A Closer Look at the DistributionalImpact of Ghana’s Structural Adjustment Programme.” Journal of ModernAfrican Studies 36(1): 47–70.
Berhanu, Kassahun, and Colin Poulton. 2014. “The Political Economy of Agri-cultural Extension Policy in Ethiopia: Economic Growth and Political Control.”Development Policy Review 32(S2): S197–S213.
Besley, Timothy, and Masayuki Kudamatsu. 2006. “Health and Democracy.”American Economic Review 96(2): 313–18.
Bigg, Matthew Mpoke, and Kwasi Kpodo. 2014. “Ghana Starts Talks with IMFwith Public Sector Reform on Agenda.” Reuters, September 16. Available at:http://www.reuters.com/article/ghana-economy-imf-idUSL3N0RH4SN20140916.
Biitir, Samuel, and Baslyd Nara. 2016. “The Role of Customary Land Secretariatsin Promoting Good Local Land Governance in Ghana.” Land Use Policy50: 528–36.
Blanchet, N. J., G. Fink, and I. Osei-Akoto. 2012. “The Effect of Ghana’s NationalHealth Insurance Scheme on Health Care Utilization.” Ghana Medical Journal46(2): 76–84.
Blaydes, Lisa, and Mark Andreas Kayser. 2011. “Counting Calories: Democracyand Distribution in the Developing World.” International Studies Quarterly55: 887–908.
Block, Steven. 2002. “Political Budget Cycles, Democratization, and EconomicReform: The Case of Africa.” Journal of Development Economies 67: 205–28.
Boamah, Festus. 2014. “How and Why Chiefs Formalize Land Use in RecentTimes: The Politics of Land Dispossession through Biofuels Investment inGhana.” Review of African Political Economy 41(141).
OUP CORRECTED PROOF – FINAL, 30/7/2019, SPi
84 ,

Boix, Carles. 2003. Democracy and Redistribution. New York: Cambridge UniversityPress.
Bonoff, Nicole. 2016. “Traditional Authority in the State: Chiefs, Elections andTaxation in Ghana.” PhD dissertation, University of California, San Diego.
Boone, Catherine. 2014. Property and Political Order in Africa: Land Rights andthe Structure of Politics. New York: Cambridge University Press.
Booth, David. 2012. Development as a Collective Action Problem: Addressing theReal Challenges of African Governance. London: ODI for Africa Power andPolitics Programme.
Booth, David, and Frederick Golooba-Mutebi. 2014. “Policy for Agriculture andHorticulture in Rwanda: A Different Political Economy?” Development PolicyReview 32(S2): S173–S196.
Booth, David, Richard Crook, E. Gyimah-Boadi et al. 2005. “What Are the Drivers ofChange in Ghana?” CDD/ODI Policy Brief 1. Accra and London: CDD and ODI.
Bräutigam, Deborah. 1997. “Institutions, Economic Reform, and DemocraticConsolidation in Mauritius.” Comparative Politics 30(1): 45–62.
Bräutigam, Deborah, Lise Rakner, and Scott Taylor. 2002. “Business Associationsand Growth Coalitions in Sub-Saharan Africa.” Journal of Modern AfricanStudies 40(4): 519–47.
Brender, A. and A. Drazen. 2005. “Political Budget Cycles in New versus Estab-lished Democracies.” Journal of Monetary Economics 52: 1271–95.
Brown, David, and Wendy Hunter. 1999. “Democracy and Social Spending in LatinAmerica, 1980–1992.” The American Political Science Review 93(4): 779–90.
Brüntup, Michael, Tony Swetman, Mirja Michalscheck, and Felix Asante. 2014.“Factors of Success and Failure of Large Agro-enterprises (Production, Pro-cessing, and Marketing) a Pilot Study in Ghana: Results of Case Studies in theFruit, Maize, and Palm Oil Sub-sectors.” African Journal of Food, Agriculture,Nutrition and Development 13(5).
Bueno de Mesquita, Bruce, Alastair Smith, Randolph Siverson, and James Morrow.2005. The Logic of Political Survival. Cambridge, MA: MIT Press.
Callaghy, Thomas. 1990. “Lost between State and Market: The Politics of Eco-nomic Adjustment in Ghana, Zambia, and Nigeria,” in Joan Nelson (ed.),Economic Crisis and Policy Choice: The Politics of Adjustment in the ThirdWorld. Princeton, NJ: Princeton University Press, 257–320.
Callaghy, Thomas. 1987. “The State as Lame Leviathan: The Patrimonial-Administrative State in Africa,” in Z. Ergas (ed.), The African State in Transi-tion. London: Macmillan Press: 423–42.
Cammack, Diana, Tim Kelsall, and David Booth. 2010. “Developmental Patrimo-nialism? The Case of Malawi.” Working Paper No. 12. APPP, ODI.
OUP CORRECTED PROOF – FINAL, 30/7/2019, SPi
85

Campos, J. E., and H. L. Root. 1996. The Key to the Asian Miracle: Making SharedGrowth Credible. Washington, DC: Brookings Institution.
Chang, Ha-Joon. 1994. The Political Economy of Industrial Policy. Basingstoke:Macmillan.
Cheng, Tun-Jen, Stephan Haggard, and David Kang. 1998. “Institutions andGrowth in Korea and Taiwan: The Bureaucracy.” Journal of DevelopmentStudies 34(6): 87–111.
Chung, Joanna. 2007. “Ghana Makes International Bond Debut.” Financial Times,September 27.
Collier, Paul. 2009. War, Guns, and Votes: Democracy in Dangerous Places. NewYork: Harper Collins.
Devarajan, Shantayanan, David Dollar, and Torgny Holmgren (eds). 2001. Aidand Reform in Africa. Washington, DC: The World Bank.
Deyo, Frederic. 1989. “Labor and Development Policy in East Asia.” The Annals ofthe American Academy of Political and Social Sciences 505(September): 152–61.
Evans, Peter. 1995. Embedded Autonomy: States and Industrial Transformation.Princeton, NJ: Princeton University Press.
Evans, Peter, and James Rauch. 1999. “Bureaucracy and Growth: A Cross-nationalAnalysis of the Effects of the ‘Weberian’ State Structures on Economic Growth.”American Sociological Review 64(5): 748–65.
Feng, Yi. 1997. “Democracy, Political Stability, and Economic Growth.” BritishJournal of Political Science 27: 391–418.
Fisher, Martyn. 2013. “Ghana Endures Major Pineapple Slump.” Fresh ProduceJournal, October 15. Available at: http://www.fruitnet.com/fpj/article/159652/ghana-endures-major-pineapple-slump.
Gatune, Julius. 2016. “Cassava as a Driver of Innovation—The Case of Ghana andNigeria,” in Olugbenga Adesida, Geci Karuri-Sebina, and João Resende-Santos(eds), Innovation Africa: Emerging Hubs of Excellences. Bingley: EmeraldGroup: 239–82.
Geddes, Barbara. 2003. Paradigms and Sand Castles: Theory Building andResearch Design in Comparative Politics. Ann Arbor, MI: University of MichiganPress.
Gerring, John, Philip Bond, William Barndt, and Carola Moreno. 2005. “Democ-racy and Economic Growth: A Historical Perspective.” World Politics 57:323–64.
Goldstein, Markus, and Christopher Udry. 2008. “The Profits of Power: LandRights and Agricultural Investment in Ghana.” Journal of Political Economy116(6): 981–1022.
Gyimah-Boadi, E. 2007. “The Challenges Ahead.” Journal of Democracy 8(2):78–91.
OUP CORRECTED PROOF – FINAL, 30/7/2019, SPi
86 ,
Gyimah-Boadi, E. 2009. “A ‘Liberal’ Developmental State in Ghana: An EmergingParadigm for Democracy and Economic Growth?” Paper presented at theconference From Asymmetry to Symmetry? The West, Non-West and theIdea of Development as Conceptual Flow.” University of Heidelberg, Germany,13–16 July.
Gyimah-Boadi, E., and Richard Jeffries. 2000. “The Political Economy of Reform,” inErnest Aryeetey, Jane Harrigan, andMachiko Nissanke (eds), Economic Reforms inGhana: The Myth and the Mirage. Trenton, NJ: Africa World Press, 32–50.
Gyimah-Boadi, E., and H. Kwasi Prempeh. 2012. “Oil, Politics, and Ghana’sDemocracy.” Journal of Democracy 23(3): 94–108.
Haggard, Stephan. 1990. Pathways from the Periphery: The Politics of Growth inthe Newly Industrializing Countries. Ithaca, NY: Cornell University Press.
Haggard, Stephan, and Robert R. Kaufman. 2008. Development, Democracy, andWelfare States: Latin America, East Asia, and Eastern Europe. Princeton, NJ:Princeton University Press.
Hall, Peter, and David Soskice. 2001. Varieties of Capitalism: The InstitutionalFoundations of Comparative Advantage. New York: Oxford University Press.
Halperin, Morton, Joseph Siegle, and Michael Weinstein. 2005. The DemocracyAdvantage. New York: Routledge.
Handa, S., M. J. Park, R. O. Darko et al. 2013. “Livelihood Empowerment againstPoverty Impact Evaluation.” Carolina Population Center, University of NorthCarolina.
Handley, Antoinette. 2007. “Business, Government, and the Privatization of theAshanti Goldfields Company in Ghana.” Canadian Journal of African Studies41(1): 1–37.
Handley, Antoinette. 2008. Business and the State in Africa: Economic Policy-making in the Neo-Liberal Era. New York: Cambridge University Press.
Harding, Robin. 2015. “Attribution and Accountability: Voting for Roads inGhana.” World Politics 67(4): 656–89.
Hausmann, Ricardo, Dani Rodrik, and Charles Sabel. 2008. “Reconfiguring Indus-trial Policy: A Framework with an Application to South Africa.” CID WorkingPaper No. 168, Harvard University, Cambridge, MA.
Herbst, Jeffrey. 1993. The Politics of Reform in Ghana, 1982–1991. Berkeley, CA:University of California Press.
Holden, Joseph. 2012. “Rwanda: Overcoming the Industrial Policy Taboo,” inM. Campioni and P. Noack (eds), Rwanda Fast Forward. London: PalgraveMacmillan, 126–44.
Howard, Marc Morjé, and Philip Roessler. 2006. “Liberalizing Electoral Outcomesin Competitive Authoritarian Regimes.” American Journal of Political Science50(2): 365–81.
OUP CORRECTED PROOF – FINAL, 30/7/2019, SPi
87

Huber, Evelyne, Thomas Mustillo, and John Stephens. 2008. “Politics and SocialSpending in Latin America.” The Journal of Politics 70(2): 420–36.
Hutchful, Eboe. 2002. Ghana’s Adjustment Experience: The Paradox of Reform.Geneva: United Nations Research Institute for Social Development (UNRISD).
IMF. 1999. “Ghana: Selected Issues.” IMF Staff Country Report No.99/3.Washington, DC: IMF.
IMF. 2017. “IMF Staff Concludes Visit to Ghana.” Washington, DC: IMF. Avail-able at: https://www.imf.org/en/News/Articles/2017/02/10/pr1743-IMF-Staff-Concludes-Visit-to-Ghana.
Jedwab, R., and R. D. Osei. 2012. “Structural Change in Ghana, 1960–2012.” IIEPWorking Paper. Washington, DC: George Washington University, Institute forInternational Economic Policy.
Jeffries, Richard. 1992. “Urban Popular Attitudes towards the Economic RecoveryProgramme and the PNDC Government in Ghana.” African Affairs 91(363):207–26.
Johnson, Chalmers. 1982.MITI and the Japanese Miracle: The growth of industrialpolicy, 1925–1975. Stanford, CA: Stanford University Press.
Karakoc, Ekrem. 2010. “The Democracy and Equality Paradox: How Democracyhas Increased Income Disparities in Postcommunist and Southern Europe.”PhD dissertation, The Pennsylvania State University.
Katzenstein, Peter. 1985. Small States in World Markets: Industrial Policy inEurope. Ithaca, NY: Cornell University Press.
Kaufman, Robert, and Alex Segura-Ubiergo. 2001. “Globalization, Domestic Pol-itics, and Social Spending in Latin America: A Time-series Cross-sectionAnalysis, 1973–1997.” World Politics 53(4): 553–87.
Keefer, Philip. 2007. “Clientelism, Credibility, and the Policy Choices of YoungDemocracies.” American Journal of Political Science 51: 804–21.
Kelsall, Timothy. 2011. “Rethinking the Relationship between Neo-patrimonialismand Economic Development in Africa,” IDS Bulletin. Vol. 42(2): 76–87.
Kelsall, Timothy. 2013. Business, Politics, and the State in Africa: Challenging theOrthodoxies on Growth and Transformation. London: Zed Books.
Khan, Mustaq. 2000. “Rents, Efficiency and Growth,” in M. H. Khan andJ. K. Sundaram (eds), Rents, Rent-Seeking and Economic Development: Theoryand Evidence in Asia. Cambridge: Cambridge University Press, 21–69.
Killick, Tony. 2000. “Fragile Still: The Structure of Ghana’s Economy 1960–94,” inE. Aryeetey, J. Harrigan, and M. Nissanke (eds), Economic Reforms in Ghana:The Miracle and the Mirage. Oxford: James Currey: 51–67.
Kohli, Atul. 2004. State-Directed Development: Political Power and Industrializa-tion in the Global Periphery. New York: Cambridge University Press.
OUP CORRECTED PROOF – FINAL, 30/7/2019, SPi
88 ,

Kraus, Jon. 1991. “The Political Economy of Stabilization and StructuralAdjustment in Ghana,” in Donald Rothchild (ed.), Ghana: The PoliticalEconomy of Recovery. Boulder, CO: Lynne Rienner Publishers, 119–55.
Kraus, Jon. 2002. “Capital, Power and Business Associations in the AfricanPolitical Economy: A Tale of Two Countries, Ghana and Nigeria.” Journal ofModern African Studies 40(3): 395–436.
Lake, David, and Matthew Baum. 2001. “The Invisible Hand of Democracy:Political Control and the Provision of Public Services.” Comparative PoliticalStudies 34(6): 587–621.
Larbi, G. 1999. “The New Public Management Approach and Crisis States.”UNRISD Discussion Paper No. 112. Geneva: United Nations Research Institutefor Social Development.
Lavers, Tom, and Festus Boamah. 2016. “The Impact of Agricultural Investmentson State Capacity: A Comparative Analysis of Ethiopia and Ghana.” Geoforum72: 94–103.
Leftwich, Adrian. 2010. “Beyond Institutions: Rethinking the Role of Leaders,Elites and Coalitions in the Institutional Formation of Developmental Statesand Strategies.” Forum for Development Studies 37(1): 93–111.
Leftwich, Adrian. 1995. “Bringing Politics Back in: Towards a Model of theDevelopmental State.” Journal of Development Studies 31(3): 400–27.
Leite, Sérgio, Anthony Pellechio, Luisa Zanforlin et al. 2000. Ghana: EconomicDevelopment in a Democratic Environment. Washington, DC: IMF.
Levitsky, Steven, and Lucan Way. 2010. Competitive Authoritarianism: The Emer-gence and Dynamics of Hybrid Regimes in the Post-Cold War Era. New York:Cambridge University Press.
LeVan, Carl. 2015. Dictators and Democracy in African Development. New York:Cambridge University Press.
MacLean, Lauren. 2010. Informal Institutions and Citizenship in Rural Africa: Riskand Reciprocity in Ghana and Côte d’Ivoire. New York: Cambridge UniversityPress.
Martin, Matthew. 1993. “Neither Phoenix nor Icarus: Negotiating EconomicReform in Ghana and Zambia, 1983–1992,” in Thomas Callaghy and JohnRavenhill (eds), Hemmed In: Responses to Africa’s Economic Decline. NewYork: Columbia University Press, 130–79.
Maxfield, Sylvia, and Ben Ross Schneider. 1997. Business and the State in Devel-oping Countries. Ithaca, NY: Cornell University Press.
McCaig, Brian, Margaret McMillan, Inigo Verduzco-Gallo, and Keith Jefferis.2015. “Stuck in the Middle? Structural Change and Productivity Growth inBotswana,” NBER Working Paper No. 21029. Cambridge, MA: NBER.
OUP CORRECTED PROOF – FINAL, 30/7/2019, SPi
89
McMillan, Margaret. 2013. “Blue Skies: How One Firm Overcame ‘BindingConstraints.’ ” Ghana Strategy Support Program (GSSP) Discussion NoteNo. 21. Washington, DC: IFPRI.
Meltzer, Allen, and Scott Richard. 1981. “A Rational Theory of the Size ofGovernment.” Journal of Political Economy 89(5): 914–27.
Mikell, Gwendolyn. 1989. “Peasant Politicisation and Economic Recuperation inGhana: Local and National Dilemmas.” The Journal of Modern African Studies27(3): 455–78.
Mosley, Paul, and Blessing Chiripanhura. 2016. “The African Political BusinessCycle: Varieties of Experience.” Journal of Development Studies 52(7): 917–32.
Nordhaus, W. 1975. “The Political Business Cycle,” Review of Economic Studies42: 169–90.
Nugent, Paul. 1995. Big Men, Small Boys and Politics in Ghana: Power Ideologyand the Burden of History. London: Pinter.
Nugent, Paul. 2004. Africa since Independence. London: Palgrave McMillan.
Nyanteng, V. K., and A. Wayo Seini. 2000. “Agricultural Policy and the Impact onGrowth and Productivity, 1970–1995,” in Ernest Aryeetey, Jane Harrigan, andMachiko Nissanke (eds), Economic Reforms in Ghana: The Myth and theMirage. Trenton, NJ: Africa World Press, 267–83.
Oduro, Franklin, Mohammed Awal, andMaxwell Agyei Ashon. 2014. “ADynamicMapping of the Political Settlement in Ghana.” Effective States and InclusiveDevelopment (ESID) Working Paper No. 28. University of Manchester.
Ohemeng, Frank Louis Kwaku. 2011. “Institutionalizing the Performance Man-agement System in Public Organizations in Ghana.” Public Performance &Management Review 34(4): 467–88.
Olson, Mancur. 1993. “Dictatorship, Democracy and Development.” AmericanPolitical Science Review 87(3): 567–76.
Opoku, Darku. 2010. The Politics of Government–Business Relations in Ghana,1982–2008. New York: Palgrave Macmillan.
Osei, Philip. 2000. “Political Liberalization and the Implementation of ValueAdded Tax in Ghana.” The Journal of Modern African Studies 38: 255–78.
Oxford Business Group. 2013. The Report: Ghana. London: Oxford Business Group.
Pitcher, Anne. 2012. Party Politics and Economic Reform in African Democracies.New York: Cambridge University Press.
Poulton, Colin. 2014. “Democratization and the Political Incentives for Agricul-tural Policy in Africa.” Development Policy Review 32(S2): S101–S122.
Powell, M., and J. Round. 2000. “Structure and Linkage in the Economy of Ghana:A SAM Approach,” in E. Aryeetey, J. Harrigan, and M. Nissanke (eds), EconomicReforms in Ghana: The Miracle and the Mirage. Oxford: James Currey: 68–87.
OUP CORRECTED PROOF – FINAL, 30/7/2019, SPi
90 ,

Prempeh, H. K., and C. Kroon. 2012. The Political Economy Analysis of the Oil andGas Sector in Ghana: The Implication for STAR-Ghana. Accra: STAR Ghana.
Przeworski, Adam, Michael Alvarez, Jose Antonio Cheibub, and Fernando Limongi.2000. Democracy and Development. Cambridge: Cambridge University Press.
Quartey, Peter and Gloria Afful-Mensah. 2014. “Financial and Monetary Policiesin Ghana: A Review of Recent Trends.” Review of Development Finance 4(2):115–25.
Rao, Sujata. 2007. “Ghana Sees Huge Demand for Debut 10-year Eurobond.”Reuters.
Rauch, James, and Peter Evans. 2000. “Bureaucratic Structure and BureaucraticPerformance in Less Developed Countries.” Journal of Public Economics 75: 49–71.
Riedl, Rachel, and Tyler Dickovick. 2014. “Party Systems and Decentralization inAfrica.” Studies in Comparative International Development 49: 321–42.
Rimmer, Douglas. 1992. Staying Poor: Ghana’s Political Economy, 1950–1990.New York: Pergamon Press.
Robinson, James. 2009. “Industrial Policy and Development: A Political EconomyPerspective.” Paper prepared for the 2009 World Bank ABCDE Conference inSeoul, Korea, June 22–24.
Rodrik, Dani. 1999. “Democracies Pay Higher Wages.” Quarterly Journal ofEconomics 114(3): 707–38.
Rodrik, Dani. 2000. “Institutions for High-Quality Growth: What They Are andHow to Acquire Them.” Studies in Comparative International Development 35(3): 3–31.
Rodrik, Dani. 2008. “Normalizing Industrial Policy.” Commission on Growth andDevelopment, Working Paper No. 3. Washington, DC: The World Bank.
Rodrik, Dani. 2014. “The Past, Present, and Future of Economic Growth,” inFranklin Allen, Jere Behrman, Nancy Birdsall et al. Towards a Better GlobalEconomy: Policy Implications for Citizens Worldwide in the 21st Century.Oxford: Oxford University Press, 70–137.
Rogoff, Kenneth. 1990. “Equilibrium Political Budget Cycles.” American EconomicReview 80(1): 21–36.
Ross, Michael. 2006. “Is Democracy Good for the Poor?” American Journal ofPolitical Science 50(4): 860–74.
Rothchild, Donald. 1991. Ghana: The Political Economy of Recovery. Boulder, CO:Lynne Rienner Publishers.
Sachs, Jeffrey. 2005. The End of Poverty: Economic Possibilities for our Time.New York: Penguin Books.
Sandbrook, Richard. 2005. “Origins of the Democratic Developmental State:Interrogating Mauritius.” Canadian Journal of African Studies 39(3): 549–81.
OUP CORRECTED PROOF – FINAL, 30/7/2019, SPi
91

Schneider, Ben Ross. 1999. The Developmental State. Ithaca, NY: Cornell Univer-sity Press.
Schneider, Ben Ross. 2010. “Business Politics in Latin America: Patterns ofFragmentation and Centralization,” in D. Coen, W. Grant, and G. K. Wilson(eds.), The Oxford Handbook of Business and Government. New York, UnitedStates: Oxford University Press.
Schneider, Ben Ross. 2013. “Institutions for Effective Business-Government Col-laboration: Micro Mechanisms and Macro Politics in Latin America.’ Inter-American Development Bank (IDB) Working Paper Series No. IDB-WP-418.Washington, DC: IDB.
Schoneveld, G., L. German, and E. Nutakor. 2010. “Towards Sustainable BiofuelDevelopment: Assessing the Local Impacts of Large-scale Foreign Land Acqui-sitions in Ghana.” Paper presented at the Annual World Bank Conference onLand Policy and Administration.
Sen, Kunal. 2015. “The Political Determinants of Economic Growth: An Analyt-ical Review,” in Sam Hickey, Kunal Sen, and Badru Bukenya (eds), The Politicsof Inclusive Development: Interrogating the Evidence. Oxford: Oxford UniversityPress, 35–59.
STAR-Ghana (Strengthening Transparency, Accountability, and Responsivenessin Ghana). 2011. Political Economy of Ghana and Thematic Strategy Develop-ment for STAR-Ghana. Accra: STAR and DfID.
Stasavage, David. 2005. “Democracy and Education Spending in Africa.” Ameri-can Journal of Political Science 49(2): 343–58.
Tangri, Roger. 1999. The Politics of Patronage in Africa: Parastatals, Privatizationand Private Enterprise. Oxford: James Currey.
Terkper, Seth. 1995. “Ghana Tax Administration Reforms (1985–1993).”HarvardDevelopment Discussion Papers. Cambridge, MA: Harvard Institute for Inter-national Development.
Taylor, Scott. 1999. “Race, Class and Neopatrimonial Politics in Zimbabwe,” inRichard A. Joseph (ed.), State, Conflict, and Democracy in Africa. Boulder, CO:Lynne Rienner, 239–66.
Taylor, Scott. 2007. Business and the State in Southern Africa: The Politics ofEconomic Reform. Boulder, CO: Lynne Rienner Publishers.
Throup, David, Chris Jackson, Katherine Bain, and Rachel Ort. 2014. “DevelopingCommercial Agriculture in Ghana,” in Verena Fritz, Brian Levy, and Rachel Ort(eds), Problem-Driven Political Economy Analysis. Washington, DC: WorldBank, 143–74.
Tsikata, G. Kwaku. 1995. The Gold Sub-Sector and Economic Growth and Devel-opment in Ghana. Washington, DC: The World Bank.
OUP CORRECTED PROOF – FINAL, 30/7/2019, SPi
92 ,

Tsikata, G. Kwaku, Yaw Asante, and E. M. Gyasi. 2000. Determinants of ForeignDirect Investment in Ghana. London: Overseas Development Institute.
Tsikata, Yvonne. 2001. “Ghana,” in Shanta Devarajan, David Dollar, and TorgnyHolmgren (eds), Aid and Reform in Africa: Lessons from Ten Case Studies.Washington, DC: The World Bank.
Ubink, Janine. M. 2008. “Struggles for Land in Peri-urban Kumasi and theirEffects on Popular Perception of Chiefs and Chieftaincy,” in J. M. Ubink andK. Amanor (eds), Contesting Land and Custom in Ghana: State, Chief, and theCitizen. Leiden: Leiden University Press, 155–82.
United Nations Development Program (UNDP). 2015. Ghana Millennium Devel-opment Goals, 2015 Report. New York: UNDP.
van de Walle, Nicolas. 2001. African Economies and the Politics of PermanentCrisis, 1979–1999. New York: Cambridge University Press.
Wade, Robert. 1990. Governing the Market: Economic Theory and the Role ofGovernment in East Asian Industrialization. Princeton, NJ: Princeton Univer-sity Press.
Weber, Max. 1978. Economy and Society. Berkeley, CA: University of CaliforniaPress.
Weghorst, Keith and Staffan Lindberg. 2013. “What Drives the Swing Voter inAfrica?” American Journal of Political Science 57(3): 717–34.
Whitfield, Lindsay. 2010. “The State Elite, PRSPs, and Policy Implementation inAid-Dependent Ghana.” Third World Quarterly 31(5): 721–37.
Whitfield, Lindsay. 2011. “Competitive Clientelism, Easy Financing and WeakCapitalists: The Contemporary Political Settlement in Ghana,” DIIS WorkingPaper 2011:27. Copenhagen: Danish Institute for International Studies.
Whitfield, Lindsay. 2012. “Developing Technological Capabilities in Agro-Industry: Ghana’s Experience with Fresh Pineapple Exports.” Journal of Devel-opment Studies 48(3): 308–21.
Whitfield, Lindsay, and Lars Buur. 2014. “The Politics of Industrial Policy: RulingElites and their Alliances.” Third World Quarterly 35(1): 126–44.
Whitfield, Lindsay, and Emily Jones. 2009. “Ghana: Breaking out of Aid Depend-ence? Economic and Political Barriers to Ownership,” in Lindsay Whitfield(ed.), The Politics of Aid: African Strategies for Dealing with Donors. Oxford:Oxford University Press, 185–216.
Whitfield, Lindsay, Ole Therkildsen, Lars Buur, and Anne Mette Kjær. 2015. ThePolitics of African Industrial Policy: A Comparative Perspective. New York:Cambridge University Press.
Wiggins, Steven, andHenri Leturque. 2011. “Ghana’s Sustained Agricultural Growth:Putting Underused Resources toWork.” London: OverseasDevelopment Institute.
OUP CORRECTED PROOF – FINAL, 30/7/2019, SPi
93

Williams, Tracy. 2009. An African Success Story: Ghana’s Cocoa MarketingSystem. IDS Working Paper No. 318. Brighton: University of Sussex.
World Bank. 2009. Abolishing School Fees in Africa: Lessons from Ethiopia, Ghana,Kenya, Malawi, and Mozambique. Washington, DC: World Bank.
World Bank. 2010. Ghana’s New Approach to Public Sector Reform: Focusing onDelivery. Global Expert Team, Public Sector Performance. Washington, DC:The World Bank.
World Bank. 2011. Republic of Ghana: Joint Review of Public Expenditure andFinancial Management. Washington, DC: World Bank.
World Bank. 2014. Ghana: Country Profile 2013. Enterprise Surveys, Washington,DC: The World Bank.
World Development Indicators (WDI). 2016. Washington, DC: The World Bank.
OUP CORRECTED PROOF – FINAL, 30/7/2019, SPi
94 ,

PART II
AGRICULTURE ’S ROLE INGHANA ’S TRANSFORMATION
OUP CORRECTED PROOF – FINAL, 31/7/2019, SPi

OUP CORRECTED PROOF – FINAL, 31/7/2019, SPi

4Ghana’s Agricultural Transformation
Past Patterns and Sources of Change
Peter Hazell, Xinshen Diao, and Eduardo Magalhaes
Ghana’s agriculture has performed reasonably well by African standards sincethe 1980s in terms of its growth, labor productivity, farm incomes, and thedecline in rural poverty. Yet it has not exploited its potential to become a moreimportant source of export earnings beyond cocoa, or to reduce the country’sgrowing dependence on many imported foods. As noted in Chapter 2, agri-culture needs to become a more powerful engine of growth in the future ifGhana is to sustain its economic transformation and continue to grow itsnational per capita income. There are also concerns about the sustainability ofthe recent pattern of agricultural growth with its heavy dependence onexpanding the cropped area rather than shifting to more intensive farmingpractices that can increase land productivity. Given the importance of agri-culture in the Ghanaian economy, this chapter and Chapters 5–9 aim toprovide a comprehensive review of the agricultural transformation that hasoccurred, the underlying reasons for why it has evolved the way it has, and toidentify options for future growth.
This chapter is structured as follows. Section 4.1 describes the main featuresof the agricultural transformation that has occurred since the policy reforms ofthe 1980s, focusing on changes in: a) production (area, yield, output, cropmix); b) technology (fertilizer, seeds, pesticides, mechanization); c) land andlabor (employment, wages, productivity, farm size distribution); and d) ruralincomes (farm income, nonfarm income diversification, total income, expend-iture). We provide regional as well as national insights. Then in Section 4.2 weexamine important factors that may have driven this pattern of transform-ation: the policy environment; growing population pressure on the land base;and rapid urbanization. Section 4.3 contains our conclusions.
OUP CORRECTED PROOF – FINAL, 31/7/2019, SPi
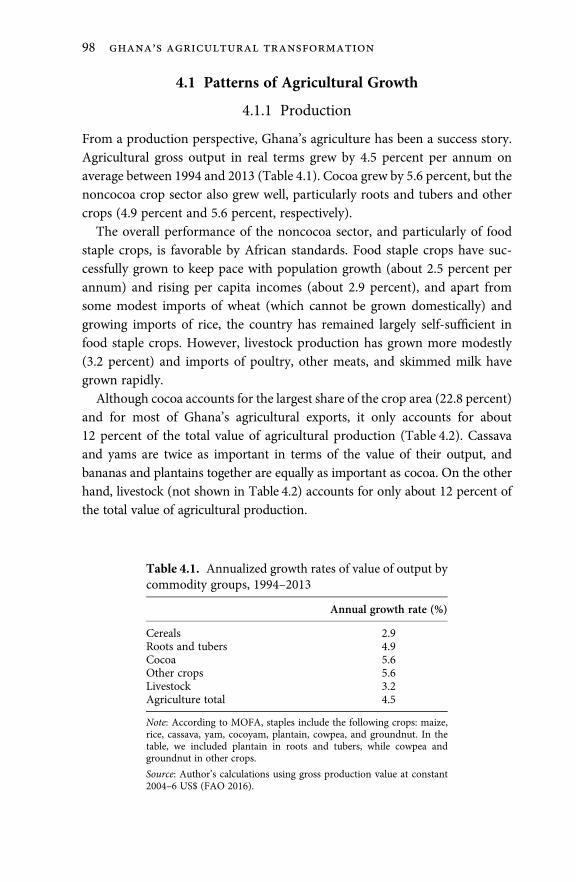
4.1 Patterns of Agricultural Growth
4.1.1 Production
From a production perspective, Ghana’s agriculture has been a success story.Agricultural gross output in real terms grew by 4.5 percent per annum onaverage between 1994 and 2013 (Table 4.1). Cocoa grew by 5.6 percent, but thenoncocoa crop sector also grew well, particularly roots and tubers and othercrops (4.9 percent and 5.6 percent, respectively).
The overall performance of the noncocoa sector, and particularly of foodstaple crops, is favorable by African standards. Food staple crops have suc-cessfully grown to keep pace with population growth (about 2.5 percent perannum) and rising per capita incomes (about 2.9 percent), and apart fromsome modest imports of wheat (which cannot be grown domestically) andgrowing imports of rice, the country has remained largely self-sufficient infood staple crops. However, livestock production has grown more modestly(3.2 percent) and imports of poultry, other meats, and skimmed milk havegrown rapidly.
Although cocoa accounts for the largest share of the crop area (22.8 percent)and for most of Ghana’s agricultural exports, it only accounts for about12 percent of the total value of agricultural production (Table 4.2). Cassavaand yams are twice as important in terms of the value of their output, andbananas and plantains together are equally as important as cocoa. On the otherhand, livestock (not shown in Table 4.2) accounts for only about 12 percent ofthe total value of agricultural production.
Table 4.1. Annualized growth rates of value of output bycommodity groups, 1994–2013
Annual growth rate (%)
Cereals 2.9Roots and tubers 4.9Cocoa 5.6Other crops 5.6Livestock 3.2Agriculture total 4.5
Note: According to MOFA, staples include the following crops: maize,rice, cassava, yam, cocoyam, plantain, cowpea, and groundnut. In thetable, we included plantain in roots and tubers, while cowpea andgroundnut in other crops.
Source: Author’s calculations using gross production value at constant2004–6 US$ (FAO 2016).
OUP CORRECTED PROOF – FINAL, 31/7/2019, SPi
98 ’

For most food crops, increases in the area harvested since 1995 have beena more important source of production growth than increases in yields(Table 4.3). Also, yield growth rates for many crops have slowed since theearly 1990s. For example, yield growth rates for cocoa, maize, rice, and yams in1995–2012 were about one quarter the growth rates achieved in 1980–94(Table 4.3). The higher growth rates achieved during 1980–94 may simplyreflect a period of yield catch-up after the disastrous pre-reform period, whilethe more recent growth rates are in line with the Africa-wide average for thesame period (ReSAKSS.org, accessed in 2018).
Changes in the crop mix have also contributed to agricultural growth. Thecrops whose area expanded faster than average during 1995–2013 typicallyeither already had high value of output per hectare (VOP/ha) or experiencedmore rapid growth than average in VOP/ha over that period (Table 4.4). Thesecrops included groundnuts, yams, pulses, and vegetables.
4.1.1.1 Regional Diversity
Ghana spans several agroclimatic zones, and this leads to clear geographicpatterns in crop production. MoFA identifies three main agroecological zonesdefined on the basis of climate, natural vegetation, and soils. These are the forestzone (which includes the rain and deciduous forests), the savanna zone (includ-ing the coastal and northern savannas), and the transitional zone (Map 4.1).
Table 4.2. Composition of crop agriculture, 2012
Crop Land area (ha) Share of cropland (%)
VOP ($10³) Share ofVOP (%)
Cassava 875,185 12.5 1,519,652 23.6Cocoa, beans 1,600,300 22.8 913,192 12.3Groundnuts 328,940 4.7 202,446 2.4Maize 1,023,459 14.6 147,642 1.9Yams 421,558 6.0 1,693,203 25.5Other tree crops 645,514 9.2 194,307 2.8Pulses 430,000 6.1 145,959 1.9Rice, paddy 215,905 3.1 130,764 2.2Taro (cocoyam) 193,998 2.8 269,407 3.8Banana+plantain 346,860 4.9 756,803 11.1Vegetables 64,466 0.9 378,508 5.6Sorghum+millet 386,556 5.5 75,027 0.9Fruits 408,427 5.8 378,183 5.7Others 86,050 1.2 21,680 0.3
Total 7,027,218 100.0 6,826,775 100.0
Source: Authors’ calculation using FAO data.
OUP CORRECTED PROOF – FINAL, 31/7/2019, SPi
, , 99

Table 4.3. Growth in crop area, output, and yield, by period (%/year)
1980–94 1995–2012
Areaharvested
Production Yield Areaharvested
Production Yield
Cassava 7.9 9.8 1.8 2.6 4.7 2.0Cocoa, beans –3.4 2.4 6.1 2.6 5.1 2.5Groundnuts 2.9 0.0 –2.8 4.6 7.0 2.3Maize 3.1 8.3 5.0 2.6 3.8 1.2Yams 3.4 10.0 6.3 5.0 6.5 1.5Other tree crops 3.0 0.1 –2.9 3.4 4.6 1.2Pulses 0.3 0.1 –0.2 8.1 21.5 12.4Rice, paddy –0.1 7.6 7.8 3.5 5.4 1.9Taro (cocoyam 1.0 5.3 4.2 –0.4 –0.9 –0.5Plantain 1.1 3.4 2.3 2.6 5.2 2.5Vegetables 1.2 2.9 1.6 4.4 4.5 0.1Sorghum & millet 2.0 5.3 3.2 –1.6 –0.7 0.9Fruits 0.5 2.6 2.1 2.0 5.9 3.8Others 1.7 1.2 –0.5 5.0 2.5 –2.4
Total 1.1 5.8 4.1 2.7 5.1 2.4
Source: Authors’ calculation using FAO data.
Table 4.4. Growth in value added/ha and crop area, by commodity,1995–2013 (%/year)
VOP/hain 2012
Growth in VOP/ha1995–2013
Growth in crop area1995–2013
Cassava 1.7 2.0 2.6Cocoa, beans 0.6 2.7 2.6Groundnuts 0.6 3.2 4.6Maize 0.1 1.0 2.6Yams 4.0 1.8 5.0Other tree crops 0.3 –1.5 3.4Pulses 0.3 15.3 8.1Rice, paddy 0.6 1.6 3.5Taro (cocoyam 1.4 0.4 –0.4Banana+plantain 2.2 2.7 2.6Vegetables 5.9 –4.1 4.4Sorghum+millets 0.2 1.2 –1.6Fruits 0.9 7.4 2.0Others 0.3 –0.1 5.0
Total 1.0 2.1 2.7
Note: The aggregation of agricultural production takes into consideration the weightfor each crop, which is in 2004–6 international constant prices.
Source: Authors’ calculation using FAO data.
OUP CORRECTED PROOF – FINAL, 31/7/2019, SPi
100 ’

The distribution of major food crops by agroecological zone is shown inTable 4.5, using average production data for 2010–12. Maize and yams are theonly major crops that are grown widely throughout the country, while millet,sorghum, groundnut, and cowpea are grown almost exclusively in the savan-nah zone, and cassava, plantain, and cocoyam are grown mostly in thetransition and forest zones. Rice is most important in the savannah and forest
B U R K I N A F A S O
RE
PU
BL
IC O
F T
OG
O
CO
TE
D’I
VO
IRE
G U L F O F G U I N E A
Brong Ahafo
Northern
Sakpule
Upper East
Upper West
HiawoanmuEjura-Sekyedumase
District
HiawoanmuEjura-Sekyedumase
District
Ashanti
WesternCentral Greater Accra
Eastern
Volta
N
Kilometers0 20 40 80 120 160
VillageDistrict BoundaryRegional BoundaryVolta Lake
ForestSavannaTransition
TindangTindang
ecological zone
Legend
Savelugu-NantonDistrict
SekyerekromSekyerekrom
Greater AccraGreater Accra
Map 4.1. Ecological zones of GhanaSource: Compiled from Harvest Choice and GADM data (2015). Map reprinted with permission fromSpringer.
OUP CORRECTED PROOF – FINAL, 31/7/2019, SPi
, , 101
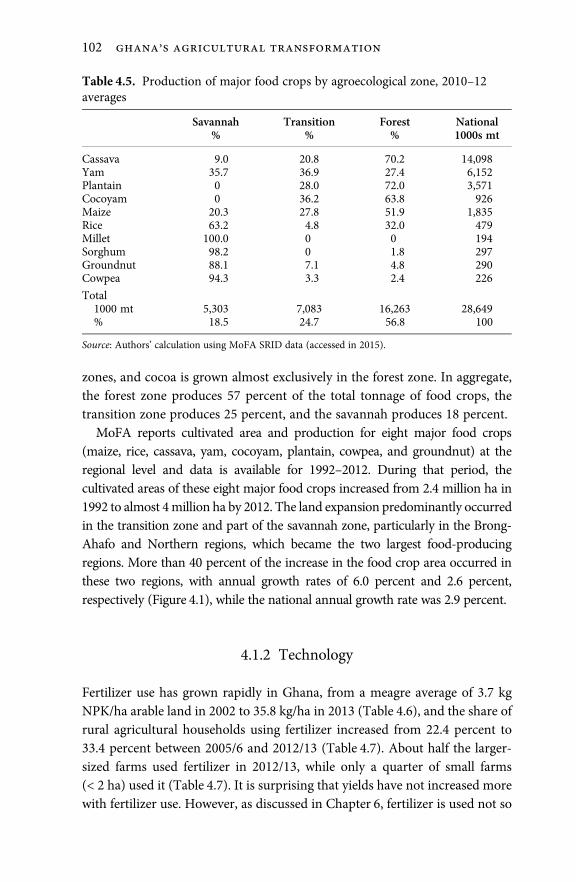
zones, and cocoa is grown almost exclusively in the forest zone. In aggregate,the forest zone produces 57 percent of the total tonnage of food crops, thetransition zone produces 25 percent, and the savannah produces 18 percent.
MoFA reports cultivated area and production for eight major food crops(maize, rice, cassava, yam, cocoyam, plantain, cowpea, and groundnut) at theregional level and data is available for 1992–2012. During that period, thecultivated areas of these eight major food crops increased from 2.4 million ha in1992 to almost 4million ha by 2012. The land expansion predominantly occurredin the transition zone and part of the savannah zone, particularly in the Brong-Ahafo and Northern regions, which became the two largest food-producingregions. More than 40 percent of the increase in the food crop area occurred inthese two regions, with annual growth rates of 6.0 percent and 2.6 percent,respectively (Figure 4.1), while the national annual growth rate was 2.9 percent.
4.1.2 Technology
Fertilizer use has grown rapidly in Ghana, from a meagre average of 3.7 kgNPK/ha arable land in 2002 to 35.8 kg/ha in 2013 (Table 4.6), and the share ofrural agricultural households using fertilizer increased from 22.4 percent to33.4 percent between 2005/6 and 2012/13 (Table 4.7). About half the larger-sized farms used fertilizer in 2012/13, while only a quarter of small farms(< 2 ha) used it (Table 4.7). It is surprising that yields have not increased morewith fertilizer use. However, as discussed in Chapter 6, fertilizer is used not so
Table 4.5. Production of major food crops by agroecological zone, 2010–12averages
Savannah%
Transition%
Forest%
National1000s mt
Cassava 9.0 20.8 70.2 14,098Yam 35.7 36.9 27.4 6,152Plantain 0 28.0 72.0 3,571Cocoyam 0 36.2 63.8 926Maize 20.3 27.8 51.9 1,835Rice 63.2 4.8 32.0 479Millet 100.0 0 0 194Sorghum 98.2 0 1.8 297Groundnut 88.1 7.1 4.8 290Cowpea 94.3 3.3 2.4 226
Total1000 mt%
5,30318.5
7,08324.7
16,26356.8
28,649100
Source: Authors’ calculation using MoFA SRID data (accessed in 2015).
OUP CORRECTED PROOF – FINAL, 31/7/2019, SPi
102 ’

much to increase yields as to offset declining yields due to loss of soil fertility asfallow periods have been shortened. The adoption of improved seed varietiesthat might have enhanced the yield response to fertilizer has also been modest.For example, based on a recent farm survey, Ragasa et al. (2013) found thatthere has been very little increase in the adoption of improved varieties ofmaize since a 1997 survey, and although 61 percent of the maize area wasplanted with modern varieties, only 15 percent was planted with certified seed.
In recent years, many farmers have also adopted herbicides and insecticides,and shifted to tractors for land preparation (Table 4.7). As shown in Chapter 6,these labor-saving technologies have enabled many farmers in the savannahand transition zones to expand their cropped area, while substantially redu-cing hired labor use per hectare, which has become more expensive with rapidurbanization. However, the increased labor needs associated with largercropped areas has more than offset reductions in labor use per ha, and theshare of farm households using hired labor about doubled between 2005/6 and2012/13 (Table 4.7).
Table 4.6. Fertilizer use (tons of nutrients)
N P K Total NPK Application rate kgNPK/ha of arable land
2002 4,330 120 11,120 15,570 3.72013 61,922 55,628 50,823 168,373 35.8
Source: FAOSTAT.
–6
–4
–2
0
2
4
6
8
8–5 Ashanti
Brong-Ahafo
Centra
l
Eastern
Northern
Upper-East
Upper-W
estVolta
West
ern0
5
10
15
20
25
Ann
ual g
row
th ra
te (%
)
% o
f inc
reas
ed a
reas
in 1
992–
2012
% of increased area in 1992–2012Annual growth rate in 1992–2012
Gt. Accr
a
Gt. Accr
a
Figure 4.1. Distribution of increases in food crop areas and annual growth ratesby regionSource: Authors’ calculation using MoFA SRID data (accessed in 2016).
OUP CORRECTED PROOF – FINAL, 31/7/2019, SPi
, , 103

4.1.3 Land and Labor
The total cropped area grew by 2.7 percent per year over 1999–2014(Table 4.4) as farmers brought virgin land into production and shortenedfallow periods. FAO estimates that the agricultural labor force also grew atabout the same rate over a similar period (Table 4.8). However, this estimatemay be high; GGDC (Timmer et al. 2016) estimates that agricultural employ-ment grew by only 0.7 percent per year during 2000–10, and this estimate isconsistent with our own estimates based on the Ghana Living Standard Surveydata. Census data also show that the rural population has peaked in size, inwhich case the pressure on the land base should be easing.¹
Labor also became more expensive as real wage rates were pulled up bycompetition from rural nonfarm jobs (Chapters 2 and 5), growing by nearly7 percent per year on average over 1991 to 2012 at both national and regionallevels (Table 4.9). However, the value of agricultural production has grownfaster than land and labor (4.5 percent per year), leading to increases in bothland and labor productivity. Figure 4.2 plots the changes in land and laborproductivity since 1991, and shows that while both have increased, laborproductivity has grown considerably faster than land productivity, a reflection
Table 4.7. Share of rural households using modern inputs and hired labor (%)
Input Farm size Total
< 2 ha 2–5 ha 5–20 ha > 20 ha
Fertilizer:2005/6 17.0 26.4 30.8 49.3 22.42012/13 24.6 40.6 44.8 52.5 33.4
Pesticides:2005/6 26.2 36.3 46.3 37.7 32.22012/13 59.6 79.3 86.3 83.7 70.6
Mechanization:2005/6 12.9 20.3 27.0 34.4 17.52012/13 22.0 37.8 53.6 72.8 32.5
Hired labor:2005/6 19.2 34.6 40.3 28.8 27.72012/13 43.1 53.2 64.6 74.1 50.0
Source: Authors’ calculation using GLSS5 and GLSS6.
¹ The land pressure on the rural population will also have been affected by loss of land to urban-basedentrepreneurs who are reportedly venturing into farming (Jayne et al. 2016), but there has also been anoffsetting pattern with some rural households giving up their land to focus on nonfarm occupations(see Chapter 5).
OUP CORRECTED PROOF – FINAL, 31/7/2019, SPi
104 ’

of a switch to labor-saving technologies and crops. This is consistent withChapter 2 where it is shown that labor productivity growth within agriculturewas an important source of growth in national labor productivity.
4.1.3.1 Land distribution
Ghanaian agriculture is still dominated by small farms of less 2 ha in size, butone consequence of the changes in land area and population has been a shift inthe farm size distribution (Table 4.10). Nationally, about three quarters of allrural households had land in 2012/13, and of these about half farmed 2 ha orless (i.e., about 4.5 million small farms). The share of rural households withno cultivated land increased from 16.8 percent in 2005/6 to 23.2 percent in2012/13, while amongst those households who do have land, there has been anincrease in the share of middle-sized farms at the expense of small (< 2 ha) andlarge (> 20 ha) farms. This change masks important differences at regionallevels. In the northern regions (comprising most of the savannah and part oftransition zones), the changes are similar to but more modest than the changes
Table 4.9. Agricultural wages in Ghana, 1991–2012, by type of work(new cedis, deflated by CPI)
Year Men clearing Women harvesting Men harvesting
1991 1.18 0.94 1.111998 1.39 1.03 1.352005 2.30 1.84 2.382012 4.55 3.60 4.24Growth rate 6.70 6.78 6.78
Note: Annualized growth rates over 1991–2012.
Source: Authors’ calculation using GLSS3 to GLSS6.
Table 4.8. Growth in national and agricultural labor forces
Millions Annual growth rate %
1999 2004 2009 2014 1999–2004 2004–9 2009–14
National population 18.38 20.84 23.69 26.44 2.54 2.60 2.22Rural population 10.44 11.05 11.71 12.20 1.01 1.01 1.00National labor force 8.07 9.20 10.75 12.43 2.66 3.16 2.95Agricultural laborforce
4.62 5.15 5.87 6.63 2.20 2.65 2.50
Source: FAOSTAT.
OUP CORRECTED PROOF – FINAL, 31/7/2019, SPi
, , 105

Table 4.10. Changes in the size distribution of farms amongst rural households (%)
No land < 2 ha 2–5 ha 5–20 ha > 20 ha Some land
National2005/6 16.8 53.3 31.8 12.9 1.9 83.22012/13 23.2 49.3 35.6 14.2 0.9 76.8
Northern regions (savannah and transition zones)2005/6 12.8 44.3 36.6 15.9 3.2 87.22012/13 14.9 38.6 41.2 18.8 1.4 85.1
Southern regions (forest and coastal zones)2005/6 16.8 53.3 31.8 12.9 1.9 83.22012/13 29.1 58.4 30.8 10.3 0.5 70.9
Source: Authors’ calculations using GLSS5 and GLSS6 data. Land is defined as cultivated land.
9192
93
94
9596
97 9899
00 01
02 0305 06
08
091011
0.95
1.05
1.15
1.25
1.35
1.45
1.55
1.65
1.75
1.85
1.95
0.95 1.05 1.15 1.25 1.35 1.45 1.55 1.65 1.75 1.85 1.95
Land
pro
duct
ivity
Labor productivity
1991–2000 2001–2011
04 07
Figure 4.2. Trends in land and labor productivity, 1991–2011Note: Each dot in the chart represents an individual year.
Source: Authors’ calculation using data from GGDC (2016) for agricultural value added andagricultural employment, and from FAO (2016) for cultivated agricultural land.
OUP CORRECTED PROOF – FINAL, 31/7/2019, SPi
106 ’

in national aggregates. In the southern regions (comprising the forest andcoastal zones), there has been a much sharper increase in no-land households,and the share of small farms (< 2 ha) has actually increased by 10 percent atthe expense of all the other size groups.
The GLSS data can also be used to calculate the share of the total operatedland farmed by different farm size groups. Jayne et al. (2016) provide theestimates in Table 4.11. According to their estimates, small farms of less 5 haaccounted for 84.5 percent of all farms in 2012 (down from 92.1 percent in1992), and for 48.9 percent of the total operated area (down from 60.7 percentin 1992). On the other hand, the share of farms in the 5–100 ha range aboutdoubled between 1992 and 2012 (up 97 percent) while their share of theoperated land area increased by 45.5 percent. This confirms the growingimportance of middle-sized farms. Further confirmation is to be found fromvillage studies in the savannah zone (in Chapter 6). In the 1980s there werevery few farms greater 5 acres in the four study villages, but by 2015 half ormore of the farms in all the villages were larger than 5 acres.
A problem with representative household surveys like the GLSS is that,because they are sampled to represent households and not agricultural area,they can seriously understate the importance of large farms, and hence distortestimated land shares (Lowder et al. 2016). Jayne et al. (2016) used census andother area based data to estimate a more accurate picture for Ghana, andfound that while there were very few farms greater then 100 ha in the GLSSsurveys, nevertheless they account for about 22 percent of the total farmedarea. This group is missing in estimates like those in Table 4.10, which arebased only on GLSS data.
Table 4.11. Distribution of farms and operated area by farm size groups, 1992and 2012
Farm size Percent of farms Percent of operated land area
1992 2012 % change 1992 2012 % change
0–5 ha 92.1 84.5 –8.3 60.7 48.9 –19.45–10 ha 5.3 9.2 73.6 17.2 19.5 13.410–20 ha 1.7 4.0 135.3 11.0 16.0 45.520–100 ha 0.9 2.4 166.7 11.1 15.6 40.55–100 7.9 15.6 97.4 39.3 51.1 30.0
Source: Jayne et al. (2016) based on GLSS data.
OUP CORRECTED PROOF – FINAL, 31/7/2019, SPi
, , 107

4.1.4 Rural Livelihoods, Incomes, and Poverty
Rural households have benefited directly from the changes in the agriculturalsector, but they have also benefited from new opportunities in the ruralnonfarm economy. Nonfarm opportunities have grown rapidly in urbanizingareas, especially in districts with medium and small-sized towns, leading toconsiderable diversification of farm household livelihoods into nonfarmsources of income and employment (see Chapter 5). Table 4.12 summarizessome of the main changes in terms of incomes sources by farm size groups.About half of all farm households (51.3 percent) received less than one third oftheir total income from nonfarm sources in 2012/13 and can be considered tohave been primarily dependent on farming. This share was down from 55.8percent in 2005/6. Moreover, the share of farm households receiving twothirds or more of their total income from nonfarm sources was 41.4 percentin 2012/13, up from 32.1 percent in 2005/6. Proportionally, more small farms(� 2 ha) obtain two thirds or more of their income from nonfarm sources thanmedium and large farms; 42.7 percent versus 35.7 percent.
The combined impact of changes in the agricultural sector plus diversifica-tion into nonfarm sources of income has led to substantial increases in ruralincomes, which, because of data problems, we proxy here by householdexpenditures (Table 4.13). For rural households as a group, per householdand per capita real expenditures increased by 2.4 percent and 2.2 percentannually between 2005/6 and 2102/13. These increases compare favorably
Table 4.12. Composition of farm household by type of livelihood strategy
Nonfarm income as sharetotal income
Farm size
Small(� 4 ha)
Medium and large(> 4 ha)
Total
2012/13 (n = 9,111)Low (� ⅓) 41.0 10.3 51.3Medium (⅓–⅔) 5.8 1.5 7.3High (> ⅔) 35.0 6.5 41.4
Total 81.8 18.2 100.0
2005/6 (n= 5,200)Low (� ⅓) 41.5 14.3 55.8Medium (⅓–⅔) 9.7 2.4 12.1High (> ⅔) 27.2 4.9 32.1
Total 78.4 21.6 100.0
Note: Includes rural and urban households that have some operated farm land.
Source: Calculations by Melanie Bacou using GLSS data.
OUP CORRECTED PROOF – FINAL, 31/7/2019, SPi
108 ’

with the national average increases in household and per capita expenditureof 2.6 percent and 2.7 percent per annum, respectively. Although the differencesin rates of increase are small, they are sufficient to prevent any convergence inhousehold expenditures (or incomes) between rural and urban households,and between agricultural and nonagricultural households in rural areas. In2012/13, rural households still had average per capita expenditures that were70 percent of the national average, and agricultural households had per capitaexpenditures that were only 61 percent as large as the rural average.
Along with income growth, rural poverty has declined. The national povertyrate fell from 52 percent in 1991/2 to 32 percent by 2005/6, and to 24 percentby 2012/13. The rural poverty rate has remained higher than the national rate,but it also fell sharply—from about 65 percent in 1991/2 to 44 percent in2005/6, and to 38 percent in 2012/13. As shown in Chapter 5, there is a clearrelationship between poverty and rural livelihood opportunities, particularlythe participation in rural nonfarm activities, and which varies with the level ofurbanization.
4.2 Explaining the Trends
Ghana’s agricultural performance has been better than in most other Africancountries, but it has not been outstanding, nor has it exploited its potential tobecome a more important source of export earnings beyond cocoa, or toreduce the country’s growing dependence on many imported foods. Moreover,despite continuing rural population growth, agricultural growth has depended
Table 4.13. Changes in household and per capita expenditure, 2005/6 and 2012/13
Type household
National Rural Rural agriculture Ruralnonagriculture
Rural mixed
Per household (2012/13 cedi)2005/6 7,511 6,015 5,648 6,658 7,6412012/13 9,014 7,078 6,435 7,762 8,939Ratio 1.20 1.18 1.14 1.17 1.17
Per capita (2012/13 cedi)2005/6 1,872 1,376 1,251 1,929 1,2992012/13 2,259 1,586 1,389 2,260 1,504Ratio 1.21 1.16 1.11 1.17 1.16
Source: Authors’ calculation using GLSS5 and GLSS6 data.
OUP CORRECTED PROOF – FINAL, 31/7/2019, SPi
, , 109

mainly on expanding the cropped area, and there has been little agriculturalintensification of the Green Revolution type. In this section we attempt toexplain why agriculture has developed the way it has, and to assess theimplications for the future.
The observed patterns of change reflect the summation of the decisions ofsome 6 million farmers, who have responded over time to a changing politicaland economic environment. Key drivers of change to explore are:
• Government policy, including the political and economic environment,public investment, and pro-active state interventions to further thedevelopment of particular value chains, regions, or groups of farmers.
• Population pressure and land expansion
• Rapid urbanization, which can impact on agriculture through changes inmarket access, infrastructure, population pressure, rural nonfarm oppor-tunities, and higher wages.
4.2.1 Policy
4.2.1.1 An enabling economic environment
As discussed in Chapter 3, apart from cocoa, the value chain for which thegovernment has intervened actively through Cocobod (a parastatal), and tradeand tax policies, the government has generally shown benign neglect of theagricultural sector since the SAP reforms of the 1980s, relying more oncreating a stable and enabling economic environment than on direct inter-ventions that favored particular commodities. As discussed in Chapter 2, thisimprovement in what Rodrik calls “fundamentals” led to significant growth inlabor productivity in agriculture after the SAP, to the point where it has been amajor factor in the growth of national per capita income since the 1980s.
The improvement in the enabling economic environment for agriculture isreflected in a sustained shift in the sector’s domestic terms of trade. Real farmgate prices increased modestly over 1998–2012 (Table 4.14), while farm inputprices, including fertilizer, declined substantially (Table 4.15). Against this,agricultural wage rates grew by nearly 7 percent per year on average over 1991to 2012 (Table 4.9), and labor costs are now a major production cost for mostfarmers (Diao et al. 2014). There was also a general decline in the level oftaxation of agriculture, as reflected by changes in average nominal rates ofassistance for agriculture (see Chapter 3).
OUP CORRECTED PROOF – FINAL, 31/7/2019, SPi
110 ’

4.2.1.2 Direct government interventions
The lack of direct support for agriculture is reflected in low levels of publicspending on agriculture and limited and often ineffective interventions forpromoting value chain development for commodities other than cocoa.
The government has underinvested in agriculture by the norms of otherAfrican countries, and by its own commitment under the Maputo Declarationto spend at least 10 percent of its total budget on agriculture. As shown inChapter 7, public spending on agriculture averaged only 2.1 percent of totalgovernment spending during 2001–8, and 2.8 percent during 2009–12. Fur-thermore, about two thirds of this spending went to the cocoa subsector,leaving the noncocoa subsector even more neglected. When expenditures of
Table 4.14. Annualized growth rates in crop prices,1998–2012 (%)
Crop Current Prices Constant 2005 prices
Cassava 18.49 –0.41Yam 16.77 –1.86Plantain 21.84 2.41Cocoyam 19.25 0.23Maize 21.06 1.75Sorghum 21.29 1.94Groundnut 22.98 3.37Millet 19.65 0.57Rice 20.94 1.65Tomato 23.15 3.51
Source: Authors using data from the Ministry of Agriculture of Ghana.
Table 4.15. Annualized growth rates in input prices,1998–2012 (%)
Input Current prices Constant 2005 prices
NPK 15–15–15 7.80 –7.17Sulphate of Ammonia 7.37 –7.54Urea 5.15 –9.45Round Up 3.99 –10.45Karate –0.20 –14.06Actellic –2.67 –16.18Hoe 18.52 2.06Cutlass 14.38 –1.50Jute Sac 25.61 8.17
Source: Authors using data from the Ministry of Agriculture of Ghana.
OUP CORRECTED PROOF – FINAL, 31/7/2019, SPi
, , 111

the Ghana Cocoa Board are included as part of public expenditures onagriculture, and expenditures of other public corporations are included aspart of total public expenditure, then, as shown in Chapter 7, the budget shareis about 3.8–5.3 percent, which still falls far short of the 10 percent MaputoDeclaration target.² Ghana also spends relatively little on rural roads and otherinfrastructure important to agriculture (Chapter 7), and spending on agricul-tural R&D has averaged 0.6–0.7 percent of agricultural GDP since 2000, whichis barely above the Africa-wide average, and well below the African Union(AU) target of 1 percent (Stads 2016).
Apart from cocoa, whose value chain is tightly controlled by Cocobod, andwhich generally does a good job (see Chapter 8), the government has made fewdirect interventions along the value chains of other commodities since theeconomic reforms, and the few attempts that have been made were mostlyunsuccessful (Chapters 3 and 8). For example, the public sector attempts topromote domestic cocoa processing, palm oil production, and the export ofpineapples (Chapter 3). This lack of effective value chain interventions maynot have adversely affected many of the markets for nontradable agriculturalproducts, but Ghana has not done well in developing additional exports cropslike pineapple, in competing with imports like rice and tomatoes, or indeveloping agroprocessing industries, despite strong demand. Weak publicsector support has contributed to the poor availability of appropriate tech-nologies, especially improved seeds, weak rural infrastructure like roads,transport systems, and cold storage, lack of grading systems for qualitycontrol, and limited export promotion (Chapter 8). However, as discussed inChapter 3, for government to play more proactive roles along value chainsrequires overcoming inherently weak public sector capacities, and a greaterwillingness to engage with the domestic as well as the international privatesectors.
In 2007, the government started paying more attention to the noncocoasubsector with some proactive interventions. These included the reintroduc-tion of a fertilizer subsidy, the establishment of subsidized Agricultural Mech-anization Service Centers (AMSECs), the setting up of Block Farms thatbenefit from a range of subsidized inputs and extension, and the stabilizationof output prices via the establishment of the National Food Buffer StockCompany (NAFCO). The cost of these programs was initially modest atGHS7.5 million per year in 2007 and 2008, but had escalated to 25 percent
² Offsetting to some extent this neglect in public spending has been some off-budget spending by anumber of donors that is channeled directly to partners in the private and NGO sectors.
OUP CORRECTED PROOF – FINAL, 31/7/2019, SPi
112 ’

of MoFA’s budget in 2010, and were on track to increase to about halfMoFA’s total budget by 2020 (Chapter 7).
A key question is whether these public sector interventions will be any moreeffective than past attempts, or whether public sector capabilities are still tooweak and disengaged from the private sector. While there is some preliminaryevidence that these programs are leading to higher yields for some farmers,still growth in average land productivity for the noncocoa subsector was onlymarginally higher during 2009–12 (3.6 percent per annum) than during2001–8 (3.2 percent per annum) (see Chapter 7). There is also little evidencethat the AMSECs are effective in promoting agricultural mechanization andmay if anything be distorting more efficient private sector initiatives(Chapter 9). Recent turmoil in the government’s fertilizer subsidy policy alsoraises doubts about the effectiveness of its interventions. Rather than stayingwith a well-defined objective for the subsidy, the government’s objectives andthe program’s design have changed almost yearly in response to changingpolitical and financial pressures. There have also been serious problems incontaining the total cost of the subsidy (see Chapter 7), and problems imple-menting the program in ways that ensure dealers are able to import requiredamounts of fertilizer each year and that farmers receive their fertilizer in timefor each crop season (Resnick and Mather 2016).
In short, there is little evidence to suggest that proactive governmentpolicies and investments in agriculture and along value chains have been amajor driver of agricultural growth in Ghana since the economic reforms,other than in the cocoa subsector. However, by creating and sustaining afavorable enabling environment and improved terms of trade for agriculture,the government has encouraged farmers and other private sector players toinvest in agriculture and along value chains, leading to sustained agriculturalgrowth and gains in labor productivity.
4.2.2 Population Pressure on the Land Base
The rural population has grown steadily over the years, adding to the popu-lation pressure on the land base, and an 18 percent decline over 1981–2013 inthe available agricultural land area per rural person (Table 4.16). However,because more land has been brought into crop production by clearing virginland and reducing the length of fallow periods, the arable land area grewfast enough to enable the arable land area per rural person to increase by52 percent over 1981–2013 (Table 4.16). Nearly all this increase occurred
OUP CORRECTED PROOF – FINAL, 31/7/2019, SPi
, , 113

before 1999, with only a 2.7 percent increase since 1999. The most recentcensus data suggests that the rural population size has now peaked. As shownin Chapter 5, there has been considerable spatial variation in these patterns,with much of the rural population growth occurring in the more urbanizedand population dense areas, and much of the arable land expansion occurringin the more sparsely settled rural areas, particularly in the savannah andtransition zones.
Early advocates of induced innovation (Boserup 1965; Ruthenberg 1980)argued that as rural population densities increase, there ought to be increasingfarmer demand for yield-enhancing technologies to raise land productivity.A complication for this theory in Ghana is that it ignores the elastic nature ofthe land constraint, which has contributed to an increase in the cropped area perrural person even as the agricultural land area per rural person has declined(Table 4.16). However, as noted above, these national figures mask importantregional variations, so there could still be pockets of induced innovation,especially in some of the more urbanized areas. There have, for example, beencases of rice intensification in some irrigated areas, but one study suggests theseare driven more by market opportunity and new technology than populationpressure (Takeshima et al. 2013; Otsuka and Larson 2013).
Nin-Pratt and McBride (2014) analyzed the relationship between popula-tion density and the purchase of modern inputs and the value of output/ha indifferent ecological zones in Ghana, using GLSS5 data. They focused on the30 percent most efficient farmers in the sample as measured through a dataenvelop analysis (DEA), on the grounds that the more efficient farmers are themost likely ones to be adopting modern inputs in response to any changes infactor prices. They found no consistent relationships in the coastal, forest, and
Table 4.16. Changes in rural population density, 1991–2013
Agriculturalarea (m ha)
Arablearea(m ha)
Ruralpopulation(m)
Agriculturalland/ruralperson (ha)
Arableland/ruralperson (ha)
1981 12.00 1.90 7.628 1.57 0.251991 12.72 2.84 9.452 1.34 0.301999 14.18 3.85 10.445 1.36 0.372013 15.70 4.70 12.244 1.28 0.38
Percent change1981–1999 18.17 102.63 36.93 –13.38 48.001999–2013 10.72 22.08 17.22 –5.89 2.701981–2013 30.83 147.37 60.51 –18.47 52.00
Source: FAOSTAT.
OUP CORRECTED PROOF – FINAL, 31/7/2019, SPi
114 ’
savannah zones to support the induced innovation theory, except for someincrease in hired labor costs and value of output/ha in the top two populationdensity deciles of the forest zone (which may reflect an emerging land con-straint). This analysis has now been updated using GLSS6 data, and the resultsfor the forest and savannah zones are shown in Figures 4.3a and 4.3b.³ Wereport results for the full GLSS6 sample as well as the 25 percent most efficientand inefficient farmers using the DEA approach. Again, there are few system-atic relationships between input use and population density, and whereas theinduced innovation theory would predict that the value of production/hashould increase as the population density increases, the reality is the reverse.Limiting the analysis to the more efficient farmers does not make muchdifference.
4.2.3 Urbanization
If proactive government policies and increasing population density do notadequately explain past patterns of agricultural growth in Ghana, then whatdoes? We explore a third hypothesis that attributes an important part ofGhana’s agricultural success to the impact of rapid urbanization. Chapter 5examines this hypothesis in detail for Ghana, and finds that urbanization hasled many rural households to move into nonfarm occupations as their primaryjobs, with a corresponding decline in the share of households that dependprimarily on agriculture. Not surprisingly, this shift into nonfarm occupationsis positively correlated with the degree of urbanization of a district and theproximity to large urban centers. Chapter 5 also finds that farming in the mosturbanized districts is increasingly undertaken by small-scale units, often on apart-time basis. On the other hand, in the agriculturally important northwhere there are less nonfarm job opportunities, there has been a morepronounced trend towards a larger share of medium-sized farms. Finally,Chapter 5 finds that there is little evidence that urbanization has led to moreintensive farming practices in terms of the use of modern inputs or choice oftechnology in the more urbanized areas.
Although Chapter 5 finds that there has been substantial uptake of fertil-izers, herbicides, and mechanization in Ghana in recent years, this does notseem to have been driven by urbanization. In fact, the use of fertilizer is greaterin the north of the country than the more urbanized south, and higher
³ The authors are grateful to Alejandro Nin-Pratt for his help in updating this analysis.
OUP CORRECTED PROOF – FINAL, 31/7/2019, SPi
, , 115

Cos
t per
hec
tare
of c
ultiv
ated
land
($)
Cos
t per
hec
tare
of c
ultiv
ated
land
($)
Cos
t per
hec
tare
of c
ultiv
ated
land
($)
Inde
xed
valu
e of p
rodu
ctio
n pe
r hec
tare
of cu
ltiva
ted
land
Inde
xed
valu
e of p
rodu
ctio
n pe
r hec
tare
of c
ultiv
ated
land
Inde
xed
valu
e of p
rodu
ctio
n pe
r hec
tare
of c
ultiv
ated
land
16141210
86420
30
25
20
15
10
5
0
60
50
40
30
20
10
0
120
100
80
60
40
20
0
12
10
8
6
4
2
0
200
150
100
50
0
1 2 3 4 5 6 7 8 9 10
1 2 3 4 5 6 7 8 9 10
Deciles of population density
Deciles of population density
Deciles of population density
AEZ = Forest – Average
Fertilizer HerbicideVOPHired labor
Capital costs
Fertilizer HerbicideVOPHired labor
Capital costs
Fertilizer HerbicideVOPHired labor
Capital costs
AEZ = Forest – 25% least efficient farmers
AEZ = Forest – 25% most efficient farmers
Figure 4.3a. Patterns of intensification against population density in the forestzone comparing full sample with least and most cost-efficient farmersSource: Calculations by Alejandro Nin-Pratt and authors, using GLSS6 data.
OUP CORRECTED PROOF – FINAL, 31/7/2019, SPi
116 ’

Cos
t per
hec
tare
of c
ulti
vate
d la
nd (
$)C
ost p
er h
ecta
re o
f cul
tiva
ted
land
($)
Cos
t per
hec
tare
of c
ulti
vate
d la
nd (
$)
Inde
xed
valu
e of
pro
duct
ion
per
hect
are
of c
ulti
vate
d la
ndIn
dexe
d va
lue
of p
rodu
ctio
n pe
r he
ctar
eof
cul
tiva
ted
land
40353025201510
50
60
50
40
30
20
10
0
100
80
60
40
20
0
140
120
100
80
60
40
20
0
30
25
20
15
10
5
0
1 2 3 4 5 6 7 8 9 10
1 2 3 4 5 6 7 8 9 10
Deciles of population density
Deciles of population density
AEZ = Savannah – Average
AEZ = Savannah – 25% least efficient farmers
Fertilizer Herbicide
VOPHired labor
Capital costs
Fertilizer Herbicide
VOPHired labor
Capital costs
Inde
xed
valu
e of
pro
duct
ion
per
hect
are
of c
ulti
vate
d la
nd
600
500
400
300
200
100
01 2 3 4 5 6 7 8 9 10
Deciles of population density
AEZ = Savannah – 25% least efficient farmers
Fertilizer Herbicide
VOPHired labor
Capital costs
Figure 4.3b. Patterns of intensification against population density in thesavannah zone comparing full sample with least and most cost-efficient farmersSource: Calculations by Alejandro Nin-Pratt and authors, using GLSS6 data.
OUP CORRECTED PROOF – FINAL, 31/7/2019, SPi
, , 117

amongst medium- and large-sized farms than small farms. These patterns areconsistent with the finding from the village narratives in Chapter 6 thatfertilizer is used mainly for offsetting declining soil fertility rather thanintensification. Overall, the evidence suggests that intensification is only takingplace to a limited extent even in areas near urban centers. Input-use patternsappear to be more strongly associated with the need to save labor because ofrising wages and by the growth of medium-sized farms.
4.3 Conclusions
Past patterns of agricultural growth have been associated with an elastic landfrontier that has enabled agricultural production to grow by expanding thecropped area. This was initially achieved by bringing more virgin land intoproduction, but as the land frontier tightened farmers increased their croppedarea by shortening fallow periods, and using fertilizer to compensate for thesoil fertility problems that followed. At the same time, farmers in the transitionand savannah regions have responded to rising labor costs, urbanization, andnew market opportunities, by increasing their farm sizes with the aid ofmechanization and herbicides, and changing their crop mixes to better meetmarket demand. The result has been substantial increases in farm productionand incomes, but more from increases in the cropped area and crop mix thanfrom increased yields. Land productivity has increased only modestly, butlabor productivity has increased substantially in line with wages.
The pattern of transformation has been different in the southern parts of thecountry that have been more affected by rapid urbanization. Here many farmhouseholds have taken advantage of urban-rural linkages to diversify intononagricultural sources of income, and farms have become smaller at theexpense of larger farms. Despite having greater access to urban markets,services, infrastructure and an increasing population pressure on the landbase, there is little evidence of any agricultural intensification leading to higheryields and land productivity in these areas. As in the northern parts of thecountry, the transition has been towards labor-saving farming practices andincreased labor productivity. These livelihood patterns seem likely to be sus-tained into the future as long as the nonagricultural economy, especially inmiddle- and small-sized cities, continues to flourish. There must be pockets ofagricultural intensification, e.g., high-value agriculture near urban centers, butif so they are still at too small a scale to be captured in the level of householdaggregation used in Chapter 5, or indeed in the GLSS household surveys.
OUP CORRECTED PROOF – FINAL, 31/7/2019, SPi
118 ’

Although the agricultural sector has benefited from an enabling policyenvironment that has encouraged farmers to invest in expanding their pro-duction, still the sector has been constrained by low levels of public investmentand a lack of proactive public sector interventions to develop the value chainsfor important export crops (other than cocoa) or import-substituting cropslike rice and tomatoes. Had the government done more to help farmers accessimproved seeds, irrigation, roads, credit, markets, etc., then perhaps therewould have been a greater shift by now to agricultural intensification inGhana, and even faster rates of agricultural growth. Induced innovation ishypothesized to happen as an endogenous response to increasing populationpressure and urbanization, but it can only work if there are intensificationtechnologies available to farmers that are profitable to use, and markets toabsorb their additional production.
The future sustainability of the current patterns of agricultural growth isconstrained by the availability of remaining virgin and fallow land for futureexpansion of the cropped area. As the land frontier runs out, farmers will needto shift towards more intensive modes of production, and options will need toinclude higher-yielding technologies and a greater focus on high-value prod-ucts. The economic viability of these options will depend on governmentpolicies towards agricultural R&D, infrastructure, and value chain interven-tions that condition access to modern inputs and urban markets and theircosts, and trade policies that condition the level of competition farmers mustface in their domestic markets. These policies will need to be cognizant ofthe needs of the changing nature of Ghanaian agriculture. As more smallfarm households are attracted into nonfarm activities, farms become moreconsolidated, rural wages rise, and rural youth become better educated, moreemphasis will be needed on the development of technologies and commercialfarming practices that raise land as well as labor productivity, are attractive toyoung farmers, and meet the needs of Ghana’s increasingly urbanized foodsystem. We return to these issues in Chapter 10.
References
Boserup, E. 1965. The Conditions of Agricultural Growth. New York: AldinePublishing.
Diao, X., F. Cossar, N. Houssou, and S. Kolavali. 2014. “Mechanization in Ghana:Emerging Demand, and the Search for Alternative Supply Models.” Food Policy48: 168–81.
OUP CORRECTED PROOF – FINAL, 31/7/2019, SPi
, , 119

Jayne, T. S., J. Chamberlin, L. Traub et al. 2016. “Africa’s Changing Farm SizeDistribution Patterns: The Rise of Medium-scale Farms.” Agricultural Economics47: 197–214.
Lowder, S. K., J. Skoet, and T. Raney. 2016. “The Number, Size, and DistributionFarms, Smallholder Farms, and Family Farms worldwide.” World Development87: 16–29.
Nin-Pratt, A., and L. McBride. 2014. “Agricultural Intensification in Ghana:Evaluating the Optimist’s Case for a Green Revolution.” Food Policy 28: 153–67.
Otsuka, K., and D. Larson. 2013. An African Green Revolution: Finding Ways toBoost Productivity on Small Farms. Dordrecht: Springer.
Ragasa, C., A. Dankyi, P. Acheampong et al. 2013. “Patterns of Adoption ofImproved Maize technologies in Ghana.” Ghana Strategy Support ProgramWorking Paper (GSSP) No. 35. Washington, DC: IFPRI.
Resnick, Danielle, and David Mather. 2016. “Agricultural Inputs Policy underMacroeconomic Uncertainty: Applying the Kaleidoscope Model to Ghana’sFertilizer Subsidy Programme (2008–2015).” IFPRI Discussion Paper No.01551, Washington, DC: IFPRI.
Ruthenberg, Hans. 1980. Farming Systems in the Tropics. 3rd edition. Oxford:Oxford University Press.
Stads, G.-J. 2016. “Investment in Agricultural Research and Development: AnAccount of Two-speed Growth, Underinvestment, and Volatility,” in J. Lynam,N. Beintema, J. Roseboom et al. (eds), Agricultural Research in Africa: Investingin Future Harvests. Washington, DC: IFPRI, 85–108.
Takeshima, H., K. Jimah, S. Kolavalli et al. 2013. “Dynamics of Transformation:Insights from an Exploratory Review of Rice Farming in the Kpong IrrigationProject.” IFPRI Discussion Paper No. 01272. Washington, DC: IFPRI.
Timmer, M. P., G. J. de Vries, and K. de Vries. 2015. “Patterns of StructuralChange in Developing Countries,” in J. Weiss and M. Tribe (eds), Handbook ofIndustry and Development. London: Routledge, 65–83.
OUP CORRECTED PROOF – FINAL, 31/7/2019, SPi
120 ’

5Urbanization and its Impact onGhana’s Rural Transformation
Xinshen Diao, Eduardo Magalhaes, and Jed Silver
5.1 Introduction
Ghana has rapidly urbanized in recent years and more than half the totalpopulation now lives in urban areas. However, urbanization in Ghana has notfollowed the typical historical pathway for the economic transformation of anagrarian country. As discussed in earlier chapters, urbanization in Ghana hasnot been driven by an agricultural revolution and the development of a labor-intensive manufacturing sector but by rapid growth in the services sector.Moreover, urbanization has involved growth in medium and small towns aswell as large cities, perhaps bringing more local opportunities to rural-basedhouseholds. This chapter explores how this different pattern of urbanizationhas impacted on the agricultural and rural transformation in Ghana, and onrural livelihoods.
The chapter addresses three broad questions. First, are patterns of ruralemployment in Ghana changing with urbanization and are those changesrelated in any systematic way with proximity to urban centers of differentsizes? Second, does proximity to different-sized urban centers have any impacton patterns of agricultural intensification? Finally, what are the impacts onhousehold livelihoods and welfare outcomes? To answer these questions theanalysis goes beyond the usual agroecological breakdown (Chapter 4) and usesa spatial typology of rural areas based on work by Berdegue et al. (2015) andothers in Latin America.
The rest of the chapter is structured as follows: Section 5.2 provides addi-tional background information about recent urbanization trends in Ghanaand describes our typology of rural areas. Section 5.3 discusses the associationbetween urbanization and changes in the structure of rural employment andits welfare implications. Section 5.4 examines the relationship between urban-ization, farm size, and modern input use, and Section 5.5 concludes.
OUP CORRECTED PROOF – FINAL, 30/7/2019, SPi

5.2 Urbanization Trends in Ghana
Ghana has always been relatively urbanized compared to other Africancountries. This is partially due to the post-Independence expansion of thecocoa sector (Jedwab and Moradi 2011), and the promotion of state-ownedindustries in the late 1960s and early 1970s (Ackah, Adjasi, and Turkson2014). However, urbanization has been especially rapid in the past twodecades, as shown in Figure 5.1. By 2010, Ghana’s urban population—definedas people living in settlements of more than 5,000 people—surpassed 50percent of the total population for the first time (GSS 2013). Urbanizationhas involved the growth of large cities, but more so the development of smallcities and towns throughout the country. There has been substantial migrationof workers from rural to urban areas, alongside substantial employmentgrowth in the rural nonfarm economy, leading to a decline in the share ofworkers remaining in agriculture (Figure 5.2).
5.2.1 A Spatial Typology of Rural Areas
National-level statistics mask considerable spatial heterogeneity within Ghana,which we capture through use of a spatial typology of rural areas. Specifically,
0
10
20
30
40
50
60
0.0
0.5
1.0
1.5
2.0
2.5
3.0
3.5
4.0
4.5
5.0
1960–70 1970–84 1984–2000 2000–10
% o
f tot
al p
opul
atio
n
Ann
ualiz
ed g
row
th ra
te (%
)
Rural UrbanTotal Urban pop share
Figure 5.1. Annual growth rate in the population between census years, andurban population share in census years, 1960–2010Note: Urbanpopulation share is for the census years,which is the ending year of eachperiod along the x-axis.
Source: Authors’ calculation using data from the five rounds of censuses (GSS 2013).
OUP CORRECTED PROOF – FINAL, 30/7/2019, SPi
122 ’ ’

we take districts as our primary spatial unit, and classify districts by the size oftheir largest city. Similar studies have found correlations between the size of acity and its impact on the surrounding rural areas (e.g., Berdegue et al. 2015;Deichmann, Shilpi, and Vakis 2008). An alternative approach would be tocapture the effect of proximity to cities using a gravity model as done byBinswanger-Mkhize et al. (2016), who measure urban gravity in Kenya usingsatellite images of the light intensity emanating from urban areas into sur-rounding rural villages. However, this approach requires data that is notavailable for Ghana.
Ghana has a well-defined south–north divide, which, amongst other things,reflects spatial differences in agroecological conditions, population density,rural infrastructure, and levels of urbanization. As a first step in our typology,we therefore differentiate between two major regions based on both the north–south divide and agroecological conditions. We distinguish between the agri-culturally dominant north, comprising the regions of Brong Ahafo, Northern,Upper East, and Upper West, which we call the North. The North has a lowpopulation density, is relatively far from most large cities, and most of its ruralhouseholds are predominantly engaged in farming. The North also corres-ponds closely to the savanna and transition agroecological zones, and hencehas its own well-defined farming systems (Chapter 4). The remaining regions:Ashanti, Central, Eastern, Greater Accra, Volta, andWestern, are then grouped
0
10
20
30
40
50
60
70
0.0
1.0
2.0
3.0
4.0
5.0
6.0
1960–70 1970–84 1984–2000 2000–10
% o
f tot
al em
ploy
men
t
Ann
ualiz
ed g
row
th ra
te (%
)TotalAgriculture
Ag em shareNon agriculture
Figure 5.2. Annual growth rate in employment between census years andagricultural share of total employment in census years, 1960–2010Note: Agricultural employment share is for the census years, which is the ending year of each periodalong the x-axis.
Source: Authors’ calculation using data from the five rounds of censuses (GSS 2013).
OUP CORRECTED PROOF – FINAL, 30/7/2019, SPi
, , 123

into the South, which is less dependent on agriculture, is more urbanized anddensely populated, and has a well-developed rural nonfarm economy. TheSouth corresponds closely to the forest and coastal agroecological zones,which also have their own well-defined farming systems (Chapter 4).
Taking districts as our primary spatial unit using 2010 census data, eachof the two regions is subdivided into four groups based on the proximity ofeach district to cities of different sizes. Big city districts are those that containparts of Accra and Kumasi, and hence are only in the South, 2nd-tier citydistricts are those with cities of between 100,000 and 500,000 people, whichare located in both the North and South, 3rd-tier city districts are those withcities containing between 40,000 and 100,000 people, and non-city districtsare those with no settlement of over 40,000 people. This leads to a total ofseven groups of districts in Ghana, three in the North and four in the South.These are mapped in Figure 5.3.
Although the South covers a much smaller land area than the North, the2010 census shows that 73 percent of the total population and 63 percent ofthe rural population live in the South. Moreover, the majority of the totalpopulation lives in districts with cities of at least 40,000 people in both regions;40 percent of the rural population also lives in such districts.
Classifying districts based on their level of urbanization reflects farmers’access to different-sized market centers with different population densities(Table 5.1). As such, more recent interpretations of the induced innovationtheory (Pingali et al. 1987; Binswanger and McIntire 1987; McIntire et al.1992), which emphasize the role of market access as well as populationpressure (resulting in decreased access to land) in driving agricultural intensi-fication, suggest that farmers in more urbanized areas will be more likely toadopt agricultural intensification practices and technologies.
5.3 Changing Patterns of Rural Employmentand Welfare Outcomes
5.3.1 Changes in Employment
We now examine changes in the structure of rural employment across theseven district groups. Unlike other studies, we focus on employment atthe household rather than individual level in order to distinguish betweenchanging employment patterns that involve entire households shifting sectors,and farm household diversification that involves employment of membersin multiple sectors including agriculture. We classify rural households into
OUP CORRECTED PROOF – FINAL, 30/7/2019, SPi
124 ’ ’

three types based on members’ reported primary occupations in the census orGLSS data: (1) agricultural households that have members whose primaryemployment is in agriculture and that have no family members primarilyengaged in non-agriculture—called agriculture-only households; (2) nonagri-cultural households that have members whose primary employment is in
Tamale Yendi
Tarkwa
Kintampo
Berekum
Domaa AhenkroSunyani
Bechem
Techiman
Mamponteng Kumasi
Kuntanase
Obuase
Nkawkaw(Nkokoo)
New AbirimKibi
AkimOda
Koforidua Nsawam
AccraCapeCoast
(Oguaa)
Takoradi
Ada FoahSogakope Keta
Adidome Denu
Ho
KpanduHohoe
BolgatangaBawku
Wa
40,000 – 100,000100,001 – 500,000> 500,000
4 district types1
234
7 district groups
2nd-tier city districts, North3rd-tier city districts, NorthNo city districts, NorthBig city districts, South2nd-tier city districts, South3rd-tier city districts, South
No city districts, South
Tamale
Winneba
Amanfro GbaweTema
Yendi
Sekondi
Tarkwa
Tamale Yendi
Tarkwa
Kintampo
BerekumSunyani
Bechem
Techiman
Mamponteng Kumasi
Kuntanase
Obuase
Nkawkaw(Nkokoo)
New AbirimKibi
AkimOda
Koforidua Nsawam
AccraCapeCoast
(Oguaa)
Takoradi
Ada FoahSogakope Keta
Adidome Denu
Ho
KpanduHohoe
BolgatangaBawku
Wa
Towns
Tamale
N
Winneba
Amanfro GbaweTema
Yendi
Sekondi
Tarkwa
Domaa Ahenkro
AgonaAgonaSwedruSwedruAgonaSwedru
Figure 5.3. Ghana map showing the different types of districtsSource: The map was created by Mekamu Kedir Jemal (IFPRI) who combines 2010 Census data withother spatial data including cities and road networks. Spatial data of cities, towns and road network arefrom University of Ghana Remote Sensing & Geographic Info Systems website (http://www.ug.edu.gh/rsgislab/rs-gis-geonode-app.html).
OUP CORRECTED PROOF – FINAL, 30/7/2019, SPi
, , 125

non-agriculture and having no members whose primary employment is inagriculture—called non-agriculture-only households; and (3) households thathave members with primary employment in both agriculture and non-agri-culture—called mixed households. We ignore a small percentage of ruralhouseholds that do not report any primary employment. Table 5.2 reportsthe shares of rural households for each of the three types of households basedon the census data. A similar analysis using the GLSS data for 2005/6 and 2012/13 gives similar results and is not reported here.
In both the South and North, rural households’ exit from agriculture hasbeen highly correlated with proximity to cities and their population sizes. Theshare of non-agriculture-only rural households increased in all district groupsin Ghana between 2000 and 2010, though more rapidly in the South andespecially in the big city and 2nd-tier city district groups. This was mirrored byan almost equivalent pattern of decline in the shares of agriculture-only ruralhouseholds in the South and the district group with 2nd-tier cities in theNorth. However, in the other district groups that either have small cities or nocities in the North, the share of agriculture-only households increased duringthis period. Thus, there has been a sizeable movement of household fromagriculture to the rural nonfarm economy in the South and in districts withsecondary cities in the North. Despite this exit, the share of rural agriculture-only households remains high in district groups without big and secondarycities in both the North and South, averaging 46 percent even in the South in2010. Only in the areas with relatively larger cities did non-agriculture-onlyhouseholds dominate in the rural areas in 2010.
Table 5.1. Population densities by district group, 2000 and 2010 (people/km²)
District Group 2000 2010
Total Rural Urban Total Rural Urban
North:2nd-tier city districts 210 72 138 257 73 1843rd-tier city districts 57 40 17 69 45 24No city districts 28 23 5 37 28 9North total 38 27 10 48 33 16
South:Big city districts 2,410 127 2,283 3,577 129 3,4482nd-tier city districts 753 133 620 1,023 119 9043rd-tier city districts 136 89 48 177 100 77No city districts 71 56 15 84 62 22South total 135 68 68 178 75 102
Source: Authors’ calculation using Population and Housing Census 2000 and 2010.
OUP CORRECTED PROOF – FINAL, 30/7/2019, SPi
126 ’ ’

There has been a modest but surprising decline in the shares of agriculture/non-agriculture mixed rural households in both North and South (Table 5.2).Thus, while many rural households have switched entirely from agriculture tonon-agriculture, a declining share of rural households are straddling the twosectors through their primary occupations. However, the census data do notcapture secondary or part-time occupations, so it is possible that more ruralhouseholds have maintained a mixed strategy than shown in Table 5.2, but on apart-time basis.
Some insights about this can be gained from the GLSS data. Figure 5.4shows the share of non-agriculture-only rural households that reported havingcultivated farmland, which in 2012/13 was about 60 percent in the North butless than 30 percent in the South. The size of the land area held by suchhouseholds is small, mostly less than 2 hectares. However, it does seem thatmany households whose members’ primary occupations lie outside agricultureare still engaged in farming as a secondary or part-time occupation.
Table 5.2. Distribution of rural households by agricultural, nonagricultural, andmixed occupations across district groups (each type of district’s total ruralhouseholds = 100)
District group North South
Agri. only Non-agri.only
Mixed Agri.only
Non-agri.only
Mixed
Census 2000Big city districts 27.7 50.3 12.32nd-tier city districts 53.8 18.2 20.3 38.3 32.4 14.93rd-tier city districts 58.2 11.2 19.1 50.1 21.1 18.8Non-city districts 62.6 8.2 19.0 61.5 13.9 17.9Regional total 60.9 9.7 19.1 55.3 18.4 18.0
Census 2010Big city districts 9.0 74.1 6.62nd-tier city districts 37.7 34.9 20.4 14.9 59.7 10.23rd-tier city districts 63.7 14.5 17.8 39.4 34.1 17.4Non-city districts 67.5 10.5 18.6 53.4 23.0 17.0Regional total 64.7 13.0 18.5 45.6 29.7 16.7
Difference in 2000–10Big city districts –18.7 23.8 –5.82nd-tier city districts –16.1 16.6 0.0 –23.4 27.4 –4.73rd-tier city districts 5.5 3.2 –1.3 –10.7 12.9 –1.4Non-city districts 4.9 2.3 –0.4 –8.0 9.1 –0.9Regional total 3.8 3.3 –0.6 –9.6 11.3 –1.3
Note: the households that did not report any primary job are not reported in the table; therefore, thesum of the three groups does not equal 100.
Source: Authors calculation using data from the 2000 and 2010 Census (GSS 2003, 2013).
OUP CORRECTED PROOF – FINAL, 30/7/2019, SPi
, , 127

Additionally, some rural households classified as agriculture-only alsoreport having nonfarm household enterprises, though these are likely to beseasonal or part-time activities. This phenomenon was more prevalent in therelatively less urbanized districts, though its importance fell between 2005/6and 2012/13 (GSS 2008; 2014—not pictured in Figure 5.4).
The census data also provides detailed insights into the types of primaryemployment, and we focus on non-agriculture-only households in Table 5.3for such information. By far the largest share of nonagricultural employmentin the rural areas is in informal activities, and this is true for all district groupsin both census years. Informal trade is more prevalent than informal manu-facturing, and more so in 2010 than in 2000. Between the North and Southinformal manufacturing is also more prevalent in less urbanized areas in theNorth, as much of it involves small-scale food processing for the local market.The growing importance of informal trade suggests increasing integration ofrural areas with urban areas and the broader economy (Haggblade, Hazell, andBrown 1989).
5.3.2 Changes in Welfare Outcomes
It is to be expected that the changes in household employment and livelihoodpatterns associated with urbanization will also have impacted on householdwelfare. We know from earlier chapters that average per capita incomes have
0102030405060708090100
0102030405060708090
100
2nd-tiercity
districts
3rd-tiercity
districts
No citydistricts
Northtotal
Big citydistricts
2nd-tiercity
districts
3rd-tiercity
districts
No citydistricts
Southtotal
North
< 2h
a hh
of ru
ral n
on-a
g hh
with
land
(%)
No-
land
hh
of ru
ral n
on-a
g hh
(%)
South
No-land, 2005Less than 2ha, 2005
No-land, 2012Less than 2ha, 2012
Figure 5.4. Shares of no-land households and households with cultivated landless than 2 ha by types of district groupsSource: Authors’ calculations using data from GLSS5 for 2005 and GLSS6 for 2012 (GSS 2008, 2014).
OUP CORRECTED PROOF – FINAL, 30/7/2019, SPi
128 ’ ’

grown significantly in Ghana with the economic transformation, that thenational poverty rate has fallen, and that a variety of other social welfareindicators (e.g., literacy, mortality rates) have also improved (Chapters 2and 4). But how have these welfare gains been spatially distributed, andhow do they relate to urbanization? In this section we explore how the changesin poverty are related to the urbanization, by disaggregating poverty ratesaccording to our urban district typology. Table 5.4 displays poverty rates foragriculture-only and non-agriculture-only rural households as well as for total
Table 5.3. Types of primary employment amongst non-agriculture-onlyhouseholds, by district type, 2000 and 2010
% of rural nonagricultural households with family membersengaging in:
Formalonly
Inf.mfgonly
Inf.tradeonly
Inf. mfg& trade
Inf.others
Formal &informalcombined
2000
North:2nd-tier city districts 30.1 10.5 21.6 4.3 9.7 23.73rd-tier city districts 16.1 27.5 14.0 5.0 18.0 19.3No city districts 21.7 25.6 18.7 2.7 15.6 15.7North total 21.0 24.4 17.6 3.6 15.6 17.8
South:Big city districts 27.7 6.3 15.5 2.9 13.0 34.52nd-tier city districts 24.8 10.1 22.7 3.3 12.0 27.13rd-tier city districts 19.4 16.2 23.6 4.9 13.7 22.1No city districts 23.6 16.8 22.1 4.1 12.5 20.9South total 22.1 15.3 22.2 4.3 13.1 22.9
National total 21.9 16.9 21.4 4.2 13.5 22.0
2010
North:2nd-tier city districts 29.2 5.4 20.8 4.9 9.7 30.03rd-tier city districts 24.0 14.7 21.2 4.1 14.5 21.5No city districts 22.9 19.0 22.0 4.2 11.4 20.4North total 24.3 15.6 21.6 4.3 12.0 22.3
South:Big city districts 24.0 6.0 19.5 3.0 10.9 36.62nd-tier city districts 25.4 8.8 20.0 3.8 10.1 31.93rd-tier city districts 20.5 14.5 24.1 4.2 12.0 24.5No city districts 23.6 13.3 25.3 3.8 11.6 22.4South total 22.3 13.2 24.1 3.9 11.7 24.8
National total 22.6 13.5 23.7 4.0 11.7 24.4
Source: Authors’ calculation using data of Census 2000 and 2010 (GSS 2003; 2013).
OUP CORRECTED PROOF – FINAL, 30/7/2019, SPi
, , 129
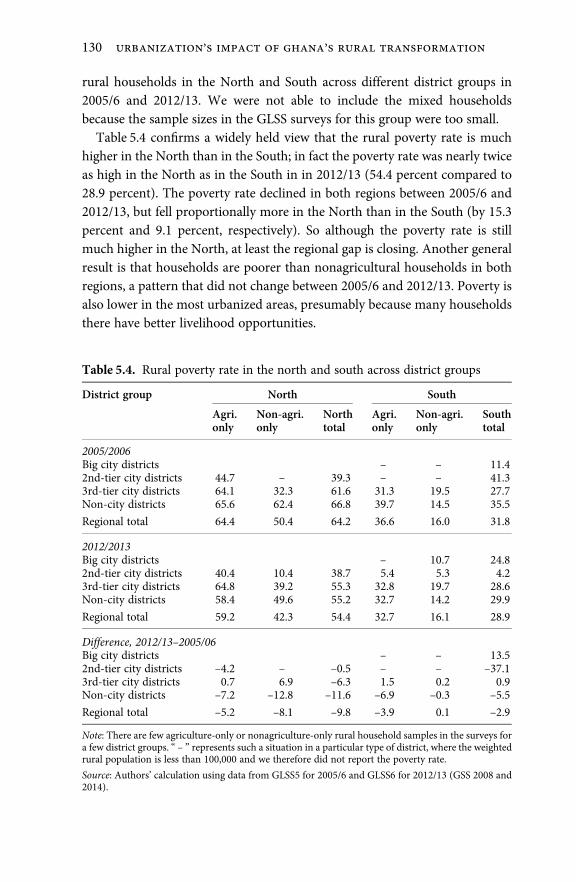
rural households in the North and South across different district groups in2005/6 and 2012/13. We were not able to include the mixed householdsbecause the sample sizes in the GLSS surveys for this group were too small.
Table 5.4 confirms a widely held view that the rural poverty rate is muchhigher in the North than in the South; in fact the poverty rate was nearly twiceas high in the North as in the South in in 2012/13 (54.4 percent compared to28.9 percent). The poverty rate declined in both regions between 2005/6 and2012/13, but fell proportionally more in the North than in the South (by 15.3percent and 9.1 percent, respectively). So although the poverty rate is stillmuch higher in the North, at least the regional gap is closing. Another generalresult is that households are poorer than nonagricultural households in bothregions, a pattern that did not change between 2005/6 and 2012/13. Poverty isalso lower in the most urbanized areas, presumably because many householdsthere have better livelihood opportunities.
Table 5.4. Rural poverty rate in the north and south across district groups
District group North South
Agri.only
Non-agri.only
Northtotal
Agri.only
Non-agri.only
Southtotal
2005/2006Big city districts – – 11.42nd-tier city districts 44.7 – 39.3 – – 41.33rd-tier city districts 64.1 32.3 61.6 31.3 19.5 27.7Non-city districts 65.6 62.4 66.8 39.7 14.5 35.5
Regional total 64.4 50.4 64.2 36.6 16.0 31.8
2012/2013Big city districts – 10.7 24.82nd-tier city districts 40.4 10.4 38.7 5.4 5.3 4.23rd-tier city districts 64.8 39.2 55.3 32.8 19.7 28.6Non-city districts 58.4 49.6 55.2 32.7 14.2 29.9
Regional total 59.2 42.3 54.4 32.7 16.1 28.9
Difference, 2012/13–2005/06Big city districts – – 13.52nd-tier city districts –4.2 – –0.5 – – –37.13rd-tier city districts 0.7 6.9 –6.3 1.5 0.2 0.9Non-city districts –7.2 –12.8 –11.6 –6.9 –0.3 –5.5
Regional total –5.2 –8.1 –9.8 –3.9 0.1 –2.9
Note: There are few agriculture-only or nonagriculture-only rural household samples in the surveys fora few district groups. “ – ” represents such a situation in a particular type of district, where the weightedrural population is less than 100,000 and we therefore did not report the poverty rate.
Source: Authors’ calculation using data from GLSS5 for 2005/6 and GLSS6 for 2012/13 (GSS 2008 and2014).
OUP CORRECTED PROOF – FINAL, 30/7/2019, SPi
130 ’ ’

Looking at the changes between 2005/6 and 2012/13, the biggest decline inthe North was in the rural districts without cities, where it fell proportionallymore among nonagricultural than agricultural households. It would seem thatthe growth in nonfarm employment opportunities for rural households hasbeen a step out of poverty for many. In the South the biggest poverty reductionwas in districts with 2nd-tier cities, whilst poverty worsened in districts withbig cities. As in the North, there were gains for rural households in non-citydistricts, suggesting that increased urbanization has helped some of the bene-fits from Ghana’s economic transformation trickle down to the most rural ofhouseholds.
5.4 Urbanization and Agricultural Intensification
5.4.1 Farm Size Distribution
Along with changes in occupation patterns, there have also been changes inthe distribution of land amongst rural households (Tables 5.5a and 5.5b).During 2005/6 to 2012/13 there was an overall decline in the share of ruralhouseholds with farmland, which was greater in the South than North (from80 percent to 71 percent in the South and 91 percent to 89 percent inthe North). The decline was most marked in Southern big city districts(from 42 percent to 12 percent). However, despite these changes, the majorityof rural households still held cultivated land in 2012/13 in all types of districtsexcept big city districts (Table 5.5b).
Nationally, the share of small farms with less than 2 ha declined from 53.3percent in 2005/6 to 49.3 percent in 2012/13. This was offset by some increasein the shares of medium-sized farms (2–5 ha and 5–20 ha), while the share offarms larger than 20 ha remained at about 1 percent. Similar patterns ofchange occurred on average in both the North and South. However, therewas a reverse trend in the most urbanized districts of the South, where theshares of small farms increased from 77 percent to 90 percent in big citydistricts and from 52.6 percent to 61.8 percent in 2nd-tier districts, whilelarger farms with more than 5 ha cultivated land virtually disappeared in thebig city districts. Apparently, the trend is for farming in the most urbanizeddistricts to be undertaken by small-scale units. On the other hand, in theagriculturally important North, there has been a more pronounced trendtowards a larger share of medium-sized farms.
However, these changes in the distribution of rural households by farm sizeseem not to have affected the average farm sizes of small, medium, and large
OUP CORRECTED PROOF – FINAL, 30/7/2019, SPi
, , 131

Table 5.5a. Shares of rural households by farm size and district group, 2005/6
District Group Percentlandlesshouse-holds
Percent landed households by farmsize
Percentlandedhouseholds
< 2 ha 2–5 ha 5–20 ha > 20 ha
North2nd-tier city districts 27.0 55.5 39.0 5.6 – 73.03rd-tier city districts 7.9 49.6 28.9 17.8 3.8 92.1No city districts 8.1 40.7 42.0 14.3 3.1 91.9Total North 9.0 43.9 38.0 16.2 3.2 91.0
SouthBig city districts 57.9 77.2 16.2 3.1 3.5 42.12nd-tier city districts 29.4 52.6 34.6 12.7 – 70.63rd-tier city districts 22.6 65.9 25.8 7.6 0.7 77.4No city districts 16.5 52.0 31.1 15.1 1.2 83.5Total South 20.2 58.0 28.8 11.8 1.3 79.8
National total 16.8 53.3 31.8 12.9 1.9 83.2
Note: Land is defined as cultivated farmland.
Source: Authors’ calculation using data of GLSS6 (GSS 2014).
Table 5.5b. Shares of rural households by farm size and district group, 2012/13
District group Percent landlesshouseholds
Percent landed households byfarm size
Percent landedhouseholds
< 2 ha 2–5 ha 5–20 ha > 20 ha
North2nd-tier city districts 22.8 40.5 37.7 20.6 1.2 77.23rd-tier city districts 7.7 49.3 35.3 13.1 2.3 92.3No city districts 10.2 32.5 44.4 21.7 1.4 89.8Total North 10.3 37.3 41.7 19.4 1.7 89.7
SouthBig city districts 87.8 90.3 9.7 – – 12.22nd-tier city districts 42.7 61.8 24.5 12.9 0.8 57.33rd-tier city districts 35.0 61.6 29.2 8.4 0.8 65.0No city districts 22.3 52.2 34.5 13.1 0.2 77.7Total South 28.8 55.8 32.3 11.4 0.4 71.2
National total 23.2 49.3 35.6 14.2 0.9 76.8
Note: Land is defined as cultivated farmland.
Source: Authors’ calculation using data of GLSS6 (GSS 2014).
OUP CORRECTED PROOF – FINAL, 30/7/2019, SPi
132 ’ ’
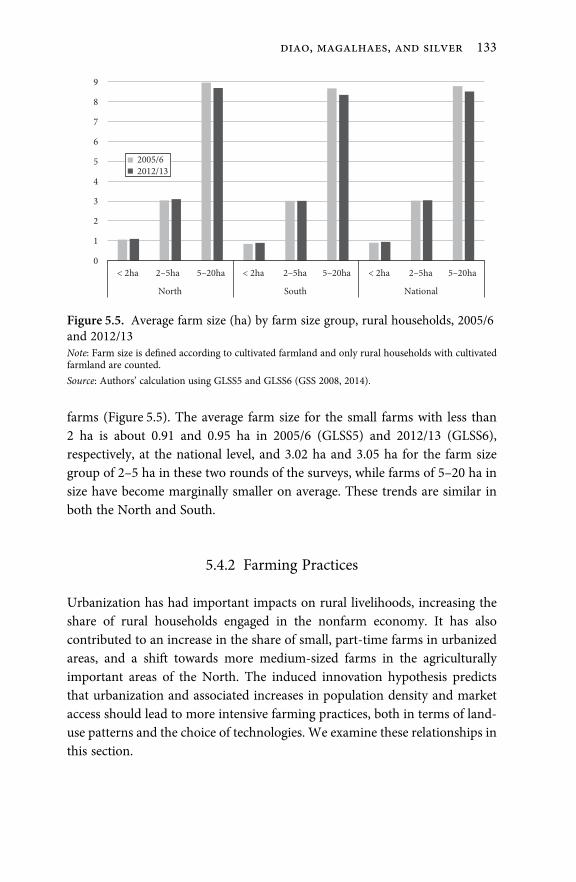
farms (Figure 5.5). The average farm size for the small farms with less than2 ha is about 0.91 and 0.95 ha in 2005/6 (GLSS5) and 2012/13 (GLSS6),respectively, at the national level, and 3.02 ha and 3.05 ha for the farm sizegroup of 2–5 ha in these two rounds of the surveys, while farms of 5–20 ha insize have become marginally smaller on average. These trends are similar inboth the North and South.
5.4.2 Farming Practices
Urbanization has had important impacts on rural livelihoods, increasing theshare of rural households engaged in the nonfarm economy. It has alsocontributed to an increase in the share of small, part-time farms in urbanizedareas, and a shift towards more medium-sized farms in the agriculturallyimportant areas of the North. The induced innovation hypothesis predictsthat urbanization and associated increases in population density and marketaccess should lead to more intensive farming practices, both in terms of land-use patterns and the choice of technologies. We examine these relationships inthis section.
0
1
2
3
4
5
6
7
8
9
< 2ha 2–5ha 5–20ha < 2ha 2–5ha 5–20ha < 2ha 2–5ha 5–20ha
North South National
2005/62012/13
Figure 5.5. Average farm size (ha) by farm size group, rural households, 2005/6and 2012/13Note: Farm size is defined according to cultivated farmland and only rural households with cultivatedfarmland are counted.
Source: Authors’ calculation using GLSS5 and GLSS6 (GSS 2008, 2014).
OUP CORRECTED PROOF – FINAL, 30/7/2019, SPi
, , 133

Fertilizer use, particularly inorganic fertilizer, has increased significantlyin Ghana from 3.7 kg NPK/ha arable land in 2002 to 35.8 kg/ha in 2013(Chapter 4). Still, only 45 percent of farmers were using either organic orinorganic fertilizer in 2012/13 (GLSS6), and the share of farmers usingfertilizer was nearly twice as high in the less-urbanized North than in themore-urbanized South (Table 5.6), which can be explained by problems withdeclining soil fertility in the North (Chapters 4 and 6) rather than urbaniza-tion. Table 5.6 also shows an inverse relationship between the degree ofurbanization of a district and the share of farmers using fertilizer in boththe North and South, i.e., the lower the level of urbanization for a districtgroup, the higher percentage of farmers that use fertilizer. Thus, rather thanany pattern of induced fertilizer adoption from urbanization, these datasuggest that the main drivers of increased fertilizer use may have beena) the need to maintain soil fertility and crop yields in the North as fallowperiods were shortened, and b) possibly the introduction the government’sfertilizer subsidy policy in 2007/8.
Herbicide and insecticide use in Ghana has also increased sharply in recentyears, from less than 2 percent of all farm households in 1998 to about 55 percentin 2013 (Grabowski and Jayne 2016). Nationally, about 70 percent of farmhouseholds used herbicides or/and insecticides in 2012/13 (GLSS6), andwith the big city district group in the South as an exception (possibly due tofew observations covered by the survey), the use of herbicides/insecticides ismore evenly distributed between the North and South than is fertilizer use(Table 5.7). In both the North and South, small farms are less likely to useherbicides or insecticides than medium-sized or large farms (with
Table 5.6. Share of rural farm households using organic and inorganic fertilizer,2012/13
Type district < 2 ha 2–5 ha 5–20 ha > 20 ha Total
North 2nd-tier city districts 38.7 59.1 70.3 82.0 53.43rd-tier city districts 55.5 67.2 63.9 84.5 61.4No city districts 48.3 69.0 73.1 93.5 63.5Total North 50.3 68.2 71.3 89.8 62.4
South Big city districts 3.6 3.32nd-tier city districts 15.7 36.4 50.4 0.0 25.13rd-tier city districts 23.3 42.3 58.6 48.7 32.0No city districts 28.6 47.6 56.1 29.2 38.8Total South 26.2 45.7 56.6 40.4 36.1
National Total 32.7 55.0 63.7 73.7 45.4
Source: Authors calculations using GLSS6.
OUP CORRECTED PROOF – FINAL, 30/7/2019, SPi
134 ’ ’

exceptions for larger-than-20-ha size group in the South, (again possiblydue to few observations in the survey). However, there is no consistentpattern of increased use of herbicides with levels of urbanization within theNorth or South, suggesting that urbanization is not inducing greater use.
Mechanization. The share of farmers using mechanization (mostly tractorsfor land preparation) doubled from 17 percent in 2005/6 to 33 percent in2012/13 (based on GLSS5 and GLSS6 data). About 40 percent of farm house-holds used mechanization in 2012/13 in the North, compared to less than 30percent in the South (Table 5.8). The lower use in the South is possibly due tothe problems with tree stumps in the forest zone. The share of farm house-holds using machinery also increased with farm size in both the North and
Table 5.7. Share of rural farm households using herbicides or insecticides, 2012/13
Type district < 2 ha 2–5 ha 5–20 ha > 20 ha Total
North 2nd-tier city districts 85.6 93.8 78.5 100.0 87.43rd-tier city districts 43.1 73.3 88.1 96.1 60.9No city districts 59.0 81.4 92.4 93.8 76.7Total North 55.0 80.2 90.9 94.8 73.1
South Big city districts 7.3 6.62nd-tier city districts 56.3 62.9 94.1 62.43rd-tier city districts 59.1 79.1 84.1 69.5 67.1No city districts 63.4 78.9 80.8 50.9 71.0Total South 61.5 78.7 82.0 60.7 69.4
National 59.6 79.3 86.3 83.3 70.6
Source: Authors’ calculations using GLSS6 data.
Table 5.8. Share of rural households using mechanization, 2012/13
< 2 ha 2–5 ha 5–20 ha > 20 ha Total
North 2nd-tier city districts 42.3 54.2 62.3 100.0 51.63rd-tier city districts 20.5 43.6 51.9 96.1 34.5No city districts 26.5 40.1 59.4 66.6 40.3Total North 25.3 41.6 58.2 78.6 39.3
South Big city districts 28.8 26.02nd-tier city districts 17.1 0.0 0.0 0.0 10.63rd-tier city districts 23.1 36.9 50.4 69.5 29.8No city districts 19.2 35.1 50.5 51.4 28.9Total South 20.7 35.1 49.3 60.9 28.8
National 22.0 37.8 53.6 72.8 32.6
Source: Authors’ calculations using GLSS6.
OUP CORRECTED PROOF – FINAL, 30/7/2019, SPi
, , 135

South, but more so in the agriculturally important North. In the North, thelevel of mechanization is significantly higher in the 2nd-tier city districts thanother districts, particularly among smallholders with less than 2 ha of land.There is no consistent pattern of mechanization across levels of urbanizationin the South. The factors driving mechanization are explored more fullyin Chapter 9.
5.4.3 Regression Analysis of the Links betweenUrbanization and Modern Input Adoption
So far, we have looked at bivariate relationships between urbanization anduse of modern inputs. Further insights can be obtained by using regressiontechniques to unravel more complex multivariate relationships. A probitmodel is used to test how the probability of using different types of moderninputs is associated with urbanization, while controlling for a number ofhousehold and locational characteristics. The latter included farm size group,type of household head (youth, gender, level of education), the degree ofurbanization of the districts in which the households live (using our districttypology), and a set of infrastructural variables such as access to markets, publictransportation, or electricity at the rural community level. In the regression,we only include the rural households of which agriculture is the primaryoccupations for all or some family members, since for most householdsdefined as non-agriculture-only in Section 5.3any agricultural activity appearsto be part-time.
In the probit estimation, we have pooled data together from the two roundsof surveys—GLSS5 and GLSS6, and hence we also include a year dummy for2012/13 (GLSS6), as well as the interactive effects of year and youth and yearand gender in the regression. Still, there are too many missing variables in theregressions to test any causal relationships (e.g., we are unable to control forwages or missing household effects), but they do reveal some interestingpatterns of association. We only report the marginal effects of the probitestimation in Table 5.9.
Urbanization, as captured through our typology, has some significant butcomplex links with agricultural intensification. Rural households in all thethree district groups in the agriculturally important North have a higherpredicted probability of using fertilizers than households in the South, whichas we mentioned above, may be driven by increasing soil fertility problems inthe North. However, contrary to the bivariate relationship of Table 5.5, in
OUP CORRECTED PROOF – FINAL, 30/7/2019, SPi
136 ’ ’

which we could not find a consistent pattern of increased use of fertilizer withlevels of urbanization within each of the two regions, the probit estimationshows that in the North, the higher the urbanization level—measured by thesize of cities in different district groups, the higher the predicted probability ofusing fertilizer. For example, compared with households in the South’s dis-tricts without cities, the predicted probability of using fertilizer increases by25 percent in the North’s districts with secondary cities, while the marginaleffects are smaller in Northern districts with 3rd-tier cities or without cities, at18.7 percent and 13.9 percent, respectively.
The probit estimates show a similar relationship between farm size anduse of fertilizer as we observe in Table 5.6, i.e., the smaller the farm size is fora rural household, the less likely for it to use fertilizer. For example, thepredicted probability of using fertilizer is 27.8 percent lower for households
Table 5.9. Probit model regressions for input use, pooled data of GLSS5 andGLSS6
Independent variable (1) (2) (3) (4)Fertilizer Herbicides/
InsecticidesHiringlabor
Mechanization
Farm sizeLess than 2 ha –0.278*** –0.147*** –0.223*** –0.286***
(0.0461) (0.0449) (0.0501) (0.0389)2–5 ha –0.140*** –0.0236 –0.116** –0.187***
(0.0463) (0.0447) (0.0503) (0.0388)5–20 ha –0.0842* 0.0709 –0.00961 –0.0869**
(0.0475) (0.0462) (0.0519) (0.0399)Base is > 20 ha
Types of district groups
2nd-tier city districts, North 0.250*** 0.174*** 0.177*** 0.0803**(0.0452) (0.0522) (0.0508) (0.0383)
3rd-tier city districts, North 0.187*** –0.172*** –0.0150 –0.000881(0.0184) (0.0181) (0.0205) (0.0172)
No city districts, North 0.139*** –0.0827*** 0.0103 –0.00338(0.0138) (0.0137) (0.0154) (0.0128)
Big city districts, South 0.0217 –0.0730 0.180* 0.175**(0.107) (0.109) (0.103) (0.0857)
2nd-tier city districts, South –0.00633 –0.159*** 0.0604 –0.0807(0.0621) (0.0587) (0.0669) (0.0630)
3rd-tier city districts, South –0.0693*** –0.0404*** –0.0254 –0.00712(0.0156) (0.0150) (0.0166) (0.0140)
Base is no city districts, South
Notes: Farm size is based on cultivated area. Rural households defined as agricultural onlyor agricultural and nonagricultural mixed households in GLSS5 are included in the regressions.* p < 0.1, ** p < 0.05, *** p < 0.01.
Source: Authors’ own estimation using GLSS5 and GLSS6 data.
OUP CORRECTED PROOF – FINAL, 30/7/2019, SPi
, , 137

with less than 2 ha of land compared to households with 20 ha or more, but theprobability is only 14.0 percent and 8.4 percent lower for those with land of2–5 ha and 5–20 ha, respectively. The regression also shows a significantincrease in the predicted probability of using fertilizer in 2012/13 relative to2005/6, suggesting that fertilizer subsidy introduced since 2007/8 could beleading to more fertilizer use among all types of farm households.
The probit results for the use of herbicides/insecticides, hiring labor and useof mechanization also show that the smaller the farm size, the less likely theyare to be used. As with fertilizer, their use also increases with the educationlevel of the household head.
Table 5.9. Probit model regressions for input use, pooled data of GLSS5 andGLSS6 (cont.)
Independent variable (1) (2) (3) (4)Fertilizer Herbicides/
InsecticidesHiringlabor
Mechanization
Year dummy for 2013 0.156*** 0.346*** –0.0743*** 0.149***(0.0108) (0.00876) (0.0124) (0.00993)
Youth-headed household 0.00104 0.0234* –0.0433*** 0.00602(0.0134) (0.0134) (0.0147) (0.0123)
Female-headed household –0.0695*** –0.0842*** 0.0612*** –0.0385***(0.0159) (0.0155) (0.0168) (0.0144)
Year dummy* Youth 0.0596** –0.0663** –0.0200 0.0295(0.0266) (0.0269) (0.02904) (0.0245)
Year dummy* Female –0.00362 –0.0440 –0.0184 –0.0773**0.02845 (0.0286) (0.0303) (0.0261)
Education levelPrimary completed 0.0265** 0.0647*** 0.0609*** 0.0601***
(0.0134) (0.0131) (0.0144) (0.0121)Secondary completed 0.0828*** 0.0961*** 0.0833*** 0.0863***
(0.0267) (0.0276) (0.0303) (0.0241)University and above 0.0130 0.352** 0.184 0.136
(0.0894) (0.148) (0.142) (0.143)Base is no education
Access to markets –0.0335** –0.0276* 0.0314* –0.0278**(0.0145) (0.0143) (0.0161) (0.0126)
Access to publictransportation
0.0418*** 0.103*** 0.0769*** 0.0904***
(0.0125) (0.0124) (0.0138) (0.0116)Access to electricity –0.00848 –0.0381*** 0.0284** –0.00746
(0.0124) (0.0122) (0.0134) (0.0116)
Observations 13,388 13,340 13,340 13,340
Notes: Agricultural only or agricultural and nonagricultural mixed rural households in GLSS5 areincluded in the regressions. * p < 0.1, ** p < 0.05, ***p < 0.01.Source: Authors’ own estimation using GLSS5 and GLSS6 data.
OUP CORRECTED PROOF – FINAL, 30/7/2019, SPi
138 ’ ’

While predicted probabilities of fertilizer, herbicide/insecticide and mech-anization use are higher in 2012/13, they are lower for hired labor use. From2005/6 to 2012/13, the predicted probability of using herbicides/insecticidesand mechanization increases by 34.6 percent and 14.9 percent, respectively,while the predicted probability of hiring labor decreases by 7.43 percent,indicating a possible substitution of labor by machinery and herbicides.
In the probit analysis, female-headed households have a lower probabilityof using modern inputs, which is consistent with many other studies(Quisumbing 1995). However, the marginal effect is positive for hiring laboramong female-headed households, possibly due to the labor constraints suchhouseholds face. The sign of the marginal effect for the youth dummy is notconsistent and often insignificant in the regressions. This result is somewhatsurprising, since younger farmers might be expected to be more open to newtechnologies and knowledge than older adults.
The marginal effect of urbanization on the use of other inputs is not alwaysconsistent with that for fertilizer use. Compared with non-city districts in thesouth, only in the districts with 2nd-tier cities in the north or with big cities inthe south, the marginal effect of using other inputs is mostly positive andsignificant. The sign of marginal effect tends to be negative, if significant, forthe other types of district groups in both North and South.
Among the three variables related to market access or public infrastructure,the marginal effect of input use is positive only for the access to publictransportation variable. The probability for any modern input use or laborhiring increases by 4.18–10.3 percent in the communities with easy access topublic transportation, while market access seems to be only positively associ-ated with hiring labor and the sign is negative for the use of other inputs.Market access is measured by whether a rural community has a daily orperiodic market. It is also possible that better access to public transportationallows farmers to get access to market through traders who can come tovillages directly.
5.5 Conclusions
Ghana has rapidly urbanized in recent decades, through the development ofmany secondary and small cities as well as through growth of large cities,particularly in the South of the country. Urbanization has diversified rurallivelihood opportunities, leading to significant growth in the share of ruralhouseholds engaged primarily in the nonfarm economy. In addition to
OUP CORRECTED PROOF – FINAL, 30/7/2019, SPi
, , 139

migration to urban areas, there has been widespread diversification of ruralhouseholds into the rural nonfarm economy on a full- or part-time basis.The result has been a substantial decline in the share of households whodepend primarily on agriculture. Urbanization has also contributed to anincrease in the share of small, part-time farms in the more urbanized areas,and a shift towards more medium-sized farms in the agriculturally import-ant areas of the North. These patterns of change in household employmenthave also led to spatial patterns of change in the incidence of poverty.Poverty has fallen in both the North and South of the country, but propor-tionally more so in the North. And while the impacts are mixed in districtswith larger cities, poverty rates have fallen for all household types in thenon-city districts. It would seem that increased urbanization has helpedsome of the benefits from Ghana’s economic transformation trickle downto the most rural of households.
The induced innovation hypothesis predicts that urbanization and associ-ated increases in population density and market access should lead to moreintensive farming practices, both in terms of the land-use patterns and thechoice of technologies. Although there has been substantial uptake of fertil-izers, herbicides, and mechanization in recent years, we find only limitedsupport for the hypothesis that this has been driven by urbanization, andthis support is mainly in the North and in some districts with big cities in theSouth. More generally, fertilizer appears to be used mainly for offsettingdeclining soil fertility rather than intensification. Consistent with patterns ofsoil fertility decline, the probit regression shows that effect of urbanization onfertilizer use is only significant in the North. This is also consistent withfindings in Chapter 6.
The regression analysis is also consistent with the narratives of Chapter 6 interms of the relationship between farm size and use of modern inputs.Chapter 6 describes how farmers in the savanna and transition zones arecropping larger areas and using mechanization to reduce labor requirementsin the face of increasing wages. In the probit regressions here, the probabilityof fertilizer use and using other inputs and mechanization and hiring laborincreases significantly with farm size.
Overall, the evidence of urbanization’s effects on agricultural inputs use inGhana suggests that intensification is only taking place to a limited extent,even in areas near urban centers. Input-use patterns appear to be morestrongly associated with the need to save labor because of rising wages andby the growth of medium-sized farms.
OUP CORRECTED PROOF – FINAL, 30/7/2019, SPi
140 ’ ’

References
Ackah, C., C. Adjasi, and F. Turkson. 2014. “Scoping Study on the Evolution ofIndustry in Ghana”. Learning to Compete Working Paper No. 18. Washington:Africa Growth Initiative (AGI) at Brookings.
Berdegue, J., F. Carriazo, B. Jara et al. 2015. “Cities, Territories and InclusiveGrowth: Unraveling Urban–Rural Linkages in Chile, Colombia, and Mexico.”World Development 73: 56–71.
Binswanger, Hans P., and John McIntire. 1987. “Behavioral and Material Deter-minants of Production Relations in Land-abundant Tropical Agriculture.”Economic Development and Cultural Change 36(1): 73–99.
Binswanger-Mkhize, H., T. Johnson, P. Samboko, and L. You. 2016. “The Impactof Urban Growth on Agricultural and Rural Nonfarm Growth in Kenya.”Rome: International Fund for Agricultural Development.
Deichmann, U., F. Shilpi, and R. Vakis. 2008. “Urban Proximity, AgriculturalPotential and Rural Non-farm Employment: Evidence from Bangladesh.”World Development 37(3): 645–60.
Grabowski, P., and Jayne, T. 2016. “Analyzing Trends in Herbicide Use in Sub-Saharan Africa.” East Lansing: Food Security and International DevelopmentWorking Paper No. 142. Department of Agricultural, Food, and ResourceEconomics, Michigan State University.
GSS (Ghana Statistical Service). 2003. Population and Housing Census 2000.Census data. Accra.
GSS (Ghana Statistical Service). 2008. Ghana Living Standards Survey Round 5(GLSS 5). Survey Data. Accra.
GSS (Ghana Statistical Service). 2013. Population and Housing Census 2010.Accra.
GSS (Ghana Statistical Service). 2014. Ghana Living Standards Survey Round 6(GLSS 6). Survey data. Accra.
Haggblade, S., P. Hazell, and J. Brown. 1989. “Farm–Nonfarm Linkages in RuralSub-Saharan Africa.” World Development 17(8): 1173–201.
McIntire, John, Daniel Bourzat, and Prabhu Pingali. 1992. “Crop Livestock Inter-action in Sub-Saharan Africa.” Washington, DC: World Bank.
Pingali, Prabhu, Yves Bigot, and Hans P. Binswanger. 1987. Agricultural Mechan-ization and the Evolution of Farming Systems in Sub-Saharan Africa. Baltimore,MD: Johns Hopkins University Press.
Quisumbing, Agnes. 1995. “Gender Differences in Agricultural Productivity:A Survey of Empirical Evidence.” FCND Discussion Paper No. 5. Washington,DC: IFPRI.
OUP CORRECTED PROOF – FINAL, 30/7/2019, SPi
, , 141

6Agricultural Transformation
in the Savannah
Perspectives from the Village
Michael Johnson, Nazaire Houssou,Shashidhara Kolavalli, and Peter Hazell
6.1 Introduction
Most of the evidence presented in this book about changes in the agriculturalsector draws on secondary data and nationally representative householdsurveys like the GLSS. This chapter seeks to ground the truth of some of thekey findings by providing village and farmer perspectives on importantchanges that have impacted on their livelihoods since the 1980s, and howthey have adapted their farming systems and practices. The chapter alsoaddresses several key questions. What were the key factors driving farmers’adaptation decisions, including the roles of changes in population density andthe availability of additional land for cultivation, improved access to markets,changing market demands, increased competition for labor from the ruralnonfarm economy, and higher wages? Why, despite continuing rural popula-tion growth, have farmers generally chosen to adopt technologies and farmingpractices that increase labor productivity relative to land productivity? Finally,what happens once options for bringing more land into production becomeexhausted? As discussed in Chapter 4, how well farmers adjust to increasingland scarcity will be critical for the future sustainability of agricultural growthin Ghana.
The study draws on two sources of evidence. First, the results from inter-views conducted during 2015 with focus groups and key informants in fourrepresentative villages in the transition and Guinea savannah zones. Villageswere selected that provide contrasting situations about the availability ofadditional land. This study is reported in Section 6.2. Second, a farm modelingexercise was undertaken to simulate the changes in farming practices that have
OUP CORRECTED PROOF – FINAL, 30/7/2019, SPi

occurred in the villages since the 1980s to help identify what have been themain drivers of the adaptations farmers have made. This study is reported inSection 6.3.
6.2 Village and Farmer Perspectives of Change
Given limited resources, the village study was undertaken in the Guineasavannah and transition zones.¹ These zones were chosen because they prod-uce the bulk of Ghana’s cereal and legume crops (Chapter 4) and because theyare also the zones that have experienced the fastest growth in cultivated areasince 1992, which is germane to concerns about the sustainability of pastpatterns of agricultural growth as the land frontier becomes exhausted.
6.2.1 Selection of Villages
The study was conducted in two villages in the transition zone and two in theGuinea savannah zones. In each zone, one village was selected that has reachedits land frontier (Type I) and one that still has virgin land left (Type II). Thevillages (Table 6.1) were selected based on discussions with local officials torepresent the typical transformations that have occurred in the two zones.
Interviews were conducted in each village during 2015. These involvedfocus group discussions, as well as individual interviews with selected farmers,village leaders, and local extension and government officials. Interviews fol-lowed a loosely structured format in which interviewees were encouraged toidentify important changes and to suggest reasons, rather than trying to testmany preconceived hypotheses.
Table 6.1. Location and names of the selected villages
Agroecological zone District Village
Type I Type II
Transition Ejura–Sekyedumase Hiawoanwu SekyerekromGuinea savannah Savalegu–Nanton Tindan Sakpule
Note: Sekyekrom and Sakpule are also known as Sakiryiakura and Saakpuli, respectively.
Source: Authors’ village studies.
¹ This section draws on a more detailed paper by Houssou1 et al. (2017).
OUP CORRECTED PROOF – FINAL, 30/7/2019, SPi
, , , 143

6.2.1.1 Village Characteristics
Both Type I villages are connected by tarred roads, whereas the Type II villagesare connected by sandy/gravel roads. This suggests that land frontier has beenreached first in villages that are better connected to urban centers and markets.None of the villages had good roads in the 1980s, and the tarred roads havebeen constructed since 2000.
There have been some improvements in education, potable water, andelectrification, though not all villages have progressed evenly. All have bene-fited since 2005 from massive changes in communication with the introduc-tion of mobile phones. In Sekyerekrom, for example, nine out of ten adultshave mobile phones.
There have been changes in access to credit as well. During the 1980s andthe 1990s, people borrowed from informal sources such as family, relatives,and friends who did not charge any interest. Now they borrow from formalsources paying interest ranging from 30 to 50 percent—even credit frominformal family and friends now comes only with interest.
Population sizes have grown in all four villages since the 1980s, oftenthrough in-migration. Census data for 2000 and 2010 show that populationgrowth has slowed in recent years (Table 6.2), except in Sapules where it hasincreased significantly despite this being one of the poorest villages lacking aschool and mains electricity. This was basically because of in-migrationattracted by the availability of land.
Apart from farming, other sources of income have emerged, such as pettytrading, provision of transport services, and firewood and charcoal produc-tion. In the two transition zone villages, which are closer to urban centers inthe South, youth are also migrating to urban areas to work as electricians,mechanics, and drivers among other occupations.
Table 6.2. Changes in village population, 2000 to 2010
Village Census
2000 2010
Hiawoanwu 2,582 2,718Tindan 452 451Sekyerekrom 524 523Sakpule 186 854
Source: Ghana Statistical Service (2000, 2010).
OUP CORRECTED PROOF – FINAL, 30/7/2019, SPi
144

6.2.2 Local Perceptions of Change about Farming Practices
6.2.2.1 Land Use
Farmers report that land was more abundant (and available closer to home-steads) in the 1980s, and cultivated land was allowed to revert to long-termfallow after three to four years of cropping and replaced by clearing virgin ormature fallow land. Today there is little or no virgin land left in any of thevillages, and fallow land is also getting scarce, particularly in the Type Ivillages. In Sekyerekrom, farmers reported that in the 1990s, virgin landaccounted for 60 percent of their farmland, but this had declined to 40 percentby the 2000s, and today there is none left.
There are also more larger farms today than in the 1980s. In the 1980s, onlySekyerekrom had any farms greater 5 acres, but by 2015 half or more of thefarms in all four villages were larger than 5 acres (Table 6.3). The emergence oflocal land constraints has not prevented farmers from expanding their oper-ations; they are expanding by cultivating lands in other villages that still haveavailable land. For example, more than one half of the farmers in Tindangcultivate lands outside their village boundaries. By 2015, there were highershares of farms in the largest size group in the Type I villages than in theType II villages. However, this does not mean that many small farms are beingconsolidated; rather fallow periods are being shortened and farmers areacquiring additional land away from their villages.
Fallowing is still practiced as part of the farming system, but larger farmstend to fallow a smaller portion of their lands than small farms, probably
Table 6.3. Changes in cultivated farm size distribution (%)
Village Size group (acres) 1980s 2015
Type I Hiawoanwu 1–55–15> 15
10000
203050
Tindang 1–1010–25> 25
10000
302050
Type II Sekyerekrom 1–55–15> 15
503020
304030
Sakpule 1–55–30> 30
10000
502030
Source: Authors’ village studies.
OUP CORRECTED PROOF – FINAL, 30/7/2019, SPi
, , , 145

because they have greater access to tractors. Farmers in one village suggestedthat smallholders fallow 80 percent of their land compared to 70 and 30percent on medium- and large-sized holdings.
6.2.2.2 Crop Dynamics
In the 1980s, farmers produced primarily for their own subsistence needs, andthe amount of land they could cultivate was limited by the use of hoes andcutlasses for clearing and preparing land. In Tindang, for example, yellowmaize and yams were widely grown, though there was no market for eithercrop at the time. Women in Sakpule indicated that they used to cultivategroundnuts on a single acre of land given to them by their husbands tocomplement the grains that the males produced for the family pot. Todayfarm families have greater need for cash to meet the costs of schooling theirchildren and other essentials like mobile phones. To generate more cashincome they farm a larger crop area, and hire tractor services from localproviders to plow the fields for them. They pay for this service after harvest.Nearly all farm households market some produce today, though the extent oftheir participation in markets depends on their farm size.
The changes in cropping choices can be summarized as follows:Transition zone: In Hiawoanwu during the 1980s and 1990s, the crops grownincluded maize, cowpea, cassava, yam, tomato, groundnut, cotton, andtobacco. In 2010, tomato, cotton, and tobacco had disappeared, and yam,cassava, and groundnuts had declined to subsistence levels. The main cashcrops now are maize and cowpeas. A similar trend is observed in Sekyerekrom.Guinea savannah zone: In Tindang, yams and cassava were important crops inthe 1980s, but have now disappeared. The main cash crops today are maize,rice, groundnuts, and soybean. A similar trend is observed in Sakpule, whereimportant crops in the 1980s like yams, cassava, millets, and sorghum have allbut disappeared today and the main crops today (in order of importance) aresoybeans, cotton, rice, and maize.
In general, farmers have moved from root-based subsistence crops (such asyam and cassava) to grain–legume-based crops (such as maize and ground-nuts) that have market value. Yams, which require rich soils, are grownimmediately after clearing forests. As soil fertility declines, farmers switch toother crops like maize that are more tolerant of the declining soil fertility. Thecropping mix has changed from a subsistence-driven system of intercroppingbased on multiple crops to a mixed subsistence–commercial system based on afew crops, in which commercialized crops are mostly grown as monocrops,such as maize, cowpea, groundnut, and soybean.
OUP CORRECTED PROOF – FINAL, 30/7/2019, SPi
146

The crop mix also varies by farms size, in part because of labor and capitalconstraints. For example, in Tindang, small farmers specialize more in labor-intensive and capital-extensive crops like soybeans while larger farms special-ize more in capital-intensive but labor-extensive crops like rice. The differencein cropping by farm size in Tindang is as follows:
• Large-scale farmers: 50 percent rice, 30 percent maize, and 20 percentgroundnut
• Medium-scale farmers: 50 percent maize, 30 percent rice, and 20 percentgroundnut, and
• Small-scale farmers: 30 percent maize, 60 percent soybean, and 10 percentgroundnut.
In Hiawoanwu, large scale farmers are not cultivating yams because theyrequire special care and labor-intensive husbandry practices.
Farmers explained that their cropping patterns and farm sizes have beeninfluenced by a number of factors, but especially by their household needs forstaple foods and cash, soil fertility problems, the location of their lands relativeto their houses, and market opportunities. Changes in rainfall patterns havealso induced some changes in the crops and varieties that farmers grow.
6.2.2.3 Labor Use
Back in the 1980s, farmers relied on family and communal labor, which wasrelatively abundant, and adequate to meet their needs. Land preparation andweeding were undertaken manually. Today communal labor has declinedsignificantly, and farmers are cultivating larger areas. This has increased theirdependence on hired labor, and at a time when real wages have been rising.
Hired labor has become scarcer and more expensive in the villages, especiallyduring weeding and harvesting operations. Local workers are often insufficienttomeet the demand and as a result, migratory workers are helping to fill the gap.In Tindang, laborers migrate from West Mamprusi and Savalegu to the villageto offer their services during the farming season. Laborers also migrate from theGuinea savanna zone in the north to the transition zone in the south.
Labor constraints affect different sized farmers differently. Large farms areparticularly affected because they need to mobilize more laborers than smallfarms, and who may not be available at the time needed. On the positive side,large farmers can afford to bring labor from as far as the Northern region, andsmall farms can access such laborers after they have worked on the large farms.With increasing labor scarcity (and cost), other technologies such as herbi-cides and tractors for land preparation have emerged as substitutes.
OUP CORRECTED PROOF – FINAL, 30/7/2019, SPi
, , , 147

6.2.2.4 Mechanization
Tractor plowing and maize shelling have increasingly become standard farmingpractices in the villages. This trend is broadly consistent with regional patterns(Table 6.4). However, access to these technologies differs depending on farmsize. Whereas access to tractors is relatively easy for medium- and large-scalefarmers, smallholder farmers need to organize to secure tractor services,especially in communities where there is a limited number of locally ownedtractors. Some medium- and large-scale farmers also own machines. Increas-ingly, mechanized farming seems to have shifted labor bottlenecks from landpreparation to weeding and harvesting operations.
6.2.2.5 Herbicides
An important labor-saving innovation has been the introduction of herbicidesin the villages. The use of herbicides has led to a drastic reduction in the use ofhoes, cutlasses, and manual labor for weeding. Herbicide use has also replacedthe practice of slash-and-burn cultivation. Weed problems seem to haveincreased as soil fertility has declined. The uptake of herbicides for landpreparation (nonselective) and weed control (selective) occurred in the early1990s in Hiawoanwu and the early 2000s in Sekyerekrom. Today, the use ofherbicides to clear lands before plowing is widespread in the villages. One ofthe farmers suggested that plowing to clear lands without first applyingherbicide lowers germination, limits plant growth, and leads to lower yields.They believe that plowing in dead weeds enriches the soils. However, on-farmweed control by resource-constrained smallholder farmers is still sometimesdone manually using family labor. A farmer in Sekyerekrom indicated that inthe absence of herbicides, many medium- and small-scale farms would have toscale down their operations.
Table 6.4. Trends in the share of farmers renting mechanical equipment,by farm size
Farm category Transition zone Guinea savannah zone
1998 2005 2012 1998 2005 2012
Percent of farms< 5 acres 0.0 4.7 7.6 6.9 3.1 12.5≥ 5–12 acres 4.5 2.4 9.6 6.0 4.8 25.6≥ 12–25 acres 0.0 12.1 18.1 12.5 6.5 38.4≥ 25 acres 3.7 22.5 9.0 – 7.7 35.8
Average 1.5 5.3 9.8 6.8 4.6 23.3
Source: Ghana Statistical Service (1998, 2005, 2012).
OUP CORRECTED PROOF – FINAL, 30/7/2019, SPi
148

6.2.2.6 Fertilizer Use
Little inorganic fertilizer was used in the 1980s, but today its use is widespread,largely because the fertility of most of the farmed lands has declined.However, farmers use less than the recommended rate of fertilizer for manyreasons, including financial constraints, risk management, outdated recom-mendations, knowledge of their own soils, and the availability of fallow lands.For example, in Sakpule, only 50 percent of farmers in the village appliedammonia in addition to the compound fertilizer, while 75 percent of farmersapplied only half of the recommended rate of NPK per acre. Without chemicalfertilizers, it seems clear that yields could not have been maintained as landswere more continuously cropped. Organic fertilizers, such as manure are rarelyused, except in Tindang, where it is used on a limited scale by cattle owners.
In Hiawoanwu and Sekyerekrom in the transition zone, a standard practicefor maintaining soil fertility is the use of a maize–cowpea rotation betweenmajor and minor seasons. Likewise in Tindang, farmers practice a soybean–maize rotation. The nitrogen fixed in the soil by a legume crop like cowpea orsoybean benefits the maize crop that follows, enabling farmers to apply less orno chemical fertilizers and to save on their production costs.
6.2.2.7 Seeds
Local and late-maturing varieties of crops were planted in the early 1980s, butmany of these have been replaced over time by improved varieties. In Sakpule,farmers indicated that the pattern of rainfall has changed in the past thirty toforty years, and they have switched from local to improved and early-maturingvarieties of maize such as Okomasa and Obtampa, and to new crops such assoybean and cotton. Soybean varieties like Jenguma have also been adoptedby farmers in the Guinea savannah zone owing to the crop’s resistance toshattering, which helps reduce yield losses resulting from late harvesting.Although farmers have adopted improved and early maturing varieties, mostof them do not purchase seeds on the market but rely instead on recycled seedsselected from the previous season, a pattern also reported by Ragasa et al.(2013). Furthermore, with declining soil fertility and exhaustion of virginlands, the major varieties of yam grown have also changed. Modern cultivarsare more tolerant of drier conditions and can thrive in less fertile soils,producing big tubers that are consumed domestically but have limited marketpotential. Amanor and Pabi (2007) also note that yams cultivated with inor-ganic fertilizers grow to be large but they develop an unpleasant hairy appear-ance that repels urban consumers.
OUP CORRECTED PROOF – FINAL, 30/7/2019, SPi
, , , 149
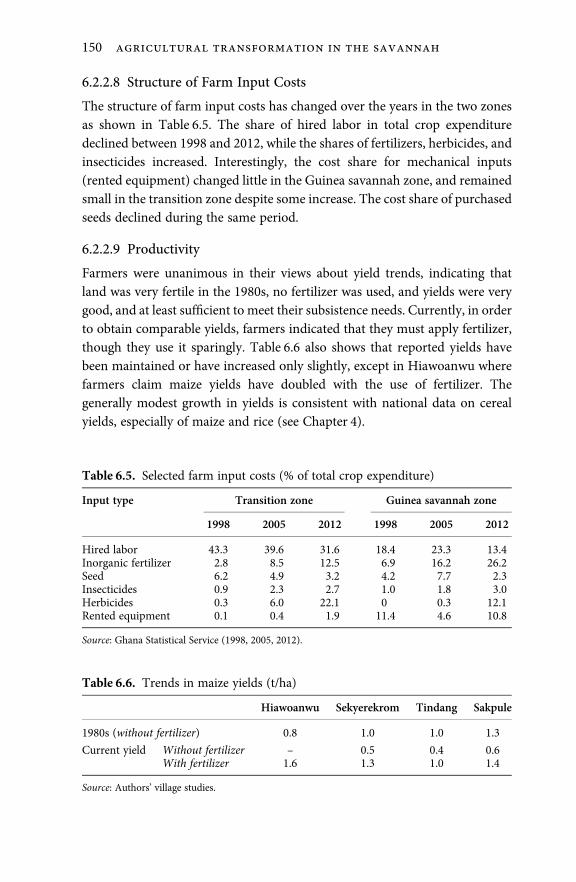
6.2.2.8 Structure of Farm Input Costs
The structure of farm input costs has changed over the years in the two zonesas shown in Table 6.5. The share of hired labor in total crop expendituredeclined between 1998 and 2012, while the shares of fertilizers, herbicides, andinsecticides increased. Interestingly, the cost share for mechanical inputs(rented equipment) changed little in the Guinea savannah zone, and remainedsmall in the transition zone despite some increase. The cost share of purchasedseeds declined during the same period.
6.2.2.9 Productivity
Farmers were unanimous in their views about yield trends, indicating thatland was very fertile in the 1980s, no fertilizer was used, and yields were verygood, and at least sufficient to meet their subsistence needs. Currently, in orderto obtain comparable yields, farmers indicated that they must apply fertilizer,though they use it sparingly. Table 6.6 also shows that reported yields havebeen maintained or have increased only slightly, except in Hiawoanwu wherefarmers claim maize yields have doubled with the use of fertilizer. Thegenerally modest growth in yields is consistent with national data on cerealyields, especially of maize and rice (see Chapter 4).
Table 6.5. Selected farm input costs (% of total crop expenditure)
Input type Transition zone Guinea savannah zone
1998 2005 2012 1998 2005 2012
Hired labor 43.3 39.6 31.6 18.4 23.3 13.4Inorganic fertilizer 2.8 8.5 12.5 6.9 16.2 26.2Seed 6.2 4.9 3.2 4.2 7.7 2.3Insecticides 0.9 2.3 2.7 1.0 1.8 3.0Herbicides 0.3 6.0 22.1 0 0.3 12.1Rented equipment 0.1 0.4 1.9 11.4 4.6 10.8
Source: Ghana Statistical Service (1998, 2005, 2012).
Table 6.6. Trends in maize yields (t/ha)
Hiawoanwu Sekyerekrom Tindang Sakpule
1980s (without fertilizer) 0.8 1.0 1.0 1.3
Current yield Without fertilizer – 0.5 0.4 0.6With fertilizer 1.6 1.3 1.0 1.4
Source: Authors’ village studies.
OUP CORRECTED PROOF – FINAL, 30/7/2019, SPi
150

Land productivity (value of production per ha) more than doubled between1998 and 2012 in both the transition and savannah zones, even though cerealyields did not increase by much (Table 6.7). This reflects changes in thecropping pattern (with increases in crops oriented for the market), as well aschanges in real farm gate prices.
6.2.2.10 Incomes
With increases in the average cropped area per farm and land productivity,farm incomes have increased. At the same time, farm households have aboutdoubled their nonfarm sources of income (Table 6.7), which now accounts for20–30 percent of their household income. The net result has been a substantialincrease in household welfare, as measured by real per capita expenditure(Table 6.7). This increased by 260 percent between 1998 and 2012 in thetransition zone, and by 328 percent in the Savannah zone.
6.2.3 Conclusions from the Village Narratives
Since the 1980s, farmers in the savannah and transition zones have respondedto increasing population pressure, changing household needs and expandingmarket opportunities, by increasing the size of their farms and growing moremarket-oriented crops. This adjustment has been complicated by an increas-ing scarcity of virgin land, which has compelled farmers to reduce fallowperiods or acquire land in other more distant communities that still have avirgin land frontier. With shortened fallow periods, there has been a decline insoil fertility, and farmers have had to adjust by using inorganic fertilizer—essentially to maintain rather than increase yields, introduce soil fertility
Table 6.7. Value of agricultural production, income, and consumptionexpenditures (real US$)
Indicators Transition zone Guinea savannah zone
1998 2005 2012 1998 2005 2012
Estimated value of agriculturalproduction (real US$/ha)
168 219 353 128 187 297
Share of nonfarm income (%) 16.8 20.2 28.4 11.3 14.6 20.8
Annual per capitaexpenditure (real US$)
284 320 734 156 219 512
Source: Ghana Statistical Service (1998, 2005, 2012).
OUP CORRECTED PROOF – FINAL, 30/7/2019, SPi
, , , 151

management practices like legume–cereal rotations, and adopt new crops andcrop varieties that are more tolerant of less fertile soils and to changing rainfallpatterns. Another factor complicating farmers’ adaptation has been theincreasing cost of labor and growing difficulties in accessing it at criticaltimes of the agricultural season. Farmers have adjusted to this problem byadopting labor-saving technologies like tractors and herbicides, and by grow-ing less labor-using crops.
One result of all these changes is that the composition of outputs haschanged from root-based crops for local consumption to grain–legume-based cash crops that are increasingly commercialized. However, becausefarmers have invested more in labor-saving technologies like mechanizationand herbicides than in land-saving technologies like improved seeds andfertilizers, yields have increased only marginally. Yet with the increase in theaverage cropped area per farm, changes in the crop mix, and an increase innonfarm incomes, most farm households have managed to make substantialwelfare gains since the 1980s, whether measured by the value of agriculturalproduction or household consumption expenditure.
6.3 A Farm Model Analysis
In order to better understand the factors driving changes at the farm level andhow well farmers have adapted, a mathematical programming model wasconstructed for farms in a typical village in the transition zone and used tosimulate farming practices in 1990, 2000, and 2010. The model is solved fordifferent assumptions about changes in land and labor supplies, technology,wages, and commodity prices, which allows the contributions of differentdrivers of change to be unraveled.
Three models representing small, medium, and large farms were con-structed and results derived for each farm size and for the average villagefarm. The model assumes rational choice behavior, and in particular thatfarmers are risk averse and maximize an expected income standard deviationutility function as described in Hazell and Norton (1986). Decisions are madesubject to three types of land constraints (virgin, fallow, and continuouslycropped lands) and seasonal labor constraints. The total crop area available tothe village each year and its allocation between virgin, fallow, and continuouslycropped land, are exogenously fixed in the model for each sized farm usingdata from the village narratives. The model allows farmers to choose whichcrops to grow and which technologies to use in each of two seasons, where the
OUP CORRECTED PROOF – FINAL, 30/7/2019, SPi
152

technologies reflect the options for improved seeds, fertilizer, herbicides, andtractors that were available in different decades. Tractor services and seasonallabor can be hired in, and family labor can be hired off farm up to seasonallimits. Some crops, such as vegetables, are excluded from the model due totheir small area allocation (primarily to meet subsistence needs) relative tocereals, legumes, and root crops. As in Hazell and Norton (1986), modelsolutions corresponding to different degrees of risk aversion were comparedto actual cropping patterns to select a “best fitting” value of the risk-aversioncoefficient.
6.3.1 Results for Average Farm
The model was parameterized using data collected during the interviews inHiawoanwu and Sekyerekrom villages in the transition zone, and from a varietyof secondary sources. Additional details of the model and parameter assump-tions are presented in the Appendix to this chapter. Table 6.8 presents keyresults for the average village farm in 1990, 2000, and 2010. This is a weightedaverage of the results for the small-, medium- and large-sized farms, where theweights are the shares of the three groups in total farms in 1990, 2000, and 2010.
The model results replicate many of the changes in farming practicesreported in the village narratives, and provide quantitative estimates aboutaspects of those practices that could not be elicited during the interviews. Someof the changes were imposed on the model through the resource constraints,most notably the increases in the cultivated farm sizes between 1990 and 2010,and the declining importance of fallow and virgin land and the increasing useof continuously cropped land. In particular, the assumed changes led to theaverage farm more than doubling its crop area (from 8.8 to 20.7 ha between1990 and 2010, which was achieved by increasing its continuously cropped areafrom 2.1 to 13.7 ha, while the fallow and virgin land under cultivation increasedmodestly; from 4.93 to 5.59 ha and 1.76 to 2.9 ha, respectively, but fell sharply asshares of the total cropped area. Changes in the farm size distribution used tocalculate the average farm each year were also exogenous. But most otherchanges are endogenous to the model. Some key results are as follows:
• Expected farm income more than tripled between 1990 and 2010. This isin line with the increases in annual per capita expenditure reported by theGhana Statistical Service in Table 6.7. The higher income was achievedwithout any apparent increase in risk, as measured by the coefficient ofvariation of income (CV).
OUP CORRECTED PROOF – FINAL, 30/7/2019, SPi
, , , 153

• As in the farm narratives, there is a marked shift from a root-basedcropping system based on yams and cassava to a grain-based croppingsystem based on maize and legumes. The preferred legumes are ground-nuts and cowpeas.
• The output of cassava, groundnuts, and yams declined by 47, 36, and 44percent, respectively, between 1990 and 2010 while there was a fourfoldincrease in maize production, and cowpeas production went from zero to17,324 kg.
Table 6.8. Model results for the average farm in the representative transitionzone village, 1990, 2000, and 2010
1990 2000 2010 Ratio2010/2000
Ratio2010/1990
Expected income ($,000) 6.2 11.1 20.2 1.82 3.25CV income (%) 0.1 0.1 0.1 0 0Cultivated area (ha) 8.8 14.1 20.7 1.46 2.35
Type land (%)Continuously cropped 24 45 66 1.47 2.75Fallow 56 37 27 0.73 0.48Virgin 20 18 14 0.78 0.70
Crop mix (%)Yam/cassava 34 22 10 0.45 0.29Maize based 66 78 90 1.15 1.36
Crop output (Kg)Cassava 20,002 9,024 10,652 1.18 0.53Cowpeas 0 7,307 17,324 2.37 —Groundnuts 6,220 5,163 3,969 0.77 0.64Maize 12,794 33,278 53,607 1.61 4.19Yams 17,860 9,191 10,078 1.10 0.56
Labor use (days)Family labor 577 776 878 1.13 1.52Hired labor 690 630 1,138 1.81 1.65Total labor 1,267 1,406 2,016 1.43 1.59Total labor (days/ha) 145 100 97 0.97 0.67
Labor and land productivityTotal labor ($/day) 3.0 5.5 8.0 1.45 2.67Land productivity ($/ha) 626 695 886 1.27 1.42
Technology adoptionFertilizer (kg/ha) 16.4 28.0 33.9 1.21 2.07Total fertilizer (kg) 143 396 703 1.77 4.92Fertilizer (% maize area) 49 63 82 1.32 1.67Land under tractors (%) 7 45 86 1.91 12.29Seeds (% farm area) 65 100 100 1.00 1.54
Source: Authors’ model results.
OUP CORRECTED PROOF – FINAL, 30/7/2019, SPi
154

• Total labor use per hectare declined by one third due to greater use oflabor-saving technologies and less labor-intensive crops, but total laboruse on the farm increased by 60 percent, mainly because of the increasedcropped area. Family and hired labor use increased by 52 and 65 percent,respectively, but all the increase in the use of hired labor occurredbetween 2000 and 2010.
• The percentage of the cropped area plowed with tractors increased from7 percent in 1990 to 86 percent in 2010.
• Fertilizer use per hectare doubled between 1990 and 2010, but its use stillremained moderate at 33.9 kg/ha in 2010. Total fertilizer use increasedmuch more, by about 400 percent, because of the increased crop area aswell as more intensive use of fertilizer. Much of the fertilizer is appliedto the maize crop, 82 percent of which was fertilized in 2010, up from49 percent in 1990.
• The use of improved maize seeds increased from 65 percent of the maizearea in 1990 to 100 percent in 2000, and remained at full adoptionthrough 2010. Even higher yields might have been obtained with hybridmaize, but this was not included as an option in the model becausehybrid seeds were virtually unattainable in the study area over theperiod modeled.
• While labor productivity increased by 167 percent between 1990 and2010, land productivity (income per hectare) increased by a more modest42 percent. These increases translate into annualized growth rates of1.7 percent for labor productivity and 3.9 percent per annum for landproductivity. The growth in land productivity is primarily the result of alarger cropped area, a shift towards higher value crops, and the adoptionof labor-saving technologies, as also reported from the village narratives.
6.3.2 Differences by Farm Size
Table 6.9 and Figure 6.1 highlight some important differences in the results byfarm size.
Small farms increased their cropped area by 92 percent between 1990 and2010, compared to 51 percent for medium-sized farms and 27 percent for largefarms. These changes were exogenous to the model, but importantly smallfarm income increased proportionally more than the incomes of the mediumand large farms; by 222 percent verses 134 percent and 85 percent,
OUP CORRECTED PROOF – FINAL, 30/7/2019, SPi
, , , 155

respectively. Although small farms followed medium and large farms inshifting from a root-based to a maize-based cropping system, the shift wasmore muted, in part because of their own consumption needs for these crops.
Total labor use increased by 34 percent (from 241 to 323 days) on smallfarms between 1990 and 2010, but declined by 4 percent and 12 percent,respectively, on medium and large farms. This reflects changes in the laborintensity of their different cropping patterns and differences in the uptakeof tractor mechanization. Small farms also use more labor per hectarethan medium and large farms in all three years. Hired labor is used mostlyon large farms but their total use fell by 16 percent between 1990 and 2010.Small farms do not use any hired labor in the model results, and medium-sizedfarms used only moderate amounts. Small farms use less fertilizer per hectarethan larger farms in all three years, but they also fully adopt improved maizeseeds by 2000.
Finally, while there is a more than doubling of labor productivity for allsized farms, land productivity (income per hectare) increases more modestly,by 53 percent, 46 percent, and 45 percent for small, medium, and largefarms. These translate into annualized growth rates in labor productivity of
Table 6.9. Selected model results by farm size group, representative village in thetransition zone, 1990, 2000, and 2010
Variable Small farm Medium farm Large farm
1990 2000 2010 1990 2000 2010 1990 2000 2010
Expected income ($000) 2.2 4.0 7.1 5.6 7.9 13.1 18.6 23.8 34.5CV income (percent) 19 16 9 17 17 9 11 13 7Cropped area (ha) 1.3 1.8 2.5 6.4 7.9 9.7 33.0 37.1 41.8
Crop mix (percent)Yam/cassava 42.1 44.8 23.8 30.2 12.0 8.7 17.0 1.2 1.5Maize based 57.9 55.2 76.2 69.8 88.0 91.3 83.0 98.8 98.5
Labor use (days)Total labor 241 306 323 1,028 982 991 4,519 3,335 3,970Hired 0 0 0 173 0 114 3,260 2,099 2,744Total (days/ha) 185 170 129 160 124 102 137 90 95
Technology adoptionFertilizer (kg/ha) 14.5 20.7 28.6 17.5 29.2 34.2 20.7 37.0 36.9Total fertilizer (kg) 19 37 71 112 231 332 685 1,374 1,544Fertilizer (% maize area) 41 38 62 54 78 84 71 98 97Land under tractors (%) 0 5 60 8 47 91 27 98 99Seeds (% of farm area) 80 100 100 58 100 100 28 100 100
Source: Authors’ model results.
OUP CORRECTED PROOF – FINAL, 30/7/2019, SPi
156

7.8, 5.6, and 4.5 percent for small, medium, and large farms, respectively, over1990–2010, but only about 2 percent per annum in land productivity for allfarms. As might be expected, smaller farms experience higher values of landproductivity than medium and large farms, as illustrated in Figure 6.1.
6.3.3 A Decomposition Analysis of the Changes, 1990–2010
The model was used to identify the contributions of different drivers of changebetween 1990 and 2010 for each farm size group using a decompositionanalysis. Specifically, model simulations were undertaken to decomposechanges in key endogenous variables like expected income, input use, cropchoice and production into parts due to exogenous changes over 1990 to 2010in available land and improved seeds, and changes in wages, input and outputprices, and a residual measuring interactions between these components. Thiswas done by first solving the 1990 and 2010 models to calculate the totalchange in key endogenous variables, and then solving the 1990 model with2010 land constraints and everything else set at 1990 values; solving again for2010 seeds with everything else set at 1990 values; solving again for 2010 wages
1990
2000
2010
1990
2000
2010
1990
2000
2010
0.0
3.0
6.0
9.0
12.0
500 600 700 800 900 1,000 1,100 1,200 1,300 1,400
Labo
r pro
duct
ivity
($/p
erso
n da
ys)
Land productivity ($/ha)
Small Medium Large
Figure 6.1. Changes in labor and land productivity by farm size, representativevillage in the transition zone, 1990–2010Source: Authors’ model results.
OUP CORRECTED PROOF – FINAL, 30/7/2019, SPi
, , , 157

with everything else set at 1990 values; etc. Then for each endogenous variableof interest calculate:
Y₂₀₁₀ = Y₁₉₉₀ + Y₁₉₉₀ (given 2010 land) + Y₁₉₉₀ (given 2010 wage) + Y₁₉₉₀(given 2010 seeds) + Y₁₉₉₀ (given 2010 price ratios) + Residual (equalsinteraction terms).
Where the residual is calculated as the difference to balance the equation.The results can then be used to assess the relative importance of changes inthe exogenous variables in explaining the changes between 1990 and 2010.
Table 6.10 shows the decomposition results. Some key points are as follows:
• The exogenous increase in farm sizes between 1990 and 2010 accountsfor about 10 percent of the increase in expected incomes for all sizedfarms. Increases in farm size are also an important driver of the increasesin total labor use for all sized farms, and for hired labor on medium andlarge farms. Increases in farm size are also an important driver offertilizer use for all sized farms.
• Increases in farm size had a negligible impact on the use of tractorplowing. The latter was more affected by increases in the wage rateand, in the case of large farms, by reductions in input (presumablyherbicide) costs.
• Increases in wages acted to reduce labor use on all sized farms, andencouraged greater use of tractor plowing. Wage increases also had apositive impact on the incomes of small and medium-sized farms, but anegative impact on the incomes of large farms. This is because largefarms are net buyers of labor, whereas small and medium farms sell morelabor off farm over the year than they hire in.
• Improved seeds made an important contribution to incomes, especiallyfor medium and large farms, but acted to reduce total fertilizer use. Thisis surprising; seeds seem to be used as a substitute for fertilizer ratherthan as a complementary input, perhaps because they are used on morefertile land.
• Changes in output prices contributed little to incomes, but encouragedgreater use of fertilizer, a pattern that was reinforced by reductions ininput prices. Changes in input prices also encouraged greater mechan-ization and reduced labor use. This is partly the impact of less costlyherbicides.
OUP CORRECTED PROOF – FINAL, 30/7/2019, SPi
158

Table 6.10. Decomposition of changes in selected variables by farm size group, representative village in the transition zone, 1990–2010
Percentage share of 2010 value attributed to
Endogenous variable (by farmtype)
1990 value Changein land
Changein wages
Changein seeds
Change inoutput prices
Change ininput prices
Interactionterms
2010/1990value
Expected income ($)Small farm 31.5 11.6 41.1 9.6 0.1 1.6 4.4 3.2Medium farm 42.8 13.6 8.7 23.0 3.1 4.9 3.9 2.3Large farm 53.9 10.8 –25.1 45.8 5.0 13.3 –3.6 1.9
Total fertilizer use (kg)Small farm 26.4 37.4 18.0 –9.3 14.5 38.8 –25.8 3.8Medium farm 33.7 22.4 –12.4 –13.9 10.0 29.0 31.3 3.0Large farm 44.4 16.3 –25.7 –10.6 5.3 35.9 34.4 2.3
Tractorized land area (ha)Small farm 0.0 0.0 42.5 0.0 0.0 3.3 54.2 –Medium farm 6.1 –3.1 40.7 –2.9 –5.5 3.2 61.3 16.3Large farm 21.3 3.5 28.0 –9.4 –9.0 34.2 31.4 4.7
Labor use (days)—familySmall farm 74.6 54.3 –31.3 4.0 –11.3 –9.5 19.2 1.3Medium farm 97.5 22.7 –25.9 –0.9 11.0 –4.5 0.0 1.0Large farm 102.6 0.0 –27.1 0.0 9.3 –12.5 27.7 1.0
Labor use (days)—HiredSmall farm 0.0 0.0 0.0 0.0 0.0 0.0 0.0 1.0Medium farm 151.7 251.2 –138.7 82.9 –134.0 –32.2 –81.0 0.7Large farm 118.8 35.3 –92.2 31.4 –8.9 –39.9 55.4 0.8
Labor use (days)—TotalSmall farm 75.9 55.2 –31.9 4.1 –11.5 –9.7 19.5 1.3Medium farm 84.8 40.1 –31.8 7.2 –4.7 –6.2 –7.6 1.0Large farm 100.2 21.5 –63.5 19.1 –2.9 –27.7 41.3 0.9
Source: Authors’ model results.
OUPCORRECTED
PROOF–FIN
AL,
30/7/2019,SP
i

6.4 Conclusions
The village narratives and the farm model results tell a consistent story ofchange since the 1980s in the savannah and transition zones. Farmers haveresponded rationally to increasing population pressure, changing householdneeds and expanding market opportunities, by increasing the size of theirfarms and growing more market-oriented crops. This adjustment has beencomplicated by an increasing scarcity of virgin land, which has compelledfarmers to reduce fallow periods or acquire land in other more distantcommunities that still have a virgin land frontier. With shortened fallowperiods there has been a decline in soil fertility and farmers have had toapply more inorganic fertilizer to maintain rather than increase yields, intro-duce soil fertility management practices like legume–cereal rotations, andadopt new crops and crop varieties that are more tolerant of less fertile soilsand to changing rainfall patterns. Also, higher wages and difficulties inaccessing hired labor at critical times of the agricultural season have ledfarmers to adopt labor-saving technologies like tractors and herbicides, andto switch to crops that require less labor.
As a result, the composition of farm output has changed from root-basedcrops for local consumption to grains and legumes (especially maize, cowpeas,and groundnuts) that are increasingly commercialized. Given the emphasis onlabor-saving technologies like mechanization and herbicides, labor product-ivity has risen faster than land productivity, and yields of many crops haveincreased only marginally. However, because of the increase in the averagecropped area per farm, changes in the crop mix, and some increase in nonfarmincomes, most farm households have managed to substantially increase theirincomes since the 1980s, whether measured by income, the value of agricul-tural production, or household consumption expenditure.
Although farmers have adjusted to increasing land scarcity, it is not clearthat they have found a sustainable solution for future agricultural growth.They are still exploiting remaining opportunities to shorten fallows and offsetdeclining soil fertility with fertilizers and crop rotations, and seeking add-itional land in other villages. But there is little evidence that they are success-fully switching to yield enhancing technologies that will be essential for futureagricultural growth. This is true even in the villages that have already reachedtheir land limit. Such intensification may require a more proactive policyagenda, especially promoting hybrid seeds and the like. We return to theseissues in Chapter 10.
OUP CORRECTED PROOF – FINAL, 30/7/2019, SPi
160

Appendix 6A: Description of the Ghana Farm Model
The Model
The model was developed using the general algebraic modeling system, or GAMS (Brookeet al. 1998), using nonlinear programming approaches. The choice variables in the model(to be capitalized) include land area (Xijk) allocated by farmer type i (small, medium, andlarge) to activities j (by crop and technology type) and land type k. Labor can be own familylabor (Lfinit ) and/or hired labor (Lhit) at the going wage rate (wt). Additionally, because weassume the existence of a labor market, we also permit each farmer type to sell their ownlabor at any time of the year (Lfoutit ) but at a fraction of the going wage rate (w*t ). Five majorcrop rotation activities j are included with assumed area allocation to those activities.Because of bimodal rainy seasons in the Ejura area, farmers typically rotate their croppingactivities between legumes and cereals (in this case, cowpeas, groundnuts, and maize).The exceptions are root crops, such as yam and cassava, as these are single annual crops.Table 6A.1 summarizes these crop activities, as well as a description of the various param-eters, indices, and endogenous variables defined in the model.
Mathematically, the objective for each average farmer type i is represented by zi inequation 1 below—to maximize net profits (πi) minus its standard deviation (σi) acrossactivities ðXijkÞmultiplied by a risk parameter (ρ) whose values can be adjusted to reflect thedegree of risk aversion among farmers in each location. Specifically:
Max zi ¼ πi � ρiσi; 8i ð1ÞWhere:
πi ¼X
j
X
k
μijk �X
t
cijtXijkð1þ τÞ þX
t
ðw*t Loutit � wtLinit Þ; 8i
#"ð2Þ
[Expected income]
σi ¼ ffiffiffiffivi
p; and vi ¼
X
j
X
k
X
j 0
X
k0covjkj 0 k0 ð3Þ
[Standard deviation of gross margins]
And where:
μijk ¼1N
XN
n¼1
pnijynijl; 8ij ð20Þ
[Gross margins by crop activity]
vjkj0 k0 ¼1N
XN
n¼1
ðpnijynijk � μijkÞðpnij0 ynij0 k0 � μij0 k0 Þ; 8i ð30Þ
[Variance-covariance of gross margins by crop activity]
For the risk parameter values (ρi) in equation (1), we use the risk premium value ofρi = 1:485 for all farmer types (small, medium, and large). This was derived as the best-fitting value for aligning the model results with the actuals as revealed through the farmernarratives using the approach suggested by Hazell and Norton (1986). The model considers
OUP CORRECTED PROOF – FINAL, 30/7/2019, SPi
, , , 161

Table 6A.1. Summary description of model parameters and variables
a) Indices and subscripts
Index Description
i Farmer type i = small, medium, and largej Crop rotations and technology type, j = CPMZ, GNMZ, MZCP, MZGN, and
YMCS with improved or traditional variety seed, mechanized with chemicals,with fertilizer or not. YMCS=yam–cassava single intercrop. For the maize-based crops, the crop activities are sequenced by the bimodal season (1st cropis cultivated in the major season, and 2nd in the minor season later in the yearas a rotation on the same area plot—see Figure 6A.1 below): CPMZ=cowpea–maize rotation; GNMZ=groundnut–maize rotation; MZCP=maize–cowpearotation; MZGN=maize–groundnut rotation. Technology type are two seedvarieties (traditional or local and improved), inorganic fertilizer (with fourapplication rates: ¼, ½, 3/4, and full, based on a maximum recommendeddosage), and tractor and chemical use for cultivating and clearing land.
k Land type k = continuously cropped, previously fallowed, and cleared virginland
j0, k
0Primes of indices of j and k.
t Seasons by month of the year, t = 1, . . . , 12
n Years within each decade n = 1, . . . , N (N=10)
b) Exogenous or fixed parameters
Parameter Description
ρi Risk parameter of farmer type i, 0<ρi � 1:65
wt Seasonal going wage rate (monthly), t = 1, . . . , 12
wt* Seasonal wage earned for hiring out family labor (as a fraction of wt),t = 1, . . . , 12
pnij Annual average commodity prices at farm gate for each decade, n = 1, . . . , N(N=10)
ynijk Annual average commodity yields and by land type k, n = 1, . . . , N (N=10)τ Average interest rate
cijt Per hectare cost of purchasing inputs: seeds, fertilizer, chemicals, and the useof a tractor
fit Total adult equivalent family labor available each month t for farmer type i.
αjkt Per hectare labor requirements for land preparation, planting, weeding,applying chemicals and operating a tractor or each activity j and land type k
αhjkt Per hectare labor requirements for harvesting of crop activity j and with landtype k in month t and as a function of average yield, i.e., αhjt ¼ f ð�yijkÞ for amonth of harvesting.
c) Endogenous or choice variables
Parameter Description
πi Annual income or net profits per farmer type i and for each decade
μijk Gross margins of farmer type i, crop activity j, and by land type k
covjkj 0 k 0 Variance-covariance of gross margins for farmer type i, by crop activities j andland type k.
OUP CORRECTED PROOF – FINAL, 30/7/2019, SPi
162

two growing seasons and we assume that the covariance of income between the two seasonsis zero. This implies that expected utility for the year is simply the sum of the expectedutilities generated each season.
The symbols μijk and covjkj 0 k 0 in equations 20and 3
0above are the expected mean and
covariance of on-farm gross margins, respectively, for each cropping activity j and by typeof land k based on annual observations over each decade. The prime of j (or k) associates thecovariants between all activities adopted in the choice set, respectively. The subscripts i inthe mean profits (πi) and standard deviation of gross margins (σi) represent the three farmtypes: small, medium, and large. The j cropping activities include the five choice cropactivities and by technology types available (see Table 6A.1).
Xijk, Lfoutit and Lhit are choice variables as follows: Xijk is the acreage allocation to each
cropping activity and by land type; Lfoutit is own family labor hired out by farmer type i andin month t; and Lhit is labor hired in by farmer type i and in month t. Fixed parameters includethe following: wit is the going wage rate for hiring in labor, while w*it is a fraction of the goingwage rate for hiring out own family labor by farmer type. We assumed this changed over thedecades as increasingly more off-farm employment options grew over time. As such, thevalue of w*it was set at 40 percent, 50 percent, and 60 percent for the 1990, 2000, and 2010decades across the months; pij represents the average farm-gate price of each crop by activity j(all in constant 2015 Ghanaian cedi values); yij represents crop yields by activity j (crop andby technology type). Finally, cijt represents per unit costs for purchased inputs under eachactivity j in month t (also in constant 2015 Ghanaian cedi values).
The objective function in equation 1 is subjected to three resource constraints repre-senting an upper bound on the supply of labor, land, and a minimum amount of produc-tion to satisfy own consumption for maize, yam, and cassava. In mathematical terms, theresource constraints are as follows:
X
j
X
k
½αjkt þ αhjktð�yijkÞ�Xijk � Lfit þ Linit ; 8it ð4Þ
Where:
Lfit � ft � Loutit ð5Þ
[Labor supply constraint in month t]
X
j
Xijk � aik; 8ik ð6Þ
[Land availability constraint by land type]
vi Total variance of gross margins across activities and land types for farmer type i
σi Total standard deviation of gross margins across activities and land types forfarmer type i
Xijk Area located by each farmer type i to each crop activity j (including technologytype) and by land type k.
Linit Hired in labor for farmer type i and by season t
Lfit Own family labor used by farmer type i in season t, where Lfinit � fitLoutit Own family labor hired out by farmer type i in season t, where Lfoutit � fit
OUP CORRECTED PROOF – FINAL, 30/7/2019, SPi
, , , 163

Equation (4) is the main labor demand and supply equation—that is, labor requiredacross all production activities and land clearing for new land can be sourced only fromown family labor used (Lfit) and labor hired in (Linit ). The term αjt represents labor-usecoefficients (person hours) under each cropping activity for land preparation, planting, andweeding. Harvesting and shelling in the field is captured in the separate term αhjkt , which is afunction of average annual yields �yijk each decade by crop, technology, and land type. In themodel we also restrict the YMCS (yam–cassava) activity to virgin land only, based on theobserved practice of growing yam during the process of clearing land—burning the treesstumps around the yam mounds. These do not change over the decades. Most of theparameter values do not vary by land type except for land-clearing labor (not shown in thetable). For virgin land, this is set at fifty-one man-days per hectare for non-yam–cassavacrops and none for the YMCS crop mix as this is cultivated without clearing land. Theclearing of a previous plot in fallow for three years is assumed to be a quarter of the timerequired to clear virgin land.
Equation (5) implies that own labor used on the farm each month (Lfit) cannot exceedthe residual of each farm type’s adult equivalent household size (ft) and labor hired outoff the farm each month (Lfoutit ). A typical household size was assumed fixed over thedecades and equal across the three farm types. Assuming four adults (two males and twofemales) and two youth, who work 26 days per month, their adult equivalent are calculatedas ft ¼ 114:4 ði:e: 26 * ð2 þ 0:7 * 2 þ 0:5 * 2Þ in person days. For simplicity, we assumethere is no upper bound for hired labor (Linit ).²
Equation (6) is a simple land constraint that imposes upper limits on total land availableon the farm—that is, total cultivated area cannot exceed what the farmer already has access toon the farm as aik and by land type. The assumption on fixed availability of land type permitsus to impose the local circumstances of declining access to virgin and fallowed lands asobserved in the Ejura area. Table 6A.2 presents the share of land type to total area cultivatedacross the decades based on an earlier IFPRI/SARI survey undertaken in the target area in 2013(IFPRI/SARI 2013). From the table, use of fallowed land has declined significantly over time asfarmers increasingly faced a land frontier by the 2010 decade. Only 10 to 27 percent of areacultivated is previously fallowed land, and only 6 to 25 percent is recently cleared virgin land.
While access to credit is often considered as a limiting factor to adoption in devel-oping countries, we chose not to include it except to introduce a cost for using cash to
Table 6A.2. Percent shares in the type of land available by farm type and for eachdecade (1990–2010)
Farm type Large Medium Small
1990 2000 2010 1990 2000 2010 1990 2000 2010
Continuous 22% 44% 65% 29% 47% 66% 23% 45% 67%Fallowed 37% 24% 10% 56% 41% 27% 62% 45% 27%Virgin land 41% 33% 25% 16% 12% 8% 15% 11% 6%
Source: IFPRI/SARI Survey (2013).
² Earlier attempts to restrict it proved redundant given the small-size acreages and thus the smallquantity of hired labor demanded when own family labor becomes binding.
OUP CORRECTED PROOF – FINAL, 30/7/2019, SPi
164

purchase inputs, valued here at the current interest rate or τ in equation (2). Thevalue of τ varies by farmer type to capture the variance in access based on wealth andfarm size: small—30 percent, medium—25 percent, and large– 20 percent. This is keptconstant across the decades and is only meant to emphasize the greater difficulty foraccessing cash among poorer or small-farm-size households. We chose to ignore accessto credit in its traditional form as we are more interested in adoption patterns when landtype conditions change, rather than restricting the ability to pay for inputs altogether.
Among the improved technology types in the model, four are introduced across allfarm types and across the decades (not shown in the equations), including: improvedseeds only (T1); improved seeds and chemical application, e.g., inorganic fertilizer andherbicides (T2); improved seeds, chemical application, and mechanization (T3); andmechanization and improved seeds only (T4). Traditional technologies will be referredto as T0. Although pesticides (or insecticides) can be considered as a chemicalapplication—we impose these across all technology packages for cowpeas (with theexception of traditional technologies) because these are required regardless of the tech-nology type. Additionally, while mechanization in T3 and T4 refers to the use of tractorsduring land preparation, we also include chemical herbicides under both packages torepresent agricultural extensification (as both are labor-saving technologies). Agriculturalintensification, on the other hand, refers to improved seeds and fertilizer use only in T1and T2, respectively.
Other restrictions on technology use are imposed on yam, cassava, cowpea, andgroundnuts based on local practice. For example, the YMCS activity does not use anychemical inputs or mechanization while groundnuts and cowpeas within their respectiverotations do not use any fertilizer. Maize is the only crop using fertilizer in its rotationwith legumes. From the field interviews, mechanization was very minimal in the 1990sdue to its unavailability and high relative cost. Finally, the maize–legume crop rotationsare also affected by rotations across the two growing seasons based on the field interviewson local practices. Farmers claimed that typically they would halve the total area allocatedto the rotation as illustrated in Figure 6A.1. Basically, farmers break down their areaallocated to the rotation in half, growing maize in one plot and a legume in the other half.For the next season, they rotate but sticking to the same legume and cereal (maize in thiscase). According to them, this helps recover some soil nutrient losses by following such acereal-and-legume rotation.
Season 1 Season 2
½ acre Maize
½ acre Legume
½ acre Maize
½ acre Legume
Figure 6A.1. Crop rotations between maize and legume (groundnuts or cowpeas)for a one-acre plot example and between two growing seasons in the Ejura areaSource: Based on field interviews by the authors in Ejura.
OUP CORRECTED PROOF – FINAL, 30/7/2019, SPi
, , , 165

Data Sources and Calculations
Based on an extensive literature review and data sources, including one of the author’s ownpast work in Ghana (see Johnson et al. 2006), input and output coefficients, population,land-use patterns, prices, and crop area allocations, were compiled and reviewed for eachof the four decades being analyzed. The data and parameters used in the model are onlyfor the transitional zone and can be made available by the author upon request ([email protected]). Here we only present a few key parameters we wish to highlight—yields,means, and co-variance of gross margins.
For yields, a number of assumptions and calculations had to be undertaken in order tonot only capture changes in yield variability across decades, but yield differences accordingto both technology (seeds and fertilizer) and land type (continuous, fallowed, and virginlands), and accounting for the general decline in yields due to degradation in soil fertilityover time.
To capture the effect of technologies such as fertilizer (applied only to maize), a simplequadratic crop response function was specified, calculated frommaize yield estimates in theEjura area by Adjei-Nsiah et al. (2007):
ytðNÞ ¼ αt þ βN þ γN2; 8t ¼ 1990; . . . ; 2015 ð7Þ
Where, αt = is an intercept (known annual base yield), β = is a constant slopeparameter valued at 33.2, and γ = a negative quadratic term valued at –0.185. For eachdecade, the baseline yields also vary by the land on which they are being cultivated(continuous, fallowed, or on previous virgin lands) and by the type of seed (traditionalor improved). The N variable is weight of inorganic fertilizer applied at fivedifferent rates up to a maximum recommended dosage of 90 kg per hectare: N= 0 (nofertilizer application such that ytð0Þ= αt); N= 0:25 (one quarter the maximum dosage, or22.5 kg/ha); N= 0:50 (one half the maximum dosage, or 45.0 kg/ha); N= 0:75 (threequarters the maximum dosage, or 67.5 kg/ha); and, N= 1:00 (the full recommended max-imum dosage, or 90.0 kg/ha). Because we also wished to capture declining levels of soilfertility over time, we assumed the base yields in αt declined over time at about 7.2 percentper decade on average.
To allow for a time-series trend in yields and their variability, we had to rely onnational level trends given the absence of sufficient time-series data at the local level inEjura. These trends were adjusted to their base levels in the Ejura region. Combining thisinformation with the fertilizer to yield the response function described above, we esti-mated the pattern of yield changes over time by the type of seed used and from fallowed landsonly. These were then compared with actual observed yields based on interviewee estimates inthe field and secondary data sources from the Ministry of Food and Agriculture (MoFA) andUnited Nations’ Food and Agricultural Organization statistical database (FAOSTAT) forconsistency.
Final averaged yields across the decades are reported in Table 6A.3. From the table,yields for local seeds are shown to decline over time under a continuous cropping systemand reduced fallow as nutrients are mined from the soil. This has actually been occurring inEjura as fallowed and virgin lands have become increasingly scarce. On the other hand, weassumed the average yield from improved varieties will still rise some (although veryslightly) under continuous cropping as new higher-yielding varieties are introduced eachyear and in spite of the decline in soil fertility. Both seeds perform quite well with the
OUP CORRECTED PROOF – FINAL, 30/7/2019, SPi
166

introduction of fertilizer—although the improved variety always outperforms local seeds’response to fertilizer as would be expected. We assume yields on virgin lands to not changeover the years for local seeds.
For prices, local prices were cross-checked with those from the Ministry of Food andAgriculture (MoFA) for Ejura. Because prices of vegetables were only a proxy usingtomatoes, the prices subsequently were adjusted during model calibration. It was alsoobserved that local prices for yams and cassava fluctuated a lot, and are often lower thanthe numbers reported. The same is true with yields for both crops, as these are inherentlydifficult to measure (as tubers). As such, prices for these two commodities were alsoadjusted during model calibration—especially for the 1980s and 1990s decades. The finalprices used in the model are shown in Figure 6A.2, including corresponding estimates ofgross margins. The variations in gross margins and prices appear to be quite similar,implying that price variation has been more volatile than yields.
One thing that stands out immediately in Figure 6A.2 is the higher variance in priceand gross margins for most of the commodities in the 2000 decade (aside from cowpeas,yams, and cassava). This was a period when food prices rose sharply in the latter half ofthe 2000 decade. The volatility in prices remained higher than in the 1990s duringthe more recent decade (2010) for cassava only. Among the five commodities, maizeand groundnuts recorded the highest volatility in gross margins in 2000—whichexplains some of the shifting away from groundnuts to cowpea cultivation in the farm
Table 6A.3. Maize yields by type of seed and responses to fertilizer
No fertilizerapplication
S2, with fertilizer (applicationrates—% of maximum dosagerecommended)
Ratio(Seeds)
Ratio(Fertilizer)
S1 S2 25% 50% 75% 100% S2/S1 100% app/No app
a b c b/a c/b
Continuously cropped1990 793 1,025 1,554 1,931 2,156 2,229 1.29 2.182000 736 1,213 1,795 2,210 2,458 2,538 1.65 2.092010 683 1,402 1,984 2,399 2,647 2,727 2.05 1.94
Previously fallowed1990 855 1,104 1,634 2,011 2,236 2,309 1.29 2.092000 834 1,276 1,858 2,273 2,521 2,601 1.53 2.042010 794 1,439 2,021 2,435 2,683 2,763 1.81 1.92
Cleared virgin land1990 855 1,104 1,634 2,011 2,236 2,309 1.29 2.092000 855 1,308 1,890 2,304 2,552 2,632 1.53 2.012010 855 1,512 2,093 2,508 2,756 2,836 1.77 1.88
Annual growth (%)Continuous –0.6 1.5 1.1 1.0 0.9 0.9 n.a. n.a.Fallowed –0.3 1.2 0.9 0.8 0.8 0.8 n.a. n.a.Virgin land 0.0 1.5 1.1 1.0 0.9 0.9 n.a. n.a.
Source: Authors’ calculations from model data.
OUP CORRECTED PROOF – FINAL, 30/7/2019, SPi
, , , 167

model solutions. In general, expected gross margins and their variances also rise withhigher-yielding technology and/or land type combinations—which can affect the rate ofadoption each decade under risk-averse behavior.
With regard to input costs, wages have grown more significantly since 2000, essentiallymore than doubling. We assumed off-farm wages are typically less than the cost of hiring inlabor, due to either search costs, or as is more common, leasing out labor at a period whendemand for labor is lower and pays less. Nevertheless, to capture recent improvements inroad infrastructure and transportation, and therefore access to off-farm employmentopportunities in the Ejura area, we allow this wage to rise until it is about equal to thewage for hiring in labor by 2010. Base values for farm sizes and area allocations to crops wasderived from both the group interviews of farmers in the Ejura area and data collected byIFPRI in 2012 in the same area.
a) Gross margins
b) Prices
0.00
0.20
0.40
0.60
0.80
1.00
1.20
1990
1992
1994
1996
1998
2000
2002
2004
2006
2008
2010
2012
2014
Cedi
/Kg
0
500
1,000
1,500
2,000
2,500
1990
1992
1994
1996
1998
2000
2002
2004
2006
2008
2010
2012
2014
Cedi
/ha
0.00
0.05
0.10
0.15
0.20
0.25
0.30
0.35
0.40
1990 2000 2010
Within decade coefficient of variation
0.000.050.100.150.200.250.300.350.400.450.50
1990 2000 2010
Within decade coefficient of variation
Cowpea Cassava GroundnutsMaize Yam
Cowpea Cassava GroundnutsMaize Yam
Figure 6A.2. Gross margins and annual price trends in Ejura, 1980–2015(constant 2015 US$/kg)Source: MoFA national monthly price data, 1980–2010. For the more recent years, 2011–15, these aretaken from monthly recorded prices in Ejura and adjusted with previous national trends.
OUP CORRECTED PROOF – FINAL, 30/7/2019, SPi
168

References
Adjei-Nsiah, S., T. W. Kuyper, C. Leeuwis et al. 2007. “Evaluating Sustainable andProfitable Cropping Sequences with Cassava and Four Legume Crops: Effectson Soil Fertility and Maize Yields in the Forest/Savannah Transitional Agro-Ecological Zone of Ghana.” Field Crops Research 103(2): 87–97.
Amanor, K. S., and O. Pabi. 2007. “Space, Time, Rhetoric and Agricultural Changein the Transition Zone of Ghana.” Human Ecology 35: 51–67.
Brooke, A., D. Kendrick, and A. Meeraus. 1998. GAMS: A User’s Guide. RedwoodCity: The Scientific Press.
Ghana Statistical Service. 1998. Ghana living standards survey data 1998. Accra.
Ghana Statistical Service. 2000. Ghana living standards survey data 2000. Accra.
Ghana Statistical Service. 2005. Ghana living standards survey data 2005. Accra.
Ghana Statistical Service. 2010. Ghana living standards survey data 2010. Accra.
Ghana Statistical Service. 2012. Ghana living standards survey data 2012. Accra.
Hazell, P. B. R., and R. D. Norton. 1986. “Mathematical Programming forEconomic Analysis in Agriculture.” New York: Macmillan.
Houssou1, Nazaire, Michael Johnson, Shashidhara Kolavalli, and Collins Asante-Addo. 2017. “Changes in Ghanaian Farming Systems: Stagnation or a QuietTransformation?” Agriculture and Human Values 35(1): 41–66.
Johnson, M., W. A. Masters, and P. V. Preckel. 2006. “Diffusion and Spillover ofNew Technology: A Heterogeneous-agent Model for Cassava in West Africa.”Agricultural Economics 35(2): 119–129.
Ragasa, C., A. Dankyi, P. Acheampong et al. 2013. “Patterns of Adoption of ImprovedMaize Technologies in Ghana.” GSSP Working Paper No. 35. Washington, DC:International Food Policy Research Institute.
OUP CORRECTED PROOF – FINAL, 30/7/2019, SPi
, , , 169

7Public Expenditure on Agriculture
and its Impact
Samuel Benin
7.1 Introduction
Along with the creation of enabling policies, public investment in agricultureplays a crucial role in promoting agricultural growth and conditioning itsdistributional outcomes. These linkages are well established in the literature(Aschauer 1989; Barro 1990; Thirtle et al. 2003; Fan 2008), but their realizationrequires sufficient levels of public spending, the right types of spending (e.g.,amongst agricultural research, extension, irrigation, input subsides, roads,education, and health), an appropriate distribution of spending across geo-graphic areas to improve the distributional outcomes and impacts, and strik-ing an appropriate balance between capital investment for long-term growthand recurrent costs incurred in providing public services.
This chapter examines past patterns of public spending on agriculture inGhana, and asks whether Ghana has invested enough resources in agricultureand how the patterns of investment in the sector have impacted agriculturalproductivity growth.
The scope and rigor of the analysis is constrained by the available data,and only partial insights are possible drawing on a variety of data sourcesand studies. The chapter is structured as follows. The next section examinestrends in public agriculture spending over the period 1961–2012, and dis-aggregates that spending into the cocoa and noncocoa sectors. The noncocoasubsector is managed by the general government sector within the nationalbudget and procurement systems, whereas the cocoa subsector is managedexclusively by a public corporation or state-owned enterprise—Ghana CocoaBoard (Cocobod)—directly from the proceeds of the export of cocoa beanspurchased from the farmers. Relative to the subsector’s value-added, theamount spent by the Cocobod on the cocoa subsector far outweighs theamount spent by the government on the noncocoa subsector, which includes
OUP CORRECTED PROOF – FINAL, 30/7/2019, SPi

all the country’s food staples. To obtain more detailed insights about thetypes of spending within the agricultural sector, we draw on a study byBenin et al. (2012) who provide some insights into the types of governmentspending and their regional allocation for the period 2000–7. The subsequentsection then reports on two econometric analyses that estimate the impact ofpublic spending on agricultural productivity growth, and provide some usefulinsights into the marginal returns to public investments in the cocoa andnoncocoa subsectors, and by type of public investment. This is followed by adiscussion of the government’s recent attempts to promote noncocoa agricul-tural growth through several new subsidy programs, and this leads to ourconcluding section.
7.2 Trends in Public Agriculture Spending, 1961–2012
7.2.1 Data Sources
Data on public agriculture expenditure in Ghana were compiled from variousnational and international sources from 1961 to 2012 for the agriculture sectoras a whole, and separately for the cocoa and noncocoa subsectors (Table 7.1).The noncocoa subsector includes noncocoa crops (including food staples),livestock, forestry, and fishery. Agricultural production data were compiledfrom FAOStat, and disaggregated for the cocoa and noncocoa subsectors.
Table 7.1. Data sources for public spending and agricultural output, 1961–2012
Variable Description/Disaggregation Data sources
Totalexpenditure(TE)
Total government expenditure inconstant 2006 GHS, million
Stryker (1990), IMF (1998, 2000,2005), Kolavalli et al. (2012),MoFA (2013), GCB (2013), CAGD(2011, 2013, 2014), IFPRI (2015),World Bank (2015)
Agriculturalpublicexpenditure(agEXP)
Government expenditure onagriculture in constant 2006 GHS,million, disaggregated into:• Cocoa subsector• Noncocoa subsector (noncocoacrops, livestock, forestry, fishery)
Agriculturaloutput (Y)
Gross output in constant 2004–6GHS, million, divided byagricultural area (including arableland, permanent crops, permanentmeadows and pastures, forest area,and inland water), disaggregated into:• Cocoa subsector• Noncocoa subsector
FAO (2016)
OUP CORRECTED PROOF – FINAL, 30/7/2019, SPi
171

Appendix Table 7A shows details of how the annual expenditure data werecompiled, including the sources for each data point.
7.2.2 Trends in Public Agriculture Expenditureand Output per Hectare
Trends in agricultural public expenditure and gross agricultural output perhectare of agricultural land are shown in Figures 7.1 and 7.2, respectively, andTable 7.2. The ratio of expenditure to output is shown in Figure 7.3 There havebeen considerable fluctuations in public spending over the years, driven bychanging governments and their policy agendas, but very little upward trenduntil the 1990s after the economic reforms. Spending by the Cocobod on the
0
200
400
600
800
1000
1961 1966 1971 1976 1981 1986 1991 1996 2001 2006 2011
Cons
tant
200
6 G
HS,
mill
ion Total Noncocoa Cocoa
Figure 7.1. Agricultural public expenditure in Ghana by subsector, 1961–2012Note: GHS = Ghanaian cedi. Expenditure on the noncocoa subsector is by the government and that onthe cocoa subsector is by the Cocobod. Total is from adding the two.
Source: Author’s illustration based on compiled data (see Tables 7.1 and 7A).
0
200
400
600
1961 1966 1971 1976 1981 1986 1991 1996 2001 2006 2011
Cons
tant
200
4–6
GH
Spe
r hec
tare
Total Noncocoa Cocoa
Figure 7.2. Agricultural output per hectare by subsector in Ghana, 1961–2012Note: GHS = Ghanaian cedi.
Source: Author’s illustration based on FAO (2016).
OUP CORRECTED PROOF – FINAL, 30/7/2019, SPi
172
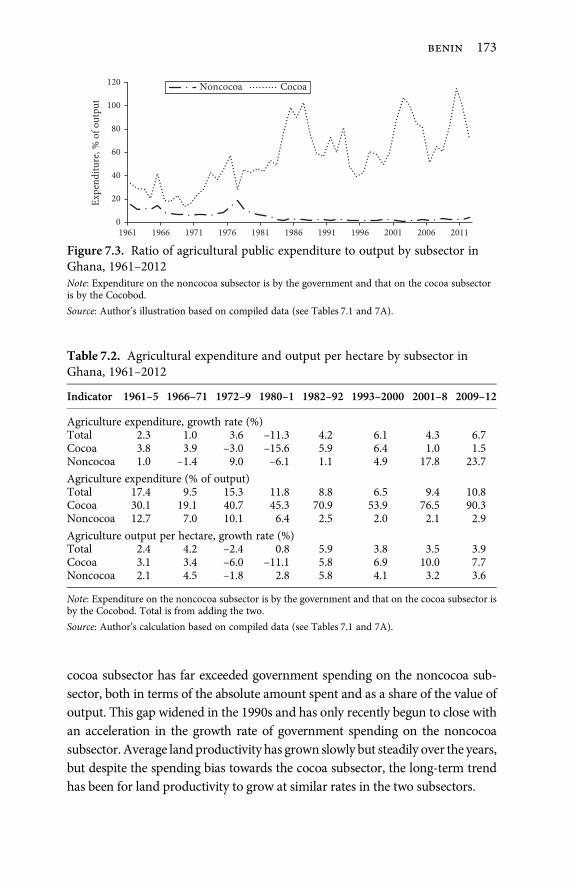
cocoa subsector has far exceeded government spending on the noncocoa sub-sector, both in terms of the absolute amount spent and as a share of the value ofoutput. This gap widened in the 1990s and has only recently begun to close withan acceleration in the growth rate of government spending on the noncocoasubsector. Average landproductivity has grown slowly but steadily over the years,but despite the spending bias towards the cocoa subsector, the long-term trendhas been for land productivity to grow at similar rates in the two subsectors.
0
20
40
60
80
100
120
1961 1966 1971 1976 1981 1986 1991 1996 2001 2006 2011
Expe
nditu
re, %
of o
utpu
tNoncocoa Cocoa
Figure 7.3. Ratio of agricultural public expenditure to output by subsector inGhana, 1961–2012Note: Expenditure on the noncocoa subsector is by the government and that on the cocoa subsectoris by the Cocobod.
Source: Author’s illustration based on compiled data (see Tables 7.1 and 7A).
Table 7.2. Agricultural expenditure and output per hectare by subsector inGhana, 1961–2012
Indicator 1961–5 1966–71 1972–9 1980–1 1982–92 1993–2000 2001–8 2009–12
Agriculture expenditure, growth rate (%)Total 2.3 1.0 3.6 –11.3 4.2 6.1 4.3 6.7Cocoa 3.8 3.9 –3.0 –15.6 5.9 6.4 1.0 1.5Noncocoa 1.0 –1.4 9.0 –6.1 1.1 4.9 17.8 23.7
Agriculture expenditure (% of output)Total 17.4 9.5 15.3 11.8 8.8 6.5 9.4 10.8Cocoa 30.1 19.1 40.7 45.3 70.9 53.9 76.5 90.3Noncocoa 12.7 7.0 10.1 6.4 2.5 2.0 2.1 2.9
Agriculture output per hectare, growth rate (%)Total 2.4 4.2 –2.4 0.8 5.9 3.8 3.5 3.9Cocoa 3.1 3.4 –6.0 –11.1 5.8 6.9 10.0 7.7Noncocoa 2.1 4.5 –1.8 2.8 5.8 4.1 3.2 3.6
Note: Expenditure on the noncocoa subsector is by the government and that on the cocoa subsector isby the Cocobod. Total is from adding the two.
Source: Author’s calculation based on compiled data (see Tables 7.1 and 7A).
OUP CORRECTED PROOF – FINAL, 30/7/2019, SPi
173

To better understand these trends and fluctuations in public expenditure, itis useful to relate them to the underlying agricultural policies of successivegovernments. Major influential factors include the following:
• Until 1990, there was direct agricultural production by the governmentthrough state farms and cooperatives.
• Subsidization of farm production stopped in 1990 and returned in 2007.
• Implementation of policies and strategies was mostly through projectsuntil the 1990s and then through programs and sector-wide approachesafterward.
• Government and public spending was decentralized, including the enact-ment of the Local Government Law in 1988, establishment of the DistrictAssembly Common Fund in 1993, and implementation of direct districtbudgeting and execution starting in 2012.
• Agricultural public expenditure reviews were conducted in 1977, 1998,2006, and 2012.
• The country signed the CAADP compact in 2009.
• Specific to the cocoa subsector, Cocobod is constitutionalized in 1984,licensed buying companies are introduced in 1993, the Produce BuyingCompany is privatized in 1999, and a hi-tech program is initiated in2004.
Table 7.2 summarizes the trends in public expenditure and land productiv-ity by sub-periods that correspond to successive governments, beginning in1961. A short summary of the agricultural policies of each period follows.
7.2.2.1 1958 to 1966
The post-Independence policies of the Convention People’s Party governmentled by Dr. Kwame Nkrumah extended until 1966, and were dictated by theoverall economic development agenda of rapid industrialization, which wasprimarily financed by taxing agriculture. An Agricultural Development Cor-poration (ADC) was established to promote the production of export crops(mainly cocoa) for foreign exchange earnings and production of industrialcrops (mainly rubber, sugar cane, oil palm, and cotton) to feed the ambitiouslocal factories that were being set up. As such, the bulk of agriculture expend-iture was allocated to ADC and spent on input subsidies (imports of fertilizers,other chemicals, tractors, and implements) and on distribution and marketingof produce associated with the state farms. Following the ADC’s forced closure
OUP CORRECTED PROOF – FINAL, 30/7/2019, SPi
174

in 1962, due to its accumulated large debts and unsuccessful large-scaleproduction and marketing activities, state farms and cooperatives were estab-lished to take over ADC’s projects and the ministry’s stations. Price controls,input and credit subsidies, and obligatory credit allocations continued to beused to support the heavy state involvement in agricultural production,distribution, and marketing (Stryker 1990; Dappah 1995). At the time ofNkrumah government’s overthrow in 1966, there were 105 state farms(42 of them were inherited from ADC) cultivating about 22,396 hectares,with 62 percent under permanent crops (mainly rubber, oil palm, sugarcane, cotton, coconut, banana, and kola nut) and the remaining 38 percentunder food crops (mainly maize and rice) (Austin and Luckham 1975). AsTable 7.2 shows, agriculture expenditure in 1961–5 grew at an annual averagerate of 2.3 percent, with expenditures on cocoa growing faster (3.8 percent)than combined expenditures on the noncocoa subsector (1.0 percent). Theamount spent as a share of the respective subsector’s agricultural output wasmuch higher for cocoa (30.1 percent) than for noncocoa (12.7 percent).Growth in the land productivity for the agricultural sector as a whole averaged2.4 percent year, with growth in the noncocoa subsector (2.1 percent) beinglower compared with the growth in the cocoa subsector (3.1 percent).
7.2.2.2 1966 to 1971
This era was governed by the National Liberation Council military govern-ment under Lieutenant General Joseph Arthur Ankrah and Lieutenant Gen-eral Akwasi Afrifa (1966–9), followed by the second republic under DoctorKofi Busia and the Progress Party (1969–72). The main strategy of theNational Liberation Council government that had significant bearing on thelevel of agriculture expenditure and how it was allocated was in trying to wardoff the domestic crisis (mainly, high food prices and low producer prices) andto pay off the large debts amassed by the previous government (Austin andLuckham 1975). Doing so involved stimulating more agricultural primaryexports (cocoa and timber) and cutting back on direct state involvement inagricultural production. For example, between the 1966 coup d’état and May1968, the producer price of cocoa was doubled, no new state farms wereestablished, and some state farms and factories were closed or sold off. Thistrend continued into the Busia-led government. Although there was markedstructural change in the rest of the economy (especially nationalism andpromotion or takeover of businesses by Ghanaians), agricultural policy andfinance mostly continued as before—that is, promoting production of cocoafor export, promoting industrial crops to feed factories, importing and
OUP CORRECTED PROOF – FINAL, 30/7/2019, SPi
175
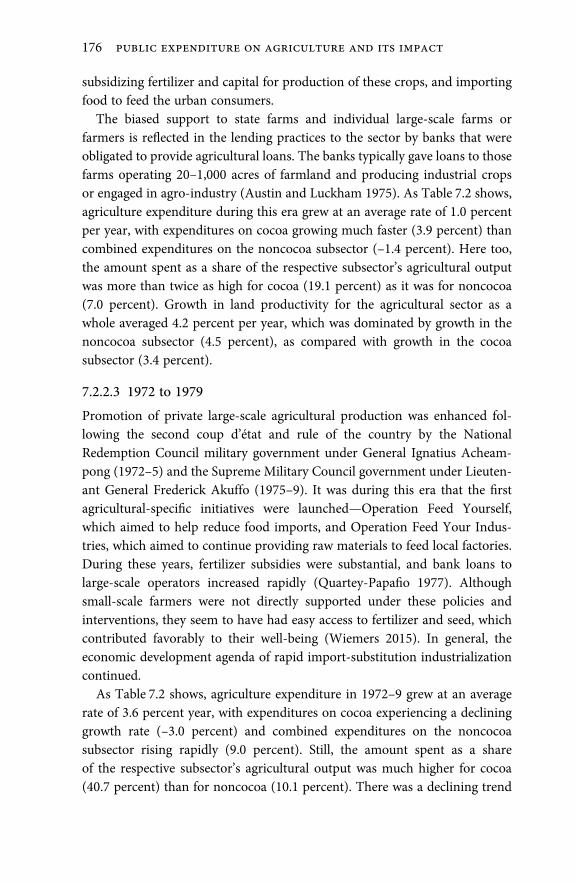
subsidizing fertilizer and capital for production of these crops, and importingfood to feed the urban consumers.
The biased support to state farms and individual large-scale farms orfarmers is reflected in the lending practices to the sector by banks that wereobligated to provide agricultural loans. The banks typically gave loans to thosefarms operating 20–1,000 acres of farmland and producing industrial cropsor engaged in agro-industry (Austin and Luckham 1975). As Table 7.2 shows,agriculture expenditure during this era grew at an average rate of 1.0 percentper year, with expenditures on cocoa growing much faster (3.9 percent) thancombined expenditures on the noncocoa subsector (–1.4 percent). Here too,the amount spent as a share of the respective subsector’s agricultural outputwas more than twice as high for cocoa (19.1 percent) as it was for noncocoa(7.0 percent). Growth in land productivity for the agricultural sector as awhole averaged 4.2 percent per year, which was dominated by growth in thenoncocoa subsector (4.5 percent), as compared with growth in the cocoasubsector (3.4 percent).
7.2.2.3 1972 to 1979
Promotion of private large-scale agricultural production was enhanced fol-lowing the second coup d’état and rule of the country by the NationalRedemption Council military government under General Ignatius Acheam-pong (1972–5) and the Supreme Military Council government under Lieuten-ant General Frederick Akuffo (1975–9). It was during this era that the firstagricultural-specific initiatives were launched—Operation Feed Yourself,which aimed to help reduce food imports, and Operation Feed Your Indus-tries, which aimed to continue providing raw materials to feed local factories.During these years, fertilizer subsidies were substantial, and bank loans tolarge-scale operators increased rapidly (Quartey-Papafio 1977). Althoughsmall-scale farmers were not directly supported under these policies andinterventions, they seem to have had easy access to fertilizer and seed, whichcontributed favorably to their well-being (Wiemers 2015). In general, theeconomic development agenda of rapid import-substitution industrializationcontinued.
As Table 7.2 shows, agriculture expenditure in 1972–9 grew at an averagerate of 3.6 percent year, with expenditures on cocoa experiencing a declininggrowth rate (–3.0 percent) and combined expenditures on the noncocoasubsector rising rapidly (9.0 percent). Still, the amount spent as a shareof the respective subsector’s agricultural output was much higher for cocoa(40.7 percent) than for noncocoa (10.1 percent). There was a declining trend
OUP CORRECTED PROOF – FINAL, 30/7/2019, SPi
176

in land productivity for the entire agricultural sector, which averaged –2.4percent per year, with the decline in the noncocoa subsector (–1.8 percent)being lower than in the cocoa subsector (–6.0 percent).
7.2.2.4 1979 to 1981
Following another coup d’état in June 1979 came the brief military govern-ment of the Armed Forces Revolutionary Council, led by Flight LieutenantJerry John Rawlings from June to September 1979, and then the third republic,led by the government of the People’s National Party under Doctor HillaLimann from September 1979 to December 1981. Dr. Limann’s governmentlaunched a two-year program, Action Programme for Agricultural Produc-tion, 1980–1 (Andah 1980). As Table 7.2 shows, there was negative growth inmost indicators during this relatively short period, likely reflecting the widelyacclaimed economic mismanagement of the government prior to the coupd’état. The amount spent as a share of the respective subsector’s agriculturaloutput continued to be much higher for cocoa (45.3 percent) than for non-cocoa (6.4 percent).
7.2.2.5 1982 to 2000
Jerry Rawlings came back to power, first through another coup d’état underthe government of the Provisional National Defence Council from the eve of1982 until 1993, and then through the ballot box, ushering in the fourthrepublic under the National Democratic Congress government until January2001. This roughly twenty-year period is known for the Structural AdjustmentProgram, which is locally called the Economic Recovery Program. In addition,numerous agricultural sector–specific plans, strategies, projects, or programswere launched. As expected with the structural adjustment, there was a sub-stantial cutback in government spending in general, and agricultural inputsubsidies were stopped in 1990. Overall agriculture expenditure grew at anaverage rate of 4.2 percent in 1982–92 and 6.1 percent in 1993–2000, withexpenditures on the cocoa subsector growing faster than combined expend-itures on the noncocoa subsector. As Table 7.2 shows, the amount spent as theshare of the respective subsector’s agricultural output continued to be muchhigher for the cocoa subsector than for the noncocoa subsector.
With the launch of the Local Government Law, the decentralization policy,and institution of the District Assembly Common Fund, direct spending andaccounting of expenditures at lower levels increased, likely increasing thetargeting of expenditures for agricultural and rural development (Moguesand Benin 2012). Comparative growth in land productivity was mixed,
OUP CORRECTED PROOF – FINAL, 30/7/2019, SPi
177

however; whereas it was equal (5.8 percent per year) in the cocoa andnoncocoa subsectors in 1982–92, it was higher for the cocoa subsector (6.9 percentper year) than for the noncocoa subsector (4.1 percent percent) in 1993–2000.
7.2.2.6 2001 to 2008
With the National Patriotic Party, led by John Agyekum Kufuor, coming intopower in January 2001, there was a shift from project-based agriculturaldevelopment to program-based and sector-wide approaches. Some of themost influential approaches on the sector were the Presidential Special Initia-tives, the Agricultural Services Subsector Investment Program, and the Foodand Agricultural Sector Development Policy, among others. It was during thisera that CAADP, the Africa-wide, agriculture-led development initiative, waslaunched in the continent, though Ghana did not officially complete and signits national compact until 2009. The CAADP raised the profile of agriculturalexpenditures and influenced the definition and accounting of agricultureexpenditure (the debate of which continues today).
In 2007, the government announced that it would reintroduce agriculturalinput subsidies (fertilizer, block farms, mechanization, and buffer stock) andthen went on to spend an average of GHS 7.9 million each year in 2007 and2008 to implement it (Benin et al. 2013). Direct spending at subnational levelscontinued. As Table 7.2 shows, at the national level, agriculture expenditureduring this era grew at an average rate of 4.3 percent per year, with growth inexpenditure on the cocoa subsector being almost stagnant (1.0 percent)compared with growth in expenditure on the noncocoa subsector (17.8 percent).The amount spent as a share of the respective subsector’s agricultural outputcontinued to be much higher for cocoa than for noncocoa. For example, theshare of expenditure on cocoa as a share of the subsector’s agriculturaloutput was 76.5 percent, compared with only 2.1 percent for the noncocoasubsector. Growth in land productivity for the entire agricultural sectoraveraged 3.5 percent per year, with the average growth being lower in thenoncocoa subsector (3.2 percent), compared with growth in the cocoasubsector (10.0 percent).
7.2.2.7 2009 to 2012
From January 2009 until 2016, the National Democratic Congress has beenthe ruling government in Ghana—first under Professor John Evans AttaMills (2009–12) and then John Dramani Mahama (2012–16). Some of thekey policies, programs, and projects undertaken during this era include theGhana Commercial Agriculture Project and the Soil, Land, and Water
OUP CORRECTED PROOF – FINAL, 30/7/2019, SPi
178

Management Project. Direct spending at subnational levels continued. In2012, the composite budgeting system was introduced for all metropolitan,municipal, and district assemblies¹ to effect fiscal decentralization of the1988 Local Government Law, in which all decentralized functions of gov-ernment are directly managed by the assemblies at the respective levels ofgovernment.
Agricultural input subsidies also remained strong. The overall trends inagriculture expenditure at the national level are similar to trends seen in thepreceding periods analyzed. For example, agriculture expenditure during2009–12 grew at an average rate of 6.7 percent per year, with expenditure oncocoa barely growing (1.5 percent), as compared with combined expenditureon the noncocoa subsector (23.7 percent). The share of expenditure on cocoaas a share of the subsector’s agricultural output was 90.3 percent per year,compared with only 2.9 percent per year for the noncocoa subsector. Growthin land productivity for the entire agricultural sector was 3.9 percent, withgrowth in the cocoa subsector (7.7 percent) outperforming growth in thenoncocoa subsector (3.6 percent).
7.2.2.8 Overall trends from 1961 to 2012
To summarize, overall agricultural policy and expenditure have favored thecocoa subsector. Between 1961 and 2012, the periods over which the data usedhere are available, agricultural expenditure on the cocoa subsector grew atan average rate of 3.7 percent per year, compared with –0.3 percent for thenoncocoa subsector. The share of expenditures on the cocoa subsector as ashare of the subsector’s agricultural output was 57.6 percent per year, com-pared to only 3.7 percent per year for the noncocoa subsector. The annualaverage growth rate in land productivity for the entire agricultural sectoraveraged 3.3 percent per year, driven by growth in the noncocoa subsector(3.7 percent), as compared with growth in the cocoa subsector (1.0 percent).
In terms of fulfilling its Maputo Declaration target of allocating at least10 percent of total government spending to agriculture, Ghana has failed tomeet this requirement, amidst several reports that show otherwise followingconfusion on differentiating mostly expenditures of the government sectorand those of public corporations such as the Ghana Cocoa Board (Benin2014). Considering only expenditures of the general government sector(i.e., expenditures on the noncocoa subsector as shown in Table 7.2), the
¹ These include six metropolitan assemblies, forty-nine municipal assemblies, and 161 districtassemblies.
OUP CORRECTED PROOF – FINAL, 30/7/2019, SPi
179

share of government expenditure on agriculture as a share of total governmentexpenditure amounts to only 2.1 percent during 2001–8 and 2.8 percentduring 2009–12. This is low even by African standards (Benin and Yu 2013),especially as it includes all the country’s food staples. When expenditures ofthe Ghana Cocoa Board are included as part of public expenditures onagriculture, and expenditures of other public corporations are included aspart of total public expenditure, Benin (2014) estimates the share to be about3.8–5.3 percent, which still falls short of the 10 percent Maputo Declarationtarget.
7.2.3 Composition of Public Spending on Agriculture, 2000–7
Benin et al. (2012) provide more detailed insights into the composition ofpublic spending in rural areas for 2000–7. Their analysis includes levels andtrends for public spending differentiated by type of spending and by regionalpriorities. Government spending on agriculture is channeled through a num-ber of ministries and institutions² and Benin et al. (2012) report these by majorchannel in Table 7.3. The government’s resource allocation to the agriculturalsector increased by nearly four times between 2000 and 2007³. Interestingly,MoFA, the conventional ministry responsible for the agricultural sector,accounted for only 25 percent of total public spending on the sector, downfrom about one half of the total expenditures in the sector in the mid-1990s(MoFA 1999). The share for CSIR average 14.2 percent, increasing from12.5 percent in 2000 to 27.2 percent in 2007. This shows that agencies other
² Public spending on the agricultural sector takes place not only through conventional allocation bythe Ministry of Agriculture, but also through various other government ministries, departments, andagencies, in addition to public corporations or state-owned enterprises. In Ghana for example, fisheryand forestry each fall under their own separate ministry, both distinct from the Ministry of Food andAgriculture (MoFA), which is responsible for crops, other than cocoa, and livestock. Cocoa is managedby the Ghana Cocoa Board (Cocobod), which in turn is under the Ministry of Finance and EconomicPlanning. Agricultural R&D is managed by the Council for Scientific and Industrial Research (CSIR),which reports to the Ministry of Education, Sports, and Science. Other expenditures related toagriculture in Ghana are undertaken by the Ministry of Trade and Industry (such as spending relatingto food imports and agricultural marketing and trade), the Ministry of Roads and Transport (such asfeeder roads development), the Ministry of Local Government and Rural Development, Ministry ofWomen and Children’s Affairs, Ministry of Manpower Development and Employment (all threeallocate resources to agricultural community-based development projects), and the Presidential SpecialInitiatives on agriculture. Thus, even with a clearly defined agricultural sector, it is usually difficult toobtain expenditure data on the sector when the audited public accounts do not have clearly defined lineitems for each of the above, and as the ministries and institutions evolve.³ Unless otherwise stated, all monetary values are in 2000 constant prices.
OUP CORRECTED PROOF – FINAL, 30/7/2019, SPi
180
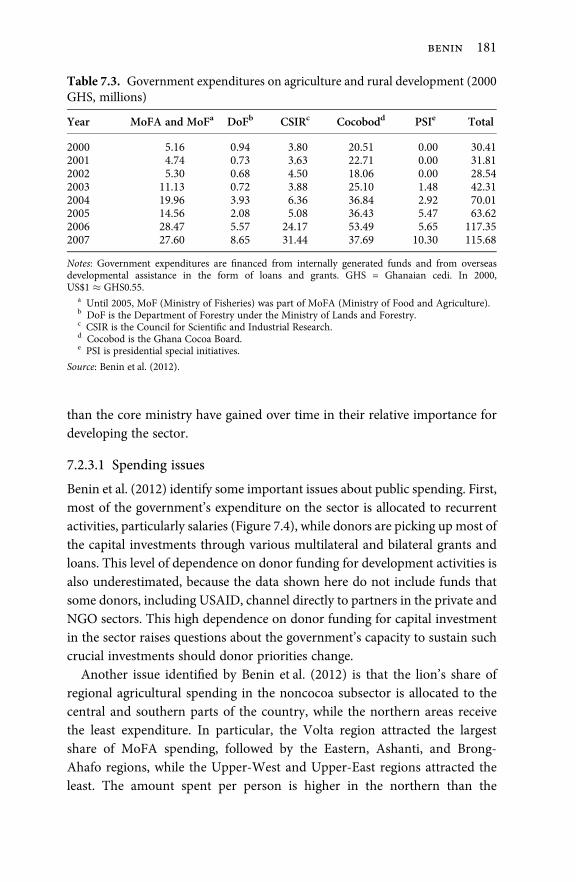
than the core ministry have gained over time in their relative importance fordeveloping the sector.
7.2.3.1 Spending issues
Benin et al. (2012) identify some important issues about public spending. First,most of the government’s expenditure on the sector is allocated to recurrentactivities, particularly salaries (Figure 7.4), while donors are picking up most ofthe capital investments through various multilateral and bilateral grants andloans. This level of dependence on donor funding for development activities isalso underestimated, because the data shown here do not include funds thatsome donors, including USAID, channel directly to partners in the private andNGO sectors. This high dependence on donor funding for capital investmentin the sector raises questions about the government’s capacity to sustain suchcrucial investments should donor priorities change.
Another issue identified by Benin et al. (2012) is that the lion’s share ofregional agricultural spending in the noncocoa subsector is allocated to thecentral and southern parts of the country, while the northern areas receivethe least expenditure. In particular, the Volta region attracted the largestshare of MoFA spending, followed by the Eastern, Ashanti, and Brong-Ahafo regions, while the Upper-West and Upper-East regions attracted theleast. The amount spent per person is higher in the northern than the
Table 7.3. Government expenditures on agriculture and rural development (2000GHS, millions)
Year MoFA and MoFa DoFb CSIRc Cocobodd PSIe Total
2000 5.16 0.94 3.80 20.51 0.00 30.412001 4.74 0.73 3.63 22.71 0.00 31.812002 5.30 0.68 4.50 18.06 0.00 28.542003 11.13 0.72 3.88 25.10 1.48 42.312004 19.96 3.93 6.36 36.84 2.92 70.012005 14.56 2.08 5.08 36.43 5.47 63.622006 28.47 5.57 24.17 53.49 5.65 117.352007 27.60 8.65 31.44 37.69 10.30 115.68
Notes: Government expenditures are financed from internally generated funds and from overseasdevelopmental assistance in the form of loans and grants. GHS = Ghanaian cedi. In 2000,US$1 � GHS0.55.
a Until 2005, MoF (Ministry of Fisheries) was part of MoFA (Ministry of Food and Agriculture).b DoF is the Department of Forestry under the Ministry of Lands and Forestry.c CSIR is the Council for Scientific and Industrial Research.d Cocobod is the Ghana Cocoa Board.e PSI is presidential special initiatives.
Source: Benin et al. (2012).
OUP CORRECTED PROOF – FINAL, 30/7/2019, SPi
181

southern areas, but the amount spent per hectare of land area is smaller inthe north.
A final issue concerns the allocation of public expenditure across differenttypes of spending. Access to other public goods and services such as educa-tion, health, roads, and other infrastructure can be as important as agricul-tural investment for promoting long-term agricultural productivity growth(Fan 2008). As shown in Table 7.4, the government has not neglected suchnonagricultural spending, and total spending increased at an average rateof 2.5 percent per year between 2000 and 2007 in constant prices. However,the lion’s share of the increase went to spending on education and health,while the spending shares for agriculture and transport (including all typesof roads, ports, harbors and railways, etc.) and communication remained
Table 7.4. Government expenditures, by sector
2000 2001 2002 2003 2004 2005 2006 2007
Total (2006 GHS, billion) 3.81 4.51 3.91 4.47 5.41 5.55 4.06 4.87
Sector shares (% of total expenditures)Agriculture 2.4 1.2 1.4 1.4 1.8 2.6 2.2 2.5Education 14.8 14.2 18.1 16.2 15.2 17.1 17.7 17.0Health 3.0 3.8 5.2 5.1 4.6 5.7 6.7 6.8Transport & communication 2.3 1.3 0.7 1.1 1.1 1.3 1.3 1.4Defense 2.2 2.4 2.3 2.5 1.9 2.3 2.3 2.1Other 75.4 77.1 72.2 73.7 75.3 71.0 69.8 70.1
Notes: GHS = Ghanaian cedi.Source: Authors’ calculation based on IFPRI (2015) and World Bank (2015).
0
3
6
9
12
15
18
0
20
40
60
2000 2001 2002 2003 2004 2005
perc
ent
2000
GH
S, m
illio
nsDevelopmental (2000 GHS, mil.)Recurrent (2000 GHS, mil.)Developmental (percent of total)
Figure 7.4. Government recurrent and developmental expenditures in agriculture(2000 GHS, millions)Notes: GHS = Ghanaian cedi.Source: Benin et al.
OUP CORRECTED PROOF – FINAL, 30/7/2019, SPi
182

flat. This pattern of spending has been broadly consistent since the 1980s(see Chapter 3). A relevant question is whether these were the best spendingpriorities for supporting agricultural productivity growth.
7.3 Growth Effects of Public Spending on Agriculture
Three key questions arise from our analysis of past patterns of public spendingon agriculture. First, though a relatively small share of total governmentspending has been allocated to agriculture since 1961 (between 1 and 3 percenton average per year), has this been money well spent? Second, given therelatively high expenditure-to-output ratio in the cocoa subsector comparedto the noncocoa subsector, has the noncocoa sector been unduly neglected?Third, we would like to know how effective the government’s spendingallocation across different types of investments and regions has been foragricultural growth. Our analysis draws on two recent studies. One study isby Benin (2016) who uses national-level data to estimate the marginal returnto total public spending in agriculture over 1970–2012, and also the marginalreturns for spending within the cocoa and noncocoa subsectors. We updatethis study using a revised model and data over 1961–2012. The other study byBenin et al. (2012) uses GLSS household survey data from 2005/6 and district-and region-disaggregated expenditure data over 2001–6 to estimate the prod-uctivity impacts of different types of public spending.
7.3.1 Conceptual Framework
The analysis in this chapter is based on a conceptual framework that seespublic spending as contributing to a stock of public capital in rural areas, andthis stock contributes to agricultural growth. This growth linkage can arisethrough various channels:
• Technology-advancing productivity effects, which typically derive fromthe yield-enhancing technologies of public expenditure in agriculturalR&D
• Human-capital-enhancing productivity effects, which typically derivefrom public expenditure in agricultural education, extension, and infor-mation, which all help raise the knowledge and skills of farmers and thoseengaged in agricultural production (Schultz 1982)
OUP CORRECTED PROOF – FINAL, 30/7/2019, SPi
183

• Transaction cost–reducing productivity effects, which derive frompublic expenditure on infrastructure (such as storage facilities, marketinformation, and feeder roads) in the agricultural sector, which in turncontributes to improved access to input and output markets and thusreduces the cost of agricultural inputs and technologies (Sadoulet and deJanvry 1995)
• Crowding-in productivity effects, which is a second-order effect in whichthe increase in public capital induces an increase in private investment inagricultural production and along agricultural value chains.
In addition to the various channels through which productivity effects ofpublic agriculture expenditure may materialize, the literature also shows thatthe effects are not the same for all types of expenditure. Also, the effects oftenmaterialize with a lag rather than contemporaneously. See Benin (2016) forfurther discussion.
These various effects can be captured in a model in which agricultural outputis specified as a function of the stocks of both public and private capital inagriculture, as well as the use of resources like land, labor, and modern inputs,and other exogenous factors like rainfall. The stocks of public and private capitaldepend, respectively, on accumulated public and private spending over time,with relevant time-lag structures and depreciation rates. The stocks of publiccapital can also be disaggregated by type of spending. A second set of equationsspecifies that the stock of private capital and the use of other resources (land,labor, andmodern inputs) is a function of the stock of public capital, along withother variables such as prices, policies, terms of trade, infrastructure, accessto financial and technical services, access to input and output markets, landpressure, etc.
The literature on public investment analysis shows that the public spendingdecision, too, may be endogenous, since the amount spent or invested on asector or activity may depend on the performance of the sector or returns toinvestment in the activity. So is the notion that growth in public capital is anendogenous process, that is, an outcome of growth in income rather than only acause of it. As such, it is good practice to add a third equation to explain the levelof public spending each year, typically using variables on political processes andinstitutional arrangements. When estimating the model, allowance must alsobe made for other variables that could be endogenous to the model or which areserially correlated over time. This modeling approach is well established in theliterature (e.g.,, Aschauer 1989; Barro 1990, Thirtle et al. 2003, Fan 2008).
OUP CORRECTED PROOF – FINAL, 30/7/2019, SPi
184

7.3.2 Disaggregated Impact of Public Spendingin the Cocoa and Noncocoa Subsectors
7.3.2.1 The model
Using national data for the period 1961–2012, we estimate a variant of Benin’s(2016) model for Ghana’s agricultural sector as a whole, and then separatelyfor the cocoa and noncocoa subsectors. The model is a semi-reduced-form,single equation that is specified as follows:
Yst ¼ f ðagEXPst; agSTKst;Z1st; Z2t; tÞ; ð1Þ
where Y is the value of gross agricultural output; agEXP is public agricultureexpenditure; agSTK is public agriculture capital stock; t is a time trend; and Z1and Z2 are vectors of exogenous factors affecting agricultural output and use ofinputs such as public nonagriculture expenditure, policies, institutions, infra-structure, prices, differentiating those that are subsector specific (Z1, as relatedto some policies and institutions for example) and those that are not (Z2, suchas land pressure, climate and agroecology).
Public agriculture expenditure equation is specified as follows:
agEXPst ¼ hðagSTKst ;Z3st;Z4t; tÞ; ð2Þ
where Z3 and Z4 represents the variables that affect agEXP, some of whichmay also affect Y and inputs and, therefore, are common to Z1 and Z2. Heretoo, differentiating those that are subsector specific (Z3) and those that are not(Z4). All the variables used in the estimation are observed with the exceptionof the public agriculture capital stock, agSTK, which was constructed using thefollowing capital formation approach:
agSTKst ¼ Ist þ ð1� δÞagSTKst�1; ð3aÞ
agSTKs;1961 ¼ Is;1961ðδþ rÞ ð3bÞ
Where I is the gross capital formation, δ is the depreciation rate, r is the realinterest rate, and the initial capital stock, agSTK₁₉₆₁, is estimated using theprocedure of Kohli (1982). The annual values of I are based on the share ofcapital expenditure in total expenditure for the entire economy (compiledfrom the same sources of expenditure listed in Table 7.1), δ is compiled from(Knoema 2016), and r from the World Bank (2016).
OUP CORRECTED PROOF – FINAL, 30/7/2019, SPi
185

From the estimation, the elasticity of agricultural output with respect topublic agriculture expenditure (ϑs) can be obtained as:
ϑs ¼ @Ys
@agEXPsþ @Ys
@agSTKsð4Þ
where @ refers to the partial derivative. The elasticity is interpreted as thepercentage change in agricultural output (Y) due to a 1 percent change inpublic agriculture expenditure (agEXP).
7.3.2.2 Empirical model
The empirical model estimated comprises two sets of a system of equationsthat can be written as:
agEXPst ¼ aþ γsagSTKst þ Z30stτs þ Z4
0tπþ t þ et ð5aÞ
Yt ¼ aþX
sβsagEXPst þ
XsγsagSTKst þ Z1
0stτs þ Z2
0tπþ t þ et ð5bÞ
and
agEXPst ¼ aþ γsagSTKst þ Z30stτs þ Z4
0tπþ t þ et ð6aÞ
Yst ¼ as þ βsagEXPst þ γsagSTKst þ Z10stτs þ Z2
0tπs þ t þ est: ð6bÞ
where (5a) and (5b) are for estimating the effect of subsector-disaggregatedexpenditures on total agricultural output, and (6a) and (6b) are separateequations for estimating the effect of subsector-disaggregated expenditureson subsector-disaggregated output.
Table 7.5 presents descriptive statistics of the specific variables used in theeconometric analysis from 1961 to 2012. Most variables are self-explanatorybut a few explanations are in order. For variables captured by Z3 and Z4, thatis, factors affecting expenditures, we follow the literature closely and use, forexample, GDP per capita (GDPCAP) to test Wagner’s law that public expend-iture rises constantly as income growth expands (Wagner 1883); and differentshocks such as change in government and political party systems (GOVTYP),change in the minister of finance (MINFIN), change in the minister ofagriculture (MINAG), change in the chief executive officer of the Cocobod(CEOCOB), policy reforms in the agriculture sector (AGPOL) and cocoasubsector (COPOL), and monetary policy (MONPOL) to test the displace-ment hypothesis (Peacock and Wiseman 1961). Another noncocoa-specific
OUP CORRECTED PROOF – FINAL, 30/7/2019, SPi
186

Table 7.5. Description and summary statistics of variables, 1961–2012 annualaverage
Variable Name inmodel
Mean Standarderror
Agricultural GDP, million 2004–6 GHS YTotal agriculture Ytot 4,145.59 172.03Noncocoa subsector Ynon 3,584.98 170.64Cocoa subsector Ycoc 560.62 26.07
Agricultural expenditure, million 2006 GHS agEXPNoncocoa subsector agEXPnon 103.98 7.43Cocoa subsector agEXPcoc 211.02 22.25
Agricultural capital stock, million 2006 GHS agSTKNoncocoa subsector agSTKnon 2,276.08 46.40Cocoa subsector agSTKcoc 2,729.56 212.88
Variables in expenditure equations onlyGDP per capita, 2006 GHS GDPPCAP 739.15 17.84Real foreign exchange, GHS/US$1 FOREX 1.84 0.15Official development assistance, share of GDP ODAGDP 6.17 0.57Type of government: 1966, 1972, 1979, 1982 GOVTYP 0.08Minister of finance: 1966, 1969, 1972, 1978,1979, 1980,1982, 1995, 2001, 2005, 2007, 2009
MINFIN 0.23
Minister of agriculture: 1962, 1963, 1966, 1967,1968, 1969, 1971, 1972, 1973, 1977, 1979, 1980,1981, 1982, 1984, 1985, 1986, 1992, 1996, 1997,1998, 2001, 2005, 2009
MINAG 0.46
Chief executive officer of Cocobod: 1973, 1976,1978,1980, 1984, 1992, 1994, 1997, 2001, 2002,2006, 2009
CEOCOB 0.23
Agricultural sector policy: 1972, 1983, 1988,1991, 1994, 1997, 2007
AGPOL 0.13
Cocoa subsector policy: 1966, 1977, 1984, 1993,1996,1999, 2004
COPOL 0.13
Agriculture expenditure review: 1977,1997, 2006
AGPER 0.06 0.05
Variables in both expenditure and outputequationsGovernment total expenditure, share of GDP TOTEXP 22.49 1.02Share of cocoa price (f.o.b.) received by farmers SHCOCPR 53.22 5.16Openness of economy, ratio of value of importsto exports
OPENECON 1.31 0.03
Population growth, % POPGROW 2.59 0.06Monetary policy: 1967, 1971, 1975, 1977, 1980,1982, 1983, 1993, 2006, 2007
MONPOL 0.19
Rainfall, mm RAINTOT 1,177.36 20.13Rainfall, monthly coefficient of variation RAINCOV 70.05 0.92
Variables in output equations onlyRatio of cocoa price index to fertilizer priceindex
COCFERT 1.51 0.11
Ratio of agriculture price index to fertilizerprice index
AGRFERT 1.58 0.07
(continued)
OUP CORRECTED PROOF – FINAL, 30/7/2019, SPi
187

variable is measured by the dummy variable for the three years following theyear (1977, 1997, 2006, and 2012) in which an agriculture public expenditurereview was undertaken (agPER). For these shock variables, they take on thevalue of 1 in 1961 and subsequent years until a change in regime or an incidenttakes place and then the value goes up to 2, then 3, 4, etc., for the respectiveyears indicated in Table 7.5. Taking the variable AGPOL as an example, whichis used for the general evolution of policies, institutions, infrastructure etc.,it represents change occurring at successive time periods: 1961–1971 = 1 (asthe baseline following Independence), 1972–1982 = 2 (period after the firstagriculture-sector-specific strategy embodied in the operation Feed Yourself),1983–1990 = 3 (start of the Economic Recovery Program), 1988–1990 = 4(start of decentralization), 1991–9 = 5 (for complete pullout of the direct gov-ernment involvement in production, stoppage of subsidies, etc.), 1994–5 = 6(establishment of the District Assembly Common Fund), 1997–2006 = 7(incorporation of the district agricultural development units into the DistrictAssembly), and 2007–12 = 8 (for PRSP, CAADP, reintroduction of subsidies,etc.). For the MONPOL, we combine major incidents in currency change(1967, 1982, 2007), GDP rebasing (1993 and 2008), and drought (1971,1977, 1980, and 1983). A measure of the openness of the economy (OPEN-ECON) is used to test the efficiency or compensatory theory of the effects ofglobalization (Rodrik 1998; Garrett 2001). Other variables include total gov-ernment expenditure (TOTEXP, which is used to capture overall budgetconstraint), foreign exchange rate (FOREX), official development assistance
Table 7.5. Continued
Variable Name inmodel
Mean Standarderror
Ratio of gold price index to cocoa price index GOLDCOC 0.53 0.05Ratio of gold price index to agriculture priceindex
GOLDAGR 0.45 0.04
Ratio of area under cocoa to area undernoncocoa
SHCOAREA 0.07 0.00
Note: For the exogenous or predetermined variables, the lagged values are used (this includes the laggedvalues of the endogenous variables). The exogenous categorical variables take on the value of 1 in 1961and subsequent years until a change in regime or an incident takes place and then the value goes up to2, then 3, 4, etc., for the respective years indicated. For these, the mean values represent the frequency ofchange in the fifty-two years of the data. All continuous variables are transformed by natural logarithm,excluding those measured as indexes or as percentages or shares. Then the first differences of alltransformed or nontransformed variables are used in the estimation.Source: Author’s calculation based on various data sources (see Table 7A.2 for details).
OUP CORRECTED PROOF – FINAL, 30/7/2019, SPi
188

(ODAGDP), share of cocoa prices received by farmers (SHCOCPR), andpopulation growth (POPGROW). Rainfall, measured as total annual amount(RAINTOT) and monthly coefficient of variation (RAINCOV), obtained fromHarvestChoice (2015) are used to capture the effect of weather shocks.
For variables captured by Z1 and Z2, that is, factors affecting inputs andoutput, they include several of those described above such as OPENECON,TOTEXP, MONPOL, SHCOCPR, POPGROW, RAINTOT, and RAINCOV. Inaddition, we include four variables on relative price indexes (cocoa/fertilizer,agriculture/fertilizer, gold/cocoa, and gold/agriculture) and ratio of cocoa areato noncocoa area.
The two sets of equations, 5a and 5b and then 6a and 6b, were estimatedusing simultaneous equations modeling (SEM) methods. A number of esti-mation issues had to be addressed and these are discussed in Appendix7B. The model results and statistical tests are also presented and discussedin Appendix 7B, along with tables showing the regression results. A briefdiscussion of the general results is provided there.
7.3.2.3 Estimated elasticities or growth effects of publicagricultural spending
Whereas, the estimated elasticities of government spending on output in thenoncocoa subsector are mostly positive and statistically significant, those withrespect to Cocobod spending on output in the cocoa subsector are mostlyinsignificant with a mix of positive and negative effects. Considering the effectof the disaggregated spending on total agricultural output, for example, bothexpenditure and capital stock in the noncocoa subsector have direct positiveand statistically significant effects, with elasticities in the range of 0.10–0.13 forexpenditures and 0.9–1.21 for stocks. However, the total effect after account-ing for an indirect effect arising from an increase in the stock of capitalreducing the government’s spending leads to a smaller elasticity estimates(0.34–0.48) that are not statistically significant. On the other hand, the director total effect of expenditures and stocks in the cocoa subsector on total outputis not statistically significant. A similar pattern is observed for the estimatedelasticities of subsector-disaggregated expenditures and stocks on subsector-disaggregated output, with some mixed results. For the noncocoa subsector,the direct effect of expenditures is not statistically significant, but the directeffect of stocks is statistically significant (0.7–1.1), and so is the total effect(0.7–1.0). For the cocoa subsector, the direct effect of expenditures is signifi-cant (0.5–0.7), but the direct effect of stocks is not statistically significant, andthe total effect too, which is negative, is not statistically significant. Because of
OUP CORRECTED PROOF – FINAL, 30/7/2019, SPi
189

the larger expenditure-to-output ratios in the cocoa subsector compared tothe noncocoa subsector (which is about twenty times larger on average in1961–2012 and more in recent years—see Table 7.2), these estimated elastici-ties translate into higher marginal effects or returns to spending in the non-cocoa subsector than in the cocoa subsector.
Because the financial management and expenditure determination pro-cesses are different for the two subsectors, there is no direct way of reallocatingexpenditures on the cocoa subsector to the noncocoa subsector as the resultsmay imply. Expenditures on the noncocoa subsector by the government derivefrom the national budget that is approved by parliament, whereas the expend-itures on cocoa by the Cocobod are directly financed from the proceeds of cocoaexports. But the two are linked since the government revenue and spendingdepends on the tax on cocoa exports and profits, both of which in turn dependon the share of cocoa f.o.b. prices that is given to farmers (SHCOCPR in themodel). As expected, SHCOCPR has a negative effect on expenditures in boththe noncocoa and cocoa subsectors. But SHCOCPR has a relatively largerpositive effect on output. Therefore, increasing the share of cocoa f.o.b. pricesthat is given to farmers may be an indirect way of reallocating expenditures toboost output and raise the returns to spending in especially the cocoa subsector.
One reason government spending has had a weaker long-term impact onnoncocoa output is because the government tended to reduce its spendingover time as the capital stock increased, leading to a negative feedback effect inthe model. If the government were to change this behavior in the future andfocus more on building up the capital stock in the noncocoa sector, then thereturns to its investment would be enhanced.
Results of the aggregate analysis also mask differences between the twosubsectors in terms of the importance of other variables. Detailed results areagain discussed in Appendix 7B, but of particular interest are the following.With respect to total agricultural output, for example, the main statisticallysignificant variables are OPENECON (–), SHCOCPR (+), and MONPOL (–).These suggest that globalization (importing more relative to exports) has had adampening effect on agricultural growth. The same with MONPOL, which isassociated with incidents of currency change, GDP rebasing, and drought.Giving a higher share of the cocoa f.o.b. price to farmers (SHCOCPR) has aboosting effect, perhaps by increasing farmers’ investment in the agriculturalsector. The results by subsector suggest that whereas the negative effect ofMONPOL derives from both subsectors, the negative effect of OPENECONderives mostly from the noncocoa subsector and the positive effect ofSHCOCPR derives mostly from the cocoa subsector.
OUP CORRECTED PROOF – FINAL, 30/7/2019, SPi
190

In general, there is a low number of variables that have a statisticallysignificant effect on expenditures in the cocoa subsector (see Table 7B.2aand Table 7B.3a), which suggest that the expenditure determination processin the cocoa subsector as modeled here may not have been realistic. With alikely omitted variables problem, any resulting bias in the cocoa subsectorexpenditure equation may have been transmitted to the other equations.Further research is needed on this. Also, there are other objectives such asfood security and foreign exchange earnings beyond production that will beuseful to include in the model. Thus, further disaggregation and analysis ofexpenditures in the noncocoa subsector into, for example, export and foodsubgroups is needed, in addition to disaggregated data on foreign exchangeearnings and food imports.
7.3.3 Relative Returns to Public Expenditureby Type of Spending, 2000–6
Beyond differentiating between spending on the cocoa and noncocoa sub-sectors, the previous analysis sheds little light on which types of publicspending are the most productive, and hence which types of spending shouldbe prioritized for agricultural growth. The available data for Ghana limit thelevel of analysis that can be undertaken, but Benin et al. (2012) have estimatedthe marginal returns to public spending on agriculture verses other sectors,including education, health, and rural roads. Their analysis follows the samebasic conceptual framework as described earlier, but with a different empiricalapproach. Unlike the reduced-form, single-equation approach used in thepreceding analysis, Benin et al. (2012) estimate a system of equations consist-ing of a household agricultural production function and separate equations toexplain the levels of farm investment and public agriculture expenditure. Theproduction function and farm investment are estimated using household leveldata from the 2005/6 GLSS household survey, and the agricultural publicexpenditures and capital stocks are calculated using district- and region-disaggregated public expenditure data from 2000 to 2006. The effect of publicspending on the other sectors of rural roads, education, and health weremodeled via the impact of rural road density, literacy rate, and access to ahealth facility, respectively, on farm investments and agricultural production.
Their results show that an increase in public spending on the agriculturalsector by 1 percent is associated with a 0.22–0.35 percent increase in house-holds’ agricultural productivity (i.e., value of household total agricultural
OUP CORRECTED PROOF – FINAL, 30/7/2019, SPi
191

production per capita). This translates into very high economic returns. Forthe marginal Ghana cedi (GHS) spent, GHS3.51–4.15 is returned in terms ofincrease in agricultural GDP.
Regarding spending on other sectors, greater rural road density—the indi-cator used for public capital in the sector—is significantly associated withgreater household agricultural productivity, with an estimated productivityeffect of 0.19–0.26 percent for a 1 percent increase in the rural road density.⁴
Literacy rate, or the proportion of the population that is literate—theindicator used for public capital in the education sector—has no statisticallysignificant effect. This may seem surprising given the large share of andincrement in spending on the education sector (Table 7.4). However, whileboth net enrollment and adult literacy improved over time at the nationallevel, they declined in rural areas, suggesting that the increase in total publicspending on the sector has not benefited the agricultural sector.
The effect of the public capital variables in the health sector is mixed, and isalso somewhat surprising. The public capital stock is measured by the pro-portion of the population living within 1km and between 1–5km of a healthfacility, against the comparative base of the population living more than 5kmaway from a health facility. While the association between agricultural prod-uctivity and the indicator for those living within 1km of a health facility ispositive, the level of statistical significance is weak.
As captured in this analysis, it would seem that government spending onagriculture and rural roads have been the best investments for increasingagricultural productivity growth, whilst government spending on educationand health does not seem to have translated into measurable agriculturalproductivity effects. This is concerning given that government spending onhealth and education has grown rapidly in recent years and (together)accounts for about a quarter percent of the total expenditures (Table 7.4),while spending on agriculture and rural roads has remained flat and accountsfor less than 5 percent of the total expenditures. The analysis has notattempted to capture the impacts of public spending on the different sectorsin the nonagricultural sector or the entire economy, so it is hard to draw strongconclusions on their relative importance for raising overall growth or inreducing overall poverty. Also missing is any disaggregated analysis of theimpacts of different kinds of agricultural spending. For example, is it better to
⁴ Estimating the marginal returns to public spending on the nonagricultural sectors was not done asthe author did not have data on the relevant expenditures to estimate the relationship between theexpenditures and the public capital stocks, as was done for the agricultural sector.
OUP CORRECTED PROOF – FINAL, 30/7/2019, SPi
192

spend more on R&D or irrigation versus other kinds of agricultural spendingsuch as market infrastructure or subsidies? All we know at this point is thatspending on the noncocoa subsector gives higher returns than spending on thecocoa subsector. There is a need for more research on this topic.
7.4 New Directions in Government Spendingon Agriculture
With the reintroduction of fertilizer subsidies in 2007, the government seemsto have started paying more attention to the noncocoa subsector, with theintroduction of four major subsidy and credit programs being implemented byMoFA. These involve:
• Subsidization of agricultural mechanization services via support to theestablishment and operation of Agricultural Mechanization Service Cen-ters (AMSEC)
• Subsidization of fertilizers via the National Fertilizer Subsidy Program
• Establishment and management of block farms that benefit from subsid-ized mechanization services and inputs (fertilizers, improved seed, andpesticides) and extension services, and
• Stabilization of output prices via the establishment and operation of theNational Food Buffer Stock Company (NAFCO).
Food crops are the target, with the major ones including maize grain andseed, rice grain and seed, soybean, sorghum, tomato, and onions. The govern-ment spent about GHS 7.9 million each year in 2007 and 2008 on theseprograms, but the costs have since escalated. Benin et al. (2013) estimatedthat the combined cost of the fertilizer subsidy, block farming, and AMSECprograms was 25 percent of MoFA’s budget in 2010, with the fertilizer subsidyaccounting for the bulk. Because of the escalation in the cost, the governmentwas not able to implement the fertilizer program in 2014, though it resumed itin 2015.
Early evidence suggested that the fertilizer subsidy did increase fertilizer use,and farmers who applied fertilizer on their farms obtained higher yields andnet income than those who did not use any (Benin et al. 2013). On the basis ofthat evidence, Benin et al. (2013) projected that the overall future economicreturn of the program would be positive, with an estimated benefit–cost ratioof 1.7. The same study also found initial benefits from the AMSEC and block
OUP CORRECTED PROOF – FINAL, 30/7/2019, SPi
193

farming programs, and strong synergies between the benefits of the fertilizersubsidy, AMSEC and block farming programs and the price support programimplemented by NAFCO. Benin (2015) found that the AMSEC program hashad mixed impact on different outcome indicators—whereas the programhas contributed to improving availability of mechanization services, reducingdrudgery, and raising yield, it has had no impact on the change in the pricespaid by farmers for the services used and the change in the amount of areaplowed. The initial gains from these programs is reflected in the positivegrowth rate (3.6 percent per annum) over 2009–12 in agriculture output perhectare for the noncocoa subsector (Table 7.2). The relative contribution of thefour programs to this overall productivity performance is unknown, however.Given the weak relationship between fertilizer use and yields found in otherchapters of this book, the rationale for spending the bulk of the funds on thefertilizer subsidy program is questioned. The evidence in the other chaptersshows that fertilizer use is related more to maintaining soil fertility as fallowperiods are shortened rather than to intensify land productivity. Similarly,the analysis of AMSEC in Chapter 9 also raises questions as to whether thereliance on heavy-duty tractors and equipment is a sound intervention forpromoting agricultural mechanization in Ghana. While this chapter hasdemonstrated the need to rebalance public spending towards the noncocoasubsector, and the government’s ongoing attempt to do that must be wel-comed, serious concerns remain about whether the current approach is likelyto be successful or cost effective.
7.5 Conclusions
The government’s public spending on agriculture has fallen short of 10 percentof its total expenditure in most years since 1961. In recent times, the share wasonly 2.1 percent during 2001–8 and 2.8 percent during 2009–12. This is loweven by African standards, especially as it includes food staples, and in termsof fulfilling the Maputo Declaration target of 10 percent. This excludes thecocoa subsector, which is managed by the Cocobod (a state-owned enterprise).Relative to the respective output of the subsector, the amount spent bythe Cocobod on the cocoa subsector far outweighs the amount spent by thegovernment on the noncocoa subsector. One reason for the low shareof government spending on the noncocoa subsector is that the tax on cocoaexports sustains a lot of the spending in the cocoa subsector. This is consistentwith the finding of a negative effect of the share of cocoa prices received byfarmers on expenditure in the noncocoa subsector.
OUP CORRECTED PROOF – FINAL, 30/7/2019, SPi
194

Overall, public spending on agriculture has given favorable returns inGhana, and better than some other public investments in rural areas. Onestudy, for example, found that on the margin, each Ghanaian cedi (GHS) spenton agriculture during 2000–6 returned GHS3.51–4.15 in terms of increases inagricultural GDP, and that government spending on agriculture and ruralroads had bigger marginal impacts on agricultural productivity than govern-ment spending on education and health (Benin et al. 2012). The detailedanalysis reported in this chapter for 1961–2000 also found significant andpositive direct impacts from public spending in agriculture, but with morepowerful and statistically significant impacts in the noncocoa than the cocoasubsector. It was also found that government spending in the noncocoasubsector was negatively related to the size of the capital stock, and this hada negative and indirect impact on the returns. If in the future the governmentwere to change its behavior and attach more importance to building up thecapital stock, this would enhance the long-run returns on its investments.Although the expenditure-to-GDP ratio is much higher in the cocoa than in
the noncocoa subsector, there is no direct way of reallocating expenditures fromthe cocoa to the noncocoa subsector as the expenditures on cocoa are directlyfinanced by the proceeds of cocoa exports. The government simply needs toboost its spending on the noncocoa subsector. In 2007 the government launchedseveral subsidy programs to help grow the noncocoa subsector. These includethe fertilizer subsidy program, and the AMSEC and block farming programs, aswell as a price support program implemented by NAFCO. The cost of theseprograms was initially modest at GHS7.5 million per year in 2007 and 2008, buthad escalated to 25 percent of MoFA’s budget in 2010, and seems likely toincrease to about half MoFA’s budget by 2020. Unfortunately, the availableevidence does not show these programs to be generating the full benefits thatwere expected, and there is need to reevaluate them to ascertain whether this isthe best way to spend available public resources to promote agricultural growth.In terms of its total budget, the government spends far more on health and
education than on agriculture and rural roads. Analysis shows that govern-ment spending on agriculture and rural roads has been the best investment forincreasing agricultural productivity growth, whilst government spending oneducation and health does not seem to have translated into measurableagricultural productivity effects. The analysis has not attempted to capturethe impacts of this public spending on overall growth or poverty reduction, soit is hard to draw strong conclusions. Also missing is any disaggregatedanalysis of the impacts of different kinds of agricultural spending, for exampleR&D or irrigation versus other kinds of agricultural spending. There is a needfor more research on this topic.
OUP CORRECTED PROOF – FINAL, 30/7/2019, SPi
195

APPENDIX
7A: Data Sources on Public Expenditures in Ghana, 1961–2012
Table 7A.1. Data and sources on public expenditures in Ghana, 1961–2012
Year Total government expenditure Agriculture expenditure (million GHS) Deflatord Agriculture expenditure data sources(N=noncocoa, C=cocoa)
Million GHSa Capital (%)b Noncocoa subsector Cocoa subsectorc 2006=100
1961 0.023 39.1 0.0028 0.0022 0.0017 Stryker (1990)1962 0.025 40.7 0.0021 0.0020 0.0017 Stryker (1990)1963 0.027 39.3 0.0025 0.0021 0.0019 Stryker (1990)1964 0.033 38.8 0.0027 0.0022 0.0020 Stryker (1990)1965 0.036 39.2 0.0039 0.0038 0.0024 Stryker (1990)1966 0.027 24.2 0.0027 0.0017 0.0026 Stryker (1990)1967 0.031 22.0 0.0025 0.0018 0.0025 Stryker (1990)1968 0.037 18.3 0.0026 0.0020 0.0028 Stryker (1990)1969 0.044 19.0 0.0029 0.0016 0.0031 Stryker (1990)1970 0.047 23.0 0.0030 0.0019 0.0032 Stryker (1990)1971 0.050 20.6 0.0034 0.0034 0.0034 Stryker (1990)1972 0.054 17.9 0.0039 0.0042 0.0039 Stryker (1990)1973 0.077 22.1 0.0042 0.0062 0.0047 Stryker (1990)1974 0.114 25.2 0.0076 0.0075 0.0059 Stryker (1990)1975 0.150 29.5 0.0107 0.0124 0.0076 Stryker (1990)1976 0.200 31.9 0.0192 0.0165 0.0097 Stryker (1990)1977 0.306 22.7 0.0426 0.0114 0.0163 Stryker (1990)1978 0.374 20.3 0.0476 0.0311 0.0282 Stryker (1990)1979 0.409 16.9 0.0490 0.0427 0.0389 Stryker (1990)1980 0.467 10.5 0.0570 0.0685 0.0588 N=IFPRI (2015), C=Stryker (1990)1981 0.772 14.8 0.0940 0.1015 0.1032 N=IFPRI (2015), C=Stryker (1990)1982 0.953 8.7 0.1020 0.1290 0.1320 N=IFPRI (2015), C=Stryker (1990)1983 1.476 8.1 0.1171 0.2178 0.2944 N=IFPRI (2015), C=Stryker (1990)
OUPCORRECTED
PROOF–FIN
AL,
30/7/2019,SP
i

1984 2.669 12.6 0.1320 0.4641 0.3984 N=IFPRI (2015), C=Stryker (1990)1985 4.576 13.1 0.2830 0.8321 0.4807 N=IFPRI (2015), C=Stryker (1990)1986 7.066 11.9 0.3200 1.2524 0.6811 N=IFPRI (2015), C=Stryker (1990)1987 10.213 19.7 0.4630 1.6651 0.9481 N=IFPRI (2015), C=linear interpolation1988 14.390 19.4 0.5000 2.1168 1.2648 N=IFPRI (2015), C=linear interpolation1989 19.647 21.9 0.9140 2.5817 1.6227 N=IFPRI (2015), C=linear interpolation1990 25.447 20.9 1.0438 3.2105 2.1284 N=IFPRI (2015), C=IMF (1998)1991 34.026 20.8 1.2378 4.0886 2.5550 N=IFPRI (2015), C=IMF (1998)1992 49.881 24.1 1.9815 4.7814 2.8399 N=IFPRI (2015), C=IMF (2000)1993 81.353 19.1 2.8449 7.0119 3.7418 N=IFPRI (2015), C=IMF (2000)1994 177.231 25.8 2.9427 6.0667 4.8691 N=CAGD (2011), C=IMF (2000)1997 464.865 18.2 6.5785 20.7430 11.6350 N=CAGD (2011), C=IMF (2000)1998 560.744 18.6 7.8291 29.5062 13.6186 N=CAGD (2011), C=IMF (2000)1999 656.622 27.9 17.7458 30.4868 15.5213 N=CAGD (2011), C=IMF (2000)2000 752.500 36.9 17.9186 46.5510 19.7477 N=CAGD (2011), C=IMF (2005)2001 1,199.760 51.6 14.7664 83.0808 26.6235 N=MoFA (2013), C=Kolavalli et al. (2012)2002 1,277.780 43.4 18.3890 107.9965 32.6985 N=MoFA (2013), C=Kolavalli et al. (2012)2003 1,880.200 48.4 26.3825 190.3620 42.0845 N=MoFA (2013), C=Kolavalli et al. (2012)2004 2,603.466 53.5 45.7670 271.3823 48.1237 N=MoFA (2013), C=Kolavalli et al. (2012)2005 3,070.353 48.9 78.9841 300.8731 55.3247 N=MoFA (2013), C=Kolavalli et al. (2012)2006 4,056.891 31.5 90.6267 340.0949 100.0000 N=MoFA (2013), C=Kolavalli et al. (2012)2007 5,661.918 41.3 141.4683 418.8755 116.2760 N=MoFA (2013), C=Kolavalli et al. (2012)2008 7,407.220 43.4 256.6725 521.9458 139.7663 N=MoFA (2013), C=Kolavalli et al. (2012)2009 8,869.230 53.9 220.6086 872.2741 163.8475 N=MoFA (2013), C=Kolavalli et al. (2012)2010 12,173.835 44.1 327.9592 1,257.9316 191.0390 N=MoFA (2013), C=Kolavalli et al. (2012)2011 13,829.000 38.2 406.5289 1,368.8934 217.6239 N=MoFA (2013), C=GCB (2013)2012 22,675.000 15.8 667.0152 1,423.1870 250.7148 N=CAGD (2013), C=GCB (2013)
Notes: Expenditure data prior to 2007 were mostly in the old currency units (GHC), which were divided by 10,000 to obtain the new currency equivalent (GHS).a Data series on total government expenditure were compiled from three sources: 1961–1979 from Stryker (1990), 1980–2010 from IFPRI (2015), and 2011–2012 fromCAGD (2014). These total expenditures do not include expenditures on cocoa that were incurred by the Ghana Cocoa Board, which is an autonomous publiccorporation. In the analysis therefore, we add the expenditures on cocoa to total government expenditure to obtain total public expenditure.
b Data series on total capital expenditures were compiled from two sources: 1961–1979 from Stryker (1990) and 1980–2012 from various issues of government financestatistics issued by the Controller of Accountant General’s Department (CAGD).
c Expenditures on the cocoa were reported for financial years from October to September. We use the last year in the financial year as the calendar year to compile the data(e.g., 1978 for 1977/1978).
d Data series on the deflator is calculated by dividing GDP in current GHS by GDP in constant 2006 GHS, which were obtained from the World Bank (2015).
OUPCORRECTED
PROOF–FIN
AL,
30/7/2019,SP
i
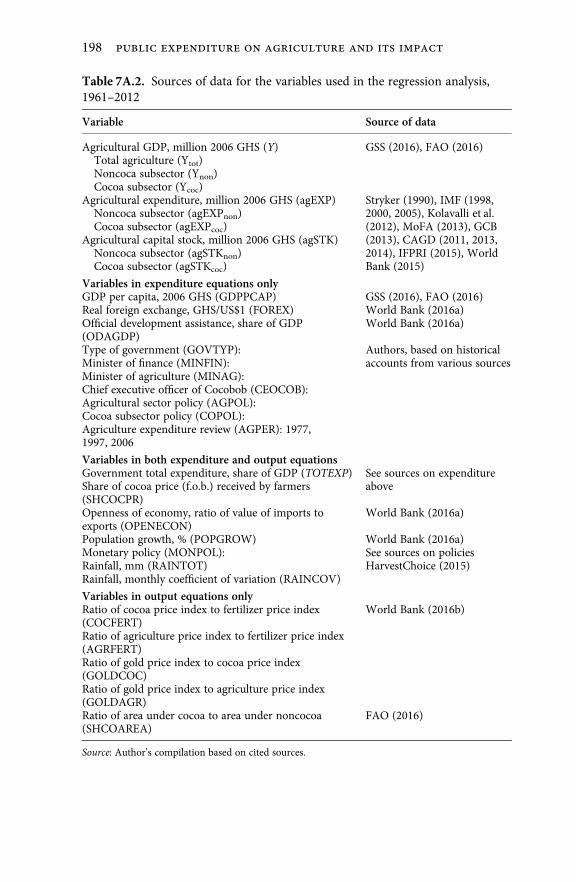
Table 7A.2. Sources of data for the variables used in the regression analysis,1961–2012
Variable Source of data
Agricultural GDP, million 2006 GHS (Y) GSS (2016), FAO (2016)Total agriculture (Ytot)Noncoca subsector (Ynon)Cocoa subsector (Ycoc)
Agricultural expenditure, million 2006 GHS (agEXP) Stryker (1990), IMF (1998,2000, 2005), Kolavalli et al.(2012), MoFA (2013), GCB(2013), CAGD (2011, 2013,2014), IFPRI (2015), WorldBank (2015)
Noncoca subsector (agEXPnon)Cocoa subsector (agEXPcoc)
Agricultural capital stock, million 2006 GHS (agSTK)Noncoca subsector (agSTKnon)Cocoa subsector (agSTKcoc)
Variables in expenditure equations onlyGDP per capita, 2006 GHS (GDPPCAP) GSS (2016), FAO (2016)Real foreign exchange, GHS/US$1 (FOREX) World Bank (2016a)Official development assistance, share of GDP(ODAGDP)
World Bank (2016a)
Type of government (GOVTYP): Authors, based on historicalaccounts from various sourcesMinister of finance (MINFIN):
Minister of agriculture (MINAG):Chief executive officer of Cocobob (CEOCOB):Agricultural sector policy (AGPOL):Cocoa subsector policy (COPOL):Agriculture expenditure review (AGPER): 1977,1997, 2006
Variables in both expenditure and output equationsGovernment total expenditure, share of GDP (TOTEXP) See sources on expenditure
aboveShare of cocoa price (f.o.b.) received by farmers(SHCOCPR)Openness of economy, ratio of value of imports toexports (OPENECON)
World Bank (2016a)
Population growth, % (POPGROW) World Bank (2016a)Monetary policy (MONPOL): See sources on policiesRainfall, mm (RAINTOT) HarvestChoice (2015)Rainfall, monthly coefficient of variation (RAINCOV)
Variables in output equations onlyRatio of cocoa price index to fertilizer price index(COCFERT)
World Bank (2016b)
Ratio of agriculture price index to fertilizer price index(AGRFERT)Ratio of gold price index to cocoa price index(GOLDCOC)Ratio of gold price index to agriculture price index(GOLDAGR)Ratio of area under cocoa to area under noncocoa(SHCOAREA)
FAO (2016)
Source: Author’s compilation based on cited sources.
OUP CORRECTED PROOF – FINAL, 30/7/2019, SPi
198

7B: Regression Results on Impact of Agricultural PublicExpenditure on Agricultural Output, 1961–2012
Brief Discussion of Estimation and Results
The model presented in the main text (equations 5a, 5b, 6a and 6b) was estimated for theagricultural sector as a whole and then separately for the cocoa and noncocoa subsectors,using simultaneous equations modeling (SEM) estimation techniques. Table 7.5 in themain text presented the specific variables used and their descriptive statistics. The sameset of variables were used in the aggregate and disaggregated analysis, with the exception ofa few variables that were included or excluded as they were hypothesized to be subsectorspecific or affecting expenditures or output only.
Two major estimation issues were addressed. First, in applying SEM methods, the errorterms est are assumed to have a mean of zero and constant variance, and be uncorrelatedwith the explanatory variables and uncorrelated across equations or over time (Zellner andTheil 1962; Greene 1993). For the latter, autocorrelation, we test the null hypothesis of noautocorrelation using the Harvey Lagrange multiplier (LM) test (Harvey 1990; Judge et al.1985), separately for each equation and then for the overall system. The second issue isidentification of the system, which we use exclusion restrictions to accomplish. The rule ofthumb for using exclusion restrictions is that the number of exogenous variables excludedfrom equation q must be at least as large as the number of endogenous variables included inequation q. In addition to the explanatory factors discussed earlier, we use the lagged valueof Y as its instrument in some model specification to assess the strength of identification.
As we are using time-series data, another issue to deal with is stationarity of especiallythe dependent variables, which we find to be nonstationary in their levels but stationary intheir first differences. Therefore, we estimate the first-difference equations. This means thatthe initial constant term a drops out and is replaced by a new one since t – (t – 1) = 1. Ingeneral, first differencing helps address expenditure endogeneity due to omitted time-invariant factors such as agroclimatic conditions that are fixed over time (Fan, Hazell,and Thorat 2000). Also, differencing can address expenditure endogeneity due to simul-taneity if expenditure decisions are driven by levels, but not changes in the hypothesizedoutcome, or agricultural output in this case. The drawback of differencing, however, is thatit could remove the long-term effect of expenditures whose benefits typically materializewith a lag rather than contemporaneously (Hsiao 1986). All continuous variables aretransformed by natural logarithm so that their estimated coefficients are interpreteddirectly as elasticities. Then, the elasticity of agricultural output with respect to publicagriculture expenditure is obtained as:
ϑs ¼ βs þ γs:
The stationarity test results are presented in Table 7B.1. The results for the agriculturalsector as a whole are presented in Tables 7B.2a for subsector expenditure equations and7B.2b for the aggregate output equations. This is followed by the estimation for the separatesubsectors in Table 7B.3a for the subsector expenditure equations and 7B.3b for thesubsector output equations. In each set of estimation, we use different model specificationsin terms of allowing the agSTKt in one subsector to be a determinant of agEXPt or Yt in theother subsector.
Stationarity test results for the dependent variables: Details of the stationarity test resultsfor the dependent variables shown in Table 7B.1 suggest that unit root is a problem with the
OUP CORRECTED PROOF – FINAL, 30/7/2019, SPi
199

level measures but not the first differences. The exceptions are in the cocoa subsector wherethe levels of expenditure and output are weakly stationary. Therefore, the first-differencemeasures of the variables were used in the estimation to avoid spurious regressions, whichare possible when using the level measures of the variables.
Overall model results: The overall model results are strong. The F-statistics for theindividual equations and the system are statistically significant at the 1 percent level.Also, the R-squared for the individual equations is within the range of 0.4 and 0.7, withthose for the systems being generally greater, considering the two different measures of theR-squared that is used. Also, the test for the presence of autocorrelation is rejected forthe individual equations as well as for the systems. With respect to efficiency in the use ofthe system of equations, the results are mixed. In the estimation with respect to totalagricultural output, efficiency is gained from allowing cross-over effect of agSTK, that is, byallowing the agSTK in one subsector to affect agEXP in the other subsector. This isindicated by rejection of the Breusch-Pagan LM diagonal covariance matrix test, whichthe null hypothesis is that there is no contemporaneous correlation across the equations(Judge et al. 1985). In the estimation with respect to subsector-disaggregated agriculturaloutput however, there is no efficiency gain when from allowing cross-over effect of agSTK.
Determinants of subsector expenditures: The statistical significant factors and their signsare the same whether estimated jointly with total agricultural output (Table 7B.2a) or withsubsector-disaggregated output (Table 7B.3a). Subsector agricultural capital stock, agSTKs,has a negative effect on its respective subsector agricultural expenditure, agEXPs. The cross-over effect is positive, but only statistically significant for agSTKcoc on agEXPnon. Withrespect to the other variables, most of their effects are consistent with the literature,although many of them have a statistical significant effect agEXPnon only. Those with apositive effect are GDPPCAP, TOTEXP, ODAGDP, and MONPOL; whereas FOREX,OPENECON, MINFIN, and RAINCOV have a negative effect. The share of cocoa pricereceived by farmers (SHCOCPR) has a negative effect on both subsector expenditures,which is intuitive, by reducing the amount available to Cocobod to spend and reducing the
Table 7B.1. Stationarity test results for level and first difference of dependentvariables, 1961–2012
Variable Unit root test Level First difference
Test statistic p-value Test statistic p-value
agEXPnon ADF –1.51 0.827 –7.78*** 0.000PP –1.35 0.873 –7.89*** 0.000
agEXPcoc ADF –3.06 0.115 –8.28*** 0.000PP –3.15* 0.095 –8.44*** 0.000
Ytot ADF –2.74 0.219 –7.26*** 0.000PP –2.66 0.253 –7.45*** 0.000
Ynon ADF –2.65 0.259 –7.08*** 0.000PP –2.57 0.292 –7.14*** 0.000
Ycoc ADF –3.14* 0.097 –7.25*** 0.000PP –3.32* 0.064 –7.28*** 0.000
Note: See Table 7A.2 for detailed descriptions of variables. ADF = augmented Dickey-Fuller (Dickeyand Fuller 1979). PP = Phillips-Perron (Phillips and Perron 1988). *, **, and *** mean the test isstatistically significant at the 10, 5, and 1 percent level, respectively.
Source: Authors’ model results.
OUP CORRECTED PROOF – FINAL, 30/7/2019, SPi
200

taxes or revenue to the government. Total rainfall (RAINTOT) has a negative effecton agEXPcoc only. The low number of variables having a statistical significant effect onagEXPcoc seems surprising, although it may indicate a different expenditure determinationprocess in the cocoa subsector. More on this later.
Agricultural growth effects of agricultural public expenditure: With respect to totalagricultural output (Table 7B.2b), both agEXPnon and agSTKnon have direct positive andstatistical significant effect. This is without the agSTKs–agEXPs crossover (about 0.1elasticity for agEXPnon and 0.9 for agSTKnon) and with the crossover (0.11–0.13 foragEXPnon and 1.01–1.21 for agSTKnon). However, the total elasticity, that is, accountingfor the negative indirect effect via agSTKnon on agEXPnon (Table 7B.2a) is not statisticallysignificant (see bottom rows of Table 7B.2b). The effect of agricultural expenditures andstocks in the cocoa subsector on total output is not statistically significant, considering thedirect or total effect. With respect to the effect of subsector-disaggregated expenditures andstocks on subsector-disaggregated output, the results shown in Table 7B.3b are mixed:agSTKnon has direct statistical significant effect on Ynon (0.7–1.1) and agEXPcoc has directstatistical significant effect on Ycoc (0.5–0.7); the crossover effects are not statisticallysignificant; the total effect in the noncocoa subsector is statistically significant (0.7–1.0);but the total effect in the cocoa subsector is not statistically significant.
Might the low number of variables having a statistical significant effect on agEXPcoc (seeTable 7B.2a and Table 7B.3a) have something to do with these results? In the agSTKs–agEXPs crossover specification models, we see that agSTKcoc has a strong positive effect onagEXPnon, but the opposite is not observed—i.e., effect of agSTKnon on agEXPcoc is notsignificant. Also, the negative effect of agSTKnon on agEXPnon increases with the crossover.Together, these suggest that the expenditure determination process in the cocoa subsectoras modeled here may not be realistic, likely suffering from omitted variables bias that hasbeen transmitted to the other equations.⁵ Further research is needed on this.
Influence of other factors on agricultural growth: With respect to total agricultural output(Table 7B.2b), all the variables that have a statistical significant effect are consistent underthe different model specifications—excluding or including agSTKs–agEXPs crossover andexcluding or including lagged value of output. The main statistical significant variables areOPENECON (–), SHCOCPR (+), and MONPOL (–). These suggest that globalization(importing more relative to exports) has had dampening effect on agricultural growth.The same with MONPOL, which is associated with incidents of currency change, GDPrebasing, and drought. Giving a higher share of the cocoa f.o.b. price to farmers(SHCOCPR) has a boosting effect, perhaps by increasing farmers’ investment in theagricultural sector. With respect to subsector-disaggregated output (7B.3b), those discussedabove are also important in addition to several others, some differentiation by subsector.Those that have a common effect on both subsectors are MONPOL (–) and SHCOCAREA(– for Ycoc and + for Ynon). Those that have a statistical significant effect on Ynon only areOPENECON (–) and AGRFERT (+), whereas those that have a statistically significant effecton Ycoc only are SHCOCPR (+), COCFERT (+), and RAINCOV (–). Together with theabove, these suggest the negative effect of MONPOL derives from both subsectors, whereasthe negative effect of OPENECON derives mostly from the noncocoa subsector and thepositive effect of SHCOCPR derives mostly from the cocoa subsector.
⁵ Related to this, the subsector-disaggregated equations were estimated separately—i.e., the expend-iture and output equations were jointly estimated for the noncocoa subsector, and then the expenditureand output equations were jointly estimated for the cocoa subsector. The results, which are notreported here, are consistent with those reported in this chapter.
OUP CORRECTED PROOF – FINAL, 30/7/2019, SPi
201

Table 7B.2a. Determinants of agricultural expenditure on cocoa and noncocoa subsectors in Ghana (with total agricultural output), 1961–2012
Allowing agSTK in one subsector to affect agEXP in own subsector only Allowing agSTK in one subsector to affect agEXP in the other subsector
Without lag of output With lag of output Without lag of output With lag of output
Noncocoa Cocoa Noncocoa Cocoa Noncocoa Cocoa Noncocoa Cocoa
coeff sig coeff sig coeff sig coeff sig coeff sig coeff sig coeff sig coeff sig
agSTKnon –4.972 *** –4.972 *** –7.668 *** 0.943 –7.615 *** 1.821agSTKcoc –3.614 ** –3.643 ** 5.201 *** –3.639 ** 5.260 *** –4.489 ***GDPCAP 1.029 –0.731 1.046 –0.730 1.686 *** –0.790 1.613 ** –1.192FOREX –0.610 *** 0.065 –0.610 *** 0.064 –0.589 *** 0.102 –0.562 *** 0.066SHCOCPR –0.004 *** –0.002 ** –0.004 *** –0.002 ** –0.005 *** –0.002 ** –0.005 *** –0.001TOTEXP 0.017 * –0.003 0.017 * –0.003 0.022 ** –0.002 0.022 ** –0.007OPENECON –0.429 ** –0.124 –0.428 ** –0.122 –0.603 *** –0.121 –0.598 *** –0.077ODAGDP 0.039 ** 0.011 0.040 ** 0.011 0.033 ** 0.010 0.032 ** 0.007GOVTYP –0.091 –0.086 –0.093 –0.088 0.009 –0.086 0.013 –0.097MINFIN –0.171 ** –0.124 –0.170 ** –0.124 –0.121 * –0.131 –0.116 –0.175 **MINAG 0.027 0.028 –0.001 –0.012CEOCOB –0.020 –0.020 –0.009 0.047AGPOL 0.088 0.089 0.065 0.052COPOL 0.032 0.033 0.022 0.096AGPER 0.013 0.071 0.011 0.067 0.204 ** 0.073 0.215 ** 0.029POPGROW –0.175 0.287 –0.177 0.285 –0.026 0.326 * –0.017 0.387 *MONPOL 0.159 * –0.068 0.160 * –0.068 0.193 ** –0.074 0.189 ** –0.047RAINTOT 0.101 –0.343 * 0.101 –0.340 * –0.059 –0.354 * –0.097 –0.274RAINCOV –0.699 *** –0.051 –0.696 *** –0.053 –0.605 *** –0.053 –0.592 *** –0.283Intercept 0.069 0.267 ** 0.069 0.270 ** –0.204 ** 0.260 ** –0.203 ** 0.280 **F-statistic 3.610 *** 2.590 *** 3.610 *** 2.590 *** 4.870 *** 2.380 *** 4.480 *** 2.350 ***R-squared 0.539 0.441 0.540 0.441 0.621 0.445 0.616 0.446Rho 0.000 (0.90) 0.001 (0.86) 0.000 (0.89) 0.001 (0.86) 0.000 (0.87) 0.000 (0.93) 0.000 (0.88) 0.000 (0.93)
System results Rho = 0.19 (0.98); BP = 3.47 (0.32) Rho = 0.11 (0.99); BP = 3.21 (0.36) Rho = 0.15 (0.98); BP = 8.07 (0.04)** Rho = 0.07 (0.99); BP = 7.69 (0.05)**
Notes: Dependent variable is agricultural expenditure (agEXPst). Blank cell = not applicable. All continuous variables are transformed by natural logarithm. For rho, the test is autocorrelation usingthe Harvey Lagrange multiplier (LM) test with the null hypothesis that rho is zero (Harvey 1990; Judge et al. 1985). BP = Breusch-Pagan LM diagonal covariance matrix test with the null hypothesisthat there is no contemporaneous correlation (Judge et al. 1985). For rho and the system results, the figure in parentheses is the p-value. *, **, and *** represent statistical significance at the 0.1, 0.5,and 0.01 probability level, respectively.
Source: Author’s representation based on model results. See Table 7B.1 for detail description of variables.
OUPCORRECTED
PROOF–FIN
AL,
30/7/2019,SP
i

Table 7B.2b. Effect of agricultural expenditure on total agricultural output inGhana, 1961–2012
Allowing agSTK in onesubsector to affect agEXPin own subsector only
Allowing agSTK in onesubsector to affect agEXPin the other subsector
Without lag ofoutput
With lag ofoutput
Without lag ofoutput
With lag ofoutput
coeff sig coeff sig coeff sig coeff sig
agEXPnon 0.103 ** 0.101 ** 0.112 *** 0.130 ***agSTKnon 0.860 * 0.882 * 1.011 ** 1.214 **agEXPcoc 0.058 0.054 0.076 0.002agSTKcoc –0.182 –0.195 –0.363 –0.729TOTEXP 0.000 0.000 0.001 0.001OPENECON –0.085 * –0.083 * –0.081 * –0.091 *SHCOCPR 0.001 ** 0.001 ** 0.001 ** 0.001 *COCFERT 0.032 0.032 0.025 0.018AGRFERT 0.035 0.034 0.050 0.073 *GOLDCOC –0.057 –0.060 –0.046 –0.026GOLDAGR –0.087 –0.084 –0.094 –0.089SHCOCAREA 0.748 0.825 0.402 0.746POPGROW –0.010 –0.010 –0.019 0.002MONPOL –0.088 *** –0.090 *** –0.092 *** –0.100 ***RAINTOT –0.061 –0.059 –0.078 –0.079RAINCOV 0.020 0.020 0.011 0.001Lag of output(Yt–1)
–0.035 –0.037
Intercept 0.038 * 0.040 * 0.044 * 0.062 ***F-statistic 4.360 *** 4.140 *** 4.530 *** 4.600 ***R-squared 0.571 0.574 0.555 0.494Total effect(agEXPnon+agSTKnon)
0.452 0.479 0.336 0.356
Total effect(agEXPcoc+agSTKcoc)
–0.334 –0.337 0.018 –0.051
Rho 0.003 (0.70) 0.001 (0.80) 0.002 (0.73) 0.001 (0.84)
System results Rho = 0.19(0.98); BP =3.47 (0.32)
Rho = 0.11(0.99); BP =3.21 (0.36)
Rho = 0.15(0.98); BP =8.07 (0.04)**
Rho = 0.07(0.99); BP =7.69 (0.05)**
Notes: Dependent variable is agricultural output (Yt). Blank cell = not applicable. All continuousvariables are transformed by natural logarithm. Total effect is obtained by summing elasticities withrespect to agEXPst and agSTKst. and agSTKst indirectly via agEXPst. For rho, the test is autocorrelationusing the Harvey Lagrange multiplier (LM) test with the null hypothesis that rho is zero (Harvey 1990;Judge et al. 1985). BP = Breusch-Pagan LM diagonal covariance matrix test with the null hypothesisthat there is no contemporaneous correlation (Judge et al. 1985). For rho and the system results, thefigure in parentheses is the p-value. *,**, and*** represent statistical significance at the 0.1, 0.5, and 0.01probability level, respectively.
Source: Author’s representation based on model results. See Table 7B.1 for detail description ofvariables.
OUP CORRECTED PROOF – FINAL, 30/7/2019, SPi
203

Table 7B.3a. Determinants of agricultural expenditure on cocoa and noncocoa subsectors in Ghana (with subsector agricultural output), 1961–2012
Allowing agSTK in one subsector to affect agEXP in own subsector only Allowing agSTK in one subsector to affect agEXP in the other subsector
Without lag of output With lag of output Without lag of output With lag of output
Noncocoa Cocoa Noncocoa Cocoa Noncocoa Cocoa Noncocoa Cocoa
coeff sig coeff sig coeff sig coeff sig coeff sig coeff sig coeff sig coeff sig
agSTKnon –4.782 *** –4.842 *** –7.022 *** 1.282 –7.201 *** 1.295agSTKcoc –3.641 ** –3.454 ** 4.419 *** –4.052 ** 4.601 *** –3.879 **GDPCAP 1.125 * –0.753 1.165 * –0.557 1.739 *** –0.873 1.765 *** –0.703FOREX –0.582 *** 0.077 –0.606 *** 0.135 –0.580 *** 0.104 –0.591 *** 0.138SHCOCPR –0.004 *** –0.003 ** –0.004 *** –0.002 ** –0.005 *** –0.003 ** –0.005 *** –0.002 **TOTEXP 0.011 –0.004 0.012 –0.004 0.016 * –0.003 0.017 ** –0.003OPENECON –0.359 ** –0.110 –0.374 ** –0.137 –0.528 *** –0.097 –0.546 *** –0.118ODAGDP 0.048 *** 0.012 0.048 *** 0.012 0.042 *** 0.012 0.041 ** 0.012GOVTYP –0.154 ** –0.098 –0.147 ** –0.098 –0.063 –0.110 –0.050 –0.106MINFIN –0.168 ** –0.110 –0.172 ** –0.120 –0.133 * –0.121 –0.133 * –0.125MINAG 0.095 0.085 0.056 0.045CEOCOB –0.017 –0.009 –0.002 0.000AGPOL 0.167 * 0.159 0.145 0.133COPOL 0.044 0.059 0.034 0.042AGPER –0.081 0.037 –0.066 0.046 0.106 0.021 0.130 0.036POPGROW –0.252 0.277 –0.240 0.292 –0.105 0.312 –0.091 0.327 *MONPOL 0.198 ** –0.061 0.194 ** –0.050 0.225 *** –0.068 0.220 *** –0.061RAINTOT 0.187 –0.320 * 0.173 –0.293 0.048 –0.318 * 0.031 –0.306RAINCOV –0.767 *** –0.061 –0.763 *** –0.066 –0.691 *** –0.078 0.678 *** –0.075Intercept 0.060 0.273 *** 0.061 0.261 ** –0.171 * 0.287 ** –0.179 ** 0.274 **F-statistic 3.920 *** 2.620 *** 3.910 *** 2.590 *** 4.990 *** 2.450 *** 5.020 *** 2.420 ***R-squared 0.530 0.438 0.536 0.433 0.625 0.443 0.628 0.442Rho 0.002 (0.75) 0.000 (0.94) 0.001 (0.79) 0.000 (0.97) 0.000 (1.00) 0.000 (0.92) 0.000 (1.00) 0.000 (0.94)
System results Rho = 1.12 (0.89); BP = 13.86 (0.03)** Rho = 0.19 (0.99); BP = 12.57 (0.05)** Rho = 1.10 (0.89); BP = 10.37 (0.11) Rho = 0.21 (0.99); BP = 8.69 (0.19)
Notes: Dependent variable is agricultural output (Yt). Blank cell = not applicable. All continuous variables are transformed by natural logarithm. For rho, the test is autocorrelation using the HarveyLagrange multiplier (LM) test with the null hypothesis that rho is zero (Harvey 1990; Judge et al. 1985). BP = Breusch-Pagan LM diagonal covariance matrix test with the null hypothesis that thereis no contemporaneous correlation (Judge et al. 1985). For rho and the system results, the figure in parentheses is the p-value. *, **, and *** represent statistical significance at the 0.1, 0.5, and 0.01probability level, respectively.
Source: Author’s representation based on model results. See Table 5B.1 for detail description of variables.
OUPCORRECTED
PROOF–FIN
AL,
30/7/2019,SP
i

Table 7B.3b. Effect of subsector agricultural expenditure on subsector agricultural output in Ghana, 1961–2012
Allowing agSTK and agEXP own subsector output only Allowing agSTK in one subsector to affect output in the other subsector
Without lag of output With lag of output Without lag of output With lag of output
Noncocoa Cocoa Noncocoa Cocoa Noncocoa Cocoa Noncocoa Cocoa
coeff sig coeff sig coeff sig coeff sig coeff sig coeff sig coeff sig coeff sig
agEXPnon –0.010 0.016 0.013 0.038agSTKnon 0.748 * 0.781 * 1.086 ** –2.712 1.103 ** –2.597agEXPcoc 0.487 0.697 ** 0.498 * 0.631 **agSTKcoc –0.837 –0.211 –0.058 0.272 –0.149 0.639TOTEXP 0.001 0.014 0.001 0.012 0.001 0.011 0.001 0.009OPENECON –0.182 *** 0.212 –0.185 *** 0.287 –0.177 *** 0.225 –0.181 *** 0.276SHCOCPR 0.002 * 0.003 ** 0.002 * 0.003 **COCFERT 0.156 * 0.153 * 0.183 ** 0.178 *AGRFERT 0.081 *** 0.083 *** 0.081 *** 0.084 ***GOLDCOC 0.107 0.044 0.181 0.138GOLDAGR –0.193 –0.189 –0.175 –0.168SHCOCAREA 2.684 ** –10.525 ** 2.577 ** –12.528 ** 2.646 ** –11.121 ** 2.505 ** –12.543 **POPGROW –0.004 –0.300 0.005 –0.342 0.013 –0.369 0.019 –0.390MONPOL –0.066 *** –0.250 ** –0.062 ** –0.229 ** –0.067 *** –0.228 ** –0.064 ** –0.213 *RAINTOT –0.088 0.084 –0.086 0.042 –0.080 0.065 –0.083 0.036RAINCOV –0.055 1.056 *** –0.063 1.117 *** –0.053 1.030 *** –0.064 1.085 ***Lag of output (Ynon) 0.072 0.082Lag of output (Ycoc) 0.134 0.107Intercept 0.036 *** 0.070 0.033 *** 0.032 0.034 * 0.047 0.035 * 0.022F-statistic 4.460 *** 3.130 *** 4.250 *** 3.130 *** 4.190 *** 3.020 *** 4.050 *** 2.950 ***R-squared 0.476 0.440 0.499 0.441 0.493 0.456 0.506 0.465Total effect (agEXPnon+ agSTKnon) 0.787 * 0.718 1.007 ** –2.074 0.865 * –1.781Total effect (agEXPcoc+ agSTKcoc) –2.123 –1.922 –1.248 –0.001 –1.177 0.028Rho 0.010 (0.48) 0.010 (0.47) 0.002 (0.77) 0.001 (0.87) 0.008 (0.52) 0.014 (0.41) 0.006 (0.86) 0.003 (0.68)
System results Rho = 1.12 (0.89); BP = 13.86 (0.03)** Rho = 0.19 (0.99); BP = 12.57 (0.05)** Rho = 1.10 (0.89); BP = 10.37 (0.11) Rho = 0.21 (0.99); BP = 8.69 (0.19)
Notes: Dependent variable is agricultural output per hectare (Yt). Blank cell = not applicable. All continuous variables are transformed by natural logarithm. Total effect is obtained by summingelasticities with respect to agEXPst and agSTKst. and agSTKst indirectly via agEXPst. For rho, the test is autocorrelation using the Harvey Lagrange multiplier (LM) test with the null hypothesis thatrho is zero (Harvey 1990; Judge et al. 1985). BP = Breusch-Pagan LM diagonal covariance matrix test with the null hypothesis that there is no contemporaneous correlation (Judge et al. 1985). Forrho and the system results, the figure in parentheses is the p-value. *, **, and *** represent statistical significance at the 0.1, 0.5, and 0.01 probability level, respectively.
Source: Author’s representation based on model results. See Table 5B.1 for detailed description of variables.
OUPCORRECTED
PROOF–FIN
AL,
30/7/2019,SP
i

References
Andah, E. K. 1980. “Action Programme for Agricultural production, 1980–81.”Accra: Ministry of Food and Agriculture.
Aschauer, D. A. 1989. “Is Public Expenditure Productive?” Journal of MonetaryEconomics 23: 177–200.
Austin, D., and R. Luckham. 1975. Politicians and Soldiers in Ghana 1966–1972.London: Cass University Paperbacks.
Barro, R. 1990. “Government Spending in a Simple Model of EndogenousGrowth.” Journal of Political Economy 98(5): 103–25.
Benin, Samuel. 2014. “Identifying Agricultural Expenditures within the PublicFinancial Accounts and Coding System in Ghana: Is the 10 Percent GovernmentAgriculture Expenditure Overestimated?” IFPRI Discussion Paper No. 1365.Washington, DC: International Food Policy Research Institute.
Benin, Samuel. 2015. “Impact of Ghana’s Agricultural Mechanization ServicesCenter Program.” Agricultural Economics 46(1): 103–17.
Benin, Samuel. 2016. “Returns to Agricultural Public Spending in Ghana: Cocoaversus Noncocoa Subsector.” IFPRI Discussion Paper No. 01503. WashingtonDC: International Food Policy Research Institute.
Benin, S., M. Johnson, E. Abokyi et al. 2013. “Revisiting Agricultural Input andFarm Support Subsidies in Africa: The Case of Ghana’s Mechanization, Fertil-izer, Block Farms, and Marketing Programs.” IFPRI Discussion Paper No. 1300.Washington, DC: International Food Policy Research Institute.
Benin, S., T. Mogues, G. Cudjoe, and J. Randriamamonjy. 2012. “Public Expend-itures and Agricultural Productivity Growth in Ghana,” in T. Mogues andS. Benin (eds), Public Expenditures for Agricultural and Rural Development inAfrica. London: Routledge; New York: Taylor and Francis Group.
Benin, S., and B. Yu. 2013. “Complying with the Maputo Declaration Target: Trendsin Public Agricultural Expenditures and Implications for Pursuit of OptimalAllocation of Public Agricultural Spending. ReSAKSS Annual Trends andOutlookReport 2012.”Washington, DC: International Food Policy Research Institute.
Breusch, T. S., and A. R. Pagan. 1980. “The Lagrange Multiplier Test and itsApplications to Model Specification in Econometrics.” Review of EconomicStudies 47: 239–53.
CAGD (Controller and Accountant General’s Department). 2011. “Report of theAuditor General on the Public Accounts of the Government of Ghana forthe Year Ended 31 December 2010.” Accra, Ghana.
CAGD (Controller and Accountant General’s Department). 2013. “Report of theAuditor General on the Public Accounts of the Government of Ghana forthe Year Ended 31 December 2012.” Accra, Ghana.
OUP CORRECTED PROOF – FINAL, 30/7/2019, SPi
206
CAGD (Controller and Accountant General’s Department). 2014. “Report of theAuditor General on the Public Accounts of the Government of Ghana forthe Year Ended 31 December 2013.” Accra, Ghana.
Dappah, S. K. 1995. “Empirical Analysis of the Likely Future Evolution of Agri-culture in Ghana and How It Will Affect the Prospects for Longer-term Growthof Agriculture, the Food System and the Broader Economy.” Paper presented atthe workshop on Agricultural Transformation in Africa, Abidjan, Cote d’Ivoire,September 26–29.
Dickey, D. A., and W. A. Fuller. 1979. “Distribution of the Estimators for Auto-regressive Time Series with a Unit Root.” Journal of the American StatisticalAssociation 74: 427–31.
Fan, S. (ed.). 2008. Public Expenditures, Growth, and Poverty: Lessons fromDeveloping Countries. Baltimore, MD: Johns Hopkins University Press.
Fan, Shenggen, Peter Hazell, and Sukhadeo Thorat. 2000. “Government Spending,Growth and Poverty in India.” American Journal of Agricultural Economics82(4): 1038–51.
FAO (Food and Agriculture Organization of the United Nations). 2016. “FAO-STAT: Commodities by Country.” Available at: http://faostat.fao.org/site/339/default.aspx.
Garrett, G. 2001. “Globalization and Government Spending around the World.”Studies in Comparative International Development 35(4): 3–29.
GCB (The Ghana Cocoa Board). 2013. “44th Annual Report & Financial State-ments for the Year Ended 30th September, 2013.” Accra: Ghana Cocoa Board.
Greene, W. H. 1993. Econometric Analysis. New York: Macmillan.
HarvestChoice. 2015. “Long-Term Climate Trends for Sub-Saharan Africa.”Database. Available at: http://harvestchoice.org/tools/long-term-climate-trends-and-variations-sub-saharan-africa.
Harvey, A. C. 1990. The Econometric Analysis of Time Series, 2nd ed. Cambridge,MA: MIT Press.
Hsiao, C. 1986. Analysis of Panel Data. Cambridge: Cambridge University Press.
IFPRI (International Food Policy Research Institute). 2015. “Public ExpenditureDatabase: Statistics on Public Expenditure for Economic Development (SPEED).”Available at: http://www.ifpri.org/book-39/ourwork/programs/priorities-public-investment/speed-database.
IMF. 1998. Ghana: Statistical Annex. IMF Country Report No. 98/2. Washington,DC: IMF.
IMF. 2000. Ghana: Statistical Annex. IMF Staff Country Report No. 1. Washington,DC: IMF.
IMF. 2005. Ghana: Statistical Appendix. IMF Country Report No. 05/286.Washington, DC: IMF.
OUP CORRECTED PROOF – FINAL, 30/7/2019, SPi
207

Judge, G., W. E. Griffiths, R. C. Hill et al. 1985. The Theory and Practice ofEconometrics, 2nd ed. New York: John Wiley & Sons.
Kohli, U. 1982. “A Gross National Function Product and the Derived Demand forImports and Supply of Exports.” Canadian Journal of Economics 18: 369–86.
Kolavalli, S., M. Vigneri, H. Maamah, and J. Poku. 2012. “The Partially LiberalizedCocoa Sector in Ghana: Producer Price Determination, Quality Control, andService Provision.” IFPRI Discussion Paper No. 1213. Washington, DC: Inter-national Food Policy Research Institute.
Knoema. 2016. “Average Depreciation Rate of the Capital Stock.” Available at:https://knoema.com/PWT2015/penn-world-table-9–0?tsId=1015390.
MoFA. 1999. Agricultural Sector Expenditure Review, 1995–1997. Accra: Ministryof Food and Agriculture.
MoFA. 2013. “Basic Agricultural Public Expenditure Diagnostic Review.” Reportunder Strengthening National Comprehensive Agricultural Public Expenditurein Sub-Saharan Africa. Washington, DC: World Bank.
Mogues, T., and S. Benin. 2012. “Do External Grants to District GovernmentsLeverage Own-revenue Generation? A Look at Local Public Finance Dynamicsin Ghana.” World Development 40(5): 1054–67.
Peacock, A. T., and J. Wiseman. 1961. “The Growth of Public Expenditure in theUnited Kingdom.”NBERGeneral Series 72. Princeton, NJ: Princeton UniversityPress.
Phillips, P. C. B., and P. Perron. 1988. “Testing for a Unit Root in Time SeriesRegression.” Biometrika 75: 335–46.
Quartey-Papafio, H. K. 1977. “Report of the Operation Feed Yourself and Oper-ation Feed Your Industries Review Committee.” Accra: Council for Scientificand Industrial Research.
Rodrik, D. 1998. “Why Do More Open Economies Have Bigger Governments?”Journal of Political Economy 106(5): 997–1032.
Sadoulet, E., and A. de Janvry. 1995. Quantitative Development Policy Analysis.Baltimore, MD: Johns Hopkins University Press.
Schultz, T. W. 1982. Investing in People: The Economics of Population Quality.Berkeley, CA: University of California Press.
Stryker, J. D. 1990. Trade, Exchange Rate, and Agricultural Pricing Policies inGhana.World Bank Comparative Studies 8399. Washington, DC: World Bank.
Thirtle, C., J. Piesse, and L. Lin. 2003. “The Impact of Research-Led AgriculturalProductivity Growth on Poverty Reduction in Africa, Asia and Latin America.”World Development 31(12): 1959–75.
Wagner, A. 1883. Finanzwissenschaft, 3rd ed. Leipzig: C. F. Winter. Partiallyreprinted in R. A. Musgrave and A. T. Peacock (eds), Classics in the Theory ofPublic Finance. London: Macmillan.
OUP CORRECTED PROOF – FINAL, 30/7/2019, SPi
208

Wiemers, A. 2015. “ ‘Time of Agric’: Rethinking the ‘Failure’ of AgriculturalPrograms in 1970s Ghana.” World Development 66: 104–17.
World Bank. 2015. World Development Indicators. Washington, DC.
World Bank. 2016a. World Development Indicators. Washington, DC.
World Bank. 2016b. “Commodity Markets: Annual Prices.” Available at: http://www.worldbank.org/en/research/commodity-markets.
Zellner, A., and H. Theil. 1962. “Three Stage Least Squares: Simultaneous Estimateof Simultaneous Equations.” Econometrica 29: 54–78.
OUP CORRECTED PROOF – FINAL, 30/7/2019, SPi
209

8Developing Agricultural
Value Chains
Shashidhara Kolavalli
8.1 Introduction
Although Ghana’s agricultural sector output grew at an impressive 4.5 percentper annum between 1994 and 2013, most of this growth was from cocoa androots and tubers, which together account for nearly 75 percent of the totalvalue of agricultural output (see Chapter 4). As a result, while the countryremains largely self sufficient in basic staples, and continues to expand itstraditional export crop, cocoa, the composition of agricultural output has notchanged adequately to match the growth in the domestic demand for higher-income elastic foods like rice and tomatoes, nor has agro-processing expandedto meet a growing urban demand for processed and pre-cooked foods. Oneconsequence has been rapid growth in the importation of rice, poultry meat,and processed tomato paste, while nontraditional agricultural exports likepineapples have languished. This begs the question: Is it sufficient for govern-ment policy to focus largely on fundamentals, such as creating an enabling, butcommodity neutral, policy environment, and relying on the private sector to takeit from there (see Chapters 3 and 4)? This approach seems to have workedreasonably well for many traditional food commodities produced for the domes-tic market (e.g., many local food staples and vegetables), but has been much lesssuccessful in developing value chains for commodities that compete internation-ally, either as exports or import substitutes, in raw or processed form.
In many developing countries, governments have played leading roles indeveloping value chains for priority commodities, particularly nontraditionalcommodities (Chandra 2006). This can be a very successful approach, asillustrated by the development of coffee exports from Vietnam, and tropicalfruit juices from Thailand (Thoburn 2009). It was also a very successfulstrategy during Asia’s green revolution, where most states assumed manyof the functions along value chains for wheat and rice. Ghana’s own
OUP CORRECTED PROOF – FINAL, 30/7/2019, SPi

experience with cocoa is another example of where the state has activelyintervened along an entire value chain, from direct support of technology,farm inputs, and pest management to control of marketing and exports, andthis has been very successful since the policy reforms of the 1980s. Whensuccessful, these value chain interventions have served as important growthmotors helping to drive broader patterns of agricultural development andstructural transformation.
However, the approach has not always worked, especially in Africa, includ-ing some of Ghana’s earlier attempts with state agro-industries in the imme-diate post-Independence period, and its “Operation Feed Yourself ” (OFY)and “Operation Feed Your Factories” programs of the 1970s (Rothchild2015).¹ As discussed in Chapter 3, part of the problem has been a weak publicsector capacity for developing and implementing effective value chain inter-ventions, a weakness that has been amplified by the government’s oftenantagonistic and weak relationships with the private sector. However, thismay be changing, and the government has recently committed to the policyframework of the “New Alliance for Food Security and Nutrition”, aninitiative of the G7 and African Union. In return for committing to policiesthat would enable the private sector to participate more fully in inputmarkets, reduce transactions costs, and engage in a more transparent devel-opment of evidence-based policies that would encourage private invest-ments, nearly fifteen domestic and global companies have signed letters ofintent to invest in the agricultural sector.
The question now is whether the Ghanaian government should again try topromote the development of value chains for specific commodities, and if so inwhat ways? Possible interventions might range from state interventions whichcomplement the private sector by fixing specific weak points along valuechains, to more comprehensive interventions where the state either assumesmany of the functions along the value chain, or seeks coordinated solutions inpartnership with the private sector.
This chapter examines and compares four important but different typesof value chains in Ghana: two export crops—cocoa and pineapples, and twoimport-substitution crops—rice and tomatoes. Apart from cocoa, these cropshave under-exploited opportunities, and we examine the opportunities andconstraints along their value chains, and the roles that the public sector has or
¹ Weimers (2015) has argued that some of the earlier commodity and subsidy programs werehelpful for small farmers, but there is little evidence to show they had sufficient impacts on nationalsupplies of targeted crops or the agricultural growth rate to justify their high costs.
OUP CORRECTED PROOF – FINAL, 30/7/2019, SPi
211

might need to play. This leads to some more general conclusions about thebest ways to develop these and related agricultural value chains in Ghana.
8.2 The Selected Value Chains
The selected value chains demonstrate mixed experiences in developingdomestic and export value chains for commodities exposed to internationalcompetition. Cocoa is a notable success, the production and export of whichhas increased dramatically since the early 2000s, and Ghana had regained itsstatus as a major global producer by 2010. On the other hand, after makingsome inroads into expanding nontraditional exports in the late 1990s, theexport of pineapples, the principal nontraditional export crop, has nearlyhalved. Nor have domestic value chains developed adequately to take advan-tage of import-substitution opportunities. Concerned about growing foodimports, the president noted in 2014 that Ghana was spending nearly a billiondollars annually to import food that it could produce. The big items on the listwere rice, poultry meat, and tomato products. Rice consumption has racedahead of domestic production, necessitating imports of nearly half a milliontons of rice annually, equivalent to about half of domestic rice consumption.Processing of tomato, which has been an ambition since Independence, has yetto turn into reality; Ghana is now one of the largest importers of processedtomato products in West Africa. Ghana does not even produce enough freshtomatoes to meet its domestic demand. Further details about each of the fourvalue chains are considered below.
Cocoa, rice, and tomatoes are all labor-intensive crops that are hard tomechanize and hence are grown predominantly by smallholders, who, withtheir more abundant family labor per hectare, have a competitive edge overlarger holdings. Smallholders also tend to obtain higher yields. With cocoa, forexample, smallholders use higher levels of fertilizers and obtain yields that arenearly double those obtained on larger holdings. Smallholders also dominatethe production of pineapples for the local market, but play a smaller role inproducing for the export market. This is because they are less able to adopt themore capital- and knowledge-intensive technologies that are needed to prod-uce the varieties required as export materials, or to meet the high qualitystandards for fresh fruits. The few smallholders who do participate in theexport market either belong to a cooperative or are vertically integrated withpineapple exporters, such as through “core-satellite” systems (Suzuki, Jarvis,and Sexton 2011).
OUP CORRECTED PROOF – FINAL, 30/7/2019, SPi
212

8.2.1 Cocoa
Cocoa was developed by indigenous capitalist farmers who were alreadyproducing export crops like oil palm and saw an opportunity to sell cocoato European trading houses (Hill 1963). By the time Ghana became inde-pendent, it was the largest cocoa producer in the world, with an establishedmarketing board that had built up huge financial reserves. These reserves,plus revenues from a continuing cocoa tax, became available to the firstadministration to launch an ambitious but unsuccessful industrializationstrategy. During the economic crisis leading up to the policy reforms of the1980s, the government had become highly dependent on cocoa taxes formost of its revenue, and producers were so squeezed by a high cocoa tax, anover-valued currency, and rapid inflation, that cocoa production for manyfarmers was barely profitable. By the early 1980s, production had fallenbelow 200,000 tons, less than one half of the peak production of 565,000tons achieved in the 1960s.
The policy reforms of the 1980s, together with an upward trend in worldcocoa prices beginning in the early 2000s, revived the fortunes of the cocoasector (Kolavalli and Vigneri 2011). Production soared to a million tons in2010, though it has since stabilized at around 850,000 tons. At the heart of thepolicy reform was the commitment by the government to increase the produ-cers’ share of export prices. Unlike some neighboring countries, the govern-ment decided not to fully liberalize the cocoa value chain, and insteadreorganized the marketing board to limit the scope of its activities and reduceits staff strength drastically. It also established the Producer Price ReviewCommittee comprising of stakeholder representatives to recommend produ-cer prices and prices for various services in the sector. It also gradually reducedexport taxes from nearly a third of export prices to less than 3 percent by 2010.The marketing board continued to control the quality of cocoa exports, apractice that was discontinued in the liberalized sectors of some neighboringcountries, and this has enabled Ghana to maintain its reputation for cocoa ofhigh quality, which earns a price premium of around 5 percent in the worldmarket (Kolavalli et al. 2012).
8.2.1.1 Marketing
Since colonial times, all trade in cocoa for both the domestic and exportmarkets has been controlled by a marketing board, originally the CocoaMarketing Board (CMB) but later named the Cocobod. Cocobod pays produ-cers a guaranteed pan-seasonal, pan-national price that is announced at the
OUP CORRECTED PROOF – FINAL, 30/7/2019, SPi
213
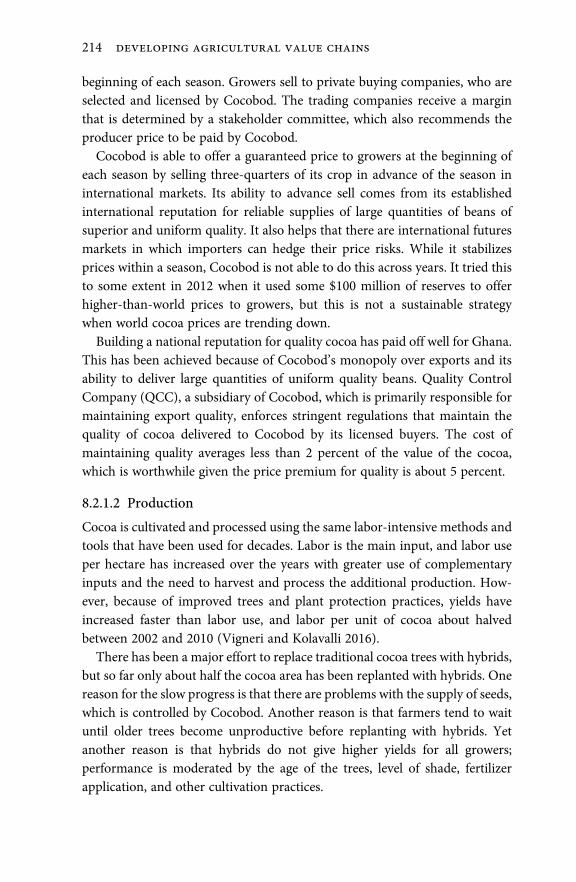
beginning of each season. Growers sell to private buying companies, who areselected and licensed by Cocobod. The trading companies receive a marginthat is determined by a stakeholder committee, which also recommends theproducer price to be paid by Cocobod.
Cocobod is able to offer a guaranteed price to growers at the beginning ofeach season by selling three-quarters of its crop in advance of the season ininternational markets. Its ability to advance sell comes from its establishedinternational reputation for reliable supplies of large quantities of beans ofsuperior and uniform quality. It also helps that there are international futuresmarkets in which importers can hedge their price risks. While it stabilizesprices within a season, Cocobod is not able to do this across years. It tried thisto some extent in 2012 when it used some $100 million of reserves to offerhigher-than-world prices to growers, but this is not a sustainable strategywhen world cocoa prices are trending down.
Building a national reputation for quality cocoa has paid off well for Ghana.This has been achieved because of Cocobod’s monopoly over exports and itsability to deliver large quantities of uniform quality beans. Quality ControlCompany (QCC), a subsidiary of Cocobod, which is primarily responsible formaintaining export quality, enforces stringent regulations that maintain thequality of cocoa delivered to Cocobod by its licensed buyers. The cost ofmaintaining quality averages less than 2 percent of the value of the cocoa,which is worthwhile given the price premium for quality is about 5 percent.
8.2.1.2 Production
Cocoa is cultivated and processed using the same labor-intensive methods andtools that have been used for decades. Labor is the main input, and labor useper hectare has increased over the years with greater use of complementaryinputs and the need to harvest and process the additional production. How-ever, because of improved trees and plant protection practices, yields haveincreased faster than labor use, and labor per unit of cocoa about halvedbetween 2002 and 2010 (Vigneri and Kolavalli 2016).
There has been a major effort to replace traditional cocoa trees with hybrids,but so far only about half the cocoa area has been replanted with hybrids. Onereason for the slow progress is that there are problems with the supply of seeds,which is controlled by Cocobod. Another reason is that farmers tend to waituntil older trees become unproductive before replanting with hybrids. Yetanother reason is that hybrids do not give higher yields for all growers;performance is moderated by the age of the trees, level of shade, fertilizerapplication, and other cultivation practices.
OUP CORRECTED PROOF – FINAL, 30/7/2019, SPi
214

Yield response to fertilizer is generally modest, but its use is maintainedwith the aid of a fertilizer subsidy. The subsidy reached nearly 100 percent in2015 when fertilizers were supplied free to well-maintained farms. Pesticidesare also subsidized for cocoa, and public sprays to control some contagiouspests and diseases are undertaken by Cocobod, paid for using cocoa exportrevenue held back from growers.
8.2.1.3 Competitiveness
Ghanaian cocoa is internationally competitive because its high-quality beansensure that the beans are sought after and sell at a premium. Major competi-tors of other countries in the world market have achieved higher yields withlower costs of production, but because their product quality is lower, theirreturns are no higher. For example, under comparable levels of technology, thegross margins earned per hectare in Ghana are similar to those obtained inCote d’Ivoire (LMC 2014).
Despite producing high-quality beans, Ghana has not been able to developany agro-processing activities like manufacturing chocolate. This is primarilybecause cocoa beans make up less than 20 percent of the cost of raw materialgoing into production of chocolates (Gilbert 2008), and for the other materialsused in chocolate production, including dairy products, Ghana simply cannotcompete with Western Europe on a cost basis.
8.2.2 Pineapples
Indigenous farmers also initiated the production of pineapples in Ghana. TheAburi botanical gardens, established by German missionaries in the latenineteenth century, introduced the smooth Cayenne variety into Ghana andpeasant farmers near Accra started growing it. The first serious attempt toexport pineapples was made during the mid-1960s, when a processingplant and a state-owned plantation were established as part of the country’spost-Independence strategy for industrialization and import substitution(Whitfield 2010). However, production stalled when the public processingplants that were established in the early 1960s failed because of weak rawmaterial supply, in addition to the usual management problems that besetmost parastatals.
Pineapple exports were revived in the 1990s by private importers who sawan opportunity to compete in the European markets when airfreight costs toEurope became favorable as a result of the economic reforms (Danielou and
OUP CORRECTED PROOF – FINAL, 30/7/2019, SPi
215

Ravry 2005). Airfreight from Ghana actually became cheaper than sea freightfrom neighboring Cote d’Ivoire, the major exporter from West Africa. Ghanadramatically increased its exports of fresh pineapples to Europe between 1994and 2004, reaching annual exports of 71,000 MT, and increasing its marketshare in Europe to 10 percent in 2004 (Gatune et al. 2013). This expansionwas temporarily checked when airfreight was liberalized in Cote d’Ivoire, butwith a public effort that involved organizing producers into a cooperative—Sea-Freight Pineapple Exporters Ghana (SPEG)—to bulk up their exports toattract ships to Ghanaian ports to pick up the produce, producers were able toswitch back to sea freight and exports continued. However, the quality ofexports declined with the longer delays incurred with sea freight.
Exports crashed in 2005 when a new variety of pineapple, MD2, went intoproduction in Costa Rica and was introduced into the European markets.MD2 was developed by the Hawaii Pineapple Research Institute and furthermodified by Del Monte, and is sweeter, smaller in size, yellowish (golden)in appearance and more consistent in flavor than the traditional SmoothCayenne exported by Ghana. Retailers also considered it to be superiorbecause of its longer shelf life and easier storability (Fold and Gough 2008).Even though planting material for MD2 became available in Ghana, mostgrowers were not able to acquire the necessary knowledge to grow it in theabsence of any forward-looking national investments in research and develop-ment to support local production (Whitfield 2010). Some large-scale growershired consultants from Costa Rica to guide them in their production practices,but these practices do not seem to have been suitable for Ghanaian conditions(Moss et al. 2014).
Ghana’s exports fell from 71,000 MT in 2004 to 35,000 MT in 2008, and theexport of Smooth Cayenne by sea ceased in 2006 (Gatune et al. 2013). Severalfruit-processing firms that had sprung up to take advantage of pineapplesrejected for export closed down as they were no longer able to procuresufficient fruits from growers (Gatune, et al. 2013). Processing SmoothCayenne and Sugar Loaf varieties, which are produced for the local market,has evolved as a strategy to replace some exports (Kleemann, Abdulai, andBuss 2014).
8.2.2.1 Marketing
There are two markets for pineapples: export of fresh pineapples, and adomestic market for fresh and processed pineapples. Most of the productionfor the domestic market is produced by small-scale growers and sold toitinerant traders who supply fresh fruits to consumer markets throughout
OUP CORRECTED PROOF – FINAL, 30/7/2019, SPi
216

the country, and to fruit-processing companies. All pineapple exports areundertaken by private companies, many of which also have their own pine-apple farms. There were about sixty exporters prior to 2004, but Suzuki (2014)found only fourteen a decade later. Relatively few smallholders producepineapples for the export market, and those who do are vertically linked topineapple exporters, such as in “core-satellite” systems (Suzuki, Jarvis, andSexton 2011). Contract farmers may receive inputs and services from theexporter, but there is no commitment to buy specific quantities from themat the time of planting. Under this system, the smallholders bear most of themarketing risk (Suzuki et al. 2011). This is because exporters have first call onthe growers’ harvest, but they only purchase the amount of pineapples theycan export, and this amount is often not known until the last moment.Smallholders have to sell any surplus production in the domestic market.
8.2.2.2 Competitiveness
Ghana struggles to remain competitive as a pineapple exporter. Its last exportsurge depended on sea freight, and that depended on producers and exportersproducing fruits of good quality with an adequate shelf life, and delivered tothe port in good condition and kept under cool conditions. This has alwaysbeen a challenge in Ghana. Growers do not follow standardized practicescapable of producing homogenous, good quality fruits, and there is significantloss and deterioration of quality at the post-harvest stage because of insuffi-cient investments in handling, cooling, and transporting facilities (Whitfield2010). In addition, facilities at the main seaport are not organized for perish-able exports as there are no packing sheds and cold stores.
Ghanaian exporters have never been able to achieve the volumes of exportsand standards of management needed to gain leverage in the European marketand increase their profit margins. Ghana’s pineapple exports were estimated toearn 20 percent gross margin on turnover compared to 49 percent by CostaRican exporters; Costa Rican producers also have six times more revenue perhectare than Ghana in the conventional market (Gatune et al. 2013). Com-petitiveness took another shock in 2005 with the introduction of MD2 into theEuropean market, and the failure of most Ghanaian producers to adopt it.
8.2.3 Rice
Rice is one of the main staples in Ghana, and because demand is incomeelastic, the growth in per capita incomes has helped increase per capita
OUP CORRECTED PROOF – FINAL, 30/7/2019, SPi
217

consumption of rice by about 20 percent since the 1980s (MoFA 2010).Production grew by 7.6 percent per year over 1980–94, and 5.4 percent peryear over 1995–2012, and total production grew from about 80,000 MT ofpaddy rice per year in the late 1980s, to nearly half a million MT in 2010 (seeChapter 4). However, national demand grew faster and rice imports (in milledrice equivalents) increased from 16,358 tons in 1980, to 166,828 tons in 2000,to 320,143 tons in 2010 (FAOSTAT). Most of the imported rice is of the longgrain, aromatic varieties that consumers generally prefer, and which originateprincipally from Vietnam and Thailand (Amanor-Boadu 2012; Modzakeh andAngelucci 2016). Locally produced rice is perceived to be of lower qualitybecause of the type of varieties grown and the way it is milled. Rice is typicallyprocessed through parboiling techniques, which makes the rice harder, glassier,and firmer when cooked, and this does not appeal to the many urban con-sumers who now dominate the domestic rice market (Kranjac-Berisavljevicet al. 2003).
8.2.3.1 Marketing
Rice production and trading is fully in the hands of the private sector. Thereare essentially two markets, one for imported rice and the other for locallyproduced rice. Smallholder rice producers usually sell their produce to marketwomen who then sell to retailers and consumers. Just a few producers are ableto sell their produce directly to final consumers (Amanor-Boadu 2012). Themarket women, who constitute the majority of wholesalers and retailers, travelto rice-producing areas to assemble production from numerous smallholderproducers. These itinerant traders operate an oligopolistic system with stronginfluences on both consumer and producer prices (Kranjac-Berisavljevic et al.2003; Amanor-Boadu 2012).
Imported rice is sold to wholesalers and retailers at the local ports in Temaand Takoradi. Although middlemen are often used to link wholesalers toretailers and consumers, consumers are also able to directly purchase fromimporters (Amanor-Boadu 2012). Various brands of imported rice are mar-keted through television and other media (Kranjac-Berisavljevic et al. 2003).
Imported rice is priced higher than local rice, by about 15–40 percent onaverage, and is mainly associated with better-quality, long-grain perfumed riceof good taste and appearance (Ragasa et al. 2013). Grade 1 rice accountsfor about 6 percent of total imports, while grade 2 accounts for 51 percent.Grade 1 rice is not produced in Ghana, and grade 2 rice represents only4 percent of total production. Most of the domestic production (83 percent)is of grade 5 (USAID 2009).
OUP CORRECTED PROOF – FINAL, 30/7/2019, SPi
218

8.2.3.2 Production
The bulk of the rice is produced in northern Ghana under lowland or irrigatedconditions. While non-irrigated yields are generally 2 tons per ha, yieldsaveraging 5.5 tons per hectare have been achieved in the Kpong IrrigationProject (KIP), where producers benefit from good irrigation, grow consumer-preferred fragrant rice varieties, use certified seeds, and adopt a well-developedset of agronomic practices that are communicated through an effective exten-sion system (Takeshima et al. 2013).
Tractors are used to prepare land for rice cultivation, and machines are alsoused for harvesting and threshing. Mechanization costs are high comparedto competing countries like Thailand (Byerlee et al. 2013). The adoption andreplacement of modern varieties in rice production is about average for a WestAfrican country; the average age of rice varieties is fifteen years (Ragasa et al.2013). Although nearly twenty rice varieties have been officially released inGhana since the 1970s, significant quantities of certified seeds are only pro-duced for three varieties. Use of fertilizer is generally not profitable exceptunder irrigated conditions (Ragasa et al. 2013).
8.2.3.3 Competitiveness
With few exceptions, domestically grown rice cannot compete with importedlong grain, aromatic rice, and is protected by levies and taxes that add nearly40 percent to the price of imports. One exception is the Kpong IrrigationProject which can compete, but this required substantial public investment inirrigation infrastructure. On average, domestic rice sells at prices that are10–30 percent less than those of imported rice (Ragasa et al. 2013). Thecosts of producing and marketing rice in Ghana are considerably higherthan in Thailand or Senegal (Byerlee et al. 2013). There are opportunities forimproving competitiveness by growing more of the types of rice that con-sumers want, by growing more rice under irrigated conditions, and by improv-ing rice milling and processing to improve conversion rates and quality(Winter-Nelson and Aggrey-Fynn 2008).
8.2.4 Tomatoes
Tomatoes and processed products such as tomato paste are an integral partof the Ghanaian diet, and a significant share of household expenditures onvegetables is for tomatoes and tomato products. National consumption has
OUP CORRECTED PROOF – FINAL, 30/7/2019, SPi
219

grown steadily, while domestic production has stagnated. Beginning at about100,000 tons in the 1970s, production peaked at about 200,000 tons per year inthe late 1990s, but has since gradually declined. Yields were about 13 tons perhectare in the 1990s (Wolff 1999), but averaged only about 7.5 tons/ha in theearly 2000s, and 6.7 tons/ha by the end of the decade (Asuming-Brempongand Asuming Boakye 2008). Ghana is now a major importer of tomato pasteand anywhere from a third to one half of the fresh tomatoes consumed in thecountry are imported from Burkina Faso.
Government invested in the processing of tomatoes as part of the post-Independence industrialization strategy, but the industry failed. Apart frompublic sector inefficiencies, a key reason for failure was an inability to sourcetomatoes of acceptable quality at remunerative prices from Ghanaian farmers(Robinson and Kolavalli 2010a). Recent surveys suggest that nearly three-quarters of producers have production costs that are higher than the pricesthat processors can viably afford to pay given the price of available imports(Robinson and Kolavalli 2010a). Privatization of some of the state-ownedfactories also failed, basically because the processors were also unable to sourceadequate raw material through out-grower arrangements.
8.2.4.1 Marketing
Producers sell their tomatoes to itinerant traders. The movement of tomatoesto major markets is controlled by an association of traders, which acts as acartel controlling the total volume that enters a market. The cartel effectivelywidens the price wedge between farmers and consumers in major urbanmarkets, but the prices producers receive are still higher than what theywould get selling in local markets (Robinson and Ngleza 2011). Paste andother processed tomato products are imported into the country by privatetraders; one company imports paste in bulk to repackage for the local market.
8.2.4.2 Production
Most tomatoes are grown seasonally under rain-fed conditions, though somegrowers irrigate manually by lifting water from shallow wells. Improvedvarieties are important for achieving higher yields. Two varieties, PowerRano, grown widely in Brong Ahafo under rain-fed conditions, and Pecto-mech, a variety suitable for processing that is grown widely in the Upper East,outperform other varieties under most conditions. However, farmers in Ghanahave historically appeared reluctant to purchase seeds (Orchard and Suglo1999). Recent surveys suggest that less than one half of the producers purchaseall their seeds, and nearly a third use seeds extracted from unsold tomatoes
OUP CORRECTED PROOF – FINAL, 30/7/2019, SPi
220

(Monney et al. 2009). In the northeastern part of the country, where tomato iscultivated intensively with appropriate varieties and adequate levels of fertil-izers, yields are declining because of a “the tomato disease complex”, whichinvolves the excessive buildup of soil nematodes and uncontrollable prolifer-ation of fungal, bacterial, viral, and other diseases (Baba et al. 2013).
8.2.4.3 Competitiveness
The tomato sector struggles to compete with imports. Imported fresh toma-toes are typically of higher quality than local products, and they are not asseasonal in their supply, making them more attractive to urban retailers andsupermarkets. Traders claim that locally produced tomatoes are watery, tooseedy, and have shorter lifespans than imported varieties. Local tomatoes arealso too expensive for processing given the low price of imported products.A major reason for this is low yields, which range from 10 to 20 tons/ha,depending on whether production is rain-fed or irrigated, compared to 60 to80 tons/ha obtained in major processing countries. More than half of produ-cers incur production costs that are higher than GH¢100 per ton, which is theprice that processors can afford to pay growers and still compete withimported products (Robinson and Kolavalli 2010a).
8.3 Policies to Support Value Chains
We turn now to an examination of the kinds of public interventions that mighthelp strengthen the four value chains described above. A value chain com-prises a series of value-adding activities that extend from various stages infarm production, through post-harvest handling, processing, and marketinguntil the product reaches its final destination. Most activities along valuechains are best undertaken by the private sector, and the need for publicinterventions arises when the private sector is unable to adequately performits roles. There may be many reasons for private sector failings, includingmarket failure problems (e.g., lack of complementary inputs, or first moverproblems), discriminatory government policies (e.g., taxes and tariffs, prefer-ential treatment of state-owned enterprises), and insufficient provision ofpublic goods and services (e.g., rural roads, agricultural R&D, seed regulations,and cold storage facilities). Public interventions to resolve value chain prob-lems range from ones designed to fix specific weaknesses along the value chainfor an individual commodity, through public–private partnerships to coord-inate activities along the value chain, to the public sector taking control of
OUP CORRECTED PROOF – FINAL, 30/7/2019, SPi
221

large parts of the value chain (as with cocoa). We consider recent examples ofgovernment interventions in Ghana, and identify some important gaps andfailures that remain for our selected value chain case studies.
8.3.1 Targeted Interventions along Value Chains
We consider interventions along value chains, beginning with inputs neededfor farm production and working up the chain to processing and marketing.Some value chain interventions are specific to a commodity, but many arecross cutting and impact on several value chains at a time.
8.3.1.1 Seeds
Apart from cocoa, where Cocobod has proactively supported the development anddissemination of improved cocoa trees, Ghanaian farmers have limitedaccess to improved crop varieties, either because they have not been devel-oped and adapted to local conditions, or because the seeds are unattainable.A recent IFPRI study (Tripp and Ragasa 2015) identified several weaknessesalong the seed supply chain and made recommendations for improving thesituation. These included: a) additional government support of public researchinstitutions to implement long-term strategies to supply farmers with superiorseed varieties, and to maintain pure lines that are accessible to private breed-ers; b) strengthening the functioning of critical institutions in the seed sector,such as the National Seed Council; c) providing more effective coordinationand regulation; d) guaranteeing the availability of foundation seeds; ande) ensuring the integrity and pureness of seeds sold to farmers. It was alsonoted that access to seeds could be improved immediately by implementingthe existing ECOWAS harmonization policy on seeds to benefit from a largermarket for seeds and to encourage private investments.
8.3.1.2 Chemical Inputs
Chemical inputs of fertilizers and pesticides are mainly supplied by the privatesector in Ghana. However, use levels are still low, and this reflects demand aswell as supply-side issues. One reason demand is low is because for manyfarmers, the returns to fertilizer use are low and risky, especially when cropsare grown without irrigation. Higher returns depend on complementaryactions like the use of improved seeds, better management of soil fertility,better agronomic practices, and additional irrigation. In the case of cocoa,Cocobod provides extension services for cocoa growers to help establish the
OUP CORRECTED PROOF – FINAL, 30/7/2019, SPi
222

complementary requirements for achieving higher yields, but there is littlesystematic support for other commodities. The private sector plays a small rolein providing information to farmers growing other crops, such as export firmsthat enter into contract-farming arrangements (e.g., pineapples), or inputsuppliers who have incentive to help farmers increase their crop yieldresponses, and hence their demand for chemicals. However, there is clearlyan important knowledge gap that is not currently being met by the publicextension system (Moore, Ferguson, and Lolig 2015). There is also need formore widespread soil testing and mapping so that fertilizer dealers andfarmers can better match fertilizer blends with regional soil nutrient deficien-cies. Other public responsibilities include regulating and guiding proper use offertilizers and chemicals.
Cocobod has been subsidizing fertilizer use on cocoa since 2003 as part of itsHi-Tech Program, but in order to encourage greater use on other crops thegovernment introduced a subsidy in 2007 as part of a broader package ofinterventions to support agricultural growth (see Chapter 7). The subsidycovered about half the fertilizer price in 2008, but had fallen to 26 percent in2016. Partly as a result of the subsidy, fertilizer use in Ghana was six to tentimes higher in 2010 than it was in the early 2000s. Although the subsidy hasencouraged greater fertilizer use, the evidence provided in other chapters ofthis book suggests that this has contributed little to crop yield growth, but byhelping to maintain soil fertility, has enabled farmers to reduce the length oftheir fallow periods and expand their cropped areas. As discussed inChapter 7, the fertilizer subsidy has become an important financial burdenof the state that may not be sustainable, and there is a need to explore smarterand less costly ways of supporting the uptake of fertilizer use. Ghana does apoor job of targeting fertilizer subsidies compared to some other Africancountries, and the financial cost could be reduced with little impact onfertilizer use by targeting subsidies to smallholders for the production offood grains who would not otherwise buy fertilizers (Houssou et al. 2018).Moreover, investments in seed supplies, irrigation, and soil mapping andtesting, as well as the development of more effective fertilizer products,could help improve crop-yield response to fertilizer, making it more profitablefor farmers to use even in the absence of a subsidy (Jayne et al. 2015).
8.3.1.3 Mechanization
Farming systems in Ghana have evolved to the extent that mechanization ofsome operations has become necessary. Currently, the main demand formechanization is for land preparation, which is important for regularly
OUP CORRECTED PROOF – FINAL, 30/7/2019, SPi
223

planted crops like rice, pineapples, and tomatoes. Most land preparation isundertaken using four-wheel tractors, and since few farmers can afford to ownthese, they are available for hire through parallel supply systems (see Chapter 9for more details). One is a network of Agricultural Mechanization ServicesCenters (AMSECs) established by the government beginning in 2007 throughthe supply of subsidized machinery and credit to selected private sectorcontractors. The other is a well-developed private sector supply chain ofimporters, machinery service contractors (mostly farmers), and repair andmaintenance shops. The private system has developed without governmentsupport, and its lynchpin is a cadre of medium- and large-scale farmers whoown used tractors and hire out tractor services to smaller-scale farmers whenthey are not required for use on the home farm. These contractor farmersinterface with private firms who import secondhand tractors, and machineryrepair and maintenance shops, which also stock spare parts. This system isworking well and has created a competitive market for hiring-in services. Onthe other hand, the AMSEC model recently promoted by the governmentseems not to be viable in its present form (see Chapter 9). Many of theAMSECs have unprofitable business models and struggle to pay their debtsto the government. One reason is a lack of development of spare parts andmaintenance services for the machines imported by the government, whichprevents them from making effective use of the machines.
As argued in Chapters 7 and 9, continuation of the AMSEC program in itspresent form will only add to the financial burden on the government. Itwould be better if the government were to phase out its AMSEC program, orsuitably modify it to make machines available to commercial growers, andfocus its efforts on supporting the private sector by funding appropriatemechanization research, technical training of young mechanics, and ensuringthat financial institutions can provide the longer-term lending needed byprivate agents and farmers in the mechanization supply chain (see Chapter 9).
8.3.1.4 Credit
High-value crops like pineapples and tomatoes also have high input costs, andseasonal cash flow can be a problem for many smallholders. At present, theformal financial sector provides little credit to smallholders other than forcocoa, and smallholders borrow mainly from relatives and traders. Banks arereluctant to lend for agricultural activities, which are perceived to be risky,especially at a time when the return on T-bills exceeds 20 percent. Whencommercial bank loans are available, loan rates range from 30–35 percent inaddition to a hefty administrative fee. Finding effective ways of facilitating
OUP CORRECTED PROOF – FINAL, 30/7/2019, SPi
224

greater farmer access to credit would seem to be one area where additionalresearch is needed.
8.3.1.5 Organizing farmers into groups
All four of our selected value chains are predominantly supplied by small-holders, and this poses challenges in maintaining competitiveness in worldmarkets, either for export or import substitution. To keep costs down andquality up, it helps to organize smallholders into groups for marketing pur-poses, and for supplying them with modern inputs, extension, credit, and thelike. In the case of cocoa, Cocobod serves this role, acting rather like a nationalcooperative. But farmers are much more fragmented for other commodities.
There have been many project interventions in Ghana to organize small-holders into Farmer Based Organizations (FBOs), but overall the experiencehas not been encouraging. For example, there was a World Bank attempt in1999 to set up a pineapple exporting cooperative for smallholders (FarmapineGhana Ltd) that initially had 178 smallholder members. The cooperativeoffered technical advice to its members and bulked up their output formarketing (Takane 2004). At its peak in 2000 the cooperative became thesecond-largest exporter of pineapples from Ghana. However, because of highoperating costs, the prices it offered to its members were less than theprices offered by commercial exporters and the company went bankrupt in2003–4, just as the global market for Smooth Cayenne pineapples collapsed(Halbach 2011).
A recent review of one project in which FBOs were organized found noevidence of the groups obtaining higher prices by acting collectively (IFAD2015). One survey of FBOs found that a significant share was organized largelyfor receiving grants and services from projects, rather than filling any mar-keting or input supply need (Salifu et al. 2012).
Many private companies also try to work with groups of farmers rather thanindividuals. One input supply company organizes cocoa producers into smallgroups so as to provide them with inputs on credit, and train them in bestpractices (Opoko et al. 2009). Masara N’zarki is a program in which maizegrowers are organized into groups to receive inputs on credit, in some caseswith an arrangement to buy the grains from them (Guyver and MacCarthy2011). While on average participants in these programs become more pro-ductive, it is disappointing that a surprisingly large share of them underminethe programs by side-selling produce to avoid debt repayment. Moreover,proliferation of programs that offer inputs for free or on a subsidizedbasis also discourage participation in commercial contracts (Lambrecht and
OUP CORRECTED PROOF – FINAL, 30/7/2019, SPi
225

Asare 2016). One donor teamed up with a private processing company, amarketing company, and the Ministry of Agriculture to support farmers inproducing tomatoes for the processor on contract. For various reasons,including the inability to supply inputs on time to farmers and delayed rainfall,producers were not able to increase productivity as expected and many ofthem side-sold to itinerant traders (Robinson and Kolavalli 2010b).
The need to organize smallholders seems less compelling for rice thanpineapples or tomatoes, since rice is a nonperishable commodity and thereare competitive marketing arrangements with many traders and many differ-ent sized mills.
8.3.1.6 Agro-processing
The private sector plays the primary role in agro-processing in Ghana today;past attempts with state-owned processing plants for a range of commoditiesall failed. However, there are a number of constraints that hold back privateinvestment in agro-processing. One is comparative advantage. In the case ofcocoa, Ghana has no comparative advantage in exporting processed chocolateproducts, but it has developed private processing capacity for the domesticmarket. Unfortunately, less than 50 percent of the local capacity to grind cocoabeans (nearly half a million tons) is utilized. In the case of tomatoes, yields aretoo low and per unit growing costs too high to enable processors to competewith imported tomato paste. This has led to many failed and under-utilizedtomato processing plants.
Another constraint is the challenge of obtaining adequate supplies of rawmaterials of the right qualities and on a sustained basis. Small-scale rice millowners in the Kpong area attempt to obtain adequate paddy supplies to keeptheir mills running by extending credit to smallholders. In the case of pine-apples and tomatoes, growers look to processors primarily to absorb surplusesthey cannot sell for export or in the fresh market. Viable processing, however,cannot be built on seasonal gluts, as they may not be suitable for processing(e.g., tomatoes for processing need to have higher level of solids than thatcontained in tomatoes marketed to consumers), and mills need more sus-tained supplies over the year to operate their capacity efficiently.
Government policy can have a major impact on the development of agro-processing. Writing on the globalization of tomato processing, Prichard andBurch (2003) note that in Thailand, the sector emerged because of thecongruence of a growing domestic demand for paste, producers who werealready used to contract-farming systems, government incentives offered toindustries to site themselves in the region, and cheap capital from Taiwan.
OUP CORRECTED PROOF – FINAL, 30/7/2019, SPi
226

In China, another country in which processing has flourished, financingarrangements with Italian firms enabled them to invest in state-of-the-artequipment by paying for it in processed outputs. The arrangement also gavethem access to markets.
The four value chains studied here suggest that private sector investments inprocessing usually follow the availability of raw materials rather than the otherway round, in which case it is better for policymakers to focus on ways ofincreasing the productivity and quality of crops and to leave processinginvestments to the private sector. But government does have an importantfacilitating role to play in supporting private firms, especially during theirestablishment phase. The experience of some of the agro-processing units inthe northern part of Ghana suggests that incentives such as tax breaks do notmake much of a difference, whereas a reliable supply of raw material andinfrastructure that influence the cost of operations are more important to theviability of operations.² A recent enterprise survey in Ghana found that accessto finance was overwhelmingly identified as the main obstacle to growth(World Bank 2014). Land rights are another important constraint, both forobtaining sites for building agro-processing and storage facilities, and forestablishing large-scale commercial farms, even when the latter might serveas hubs for smallholder out-grower schemes (Amanor 2013; Throup et al.2014). For perishable commodities like pineapples and tomatoes, public sup-port for investments in transport systems and cold storage facilities is alsoimportant for building up supply chains for agro-processing.
8.3.1.7 Quality control
Quality control is particularly important for exports, with the potential tocreate a regional/national reputation to either obtain a price premium or serveniche markets. Ghana’s experience in exporting high-quality cocoa beans is agood example of the benefits of quality control. The absence of it can bedisastrous, as illustrated by a recent EC ban on imports of all fruits andvegetables from Ghana because of contamination with harmful organismsand poor documentation. Investing in improving quality is also worthwhilein the domestic market. Domestically produced rice, for example, has not beenable to adequately compete with imported rice because of quality issues, andsells at prices that are 15 percent lower than imported rice, despite an import
² Based on discussions by the author with the heads of Ghana’s investment promotion council andthe free trade zone authority.
OUP CORRECTED PROOF – FINAL, 30/7/2019, SPi
227

tariff on the latter. Desired attributes of rice quality include fragrance, polish,and freedom from contamination with stones and chaff.
Quality improvement needs to be undertaken at two levels: during on-farmproduction, and during post-harvest handling, processing, and marketing.Table 8.1 indicates key quality aspects for each of our four commodities, aswell as some of the infrastructure requirements needed to achieve them.
Quality improvement on-farm requires the adoption of appropriate pro-duction and post-harvest practices by producers. In the case of cocoa, forexample, quality depends on plant protection practices, timely harvesting, andproper fermenting and drying of beans. For rice, pineapples, and tomatoes,quality could be significantly improved by growing varieties that better meetconsumer and processor requirements. Proper post-harvest handling of per-ishable crops like tomatoes and pineapples requires farmers have good accessto transport and appropriate storage facilities (e.g., cold storage for pineapples)to avoid spoilage. Rice farmers need to thresh and bag their paddy withoutadding stones and soil. Tomato growers need to adopt watering practices priorto harvesting that lead to acceptable solids content in the fruit, which isimportant for processing.
Agricultural processors and exporters need access to good transport andstorage facilities, which link back to the farm. Some of the needed infrastruc-ture investments will be privately made, but public investments in rural roads,warehouses, cold storage, port facilities, and the like, play crucial complemen-tary roles. Limited access to feeder roads and farm tracks still discourage
Table 8.1. Requirements for improving quality in selected value chains
Cocoa Rice Tomato Pineapple
Productionpractices
Appropriateharvestingpractices
Cultivation of afragrant variety
Suitable varietyand wateringpractices to reducewater content
Suitablevariety andproductionpractices
Post-harvesthandling/Processing
Properfermentationand drying
Threshing andbagging withoutstones and soil;proper milling
Sorting andpacking;appropriatecontainers
Sorting andpacking in acold chain
Infrastructurerequired
Minimal:low-techframes fordrying onfarms
Appropriatemilling andgrading facility
Transport On-farmcold chain
Source: Author.
OUP CORRECTED PROOF – FINAL, 30/7/2019, SPi
228
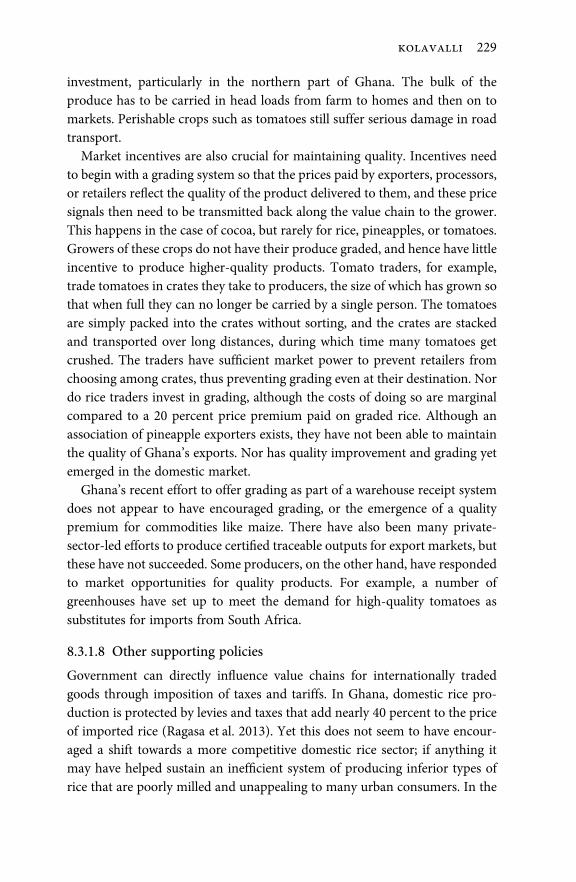
investment, particularly in the northern part of Ghana. The bulk of theproduce has to be carried in head loads from farm to homes and then on tomarkets. Perishable crops such as tomatoes still suffer serious damage in roadtransport.
Market incentives are also crucial for maintaining quality. Incentives needto begin with a grading system so that the prices paid by exporters, processors,or retailers reflect the quality of the product delivered to them, and these pricesignals then need to be transmitted back along the value chain to the grower.This happens in the case of cocoa, but rarely for rice, pineapples, or tomatoes.Growers of these crops do not have their produce graded, and hence have littleincentive to produce higher-quality products. Tomato traders, for example,trade tomatoes in crates they take to producers, the size of which has grown sothat when full they can no longer be carried by a single person. The tomatoesare simply packed into the crates without sorting, and the crates are stackedand transported over long distances, during which time many tomatoes getcrushed. The traders have sufficient market power to prevent retailers fromchoosing among crates, thus preventing grading even at their destination. Nordo rice traders invest in grading, although the costs of doing so are marginalcompared to a 20 percent price premium paid on graded rice. Although anassociation of pineapple exporters exists, they have not been able to maintainthe quality of Ghana’s exports. Nor has quality improvement and grading yetemerged in the domestic market.
Ghana’s recent effort to offer grading as part of a warehouse receipt systemdoes not appear to have encouraged grading, or the emergence of a qualitypremium for commodities like maize. There have also been many private-sector-led efforts to produce certified traceable outputs for export markets, butthese have not succeeded. Some producers, on the other hand, have respondedto market opportunities for quality products. For example, a number ofgreenhouses have set up to meet the demand for high-quality tomatoes assubstitutes for imports from South Africa.
8.3.1.8 Other supporting policies
Government can directly influence value chains for internationally tradedgoods through imposition of taxes and tariffs. In Ghana, domestic rice pro-duction is protected by levies and taxes that add nearly 40 percent to the priceof imported rice (Ragasa et al. 2013). Yet this does not seem to have encour-aged a shift towards a more competitive domestic rice sector; if anything itmay have helped sustain an inefficient system of producing inferior types ofrice that are poorly milled and unappealing to many urban consumers. In the
OUP CORRECTED PROOF – FINAL, 30/7/2019, SPi
229

case of cocoa, production for export is still taxed, though since the economicreforms the rate of taxation has been kept low enough so as not to discourageproduction. Moreover, a substantial share of the tax is returned to cocoagrowers in the form of services provided by Cocobod (Kolavalli, 2017).
8.3.2 More Comprehensive Institutional Interventionswithin Value Chains
Given obvious failures at various points along the value chains for pineapples,rice, and tomatoes,might there be a case for greater public sector coordination, ashas been done successfully for cocoa formanydecades?We considerfirst the caseof cocoa and identify reasons why the Cocobod model is unlikely to work forother commodities like pineapples, rice, or tomatoes. This leads to considerationof alternative forms of public intervention for these commodities.
8.3.2.1 The Cocobod model
The Cocobod model is one in which the state, through a parastatal, has takenalmost full control of the value chain for cocoa. While some functions alongthe value chain have been privatized, such as the collection of cocoa fromfarmers, supplying fertilizers, and processing, most of these functions areundertaken by private firms that are vetted and licensed by Cocobod.
There are two compelling reasons that justify Cocobod’s continuing andextensive interventions along the value chain for cocoa. One is the need toachieve quality control along the entire value chain to ensure high quality cocoabeans for export that attract a price premium. Quality control is especiallychallenging given that the crop is grown by a large number of diverse small-holders scattered throughout the forest zone. Second, is the need to have themarketing power to obtain and maintain leverage and branding in the worldmarket, something that no private exporting firm could easily replicate. Coco-bod has been able to fulfill these needs because, unlike the cocoa sectors in someneighboring countries, it has retained a monopoly power over cocoa exports. Italso helps that Ghana is an established and major player in the world market.Cocobod has also strengthened its competitiveness by using its marketing powerto retain some of the cocoa revenues to invest in cocoa research and to supplyproductivity- and quality-enhancing services to farmers, such as hybrid trees,extension, and public sprays.
The experience with marketing boards in Africa has generally been unfavor-able, but Cocobod stands out as an exception. Contrary to what might be
OUP CORRECTED PROOF – FINAL, 30/7/2019, SPi
230

expected, Cocobod and its associated marketing organizations (QualityControl Company and the Cocoa Marketing Company) seem not to havebeen corrupted or lured into major inefficiencies as a result of their monopolypower. It is not clear that there are any specific characteristics of cocoa as acommodity that explain the development of a marketing organization as“capable” and accountable as Cocobod, and its success may simply reflect acapacity that originates from its accumulated institutional heritage and mar-keting experience from prior to Independence, and its initial base in London.It also benefited from cost-cutting and performance-improving measuresintroduced as part of the economic reforms, and to continuing governmentoversight. Yet its success with cocoa does not seem to be easily transferable, asdemonstrated by Cocobod’s recent and less successful foray into developingthe value chain for shea nut exports.
Would the Cocobod model work for other export commodities like pine-apples? Probably not. Ghana is a relatively small player in the world pineapplemarket and the successful exporting of fresh pineapples requires finding aniche in a very competitive and dynamic world market, and overcomingquality and transport problems with a perishable commodity. There is needfor nimble solutions that only the private sector is likely to find. Rather than apublicly controlled marketing board, perhaps what Ghana needs for its pine-apple exports is some large private firms, or an association of private firms, todevelop and integrate the value chain themselves, especially firms that haveaccess to export markets and foreign investment capital, and who could set uptheir own production networks and invest in domestic processing as appro-priate. The state could still play a supporting role, such as promoting exports,much as the Chilean government promotes the branding and export ofChilean wine (Benavente 2006).
In the case of tomatoes, the challenge is to be able to match the quality ofimported tomatoes and processed products, not to create world market nichesfor exports. A parastatal marketing board would likely lobby for import tariffsand taxes on competing imports, which would not only discourage develop-ment of a more competitive domestic value chain for tomatoes and tomatoproducts, but would also raise the prices of some important and nutritiousfoods for the poor.
The market for rice is quite different. It is a non-perishable commodity witha highly competitive domestic market with lots of traders and millers ofdifferent scales. As with tomatoes, a major challenge is to improve the qualityof domestically grown and milled rice to compete with imports, and this callsfor a more limited but supportive public sector role. There is already an import
OUP CORRECTED PROOF – FINAL, 30/7/2019, SPi
231

tariff on imported rice, but it has done little to promote a more competitivedomestic value chain, yet has increased the price of an important food forthe poor.
8.3.2.2 Alternative Models
Resolving many of the weaknesses along the value chains for pineapples,tomatoes, and rice does call for some more coordinated interventions alongtheir value chains. Quality control, for example, requires an adequate gradingsystem of the final product, and also the ability to transmit the price differen-tials associated with different qualities back along the value chain to relevantdecision-makers, including farmers. This might require some coordination ofthe supply of desired seed varieties to farmers with appropriate advice onagronomic practices, with improved post-harvest grading and handling byfarmers, traders, and transporters, as well as improvements in processingplants. Getting all the relevant decision-makers to agree and work in comple-mentary ways and at the right times is not something that necessarily evolveswhen left to market forces alone.
As an alternative to the marketing board solution, there have been severalrecent attempts to find more flexible institutional structures that can facilitateand encourage coordination and the development of non-market relationshipsamong value chain actors, but without undermining a basic laissez-faireapproach to the market. Particular attention has been given to the problemof giving smallholders access to inputs and markets (Kolavalli et al. 2015).Some programs in Ghana such as the Northern Rural Growth Project (NRGP)and the Market Oriented Agricultural Project (MoAP), enable various actorsin value chains to interact with each other by organizing value chain commit-tees. Whether these efforts are useful to overcome some of the marketfailures to give smallholders greater access to inputs and output marketsremains to be seen.
Crop development strategies too have been developed with the participationof private value chain actors. Maize and yam development strategies weredeveloped in Ghana with substantial participation of value chain actors in thebelief that when they come together problems can be better diagnosed andresolved (Kolavalli et al 2015). The strategies that emerge from such approaches,however, lack focus and often neglect the role of technologies. For example,value-chain-based studies attribute low productivity and production of ricein Ghana to a whole range of factors: low profitability and trader oligopoly,low processing premiums, insufficient knowledge of packaging, insufficientavailability of inputs including certified seeds, insufficient mechanization
OUP CORRECTED PROOF – FINAL, 30/7/2019, SPi
232

and private-sector development for machine parts or appropriate millingmachines, high labor costs, poor performance of public irrigation projects,weak extension services with poor knowledge of production practices forlowland/irrigated rice production, lack of credit and high interest rates,inadequate drying space, warehousing and storage, weak land tenure thatdiscourages investment in irrigation and land improvements (Kranjac-Berisavljevic et al. 2003; USAID 2009; CARD 2010; IFDC 2008; Somadoet al. 2008). Without some prioritization of these problems it is not clearhow any committee would be able to begin to resolve them.
As discussed in Chapter 3, the development of more cohesive strategies forvalue chain development such as practiced in some East Asian countries hasbeen constrained by a weak public sector capacity and the government’s oftenantagonistic and weak relationships with the private sector.
8.4 Conclusions
This chapter has examined the value chains four important agriculturalcommodities, each of which has to compete internationally, either as an exportcommodity (cocoa and pineapples) or as a substitute for imports (tomatoesand rice).
The cocoa value chain is controlled by a parastatal, Cocobod, and worksreasonably well. Ghana is able to maintain a high-quality product that is recog-nized in the world market and receives a price premium. Quality control iseffectively managed all the way down from the export market to the smallholder.Growers have access to hybrids and needed inputs, and Cocobod even does someof the spraying. While there have been government aspirations to develop morevalue addition from cocoa, it seems clear that apart from the domestic market,Ghana has no competitive advantage in developing an industry for producingchocolate products for export. The puzzle with cocoa is why Cocobod has beenso successful given the generally poor experience with marketing boards andparastatals in Ghana and elsewhere in Africa. Its success may lie with a uniqueinstitutional capacity that is the outcome of its long history and accumulatedmarketing experience, together with effective government oversight.
Pineapples provide an example of failed coordination along a value chain.The problems faced by the Ghanaian pineapple industry is not so much accessto world markets, but rather challenges with production, quality control,responding to market shifts, and transitioning to new game-changing varietieslike MD2. It is not clear that the government has the capacity to establish a
OUP CORRECTED PROOF – FINAL, 30/7/2019, SPi
233

marketing board that would do for pineapples what Cocobod has done forcocoa. A better option is to provide public sector support to large private firms,or an association of private firms, in developing and integrating the value chainthemselves for pineapple exports; firms that have access to export markets andforeign investment capital, and who can set up their own production and qualitycontrol systems, and invest in domestic processing as appropriate. Such modelsalready exist in Ghana, and the public sector could help scale up such venturesand link in more smallholders by investing in agricultural extension andinfrastructure development, such as rural roads and cold storage facilities atairport or docks; also by supporting pineapple grading systems, making landaccessible for hub-and-spoke estates, providing tax incentives, and promotingGhana’s pineapple exports and branding in overseas markets. Many of theseinvestments might be financed by introducing a levy on exports, much as isdone with cocoa. The lack of such government support in the past helps explainwhy private firms have not been more successful (Whitfield 2012).
Tomato is another value chain that is best left to private sector initiative.However, in this case there is scope for parallel supply systems: one that ismore highly organized for quality control to meet the requirements of pro-cessing plants and high-end retailers and supermarkets, and another less-organized chain to produce fresh fruits for the domestic market. Again, theprivate sector should be encouraged to invest in developing the value chain forquality controlled fruits and to set up its own supply, quality control, andprocessing systems. But again this requires a more supportive environmentthan the government has been willing to provide so far, especially in helpingsmall farmers improve their yields and the quality of their produce.
The value chain for rice is quite different. It is a non-perishable commoditywith a highly competitive domestic market with lots of traders and millers ofdifferent scales. A major challenge is to improve the quality of domesticallygrown and milled rice to compete with imports. Rice does not easily lend itselfto contract farming or out-grower schemes, so it is difficult for the millingsector to improve the quality of the paddy it receives from farmers for milling.Rice growers need more public sector support to increase the productivity andquality of their product, and among other things this requires greater invest-ment in irrigation, agricultural research, and rural infrastructure. So far themain policy intervention has been the introduction of an import tariff onimported rice, but it has done little to promote a more competitive domesticvalue chain, yet has increased the price of an important food for the poor.
The findings for pineapples, tomatoes, and rice are illustrative of the prob-lems facing most other agricultural value chains in Ghana, and which arise
OUP CORRECTED PROOF – FINAL, 30/7/2019, SPi
234

from inadequate levels of state support for farmers and private sector playersalong value chains. Part of the problem is weak state capacity to intervenemoreeffectively along value chains (Cocobod being an exception), but more funda-mentally it reflects low levels of public investment in the noncocoa subsector(Chapter 7), and a constraining business environment. Important failures havebeen: the poor performance of the public R&D system in developing moreappropriate crop varieties to meet market needs; breakdowns in the supplychain for providing farmers with improved seeds; and inadequate agricul-tural extension, all of which are needed to further the development anduptake of better technologies that could help make Ghanaian farmers morecompetitive. Another failure has been insufficient provision of finance toagribusiness. Land rights are another important issue, both for obtainingsites for building agro-processing and storage facilities, but also for estab-lishing large-scale commercial farms, even when the latter might serve ashubs for smallholder out-grower schemes (Amanor 2013; Throup et al.2014). Greater investment in these fundamentals would go a long waytowards helping Ghana’s small farmers become more competitive in theirdomestic as well as export markets.
Beyond these fundamentals, there is need for government to be moreproactive in working with private sector players, both large and small, indeveloping grading systems and coordinating value chains through variousforms of marketing associations, or multi-stakeholder platforms (Devaux et al.2016). However, as discussed in Chapter 3, for government to play moreproactive roles along value chains requires overcoming inherently weak publicsector capacities, and a greater willingness to engage with the private sector. Asthe Government is again turning towards a more proactive approach to thenoncocoa subsector, it remains to be seen whether its recent commitment tothe policy framework of the “New Alliance for Food Security and Nutrition”will lead to more effective partnerships with the private sector.
References
Amanor, Kojo Sebastian. 2013. “Expanding Agri-business: China and Brazil inGhanaian Agriculture.” IDS Bulletin 44(4): 80–90.
Amanor Boadu, V. 2012. “Rice Price Trends in Ghana (2006–2011).” GhanaResearch and Issue Paper Series No. 02-2012. Accra: Monitoring, Evaluationand Technical Support Services (METSS), United States Agency for InternationalDevelopment (USAID).
OUP CORRECTED PROOF – FINAL, 30/7/2019, SPi
235

Asuming-Brempong S., and A. Asuming Boakye. 2008. “Socio-economic Analysisof Tomato Production in Ghana.” Technical report prepared for the Ghanatrade and livelihood coalition. University of Ghana Affiliates: Accra. (Mimeo.)
Baba, I. Y., J. Yirzagla, and M. Mawunya. 2013. “The Tomato Industry in Ghana—Fundamental Challenges, Surmounting Strategies, and Perspectives: A Review.”International Journal of Current Research 5(12): 4102–7.
Banful, A. B. 2009. “Operational Details of the 2008 Fertilizer Subsidy in Ghana:Preliminary Report.” GSSP Background Paper 18. Washington, DC: Inter-national Food Policy Research Institute.
Benavente, J. M. 2006. “Wine Production in Chile,” in V. Chandra (ed.), Tech-nology Adaptation and Exports. Washington, DC: World Bank.
Benin, S., M. Johnson, E. Abokyi et al. 2013. “Revisiting Agricultural Input andFarm Support Subsidies in Africa: The Case of Ghana’s Mechanization, Fertil-izer, Block Farms, and Marketing Programs.” IFPRI Discussion Paper No. 1300.Washington, DC: International Food Policy Research Institute.
Byerlee, Derek, Andres F. Garcia, Asa Giertz et al. 2013.Growing Africa: Unlockingthe Potential of Agribusiness: Main Report. Washington, DC: World Bank.
CARD (Coalition for African Rice Development). 2010. “Mapping of PovertyReduction Strategy Papers (PRSPs), Sector Strategies and Policies Related toRice Development in Ghana.” Nairobi: CARD–Alliance for a Green Revolutionin Africa (AGRA).
Chandra, Vandana (ed). 2006. “Technology, Adaptation, and Exports: How SomeDeveloping Countries Got It Right.” Washington DC: World Bank.
Danielou, M., and C. Ravry. 2005. “The Rise of Ghana’s Pineapple Industry: FromSuccessful Takeoff to Sustainable Expansion.” Africa region working paperseries. Washington, DC: World Bank.
Devaux, A., M. Torero, J. Donovan, and D. Horton. 2016. “Innovation forInclusive Value-chain Development.” Washington, DC: International FoodPolicy Research Institute.
Fold, N., and Gough, K. V. 2008. “From Smallholders to Transnationals: TheImpact of Changing Consumer Preferences in the EU on Ghana’s PineappleSector.” Geoforum 39:1687–97.
Gatune, J., M. Chapman-Kodam, K. Korboe et al. 2013. “Analysis of TradeImpacts on the Fresh Pineapple Sector in Ghana.” Research Working PaperNo. 41. Rome: Food and Agriculture Organization of the United Nations.
Gilbert, C. L. 2008. “Value Chain Analysis and Market Power in CommodityProcessing with Application to the Cocoa and Coffee Sector.” Discussion PaperNo. 5. Trento: Universita degli Studi de Trento.
Halbach, M. 2011. “Facilitating Collective Action for CommonMarketing.”Mastersthesis, University of Utrecht.
OUP CORRECTED PROOF – FINAL, 30/7/2019, SPi
236

Hill, P. 1963. Migrant Cocoa Farmers of Southern Ghana. Cambridge: CambridgeUniversity Press.
Houssou, Nazaire, Collins Asante-Addo, Kwaw S. Andam, and Catherine Ragasa.2018. “How Can African Governments Reach Poor Farmers with FertiliserSubsidies? Exploring a Targeting Approach in Ghana,” The Journal of Develop-ment Studies. Article in press. https://doi.org/10.1080/00220388.2018.1528353.
IFAD. 2015. “Roots and Tuber Improvement and Marketing Programme: ProjectCompletion Report.” Rome: International Fund for Agriculture.
IFDC (International Fertilizer Development Center). 2008. “Study of the Domes-tic Rice Value Chains in the Niger Basin of Mali, Niger, and Nigeria, WestAfrica.” Lomé: IFDC North and West Africa Division.
Jayne et al. 2015. “Towards a Sustainable Soil Fertility Strategy in Ghana.” Reportsubmitted to the Ministry of Food and Agriculture, Government of Ghana.
Kleemann, L., A. Abdulai, and M. Buss. 2014. “Certification and Access to ExportMarkets: Adoption and Return on Investment of Organic-Certified PineappleFarming in Ghana.” World Development 64: 79–92.
Kolavalli, S. and M. Vigneri. 2011. “Cocoa in Ghana: Shaping the Success of anEconomy,” in P. Chuhan-Pole and M. Angwafo (eds), Yes Africa Can: SuccessStories from a Dynamic Continent. Washington, DC: World Bank.
Kolavalli, S., M. Vigneri, H. Maamah, and J. Poku. 2012. “The Partially LiberalizedCocoa Sector in Ghana: Producer Price Determination, Quality Control, andService Provision.” IFPRI Discussion Paper No. 01213. Washington, DC:Development Strategy and Governance Division, IFPRI.
Kolavalli, Shashidhara, Akwesi Mensah-Bonsu, and Saima Zaman. 2015. “Agri-cultural Value Chain Development in Practice: Private Sector-led SmallholderDevelopment.” IFPRI Discussion Paper No. 1460. Washington, DC: Inter-national Food Policy Research Institute.
Kranjac-Berisavljevic, G., R. M. Blench, and R. Chapman. 2003. “Multi-agencyPartnerships (MAPS) for Technical Change in West African Agriculture: RiceProduction and Livelihoods in Ghana.” London: Overseas DevelopmentInstitute.
Kwakye, J. K. 2010. “High Interest Rates in Ghana: A Critical Analysis.” Accra:The Institute of Economic Affairs.
Lambrecht, I., and C. Ragasa. 2016. “Do Development Projects Crowd out PrivateSector Activities? A Survival Analysis of Contract Farming Participation inNorthern Ghana.” IFPRI Discussion Paper No. 01575. Washington, DC: Inter-national Food Policy Research Institute.
LMC International. 2014. “Cocoa Comparative Household Economy Study:West Africa Smallholder Cocoa Farmers.” Washington, DC: World CocoaFoundation.
OUP CORRECTED PROOF – FINAL, 30/7/2019, SPi
237

Modzakah, David, and Federica Angelucci. 2016. “Analysis of Price Incentives forRice in Ghana 2005–2013.” Technical Notes Series. Rome: FAO.
Monney, E., V. Edusei Poku, and E. Armah. 2009. “Baseline Survey of TomatoProduction in Ghana: A Study of Twelve Production Districts in Four Regions.”Ghana: The Horticulture Development Unit, Directorate of Crop Services andPost-Harvest Management Unit, Agriculture Engineering Services Directorate,Ministry of Food and Agriculture.
Moore, Austen, Oliver Ferguson, and Victor Lolig. 2015. “Assessment of Exten-sion and Advisory Services in Ghana’s Feed the Future Zone of Influence.”MEAS Country Assessment. Available at: https://agrilinks.org/sites/default/files/resource/files/MEAS%20Country%20Report%20GHANA%20-%20August%202015.pdf.
Moss, R., Garcia, J., and Osei, P. S. 2014. “An Integrated Approach to DiseaseControl and Soil Fertility Management for MD2 Pineapple: A Preliminary Trialin Ghana.” Pineapple News 21: 39. Available at: http://www.ishs-horticulture.org/workinggroups/pineapple/PineNews21.pdf.
Overseas Development Institute (ODI). 2003. “Multi-agency Partnership forTechnical Change in West African Agriculture: Rice Production and Livelihoodin Ghana.” London: ODI.
Opoko, Emmanuel, Richman Dzene, Stefano Cariaet al. 2009. “Impacts of Group-based Microfinance in Agriculture: Evidence from Ghana’s Cocoa AbrabopaAssociation.” Oxford: Centre for the Study of African Economies Departmentof Economics, University of Oxford.
Orchard, J. E., and K. J. Suglo. 1999. “Integrated Food Crops Projects: EnhancingSmallholder Livelihoods through Reducing Cost and Adding Value to Agricul-tural Production.” Final Technical Report. Kent: Natural Resource Institute andMinistry of Agriculture Ghana.
Patrick Guyver, and Mavis MacCarthy. 2011. “The Ghana Grains Partnership.”International Journal of Agricultural Sustainability 9(1): 35–41.
Pritchard, B., and D. Burch. 2003. Agro-food Globalisation in Perspective: Inter-national Restructuring in the Processing Tomato Industry. Aldershot: Ashgate.
Ragasa, Catherine, Awere Dankyi, Patricia Acheampong et al. 2013. “Patternsof Adoption of Improved Rice Technologies in Ghana.” GSSP Working PaperNo. 35. Washington, DC: International Food Policy Research Institute.
Robinson, Elizabeth, and Shashi Kolavalli. 2010a. “The Case of Tomato in Ghana:Processing.” GSSP Working Paper No. 21. Accra: GSSP.
Robinson, Elizabeth, and Shashi Kolavalli. 2010b. “The Case of Tomato in Ghana:Instutional Support.” GSSP Working Paper No. 22. Accra: GSSP.
Robinson, Elizabeth, and Guylain Ngleza. 2011. “Cartels and Rent-sharing at theFarmer–trader Interface: An Example from Ghana’s Tomato Sector.” IFPRI
OUP CORRECTED PROOF – FINAL, 30/7/2019, SPi
238

Discussion Paper No. 01065. Washington, DC: International Food PolicyResearch Institute.
Rothchild, Donald. 1980. “Military Regime Performance: An Appraisal of theGhana Experience, 1972–78.” Comparative Politics 12(4): 459–79.
Salifu, Adam, Rebecca Lee Funk, Meagan Keefe, and Shashidhara Kolavalli.2012. “Farmer-based Organizations in Ghana.” GSSP Working Paper No. 13.Washington, DC: International Food Policy Research Institute.
Somado, E., R. G. Guei, and N. Nguyen. 2008. “Module 1: Overview: Rice inAfrica,” in E. A. Somado, R. G. Guel, and S. O. Keya (eds), NERICA: The NewRice for Africa—a Compendium. Bouaké: Africa Rice Center (WARDA), 1–9.
Suzuki, Aya. 2014. “Risk on Dynamic Behavior of Farmers in the Export Market:A Case from the Pineapple Industry in Ghana.” Selected Paper prepared forpresentation at the Agricultural & Applied Economics Association’s 2014AAEA Annual Meeting, Minneapolis, MN.
Suzuki, A., L. S. Jarvis, and R. J. Sexton. 2011. “Partial Vertical Integration, RiskShifting, and Product Rejection in the High-Value Export Supply Chain: TheGhana Pineapple Sector.” World Development 39(9): 1611–23.
Takane, T. 2004. “Smallholders and Nontraditional Exports under EconomicLiberalization: The Case of Pineapples in Ghana.” African Study Monographs25(1): 29–43.
Takeshima, Hiroyuki, Kipo Jimah, Shashidhara Kolavalli et al. 2013. “Dynamics ofTransformation: Insights from an Exploratory Review of Rice Farming in theKpong Irrigation Project.” IFPRI Discussion Paper No. 1271 Washington, DC:International Food Policy Research Institute.
Thoburn, John. 2009. “Vietnam as a Role Model for Development.” ResearchPaper No. 2009/30. Helsinki: UNU/WIDER.
Throup, David, Chris Jackson, Katherine Bain, and Rachel Ort. 2014. “DevelopingCommercial Agriculture in Ghana,” in Verena Fritz, Brian Levy, and Rachel Ort(eds), Problem-Driven Political Economy Analysis. Washington, DC: WorldBank, ch. 6.
Tripp, Robert and Ragasa, Catherine. 2015. “Hybrid Maize Seed Supply inGhana.” GSSP Working Paper No. 40. Washington, DC: International FoodPolicy Research Institute.
USAID. 2009. “ Global Food Security Response: West Africa Rice Value ChainAnalysis.” Washington, DC: USAID.
Vingeri, Marcella, and Shashi Kolavalli. 2018. “Growth through Pricing Policy:The Case of Cocoa in Ghana.” Background paper for UNCTAD-FAO Com-modities and Development Report 2017: Commodity Markets, Economic Growthand Development. Rome: FAO.
OUP CORRECTED PROOF – FINAL, 30/7/2019, SPi
239

Weimer, Alice. 2015. “A ‘Time of Agric’: Rethinking the ‘Failure’ of AgriculturalPrograms in 1970s Ghana.” World Development 66: 104–17.
Whitfield, Lindsay. 2010. “Developing Technological Capabilities in Agro-Industry: Ghana’s Experience with Fresh Pineapple Exports in ComparativePerspective.” DIIS Working Paper No. 2010:28. Copenhagen: Danish Institutefor International Studies.
Winter-Nelson and Aggrey-Fynn. 2008. “Identifying Opportunities in Ghana’sAgriculture: Results from a Policy Analysis Matrix.” GSSP Background PaperNo. 12. Washington, DC: International Food Policy Research Institute.
Wolf, H. 1999. “Economics of Tomato Production with Special Reference toAspects of Plant Protection: A Case Study of Two Tomato Production Systemsin Brong-Ahafo Region, Ghana. Prepared for Ghanaian–German Project forIntegrated Crop Protection.” GTZ: Eschborn.
World Bank. 2014. Ghana: Country Profile 2013. Enterprise Surveys. Washington,DC: World Bank.
OUP CORRECTED PROOF – FINAL, 30/7/2019, SPi
240

9Unleashing the Power of
Mechanization
Xinshen Diao, Frances Cossar, Nazaire Houssou,and Shashidhara Kolavalli
9.1 Introduction
As in most of Africa, agricultural mechanization in Ghana has been slow todevelop, either in the form of animal or tractor power. But this has changedmarkedly since the early 2000s, and today about one third of all Ghana’sfarmers report using some form of mechanization, mostly tractors for landpreparation, as do over half the farmers with five or more hectares of croppedland. However, policymakers often are skeptical of the role played by theprivate sector in providing mechanization services and worry that supply-side issues may be constraining its uptake, especially amongst smaller-sizedfarms. With this in mind, the government recently started to directly engage inthe importation and subsidization of tractors, and has established a network ofsubsidized agricultural mechanization service centers around the country(Diao et al. 2014). The government program operates in direct competitionwith an already established private sector supply system, and this raises anumber of important questions. In particular, is the government programovercoming some inherent market failure problems or is it introducing marketdistortions in machinery prices, encouraging rent-seeking behavior and pos-sibly crowding out more efficient private suppliers? If the latter, then assuggested in Chapter 6, the program may be an unnecessary and costlyaddition to the financial burden of the public sector.
To address these issues, we review recent developments in the uptake ofagricultural mechanization in Ghana, and of the factors that are driving thegrowth in farmers’ demand. We then discuss possible supply-side constraints,and evaluate the government’s recent interventions and their impact on theexisting private sector alternative. This leads to our conclusions about appro-priate mechanization policies for the future.
OUP CORRECTED PROOF – FINAL, 29/7/2019, SPi

9.2 Mechanization Trends in Ghana
Until recently, most cropped land in Ghana was cultivated manually, and useof animals or tractors for plowing was limited, despite early government-sponsored mechanization programs in the 1960s. The use of animal tractionhas always been constrained by tsetse fly problems in much of the country,¹but recent years have seen rapid growth in demand for tractor plowing.
The agricultural census data are unreliable for showing trends in the owner-ship of tractors, but Figure 9.1 shows the substantial growth in the import ofnew and used tractors since 2003. Data on the use of mechanization is alsoavailable from the GLSS surveys and a recent Labor Force Survey conducted in2015/16 (GSS 2016). The share of households incurring expenses for any type ofagricultural mechanization (including purchasing or hiring machines and oper-ating, maintenance, and repair costs) increased from virtually zero in 1991/2 to17.5 percent in 2005/6, and then almost doubled to 32.5 percent in 2012/13.Mechanization is most prevalent in the Upper West and Northern regions andin the Greater Accra region, regions where 75 percent or more of farmers reportspending on mechanization. The least mechanized regions are the Central andAshanti regions, where less than 10 percent of farmers report spending onmechanization. One reason for this regional distribution is that the dominant
0
200
No.
of t
ract
ors
400
600
800
1,000
1,200
2003 2004 2005 2006 2007 2008 2009 2010 2011 2012
newused
Figure 9.1. Tractor imports, 2003 to 2012Note: Data for 2012 are to July 2012.
Source: Customs, Excise and Preventive Service, Government of Ghana.
¹ Draft animals are used more widely in the very north of the country where they are complemen-tary with tractors (Houssou et al. 2013a).
OUP CORRECTED PROOF – FINAL, 29/7/2019, SPi
242

form of mechanization is tractor plowing, and this is more relevant in regionsthat grow field crops than in the forest and cocoa growing areas.
Larger farms with more than five hectares are much more mechanized thansmaller farms in both the North and the South (Table 9.1). While the largestfarms often own their own tractors, most other farms are too small to justify sucha lumpy investment and must hire in tractor services. Some medium-sized farmsare able to justify purchasing a tractor by hiring out tractor services once theyhave met their own mechanization needs. A 2013 survey jointly conducted byIFPRI and the Savannah Agricultural Research Institute (SARI) in eight districtsin the Northern and Central regions of Ghana found that more than 60 percentof the surveyed farmers used tractors for plowing, and that two thirds of them(who were all medium- and small- scale farmers) did not own a tractor but hiredtractor services in (Diao et al. 2014). Of themedium- and large-scale farmers whoowned tractors, 78 percent reported hiring out plowing services to other farmersduring the survey year. Since the average farm size is larger in the Northernregion and large farms are more likely to mechanize, then it can also be inferredthat the share of the cropped area that is mechanized has also increased.
9.3 The Emerging Demand for AgriculturalMechanization in Ghana
Why has mechanization finally taken off in Ghana since the early 2000s? Whathas driven demand and to what extent has the supply of mechanization
Table 9.1. Share of rural households using mechanization (percent)
Farm size Total
< 2 ha 2–5 ha 5–20 ha > 20 ha
National:1991/22005/62012/13
12.922.0
20.337.8
27.053.6
34.472.8
1.017.532.5
North:2005/62012/13
10.222.2
13.437.9
17.656.3
22.876.4
12.835.9
South:2005/62012/13
14.021.9
24.737.7
32.151.3
47.467.2
19.830.8
Note: South = Coastal + Forest zones; North = Savannah + Transition zone.
Source: Authors’ calculations using GLSS3, GLSS5, and GLSS6.
OUP CORRECTED PROOF – FINAL, 29/7/2019, SPi
, , , 243

services kept up with potential demand? We explore the determinants ofdemand in this section, and then consider supply-side issues in Section 9.4.
A large literature exists that aims to explain the slow evolution of agricul-tural mechanization in Africa. One theory, developed by Hans Ruthenburg(1980) and based on his historical analysis of the evolution of tropical farmingsystems, predicts that farming communities will only adopt draft animals ortractors for land preparation once their land-use intensity reaches a criticalthreshold. Ruthenburg measured land-use intensity as the ratio of the har-vested area to the total agricultural area (cropland plus fallow land)—which hecalled the R ratio, and concluded that this ratio needed to exceed 33 percentbefore mechanization of land preparation would take hold. This is equivalentto when the average fallow period has been shortened to less than two years foreach year of cultivation. One reason for the switch in technology is that asfallows get shorter, grassy weeds and hardened soils become more seriousproblems and they are hard to overcome with hand hoeing, making animalor tractor plowing more attractive.
Diao et al. (2014) have calculated annual R-values for Ghana over the period1961 to 2011 (Figure 9.2). Ghana was a relatively land-abundant country withlow R-values until the late 1990s, during which time there was little evidence ofrising demand for tractor mechanization. From the late 1990s onwards, how-ever, the R-values have permanently risen above the threshold of 33, reaching40 to 43 in the late 2000s. While this highly aggregated data fails to captureimportant regional variations, it does suggest that farming systems and land-useintensity have changed significantly in Ghana since the late 1990s, and which isconsistent with the recent growth in demand for tractor plowing.
Ruthenburg’s R ratio does not consider other economic factors that mightaffect mechanization besides land-use intensity, and these need to be taken
20
25
30
35
40
45
1961 1966 1971 1976 1981 1986 1991 1996 2001 2006 2011
R-valueR value of 33
Figure 9.2. R-value measure of farming system evolution in Ghana, 1961–2011Source: Compiled from FAO data.
OUP CORRECTED PROOF – FINAL, 29/7/2019, SPi
244

into account in explaining the recent growth of agricultural mechanization inGhana. Another relevant theory from the literature is the induced innovationtheory, which essentially predicts that since mechanization is a labor-savingtechnology, demand will develop once labor becomes sufficiently costly rela-tive to capital and other purchased inputs (Hayami and Ruttan 1970, 1985;Binswanger and Ruttan 1978; Pingali et al. 1987). This typically happens aftera country has reached a point in its economic transformation where theabsolute number of workers remaining in agriculture begins to decline, andthe land/labor ratio increases. For field crops, this usually leads to farmsgetting bigger, and with greater scarcity of labor relative to land, farmershave incentive to adopt labor-saving technologies like mechanization. How-ever, as Chapter 5 shows, this change can be accelerated by rapid urbanization,which in addition to pulling workers out of agriculture, leads to more diver-sified rural livelihoods amongst remaining farm households, and hence togreater wage competition between agriculture and the nonagricultural sectors.Changes in urban diets may also lead to expansion of more labor-intensivecrops, adding to the competition for labor.
We look at the evidence on three key drivers that may have led to inducedinnovation: changes in the land/labor ratio, changes in farm size, and changesin urbanization.
9.3.1 Land/Labor Ratio
Unlike many African countries, Ghana is still a relatively land-abundantcountry, and as shown in Table 9.2, the average cropped area per rural personactually increased by 11.8 percent between 2000 and 2010. This happeneddespite continued population growth because the rapid urbanization of thecountry has pulled many workers out of agriculture on a full- or part-timebasis, while at the same time changing market opportunities have led farmersto increase their cultivated areas (see Chapters 4 and 6). However, there areimportant regional differences in these changes as shown in Table 9.2. Lookingacross regions, there is an inverse relationship between increases in thecropped area per rural person over 2000 to 2010 and population density.For example, the Brong Ahafo region experienced the largest percentageincrease in its cropped area per rural person (52.5 percent) and it was alsothe region with the lowest population density in 2010. At the other extreme,the Greater Accra region experienced a 38.8 percent decline in its cropped areaper rural worker, and had the highest population density in 2010.
OUP CORRECTED PROOF – FINAL, 29/7/2019, SPi
, , , 245

The regions that experienced the largest increases in their land/labor ratios arealso the most important regions in terms of national food-crop production(Table 9.2). Labor also became more expensive as real wage rates were pulledup by competition from rural nonfarm jobs, growing by nearly 7 percent per yearon average over 1991 to 2012 at both national and regional levels (Chapter 4,Tables 4.9 and 4.10). As revealed in the village studies, these increases have beenan important driver of changes in farming practices, includingmechanization, inthe agriculturally important savannah and transition zones (Chapter 6).
9.3.2 Farm Size
One consequence of an increasing land/labor ratio has been that farms havegrown larger in size. Nationally, there has been an increase in the share ofmiddle-sized (2–20 ha) farms at the expense of small (< 2 ha) and large (> 20 ha)farms, and medium-sized farms now account for half of all farms (Table 9.3).This change masks important differences at regional levels. In the Northernregion (comprising the savannah and transition zones), medium-sized farmshave forged ahead and now account for 60 percent of all farms, and this hasbeen at the expense of small and large farms. However, there has been a reversetrend in the south (comprising the forest and coastal zones), where the share ofmedium-sized farms has actually declined (from 44.7 to 41.1 percent) and the
Table 9.2. Crop area per rural person, by region, 2000 and 2010
Region 2010 Ruralpopulation density(persons/km²)
2010 share in nationalfood crop area(percent)
Crop area per ruralperson (ha)
2000 2010 Percentchange
Western 57 6.7 0.20 0.18 –6.7Central 118 7.0 0.20 0.23 12.3Greater Accra 117 0.3 0.06 0.03 –38.8Eastern 77 14.1 0.34 0.35 4.0Volta 68 5.9 0.14 0.16 16.2Ashanti 77 12.8 0.24 0.26 7.7Brong Ahafo 32 18.5 0.35 0.54 52.5Northern 25 16.1 0.33 0.35 7.0Upper West 32 10.6 0.58 0.68 16.8Upper East 94 8.0 0.41 0.36 –12.6National 51 100.0 0.28 0.31 11.8
Source: Diao et al (2014).
OUP CORRECTED PROOF – FINAL, 29/7/2019, SPi
246

share of small farms has increased. Since medium- and large-sized farms arethe most likely to mechanize, then these trends suggest that mechanization islikely to have grown faster in the north than in the south of the country.
9.3.3 Urbanization
The impact of urbanization on mechanization is explored in detail in Chapter 5.A key finding is that while there is no consistent pattern of mechanization acrosslevels of urbanization in the south, in the north the level of mechanization issignificantly higher in the districts with larger cities than other districts, particu-larly among smallholders with less than two hectares.
Given the above patterns of change in land/labor ratios, farm size, andurbanization, the induced innovation theory leads us to infer that mechaniza-tion should: a) be more likely in northern Ghana where the land/labor ratio ishighest and the share of small sized farms is lowest, b) increase with farm size,and c) increase with urbanization. These expectations are consistent with theactual patterns of adoption reported in Table 9.1, confirming that mechaniza-tion in Ghana is demand led and a response to evolving economic incentives.This conclusion is consistent with findings in Chapter 6 which show thatfarmers in the savannah and transition zones are increasing their croppedareas and adapting their farming practices, including mechanization, inresponse to higher local wages and better market opportunities.
Although mechanization has been demand led, there is still the question ofwhether the supply of mechanization services has kept pace with potential
Table 9.3. Changes in the farm size distribution, 2005/6 and 2012/13
Small (< 2 ha) Medium (2–20 ha) Large (> 20 ha)
National:2005/062012/13
53.349.3
44.749.8
1.90.9
North:2005/062012/13
44.338.6
52.560.0
3.21.4
South:2005/062012/13
53.358.4
44.741.1
1.90.5
Note: South = Coastal + Forest zones; North = Savannah + Transition zone.Source: Authors’ calculations using GLSS5 and GLSS6.
OUP CORRECTED PROOF – FINAL, 29/7/2019, SPi
, , , 247

demand. Hard evidence on possible market failures is hard to come by, but asfound in the farm modeling work in Chapter 6, the optimal share of thecropped area that should have been mechanized in 2010 is much higher thanthe actual that year. This suggests that supply is constraining the adoption ofmechanization, although there could of course be other reasons why farmersare not optimizing in the way the model predicts. We end this section withsome of our own observations from multiple field visits in Ghana during2012–18 when we interviewed many different types of farmers, includingtractor owners and renters, specialized tractor contractors, and smallholders.We heard many complaints from smallholder farmers who hire in about thedifficulties of obtaining adequate tractor services for plowing and at the righttimes, and how they often had to approach several tractor owners beforesecuring the plowing services they needed. However, we did not hear a singlecomplaint from a tractor owner about there being insufficient demand forhis/her services; in fact, most said they were inundated with more requeststhan they could handle during the plowing season.
9.4 The Supply of Mechanization Services in Ghana
Demand for mechanization need not always lead to an adequate supplyresponse, particularly when such demand comes from many small- andmedium-scale farmers and the industry is at an early stage of development.While many farmers might be willing to pay market prices for hired services,few have a sufficiently large farm to justify owning a tractor given the sizeablelump-sum cost involved. Governments in Africa, including Ghana, often usethis as an argument to justify a subsidized mechanization program. However,while this might improve access for smaller farms, there is a risk that subsid-ized programs can distort market prices for agricultural machinery and dis-courage private investment, leading to market inefficiencies and long-termcosts to the government, and impede the longer-term development of avibrant private sector supply chain.
In Ghana, there are currently two parallel supply channels for agriculturalmechanization services for farmers; a government-sponsored Agricultural Mech-anization Services Center (AMSEC) program; and a private sector system ofimporters, machinery service providers (many of which are medium-scalefarmers), and repair and maintenance shops. We consider each in Sections9.4.1 and 9.4.2 that follow.
OUP CORRECTED PROOF – FINAL, 29/7/2019, SPi
248

9.4.1 Ghana’s Agricultural Mechanization ServicesCenter (AMSEC) Program
The government’s current involvement in mechanization services through itsAMSEC program is not a new phenomenon in Ghana. In the 1960s, theMinistry of Agriculture owned and operated an estimated 1,500 tractors inits thirty-two district mechanization stations in the savannah zone (Seager andFieldson 1984). This program failed partly because of weak farmer demand formechanization, but also because service charges for the provision of plowingservices were set too low (about 50 percent of their real costs) making theprogram financially unsustainable for the government. From then until theearly 2000s, the supply of mechanization was left largely to the private sector.However, since 2003 the Government started again to intervene in the marketwith its AMSEC program, on the grounds that small-scale farmers were notreceiving adequate tractor services. The program operates with the govern-ment importing tractors and providing them on a subsidized basis to itsmachinery service centers.
9.4.1.1 State-led tractor imports
The main source of funding for AMSEC is through concessional loansreceived by the government from various emerging economies such as Brazil,China, and India. Such concessional loan agreements require that Ghanaimport tractors from the lender country. Therefore, different loan agreementshave brought in different brands of tractors from different countries. Intheory, the government does not directly handle the importation of anytractors, but uses private agents to act on its behalf. However, the governmentselects the private agents and they have no say over the type of machinery to beimported or to negotiate prices; these are determined as part of the loanagreements between the government and the donor countries. The import ofFarmtrac tractors is a good example of the process and its problems. Afterreceiving a concessional loan for tractor imports in 2007 and 2008 from theExport-Import Bank of India, the government selected a local company as itsimport agent. The company imported 500 Farmtrac tractors from Indiaduring 2007 and 2008, but had no say in the selection of the Farmtracbrand, the tractor models chosen, or the import prices. Expecting theirbusiness to continue with the government, the company constructed a largewarehouse and built up stocks of spare parts with its own money. However, in2009 the government entered into a new concessional loan arrangement with
OUP CORRECTED PROOF – FINAL, 29/7/2019, SPi
, , , 249

the Indian government for importing John Deere machinery manufactured inIndia, and a new local company was selected as the government’s importingagent. This undercut the company importing Farmtrac tractors; not onlycould they no longer import subsidized tractors from India, but their owninvestment in building up a stock of spare parts was devalued. Similar one-time arrangements have been made recently for importing Mahindra tractorsfrom India and other brands from China, Brazil, and other countries.
9.4.1.2 Government-selected “private” entities as amsecs
In order to avoid direct government management of mechanization services,private agents are selected by the government to own and operate the machin-ery services centers. The first group of seventeen AMSECs was establishedin 2007/8, a second group of fifty-two was established in 2009, and anothertwenty were established in 2010/11 (Diao et al. 2018). For the sixty-nineAMSECs established in 2007/9, each was given a package of five to seventractors, with plows, harrows, and trailers, by the government. The cost of thetractors to the centers was subsidized by 30 percent, and the centers only hadto pay 10–20 percent of the subsidized price as a down payment for a five-yearinterest-free loan. Given that the subsidized tractor prices are well belowmarket prices to begin with, the generous financial arrangements seeminglymake AMSECs a lucrative and attractive business, and the government has nothad any difficulties in attracting applicants. In fact, there have been sufficientapplicants and the government has had to turn many down, yet the criteria forselection is not known. This raises concerns about possible rent-seekingbehavior.
9.4.1.3 Difficulties with the amsecs program
The AMSECs were designed to provide specialized tractor services to the localmarket without adequate consideration of whether this is profitable. Unfortu-nately, it turned out that many AMSECs were not profitable and havedefaulted on their debt repayments, leaving the government responsible forthe repayment of concessional loans.²
Houssou et al. (2013b) have demonstrated why tractor hiring alone is notprofitable for many AMSECs. Based on subsidized tractor prices, actualoperational costs in Ghana, and an assumed 10 percent capital depreciation
² According to a report published by Japan International Cooperation Agency (JICA) in 2015, theloan repayment rate for AMSECs established in 2007/8 was only 17.2 percent and 44.9 percent forthose established in 2009. Almost one third of AMSECs have not made any repayment at all after thedown payment (JICA 2015).
OUP CORRECTED PROOF – FINAL, 29/7/2019, SPi
250

rate, they calculate that a minimum of 287 hectares must be plowed per tractoreach season in order for the net profit from plowing services to be comparableto the interest earnings from a similar-sized savings deposit in a bankaccount—a necessary condition for tractor renting to break even. Using surveydata, Houssou et al. (2013b) also show that few AMSECs plow sufficientacreages to be profitable. An important reason is that the plowing season istoo short to enable tractors to plow larger acreages within the localities thateach AMSEC serves.
One way to increase the utilization of tractors is through seasonal migrationto different regions with complementary plowing seasons. South Ghana, forexample, has two cropping seasons while the North has one, and this differ-ence could in theory be exploited by mobile tractor service providers toincrease the number of operational days per tractor (Houssou et al. 2013b).In practice, there is little evidence of any of the AMSECs attempting to beregionally mobile, although there is evidence that some private tractor ownersare doing so.
Another possible way to make AMSECs more profitable would be for themto diversify beyond plowing and offer a wider range of mechanization services.A survey by Benin et al. (2012) showed that in 2010, only thirty-eight machin-ery services firms among 136 surveyed provided services other than plowing,and even for such firms 80–90 percent of their revenue came from plowing.However, so far there has not been much demand for additional services inGhana, and as experience in some other countries has shown, demand typic-ally develops in parallel with innovation in the design and adaptation of otherkinds of tractor implements and machines tailored to the niche needs ofspecific groups of farmers or localities (Diao et al. 2014). This kind of innov-ation is much more likely to arise in the private sector than with the govern-ment sponsored AMSECs.
9.4.2 The Private Sector Alternative
In addition to the heavily subsidized and state interventionist AMSEC pro-gram, there is a well-developed private sector supply chain of importers,machinery service contractors (mostly farmers), and repair and maintenanceshops. Other than benefiting from an import tariff exemption that applies toall agricultural machinery imports, the private sector receives no other supportfrom the government. The scale of the private sector alternative is significant;while the government imported about 3,000 new tractors and 300 power tillers
OUP CORRECTED PROOF – FINAL, 29/7/2019, SPi
, , , 251

over ten years, a similar, or even larger number of used tractors were importedby private importers in the same period (Ghana, CEPS 2012). The share ofused tractors in total imports has increased substantially since 2010, and it isestimated that more than 10,000 tractors are currently operating in Ghana(Diao et al. 2018), suggesting considerable and growing demand for affordabletractors by the private sector.
Private importers are predominantly small-scale businessmen who havewell-developed import channels, and tractors are typically only part of theirbusiness. This diversification enables then to spread their risks, and to smoothout the seasonal nature of the demand for tractors. Their clients are mostlymedium- and larger-scale farmers, who find imported secondhand tractorsmuch more affordable than new ones (USAID/ACDI-VOCA 2013).
Secondhand tractors are attractive to farmers not only because they aremore affordable, but because they can obtain tractor brands of their ownchoice. Moreover, since the private sector has operated in the tractor importbusiness for many years, the spare parts for the brands they import areavailable in most locations at reasonable prices. By contrast, the brands ofnew tractors imported by the government keep changing, and spare parts forthem are harder to obtain.
Medium- and large-scale farmers are the main buyers of secondhandtractors from private importers, and they are also the main providers ofmechanized services to other farmers. For most of them, hiring out tractorservices after they have plowed their own land is an important way to justifythe substantial lump-sum investment cost involved. On the other hand, asfarmers they are not as dependent as the AMSECs on hiring out services fortheir income.
The 2013 IFPRI/SARI survey found that almost half of the small-scalefarmers surveyed hired in tractor services for plowing, and these serviceswere nearly all sourced locally, and mostly from other farmers (Benin et al.2012). On average, tractor-owning farmers who hire out have 100–120 farmerclients, of which 45–51 are small-scale farmers with land less than twohectares. Because of the dominant role of medium- and large-scale farmersin providing tractor services, the market for land-preparation services iscompetitive. One outcome is that farmers in different locations are payingsimilar prices for plowing services, regardless of whether they hire in fromprivate or AMSEC sources (Benin et al. 2012).
OUP CORRECTED PROOF – FINAL, 29/7/2019, SPi
252
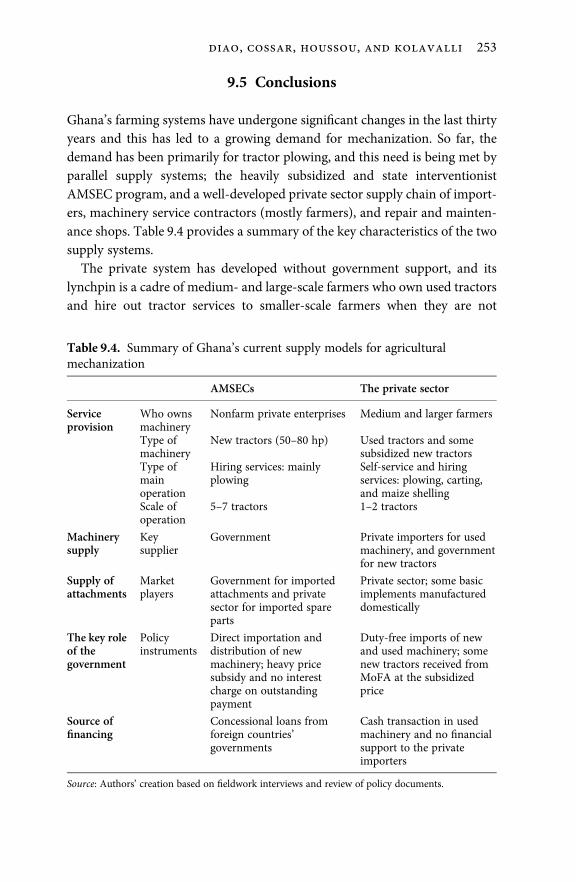
9.5 Conclusions
Ghana’s farming systems have undergone significant changes in the last thirtyyears and this has led to a growing demand for mechanization. So far, thedemand has been primarily for tractor plowing, and this need is being met byparallel supply systems; the heavily subsidized and state interventionistAMSEC program, and a well-developed private sector supply chain of import-ers, machinery service contractors (mostly farmers), and repair and mainten-ance shops. Table 9.4 provides a summary of the key characteristics of the twosupply systems.
The private system has developed without government support, and itslynchpin is a cadre of medium- and large-scale farmers who own used tractorsand hire out tractor services to smaller-scale farmers when they are not
Table 9.4. Summary of Ghana’s current supply models for agriculturalmechanization
AMSECs The private sector
Serviceprovision
Who ownsmachinery
Nonfarm private enterprises Medium and larger farmers
Type ofmachinery
New tractors (50–80 hp) Used tractors and somesubsidized new tractors
Type ofmainoperation
Hiring services: mainlyplowing
Self-service and hiringservices: plowing, carting,and maize shelling
Scale ofoperation
5–7 tractors 1–2 tractors
Machinerysupply
Keysupplier
Government Private importers for usedmachinery, and governmentfor new tractors
Supply ofattachments
Marketplayers
Government for importedattachments and privatesector for imported spareparts
Private sector; some basicimplements manufactureddomestically
The key roleof thegovernment
Policyinstruments
Direct importation anddistribution of newmachinery; heavy pricesubsidy and no interestcharge on outstandingpayment
Duty-free imports of newand used machinery; somenew tractors received fromMoFA at the subsidizedprice
Source offinancing
Concessional loans fromforeign countries’governments
Cash transaction in usedmachinery and no financialsupport to the privateimporters
Source: Authors’ creation based on fieldwork interviews and review of policy documents.
OUP CORRECTED PROOF – FINAL, 29/7/2019, SPi
, , , 253

required for use on the home farm. These contractor farmers interface withprivate firms who import the tractors, and own machinery repair and main-tenance shops, which also stock spare parts. This system is working well andhas created a competitive market for hiring-in services. On the other hand, theAMSECmodel recently promoted by the government seems not to be viable inits present form. Many of the AMSECs have unprofitable business models andstruggle to pay their debts to the government, while the constant changing ofimported tractor models and a lack of spare parts undermines the demand forthe subsidized tractors that the government procures through its agents.
Continuation of the AMSEC program in its present form will only add tothe financial burden on the government, diminish the role of the private sectorin further developing the mechanization supply chain, and lead to rent-seeking behavior amongst government selected agents who import tractorsor run the AMSECs.
So far, the demand for mechanization in Ghana has not evolved muchbeyond tractors for land preparation and for shelling maize after harvesting.As wages continue to rise and farms get larger, additional demands for mech-anizing other aspects of crop production, harvesting, transportation, waterpumping, post-harvest processing and the like, will inevitable grow. Meetingthis demand will require a flexible supply chain, one which can develop and/oradapt a variety of machinery types and services to meet a diverse set of farmerneeds that will vary by type of farm and locality. Experience in several Asiancountries, where farm mechanization for small-scale farms is much moreadvanced than in Ghana, shows that only the private sector has the capabilityto develop these kinds of flexible supply chains, and that heavy-handed gov-ernment interventions can be counterproductive (Diao et al. 2014).
That said, there are things the government can do to support these develop-ments. For example, the government could domore through field demonstrationand perhaps some directed credit subsidies to promote the value of yield-enhancing mechanization practices like second-plowing and harrowing, andthe adaptation and uptake of smaller tractors. The government might alsousefully support appropriate mechanization research and technical trainingof young mechanics (Diao et al. 2018). However, a key question is whether thegovernment will be willing to recognize the dominant role played by the privatesector, and especially the renting-out services provided by medium- and large-scale farmers, and rethink its AMSEC program. An effective mechanization policyshould aim to strengthen the entire value chain for mechanization services andnot just be limited to targeting specific types of services or providers.
OUP CORRECTED PROOF – FINAL, 29/7/2019, SPi
254

References
Benin, S., M. Johnson, K. Jimah, J. Taabazuing, A. Tenga, E. Abokyi, andG. Nasser. 2012. “Evaluation of Four Special Initiatives of the Ministry ofFood and Agriculture, Government of Ghana.” Draft Report, InternationalFood Policy Research Institute, Washington, DC.
Binswanger, Hans and Vernon Ruttan. 1978. Induced Innovation. Baltimore: TheJohns Hopkins University Press.
Boserup, E. 1965. The Conditions of Agricultural Growth: The Economics ofAgrarian Change under Population Pressure. London: George Allen and Unwin.
Diao, X., F. Cossar, N. Houssou, and S. Kolavalli. 2014. “Mechanization in Ghana:Emerging Demand, and the Search for Alternative Supply Models.” Food Policy48(2014): 168–81.
Diao, X., J. Agandin, P. Fang, S. E. Justice, D. Kufoalor, and H. Takeshima. 2018.“Agricultural Mechanization in Ghana: Insights from a Recent Field Study.”IFPRI Discussion Paper 10729, International Food Policy Research Institute,Washington DC.
Ghana, CEPS (Customs, Excise and Preventive Services). 2012. Import Data.
GSS (Ghana Statistical Service). 2016. 2015. “Labor Force Survey Report.”December2016.
Hayami, Y., and V. W. Ruttan. 1985. Agricultural Development: An InternationalPerspective. Baltimore: Johns Hopkins University Press.
Hayami, Y., and V. W. Ruttan. 1970. “Factor Prices and Technical Change inAgricultural Development: The United States and Japan, 1880–1960.” Journalof Political Economy 78(5): 1115–41.
Houssou, N, S. Kolavalli, E. Bobobee, and V. Owusu. 2013a. “Animal Traction inGhana.” Ghana Strategy Support ProgramWorking Paper No. 34. Washington,DC: International Food Policy Research Institute.
Houssou, N., X. Diao, F. Cossar, S. Kolavalli, K. Jimah, and P. Aboagye. 2013b.“Agricultural Mechanization in Ghana: Is Specialization in AgriculturalMechanization a Viable Business Model?” American Journal of AgriculturalEconomics 95(5): 1237–44; doi: 10.1093/ajae/aat026.
JICA (Japan International Cooperation Agency). 2015. “Expert on SmallholderFarmers’ Access to Agriculture Mechanization in Ghana—Project CompletionReport.” Tokyo.
Pingali, P., Y. Bigot, and H. Binswanger. 1987. Agricultural Mechanization andthe Evolution of Farming Systems in Sub-Saharan Africa. Washington, DC:World Bank.
Ruthenburg, H. 1980. Farming Systems in the Tropics. Oxford: Oxford UniversityPress.
OUP CORRECTED PROOF – FINAL, 29/7/2019, SPi
, , , 255

Seager, P. J., and R. S. Fieldson. 1984. “Public Sector: Tractor Hire and EquipmentHire Schemes in Developing Countries.” Paper Prepared by the OverseasDivision of NIAE.
USAID/ACDI-VOCA. 2013. “ADVANCE Tractor Census of Northern Ghana.”Washington, DC.
OUP CORRECTED PROOF – FINAL, 29/7/2019, SPi
256

10Future Prospects
Xinshen Diao, Peter Hazell, Shashidhara Kolavalli,and Danielle Resnick
10.1 Introduction
This final chapter pulls together the main findings of the book, highlightsfuture challenges and opportunities for Ghana, and provides some guidanceon the kinds of strategic changes that might help the country’s efforts towardsmore sustained structural change. It also concludes with some reflections onwhat the Ghanaian experience suggests for the rest of Africa.
10.2 Economic Prospects and Options
10.2.1 The National Economy
As reviewed in Chapter 2, Ghana has followed a slow but steady growthtransformation since its Structural Adjustment Program (SAP) of the 1980s,and national income has grown by 5.4 percent per annum on average (or2.8 percent per capita) for over thirty years. This growth has been drivenmainly by growth in labor productivity within sectors rather than the transferof workers from low-productivity sectors like traditional agriculture to high-productivity sectors like modern manufacturing. In Rodrik’s (2014) termin-ology, Ghana has benefited more from improvements in its fundamentals thanfrom structural change. This is the result of a policy regime since the SAPfocused on creating the enabling conditions for private-sector-led growthrather than many proactive state interventions in production. Althoughmany workers have left agriculture, they have mostly moved into low-productivity jobs in the service sector, and this has added little to averagelabor productivity. Contrary to the Asian pattern of transformation, Ghana’sindustrial sector has stagnated rather than grown, and failed to create the high-productivity, less-skilled jobs in manufacturing that helped transform Asianliving standards.
OUP CORRECTED PROOF – FINAL, 29/7/2019, SPi

The agricultural sector has also performed reasonably well since the SAP,and grew by 4.5 percent per annum over 1994–2013. The cocoa sector grew by5.6 percent per annum over this period, and remains a major source of foreignexchange. It also continues to produce high-quality beans that attract a pricepremium in the world market. The noncocoa subsector has also grownsuccessfully, particularly roots and tubers and other agriculture (4.9 percentand 5.6 percent per annum, respectively). However, agricultural growth hasbeen driven more by land expansion than agricultural intensification.Although labor productivity has increased through use of mechanizationand other labor-saving technologies, Ghana has yet to widely adopt game-changing technologies that can significantly increase yields and land product-ivity, or to invest adequately in post-harvest handling and quality control. As aresult, much of the noncocoa subsector is not internationally competitive, andstruggles to compete with many imported foods or to expand into the exportof commodities other than cocoa.
This pattern of “transformation without industrialization” has importantimplications for future growth opportunities. While the economy will continueto benefit from growth in within-sector productivities, these are likely to remainmodest without significant new investments and technologies. In the case ofagriculture, even past rates of productivity growth will become unsustainablewithout a major shift to land-intensification technologies as the land frontier isexhausted. Just to maintain, let alone accelerate, past levels of economic growth,Ghana will need to tap into new sources of productivity growth as well movemore workers from low- to higher-productivity sectors. This means growinghigh-productivity sectors like manufacturing, modern agriculture, and formalservices. However, this strategy faces demand as well as supply-side challenges.
On the demand side, high-productivity sectors can only expand if there isan adequate market. The best markets are export markets because demand isthen highly elastic. One option is for Ghana to expand its traditional exports ofcocoa, gold, and oil. Another is to develop new exports, such as manufacturedgoods and nontraditional agricultural exports. There is also scope to producemanufactured and agricultural goods that can substitute for imports, at leastuntil those substitution opportunities have been exhausted. Growth in mostother sectors will be constrained by growth in domestic demand, and relyingheavily on these would effectively mean a “balanced growth” strategy forGhana in which sectors that produce predominantly nontradables couldonly grow in proportion to growth in their domestic demand. For agriculture,which apart from cocoa faces an inelastic aggregate demand, this may meanthat growth of the noncocoa subsector would hit a ceiling at around 6 percent
OUP CORRECTED PROOF – FINAL, 29/7/2019, SPi
258

per annum (Breisinger et al. 2012), beyond which the domestic terms of tradewould turn against agriculture and act as a break on further growth. It will alsobe hard for the national economy to grow much faster than its past averagewithout a significant increase in exports.
On the supply side, it seems likely that as a result of recent discoveries andinvestments in oil, oil exports will expand and provide an important, ifvolatile, source of government revenue. But its contribution to national percapita GDP is likely to remain small, and the sector is not likely to create muchadditional employment. Much the same is true for gold and other mineralexports. While these opportunities should of course be seized, the betteropportunities for achieving structural change with growth in productiveemployment appear to lie with manufacturing and agriculture, both for exportand import substitution.
However, manufacturing has shrunk in Ghana since the SAP, while theindustrial sector at large has stagnated. Major constraints include the businessenvironment, high transport costs, inadequate and costly port facilities, unre-liable power supplies, inadequate access to finance, difficulties in obtainingland rights, high labor costs, and weak or ineffective industrial policies andstate–business relationships. These constraints make it difficult for Ghanaianmanufacturing firms to compete with imports, let alone expand into exportmarkets. There is some recent indication of foreign investments in the assem-bly of bulky products such as tractors and cars imported into Ghana, and anIndian tractor company has opened a small unit. But, whether all of this willturn into significant assembly in the country remains to be seen.
Agro-processing, which is a major component of the manufacturing sector,offers brighter prospects because of its potential to substitute for imports inmeeting a rapidly growing domestic demand for processed and pre-cookedfoods. A fairly high share of processed foods on Ghanaian shelves are imports,even in smaller towns away from the ports (Andam et al. 2018). Ghanaian firmsare producing niche products such as fufu flour and banana chips. They mightalso be able to export into the regional West African market. But the localprocessing sector, which is predominantly engaged in primary processing suchas drying and milling, is not doing well. Employment in the sector shrankbetween 2014 and 2017 from an average of thirty workers to twenty-one workersper firm (Andam and Asante 2018). The sector is held back by many of the sameconstraints as manufacturing in general, as well as challenges in obtainingreliable supplies of raw materials of the right qualities from farmers. Its growthpotential is therefore closely linked to a successful agricultural transformationthat can produce raw materials of the right quality and at competitive prices.
OUP CORRECTED PROOF – FINAL, 29/7/2019, SPi
, , , 259

10.2.2 Agriculture
The agricultural sector is still a major employer in Ghana, and while its laborproductivity has about doubled since 1991 since the SAP, it is still lower thanall other sectors except trade and personal services. However, it has goodgrowth potential, both by expanding into growing markets and also bytransitioning from traditional to improved technologies that could enhanceits productivity and competitiveness.
Some of the best growth opportunities from the demand side are as follows:
• Further growth in cocoa exports. However, expansion of the cocoa area isreaching its limit and further growth has mainly to come from replace-ment of older trees with high-quality cocoa trees that can give higheryields while sustaining, perhaps improving the country’s reputation forhigh-quality cocoa beans. This will require carefully rebalancing the useof cocoa revenues to more effectively supply critical inputs, includingsuperior performing cocoa trees, while also maintaining adequate after-tax price incentives for growers (Kolavalli and Vigneri 2017). Whileproductivity increases are needed, major producing countries such asGhana and Côte d’Ivoire are becoming aware of the risks of cocoasupplies outpacing international demand, putting downward pressureon prices, as happened in 2016. Along with efforts to increase product-ivity, farmers need to be assisted to diversify so that they can betterweather price volatility.
• Expansion of nontraditional exports like pineapples, mangoes, and veget-ables. The biggest challenges here are producing high-quality produce atcompetitive prices, and delivering them to international markets in thesame condition.
• Import-substitution opportunities exist for a wide range of commodities,particularly rice, yellow maize, poultry, vegetables, fish, and livestock, butthey need to become more competitive in cost and quality. For example,vegetable yields in Ghana are significantly lower than in neighboringcountries, all of whom participate in a regional market that is wellintegrated (van Asselt et al. 2018a). This in turn requires increasedproductivity to reduce production costs, improved quality to matchthose of imports, and improved marketing and distribution channels.
• Growing domestic demand for more nutritious and often perishablefoods like fruits, vegetables, and livestock products, many of which are
OUP CORRECTED PROOF – FINAL, 29/7/2019, SPi
260

ideal for smallholders to grow because they give high returns per hectareof land. For example, gross margins for tomatoes, onions, carrots, andscotch bonnet peppers are considerably greater than those of rice andmaize (van Asselt et al. 2018a).
• Leveraging growth in Ghana’s broader agri-food system. With rapidurbanization and changing diets, including consumption of more pro-cessed and precooked foods, and eating out, there is opportunity foragribusiness to add considerable post-farm-gate value to the foods con-sumed by urban people. The “quiet revolution” observed in the foodsystems of some East African and Southern African countries wherebysmall- and medium-sized enterprises (SMEs) are rapidly populatingvalue chains is surely indicative of the changes Ghana can expect (Reardon2015; Reardon et al. 2014). Agro-processing should be a major beneficiaryof this food system transformation as long as it can develop in ways tocompete with processed food imports.
Complementing all these demand-side opportunities is a considerablesupply-side opportunity to raise agricultural productivity and increase com-petitiveness by shifting to improved technologies and farming practices. Yieldsand land productivity are still low in Ghana, and have increased only modestlysince 1991. Many available technology and irrigation potentials for improvingproductivity have barely been tapped. For example, yield gaps between dem-onstrated potentials and realized averages are around 40 percent for cerealsand 20 percent for legume crops (Breisinger et al. 2012). Some imported maizehybrids yield as much as 5 tons per ha, yet the average maize yield remainsbelow 2 tons per ha (van Asselt et al. 2018b). An important reason is that lessthan 5 percent of the maize area is planted with improved varieties includinghybrids, and the average age of the varieties grown is more than twenty years(Ragasa et al. 2013). Although farmers have replaced nearly all of the trad-itional varieties of most crops, they are not replacing them fast enough withbetter varieties.
However, these new opportunities also come with at least three key chal-lenges that need to be confronted. First, the land frontier is tightening.Therefore, continued agricultural growth will become unsustainable withouta significant technological transition to the kinds of intensification technolo-gies and farming practices that lead to growth in land as well as laborproductivity. Second, labor costs in agriculture are being pulled up by urban-ization and competition from the rural nonfarm economy. The availableworkers are also getting younger and better educated, and less interested in
OUP CORRECTED PROOF – FINAL, 29/7/2019, SPi
, , , 261

traditional farming. This means that labor-intensive technologies, while stillused by smallholders growing cocoa and other higher-value crops, are becom-ing less relevant for low-value crops like cereals and root crops and more so formost medium- and large-sized farms.
Third, the private sector is now in the driving seat along most agriculturalvalue chains, and the public sector must learn to work more effectively with it.Except for the cocoa sector, many Ghanaian farmers have shifted away fromweakened public systems to private sector enterprises for accessing theirmodern inputs, finance, and urban markets. This shift has also been embodiedwithin many recent agricultural development projects promoted bothby donors and the government that seek to leverage key private actors invalue chains to provide better services to smallholders. However, apart froma relatively small share of farms that are embedded in contract-farmingarrangements with large agribusinesses, most small farms depend on SMEsand noncontractual arrangements for linking to markets in value chains.Strengthening these linkages through policy reforms and public supportrather than undercutting them provides an opportunity not only to increaseefficiency and competitiveness along value chains, but also to generate a moreinclusive and employment-intensive transformation within the agri-foodsystem (AGRA 2017).
Relatedly, there is also new interest from large international and regionalagribusinesses in Africa’s food chains, as exemplified by the commitmentsmade under the New Alliance for Food Security and Nutrition and the effortsof the Grow Africa Investment Forum. Ghana has joined both initiatives, andis actively encouraging such foreign investment. Large agribusinesses can playimportant roles in developing internationally competitive value chainsbecause of their greater access to new technologies from outside the country(like hybrid seeds), and their scale and market power to develop and enforcequality standards along value chains, or to penetrate into export markets.Despite the promise, Ghana has yet to take any significant advantage of suchforeign investments.
What would it take for Ghana to seize the available and growing opportun-ities within agriculture and the broader agri-food system? Many of the desiredchanges have been identified and discussed in previous chapters, and here wesimply highlight some of the key roles for the public sector:
• Providing enabling policies. Ghana has done reasonably well since the1980s in maintaining favorable price and trade policies for agriculture.Though the government still leans towards keeping the provision of some
OUP CORRECTED PROOF – FINAL, 29/7/2019, SPi
262

key services for farmers within the public sector, SMEs now play muchbigger roles along value chains, particularly in downstream agribusiness.The government should encourage this trend, and allow private enter-prises to take on more of these roles. This will require improvements inthe enabling environment for both small and large businesses, and thedevelopment of more effective state–business relationships, includingwith SMEs and small traders.
• Rural infrastructure. Past public investments in rural infrastructure havegiven good returns, and the government has invested heavily in road andother infrastructure in the recent years. However, additional spending isneeded on rural roads, farm tracks connecting farms to communities,electrification and energy, cold storage, urban marketplaces, and portfacilities. The benefits from improved road connections are illustrated bythe spontaneous development of motorized tricycle services, which havenow become widely available in the north for transporting crops fromfields to homestead and for bringing people to urban centers and markettowns. Better marketing links have also helped households diversify awayfrom staple crops, increase the area they cultivate, and produce and sellmore home-processed foods (Mueller, Masias, and Vallury 2018).
• Land policy reforms are needed to ensure farmers have secure access toland, reduce land disputes, facilitate land transfers in both rural andurban areas, and enable agribusinesses to obtain land for commercialdevelopment. While long-term formal land-leasing arrangements havebecome increasingly popular, and institutions such as land banks thatcould reduce transaction costs for buyers and give landowners fairreturns have been talked about and developed to various degrees, theseefforts need to be sustained by more transparent land governance andpolicies.¹
• Better regulation of modern farm inputs like seeds, herbicides, and fertil-izers for quality and safety. Farmers need to be protected from dangerouschemicals, and assured that the inputs they buy are genuine and ofacceptable quality (e.g., seeds need to be of the promised variety, diseasefree, and have acceptable germination rates).
• Investing more in agricultural R&D. Apart from cocoa, Ghana has ser-iously underinvested in its agricultural R&D system and urgently needsto increase its spending and strengthen the capabilities of the national
¹ https://ghanaguardian.com/sada-lures-investors-land-bank.
OUP CORRECTED PROOF – FINAL, 29/7/2019, SPi
, , , 263

research institutions. Some of the maize varieties released in recent years,for example, do not perform any better than older maize varieties (vanAsselt et al. 2018b). The research system needs financially sustainablestrategies for developing, testing, and disseminating superior seed var-ieties, for responding to climate change, and to expand the scope of itswork to support farmer diversification into higher value products for thedomestic and nontraditional export markets. Research practices alsoneed to be improved to provide better channels of communicationbetween farmers and researchers about research needs and the effective-ness of newly developed research products like seed varieties.
• Improve agricultural extension. The government has hired more exten-sion agents in recent years but extension is only as effective as thetechnologies available to agents to extend. Preliminary results from anexperiment in northern regions of Ghana, for example, suggest that theuse of effective extension methods to disseminate best practices forgrowing maize with existing varieties did not result in increased yieldsor profits, although farmer knowledge and practices were improved(Udry 2018).² Moreover, despite the devolution of agricultural extensionto the local government level in recent years, there is still an urban bias inthe distribution of extension agents across the country (Resnick 2018).
• Seed systems. In addition to strengthening the public R&D system, arecent IFPRI study has shown a need to make complementary improve-ments in the seed delivery system (Tripp and Ragasa 2015). Theseinclude: a) maintaining pure lines that are accessible to private breeders;b) strengthening the functioning of critical institutions in the seedsector, such as the National Seed Council; c) providing more effectivecoordination and regulation; d) guaranteeing the availability of founda-tion seeds; and e) ensuring the integrity and pureness of seeds sold tofarmers. Regulation is still weak: seed certification and getting spuriousseeds off the market remain critical. There still is not a viable mechanismfor production of foundation seeds beyond the research, which has madethe transfer of genetic material from the public to private sectors unre-liable. The entry of a large African seed company that wants to serve theregion based in Ghana has the potential to overcome some of theproblems faced by Ghanaian seed producers. International seed compan-ies have their own varieties and capabilities for testing them for local
² https://www.atai-research.org/wp-content/uploads/2018/07/Udry-DIRTS-overview.pdf.
OUP CORRECTED PROOF – FINAL, 29/7/2019, SPi
264

suitability, whereas local seed companies must typically depend on theantiquated public sector facilities for testing. The presence of a regionalplayer in the country can also be expected to hasten the approval ofregional harmonization policies on seed standards.
• Fertilizer and soil and nutrient management. Fertilizer use in Ghana isstill low and is widely used to offset soil fertility losses arising fromshortened fallow periods rather than to increase crop yields. Returns toits use could be improved by more widespread soil testing and mappingso that fertilizer dealers and farmers can better match fertilizer blendswith regional soil nutrient deficiencies. To sustain soil fertility, its use alsoneeds to be complemented with improved soil and nutrient managementpractices, including crop rotations and precision farming. Improved soilswould also enhance crop yield response to fertilizer. Initial public invest-ments can attract private investments; e.g., creating a demand for soiltesting can lead to private labs, fertilizer firms can be required to producelocation specific fertilizers. A positive development is that several donor-supported projects and private companies working with local researchorganizations have developed region- and crop-specific informationand identified fertilizer formulations that might be suitable for variousregions. Simultaneously, there have been efforts to develop soil fertilitymapping including by Optimizing Fertilizer Recommendations inAfrica (OFRA) supported by the Alliance for a Green Revolution in Africa(AGRA).³ Ghana is also negotiating with a large company to blendformulations in the country and also manufacture fertilizers.
• Mechanization. The demand for mechanization services, especially trac-tors for plowing, has grown rapidly in recent years and this demand iscurrently met by parallel public and private systems. As reviewed inChapter 9, the private system has developed without government sup-port, and is working well and has created a competitive market for hiring-in services. On the other hand, the AMSEC model recently promoted bythe government seems not to be viable in its present form. It would bebetter if the government were to phase out the AMSEC program, andfocus its efforts on supporting the private sector by funding appropriatemechanization research, technical training of young mechanics, andensuring that financial institutions can provide the longer-term lendingneeded by private agents and farmers in the mechanization supply chain.
³ http://africasoilhealth.cabi.org/wpcms/wp-content/uploads/2017/03/OFRA-book-low-res.pdf.
OUP CORRECTED PROOF – FINAL, 29/7/2019, SPi
, , , 265

Of particular benefit would be research to support the mechanization of“control” operations such as seeding, fertilizer application, and harvest-ing, which can be expected to encourage the adoption of improvedagricultural practices or intensification while reducing overall laborrequirements. Better utilization of tractors for a range of operationswould also make provision of tractor services much more remunerative.
• Irrigation has long been ignored in Ghana, and only about 3 percent ofthe crop area is irrigated, or less than 20 percent of the irrigable potential.Yet irrigation has a key role to play in increasing land productivity,facilitating the adoption of more intensive technologies, and helping tomanage increasing weather risks. A lot of public sector money has goneinto rehabilitating old, badly designed surface irrigation systems, andbetter options may lie in promoting small scale irrigation investmentsin wells, river lifts, and water harvesting at community levels.
• Financial services. At present, the formal financial sector provides littlecredit to smallholders other than cocoa growers. Banks are reluctant tolend for agricultural activities, which are perceived to be risky, and whencommercial bank loans are available, interest rates range from 30–35percent, in addition to a hefty administrative fee. SMEs in agribusinessalso report that access to finance is a major constraint for them. Publiclyprovided credit guarantees, insurance or co-financing can be helpful forreducing risk along value chains, and making small farms more attractiveto agribusinesses (Varangis et al. 2017). The government has launchedthe Ghana Incentive-Based Risk-Sharing System for Agricultural Lend-ing (GIRSAL)⁴ to underwrite 20–30 percent of the agriculturally relateddefault risks assumed by lending institutions, and to help them developmore appropriate credit products.
• Coordination along value chains. Apart from cocoa, the value chain forwhich is successfully controlled by Cocobod, there are serious marketfailure issues in many other value chains that prevent the development ofgrading systems, value chain financing, and export marketing channels.This makes it difficult for domestic products to compete internationallyin export markets or to displace more imports. As discussed in Chapter 8,in most cases marketing boards do not appear to be a relevant solution,and there have been several recent attempts to find more flexible
⁴ http://www.ghana.gov.gh/index.php/media-center/news/3165-bank-of-ghana-launches-girsal-scheme.
OUP CORRECTED PROOF – FINAL, 29/7/2019, SPi
266

institutional structures that can facilitate and encourage coordinationand the development of non-market relationships among value chainactors, but without undermining a basic laissez-faire approach to themarket. Some recent projects in Ghana, such as the Northern RuralGrowth Project (NRGP) and the Market-Oriented Agricultural Project(MOAP), have enabled various actors in value chains to interact witheach other by organizing value chain committees, but how effective theyare remains to be seen. Preliminary findings suggest that the mere offer ofplatforms for exchange does not lead to technical or institutionalinnovations.
• Linking small farms to value chains. SMEs are the main entry point formost small farmers to obtain modern inputs or to link to urban markets,so policies that assist the growth of SMEs can be an indirect way ofhelping small farmers. Such interventions might include improving SMEaccess to credit, and providing training in business management skills.Many value chain development projects including the USAID-fundedADVANCE have sought to strengthen the operations of aggregators/traders, processors, and tractor service providers through training andgrants. Larger agribusinesses tend to avoid linking with many small farmsbecause of the higher transaction costs and uncertainties involved com-pared to working with larger commercial farms. To overcome thisimpediment, one option is for small farms to be organized into producerorganizations that can link with large agribusinesses, and there have beenmany attempts to do this in Ghana through the formation of FarmerBased Organizations (FBOs). However, the results have not been encour-aging. Many agribusinesses have done it to various degrees on their own,but since, as one firm manager commented, it involves building relation-ships and trust not just writing contracts, it is not clear how publicinterventions can help scale up such arrangements.
10.3 Resources, Politics, and Practicalities
How likely is it that Ghana will or could adopt an agricultural transformationagenda along the lines suggested above? Fundamentally, the governmentwould need to increase its level of investment in agriculture, take a moreproactive role in guiding the agricultural transformation and overcoming
OUP CORRECTED PROOF – FINAL, 29/7/2019, SPi
, , , 267

market failures along important value chains, while at the same time support-ing and building stronger alliances with the private sector. There are politicalas well as economic challenges involved.
Currently the government spends 4–5 percent of its total budget on agri-culture, but the lion’s share of that goes to the cocoa subsector. Ideally, thisshare should be increased to meet the CAADP target of 10 percent, butincreasing government spending on agriculture or other agriculture-relateddevelopment activities will be difficult now that the country is facing seriousmacroeconomic imbalances (World Bank 2017). Investments therefore mustbe strategic, focused, and more efficient. There is scope to increase theeffectiveness of public spending if many of the off-budget projects funded bydonors were better coordinated with each other and with the government’sown investments. But differences in the development approaches taken bydifferent donors and the government necessarily limit the extent to which theywould be willing to align their programs and pool resources.
Another constraint is a weak state capacity for designing and implementinga more proactive and comprehensive development approach. As reviewed inChapter 3, this capacity remains weak despite several past efforts to strengthenthe civil service. It is also a barrier to the more effective public–privatepartnerships that are needed for developing value chains and reaching out tomore smallholders and SMEs.
Adding to the challenge of the state’s capabilities is the recent decision todevolve responsibility for agricultural policy formulation and implementationfrom the central Ministry of Food and Agriculture to the District Directors ofAgriculture (DDAs) who are located in the country’s 254 Metropolitan,Municipal, and District Assemblies (MMDAs). This has real implications forhow and whether nationally defined objectives for agricultural transformationcan be feasibly implemented. On the one hand, devolution promises toimprove citizen oversight over policy priorities and enable farmers to havegreater input into the agricultural policy process. On the other hand, staffcapabilities may be even weaker at these devolved levels; recent research findsthat since agriculture functions officially were devolved in 2012, there havebeen declines in agricultural extension staff and a general reduction in actualexpenditures for the agricultural sector in favor of increased expenditures onvisible public works projects that appeal to rural voters (Resnick 2018).
What other options are there for a proactive government effort that can cutacross ministries and take a more holistic system view of the developmentchallenges? Rather than trying to drive the entire agricultural sector forward atthe same time, with all the public sector capabilities and financial resourcesthat requires, there is growing interest today in more focused “first mover”
OUP CORRECTED PROOF – FINAL, 29/7/2019, SPi
268

strategies. A first mover might be a nontraditional export crop or a priorityfood staple that must compete with imports, and the idea would be toconcentrate resources and effort on selected value chains and drive thesehard for growth and employment creation. There can also be a regionaldimension to first movers, for example, starting in high potential areas thathave the best infrastructure, market access, and agricultural growth potential.Another spatial approach is the development of agro-corridors, agro-clusters,agro-industrial parks, and agro-based special economic zones. These typicallyuse agro-processing as a driving industry, and seek to make links back tosmallholders through various forms of out-grower or contract-farmingarrangements. A first mover approach can lead to quick wins in terms ofincome and employment, and their visibility can also be good for developingpolitical momentum and support for agriculture; government ministers anddonors love successes. And once the first movers have been successfullylaunched and rural incomes and employment are rising, then attention canshift to other activities, regions, and goals.
A first mover strategy is not new. It is very similar to the Asian GreenRevolution strategy, where an initial thrust on import substitution for wheatand rice grown in the best-irrigated areas led the successful rural transform-ation that followed (Rosegrant and Hazell 2000). It has also been used in Asiato drive nontraditional export crops (e.g., Vietnam used the approach todevelop coffee production, moving from zero production to a major worldexporter over little more than a decade). It has also been tried in Africa in thepast (e.g., presidential initiatives for specific commodities, and integratedrural development projects) but with mixed success. What makes it a newand promising approach today is that it can build on embedded marketliberalization policies and stronger private sector roles. First moverapproaches provide platforms that enable relevant public and private sectorplayers to come together to better serve groups of smallholder farms, whileenabling public and private investments in infrastructure and supportingservices to achieve critical levels. Moreover, because policymaking in Ghanahas become more decentralized and communities and local governmentshave greater say, some regions are more ready for development projectsthan others.
10.4 Recent Developments
In an encouraging recent development, the government has elevated its levelof support for agricultural transformation. However, less encouragingly, key
OUP CORRECTED PROOF – FINAL, 29/7/2019, SPi
, , , 269

components of the new strategy do not align well with the agenda outlinedin Section 10.3.
Although Ghana participates in the CAADP process and has a countrycompact and a National Agricultural Investment Strategy (NAIS), these arenot well developed and do not seem to guide the government’s actual strategyfor agriculture. The current administration came to power promising anexplicit strategy for the inclusive transformation of small farms with emphasison the development of agro-processing. It is implementing three centrallydriven agriculture- and industry-related programs that are expected to benefitall the districts: planting for food and jobs (PFJ), “one village one dam,” and“one district one factory.” The political leadership including the minister andthe president is fully behind the programs. It is also holding itself politicallyaccountable by tying these programs to the party’s manifesto. Apart from theambitious PFJ, the vice president also announced recently that Ghana ispreparing a Marshall plan for agriculture.
The PFJ aims to increase productivity by encouraging the use of improvedseeds and fertilizers (MoFA 2017). The program has five pillars—seeds,fertilizers, extension, marketing, and e-agriculture, but at the heart of it issubsidized supply of seeds and fertilizers. In many ways it is a scaled-upversion of strategies Ghana has followed in the past, with minor differences.Many of the past strategies, particularly the one implemented immediatelyafter gaining independence and the “Operation Feed Yourself ” implementedin the 1970s, focused on mechanization and the development of large-scaleprivate and state farms. PFJ on the other hand, seeks to pass on subsidizedinputs to thousands of farmers in every district in the country.
By supporting the production of seven crops and addressing variousissues—extension, markets, and production costs—the program lacks focus.It is not designed to overcome market failures in any specific value chains,but merely to reduce costs to boost the use of fertilizers and seeds. It is animprovement over the fertilizer subsidy programs implemented thus far inthat it also encourages the use of improved seeds. But it is not targeted, so willsubsidize substantial amounts of fertilizer that would be used anyway, andwhere it does induce additional fertilizer and seed use, it remains unclear as towhether farmers would continue to use those inputs if the subsidies wereremoved. Otherwise, as in the past it will be a program of “subsidized funda-mentals” through which input use may be increased in the short run withoutovercoming bottlenecks that may exist in these chains. In parallel, donors aresupporting commodity-based projects but because of the very nature of projects,they lack the continuity and the flexibility to effectively develop value chains.
OUP CORRECTED PROOF – FINAL, 29/7/2019, SPi
270

The government’s assumption of the supplier of inputs also reverses thetrend in which farmers were becoming market oriented and private sector wasdeveloping slowly. Farmers will continue to see the state as the supplier ofcredit and inputs and the buyer of last resort. Although inputs are purchasedfrom private companies, the private sector becomes tethered to the state,grateful for the business opportunities and its existence. Whether the programwill serve as a state-led market development for private sector will depend onwhether technologies that are pushed through the project can be sustainedwithout subsidies.
The design of the other two programs, the “one village one dam” and the“one district one factory” to appeal to the electorates all over the countrycompromises their effectiveness. In addition to the difficulties in adequatelyfinancing them, spreading investments over a large area is likely to dilute theirpotential impact and returns. For example, carefully sited larger irrigationsystems are likely to be more productive than small dams in each village,unless the objective is to meet domestic water requirements. Similarly, signifi-cant support for processing of a few critical agricultural products in prioritydistricts is likely to be more effective than spreading limited resources uni-formly across all districts, unless there are significant investment opportunitiesin every district to choose from. While the programs are politically appealingand address some real concerns, Ghana is missing an opportunity to use itslimited resources to more selectively intervene in critical areas to triggerprivate-sector-led innovations that can sustain an agricultural transformation.
10.5 Implications for Other African Countries
Ghana’s economic growth story is particularly relevant because there are keyparallels with many other countries in Africa. Despite being unusually blessedin its endowment of minerals and natural resources, and having easy access toworld shipping lanes, Ghana is experiencing the same pattern of rapid urban-ization without industrialization that is ongoing across most of Africa. More-over, Ghana is typical of other African countries in that it has not experienceda widespread agricultural revolution, even though the sector is still a majoremployer. While the agriculture sector has grown at a reasonable rate, itcontinues to be only a major cocoa exporter, and is becoming increasinglydependent on imported foods. Recent agricultural growth has been achievedmainly through land expansion rather than the uptake of higher-yieldingtechnologies. While labor productivity is growing in agriculture, the sector
OUP CORRECTED PROOF – FINAL, 29/7/2019, SPi
, , , 271

still has one of the lowest labor productivities in the economy, which is alsotrue in many other African countries.
Countries, especially smaller ones like Ghana, cannot get rich by producingpredominantly nontradable goods and services. Instead, modern agricultureand agri-business, either for export or import substitution, offer opportunitiesto Africa for future prosperity. However, Ghana’s past experience shows theconsequences of neglecting agriculture in the post-SAP era. Despite its richagricultural endowments and potential, Ghana like most Africa countries hasnot invested sufficiently in such basics for agricultural development as R&D,irrigation, rural roads, transport and storage systems, and rural financialsystems, all of which are needed if the private sector is to successfully leadan agricultural transformation.
Nonetheless, Ghana is unusual by African standards in that it has experi-enced over three decades of stable and democratic government, during whichtime it has also worked to develop an enabling environment to attract theprivate sector. If any country can be seen as a test case of the WashingtonConsensus approach that guided the SAP reforms, then Ghana is it. And theverdict is that while a focus on enabling policies appears necessary for achiev-ing the kinds of rapid economic growth seen in Asia, it is not sufficient.Moreover, today’s globalization has challenged many late developers, includ-ing African countries, which are facing limited opportunities for exportmanufacturing; together with import competition at home, industrializationbecomes much more difficult in Africa than it was in previous decades inmuch of Asia.
Encouragingly, African governments are slowly rediscovering the import-ance of their agricultural sectors and the need to transform them throughmore productive technologies, and the CAADP process is an encouraging stepin bringing some political pressure to that end. Several key donor agencies arealso backing agricultural development again after a long respite. A focus onfirst-mover strategies that lead to quick and visible successes despite weak-nesses in public sector capabilities might also help develop greater politicalmomentum in support of agriculture. But perhaps the best hope lies in the factthat the ongoing changes in Africa’s food system are creating a wealth of newopportunities not only for farmers, but also for a growing agribusiness sector.Due to rapid urbanization and rising incomes, there has been a shift inpatterns of food demand that is driving rapid growth in a swath of agribusi-nesses that move foods from rural to urban areas, and process and distributethem in ways that is adding considerable value addition beyond thefarm gate. The World Bank has estimated that agribusiness in Africa will
OUP CORRECTED PROOF – FINAL, 29/7/2019, SPi
272

be worth about $1 trillion by 2030 (in 2010 prices), or over $1,000 perAfrican. That is a huge market opportunity to be seized, and does not includethe additional value of agricultural production that will be required to supplythe agribusiness sector.
The sheer size of these opportunities also has been recently recognized intwo Africa-wide studies (ACET 2017; AGRA 2017), and they may be largeenough to spark a new political dynamic built on complementary public andprivate sector interests, leading to new investments and partnerships andsupporting policies. If so, governments in African countries need to playmore proactive roles in partnership with the private sector to fix market andinstitutional failures along important value chains that constrain private sectordevelopment and the effectiveness of market solutions. And they need to do allthis while prioritizing small farms and SMEs to ensure that the agriculturaltransformation is inclusive and employment-intensive.
References
Andam, Kwaw S., David Tschirley, Seth B. Asante et al. 2018. “The Transform-ation of Urban Food Systems in Ghana: Findings from Inventories of ProcessedProducts.’ Outlook on Agriculture (3): 233–43.
Andam, Kwaw S. and Seth B. Asante. 2018. “Firm Employment, Exit, and Growthin the Food-processing Sector: Evidence from Ghana.” IFPRI Discussion PaperNo. 1755. Washington, DC: International Food Policy Research Institute.
Alliance for a Green Revolution in Africa (AGRA). 2017. “African AgricultureStatus Report 2017: The Business of Smallholder Agriculture in Sub-SaharanAfrica.” Nairobi: AGRA.
African Center for Economic Transformation (ACET). 2017. “African Trans-formation Report 2017: Agriculture Powering Africa’s Economic Transform-ation.” Accra: ACET.
Breisinger, C., X. Diao, J. Thurlow et al. 2012. “Ghana,” in X. Diao, J. Thurlow,S. Benin, and S. Fan (eds), Strategies and Priorities for African Agriculture:Economywide Perspectives from Country Studies. Washington, DC: IFPRI,141–64.
Diao, Xinshen, Margaret McMillan, and Dani Rodrik. 2017. “The Recent GrowthBoom in Developing Economies: A Structural Change Perspective.” NBERWorking Paper No. 23132. Available at: http://www.nber.org/papers/w23132.
Houssou, Nazaire, Collins Asante-Addo, Kwaw S. Andam, and Catherine Ragasa.2018. “How Can African Governments Reach Poor Farmers with FertiliserSubsidies? Exploring a Targeting Approach in Ghana.” The Journal of
OUP CORRECTED PROOF – FINAL, 29/7/2019, SPi
, , , 273

Development Studies. Article in press. Available at: https://doi.org/10.1080/00220388.2018.1528353.
Kolavalli, Shashidhara, and Marcella Vigneri. 2017. “The Cocoa Coast: TheBoard-managed Cocoa Sector in Ghana.” Washington, DC: InternationalFood Policy Research Institute.
Ministry of Food and Agriculture (MoFA). 2017. “Planting for Food and Jobs:Strategic Plan for Implementation (2017–2020).” Accra: Republic of Ghana.
Mueller, V., I. Masias, and S. Vallury. 2018. “Labor-Saving Technologies andStructural Transformation in Northern Ghana.” Working Paper. Washington,DC: International Food Policy Research Institute.
Nutsukpo, Delali Kofi, Abdulai Jalloh, Robert Zougmore et al. 2013. “Ghana,” in:Abdulai Jalloh, Gerald C. Nelson, Timothy S. Thomas et al. (eds),West AfricanAgriculture and Climate Change: A Comprehensive Analysis. Washington DC:International Food Policy Research Institute, 141–72.
Ragasa, Catherine, Awere Dankyi, Patricia Acheampong et al. 2013. “Patterns ofAdoption of Improved Maize Technologies in Ghana.” GSSP Working PaperNo. 36. Washington, DC: International Food Policy Research Institute.
Reardon, T., D. Tschirley, B. Minten et al. 2014. “Transformation of AfricanAgrifood Systems in the New Era of Rapid Urbanization and the Emergenceof a Middle Class” in O. Badiane and T. Makombe (eds), Beyond a MiddleIncome Africa: Transforming African Economies for Sustained Growth withRising Employment and Incomes. ReSAKSS, Annual Trends and OutlookReport 2014. Washington, DC: IFPRI, 62–74.
Reardon, Tom. 2015. “The Hidden Middle: The Quiet Revolution in the Mid-stream of Agrifood Value Chains in Developing Countries.” Oxford Review ofEconomic Policy 31(1): 45–63.
Resnick, D. 2018. “The Devolution Revolution: Implications for AgriculturalService Delivery in Ghana.” IFPRI Discussion Paper No. 1714. Washington,DC: International Food Policy Research Institute.
Resnick, D., and N. M. Mason. 2016. “What Drives Input Subsidy Policy Reform:The Case of Zambia, 2002–2016.” IFPRI Discussion Paper No. 01572.Washington,DC: International Food Policy Research Institute.
Rodrik, D. 2014. “The Past, Present, and Future of Economic Growth,” in FranklinAllen et al., Towards a Better Global Economy: Policy Implications for CitizensWorldwide in the 21st Century. Oxford: Oxford University Press, 70–133.
Rodrik, Dani. 2017. “Growth without Industrialization.” Project Syndicate.October 10. Available at: https://www.economics.utoronto.ca/gindart/2017-10-10%20-%20Growth%20without%20industrialization.pdf.
Rosegrant, M., and P. Hazell. 2000. Transforming the Rural Asian Economy: TheUnfinished Revolution. Oxford: Oxford University Press for the Asian Devel-opment Bank.
OUP CORRECTED PROOF – FINAL, 29/7/2019, SPi
274

Tripp, Robert, and Catherine Ragasa. 2015. “Hybrid Maize Seed Supply inGhana.” GSSP Working Paper No. 40. Washington, DC: International FoodPolicy Research Institute.
Varangis, P., R. Chen, and T. Ono. 2017. “Strengthening Financial Systems forSmallholders,” in African Agriculture Status Report 2017: The Business ofSmallholder Agriculture in Sub-Saharan Africa. Nairobi: AGRA, 65–88.
van Asselt, Joanna, Ian Masias, and Shashi Kolavalli. 2018a. “Competitiveness ofthe Ghanaian Vegetable Sector: Findings from a Farmer Survey.” GSSP Work-ing Paper No. 47. Washington, DC: International Food Policy ResearchInstitute.
van Asselt, Joanna, Federica Di Battista, Shashi Kolavalli, and Christopher Udry.2018b. “Agronomic Performance of Open Pollinated and Hybrid Maize Var-ieties: Results from On-farm Trials in Northern Ghana.” GSSP Working PaperNo. 44. Washington, DC: International Food Policy Research Institute.
World Bank. 2017. “Ghana Country Report.” Washington DC: World Bank.Available at: http://www.worldbank.org/en/country/ghana/overview.
OUP CORRECTED PROOF – FINAL, 29/7/2019, SPi
, , , 275

OUP CORRECTED PROOF – FINAL, 29/7/2019, SPi

Index
Note: Tables and figures are indicated by an italic t and f following the page number.
Abbey, Joseph 62Acheampong, Ignatius 59t, 59, 75f, 176Action Programme for Agricultural
Production 177Archer Daniels Midland 78African Union 211Afrifa, Akwasi 59t, 175agribusiness 8, 9
Africa 3–4, 272–3economic prospects and options 259, 261,
262, 263, 266, 267future prospects 44land rights 78political transformation 78, 79public sector 112recent developments 270resources, politics, and practicalities 269state–business relationships 73urbanization 128value chains 210, 211, 226–7, 235cocoa 78, 215organizing farmers into groups 226pineapples 215, 216, 217quality control 228tomatoes 221, 234
Agricultural Development Corporation(ADC) 174–5
agricultural extension 264agricultural intensification 8, 10, 110,
114–15, 116–17f, 118economic prospects and options 258, 261public expenditure 194public sector 119urbanization 115, 118, 124, 131–9, 140village perspectives of change 160, 165see also fertilizers; herbicides; insecticides;
mechanization; pesticides; tractorsAgricultural Mechanization Services
Centers see AMSECs
agricultural sector 9–15Africa 1, 2, 3–4, 271–2employment share 2fGDP share 2f
assistance, average nominal rates of 63fdemocracy 53economic prospects and options 257–67economic transformation 6, 7–8, 39, 45employment 26, 26t, 27f, 27productivity, sources of growth in 33,34, 35t, 36, 36t, 37, 38t
structural change 22future prospects 39, 40, 45mechanization see mechanizationpolitical transformation 51, 60–1, 68,
76–81, 82state–business relationships 74, 76
public expenditure 12–13, 64, 65f, 111–12,119, 170–205, 267, 268
composition 180–3, 181t, 182f, 182tdata sources 171–2, 171t, 196–8tgrowth effects 183–93, 187–8tnew directions 193–4recent developments 271regression results 199–205, 200t,202–5t
trends and output per hectare 171–83,172f, 173f, 173t
value chains 219, 235recent developments 269–71resources, politics, and practicalities
267–9share of total employment 123ftransformation 97–120growth patterns 98–109land and labor 104–7policy 110–13population pressure on landbase 113–15
OUP CORRECTED PROOF – FINAL, 30/7/2019, SPi

agricultural sector (cont.)production 98–102, 98t, 99t, 100t,102t, 103f
rural livelihoods, incomes, andpoverty 108–9
technology see mechanizationurbanization 115–18
urbanization 121–40farming practices 133–6farm size distribution 131–3modern input adoption 136–9rural employment 124–8trends 122–4welfare outcomes 128–31
village perspectives of change 142–68farm model analysis 152–8, 154t,156t, 157f, 159t, 161–8, 162t
narratives 145–52selection of villages 143–4, 143t
Agricultural Services RehabilitationProject 60
Agricultural Services Subsector InvestmentProgram 178
agroecological zones 99–101food crop distribution 101–2, 102fmap 101f
agro-processing see agribusinessAkuffo, Frederick 176Akufo-Addo, Nana 59t, 66, 67–8Alien Compliance Orders Act 59Alliance for a Green Revolution in Africa
(AGRA) 265AMSECs (Agricultural Mechanization
Services Centers) 14, 112, 248,249–51, 253–4, 253t, 265
effectiveness 113public expenditure 193, 194, 195value chains 224
animal traction 242, 244Ankrah, Joseph Arthur 59t, 175Armed Forces Revolutionary Council 177Ashanti Goldfields Company 62Asian tigers 8Association of Ghana Industries 73authoritarianism 61, 82autocracy 82
bananas 98Banda, Hastings 57
Benin 70, 71t, 75tblock farms 112, 193–4, 195Blue Skies 78Boahen, Adju 63Botchwey, Kwesi 62, 67Botswana
credit 75tdevelopmental state 55, 82economic growth 6, 20tpublic management 70, 71t
Brazil 50, 75t, 249, 250Burkina Faso 220Busia, Kofi 59t, 59, 73n, 75f, 175business environment see private sectorbusiness services sector
employment 28t, 29t, 30t, 31productivity, sources of growth in 35t,
36t, 37, 38t, 38
CAADP 174, 178, 268, 270, 272Callebaut 78Captains of Industry program 74Cargill 78cassava 80–1
productivity 99, 101, 102village perspectives of change 146, 154,
161, 163, 164, 165, 167, 168fcentralized planning 22Chile 231China
agro-processing 227AMSEC program 249, 250credit 75tgrowth 20t, 32manufacturing sector 40
civil service 8, 61, 68–9, 71–2, 268wages 67, 69
Civil Service Performance ImprovementProgram (CSPIP) 69
Civil Service Reform Program 69clientelism 53, 57coastal agroecological zone 106t, 107,
114, 124cocoa
democracy 64economic prospects and options 258exports 5, 98, 109, 213, 233, 258, 271economic prospects and options 260growth 210
OUP CORRECTED PROOF – FINAL, 30/7/2019, SPi
278

marketing 230public expenditure 175, 190, 194, 195quality control 230taxation 194, 230
growth 210mechanization trends 243political transformation 59, 60, 61, 62, 78SAP 60, 61state–business relationships 73n
productivity 98, 99, 102public expenditure 12, 13, 111–12, 170,
194, 195, 268growth effects 183, 189–91, 193trends and output per hectare 172–80,172f, 173f, 173t
urbanization 122value chain 13, 211, 212, 213–15, 233agro-processing 226chemical inputs 222–3Cocobod model 230–2credit 224quality control 227, 228, 228t, 229seeds 222taxation 230
Cocoa Board see CocobodCocoa Marketing Company 231Cocobod 110, 180n, 213–14, 215, 233
cocoa processing 78public expenditure 170, 181t, 194growth effects 189, 190trends and output per hectare 172–3,174, 179, 180
tax revenue 230value chain 230–2chemical inputs 222–3organizing farmers into groups 225
cocoyams 101, 102coffee 210cold storage 263
public sector 112value chainsagro-processing 227pineapples 217, 234quality control 228
collective bargaining 53communal conflict, sources of 77t, 77communications
public expenditure 64, 65f, 182t, 182village perspectives of change 144
competitiveness 225, 226cocoa 215, 230pineapples 217rice 219, 231, 232tomatoes 221, 231
construction sectoremployment 26, 26t, 28t, 29t, 30t, 31productivity, sources of growth in 35t,
36t, 38t, 38Convention People’s Party 59t, 174cooperatives 174, 175, 225Corporate Village Enterprises (COVEs) 79corporatism 56, 57corruption 71–2Costa Rica 80, 216, 217Côte d’Ivoire
cocoa 215, 260developmental state 58pineapples 79, 80, 216political instability 50public management 70, 71t
cotton 146, 149Council for Scientific and Industrial
Research (CSIR) 180, 180n, 181tCouncil of Independent Business
Associations 73cowpeas
productivity 101, 102village perspectives of change 146, 149, 160farm model analysis 154, 161, 165,167, 168f
crediteconomic prospects and options 266interest rates 67palm oil 79political transformation 72–3, 74–6,
75f, 75tpublic expenditure 175, 176, 193value chains 224–5agro-processing 227rice 226
village perspectives of change 144, 164–5crony capitalism 57crop rotations
economic prospects and options 265village perspectives of change 149, 152, 160farm model analysis 161, 165, 165f
Crystal Ventures (Rwanda) 58Customary Land Secretariats 78
OUP CORRECTED PROOF – FINAL, 30/7/2019, SPi
279

Danquah, J. B. 73ndebt forgiveness 67decentralization 5, 174, 177, 179, 268defense spending 182tdeliberation councils 56Del Monte 216democracy 5, 8, 272
IIAG 70policy environment 66political transformation 50, 51, 53–4, 58,
63–8state–business relationships 73
Department for International Development(DfID) 69
Department of Forestry (DoF) 181tdevelopmental states 54–5, 82
neo-patrimonial 57–8District Assembly Common Fund 174, 177District Directors of Agriculture
(DDAs) 268donors 181, 262, 265, 268, 270, 272
economic prospects and options257–67
Economic Reform Program (ERP) seeStructural Adjustment Program
economic transformation 6–9, 19–46,82, 257
employment 26–31future prospects 39–45agriculture 40manufacturing 40–4services 44–5
investment in fundamentals 58–63per capita income 20–1productivityaggregate growth 23–5sources of growth 31–9
state–business relationships 73structural change 21–3
ECOWAS 222education 68, 81
female 65public expenditure 64, 65f, 65, 66, 182t,
182, 195growth effects 183, 191, 192
village perspectives of change 144electricity 144, 263embedded autonomy 56, 82
employmentAfrica 2fagribusiness 259agricultural sector 260economic transformation 8,
26–31manufacturing sector 41, 42, 42t, 44productivity, sources of growth in35t, 36
future prospects 40, 45political transformation 82service sector 6urbanization 122, 123f, 124–8, 127t, 129tsee also labor
EPRDF 58Ethiopia 50, 58ethnic factors 50Eurobonds 50Export Development and Investment Fund
(EDIF) 74Export-Import Bank of India 249exports
Africa 272cassava 80cocoa see cocoa: exportseconomic prospects and options 258,
259, 260economic transformation 8future prospects 45gold 62, 259manufacturing sector 39, 41minerals 5, 259mining sector 38pineapples 79–80, 112, 212, 215–17, 225,
229, 231, 233, 234, 260political transformation 61, 74promotion 112public expenditure on agriculture 174shea nuts 231value chains 210, 212, 223quality control 227, 229
fallow periods 11, 104arable land area 113economic prospects and options 265fertilizer use 103mechanization 244public expenditure 194value chains 223
OUP CORRECTED PROOF – FINAL, 30/7/2019, SPi
280

village perspectives of change 145–6, 151,153, 160
Farmapine Ghana Ltd 225Farmer Based Organizations (FBOs)
225, 267farm incomes 151t, 151, 160
farm model analysis 153, 158, 159tfarm input costs 150, 150t, 158farm size 105–7, 106t, 107t
crop dynamics 147fertilizer use 102labor use 147mechanization 148tdemand 245, 246–7, 254supply 252trends 243t, 243
rural nonfarm economy 108, 108ttrends 247turbanization 115, 118, 131–3, 132t,
133f, 140agricultural intensification 134t,134–6, 135t, 137t, 137–8
village perspectives of change 145, 145t,149, 150, 150t, 151, 160
farm model analysis 153, 155–7, 156t,158, 159t
Farmtrac 249–50Federation of Associations of Ghana
Exporters 73Felda 78female education 65fertilizers 11, 102–3, 103t, 104t
economic prospects and options 263, 265planting for food and jobs program 270prices 110public expenditure 176, 193subsidies 112, 113, 134, 138, 176, 193,
194, 195cocoa 215, 223SAP 60value chains 223
urbanization 115–18, 134t, 134, 136–9,137t, 138t, 140
value chains 222–3cocoa 212, 215, 223, 230rice 219tomatoes 221
village perspectives of change 155, 156,158, 159t, 165, 166–7, 167t
finance sectoremployment 26, 26tsee also credit
firm sizeagricultural sector see farm sizemanufacturing sector 42–3, 42t
first mover strategies 268–9, 272fiscal management 51, 53–4, 67, 81Food and Agricultural Sector Development
Policy (FASDEP II) 78, 178food crisis (2008) 77food demand 3, 14food imports 98, 109, 112, 271
economic prospects and options 258, 259political transformation 59public expenditure on agriculture 176value chains 210, 212
food security 191foreign direct investment (FDI) 62, 81
economic prospects and options 259, 262land rights 77
foreign exchange 60, 191forest agroecological zone 99, 124
agricultural intensification 114–15, 116ffarm size 106t, 107food crops 101–2, 102tmap 101f
formal sectoremployment 27, 28t, 29t, 30t, 31manufacturing 43
fruit juices 210fundamentals
agricultural transformation 110democracy 54economic prospects and options 257economic transformation 7, 31–2, 33, 39, 45productivity, sources of growth in 37
future prospects 9planting for food and jobs program 270political regime 52political transformation 49, 50, 58–63value chains 210
G7 211Germany 50, 75tGhana Chamber of Mines 73Ghana Cocoa Board see CocobodGhana Commercial Agricultural
Project 77, 178
OUP CORRECTED PROOF – FINAL, 30/7/2019, SPi
281

Ghana Free Zones Board (GFZB) 73Ghana Incentive-Based Risk-Sharing
System for Agricultural Lending(GIRSAL) 266
Ghana Investors Agency Council 74globalization 190, 226, 272gold 62, 258, 259government see public sectorgovernment services sector
employment 26, 26tproductivity, sources of growth in 35t, 36,
36t, 38tgross domestic product (GDP)
Africa 1, 2faggregate growth 23–4, 24f, 25tcountries with thirty years’ uninterrupted
growth in 20teconomic transformation 20, 21–2, 23, 39, 45future prospects 39per capita 62sectoral shares 21f, 22tservice sector 6, 44sources of growth 35t, 36
groundnutsproductivity 101, 102village perspectives of change 146, 147, 160farm model analysis 154, 161, 165,167, 168f
Grow Africa Investment Forum 262Growth and Poverty Reduction Strategy
(2006–9) 64Guinness Ghana Breweries Limited 80
Hawaii Pineapple Research Institute 216health
insurance 81public expenditure 64, 65f, 65, 67, 182t,
182, 191, 192, 195Heavily Indebted Poor Countries
(HIPC) 64, 66, 67, 74herbicides 103
economic prospects and options 263urbanization 115, 134–5, 135t, 137t, 138t,
138–9, 140village perspectives of change 147, 148,
150, 150t, 152, 160farm model analysis 158, 165
hired labor see laborHong Kong 54
Houphouët-Boigny, Félix 58human capital 53, 183human development (IIAG) 70f, 70human rights (IIAG) 70f, 70
Ibrahim Index of African Governance(IIAG) 69–71, 70f, 71t
importsfertilizers 113food see food importsrice 98, 112, 218, 219, 227–8, 234tomatoes 112, 220, 221tractors 241, 242, 242f, 249–50, 251–2, 254
import substitution 5, 14, 58Africa 272developmental states 55economic prospects and options 258, 259, 260economic transformation 41, 45first mover strategy 269public expenditure on agriculture 176value chains 210, 212, 233pineapples 215tomatoes 229
incomes see per capita incomesIndia 20, 20t, 249–50induced innovation theory 10, 114–15, 119
mechanization demand 245, 247urbanization 124, 133, 140
industrialization 5, 6Africa 3, 271, 272economic transformation 21, 22pineapple value chain 215SAP 41tomato value chain 220
industrial policy 43, 45, 74, 259developmental states 54, 55, 56
industrial sectorAfrica 1employment share 2f
economic prospects and options 257, 259economic transformation 6employment 26t, 27f, 27structural change 22–3
future prospects 41, 45inflation 62informal sector
economic transformation 39employment 27, 28t, 29t, 30t, 31manufacturing 41, 43–4
OUP CORRECTED PROOF – FINAL, 30/7/2019, SPi
282

productivity, sources of growth in 33,34, 38, 39
services 44urbanization 128, 129t
infrastructureeconomic prospects and options 263IIAG 70f, 70political transformation 81public expenditure 64, 182, 184public sector 112, 119value chainsagro-processing 227pineapples 234quality control 228
see also roadsinnovation see induced innovation theory;
research and developmentinsecticides 103
urbanization 134–5, 135t, 137t, 138t, 138–9village perspectives of change 150, 150t, 165see also pesticides
interest rates 67, 72, 266International Monetary Fund (IMF)
aid disbursements temporarily halted 67negotiations with Ghana (2014) 69SAP 6, 20, 59, 60, 66
Investment Code 62investment environment 8
agricultural sector 9, 265economic fundamentals 58–63interest rates 67land rights 77–8political transformation 60, 74, 81public expenditure 184see also foreign direct investment; public
expenditureirrigation 272
economic prospects and options 261, 266palm oil 79public expenditure 193, 195recent developments 271value chains 222rice 114, 219tomatoes 220, 221
Italy 227
Japan 54, 75tJohn Deere 250joint ventures 62
Kagame, Paul 57–8Kenya 5, 71t, 75tKorea 20, 20t, 50, 54Kpong Irrigation Project (KIP) 219Kufuor, John Agyekum 59t
credit 75fpalm oil 78public expenditure on agriculture 178state–business relationships 72, 73–4
labor 104–7cocoa value chain 214costs see wageseconomic prospects and options 261–2growth 105tmechanization demand 245–6, 246t, 247productivity see labor productivitytechnology 103, 104turbanization 137t, 138t, 138–9, 140village perspectives of change 147, 150,
150t, 152, 160farm model analysis 155, 156,158, 159t
see also employmentlabor productivity
Africa 271–2aggregate growth 23–5, 24f, 25tagricultural transformation 9, 10, 11,
12, 110economic prospects and options 257,
258, 260economic transformation 7–8, 39, 45employment 31manufacturing sector 41, 42–3, 42t, 44service sector 44sources of growth 33, 34, 35t, 36, 36t,37–9, 38t
future prospects 39, 40public sector 113trends 104–5, 106f, 118village perspectives of change 155, 156–7,
157f, 160labor unions 61land 104–7
policy 263population pressure 113–15productivity see land productivityrights 76–8, 227, 235scarcity see land scarcity
OUP CORRECTED PROOF – FINAL, 30/7/2019, SPi
283

land (cont.)urbanization 127, 128f, 131–3, 132t, 133fvillage perspectives of change 145–6, 153,
164, 164tsee also farm size
land productivityagricultural transformation 9, 10, 11, 12economic prospects and options 258,
261, 266future prospects 40public expenditure 173f, 173, 174new directions 194trends 175, 176, 177–8, 179
public sector 113trends 104–5, 106f, 118village perspectives of change 150–1,
150t, 160farm model analysis 155, 156–7,157f, 166
see also agricultural intensificationland rights 76–8, 227, 235land scarcity 11, 12, 119
economic prospects and options 258, 261labor productivity 39mechanization demand 245village perspectives of change 145, 151, 160
Limann, Hilla 75f, 177literacy 65, 129, 191, 192Livelihood Empowerment Against Poverty
Program (LEAP) 65livestock 98living standards 25Local Government Law 174, 177, 179
Mahama, John Dramani 59t, 65, 75f, 178Mahindra 250maize
economic prospects and options 260, 261, 264mechanization 254productivity 99, 101, 102public expenditure 193SAP 60seeds 103, 155, 156, 166–7, 167tvalue chain 225, 229, 232village perspectives of change 146, 147,
148, 149, 150, 160farm model analysis 154, 155, 156,161, 163, 165, 165f, 166–7, 168f
yields 150, 150t, 166–7, 167t
Malawicredit 75teconomy 61neo-patrimonial developmental state 58political instability 50public management 70, 71t
Malaysia 78mangoes 260manufacturing sector
Africa 1GDP share 2f
economic prospects and options 257,258, 259
economic transformation 6, 39employment 26, 26t, 27f, 27, 28t,29t, 30t, 31
productivity, sources of growth in 33,34, 35t, 36t, 37, 38t, 38–9
structural change 22, 23future prospects 40–4, 45state–business relationships 73urbanization 128, 129twages 53
Maputo Declaration 111, 112, 179,180, 194
market access 139, 232marketing
economic prospects and options 263value chains 225, 226, 235, 266cocoa 213–14, 230–1, 233pineapples 216–17, 231rice 218tomatoes 220, 231
Market-Oriented Agricultural Project(MOAP) 232, 267
Marshall plan for agriculture 270Masara N’zarki 225Mauritius 6, 20t, 55, 57, 82MDBS 64mechanization 11–12, 13–14, 104t,
241–54demand 243–8economic prospects and options 258, 265–6public expenditure 193, 194SAP 60supply 248–52trends 242–3, 243turbanization 115, 135t, 135–6, 137t, 138t,
138–9, 140
OUP CORRECTED PROOF – FINAL, 30/7/2019, SPi
284

value chains 223–4rice 219
village perspectives of change 148, 148t,150, 150t, 152
farm model analysis 158, 165see also AMSECs; technology; tractors
Mexico 75tMillennium Challenge Corporation 76Millennium Development Goals
(MDGs) 19, 64–5millet 101, 146Mills, John Evans Atta 50, 59t, 65, 75f, 178mineral exports 5, 259mining sector
employment 26, 26t, 28t, 29t, 30t, 31future prospects 39–40, 45joint ventures 62productivity, sources of growth in 35t, 36t,
38t, 38SAP 60
Ministry of Agriculture 60, 180n,226, 249
Ministry of Education, Sports, andScience 180n
Ministry of Finance and EconomicPlanning 180n
Ministry of Fisheries (MoF) 180n, 181tMinistry of Food and Agriculture
(MoFA) 180nbudget 113devolution 268public expenditure on agriculture 180,
181t, 181, 193, 195Ministry of Local Government and Rural
Development 180nMinistry of Manpower Development and
Employment 180nMinistry of Private Sector Development
(MPSD) 74Ministry of Public Sector Reform 69Ministry of Roads and Transport 180nMinistry of Trade and Industry 76, 180nMinistry of Women and Children’s
Affairs 180nmortality rates 129Mozambique 71t, 75tMultilateral Debt Relief Initiative 64multinational corporations 73Mutharika, Bingu wa 58
National Agricultural Investment Strategy(NAIS) 270
National Democratic Congress (NDC) 50,59t, 64, 81
agricultural sector 76credit 75felections1992 632016 67
fiscal management 67HIPC 66political budget cycle 67public expenditure on agriculture 177, 178social welfare schemes 65state–business relationships 73, 74
National Fertilizer Subsidy Program 193National Food Buffer Stock Company
(NAFCO) 112, 193, 194, 195National Health Insurance Scheme 65National Liberation Council 59t, 175National Redemption Council 59t, 176National Seed Council 222, 264neo-patrimonialism 52, 57–8New Alliance for Food Security and
Nutrition 211, 235, 262New Patriotic Party (NPP) 50, 59t, 64, 81
agricultural sector 76, 78, 79elections1992 632016 67
political budget cycle 67public expenditure on agriculture 178social welfare schemes 65state–business relationships 72, 73–4, 76VAT 66
Nigeria 70, 71t, 75tNkrumah, Kwame 58, 59t, 75f, 174, 175Northern Rural Growth Project
(NRGP) 232, 267
Obeng, P. V. 62oil
aggregate productivity growth 24future prospects 39–40, 44, 45, 258, 259productivity, sources of growth in 38
oil palm 78–9, 112“one district one factory” program 68,
270, 271“one village one dam” program 270, 271
OUP CORRECTED PROOF – FINAL, 30/7/2019, SPi
285

onions 193Operation Feed Your Factories 211Operation Feed Your Industries 176Operation Feed Yourself 59, 176, 211, 270Optimizing Fertilizer Recommendations in
Africa (OFRA) 265
palm oil 78–9, 112patrimonialism 52People’s National Party 177per capita incomes (PCI) 5, 62
aggregate productivity growth 23–4,24f, 25t
agricultural sector 110economic prospects and options 257economic transformation 6, 7, 20–1,
20t, 31future prospects 39rice value chain 217rural 108–9, 109tsources of growth 31urbanization 128–9
personal services sector 44employment 28t, 29t, 30t, 31productivity, sources of growth in 35t, 36,
36t, 37, 38tpesticides 104t
public expenditure 193value chains 222cocoa 215
village perspectives of change 165see also insecticides
pineapplesexports 79–80, 112, 212, 215–17, 225, 229,
231, 233, 234, 260political transformation 79–80public sector 112value chain 13, 212, 215–17, 233–4agro-processing 226, 227chemical inputs 223credit 224mechanization 224organizing farmers into groups225, 226
quality control 228, 228t, 229support 231, 232
plantains 98, 101, 102Planting for Food and Jobs (PFJ)
program 68, 270
policy environment 8agricultural transformation 9–10, 110–13decentralization 269democracy 66economic prospects and options 262–3economic transformation 45–6, 62future prospects 39, 40political transformation 49, 51, 81–2value chains 221–33
political budget cycle 53, 66–7political instability/stability 50, 58–9,
81, 272political participation (IIAG) 70f, 70political regimes 52
timeline 59tpolitical stability/instability 50, 58–9,
81, 272political transformation 8–9, 49–82
democracy 53–4, 63–8developmental states 54–5neo-patrimonial 57–8
economic fundamentals, investmentin 58–63
implications for agriculturaltransformation 76–81
limitations 68–72state–business relationships 55–8, 72–6
population growth 245port facilities 217, 228, 263poverty 19
political transformation 64, 65, 73, 74rural 109urbanization 129–31, 130t, 140
Poverty Reduction Strategy (PRS) 64, 74Presidential Delivery Unit Model 69President’s Special Initiatives (PSIs) 74,
76, 78–9, 80, 81, 178, 180npublic expenditure on agriculture 181t
Private Enterprise Foundation (PEF) 73private sector
Africa 272, 273business environment (IIAG) 70f, 70democracy 64economic prospects and options 262economic transformation 23, 41first mover strategies 269mechanization 248, 249, 250, 251–2,
253–4, 253tplanting for food and jobs program 271
OUP CORRECTED PROOF – FINAL, 30/7/2019, SPi
286

value chains 211, 234–5agro-processing 226, 227chemical inputs 222, 223cocoa 230mechanization 224organizing farmers into groups 225pineapples 231policies 221rice 218
see also public–private partnerships;state–business relationships
privatization 174cocoa value chain 230economic transformation 23political transformation 60, 73SAP 41tomato factories 220
Produce Buying Company 174Producer Price Review Committee 213productivity
aggregate growth 23–5see also labor productivity; land
productivity; total factor productivityProgress Party 59t, 175Provisional National Defense Council
(PNDC) 59t, 59, 61–2, 63credit 75fpublic expenditure on agriculture 177repression 66state–business relationships 72
public expenditureagricultural sector see agricultural sector:
public expenditureby sector 64, 65f
Public Financial Management ReformProgram (PUF-MARP) 69
public management (IIAG) 70f,70–2, 71t
public–private partnershipsagricultural transformation 12future prospects 40value chains 221see also state–business relationships
public sectorAfrica 272–3agricultural policy 110–13agricultural transformation 9–15economic prospects and options 262–3,
265–6
economic transformation 6, 8, 45–6manufacturing 41structural change 22–3
expenditure see public expenditurefirst mover strategies 269mechanization 241, 248–51, 253–4, 253trecent developments 269–71resources, politics, and practicalities 267–9value chains 211–12, 233–5cocoa 213–15pineapples 215–16policies 221–33tomatoes 220
see also political transformationPublic Sector Reinvention and
Modernization Strategy (PUSER-MOS) 69
Public Services Commission 69public transportation 139
quality controlpublic sector 112value chains 227–9, 232cocoa 213, 214, 230, 233pineapples 217rice 218, 234tomatoes 220, 234
Quality Control Company (QCC) 214, 231
rainfall patterns 147, 149, 152, 160Rawlings, Jerry John 51, 59t, 59, 61–3
credit 75feconomic transformation 6, 8elections1992 631996 67
HIPC 66political transformation 82public expenditure on agriculture 177repression 66state–business relationships 72, 73,
74, 76regional factors
agricultural production 99–102agricultural transformation 9farm size 105–7, 106tfirst mover strategies 269mechanization 242–3, 245–7, 251public expenditure on agriculture 181–2
OUP CORRECTED PROOF – FINAL, 30/7/2019, SPi
287

research and development (R&D) 272economic prospects and options 263–4mechanization 251, 254public expenditure 183, 193, 195public sector 112, 119recent developments 271value chains 235pineapples 216
riceAsia’s green revolution 210, 269economic prospects and options 260imports 98, 112, 218, 219, 227–8, 234intensification 114productivity 99, 101–2public expenditure 193SAP 60value chain 13, 212, 217–19, 233, 234agro-processing 226mechanization 224organizing farmers into groups 226quality control 227–8, 228t, 229support 231–3taxation 229
village perspectives of change 146, 147, 150yields 150
roads 272democracy 64economic prospects and options 263political transformation 64, 67, 80public expenditure 67, 112, 182, 191,
192, 195value chains 228–9pineapples 234
village perspectives of change 144rural areas
livelihoods, incomes, and poverty 108–9,108t, 109t
political transformation 61population 10, 104, 109, 113–15, 114t,
122f, 144, 144tRawlings’ vote share (1992) 63spatial typology 122–4map 125fpopulation densities 124, 126t
see also agricultural sector; rural nonfarmeconomy
rural nonfarm economy 10, 108–9, 108teconomic prospects and options 261employment 26, 126
mechanization 246urbanization 115, 118, 122, 133,
139–40employment 126regional factors 124welfare outcomes 131
village perspectives of change 151t, 151wages 104
Rwanda 50, 57–8, 70, 71tRwandan Patriotic Front (RPF) 57–8
savannah agroecological zone 11, 99agricultural intensification 115, 117ffarm size 105, 106t, 107food crops 101–2, 102tland base 114map 101fmechanization 246, 247, 249technology 103urbanization 123, 140village perspectives of change 142–68narratives 145–52selection of villages 143–4, 143t
Sea-Freight Pineapple Exporters Ghana(SPEG) 216
seeds 103economic prospects and options 262, 263,
264–5planting for food and jobs program 270public expenditure 176, 193public sector 112value chains 222, 232, 235cocoa 214maize 103, 155, 156, 166–7, 167trice 219tomatoes 220–1
village perspectives of change 149, 150,150t, 160
farm model analysis 155, 156,158, 165
Senegal 61, 70, 71t, 75t, 219service sector 5
Africa 1–3employment share 2fGDP share 2f
democracy 53economic prospects and options 257, 258economic transformation 6, 7employment 26, 26t, 27f, 27
OUP CORRECTED PROOF – FINAL, 30/7/2019, SPi
288

productivity, sources of growth in33, 34
structural change 21, 22, 23future prospects 44–5urbanization 121
shea nuts 231Singapore 20, 20t, 54social welfare 53, 64–5, 81soil fertility 11
economic prospects and options 265land rights 77public expenditure 194urbanization 140value chains 223village perspectives of change 146, 147,
149, 151–2, 160, 166see also fertilizers
Soil, Land, and Water ManagementProject 179
sorghum 101, 146, 193South Africa
credit 75tdevelopmental state 55, 82Eurobonds 50public management 70, 71tstate–business coalitions 57
South Korea 20, 20t, 50, 54soybeans 146, 147, 149, 193standards of living 25state–business relationships 55–7, 72–6, 82
Africa 273economic prospects and options 263New Alliance for Feed Security and
Nutrition 235resources, politics, and practicalities 268weak 72–6see also public–private partnerships
state farms 174, 175, 176state-owned enterprises
agro-processing 226economic transformation 22–3, 41political transformation 72urbanization 122
stock exchange 60Structural Adjustment Institutional
Support Project (SAIS) 68–9Structural Adjustment Program (SAP) 3, 6,
19, 20, 21, 22, 45, 272aggregate productivity growth 24
agricultural sector 110democracy 63developmental state 8economic prospects and options 257employment 26long-term effects 67manufacturing sector 41, 42political transformation 51, 59–61productivity, source of growth in 32public expenditure on agriculture 177state–business relationships 72state-owned enterprises 23technocracy 62
structural changeAfrica 3economic prospects and options 257, 259economic transformation 7, 8, 21–3, 31–2,
33, 39, 45productivity, sources of growth in 36,36t, 37
future prospects 39political regime 52political transformation 49–50, 51,
72, 81value chains 211
subsidies 67, 112cocoa value chain 215fertilizers see fertilizers: subsidiesfood production 6mechanization 241, 248, 249, 254AMSECs 250
planting for food and jobs program 270public expenditure on agriculture 174, 175,
177, 178, 179, 193, 195Supreme Military Council 176
Taiwan 54, 226Tanzania 62, 70, 71t, 75ttariffs
tractors 251value chains 228, 229rice 232, 234tomatoes 231
taxation 110political transformation 62, 66, 71n, 74value chains 229–30agro-processing 227cassava 80cocoa 194, 213
OUP CORRECTED PROOF – FINAL, 30/7/2019, SPi
289

taxation (cont.)pineapples 234tomatoes 231
VAT 66technocracy 82
developmental states 54neo-patrimonial 57
economic transformation 61, 62technology 102–4
economic prospects and options 260, 261induced innovation theory 114–15, 119planting for food and jobs program 271public expenditure 183public sector 112urbanization 115value chains 235village perspectives of change 155, 165see also mechanization
terms of trade 110Thailand 20t, 210, 218, 219, 226timber sector 60, 73ntobacco 146tomatoes
imports 112, 220, 221public expenditure 193value chain 13, 212, 219–21, 233, 234agro-processing 226, 227credit 224mechanization 224organizing farmers into groups 226quality control 228, 228t, 229support 231, 232
village perspectives of change 146, 167total factor productivity (TFP) 24–5, 25t, 53tractors 13–14, 103, 241, 253–4
demand 244, 247economic prospects and options 265, 266imports 241, 242, 242f, 249–50,
251–2, 254public expenditure 194supply 248, 249–51trends 242–3urbanization 135value chains 224rice 219
village perspectives of change 146, 147,148, 152, 160
farm model analysis 155, 156, 158,159t, 165
trade policy 3, 110, 119, 262trade services sector 39, 44
employment 26, 26t, 28t, 29t, 30t, 31productivity, sources of growth in 35t,36, 36t, 37, 38t
Trade Union Congress (TUC) 61transition agroecological zone 11, 99
farm size 105, 106tfood crops 101–2, 102tland base 114map 101fmechanization 246, 247technology 103urbanization 123, 140village perspectives of change 142–68farm model 152–8, 154t, 156t, 157f,159t, 161–8, 162t
narratives 145–52selection of villages 143–4, 143t
transportation 272economic prospects and options 263public 139public expenditure 64, 65f, 182t, 182public sector 112road see roadsvalue chains 227, 228
transport services sectoremployment 26t, 28t, 29t, 30t, 31productivity, sources of growth in 35t,
36t, 38t, 38Turkey 75t
Uganda 70, 71t, 75tunemployment 5United Kingdom 75tUnited States 64, 75turban areas
political transformation 61population 122, 122fRawlings’ vote share (1992) 63
urbanization 5, 115–18, 121–40Africa 1, 271, 272agricultural transformation 10economic prospects and options 261economic transformation 6employment 26farming practices 133–6farm size distribution 131–3mechanization demand 245, 247–8
OUP CORRECTED PROOF – FINAL, 30/7/2019, SPi
290

modern input adoption 136–9rural employment 124–8service sector 44trends 122–4welfare outcomes 128–31
Uruguay 55USAID 181, 267utilities sector
employment 26, 26t, 28t, 29t, 30t, 31productivity, sources of growth in 35t,
36, 36t, 38t, 38
value-added per workeraggregate growth 23–4, 24fmanufacturing sector 42, 42t
value-added tax (VAT) 66value chains 8–9, 210–35
Africa 273agricultural transformation 10, 12, 13cocoa 213–15economic prospects and options 261, 262,
263, 266–7pineapples 215–17planting for food and jobs program 270policies 221–33public sector 111, 112, 119resources, politics, and practicalities 268, 269rice 217–19tomatoes 219–21
Vietnam 20t, 210, 218, 269Vision 2020 58, 73, 81
wagesagricultural sector 9, 10, 105t, 110civil service 67, 69democracy 53labor productivity 118
manufacturing sector 43mechanization demand 246, 247, 254political budget cycle 66, 67rural nonfarm economy 104urbanization 118village perspectives of change 158, 160, 168
warehouses 228, 229water 65, 144Weberian bureaucracy 52, 55welfare outcomes 128–31wheat 98, 210, 269World Bank
aid disbursements temporarily halted 67Economic Management Capacity Building
Project 69Farmapine Ghana Ltd 225privatization 73SAP 6, 20, 60Structural Adjustment Institutional
Support Project 68–9
yamsproductivity 98, 99, 101, 102value chain 232village perspectives of change 146, 147, 149farm model analysis 154, 161, 163,164, 165, 167, 168f
Zambiacredit 75tdecentralization 5economy 61one-party rule 62policymaking structure 62political instability 50public management 70, 71t
Zenawi, Meles 58
OUP CORRECTED PROOF – FINAL, 30/7/2019, SPi
291