Get to Know the Changing Shopping Habits of Canadians
61
Get to Know the Changing Shopping Habits of Canadians Michele Sexsmith Senior Vice President & Practice Leader Stephanie McIsaac Vice President
-
Upload
khangminh22 -
Category
Documents
-
view
3 -
download
0
Transcript of Get to Know the Changing Shopping Habits of Canadians

©2021 Environics Analytics
Get to Know the Changing Shopping Habits of Canadians
Michele SexsmithSenior Vice President & Practice Leader
Stephanie McIsaacVice President

©2021 Environics Analytics
Today’s Presenters
Michele SexsmithSenior Vice President & Practice LeaderRetail, Real Estate, Gaming and Travel
Stephanie McIsaacVice President
Retail, Real Estate, Gaming and Travel
3

©2021 Environics Analytics4

©2021 Environics Analytics
COVID-19 Behaviours and Norms?
5

©2021 Environics Analytics6
ComprehensiveHigh QualityProprietaryActionable
30,000 Current Variables at Postal Code Level
Data DevelopmentUsed by over 1,000 Canadian Organizations
Advanced Analytics80% in Subscription & Purpose-Built Platform
Target Marketing
Message Targeting
Cross Selling
Site Selection
Omni-Channel
Product Assortment
Media Planning
Segments & Personas
Marketing ActivationThe “Intel Inside” in All Channels
Traditional Media
Online, Mobile and Social
©2021 Environics Analytics
Leveraging Mobile Movement Data to
Understand Changing Consumer Behaviours
7

©2021 Environics Analytics8
Anonymized, permission-based data collected from location-enabled apps on mobile devices• Unique, persistent, anonymous device ID, along with a day,
time and location for each observation
• All observed latitude and longitude coordinates are moved to the nearest 6-digit postal code
• Researchers can “observe” devices within a defined area such as a store, public square or on a roadway for a given date and time range
• The common evening location (CEL) and common daytime location (CDL) are inferred according to where these devices are most frequently observed during the day and at night
What are Mobile Movement Data?

©2021 Environics Analytics9
geofences
100,000Polygons
• Grocery • Drug• Mass
Merchandisers• Category Killers• Malls• Greenspaces• Golf Courses
• Banks• Credit Unions• Auto Dealerships• Coffee Shops• Restaurants (QSR
and Sit Down)• Retailers
New Geofence Library

©2021 Environics Analytics
1. Is the profile of shoppers different from what it was a year ago?
2. Are my trade areas larger or smaller than they used to be?
3. Are my shoppers coming from work or home when they come to my store?
4. What is the effect of my marketing campaign – is my target consumer responding?
5. How are my stores doing compared to my competitor stores?
6. What is the impact of a new competitor that just opened in my market?
7. Which of my stores are located in areas where consumers are out shopping and am I getting my fair share of that activity?
10
Mobile Movement Applications

©2021 Environics Analytics
Out & About – Travel to Commercial Areas
11

©2021 Environics Analytics12
Out and About – Visit Commercial Location % Visit Change: February 2021 vs 2020
Geography: ProvinceSource: Out and About, February 2020/2021, Visited Commercial Location
40% in 2021 58% in 2020 63% in 2019

©2021 Environics Analytics13
Out and About –Visit Commercial Location % Visit
Change: February 2021 vs 2020
Geography: Census Metropolitan Area (CMA) by DASource: Out and About, February 2020/2021, Visited Commercial Location
- 33% in Toronto & Montreal,- 32% in Calgary,- 21% in
Vancouver
Out and About –Visit Commercial Location % Visit
Change: February 2021 vs 2020
Out and About –Visit Commercial Location % Visit
Change: February 2021 vs 2020

©2021 Environics Analytics14
Power Centres are Changing

©2021 Environics Analytics15
Quebec Hardest Hit with 36%
Fewer Visits to Power Centres
Geography: ProvinceSource: MobileScapes, January 2019 – December 2020, Retail Power Centres
Power Centre % Visit Change: 2019 vs 2020

©2021 Environics Analytics16
Power Centres in
Toronto and Montreal
Experienced- 35% in
Visitation
Geography: Census Metropolitan Area (CMA)Source: MobileScapes, January 2019 – December 2020, Retail Power Centres
Power Centre % Visit Change: 2019 vs 2020

©2021 Environics Analytics
Toronto Power Centres saw Visitor Drop from 143M to 88M; Vancouver 37M to 28M (YOY)
17
-70.00
-60.00
-50.00
-40.00
-30.00
-20.00
-10.00
0.00January February March April May June July August September October November December
Visits Distribution
Calgary Montreal Toronto Vancouver
Pandemic declared March 11th
Geography: Census Metropolitan Area (CMA)Source: MobileScapes, January 2019 – December 2020, Retail Power Centres

©2021 Environics Analytics
Total Power Centre Visits in 2020 were 217M Less than in 2019
18
-
10,000,000
20,000,000
30,000,000
40,000,000
50,000,000
60,000,000
70,000,000
January February March April May June July August September October November December
2019 2020
Geography: CanadaSource: MobileScapes, January 2019 – December 2020, Retail Power Centres

©2021 Environics Analytics
Initial Lockdown: -48% Power Centre Visits
19
-3.1
-13.0
-29.8
-47.5
-42.1
-34.9
-31.7
-37.6
-33.6
-30.9
-35.6 -35.5
-50.0
-45.0
-40.0
-35.0
-30.0
-25.0
-20.0
-15.0
-10.0
-5.0
-
-
10,000,000
20,000,000
30,000,000
40,000,000
50,000,000
60,000,000
70,000,000
January February March April May June July August September October November December
2019 2020 % Change
Geography: CanadaSource: MobileScapes, January 2019 – December 2020, Retail Power Centres
©2021 Environics Analytics20
Become Proactive Through Consumer Insight as Shopper Habits Change

©2021 Environics Analytics
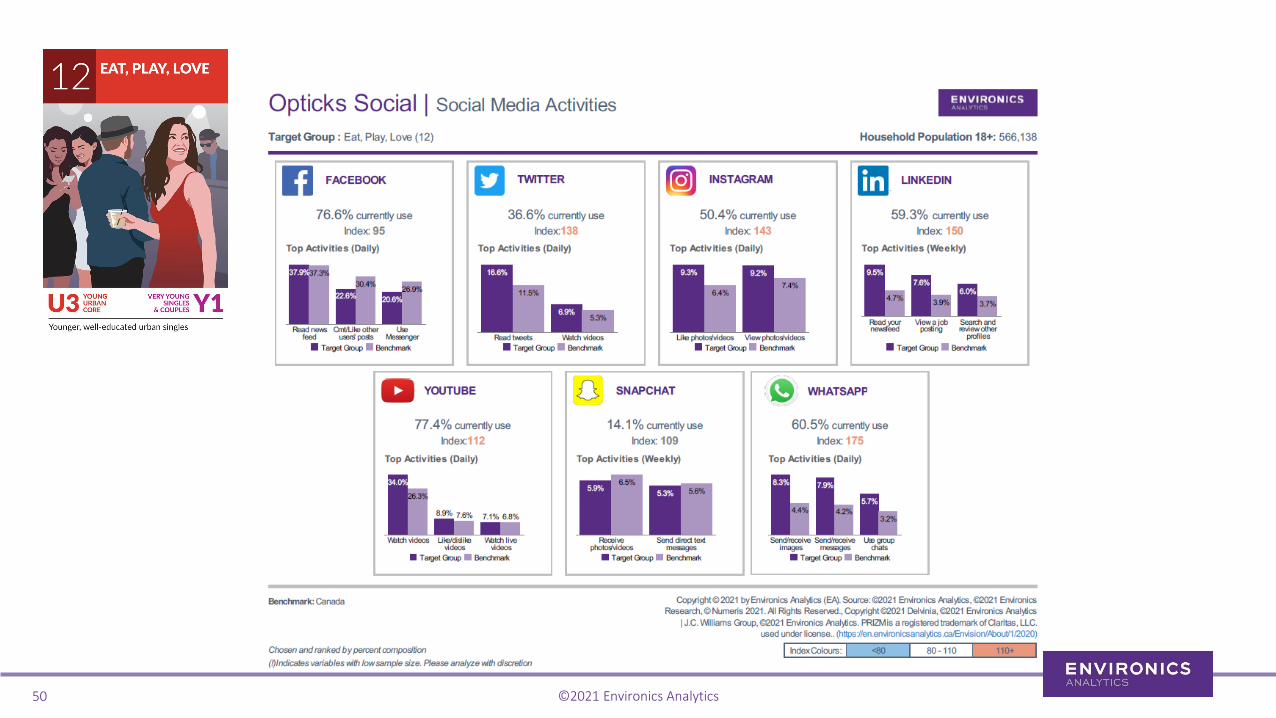
PRIZM Can Help You Understand Shopper Profile Changes
21
Pre-COVID COVIDHow are your
visitors changing over time?

©2021 Environics Analytics22
SG LG Code Name Count % Count % IndexVisitor change
(%)U3 Y1 12 Eat, Play, Love 2,894 19 4,369 24 79 -33.75U4 F3 17 Asian Avenues 1,980 13 2,185 12 108 -9.35F2 F2 10 Asian Achievement 1,584 10 1,456 8 130 8.78F2 Y2 20 New Asian Heights 1,371 9 1,274 7 129 7.59U5 Y1 28 Latte Life 990 7 910 5 130 8.78F3 F2 30 South Asian Society 716 5 670 4 128 6.87F1 F2 03 Asian Sophisticates 646 4 728 4 106 -11.30F3 F1 32 Diverse & Determined 533 4 1,092 6 58 -51.19U3 Y1 47 Social Networkers 466 3 606 3 92 -23.10U1 F1 06 Downtown Verve 376 2 572 3 79 -34.18
15,234 76 18,205 76 100 -16.32
August 2020 August 2019
Top 10 Segments - Total Estimated Visitors
Estimated Visitors
Pinpoint opportunity segments based on your shifting visitor profile.
Home in on key visitor segments to engage with and refine your target audience definition.
Are the Types of Shoppers Coming Back Similar or Different Than the Past?

©2021 Environics Analytics
Food$12,164/household
Personal Care$2,182/household
Clothing$4,883/household
Spending
Enjoy VisitingHistoric Sites
Media ChannelOnline
Favourite AttractionDinner Theatre
Behavioural
Psychographics
Joy of Consumption
Traditional Families
North American Dream
Average Income$99,045
OccupationService Sector
Vis Min PresenceHigh
Demographics
Understand Who They Are by Banner, Location and Target Group for Marketing Communication
23
©2021 Environics Analytics24
Trade Area Sizes Have Also Changed

©2021 Environics Analytics
Understand Change in Trade Area Size
25
Pre-COVID
COVID
…or to evaluate the changing environment
MobileScapes helps you map your visitors during a period of time…

©2021 Environics Analytics
0
10
20
30
40
50
60
70
80
90
100
1 3 5 7 9 11 13 15 17 19 21 23 25 27 29 31 33 35 37 39 41 43 45 47 49 51 53 55 57 59 61
Cum
ulat
ive
% o
f Visi
tors
Distance from the store (minute drive time)
Location B and Location D are both the westernmost locations. They tend to have
visitors travelling from farther to get to these locations as there may be limited options within
the western fringes of the market.
Location C operates in a isolated market and is distinct
from the other locations evaluated and tends to have a
more local and dedicated customer base resulting in a steeper distance decay line.
Location D and Location F, in the densest parts of the network, are the first of the urban locations to achieve 70% of visitors at
17 and 19 km respectively.
Understand Change in Travel Patterns by Store
26
Among this set of stores, three distinct ‘types’ of trade areas can be observed: isolated market, dense urban core and highway influence. Each trade area type has its own characteristics.

©2021 Environics Analytics
Own network for insight on:
Ability to add stores
Impact of relocations
Conversion of store format
Cross-Shop in Own Network or Across Competitors
Competitors for insight on:
Loyalists
At risk consumer segments
Identification of emerging shopper
segments
27

©2021 Environics Analytics
Where is Cross-Shop Greatest?
28

©2021 Environics Analytics
Cross-Shop Patterns
29
Store 3 is most at risk of losing customers to competitors at stores 5 – 8
Banner Store 1 Banner Store 2 Banner Store 3 Competitor Location 4
Competitor Location 5
Competitor Location 6
Competitor Location 7
Competitor Location 8
Banner Store 1 4% 2% 5% 2% 4% 0% 2%
Banner Store 2 1% 0% 2% 1% 0% 0% 1%
Banner Store 3 3% 2% 1% 7% 5% 4% 6%
Competitor Location 4 7% 6% 1% 2% 2% 1% 2%
Competitor Location 5 1% 1% 3% 1% 2% 0% 5%
Competitor Location 6 2% 0% 1% 1% 1% 0% 1%
Competitor Location 7 0% 1% 0% 1% 0% 0% 0%
Competitor Location 8 1% 1% 2% 1% 3% 1% 0%
Total Exclusive Shoppers (only one location)
89% 90% 94% 92% 90% 89% 95% 90%
Total Non-Exclusive Shoppers (cross-shoppers)
11% 10% 6% 8% 10% 11% 5% 10%
Total Shoppers 100% 100% 100% 100% 100% 100% 100% 100%
Competitor Location 4 is stealing share from Banner Store 1 and Banner Store 2
LOCATION C tends to have high cross shop with LOCATION E, LOCATION F AND LOCATION H
Banner Store 3 tends to have high cross shop with Competitor Store
5, Competitor Store 6, AND Competitor Store 7
Source: MobileScapes 2020

©2021 Environics Analytics
Banners can evaluate changing shoppers habits and lifestyle types by time of day and day of week for operational and marketing efficiency
30
Banner Level Analysis

©2021 Environics Analytics31
geofences
100,000Polygons
• Grocery • Drug• Mass
Merchandisers• Category Killers• Malls• Greenspaces• Golf Courses
• Banks• Credit Unions• Auto Dealerships• Coffee Shops• Restaurants (QSR
and Sit Down)• Retailers
Geofence Library

©2021 Environics Analytics
Non-Essential Businesses Experienced Significant Drop In Visits
32
Calgary
Toronto
Essential: In Store Shopping
- 37%
- 37%
Essential: Curbside pick-up
- 23%
- 30%
Non-essential: closed & curbside pick-up (free-standing)
- 69%
- 88%
Geography: Calgary and Toronto Census Metropolitan Area (CMA)Source: MobileScapes, Dec 2019/2020, Walmart, Home Depot, Lululemon
Note: All Walmart and Home Depot locations in CMA were aggregated, as were free-standing Lululemon stores

©2021 Environics Analytics
Weekend vs Weekday Change
33
Calgary20192020
68% 32%71% 29%
Weekday Weekend
68% 32%71% 29%
71% 29%73% 27%
71% 29%74% 26%
69% 31%67% 33%
67% 33%84% 16%
Geography: Calgary and Toronto Census Metropolitan Area (CMA)Source: MobileScapes, Dec 2019/2020, Walmart, Home Depot, Lululemon
Note: All Walmart and Home Depot locations in CMA were aggregated, as were free-standing Lululemon stores
Toronto20192020
Weekday Weekend Weekday Weekend

©2021 Environics Analytics34
Market Potential – Online vs Offline Spend
Know your market potential – offline and online to understand performance to your category

©2021 Environics Analytics35
ClickSpend™ Powered by J.C. Williams Group identifies which products consumers prefer to buy online vs offline.
• Allows comparisons of online market share to your own share in the same product category
• Identifies where to adjust merchandising mix for items that consumers prefer to buy in-store
ClickSpendTM

©2021 Environics Analytics36
• Total expenditure is broken into 14 major consumption categories
• Three estimates for each category:• Total expenditure• Online expenditure• Offline expenditure
• All estimates are for the “current year” (2020) and estimated at the postal code level
Online Expenditure by ClickSpendTM Category14 Major Categories

©2021 Environics Analytics
% of Spend That is Online by Category
37
Comparing Contrasting Markets

©2021 Environics Analytics38
See Variation Across Categories Within a City
Footwear
Furniture
Kitchen & Home Appliances
Clothing
Aggregate spend online 2020 – for Toronto

©2021 Environics Analytics39
Local Market Evaluation – Toronto
Two banners, two different impacts

©2021 Environics Analytics
Store Level: Home Depot and IKEA
40
Home Depot IKEA

©2021 Environics Analytics
Total Expenditure Online 2020 On Kitchen, Home
41
Kitchen, Home & Related Accessories
Home Depot
IKEA

©2021 Environics Analytics
2019
2020
IKEA Experienced -88% Change in December
42 Geography: Toronto Census Metropolitan Area (CMA)Source: MobileScapes, Dec 2019/2020, Home Depot, IKEA
Home Depot: StockYardsIKEA: Etobicoke
Total Change
Essential: Curbside pick-up
- 30%
Non-essential: Curbside pick-up
- 88%
71% 29%78% 22%
Weekday Weekend
61% 39%80% 20%
Weekday Weekend
Weekday vs Weekend

©2021 Environics Analytics
Hours of Operation Should Be Considered
43
Morning commute
Late morning
Midday
Evening commute
Evening
Essential: Curbside pick-up
07% 07%
27% 24%
23% 24%
25% 22%
15% 21%
3% 18%
32% 24%
21% 20%
28% 16%
15% 14%Geography: Toronto Census Metropolitan Area (CMA)Source: MobileScapes, Dec 2019/2020, Home Depot, IKEA
Home Depot: StockYardsIKEA: Etobicoke
2019 2020 2019 2020
Non-essential: Curbside pick-up

©2021 Environics Analytics
20 mins 25 mins
Trade Areas Increased in Size
44 Geography: Toronto Census Metropolitan Area (CMA)Source: MobileScapes, Dec 2019/2020, Home Depot, IKEA
Home Depot: StockYardsIKEA: Etobicoke
2019
2020 29 mins23 mins
Essential: Curbside pick-up Non-essential: Curbside pick-up

©2021 Environics Analytics45
% of Visits to Home Depot in
Dec 2020
% of Visits toIKEA in
Dec 2020
% Online Spend for Kitchen,
Home & Related Accessories
12% 10% 9%
25% 6% 5%
Geography: Toronto Census Metropolitan Area (CMA)Source: MobileScapes, Dec 2020, Home Depot, IKEA
Home Depot: StockYardsIKEA: Etobicoke
How Do You Capture Market Potential? Use Omnichannel Approach

©2021 Environics Analytics46
The Greatest Variance Is At Category Level
$4,797 $4,541Avg Spend/ Household $6,144

©2021 Environics Analytics47

©2021 Environics Analytics48

©2021 Environics Analytics49
©2021 Environics Analytics50

©2021 Environics Analytics51

©2021 Environics Analytics52

©2021 Environics Analytics53
Cross-Shop
How do you use cross-shopping to maximize opportunity?

©2021 Environics Analytics
Hudson’s Bay at CF Sherway and Oshawa Centre
54
CF Sherway Gardens Oshawa Centre

©2021 Environics Analytics55
CF Sherway Gardens (Toronto) Oshawa Centre (Oshawa)
68K visits 37K visits2020
2021 10K visits1K visits-98% -74%
Unsurprisingly, the Extent of Lockdown by Region Impacts Stores Unevenly
Source: MobileScapes, Dec 2019/2020, Hudson’s Bay at Sherway Gardens and Oshawa Centre

©2021 Environics Analytics56
Cross-Shop Implications for Shopper Journey
Source: MobileScapes, Feb 2020/2021, Hudson’s Bay at Sherway Gardens and Oshawa Centre
91% of Hudson’s Bay and also mall
CF Sherway Gardens Only Shoppers
(83%)
Hudson’s Bay Only Shoppers
(11%) 89% of Hudson’s Bay and also mall
CF Sherway Gardens Only Shoppers
(99%)
Hudson’s Bay Only Shoppers
(59%) 41% of Hudson’s
Bay and also mall
Oshawa CentreOnly Shoppers
(86%)
Hudson’s Bay Only Shoppers
(9%)
Oshawa CentreOnly Shoppers
(92%)
Hudson’s Bay Only Shoppers
(15%)
February 2021February 2020
85% of Hudson’s
Bay and also mall

©2021 Environics Analytics57
Relocation
When does relocation help you maximize your revenue?
How can you measure in advance?

©2021 Environics Analytics58
Estimated % of Total Mall Visitor Traffic From Each Location:
Retailer in Mall 1 – Previous Location15,478(15%)
Mall 1 Total105,988
15,478
Retailer in Mall 2 –New Location
8,430(17%)
Mall 2 Total48,897
8,430
Retailer in Mall 2 – New Location 1,724 visitors (or 11%) with same device ID
were also seen in 2020 at new location
Retailer in Mall 1 – Previous Location15,478 total visitors
Transfer from Former to New Location:

©2021 Environics Analytics59
Compare Lifestyle Types by Trade Area
Mall 1 Mall 2
Trade Area Households: 2,475,022 Trade Area Households: 1,561,874
PRIZM SegmentTrade Area Households %
Index vs Toronto
CMAF1 03 Asian Sophisticates 167,604 6.8 189F1 07 Mature & Secure 125,564 5.1 153F2 10 Asian Achievement 186,664 7.5 219F2 20 New Asian Heights 159,285 6.4 197F3 31 Metro Melting Pot 326,174 13.2 112U3 12 Eat, Play, Love 302,505 12.2 189U3 22 Indieville 168,957 6.8 156U4 61 Came From Away 263,201 10.6 113
High Trade Area Segments 1,699,954 68.7
PRIZM SegmentTrade Area Households %
Index vs Toronto
CMAF1 03 Asian Sophisticates 189,220 12.1 339F1 07 Mature & Secure 97,390 6.2 188F2 10 Asian Achievement 187,517 12.0 348F2 20 New Asian Heights 155,391 10.0 304F3 31 Metro Melting Pot 225,078 14.4 123U4 61 Came From Away 170,078 10.9 115
High Trade Area Segments 1,024,674 65.6

©2021 Environics Analytics60
Evaluate Market Potential Trade-offs
Average $/ Hhd in Trade Area
Mall 1 Mall 2 Toronto CMABoys (aged 4 to 14): Athletic footwear $30 $26 $31Boys (aged 4 to 14): Clothing $92 $80 $98Girls (aged 4 to 14): Athletic footwear $21 $19 $21Girls (aged 4 to 14): Clothing $119 $106 $123Men (aged 15 and over): Athletic footwear $114 $114 $120Men (aged 15 and over): Clothing $749 $803 $810Women (aged 15 and over): Athletic footwear $100 $102 $103Women (aged 15 and over): Clothing $1,246 $1,278 $1,259
With a few noted exceptions, both trade areas score below the Toronto CMA on average spend per household.
©2021 Environics Analytics61
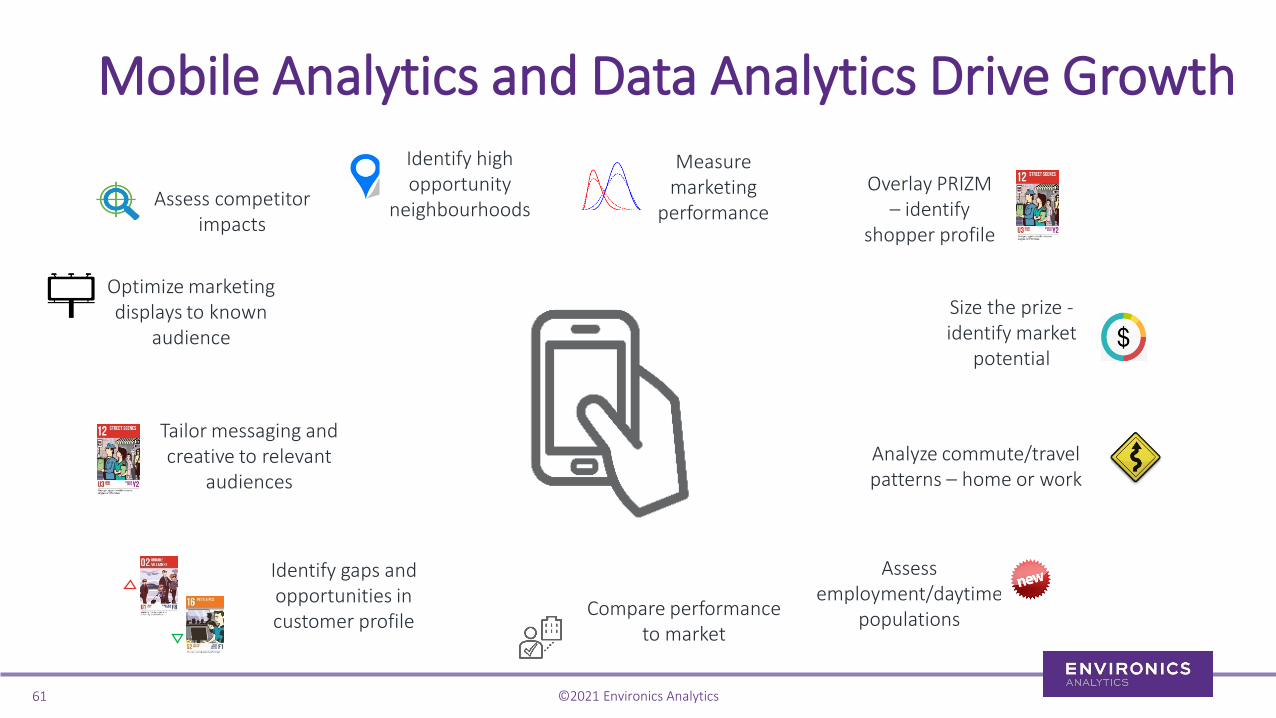
Identify high opportunity
neighbourhoodsOverlay PRIZM
– identify shopper profile
Measure marketing
performance
Identify gaps and opportunities in customer profile
Optimize marketing displays to known
audience
Compare performance to market
Analyze commute/travel patterns – home or work
Assess employment/daytime
populations
Assess competitor impacts
Size the prize -identify market
potential
Tailor messaging and creative to relevant
audiences
Mobile Analytics and Data Analytics Drive Growth

©2021 Environics Analytics
• Navigate changing consumer through unprecedented change
• Evaluate store performance and build market share
• Evaluate real estate decisions: relocations, expansions, competitive impacts
• Evaluate marketing decisions: media preferences by lifestyle to market effectively
CONTACT: [email protected]
Summary and Questions?
62