Get Ready for Chaptet 4 - Hackensack Public Schools
70
Diagnose Readiness You have two options for checking Prerequisite Skills. Get Ready for Chaptet 4 Evaluate 3a2 - 2ab * c for the values given. (Lesson l-5) l. fr=2,b=1,,c:5 2. a:-3,b:-2,c=3 !. a: -\,b :0, c = 11 4. a:5,b=-3,c=-9 5. CAR RENTAT The cost of renting a car is given by 49x + 0.3y. Let x represent the number of days rented, and let y represent the number of miles driven. Find the cost for a five-day rental over 125 miles. Take the Quick Check below. Refer to the Quick Review for help. Evaluate 2(m - nl2 + 3p lor m = 5, tt = 2, and,p - -3. 2(m - n)2 + 3p originalexpression :2(5 - 2)2 + 3(-3) substitute. = 2(3)2 + 3(-3) subtract. :2(9) + 3(-3) Evaluate Power. = 18 + (-9) Multiply. - 9 Add. Solve each equation for the given variable. (Lesson 2-8) 6. x*y:5fory 7. 2x-4:6fotx S. y - 2= x * 3fory 9. 4x - 3y = lzfor x 10. GEOMETRY The formula for the perimeter of a rectangle is P :2w l2l,wherew represents width and I represents length. Solve for zu. Solve 5x * 5x* 5x + 1.5y - 15y-9forx. 15y :9 t1y -9-LSy 5x:9 - 15y 5x 9-75y Odginalequation Subtract l5y fiom each side. Simplify. Divide each side by 5. Simplify. 55 o x:i-3tt Write the ordered (Lesson t -e) tt. A 12. B tr. c t4. D r5. E r6. F pair for each point. Write the ordered pair for A. Step I Begin at point A. Step 2 Follow along a vertical line to the x-axis. The x-coordinate is -4. Step 3 Follow along a horizontal line to the y-axis. The y-coordinate is 2. The ordered pair for point A is (-4,2). t,mgl,r,,*"i:t* Thke a self-check Chapter Readiness Quiz atqlencoe.com. E Chapter 4 Get Ready for Chapter 4 211
-
Upload
khangminh22 -
Category
Documents
-
view
3 -
download
0
Transcript of Get Ready for Chaptet 4 - Hackensack Public Schools
Diagnose Readiness You have two options for checking Prerequisite Skills.
Get Ready for Chaptet 4
Evaluate 3a2 - 2ab * c for the valuesgiven. (Lesson l-5)
l. fr=2,b=1,,c:52. a:-3,b:-2,c=3!. a: -\,b :0, c = 11
4. a:5,b=-3,c=-95. CAR RENTAT The cost of renting a car is
given by 49x + 0.3y. Let x represent thenumber of days rented, and let y representthe number of miles driven. Find the costfor a five-day rental over 125 miles.
Take the Quick Check below. Refer to the Quick Review for help.
Evaluate 2(m - nl2 + 3p lor m = 5, tt = 2,
and,p - -3.2(m - n)2 + 3p originalexpression
:2(5 - 2)2 + 3(-3) substitute.
= 2(3)2 + 3(-3) subtract.
:2(9) + 3(-3) Evaluate Power.
= 18 + (-9) Multiply.
- 9 Add.
Solve each equation for the given variable.(Lesson 2-8)
6. x*y:5fory 7. 2x-4:6fotxS. y - 2= x * 3fory 9. 4x - 3y = lzfor x
10. GEOMETRY The formula for the perimeterof a rectangle is P :2w l2l,wherewrepresents width and I represents length.Solve for zu.
Solve 5x *5x*
5x + 1.5y -
15y-9forx.15y :9t1y -9-LSy5x:9 - 15y
5x 9-75y
Odginalequation
Subtract l5y fiomeach side.
Simplify.
Divide each side by 5.
Simplify.
55ox:i-3tt
Write the ordered(Lesson t -e)
tt. A12. B
tr. ct4. D
r5. E
r6. F
pair for each point.
Write the ordered pair for A.
Step I Begin at point A.
Step 2 Follow along avertical line tothe x-axis. Thex-coordinate is -4.
Step 3 Follow along ahorizontal line tothe y-axis. The y-coordinate is 2.
The ordered pair for point A is (-4,2).
t,mgl,r,,*"i:t* Thke a self-check Chapter Readiness Quiz atqlencoe.com.
E
Chapter 4 Get Ready for Chapter 4 211
Get Started on Chapt er 4You will learn several new concepts, skills, and vocabulary terms as you studyChapter 4. To get ready, identify important terms and organize your resources.You may wish to refer to Chapter 0 to review prerequisite skitls.
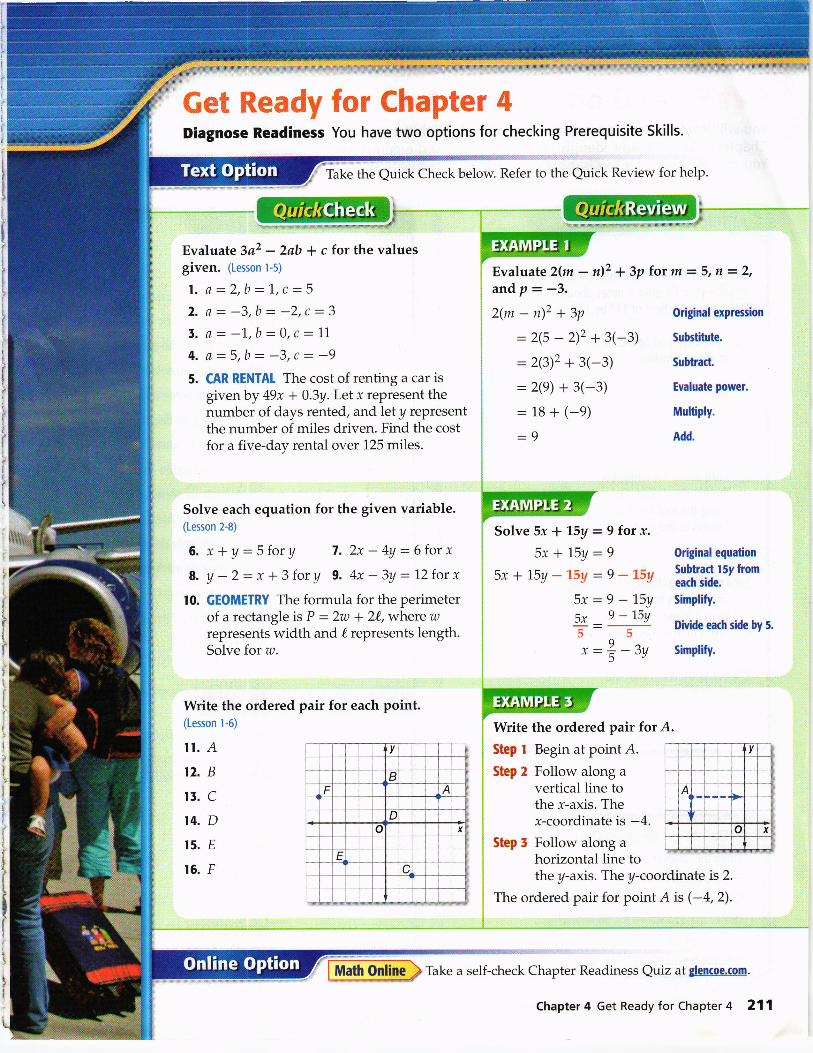
linear Funttions Make this Foldable to help you
organize your Chapter 4 notes about linear functions.Begin with one sheet of I l" by 17" papet.
Fold each end of the paper
in about 2 inches.
Fold along the width and
the lengh. Unfold. Cut
along the fold line fromthe top to the center.
Fold the top flaps down.
Then fold in half and turn toform a folder. Staple the flaps
down to form pockets,
Label the front with the
chapter title.
English
slope-intercept
form
linear extrapolation
point-slope form
parallel lines
perpendicular lines
scatter plot
line of fit
linear interpolation
best-fit line
linear regression
correlation coefficient
median-fit line
step function
piecewise function
greatest integer
function
Espaftol
formapendiente-intersecci6n
extrapolaci6n lineal
forma punto-pendiente
rectas paralelas
rectas perpendiculares
griifica de dispersi6n
recta de ajuste
interpolaci6n lineal
recta de ajuste 6ptimo
retroceso lineal
coeficiente de correlacidn
linea de mediana-ataque
funci6n etapa
funci6n a intervalos
funci6n del
mdximo entero
. p.214 .
. p.226.
. p.231 .
. p.237 .
. p.238.
. p.245 .
. p.246 .
.p.247.
. p.253 .
. p.255.
. p.253 .
.p.255o
. p.261 .
. p.261 .
. p.261.
coefficient . p.26. coeficiente the numerical factor of a term
function . p. 45 . funcidn a relation in which each element
of the domain is paired with exactly one element of theranSe
-JI
0
1
4
>2IQ
>5>-6t7
ratio. p. lll . razon a comparison of two numbers
by division
. Study the chapter online
. Explore Math in Motion
. Get extra help from your own Personal futor
. Use Extra Examples for additional help
' Take a Self-Chetk Quiz. Review Vocabulary in fun ways
212 Chapter 4 Linear Functions and Relations
Objective
Use a graphing calculator
to collect data and
investigate slope-intercept
form.
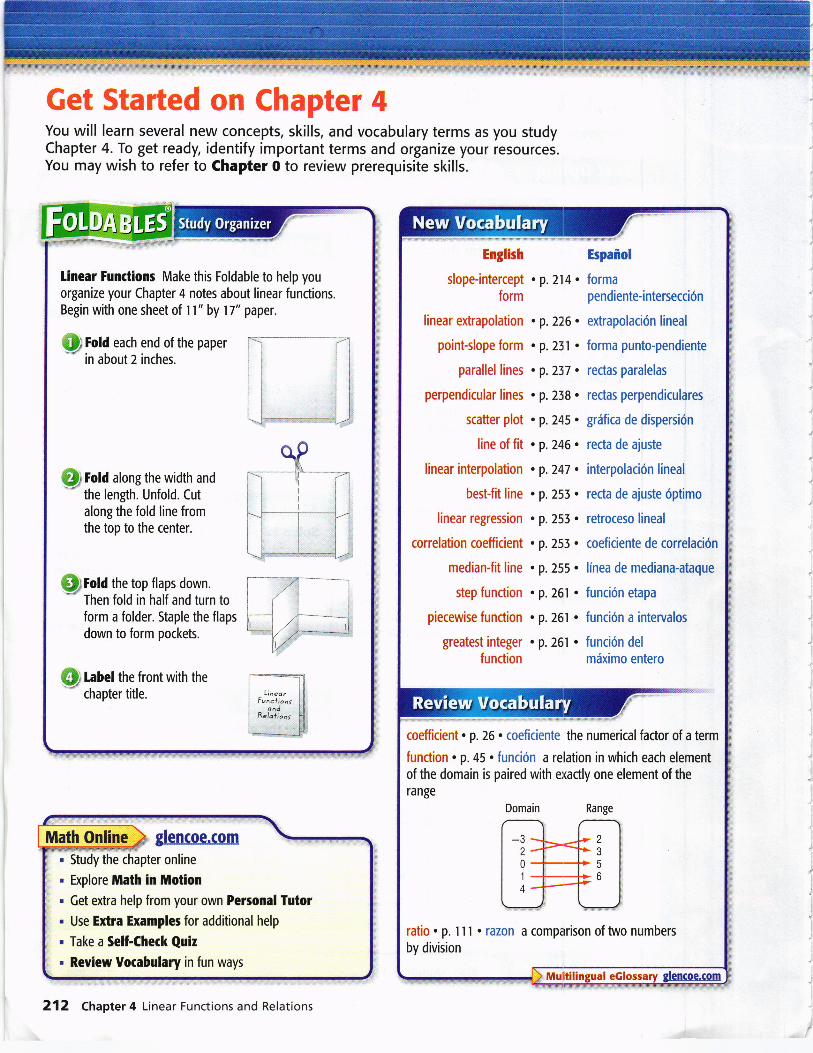
Set Up the Lab
. Cut a small hole in a top corner of aplastic sandwich bag. Hang the bagfrom the end of the force sensor.
o Connect the force sensor to yourdata collection device.
Step I Use the sensor to collect the weight with 0 washers in the bag. Recorddata pair in the calculator.
Step 2 Place one washer in the plastic bag. Wait for the bag to stop swinging,measure and record the weight.
the
then
Step 5 Repeat the experiment, adding different numbers of washers to the bag.Each time, record the number of washers and the weight.
l.
2.
5.
4.
7.
8.
Analyze the Results
The domain contains values of the independent variable, number of washers.The range contains values of the dependent variable, weight. Use the graphingcalculator to create a scatter plot using the ordered pairs (washers, weight).
Write a sentence that describes the points on the graph.
Describe the position of the point on the graph that represents the trial with nowashers in the bag.
The rate of change can be found by using the formula for slope.
rlse change in weight.r" - ah*,g"1. "r-b"t"f *rtt**
Find the rate of change in the weight as more washers are added.
5. Explain how the rate of change is shown on the graph.
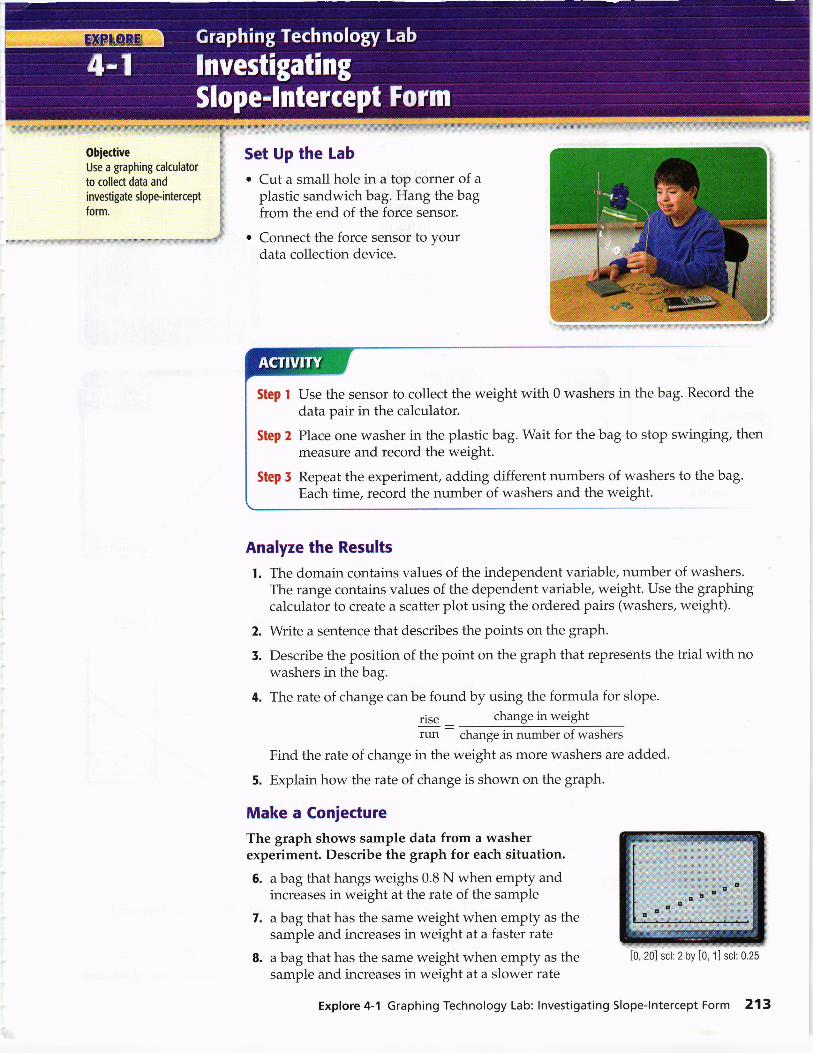
Make a Conjecture
The graph shows sample data from a washerexperiment. Describe the graph for each situation.
6. abag that hangs weighs 0.8 N when empty andincreases in weight at the rate of the sample
a bag that has the same weight when empty as thesample and increases in weight at a faster rate
a bag that has the same weight when empty as thesample and increases in weight at a slower rate
[0, 20] scl: 2 by [0, 1] scl: 0.25
Explore 4-1 Graphing Technology Lab: lnvestigating Slope-lntercept Form 213
TfuDYou found rates of change
and slopes. (Lesson l-s)
r Write and graph linear
equations in slope-
intercept form.. Model real-world data
with equations in slope-
intercept form.
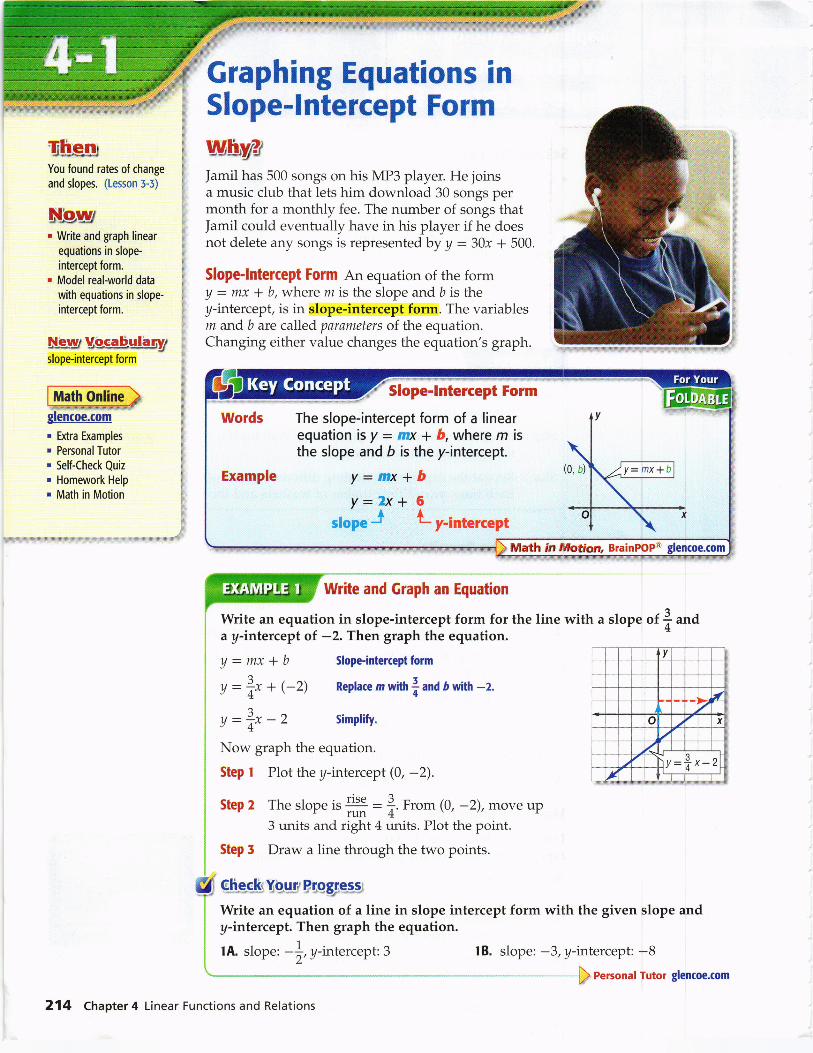
Graphing Equations inSlope-lntercept Formwlll,vpJamil has 500 songs on his MP3 player. He joinsa music club that lets him download 30 songs permonth for a monthly fee. The number of songs thatJamil could eventually have in his player if he doesnot delete any songs is represented by a : 30x + 500.
Slope-lntercept Form An equation of the formA = mx + b, where m is the slope and b is they-intercept, is in slope-intercept form. The variablesm and b are called parameters of the equation.Changing either value changes the equation's graph.
Write and Graph an Equation
Write an equation in slope-intercept form for the line with a slope of f, anda y-intercept ol -2. Then graph the equation.
U = mx + b Slope-interceptform
y =fu + e2) Reptacemwithf,andDwith -2.
y=?-2 Simplify.
Now graph the equation.
Step I Plot the y-intercept (0, -2).
Step z The slope is run :
f;. f.o* (0, -z),move up3 units and right 4 units. Plot the point.
Step 5 Draw a line through the two points.
G-[esjkYQlrry gwgSep-*
Write an equation of a line in slope intercept form with the given slope andy-intercept. Then graph the equation.
NewrUocabulhnrslope-intercept form
Math Online
glencoe.com
. Extra Examples, Personal Tutor. Self-Check Quiz. Homework Help. Math in Motion
IA. slope: -!, U-intercept: 3 lB. slope: -3,y-intercept: -8p eersonal Tutor glencoe.com
The slope-intercept form of a linearequation is y : mx I b, where m isthe slope and b is the y-intercept.
y-mx+by=Zx+ 6
slope J L y-intercept
214 Chapter 4 Linear Functions and Relations
I Dependent Variables
I y is the dependent
i variable because it
i depends on changes
i inx.
,,r Counting and
I Direction When
I counting rise and run,
1 a negative sign may
I be associated with the
r value in the numerator
, or denominator. lf with
: the numerator, begin
, by counting down fori the rise. lf with the
I denominator, count
. left when counting the
: run. The resulting line
: will be the same.
When an equation is not written in slope-intercept form, it may be easier to rewriteit before graphing.
Linear Equations
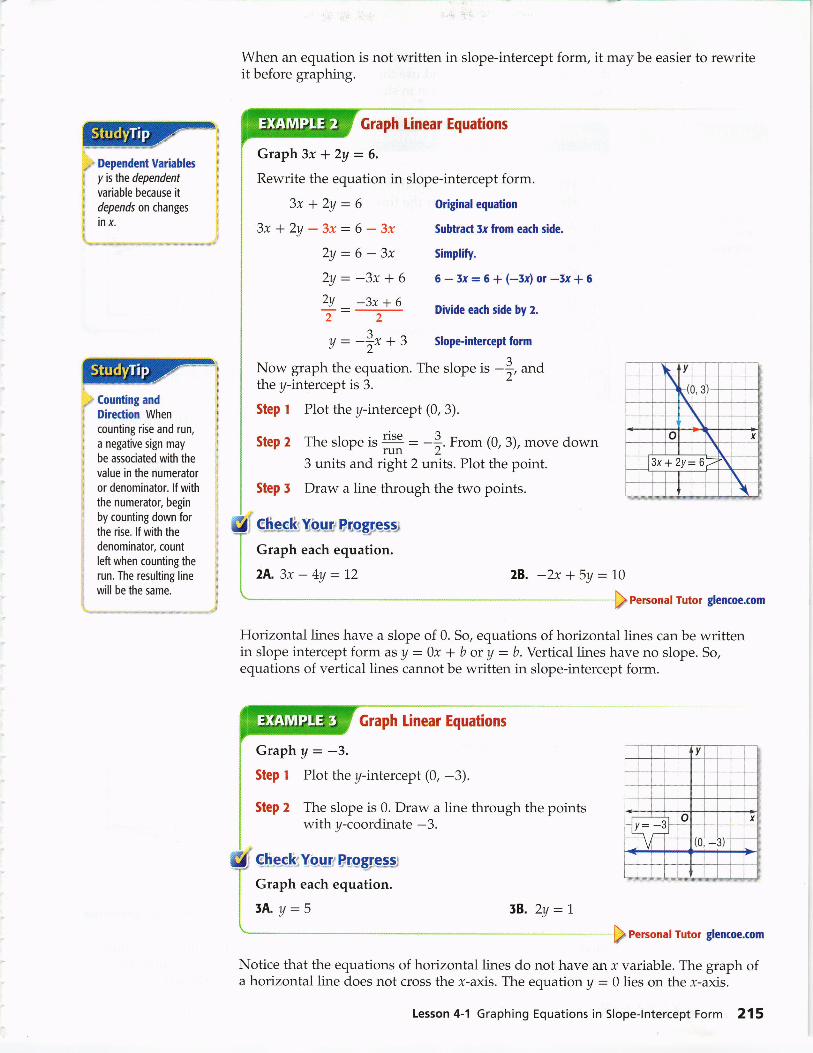
Graph 3x * 2y :6.Rewrite the equation in slope-intercept form.
3x+2Y:$3x+2y-3x=6-3x
2y:6-3x2Y:-3x+64 _-3x+e22y=_7+3
Now graph the equation. The slope is -]i, andthe y-intercept is 3.
Step t Plot the y-intercept (0, 3).
Step 2 The slope is run : -*.From (0,3), move down
3 units and right 2 units. PIot the point.
Step 5 Draw a line through the two points.
-c-h-e-e.-li:VoxtrP:t.o*gtess)
Graph each equation.
24. 3x - 4y :12 28. -2x * 5y :19
) Rersonal Tutor glencoe.com
Horizontal lines have a slope of 0. So, equations of horizontal lines can be writtenin slope intercept form as U = 0x -f b or U : b. Vertical lines have no slope. So,equations of vertical lines cannot be written in slope-intercept form.
Graph Linear Equations
Graph A : -3.Step t PIot the y-intercept (0, -3).
Step Z The slope is 0. Draw a line through the pointswith y-coordinate -3.
G_h.-e*kYo_"qrrProgge-s-s
Graph each equation.
3.A.y:$
Original equation
Subtract 5x from each side.
Simplify.
6-lx=6+(-5x)or-Ix+6
Divide each side by z.
Slope-intercept form
lB.2y:tp Rersonal Tutor glencoe.com
Notice that the equations of horizontal lines do not have an x variable. The graph ofa horizontal line does not cross the r-axis. The equation y : 0lies on the r-axis.
Lesson 4-1 Graphing Equations in Slope-lntercept Form 215
There are times when you will need to write an equation when given a graph. To dothis, locate the y-intercept and use the rise and run to find another point on thegraph. Then write the equation in slope-intercept form.
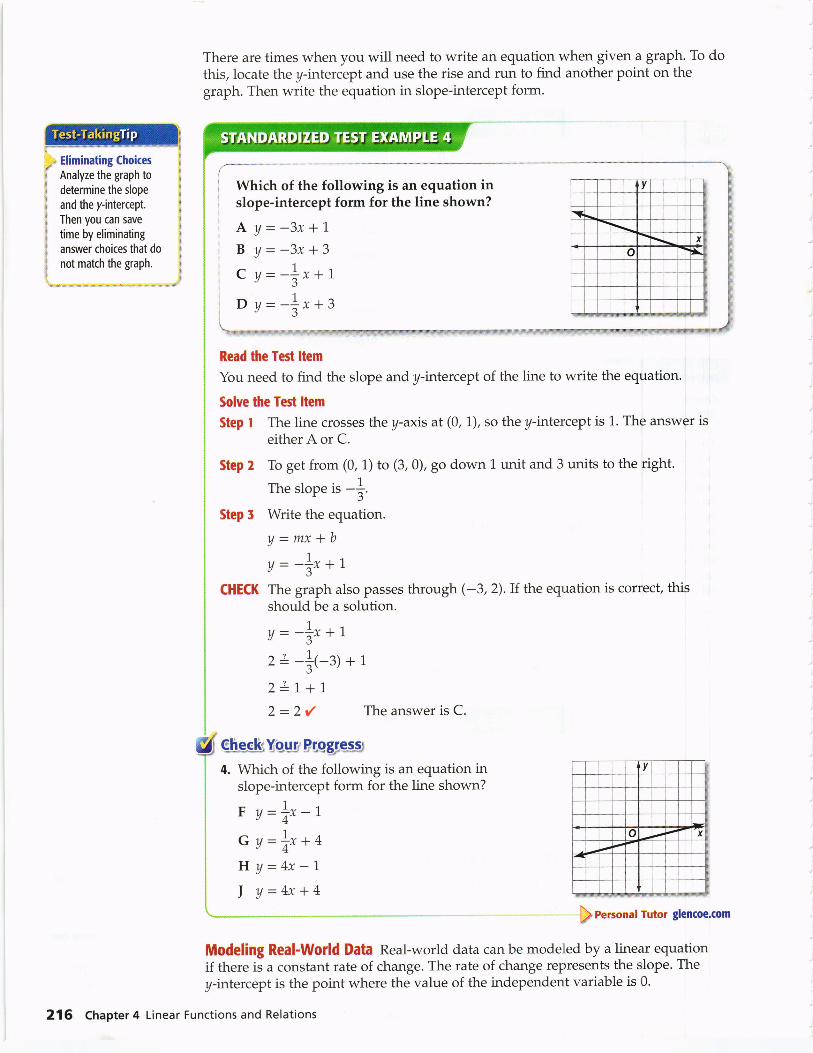
Which of the following is an equation inslope-intercept form for the line shown?
A Y:-3x+1B Y:-3x+3C y=-tx+tD y=-tx+t
Read the Test ltem
You need to find the slope and y-intercept of the line to write the equation.
Solve the Test ltem
Step I The line crosses the y-axis at (0, L), so the y-intercept is L. The answer is
either A or C.
Step Z To get from (0, 1) to (3,0), go down L unit and 3 units to the right.
The slope ts -+Step f Write the equation.
U=mx+by:_!x+1."3
CHECK The graph also passes through (-3,2).If the equation is correct, thisshould be a solution.
a=-!x+72t-+(-3) +1
zL1.+1.2:2 y' The answer is C.
glledsYsur Brogre:x4, Which of the following is an equation in
slope-intercept form for the line shown?
F y:i*-,Gy:L{*nHy--4x-1,I Y=4x+4
p Rersonat Tutor glencoe.com
Modeling Real-World Data Real-world data can be modeled by a linear equationif there is a constant rate of change. The rate of change represents the slope. The
y-intercept is the point where the value of the independent variable is 0.
216 Chapter 4 Linear Functions and Relations
iItit{
!
II
I
x
';a;-. -
*Bea}"Ule!ildEiDk
Write and Graph a Linear Equation
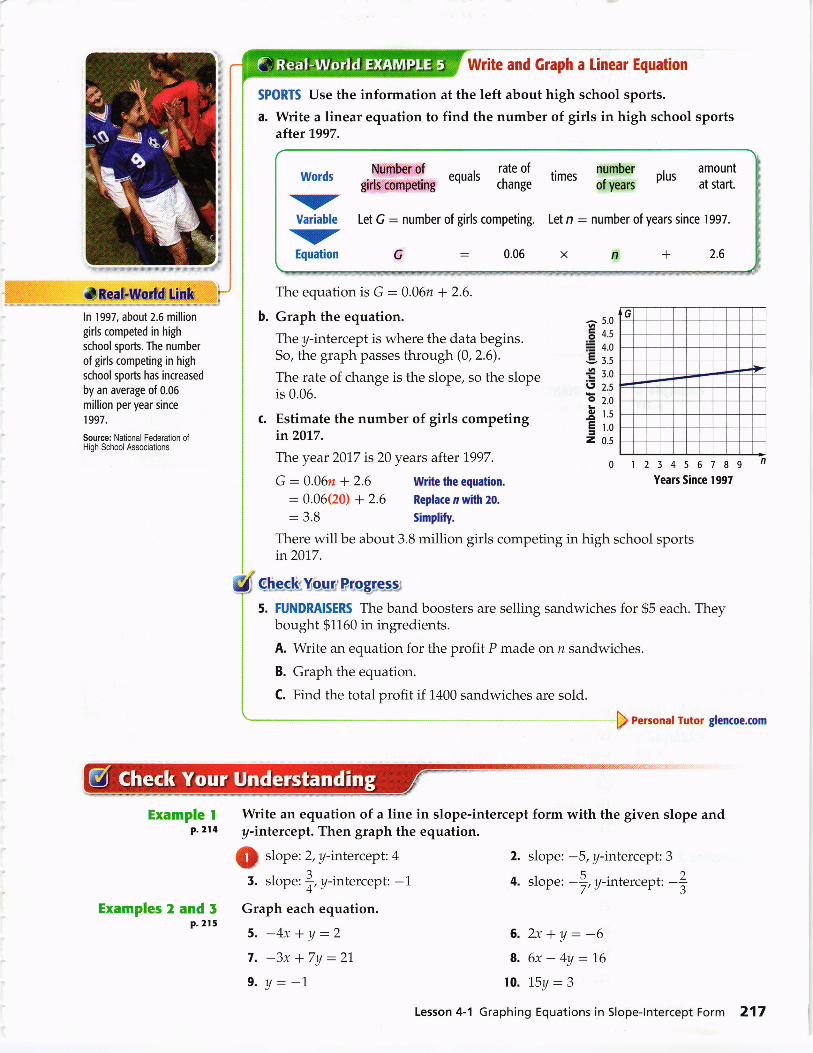
SPORTS Use the information at the left about high school sports.
a. Write a linear equation to find the number of girls in high school sportsalter 1997.
The equation is C = 0.06n + 2.6.
b. Graph the equation.
The y-intercept is where the data begins.So, the graph passes through (0,2.6).
The rate of change is the slope, so the slopeis 0.06.
c. Estimate the number of girls competingin2017.
The year 2017 is20years after 1997. 0 123456789Years Since 1997C :0.06n * 2.6 Write the equation.
: 0.06(20) + 2.6 Replace n with 20.
Simplify.
There will be about 3.8 million girls competing in high school sportsin2017.
thsskY:oxkBw$pe;*5. FUNDRAISERS The band boosters are selling sandwiches for $5 each. They
bought $1160 in ingredients.
A. Write an equation for the profit P made on n sandwiches.
B. Graph the equation.
C. Find the total profit if 1400 sandwiches are sold.
ln 1997, about 2.6 milliongirls competed in high
school sports. The number
of girls competing in high
school sports has increased
by an average of 0.06
million per year since
1997.
Source: National Federation ofHigh School Associations
a 5.0
.E o.t
= rIn
€ r.s
f r.oI 2.5o 2.0
t l.s
E r.oz 0.5
p Rersonal Tutor glencoe.com
Words
-7Variable-vEquation
Number of , rate ofgirk cmpgim change
Let G = number of girls competing.
.. numberItmes - Dtusoi years
amountat start.
0.05G
Let n : number of years since I 997.
xn+2.6
Example Ip.214
Examples 2 and 5p.2r5
Write an equation of a line in slope-intercept form with the given slope andy-intercept. Then graph the equation.
Q slope: 2, y-intercept: 4
5. slope: f;,!/-intercept: -1Graph each equation.
5. -4x*y:27. -3x *7y:219. y: -1
2. slope: -5, y-intercept: 3
4. slope: -], U-intercept: -l
6.2x+y=-68. 6x - 4y:16
10. 15y : J
Lesson 4-1 Graphing Equations in Slope-lntercept Form 217
il.Example 4
p.2I6
Example 5p.217
Example IP.214
Examples 2 and 5p.215
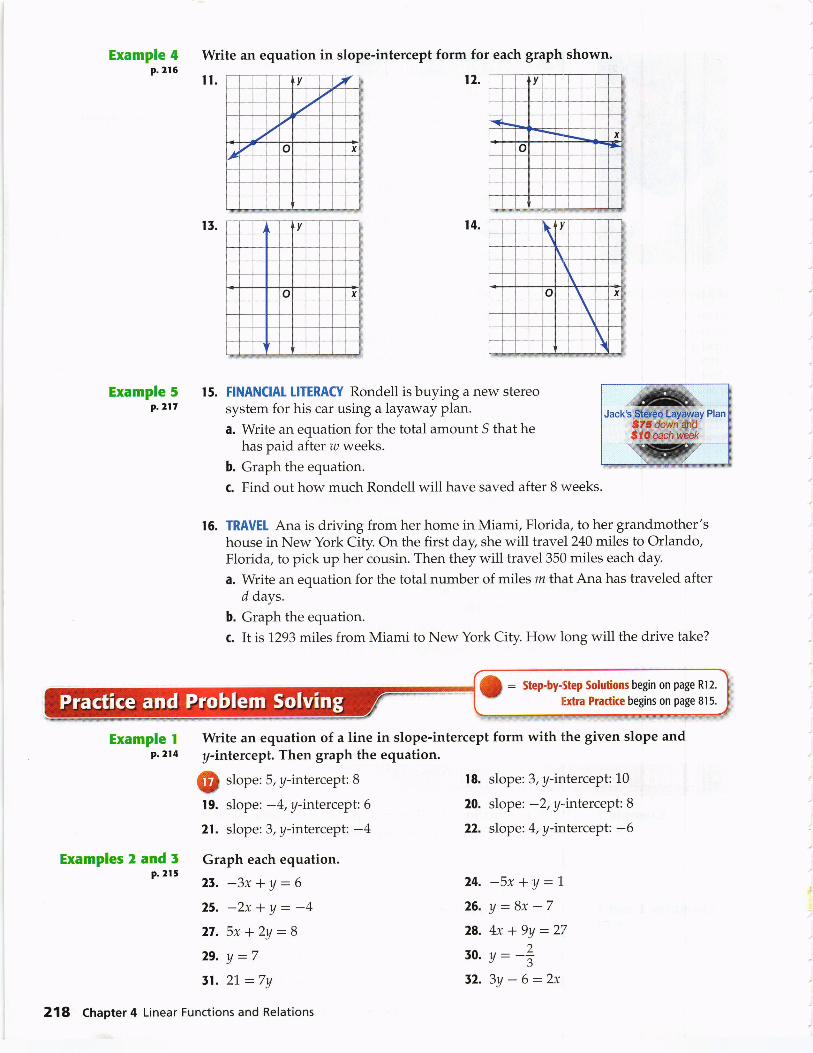
Write an equation in slope-intercept form for each graph shown.
12.
15. FINANCIAL IITERACY Rondell is buying a new stereosystem for his car using a layaway plan.
a. Write an equation for the total amount S that hehas paid after w weeks.
b. Graph the equation.
c. Find out how much Rondell will have saved after 8 weeks.
16. TRAVEL Ana is driving from her home in Miami, Florida, to her grandmother'shouse in New York City. On the first day, she will travel240 miles to Orlando,Florida, to pick up her cousin. Then they will travel350 miles each day.
a. Write an equation for the total number of miles m that Ana has traveled afterd days.
b. Graph the equation.
c. It is 1293 miles from Miami to New York City. How long will the drive take?
Write an equation of a line in slope-intercept form with the given slope andy-intercept. Then graph the equation.
Q slope:5, y-intercept: B
19. slope: -4, y-intercept: 6
21. slope: 3,y-intercept: -4Graph each equation.
2t. -3x t y:625. -2x -l y : -427. 5x *2y:g29. y =751. 21:7y
18. slope: 3, y-intercept: 10
20. slope: -2, y-intercept:8
22. slope: 4, y-intercept: -6
24. -5xty:1.26. y:8x-728. 4x *9y:2710. Y: -Z12. 3y - 6:2x
a = Step-by-Step Solutions begin on paSe Rl2'
Extra Practice begins on Page 815.
214 Chapter 4 Linear Functions and Relations
Example 4p,215
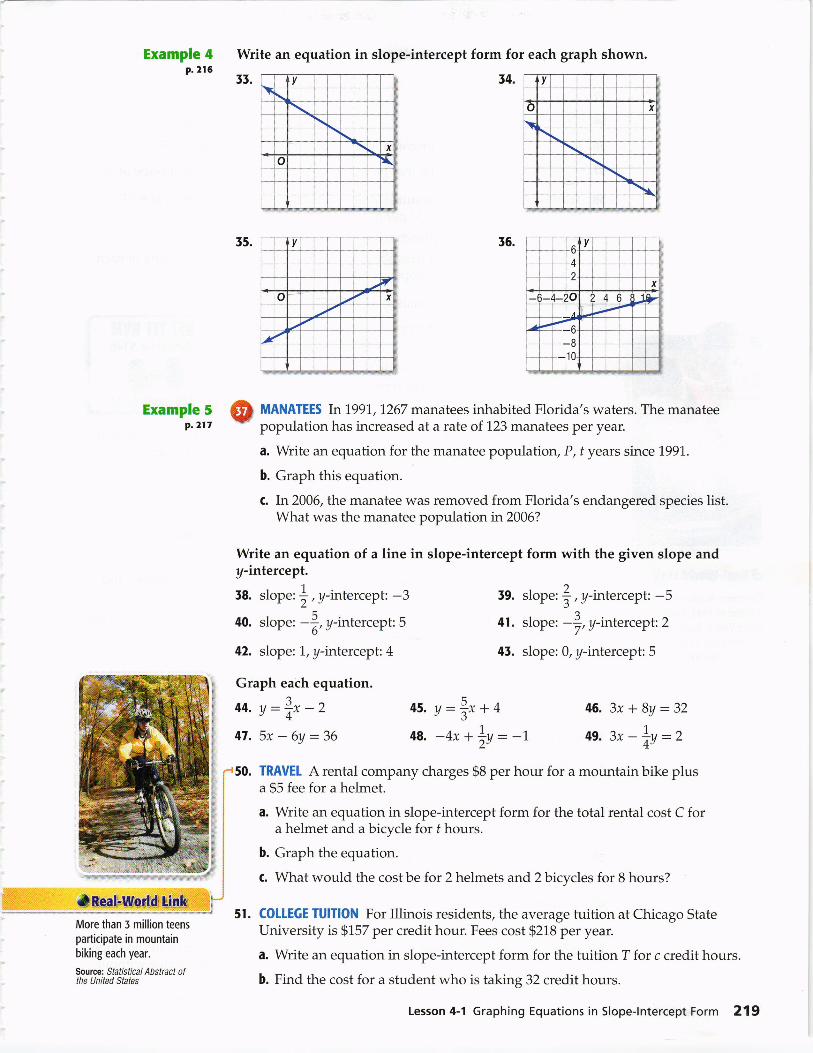
Write an equation in slope-intercept form for each graph shown.
tt.
v
7
U x
{'-t- -
14.
55.
59. slope: I , A-*t"rr"pt: -541. slope: -],A-intercept: 2
45. slope: 0, y-intercept: 5
v:2x+4
-4x-r |a = -t46.3x*8y:32
4e.3x-fu:z
mountain bike plus
More than 3 million teens
participate in mountainbiking each year.
Source: Statistical,4 bstract ofthe United States
Example 5 ([ MANATEES In1997,7267 manatees inhabited Florida's waters. The manateeP-217 population has increased at a rate of 123 manatees per year.
a. Write an equation for the manatee population , P, t years since 1991.
b. Graph this equation.
c. In2006, the manatee was removed from Florida's endangered species list.What was the manatee population in 2006?
Write an equation of a line in slope-intercept form with the given slope andy-intercept.
58. slope: ! , A-intercept: -340. slope: -|, y-intercept:5, 6'"42. slope: L, y-intercept: 4
Graph each equation.a
44. y:={-2 45.
47, 5x - 6y :36 48.
f 50. TRAVEL A rental company charges $8 per hour for a
a $5 fee for a helmet.
a. Write an equation in slope-intercept form for the total rental cost C fora helmet and a bicycle for f hours.
b. Graph the equation.
c. \Mhat would the cost be for 2 helmets and 2 bicycles for 8 hours?
51. COLLEGE TUITION For Illinois residents, the average tuition at Chicago StateUniversity is $157 per credit hour. Fees cost $218 per year.
a. Write an equation in slope-intercept form for the tuition T for c credit hours.
b. Find the cost for a student who is taking 32 credit hours.
*EealF-lffq*lid]ltjtrk
Lesson 4-1 Graphing Equations in Slope-lntercept Form 219
54.
56.
57.
58.
Write an equation of a line in slope-intercept form with the given slope andy-intercept.
52. slope: -1, y-intercept: 0 55. slope: 0.5, y-intercept: 7.5
55. slope: -1.5, y-intercept: -0.25slope: 0, y-intercept: 7
Write an equation of a horizontal line that crosses the y-axis at (0, -5).Write an equation of a line that passes through the origin and has a slope of 3.
TEMPERATURE The temperature dropped rapidly overnight. Starting at 80'F,the temperature dropped 3' per minute.
a. Draw a graph that represents this drop from 0 to 8 rninutes.
b. Write an equation that describes this situation. Describe the meaning of eachvariable as well as the slope and y-intercept.
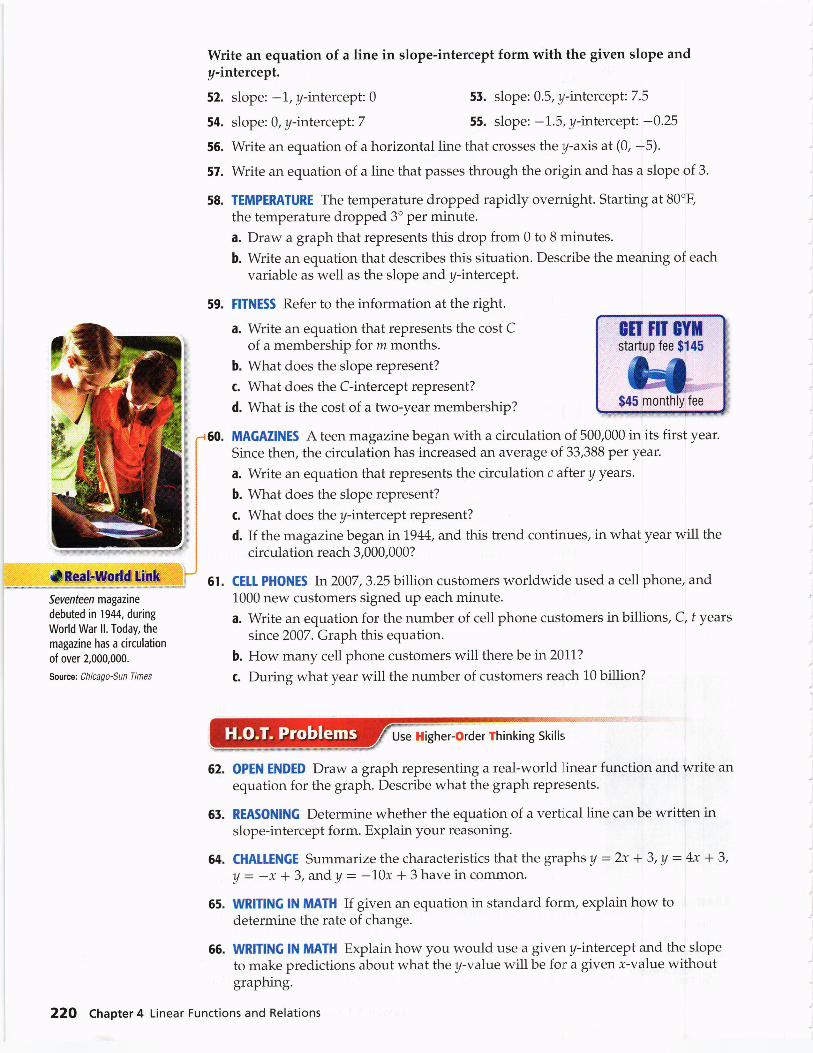
59. FITNESS Refer to the information at the right.
a. Write an equation that represents the cost C
of a membership for z months.
b. What does the slope represent?
c. What does the C-intercept represent?
d. What is the cost of a two-year membership?
Etr ]II 8YTstartup fee $145
*Bealt&*l*B.fuk
60. MAGAZINES A teen magazine began with a circulation of 500,000 in its first year.
Since then, the circulation has increased an average of 33,388 Per year.
a. Write an equation that represents the circulation c after y yearc.
b. What does the slope represent?
c. What does the y-intercept represent?
d. If the magazinebegan in1944, and this trend continues, in what year will thecirculation reach 3,000,000?
rir; 61. CEt! PHoNES In2007,3.25 billion customers worldwide used a cell phone, and1000 new customers signed up each minute.
a. Write an equation for the number of cell phone customers in billions, C, t yearssince 2007. Graph this equation.
b. How many cell phone customers will there be in 2011?
c. During what year will the number of customers reach 10 billion?
Seventeen magazine
debuted in t9++, during
World War ll. Today. the
magazine has a circulation
of over 2,000,000.
Source: Chicago-Sun Times
62. OPEN ENDED Draw a graph representing a real-world linear function and write an
equation for the graph. Describe what the graph represents.
65. REASONING Determine whether the equation of a vertical line can be written inslope-intercept form. Explain your reasoning.
64. CHAIIENGE Summarize the characteristics that the graphs U :2x * 3, y : 4x * 3,
A : -x * 3, and A : -10x * 3 have in common.
65. WRITING lN MATH If given an equation in standard form, explain how todetermine the rate of change.
66. WRITING lN MATH Explain how you would use a given y-intercept and the slopeto make predictions about what the y-value will be for a given r-value withoutgraphing.
22O Chapter 4 Linear Functions and Relations
67. A music store has x CDs in stock. If 350are sold and 3y are added to stock, whichexpression represents the number of CDsin stock?
69. A recipe for fruit punch calls for 2 ounces oforange juice for every 8 ounces of lemonade.If Jennifer uses 64 ounces of lemonade, whichproportion can she use to find r, the numberof ounces of orange juice needed?
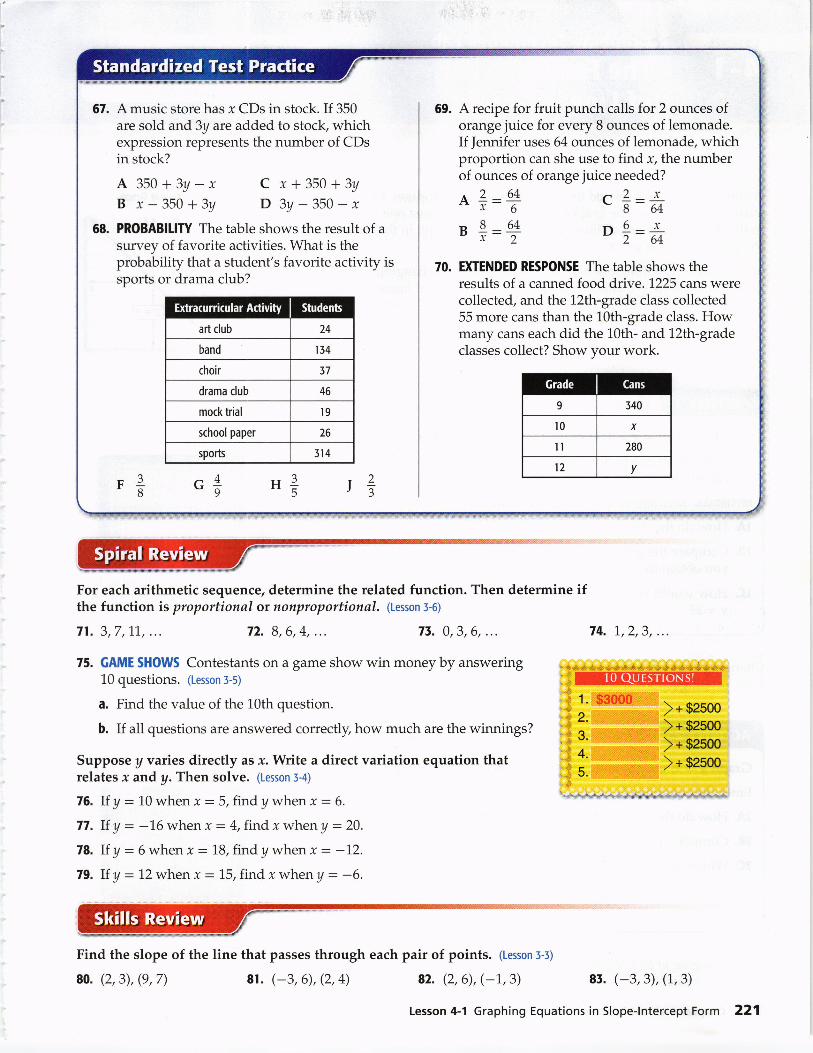
70. EXTENDED RESPONSE The table shows theresults of a canned food drive. 1225 cans werecollected, and the L2th-grade class collected55 more cans than the 10th-grade class. Howmany cans each did the 10th- and 12th-gradeclasses collect? Show your work.
A 350-t3y-xB x-350+3y
C r*350+3yD 3y- 350-r ^2 64 2 xA 7:? . E:e+
u *:+ , *:h68. PROBABIIITY The table shows the result of asurvey of favorite activities. What is theprobability that a student's favorite activity issports or drama club?
F*
For each arithmetic sequence, determine the related function. Then determine ifthe function is proportionsl ot nonproportional. (Lesson 3-6)
71.3,7,11.,... 72. 8,6,4, ... 7r. 0,3,6, ... 74. 1.,2,3,...
75. GAME SHOWS Contestants on a Bame show win money by answering10 questions. (Lesson 3-5)
a. Find the value of the 10th question.
b. If all questions are answered correctly, how much are the winnings?
Suppose y varies directly as r. Write a direct variation equation thatrelates x and y. Then solve. (Lesson i-4)
76. lf y: 10 when x:5,findy when x:6.77. If y - -16when x : A,find r when A : 20.
78. If y:6when x:18,findy when x: -1"2.
79. If y = 12 when x : ll,find r when A : -6.
1.
2.
3.
4.
5.
$3000)+ $2500
)+ $2500
)+ $2500
)+ $2s00
Find the slope of the
80. (2,3), (9,7)
line that passes through each
8t. (-3, 6), (2, 4)
pair of points. (lesson 5-5)
82. (2,6), (-1,3) 85. (-3, 3), (1, 3)
Lesson 4-1 Graphing Equations in Slope-lntercept Form 221
Math Online
. Other Calculator Keystrokes
. Graphing Technology Personal futor
w*w wwwwwwwwly,lrw:wwrwwtw
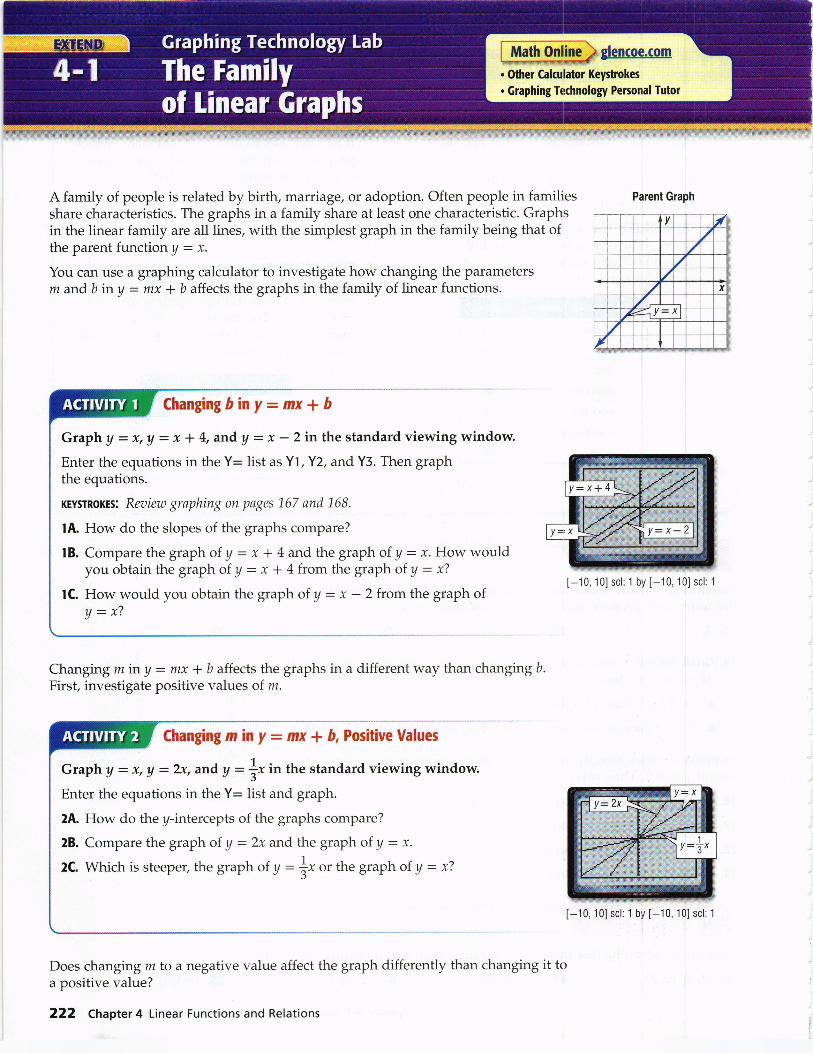
A family of people is related by birth, marriage, or adoption. Often people in familiesshare characteristics. The graphs in a family share at least one characteristic. Graphsin the linear family are all lines, with the simplest graph in the family being that ofthe parent function A : x.
You can use a graphing calculator to investigate how changing the parametersm and b in y - mx * b affects the graphs in the family of linear functions.
Changingbiny-mx*b
GraphA=x,U:x+4,andy 2 in the standard viewing window.
Enter the equations in the Y: list as Yl, Y2, and Y:. Then graphthe equations.
KEysTRoKEs: Reoiern graphing on pages 167 and 1"68.
lA. How do the slopes of the graphs compare?
lB. Compare the graph of y : x 'l 4 and the graph of y : x. How wouldyou obtain the graph of y : x * 4 from the graph of y : vt
IC. How would you obtain the graph of y : x - 2 from the graph of
a:x?
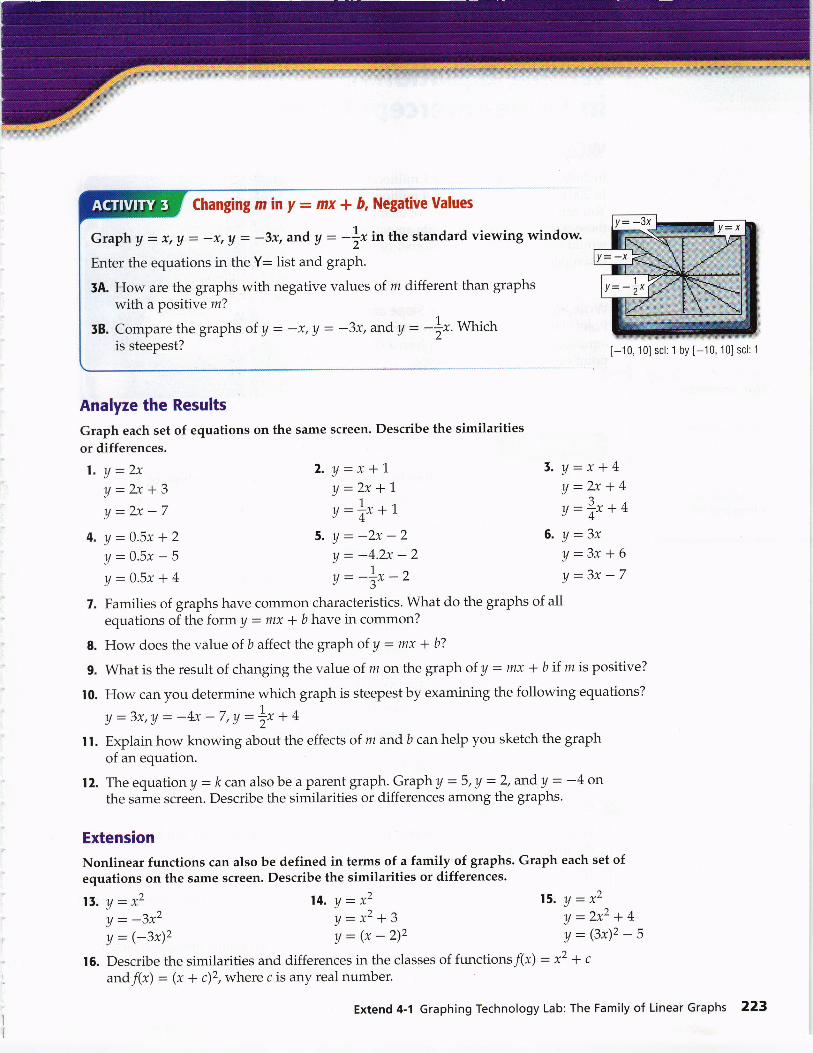
Changing m iny : Ttlx I b affects the graphs in a different way than changing b.
First, investigate positive values of m.
Changing m in y - mx + 6, Positive Values
Graph A : x, U : 2x, and, y: 1y i" the standard viewing window.
Enter the equations in the Y: list and graph.
2A. How do the y-intercepts of the graphs compare?
28. Compare the graph of y : 2x and the graph of y - x.
2C. Which is steeper, the graph of y - |r or the graph of y - v?
Does changing m to a negative value affecta positive value?
222 Chapter 4 Linear Functions and Relations
Parent Graph
[-10, 10] scl: 1 by [-10, 10] scl: 1
[-10, 10] scl: 1 by [-10, 10] scl: 1
the graph differently than changing it to
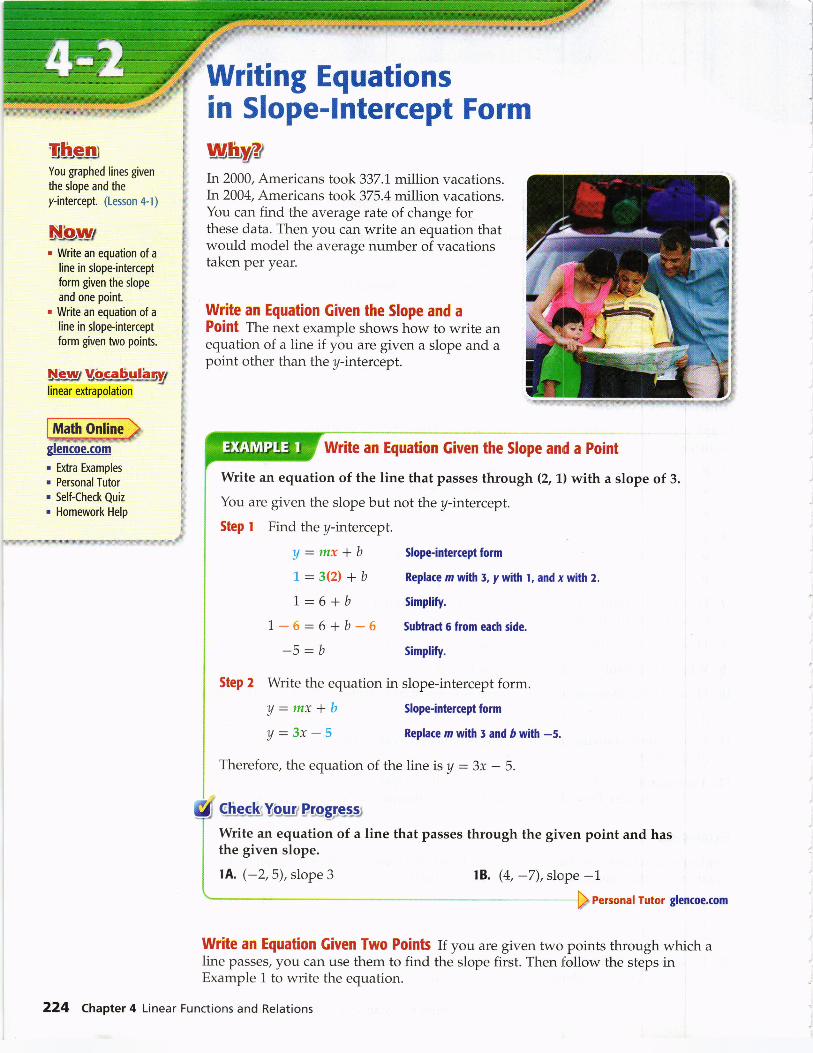
Changing m in y : fiix + 6, Negative Values
Graph A = x,U = -x,A: -3x, and'y: -Lfin the standard viewing window.
Enter the equations in the Y:5A. How are the graphs with
with a positive m?
5B. Compare the graphs of yis steepest?
Iist and graph.
negative values of m dlfferent than graphs
- -3x, and,y = -+r* Which
2'Y:*+\ll:2x+1u:Lx*7J4
5.Y=-2x-2U:-4'2x-2Lr:-!x-2-J
l'Y:x+4A:2x + 4
y:f;x + a
6' Y :3*A:3x+6U:3x-7
A:x2Y:2x2+4y=(3x)2-52+c
15.
16. Describe the similarities and differences in the classes of functions f(x) : x
andf(x): (x * c)2, where c is any real number.
[-10,10] scl:1 by [-10,10] scl: l
Analyze the Results
Graph each set of equations on the same screen. Describe the similaritiesor differences.
l. y :2,U:2x+3!/:2x-7
4.Y:o'Sx+2a :0'5x - 5
A :0'5x + 4
15. y=Y2^)a : -Jx-
y : (_3x)2
14. y-x2'!/:x2+3y:(x-2)2
7. Families of graphs have common characteristics. What do the graphs of allequations of the formy : fitx * b have in common?
8. How does the value of b affect the graph of y : mx + b?
9' what is the result of changing the value of m on the graph of y : mx + b if m is positive?
10. How can you determine which graph is steepest by examining the following equations?
A:3x,!/: -4x -7,Y:L{ * n
I l. Explain how knowing about the effects of m and b can help you sketch the graphof an equation.
12. The equation U : k canalso be a parent graph' Graph A :5,A :2, andy = -4 onthe same screen. Describe the similarities or differences among the graphs.
Extension
Nonlinear functions can also be defined in terms of a family of graphs. Graph each set ofequations on the same screen. Describe the similarities or differences.
Extend 4-1 Graphing Technology Lab: The Family of Linear Graphs 223
Ulire$You graphed lines given
the slope and they-intercept. (Lesson 4-1)
Nbur. Write an equation of a
line in slope-intercept
form given the slope
and one point.. Write an equation of a
line in slope-interceptform given two points.
. Extra Examples
. Personal Tutor
. Self-Check Quiz
. Homework Help
linear extrapolation
mglencoe.com
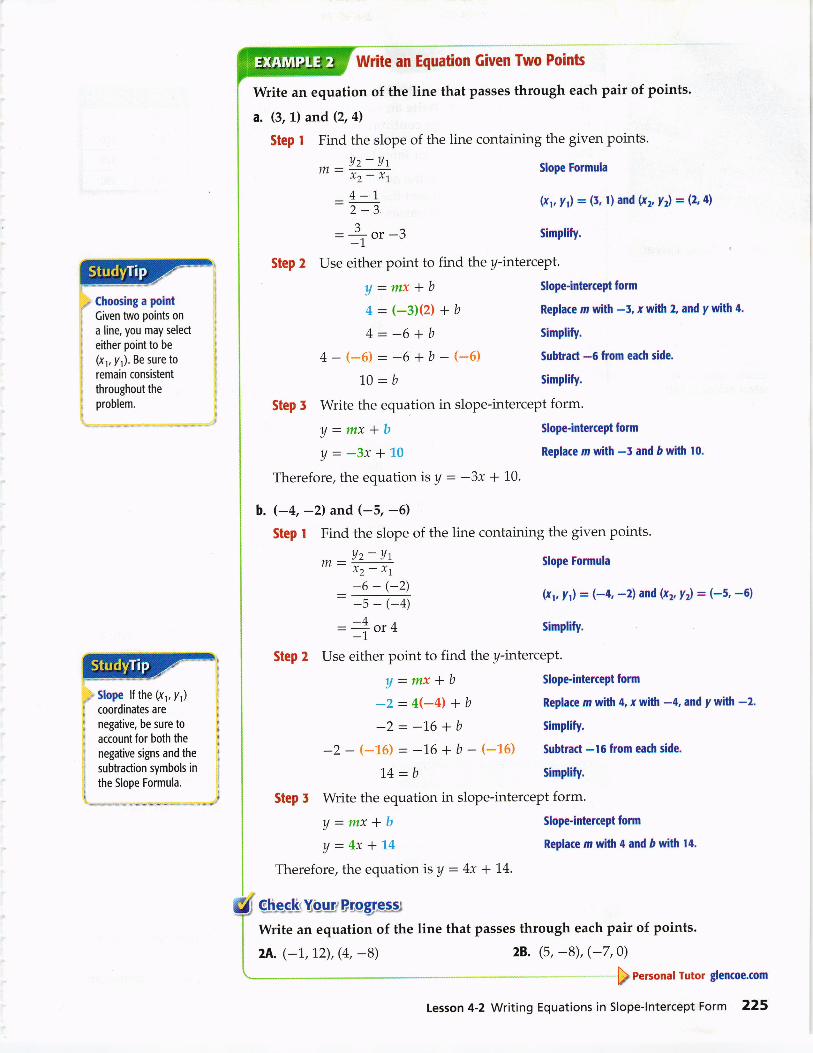
Writing Equationsin Slope-lntercept Formww?.jIn 2000, Americans took 337.1 million vacations.ln 2004, Americans took 37 5.4 million vacations.You can find the average rate of change forthese data. Then you can write an equation thatwould model the average number of vacationstaken per year.
Write an Equation Given the Slope and aPoint The next example shows how to write anequation of a line if you are given a slope and apoint other than the y-intercept.
Write an Equation Given the Slope and a Point
Write an equation of the line that passes through (2, 1) with a slope of 3.
You are given the slope but not the y-intercept.
Step t Find the y-intercept.
U:mx+bl=3(21 *b1=6+b
1-6:6+b-6_h
- h
Step 2 Write the equation
U=mx+bA=3x-5
Slope-intercept form
Replace m with 5, y with l, and x with 2.
Simplify.
Subfract 6 from each side.
Simplify.
in slope-intercept form.
Slope-intercept form
Replace m with 5 and D with -s.
Therefore, the equation of the line is U : 3x - 5.
c-heekYqur Prqgregs:""91*
Write an equation of athe given slope.
lA. (-2,5), slope 3
line that passes through the given point and has
lB. (4, -7), slope -1b personal Tutor glencoe.com
Write an Equation Given Two Points If you are given two points through which a
line passes, you can use them to find the slope first. Then follow the steps inExample 1 to write the equation.
224 Chapter 4 Linear Functions and Relations
Write an Equation Given Two Points
write an equation of the line that passes through each pair of points.
a. (3, 1) and (2, 4l
Step t Find the slope of the line containing the given points.
* _Az-Vtrz- ^l4-1.=-2-3
1^:-- or-J_I
W, Step Z Use either point to find the y-intercept.
,r Choosing a pointi Given two points on
l a line, you may select
: either point to be
,, (x t, y ). Be sure to, remain consistent
I throughout the
I problem. Step 5 Write the equation in slope-intercept form.
Therefore, the equation is y - -3x + 10.
b. (-4, -2) and (-5, -6)Step I Find the slope of the line containing the given points.
A:mx+b4: (-3)Q) + b
4:-6+b4-{-{}}:-6*b-{*6}
10:b
a:mx+bY:-3x+10
r:2: Y:^2- ^l-6 - (-2):--5 - (-4)
=-! or4-1
Step 2 Use either point to find the y-intercept.
U:mx+b-2:4(-4) + b
-2=-L6+b
2A. (-1.,12), (4, -8)
Slope Formula
(\,ltl = (1, l) and (xr, yr) = (2,41
Simplify.
Slope-intercept form
Replace rn with -3, x with 2, and y with +.
Simplify.
Subtract -6 trom each side.
Simplify.
Slope-intercept form
Replace m with -5 and D with 10.
Slope Formula
(x1, fr) = (-4, -2) and (x2, Yr) = (-5, -6)
Simplify.
= --p Slope lf the (x,, yr)
li coordinates are i
negative, be sure to
Slope-intercept Iorm
Replace m rvith 4, r with -4, and y with -2.Simplify.
28' (5' -B)' (-7 '
$ r"rron", rutor gtencoe.com
Lesson 4-2 Writing Equations in Slope-lntercept Form 225
account for both the inegative signs and the
subtraction symbols in i
the Slope Formula.
-2 - \*163 = -1.6 + b - \-16t Subtract -16 from each side.
14: b Simplify.
Step 5 Write the equation in slope-intercept form.
U = mx +b Slope-interceptform
y : 4x + 'l'4 Replace m with 4 and 6 with t4.
Therefore, the equation is y : 4x + L4.
th-exkYqu#Br"pglexWrite an equation of the line that passes through each pair of points.
Baggage HandlerAirline ground crew
responsibilities include
checking tickets, helpingpassengers with luggage,
and making sure thatbaggage is secure. This lobusually requires a high
school diploma or CED.
Source: Airline Jobs
Use Slope-lntercept Form
AIR FARES The table shows the average fares for domesticflights in certain years. Write an equation that could be usedto predict air fares if fares continue to increase at this rate.
Understand You know the air fares for the years listed.
Plan Let r represent the number of years since 2000,and let y represent the air fare. Write an equationof the line that passes through (5,366) and (6,378).
Solve Find the slope.
__Az-At"' - x2- xt
_ 378 - 3666-5
:9 or 121
Choose (6,378) and find the y-intercept of the line.
Slope Fonnula
Let (x,, y,) - (5, 356) and (x2, yzl : (6,
Simplify.
SIope-intercept form
Replace m with 12, x with 6, and y with 37S.
Simplify.
Subtract 72 fuom each side.
378).
Y=mx+b378=12(6)+b378 :72 + b
306: b
U=mx+ttA:l2x+3*6
Write the equation using m :12 andb :306.Slope-intercept formReplace m with 12 and 6 with 106.
Original equation
Replace x with 10.
An estimate of the average air fares is $426.
A:12x+306: 12(10) + 306
= 426
Check Check your result by using the coordinates of the other point.
A = 12x + 306 originalequation366 L U(5) + 306 Replace xwith 5 and ywirh 366.
366 :366 { Simplify.
5. FINANCIAI IITERACY In addition to his weekly salary, Ethan is paid $16 perdelivery. Last week, he made 5 deliveries, and his total pay was $215. Write alinear equation to find Ethan's total weekly pay T if he makes d deliveries.
p Rersonal Tutor glencoe.com
You can use a linear equation to make predictions about values that are beyond therange of the data. This process is called linear extrapolation.
Predict from Slope-lntercept Form
AIR FARES use the equation from Example 3 to estimate the cost of airfaresin 2010.
$b9cls,Y3o;lyPWgj,gsX
4. MONEY Use the equation in Check Your Progress 3 to predict how much moneyEthan will earn in a week if he makes B deliveries.
226 Chapter 4 Linear Functions and Relations
) rcrsonal Tutor glencoe.com
Example Ip.224
Example 2P.22,
Write an equationthe given slope.
t. (3, -3), slope3
5. (1,5), slope -1
of the line that passes through the given point and has
2. (2,4), slope 2
4. (-4,6), slope -2write an equation of the line that passes through each pair of points.
5. (4, -3), (2,3)
7. (-1,3), (0,8)
6. (-7, -3), (-3, 5)
8. (-2,6), (0,0)
Examples 5 and Ip.226
Example IP.724
Example 2?'22!t
Examples 5 and 4p.226
Write an equationthe given slope.
10. (3, L), slope 2
lr. (7,1), slope 8
16. (9, -2), (4,3)
t9. (3, 5), (2, -2)
25. (4,2),slopel
28. (2, -3), slope J
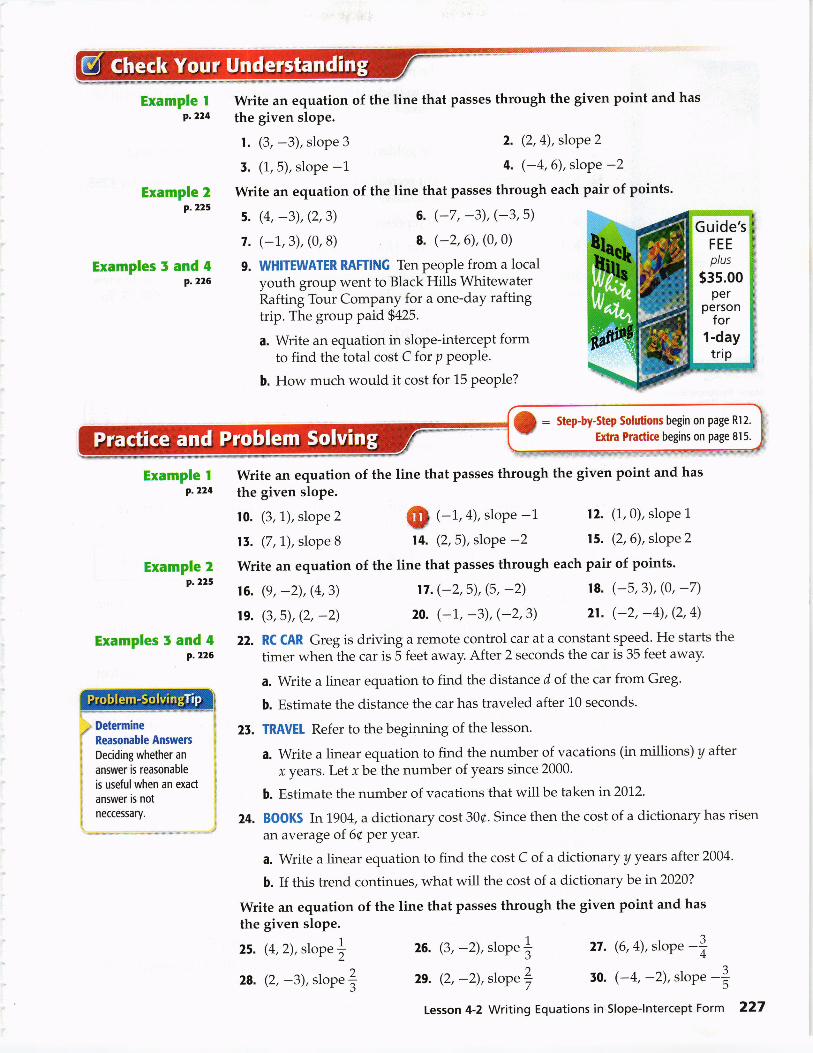
9. WHITEWATER RAFIING Ten people from a localyouth group went to Black Hills WhitewaterRafting Tour Company for a one-day raftingtrip. The group paid $425.
a. Write an equation in slope-intercept formto find the total cost C for P PeoPle.
b. How much would it cost for 15 people?
of the line that passes through the given point and has
0 (-r,4), slope -1 12. (1,0), slope 1
15. (2,6), slope 214. (2,5), slope -2write an equation of the line that passes through each pair of points.
; DetermineI Reasonable Answers
I oeciding whether an
I answer is reasonable
! is useful when an exact
I answer is not
I neccessary.l
22. RC CAR Greg is driving a remote control car at a constant speed. He starts the
timer when the car is 5 feet away. After 2 seconds the car is 35 feet away.
a. Write a linear equation to find the distance d of the car from Greg.
b. Estimate the distance the car has traveled after 10 seconds'
25. TRAVEL Refer to the beginning of the lesson.
a. Write a linear equation to find the number of vacations (in millions) y after
x years. Let r be the number of years since 2000.
b. Estimate the number of vacations that will be taken 1r.2012.
24. BOOKS Inl904, a dictionary cost 300. Since then the cost of a dictionary has risen
an average of 6c. per year.
a. Write a linear equation to find the cost C of a dictionary y years aftet 2004.
b. If this trend continues, what will the cost of a dictionary be in2020?
Write an equation of the line that passes through the given point and has
the given slope.
t7 . (-2, 5) , (5, -2)20. (-1,, -3), (-2,3)
26. (g, -2), slope ]29. (2, -2), slopel
18. (-5,3),(0, -7)21. (-2, -4), (2,4)
27. (6,4), slope -|,0. (-4,-2), slope -$
Lesson 4-2 Writing Equations in Slope-lntercept Form 227
nll.:
iI
DOGS In 2001, there were about 56.1 thousand golden retrievers registered in theUnited States. In2002, the number was 62.5 thousand.
a. Write a linear equation to find the number of golden retrievers G that will beregistered in year /, where / : 0 is the year 2000.
b. Graph the equation.
C. Estimate the number of golden retrievers that will be registere d in 2012.
GYM MEMBERSHIPS A local recreation center offers ayearly membership for g265.The center offers aerobics classes for an additional $5 per class.
a. Write an equation that represents the total cost of the membership.
b. Carly spent $500 one year. How many aerobics classes did she take?
55. SUBSCRIPTION A magazine offers an online subscription that allows you to viewup to 25 archived articles free. To view 30 archived articles, you pay $49.15. Toview 33 archived articles, you pay $57.40.a. \Mhat is the cost of each archived article for which ).ou pay a fee?
b. What is the cost of the magazine subscription?
Write an equation of the line that passes through the given points.
54. (s, -2),(7,1) €* (u, -s),(2,s) ,.. (i, i,?+,i) ,r. (+,-r),(-?,+)
Determine whether the given point is on the line. Explain why or why not.
58. (3, -1);y=L{*5 19. (6,-2);y:Lrt-s
For Exercises 4H2, determine which equation best represents each situation.Explain the meaning of each variable.
A y=-!ux+72
12.
There are approximately73 million dogs kept as
pets in the United States.
Thirty-nine percent ofhouseholds in theUnited States own at
least one dog.
Source: The Humane Societyof the United States
B Y=2st+225 c y=8x+4
40. CONCERTS Tickets to a concert cost $8 each plus a processing fee of $4 per order.
41. FUNDRAISING The freshman class has $225.They sell raffle tickets at $2 each toraise money for a field trip.
42. POOLS The current water level of a swimming pool in Tucson, Arizona, is 6 feet.The rate of evaporation is ] inch per day.
45. ENVIRONMENT A manufacturer implemented a program to reduce waste. In 1998they sent 946 tons of waste to landfills. Each year after that, they reduced theirwaste by an average 28.4 tons.
a. How many tons were sent to the landfill in 2010?
h. In what year will it become impossible for this trend to continue? Explain.
44. ,FI MUITIPLE REPRESENTATIONS In this problem, you will explore the slopesof perpendicular lines.
a. GRAPHICAL On a coordinate plane, graph y : ?p + 1.
b. PICIORIAI Use a straightedge and a protractor to draw a line that isperpendicular to the line you graphed.
c. ALGEBRAIC Find the equation of the line that is perpendicular to the originalline. Describe which method you used to write the equation.
d. ANATYTICAL Compare the slopes of the lines. Describe the relationship , if any,between the two values.
22[l Chapter 4 Linear Functions and Relations
550/o of people who buy
tickets for events use
online ticket agents.
Source: Pew lnternet & AmericanLife Prolect
^f,I COICERT TICKETS Jackson is ordering tickets for a concert online. There is a
I - O.o."ssing fee foreach order, and tlie tickets are $52 each. Jackson ordered
I 5 tickets and the cost was $275.
I a. Determine the processing fee. Write a linear equation to represent the total cost
I Cforftickets.
I u. Make a table of values for at least three other numbers of tickets.
I .. Graph this equation. Predict the cost of 8 tickets.
MUSIC A music store is offering a Frequent Buyers Club membership. The
membership costs $22 per year, and then a member can buy CDs at a reduced
price. If a member b:uys 17 CDs in one year, the cost is $111.25.
a. Determine the cost of each CD for a member.
b. Write a linear equation to represent the total cost y of a one year membership,
if r CDs are purchased.
c. Graph this equation.
47. FIND THE ERROR Tess and Jacinta are writing an equation(3, -Z) and (6, 4). Is either of them correct? Explain your
of the line throughreasoning.
Tess
4-(-Z) 6 ^tt^=23 =4ovLy=ux+b6 =/(4) +$6=8+b2=bY =Zr -Z
laaiata
*=* =9m2
/=o*x+b-2=2G)+b-2=6+b-8=b
/ = 2x'8
48.
49.
cHAttENGE Consider three points , (9,7), (-6,1) and (9, P), on the same line. Find
the value of p and explain your steps.
REASONING Consider the standard form of a linear equation, Ax + By : g'
a. Rewrite the equation in slope-intercept form.
b. What is the slope?
c. What is the y-intercePt?
d. Is this true for all real values of A, B, and C?
OPEN ENDED Create a real-world situation that fitsthe graph at the right. Define the two quantities anddescribe the functional relationship between them.Write an equation to represent this relationship anddescribe what the slope and y-intercept mean.
WRITING lN MATH Linear equations are useful inpredicting future events. Describe some factors inieal-world situations that might affect the reliability ofthe graph in making any predictions.
WRITING tN MATH What information is needed to write the
Explain.equation of a line?
50.
51.
Use Higher-Order Thinking Skills
52.
Lesson 4-2 Writing Equations in Slope-lntercept Form 229
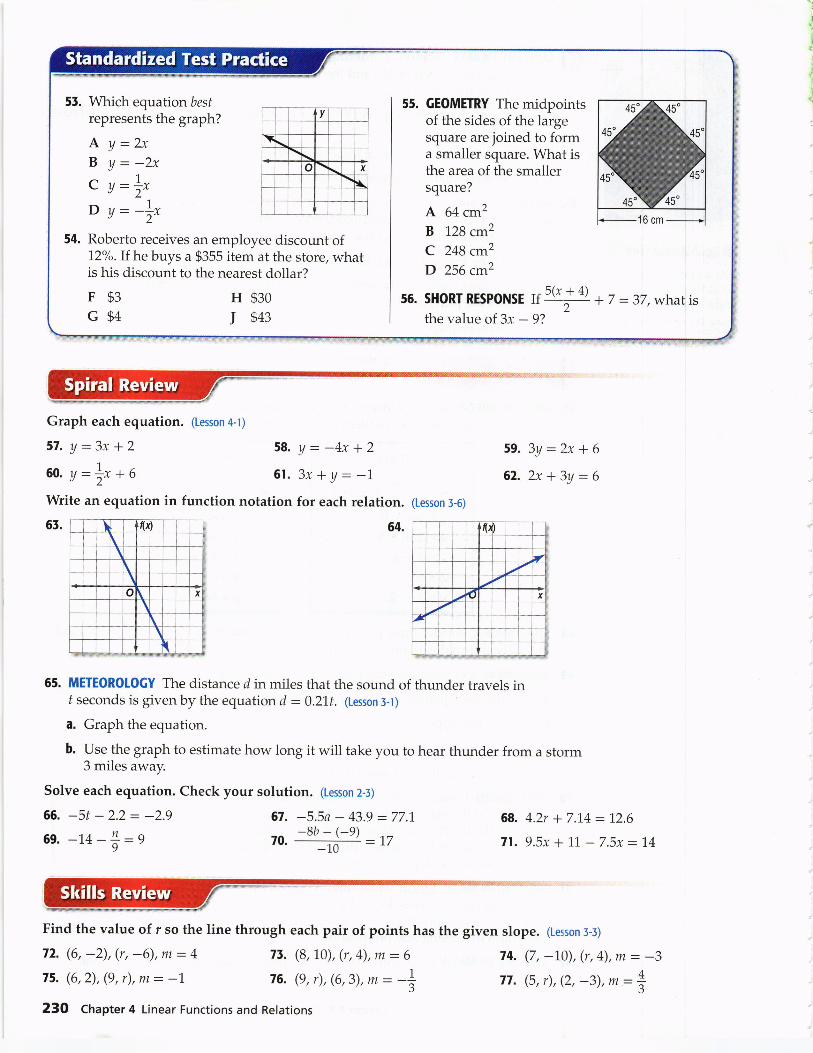
Which equation besf
represents the graph?
A y:2,B Y: -2*c y =L*D y=-*Roberto receives an employee discount of12%.If he buys a $355 item at the store, whatis his discount to the nearest dollar?
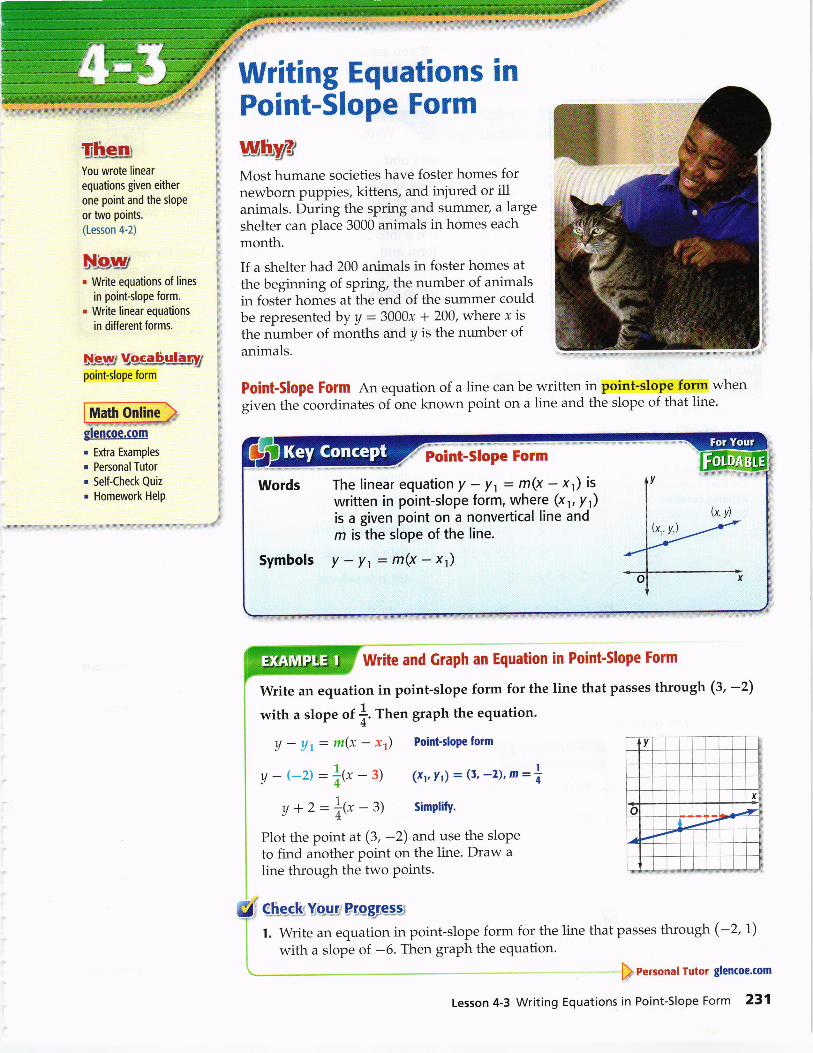
GEOMETRY The midpointsof the sides of the largesquare are joined to forma smaller square. What isthe area of the smallersquare?
A 64cm2B 128 cm2
C 248 cmz
D 256 crrr2
Graph each equation. (Lesson 4-l)
57. y:3x +2
60. y:L**U
66. -5, - 2.2: -2.96s. -14 - [: O
58. y:-4x+261. 3x i y: -I
67. -5.5n - 43.9 = 77.1,
-8b - (-9\70, __)_____:_ :17
-lu
71. (8,1.0), (r,4), m = 6
76. (g, r), (6,3), * = -IJ
fl,,
,x
59.
62.
3Y:2x+6
2x+3y:6Write an equation in function notation for each relation. (Lesson 3-6)
I I\i
\to x
65. METEOROTOGY The distance d in miles that the sound of thunder travels inf seconds is given by the equation d :0.21t. (Lesson I-r)
a. Graph the equation.
b. Use the graph to estimate how long it will take you to hear thunder from a storm3 miles away.
Solve each equation. Check your solution. (Lesson z-I)
68. 4.2r + 7.1.4:12.6
71. 9.5x + 11 - 7.5x:14
Find the value of r so the line through each pair of points has the given slope. (Lesson 3-r)
72. (6, -2), (r, -6), m : 4
75. (6,2), (9, r), m = -L
74. (7, -L0), (r, 4), m : -377. (5, r), (2, -3), * : *3
230 Chapter 4 Linear Functions and Relations
UheuYou wrote linear
equations given either
one point and the slope
or two points.
(Lesson 4-2)
Njgur. Write equations of lines
in point-slope form.. Write linear equations
in different forms.
Ntswr V.ircabulbr.vrpoint-slope form
Math Online
slencoe.com
. Extra Examples
. Personal Tutor
. Self-Check Quiz
. Homework Help
1t:
E
?tl
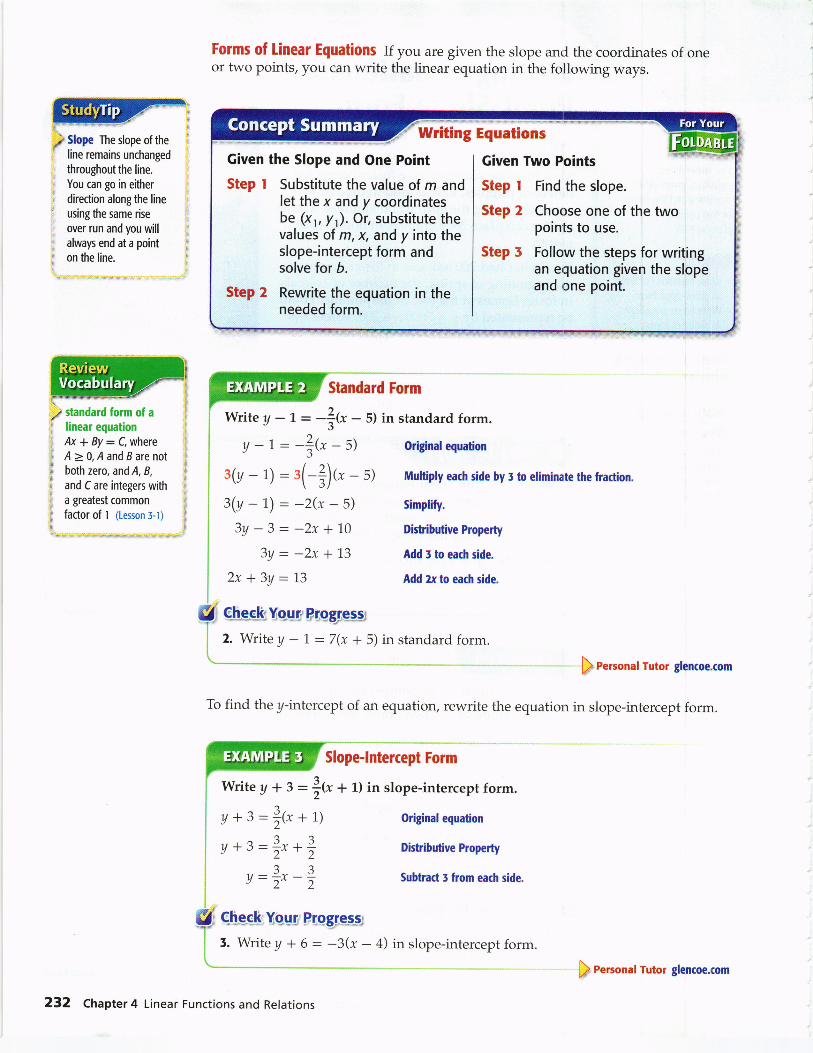
Writing Equations inPoint-Slope Form
wfiN,P.jMost humane societies have foster homes fornewborn puppies, kittens, and injured or illanimals. During the spring and summer, a large
shelter can place 3000 animals in homes each
month.
If a shelter had 200 animals in foster homes atthe beginning of spring, the number of animalsin foster homes at the end of the summer couldbe represented by a = 3000x + 200, where x is
the number of months and y is the number ofanimals.
Point-Slope Form An equation of a line can be written in point-slope form when
given the coordinates of bne known point on a line and the slope of that line.
Write and Graph an Equation in Point'Slope Form
Write an equation in point-slope form for the line that Passes through (3, -2)with a slope of f. fnu" graph the equation.
ta:,ilit,t:
,.l;,:t,.,)t)
1t
A - Ar= ffi(x - xt)
y - (-2) :f,i* - t)
y+2:1<*-ul
Point-slope form
(xu yr) = (r, -2), n : +
Simplify.
i
Plot the point at (3, -Z) and use the slopeto find another point on the line. Draw aline through the two points.
€j-e*el-tj.Vo-us$lpg1eS;;3
t. Write an equation in point-slope form for the line that Passes through (-2,1)with a slope of -6. Then graph the equation.
' p'Rersonal Tutor glencoe'com
Lesson 4-3 Writing Equations in Point-Slope Form 231
The linear equation Y - Yt : m(x - x,) is
written in point-slope form, where Er, Y)is a given point on a nonvertical line andm is the slope of the line.
y-yt=m(x-xr)
"p Slope The slope ofthe
, line remains unchanged
throughout the line.
r' You can go in either
r direction along the line
, using the same rise
r' over run and you will, always end at a point
, on the line.
Forms of [inear Equations If you are given the slope an<1 the coordinates of oneor two points, you can write the linear equation in the following ways.
Standard Form
WlJrte y - 1 = -it. -5) in standard form.
a-1:-Jfr-sl Original equation
g(y - t): s(-J)f, - sl Multiptv each side bv 3 to eliminate the fraction.
g(y - t) : -2(x - 5) simplify.
I standard form of a
I linear equationAx + By - C, whereA>0,AandBarenotboth zero, andA, B,
and C are integers witha greatest commonfactor of I (Lesson 3-t)
3y-3=-2x+703Y:-2x+L3
2x + 3y :73
Distributive Property
Add , to each side,
Add 2x to each side.
:
1
Original equation
Distributive Propefi
Subtract 3 from each side.
Given the SIope and One Point
Step I Substitute the value of m andIet the x and y coordinatesbe (x,, y).Or, substitute thevalues ol m, x, and y into theslope-intercept form andsolve for b.
Step 2 Rewrite the equation in theneeded form.
Given Two Points
Step I Find the slope.
Step 2 Choose one of the twopoints to use.
Step 5 Follow the steps for writingan equation given the slopeand one point.
V:gbeskY:9v..rPrpgre-ps-t'
2. Write U - 7 :7(x + 5) in standard form.
) Rersonal Tutor glencoe.com
To find the y-intercept of an equation, rewrite the equation in slope-intercept form.
Slope-lntercept Form
Wfite y* 3 : f;t, +L) in slope-intercept form.
y+3-|@+Dy+3:?f.*
o:1r*-*
{: gnssXYousPrssre-s;f
j 5. Write y + 6 : -3(x - 4) in slope-intercept form.
232 Chapter 4 Linear Functions and Relations
) Rersonal Tutor glencoe.com
) sop.r in Squares
r Nonvertical opposite
r sides of a square have
equal slopes. lf the
coordinates for one of: the vertices are'
unavailable, use the
slope of the opposite
, side.
Being able to use a variety of forms of linear equations can be useful in other
subjects as well.
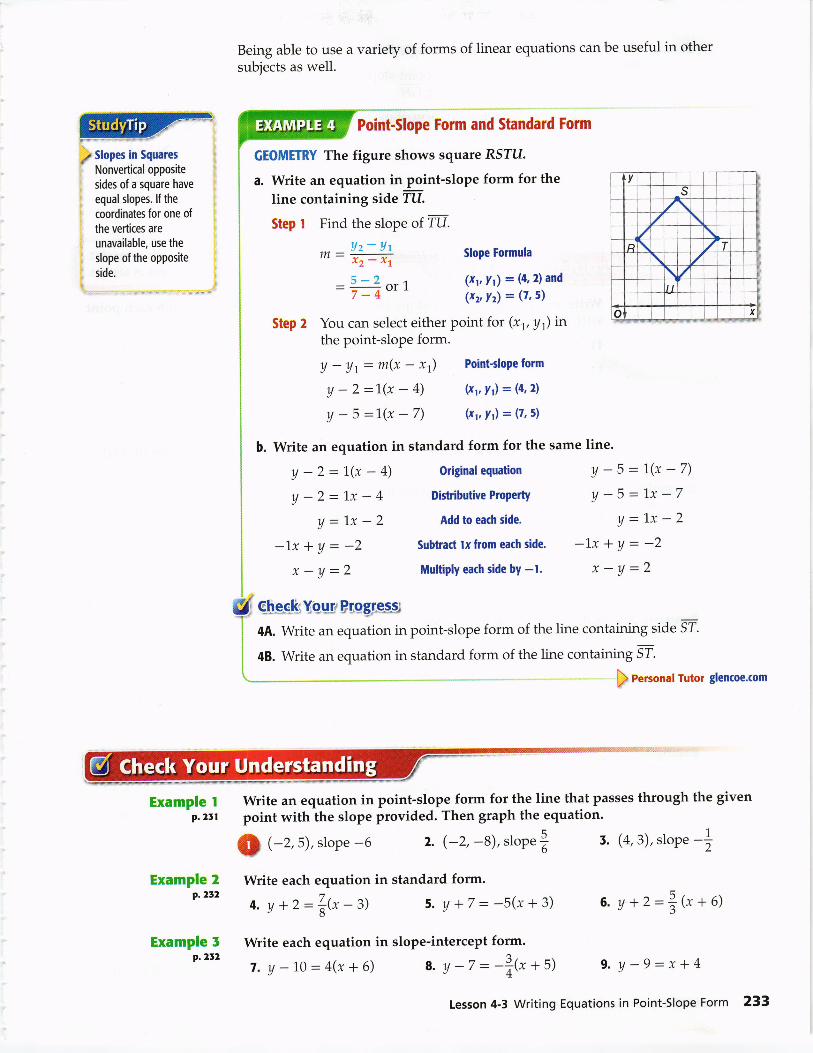
Point-Slope Form and Standard Form
GEOMETRY The figure shows square RSTU.
a. Write an equation in point-slope form for the
line containing side -U.Step I Find the slope of TU.
Az- lrm=V;_\5-2
= v:40t I
Step 2 You can select either point for (xy at) inthe point-slope form.
U - Ut = m(x - xr) Point-sloPeform
y - 2 =t@ - a) lx, Yrl = (4,21
y - 5 :1(x -7) 6t,Yr)=(7,51
b. Write an equation in standard form for the same line.
Slope Formula
(xt,f)-(4,2)and(xz,yz) = (7, 5)
Subtract lx from each side. -lx * A = -2Multiply each side by -1. x-Y=2
@jrseJrrYQarP,sg:ie**
4A. Write an equation in point-slope form of the line containing side s7i
48. Write an equation in standard form of the line containing ST'
p eersonal Tutor glencoe.com
Write an equation in point-slope form for the line that Passes through the givenpoint with the slope provided. Then graph the equation.
y-2=1.@-a)y-2:Lx-4
U=Lx-Z-lx*A=-2
*-y:2
Original equation
Distributive Propefi
Add to each side.
2. (-2, -8), stope f
y-5:1.(x-7)y-5=l.x-7
U=lx-2
5. (4,3),stope -|
o.y+2=Z(x+6)
9. y-9:x*4
Example Ip.2tt
Example 2?.2r2
Example 5P.2t2
(fu (-r,5), slope -6
Write each equation in standard form.
4.y+z:f,tx-z) 5.y+7:-5(x+3)
Write each equation in slope-intercept form.
s. y-z:-f;(x+5)7. a-10=4(x+6)
Lesson 4-3 Writing Equations in Point-Slope Form 233
Example 4p.255
Example Ip.251
Example 2p.2t2
Example 5?.2r2
lt. (5, 3),m:714. (-7,6),m:0
27.y-6:-2(x-7)29. y+5:-6(x+7)tt. y+z:l{x-+)3t. y+z:-t1zx+6)
12. (2, -l), m : -3t5. (-2,17),m:t
(-6,-3),m:-L(-7, -B),*: -]
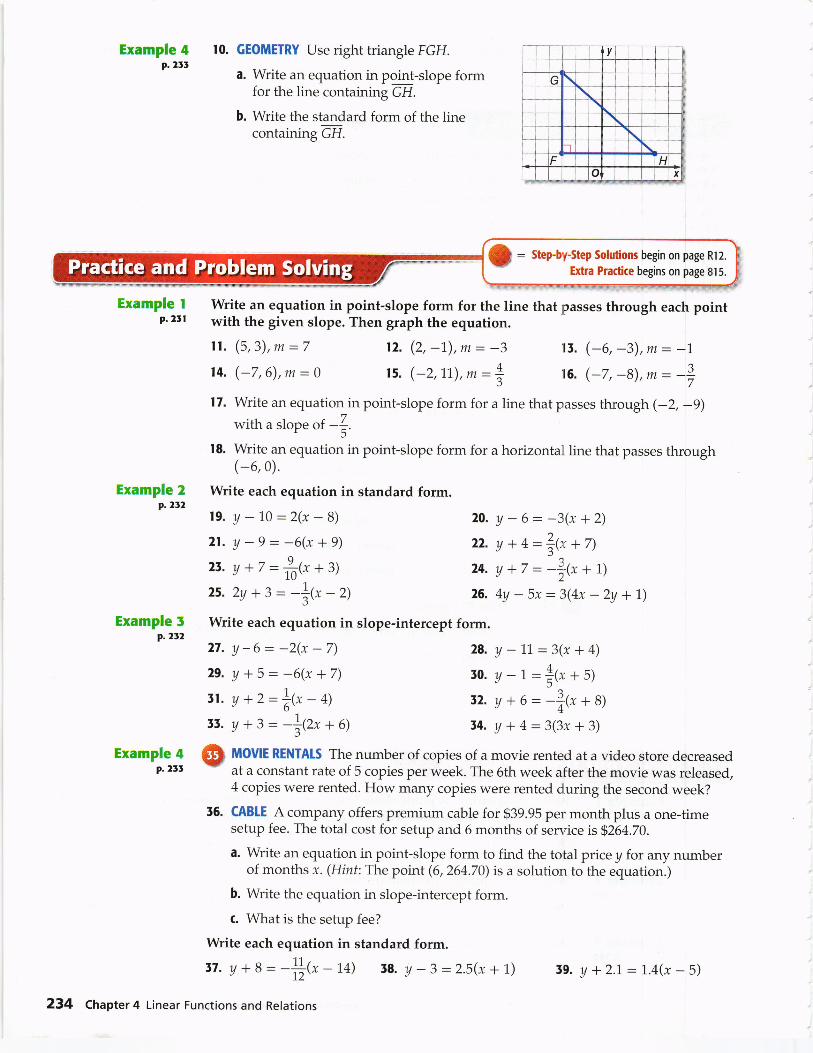
10. GEOMETRY Use right triangle FGH.
a. Write an equation in point-slope formfor the line containing GH.
b. Write the standard form of the line..:contalrung Gfl.
Write an equation in point-slope form for the line that passes through each pointwith the given slope. Then graph the equation.
t5.
I6.
17. Write an equation in point-slope form for a line that passes through (-2, -9)with a slope of -f,.
18. Write an equation in point-slope form for a horizontal line that passes through(-6,0).
Write each equation in standard form.
19. y- 10=2(x-B)
21. y-9=-6(x+9)2t. y+r:fi@+3)2s.2yr3= -lt*-zlWrite each equation in slope-intercept form.
20.y-6:-3(x*2)22. y++:l{x+7)24. y+z=-|(x+1)26. 4y - 5x:3(4x - 2y + 1)
28. y-77:3(x*4)!o.y-t:f,{*-+5)t2. y+o=-f(x+B)34. y+4:3(3x+3)
Example 4 @ fUOVlf RENTATS The number of copies of a movie rented at a video store decreasedP'2t' at a constant rate of 5 copies per week. The 6th week after the movie was released,
4 copies were rented. How many copies were rented during the second week?
56. CABTE A company offers premium cable for $39.95 per month plus a one-timesetup fee. The total cost for setup and 6 months of serr.ice is $264.70.
a. Write an equation in point-slope form to find the total price y for any numberof months x. (Hint: The point (6,264.70) is a solution to the equation.)
b. Write the equation in slope-intercept form.
c. What is the setup fee?
Write each equation in standard form.
37. y +e: -fitx _ t+) 58. y -3 :2.b(x +t)
234 Chapter 4 Linear Functions and Relations
C : Step-by'step Solutions begin on page Rl2.* Extra Practice begins on page 815.
59. y+2.L:1,.4(x-5)
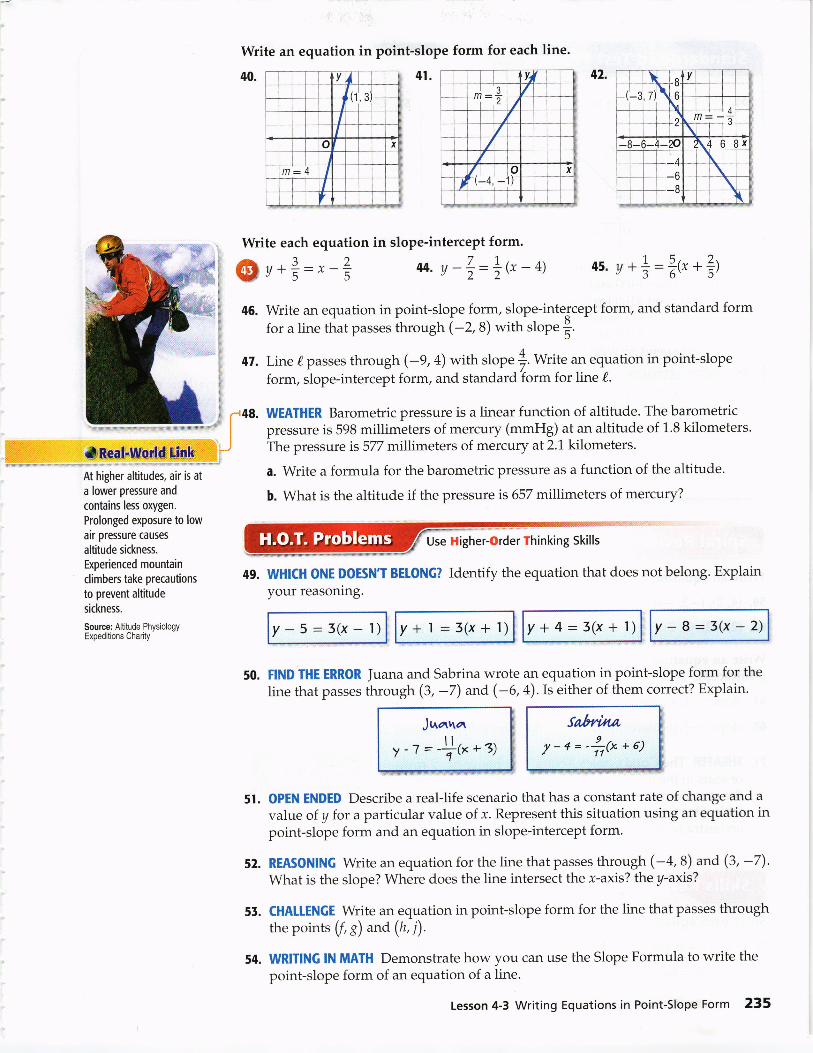
Write an equation in point-slope form for each line.
4t.3. '/',
-t-- I -rL -)
ft.,-,? 'f'
t +
42.ii
-(-s L3\
i :.2
Y', I--+t
'u - - a\ t",n 6 8x
,,r -6a
\
I
Write each equation in slope-intercept form.
@a+3:,-3 44.v-i:+@-4) +?t5',
Write an equation in point-slope form, slope-intercept form, and standard form
for a line that passes through (-2,8) with slope f,.
Line (.passes through (-g,4) with slope !.Writ"an equation in point-slope
form, slope-intercept form, and standard ?orm for line (..
45. y+*:*t,
46.
47.
*Be-a$'ril'ottdHitJk
At higher altitudes, air is at
a lower pressure and
contains less oxygen.
Prolonged exposure to low
air pressure causes
altitude sickness.
Experienced mountain
climbers take precautions
to prevent altitude
sickness.
Source: Altitude PhysiologyExpeditions Charity
y-5=3(x-l) y+1:3(x+l) y+4:5(x+l) y-8=3(x-2)
;-48. WEATHER Barometric pressure is a linear function of altitude. The barometrici pressure is 598 millimeters of mercury (mmHg) at an altitude of 1.8 kilometers.. The pressure is 577 millimeters of mercury at 2.1 kilometers.
Write a formula for the barometric pressure as a function of the altitude.
What is the altitude if the pressurc is 657 millimeters of mercury?
49. WHICH ONE DOESN'T BETONG? Identify the equation that does not belong. Explainyour reasoning.
a.
b.
50. FIND THE ERROR Juana and Sabrina wroteline that passes through (3, -7) and (-6,
an equation in point-slope form for the4). Is either of them correct? Explain.
saltrinn
/-4=-l{:"*el
5t.
Jtaarhal
y -1 = -)c *21
OPEN ENDED Describe a real-life scenario that has a constant rate of change and a
value of y for aparticular value of x. Represent this situation using an equation inpoint-slope form and an equation in slope-intercept form.
REASONTNG Write an equation for the line that passes through (-4,8) and (3, -7).What is the slope? Where does the line intersect the r-axis? the y-axis?
CHAIIENGE Write an equation in point-slope form for the line that passes throughthe points (f, g) and (h, j).
WRITING tN MATH Demonstrate how you can use the Slope Formula to write the
point-slope form of an equation of a line.
52.
55.
Use Higher-Order Thinking Skills
54.
Lesson 4-3 Writing Equations in Point-Slope Form 235
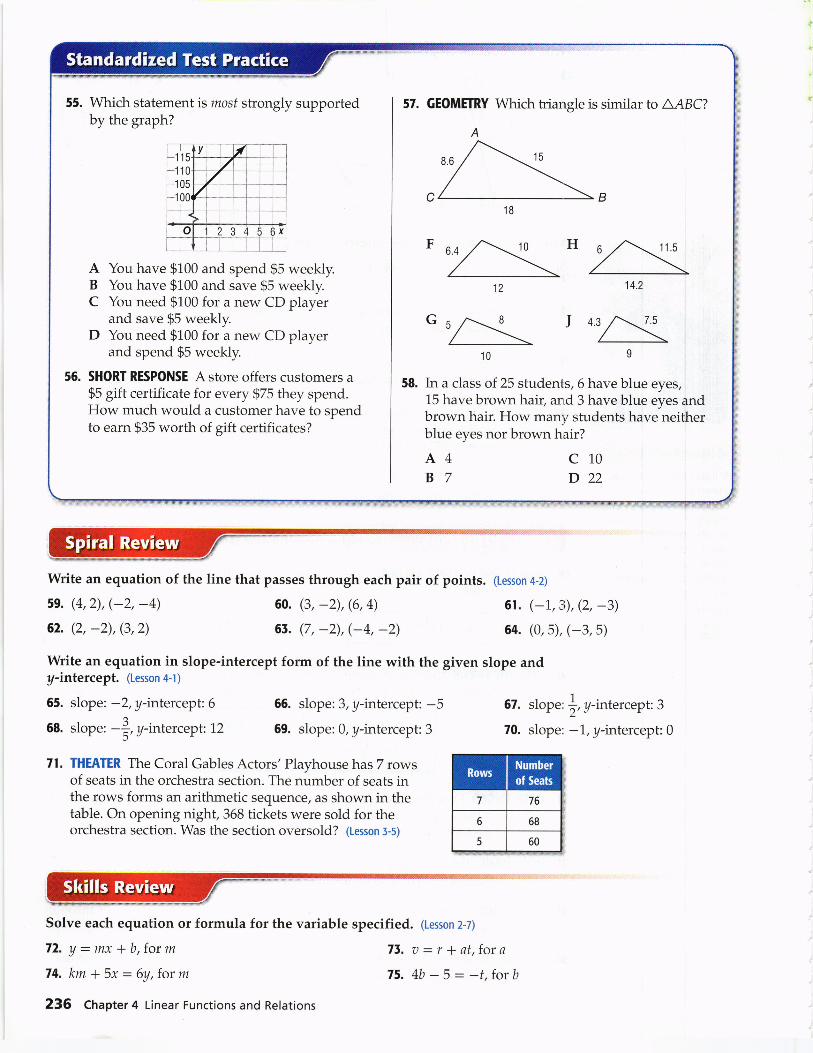
55. \tVhich statement is most strongly supportedby the graph?
A You have $100 and spend $5 weekly.B You have $100 and save 95 weekly.C You need $100 for a new CD player
and save $5 weekly.D You need $100 for a new CD player
and spend $5 weekly.
SHORT RESPONSE A store offers customers a$5 gift certificate for every $75 they spend.How much would a customer have to spendto earn $35 worth of gift certificates?
57. GEOMEIRY \A/hich triangle is similar to LABC?
A
G I q.s t.s
10 I
In a class of 25 students, 6 have blue eyes,15 have brown hair, and 3 have blue eyes andbrown hair. How many students have neitherblue eyes nor brown hair?
c10D22
56.58.
A4B7
Write an equation
59. (4,2), (-2, -4)62. (2, -2), (3,2)
65. slope: -2, y-intercept: 6
68. slope: -f;, A-intercept: 1,2
56. slope: 3, y-intercept: -569. slope: 0, y-intercept: 3
6t. (-1,3),(2, -3)64. (0,5), (-3, 5)
67. slope: |, A-intercept: 3
70. slope: -1, y-intercept: 0
of the line that passes through each pair of points. (Lesson 4-2)
60. (3, -2), (6,4)
65. (7, -2), (-4, -2)
Write an equation in slope-intercept form of the line with the given slope andy-intercept. (Lesson 4-t)
71. THEATER The Coral Gables Actors' Playhouse has 7 rowsof seats in the orchestra section. The number of seats inthe rows forms an arithmetic sequence, as shown in thetable. On opening night,368 tickets were sold for theorchestra section. Was the section oversold? (Lesson J-5)
Solve each equation or formula for the variable specified. (Lesson 2-7)
72. y-mx*b,form 71. o:r lat,fora74. km * 5x = 6y,form 75. 4b - 5 - -t,forb236 Chapter 4 Linear Functions and Relations
The$You wrote equations in
point-slope form.(Lesson 4-3)
DUsw. Write an equation o{
the line that passes
through a given pointparallel to a given line.
. Write an equation ofthe line that passes
through a given point.
perpendicular to a
given line.
NtswVOcabulbrvr#@!
parallel lines
perpendicular lines
. Extra Examples
. Personal Tutor
. Self-Check Quiz
. Homework Help
Parallel and Perpendicular Lines
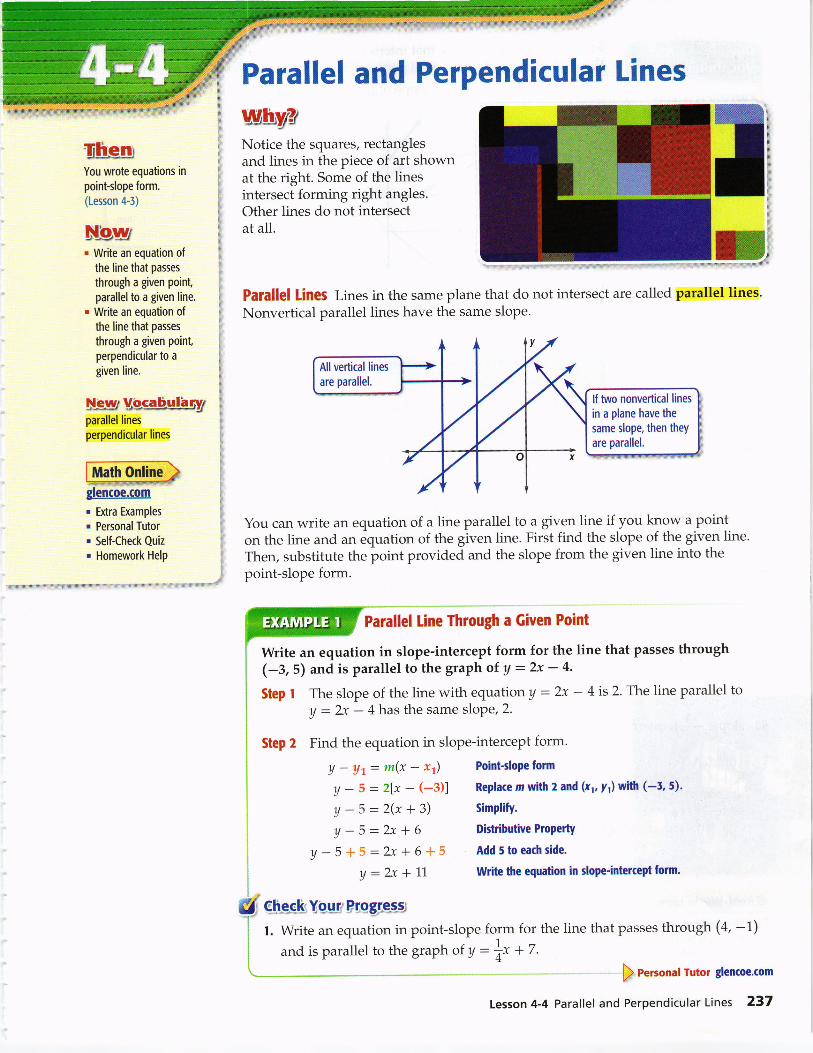
!uhUANotice the squares, rectanglesand lines in the piece of art shownat the right. Some of the linesintersect forming right angles.Other lines do not intersectat all.
Pafallel lines tines in the same plane that do not intersect are called parallel lines.
Nonvertical parallel lines have the same slope.
You can write an equation of a line parallel to a given line if you know a pointon the line and an equation of the given line. First find the slope of the given line.
Then, substitute the point provided and the slope from the given line into the
point-slope form.
Parallel Line Through a Given Point
Write an equation in slope-intercept form for the line that passes through(-3, 5) and is parallel to the graph of y - 2r - 4.
Step I The slope of the line with equation a = 2x - 4 is 2' The line parallel to
U = 2x - 4 has the same slope, 2.
Step Z Find the equation in slope-intercept form.
A - At: m(x - xt) Point-slope form
y - 5 : 2lx - F3)) Replace m with 2 and (xr, yt) with (-5, 5).
y -5:2(x+3)rt-5:2xt6
y-5+5:2x+6+5" "xf11y-L
€lreqkYAu#Bw$esg
Simplify.
Distributive Propefi
Add 5 to each side.
Write the equation in slope'intercept form.
p eersonal Tutor glencoe.com
Lesson 4-4 Parallel and Perpendicular Lines 237
L Write an equation in point-slope form for the line that Passes through (4, -1)and is parallel to the graph of y : f,x + Z.
lf two nonvertical lines
in a plane have the
same slope, then they
are parallel,
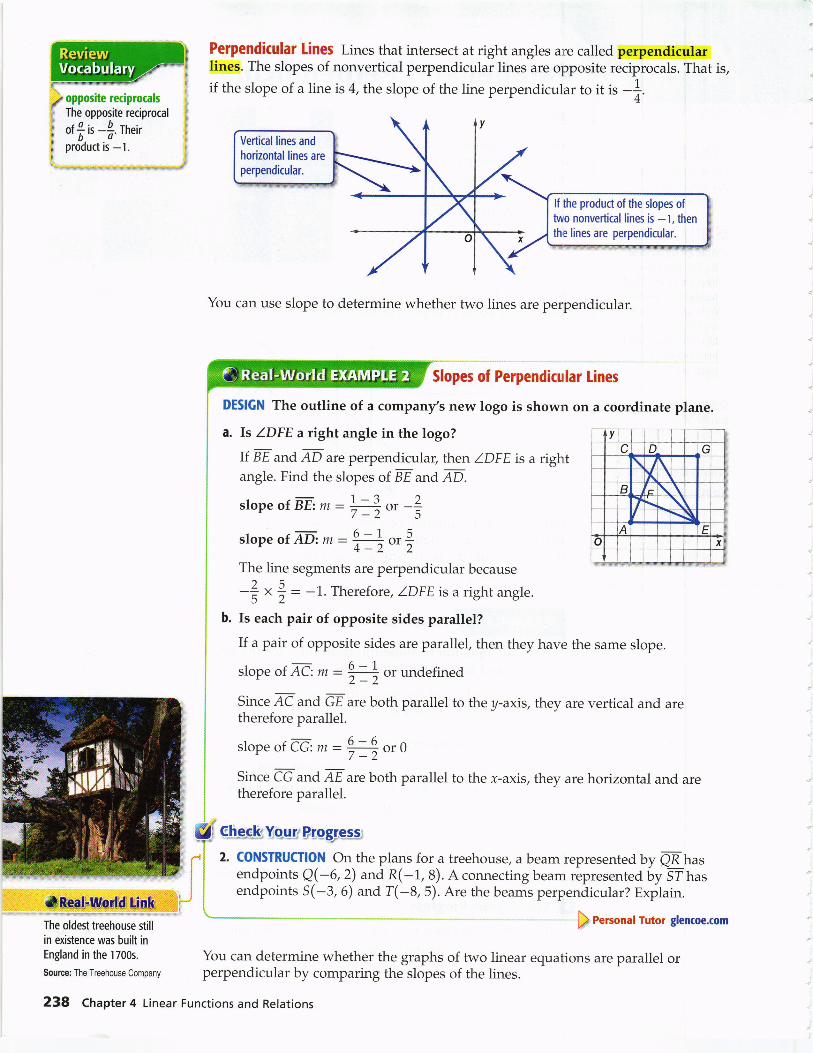
Perpendicular Lines Lines that intersect at right angles are called perpendicularlines. The slopes of nonvertical perpendicular lines are opposite reciprocals. That is,
if the slope of a line is 4, the slope of the line perpendicular to it ts -+
You can use slope to determine whether two lines are perpendicular.
Slopes of Perpendicular lines
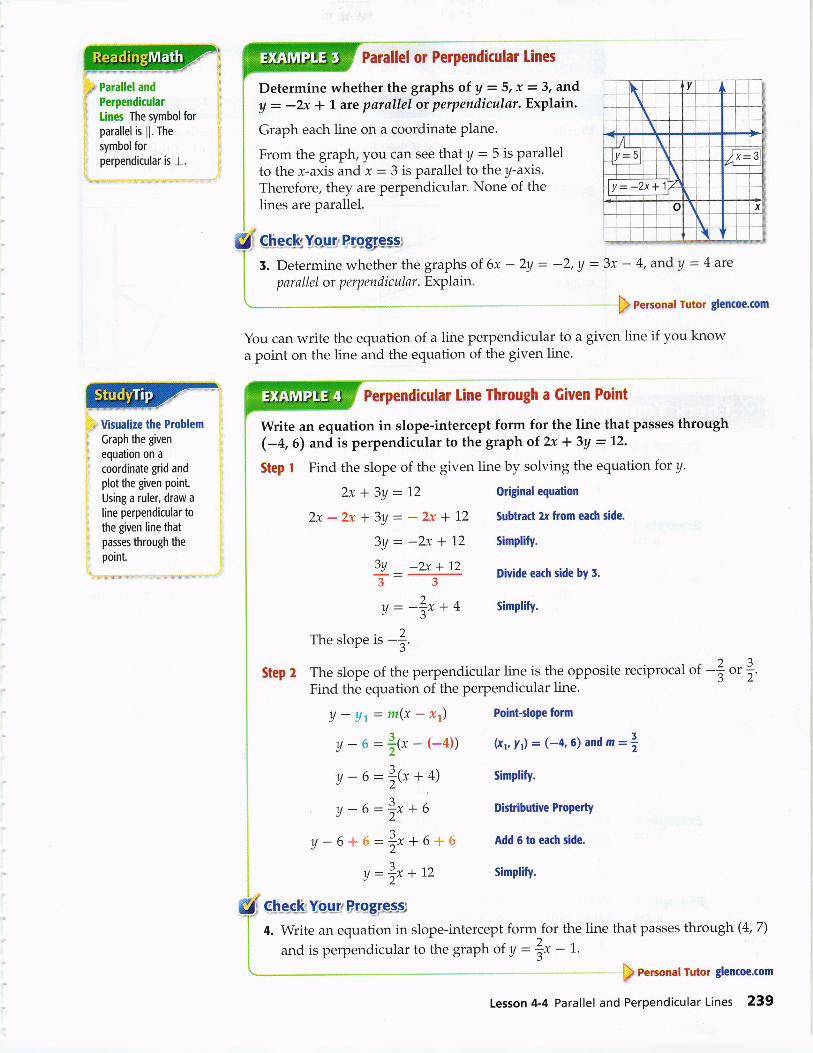
DESIGN The outline of a company's new logo is shown on a coordinate plane.
a. ls ZDFE a right angle in the logo?
If BE and M are perpendicular, then IDFE is a rightangle. Find the slopes of BE and AD.
slope of E: m : =.o,
-?slope of M: m = t= ",
2
The line segments are perpendicular because')(
-A " i - -1. Therefore, IDFE is a right angle.
b. Is each pair of opposite sides parallel?
If a pair of opposite sides are parallel, then they
slope of AC: m = #or undefined
Since AC and GE are both parallel to the y-axis, they are vertical and aretherefore parallel.
slope of CG-; m : fi or 0
since CG and AE areboth parallel to the x-axis, they are horizontal and aretherefore parallel.
have the same slope.
c-heekvoAgP.,rggy,e-s5;
2. coNsrRucrloN on.the plans for a treehouse, a beam represented by Q-R hasendpoints Qe6,2) and R(-1, B). A connecting beam represented by ST hasendpoints S(-3,6) and T(-8,5). Are the beams perpendicular? Explain.
*kal!&d$cih[qThe oldest treehouse still
in existence was built in
England in the I700s.
Source: The Treehouse Company
), eersonal Tutor glencoe.com
You can determine whether the graphs of two linear equations are parallel orperpendicular by comparing the slopes of the lines.
lf the product of the slopes oftwo nonvedcal lines is -1, thenthe lines are perpendicular.
238 Chapter 4 Linear Functions and Relations
,.' Parallel andr, Perpendicular
: Lines The symbol for
, parallel is ll. The
: symbol for
, perpendicular is I.
,, Visualize the Problem
Graph the given
equation on a
coordinate grid and
plot the given point.
Using a ruler, draw a
line perpendicular tothe given line thatpasses through thepoint.
Parallel or Perpendicular lines
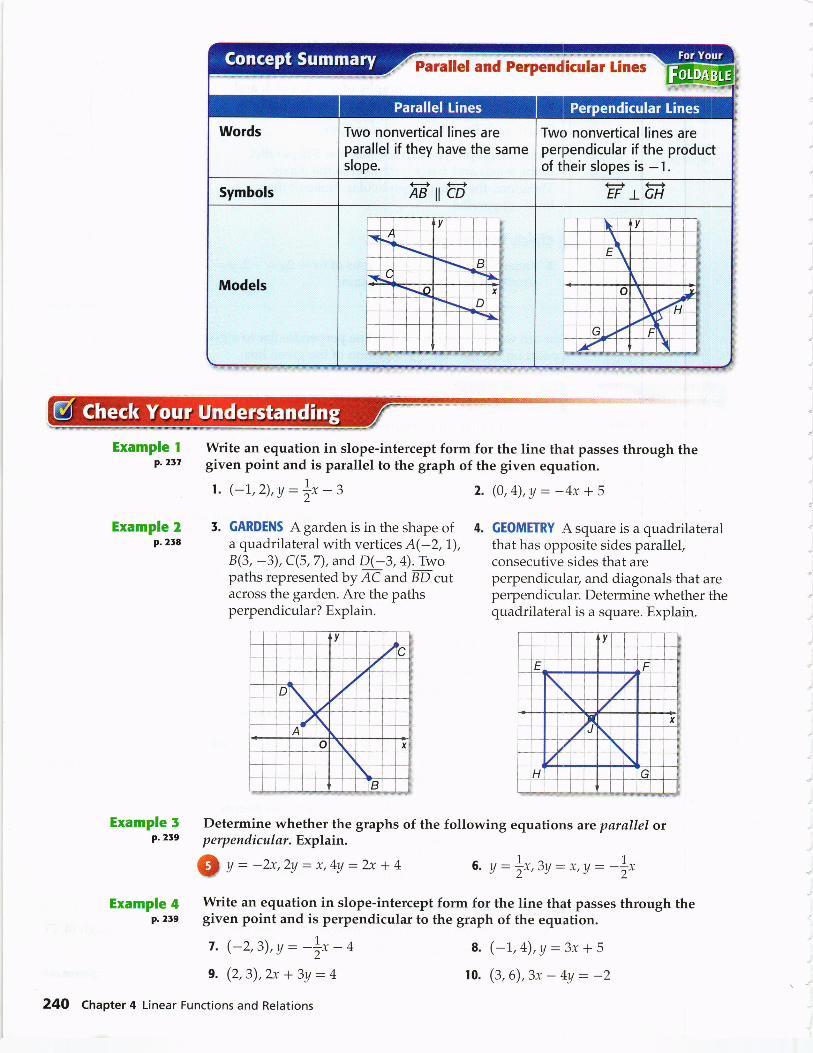
Determine whether the graphs of y - 5, x = 3, and
A = -2x * 1 are parallel or perpendicular. Explain.
Graph each line on a coordinate plane.
From the graph, you can see that U : 5 is parallelto the r-axis and r : 3 is parallel to the y-axis.Therefore, they are perpendicular. None of thelines are parallel.
$,e.nssbYo-urPrqs;e*q*] l. D"t"r*ine whether the graphs of 6x - 2y :
I pnraltel or perpendicular. Explain.-Z,y:3x-4,andy=4ate
) eersonal Tutor glencoe.com
You can write the equation of a line perpendicular to a given line if you knowa point on the line and the equation of the given line.
Perpendicular Line Through a Given Point
Write an equation in slope-intercept form for the line that passes through(-4,6) and is perpendicular to the graph of 2-x * 3y : 12.
Step I Find the slope of the given line by solving the equation for y.
2x+3y:!2 Original equation
2x - 2x + 3y - - 2x * 12 Subtract 2xfrom each side.
3y : -2x + 12 SimPlifY.
3Y -2x +12-:-JJ
Divide each side by r.
Point-slope form
(xr, yrl = (-4,6) and n =!,
Simplify.
Distributive Propefi
Add 6 to each side.
Simplify.
y:-lx+a Simplify.
The slope ts -3.
Step Z The slope of the perpendicular line is the opposite recipro cal of -l o, |.Find the equation of the perpendicular line.
U-!/t=m(x-xl)y-6:|l*-t-+lly-6=|e++1
a-y_6:lx+6y-6*r:i**6+q:
2y=ix+t2
G-h-e-e.-kYo-u-riBrpgleqs;
4. Write an equation in slope-intercept form_for the line that passes through (4, 7)
and is perpendicular to the graph of y - tr* - ,p, Rersonal Tutor glencoe.com
Lesson 4-4 Parallel and Perpendicular Lines 239
\*-**,--.".," *
Example Ip.2t7
Example 2p.2ta
Write an equation in slope-intercept form for the line that passes through thegiven point and is parallel to the graph of the given equation.
t. (-1, 2),y =f - Z
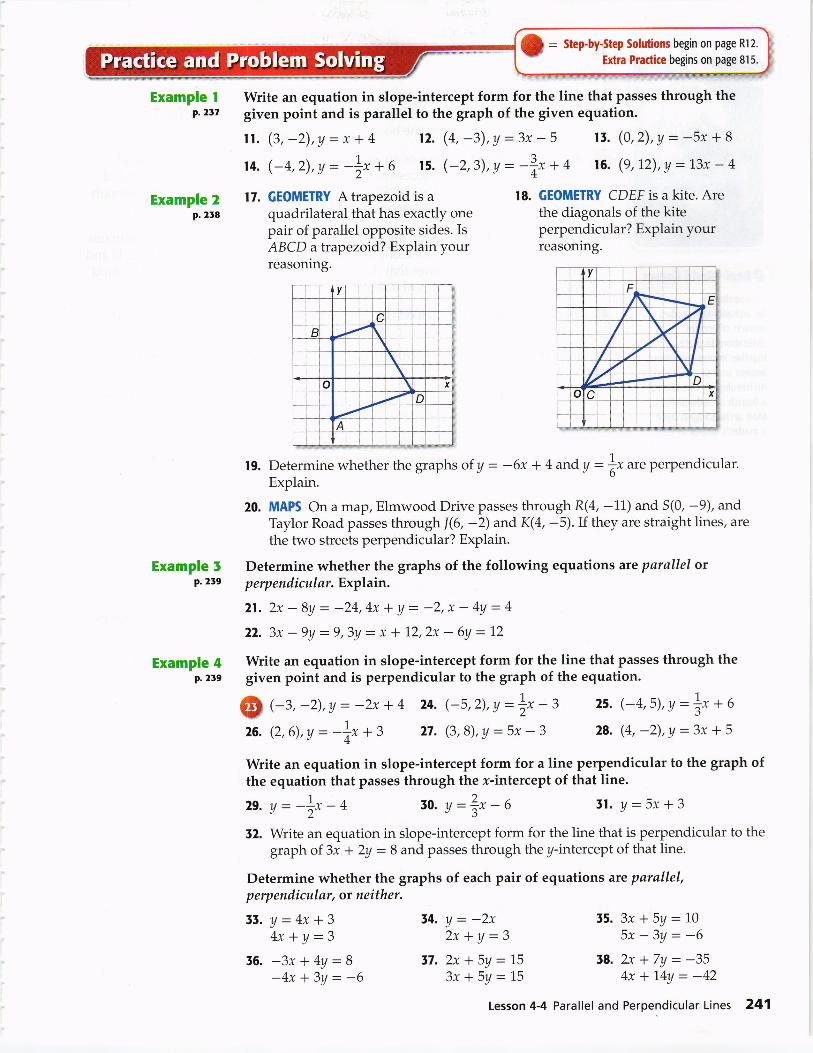
5. GARDENS A garden is in the shape of 4.
a quadrilateral with vertices A(-2,7),B(3, -3), C(5,7), and D(-3, 4). Twopaths represented by AC and BD cutacross the garden. Are the pathsperpendicular? Explain.
2. (0,4),A:-4x+5
GEOMETRY A square is a quadrilateralthat has opposite sides parallel,consecutive sides that areperpendicular, and diagonals that areperpendicular. Determine whether thequadrilateral is a square. Explain.
Example 5 Determine whether the graphs of the following equations are parallel orP. 2re perpendicular. Explain.
(QV--2x,2y=x,U:2x+4 6. y : i*,r, -' x,!/ : -Lrt
Example 4p.2I9
7. (-2,3),y: -fu - +
9. (2, 3),2x + 3y : 4
24O Chapter 4 Linear Functions and Relations
Write an equation in slope-intercept form for the line that passes through thegiven point and is perpendicular to the graph of the equation.
8. (-1, 4),y :3x + 5
10. (3, 6),3x - 4y : -2
I = Step'by-step solutions begin on page Rl2'
Extra Practice begins on page 8l 5.
Example IP.2t7
Example 2p.2ra
Example 5p.2rg
Example 4p.259
Write an equation in slope-intercept form for the line that passes through thegiven point and is parallel to the graph of the given equation.
ll. (3,-2),y=x*414. (-4,2),y = -L* * u
17. GEOMETRY A trapezoid is aquadrilateral that has exactly onepair of parallel opposite sides. IsABCD atrapezoid? Explain yourreasoning.
12. (4, -3), y = 3x - 5
ts. (-2,3),y : -3-1+ a
14. y = -2v2x+Y:3
57. 2x *5y =153x*5y=t$
15. (0,2),y: -5x + 8
16. (9,12),y = 13x - 4
ll. y=4x+34x+Y=3
56. -3x*U:8-4x * 3y -- -6
lS. GEOMETRY CDEF is a kite. Arethe diagonals of the kiteperpendicular? Explain yourreasoning.
19. Determine whether the graph s of y - -6x * 4 and,y : t{ are perpendicular.Explain.
20. MAPS On a map, Elmwood Drive passes through R(4, -11) and S(0, -9), andTaylor Road passes through 16, -2) andK(4, -5).If they are straight lines, are
the two streets perpendicular? Explain.
Determine whether the graphs of the following equations arc parallel orp erp en di cul ar. Expl ain.
21. 2x - By : -24, 4x ! y : -2, x - 4y = 4
22. 3x - 9y = 9,3y : x + 12,2x - 6y : t)
Write an equation in slope-intercept form for the line that passes through thegiven point and is perpendicular to the graph of the equation.
@ eu,-2),y = -2x + 4 24. (-5,2),a:l* - U
26. (2,6),y = -1* * 3 27. (3,8),y :5x - 3
Write an equation in slope-intercept form for a line perpendicular to the graph ofthe equation that passes through the x-intercept of that line.
2e. y:-l-t t0, y:Zu--O 51. y- 5r+3
52. Write an equation in slope-intercept form for the line that is perpendicular to thegraph of 3r + 2y = B and passes through the y-intercept of that line.
Determine whether the graphs of each pair of equations arc parallel,p erp endicular, or neither.
25. (-4,5),y:Lt * U
28. (4, -2), y = 3x * 5
15.3x*5y=195x-3Y:-6
58. 2x *7y = -354x+1.4Y:-42
Parallel and Perpendicular Lines 241Lesson 4-4

59.
40.
Write an equation of the line that is parallel to the graph of y - 7x - 3 and passesthrough the origin.
EXCAVATION Scientists excavating a dinosaur mapped the site on a coordinateplane. If one bone lies from (-5, 8) to (10, -1) and a second bone lies from(-10, -3) to (-5, -6), are the bones parallel? Explain.
ARCHAEOTOGY In the ruins of an ancient civilization, an archaeologist foundpottery at (2, 6) and hair accessories at (4, -1). A pole is found with one end at(7 , L0) and the other end at (1.4, 12). Is the pole perpendicular to the line throughthe pottery and the hair accessories? Explain.
GRAPHICS To create a design on a compute4 Andeana must enter the coordinatesfor points on the design. One line segment she drew has endpoints of (-2,1) and(4, 3). The other coordinates that Andeana entered are (2, -7) and (8, -3). Couldthese points be the vertices of a rectangle? Explain.
nE, mumplE REPRESENTATToNS In this problem, you will explore parallel andperpendicular lines.
a. GRAPHICAI Graph the points A(-3,3), B(3,5), and C.(-4,0) on a coordinateplane.
b. ANATYTICAL Determine the coordinates of a fourth point D that would forma parallelogram. Explain your reasoning.
c. ANAIYTICAL What is the minimum number of points that could be movedto make the parallelogram a rectangle? Describe which points should bemoved, and explain why.
CHALLENGE If the line through (-2,4) and (5, d) is parallel to the graph ofU :3x * 4,what is the value of d?
REASONING Is a horizontal line perpendicular to a vertical line sometimes, nlways,or neoer? Explain your reasoning.
OPEN ENDED Graph a line that is parallel and a line that is perpendicular toA:2x-1.FIND THE ERROR Carmen and Chase are finding an equation of the line that isperpendicular to the graph of y : Lt * ,and passes through the point (-3, 5).
Is either of them correct? Explain your reasoning.
Archaeologist
An archaeologist studies
artifacts of ancient
civilizations to piece
together information about
ancient societies.
Archaeology is considered
a branch of anthropology.
Most archaeologists have
a master's degree at least.
4!.
44.
45.
46.
47.
Carvqerr
y-s=3lr-(91y-s=4(r+j)
Y=3x-1+sY=4r-4
cha64
/-5=3[t<-(-s)]/-s=3()<+3)
/=3s'+9+5/ ='3x + t4
48. WRITING lN MATH Illustrate how you can determinewhether two lines are parallel or perpendicular. Writean equation for the graph that is parallel and an equationfor the graph that is perpendicular to the line shown.Explain your reasoning.
242 Chapter 4 Linear Functions and Relations
Use Higher-Order Thinking Skills
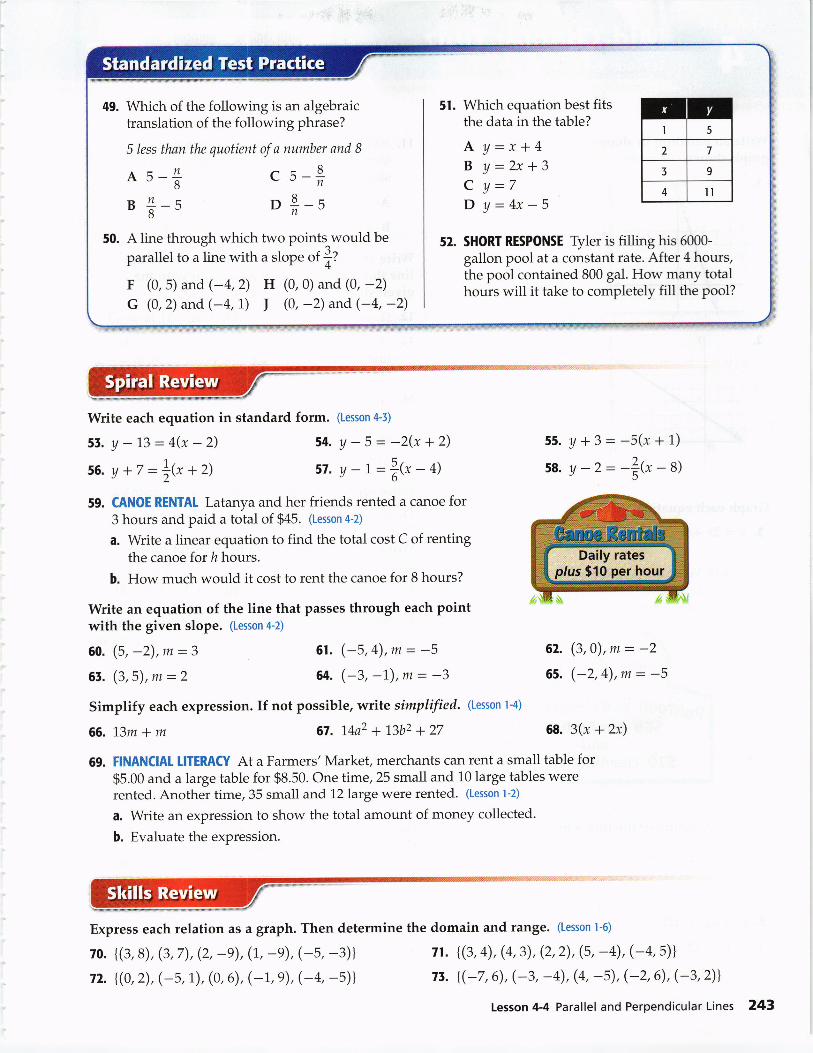
Which of the following is an algebraictranslation of the following phrase?
5less than the quotient of a number and B
(0,5) and (-4,2) H (0,0) and (0, -2)(0, 2) and (-4,1) I (0, -2) and (-4, -2)
A line through which two points.would be
parallel to a line with a slope of f?
Which equation best fitsthe data in the table?
Y=x+4A=2x+3U:7U:4x-5
s2. SHORT RESPONSE Tyler is filling his 6000-
gallon pool at a constant rate. After 4 hours,the pool contained 800 gal. How many totalhours will it take to completely fill the pool?
Write each equation in standard form. (Lesson +-l)
5t.y-13=4(x-2)i6.y+r:|@+2)
54.y-5:-2(x+2)57.y-t=l{x-+)
6t. (-5, 4), m : -564. (-3, -1.), m : -3
U*3=-5(x+1)y-2=-ffr-sl
55.
58.
59. CANOE RENTAT Latanya and her friends rented a canoe for3 hours and paid a total of $45. (Lesson 4-2)
a. Write a linear equation to find the total cost C of rentingthe canoe for h hours.
b. How much would it cost to rent the canoe for 8 hours?
Write an equation of the line that Passes through each pointwith the given slope. (Lesson 4-2)
60. (5, -2),m:365. (3,5),m =2
Simplify each expression. If not possible, write simplified. (Lesson l-4)
66. 13m + m 67. L4a2 + 13b2 + 27
62. (3,0),m = -265. (-2,4),m=-5
6s. 3(x + 2x)
71. l(3, 4), (4,3), (2,2), (5, -4), (-4,5)l
7t. 1e7,6), (-3, -4), (4, -5), (-2,6), (-3,2))
69. FINANCIAL IITERACY At a Farmers' Market, merchants can rent a small table for$5.00 and a large table for $8.50. One time, 25 small and 10 large tables wererented. Another time, 35 small and 1,21,arge were rented' (Lesson t-2)
0. Write an expression to show the total amount of money collected.
b. Evaluate the expression.
Express each relation as a graph. Then determine the domain and range. (Lesson I-6)
70. {(3,8), (3, 7), (2, -9), (1, -9), (-5, -3))72. l(0,2), (-5,1), (0, 6), (-1,9), (-4, -5)l
Lesson 4-4 Parallel and Perpendicular Lines 243
graph shown. (Lesson 4-t)
Write an equation in slope-intercept form for each
Graph each equation. (Lesson 4-l)
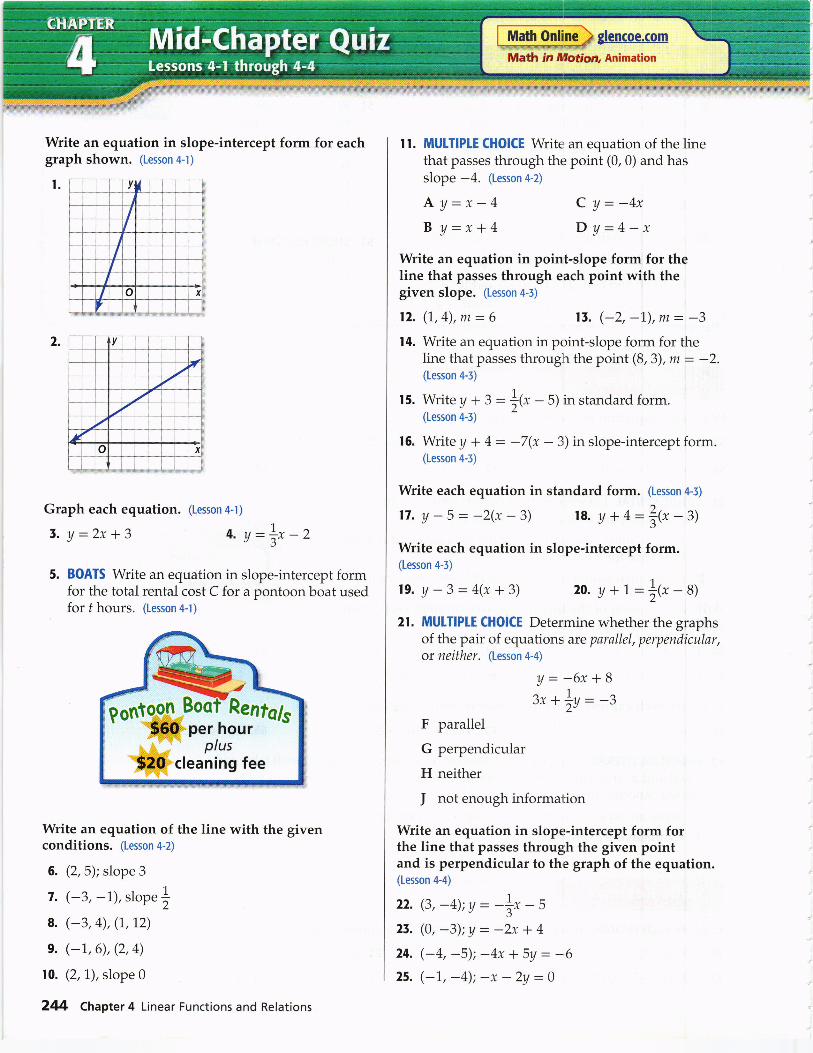
5. y:2x+3 4.y:!-Z
5. BOAIS Write an equation in slope-intercept formfor the total rental cost C for a pontoon boat usedfor f hours. (Lesson 4-l)
Write an equation of the line with the givenconditions. (Lesson 4-2)
6. (2,5); slope 3
7. (-3, -1), slope I8. (-3, 4),(1.,12)
9. (-1,6), (2,4)
10. (2,1), slope 0
2M Chapter 4 Linear Functions and Relations
i"4ffiL?'*
Math Onlins
Mafrr in ffrotiorr, Animation
ll. MULTIPLE CHOICE Write an equation of the linethat passes through the point (0, 0) and hasslope -4. (Lesson 4-2)
AY='-4B Y:x+4
C Y: -4*DY=4-'
t5.
r6.
Write an equation in point-slope form for theline that passes through each point with thegiven slope. (Lesson +-:)
12. (7,4),m:6 15. (-2, -l), m = -314. Write an equation in point-slope form for the
line that passes through the point (8,3), m - -2.(Lesson +-l)
\Nrite y * 3 = *fr -5) in standard form.(Lesson +-s)
Write y * 4 = -7(x - 3) in slope-intercept form.(Lesson +-s)
Write each equation in standard form. (Lesson +-J)
17. y - 5 : -2(x -3) 18. y + +:ltx -A)
Write each equation in slope-intercept form.(Lesson 4-5)
t9.y-3=4(x+3) 20. y+1=l<*-rl21. MUITIPLE CHOICE Determine whether the graphs
of the pair of equations are parallel, perpendicular,or neither. (Lesson 4-4)
U:-6x+83x+ty:-s
F parallel
G perpendicular
H neither
J not enough information
Write an equation in slope-intercept form forthe line that passes through the given pointand is perpendicular to the graph of the equation.(Lesson 4-4)
22. (3, -4);y = -Ly - S
2r. (0, -3);y = -2x + 4
24. (-4, -5); -4x t 5y = -625. (-1., -4); -x - 2y = 0

WhvPt lnternational Travel
The graph shows the number of people from theUnited States who travel to other countries. Thepoints do not all lie on the same line; however,you may be able to draw a line that is close toall of the points. That line would show a linearrelationship between the year x and the numberof travelers each year y. Generally, internationaltravel has increased. o ."s."+.rtr.,- +$r$o
Year
Source: Slatlstlcal,4 bstract ol the United Satus
lnvestigate Relationships Using Scatter Plots oata with two variables are called
bivariate data. A scatter plot shows the relationship between a set of data with twovariables, graphed as ordered pairs on a coordinate plane. Scatter plots are used toinvestigate a relationship between two quantities.
Evaluate a Correlation
Scatter Plots and Lines of Fit
WAGES Determine whether the graphshows a positioe, negatitte, ot nocorrelation. If there is a positive ornegative correlation, describe its meaningin the situation.
The graph shows a positive correlation. Asthe number of hours worked increases, thewages usually increase.
UheuYou wrote linear
equations given a
point and the slope.
(Lesson 4-3)
D&w' lnvestigate relationships
between quantities by
using points on scatter
plots.. Use lines of fit to
make and evaluate
predictions.
NewrUbcabulhrvrbivariate data
scatter plot
line of fitlinear interpolation
melencoe.com
. Extra Examples
. Personal Tutor
. Self-Check Quiz
. Homework Help i
. Math in Motion ?!.,
,,.* *" ".. - - -,."""".--**#
G 65,000-tfi oo,ooo
! ss,oooIg s0,000(Jp +s,oootgF +o,ooo
40r
700
600
€ soo
s 400
5 roo
200
100
0
Wages
v
a
t5 20 24 28
Hours
(l' chesk Your- Progrp.s-s;
, t. Refer to the graph on international travel. Determine whether the graph shows
, a positiae, negatiae, or no correlation. If there is a positive or negative
i correlation, describe its meaning.peersonal Tutor Slencoe.Gom
Lesson 4-5 Scatter Plots and Lines of Fit 245
v
I b.
Correlationspositive: as x increases,
y increases
negative: asx increases,
y decreases
no correlation: no
relationship between
xandy
*FselF,tSerlUJttjnlk Source: [Jltimate Roller Coaster
Step t Make a scatter plot.
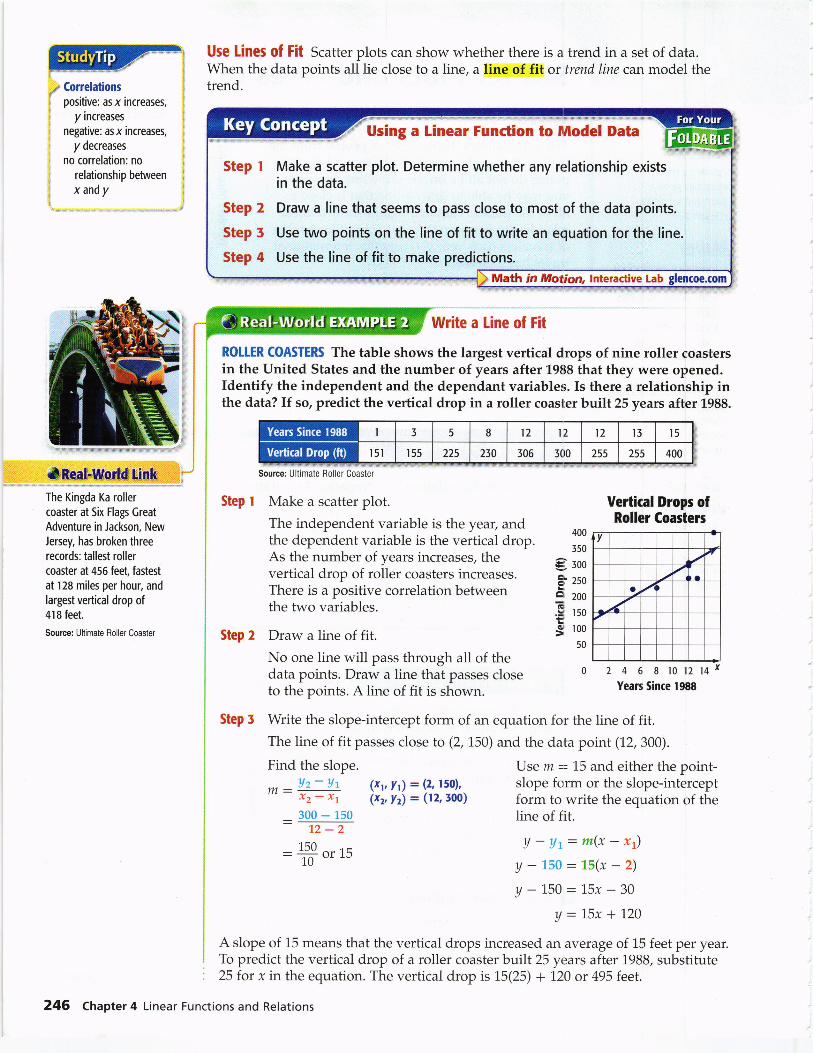
Use Lines of Fit Scatter plots can show whether there is a trend in a set of data.When the data points all lie close to a line, a line of fit or trend line can model thetrend.
Write a Line of Fit
ROttER COASTERS The table shows the largest vertical drops of nine roller coastersin the United States and the number of years after 1988 that they were opened.Identify the independent and the dependant variables. Is there a relationship inthe data? If so, predict the vertical drop in a roller coaster built 25 years after 1988.
The Kingda Ka roller
coaster at Six Flags Great
Adventure in Jackson, New
Jersey, has broken three
records: tallest roller
coaster at 456 feet, fastest
at 128 miles per hour, and
Iargest vertical drop of418 feet.
Source: Ultimate Roller Coaster
The independent variable is the year, andthe dependent variable is the veiticui drop. i::As the number of years increases, the g ;;;;i:T1lH:;l;:'.::Tffi11:f;:il"ffi'
"a ;:the two variables. E ,ro
Step 2 Draw a line of fit. E ';:No one line will pass through all of thedata points. Draw a line that passes closeto the points. A line of fit is shown.
Step f Write the slope-intercept form of an equation for the line of fit.The line of fit passes close to (2,150) and the data point (12, 300).
Use m: 15 and either the point-slope form or the slope-interceptform to write the equation of theline of fit.
!/ - Ut: m(x - xr)
y-150=15(x-2)y - 750: 15x - 30
U :75x + 120
A slope of 15 means that the vertical drops increased an average of 15 feet per year.To predict the vertical drop of a roller coaster built 25 years after 1988, substitute25 for x in the equation. The vertical drop is 15(25) + 120 or 495 feet.
Vertkal Drops ofRoller Coasters
o z 4 6 I rot2tqxYears Since 1988
Find the slope.
* _ Uz- Ar Fvfr) - (2,150),.y2 - -rr (xz,yz) - (t2, ,00)
_ 300 - 150L2-2
150- , orrs
Using a Linear Function to Model Data
Step t Make a scatter plot. Determine whether any relationship existsin the data.
Step 2 Draw a line that seems to pass close to most of the data points.
Step 5 Use two points on the line of fit to write an equation for the line.
Step 4 Use the line of fit to make predictions.
Math in Motion, lnteractive Lab
246 Chapter 4 Linear Functions and Relations
/ lnterpolation and
: Extrapolation The
1 Latin pretix inter-
I means between, and
I the Latin prelixextro-
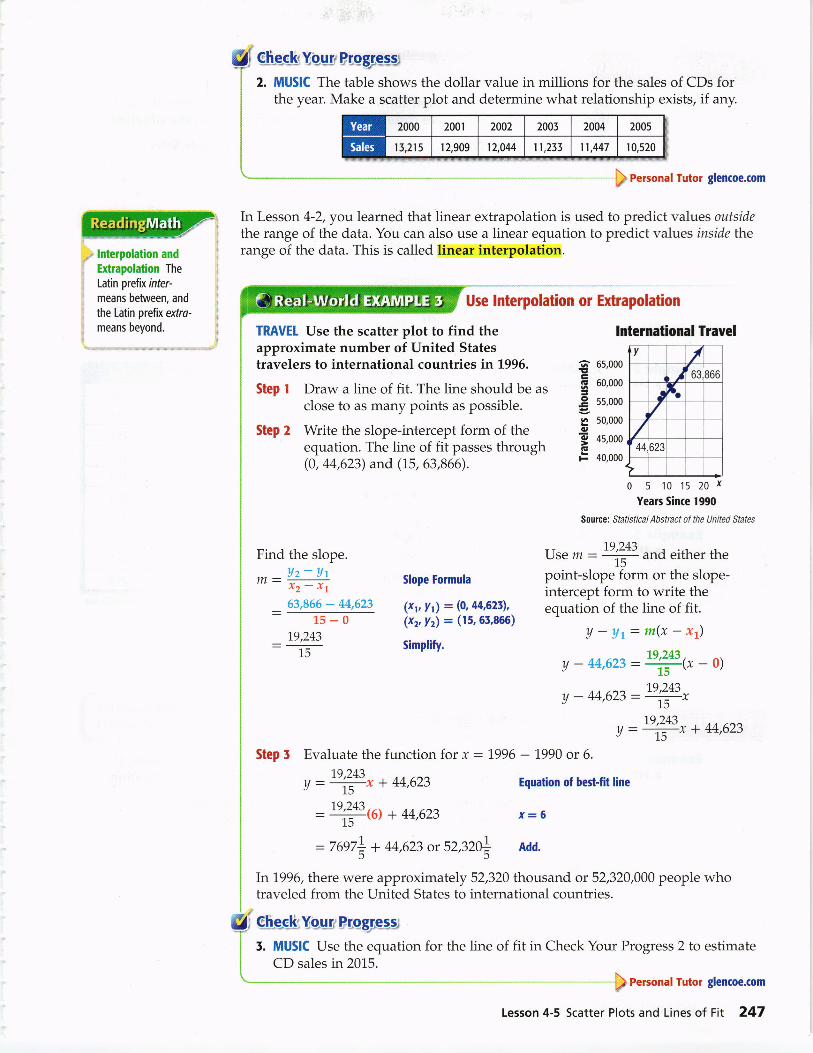
-G-h-eelkY;0utyPros;**2. MUSIC The table shows the dollar value in millions for the sales of CDs for
the year. Make a scatter plot and determine what relationship exists, if any.
p eersonal Tutor glencoe.com
ln Lesson 4-2, you learned that linear extrapolation is used to predict values outsidethe range of the data. You can also use a linear equation to predict values inside ti;re
range of the data. This is called linear interpolation.
Use lnterpolation or Extrapolation
lnternational TravelTRAVET Use the scatter plot to find theapproximate number of United Statestravelers to international countries in 1996.
Step I Draw a line of fit. The line should be as
close to as many points as possible.
Step 2 Write the slope-intercept form of theequation. The line of fit passes through(0,44,623) and (15, 63,866).
!|E
o
ooG'
65,000
60,000
55,000
50,000
45,000
40,000
Find the slope.
".. _ Az- Urtrt - *r- y,
63,866 - 44,623: 15-o19,243
15
Slope Formula
(xv yi = (0,44,621),
(xz,Yz) = (15,65,866)
Simplify.
0 5 10 15 20 x
Years Since 1990
Source: Statlsilcal Abstract of the United States
nse m = Y#and either the
point-slope form or the slope-intercept form to write theequation of the line of fit.
U-llt=m(x-x7)
y - 44,623:W1* - o)
1q.r43y - 11,623: T,
19'243 x + 44,62gY= 15
Step 5 Evaluate the function for x :1996 - 7990 or 6.
19.243y : =Gtx + 44,623 Equation of best-lit line
:'n:'!u6)+44,622 x=615
= 7697+ + 44,623 or 52320t Add.
In1996, there were approximately 52,320 thousand or 52,320,000 people whotraveled from the United States to international countries.
$:ghs-s"k:Y9gt:P,qegg,e-s;-;r"
| 5. MUSIC Use the equation for the line of fit in Check Your Progress 2 to estimate
i CD sales in 2015.\. \h------r r...-- -t^--^^-^
N
l) Personal Tutol glencoe,com
v 7I 63,866
I 5.
//44,623
Lesson 4-5 Scatter Plots and Lines of Fit 247
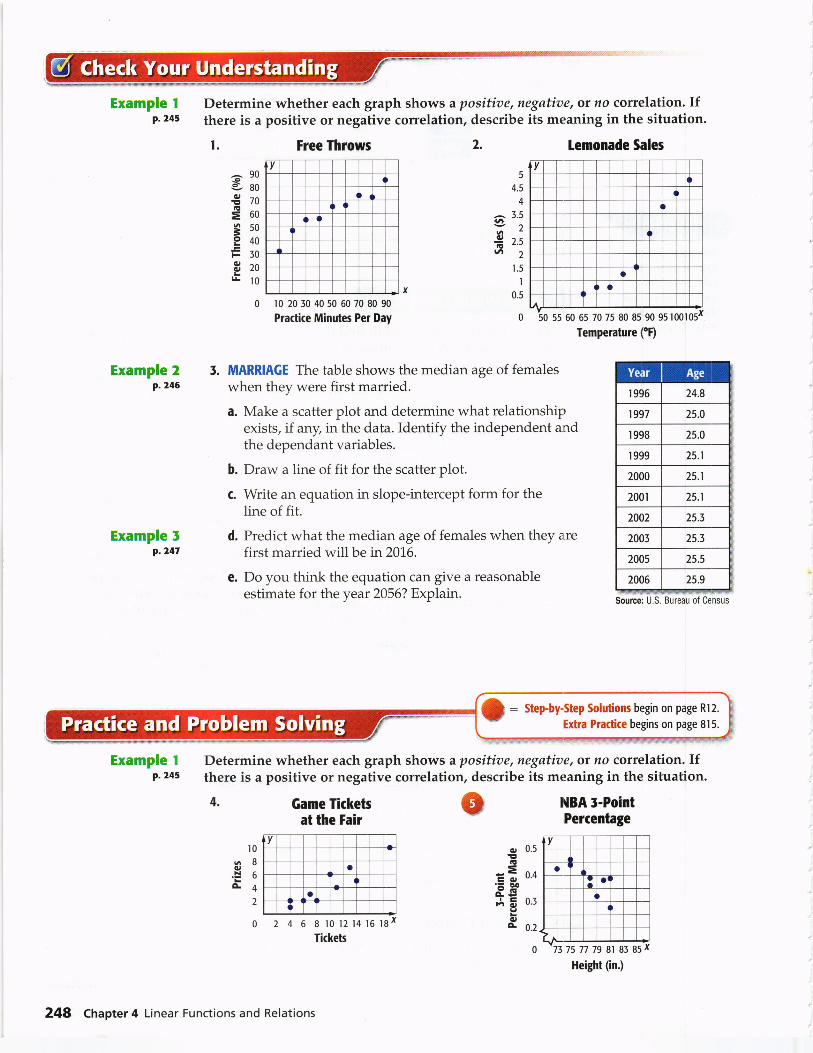
Example Ip.245
Example 2p.246
Example Ip.247
Example Ip.24t
Determine whether each graph shows a positioe, negatiae, or n o correlation. Ifthere is a positive or negative correlation, describe its meaning in the situation.
l. Free Throws 2. lemonade Sales
r0 20 30 40 50 60 70 80 90
Practice Minutes Per Day
Temperature (oF)
5. MARRIAGE The table shows the median age of femaleswhen they were first married.
a. Make a scatter plot and determine what relationshipexists, lf any, inthe data. Identify the independent andthe dependant variables.
b. Draw a line of fit for the scatter plot.
c. Write an equation in slope-intercept form for theline of fit.
d. Predict what the median age of females when they arefirst married will be in 2016.
e. Do you think the equation can give a reasonableestimate for the year 2056? Explain.
Determine whether each graph shows a positioe, negatioe, or no cotelation. Ifthere is a positive or negative correlation, describe its meaning in the situation.
NBA s.POiNtPerrentage
2 4 6 8 tO12r+15r8xTickets
5
4.5
4
^ 3.5TD6zc, ^-G -'"ttt
2
1.5
I
0.5
0
^90€ao€zoG
=60Es0e40ErofzoEl0
4. Game Ticketsat the Fair
o 0.5!,IE
=E o.+
.= b6is*S o.l!an4 0.2
io ss so 65 70 7s 80 85 90 95 tootosx
Source: U.S. Bureau ol Census
O : Step-by'Step Solutions begin on page Rl2.
Extra Practice begins on page 815.
75 77 79 8l 83 85
Height (in.)
248 chapter4 Linear Functions and Relations
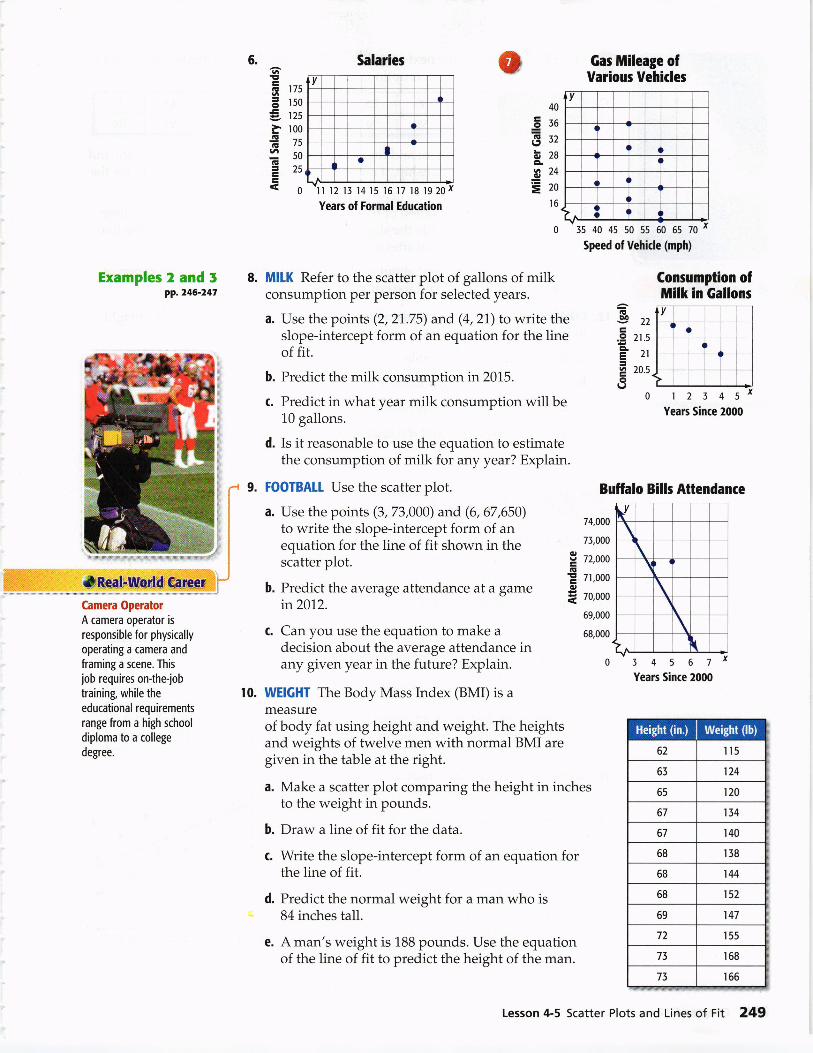
Salaries
1121514151517181920Years of Formal Education
6.
MILK Refer to the scatter plot of gallons of milkconsumption per person for selected years.
a. Use the points (2,21.75) and (4,2L) to write theslope-intercept form of an equation for the lineof fit.
b. Predict the milk consumption in 2015.
c. Predict in what year milk consumption will be10 gallons.
d. Is it reasonable to use the equation to estimatethe consumption of milk for any year? Explain.
FOOTBATL Use the scatter plot.
a. Use the points (3,73,000) and (6, 67,650)to write the slope-intercept form of anequation for the line of fit shown in thescatter plot.
b. Predict the average attendance at a gamein2012.
c. Can you use the equation to make adecision about the average attendance inany given year in the future? Explain.
10. WEIGHT The Body Mass Index (BMI)is a
measureof body fat using height and weight. The heightsand weights of twelve men with normal BMI aregiven in the table at the right.
a. Make a scatter plot comparing the height in inchesto the weight in pounds.
b. Draw a line of fit for the data.
c. Write the slope-intercept form of an equation forthe line of fit.
d. Predict the normal weight for a man who is84 inches tall.
e. A man's weight is 188 pounds. Use the equationof the line of fit to predict the height of the man.
Gas Mileage ofVarious Vehicles
35 40 4s s0 s5 60 6s 70
Speed of Vehicle (mph)
Consumption oIMilk in Gallons
12345Years Since 2000
Buflalo Bills Attendanre
5 4 5 6 7
Years Since 2000
=fi rzs
E rso
f;, tzsl. ro0.EG tJ
2soIE
=?q
40
oJO=lE zat, '^bzaaG)Aot ''Ero
l6
0
Examples 2 and Ip?.246-247
*mmFmuffiGmera OperatorA camera operator is
responsible for physically
operating a camera and
framing a scene. Thisjob requires on-the-lob
training, while the
educational requirements
range from a high school
diploma to a college
degree.
8.
=IE!9 22
.9 2r.s
=1r
E 20.5o(J
0
9.
#=iH:,
74,000
75,000
p zz,oootE
E 7r,oooq,
f, zo,ooo
69,000
68,000
0
v
(
\\
\
\I
Lesson 4-5 Scatter Plots and Lines of Fit 249
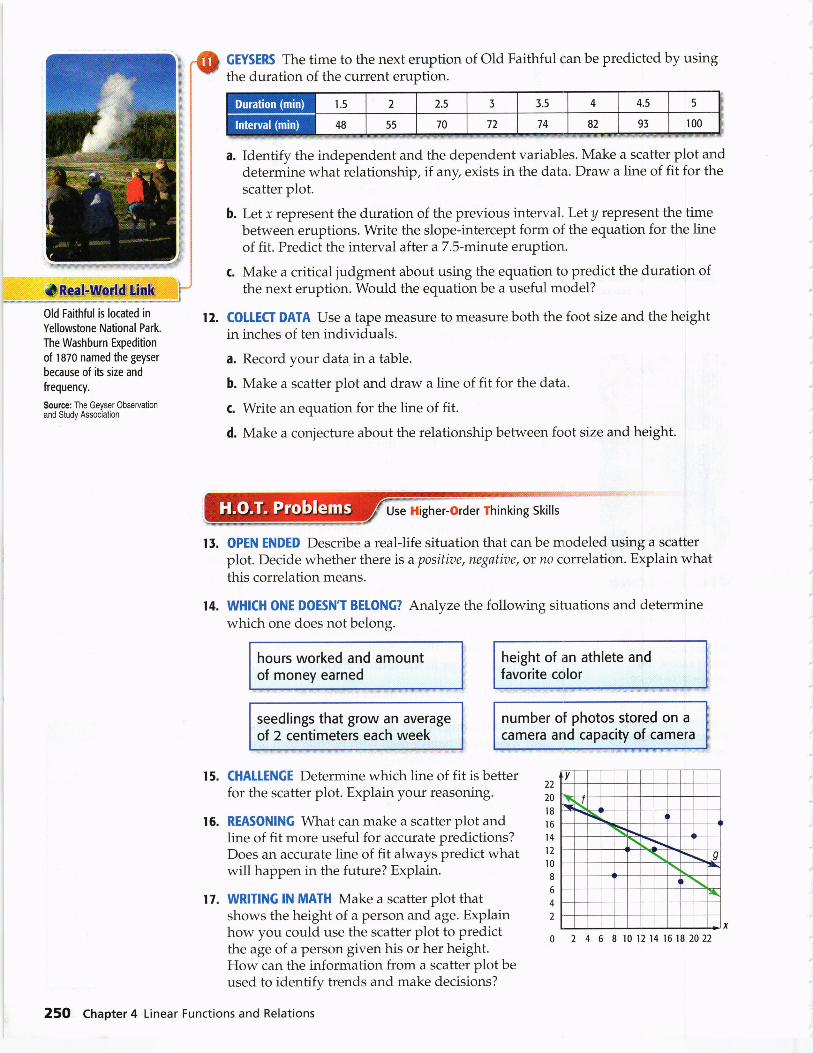
*BQalrs$tdglE&Old Faithful is located in
Yellowstone National Park.
The Washburn Expedition
of I 870 named the geyser
because of its size and
frequency.
Source: The Geyser Observationand Study Association
GEYSERS The time to the next eruption of Old Faithful can be predicted by usingthe duration of the current eruption.
a. Identify the independent and the dependent variables. Make a scatter plot anddetermine what relationship, if any, exists in the data. Draw a line of fit for thescatter plot.
b. Let r represent the duration of the previous interval. Let y represent the timebetween eruptions. Write the slope-intercept form of the equation for the lineof fit. Predict the interval after a 7.S-minute eruption.
c. Make a critical judgment about using the equation to predict the duration ofthe next eruption. Would the equation be a useful model?
12. COILECT DATA Use a tape measure to measure both the foot size and the heightin inches of ten individuals.
a. Record your data in a table.
b. Make a scatter plot and draw a line of fit for the data.
c. Write an equation for the line of fit.
d. Make a conjecture about the relationship between foot size and height.
OPEN ENDED Describe a real-life situation that can be modeled using a scatterplot. Decide whether there is apositioe, negatiue, or zo correlation. Explain whatthis correlation means.
WHICH ONE DOESN'T BETONG? Analyze the following situations and determinewhich one does not belong.
t3.
t4.
hours worked and amountof money earned
seedlings that grow an averageof 2 centimeters each week
CHATLENGE Determine which line of fit is betterfor the scatter plot. Explain your reasoning.
REASONING What can make a scatter plot andline of fit more useful for accurate predictions?Does an accurate line of fit always predict whatwill happen in the future? Explain.
17. WRITING lN MATH Make a scatter plot thatshows the height of a person and age. Explainhow you could use the scatter plot to predictthe age of a person given his or her height.How can the information from a scatter plot beused to identify trends and make decisions?
250 Chapter 4 Linear Functions and Relations
height of an athlete andfavorite color
number of photos stored on acamera and capacity of camera
15.
16.
22
20
l8l6t4t2l08
6
4
2
0 2 4 6 8 r0 12 14 16 182022
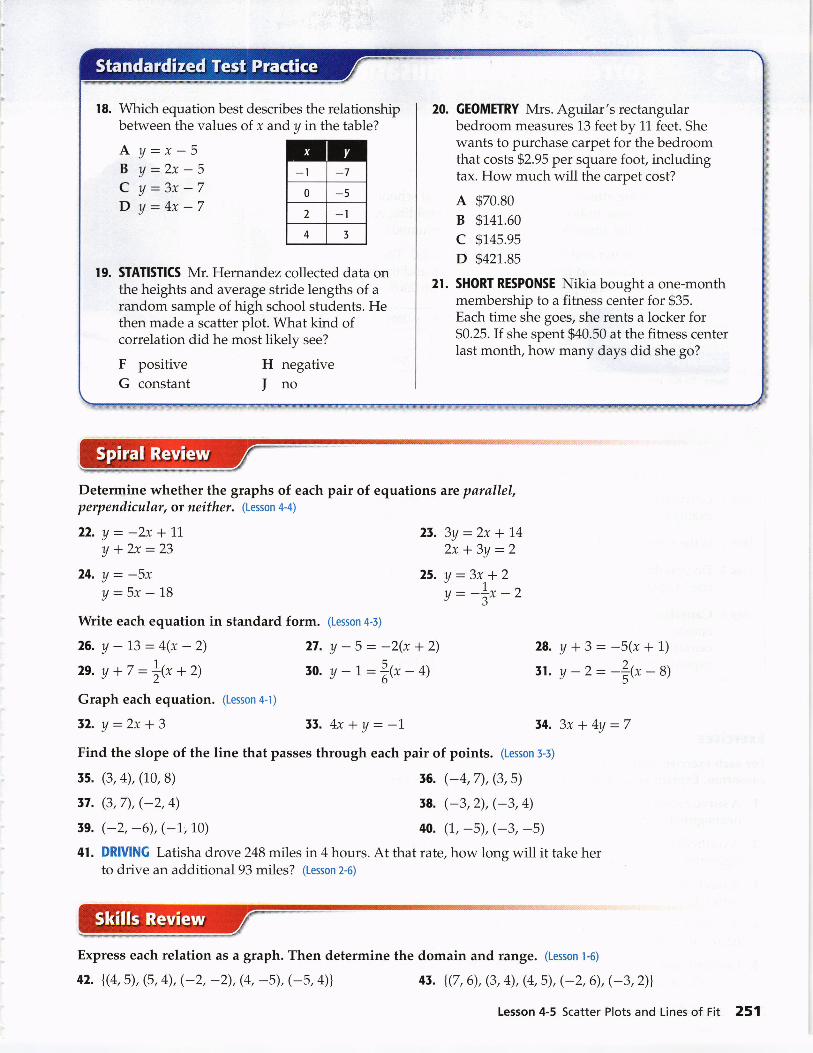
\ /hich equation best describes the relationshipbetween the values of x and y in the table?
A Y=x-5B Y:2x-5c y=3x-7D y=4x-7
19. STATISTICS Mr. Hernandez collected data onthe heights and average stride lengths of arandom sample of high school students. Hethen made a scatter plot. What kind ofcorrelation did he most likely see?
F positiveG constant
GEOMEIRY Mrs. Aguilar's rectangularbedroom measures 13 feet by 11 feet. Shewants to purchase carpet for the bedroomthat costs $2.95 per square foot, includingtax. How much will the carpet cost?
A $70.80
B $141.60
c $14s.95D $421.8s
SHORT RESPONSE Nikia bought a one-monthmembership to a fitness center for $35.Each time she goes, she rents a locker for$0.25. If she spent $40.50 at the fitness centerlast month, how many days did she go?
Determine whether the graphs of each pair of equations arc parallel,perpendicular, or neither. (Lesson 4-4)
22. y: -2x + 11
Y * 2x:2324. y = -5v
U=5x-1'8Write each equation in standard form. (Lesson +-l)
2!.3y:2x+142x+3y=2
25. v-3x+2a:-f,r-r.
26.y-13:4(x-2)2e.y+z=l{x+2)
Graph each equation. (Lesson +-t)
,2. y-2x+3
!5. (3,4), (10, B)
t7. (3,7), (-2,4)
59. (-2, -6), (-1, 10)
21. y-5:-2(x+2)to.y-t=l{x-+)
55.4x*y:-1.
28. y + 3 = -5(x + 1)
tt.y-z:-l{x-a)
54.3xt4=7Find the slope of the line that passes through each pair of points. (Lesson 3-3)
56. (-4,7), (3,5)
58. (-3,2), (-3,4)
40. (1, -5), (-3, -5)41. DRIVING Latisha drove 248 miles in 4 hours. At that rate, how long will it take her
to drive an additional 93 miles? (Lesson 2-6)
Express each relation as a graph. Then determine the domain and range. (Lesson t-6)
4t. {(7, 6), (3, 4), (4, 5), (-2, 6), (-3, 2)l42. {(4,5), (5, 4), (-2, -2), (4, -5), (-5,4)l
Lesson 4-5 Scatter Plots and Lines of Fit 251
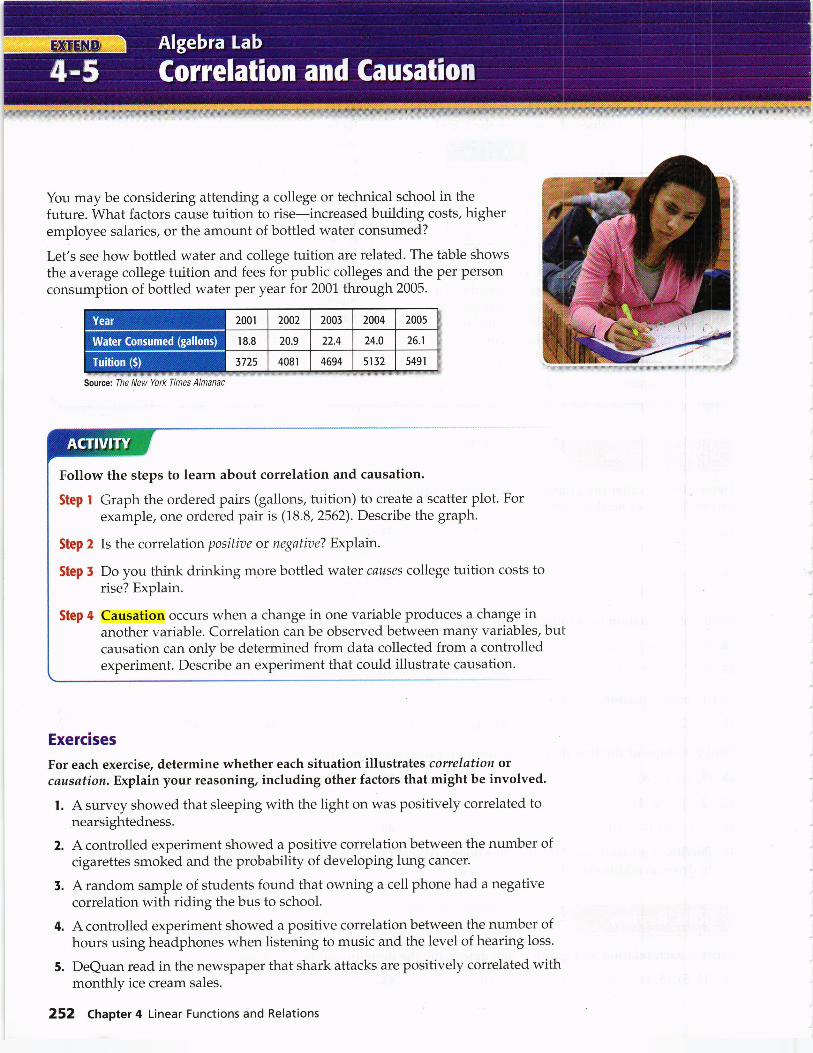
You may be considering attending a college or technical school in thefuture. What factors cause tuition to rise-increased building costs, higheremployee salaries, or the amount of bottled water consumed?
Let's see how bottled water and college tuition are related. The table showsthe average college tuition and fees for public colleges and the per Personconsumption of bottled water per year for 2001 through 2005.
Follow the steps to learn about correlation and causation.
Step I Graph the ordered pairs (gallons, tuition) to create a scatter plot. Forexample, one ordered pair is (18.8,2562). Describe the graph.
Step 2 Is the correlationpositiae or negatiae? Explain.
Step 5 Do you think drinking more bottled water causes college tuition costs torise? Explain.
Step 4 Causation occurs when a change in one variable produces a change inanother variable. Correlation can be observed between many variables, butcausation can only be determined from data collected from a controlledexperiment. Describe an experiment that could illustrate causation.
Exercises
For each exercise, determine whether each situation illustrates correlation orcausation. Explain your reasoning, including other factors that might be involved.
l. A survey showed that sleeping with the light on was positively correlated tonearsightedness.
2. A controlled experiment showed a positive correlation between the number ofcigarettes smoked and the probability of developing lung cancer.
5. A random sample of students found that owning a cell phone had a negativecorrelation with riding the bus to school.
4. A controlled experiment showed a positive correlation between the number ofhours using headphones when listening to music and the level of hearing loss.
5. DeQuan read in the newspaper that shark attacks are positively correlated withmonthly ice cream sales.
252 Chapter 4 Linear Functions and Relations
Source: The New York Times Alnanac
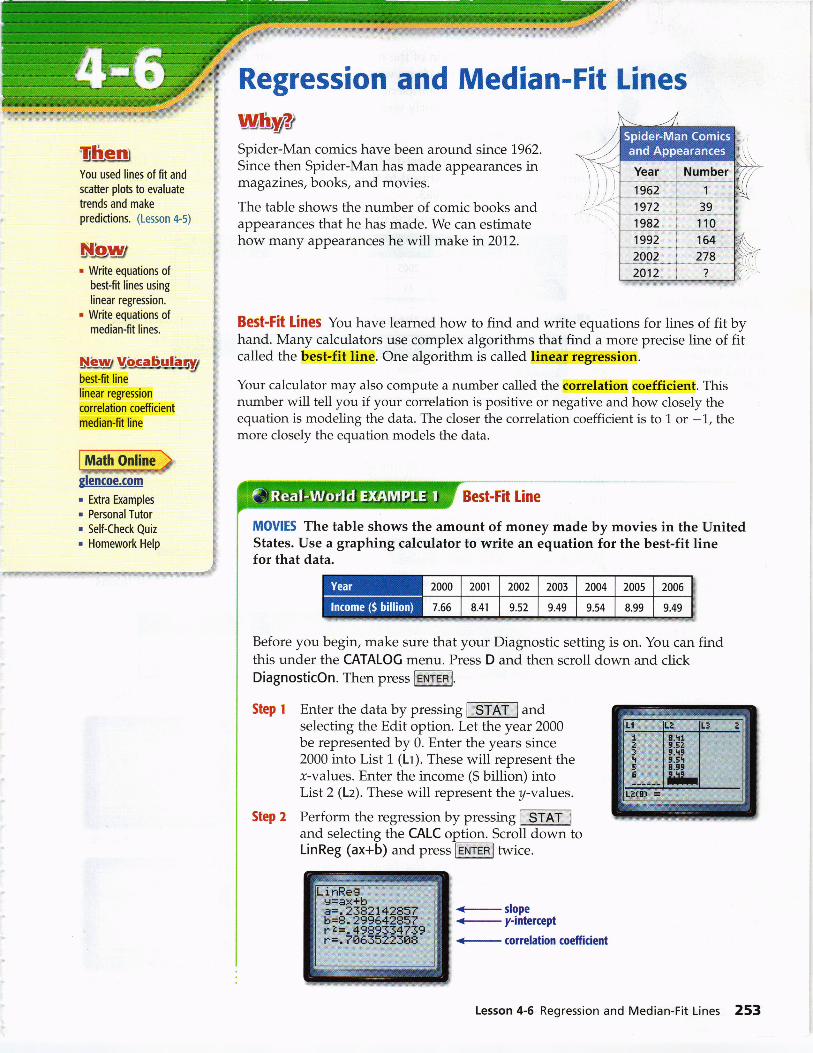
ThsruYou used lines of fit and
scatter plots to evaluate
trends and make
predidions. (Lesson 4-5)
Dlluur. Write equations of
best-fit lines using
linear regression.. Write equations of
median-fit lines.
NGw Vbcabulbnzbest-fit linelinear regression
correlation coefficient
median-fit line
glencoe.com
. Extra Examples
. Personal Tutor
. Self-Check Quiz
. Homework Help
<- slope<_ y-intercept
correlation coefficient
Regression and Median-Fit Lines
Spider-Man comics have been around since 1962. \=Since then Spider-Man has made appearances inmagazines, books, and movies.
The table shows the number of comic books andappearances that he has made. We can estimatehow many appearances he will make in 2012.
Best-Fit Lines You have learned how to find and write equations for lines of fit byhand. Many calculators use complex algorithms that find a more precise line of fitcalled the best-fit line. One algorithm is called linear regression.
Your calculator may also compute a number called the correlation coefficient. Thisnumber will tell you if your correlation is positive or negative and how closely theequation is modeling the data. The closer the correlation coefficient is to 1 or -1, themore closely the equation models the data.
Best-Fit Line
MOVIES The table shows the amount of money made by movies in the UnitedStates. Use a graphing calculator to write an equation for the best-fit linefor that data.
Before you begin, make sure that your Diagnostic setting is on. You can findthis under the CATALOG menu. Press D and then scroll down and clickDiagnosticOn. Then press EtrrtERI.
Step I Enter the data by pressing fSiATl andselecting the Edit option. Let the year 2000be represented by 0. Enter the years since2000 into List 1 (Lt). These will represent thex-values. Enter the income ($ billion) intoList 2 (Lz). These will represent the y-values.
Step 2 Perform the regression by pressing [S-TAT 1
and selecting the CALC option. Scroll down toLinReg (ax+b) and press ENTEEI twice.
Lesson 4-6 Regression and Median-Fit Lines 253
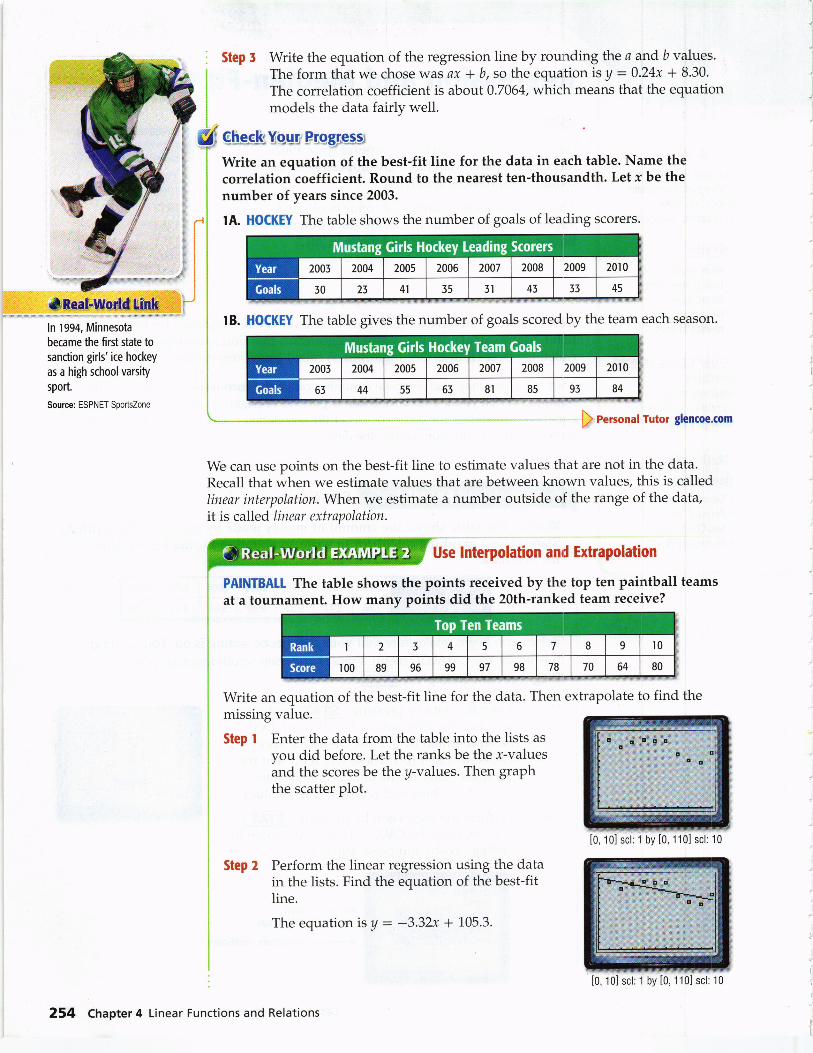
Step 5 Write the equation of the regression line by rounding the a and b values.The form that we chose was ax * b, so the equation is y - 0.24x + 8.30.
The correlation coefficient is about 01064, which means that the equationmodels the data fairly well.
*!,e$-,W1od1*ghkln 1994, Minnesota
became the first state to
sanction girls' ice hockey
as a high school varsity
sport.
Source: ESPNET Sportszone
PAINTBAII The table showsat a tournament. How many
Step I Enter the data from the table into the lists as
you did before. Let the ranks be the r-valuesand the scores be the y-values. Then graphthe scatter plot.
Step 2 Perform the linear regression using the datain the lists. Find the equation of the best-fitline.
The equation is y - -3.32x + 105.3.
[0,10] scl:1 by [0,110] scl:10
[0,10] scl:1 by [0, 110] scl:10
S qh.esk Yo,g1, Pxo g,1e-.s'-g
Write an equation of the best-fit line for the data in each table. Name thecorrelation coefficient. Round to the nearest ten-thousandth. Let x be thenumber of years since 2003.
,'= r lA. HOCKEY The table shows the number of goals of leading scorers.
lB. HOCKEY The table gives the number of goals scored by the team each season.
) eersonal Tutor glencoe.com
We can use points on the best-fit line to estimate values that are not in the data.
Recall that when we estimate values that are between known values, this is calledlinenr interpolation. When we estimate a number outside of the range of the data,it is called linear extrapolation.
Use lnterpolation and Extrapolation
the points received by the top ten paintball teamspoints did the 20th-ranked team receive?
Write an equation of the best-fit line for the data.missing value.
Then extrapolate to find the
254 Chapter 4 Linear Functions and Relations
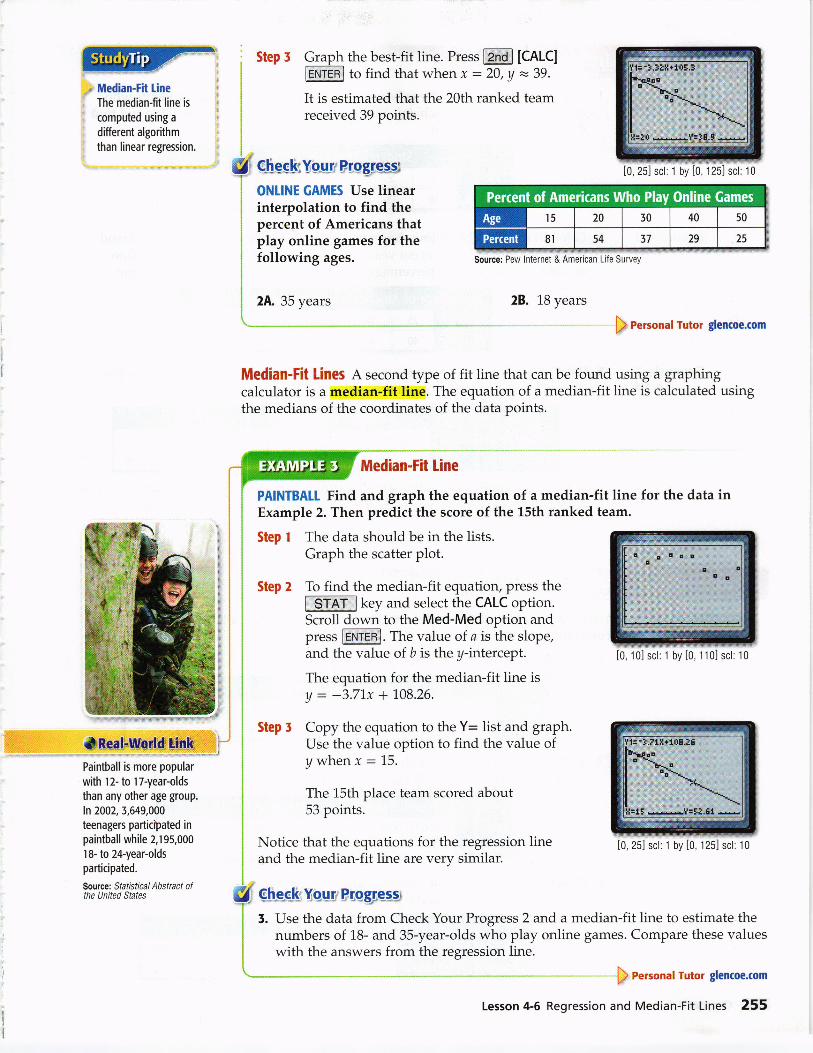
Step 5 Graph the best-fit line. Press [7ndl [CALC]E\[ER-] to find that when x = 20, y = 39.
It is estimated that the 20th ranked teamreceived 39 points.
{ GheckYour Progressr
ONIINE GAMES Use linearinterpolation to find thepercent of Americans thatplay online games for thefollowing ages.
2A. 35 years 28. 18 years
Median-Fit Lines e second type of fit line that can be found using a graphingcalculator is a median-fit line. The equation of a median-fit line is calculated usingthe medians of the coordinates of the data points.
Median-Fit [ine
PAINTBALI Find and graph the equation of a median-fit line for the data inExample 2. Then predict the score of the L5th ranked team.
5i Check Your Progress
' 5. Use the data from Check Your Progress 2 and a median-fit line to estimate the: numbers of 18- and 3S-year-olds who play online games. Compare these valuesi with the answers from ihe regression line.
) eersonal Tutor glencoe.(om
Median-Fit Line
The median-fit line is
computed using a
different algorithm
than linear regression.
*8e.1,1!lill,wli*$"1tft:
Paintball is more popular
with 12- to l7-year-oldsthan any other age group.
ln 2002, 3,649.000
teenagers participated inpaintball while 2, I 95,000
I8- to 24-year-olds
participated.
Source: Slallslrcal,4 bstract ofthe United States
Step I The data should be in the lists.Graph the scatter plot.
Step 2 To find the median-fit equation, press the
ISTAT I key and select the CALC option.Scroll down to the Med-Med option andpress lExrrnl. The value of a is the slope,and the value of b is the y-intercept.
, The equation for the median-fit line is: y:-3.71,x+L08.26.
Step 5 Copy the equation to the Y= list and graph.' Use the value option to find the value of
Twhenx=15.
, The 15th place team scored about, 53 points.
, Notice that the equations for the regression liner and the median-fit line are very similar.
,.aa:,,::,::,:.:a;.:::F e I:,::,::.,!;:::::,:::,: :.:.:,
. . t!I
lo, tol scl:1 by [0,110] scl:10
Itr:}rri$rtqg.r5
ll:llEr.i;i;i:i:;1|:5}:E1 *
[0,25] scl:1 by [0, 125] scl:10
[0,25] scl:1 by [0,125] scl:10
Source: Pew lnternet & American Life Survey
iliTir",1 t.!l
l,$
tfE
Lesson 4-6 Regression and Median-Fit Lines 255
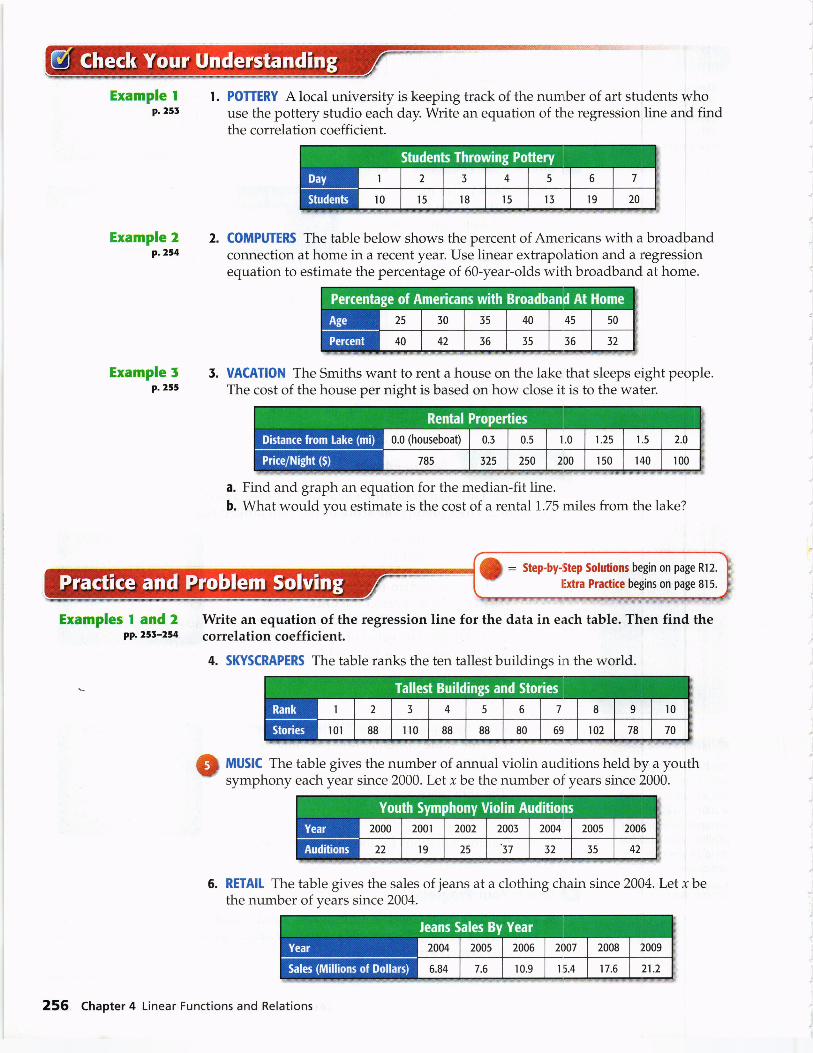
Example Ip.2!tl
Example 2p.254
Example 5p.255
Examples I and 2pp.2st-234
t. POTIERY Alocal university is keeping track of the number of art students whouse the pottery studio each day. Write an equation of the regression line and findthe correlation coefficient.
COMPUTERS The table below shows the percent of Americans with a broadbandconnection at home in a recent year. Use linear extrapolation and a regressionequation to estimate the percentage of 60-year-olds with broadband at home.
5. VACATION The Smiths want to rent a house on the lake that sleeps eight people.The cost of the house per night is based on how close it is to the water.
a. Find and graph an equation for the median-fit line.b. \A/hat would you estimate is the cost of a rental 1.75 miles from the lake?
Write an equation of the regression line for the data in each table. Then find thecorrelation coefficient.
4. SKYSCRAPERS The table ranks the ten tallest buildings in the world.
@ ttlUSlC The table gives the number of annual violin auditions held by a youth- symphony each year since 2000. Let x be the number of years since 2000.
6. RETAIL The table gives the sales of jeans at a clothing chain since 2004. Let r bethe number of years since 2004.
2.
256 Chapter 4 Linear Functions and Relations
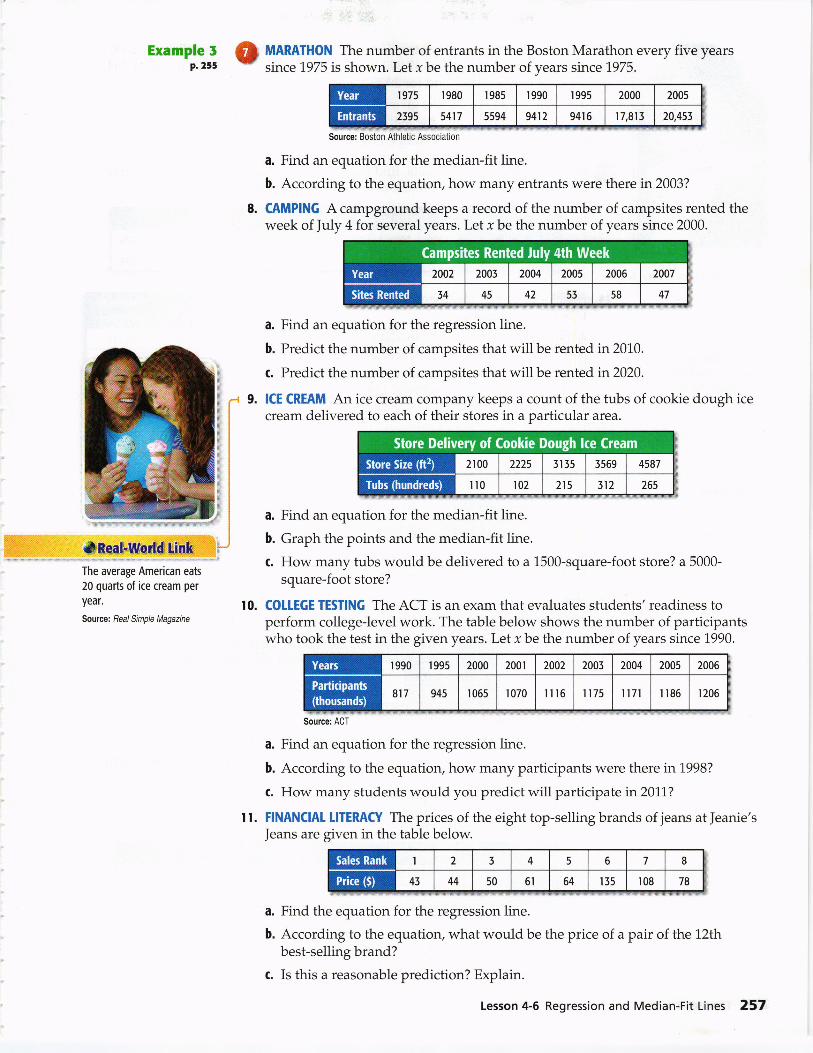
Example 5p.255
MARATHON The number of entrants in the Boston Marathon every five yearssince 1975 is shown. Let x be the number of years since 1975.
Source: Boston Athletic Association
a. Find an equation for the median-fit line.
b. According to the equation, how many entrants were there in 2003?
CAMPING A campground keeps a record of the number of campsites rented theweek of July 4 for several years. Let r be the number of years since 2000.
a. Find an equation for the regression line.
b. Predict the number of campsites that will be rented in 2010.
c. Predict the number of campsites that will be rented in 2020.
ICE CREAM An ice cream company keeps a count of the tubs of cookie dough icecream delivered to each of their stores in a particular area.
a. Find an equation for the median-fit line.
b. Graph the points and the median-fit line.
c, How many tubs would be delivered to a 150O-square-foot store? a 5000-
square-foot store?
COTLEGE TESTING The ACT is an exam that evaluates students'readiness toperform college-level work. The table below shows the number of participantswho took the test in the given years. Let x be the number of years since 1990.
Source: ACT
a. Find an equation for the regression line.
b. According to the equation, how many participants were there in 1998?
c. How many students would you predict will participate in2011?
FINANCIAI LITERACY The prices of the eight top-selling brands of jeans at Jeanie'sJeans are given in the table below.
a. Find the equation for the regression line.
b. According to the equation, what would be the price of a pair of the 12thbest-selling brand?
c. Is this a reasonable prediction? Explain.
Lesson 4-6 Regression and Median-Fit Lines 257
8.
9.
The average American eats
20 quarts of ice cream per
year.
Source: Rul Simple Magazine
10.
t t.
12. STATE FAIRS Opening day attendance at the North Carolina State Fair for 2000
was 53,331, for 2001 it was 47,940,tor 2002 it was 54,036, for 2003 it was 61.,364,
for 2004 it was 6L,289, and for 2005 it w as 52,20L.
a. Construct a table for the given data.b. Graph the points and the regression line.c. Predict the attendance on opening day in2012.
MUSIC For the fotlowing data, find the equation of the regression line and givethe correlation coefficient to the nearest ten-thousandth place.
FIREFIGHTERS The table shows statistics from theU.S. Fire Administration.a. Find an equation for the median-fit line.b. Graph the points and the median-fit line.c. Does the median-fit line give you an accurate picture
of the number of firefighters? Explain.
Florence NightingaleDavid (r909-1995)
A renowned statistician
born in lvingon, England,
Florence Nightingale David
received the first Elizabeth
L. Scott Award for her
"efforts in opening the
door to women in
statistics; ... for research
contributions to ...statistical methods ...; and
her spirit as a lecturer and
as a role model."
14.
15. ATHLETICS The table shows the number of participants in high school athletics.
a. Find an equation for the regression line.b. According to the equation, how many participated in 1988?
16. ART A count was kept on the number of paintings sold at an auction by the yearin which they were painted. Let r be the number of years since 1950.
a. Find the equation for the linear regression line.b. How many paintings were sold that were painted in 1961.?
c. Is the linear regression equation an accurate model of the data? Explain whyor why not.
17. SCHOOT The table shows the average cost of a technical school between 2000
and 2006. Let x be 0 for the school year 2000-2001.
Source: U.S. Department of Education
a. Find the equation of the median-fit line.b. Graph the points and the median-fit line.c. \Atrhat would you estimate the cost to be in 2020-2021?
258 Chapter 4 Linear Functions and Relations
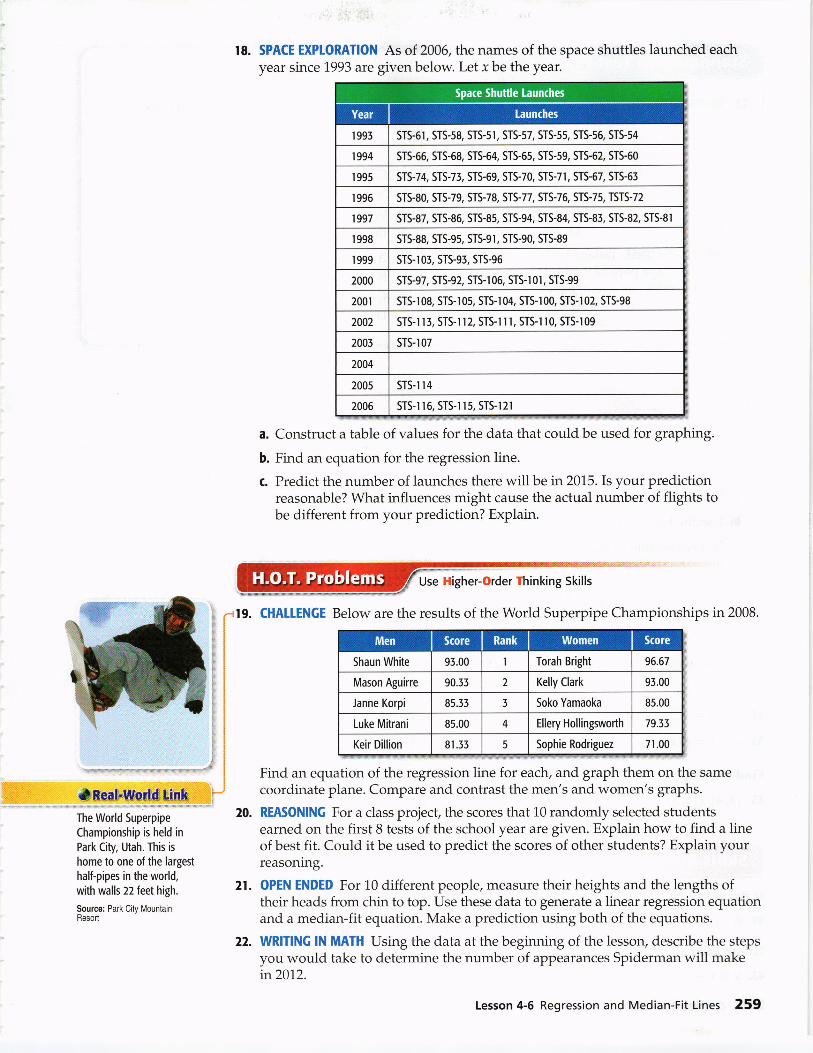
lS. SPACE EXPLORATION As of 2006,the names of the space shuttles launched each
year since 1993 are given below. Let x be the year.
a. Construct a table of values for the data that could be used for graphing.
b. Find an equation for the regression line.
c. Predict the number of launches there will be in 2015. Is your predictionreasonable? \Mhat influences might cause the actual number of flights tobe different from your prediction? Explain.
*&eat"U[u]td[itrk :.*i
19. CHAIIENGE Below are the results of the World Superpipe Championships in 2008.
Find an equation of the regression line for each, and graph them on the samecoordinate plane. Compare and contrast the men's and women's graphs.
REASONING For a class project, the scores that 10 randomly selected studentsearned on the first 8 tests of the school year are given. Explain how to find a lineof best fit. Could it be used to predict the scores of other students? Explain yourreasoning.
OPEN ENDED For 10 different people, measure their heights and the lengths oftheir heads from chin to top. Use these data to generate a linear regression equationand a median-fit equation. Make a prediction using both of the equations.
WRITING lN MATH Using the data at the beginning of the lesson, describe the stepsyou would take to determine the number of appearances Spiderman will makein2012.
The World Superpipe
Championship is held in
Park City, Utah. This is
home to one of the largest
half-pipes in the world,
with walls 22 feet high.
Source: Park City MountainResort
20.
21.
sTs-61, sTS-s8, STS-5r, STS-57, STS-55, 5T5-56, STS-54
sTs-56, sTs-68, sTS-64, sTs-65, sTs-sg, sTS-62, 5T5-60
sT5-74, STS-73, 5T5-69, STS-70, STS-7r, 5T5-67, 5T5-65
STS-80, STS-79, STS-78, STS.77, STS-76, STS-75, TSTS.72
sTs-87, sTS-86, 5TS-8s, STS-94, STS-84, STS-83, STS-82, STS-81
STS.88, STS.95, STS-9I, STS.9O, STS-89
sTS-97, STS-92, STS-r06, STS-r0r, STS-99
STS-I08, STS.I05, STS.I04, STS.IOO, STS.I02, STS.98
sTs-l 15, sTS-r r2, sTs-r r r, sTS-r r0, sTS-r09
STS-I I4
sTS-r r6, sTS-r rs. STS-r2r
Use Higher-Order Thinking Skills
22.
Lesson 4-6 Regression and Median-Fit Lines 259

GEOMETRY Sam is putting a border around a
poster. x represents the poster's width, andy represents the poster's length. Whichequation represents how much border Samwill use if he doubles the length and thewidth?
C 4(x +y)D 1.6(x + y)
SHORT RESPONSE Thtiana wants to run 5 milesat an average pace of 9 minutes per mile.After miles, her average pace is 9 minutes10 seconds. In how many minutes must shecomplete the final mile to reach her goal?
What is the slope of the line that passes
through (1, 3) and (-3,1)?
What is an equation of the line that passes
through (0, 1) and has a slope of 3?
A Y:3x-IB Y=3x-2C Y=3x*4D Y:3x*1'
27. USED CARS Gianna wants to buy a specific make and model of a usedcar. She researched prices from dealers and private sellers and madethe graph shown. (Lesson 4-5)
a. Describe the relationship in the data.
b. Use the line of fit to predict the price of a car that is 7 years old.
c. Is it reasonable to use this line of fit to predict the price of a 10-year-old car? Explain.
GEOMETRY A quadrilateral has sides with equations A = -2x,2x * !/ - 6, y : Lr, + 6, and. x - 2y : 9. Is the figure a rectangle?
Explain your reasoning. (Lesson +-+)
Write each equation in standard form. (Lesson +-l)
5,0.y- 5:6(r+1)t2. y+z:|1x+4)54. y+z=-l1x+2)
at. f(a)
45. 2x - 3y :6
Used Cars
38. (-3, 2), (-3,4)
42. f(b + 2)
46. 5x -l2y :6
llArorE^
€8o7trblEq
o4
6r^'=4l
0
Find the slope of the line that passes through each pair of points. (Lesson 3-3)
55. (3,4), (10,8) ,6. (-4,7), (3,5) 57. (3,7), (-2,4)
29.y-2=3(x-1)tl.y+2:*2(x-5)t!.y-t:l@+e)
- x * 1., find each value. (Lesson I-7)
Graph each equation.
40. /(5) - 3
(Lesson 5-l )
43. Y:Y12 44. x*5Y:4260 Chapter 4 Linear Functions and Relations
lff(xl = x2
!e. f(-1)
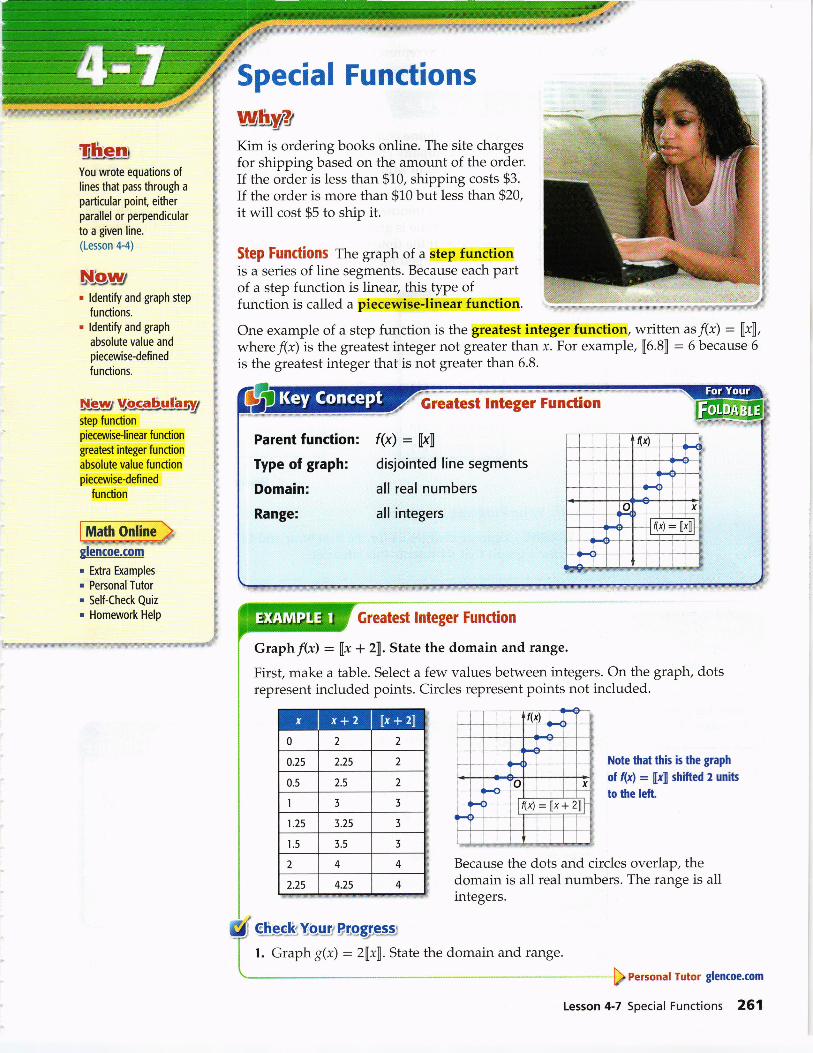
Special Functions
ThenYou wrote equations of
lines that pass through a
particular point, eitherparallel or perpendicular
to a given line.
(Lesson 4-4)
bllsur. ldentify and graph step
functions.. ldentify and graph
absolute value and
piecewise-defined
functions.
Ntswr V6cabulbrwr+4..#!'
step functionpiecewiselinear f unction
greatest integer f unction
absolute value functionpiecewise-defined
function
slencoe.com
. Extra Examples
. Personal Tutor
. Self-Check Quiz
. Homework Help
Kim is ordering books online. The site chargesfor shipping based on the amount of the order.If the order is less than $10, shipping costs $3.If the order is more than $10 but less than $20,it will cost $5 to ship it.
Step Functiotls The graph of a step functionis a series of line segments. Because each partof a step function is linear, this type offunction is called a piecewise-linear function.
One example of a step function is the greatest integer function, written as f(x) = [xn,where/(r) is the greatest integer not greater than r. For example, [6.8] = 6 because 6
is the greatest integer that is not greater than 6.8.
Greatest lnteger Function
Graphflr) = [x * 2!. State the domain and range.
First, make a table. Select a few values between integers. On the graph, dotsrepresent included points. Circles represent points not included.
Note that this is the graph
of (x) - [x] shifted 2 units
to the left.
Because the dots and circles overlap, thedomain is all real numbers. The range is allintegers.
G*l!"ec_k:YsqrPrqgJeA*
l. Graph 8@):2[x]. State the domain and range.
p Rersonal Tutor gtencoe.com
Lesson 4-7 Special Functions 261
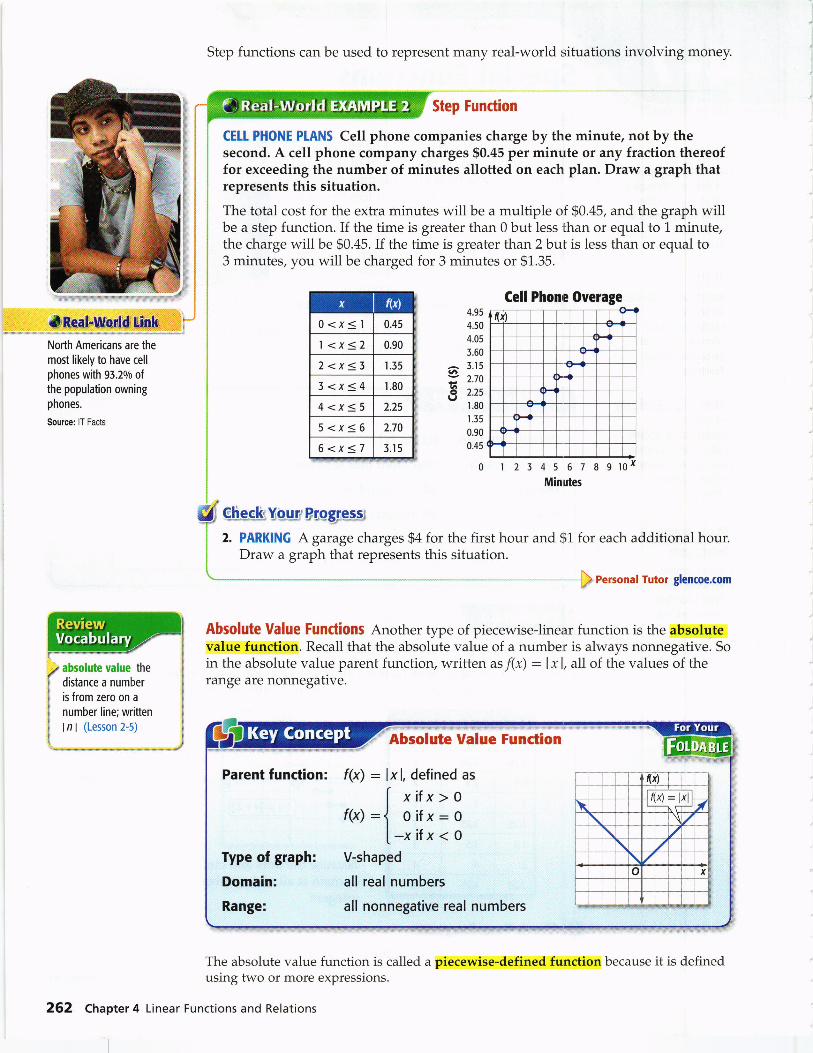
Nofth Americans are themost likely to have cell
phones with 93.20/o olthe population owningphones.
Source: lT Facts
The absolute value function is called a
using two or more expressions.
262 Chapter 4 Linear Functions and Relations
Step functions can be used to represent many real-world situations involving money.
Step Function
CELI PHONE PTANS Cell phone companies charge by the minute, not by thesecond. A cell phone company charges $0.45 per minute or any fraction thereoffor exceeding the number of minutes allotted on each plan. Draw a graph thatrepresents this situation.
The total cost for the extra minutes will be a multiple of $0.45, and the graph willbe a step function. If the time is greater than 0 but less than or equal to 1 minute,the charge will be $0.45. If the time is greater than 2 but is less than or equal to3 minutes, you will be charged for 3 minutes or $1.35.
for each additional hour.
) Rersonal Tutor glencoe.com
Absolute Value Functions Another type of piecewise-linear function is the absolutevalue function. Recall that the absolute value of a number is always nonnegative. Soin the absolute value parent function, written as f(x) : I xl, all of the values of therange are nonnegative.
4.95
4.50
4.05
3.60
^ 3.r5U}
= 2.70
$ z.zs
I.80I .35
0.90
0.45
0
7 absolute value the
I distance a numberI is from zero on a
i number line;written
i tn t (Leson 2-s)
Cell Phone Overage
*tsealtt{o*lidHink 0<x<11 <x<22<x<33<x<44<x=55<x<66<x<7
f@) : lxl, defined as
I xifx > 0f(x):{ o itX:0
[-xifx<oV-shaped
all real numbers
all nonnegative real numbers
piecewise-defined function because it is defined
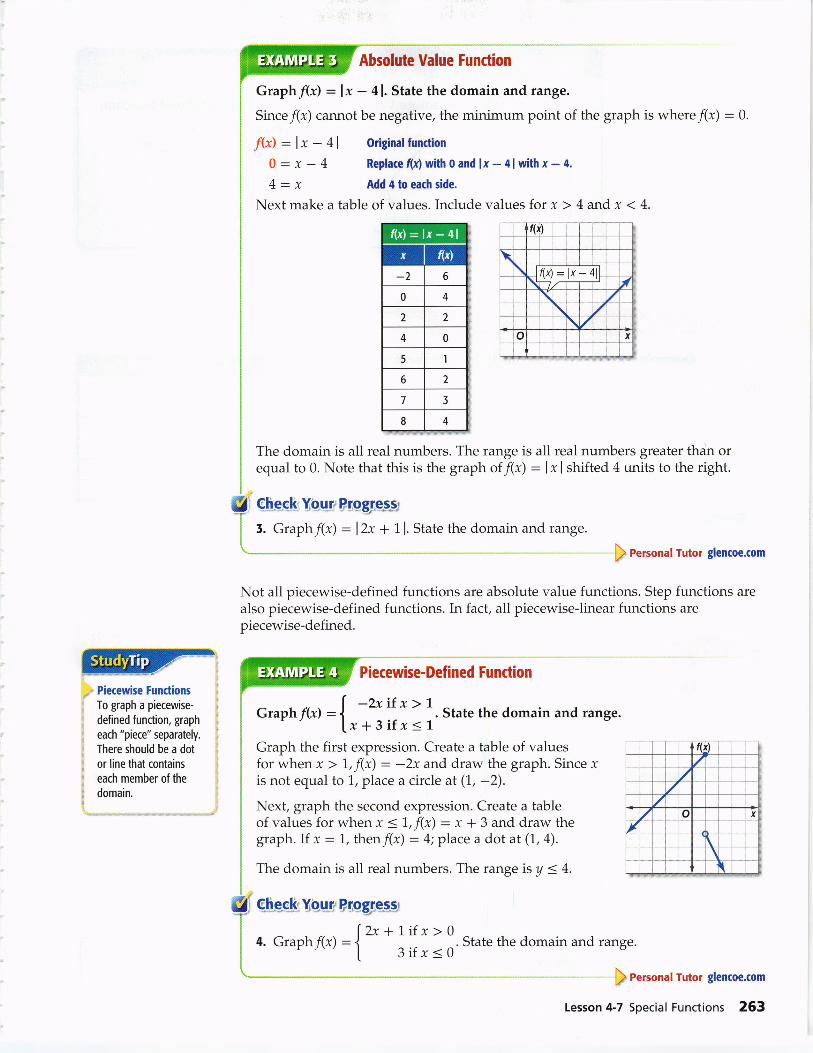
W.y Piecewise Functions
: To graph a piecewise-
: defined function, graph
, each "piece" separately.
., There should be a dot
,. or line that contains
rr each member of the: domain.
Absolute Value Function
Graphflr) : lx - 4l. State the domain and range.
Since/(x) cannot be negative, the minimum point of the graph is where/(r) : 0.
f(x) : lx - 4l originalfunction
O:x-4 Replace (x) with 0 and lx - 4l with x - 4.
Add 4 to each side.
Next make a table of values. Include values for x > 4 and x < 4.
t(xl
!f(x)=lx-41--1 ,/--1----1----1' :,
io x
The domain is all real numbers. The range is all real numbers greater than orequal to 0. Note that this is the graph of f(x) : lx I shifted 4 units to the right.
c_h_e_ckYg,glBtqg;e-s.q
5. Graphflx) : l2x + 1 l. State the domain and range.
p Rersonal Tutor gtencoe.com
Not all piecewise-defined functions are absolute value functions. Step functions are
also piecewise-defined functions. In fact, all piecewise-linear functions arepiecewise-defined.
Piecewise-Defined Function
Graphflx) :{.:;'r'r..1'. ,,u," the domain and range.
Graph the first expression. Create a table of valuesfor when x > 1,,f(x) : -2x and draw the graph. Since ris not equal to 1, place a circle at (1., -2).Next, graph the second expression. Create a tableof values for when x < 7, f(x) = x * 3 and draw thegraph. If x :1, then/(x) : 4; place a dot at (1, 4).
The domain real numbers. The range is y < 4.
9l!-ee3:Yo.urBregtre*q*
(zx+1ifx>04. Graphflx) : i . State the domain and range.
|. 3ifx<0p,Rersonal Tutor glsncoe.com
Lesson 4-7 Special Functions 263
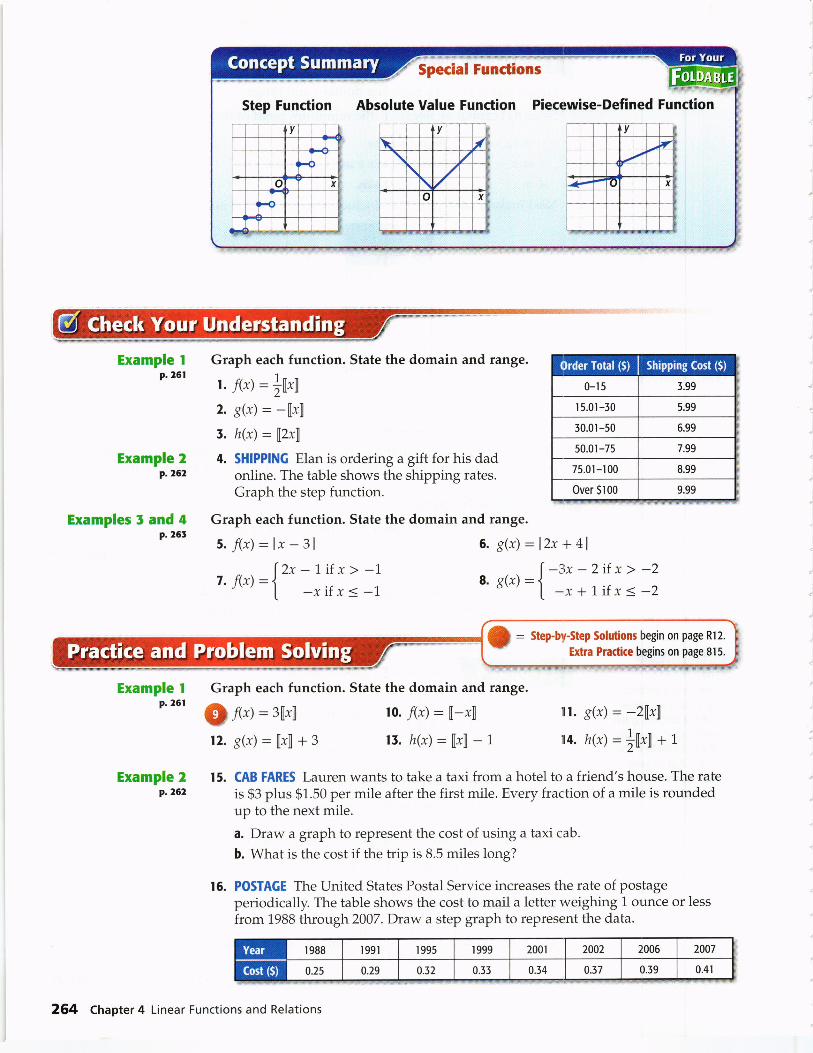
Absolute Value Function Piecewise-Defined Function
Example Ip.261
Example 2p.262
Examples 5 and Ip.2GI
Graph each function. State the domain and range.
t. f(x):t[*l2. g(x): -[rnt. h(x) : [2x\4. SHIPPING Elan is ordering a gift for his dad
online. The table shows the shipping rates.Graph the step function.
Graph each function. State the domain and range.
s. f(x): lx - 3 I
lzx-1ifx>-17. f(x) : l| -xifx<-1\-
6. g(r) : l2x + 4l
l-zx-zifx>-2s.g(r):{ _x+1ifx<_2
*= Step-by-Step Solutions begin on page Rl2.
Extra Practice begins on page 815.
Example Ip.261
Graph each function. State the domain and range.
Q x,l : afirn
12. g(x): [xl + 3
10. f(x): [-xn
15. h(x): fxl - 1
ll. g(x) : -Ztxn
A. h(x) = |[rn + r
Example 2 15. CAB FARES Lauren wants to take a taxi from a hotel to a friend's house. The rateP.262 is $3 plus $1.50 per mile after the first mile. Every fraction of a mile is rounded
up to the next mile.
a. Draw a graph to represent the cost of using a taxi cab.
b. What is the cost if the trip is 8.5 miles long?
16. POSTAGE The United States Postal Service increases the rate of postageperiodically. The table shows the cost to mail a letter weighing 1 ounce or less
from 1988 through 2007. Draw a step graph to represent the data.
264 Chapter 4 Linear Functions and Relations
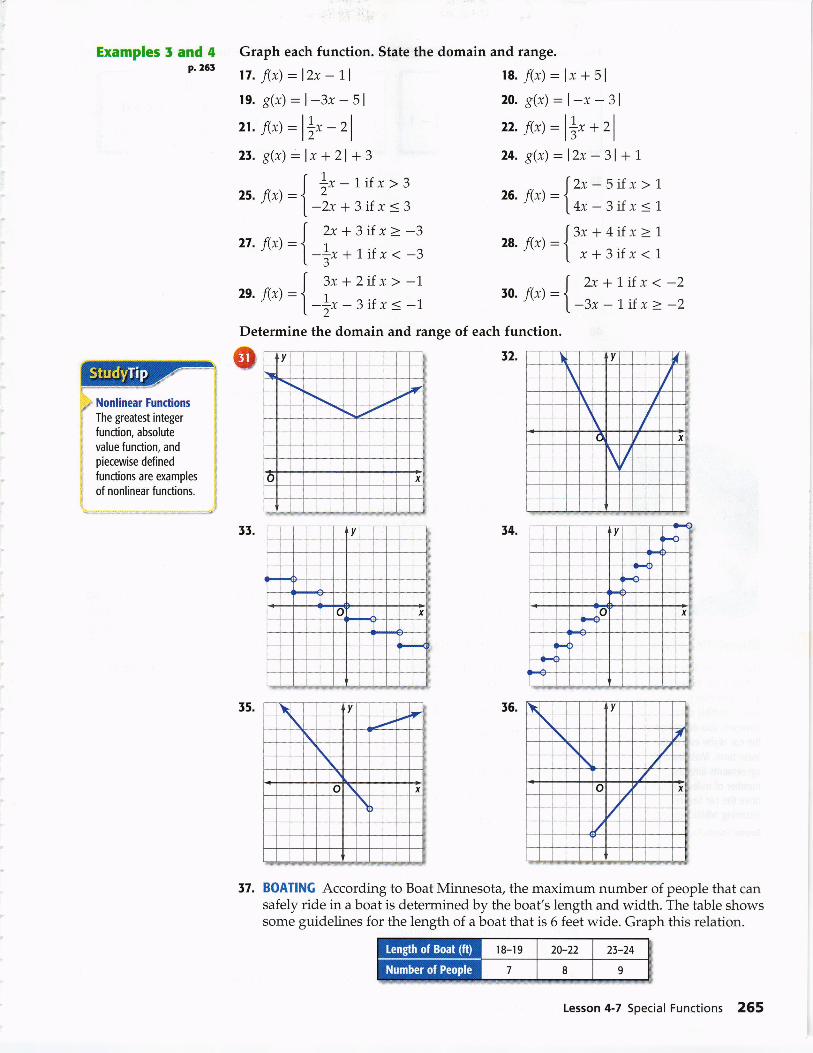
Examples lt and 4p.265
Graph each function. State the domain and range.
tt. f(x) = lZx - 1.1
19. g(r)=l-3x-512t. f(x) =ll- - rl21. g(x) - lx + 21+ s
zs. ,ot=[ l-tif x>3r"
l-zx+3ifx<3I Zx+3ifx>-327.f(x):i_+r+1ifx<_3
I gr + 2if x > -1.2e. f(x):t_+r_3if r<_1Determine the domain and range of each function.
ts. f(x):lr+5120. g(x):l-r-3122. f(x):1,* * rl2a. g@):lLx - 3l + r
lzx-5ifx>126. f(x\ :1J\ / l4x-3if x<1\-
I Zx + 4if x > 728. f(x\ = Ir' L,+3ifx<1
| 2x+1ifx<-250. f(x) = {r' L-3r-\ifx>-2
M(DNonlinear Functions
The greatest integer
function, absolute
value function, and
piecewise defined
functions are examples
of nonlinear functions.
t.
35.
BOATING According to Boat Minnesota, the maximum number of people that cansafely ride in a boat is determined by the boat's length and width. The table showssome guidelines for the length of a boat that is 6 feet wide. Graph this relation.
v
! i
+'"I
i
\
o x
v
N A
'tfi
x
l \+
v
c x
A
rI++I
r8-19 20-22 23-24
7 8 9
,7.
Lesson 4-7 Special Functions 265
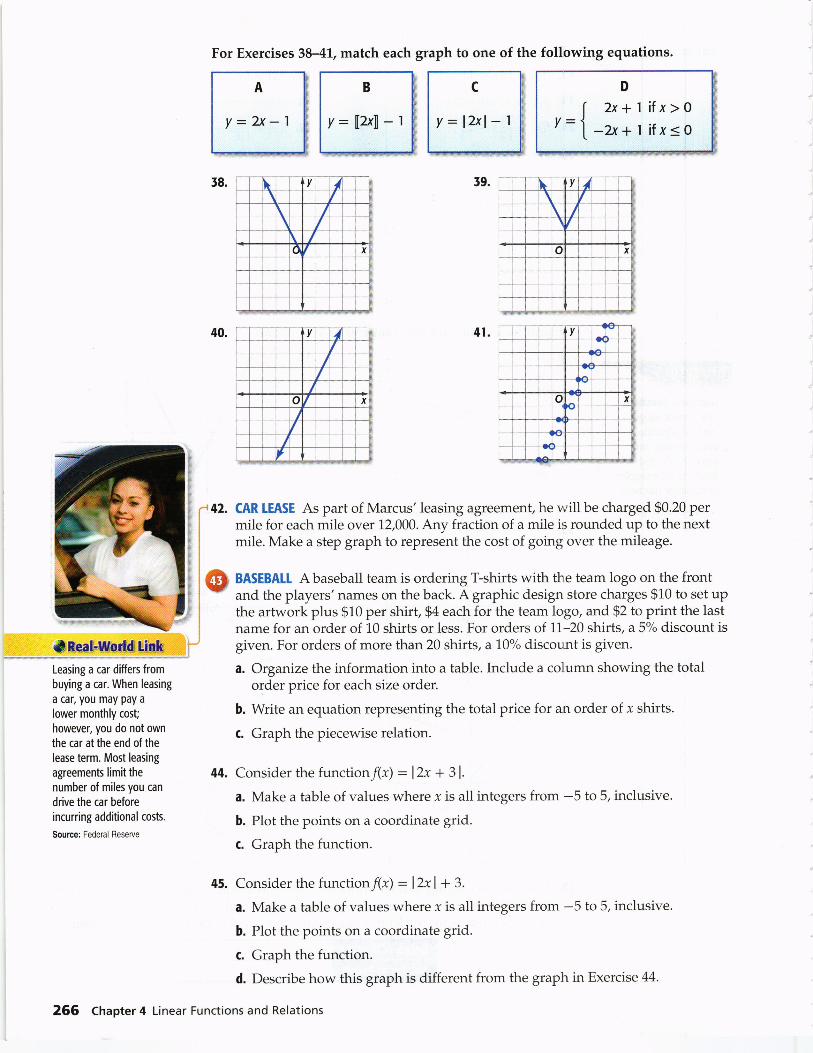
For Exercises 38-4L, match each graph to one of the following equations.
A
Y:2x-1
B
y=[2x\-1
c
y:l2xl-1
:'+2.:
,
,
l;Eea-hltrodldtin*.
Leasing a car differs from
buying a car. When leasing
a car, you may pay a
lower monthly cost;
however, you do not own
the car at the end of the
lease term. Most leasing
agreements limit the 44.number of miles you can
drive the car before
incurring additional costs.
Source: Federal Reserve
CAR TEASE As part of Marcus' Ieasing agreement, he will be charged $0.20 permile for each mile over 12,000. Any fraction of a mile is rounded up to the nextmile. Make a step graph to represent the cost of going over the mileage.
BASEBAII A baseball team is ordering T-shirts with the team logo on the frontand the players'names on the back. A graphic design store charges $10 to set upthe artwork plus $10 per shirt, $4 each for the team logo, and $2 to print the lastname for an order of 10 shirts or less. For orders of 11,-20 shirts, a 5% discount isgiven. For orders of more than 20 shirts, a 10'h discount is given.
a. Organize the information into a table. Include a column showing the totalorder price for each size order.
b. Write an equation representing the total price for an order of x shirts.
c. Graph the piecewise relation.
Consider the function f(*) : l2x + 3|,.
a. Make a table of values where x is all integers from -5 to 5, inclusive.
b. Plot the points on a coordinate grid.
c. Graph the function.
45. Consider the function/(x1 : l2xl + 3.
a. Make a table of values where x is all integers from -5 to 5, inclusive.
b. Plot the points on a coordinate grid.
c. Graph the function.
d. Describe how this graph is different from the graph in Exercise 44.
266 Chapter 4 Linear Functions and Relations
v={
D
2x+lifx>0-?x+ I if x<0
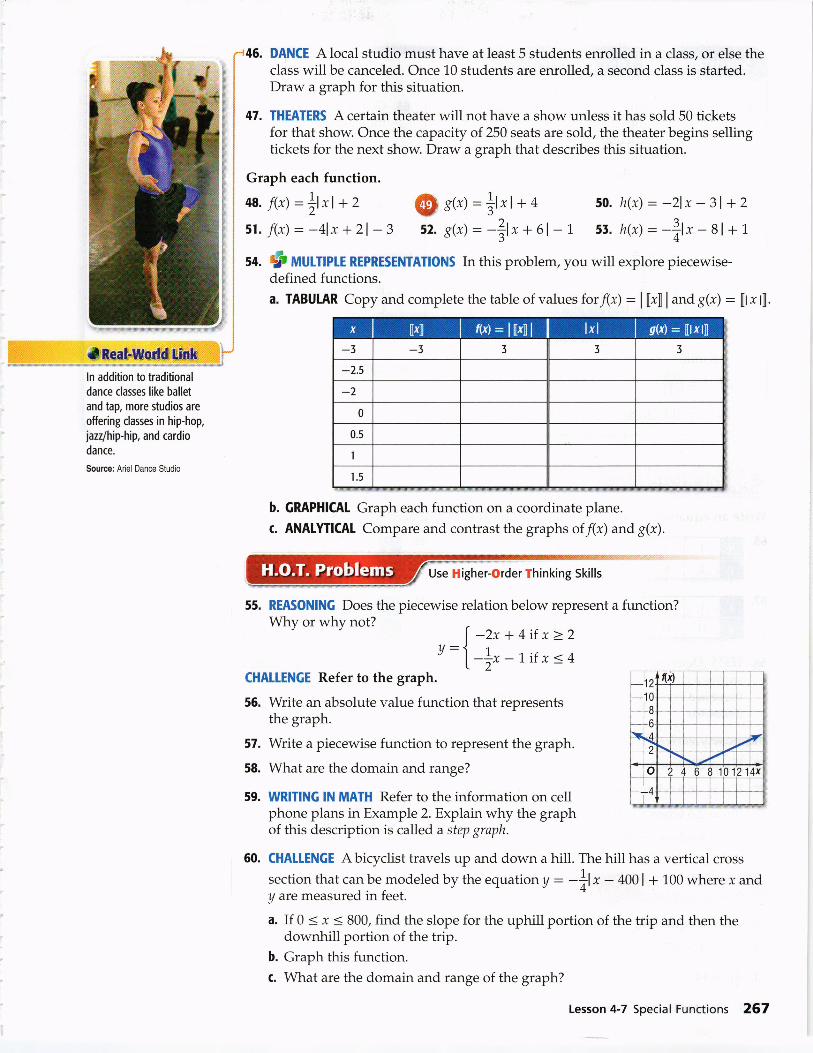
r="" _ *_ww.sF:=i=ln addition to traditional
dance classes like ballet
and tap, more studios are
offering classes in hip-hop,
iazzl hip-hip, and cardio
dance.
Source: Ariel Dance Studio
-46. DANCE A local studio must have at least 5 students enrolled in a class, or else theI chss will be canceled. Once 10 students are enrolled, a second class is started.
I Oraw a graph for this situation.
| +2. ffffnfERS A certain theater will not have a show unless it has sotd 50 tickets
i for that show. Once the capacity of 250 seats are sold, the theater begins sellingI tickets for the next show. Draw a graph that describes this situation.I
j Graph each function.
| +e. ltrl =ll*l+z @r(*l =tl*l++ 50. h(x):-2lx-31+z
I t. 1r1:-4lx+21-s i2.8(x): -ll**61-r st. h(x):-f;lr-81+tI
I s+. $ MUITIPLE REPRESENTATIONS In this problem, you will explore piecewise-
I defined functions.
I a. TABUTAR Copy and complete the table of values for f(x): I flrn I and g(x) : [tr t].
I
b. GRAPHICAL Graph each function on a coordinate plane.
c. ANALYTICAL Compare and contrast the graphs of f(x) and g(x).
55. REASONING Does the piecewise relation below represent a function?Why or why not?
| -z**4if x>2,=l-rrr-1.irx<4
CHALTENGE Refer to the graph.
56. Write an absolute value function that representsthe graph.
57. Write a piecewise function to represent the graph.
58. What are the domain and range?
59. WRITING lN MATH Refer to the information on cellphone plans in Example 2. Explain why the graphof this description is called a step graph.
60. CHALIENGE Abicyclist travels up and down a
section that can be modeled by the equation yy are measured in feet.
hill. The hill has a vertical cross
= -f,lx - 4ool + roo where x and
a. If 0 < x < 800, find the slope for the uphill portion of the trip and then thedownhill portion of the trip.
b. Graph this function.
c. \AIhat are the domain and range of the graph?
-3 -3 3 3 3
-2.5
-20
0.5
I
1.5
Use Higher-Order Thinking Skills
10 12 14x
Lesson 4-7 Special Functions 267
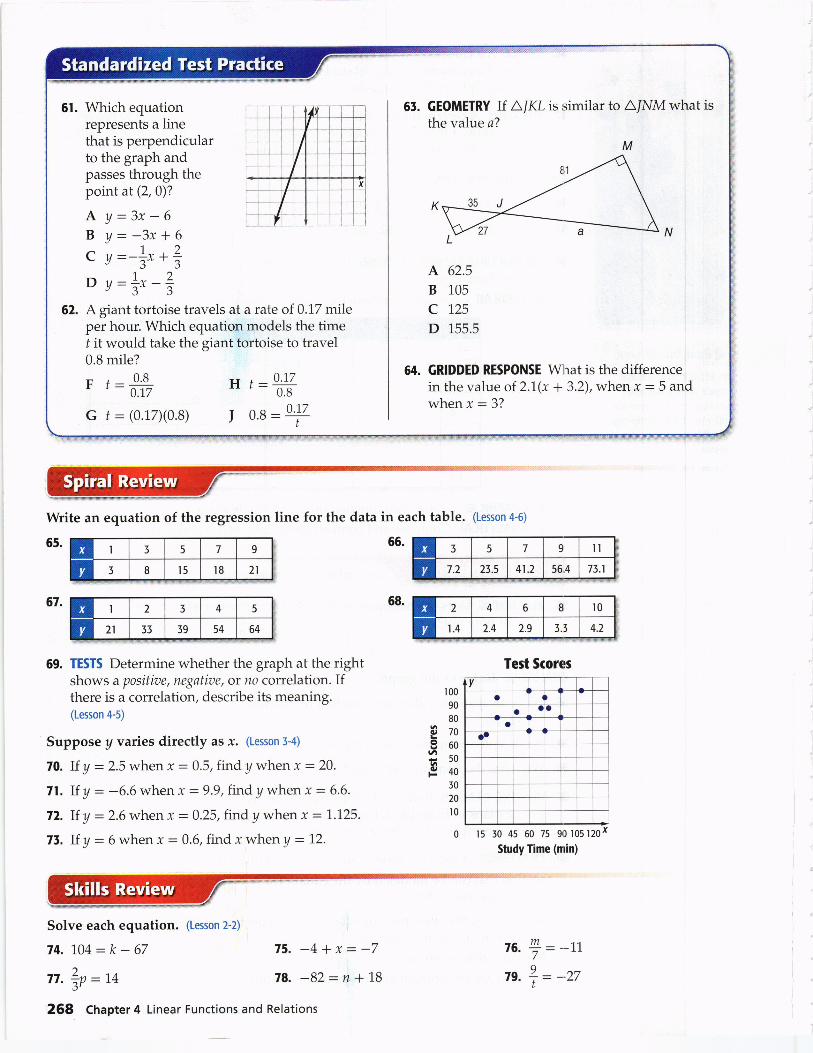
61. Which equationrepresents a linethat is perpendicularto the graph andpasses through thepoint at (2,0)?
A Y:3x-6B Y:-3x+6g y:-!x+?
"JJ
D v=lr-?"JJ
62. Agiant tortoise travels at a rate of 0.17 mileper hour. Which equation models the timef it would take the giant tortoise to travel0.8 mile?
GEOMETRY If A.IKL is similar to A/NM what isthe value a?
M
A 62.5
B 105
c 125
D 155.5
GRIDDED RESPONSE What is the differencein the value of 2.1(x + 3.2), when I : 5 andwhen x:3?
6r.
64.F t=#G t = (0.17X0.8)
, t:wI o.B :ry
Write an equation of the regression line for the data in each table. (Lesson 4-6)
65. 66.
69. TESTS Determine whether the graph at the rightshows a positiae, negatioe, or no correlation. Ifthere is a correlation, describe its meaning.(Lesson 4-5)
Suppose y varies directly as x. (Lesson 3-4)
70. If y: 2.5 when x :0.5, findy when x :20.71. If y: -6.6 when x:9.9,findy when x = 6.6.
72. If y: 2.6 when x = 0.25, findy when x :1..125.
71. If y : 6 when x : 0.6,find x when U = 12.
I0090
80
?to9eo-50g40
30
20
t0
0
Test Srores
a
15 io 45 60 75 golo5tzox
Study Time (min)
-11an
So1ve each equation. (Lesson 2-2)
74. 1.04:k-67 75. -4+x:-7)
77. ip =7a 78. -82:n *\8
264 Chapter 4 Linear Functions and Relations
76. +=,g.?:
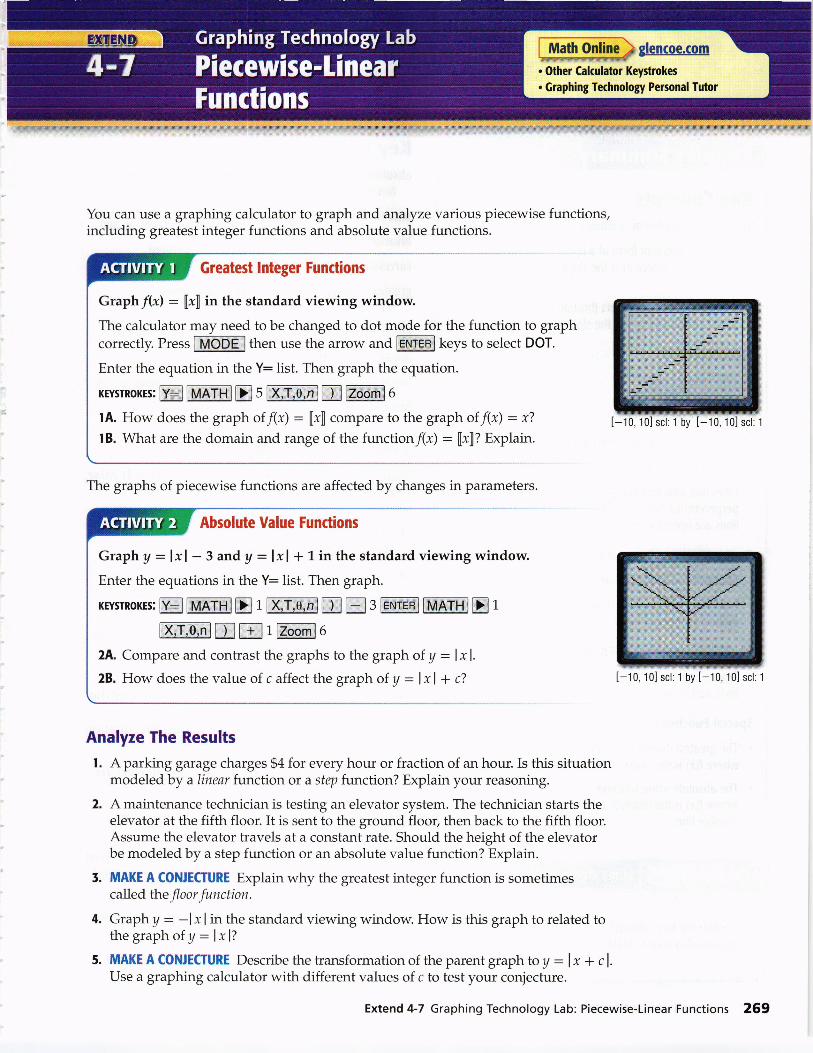
Math Online
. Other Glculator Keystrokes
. Graphing Technology Personal Tutor
You can use a graphing calculator to graph and analyze various piecewise functions,including greatest integer functions and absolute value functions.
Greatest lnteger
Graphflx) : [x] in the standard viewing window.
The calculator may need to be changed to dot mode for the function to graphcorrectly. Press IMODElthen use the arrow and [er'i:r-enlkeys to select DOT.
Enter the equation in the Y: list. Then graph the equation.
KEysrRoKEs: E EATHI E 5 Ef,€",l.lE Eooml 0
lA. How does the graph of f(x) : [x] compare to the graph of f(x) : v7
lB. What are the domain and range of the function/(r; : [x]? Explain.
The graphs of piecewise functions are affected by changes in parameters.
Absolute Value Functions
Graph A : lxl - 3 and U : lxl + r in the standard viewing window.
Enter the equations in the Y: list. Then graph.
KEysrRoKEs: E MATHIE t trrsn In E 3 EN?tTl NATHI E 1
ELAd D f 1Eoom]6
2A. Compare and contrast the graphs to the graph of y = ly1.
28. How does the value of c affect the graph of y : lxl + c?
Analyze The Results
l. A parking garage charges $4 for every hour or fraction of an hour. Is this situationmodeled by a linear function or a step function? Explain your reasoning.
2. A maintenance technician is testing an elevator system. The technician starts theelevator at the fifth floor. It is sent to the ground floor, then back to the fifth floor.Assume the elevator travels at a constant rate. Should the height of the elevatorbe modeled by a step function or an absolute value function? Explain.
5. MAKE A CONIECTURE Explain why the greatest integer function is sometimescalled the floor function.
4. Graph A : -lx I in the standard viewing window. How is this graph to related tothegraph of y:lxl?
5. MAKE A CONJECTURE Describe thetransformationof theparentgraph toy - lx + cl.Use a graphing calculator with different values of c to test your conjecture.
[-10, 10] scl: 1 by [-10, 10] scl: 1
Extend 4-7 Graphing Technology Lab: Piecewise-Linear Functions 269
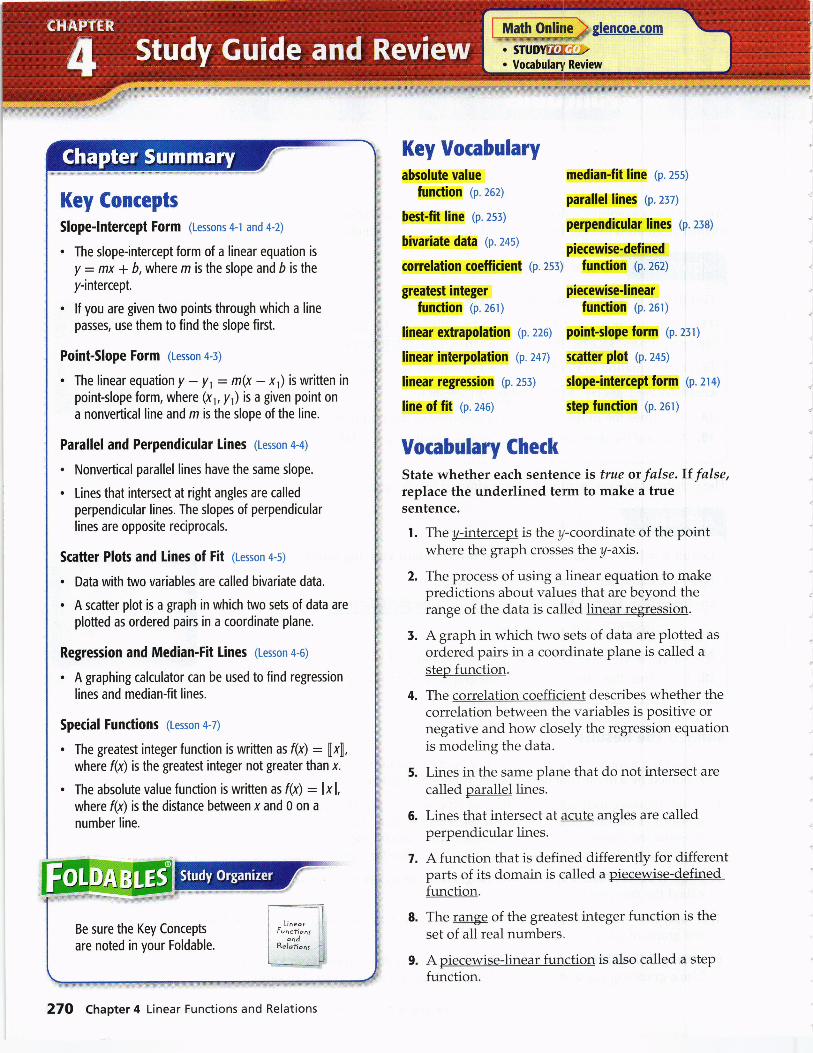
Key ConceptsSlope-lntercept Form (essons 4-l and 4-2)
. The slope-intercept form of a linear equation is
y : mx + 6, where m is the slope and b is they-intercept.
. lf you are given two points through which a linepasses, use them to find the slope first.
Point-Slope Form (Lesson 4-i)
. The linear equation y - yr : m(x - x,) is wriften in
point-slope form, where 8t, y) is a given point on
a nonvertical line and m is the slope of the line.
Parallel and Perpendicular lines (Lesson 4-4)
. Nonvertical parallel lines have the same slope.
. Lines that intersect at right angles are called
perpendicular lines. The slopes of perpendicular
lines are opposite reciprocals.
Scatter Plots and lines of Fit (leson +-s)
. Data with two variables are called bivariate data.
. A scatter plot is a graph in which two sets of data are
plotted as ordered pairs in a coordinate plane.
Regression and Median-Fit Lines (Lesson 4-6)
. A graphing calculator can be used to find regression
lines and median{it lines.
Special Functions (Lesson +-7)
. The greatest integer function is written as f(x) : [x],where f(x) is the greatest integer not greater than x.
. The absolute value function is written as f(x) : lx l,where f(x) is the distance between x and 0 on a
number line.
Be sure the Key Concepts
are noted in your Foldable.
Key Vocabularyabsolute value
function (p.262)
best-fit line (p. zsg)
bivariate data (p. z+s)
correlation coefficient (p. 2sJ)
greatest integerfunction (p.26t)
linear extrapolation (p. 226)
linear interpolation (p.24t)
linear regression (p. zsr)
line of fit (p. z+s)
median-fit line 1p. zss;
parallel Iines (p. zrz)
perpendicular lines (p. 2rB)
piecewise-defined
function (p.262)
piecewise-linear
function (p.26t)
point-slope form 1p. zrt;
scatter plot (p. z+s)
slope-intercept form (p. 214)
step function (p.26r)
Vorabulary CheckState whether each sentence is true or false.Il false,replace the underlined term to make a truesentence.
l. The y:intgeept is the y-coordinate of the pointwhere the graph crosses the y-axis.
2. The process of using a linear equation to makepredictions about values that are beyond theranse of the data is called linear resression.
5. A graph in which two sets of data are plotted as
ordered pairs in a coordinate plane is called a
step function.
4. The correlation coefficient describes whether thecorrelation between the variables is positive ornegative and how closely the regression equationis modeling the data.
5. Lines in the same plane that do not intersect arecalled oarallel lines.
6. Lines that intersect at acute angles are calledperpendicular lines.
A function that is defined differently for differentparts of its domain is called a pieecrdisc-dcfincdfunction.
The range of the greatest integer function is theset of all real numbers.
a@isalsocalledastePfunction.
7.
8.
9.
27O Chapter 4 Linear Functions and Relations
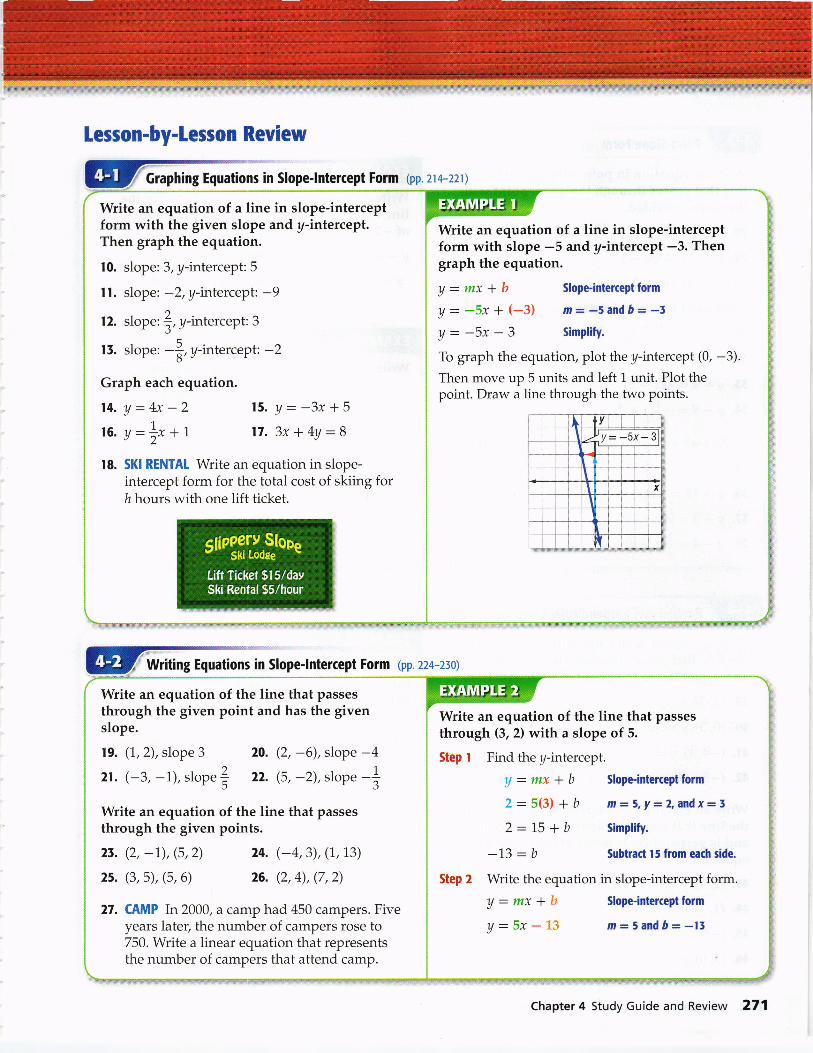
Write an equation of a line in slope-interceptform with slope -5 and y-intercept -3. Thengraph the equation.
U: mx +b Slope'interceptform
U = -5x + (-3) ilt=-5andb=-t
U=-5x-3 SimPlifY.
To graph the equation, plot the y-intercept (0, -3).Then move up 5 units and left 1 unit. Plot thepoint. Draw a line through the two points.
Write an equation of a line in slope-interceptform with the given slope and y-intercept.Then graph the equation.
10. slope: 3, y-intercept: 5
ll. slope: -2,y-intercept -912. slope: l, A-rntercept: 3
15. slope: -f;,A-intercept: -2
Graph each equation.
14. y:4x-216. y:Lrr*,
18. SKI RENTAT Write an equation in slope-intercept form for the total cost of skiing forh hours with one lift ticket.
15. y: -3x+517. 3x * 4y =g
Lesson-by-Lesson Review
Graphing Equations in Slope-lntercept Form @p.214-z2t)
Wdting Equations in Slope-lntercept Form @p.224-z5o)
Write an equation of the line that passesthrough (3,2) with a slope of 5.
Step t Find the y-intercept.
U : mx + b SloPe'intercePtform
2 = 5(3) * b m=5,y=2,anilx=!
2:1.5 + b
-13: b
Step Z Write the equation in slope-intercept form.
y--mx+b
A=5x-13
Write an equation of the line that passesthrough the given point and has the given
20. (2, -6), slope -422. (5,-2), slope -]
Write an equation of the line that passesthrough the given points.
2t. (2, -1), (5,2)
25. (3,5), (5,6)
24. (-4,3), (1,13)
26. (2, 4), (7,2)
27. (AMP In 2000, a camp had 450 campers. Fiveyears later, the number of campers rose to750. Write a linear equation that representsthe number of campers that attend camp.
Chapter 4 Study Guide and Review 271

Point-Slope Form (pp. 2ir-256)
Parallel and Perpendicular Lines (pp. 237-24i)
Write an equation in point-slope form for theline that passes through the given point withthe slope provided.
28. (6,3), slope 5
29. (-2,1), slope -310. (-4,2), slope 0
Write each equation in standard form.
5l.y-3:5(x-2)t2.y-7=-3(x-t1)tt.y++:|tx-z)t4.y-9:-[1x+2)
' 5'
Write each equation in slope-intercept form.
55.y-2=3(x-5)t6.y-12=-2(x-3)t7.y+3=5(x+1)!s.y-+=t@+2)
Write an equation in point-slope form for theline that passes through (3,4) with a slopeof -2.U - Ur = m(x - xt) Point'sloPe form
y - 4 : -2(x - 3) Replace m with -2 and
(x,, y,) wifir (3,4).
Write y + 6 - -4(x - 3) in standard form.
y + 6= -a@ -3) Originalequation
y+6=-4x+12 Simplify.
4x+y*6:\24x+Y:6
Add 4x to each side.
Subbact 6 ftom each side.
Write an equation in slope-intercept form forthe line that passes through (-2,41and isparallel to the graph of y - 6x - 3.
The slope of the line with equation A = 6x - 3is 6. The line parallel to y - 6x - 3 has the sameslope,6.
U - Ut = m(x - xt) Point*loPe form
y - 4: 0(x - (-Z)) Subst'tute.
y-4=6(x+2) Simplify.
y - 4: 6x + 12 Disributive Property
U : 6x + 16 Add 4 to each side.
Write an equation in slope-intercept form forthe line that passes through the given pointand is parallel to the graph of each equation.
59. (2,5),y:x-340. (0,3),y:3x+541. (-4,L),y: -2x - 6
42. (-5, -Z),y = -Lrt + +
Write an equation in slope-intercept form forthe line that passes through the given pointand is perpendicular to the graph of the givenequation.
45. (2,4),U :3x + L
44. (L,3),y: -2x - 4
45. (-5,2),U:Lt * n
46. (3,0),y: -Lf,
272 Chapter 4 Linear Functions and Relations
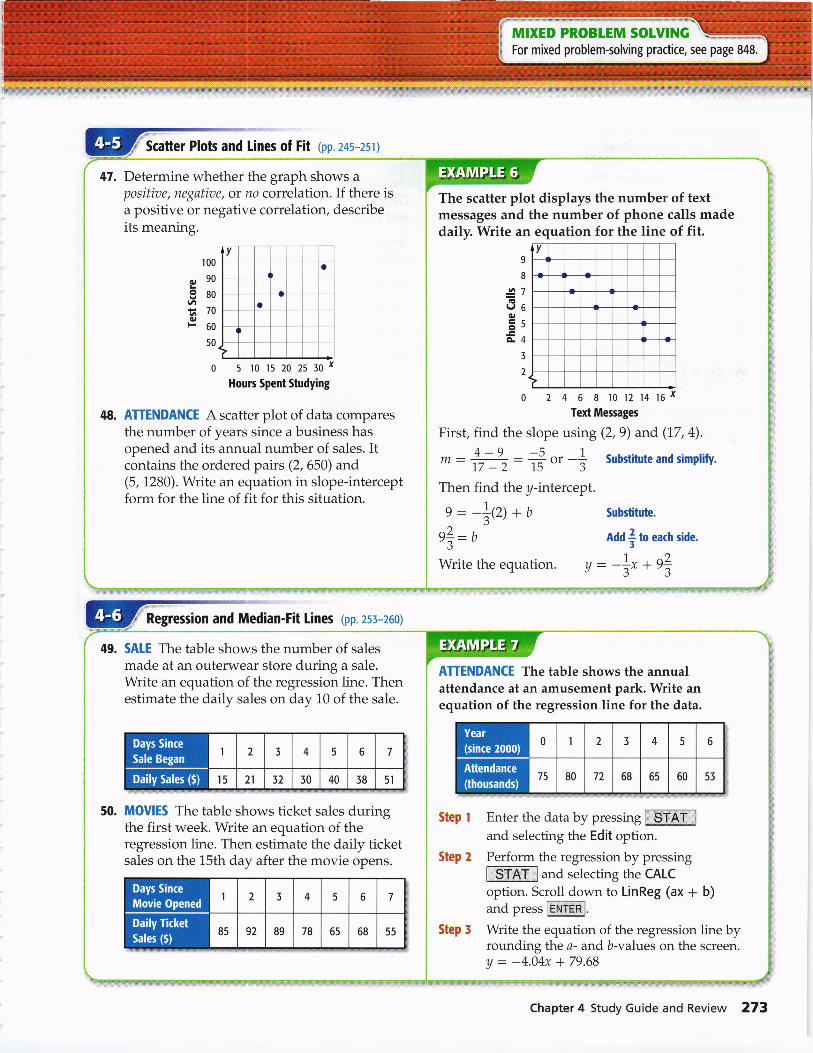
The scatter plot displays the number of textmessages and the number of phone calls madedaily. Write an equation for the line of fit.
v
o 2 4 6 8 l0 12 14 $xText Messages
First, find the slope using (2,9) and (17, 4).
* = #: # o. -* substitute and simplify.
Then find the y-intercept.
Determine whether the graph shows apositizse, negatiae, or no correlation. If there isa positive or negative correlation, describeits meaning.
0 5 lot5zozs:0xHours Spent Studying
ATTENDANCE A scatter plot of data comparesthe number of years since a business hasopened and its annual number of sales. Itcontains the ordered pairs (2,650) and(5, 1280). Write an equation in slope-interceptform for the line of fit for this situation.
va
o
Scatter Plots and Lines of Fit (pp.24s-2st)
Regression and Median-Fit Lines gp.2s5-260)
SAIE The table shows the number of salesmade at an outerwear store during a sale.Write an equation of the regression line. Thenestimate the daily sales on day 10 of the sale.
MOVIES The table shows ticket sales duringthe first week. Write an equation of theregression line. Then estimate the daily ticketsales on the 15th day after the movie opens.
ATTENDANCE The table shows the annualattendance at an amusement park. Write anequation of the regression line for the data.
Step I Enter the data by pressing fffitlland selecting the Edit option.
Step 2 Perform the regression by pressing
fSIATll and selecting the CALC
option. Scroll down to LinReg (ax + b)and press WF].
Step f Write the equation of the regression line byrounding the a- and b-values on the screen.
A:-4.04x+79.68
Chapter 4 Study Guide and Review 273
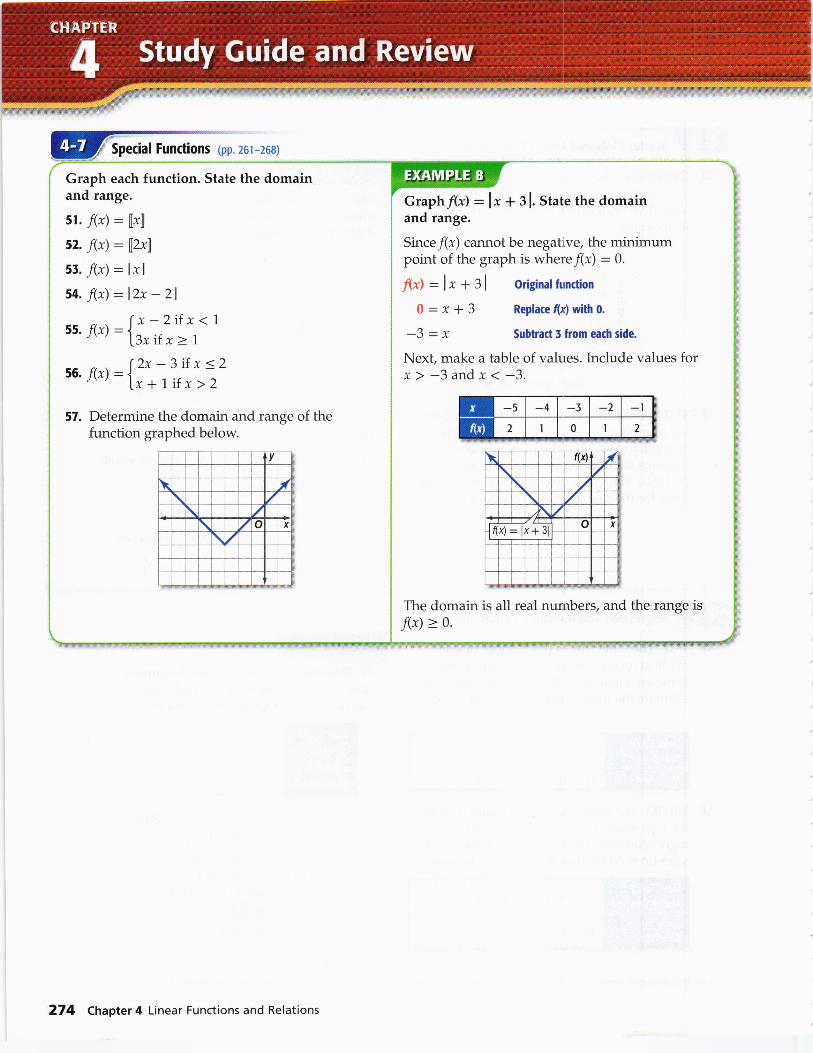
Special Functions (pp. 26r-268)
Graphf(x) = lr * s l. state the domainand range.
Since/(x) cannot be negative, the minimumpoint of the graph is where/(r) : 0.
f(x) = lx + gl originalfunction
0 : x * 3 Replace(x)witho.
Subtract I fiom each side.
Next, make a table of values. Include values forx>-3andx<-3.
wE----f---f;l(x)= lx+ slF$
The domain is all real numbers, and the range is
f(x) > o.
Graph each function. State the domainand range.
51. /(x) : [r]52. f(x) : [2x]55. f(x) = lvls+. f(x) : l2x - 2l
(x-Zifx<7s5'J@)=trrifx>1
i6. f(x\=[2*-3if x<2r. Lx+1ifx>2
57. Determine the domain and range of thefunction graphed below.
274 Chapter 4 Linear Functions and Relations
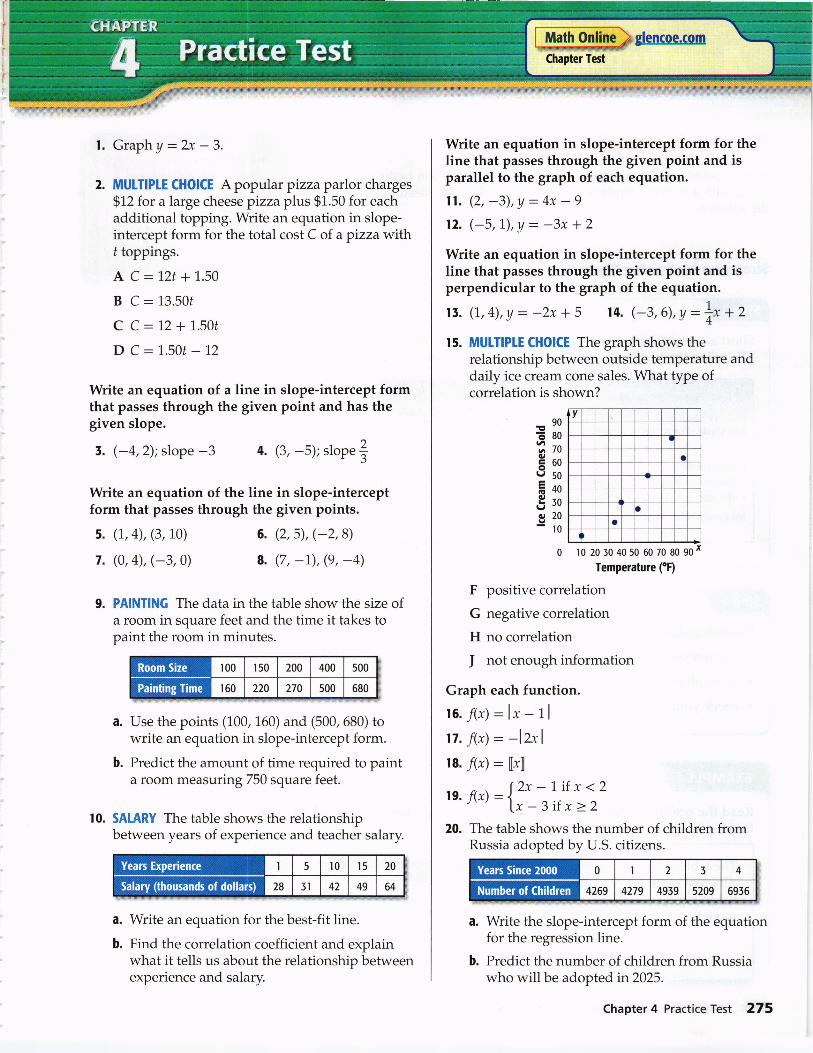
l. Graph A :2x - 3.
2. MUTTIPLE CHOICE A popular pizza parlor charges$12 for a large cheese pizzaplus $1.50 for eachadditional topping. Write an equation in slope-intercept form for the total cost C of apizzawlthf toppings.
A C: 12t + 1..50
B C: 13.50f
C C:12+1..50t
D C: 1..50t - 12
Write an equation of a line in slope-intercept formthat passes through the given point and has thegiven slope.
t. (-4,2); slope -3 4. (3,
Write an equation of the line in slope-interceptform that passes through the given points.
-5); slope ]
5. (1.,4), (3,10)
7. (0,4), (-3,0)
6. (2,5),(-2,8)
8. (7 , -1), (9 , -4)
9. PAINTING The data in the table show the size ofa room in square feet and the time it takes topaint the room in minutes.
a. Use the points (100, 160) and (500, 680) towrite an equation in slope-intercept form.
b. Predict the amount of time required to painta room measuring 750 square feet.
SATARY The table shows the relationshipbetween years of experience and teacher salary.
a. Write an equation for the best-fit line.
b. Find the correlation coefficient and explainwhat it tells us about the relationship betweenexperience and salary.
10.
Write an equation in slope-intercept form for theline that passes through the given point and isparallel to the graph of each equation.
ll. (2, -3), y = 4x - 9
12. (-5, L), y : -3x + 2
Write an equation in slope-intercept form for theline that passes through the given point and isperpendicular to the graph of the equation.
It. (1,,4), y = -2x -l5 t4. (-3,6), y : Lnx + 2
15. MUIIIPLE CHOICE The graph shows therelationship between outside temperature anddaily ice cream cone sales. What type ofcorrelation is shown?
F positive correlation
G negative correlation
H no correlation
J not enough information
Graph each function.
16. f(x): lx - 1l
tt. f(x) = -lz*lts. /(x) = [x]
re.f (x):{1'_-rill,.,_7'
20. The table shows the number of children fromRussia adopted by U.S. citizens.
Write the slope-intercept form of the equationfor the regression line.
Predict the number of children from Russiawho will be adopted n2025.
90=,E802n6'E60u50Eoo8,,820-10
0
Chapter 4 Practice Test 275
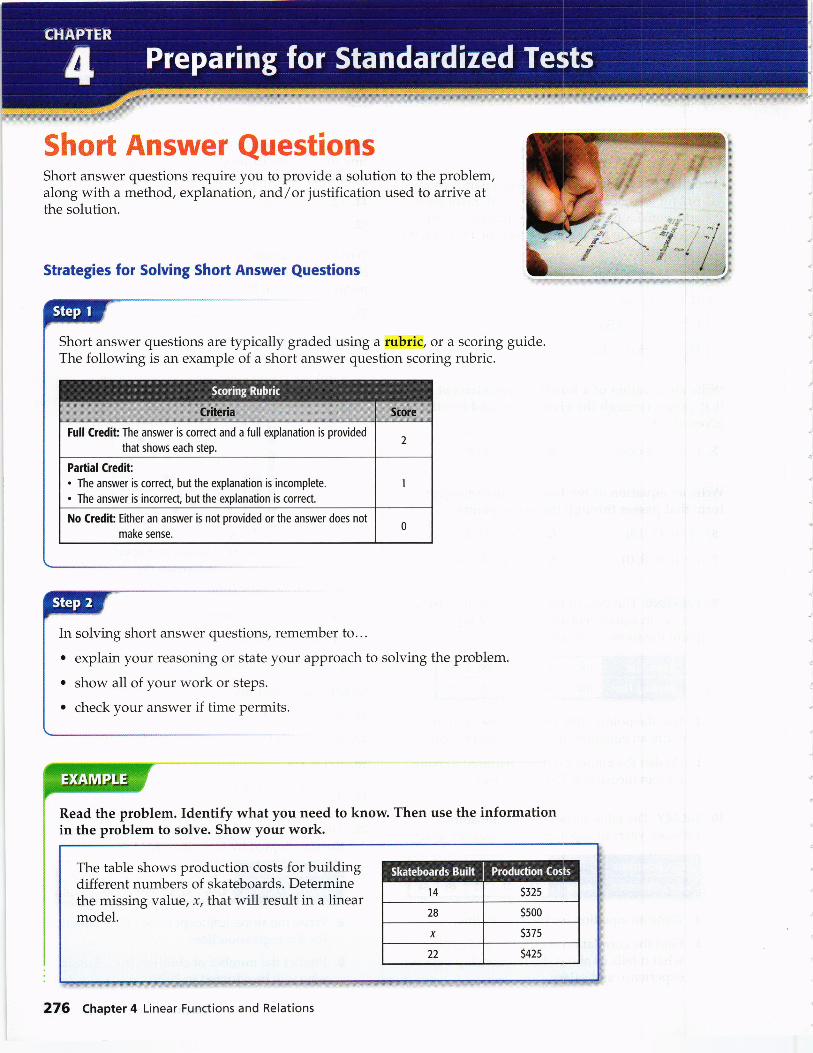
Short Answer QuestionsShort answer questions require you to provide a solution to the problem,along with a method, explanation, andf or justification used to arrive atthe solution.
Strategies for Solving Short Answer Questions
Short answer questions are typically graded using a rubric, or a scoring guide.The following is an example of a short answer question scoring rubric.
ln solving short answer questions, remember to...
. explain your reasoning or state your approach to solving the problem.
. show all of your work or steps.
. check your answer if time permits.
ffii Read the problem. Identify what you need to know. Then use the information
in the problem to solve. Show your work.
The table shows production costs for buildingdifferent numbers of skateboards. Determinethe missing value, x, that will result in a linearmodel.
':ii:..1
''*
276 Chapter 4 Linear Functions and Relations
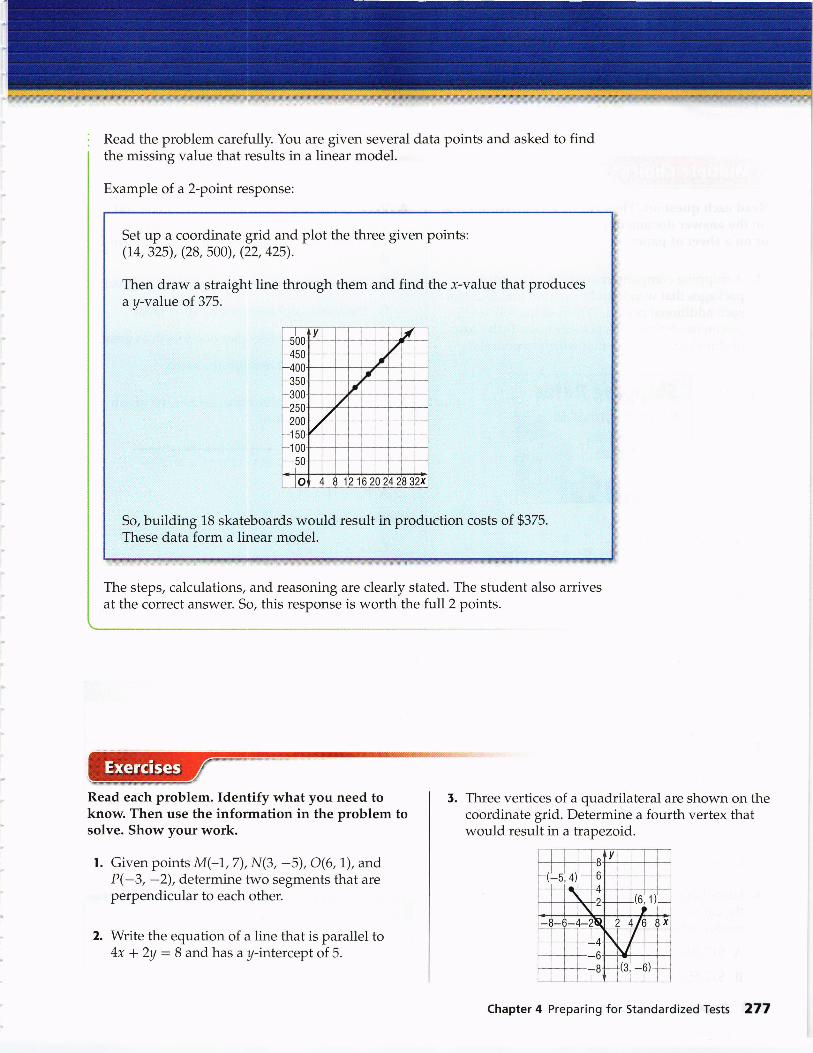
Set up a coordinate grid and plot the three given points:(74, 325), (28, 500), (22, 425).
Then draw a straight line through them and find the r-value that producesay-value of 375.
So, building 18 skateboards would result in production costs of $375.These data form a linear model.
Read the problem carefully. You are given several data points and asked to findthe missing value that results in a linear model.
Example of a 2-point response:
The steps, calculations, and reasoning are clearly stated. The student also arrivesat the correct answer. So, this response is worth the full2 points.
Read each problem. Identify what you need toknow. Then use the information in the problem tosolve. Show your work.
l. Civen points M(-7,7), N(3, -5), 0(6,1), andP(-3, -2), determine two segments that areperpendicular to each other.
2. Write the equation of a line that is parallel to4x + 2Y : B and has a Y-intercePt of 5.
I
{
5. Three vertices of a quadrilateral are shown on thecoordinate grid. Determine a fourth vertex thatwould result in a trapezoid.
Chapter 4 Preparing for Standardized Tests 277
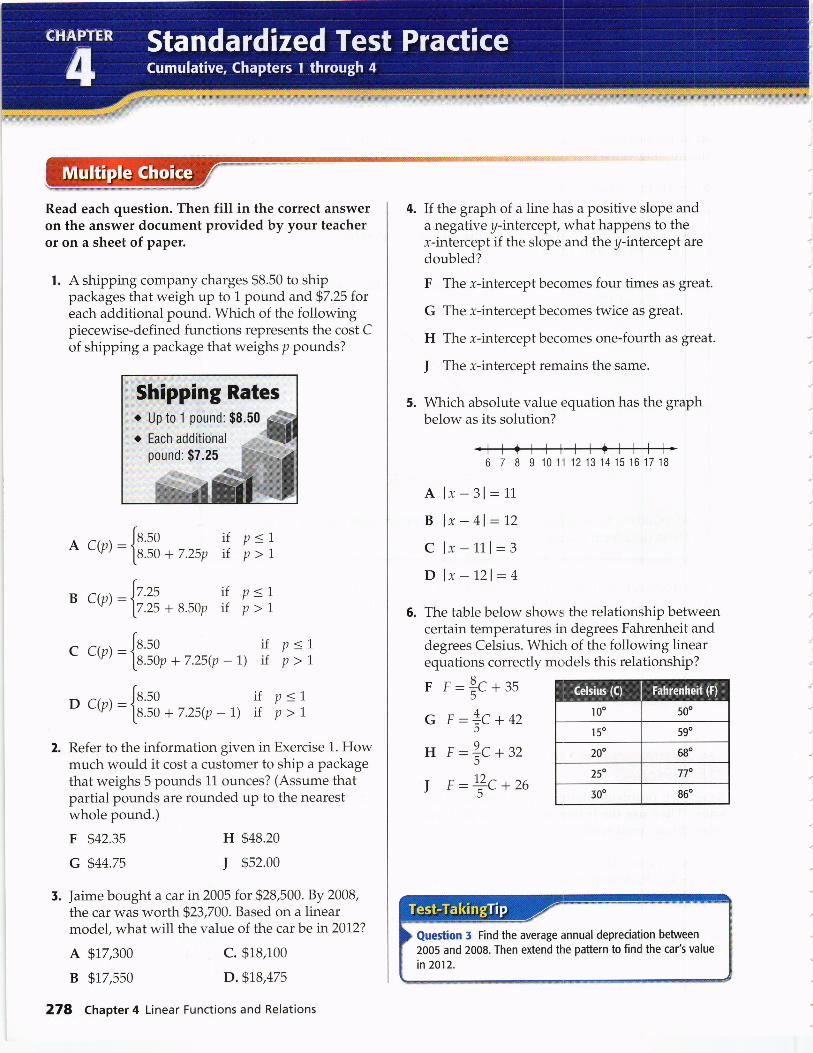
Read each question. Then fill in the correct answeron the answer document provided by your teacheror on a sheet of paper.
l. A shipping company charges $8.50 to shippackages that weigh up to 1 pound and$7.25 foreach additional pound. \Atrhich of the followingpiecewise-defined functions represents the cost Cof shipping a package that weighs p pounds?
^ c(p)
B c(p)
c c(p)
o c(p)
A $17,300
B $17,550
if p=17.25p if p>1
[s.so:{18.50 +
-[z.zs ir p=1-
lz.zs + 8.50p if p > l
-Ja.so if p<l: fa.sop + 7.25(p - 1) if 'p
> 7
-[s.so if p<l=
[s.so + 7.25(p - 1) if 'p > 7
2. Refer to the information given in Exercise 1. Howmuch would it cost a customer to ship a packagethat weighs 5 pounds 11 ounces? (Assume thatpartial pounds are rounded up to the nearestwhole pound.)
F $42.35
G $44.75
5. Jaime bought a car in 2005 for $28,500. By 2008,the car was worth $23,700. Based on a linearmodel, what will the value of the car be in2012?
c. $18,100
D.$18,475
H $48.20
I $52.00
Sh,ipping RatesI Up to 1 pound: $8.50
r Each additional ,,,::;:::
278 Chapter 4 Linear Functions and Relations
5.
If the graph of a line has a positive slope anda negative y-intercept, what happens to thex-intercept if the slope and the y-intercept aredoubled?
F The r-intercept becomes four times as great.
G The x-intercept becomes twice as great.
H The l-intercept becomes one-fourth as great.
] The r-intercept remains the same.
Which absolute value equation has the graphbelow as its solution?
6 7 8 910 1't 12131415 161718
A lx-31:11B lx - 4l:12C lx-111:3D lr-121:4
The table below shows the relationship betweencertain temperatures in degrees Fahrenheit anddegrees Celsius. Which of the following linearequations correctly models this relationship?
F F:fc+as
G r:f,c + +z
H F: f,c+zz
! F:lc+zo
6.
Question 5 Find the average annual depreciation between
2005 and 2008. Then extend the pattern to find the car's value
in 2012.

Math Online
Standardized Test Practice
Record your answers on the answer sheet providedby your teacher or on a sheet of paper.
7. What is the equation of the line graphed below?
Express your answer in point slope form usingthe point (-8,3).
8. GRIDDED RESPONSE The linear equation below is abest fit model for the peak depth of the MadRiver when x inches of rain fall. \Mhat would youexpect the peak depth of the river to be after a
storm that produces 1f; inches of rain? Round
your answer to the nearest tenth of a foot ifnecessary.
Y :2.5x + I4.8
9. Jacob formed an advertising company in1992.Initially, the company only had 14 employees.In 2008, the company had grown to a total of63 employees. Find the percent of change inthe number of employees working at ]acob'scompany. Round to the nearest tenth of a percentif necessary.
10. The table shows the total amount of rain during a
storm.
a. Write an equation to fit the data in the table.
b. Describe the relationship between the hourand the amount of rain received.
I l, An electrician charges a $25 consultation fee plus$35 per hour for labor.
a. Copy and complete the following tableshowing the charges for jobs that take 1,2,3,4, or 5 hours.
Write an equation in slope-intercept form forthe total cost of a job that takes h hours.
If the electrician bills in quarter hours, howmuch would it cost for a job that takes 3 hours15 minutes to complete?
Record your answer on a sheet of paper. Show yourwork.
12. Explain how you can determine whether twolines are parallel or perpendicular.
b.
I 2 3 4
0.45 0.9 1.35 1.8
Chapters 1-4 Standardized Test Practice 279
Uhc$ln Chapter 2, you solved equations.
$lburln Chapter 5, you will:
. Solve one-step and multi-step
inequalities.. Solve compound inequalities and
inequalities involving absolute
value.. Graph inequalities in two variables.
S prrs tn the United states,
about 75 million dogs are kept
as pets. Approximately l Soio
of these were adopted fromanimal shelters. About l4olo of
dog owners own more than
5 dogs.
h'Vir.YF-I
tu ireqldljly/ 2 , - 3 @snlstu n!mb-oIdos r6ys yofrll bsy 6o.h yoor dcpddins dr l&.unberof d€! FU tuvd
Oq eGh Fiil ro& rcftd Posnio in 6srid. O
C,tkko@oF*lhb.odbPht
s.l.d h [email protected]€ i6 sd. ih oE in tu sd.
E Shode obove the lins
*l Shode below the line
280 Chapter 5 Linear lnequalities