Geotechnical Characterization of Lateritic Soils in Jos and Environs North Central Nigeria By Lar,...
13
1 Geotechnical Characterization of Lateritic Soils in Jos and Environs North Central Nigeria By Lar, U. A., Wazoh, H.N., Mallo, S.J. & Chup, A.S. Department of Geology and Mining, University of Jos, Nigeria ABSTRACT The geotechnical properties of Lateritic soils from part of Jos and environs have been investigated covering 78km 2 within latitudes 8 0 50` to 8 0 56` N and Longitude 9 0 50`to 09 0 54`E, central Nigeria; with a view to assessing the suitability of the soils for construction and other engineering applications. Representative samples were collected from twenty locations within the study area and subjected to series of laboratory geotechnical analyses such as the grain size analysis, Atterberg limits, Liquid/Plastic Limit tests, Plasticity Index, Linear Shrinkage Tests, Compaction and shear Strength tests in Accordance with procedures of the British standard (BS)1377 with necessary modifications. Geotechnical results obtained revealed that the liquid limit ranging from 30.3 – 61.7 % and plastic limit ranged from 22.5% - 40.6%. The plasticity index was found to be between 7.8% and 21.7% and linear shrinkage values ranged between 5.7 and 11.4 indicating low – medium swelling potential with some indication of expansiveness by some of the samples. Based on the Unified Soils Classification System (USCS), the soils of the study area can therefore be poor, fair or good materials. Based on compaction characteristics the soils can be considered poor to fair and therefore suitable for construction of embankments. Some of the soils will require some form of improvement in order to be suitable for highway construction and other applications. From the established coefficients and angles of friction of soils derived from the Morh’s circle of the study areas, the various bearing capacities of soils can also be determined for civil and construction purposes. INTRODUCTION Lateritic soils in Nigeria have found wide application in the construction industry. Most construction works are carried out on or with residual soils. Prominent among their uses is in road construction where they are utilized not only as fill materials but as materials on which the highway pavements are founded. Laterites are known to be rich in iron oxides and alumina sesquoxides with varying contents of silica depending on the degree of weathering and decomposition experienced. Because of the nature of their formation, they have extremely variable engineering properties and field performance, (Ajayi, 1987). Not even the most experienced engineer would attempt to assess the strength of concrete without some knowledge of its composition, yet quite inexperienced
Transcript of Geotechnical Characterization of Lateritic Soils in Jos and Environs North Central Nigeria By Lar,...

1
Geotechnical Characterization of Lateritic Soils in Jos and Environs
North Central Nigeria By
Lar, U. A., Wazoh, H.N., Mallo, S.J. & Chup, A.S.
Department of Geology and Mining, University of Jos, Nigeria
ABSTRACT The geotechnical properties of Lateritic soils from part of Jos and environs have been investigated
covering 78km2 within latitudes 80 50` to 80 56` N and Longitude 90 50`to 09 0 54`E, central Nigeria; with a
view to assessing the suitability of the soils for construction and other engineering applications.
Representative samples were collected from twenty locations within the study area and subjected
to series of laboratory geotechnical analyses such as the grain size analysis, Atterberg limits, Liquid/Plastic
Limit tests, Plasticity Index, Linear Shrinkage Tests, Compaction and shear Strength tests in Accordance
with procedures of the British standard (BS)1377 with necessary modifications.
Geotechnical results obtained revealed that the liquid limit ranging from 30.3 – 61.7 % and plastic
limit ranged from 22.5% - 40.6%. The plasticity index was found to be between 7.8% and 21.7% and linear
shrinkage values ranged between 5.7 and 11.4 indicating low – medium swelling potential with some
indication of expansiveness by some of the samples. Based on the Unified Soils Classification System
(USCS), the soils of the study area can therefore be poor, fair or good materials. Based on compaction
characteristics the soils can be considered poor to fair and therefore suitable for construction of
embankments. Some of the soils will require some form of improvement in order to be suitable for highway
construction and other applications. From the established coefficients and angles of friction of soils derived
from the Morh’s circle of the study areas, the various bearing capacities of soils can also be determined for
civil and construction purposes.
INTRODUCTION Lateritic soils in Nigeria have found wide application in the construction industry.
Most construction works are carried out on or with residual soils. Prominent among their
uses is in road construction where they are utilized not only as fill materials but as
materials on which the highway pavements are founded. Laterites are known to be rich in
iron oxides and alumina sesquoxides with varying contents of silica depending on the
degree of weathering and decomposition experienced. Because of the nature of their
formation, they have extremely variable engineering properties and field performance,
(Ajayi, 1987). Not even the most experienced engineer would attempt to assess the
strength of concrete without some knowledge of its composition, yet quite inexperienced
2
engineers have in the past ventured to assess the bearing power of soil with a degree of
accuracy quite out of proportion to their knowledge of its nature. Many building
constructions have been costly, largely because the site(s) has been badly selected, and
there have been examples of structures which failed because the soils were too weak to
support them. Soil like any engineering material, distorts when placed under a load. This
distortion could be shearing or sliding or distortion and compression. In general, soils
cannot withstand tension. In some situations where the particles are cemented together, a
small amount of tension may be withstood, but not for long periods.
Though evidence of engineering problems can be seen in most places (e.g. failed
road segments and movements in building known as settlement), all of these engineering
facilities are founded in or on soils. Lateritic soils have been found to develop on many
rock types in different sub-climate and drainage environments. Each of the ubiquitous
soils often exhibit unique set of physical, chemical and hence engineering properties.
Therefore, in order to ensure their sustainability, a thorough knowledge of the
characteristics of the soils that act as these foundations must be acquired prior to its
utilization for any engineering purpose. By supplying pre-knowledge of this kind it is the
function of soil science to show how economic waste can be avoided. Therefore, the need
to characterize the soil, based on the geotechnical and geochemical properties of the soil.
This scenario has therefore prompted the need for this research work. This study intends
to evaluate the properties of soils of the study area using geotechnical methods. This
characterization will not be regarded as an end in itself but as a tool to acquiring more
knowledge on the behavior of the lateritic soil.
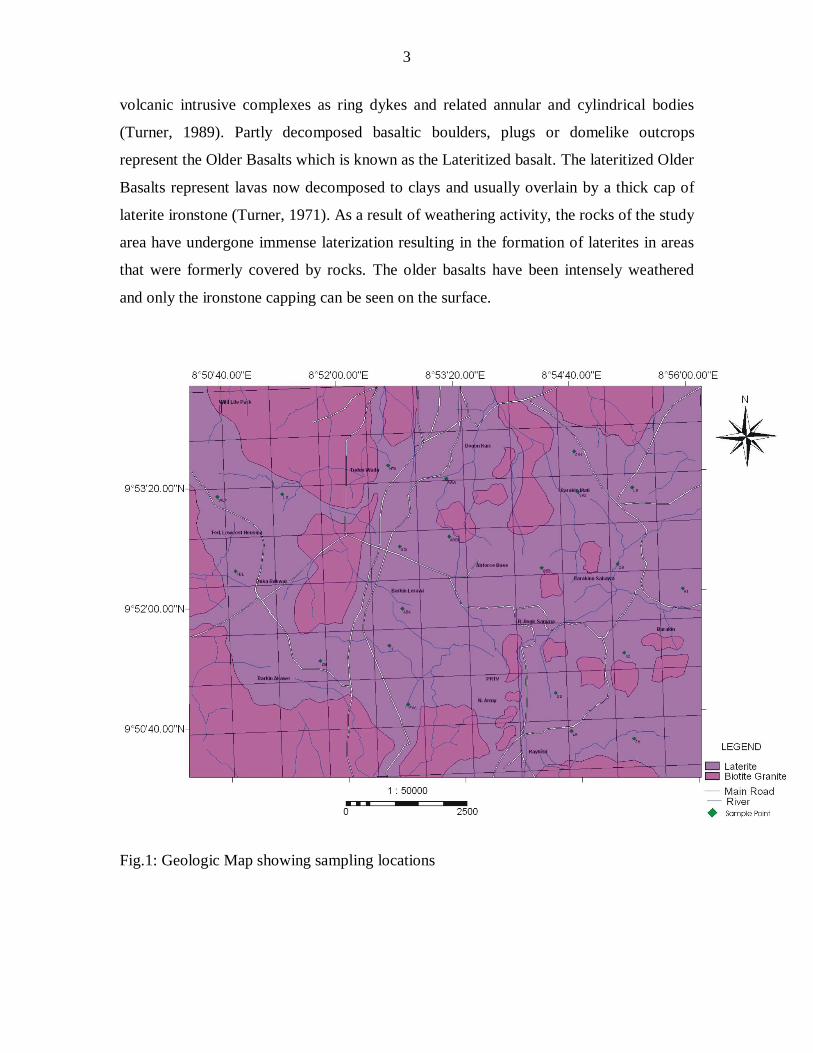
GEOLOGY OF THE STUDY AREA
The study area is part of the Jurassic Younger Granite Ring Complexes and Tertiary
basaltic volcanic rocks of North Central Nigeria. The granites were first defined by
Falconer, (1911), where he described them as cross-cutting alkali granites containing
riebeckite or biotite characterized by chilled margins against their country rocks. The
rocks occur as hilly massifs, sharply differentiated from the smoother topography of the
surrounding basement rocks. They are a petrologically distinctive series of alkali feldspar
granites, associated with rhyolites and minor gabbros and syenites, which occur in sub-
3
volcanic intrusive complexes as ring dykes and related annular and cylindrical bodies
(Turner, 1989). Partly decomposed basaltic boulders, plugs or domelike outcrops
represent the Older Basalts which is known as the Lateritized basalt. The lateritized Older
Basalts represent lavas now decomposed to clays and usually overlain by a thick cap of
laterite ironstone (Turner, 1971). As a result of weathering activity, the rocks of the study
area have undergone immense laterization resulting in the formation of laterites in areas
that were formerly covered by rocks. The older basalts have been intensely weathered
and only the ironstone capping can be seen on the surface.
Fig.1: Geologic Map showing sampling locations
4
MATERIALS AND METHODS
Disturbed samples were collected at change of strata and convenient intervals at a
depth of not less than 0.5m for visual inspection and classification tests. Undisturbed
samples were collected with tubes by the method of digging using a digger to a depth of
1m and above, from different locations within the study area (Fig.1). A total of twenty
samples were collected. Laboratory geotechnical analyses such as the grain size analysis,
Atterberg limits, Liquid/Plastic Limit tests, Plasticity Index, Linear Shrinkage Tests,
Compaction and shear Strength tests in accordance with procedures of the British
standard (BS) 1377 with necessary modifications were carried out.
For the grain size analysis, 500 grams of the natural soil sample was oven dried
and passed through a series of sieves of known aperture with a number 3/8 inches on top
a number 200 at the bottom. Sieving consisted of electrically shaking the sieves for some
minutes. Fractions of the sample retained were weighed and recorded. From the weights
recorded, the percentage retained and the percent passing in each of the sieves were
calculated. The percentage passing was then plotted against grain size on the semi-log
paper (Fig.2).
The portion of air dried sample passing the British Standard sieve number 36
(0.425mm) was used for Atterberg limits test. The sample was mixed with ordinary tap
water up to plastic limit for about five minutes and left over night for 24 hours.
One standard was used in the compaction test, the British Standard (BS).The
material used in each case was that passing through the 5mm (3/16 inches) British
Standard sieve. The retained portions were discarded. The soil was air dried to 0 – 2 %
moisture before the test. In the British Standard test a certain percentage of water was
added to the soil and mixed very well until uniform moisture distribution is attained. The
mixture was compacted in three layers in a Standard proctor mould using a 25
blows/layer of a 2.5kg rammer falling from a height of about 0.3005m (1ft). The sample
was leveled to the top of the mould and weighed. The difference between this weight and
that of the empty mould gave the weight of the compacted material. The experiment was
repeated at higher water content for each of the percentage mixtures.

5
For shear strength test, undisturbed samples were collected in three tubes for each
location and taken to the laboratory. The samples were extruded from the tubes into a
mould where it is being removed and weighed (wet weight). The sample is covered with
a rubber membrane to prevent loss or gain of moisture. The extremities of the sample
were covered with flat porous plates and the prepared sample set up in the triaxial
chamber. Cell pressures of 15, 30 and 45 KN/m2 respectively were used as confining
pressures for the tests while axial loading was applied electrically at a constant rate
through a proving ring of known constant. The dial readings were nulled and the machine
set in motion. The deviator load read from the load dial gauge at predetermined strain dial
values corresponding to known percentages of strain.
Table 1:- Summary of geotechnical properties of soils
Location Soil Description % passing
sieve No.200
British Sieve
Atterberg Limits Strength
Parameters
Compaction
characteristics
L S %
(LL) % (PL)
%
(PI)
% (φo) (Cu)
KN/m2
(%)
OMC
(MDD)
Kg/m3
A ba Memorial college- ABA Brownish –white Clay 91.92 55.4 40.6 14.8 24 21 22 1500 10.7
Abattoir 1-ABB1 Orange-brown sandy clay 45 41.5 30 11.5 - - 14.6 1820 7.9
Abattoir 2- ABB2 Brownish Sandy -clay 48 50 39.1 10.9 20 41.34 14.4 1860 10.8
Dwei Du –DD Reddish brown sandy clay 37 41.2 32 9.2 23 41.34 16 1820 7.1
Federal Low-cost- FDL 64 50.2 37 13.2 26 28 20.4 1650 10
Fwavwei link – FWL 53 48.6 35.2 13.4 32 28 17.9 1760 9.3
Gwarandok 1- GD1 Brownish white clay 97 61.7 40.5 21.2 18 34.45 22.6 1520 10.7
Gwarandok 2 –GD2
Red
dish
bro
wn
sand
y cl
ay
57 50 35.3 14.7 - - 17.4 1710 11.4
Industrial layout – IL 61 59.8 40.2 19.6 27 41.34 20.5 1670 10.0
Kwanga Pri. Sch - K1 54 47.8 37.7 10.1 - - 18.1 1740 10.0
Kwang – Rayfield - K2 34 46.8 34.7 12.1 - - 14.7 1870 10.0
Latya – LA 53 51 37.2 13.8 30 21 17.3 1890 10.7
Liberty dam – LB 52 48.0 36.0 12.0 14 48 23.8 1570 10.7
Longwa –LG 42 34 23.5 10.5 30 55 21.6 1560 7.1
Hwolshe – NTA 52 46.2 25 21.7 18 38 18.6 1630 9.3
Shaka 1 - SK1 55 48.2 37.6 10.6 17 24.12 22.7 1540 10.0
Shaka 2 - SK2 34 40.1 30.7 9.4 22 41.34 17.3 1750 6.4
Wild life Park – WLP 26 36.8 27.4 9.4 - - 22.7 1570 6.4

6
ABA
Particle Size Distribution
Description
Log setting velocity in cm. per second B. S. S ieve Numbers Aperture Size in inches
ClayFraction
fine medium coarse fine medium coarse fine medium coarse
Silt Fraction Sand Fraction Gravel FractionBoulders
Sum
mat
ion
Perc
enta
ge
Summ
ation Percentage
90
100
80
70
60
50
40
30
20
10
0
90
100
80
70
60
50
50
40
30
20
0
10
0006 002 006 02 06 2 6 2 6 20 60 200
Particle Size in mm
4 3 2 1 300 200 150 100 75 52 36 25 18 14 10 7 16 3/8 1 1 3 5½ ½
ABB2LB
Sk1
ZK
Sk2
WLP
NTA
LA
LG
K1IL
Gd2
FWL
FDL
DDABB1
ZM
52
Gd1
K2
Fig.2: Summary of Particle Size distribution
7
% P
last
icity
Inde
x (P
I)
% Liquid Limit (LL)
100 20 30 40 50 60 70 80 90 100
10
20
30
40
50
60
0
100 20 30 40 50 60 70 80 90 100
4
7
35
1 - ABA2 - ABB3 - ABB4 - DD5 - FDL6 - FWL7 - GD8 - Gd9 - IL10 - K11 - K12 - LA13 - LB14 - LG15 - NTA16 - WLP17 - SK18 - Sk19 - 2K20 - 2M
1
2
1
2
1
2
1
2
Inorganic silts,very fine sands,rock flour, silty orclayey fine
ML =
Organic silts andorganic silty claysof low plasticity
OL =
Inorganic silts,micaceous ordiatomaceous finesands or silts, elastic silt
MH =
Organic clays ofmedium tohigh plasticity
OH =
INORGANIC CLAYS
A - LINE
PI = 0.73 (
LL - 20)
Soils Plasticity Plasticity Plasticity
CH
Cohesionless Low Medium High
LL - 50LL - 35LL - 20
CL
CL
ML & OL
ML
CL - ML 19
1416
1842
20 1115
10 176
1333
12
61 9
7
MH & OH
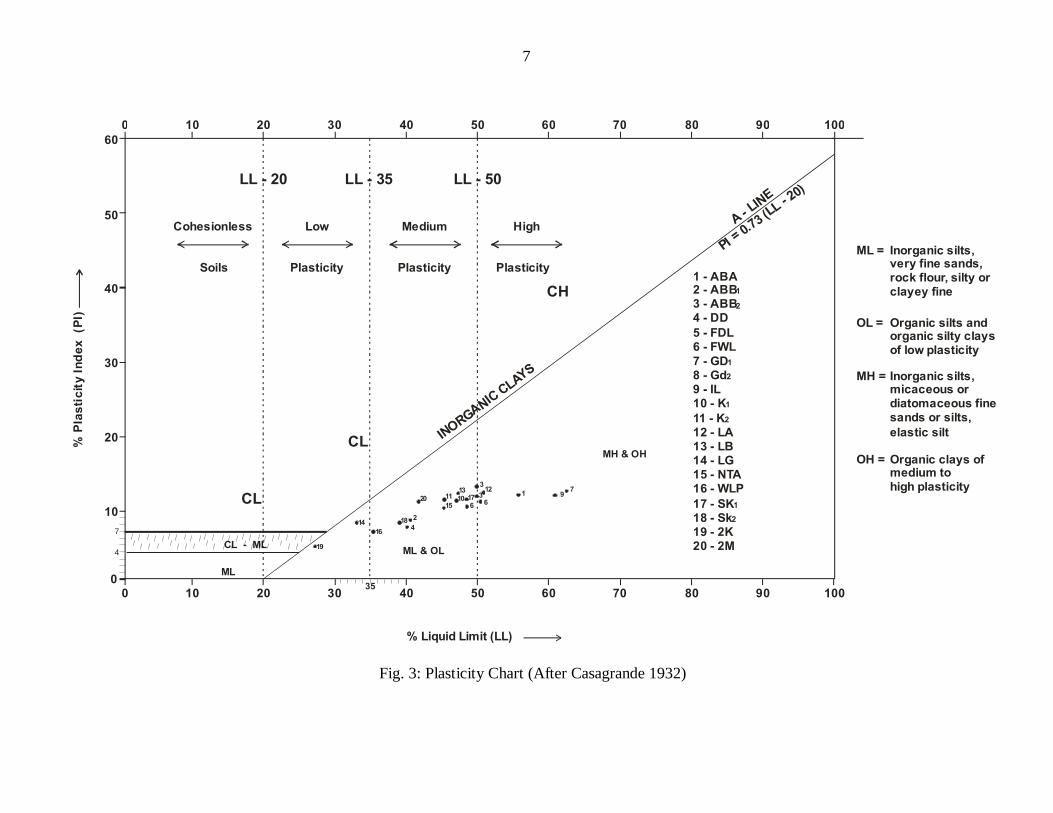
Fig. 3: Plasticity Chart (After Casagrande 1932)

8
6 8 10 12 14 16 181.300
1.400
1.500
1.600
1.700
1.800
Max Dry DensityOptimum Moisture ContentC.B.R. at Opt. M.C.
kg/m%%
MOISTURE CONTENT - percent
Compaction Curve
DR
Y D
ENS
ITY
- kg/
m1
ABB 2
NTALB
K2
LG
KL
DD
O M C
MD
D
Fig. 4: Summary of Compaction Curves
According to the AASHTO classification, soil samples from, Abattoir 1(central
part of the study area), Abattoir 2 (central part of the study area), Dwei-Du (south eastern
part of the study area), Federal low-cost (southern part), Fwa-vwei link, Gwarandok 2
(central part), Industrial layout (southern part), Kwanga primary School, Liberty dam
(North eastern part), Longwa (north western part), Hwolshe NTA, Shaka1(North eastern
part) and Zaramaganda, more than 35% of the soils passes through sieve No.200 hence
the soils are in the group A – 4 or higher and falls in the silt – clay group and can
therefore, be classified as fair materials. More than 75% of samples from Aba Memorial
College (central part) and Gwarandok1(central part) pass through No. 200 sieve, they are
regarded as A – 6 group falling in the clayey group of soils and are poor materials, while
for Samples from Kwanga Primary School, Shaka 2 (North eastern part), Wild Life Park,

9
Zot Kwang, less than 35% pass through the No. 200 sieve and are therefore regarded as
A – 2 material falling in the silty or clayey gravel and sand group of soils, except that the
liquid limit for Kwang exceeds 40 which is the maximum value for A – 2 soils, also the
plasticity index is greater than 11 which is the maximum value for A – 2 soils. The non-
satisfaction of the liquid limit and the plasticity index requirement indicates that the soil
is actually poor in quality when compared to A – 2 soils. It therefore would require
improvement before it can be used as an A – 2 materials. However, samples Shaka 2
(North eastern part), Wild Life Park (north western part) and Zot Kwang (south eastern
part) fall within the range of liquid limit for A – 2 materials, hence these soils can be
regarded as good materials.
According to the Unified Soils Classification System (USCS), (Fig. 3) soils from
Abattoir 1 (central part), Dwei Du (south eastern part), Fwavwei link (southern part),
Kwanga Primary School, Kwang (south eastern part), Liberty Dam (North eastern part),
Hwolshe NTA, Shaka 1(North eastern part), Shaka 2 (North eastern part), Wild life park
(north western part), and Zaramaganda contain inorganic silts and silty - clay of medium
plasticity, while soils from Longwa (north western part), Zot Kwang (south eastern part)
can be classified as soils containing inorganic silts and silty clays of low plasticity
values. Also, soils from Gwarandok 2 (central part of the study area) and Abattoir
2(central part of the study area) which plot exactly on the LL = 50 can together with Aba
Memorial College, Federal Low cost, Gwarandok 1(central part of the study area),
Industrial Layout (southern part), and Latya (southern part) be classified as containing
inorganic silts of high plasticity.
The liquid limit ranges between 30.3 and 61.7, while the plasticity index ranges
between 7.8 and 21.7
According to the guidelines of Federal Ministry of Works (FMW, 1997), the
liquid limit should not exceed 35% to be suitable for use as sub - grade and sub- base or
base course materials, hence samples Longwa (north western part) and Zot Kwang
(south eastern part) can be regarded as fairly good for sub- base or base course materials.
Generally, soils with high liquid limit (LL) are clays with poor engineering
properties too weak in strength, Asphalt Institute (1962).The Institute states that the
typical liquid limit for clay is 40 – 60 and silt is 25- 50 and plastic limit for clays is

10
between 6 – 14 while silt is 15 – 30 to be able to meet the requirement for highway
construction. Following the classification of these soils above, the soils have been
regarded as silt and silty clay, hence, it can be deduced that that since the liquid limit of
the studied soils range between 30.3 and 61.7; all the soils can be used for highway
constructions except for Gwarandok 1(central part of the study area) with Liquid limit
(LL) of 61.7. Also, based on plastic limit values, samples from Abattoir1(central part of
the study area), Longwa (north western part), Hwolshe NTA (northern part), Wild life
Park (north western part), Zot Kwang (south eastern part)and Zaramaganda (south
western part) fall within the recommended range specified by the Institute.
According to the specification for Roads and Bridges, Ministry of Works, Benue-
Plateau State (1975), samples from Abattoir1, Dwei Du (south eastern part), Longwa
(north western part), Wild life park (north western part), Shaka 2 (North eastern part), Zot
Kwang (south eastern part) and Zaramaganda (south western part) has fulfilled the
requirements to be used as fill materials with Liquid limit (LL) ranging from 0 – 45% and
plasticity index of 0 – 20%.
Swelling potential rating of some Northern Nigerian soils based solely on
plasticity (PI) index is given below:
Table 2:- Relationship between the plasticity index and swelling potential (Ola, 1981)
Plasticity
index (%)
Swelling potential Studied Soils
0 – 15 Low ABA, ABB1, ABB2, DD, FDL, FWL, GD2, K1,
K2, LA, LB, LG, SK1, SK2 WLP, ZK,ZM
15 -25 Medium GD1, IL, NTA
25 – 35 High
> 35 Very high
Samples from Aba Memorial College (central part), Abattoir 2, Federal low-cost
(southern part), Fwa -vwei Link (south western part), Gwarandok1(central part of the
study area), Gwarandok 2(central part of the study area), Industrial layout (southern part),
Kwanga Primary School, Kwang (south eastern part), Latya (southern part), Liberty dam
(North eastern part), Hwolshe NTA (northern part), Shaka1(North eastern part) and

11
Zaramaganda (south western part) have linear shrinkage of greater than 8 % hence, they
are indicators of expansiveness, thus, can pose field compaction problems (Gidigasu,
1973) because linear shrinkage values greater than 8% indicate expansiveness, as noted
by Attimeyer, (1954). Samples from Abattoir1(central part of the study area), Dwei- Du
(south eastern part), Longwa (north western part), Shaka 2 (North eastern part), Wild life
Park (north western part) and Zot Kwang (south eastern part) have values of less than
8%.
The Specifications for Roads and Bridges, Benue-Plateau (1975) states the significance
of the moisture – density test as an aid in the field compaction of soils so as to develop
the best engineering properties of the material, since it is assumed that the strength or
shearing resistance of the soil increases with higher densities. The manual states the range
of maximum values of dry density and optimum moisture content as follows:-
Table 3: Maximum dry density specification
Type of Material Maximum Dry Density
(MDD) Kg/m3
Optimum Moisture
Content (OMC) %
Clays 1440 – 1680 20 – 30
Silty clays 1660 – 1840 15 - 25
Sandy clays 1760 – 2160 8 – 15
The moisture density relationship, i.e. the compaction curves (Fig.4) showed a
maximum dry density ranging from 1500kg/m3 for the lowest curve and 1890 k/m3 for
the highest curve at an optimum moisture content of 23.4 and 13.4 % respectively. Since
the curve indicates the maximum bulk density to which the soil may be compacted by a
given force and the water content of the soil that is optimum for maximum compaction,
when the soil is either drier or wettier than this values, the compaction will be more
difficult,( Brady and Well,1999). Based on the range of values anticipated for the
standard moisture density test stated above (Table 3), the soils in the study area fall in the
clays and silty clays range which also concur with the results indicated by the Atterberg
limit classification and grain size distribution.
The results show that, to compact the soils in the field, the sample with the least
optimum moisture content will require smaller amount of water to bring it to its highest

12
density. It could also mean that the samples with high range of moisture absorption
capacity may have an advantage in an exceptionally moist area and may easily become
saturated and so lose its strength relatively fast, (Alabo et al., 1984).
Knowledge of shear strength is required in all engineering problems involving
stability analysis such as in the design of foundations of structures retaining walls and
stability of earth slopes. Perhaps the most important property of a soil for engineering
uses is its strength, which is the measure of the capacity of a soil mass to withstand
stresses without giving way to those stresses by rupturing or becoming deformed.
According to Krynine and Judd (1957), the unconfined compression test is an important
test often used to estimate the shear strength of engineering soils. Generally for clayey
soils, the shear strength is about half of the unconfined compressive strength.
The shear strength values of the soils i.e. frictional angle (φ) range between 140
and 320, while cohesion intercepts (c) ranged from 21 – 55 KN/m2 (Table 3). Based on
the values of the shear parameters for the studied soils, the soils can be described as
cohesive soils, since none of the shear parameters is zero. It should be noted that the
bearing capacity of the soils can be estimated using the shear strength parameters at a
known depth and width of foundation.
CONCLUSION
Results of the geotechnical properties of part of Jos and environs reveal soils from Wild
Life Park, Zot Kwang , Dwei Du and Longwa as good materials for sub base and sub
grade highway construction and for other construction work, while soils from Shaka1 ,
Abattoir 1and Hwlolshe NTA are rated as fair materials for sub-base and sub grade
highway construction and other applications. Soils from Aba memorial College, Abattoir
2, Federal low cost, Fwavwei link, Gwarandok 1, Gwarandok 2, Kwanga Primary school,
Kwang, Latya, Liberty dam, Shaka 2, Industrial layout, Zaramaganda would need some
form of improvement in order to provide an excellent result in highway construction and
other applications. Soil improvement technique such as stabilization is recommended to
improve the quality of the poor soils, so that they can be utilized effectively. There is
need for further investigation on the Lateritic soils on the Jos Plateau. This will provide
comprehensive data on the use of geotechnical properties of Lateritic soils and as
references for future work.

13
REFERENCES
Ajayi, L. A. (1987: Thoughts on road failures in Nigeria. Journal of Nigerian engineers,
vol. 22 (1), pp. 10 – 17.
Alabo, E.H., FitzJohn, W.H. and Ogaree, F.A. (1984): Geotechnical properties of a
tropical red soil from parts of the eastern Delta, Nigeria. Nigerian journal of
mining geology, vol. 21 (1&2), pp.35–39.
Asphalt Institute (1962): The Asphalt Handbook, Maryland, U.S.A, 176p.
Attimeyer, W. T. 1954: Discussion of engineering properties of expansive clays, by
Holtz, W. G. and Gibbs, H. J. Trans. ASCE, vol. 121, pp.666–669.
Brady, C. N. and Well, R.R (1999): The nature and properties of soils.5th ed. New Jersey
Prentice Hall.
British Standards Institution (1975): Methods of testing soils for civil engineering
purposes, BS 1377. British Standard Institute, London.
Casagrande, A. (1932): Research on the Atterberg limits of soils, public roads, vol.13 (8),
pp. 121–136.
Falconer, J. D. (1911): The geology and geography of northern Nigeria. Macmillan
London.
Federal Ministry of Works and Housing (1997): General specifications for roads and
bridges. Federal highway Department, vol.2, pp. 145 – 284.
Gidigasu, M.D. (1973): Review of identification of problem lateritic soils in
highway engineering. Transport Research Board, Washington 407, pp.96–111.
Krynine, D. P and Judd, W.R. (1957): Principles of engineering geology and
geotechnics. McGraw-Hill Book Co., New York.
Ministry of works (1975): Specifications for roads and bridgeworks. Government of
Benue-Plateau.
Ola , S.A. (1981): Mineralogical properties of some Nigerian residual soils in relation
with building problems. Eng. Geol., vol. 15, pp.1 – 13.