Digital Repository Universitas Jember Digital Repository Universitas ...
Upload
khangminh22Category
view
7download
0
173
RESEARCH ARTICLE
Mapping of Soil Quality Index (SQI) for Paddy Fields Using
Sentinel-2 Imagery, Laboratory Analysis, and Principal
Component Analysis
Putri Tunjung Sari1,*, Indarto Indarto1, Marga Mandala1, Bowo Eko Cahyono2 1Department of Natural Resources and Environmental Management, University of Jember, Jl.
Kalimantan No. 37 Jember, 68121, Indonesia 2Faculty of Mathematics and Natural Sciences, University of Jember, Jl. Kalimantan No. 37
Jember, 68121, Indonesia
Received 2 June 2021/Revised 15 July 2021/Accepted 26 July 2021/Published 17 August 2021
Abstract
The use of intensive chemical inputs causes lower availability of nutrients, organic matter,
cation exchange capacity, and soil degradation.Therefore, this study aims to assess the soil
quality index (SQI) for paddy fields in Jember, East Java, Indonesia. Input data for this study
consist of land cover (interpreted from the Sentinel-2 image), soil type, and slope maps.
Furthermore, the procedure to calculate soil quality index (SQI) include (1) spatial analysis to
create the land unit, (2) preparation of soil sampling, (3) soil chemical analysis, (4) principal
component analysis (PCA), and (5) reclassifying soil quality index (SQI). The PCA results
showed that three variables i.e., % sand, total- P, and % silt were strongly correlated to SQI,
while three classes namely very low, low, and medium of SQI were sufficiently used to
describe the spatial variability of the paddy field. Furthermore, approximately 41.14% of the
paddy field area were classed as very low while 52.23%, and 6.63% were categorized as low
and medium SQI respectively. Based on the results, about 93.37% of paddy fields in Jember
Regency still require improvement in soil quality via the addition of ameliorants such as
organic fertilizers to increase quality and productivity. This application needs to focus on
areas with very low-low quality hence, the quality increased to the medium category.
Keywords: Mapping; Soil Quality Index (SQI); PCA; Paddy field
1. Introduction
The Increasing population and food demand have forced farmers to intensify and
extend agricultural land to improve productivity (Ren et al., 2020). Agricultural
intensification is an activity that aims to optimize agrarian land by providing additional inputs
to increase productivity (Xie et al., 2019). Meanwhile, extensification involves expanding
agricultural land and minimizing external inputs (Van Grinsven et al., 2015). The use of
intensive chemical inputs such as fertilizers and pesticides indicates agricultural
intensification activities. However, most farmers do not understand the concept of sustainable
agriculture (Johannes et al., 2019;Terano et al., 2015).
*Corresponding author. mmm Email address: [email protected] (Putri Tunjung Sari)
Geosfera Indonesia Vol. 6 No. 2, August 2021, 173-188
p-ISSN 2598-9723, e-ISSN 2614-8528
https://jurnal.unej.ac.id/index.php/GEOSI
DOI : 10.19184/geosi.v6i2.24506
*Corresponding author. mmm
Email address: [email protected] (Putri Tunjung Sari)
174
Putri Tunjung Sari et al. / Geosfera Indonesia 6 (2), 2021, 173-188
The continuous use of chemical fertilizers and pesticides has negative impacts on the
soil (Li et al., 2018). A previous study stated that fertilizer and pesticide residues settle in the
soil thereby increasing its acidity (Asvini & Jithesh, 2018). Other impacts observed include
lower availability of nutrients, organic matter, and cation exchange capacity (Hung et al.,
2019; Maas et al., 2017). Agricultural extensification is usually conducted by land conversion
and forest clearing. Mohawesh et al. (2015) stated that changes in land-use affect soil quality,
while Pierzynski et al. (2005) defined soil quality as multicriteria analysis results of chemical,
physical and biological properties. Furthermore, the characteristics of good soil usually
comprise (1) good drainage, (2) good water holding capacity (WHC), (3) less erosion, and (4)
high nutrient content (Seifu & Elias, 2018). Good quality soil supports optimal plant
productivity. Meanwhile, soil quality assessments are used to identify, evaluate and
determine the appropriate technology for land management and sustainability (Roy et al.,
2015).
Rice is widely known as the principal food of the Indonesians, therefore, the presence
of paddy fields is essential to support agricultural land and fulfill food demand. Generally,
farmers overuse fertilizers and pesticides, which in turn decrease the land quality. Moreover,
the input cost of chemical fertilizers and pesticides is expensive compared to the benefit in
the form of increase in production (Xie et al., 2019). This condition has also been exacerbated
by the increased price of chemical fertilizers in the market, hence, farmers spend much
money for less productive results. The benefits of calculating SQI include (1) increase
farmers' awareness of land mismanagement, (2) mapping complex land variability, and (3) as
a guide for sustainable management plan (Ren et al., 2020; Lin & Fukushima, 2016).
Previous studies only referred to one of the soil's chemical, physical or biological
properties to determine SQI (Supriyadi et al., 2019; Supriyadi et al., 2018). However, this
study combines the three parameters to categorize the soil quality (Bahnemiri et al., 2019).
Soil quality analysis based on remote sensing is needed to assess land variability (Reddy et
al., 2020). Meanwhile, remote sensing technology is commonly used to classify land, based
on several criteria with high accuracy (Hore et al., 2020).
The combination of remote sensing and principal component analysis (PCA) is
effective in assessing soil quality. The PCA method is used for data reduction and selection
of the primary indicator that best represents the analysis and the results are presented in the
form of a minimum data set (MDS). Furthermore, the MDS component reduces the burden of
indicators in the SQI calculation model and prevents data redundancies (Mukherjee & Lal,
2014).

175
Putri Tunjung Sari et al. / Geosfera Indonesia 6 (2), 2021, 173-188
SQI was more interpolated using the Inverse Distance Weighting (IDW) method
which predicts value base on the distance between the data point and the expected location.
The expected value is calculated as the number of measured data points located in a specific
search environment on the predicted site (Bofana & Costa, 2017). Abdel Rahman et al.
(2021) stated that the IDW technique is the most commonly used method to predict soil
properties. Only a few studies focused on assessing soil quality based on one soil
characteristic. Also, there are limited studies on the physical, chemical, or biological
properties only. Therefore, this study aims to assess soil quality based on the physical,
chemical, and biological properties by combining spatial analysis.
2. Methods
This study was conducted from December 2020 to April 2021, and the study area
covers all paddy fields in Jember Regency, East Java, Indonesia (Figure. 1).
Figure 1. Study area and classified land cover map (2019)
176
Putri Tunjung Sari et al. / Geosfera Indonesia 6 (2), 2021, 173-188
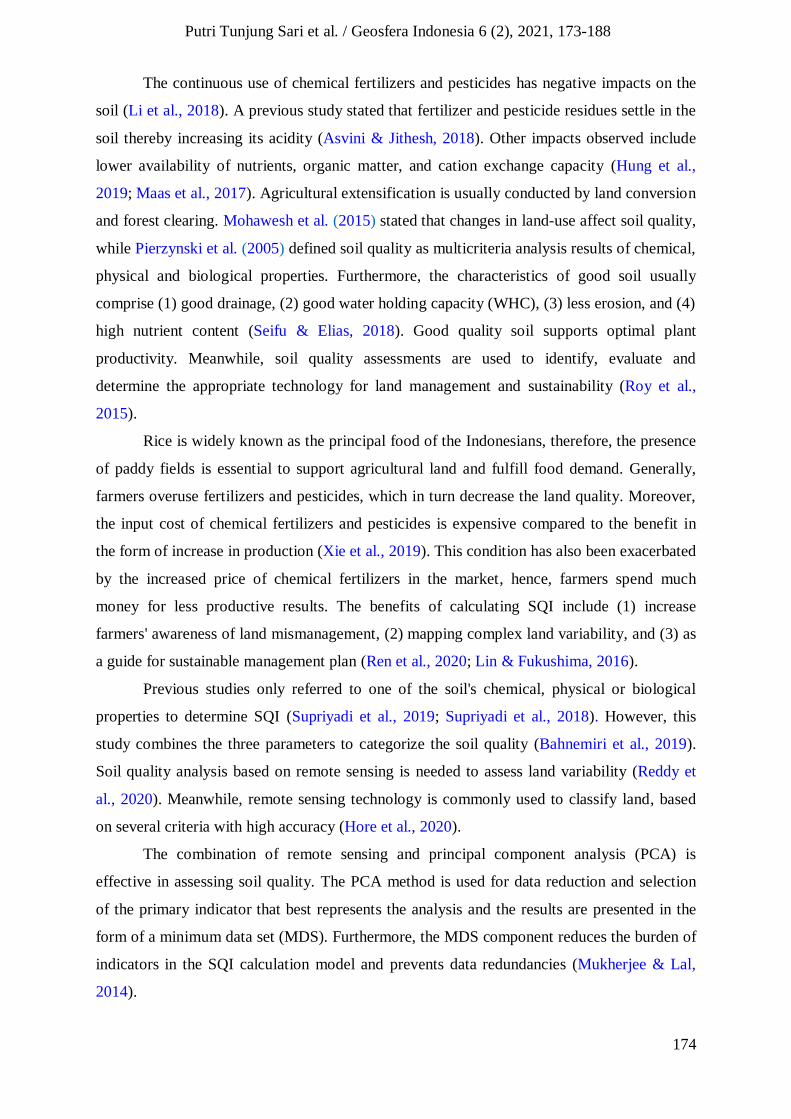
2.1 Input Data and Tool Used
The three maps (Table 1) were used as input data for this study.
Table 1. Research materials
Material Sources
Land cover map Sentinel 2A satellite image data processing
(USGS, 2019)
Soil type map (Balai Penelitian Tanah, 2015)
Slope map Derived from DEMNAS (BIG, 2019)
The tools used in this study consist of soil sampling and laboratory analysis
equipment, as well as software for processing. Soil sampling equipment consists of a soil
drill, shovel, tape measure, and plastic clips, while the laboratory equipment includes atomic
absorption spectrophotometer (AAS), pH meter, and oven (Table 2). The data obtain were
analyzed using Multispect, GIS software, and statistical tools.
Table 2. List of tools used
Tool Specification and function
Soil drill To take soil samples
Shovel To take soil samples
AAS Soil potassium analysis
Musltispec Land cover analysis
Q-GIS Soil Quality Index (SQI) calculations
Source: (Supriyadi et al., 2018)
2.2 Research Procedure
The research procedure consists of (1) determination of land unit, (2) soil sampling,
(3) laboratory analysis, (4) principal component analysis (PCA), (5) scoring and
classification, and (6) assessment of soil quality index (SQI).
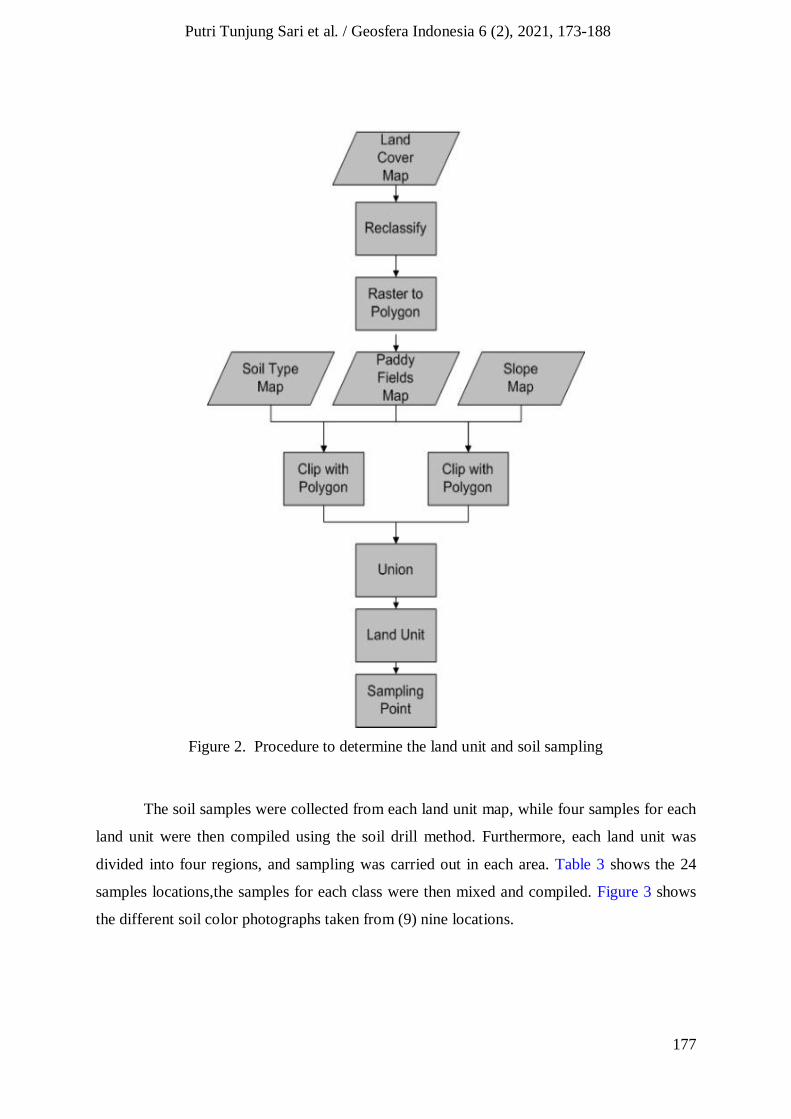
2.2.1 Land unit and soil sampling
The number of the land unit was determined by overlaying and intersecting three
input maps, i.e., land cover, soil type, and slope maps, as illustrated in Figure 2. First, the
land cover map was classified into two namely paddy fields and non-paddy fields, then, the
paddy field was converted from raster to polygon vector layer. Furthermore, the soil type and
slope map were clipped with polygon paddy field maps. The two maps results are united to
create a land unit map.
177
Putri Tunjung Sari et al. / Geosfera Indonesia 6 (2), 2021, 173-188
Figure 2. Procedure to determine the land unit and soil sampling
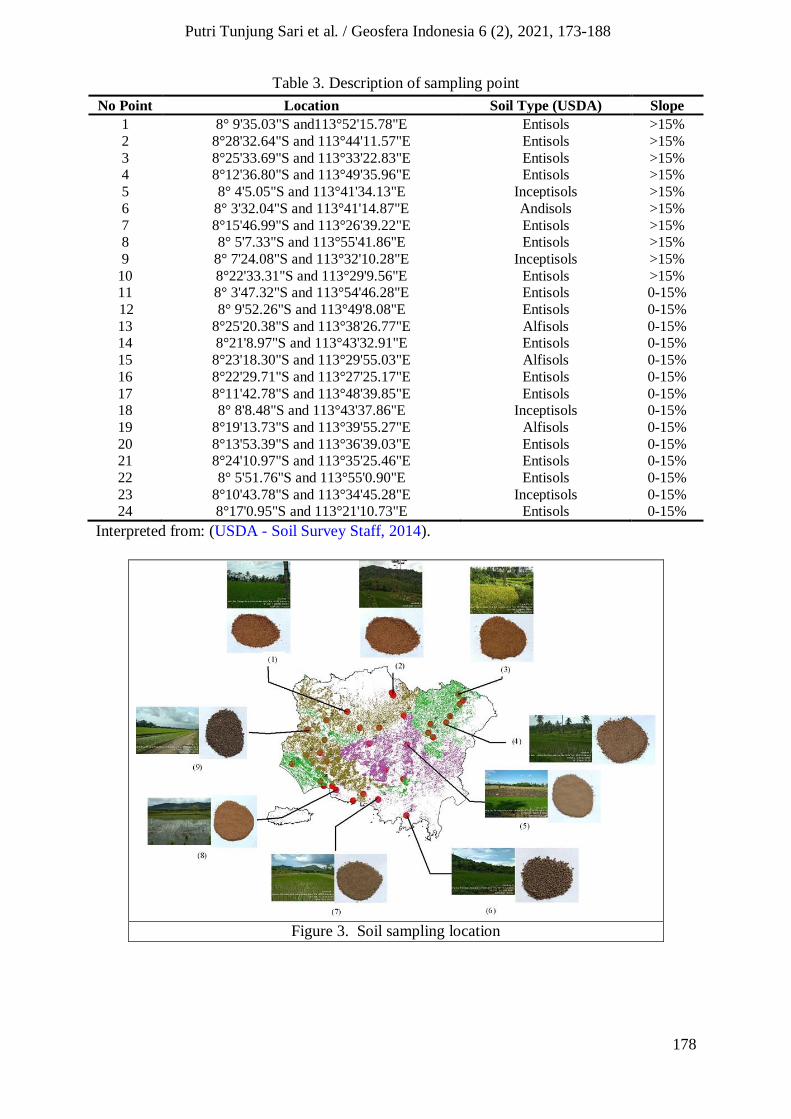
The soil samples were collected from each land unit map, while four samples for each
land unit were then compiled using the soil drill method. Furthermore, each land unit was
divided into four regions, and sampling was carried out in each area. Table 3 shows the 24
samples locations,the samples for each class were then mixed and compiled. Figure 3 shows
the different soil color photographs taken from (9) nine locations.
178
Putri Tunjung Sari et al. / Geosfera Indonesia 6 (2), 2021, 173-188
Table 3. Description of sampling point
No Point Location Soil Type (USDA) Slope
1 8° 9'35.03"S and113°52'15.78"E Entisols >15%
2 8°28'32.64"S and 113°44'11.57"E Entisols >15%
3 8°25'33.69"S and 113°33'22.83"E Entisols >15% 4 8°12'36.80"S and 113°49'35.96"E Entisols >15%
5 8° 4'5.05"S and 113°41'34.13"E Inceptisols >15%
6 8° 3'32.04"S and 113°41'14.87"E Andisols >15%
7 8°15'46.99"S and 113°26'39.22"E Entisols >15% 8 8° 5'7.33"S and 113°55'41.86"E Entisols >15%
9 8° 7'24.08"S and 113°32'10.28"E Inceptisols >15%
10 8°22'33.31"S and 113°29'9.56"E Entisols >15% 11 8° 3'47.32"S and 113°54'46.28"E Entisols 0-15%
12 8° 9'52.26"S and 113°49'8.08"E Entisols 0-15%
13 8°25'20.38"S and 113°38'26.77"E Alfisols 0-15% 14 8°21'8.97"S and 113°43'32.91"E Entisols 0-15%
15 8°23'18.30"S and 113°29'55.03"E Alfisols 0-15%
16 8°22'29.71"S and 113°27'25.17"E Entisols 0-15%
17 8°11'42.78"S and 113°48'39.85"E Entisols 0-15% 18 8° 8'8.48"S and 113°43'37.86"E Inceptisols 0-15%
19 8°19'13.73"S and 113°39'55.27"E Alfisols 0-15%
20 8°13'53.39"S and 113°36'39.03"E Entisols 0-15% 21 8°24'10.97"S and 113°35'25.46"E Entisols 0-15%
22 8° 5'51.76"S and 113°55'0.90"E Entisols 0-15%
23 8°10'43.78"S and 113°34'45.28"E Inceptisols 0-15% 24 8°17'0.95"S and 113°21'10.73"E Entisols 0-15%
Interpreted from: (USDA - Soil Survey Staff, 2014).
Figure 3. Soil sampling location
179
Putri Tunjung Sari et al. / Geosfera Indonesia 6 (2), 2021, 173-188
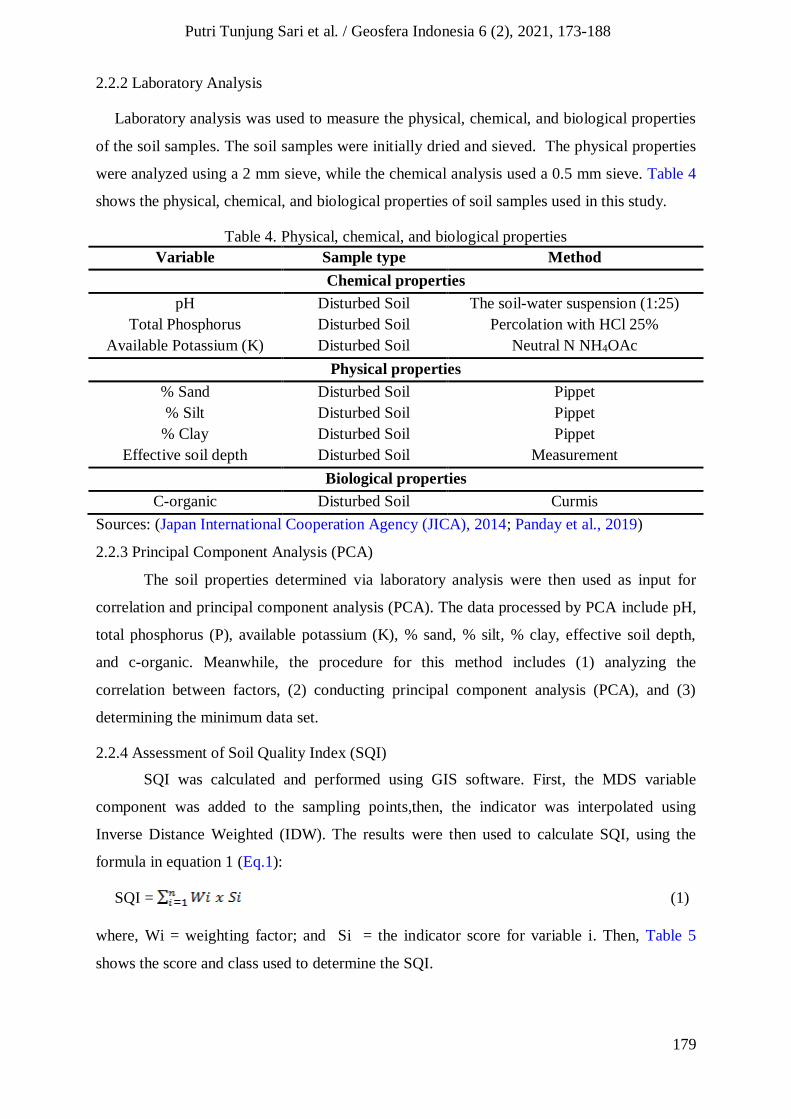
2.2.2 Laboratory Analysis
Laboratory analysis was used to measure the physical, chemical, and biological properties
of the soil samples. The soil samples were initially dried and sieved. The physical properties
were analyzed using a 2 mm sieve, while the chemical analysis used a 0.5 mm sieve. Table 4
shows the physical, chemical, and biological properties of soil samples used in this study.
Table 4. Physical, chemical, and biological properties
Variable Sample type Method
Chemical properties
pH Disturbed Soil The soil-water suspension (1:25)
Total Phosphorus Disturbed Soil Percolation with HCl 25%
Available Potassium (K) Disturbed Soil Neutral N NH4OAc
Physical properties
% Sand Disturbed Soil Pippet
% Silt Disturbed Soil Pippet
% Clay Disturbed Soil Pippet
Effective soil depth Disturbed Soil Measurement
Biological properties
C-organic Disturbed Soil Curmis
Sources: (Japan International Cooperation Agency (JICA), 2014; Panday et al., 2019)
2.2.3 Principal Component Analysis (PCA)
The soil properties determined via laboratory analysis were then used as input for
correlation and principal component analysis (PCA). The data processed by PCA include pH,
total phosphorus (P), available potassium (K), % sand, % silt, % clay, effective soil depth,
and c-organic. Meanwhile, the procedure for this method includes (1) analyzing the
correlation between factors, (2) conducting principal component analysis (PCA), and (3)
determining the minimum data set.
2.2.4 Assessment of Soil Quality Index (SQI)
SQI was calculated and performed using GIS software. First, the MDS variable
component was added to the sampling points,then, the indicator was interpolated using
Inverse Distance Weighted (IDW). The results were then used to calculate SQI, using the
formula in equation 1 (Eq.1):
SQI = (1)
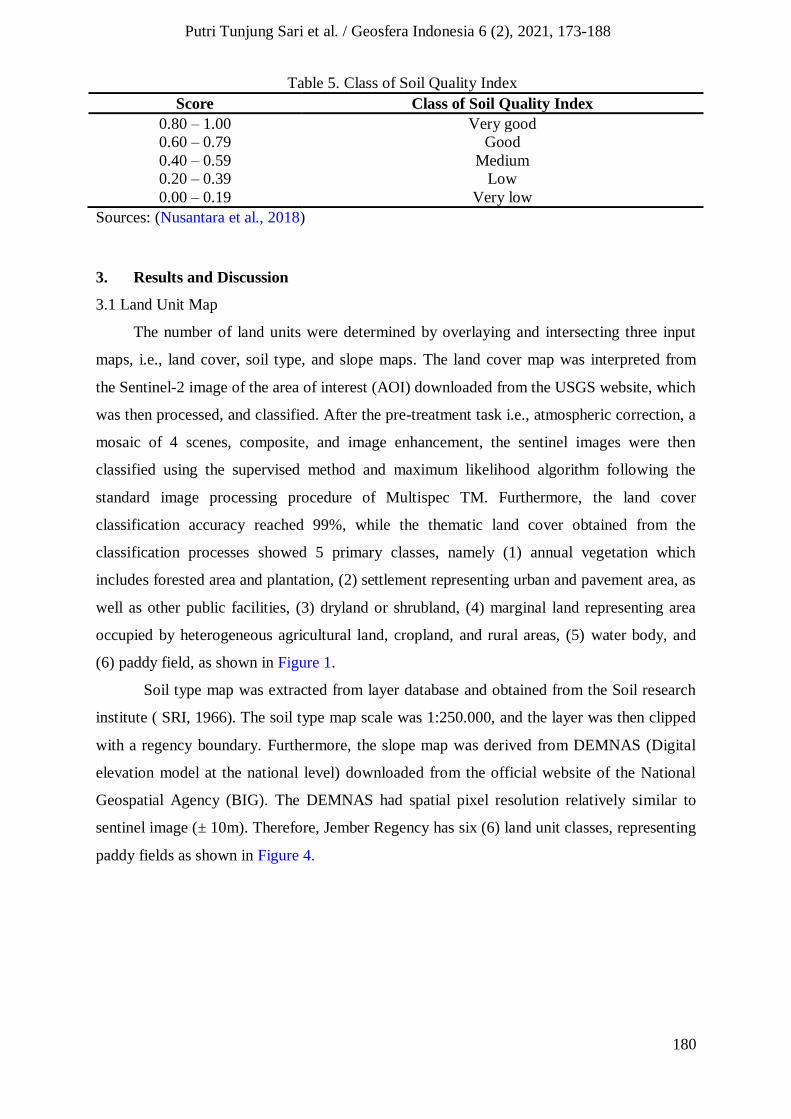
where, Wi = weighting factor; and Si = the indicator score for variable i. Then, Table 5
shows the score and class used to determine the SQI.
180
Putri Tunjung Sari et al. / Geosfera Indonesia 6 (2), 2021, 173-188
Table 5. Class of Soil Quality Index
Score Class of Soil Quality Index
0.80 – 1.00 Very good
0.60 – 0.79 Good
0.40 – 0.59 Medium
0.20 – 0.39 Low
0.00 – 0.19 Very low
Sources: (Nusantara et al., 2018)
3. Results and Discussion
3.1 Land Unit Map
The number of land units were determined by overlaying and intersecting three input
maps, i.e., land cover, soil type, and slope maps. The land cover map was interpreted from
the Sentinel-2 image of the area of interest (AOI) downloaded from the USGS website, which
was then processed, and classified. After the pre-treatment task i.e., atmospheric correction, a
mosaic of 4 scenes, composite, and image enhancement, the sentinel images were then
classified using the supervised method and maximum likelihood algorithm following the
standard image processing procedure of Multispec TM. Furthermore, the land cover
classification accuracy reached 99%, while the thematic land cover obtained from the
classification processes showed 5 primary classes, namely (1) annual vegetation which
includes forested area and plantation, (2) settlement representing urban and pavement area, as
well as other public facilities, (3) dryland or shrubland, (4) marginal land representing area
occupied by heterogeneous agricultural land, cropland, and rural areas, (5) water body, and
(6) paddy field, as shown in Figure 1.
Soil type map was extracted from layer database and obtained from the Soil research
institute ( SRI, 1966). The soil type map scale was 1:250.000, and the layer was then clipped
with a regency boundary. Furthermore, the slope map was derived from DEMNAS (Digital
elevation model at the national level) downloaded from the official website of the National
Geospatial Agency (BIG). The DEMNAS had spatial pixel resolution relatively similar to
sentinel image (± 10m). Therefore, Jember Regency has six (6) land unit classes, representing
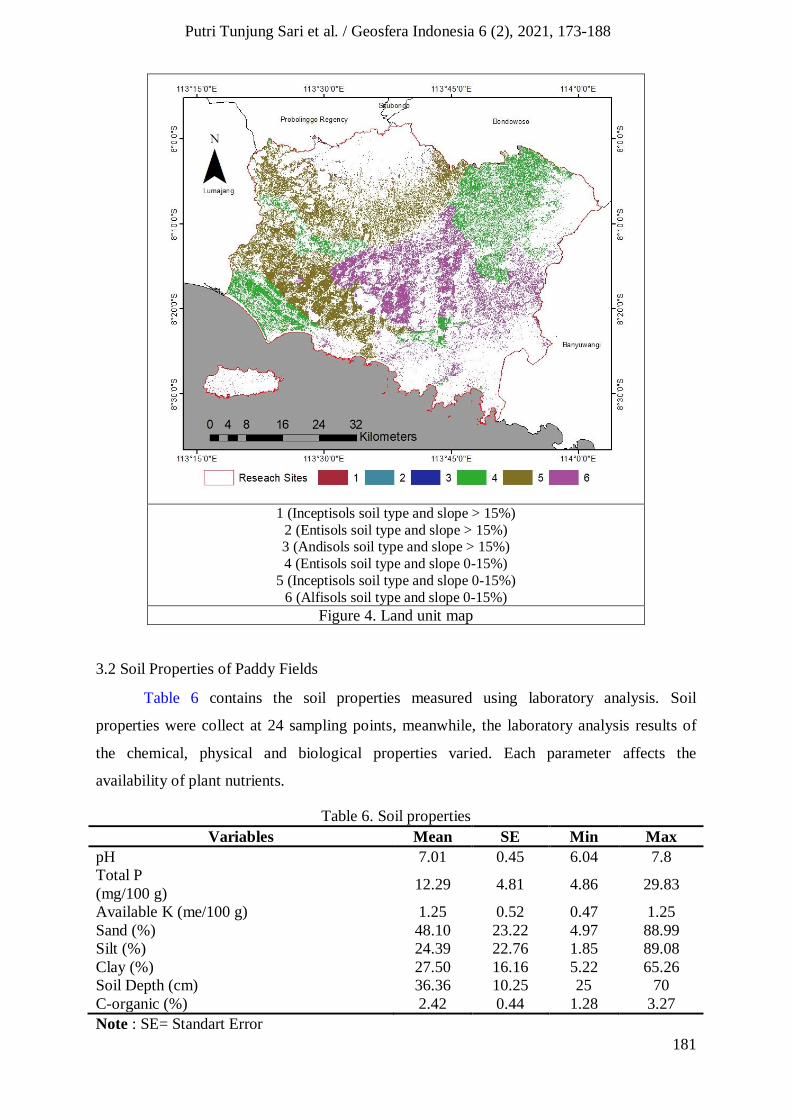
paddy fields as shown in Figure 4.
181
Putri Tunjung Sari et al. / Geosfera Indonesia 6 (2), 2021, 173-188
1 (Inceptisols soil type and slope > 15%) 2 (Entisols soil type and slope > 15%) 3 (Andisols soil type and slope > 15%) 4 (Entisols soil type and slope 0-15%)
5 (Inceptisols soil type and slope 0-15%) 6 (Alfisols soil type and slope 0-15%)
Figure 4. Land unit map
3.2 Soil Properties of Paddy Fields
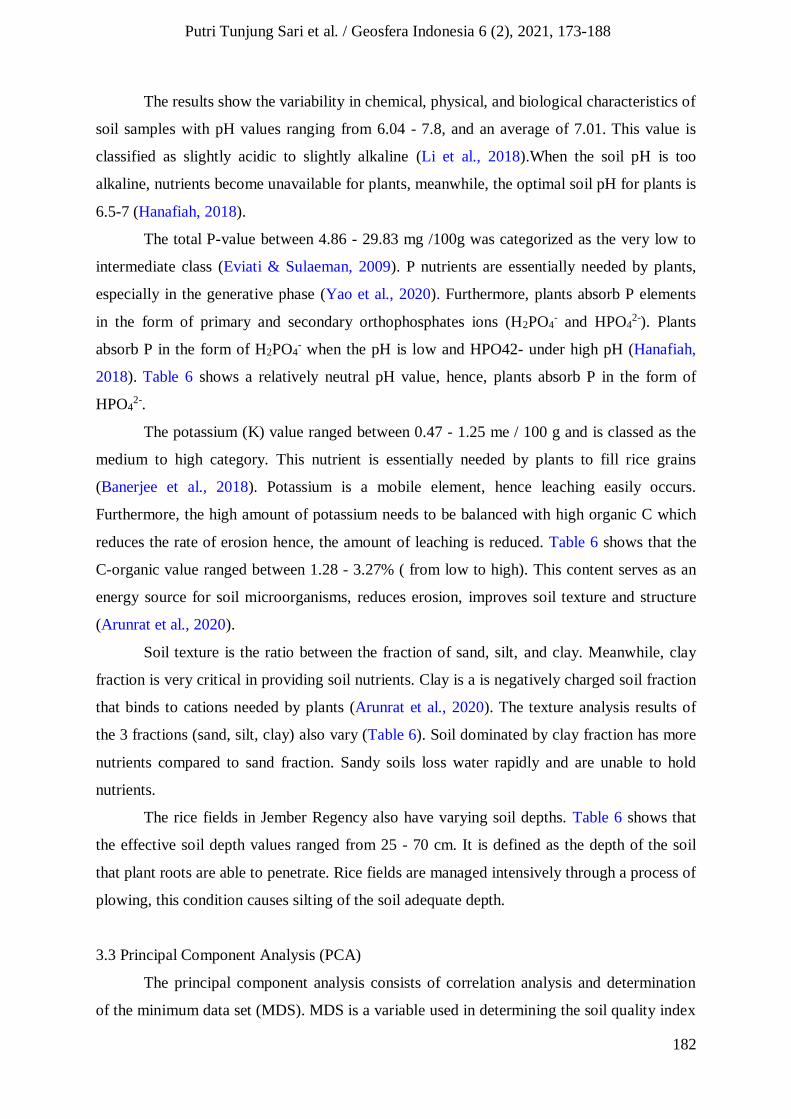
Table 6 contains the soil properties measured using laboratory analysis. Soil
properties were collect at 24 sampling points, meanwhile, the laboratory analysis results of
the chemical, physical and biological properties varied. Each parameter affects the
availability of plant nutrients.
Table 6. Soil properties
Variables Mean SE Min Max
pH 7.01 0.45 6.04 7.8
Total P
(mg/100 g) 12.29 4.81 4.86 29.83
Available K (me/100 g) 1.25 0.52 0.47 1.25
Sand (%) 48.10 23.22 4.97 88.99
Silt (%) 24.39 22.76 1.85 89.08
Clay (%) 27.50 16.16 5.22 65.26
Soil Depth (cm) 36.36 10.25 25 70
C-organic (%) 2.42 0.44 1.28 3.27
Note : SE= Standart Error
182
Putri Tunjung Sari et al. / Geosfera Indonesia 6 (2), 2021, 173-188
The results show the variability in chemical, physical, and biological characteristics of
soil samples with pH values ranging from 6.04 - 7.8, and an average of 7.01. This value is
classified as slightly acidic to slightly alkaline (Li et al., 2018).When the soil pH is too
alkaline, nutrients become unavailable for plants, meanwhile, the optimal soil pH for plants is
6.5-7 (Hanafiah, 2018).
The total P-value between 4.86 - 29.83 mg /100g was categorized as the very low to
intermediate class (Eviati & Sulaeman, 2009). P nutrients are essentially needed by plants,
especially in the generative phase (Yao et al., 2020). Furthermore, plants absorb P elements
in the form of primary and secondary orthophosphates ions (H2PO4- and HPO4
2-). Plants
absorb P in the form of H2PO4- when the pH is low and HPO42- under high pH (Hanafiah,
2018). Table 6 shows a relatively neutral pH value, hence, plants absorb P in the form of
HPO42-.
The potassium (K) value ranged between 0.47 - 1.25 me / 100 g and is classed as the
medium to high category. This nutrient is essentially needed by plants to fill rice grains
(Banerjee et al., 2018). Potassium is a mobile element, hence leaching easily occurs.
Furthermore, the high amount of potassium needs to be balanced with high organic C which
reduces the rate of erosion hence, the amount of leaching is reduced. Table 6 shows that the
C-organic value ranged between 1.28 - 3.27% ( from low to high). This content serves as an
energy source for soil microorganisms, reduces erosion, improves soil texture and structure
(Arunrat et al., 2020).
Soil texture is the ratio between the fraction of sand, silt, and clay. Meanwhile, clay
fraction is very critical in providing soil nutrients. Clay is a is negatively charged soil fraction
that binds to cations needed by plants (Arunrat et al., 2020). The texture analysis results of
the 3 fractions (sand, silt, clay) also vary (Table 6). Soil dominated by clay fraction has more
nutrients compared to sand fraction. Sandy soils loss water rapidly and are unable to hold
nutrients.
The rice fields in Jember Regency also have varying soil depths. Table 6 shows that
the effective soil depth values ranged from 25 - 70 cm. It is defined as the depth of the soil
that plant roots are able to penetrate. Rice fields are managed intensively through a process of
plowing, this condition causes silting of the soil adequate depth.
3.3 Principal Component Analysis (PCA)
The principal component analysis consists of correlation analysis and determination
of the minimum data set (MDS). MDS is a variable used in determining the soil quality index
183
Putri Tunjung Sari et al. / Geosfera Indonesia 6 (2), 2021, 173-188
(SQI), while correlation analysis is used to determine the relationship between the observed
variables. Table 7 shows the correlation analysis results.
Table 7. Correlation analysis
Total P Available K C-organic Soil Depth pH Sand Silt Clay
Total P 1.000
Available K 0.206 1.000
C-organic 0.222 0.262 1.000
Soil Depth -0.328 -0.243 -0.389 1.000
pH -0.062 0.036 0.018 0.113 1.000
Sand 0.096 -0.138 -0.543* 0.264 -0.155 1.000
Silt 0.118 0.048 0.125 -0.073 0.312 -0.213 1.000
Clay -0.157 -0.017 0.443 -0.100 0.374 -0.836* 0.245 1.000
Note: * significant
Table 7 shows the correlation analysis results for each soil variable. Sand and clay
fractions have the highest correlation compared to other variables, with a value of -0.836. A
negative value indicates that the relationship between the two is reversing. When the sand
fraction value is high, the clay fraction value tends to be low and vice versa. Furthermore, the
lowest correlation result was found between C-organic and pH variables with a value of
0.018, which is in the shallow category. Fetene & Amera (2018) stated that c-organic has
more effect on soil porosity and volume weight. The next procedure was extraction via
principal component analysis (PCA). The extraction results were in the form of minimum
data sets used in scoring and determining the soil quality index (SQI).
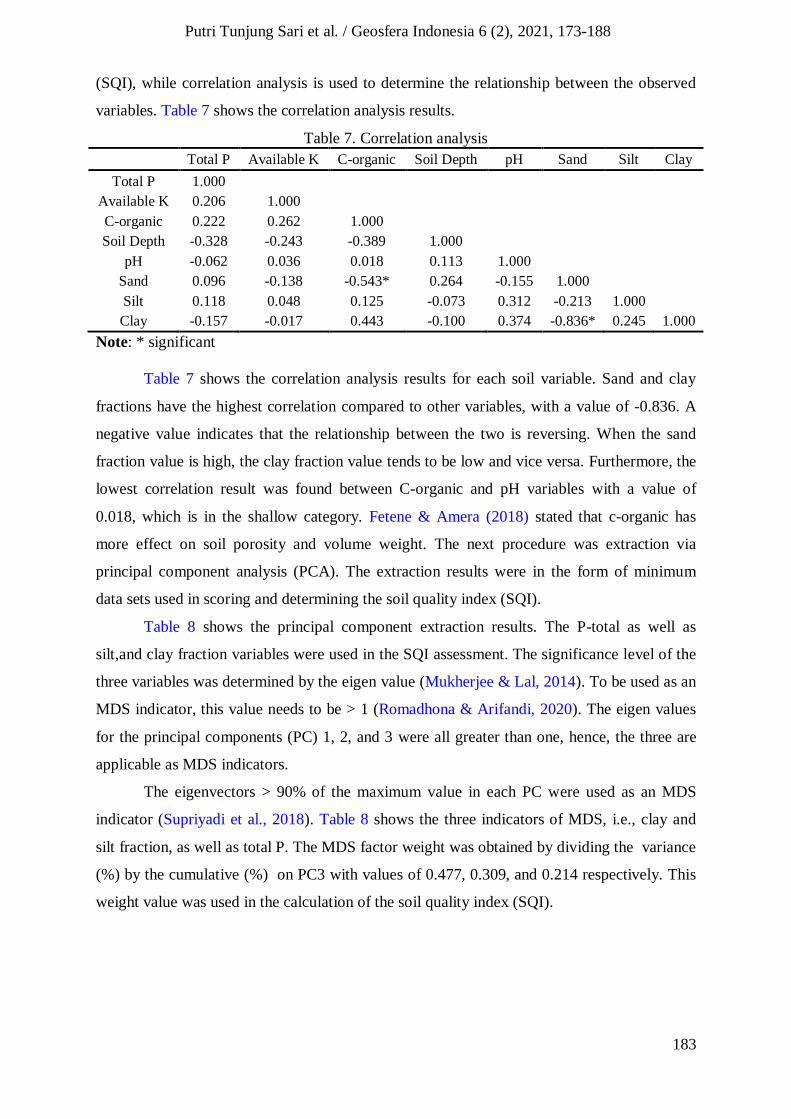
Table 8 shows the principal component extraction results. The P-total as well as
silt,and clay fraction variables were used in the SQI assessment. The significance level of the
three variables was determined by the eigen value (Mukherjee & Lal, 2014). To be used as an
MDS indicator, this value needs to be > 1 (Romadhona & Arifandi, 2020). The eigen values
for the principal components (PC) 1, 2, and 3 were all greater than one, hence, the three are
applicable as MDS indicators.
The eigenvectors > 90% of the maximum value in each PC were used as an MDS
indicator (Supriyadi et al., 2018). Table 8 shows the three indicators of MDS, i.e., clay and
silt fraction, as well as total P. The MDS factor weight was obtained by dividing the variance
(%) by the cumulative (%) on PC3 with values of 0.477, 0.309, and 0.214 respectively. This
weight value was used in the calculation of the soil quality index (SQI).
184
Putri Tunjung Sari et al. / Geosfera Indonesia 6 (2), 2021, 173-188
Table 8. PCA results
PCs PC1 PC2 PC3
Eigenvalue 2.58 1.68 1.16
% of Variance 32.28 20.96 14.45
Cumulative % 32.28 53.24 67.68
Eigenvectors
P_total 0.117 0.696* 0.406
K_available 0.294 0.493 0.178
C_organic 0.743 0.312 -0.200
Soil depth -0.445 -0.623 0.080
pH 0.341 -0.478 0.585
Sand -0.874 0.184 0.295
Silt 0.410 -0.150 0.677*
Clay 0.827* -0.423 -0.163
Note: * MDS variable
3.4 Assessment of Soil Quality Index (SQI)
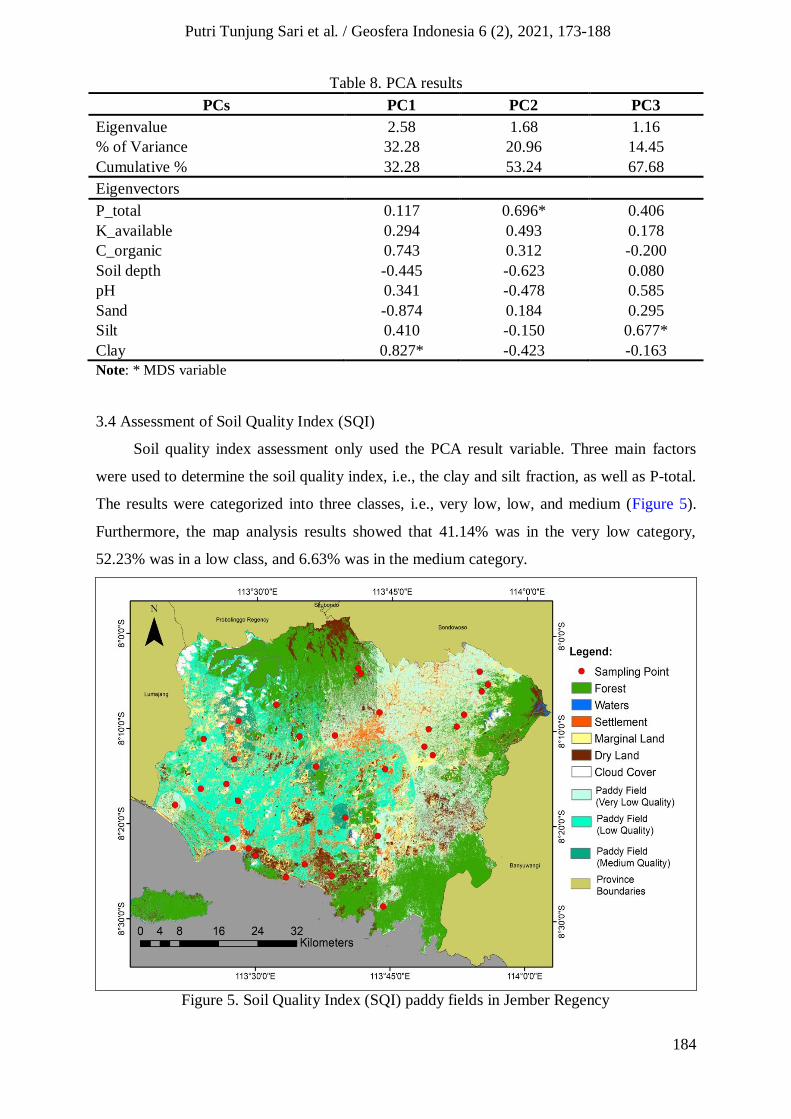
Soil quality index assessment only used the PCA result variable. Three main factors
were used to determine the soil quality index, i.e., the clay and silt fraction, as well as P-total.
The results were categorized into three classes, i.e., very low, low, and medium (Figure 5).
Furthermore, the map analysis results showed that 41.14% was in the very low category,
52.23% was in a low class, and 6.63% was in the medium category.
Figure 5. Soil Quality Index (SQI) paddy fields in Jember Regency

185
Putri Tunjung Sari et al. / Geosfera Indonesia 6 (2), 2021, 173-188
The low quality of paddy fields is due to intensive soil management and chemical
inputs. In addition, majority of farmers use only chemical fertilizers without any organic
supplement. Meanwhile, organic fertilizers are released slowly, and the results are not visible
(Maas et al., 2017). The application of chemical fertilizers has a direct effect on plants
(Asvini & Jithesh, 2018), therefore, most farmers do not use organic fertilizers.
This condition shows that there is a need to improve the quality of the paddy soil to
support sustainability. Soil quality improvement needs to focus on improving soil fertility
without damaging the environment. Meanwhile, soil fertility is a determining factor in plant
growth and development (Karamanoli et al., 2017). Organic fertilizers are applied to increase
nutrient availability and soil physical properties (Kidinda et al., 2015).
4. Conclusion
Based on the results, three variables were found to strongly influence soil quality
assessment namely total P, as well as clay and silt fraction. Approximately 93.37% of the
paddy field area was classed as very low-low quality due to the intensive use of chemical
fertilizers without organic supplements. The addition of ameliorants such as organic fertilizer
is needed to improve the soil's physical, chemical, and biological properties. This application
is to be focused on areas with very low – low soil quality to increase the quality to medium.
Conflict of Interest
The authors declare no conflict of interest.
References
Abdel Rahman, M. A. E., Zakarya, Y. M., Metwaly, M. M., & Koubouris, G. (2021).
Decisphering soil spatial variability through geostatistics and interpolation techniques.
Sustainability (Switzerland), 13(1), 1–13. https://doi.org/10.3390/su13010194.
Arunrat, N., Kongsurakan, P., Sereenonchai, S., & Hatano, R. (2020). Soil organic carbon in
sandy paddy fields of Northeast Thailand: A review. Agronomy, 10(8), 1–25.
https://doi.org/10.3390/agronomy10081061.
Asvini, B., & Jithesh. (2018). Impact of Using Artificial Fertilizer in Soil. International
Journal of Pure and Applied Mathematics, 119(17), 47–55.
Bahnemiri, A. K., Abkenar, K. T., Kooch, Y., & Salehi, A. (2019). Valuation of soil and litter
quality indices using analysis hierarchical process (AHP) in Hyrcanian beech forest
stands, Northern Iran (Case study: Korkoroud forests in Noshahr). Journal of Forest
Science, 65(10), 397–407. https://doi.org/10.17221/54/2019-JFS.

186
Putri Tunjung Sari et al. / Geosfera Indonesia 6 (2), 2021, 173-188
Balai Penelitian Tanah (2015). Soil Type Map. Retrieved from
https://balittanah.litbang.pertanian.go.id/ind/.
Banerjee, H., Ray, K., Dutta, S. K., Majumdar, K., Satyanarayana, T., & Timsina, J. (2018).
Optimizing Potassium Application for Hybrid Rice (Oryza sativa L.) in Coastal Saline
Soils of West Bengal, India. Agronomy, 8(12), 1–14.
https://doi.org/10.3390/agronomy8120292.
BIG (1999). Seamless Digital Elevation Model (DEM) dan Batimetri Nasional. Retrieved
from h http://tides.big.go.id/DEMNAS/.
Bofana, J. do R., & Costa, A. C. C. (2017). Comparison of spatial interpolators for variability
analysis of soil chemical properties in Cuamba (Mozambique). African Journal of
Agricultural Research, 12(25), 2153–2162. https://doi.org/10.5897/ajar2016.12415.
Eviati & Sulaeman. (2009). Petunjuk Teknis Analisis Kimia Tanah, Tanaman , Air dan
Pupuk. Jakarta : Balai Penelitian Tanah.
Fetene, E. M., & Amera, M. Y. (2018). The effects of land-use types and soil depth on soil
properties of Agedit watershed, Northwest Ethiopia. Ethiopian Journal of Science and
Technology, 11(1), 39. https://doi.org/10.4314/ejst.v11i1.4.
Hanafiah, K. . (2018). Basic of Soil Science. Depok : Raja Grafindo Persada.
Hore, R., Chakraborty, S., Bari, M. F., Shuvon, A. M., & Ansary, M. A. (2020). Soil
Zonation and The Shaking Table Test of The Embankment on Clayey Soil. Geosfera
Indonesia, 5(2), 196–209. https://doi.org/10.19184/geosi.v5i2.17873.
Hung, D. T., Hughes, H. J., Keck, M., & Sauer, D. (2019). Rice-residue management
practices of smallholder farms in Vietnam and their effects on nutrient fluxes in the soil-
plant system. Sustainability (Switzerland), 11(1641), 1–15.
https://doi.org/10.3390/su11061641.
Japan International Cooperation Agency (JICA) (2014). Soil Analysis Manual. Bandung :
NTC International Co., Ltd.
Johannes, H. P., Priadi, C. R., & Herdiansyah, H. (2019). Organic rice farming: An
alternative to sustainable agriculture. IOP Conference Series: Materials Science and
Engineering, 546(2). https://doi.org/10.1088/1757-899X/546/2/022008.
Karamanoli, K., Papaioannou, A., & Sofogianni, S. (2017). Soil fertility and productivity
estimation of Pinus pinaster Aiton reforestations in Central and Northeast Chalcidice in
Northern Greece. Journal of Forest Science, 63(10), 470–475.
https://doi.org/10.17221/68/2017-JFS.
Kidinda, L. K., Bandi, B. T. K.-, Mukalay, J. B., Kabemba, M. K., Ntata, C. N., Ntale, T. M.,
Tamina, D. T., & Kimuni, L. N. (2015). Impact of Chicken Manure Integration with
Mineral Fertilizer on Soil Nutriments Balance and Maize (Zea mays) Yield: A Case
Study on Degraded Soil of Lubumbashi (DR Congo). American Journal of Plant
Nutrition and Fertilization Technology, 5(3), 71–78.
https://doi.org/10.3923/ajpnft.2015.71.78.

187
Putri Tunjung Sari et al. / Geosfera Indonesia 6 (2), 2021, 173-188
Li, D., Nanseki, T., Chomei, Y., & Fukuhara, Y. (2018). Impact of soil chemical properties
on rice yield in 116 paddy fields sampled from a large-scale farm in Kinki Region,
Japan. IOP Conference Series: Earth and Environmental Science, 185(1).
https://doi.org/10.1088/1755-1315/185/1/012026.
Lin, H. C., & Fukushima, Y. (2016). Rice cultivation methods and their sustainability
aspects: Organic and conventional rice production in industrialized tropical monsoon
Asia with a dual cropping system. Sustainability (Switzerland), 8(529), 1–23.
https://doi.org/10.3390/su8060529.
Maas, E. D. V. L., Lal, R., Coleman, K., Montenegro, A., & Dick, W. A. (2017). Modeling
soil organic carbon in corn (Zea mays L.)-based systems in Ohio under climate change.
Journal of Soil and Water Conservation, 72(3), 191–204.
https://doi.org/10.2489/jswc.72.3.191.
Mohawesh, Y., Taimeh, A., & Ziadat, F. (2015). Effects of land-use changes and soil
conservation intervention on soil properties as indicators for land degradation under a
Mediterranean climate. Solid Earth, 6(3), 857–868. https://doi.org/10.5194/se-6-857-
2015.
Mukherjee, A., & Lal, R. (2014). Comparison of soil quality index using three methods.
PLoS ONE, 9(8), 1–16. https://doi.org/10.1371/journal.pone.0105981.
Nusantara, R. W., Aspan, A., Alhaddad, A. M., Suryadi, U. E., Makhrawie, Fitria, I.,
Fakhrudin, J., & Rezekikasari. (2018). Peat soil quality index and its determinants as
influenced by land use changes in kubu Raya district, West Kalimantan, Indonesia.
Biodiversitas, 19(2), 540–545. https://doi.org/10.13057/biodiv/d190229.
Panday, D., Ojha, R. B., Chalise, D., Das, S., Twanabasu, B., & Tejada Moral, M. (2019).
Spatial variability of soil properties under different land use in the Dang district of
Nepal. Cogent Food & Agriculture, 5(1), 1–19.
https://doi.org/10.1080/23311932.2019.1600460.
Pierzynski, G. M., Sims, J. T., & Vance, G. F. (2005). Soil and Environmental Quality.
Florida : CRC Press Taylor and Francis Group.
Reddy, R. S., Babu, G. A., & Reddy, A. R. M. (2020). Geospatial Approach for the Analysis
of Forest Cover Change Detection using Machine Learning. Geosfera Indonesia, 5(3),
335–351. https://doi.org/10.19184/geosi.v5i3.20157.
Ren, X., Chen, F., Ma, T., & Hu, Y. (2020). Soil quality characteristics as affected by
continuous rice cultivation and changes in cropping systems in South China. Agriculture
(Switzerland), 10(10), 1–11. https://doi.org/10.3390/agriculture10100443.
Romadhona, S., & Arifandi, J. A. (2020). Indeks Kualitas Tanah Dan Pemanfaatan Lahan
Sub Daerah Aliran Sungai Suco Kabupaten Jember. Geography: Jurnal Kajian,
Penelitian Dan Pengembangan Pendidikan, 8(1), 37–45.
Roy, R., Chan, N. W., & Xenarios, S. (2015). Sustainability of rice production systems: an
empirical evaluation to improve policy. Environment, Development, and Sustainability,
18(1), 257–278. https://doi.org/10.1007/s10668-015-9638-x.
188
Putri Tunjung Sari et al. / Geosfera Indonesia 6 (2), 2021, 173-188
Seifu, W., & Elias, E. (2018). Soil Quality Attributes and Their Role in Sustainable
Agriculture: A Review. International Journal of Plant & Soil Science, 26(3), 1–26.
https://doi.org/10.9734/ijpss/2018/41589.
Supriyadi, Mustikaningrum, I. A., Herawati, A., Purwanto, P., & Sumani, S. (2018). Soil
quality assessment in organic and non-organic paddy fields in Susukan, Indonesia.
Bulgarian Journal of Agricultural Science, 24(5), 777–784.
Supriyadi, S., Sih Dewi, W., Nugrahani, D., Rahmah, A. A., Haryuni, H., & Sumani, S.
(2019). The Assessment of Soil Quality Index for Paddy Fields with Indicator Biology
in Jatipurno Districts, Wonogiri. Modern Applied Science, 14(1), 20–33.
https://doi.org/10.5539/mas.v14n1p20.
Terano, R., Mohamed, Z., Shamsudin, M. N., & Latif, I. A. (2015). Farmers sustainability
index: The case of paddy farmers in state of Kelantan, Malaysia. Journal of the
International Society for Southeast Asian Agricultural Sciences, 21(1), 55–67.
USDA - Soil Survey Staff. (2014). Keys to soil taxonomy. Washington DC : USDA.
USGS (2019). Sentinel-2 Imagery. Retrived from
https://www.usgs.gov/centers/eros/science/usgs-eros-archive-sentinel-2.
Van Grinsven, H. J. M., Erisman, J. W., De Vries, W., & Westhoek, H. (2015). Potential of
extensification of European agriculture for a more sustainable food system, focusing on
nitrogen. Environmental Research Letters, 10(2). https://doi.org/10.1088/1748-
9326/10/2/025002.
Xie, H., Huang, Y., Chen, Q., Zhang, Y., & Wu, Q. (2019). Prospects for agricultural
sustainable intensification: A review of research. Land, 8(11), 1–27.
https://doi.org/10.3390/land8110157.
Yao, H., Chen, X., Yang, J., Li, J., Hong, J., Hu, Y., & Mao, X. (2020). Effects and
mechanisms of phosphate activation in paddy soil by phosphorus activators.
Sustainability (Switzerland), 12(9), 1–15. https://doi.org/10.3390/su12093917.
Copyright © 2022 FDOKUMEN