Geographical Classification of Turkish Virgin Olive Oils from the Aegean Region for Two Harvest...
11
ORIGINAL PAPER Geographical Classification of Turkish Virgin Olive Oils from the Aegean Region for Two Harvest Years Based on Their Fatty Acid Profiles Harun Dıraman • Hu ¨lya Saygı • Yas ¸ar Hıs ¸ ıl Received: 9 April 2011 / Accepted: 17 May 2011 / Published online: 7 June 2011 Ó AOCS 2011 Abstract In this study, the fatty acid compositions of Turkish virgin olive oils produced in the Aegean region, the major olive production zone of Turkey, were classified by chemometric methods: Principal Component Analysis (PCA) and Discriminant Analysis (DA). A total of 268 oil samples were examined over the course of two harvest years (2001–2002 and 2002–2003). The samples were divided into six groups according to the olive growing zones: Edremit Gulf (Ayvalik cultivar), Izmir province (Ayvalık, Memeli, Memecik and Gemlik), Aydın province (Memecik, Manzanilla and Gemlik), Mug ˘la (Memecik), Manisa (Gemlik, Domat, Uslu, Ayvalık), I ˙ zmir Peninsula (Erkence cultivar) and Firms (poly-cultivar or commercial blends). Consistent with discriminant analysis (DA), the predicted grouping in terms of the two harvest years were correctly separated as 74.5 and 74.8%, respectively. The highest levels of predicted grouping for the two harvest years were found in the Edremit Gulf (Ayvalık cultivar), Mug ˘la province (Memecik cultivar) and I ˙ zmir peninsula (Erkence cultivar) groups (as 90–100%). In addition to oleic, linoleic, linolenic, margaric, margoleic, total trans isomers of linoleic, oleic/linoleic and palmitic/linoleic were determined to be the best descriptive components for the oil samples. Keywords Virgin olive oils Á Fatty acids Á Geographical origin Á Principal component analysis Á Discriminant analysis Á Prediction model Introduction Virgin olive oil, obtained by physical methods from the fruits of olive trees (Olea europaea L.), has become a very important agricultural product for most of the countries of the Mediterranean basin. The consumption of virgin olive oil, the main oil source of the traditional Mediterranean diet, is of special interest to consumers due to its unique sensory properties and nutritional and health-promoting effects. The health advantages are due largely to its fatty acid composition, a particularly high level of monounsat- urated fatty acids (mainly oleic acid), and the naturally occurring antioxidants such as phenols, tocopherols and carotenoids [1]. One of today’s major problems in the agro-food indus- try, including the olive oil sector, is to identify objective tools to trace raw materials, like virgin olive oil from certain locations or cultivars, as well as finished products from the producer to the consumer. The authenticity and traceability of virgin olive oil are of great importance for the protection of the consumer. Determination of the compositional variability of virgin olive oils produced from certain location or cultivar is necessary for the proper classification of oils as well as for prevention of blending monocultivar oils. The chemical composition of virgin olive oils might differ due to geographical, agronomic and technological influences. Differences in composition due to Y. Hıs ¸ ıl paricipated equally with the work. H. Dıraman (&) Department of Olive Oil Technology, Research Institute for Olive Culture, 35100 Bornova, Izmir, Turkey e-mail: [email protected] H. Saygı Department of Econometri and Stastistics, Fisheries Faculty, Ege University, Bornova, Izmir, Turkey Y. Hıs ¸ ıl Department of Food Engineering, Faculty of Engineering, Ege University, Bornova, Izmir, Turkey 123 J Am Oil Chem Soc (2011) 88:1905–1915 DOI 10.1007/s11746-011-1862-4
-
Upload
independent -
Category
Documents
-
view
1 -
download
0
Transcript of Geographical Classification of Turkish Virgin Olive Oils from the Aegean Region for Two Harvest...
ORIGINAL PAPER
Geographical Classification of Turkish Virgin Olive Oilsfrom the Aegean Region for Two Harvest Years Basedon Their Fatty Acid Profiles
Harun Dıraman • Hulya Saygı • Yasar Hısıl
Received: 9 April 2011 / Accepted: 17 May 2011 / Published online: 7 June 2011
� AOCS 2011
Abstract In this study, the fatty acid compositions of
Turkish virgin olive oils produced in the Aegean region,
the major olive production zone of Turkey, were classified
by chemometric methods: Principal Component Analysis
(PCA) and Discriminant Analysis (DA). A total of 268 oil
samples were examined over the course of two harvest
years (2001–2002 and 2002–2003). The samples were
divided into six groups according to the olive growing
zones: Edremit Gulf (Ayvalik cultivar), Izmir province
(Ayvalık, Memeli, Memecik and Gemlik), Aydın province
(Memecik, Manzanilla and Gemlik), Mugla (Memecik),
Manisa (Gemlik, Domat, Uslu, Ayvalık), Izmir Peninsula
(Erkence cultivar) and Firms (poly-cultivar or commercial
blends). Consistent with discriminant analysis (DA), the
predicted grouping in terms of the two harvest years were
correctly separated as 74.5 and 74.8%, respectively. The
highest levels of predicted grouping for the two harvest
years were found in the Edremit Gulf (Ayvalık cultivar),
Mugla province (Memecik cultivar) and Izmir peninsula
(Erkence cultivar) groups (as 90–100%). In addition to
oleic, linoleic, linolenic, margaric, margoleic, total trans
isomers of linoleic, oleic/linoleic and palmitic/linoleic
were determined to be the best descriptive components for
the oil samples.
Keywords Virgin olive oils � Fatty acids � Geographical
origin � Principal component analysis � Discriminant
analysis � Prediction model
Introduction
Virgin olive oil, obtained by physical methods from the
fruits of olive trees (Olea europaea L.), has become a very
important agricultural product for most of the countries of
the Mediterranean basin. The consumption of virgin olive
oil, the main oil source of the traditional Mediterranean
diet, is of special interest to consumers due to its unique
sensory properties and nutritional and health-promoting
effects. The health advantages are due largely to its fatty
acid composition, a particularly high level of monounsat-
urated fatty acids (mainly oleic acid), and the naturally
occurring antioxidants such as phenols, tocopherols and
carotenoids [1].
One of today’s major problems in the agro-food indus-
try, including the olive oil sector, is to identify objective
tools to trace raw materials, like virgin olive oil from
certain locations or cultivars, as well as finished products
from the producer to the consumer. The authenticity and
traceability of virgin olive oil are of great importance for
the protection of the consumer. Determination of the
compositional variability of virgin olive oils produced from
certain location or cultivar is necessary for the proper
classification of oils as well as for prevention of blending
monocultivar oils. The chemical composition of virgin
olive oils might differ due to geographical, agronomic and
technological influences. Differences in composition due to
Y. Hısıl paricipated equally with the work.
H. Dıraman (&)
Department of Olive Oil Technology, Research Institute
for Olive Culture, 35100 Bornova, Izmir, Turkey
e-mail: [email protected]
H. SaygıDepartment of Econometri and Stastistics, Fisheries Faculty,
Ege University, Bornova, Izmir, Turkey
Y. HısılDepartment of Food Engineering, Faculty of Engineering,
Ege University, Bornova, Izmir, Turkey
123
J Am Oil Chem Soc (2011) 88:1905–1915
DOI 10.1007/s11746-011-1862-4
geographic origin provide the basis of legislation such as
protected denomination of origin (PDO) and protected
geographical indication (PGI). PDO and PGI certification
enables labeling of food products by growing area, and
provides extra economical benefits for producers of des-
ignated areas. In Europe, two regulations introduced the
Protected Designation of Origin (PDO) of traditional
products. The first one protects traditional products
(Council Regulation, EEC-N.2081/92) about designations
of origin and geographical indication, the second one
(Council Regulation, EEC-N.2082/92) defines product
types, olive oil included. In fact, virgin olive oils are pro-
duced from one certain genetic variety of olive (mono-
cultivar) or a mixture of several cultivars (coupage or
blend). Monocultivar olive oils have certain specific char-
acteristics related to the olive cultivar from which they are
elaborated. Coupage or blend olive oils are obtained from
several olive cultivars to achieve a special flavor or aroma
[2]. There are many well known cultivars used for olive oil
in Turkey, many of which are region specific. Economi-
cally important Turkish olive cultivars and their corre-
sponding production percentages are Memecik at 45%,
Ayvalık at 20%, Domat at 1.4%, Gemlik at 11%, Nizip
Yaglık at 2%, Kilis Yaglık at 2.8% and Uslu at 1% [3]. The
production of monocultivar virgin olive oils originated
from certain geographic zones has also been recently
increased in the Turkish olive oil sector because they have
a higher market price and reliable quality. The PDO of
three zones (Edremit Gulf Olive Oils, Ayvalik Olive Oils
and South Aegean Olive Oils) have been certified by the
Turkish Patent Institute to authenticate oils produced from
two economically important domestic cultivars (Ayvalik
and Memecik) of the main olive growing regions of Turkey
[4].
Major and/or minor components such as triacylglyce-
rols, fatty acids and sterols in combination with chemo-
metrics have been employed for classification and
characterization of virgin olive oils based on cultivar,
geographical origin and harvest year. Among the compo-
nents of olive oil, fatty acid profiles are extremely useful
for characterization and discrimination of an olive cultivar
or its geographical location [2, 5]. There are several studies
on geographical characterization of virgin olive oils from
Turkish [6–10] and North countries of Mediterranean basin
[11–24] based on fatty acid profiles.
In recent years, multivariate statistical methods, such as
principal component analysis (PCA), hierarchical cluster
analysis (HCA), discriminant analysis (DA) and classifi-
cation analysis (CA), have been used extensively to clas-
sify and characterize virgin olive oils based on their
geographical origins. The PCA method, one of the simplest
and most used methods, is based on variable reduction by
linear combination of initial variables that define principal
components (PC). It is possible to reduce the set of vari-
ables without losing the essential initial information [2, 5,
18, 25]. The data produced by instrumental chromato-
graphic techniques, gas chromatography (GC) and high
pressure liquid chromatography (HPLC), for the charac-
terization of virgin olive oil from different locations or
cultivars are evaluated with these sophisticated methods
(PCA, HCA, CA and DA). Multivariate statistical (PCA,
DA or CA) evaluation of data is not a solution, but is a very
promising approach for the evaluation of analytical data as
to the geographical origin of a virgin olive oil sample.
However, some studies have attempted to verify and
classify the origins of certain virgin olive oils from major
olive oil-producing countries (Italy, Spain, France, Greece,
and nowadays Turkey), using their fatty acid profiles aided
by multivariate statistical methods, such as principal
component analysis (PCA), hierarchical cluster analysis
(HCA) and discriminant analysis (DA) [5, 6, 9–22, 24].
Although Turkey is the world’s fifth largest producer of
olive oil (5%) and contributes 11.3% of the world’s exports
[3], there is a lack of data elucidating the characterization
and classification of olive oil produced and marketed in
Turkey.
This study addresses the need to evaluate by chemo-
metric methods, PCA and DA, the classification and dis-
crimination of virgin olive oils originating from the Aegean
region, Turkey’s major olive oil production zone, based on
fatty acid profile, a reliable indicator for discrimination and
classification of oils of PDO.
Materials and Methods
Locations and Experimental Material
The virgin olive oil samples were collected from plants
utilizing a number of different processing systems: classi-
cal systems (hydraulic presses—known as the wet system
and super presses—the dry system) and continuous systems
(three phase, dual phase and Sinolea) in Izmir province
between November and February of two consecutive
harvest years (2001–2002 denoted by 1 and 2002–2003
denoted by 2). These samples were divided into six sub-
groups based on the important olive cultivation districts of
Aegean region of Turkey:
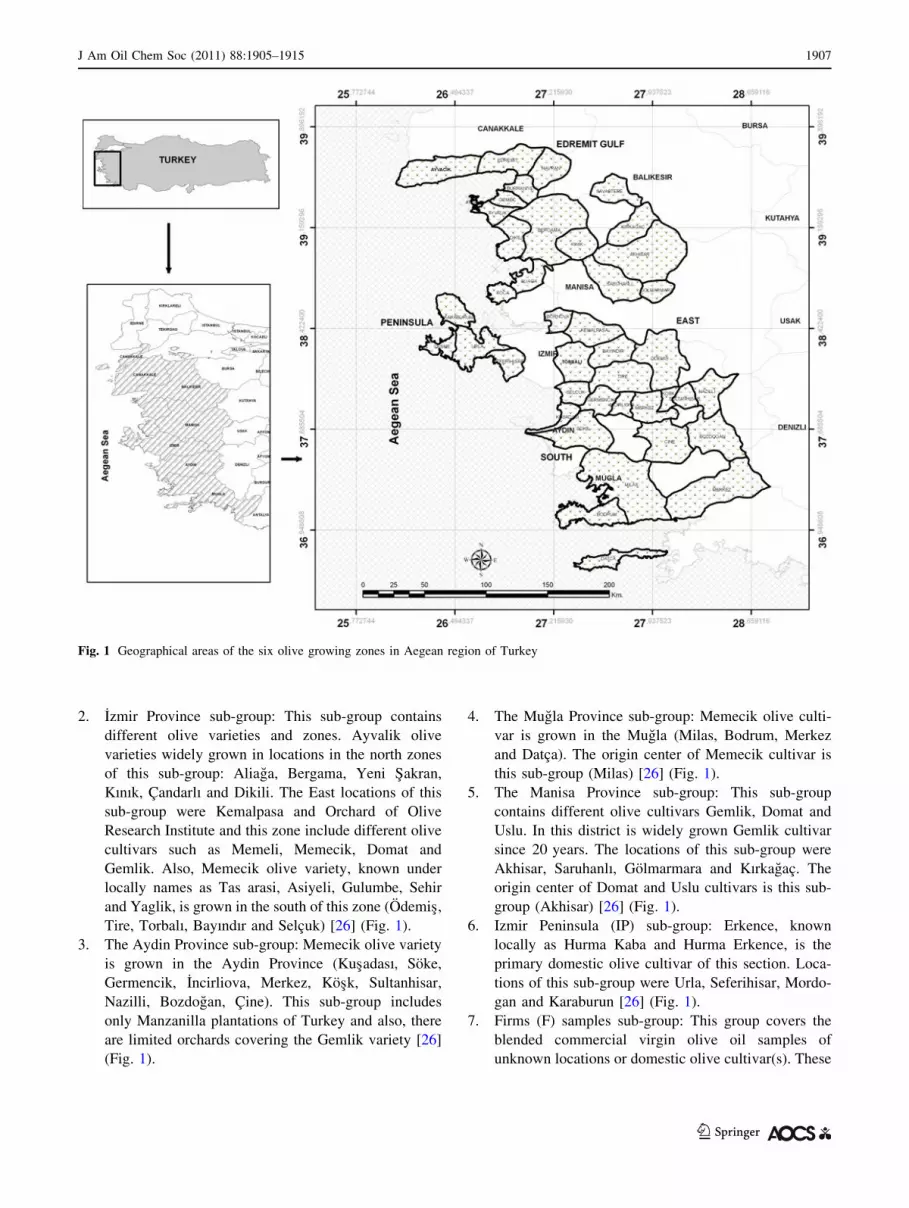
1. The Edremit Gulf (EG) sub-group: This sub-group
contains Ayvalik olive varieties widely grown in
locations around Ederemit Gulf at Balikesir province:
Ayvalık, Gomec, Burhaniye, Havran and Edremit, and
also the Ayvacık district of Canakkale province
(Fig. 1). This cultivar is locally known as Edremit,
Edremit Yaglık, Sakran, Midilli and Ada Zeytini [26]
1906 J Am Oil Chem Soc (2011) 88:1905–1915
123
2. Izmir Province sub-group: This sub-group contains
different olive varieties and zones. Ayvalik olive
varieties widely grown in locations in the north zones
of this sub-group: Aliaga, Bergama, Yeni Sakran,
Kınık, Candarlı and Dikili. The East locations of this
sub-group were Kemalpasa and Orchard of Olive
Research Institute and this zone include different olive
cultivars such as Memeli, Memecik, Domat and
Gemlik. Also, Memecik olive variety, known under
locally names as Tas arasi, Asiyeli, Gulumbe, Sehir
and Yaglik, is grown in the south of this zone (Odemis,
Tire, Torbalı, Bayındır and Selcuk) [26] (Fig. 1).
3. The Aydin Province sub-group: Memecik olive variety
is grown in the Aydin Province (Kusadası, Soke,
Germencik, Incirliova, Merkez, Kosk, Sultanhisar,
Nazilli, Bozdogan, Cine). This sub-group includes
only Manzanilla plantations of Turkey and also, there
are limited orchards covering the Gemlik variety [26]
(Fig. 1).
4. The Mugla Province sub-group: Memecik olive culti-
var is grown in the Mugla (Milas, Bodrum, Merkez
and Datca). The origin center of Memecik cultivar is
this sub-group (Milas) [26] (Fig. 1).
5. The Manisa Province sub-group: This sub-group
contains different olive cultivars Gemlik, Domat and
Uslu. In this district is widely grown Gemlik cultivar
since 20 years. The locations of this sub-group were
Akhisar, Saruhanlı, Golmarmara and Kırkagac. The
origin center of Domat and Uslu cultivars is this sub-
group (Akhisar) [26] (Fig. 1).
6. Izmir Peninsula (IP) sub-group: Erkence, known
locally as Hurma Kaba and Hurma Erkence, is the
primary domestic olive cultivar of this section. Loca-
tions of this sub-group were Urla, Seferihisar, Mordo-
gan and Karaburun [26] (Fig. 1).
7. Firms (F) samples sub-group: This group covers the
blended commercial virgin olive oil samples of
unknown locations or domestic olive cultivar(s). These
Fig. 1 Geographical areas of the six olive growing zones in Aegean region of Turkey
J Am Oil Chem Soc (2011) 88:1905–1915 1907
123
poly-cultivar oils were packaged and labelled by
various firms in Izmir.
A map of olive growing zones in Aegean region of
Turkey is given in Fig. 1.
A total of 268 virgin olive oil samples were collected
from five sub-groups in Izmir province during two harvest
years. One hundred and five (105) of these samples were
from the 2001–2002 harvest years and one hundred and
sixty-three (163) oil samples were collected from
2002–2003 harvest years.
The fatty acid profiles were determined using a capillary
gas chromatographic method described by the European
Union Commission [27]. Fatty acid methyl esters (FAMEs)
were prepared by treatment with sodium methylate
according to a cold methylation method (35). A gas chro-
matograph (HP 6890) using a capillary column DB-23
(30 m 9 0.25 mm ID and 0.25 lm film thickness 50%
cyanopropyl, J & W Scientific, Folsom, CA, USA) was
employed. The oven temperature was programmed from
170 to 210 �C at 2 �C/min and then held at 210 �C for
10 min. The carrier gas was helium (0.5 ml/min) and the
injector and detector (FID) temperatures were 250 �C. The
split ratio was 1:100 and the injected volume was 0.2 ll.
Each sample was injected in triplicate (n = 3). Fatty acid
standards had linear calibration curves through the origin
(R2 = 0.99). The GC method was validated for fatty acid
determination of oil samples within 95% confidence limits.
A standard FAME mixture was used as a standard (Sigma-
Aldrich Chemicals 189-19). All fatty acid peak areas were
calculated by HP 3365 Chemstation program and recorded
as peak area percentages [27].
Principal Component Analysis (PCA), a common tech-
nique for finding patterns in data of high dimensions, and
Linear Discriminant Analysis (LDA) with cross-validation
(CV), were performed. Statistical package SPSS version
15.0 was used (SPSS 2001) for multivariate analysis [28].
Results and Discussion
The virgin olive oil samples were characterized according to
their fatty acid profiles and 19 individual parameters: pal-
mitic (p) C16:0; palmitoleic (po) C 16:1n7; margaric (m) C
17:0; margaroleic (mo) C 17:1n8; stearic (s) C 18:0; oleic
(o) C 18:1n9; Linoleic (l) C18:2n6; Linolenic (ln) C18:3 n3;
Arachidic (a) C 20:0; gadoleic (g) C 20:1n9; behenic (b) C
22:0; lignoseric (lg) C 24:0; elaidic (ea) C 18:1 t; trans lin-
oleic (C 18:2 t) ? trans linolenic (C 18:3 t) (tlln) and Total
Trans FA (tfa); Oleic/Linoleic (ol); Palmitic/Linoleic (pl);
Linoleic/Linolenic (lln); Squalene (Sq). The statistical
parameters of fatty acid profiles for two harvest years
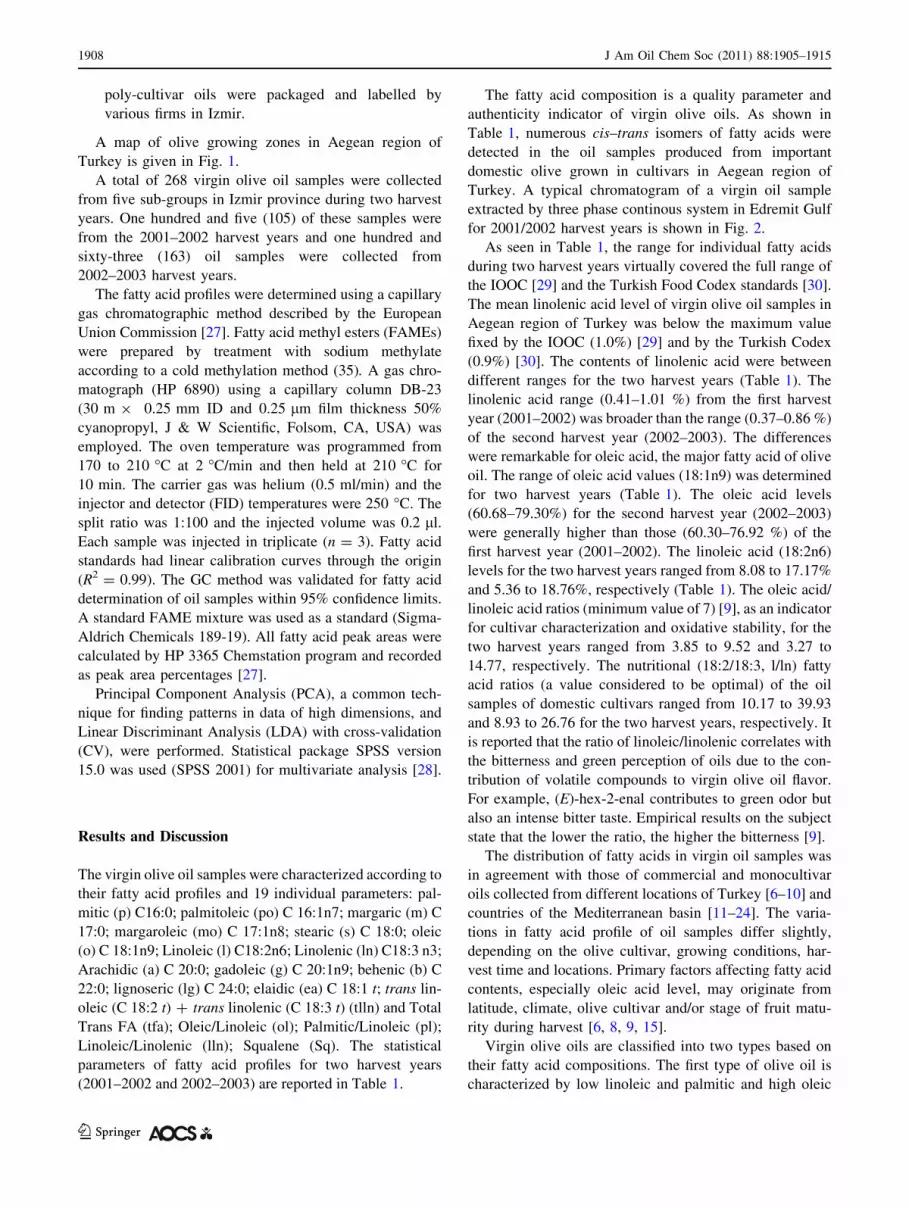
(2001–2002 and 2002–2003) are reported in Table 1.
The fatty acid composition is a quality parameter and
authenticity indicator of virgin olive oils. As shown in
Table 1, numerous cis–trans isomers of fatty acids were
detected in the oil samples produced from important
domestic olive grown in cultivars in Aegean region of
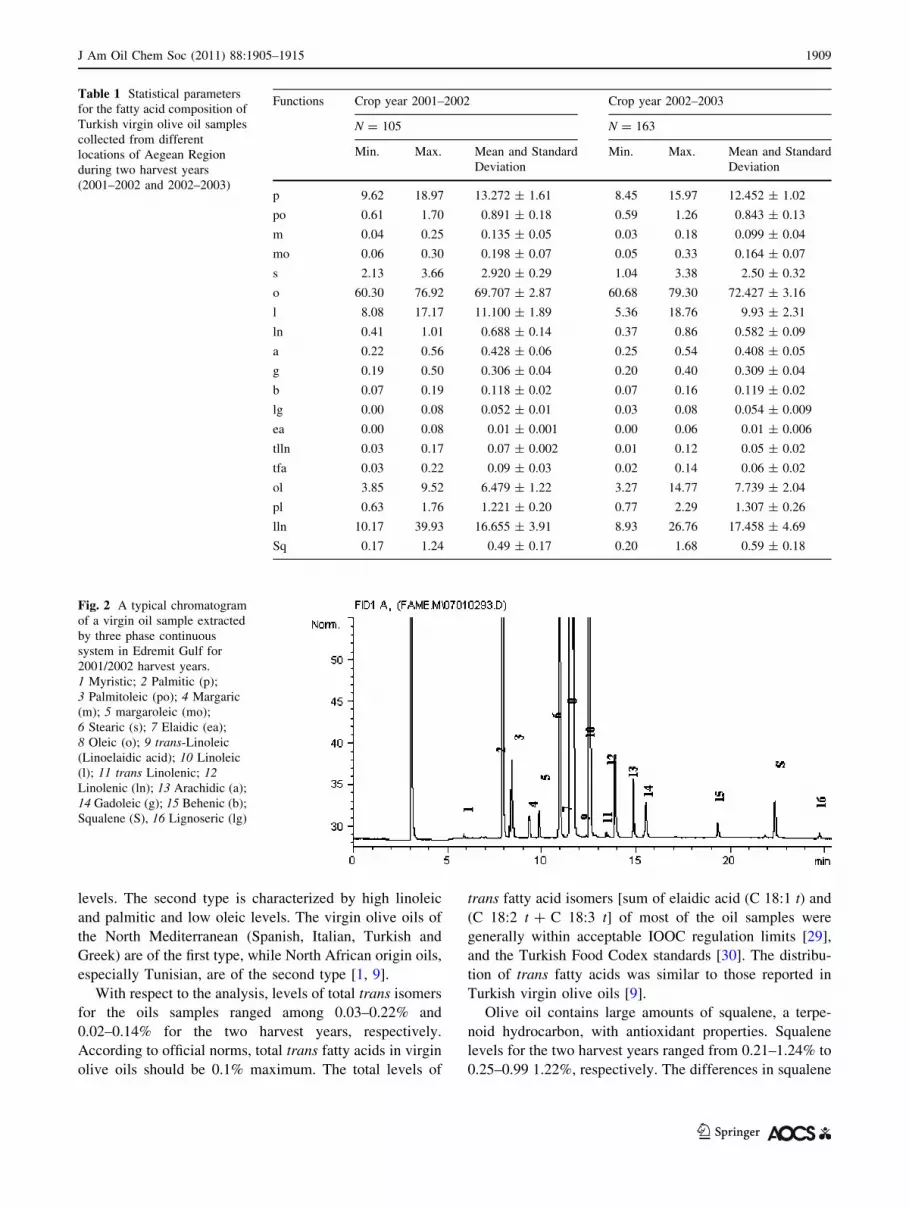
Turkey. A typical chromatogram of a virgin oil sample
extracted by three phase continous system in Edremit Gulf
for 2001/2002 harvest years is shown in Fig. 2.
As seen in Table 1, the range for individual fatty acids
during two harvest years virtually covered the full range of
the IOOC [29] and the Turkish Food Codex standards [30].
The mean linolenic acid level of virgin olive oil samples in
Aegean region of Turkey was below the maximum value
fixed by the IOOC (1.0%) [29] and by the Turkish Codex
(0.9%) [30]. The contents of linolenic acid were between
different ranges for the two harvest years (Table 1). The
linolenic acid range (0.41–1.01 %) from the first harvest
year (2001–2002) was broader than the range (0.37–0.86 %)
of the second harvest year (2002–2003). The differences
were remarkable for oleic acid, the major fatty acid of olive
oil. The range of oleic acid values (18:1n9) was determined
for two harvest years (Table 1). The oleic acid levels
(60.68–79.30%) for the second harvest year (2002–2003)
were generally higher than those (60.30–76.92 %) of the
first harvest year (2001–2002). The linoleic acid (18:2n6)
levels for the two harvest years ranged from 8.08 to 17.17%
and 5.36 to 18.76%, respectively (Table 1). The oleic acid/
linoleic acid ratios (minimum value of 7) [9], as an indicator
for cultivar characterization and oxidative stability, for the
two harvest years ranged from 3.85 to 9.52 and 3.27 to
14.77, respectively. The nutritional (18:2/18:3, l/ln) fatty
acid ratios (a value considered to be optimal) of the oil
samples of domestic cultivars ranged from 10.17 to 39.93
and 8.93 to 26.76 for the two harvest years, respectively. It
is reported that the ratio of linoleic/linolenic correlates with
the bitterness and green perception of oils due to the con-
tribution of volatile compounds to virgin olive oil flavor.
For example, (E)-hex-2-enal contributes to green odor but
also an intense bitter taste. Empirical results on the subject
state that the lower the ratio, the higher the bitterness [9].
The distribution of fatty acids in virgin oil samples was
in agreement with those of commercial and monocultivar
oils collected from different locations of Turkey [6–10] and
countries of the Mediterranean basin [11–24]. The varia-
tions in fatty acid profile of oil samples differ slightly,
depending on the olive cultivar, growing conditions, har-
vest time and locations. Primary factors affecting fatty acid
contents, especially oleic acid level, may originate from
latitude, climate, olive cultivar and/or stage of fruit matu-
rity during harvest [6, 8, 9, 15].
Virgin olive oils are classified into two types based on
their fatty acid compositions. The first type of olive oil is
characterized by low linoleic and palmitic and high oleic
1908 J Am Oil Chem Soc (2011) 88:1905–1915
123
levels. The second type is characterized by high linoleic
and palmitic and low oleic levels. The virgin olive oils of
the North Mediterranean (Spanish, Italian, Turkish and
Greek) are of the first type, while North African origin oils,
especially Tunisian, are of the second type [1, 9].
With respect to the analysis, levels of total trans isomers
for the oils samples ranged among 0.03–0.22% and
0.02–0.14% for the two harvest years, respectively.
According to official norms, total trans fatty acids in virgin
olive oils should be 0.1% maximum. The total levels of
trans fatty acid isomers [sum of elaidic acid (C 18:1 t) and
(C 18:2 t ? C 18:3 t] of most of the oil samples were
generally within acceptable IOOC regulation limits [29],
and the Turkish Food Codex standards [30]. The distribu-
tion of trans fatty acids was similar to those reported in
Turkish virgin olive oils [9].
Olive oil contains large amounts of squalene, a terpe-
noid hydrocarbon, with antioxidant properties. Squalene
levels for the two harvest years ranged from 0.21–1.24% to
0.25–0.99 1.22%, respectively. The differences in squalene
Table 1 Statistical parameters
for the fatty acid composition of
Turkish virgin olive oil samples
collected from different
locations of Aegean Region
during two harvest years
(2001–2002 and 2002–2003)
Functions Crop year 2001–2002 Crop year 2002–2003
N = 105 N = 163
Min. Max. Mean and Standard
Deviation
Min. Max. Mean and Standard
Deviation
p 9.62 18.97 13.272 ± 1.61 8.45 15.97 12.452 ± 1.02
po 0.61 1.70 0.891 ± 0.18 0.59 1.26 0.843 ± 0.13
m 0.04 0.25 0.135 ± 0.05 0.03 0.18 0.099 ± 0.04
mo 0.06 0.30 0.198 ± 0.07 0.05 0.33 0.164 ± 0.07
s 2.13 3.66 2.920 ± 0.29 1.04 3.38 2.50 ± 0.32
o 60.30 76.92 69.707 ± 2.87 60.68 79.30 72.427 ± 3.16
l 8.08 17.17 11.100 ± 1.89 5.36 18.76 9.93 ± 2.31
ln 0.41 1.01 0.688 ± 0.14 0.37 0.86 0.582 ± 0.09
a 0.22 0.56 0.428 ± 0.06 0.25 0.54 0.408 ± 0.05
g 0.19 0.50 0.306 ± 0.04 0.20 0.40 0.309 ± 0.04
b 0.07 0.19 0.118 ± 0.02 0.07 0.16 0.119 ± 0.02
lg 0.00 0.08 0.052 ± 0.01 0.03 0.08 0.054 ± 0.009
ea 0.00 0.08 0.01 ± 0.001 0.00 0.06 0.01 ± 0.006
tlln 0.03 0.17 0.07 ± 0.002 0.01 0.12 0.05 ± 0.02
tfa 0.03 0.22 0.09 ± 0.03 0.02 0.14 0.06 ± 0.02
ol 3.85 9.52 6.479 ± 1.22 3.27 14.77 7.739 ± 2.04
pl 0.63 1.76 1.221 ± 0.20 0.77 2.29 1.307 ± 0.26
lln 10.17 39.93 16.655 ± 3.91 8.93 26.76 17.458 ± 4.69
Sq 0.17 1.24 0.49 ± 0.17 0.20 1.68 0.59 ± 0.18
Fig. 2 A typical chromatogram
of a virgin oil sample extracted
by three phase continuous
system in Edremit Gulf for
2001/2002 harvest years.
1 Myristic; 2 Palmitic (p);
3 Palmitoleic (po); 4 Margaric
(m); 5 margaroleic (mo);
6 Stearic (s); 7 Elaidic (ea);
8 Oleic (o); 9 trans-Linoleic
(Linoelaidic acid); 10 Linoleic
(l); 11 trans Linolenic; 12Linolenic (ln); 13 Arachidic (a);
14 Gadoleic (g); 15 Behenic (b);
Squalene (S), 16 Lignoseric (lg)
J Am Oil Chem Soc (2011) 88:1905–1915 1909
123
levels between olive oils may depend on the specific cul-
tivar and the altitude at which the trees are grown [1].
These findings are generally in accordance with Turkish [9]
and French [19] olive oils.
To select the best model with the minimum number of
dimensions explaining the data structure, PCA was applied
(using 19 fatty acids components) to the grouped oil
samples (total of 268) according to their geographical
locations. The exclusion rule employed was based on the
amount of residual variability to tolerate [31], retaining a
sufficient number of PC’s capable of explaining a per-
centage of variance [80% or when the contribution of the
(p ? 1) th component to variance explained was very small
(\5%). Using this rule, the first two PC is sufficient
because they described 86.74 and 89.73% of the sample
variability (Table 2). This is in accordance with criteria of
Jollife [32, 33] which suggests rejecting those PC having
eigenvalues \0.7.
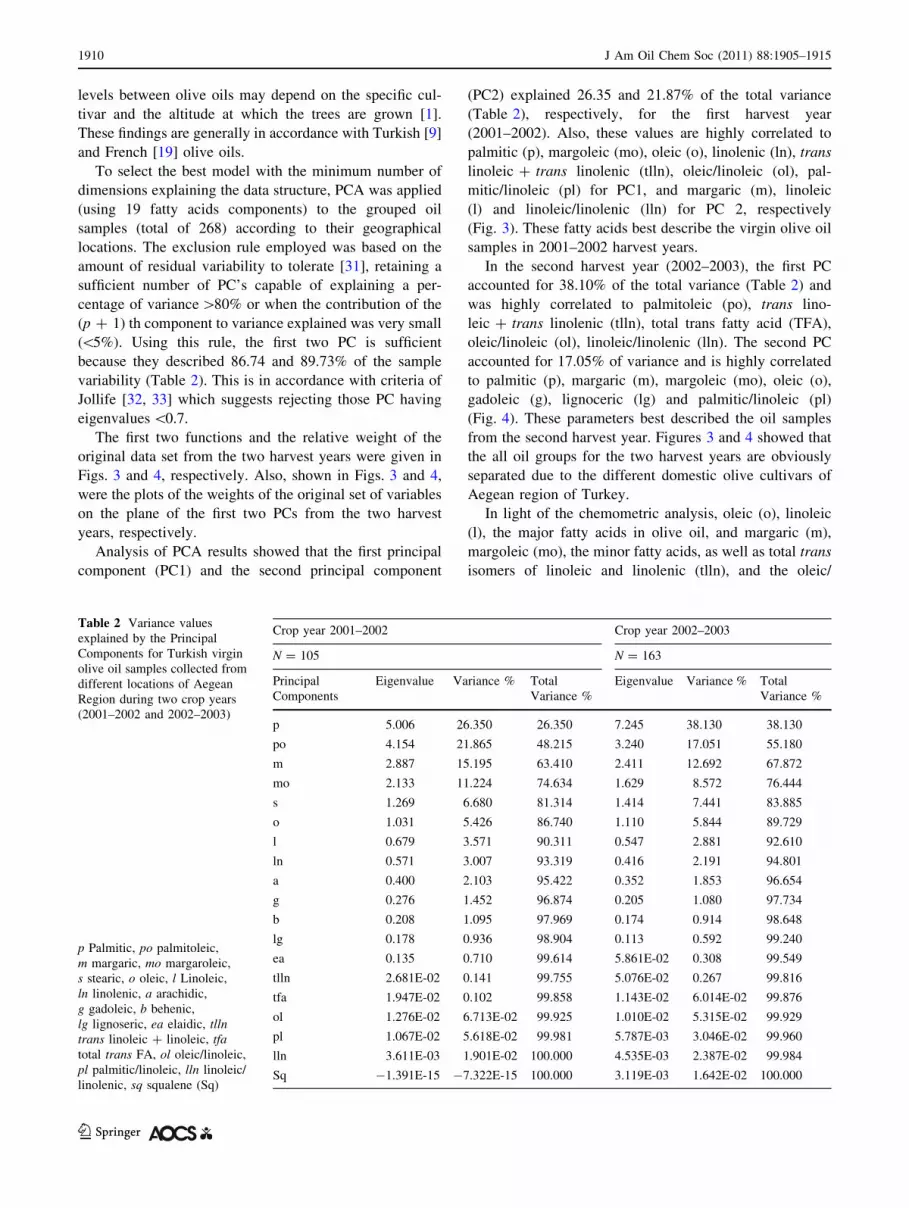
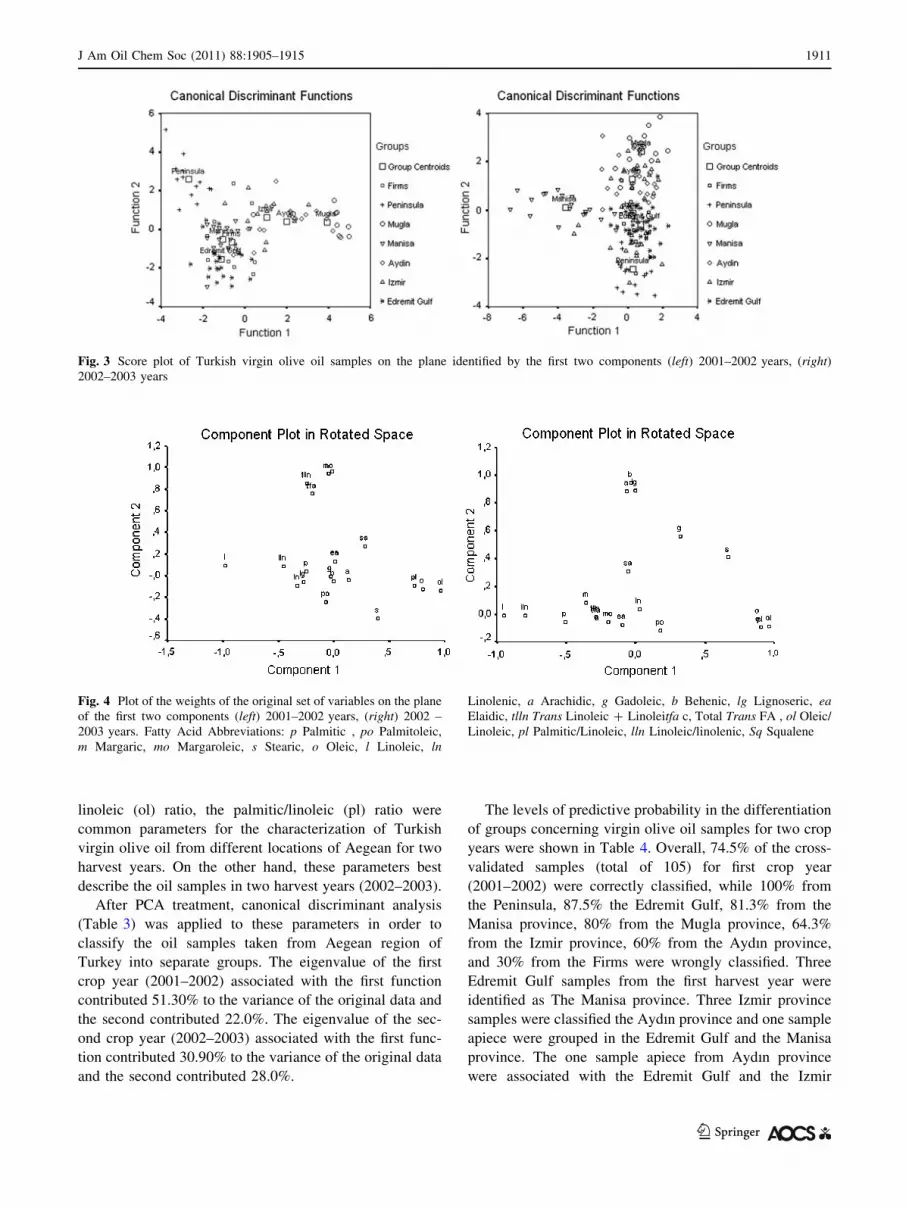
The first two functions and the relative weight of the
original data set from the two harvest years were given in
Figs. 3 and 4, respectively. Also, shown in Figs. 3 and 4,
were the plots of the weights of the original set of variables
on the plane of the first two PCs from the two harvest
years, respectively.
Analysis of PCA results showed that the first principal
component (PC1) and the second principal component
(PC2) explained 26.35 and 21.87% of the total variance
(Table 2), respectively, for the first harvest year
(2001–2002). Also, these values are highly correlated to
palmitic (p), margoleic (mo), oleic (o), linolenic (ln), trans
linoleic ? trans linolenic (tlln), oleic/linoleic (ol), pal-
mitic/linoleic (pl) for PC1, and margaric (m), linoleic
(l) and linoleic/linolenic (lln) for PC 2, respectively
(Fig. 3). These fatty acids best describe the virgin olive oil
samples in 2001–2002 harvest years.
In the second harvest year (2002–2003), the first PC
accounted for 38.10% of the total variance (Table 2) and
was highly correlated to palmitoleic (po), trans lino-
leic ? trans linolenic (tlln), total trans fatty acid (TFA),
oleic/linoleic (ol), linoleic/linolenic (lln). The second PC
accounted for 17.05% of variance and is highly correlated
to palmitic (p), margaric (m), margoleic (mo), oleic (o),
gadoleic (g), lignoceric (lg) and palmitic/linoleic (pl)
(Fig. 4). These parameters best described the oil samples
from the second harvest year. Figures 3 and 4 showed that
the all oil groups for the two harvest years are obviously
separated due to the different domestic olive cultivars of
Aegean region of Turkey.
In light of the chemometric analysis, oleic (o), linoleic
(l), the major fatty acids in olive oil, and margaric (m),
margoleic (mo), the minor fatty acids, as well as total trans
isomers of linoleic and linolenic (tlln), and the oleic/
Table 2 Variance values
explained by the Principal
Components for Turkish virgin
olive oil samples collected from
different locations of Aegean
Region during two crop years
(2001–2002 and 2002–2003)
p Palmitic, po palmitoleic,
m margaric, mo margaroleic,
s stearic, o oleic, l Linoleic,
ln linolenic, a arachidic,
g gadoleic, b behenic,
lg lignoseric, ea elaidic, tllntrans linoleic ? linoleic, tfatotal trans FA, ol oleic/linoleic,
pl palmitic/linoleic, lln linoleic/
linolenic, sq squalene (Sq)
Crop year 2001–2002 Crop year 2002–2003
N = 105 N = 163
Principal
Components
Eigenvalue Variance % Total
Variance %
Eigenvalue Variance % Total
Variance %
p 5.006 26.350 26.350 7.245 38.130 38.130
po 4.154 21.865 48.215 3.240 17.051 55.180
m 2.887 15.195 63.410 2.411 12.692 67.872
mo 2.133 11.224 74.634 1.629 8.572 76.444
s 1.269 6.680 81.314 1.414 7.441 83.885
o 1.031 5.426 86.740 1.110 5.844 89.729
l 0.679 3.571 90.311 0.547 2.881 92.610
ln 0.571 3.007 93.319 0.416 2.191 94.801
a 0.400 2.103 95.422 0.352 1.853 96.654
g 0.276 1.452 96.874 0.205 1.080 97.734
b 0.208 1.095 97.969 0.174 0.914 98.648
lg 0.178 0.936 98.904 0.113 0.592 99.240
ea 0.135 0.710 99.614 5.861E-02 0.308 99.549
tlln 2.681E-02 0.141 99.755 5.076E-02 0.267 99.816
tfa 1.947E-02 0.102 99.858 1.143E-02 6.014E-02 99.876
ol 1.276E-02 6.713E-02 99.925 1.010E-02 5.315E-02 99.929
pl 1.067E-02 5.618E-02 99.981 5.787E-03 3.046E-02 99.960
lln 3.611E-03 1.901E-02 100.000 4.535E-03 2.387E-02 99.984
Sq -1.391E-15 -7.322E-15 100.000 3.119E-03 1.642E-02 100.000
1910 J Am Oil Chem Soc (2011) 88:1905–1915
123
linoleic (ol) ratio, the palmitic/linoleic (pl) ratio were
common parameters for the characterization of Turkish
virgin olive oil from different locations of Aegean for two
harvest years. On the other hand, these parameters best
describe the oil samples in two harvest years (2002–2003).
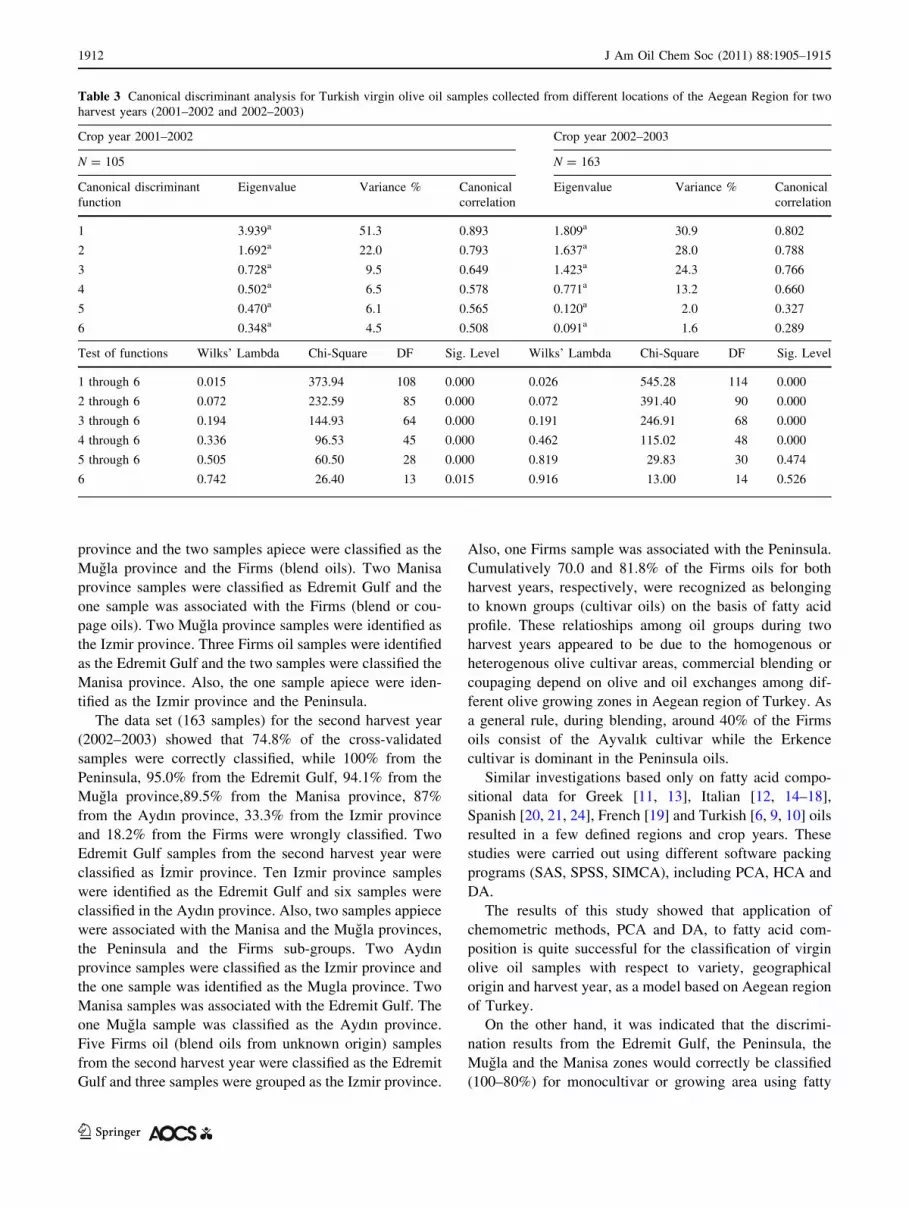
After PCA treatment, canonical discriminant analysis
(Table 3) was applied to these parameters in order to
classify the oil samples taken from Aegean region of
Turkey into separate groups. The eigenvalue of the first
crop year (2001–2002) associated with the first function
contributed 51.30% to the variance of the original data and
the second contributed 22.0%. The eigenvalue of the sec-
ond crop year (2002–2003) associated with the first func-
tion contributed 30.90% to the variance of the original data
and the second contributed 28.0%.
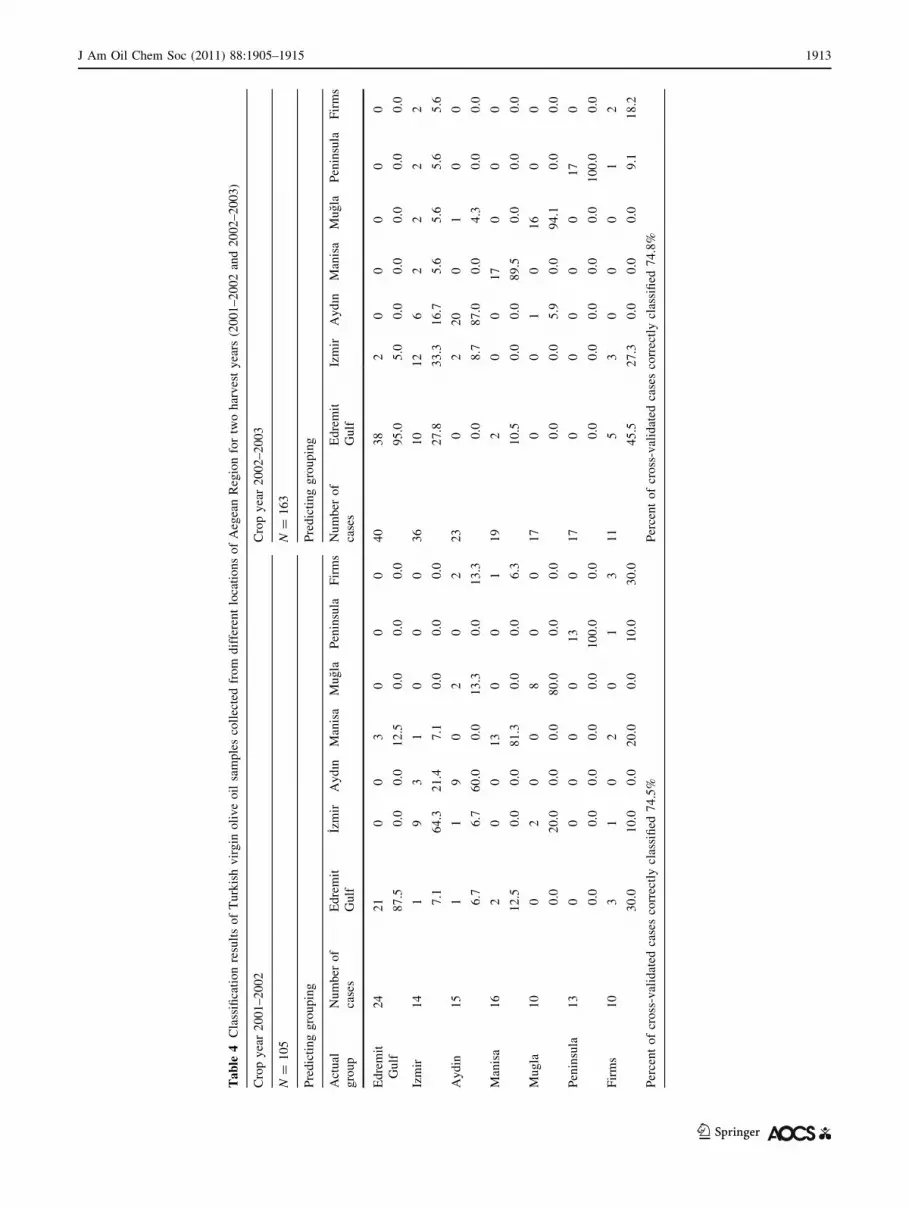
The levels of predictive probability in the differentiation
of groups concerning virgin olive oil samples for two crop
years were shown in Table 4. Overall, 74.5% of the cross-
validated samples (total of 105) for first crop year
(2001–2002) were correctly classified, while 100% from
the Peninsula, 87.5% the Edremit Gulf, 81.3% from the
Manisa province, 80% from the Mugla province, 64.3%
from the Izmir province, 60% from the Aydın province,
and 30% from the Firms were wrongly classified. Three
Edremit Gulf samples from the first harvest year were
identified as The Manisa province. Three Izmir province
samples were classified the Aydın province and one sample
apiece were grouped in the Edremit Gulf and the Manisa
province. The one sample apiece from Aydın province
were associated with the Edremit Gulf and the Izmir
Fig. 3 Score plot of Turkish virgin olive oil samples on the plane identified by the first two components (left) 2001–2002 years, (right)2002–2003 years
Fig. 4 Plot of the weights of the original set of variables on the plane
of the first two components (left) 2001–2002 years, (right) 2002 –
2003 years. Fatty Acid Abbreviations: p Palmitic , po Palmitoleic,
m Margaric, mo Margaroleic, s Stearic, o Oleic, l Linoleic, ln
Linolenic, a Arachidic, g Gadoleic, b Behenic, lg Lignoseric, eaElaidic, tlln Trans Linoleic ? Linoleitfa c, Total Trans FA , ol Oleic/
Linoleic, pl Palmitic/Linoleic, lln Linoleic/linolenic, Sq Squalene
J Am Oil Chem Soc (2011) 88:1905–1915 1911
123
province and the two samples apiece were classified as the
Mugla province and the Firms (blend oils). Two Manisa
province samples were classified as Edremit Gulf and the
one sample was associated with the Firms (blend or cou-
page oils). Two Mugla province samples were identified as
the Izmir province. Three Firms oil samples were identified
as the Edremit Gulf and the two samples were classified the
Manisa province. Also, the one sample apiece were iden-
tified as the Izmir province and the Peninsula.
The data set (163 samples) for the second harvest year
(2002–2003) showed that 74.8% of the cross-validated
samples were correctly classified, while 100% from the
Peninsula, 95.0% from the Edremit Gulf, 94.1% from the
Mugla province,89.5% from the Manisa province, 87%
from the Aydın province, 33.3% from the Izmir province
and 18.2% from the Firms were wrongly classified. Two
Edremit Gulf samples from the second harvest year were
classified as Izmir province. Ten Izmir province samples
were identified as the Edremit Gulf and six samples were
classified in the Aydın province. Also, two samples appiece
were associated with the Manisa and the Mugla provinces,
the Peninsula and the Firms sub-groups. Two Aydınprovince samples were classified as the Izmir province and
the one sample was identified as the Mugla province. Two
Manisa samples was associated with the Edremit Gulf. The
one Mugla sample was classified as the Aydın province.
Five Firms oil (blend oils from unknown origin) samples
from the second harvest year were classified as the Edremit
Gulf and three samples were grouped as the Izmir province.
Also, one Firms sample was associated with the Peninsula.
Cumulatively 70.0 and 81.8% of the Firms oils for both
harvest years, respectively, were recognized as belonging
to known groups (cultivar oils) on the basis of fatty acid
profile. These relatioships among oil groups during two
harvest years appeared to be due to the homogenous or
heterogenous olive cultivar areas, commercial blending or
coupaging depend on olive and oil exchanges among dif-
ferent olive growing zones in Aegean region of Turkey. As
a general rule, during blending, around 40% of the Firms
oils consist of the Ayvalık cultivar while the Erkence
cultivar is dominant in the Peninsula oils.
Similar investigations based only on fatty acid compo-
sitional data for Greek [11, 13], Italian [12, 14–18],
Spanish [20, 21, 24], French [19] and Turkish [6, 9, 10] oils
resulted in a few defined regions and crop years. These
studies were carried out using different software packing
programs (SAS, SPSS, SIMCA), including PCA, HCA and
DA.
The results of this study showed that application of
chemometric methods, PCA and DA, to fatty acid com-
position is quite successful for the classification of virgin
olive oil samples with respect to variety, geographical
origin and harvest year, as a model based on Aegean region
of Turkey.
On the other hand, it was indicated that the discrimi-
nation results from the Edremit Gulf, the Peninsula, the
Mugla and the Manisa zones would correctly be classified
(100–80%) for monocultivar or growing area using fatty
Table 3 Canonical discriminant analysis for Turkish virgin olive oil samples collected from different locations of the Aegean Region for two
harvest years (2001–2002 and 2002–2003)
Crop year 2001–2002 Crop year 2002–2003
N = 105 N = 163
Canonical discriminant
function
Eigenvalue Variance % Canonical
correlation
Eigenvalue Variance % Canonical
correlation
1 3.939a 51.3 0.893 1.809a 30.9 0.802
2 1.692a 22.0 0.793 1.637a 28.0 0.788
3 0.728a 9.5 0.649 1.423a 24.3 0.766
4 0.502a 6.5 0.578 0.771a 13.2 0.660
5 0.470a 6.1 0.565 0.120a 2.0 0.327
6 0.348a 4.5 0.508 0.091a 1.6 0.289
Test of functions Wilks’ Lambda Chi-Square DF Sig. Level Wilks’ Lambda Chi-Square DF Sig. Level
1 through 6 0.015 373.94 108 0.000 0.026 545.28 114 0.000
2 through 6 0.072 232.59 85 0.000 0.072 391.40 90 0.000
3 through 6 0.194 144.93 64 0.000 0.191 246.91 68 0.000
4 through 6 0.336 96.53 45 0.000 0.462 115.02 48 0.000
5 through 6 0.505 60.50 28 0.000 0.819 29.83 30 0.474
6 0.742 26.40 13 0.015 0.916 13.00 14 0.526
1912 J Am Oil Chem Soc (2011) 88:1905–1915
123
Ta
ble
4C
lass
ifica
tio
nre
sult
so
fT
urk
ish
vir
gin
oli
ve
oil
sam
ple
sco
llec
ted
fro
md
iffe
ren
tlo
cati
on
so
fA
egea
nR
egio
nfo
rtw
oh
arv
est
yea
rs(2
00
1–
20
02
and
20
02
–2
00
3)
Cro
py
ear
20
01
–2
00
2C
rop
yea
r2
00
2–
20
03
N=
10
5N
=1
63
Pre
dic
tin
gg
rou
pin
gP
red
icti
ng
gro
up
ing
Act
ual
gro
up
Nu
mb
ero
f
case
s
Ed
rem
it
Gu
lf
Izm
irA
ydın
Man
isa
Mu
gla
Pen
insu
laF
irm
sN
um
ber
of
case
s
Ed
rem
it
Gu
lf
Izm
irA
ydın
Man
isa
Mu
gla
Pen
insu
laF
irm
s
Ed
rem
it
Gu
lf
24
21
00
30
00
40
38
20
00
00
87
.50
.00
.01
2.5
0.0
0.0
0.0
95
.05
.00
.00
.00
.00
.00
.0
Izm
ir1
41
93
10
00
36
10
12
62
22
2
7.1
64
.32
1.4
7.1
0.0
0.0
0.0
27
.83
3.3
16
.75
.65
.65
.65
.6
Ay
din
15
11
90
20
22
30
22
00
10
0
6.7
6.7
60
.00
.01
3.3
0.0
13
.30
.08
.78
7.0
0.0
4.3
0.0
0.0
Man
isa
16
20
01
30
01
19
20
01
70
00
12
.50
.00
.08
1.3
0.0
0.0
6.3
10
.50
.00
.08
9.5
0.0
0.0
0.0
Mu
gla
10
02
00
80
01
70
01
01
60
0
0.0
20
.00
.00
.08
0.0
0.0
0.0
0.0
0.0
5.9
0.0
94
.10
.00
.0
Pen
insu
la1
30
00
00
13
01
70
00
00
17
0
0.0
0.0
0.0
0.0
0.0
10
0.0
0.0
0.0
0.0
0.0
0.0
0.0
10
0.0
0.0
Fir
ms
10
31
02
01
31
15
30
00
12
30
.01
0.0
0.0
20
.00
.01
0.0
30
.04
5.5
27
.30
.00
.00
.09
.11
8.2
Per
cen
to
fcr
oss
-val
idat
edca
ses
corr
ectl
ycl
assi
fied
74
.5%
Per
cen
to
fcr
oss
-val
idat
edca
ses
corr
ectl
ycl
assi
fied
74
.8%
J Am Oil Chem Soc (2011) 88:1905–1915 1913
123
acid profiles. The Ayvalık, Memecik and Erkence oils from
different growing regions could be differentiated based on
their fatty acid profiles with PCA and DA results. This
research is a step towards the subjective characterization
and classification of economically important areas in oil
production for utilization in the Turkish food industry. Use
of the multivariate approach on the fatty acid profiles of
virgin olive oil taken from six sections of Aegean region,
Turkey’s main olive oil production, during two crop years
appears to be advantageous for reducing the data set
compressing the variance into smaller number of axes. The
results of this investigation gives the possibility of evalu-
ating data to control labelling and of building up the ref-
erence set necessary for establishing criterion of
geographical origin, especially Aegean region of Turkey,
and ultimately increasing competitiveness of these prod-
ucts on the market.
Future work on characterization of virgin olive oils from
the Aegean region of Turkey should be carried out with
investigations covering different parameters (triacylglyce-
rols, sterols, phenolic compounds and volatile compounds)
in terms of building a more comprehensive data bank.
Acknowledgments The authors would like to express their thanks
to the Ministry Agriculture of Turkey (especially Dr. Seyfi Ozısık,
Director of Inst. Res. for Olive Culture, Bornova, Izmir/Turkey)
Project No TAGEM/GY/00/14/041, for financial support. Also, we
are grateful to Mr. Metin Aydogdu (Agric. Eng. Department of
Geographical Information Systems, Ministry Agriculture and Rural
Affairs, Ankara) for the map of Aegean Region, Turkey.
References
1. Kiritsakis AK (1998) Olive oil from the tree to the table. Food
and Nutrition Press, Trumbull
2. Montealegre C, Mariane Alegre ML, Garcia Luiz C (2010)
Traceability markers to the botanical origin in olive oils. J Agric
Food Chem 58:28–38
3. Ozturk F, Yalcın M, Dıraman H (2009) Turkiye ZeytinyagıEkonomisine Genel Bir Bakıs Gıda Teknolojileri Elektronik
Dergisi 12(2):35–51
4. http://www.tpi.org.tr. Accessed 26 March 2011
5. Aparicio R (1999) Characterization: mathematical procedures for
chemical analysis. In: Aparicio R, Harwood J (eds) Handbook of
olive oil: analysis and properties. Springer-Verlag, New York,
pp 285–354
6. Gurdeniz G, Ozen B, Tokatlı F (2008) Classification of Turkish
olive oils with respect to cultivar, geographic origin and harvest
year using fatty acid profile and mid-IR spectroscopy. Eur Food
Res Tech 227:1275–1281
7. Andjelkovic M, Acun S, Van Hoed VV, Verhe R, Van Camp J
(2008) Chemical composition of Turkish olive oil—Ayvalik.
J Am Oil Chem Soc 85:135–140
8. Kıralan M, Bayrak A, Ozkaya MT (2009) Oxidation stability of
virgin olive oils from some important cultivars in East Mediter-
ranean area in Turkey. J Am Oil Chem Soc 86:247–252
9. Dıraman H (2010) Characterization of important domestic and
foreign olive cultivars from the national olive collection orchard
of Turkey by chemometry. Grasas y Aceites 61:341–351
10. Ilyasoglu H, Ozcelik B, Van Hoed V, Verhe R (2010) Charac-
terization of Aegean olive oils by their minor compounds. J Am
Oil Chem Soc 87:627–636
11. Tsimidiou M, Karakostas KX (1993) Geographical classification
of Greek virgin olive oil by non-parametric multivariate evalua-
tion of fatty acid composition. J Sci Food Agric 62:253–257
12. Lanza CM, Russo C, Tomaselli F (1998) Relationship between
geographical origin and fatty acid composition of extra-virgin
olive oils produced in three areas of Eastern Sicily. Italian J Food
Sci 10:359–366
13. Stefanoudaki E, Kotsikafi F, Koutsafakis A (1999) Classification
of virgin olive oils of the two major Cretan cultivars based on
their fatty acid composition. J Am Oil Chem Soc 76:623–626
14. Mannina L, Patumi M, Proietti N, Bassi D, Laura Segre A (2001)
Geographical characterization of Italian extra virgin olive oils
using High-Field 1H NMR Spectroscopy. J Agric Food Chem
49:2687–2696
15. Bucci R, Magri AD, Magri AL, Marini D, Marini F (2002)
Chemical authentication of extra virgin olive oil varieties by
supervised chemometric procedures. J Agric Food Chem
50:413–418
16. Lanteri S, Armanino C, Peri E, Palapoli A (2002) Study of oils
from Calabrian olive cultivars by chemometric methods. Food
Chem 76:501–507
17. Giansante L, Di Vincenzo D, Bianchi G (2003) Classification of
monovarietal Italian olive oils by unsupervised (PCA) and
supervised (LDA) chemometrics. J Sci Food Agric 83:905–911
18. Mannina L, Dugo G, Salvo F, Cicero L, Ansanelli G, Calcagn C,
Segre AL (2003) A study of the cultivar–composition relationship
in Sicilian olive oils by GC, NMR, and statistical methods.
J Agric Food Chem 51:120–127
19. Ollivier D, Artaud J, Pinatel C, Durbec JP, Guerere M (2003)
Triacylglycerol and fatty acid compositions of French virgin
olive oils characterisation by chemometrics. J Agric Food Chem
51:5723–5731
20. Sanchez Casas J, Oserio Bueno E, Montano Garcia AM, Martinez
Cano M (2003) Estudio del contenido en acidos grasos de aceites
monovarietales elaborades a partir de aceitunas producidas en la
region extremena. Grasas Aceites 54:371–377
21. Aranda F, Gomez–Alanso S, del Rivera Alamo RM, Salvador
MD, Fregapane G (2004) Triglyceride, total and 2 n-position fatty
acid composition of Cornicobra virgin olive oil: comparison with
other Spanish cultivars. Food Chem 86:485–492
22. Dugo Mo G, Alfa M, La Pera L, Mavrogeni E, Pallicino D,
Maisano R, Pizzimenti G (2004) Characterization of Sicilian
virgin olive oils Note X A comparison between Cerasuola and
Nocellera del Belice varieties. Grasas Aceites 55:415–422
23. Natale L, Bono S (2006) Characteristics of the olive oils of Lazio.
Olivae 106:32–41
24. Casas JS, Gordillo CM, Bueno EO, Exposito JM, Mendoza MF,
Hierro TA, Gonzalez LG, Cano MM (2009) Characteristics of
virgin olive oils from the olive zone of Extremadura (Spain), and
an approximation to their varietal origin. J Am Oil Chem Soc
86:933–940
25. Dunteman GH (1989) Principal component analysis. Lage Pub-
lications, Beverly Hills
26. Canozer O (1991) The Catalogue for Standard Olive Varieties.
Republic of Turkey, Ministry Agriculture and Rural Affairs.
TUGEM Publication General No: 334.Serie:16. Ankara, Turkey
27. European Union Commission Regulation 2568 /91 (1991) The
characteristics of olive oil and olive-residue oil and on the rele-
vant methods of analysis. Off J Eur Commun L 248:1–83
28. SPSS (2001) Base 12.0 applications guide. SPSS Inc, Chicago
29. International Olive Oil Council (2003) Trade standard applying to
olive oils and olive—Pomace Oils. COI/T.15.NC No 3/Rev. 1.
http://www.internationaloliveoil.org (accessed 15 March 2011)
1914 J Am Oil Chem Soc (2011) 88:1905–1915
123

30. Anonymous (2007) Turkish Food Codex Communique on Olive
oil and Pomace oil. The Official Gazette of Republic of Turkey.
Date: 03.08.2007 Number: 26602. Ankara, Turkey
31. Jackson JE (1991) A user’s guide to principal components.
Wiley, New Jersey
32. Jollife IT (1972) Discarding variables in a principal component
analysis. I:Articifial data. Appl Stat 21:160
33. Jollife IT (1972) Discarding variables in a principal component
analysis. I:Real data. App Stat 22:21
J Am Oil Chem Soc (2011) 88:1905–1915 1915
123