The porcelain crab transcriptome and PCAD, the porcelain crab microarray and sequence database
Upload
independentCategory
view
4download
0
Wetlands Ecology and Management 10: 203–213, 2002.© 2002 Kluwer Academic Publishers. Printed in the Netherlands. 203
Geographic trends in mangrove crab abundance in East Africa
R.G. Hartnoll1,∗, S. Cannicci2, W.D. Emmerson3, S. Fratini2, A. Macia4, Y. Mgaya5, F. Porri3,R.K. Ruwa6, J.P. Shunula5, M.W. Skov1 & M. Vannini71Port Erin Marine Laboratory, University of Liverpool, Isle of Man IM9 6JA, British Isles; 2Dipartimento diBiologia Animale e Genetica ‘Leo Pardi’, Universita degli Studi di Firenze, Via Romana 17, I-50125 Firenze, Italy;3Department of Zoology, University of Transkei, P. Bag X1, Umtata, East Cape, South Africa; 4Department ofBiological Sciences, University Eduardo Mondlane, C.P. 257 Maputo, Mozambique; 5Institute of Marine Science,P.O. Box 668, Zanzibar, Tanzania; 6Kenya Marine and Fisheries Research Institute, P.O. Box 81651, Mombasa,Kenya; 7Museo di Storia Naturale, Sezione di Zoologia ‘La Specola’, Universita degli Studi di Firenze, Via Romana17, I-50125 Firenze, Italy; ∗Author for correspondence, Tel: +44 1624 831007, Fax: +44 1624 831001; E-mail:[email protected]
Key words: crab abundance, crab biomass, East Africa, geographic trends, mangroves
Abstract
The aim of this work was to determine the abundance of crabs in mangrove communities along a latitudinal gradientalong the eastern coast of Africa from 4◦S to 32◦S. Surveys were made at Mombasa (Kenya), Zanzibar (Tanzania),Maputo (Mozambique) and in the Transkei (South Africa). Crabs were estimated at three designated levels in themangroves by visual census using a common protocol, and numbers were converted to biomass.
Even after standardising the selection of sites and methods of census there was still extensive variability inthe data, emphasising the complex heterogeneity of mangrove ecosystems. Lunar phase (full versus new moonsprings) did not have a consistent effect on results, but shore height had several effects. Total crab biomass wassimilar in the two lower shore strata examined, but about twice as high at the top-Avicennia level. The ratio ofgrapsid biomass:ocypodid biomass also changed with height: from near unity in the lower mangrove, to 0.14 in themiddle strata, but to 15 at the top.
There was no consistent latitudinal trend in total crab numbers, but total crab biomass increased from north tosouth. In addition there was a consistent and marked change in the grapsid biomass:ocypodid biomass ratio: thisswung from 0.65 at Mombasa to 6.8 in the Transkei. This has implications for the transfer of primary productionthrough the food chain. Grapsids are important macrophagous feeders on the leaves and other parts of mangroves,whereas ocypodids are microphagous deposit feeders.
Introduction
Crabs are the most visible mangrove macrofauna, themajority burrowing in the sediment during high tide,but once the tide recedes emerging to become active onthe surface (Macintosh, 1984; Hartnoll. 1988). Mostare either fiddler crabs (Family Ocypodidae, GenusUca), or sesarmid crabs (Family Grapsidae, Subfam-ily Sesarminae), though various other members ofthe Gecarcinidae, Grapsidae, Ocypodidae, Portunidaeand Xanthidae occur. There are various accounts ofthe mangrove crab fauna in the East African area
(Macnae and Kalk, 1962; Derijard, 1966; Macnae,1968; Hartnoll, 1975; Kalk, 1995).
Few of these crabs are of direct economic im-portance, though several species may be caught andconsumed at a subsistence level. The only species ofsubstantial commercial importance is the ‘mud crab’,Scylla serrata (Forskål) (see Keenan and Blackshaw,1999 for recent review). However this inhabits thecreeks, rather than the mangrove thickets themselves,and is active at high tide rather than low tide. Further-more it is a carnivore, and occupies a higher trophiclevel than most of the other mangrove crabs.

204
One basic aim of the MEAM project (EU INCO-DC) was to evaluate the role of mangrove macrofaunain the energy flux of the mangrove ecosystem, in par-ticular the extent to which macrofauna are responsiblefor the trapping and conversion of mangrove primaryproduction within the immediate environment, and itstransfer to higher trophic levels (see Giddings et al.,1986; Robertson and Daniel, 1989; Micheli, 1993;Lee, 1997, 1998; Skov and Hartnoll, 2002). This trans-fer may be within the mangroves, or further afieldvia the export of larvae. Mangrove crabs play vari-ous roles. A limited number feed directly upon livingleaves on mangrove trees – the only important spe-cies is Sesarma leptosoma Hilgendorf (Vannini andRuwa, 1994). Others feed on fallen mangrove leaves.Some by sitting in the trees and picking them fromthe surface of the water at high tide, as in Selatiumelongatum (A. Milne Edwards) (Cannicci et al., 1999),others by collecting fallen leaves from the substratumat low tide, as in Neosarmatium meinerti (De Man)(Micheli et al., 1991; Emmerson and McGwynne,1992) and N. smithi (H. Milne Edwards) (Giddins etal., 1986). In contrast the species of Uca are depositfeeders, sorting the organic fraction from the sediment(Crane, 1975). However, most of this organic fractionis presumed to have resulted from the breakdown ofmangrove material. Other species are opportunistic,such as Metopograpsus thukuhar (Owen) (Fratini etal., 2000) and Thalamita crenata (Latreille) (Cannicciet al., 1996), or predatory as in Epixanthus dentatusWhite (Cannicci, et al., 1998).
Initially this investigation set out to quantify themangrove crabs, though there are no simple methodsapplicable to all species at all levels in the mangrove.Only recently Lee (1998) remarked in his review that‘one area of uncertainty in the overall importance ofthe crabs arises from the lack of a satisfactory methodfor the estimation of field density’. In this study itwas decided to use direct visual census as the primaryassessment method, and it is the result of that workwhich is presented here. The method involves variousuncertainties, and collateral studies to validate and cal-ibrate the visual census method are being presentedelsewhere (e.g. Skov and Hartnoll, 2001). The studieswere carried out along the East African coastline fromMombasa in the north at 4◦S to Transkei at 32◦S. Thiscompared fully tropical mangroves with ones near totheir southern limit, to determine whether the role ofthe macrofauna varied latitudinally.
Methods
The work was conducted in four geographic areas or‘locations’. They were determined at the outset ofthe project by both biological and logistic consider-ations: Mombasa, Kenya, 4◦S; Zanzibar, Tanzania,6◦S; Maputo, Mozambique, 26◦; Transkei, SouthAfrica, 32◦S. Within each location surveys were con-ducted at two ‘sites’ situated >10 km apart, selectedbecause they included communities which matchedthe criteria set out in the protocol. In some, but notall locations, two sites were sufficient for the fullsampling procedure.
Quadrat selection
Ideally a full vertical transect through the mangrovewould have been assessed, but it became apparent atan early stage that the enormous variations in man-grove infrastructure made this unproductive. So three‘levels’ within the mangroves were prescribed on bio-logical and physical criteria, which could be identifiedwithin each location. The criteria for positioning quad-rats within these evolved during field trials, but thedefinitive protocols were as follows. 1. Lumnitzera/topAvicennia quadrats. To measure 2 m by 2 m withan Avicennia tree in one corner. At the top of theAvicennia zone, maybe with Lumnitzera mixed in, andexpecting evidence of Neosarmatium meinerti pres-ence. 2. Mid Avicennia quadrats. To measure 2 m by2 m, and to be half in and half out of shade of treecanopy. Avicennia zone to have muddyish substrate,to be fairly flat, and quite broad. Trees to be 4–5 mhigh or more, c. 20 cm trunk diameter. In middle ofzone, above area where pneumatophores are denselyencrusted with barnacles. 3. Rhizophora quadrats. Tomeasure 2 m by 2 m, with mangrove tree in one corner.Fairly pure Rhizophora stand with soft mud substrate.Trees to be 4–5 m or more high with root area of c.4 m2. Approximately 50% of area bare mud, that isnot containing mangrove roots. Quadrats should notcontain drainage channels or running water.
At each level 12 quadrats were marked, and sixrandomly selected for the first survey. For the secondsurvey the six used plots were discarded, and the poolmade up to 12 by identifying six more. From thesetwelve, six were randomly selected for the secondsurvey.
205
Survey timing
All surveys were carried out between July and Decem-ber 1998: once at each site on full moon springs,and again on the following new moon springs. Thetotal work period at each location was spread over sixweeks (except where it was possible to work the twosites on the same tidal cycles): Full moon springs 1,Site 1; New moon springs 1, Site 1; Full moon springs2, Site 2; New moon springs 2, Site 2.
Observation protocol
The plots were selected and the guide ropes positioneda day before observation, avoiding trampling the quad-rats. The upper and mid level quadrats were dividedinto eight 0.5 m by 1 m strips to help visual counts.The low quadrats were subdivided into three strips of0.67 m by 2 m, which better suited the abundance ofcrabs in that area.
Surface activity was evaluated twice for each quad-rat – one hour after emersion, and at low water. Oncethe observer was stationary in position 3–4 m from thequadrat there was a wait of 15 minutes (30 minutesin the upper Avicennia) to allow normal activity to re-sume – these times were found to be adequate. Foreach category the maximum count in either evaluationwas used in the estimates presented. This was to com-pensate for differences in the timing of peak activity.Binoculars (8 by 40) were used to count the specimensof a single species in each strip in turn, storing the datain a dictaphone. Male and female Uca were scannedseparately. The process was repeated for each addi-tional species. Where specimens could not be fullyidentified (e.g. juvenile Sesarma), they were allocatedpro rata amongst the relevant identified categories.
Physical and chemical variables
Immersion time was determined for the centre of theset of quadrats at each level of each site, using onlytides with a predicted high water at Zanzibar of 3.9 to4.1 m above chart datum. The time of immersion andsubsequent emersion were recorded. Sediment particlesize and sediment organic content were determinedfor each quadrat by taking five cores – near each ofthe corners and in the centre. The cores were 5 cmdeep and 2.5 cm wide, and were mixed prior to ana-lysis. For particle size a sample of 60 g wet weightwas first wet sieved to separate particles of <64 µm,which were dried and weighed. The remainder was
dried and sieved following standard protocols, and me-dian particle diameter, quartile deviation and skewnesscalculated (Holme and McIntyre, 1971). For organiccontent a sample of 30–50 g wet weight was driedand weighed, and then incinerated in a muffle fur-nace at 500◦C for 24 hours and reweighed. A seriesof trials showed that this temperature produced fullcombustion of the organic component, but did notresult in weight loss due to breakdown of carbonates(confirmed by acid decalcification trials).
Results
Immersion periods
There was considerable variation (Table 1) withinwhat were chosen to represent comparable levels.However, at the three northernmost sites – Mombasa,Zanzibar and Maputo – there was increasing immer-sion from top Avicennia to Rhizophora (less clearcutin Zanzibar). However, at the southernmost locationin Transkei this relationship broke down, perhaps re-flecting changes in the infrastructure of the mangrovenear its geographical limit.
Sediment characteristics
For each location values were averaged by site andby level (Table 1) – the median particle size for eachlevel was substantially smaller at Umtata than at theother three locations. Both Mngazana and Mntafufuare estuarine sites: the enhanced degree of shelter andavailability of fine sediment will both contribute tothe fine sediment grade. When the levels were com-pared, the mid Avicennia had the coarsest sediment,the top Avicennia was finer, and the Rhizophora thefinest. This is not intuitively what might be expected –a gradient of increasing coarseness with shore heightmight be anticipated.
Organic content was averaged by site and by level(Table 1). No location had a clearly higher organiccontent, and there were in some cases very wide dif-ferences between the two sites at a location. When thelevels were compared there was a similar trend to thatnoted for particle size, with high organic content cor-related with finer particle size. This relationship washighly significant (r2 = 0.21, p <0.001). The highestorganic content was in the Rhizophora stratum, andthe lowest in the mid Avicennia stratum.

206
Table 1. Values for each level at each site: immersion time, mean sediment particle size, mean sediment organic content.
Level Location Site Immersion Median size Median size Organic content
(hours-mins) (phi) (mm) (%)
Upper Avicennia Mombasa Mida 1–00 1.78 0.3 13.13
Gazi 0–40 1.99 0.25 1.07
Zanzibar Maruhubi 1–00 1.34 0.39 7.24
Unguja Ukuu 2–00 1.5 0.35 3.95
Maputo Saco Inhaca 1–49 2.17 0.22 4.85
Escola Noge 2–01 1.84 0.28 4.69
Umtata Mntafufu 5–45 4.34 0.05 11.76
Mngazana 3–15 3.65 0.08 3.9
Mean UA 2.33 0.24 6.32
Mid Avicennia Mombasa Mida 2–40 2.24 0.21 2.49
Gazi 2–40 2.03 0.24 0.94
Zanzibar Maruhubi 4–47 0.95 0.51 0.87
Mbweni 5–05 1.17 0.44 1.62
Maputo Saco Inhaca 3–48 2.2 0.22 5.3
Escola Noge 4–20 1.72 0.3 4.75
Umtata Mntafufu 5–20 2.7 0.15 4.29
Mngazana 3–00 3.6 0.08 5.7
Mean MA 2.08 0.27 3.25
Rhizophora Mombasa Mida 4–00 2.53 0.17 4.33
Gazi 5–00 1.7 0.3 5.25
Zanzibar Kisakasaka 5–00 2.03 0.24 13.53
Unguja Ukuu 4–28 3.01 0.13 15.1
Maputo Saco Inhaca 5–00 1.68 0.31 10.2
Escola Noge 5–10 1.91 0.26 5.3
Umtata Mntafufu 3–35 4.3 0.05 8.46
Mngazana 3–45 4.47 0.04 13.12
Mean RH 2.70 0.19 9.41
Crab numbers and biomass
Sampling covered a considerable latitudinal range, andover this range species can be expected to vary inabundance, or to disappear and be replaced by eco-logically similar species. Examining such changeswould have little relevance to the aims of the study,so analysis of individual species was restricted toexamining their correlation with physical and chem-ical variables. Uca annulipes (H. Milne Edwards)and Neosarmatium meinerti were selected for this be-cause both are common over the full geographicalextent of the project, and because they have quitedifferent trophic niches. Uca annulipes is a select-ive deposit feeder, and Neosarmatium meinerti feedspredominantly upon fallen mangrove leaves. Abund-ance within individual quadrats was regressed uponthe values of each variable for that quadrat. Uca an-
nulipes showed a highly significant correlation withboth median particle size (p <0.0001) and with sedi-ment organic content (p <0.0001), but no significantcorrelation with immersion period (p =0.094). This isappropriate for a deposit feeder with a sorting mech-anism attuned to a certain particle grade (Icely andJones, 1978), where sediment quality is more relev-ant than shore level. When stepwise regression wascalculated all three variables were judged relevant inthe order organic content>particle size>inundationtime. However, the final r2 value was raised to only0.29, so most of the variability in crab number wasstill not explained. In contrast Neosarmatium meinertishowed no significant correlation with either sedi-ment characteristic (p =0.29, 0.91 respectively), buta highly significant correlation with immersion period(p <0.0001). This crab is little affected by sediment
207
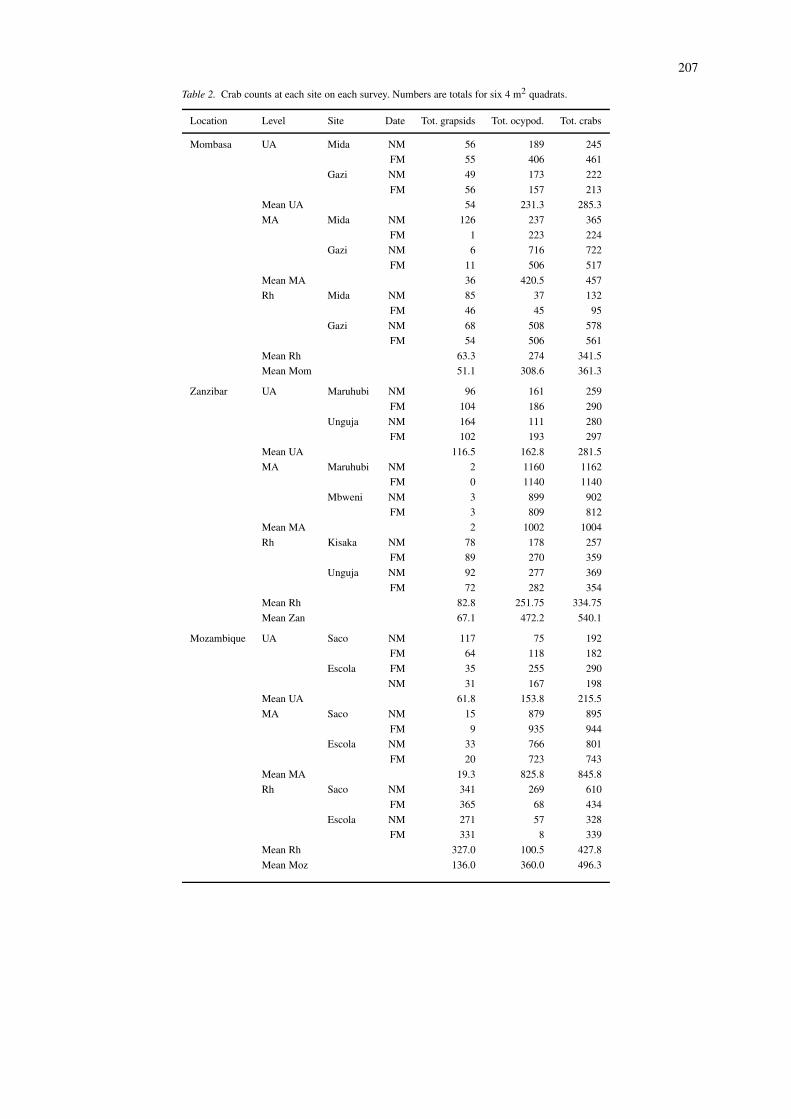
Table 2. Crab counts at each site on each survey. Numbers are totals for six 4 m2 quadrats.
Location Level Site Date Tot. grapsids Tot. ocypod. Tot. crabs
Mombasa UA Mida NM 56 189 245
FM 55 406 461
Gazi NM 49 173 222
FM 56 157 213
Mean UA 54 231.3 285.3
MA Mida NM 126 237 365
FM 1 223 224
Gazi NM 6 716 722
FM 11 506 517
Mean MA 36 420.5 457
Rh Mida NM 85 37 132
FM 46 45 95
Gazi NM 68 508 578
FM 54 506 561
Mean Rh 63.3 274 341.5
Mean Mom 51.1 308.6 361.3
Zanzibar UA Maruhubi NM 96 161 259
FM 104 186 290
Unguja NM 164 111 280
FM 102 193 297
Mean UA 116.5 162.8 281.5
MA Maruhubi NM 2 1160 1162
FM 0 1140 1140
Mbweni NM 3 899 902
FM 3 809 812
Mean MA 2 1002 1004
Rh Kisaka NM 78 178 257
FM 89 270 359
Unguja NM 92 277 369
FM 72 282 354
Mean Rh 82.8 251.75 334.75
Mean Zan 67.1 472.2 540.1
Mozambique UA Saco NM 117 75 192
FM 64 118 182
Escola FM 35 255 290
NM 31 167 198
Mean UA 61.8 153.8 215.5
MA Saco NM 15 879 895
FM 9 935 944
Escola NM 33 766 801
FM 20 723 743
Mean MA 19.3 825.8 845.8
Rh Saco NM 341 269 610
FM 365 68 434
Escola NM 271 57 328
FM 331 8 339
Mean Rh 327.0 100.5 427.8
Mean Moz 136.0 360.0 496.3
208
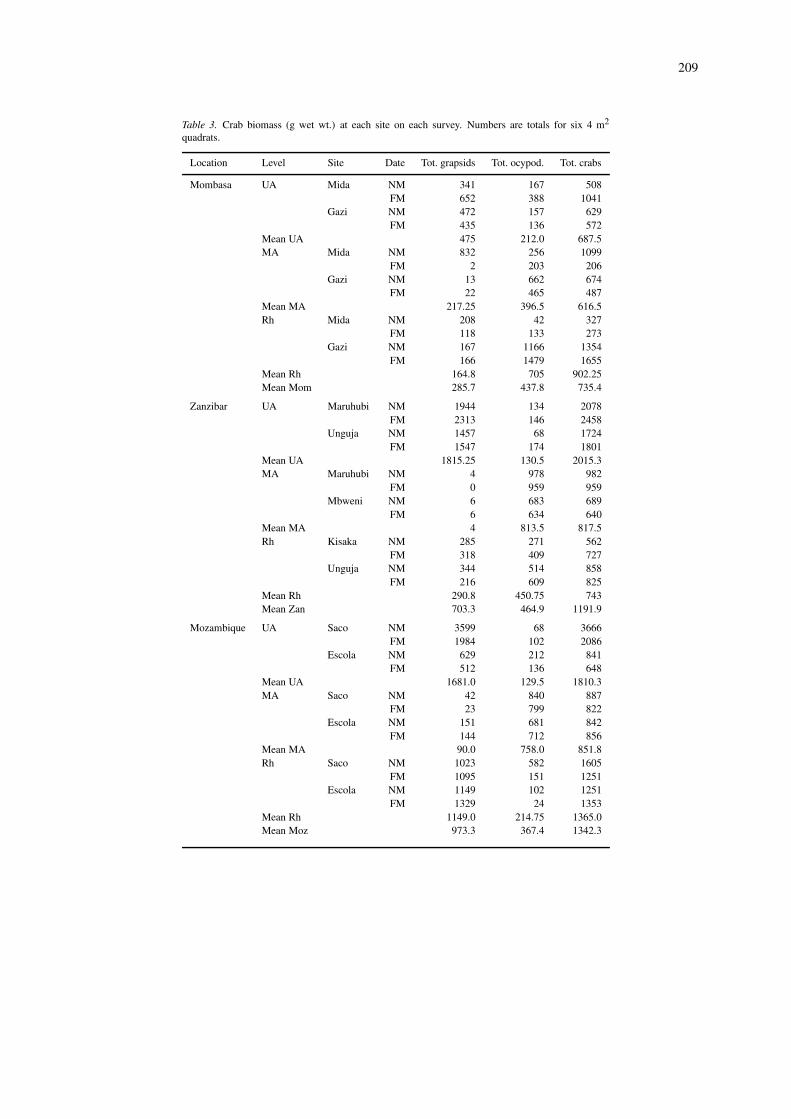
Table 2. Continued.
Location Level Site Date Tot. grapsids Tot. ocypod. Tot. crabs
Umtata UA Mntafufu NM 796 0 796
FM 433 0 433
Mngazana FM 87 0 87
NM 70 12 82
Mean UA 346.5 3.0 349.5
MA Mntafufu NM 5 794 799
FM 6 741 747
Mngazana NM 4 175 179
FM 3 398 401
Mean MA 4.5 527 531.5
Rh Mntafufu NM 158 0 158
FM 207 1 208
Mngazana NM 247 34 281
FM 251 22 273
Mean Rh 215.8 14.3 230
Mean Umt 188.9 181.4 370.3
type, but its ability to collect fallen leaves is verydependent on a prolonged exposure to air. For N.meinerti under stepwise regression two variables werejudged relevant in the order inundation time>particlesize, and the final r2 value was only 0.15. Data areavailable for other species but not reported in detailhere: under stepwise regression the final r2 values were0.17 for Uca chlorophthalmus (H. Milne Edwards) and0.28 for Sesarma guttatum A. Milne Edwards.
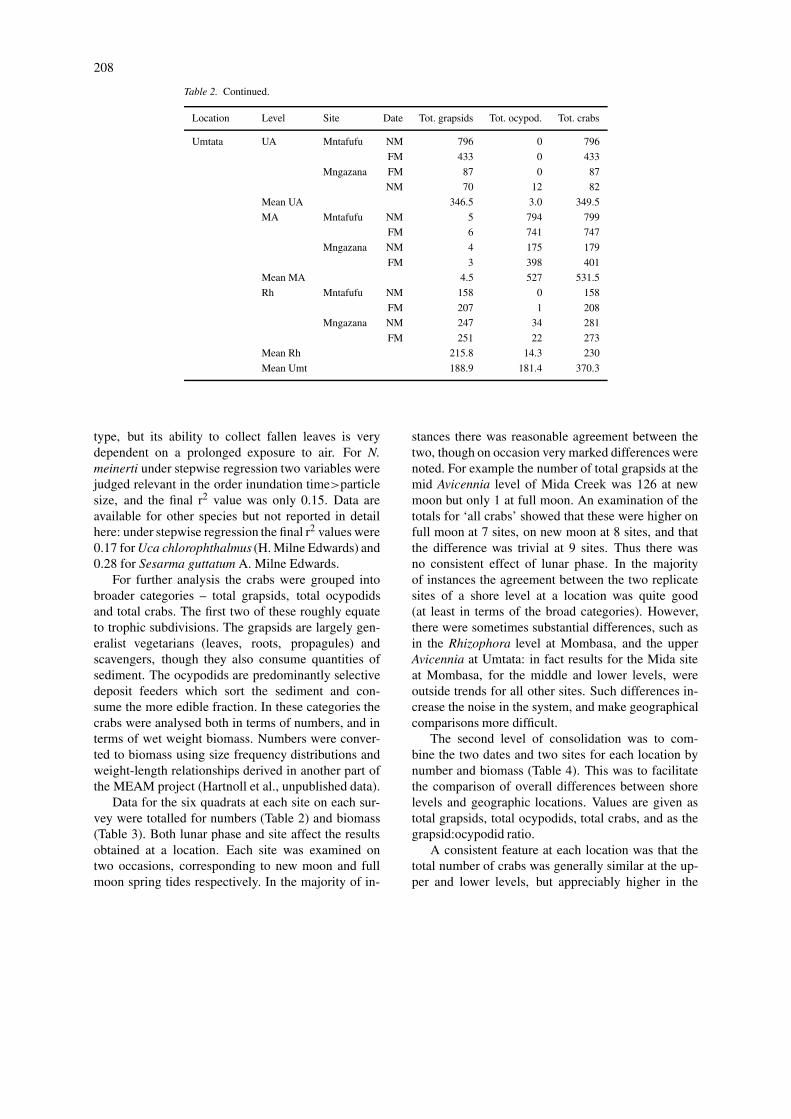
For further analysis the crabs were grouped intobroader categories – total grapsids, total ocypodidsand total crabs. The first two of these roughly equateto trophic subdivisions. The grapsids are largely gen-eralist vegetarians (leaves, roots, propagules) andscavengers, though they also consume quantities ofsediment. The ocypodids are predominantly selectivedeposit feeders which sort the sediment and con-sume the more edible fraction. In these categories thecrabs were analysed both in terms of numbers, and interms of wet weight biomass. Numbers were conver-ted to biomass using size frequency distributions andweight-length relationships derived in another part ofthe MEAM project (Hartnoll et al., unpublished data).
Data for the six quadrats at each site on each sur-vey were totalled for numbers (Table 2) and biomass(Table 3). Both lunar phase and site affect the resultsobtained at a location. Each site was examined ontwo occasions, corresponding to new moon and fullmoon spring tides respectively. In the majority of in-
stances there was reasonable agreement between thetwo, though on occasion very marked differences werenoted. For example the number of total grapsids at themid Avicennia level of Mida Creek was 126 at newmoon but only 1 at full moon. An examination of thetotals for ‘all crabs’ showed that these were higher onfull moon at 7 sites, on new moon at 8 sites, and thatthe difference was trivial at 9 sites. Thus there wasno consistent effect of lunar phase. In the majorityof instances the agreement between the two replicatesites of a shore level at a location was quite good(at least in terms of the broad categories). However,there were sometimes substantial differences, such asin the Rhizophora level at Mombasa, and the upperAvicennia at Umtata: in fact results for the Mida siteat Mombasa, for the middle and lower levels, wereoutside trends for all other sites. Such differences in-crease the noise in the system, and make geographicalcomparisons more difficult.
The second level of consolidation was to com-bine the two dates and two sites for each location bynumber and biomass (Table 4). This was to facilitatethe comparison of overall differences between shorelevels and geographic locations. Values are given astotal grapsids, total ocypodids, total crabs, and as thegrapsid:ocypodid ratio.
A consistent feature at each location was that thetotal number of crabs was generally similar at the up-per and lower levels, but appreciably higher in the
209
Table 3. Crab biomass (g wet wt.) at each site on each survey. Numbers are totals for six 4 m2
quadrats.
Location Level Site Date Tot. grapsids Tot. ocypod. Tot. crabs
Mombasa UA Mida NM 341 167 508FM 652 388 1041
Gazi NM 472 157 629FM 435 136 572
Mean UA 475 212.0 687.5MA Mida NM 832 256 1099
FM 2 203 206Gazi NM 13 662 674
FM 22 465 487Mean MA 217.25 396.5 616.5Rh Mida NM 208 42 327
FM 118 133 273Gazi NM 167 1166 1354
FM 166 1479 1655Mean Rh 164.8 705 902.25Mean Mom 285.7 437.8 735.4
Zanzibar UA Maruhubi NM 1944 134 2078FM 2313 146 2458
Unguja NM 1457 68 1724FM 1547 174 1801
Mean UA 1815.25 130.5 2015.3MA Maruhubi NM 4 978 982
FM 0 959 959Mbweni NM 6 683 689
FM 6 634 640Mean MA 4 813.5 817.5Rh Kisaka NM 285 271 562
FM 318 409 727Unguja NM 344 514 858
FM 216 609 825Mean Rh 290.8 450.75 743Mean Zan 703.3 464.9 1191.9
Mozambique UA Saco NM 3599 68 3666FM 1984 102 2086
Escola NM 629 212 841FM 512 136 648
Mean UA 1681.0 129.5 1810.3MA Saco NM 42 840 887
FM 23 799 822Escola NM 151 681 842
FM 144 712 856Mean MA 90.0 758.0 851.8Rh Saco NM 1023 582 1605
FM 1095 151 1251Escola NM 1149 102 1251
FM 1329 24 1353Mean Rh 1149.0 214.75 1365.0Mean Moz 973.3 367.4 1342.3
210
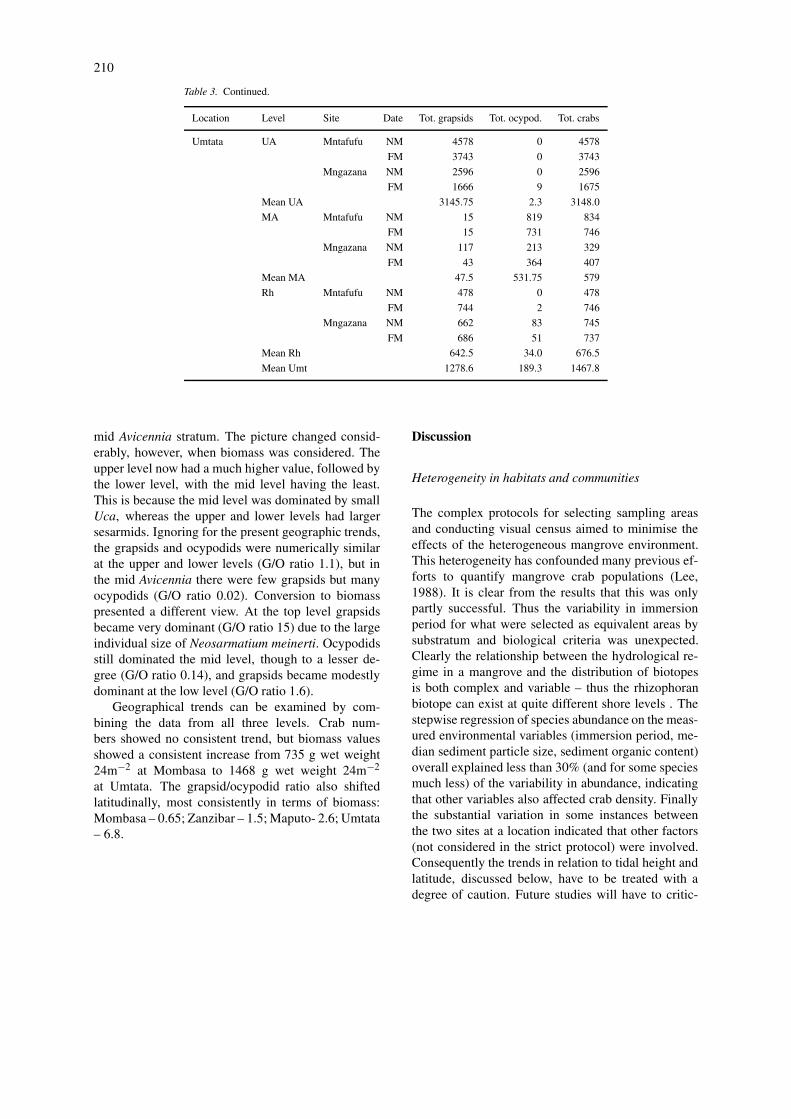
Table 3. Continued.
Location Level Site Date Tot. grapsids Tot. ocypod. Tot. crabs
Umtata UA Mntafufu NM 4578 0 4578
FM 3743 0 3743
Mngazana NM 2596 0 2596
FM 1666 9 1675
Mean UA 3145.75 2.3 3148.0
MA Mntafufu NM 15 819 834
FM 15 731 746
Mngazana NM 117 213 329
FM 43 364 407
Mean MA 47.5 531.75 579
Rh Mntafufu NM 478 0 478
FM 744 2 746
Mngazana NM 662 83 745
FM 686 51 737
Mean Rh 642.5 34.0 676.5
Mean Umt 1278.6 189.3 1467.8
mid Avicennia stratum. The picture changed consid-erably, however, when biomass was considered. Theupper level now had a much higher value, followed bythe lower level, with the mid level having the least.This is because the mid level was dominated by smallUca, whereas the upper and lower levels had largersesarmids. Ignoring for the present geographic trends,the grapsids and ocypodids were numerically similarat the upper and lower levels (G/O ratio 1.1), but inthe mid Avicennia there were few grapsids but manyocypodids (G/O ratio 0.02). Conversion to biomasspresented a different view. At the top level grapsidsbecame very dominant (G/O ratio 15) due to the largeindividual size of Neosarmatium meinerti. Ocypodidsstill dominated the mid level, though to a lesser de-gree (G/O ratio 0.14), and grapsids became modestlydominant at the low level (G/O ratio 1.6).
Geographical trends can be examined by com-bining the data from all three levels. Crab num-bers showed no consistent trend, but biomass valuesshowed a consistent increase from 735 g wet weight24m−2 at Mombasa to 1468 g wet weight 24m−2
at Umtata. The grapsid/ocypodid ratio also shiftedlatitudinally, most consistently in terms of biomass:Mombasa – 0.65; Zanzibar – 1.5; Maputo- 2.6; Umtata– 6.8.
Discussion
Heterogeneity in habitats and communities
The complex protocols for selecting sampling areasand conducting visual census aimed to minimise theeffects of the heterogeneous mangrove environment.This heterogeneity has confounded many previous ef-forts to quantify mangrove crab populations (Lee,1988). It is clear from the results that this was onlypartly successful. Thus the variability in immersionperiod for what were selected as equivalent areas bysubstratum and biological criteria was unexpected.Clearly the relationship between the hydrological re-gime in a mangrove and the distribution of biotopesis both complex and variable – thus the rhizophoranbiotope can exist at quite different shore levels . Thestepwise regression of species abundance on the meas-ured environmental variables (immersion period, me-dian sediment particle size, sediment organic content)overall explained less than 30% (and for some speciesmuch less) of the variability in abundance, indicatingthat other variables also affected crab density. Finallythe substantial variation in some instances betweenthe two sites at a location indicated that other factors(not considered in the strict protocol) were involved.Consequently the trends in relation to tidal height andlatitude, discussed below, have to be treated with adegree of caution. Future studies will have to critic-
211
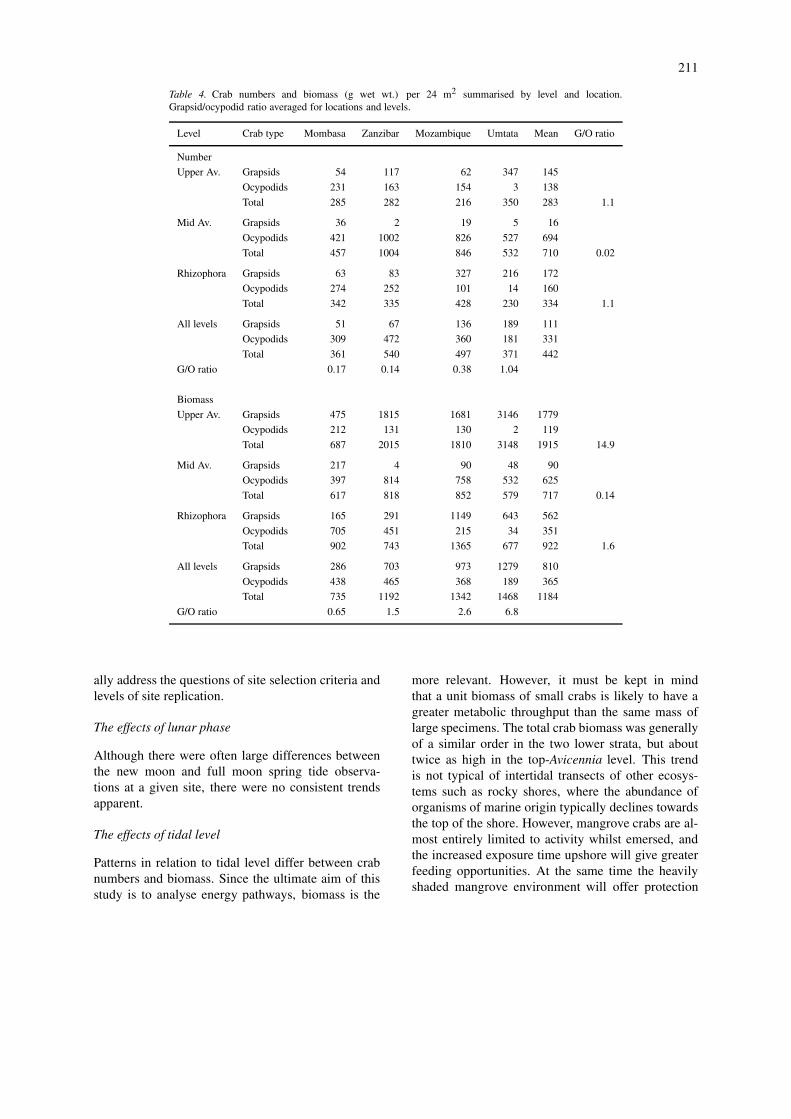
Table 4. Crab numbers and biomass (g wet wt.) per 24 m2 summarised by level and location.Grapsid/ocypodid ratio averaged for locations and levels.
Level Crab type Mombasa Zanzibar Mozambique Umtata Mean G/O ratio
Number
Upper Av. Grapsids 54 117 62 347 145
Ocypodids 231 163 154 3 138
Total 285 282 216 350 283 1.1
Mid Av. Grapsids 36 2 19 5 16
Ocypodids 421 1002 826 527 694
Total 457 1004 846 532 710 0.02
Rhizophora Grapsids 63 83 327 216 172
Ocypodids 274 252 101 14 160
Total 342 335 428 230 334 1.1
All levels Grapsids 51 67 136 189 111
Ocypodids 309 472 360 181 331
Total 361 540 497 371 442
G/O ratio 0.17 0.14 0.38 1.04
Biomass
Upper Av. Grapsids 475 1815 1681 3146 1779
Ocypodids 212 131 130 2 119
Total 687 2015 1810 3148 1915 14.9
Mid Av. Grapsids 217 4 90 48 90
Ocypodids 397 814 758 532 625
Total 617 818 852 579 717 0.14
Rhizophora Grapsids 165 291 1149 643 562
Ocypodids 705 451 215 34 351
Total 902 743 1365 677 922 1.6
All levels Grapsids 286 703 973 1279 810
Ocypodids 438 465 368 189 365
Total 735 1192 1342 1468 1184
G/O ratio 0.65 1.5 2.6 6.8
ally address the questions of site selection criteria andlevels of site replication.
The effects of lunar phase
Although there were often large differences betweenthe new moon and full moon spring tide observa-tions at a given site, there were no consistent trendsapparent.
The effects of tidal level
Patterns in relation to tidal level differ between crabnumbers and biomass. Since the ultimate aim of thisstudy is to analyse energy pathways, biomass is the
more relevant. However, it must be kept in mindthat a unit biomass of small crabs is likely to have agreater metabolic throughput than the same mass oflarge specimens. The total crab biomass was generallyof a similar order in the two lower strata, but abouttwice as high in the top-Avicennia level. This trendis not typical of intertidal transects of other ecosys-tems such as rocky shores, where the abundance oforganisms of marine origin typically declines towardsthe top of the shore. However, mangrove crabs are al-most entirely limited to activity whilst emersed, andthe increased exposure time upshore will give greaterfeeding opportunities. At the same time the heavilyshaded mangrove environment will offer protection

212
from the stresses which inhibit high shore populationsin more open habitats such as rocky shores and sandybeaches.
There were also substantial variations in thegrapsid/ocypodid (G/O) ratio with tidal level on theshore. Overall the ratio was near unity on the low shore(though with considerable geographical variation), butocypodids dominated in the mid zone (G/O ratio =0.14), and grapsids at the top (G/O ratio = 15). Theincreasing abundance of the leaf eating grapsids inthe drier high shore substrate was perhaps expected,but the ocypodids could be anticipated to predominateat the low level: they did not, except at the north-ernmost location. However, there were geographicaltrends (see below), which interact with the tidal leveleffects.
The effects of latitude
There was no consistent latitudinal trend in total crabnumbers: Mombasa was rather lower, then numbersdeclined somewhat from Zanzibar to Umtata. How-ever, for total crab biomass there was a consistentsoutherly increase from Mombasa (31 g wet wt. m−2)to the Transkei (61 g wet wt. m−2). This was surpris-ing, as it was expected that in the more stressed south-ern mangrove systems this stress would be reflected inreduced macrofaunal biomass. In addition there weremarked latitudinal changes in the grapsid/ocypodid ra-tio. The G/O ratio for biomass increased consistentlyfrom 0.65 at Mombasa to 6.8 in the Transkei. Thiswas expected, since overall grapsids show a greaterincursion into temperate climates than do ocypodids.This very marked change in dominance will have im-plications for energy flow patterns, with an apparentshift from deposit feeders in the tropics to leaf eatersin more temperate areas. The impact of this on the re-tention or export of mangrove primary production willneed to be studied. Robertson and Daniel (1989) raisedthis same point in connection with grapsid and ocy-podid dominated mangroves in Australia. They, andMcIvor and Smith (1995), also pointed out the con-trast between new world mangroves, where crabs playa minor role in leaf breakdown, and old world man-groves, where their role is generally important. McIvorand Smith (1995) suggested that increased tidal amp-litude in Australia, compared to Florida, may be afactor in this difference: the role of the even greatertidal amplitude in East Africa must be considered.
Acknowledgements
This work was carried out as part of the MEAM(Macrobenthos of Eastern African Mangroves) pro-ject, funded under the INCO-DC programme of theEU (Contract No. IC 18-CT96-0127). The authorsare grateful to the local villagers, who assisted withthe work in the field and made it possible. We alsoacknowledge the valuable help of the following stu-dents and technical staff: Abdillahi Chande, CaludiaCarcereri, Claudia Barelli, Evans Edwards, KamuliAbass, Lorenzo Montemagno, Luca Morino, MarinaGomei, Maurício Lipassula, Melissa, Santos Mu-cavele, Sekiwe Mbande, Valentina Vigiani.
References
Cannicci, S., Dahdouh-Guebas, F., Anyona, D. and Vannini, M.1996. Natural diet and feeding habits of Thalamita crenata(Decapoda: Portunidae). J. Crust. Biol. 16: 678–683.
Cannicci, S., Ruwa, R.K., Giuggioli, M. and Vannini, M. 1998.Predatory activity and spatial strategies of Epixanthus dentatus(Decapoda, Oziidae): an ambush predator among the mangroves.J. Crust. Biol. 18: 57–63.
Cannicci, S., Fratini, S. and Vannini, M. 1999. Use of time, spaceand food resources in the mangrove climbing crab Selatiumelongatum (Grapsidae: Sesarminae). Marine Biol. 135: 335–339.
Crane, J. 1975. Fiddler Crabs of the World. Ocypodidae: GenusUca. Princeton University Press, Princeton, New Jersey, USA.736 pp.
Derijard, R. 1966. Contribution à l’étude du peuplement des sédi-ments sablo-vaseux et vaseux intertidaux compactés ou fixés parla vegetation de la region de Tulear. Études Malagaches 17: 1–94.
Emmerson, W.D. and McGwynne, L.E. 1992. Feeding and assimila-tion of mangrove leaves by the crab Sesarma meinerti de Man inrelation to leaf litter production in Mgazana, a warm temperatesouthern African mangrove swamp. J. Exp. Marine Biol. Ecol.157: 41–53.
Fratini, S., Cannicci, S., Abincha, L.M. and Vannini, M. 2000. Feed-ing, temporal and spatial preferences of Metopograpsus thukuhar(Decapoda: Grapsidae): an opportunistic mangrove dweller. J.Crust. Biol. 20: 326–333.
Giddins, R.L., Lucas, J.S., Neilson, M.J. and Richards, G.N. 1986.Feeding ecology of the mangrove crab Neosarmatium smithi(Crustacea: Decapoda: Sesarmidae). Marine Ecol. – Prog. Ser.33: 147–155.
Hartnoll, R.G. 1975. The Grapsidae and Ocypodidae (Decapoda,Brachyura) of Tanzania. J. Zool. 177: 305–328.
Hartnoll, R.G. 1988. The eco-ethology of mangroves. In: Chelazzi,G. and Vannini, M. (eds.), Behavioural Adaptations to IntertidalLife, NATO ASI Series, Series A, Vol. 151: pp. 477–489, PlenumPress, New York.
Holme, N.A. and McIntyre, A.D. (eds.), 1971. IBP HandbookNo. 16. Methods for the Study of Marine Benthos. BlackwellScientific Publications, Oxford, UK. 334 pp.
Icely, J.D. and Jones, D.A. 1978. Factors affecting the distributionof the genus Uca (Crustacea: Ocypodidae) on an East Africanshore. Est. Coast. Marine Sci. 6: 315–325.

213
Kalk, M. (ed.), 1995. A Natural History of Inhaca Island. Witwater-srand University Press, Johannesburg, South Africa. 395 pp.
Keenan, C.P. and Blackshaw, A. 1999. Mud crab aquaculture andbiology. ACIAR Proc. 78: 1–216.
Lee, S.Y. 1997. Potential trophic importance of the faecal materialof the mangrove sesarmine crab Sesarma messa. Marine Ecol. –Prog. Ser. 159: 275–284.
Lee, S.Y. 1998. Ecological role of grapsid crabs in mangroveecosystems: a review. Marine Freshw. Res. 49: 335–343.
Macintosh, D.J. 1984. Ecology and productivity of Malaysian man-grove crab populations (Decapoda: Brachyura). In: Soepadmo,E., Rao, A.N. and Macintosh, D.J. (eds.), Proceedings of theAsian Symposium on Mangrove Environment, Research andManagement, pp. 354–377. Kuala Lumpur, 1984. University ofMalaya and UNESCO.
Macnae, W. 1968. A general account of the fauna and flora of man-grove swamps and forests in the Indo-west-Pacific region. Adv.Marine Biol. 6: 73–270.
Macnae, W. and Kalk, M. 1962. The ecology of the mangroveswamps at Inhaca Island, Mocambique. J. Ecol. 50: 19–34.
McIvor, C.C. and Smith, T.J. III. 1995. Differences in the crab faunaof mangrove areas of southwest Florida and a northeast Aus-tralia location: implications for leaf litter processing. Estuaries18: 591–597.
Micheli, F. 1993. Effect of mangrove litter species and availabilityon survival, moulting, and reproduction of the mangrove crabSesarma messa. J. Exp. Marine Biol. Ecol. 171: 149–163.
Micheli, F., Gherardi, F. and Vannini, M. 1991. Feeding and burrow-ing ecology of two East African mangrove crabs. Marine Biol.111: 247–254.
Robertson, A.I. and Daniel, P.A. 1989. The influence of crabs onlitter processing in high intertidal mangrove forests in tropicalAustralia. Oecologia 78: 191–198.
Skov, M.W. and Hartnoll, R.G. 2001. Comparative suitability ofbinocular observation, burrow counting and excavation for thequantification of the mangrove fiddler crab Uca annulipes (H.Milne Edwards). Hydrobiologia 449: 201–222.
Skov, M.W. and Hartnoll, R.G. 2002. Paradoxical selective feed-ing on a low nutrient diet. Why do mangrove crabs eat leaves?Oecologia 131: 1–7.
Vannini, M. and Ruwa, R.K. 1994. Vertical migrations in the treecrab Sesarma leptosoma (Decapoda, Grapsidae). Marine Biol.118: 271–278.

Copyright © 2022 FDOKUMEN