Chemistry and Properties of Nanocrystals of Different Shapes
Upload
independentCategory
view
1download
0
Genetic Variation Shapes Protein Networks Mainlythrough Non-transcriptional MechanismsEric J. Foss1, Dragan Radulovic2*, Scott A. Shaffer3, David R. Goodlett4, Leonid Kruglyak5, Antonio
Bedalov1*
1 Clinical Research Division, Fred Hutchinson Cancer Research Center and Department of Medicine, University of Washington School of Medicine, Seattle, Washington,
United States of America, 2 Department of Mathematical Sciences, Florida Atlantic University, Boca Raton, Florida, United States of America, 3 University of Massachusetts
Medical School, Worcester, Massachusetts, United States of America, 4 Department of Medicinal Chemistry, University of Washington, Seattle, Washington, United States
of America, 5 Lewis-Sigler Institute for Integrative Genomics and Department of Ecology and Evolutionary Biology, Princeton University, Princeton, New Jersey, United
States of America
Abstract
Networks of co-regulated transcripts in genetically diverse populations have been studied extensively, but little is knownabout the degree to which these networks cause similar co-variation at the protein level. We quantified 354 proteins in agenetically diverse population of yeast segregants, which allowed for the first time construction of a coherent protein co-variation matrix. We identified tightly co-regulated groups of 36 and 93 proteins that were made up predominantly of genesinvolved in ribosome biogenesis and amino acid metabolism, respectively. Even though the ribosomal genes were tightlyco-regulated at both the protein and transcript levels, genetic regulation of proteins was entirely distinct from that oftranscripts, and almost no genes in this network showed a significant correlation between protein and transcript levels. Thisresult calls into question the widely held belief that in yeast, as opposed to higher eukaryotes, ribosomal protein levels areregulated primarily by regulating transcript levels. Furthermore, although genetic regulation of the amino acid network wasmore similar for proteins and transcripts, regression analysis demonstrated that even here, proteins vary predominantly as aresult of non-transcriptional variation. We also found that cis regulation, which is common in the transcriptome, is rare atthe level of the proteome. We conclude that most inter-individual variation in levels of these particular high abundanceproteins in this genetically diverse population is not caused by variation of their underlying transcripts.
Citation: Foss EJ, Radulovic D, Shaffer SA, Goodlett DR, Kruglyak L, et al. (2011) Genetic Variation Shapes Protein Networks Mainly through Non-transcriptionalMechanisms. PLoS Biol 9(9): e1001144. doi:10.1371/journal.pbio.1001144
Academic Editor: Michael B. Eisen, University of California Berkeley, United States of America
Received January 3, 2011; Accepted July 29, 2011; Published September 6, 2011
Copyright: � 2011 Foss et al. This is an open-access article distributed under the terms of the Creative Commons Attribution License, which permits unrestricteduse, distribution, and reproduction in any medium, provided the original author and source are credited.
Funding: This work was funded by US National Institutes of Health grants UL1RR025014, CA015704, CA129132, UL1 RR025014 and 5 P30 CA015704 to AB; NIHgrant R33CA099139-04 to DRG; and R37 MH059520 to LK. LK is a James S. McDonnell Centennial Fellow and an investigator of the Howard Hughes MedicalInstitute. The funders had no role in study design, data collection and analysis, decision to publish, or preparation of the manuscript.
Competing Interests: The authors have declared that no competing interests exist.
* E-mail: [email protected] (DR); [email protected] (AB); (DR—to whom correspondence specifically related to protein quantitation algorithm should be addressed)
Introduction
Genetic variation leads to networks of co-regulated transcripts.
The implications of these network structures have been discussed
extensively, generally with the assumption that such transcription-
al networks give rise to corresponding protein networks [1–6].
However, due to limitations in technology, these hypothesized
protein networks have not been examined directly, and thus it is
not known whether they are driven by underlying transcriptional
networks. By measuring protein and transcript levels for 354 genes
in a genetically diverse population of yeast segregants, we are now
able to address the question ‘‘Are protein networks formed
primarily on the basis of regulation of their underlying
transcripts?’’ (We use the term ‘‘protein networks’’ to refer to
groups of proteins that are co-regulated and not groups of proteins
that interact physically or genetically.) Before describing our
results, three points are important to consider: First, the magnitude
of individual to individual variation in transcript levels for a single
gene is generally far less than the magnitude of gene to gene
variation in transcript levels within a single individual [7]. Second,
the demonstration in multiple studies that the correlation between
transcript and protein levels for different genes within a single
individual is high does not imply that differences in abundance of
the same transcripts between different individuals must cause
corresponding variation in protein abundance [8,9]. And third, a
correlation between transcript and protein networks does not
prove a causal relationship between the two.
Protein levels cannot necessarily be inferred from transcript
levels because protein levels can be controlled not only by
regulating transcripts but also by regulating other steps in protein
metabolism, such as translation and protein stability. Thus the
degree to which protein levels can be inferred from transcript
levels depends on the degree to which the former mode of
regulation overwhelms the latter two (Figure 1). In experimental
situations when a gene is placed under a strong promoter like the
CMV promoter, a transcript can be elevated 1,000-fold and this
generally leads to a striking increase in protein. However, in
genetically diverse populations, transcript levels generally do not
vary 1,000-fold between individuals; for example, in the
population of yeast described in this report, a typical transcript
varies just 2.7-fold across 95 individuals. Such modest variation in
transcript levels may be buffered such that it causes no variation in
protein levels, or regulation of translation and/or protein stability
may obscure effects of minor transcriptional variation. Under such
PLoS Biology | www.plosbiology.org 1 September 2011 | Volume 9 | Issue 9 | e1001144

circumstances, transcript levels should not be expected to reflect
protein levels, and whether such circumstances are the norm or
the exception for typical levels of inter-individual variation is not
known.
Several reports have demonstrated that, when comparing
different genes whose transcript levels vary over orders of
magnitude, high abundance proteins are associated with high
abundance transcripts and vice versa [8–10]. There are two
important differences between this issue and the issue we address
here: First, the magnitude of variation in transcript levels is vastly
different in the two situations. Just as 1,000-fold overexpression of
a transcript through experimental manipulation is virtually
guaranteed to increase the level of the corresponding protein,
transcript levels that differ by orders of magnitude between genes
are virtually guaranteed to manifest themselves in differences in
the corresponding proteins. For example, a 2007 study by Lu et al.
of 346 genes in yeast demonstrated a high correlation (R = 0.85)
between transcript and protein levels, and thus concluded that ‘‘…
.70% of yeast gene expression regulation [occurs] through
mRNA-directed mechanisms’’ [8]. However, if one calculates
correlation coefficients with this same data set using a sliding
window within which transcript levels vary on average just 3.5-
fold, the average correlation drops from 0.85 to 0.36 with almost
half of the bins showing correlation coefficients that could easily
have been achieved by chance (Figure S1, Text S1). Thus, the
striking correlation between transcripts and proteins all but
disappears when analysis is limited to a range of transcript
variation similar to that occurring between individuals. Second, as
we will discuss further below, studies like that of Lu et al. involve
protein and transcript measurements from a single individual
under a single experimental condition, making it impossible to
measure gene-specific correlation coefficients (Figure S2). The
point here is not to call into question the solid conclusions of these
past reports, but instead to point out that our work addresses a
different issue.
In assessing the importance of transcriptional regulation in
determining protein levels, it is important to distinguish correlation
from causality. Biological pathways that sense physiological
conditions can trigger responses that include changes in transcrip-
tion, translation, and protein stability, often with the same group
of genes targeted by more than one of these regulatory
mechanisms [11]. For example, the TOR pathway, a highly
conserved pathway named for the signaling kinase ‘‘Target of
Rapamycin,’’ responds to changes in nutritional conditions by
increasing both transcription and translation of a group of target
genes [12,13]. Thus transcript and protein levels of these genes will
be correlated, but if translation has a much larger effect on protein
levels than does transcription, this correlation need not reflect
causality. More generally, any time a cellular response pathway
has both a transcriptional and a post-transcriptional branch, the
target genes are expected to show a correlation between transcript
and protein levels, but it is only in those cases where the former
regulatory mechanism is the dominant one in affecting protein
levels that this correlation reflects a predominantly causal
relationship between transcript and protein levels (Figure 1).
Results
Protein QuantitationWe have previously reported a mass spectrometry-based
method for protein quantitation that relies on mathematical
alignment of ion signals in mass spectra (MS1) from multiple
samples [14,15]. This algorithm rounded mass to charge
measurements to integer ‘‘Dalton’’ values, which has the
advantage of making the data sets much smaller than they would
be if one made full use of the high mass accuracy of modern mass
spectrometers (like that on which the data were collected) and thus
avoids computational difficulties that arise with large data sets.
However, such rounding sacrifices accuracy to the extent that our
previous quantitation, while sufficient for obtaining a broad view
of the genetic architecture of protein expression, was insufficient in
terms of both accuracy and coverage to rigorously address the
causal relationship between variation in transcript levels and
Figure 1. Three possibilities for regulating protein levels.Protein levels can be regulated through control of transcript levels,translation, and protein stability. The weight of the arrows hereindicates the size of the effect. In this example in which protein levelsare controlled primarily non-transcriptionally, there will nonetheless bea correlation between protein and transcript levels.doi:10.1371/journal.pbio.1001144.g001
Author Summary
The level of protein produced by each gene correspondsapproximately to the level of mRNA transcript producedby that gene: so high-abundance proteins, like thoseinvolved in protein synthesis, are represented by high-abundance transcripts, whereas low-abundance proteins,like those involved in signaling pathways, are representedby low-abundance transcripts. Furthermore, genetic vari-ation can cause variation in transcript levels for the samegene between different individuals. These two observa-tions have led to the assumption that inter-individualvariation in transcript levels for any particular gene causescorresponding variation in protein levels. However, thisneed not be the case, because protein levels could becontrolled not only by regulating transcript levels but alsoby regulating protein translation and stability. Becauseinter-individual variation in the levels of the transcript forany particular gene is typically less than 3-fold, rather thanorders of magnitude, it is possible that the predominantcause of inter-individual variation in levels of any particularprotein is transcription-independent regulation of proteinlevels. Here, we look in a genetically diverse population of95 yeast strains at the genetic variation that leads in turnto variation in levels of 354 proteins that function withinco-regulated networks. We find that the between-strainvariation predominantly reflects transcription-independentmechanisms. If this result is typical of the proteome as awhole, it suggests that protein levels in genetically diversepopulations cannot be accurately inferred from levels oftheir underlying transcripts.
Genetic Variation and Protein Networks
PLoS Biology | www.plosbiology.org 2 September 2011 | Volume 9 | Issue 9 | e1001144
variation in the corresponding proteins. To overcome the
limitations of our previous algorithm, we used a modification of
an accelerated random search [16] to solve computational
challenges and developed a new protein quantitation algorithm
that exploits the high mass accuracy and resolution of modern
mass spectrometers (Text S1). We then used this algorithm to
reanalyze our previously reported [14] mass spectrometric data,
aligning 380 data sets: two technical replicates of two biological
replicates for each of 95 progeny strains derived from a cross
between a wild type and a laboratory strain of yeast [17]. These
two strains differ at approximately 0.5% of their base pairs [18],
and this cross has been studied extensively [19–21]. Restricting
ourselves to peptides that were identified with high confidence
(Text S1) and that corresponded uniquely to one protein, we
quantified 354 proteins (Table S1). This is more than twice the
number of unique peptides (164) we were able to quantify in our
previous report [14].
If one is to assess the effect of transcriptional variation on the
proteome, it is necessary to focus on transcripts that show
significant individual-to-individual variation. With measurements
for only 354 proteins, constituting less than 6% of the proteome,
we were concerned that the corresponding transcripts might not
show significant individual-to-individual variation; thus we looked
at variance of the transcripts in question (transcript data previously
reported [17]). The 354 genes for which we had protein
measurements were all among the most highly variant ,10%
(522/6,215) of all transcripts. Thus this subset of proteins is not
merely sufficiently variable for our study; it comprises almost 70%
(354/522) of the ideal genes on which to focus for our purposes.
We speculate that this fortuitous result reflects the fact that we are
best able to measure high abundance proteins, and thus our data
set is enriched for accurately measured high abundance transcripts
as well. (Levels of highly abundant proteins tend to be less variable
than low abundance proteins [22]; therefore it is unlikely that the
high variance of this set of proteins is a reflection of their
abundance.) We note, however, that this is a special set of proteins
in that they are mostly high abundance proteins involved directly
or indirectly with protein synthesis and thus they may not be
representative of the proteome as a whole.
Construction of Genetic NetworksWe next constructed a connectivity matrix between proteins on
the basis of Pearson’s correlation coefficient. For each pair of
proteins, we used permutation testing to determine a false positive
rate (FPR) cutoff, accepting only connections that were below a
1% FPR cutoff. Out of 62,481 possible protein-protein connec-
tions, we observed 7,058 connections, 91% of which were deemed
genuine because we expect only 625 connections by chance. The
numbers of connections for individual proteins ranged from 1 to
100, with an average of 40 and a median of 37. For transcripts, we
observed 15,989 connections out of 62,481 possible. For individual
genes, the transcript numbers ranged from 4 to 176, with an
average of 90 and a median of 76. Among the 50 most highly
connected proteins, there was a 1.9-fold enrichment for genes
involved in amino acid biosynthesis, and among the 50 most
highly connected transcripts, there was a 2.7-fold enrichment of
genes involved in ribosomal functions, but enrichment for other
functions was not obvious. Remarkably, the most highly connected
genes for proteins and transcripts look entirely unrelated. For
example, among the 34 most highly connected genes in the two
groups, there are only two genes present in both groups (RPS7A
and TEF4). A global comparison suggests that connectivity of
genes at the transcriptional level is unrelated to their connectivity
at the protein level (Figure S3).
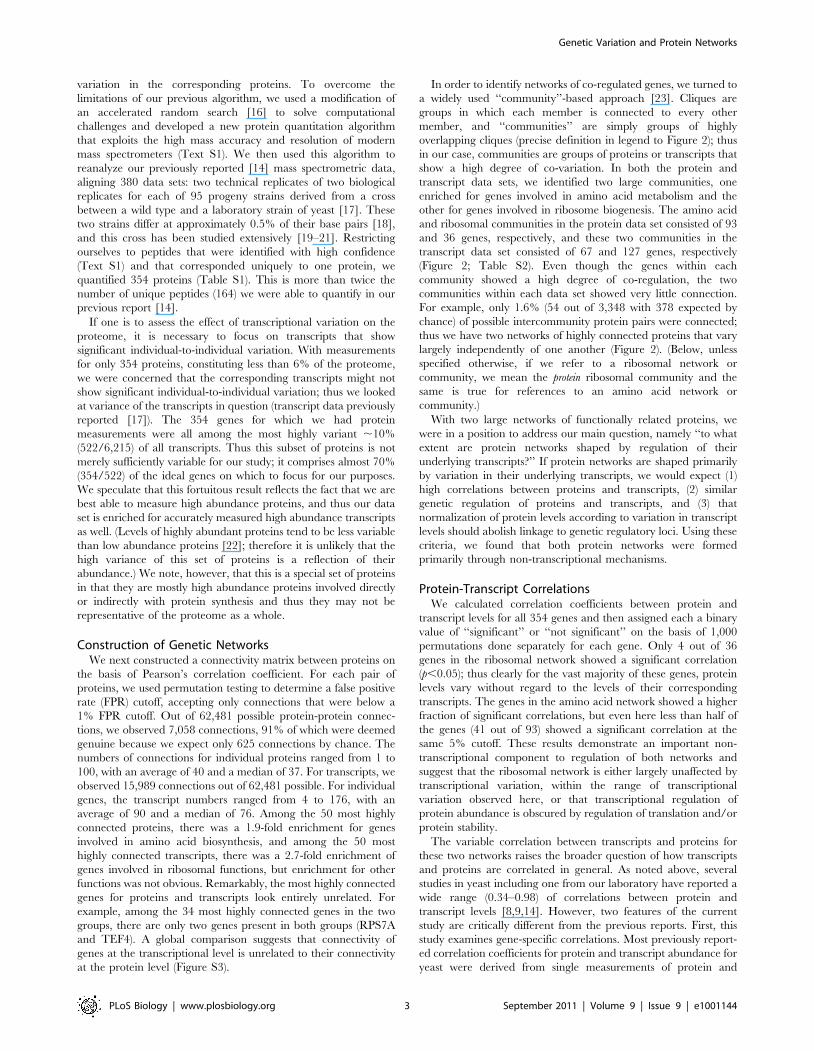
In order to identify networks of co-regulated genes, we turned to
a widely used ‘‘community’’-based approach [23]. Cliques are
groups in which each member is connected to every other
member, and ‘‘communities’’ are simply groups of highly
overlapping cliques (precise definition in legend to Figure 2); thus
in our case, communities are groups of proteins or transcripts that
show a high degree of co-variation. In both the protein and
transcript data sets, we identified two large communities, one
enriched for genes involved in amino acid metabolism and the
other for genes involved in ribosome biogenesis. The amino acid
and ribosomal communities in the protein data set consisted of 93
and 36 genes, respectively, and these two communities in the
transcript data set consisted of 67 and 127 genes, respectively
(Figure 2; Table S2). Even though the genes within each
community showed a high degree of co-regulation, the two
communities within each data set showed very little connection.
For example, only 1.6% (54 out of 3,348 with 378 expected by
chance) of possible intercommunity protein pairs were connected;
thus we have two networks of highly connected proteins that vary
largely independently of one another (Figure 2). (Below, unless
specified otherwise, if we refer to a ribosomal network or
community, we mean the protein ribosomal community and the
same is true for references to an amino acid network or
community.)
With two large networks of functionally related proteins, we
were in a position to address our main question, namely ‘‘to what
extent are protein networks shaped by regulation of their
underlying transcripts?’’ If protein networks are shaped primarily
by variation in their underlying transcripts, we would expect (1)
high correlations between proteins and transcripts, (2) similar
genetic regulation of proteins and transcripts, and (3) that
normalization of protein levels according to variation in transcript
levels should abolish linkage to genetic regulatory loci. Using these
criteria, we found that both protein networks were formed
primarily through non-transcriptional mechanisms.
Protein-Transcript CorrelationsWe calculated correlation coefficients between protein and
transcript levels for all 354 genes and then assigned each a binary
value of ‘‘significant’’ or ‘‘not significant’’ on the basis of 1,000
permutations done separately for each gene. Only 4 out of 36
genes in the ribosomal network showed a significant correlation
(p,0.05); thus clearly for the vast majority of these genes, protein
levels vary without regard to the levels of their corresponding
transcripts. The genes in the amino acid network showed a higher
fraction of significant correlations, but even here less than half of
the genes (41 out of 93) showed a significant correlation at the
same 5% cutoff. These results demonstrate an important non-
transcriptional component to regulation of both networks and
suggest that the ribosomal network is either largely unaffected by
transcriptional variation, within the range of transcriptional
variation observed here, or that transcriptional regulation of
protein abundance is obscured by regulation of translation and/or
protein stability.
The variable correlation between transcripts and proteins for
these two networks raises the broader question of how transcripts
and proteins are correlated in general. As noted above, several
studies in yeast including one from our laboratory have reported a
wide range (0.34–0.98) of correlations between protein and
transcript levels [8,9,14]. However, two features of the current
study are critically different from the previous reports. First, this
study examines gene-specific correlations. Most previously report-
ed correlation coefficients for protein and transcript abundance for
yeast were derived from single measurements of protein and
Genetic Variation and Protein Networks
PLoS Biology | www.plosbiology.org 3 September 2011 | Volume 9 | Issue 9 | e1001144
transcript levels for many genes in a single strain, and these
individual measurements for different genes were combined to
derive an average correlation coefficient. The correlation coeffi-
cients we report here, in contrast, are derived from 95
measurements of protein-transcript pairs for each of 354 different
genes (Figure S2). This is important because there are dramatic
differences in the degree to which different genes are regulated at
the transcript level versus the protein level. Second, while our
previous study reported gene-specific correlation coefficients [14],
we did not emphasize these results because our marginal ability to
map protein regulators raised the possibility that these low
correlation coefficients reflected inaccuracies in our protein
measurements (see below for mapping results). (The ability to
map significant numbers of regulators can be used as a metric to
assess accuracy of measurements when FDRs are empirically
determined through permutation testing [24].)
We found that proteins and transcripts were well correlated for
only 27% of genes (94/354 at 5% significance; Table S3), with
most genes showing little or no correlation. Even if we limit
ourselves to proteins for which we mapped regulators (p,0.05; see
below for mapping results) and thus have high confidence in our
protein measurements, only 37% of genes (46/125) show
Figure 2. Networks of protein-protein and transcript-transcript co-regulation. Communities are defined on the basis of k-cliques, complete(and in our case undirected) subgraphs of size k, and are comprised of the union of all k-cliques that can be reached from each other through a seriesof adjacent k-cliques (where adjacency means sharing k21 nodes). The most stringently defined (highest k value) protein community was a 35-cliquecommunity notably enriched for genes involved in amino acid metabolism. Lowering the k threshold to 19 simply expanded this community whereasat k = 18, there appeared five closely related communities (which we will henceforth refer to as a single community) that were enriched for ribosomalproteins. An analogous approach with transcripts yielded communities of 67 and 127 genes involved in amino acid metabolism and ribosomebiogenesis, respectively. No gene was in both protein communities and just two genes were in both transcript communities. Communities of co-regulated proteins are on the left in blue and communities of co-regulated transcripts are on the right in green. In both data sets, the ribosomalcommunity is above the amino acid community. Connections are plotted only for the 160 most highly connected genes within each data set,regardless of those genes’ membership in any community. The two genes that are present in both transcript communities, VAS1 and YHR020W, arearbitrarily plotted in the ribosomal community and connections involving these genes are not plotted.doi:10.1371/journal.pbio.1001144.g002
Genetic Variation and Protein Networks
PLoS Biology | www.plosbiology.org 4 September 2011 | Volume 9 | Issue 9 | e1001144
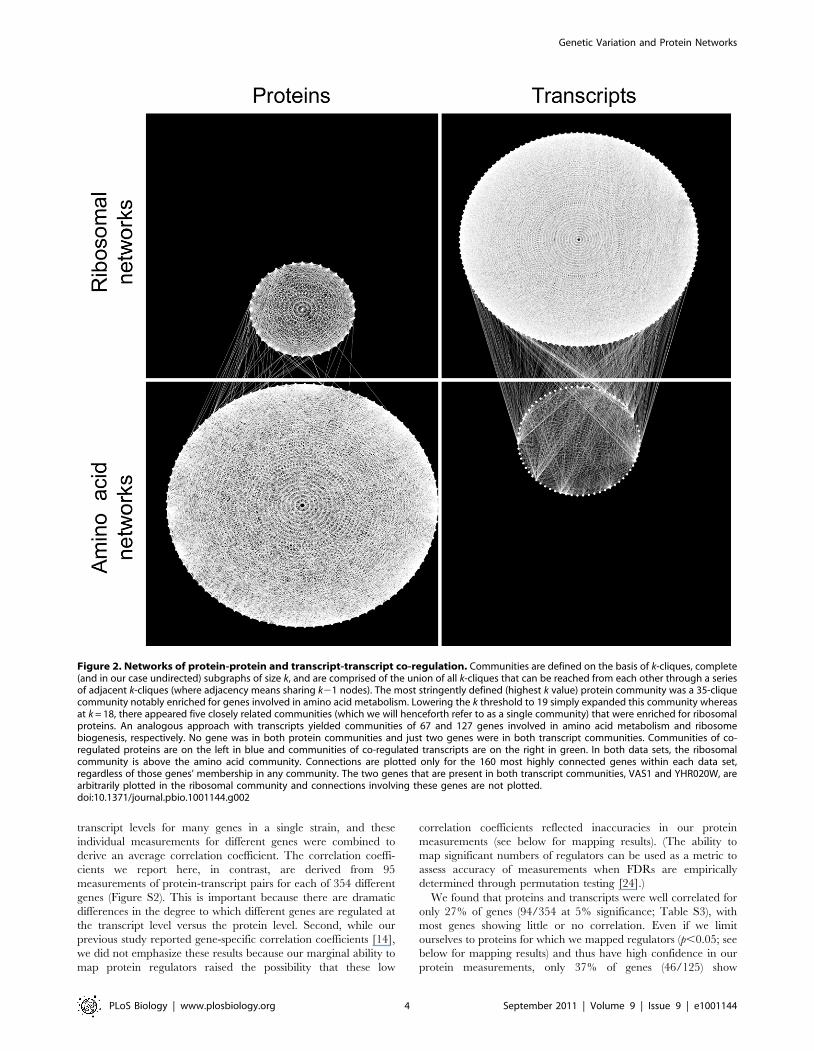
significant correlations between proteins and transcripts. Further-
more, we could find no relationship between these correlation
coefficients and the corresponding genes’ transcript or protein half
life [25,26]. Plotting the data in terms of variance explained for
transcripts and proteins similarly failed to reveal trends (unpub-
lished data). We conclude that for most genes, inter-individual
variation in protein levels does not reflect variation in underlying
transcripts (Figure 3A).
Genetic Regulation of NetworksTo compare the genetic regulation of the two protein networks,
we began by mapping loci that affect transcript and/or protein
levels. (We note that heritability for proteins, like that for
transcripts, was high: averages for proteins and transcripts were
0.70 and 0.71, respectively, and medians for proteins and
transcripts were 0.71 and 0.74, respectively; calculation described
in Materials and Methods.) All strains have been genotyped for
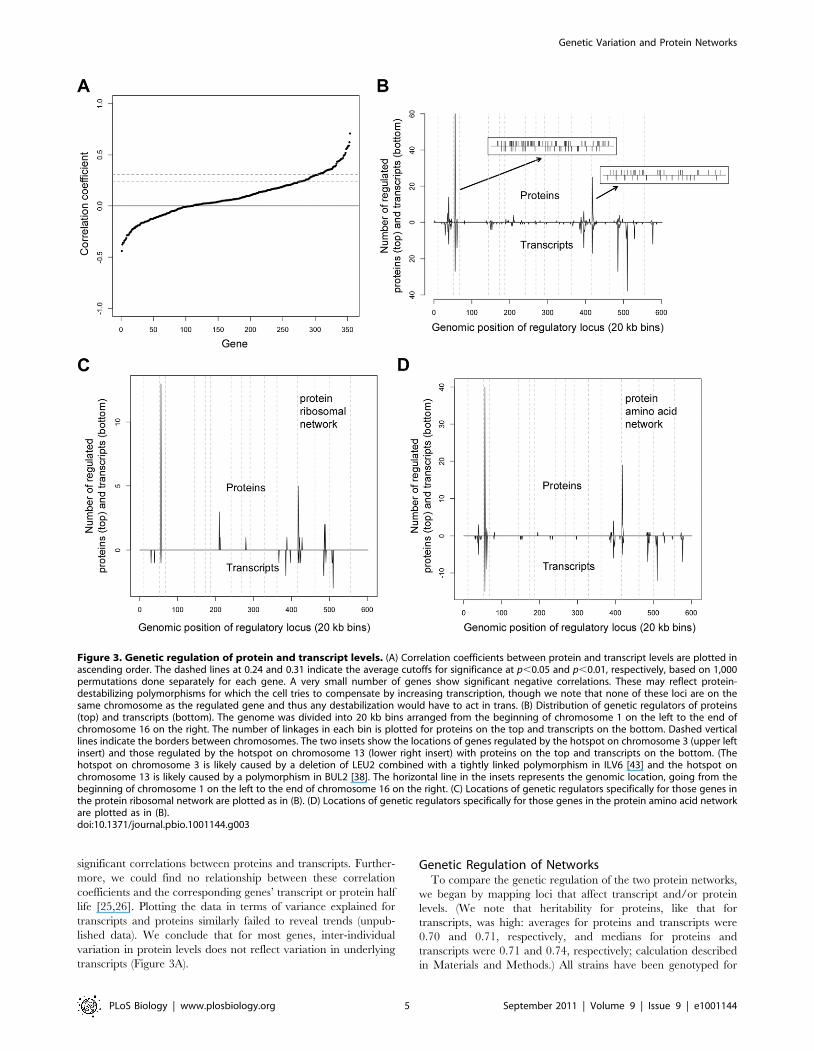
Figure 3. Genetic regulation of protein and transcript levels. (A) Correlation coefficients between protein and transcript levels are plotted inascending order. The dashed lines at 0.24 and 0.31 indicate the average cutoffs for significance at p,0.05 and p,0.01, respectively, based on 1,000permutations done separately for each gene. A very small number of genes show significant negative correlations. These may reflect protein-destabilizing polymorphisms for which the cell tries to compensate by increasing transcription, though we note that none of these loci are on thesame chromosome as the regulated gene and thus any destabilization would have to act in trans. (B) Distribution of genetic regulators of proteins(top) and transcripts (bottom). The genome was divided into 20 kb bins arranged from the beginning of chromosome 1 on the left to the end ofchromosome 16 on the right. The number of linkages in each bin is plotted for proteins on the top and transcripts on the bottom. Dashed verticallines indicate the borders between chromosomes. The two insets show the locations of genes regulated by the hotspot on chromosome 3 (upper leftinsert) and those regulated by the hotspot on chromosome 13 (lower right insert) with proteins on the top and transcripts on the bottom. (Thehotspot on chromosome 3 is likely caused by a deletion of LEU2 combined with a tightly linked polymorphism in ILV6 [43] and the hotspot onchromosome 13 is likely caused by a polymorphism in BUL2 [38]. The horizontal line in the insets represents the genomic location, going from thebeginning of chromosome 1 on the left to the end of chromosome 16 on the right. (C) Locations of genetic regulators specifically for those genes inthe protein ribosomal network are plotted as in (B). (D) Locations of genetic regulators specifically for those genes in the protein amino acid networkare plotted as in (B).doi:10.1371/journal.pbio.1001144.g003
Genetic Variation and Protein Networks
PLoS Biology | www.plosbiology.org 5 September 2011 | Volume 9 | Issue 9 | e1001144

2,955 genetic markers, 1,969 of which exhibited unique
segregation patterns among the 95 segregant strains. We looked
for linkage between inheritance of these 1,969 markers and the
354 transcript and protein levels using t tests and determined FDR
cutoffs for each gene on the basis of 100 permutations. At a 5%
FDR, we mapped 49 and 97 loci that control the level of a total of
125 and 200 proteins and transcripts, respectively. At a 1% FDR,
we mapped 30 and 74 loci that control levels of 89 and 170
proteins and transcripts, respectively (Table S4). Because proteins
and transcripts can map to more than one locus, the total number
of linkages at a 5% FDR was 179 for proteins and 342 for
transcripts, and at a 1% FDR these numbers were 115 and 253,
respectively. These results provide an objective metric for the
extent to which our current algorithm (i.e., the one used in this
report) has improved our accuracy: At a 5% FDR, our previous
algorithm [14] allowed us to map 24 regulators that regulate levels
of 18 proteins, whereas the current algorithm allowed us to map
179 regulators that regulate levels of 125 proteins. (We use the
term ‘‘regulator’’ to denote a locus that influences transcript and/
or protein levels.) With comparable measurements for proteins
and transcripts, we are now able to address questions about the
relationship between the two data sets that we could not address in
our previous publication [14]. Consistent with our previous results,
we found that (1) both proteins and transcripts show hot spots of
regulation (single loci that control multiple genes), (2) these hot
spots are largely but not completely overlapping, and (3) the genes
regulated by a single hot spot show low overlap at the protein and
transcript levels, highlighting the difference between genetic
regulation of the proteome and transcriptome (Figure 3B).
The locations of the genetic regulators that control proteins and
transcripts within the ribosomal network bore essentially no
resemblance to each other; indeed, given the overall distribution of
regulatory loci for proteins and transcripts, loci that regulated both
proteins and transcripts within this network appeared much less
frequently than is expected by chance (p,0.0001 based on 10,000
permutations; Figure 3C). These results call into question the widely
held belief that in yeast, in contrast to vertebrates, ribosomal protein
levels are controlled primarily by regulation of their transcripts [27].
(We note that genetic regulation of the ribosomal transcripts is
complex, i.e. a large number of loci, each with relatively small effect.)
The locations of genetic regulators of proteins and transcripts were
more similar for genes in the amino acid network: Approximately a
quarter of the time (20 out of 84 linkages, corresponding to 17
different regulated genes), protein linkages (5% FDR) to genes in the
amino acid network showed regulation of the corresponding
transcript by the same locus. Below we ask whether, at least for
these 20 linkages, the mechanism by which the loci regulate the
proteins is regulation of their underlying transcripts.
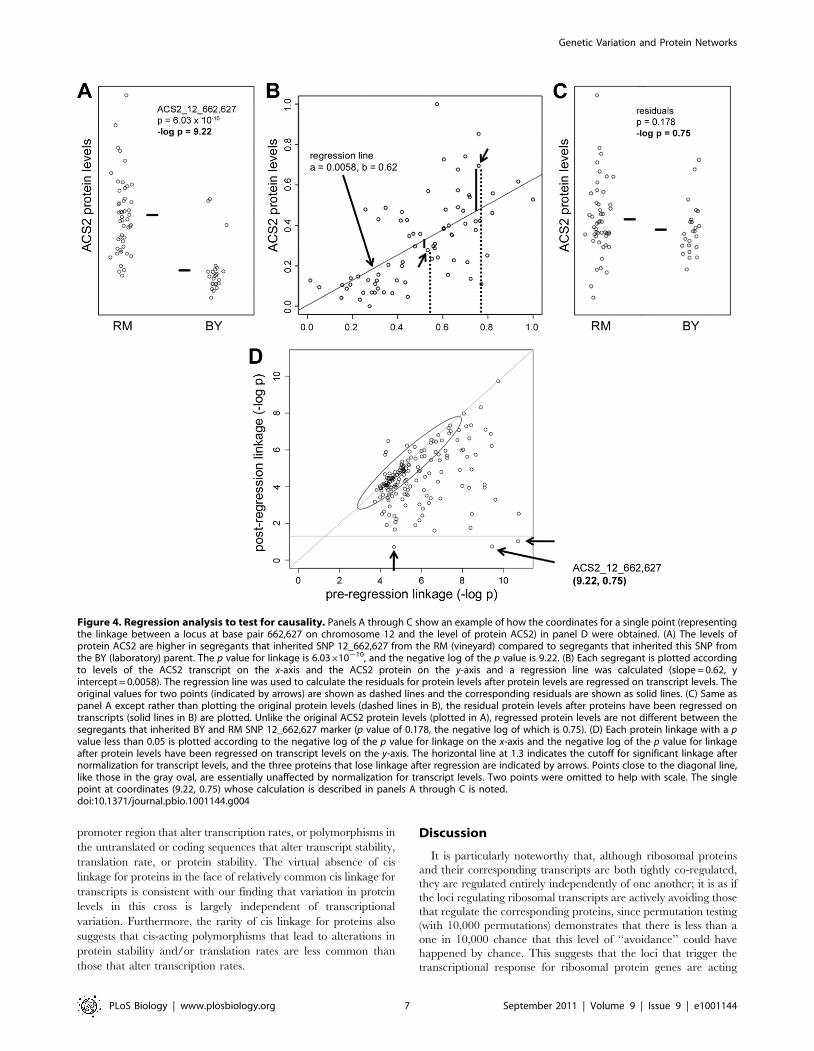
Normalization to Transcript Levels to Test CausalityThis subset of 20 linkages comprise the most likely examples of
loci that control the levels of proteins in the protein amino acid
network primarily by controlling the underlying transcripts, but
even here it is possible that transcription is not the main driver of
protein levels. For example, a response to alterations in cellular
physiology created by polymorphisms on chromosomes 3 and 13
may include both a transcriptional response of a specific set of
genes and changes in the translation of the corresponding
transcripts and/or stability of the corresponding proteins.
Multilevel control (i.e. transcriptional and posttranscriptional) of
the same genes is a well-described phenomenon in response to
environmental changes and in development that assures the
magnitude and rapidity of response and that reinforces cellular
decisions [28,29]. If the translational or protein stability changes
have a larger effect on protein levels than the transcriptional
alterations, one would still see shared genetic regulation and high
correlation coefficients, but the protein network would not be
driven primarily by transcription (Figure 1). To distinguish
between these possibilities, we asked whether these 20 linkages
for proteins in the amino acid network maintained linkage after
normalizing for transcript levels [30]. For each of the proteins and
the sites to which they are linked, such as ACS2 to chromosome
12, which is shown as an example (Figure 4A), protein levels were
regressed on the corresponding transcript levels (Figure 4B), the
residuals were tested for linkage to the original loci (Figure 4C),
and residual linkage was plotted against the original linkage
(Figure 4D). In the case of ACS2, it is clear that the locus on
chromosome 12 is regulating ACS2 protein levels by regulating
transcript levels, because the tight linkage between the locus and
protein levels (p = 6.03610210, Figure 4A) becomes insignificant
when the effect of the locus on transcript levels is taken into
account (p = 0.178, Figure 4C). Two other linkages also behaved
this way; thus a total of three out of the 20 protein linkages
examined appear to reflect primarily transcriptional regulation of
protein levels (three points below horizontal line at 2log 0.05 in
Figure 4D, in which all protein linkages have been plotted). Two of
these three map to the transcription factor HAP1, which is
inactivated in the laboratory parent by a Ty element insertion.
These two genes, ACS2 and ERG6, are both regulated by HAP1
and both have upstream HAP1 binding sites that are among the
most tightly HAP1-bound sites in the genome, thus suggesting a
mechanism for transcript-mediated regulation of these two
proteins [31]. Extending this test for transcript-mediated control
of protein levels to all 179 protein linkages (p = 0.05) shows that the
three cases mentioned above are the only instances in which
control of protein levels can be attributed exclusively to control of
the corresponding transcript (Figure 4D).
Comparison of Cis-Regulation for Proteome andTranscriptome
Quantitative trait loci that affect transcript levels have been
classified according to whether the regulated gene is linked (cis-
regulation) or unlinked (trans-regulation) to the regulatory locus.
For example a promoter mutation would be classified as cis-
regulatory whereas a mutation in a transcription factor would
likely appear as trans-regulatory. Consistent with numerous
reports in both this collection of yeast strains and other
populations [32–34], we find that at the transcript level, cis
regulation of the 354 genes in this study is relatively common
(Figure 5): at 1% FDR, we map regulators of 170 transcripts, 22 of
which act in cis. In contrast, at this FDR we map regulators of 89
proteins, only three of which act in cis (Figure 5). t tests between
each gene and a single cis marker to reduce the problem of
multiple testing confirmed the wider prevalence of cis linkage in
the transcriptome over the proteome: At a 1% significance, 50
transcripts show linkage to the nearest marker whereas only 13
proteins do. Normalizing for the 3.54 false positives expected
suggests approximately 5-fold more cis linkage for transcripts than
for proteins. As others have noted, we saw that cis regulators
tended to have above average effect sizes and therefore should be
easier to detect; for example, cis linkages at 1% significance
explained on average 29% of variation in transcript levels whereas
the corresponding trans linkages explained only 24%. Thus if
variation in protein levels between individuals were caused by
variation in the underlying transcripts, inaccurate measurements
of either proteins or transcripts would lead to an overestimate of
cis linkage, whereas we see the opposite. Cis linkage for transcript
and protein abundance can be due to polymorphisms in the
Genetic Variation and Protein Networks
PLoS Biology | www.plosbiology.org 6 September 2011 | Volume 9 | Issue 9 | e1001144
promoter region that alter transcription rates, or polymorphisms in
the untranslated or coding sequences that alter transcript stability,
translation rate, or protein stability. The virtual absence of cis
linkage for proteins in the face of relatively common cis linkage for
transcripts is consistent with our finding that variation in protein
levels in this cross is largely independent of transcriptional
variation. Furthermore, the rarity of cis linkage for proteins also
suggests that cis-acting polymorphisms that lead to alterations in
protein stability and/or translation rates are less common than
those that alter transcription rates.
Discussion
It is particularly noteworthy that, although ribosomal proteins
and their corresponding transcripts are both tightly co-regulated,
they are regulated entirely independently of one another; it is as if
the loci regulating ribosomal transcripts are actively avoiding those
that regulate the corresponding proteins, since permutation testing
(with 10,000 permutations) demonstrates that there is less than a
one in 10,000 chance that this level of ‘‘avoidance’’ could have
happened by chance. This suggests that the loci that trigger the
transcriptional response for ribosomal protein genes are acting
Figure 4. Regression analysis to test for causality. Panels A through C show an example of how the coordinates for a single point (representingthe linkage between a locus at base pair 662,627 on chromosome 12 and the level of protein ACS2) in panel D were obtained. (A) The levels ofprotein ACS2 are higher in segregants that inherited SNP 12_662,627 from the RM (vineyard) compared to segregants that inherited this SNP fromthe BY (laboratory) parent. The p value for linkage is 6.03610210, and the negative log of the p value is 9.22. (B) Each segregant is plotted accordingto levels of the ACS2 transcript on the x-axis and the ACS2 protein on the y-axis and a regression line was calculated (slope = 0.62, yintercept = 0.0058). The regression line was used to calculate the residuals for protein levels after protein levels are regressed on transcript levels. Theoriginal values for two points (indicated by arrows) are shown as dashed lines and the corresponding residuals are shown as solid lines. (C) Same aspanel A except rather than plotting the original protein levels (dashed lines in B), the residual protein levels after proteins have been regressed ontranscripts (solid lines in B) are plotted. Unlike the original ACS2 protein levels (plotted in A), regressed protein levels are not different between thesegregants that inherited BY and RM SNP 12_662,627 marker (p value of 0.178, the negative log of which is 0.75). (D) Each protein linkage with a pvalue less than 0.05 is plotted according to the negative log of the p value for linkage on the x-axis and the negative log of the p value for linkageafter protein levels have been regressed on transcript levels on the y-axis. The horizontal line at 1.3 indicates the cutoff for significant linkage afternormalization for transcript levels, and the three proteins that lose linkage after regression are indicated by arrows. Points close to the diagonal line,like those in the gray oval, are essentially unaffected by normalization for transcript levels. Two points were omitted to help with scale. The singlepoint at coordinates (9.22, 0.75) whose calculation is described in panels A through C is noted.doi:10.1371/journal.pbio.1001144.g004
Genetic Variation and Protein Networks
PLoS Biology | www.plosbiology.org 7 September 2011 | Volume 9 | Issue 9 | e1001144

through one pathway while the loci that trigger the corresponding
translational (or protein stability) response are acting through
another. The pathways that regulate transcription of ribosomal
protein genes have been studied extensively. For example,
nutrients activate the TOR and PKA pathways, which leads to
phosphorylation of Sch9 and Sfp1. This increases the levels of
Sch9 and causes Sfp1 to enter the nucleus, and this in turn triggers
Fhl1- and Ifh1-dependent transcription of ribosomal protein and
biogenesis genes [35,36]. Thus the loci that regulate transcripts in
the ribosomal community are likely perturbing intracellular
physiology in a way that elicits a TOR and/or PKA signaling
response.
So which pathway might regulate the translational (or protein
stability) response that influences ribosomal protein levels? The
loci that regulate the protein levels for genes in the protein
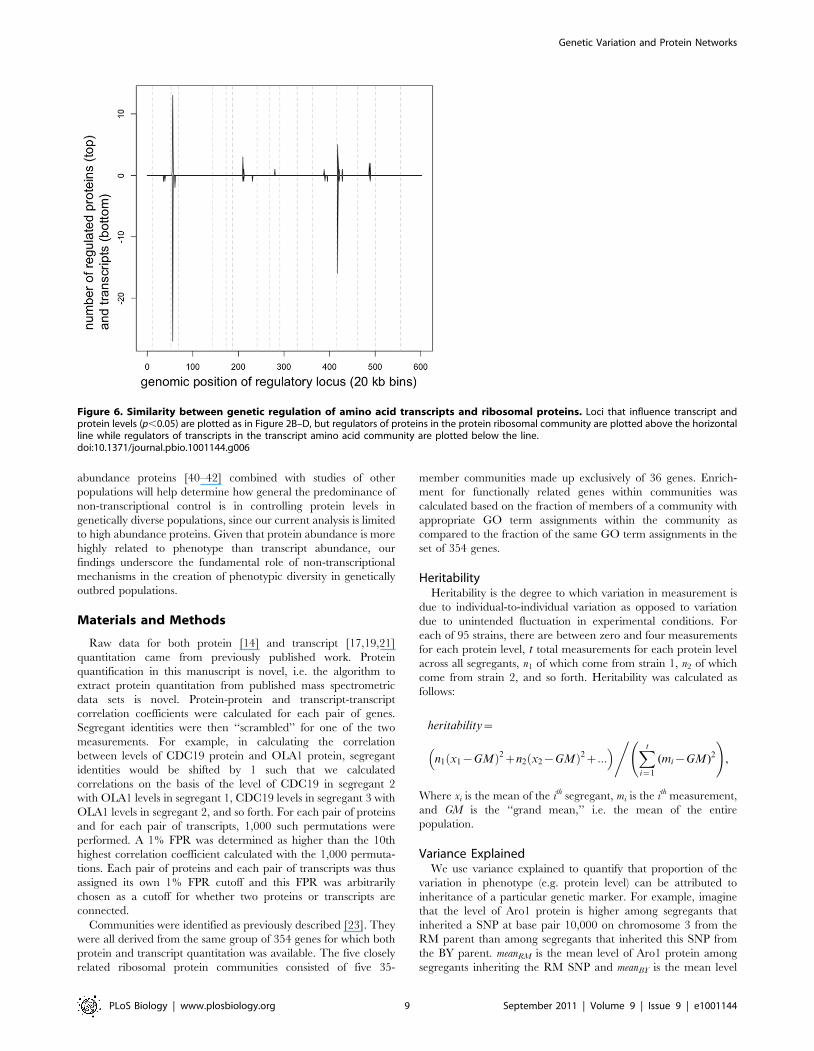
ribosomal community (upper left in Figure 2) showed a striking
resemblance to the loci that regulate transcripts in the transcript
amino acid community (lower right in Figure 2; Figure 6),
suggesting that these two networks are regulated by a common
pathway. Furthermore, the major loci that regulate these genes on
chromosomes 3 and 13 had diametrically opposing effects on the
two groups; i.e. one allele of chromosome 3 caused essentially
every amino acid transcript (65/67) to increase while also causing
every ribosomal protein (36/36) to decrease, and the same was
true for the locus on chromosome 13. Thus it appears that a single
pathway is causing ribosomal proteins and amino acid transcripts
to vary in opposition to each other. Our search for a pathway that
regulates ribosomal protein translation therefore led us to consider
pathways that affect transcription of genes involved in amino acid
synthesis. The general amino acid control pathway (GAAC)
responds to amino acid imbalances (sensed through levels of
uncharged tRNAs) by activating Gcn2, which then phosphorylates
the translation initiation factor eIF2A. This phosphorylation
causes eIF2A to downregulate translation of a large number of
genes while simultaneously promoting translation of the transcrip-
tion factor GCN4, which in turn stimulates transcription of genes
involved in amino acid synthesis [37]. Thus we suggest that loci on
chromosomes 3 and 13 skew levels of uncharged tRNAs leading to
a GAAC-dependent response that includes increasing transcrip-
tion (via GCN4) of genes involved in amino acid biosynthesis and
decreasing translation of ribosomal proteins. Likely candidate
genes are LEU2 on chromosome 3, which is involved in leucine
biosynthesis and is heterozygous in this cross and BUL2 on
chromosome 13, which regulates amino acid import and is also
heterozygous in this cross [38]. mRNAs encoding ribosomal
proteins in higher eukaryotes have 59 terminal oligopyrimidine
tracts that are critical in regulating translation and thus protein
levels [39]. The fact that yeast lack these so-called TOP mRNAs
coupled with the observation that ribosomal protein transcripts in
yeast are tightly regulated by the TOR signaling pathway [35,36]
has led to the widespread belief that yeast are different from other
eukaryotes in that they regulate ribosomal protein levels primarily
through transcription. Our observations suggest an important
translational role for control of ribosomal protein levels in yeast,
just like in vertebrates.
In summary, our results reveal striking differences in the effect
of genetic variation on networks of proteins versus transcripts. Our
results demonstrate that, in this genetically diverse population,
levels of variation in transcripts are such that non-transcriptional
mechanisms for controlling protein levels obscure the correlation
between transcripts and proteins for most genes. This is not a
consequence of selecting a subset of 354 genes whose transcripts
were biased for low variance; on the contrary, every one of these
transcripts was among the 522 with the highest variance,
suggesting that even among highly variant transcripts, non-
transcriptional variation is the predominant cause for variation
in protein levels in this population. Finally, advances in proteome
profiling technologies that enable high throughput profiling of low
Figure 5. cis-linkage for the proteome versus the transcriptome. Each transcript linkage (p,0.05) is plotted on the left according to thelocation of the regulatory locus on the x-axis and the regulated gene on the y-axis, and the same is done for proteins on the right. Vertical stripsindicate hot spots and points falling on the diagonal (gray line) indicate cis-linkage, i.e. the location of the genetic regulator is the same as that of theregulated gene.doi:10.1371/journal.pbio.1001144.g005
Genetic Variation and Protein Networks
PLoS Biology | www.plosbiology.org 8 September 2011 | Volume 9 | Issue 9 | e1001144
abundance proteins [40–42] combined with studies of other
populations will help determine how general the predominance of
non-transcriptional control is in controlling protein levels in
genetically diverse populations, since our current analysis is limited
to high abundance proteins. Given that protein abundance is more
highly related to phenotype than transcript abundance, our
findings underscore the fundamental role of non-transcriptional
mechanisms in the creation of phenotypic diversity in genetically
outbred populations.
Materials and Methods
Raw data for both protein [14] and transcript [17,19,21]
quantitation came from previously published work. Protein
quantification in this manuscript is novel, i.e. the algorithm to
extract protein quantitation from published mass spectrometric
data sets is novel. Protein-protein and transcript-transcript
correlation coefficients were calculated for each pair of genes.
Segregant identities were then ‘‘scrambled’’ for one of the two
measurements. For example, in calculating the correlation
between levels of CDC19 protein and OLA1 protein, segregant
identities would be shifted by 1 such that we calculated
correlations on the basis of the level of CDC19 in segregant 2
with OLA1 levels in segregant 1, CDC19 levels in segregant 3 with
OLA1 levels in segregant 2, and so forth. For each pair of proteins
and for each pair of transcripts, 1,000 such permutations were
performed. A 1% FPR was determined as higher than the 10th
highest correlation coefficient calculated with the 1,000 permuta-
tions. Each pair of proteins and each pair of transcripts was thus
assigned its own 1% FPR cutoff and this FPR was arbitrarily
chosen as a cutoff for whether two proteins or transcripts are
connected.
Communities were identified as previously described [23]. They
were all derived from the same group of 354 genes for which both
protein and transcript quantitation was available. The five closely
related ribosomal protein communities consisted of five 35-
member communities made up exclusively of 36 genes. Enrich-
ment for functionally related genes within communities was
calculated based on the fraction of members of a community with
appropriate GO term assignments within the community as
compared to the fraction of the same GO term assignments in the
set of 354 genes.
HeritabilityHeritability is the degree to which variation in measurement is
due to individual-to-individual variation as opposed to variation
due to unintended fluctuation in experimental conditions. For
each of 95 strains, there are between zero and four measurements
for each protein level, t total measurements for each protein level
across all segregants, n1 of which come from strain 1, n2 of which
come from strain 2, and so forth. Heritability was calculated as
follows:
heritability~
n1 x1{GMð Þ2zn2 x2{GMð Þ2z:::� �, Xt
i~1
(mi{GM)2
!,
Where xi is the mean of the ith segregant, mi is the ith measurement,
and GM is the ‘‘grand mean,’’ i.e. the mean of the entire
population.
Variance ExplainedWe use variance explained to quantify that proportion of the
variation in phenotype (e.g. protein level) can be attributed to
inheritance of a particular genetic marker. For example, imagine
that the level of Aro1 protein is higher among segregants that
inherited a SNP at base pair 10,000 on chromosome 3 from the
RM parent than among segregants that inherited this SNP from
the BY parent. meanRM is the mean level of Aro1 protein among
segregants inheriting the RM SNP and meanBY is the mean level
Figure 6. Similarity between genetic regulation of amino acid transcripts and ribosomal proteins. Loci that influence transcript andprotein levels (p,0.05) are plotted as in Figure 2B–D, but regulators of proteins in the protein ribosomal community are plotted above the horizontalline while regulators of transcripts in the transcript amino acid community are plotted below the line.doi:10.1371/journal.pbio.1001144.g006
Genetic Variation and Protein Networks
PLoS Biology | www.plosbiology.org 9 September 2011 | Volume 9 | Issue 9 | e1001144

among segregants inheriting the BY SNP. GM is the ‘‘grand
mean,’’ i.e. the mean level of Aro1 protein in all of the segregants.
There are k total segregants with i segregants inheriting the RM
SNP and j segregants inheriting the BY SNP. mRM_1 is the Aro1
protein level in the first segregant inheriting the RM SNP, mRM_2 is
the level in the second segregant inheriting this SNP, and so forth.
variance explained~
Pi
1
mRM n{meanRMð Þ2zPj
1
mBY n{meanBYð Þ2
Pk1
mn{GMð Þ2
Data collection has been described previously [14]. The protein
quantitation algorithm is described in detail below. Complete code
is available from D.R. upon request. Data collection has been
described previously [14]. The mapping algorithm was based on t
tests with permutation testing to determine false discovery rates.
Complete code is available from E.J.F. upon request. Communi-
ties were identified as described previously [23]. All protein
measurements will be placed in the GEO online database upon
publication (http://www.ncbi.nlm.nih.gov/geo/). Transcript mea-
surements are available at this site.
Supporting Information
Figure S1 Data of Lu et al. measuring protein and transcript
levels for 346 genes in yeast were divided into groups within which
transcript levels varied less than 3.5-fold and average correlation
coefficients were calculated within each bin. The horizontal line at
0.31 shows the average cutoff for significance (p,0.01), as
determined with 1,000 permutations.
(TIF)
Figure S2 Illustration of the difference between transcript-
protein correlations between different genes in a single individual
versus transcript-protein correlations between the same gene in
different individuals.
(TIF)
Figure S3 Each of 354 genes is plotted according to the number
of transcript-transcript connections (correlation coefficients with
p,0.01) on the x-axis and protein-protein connections on the y-
axis.
(TIF)
Figure S4 Zoom in view of isotopic strips. X-axis shows scan
numbers and y-axis shows m/z.
(TIF)
Figure S5 Yellow pixels indicate the peptide peaks that are
identified by MS2. On a typical run we identify 1,000 out of 5,000
to 6,000 peaks.
(TIF)
Table S1 Quantitation of 354 proteins.
(XLS)
Table S2 Community membership.
(DOC)
Table S3 Protein-transcript correlation coefficients.
(XLS)
Table S4 Genetic loci regulating protein and transcript levels.
(XLS)
Text S1 Protein quantitation algorithm (see also Figure S4 and
S5).
( )
Acknowledgments
We thank Martin Morgan for mathematical and computational advice and
Jette Foss, Adam Geballe, Dan Gottschling, Julian Simon, and Frank Stahl
for comments on the manuscript.
Author Contributions
The author(s) have made the following declarations about their
contributions: Conceived and designed the experiments: EJF AB LK.
Performed the experiments: EJF SAS. Analyzed the data: EJF. Contributed
reagents/materials/analysis tools: AB LK DRG. Wrote the paper: EJF AB.
DR quantified proteins.
References
1. Chen Y, Zhu J, Lum PY, Yang X, Pinto S, et al. (2008) Variations in DNA
elucidate molecular networks that cause disease. Nature 452: 429–435.
2. Emilsson V, Thorleifsson G, Zhang B, Leonardson AS, Zink F, et al. (2008)
Genetics of gene expression and its effect on disease. Nature 452: 423–428.
3. de la Fuente A (2010) From ‘differential expression’ to ‘differential networking’ -
identification of dysfunctional regulatory networks in diseases. Trends Genet 26:
326–333.
4. Ravasi T, Suzuki H, Cannistraci CV, Katayama S, Bajic VB, et al. (2010) An
atlas of combinatorial transcriptional regulation in mouse and man. Cell 140:
744–752.
5. Schadt EE (2009) Molecular networks as sensors and drivers of common human
diseases. Nature 461: 218–223.
6. Chesler EJ, Lu L, Shou S, Qu Y, Gu J, et al. (2005) Complex trait analysis of
gene expression uncovers polygenic and pleiotropic networks that modulate
nervous system function. Nat Genet 37: 233–242.
7. Holland MJ (2002) Transcript abundance in yeast varies over six orders of
magnitude. J Biol Chem 277: 14363–14366.
8. Lu P, Vogel C, Wang R, Yao X, Marcotte EM (2007) Absolute protein
expression profiling estimates the relative contributions of transcriptional and
translational regulation. Nat Biotechnol 25: 117–124.
9. Gygi SP, Rochon Y, Franza BR, Aebersold R (1999) Correlation between
protein and mRNA abundance in yeast. Mol Cell Biol 19: 1720–1730.
10. Schrimpf SP, Weiss M, Reiter L, Ahrens CH, Jovanovic M, et al. (2009)
Comparative functional analysis of the Caenorhabditis elegans and Drosophila
melanogaster proteomes. PLoS Biol 7: e48.
11. Marr MT, 2nd, D’Alessio JA, Puig O, Tjian R (2007) IRES-mediated functional
coupling of transcription and translation amplifies insulin receptor feedback.
Genes Dev 21: 175–183.
12. Rohde JR, Bastidas R, Puria R, Cardenas ME (2008) Nutritional control via Tor
signaling in Saccharomyces cerevisiae. Curr Opin Microbiol 11: 153–160.
13. Kapahi P, Chen D, Rogers AN, Katewa SD, Li PW, et al. (2010) With TOR,
less is more: a key role for the conserved nutrient-sensing TOR pathway in
aging. Cell Metab 11: 453–465.
14. Foss EJ, Radulovic D, Shaffer SA, Ruderfer DM, Bedalov A, et al. (2007)
Genetic basis of proteome variation in yeast. Nat Genet 39: 1369–1375.
15. Radulovic D, Jelveh S, Ryu S, Hamilton TG, Foss E, et al. (2004) Informatics
platform for global proteomic profiling and biomarker discovery using liquid
chromatography-tandem mass spectrometry. Mol Cell Proteomics 3: 984–997.
16. Appel MJ, Labarre R, Radulovic D (2004) On accelerated random search. Siam
Journal on Optimization 14: 708–731.
17. Yvert G, Brem RB, Whittle J, Akey JM, Foss E, et al. (2003) Trans-acting
regulatory variation in Saccharomyces cerevisiae and the role of transcription
factors. Nat Genet 35: 57–64.
18. Ruderfer DM, Pratt SC, Seidel HS, Kruglyak L (2006) Population
genomic analysis of outcrossing and recombination in yeast. Nat Genet 38:
1077–1081.
19. Brem RB, Kruglyak L (2005) The landscape of genetic complexity across 5,700
gene expression traits in yeast. Proc Natl Acad Sci U S A 102: 1572–1577.
20. Brem RB, Storey JD, Whittle J, Kruglyak L (2005) Genetic interactions between
polymorphisms that affect gene expression in yeast. Nature 436: 701–703.
21. Brem RB, Yvert G, Clinton R, Kruglyak L (2002) Genetic dissection of
transcriptional regulation in budding yeast. Science 296: 752–755.
22. Weiss M, Schrimpf S, Hengartner MO, Lercher MJ, von Mering C (2010)
Shotgun proteomics data from multiple organisms reveals remarkable
quantitative conservation of the eukaryotic core proteome. Proteomics 10:
1297–1306.
23. Palla G, Derenyi I, Farkas I, Vicsek T (2005) Uncovering the overlapping community
structure of complex networks in nature and society. Nature 435: 814–818.
24. Lynch M, Walsh B (1998) Genetics and analysis of quantitative traits.
SunderlandMass.: Sinauer. xvi, 980 p.
Genetic Variation and Protein Networks
PLoS Biology | www.plosbiology.org 10 September 2011 | Volume 9 | Issue 9 | e1001144
DOC
25. Wang Y, Liu CL, Storey JD, Tibshirani RJ, Herschlag D, et al. (2002) Precision
and functional specificity in mRNA decay. Proc Natl Acad Sci U S A 99:5860–5865.
26. Belle A, Tanay A, Bitincka L, Shamir R, O’Shea EK (2006) Quantification of
protein half-lives in the budding yeast proteome. Proc Natl Acad Sci U S A 103:13004–13009.
27. Warner JR (1999) The economics of ribosome biosynthesis in yeast. TrendsBiochem Sci 24: 437–440.
28. Cutler NS, Heitman J, Cardenas ME (1999) TOR kinase homologs function in a
signal transduction pathway that is conserved from yeast to mammals. Mol CellEndocrinol 155: 135–142.
29. Rohde J, Heitman J, Cardenas ME (2001) The TOR kinases link nutrientsensing to cell growth. J Biol Chem 276: 9583–9586.
30. Schadt EE, Lamb J, Yang X, Zhu J, Edwards S, et al. (2005) An integrativegenomics approach to infer causal associations between gene expression and
disease. Nat Genet 37: 710–717.
31. Hickman MJ, Winston F (2007) Heme levels switch the function of Hap1 ofSaccharomyces cerevisiae between transcriptional activator and transcriptional
repressor. Mol Cell Biol 27: 7414–7424.32. Ronald J, Brem RB, Whittle J, Kruglyak L (2005) Local regulatory variation in
Saccharomyces cerevisiae. PLoS Genet 1: e25.
33. Doss S, Schadt EE, Drake TA, Lusis AJ (2005) Cis-acting expression quantitativetrait loci in mice. Genome Res 15: 681–691.
34. Rockman MV, Kruglyak L (2006) Genetics of global gene expression. Nat RevGenet 7: 862–872.
35. Jorgensen P, Rupes I, Sharom JR, Schneper L, Broach JR, et al. (2004) A
dynamic transcriptional network communicates growth potential to ribosomesynthesis and critical cell size. Genes Dev 18: 2491–2505.
36. Martin DE, Soulard A, Hall MN (2004) TOR regulates ribosomal protein gene
expression via PKA and the Forkhead transcription factor FHL1. Cell 119:969–979.
37. Hinnebusch AG (2005) Translational regulation of GCN4 and the generalamino acid control of yeast. Annu Rev Microbiol 59: 407–450.
38. Kwan EX, Foss EJ, Kruglyak L, Bedalov A (2011) Natural polymorphism in
BUL2 links cellular amino acid availability with chronological aging andtelomere maintenance in yeast. PLoS Genet, in press.
39. Hamilton TL, Stoneley M, Spriggs KA, Bushell M (2006) TOPs and theirregulation. Biochem Soc Trans 34: 12–16.
40. Panchaud A, Jung S, Shaffer SA, Aitchison JD, Goodlett DR (2010) PAcIFICgoes faster, quantitative and accurate. Molecular and Cellular Proteomics, (in
review).
41. Panchaud A, Scherl A, Shaffer SA, von Haller PD, Kulasekara HD, et al. (2009)Precursor acquisition independent from ion count: how to dive deeper into the
proteomics ocean. Anal Chem 81: 6481–6488.42. Picotti P, Bodenmiller B, Mueller LN, Domon B, Aebersold R (2009) Full
dynamic range proteome analysis of S. cerevisiae by targeted proteomics. Cell
138: 795–806.43. Zhu J, Zhang B, Smith EN, Drees B, Brem RB, et al. (2008) Integrating large-
scale functional genomic data to dissect the complexity of yeast regulatorynetworks. Nat Genet 40: 854–861.
Genetic Variation and Protein Networks
PLoS Biology | www.plosbiology.org 11 September 2011 | Volume 9 | Issue 9 | e1001144
Copyright © 2022 FDOKUMEN