Genetic origins of the Minoans and ... - Harvard DASH
28
Genetic origins of the Minoans and Mycenaeans Citation Lazaridis, I., A. Mittnik, N. Patterson, S. Mallick, N. Rohland, S. Pfrengle, A. Furtwängler, et al. 2017. “Genetic origins of the Minoans and Mycenaeans.” Nature 548 (7666): 214-218. doi:10.1038/nature23310. http://dx.doi.org/10.1038/nature23310. Published Version doi:10.1038/nature23310 Permanent link http://nrs.harvard.edu/urn-3:HUL.InstRepos:35014964 Terms of Use This article was downloaded from Harvard University’s DASH repository, and is made available under the terms and conditions applicable to Other Posted Material, as set forth at http:// nrs.harvard.edu/urn-3:HUL.InstRepos:dash.current.terms-of-use#LAA Share Your Story The Harvard community has made this article openly available. Please share how this access benefits you. Submit a story . Accessibility
-
Upload
khangminh22 -
Category
Documents
-
view
5 -
download
0
Transcript of Genetic origins of the Minoans and ... - Harvard DASH

Genetic origins of the Minoans and Mycenaeans
CitationLazaridis, I., A. Mittnik, N. Patterson, S. Mallick, N. Rohland, S. Pfrengle, A. Furtwängler, et al. 2017. “Genetic origins of the Minoans and Mycenaeans.” Nature 548 (7666): 214-218. doi:10.1038/nature23310. http://dx.doi.org/10.1038/nature23310.
Published Versiondoi:10.1038/nature23310
Permanent linkhttp://nrs.harvard.edu/urn-3:HUL.InstRepos:35014964
Terms of UseThis article was downloaded from Harvard University’s DASH repository, and is made available under the terms and conditions applicable to Other Posted Material, as set forth at http://nrs.harvard.edu/urn-3:HUL.InstRepos:dash.current.terms-of-use#LAA
Share Your StoryThe Harvard community has made this article openly available.Please share how this access benefits you. Submit a story .
Accessibility

Genetic origins of the Minoans and Mycenaeans
Iosif Lazaridis1,2,*,†, Alissa Mittnik3,4,*, Nick Patterson2,5, Swapan Mallick1,2,6, Nadin Rohland1, Saskia Pfrengle4, Anja Furtwängler4, Alexander Peltzer3,7, Cosimo Posth3,4, Andonis Vasilakis8, P.J.P. McGeorge9, Eleni Konsolaki-Yannopoulou10, George Korres11, Holley Martlew12, Manolis Michalodimitrakis13, Mehmet Özsait14, Nesrin Özsait14, Anastasia Papathanasiou15, Michael Richards16, Songül Alpaslan Roodenberg1, Yannis Tzedakis17, Robert Arnott18, Daniel M. Fernandes19,20, Jeffery R. Hughey21, Dimitra M. Lotakis22, Patrick A. Navas22, Yannis Maniatis23, John A. Stamatoyannopoulos24,25,26, Kristin Stewardson1,6, Philipp Stockhammer3,27, Ron Pinhasi19,28, David Reich1,2,6,†, Johannes Krause3,4,†, and George Stamatoyannopoulos22,25,†
1Department of Genetics, Harvard Medical School, Boston, Massachusetts 02115, USA 2Broad Institute of Harvard and MIT, Cambridge, MA, 02142, USA 3Max Planck Institute for the Science of Human History, 07745 Jena, Germany 4Institute for Archaeological Sciences, University of Tübingen, 72074 Tübingen, Germany 5Radcliffe Institute, Cambridge, MA 02138, USA 6Howard Hughes Medical Institute, Harvard Medical School, Boston, MA, 02115, USA 7Integrative Transcriptomics, Centre for Bioinformatics, University of Tuebingen, 72076, Germany 823rd Ephorate of Prehistoric and Classical Antiquities, Herakleion, Crete, 71202 9British School at Athens, Athens 106 76, Greece 1026th Ephorate of Prehistoric and Classical Antiquities, Greek Ministry of Culture, Piraeus, Greece, 13536 11Department of Archaeology, University of Athens, Athens, Greece 17584 12The Holley Martlew Archaeological Foundation, The Hellenic Archaeological Foundation Tivoli House, Tivoli Road, Cheltenham GL50 2TD England 13University of Crete Medical School, Herakleion, Crete, 711 13, Greece 14Erenköy, Bayar caddesi, Eser Apt. No. 7, Daire 24. Kadıköy-İSTANBUL, Turkey 15Ephorate of Paleoantropology and Speleology, Greek Ministry of Culture, Athens Greece, 11636 16Department of Archaeology, Simon Fraser University, 8888 University Drive, Burnaby, B.C., Canada, V5A 1S6 17Hellenic
Users may view, print, copy, and download text and data-mine the content in such documents, for the purposes of academic research, subject always to the full Conditions of use: http://www.nature.com/authors/editorial_policies/license.html#terms†Correspondence and requests for materials should be addressed to I.L. ([email protected]), D.R. ([email protected]), J.K. ([email protected]), G.S. ([email protected]).*These authors contributed equally to this work.
Data availabilityThe aligned sequences are available through the European Nucleotide Archive under accession number PRJEB20914. Genotype datasets used in analysis are at https://reich.hms.harvard.edu/datasets.
Author ContributionsG.S. conceived the study. D.R. and J.K. co-supervised the ancient DNA work, sequencing, and data analysis. I.L. performed population genetic analysis and wrote the manuscript with input from other authors. P.J.P.McG, E.K, G.K., H.M., M.M, M.Ö, N.Ö, A.Pa., M.R., S.A.R., Y.T, A.V., R.A. P.S., R.P., J.K., G.S. assembled, studied, or described archaeological and osteological material. J.R.H, P.A.N., G.S., D.R. assembled samples for genotyping. A.M., S.P., N.R., A.F., C.P., D.F., J.R.H, D.M.L, Y.M, J.A.S, K.St., R.P., G.S., D.R., J.K. performed wet lab work. A.M., N.P., S.M., A.Pe., performed bioinformatic analyses.
Author InformationThe aligned sequences are available through the European Nucleotide Archive under accession number PRJEB20914. Genotype datasets used in analysis are at https://reich.hms.harvard.edu/datasets.
The authors declare no competing financial interests.
HHS Public AccessAuthor manuscriptNature. Author manuscript; available in PMC 2018 February 02.
Published in final edited form as:Nature. 2017 August 10; 548(7666): 214–218. doi:10.1038/nature23310.
Author M
anuscriptA
uthor Manuscript
Author M
anuscriptA
uthor Manuscript

Archaeological Service. Samara, 27, Paleo Psychico, Athens 15452, Greece 18Green Templeton College, University of Oxford, Woodstock Road, Oxford OX2 6HG, UK 19School of Archaeology and Earth Institute, Belfield, University College Dublin, Dublin 4, Ireland 20CIAS, Department of Life Sciences, University of Coimbra, Coimbra 3000-456, Portugal 21Division of Mathematics, Science, and Engineering, Hartnell College, 411 Central Ave., Salinas, CA 93901, USA 22Division of Medical Genetics University of Washington, Seattle, WA 98195 23Laboratory of Archaeometry, National Center for Scientific Research “Demokritos”, Aghia Paraskevi 153 10, Attiki, Greece 24Department of Medicine, University of Washingtion, Seattle, WA 98195 25Department of Genome Sciences, University of Washingtion, Seattle, WA 98195 26Altius Institute for Biomedical Sciences, Seattle, WA 98121 27Ludwig-Maximilians-Universität München, Institut für Vor- und Frühgeschichtliche Archäologie und Provinzialrömische Archäologie, 80799 München, Germany 28Department of Anthropology, University of Vienna, Althanstrasse 14, 1090 Vienna, Austria
Abstract
The origins of the Bronze Age Minoan and Mycenaean cultures have puzzled archaeologists for
more than a century. We assembled genome-wide data from nineteen ancient individuals,
including Minoans from Crete, Mycenaeans from mainland Greece, and their eastern neighbours
from southwestern Anatolia. We show that Minoans and Mycenaeans were genetically similar,
having at least three quarters of their ancestry from the first Neolithic farmers of western Anatolia
and the Aegean1,2, and most of the remainder from ancient populations like those of the Caucasus3
and Iran4,5. However, the Mycenaeans differed from Minoans in deriving additional ancestry from
an ultimate source related to the hunter-gatherers of eastern Europe and Siberia6–8, introduced via
a proximal source related to either the inhabitants of either the Eurasian steppe1,6,9 or Armenia4,9.
Modern Greeks resemble the Mycenaeans, but with some additional dilution of the early Neolithic
ancestry. Our results support the idea of continuity but not isolation in the history of populations of
the Aegean, before and after the time of its earliest civilizations.
Ancient DNA research has traced the principal ancestors of early European farmers to highly
similar Neolithic populations of Greece and western Anatolia, beginning in the 7th
millennium BCE1,2, but the later history of these regions down to the Bronze Age, a
transformational period in the history of Eurasia4,6,9, is less clear. There is limited genetic
evidence suggesting migrations from both the east (the area of Iran and the Caucasus),
reaching Anatolia by at least ~3,800 BCE4, and the north (eastern Europe and Siberia)
contributing ‘Ancient North Eurasian’ ancestry6,10 to all modern Europeans. The timing and
impact of these migrations in the Aegean is, however, unknown.
During the Bronze Age, two prominent archaeological cultures emerged in the Aegean. The
culture of the island of Crete, labelled ‘Minoan’ by Arthur Evans11, was Europe’s first
literate civilization, and has been described as ‘Europe’s first major experience of
civilization’12. However, the Linear A syllabic ideographic and Cretan hieroglyphic scripts
used by this culture remain undeciphered, obscuring its origins. Equally important was the
civilization of the ‘Mycenaean’ culture of mainland Greece, whose language, written in the
Linear B script, was an early form of Greek13. Cretan influence in mainland Greece and the
Lazaridis et al. Page 2
Nature. Author manuscript; available in PMC 2018 February 02.
Author M
anuscriptA
uthor Manuscript
Author M
anuscriptA
uthor Manuscript

later Mycenaean occupation of Crete link these two cultures, but the degree of genetic
affinity between mainland and Cretan populations is unknown. Greek is related to other
Indo-European languages, leading to diverse theories tracing its earliest speakers from the
7th millennium down to ~1,600 BCE, and proposing varying degrees of population change
(Supplementary Information, section 1).
Genome-wide ancient DNA data provides a new source of information about the people of
the Bronze Age, who were first known through the ancient poetic and historical traditions
commencing with Homer and Herodotus, later through the disciplines of archaeology and
linguistics, and, more recently, by the limited information from ancient mitochondrial
DNA14,15. Here we answer several questions. First, do the labels ‘Minoan’ and ‘Mycenaean’
correspond to genetically coherent populations or do they obscure a more complex structure
of the peoples who inhabited Crete and mainland Greece at this time? Second, how were the
two groups related to each other, to their neighbours across the Aegean in Anatolia, and to
other ancient populations from Europe1,2,6,8–10 and the Near East2–5,9,16,17? Third, can
inferences about their ancestral origins inform debates about the origins of their cultures?
Fourth, how are the Minoans and Mycenaeans related to Modern Greeks, who inhabit the
same area today?
We generated genome-wide data from 19 ancient individuals (Fig. 1a; Extended Data Table
1; Supplementary Information, section 1). This includes 10 Minoans from Crete, (~2,900–
1,700 BCE; labelled Minoan_Odigitria: from Moni Odigitria near the southern coast of
central Crete and Minoan_Lasithi: from the cave of Hagios Charalambos in the highland
plain of Lasithi in east Crete). From mainland Greece, 4 Mycenaeans were included
(~1,700–1,200 BCE; from the western coast of the Peloponnese, from Argolis, and the
island of Salamis). An additional individual from Armenoi in western Crete (~1,370–1,340
BCE; labelled Crete_Armenoi) postdates the appearance of Mycenaean culture on the island
of Crete. Our dataset also includes a Neolithic sample from Alepotrypa Cave at Diros bay in
the southern Peloponnese (~5,400 BCE) adding to previously published samples from
northern Greece2 (collectively labelled Greece_N). Finally, it includes 3 Bronze Age
individuals (~2,800–1,800 BCE; labelled Anatolia_BA) from Harmanören Göndürle in
southwestern Anatolia (Turkey), adding knowledge about genetic variation in Anatolia after
the Neolithic/Chalcolithic periods1,2,4,17 (Supplementary Information, section 1). We
processed the ancient remains, extracted DNA, and prepared Illumina libraries in dedicated
clean rooms (Supplementary Data Table 1; Methods), and, after initial screening for
mitochondrial DNA, used in-solution hybridization18 to capture ~1.2 million single
nucleotide polymorphisms6,19 on the ancient samples. We assessed contamination by
examining the rate at which they matched the mitochondrial consensus sequence
(Supplementary Data Table 2) and by the rate at which male samples were heterozygous on
the X-chromosome (Methods). We combined the dataset of the 19 ancient individuals with
332 other ancient individuals from the literature, 2,614 present-day humans genotyped on
the Human Origins array, and 2 present-day Cretans (Methods).
We carried out principal components analysis20 (Methods), projecting ancient samples onto
the first two principal components inferred from present-day West Eurasian populations10
that form two south-north parallel clines in Europe and the Near East along PC2. Minoans
Lazaridis et al. Page 3
Nature. Author manuscript; available in PMC 2018 February 02.
Author M
anuscriptA
uthor Manuscript
Author M
anuscriptA
uthor Manuscript

and Mycenaeans are centrally positioned in the PCA (Fig. 1b), framed to the left by ancient
populations from mainland Europe and the Eurasian steppe, to the right by ancient
populations from the Caucasus and Western Asia, and to the bottom by Early/Middle
Neolithic farmers from Europe and Anatolia. The Neolithic samples from Greece cluster
with these farmers and are distinct from the Minoans and Mycenaeans. The Bronze Age
individuals from southwestern Anatolia are also distinct, intermediate between Anatolian
and Levantine populations towards the bottom, and populations from Armenia, Iran, and the
Caucasus towards the top. ADMIXTURE analysis (Extended Data Fig. 1) shows that both
Minoans and Mycenaeans possess a ‘pink’ genetic component (K=8 and greater) as do
Bronze Age southwestern Anatolians, Neolithic Central Anatolians from Tepecik-Çiftlik17, a
Chalcolithic northwestern Anatolian1, and western Anatolians from Kumtepe16. This
component is maximized in the Mesolithic/Neolithic samples from Iran4,5 and hunter-
gatherers from the Caucasus3 (Extended Data Fig. 1). It is not found in the Neolithic of
northwestern Anatolia, Greece, or the Early/Middle Neolithic populations of the rest of
Europe, only appearing in the populations of the Late Neolithic/Bronze Age in mainland
Europe6, introduced there by migration from the Eurasian steppe1,6.
Beyond the visual impressions of PCA and ADMIXTURE, we formally tested the
relationships between populations from our study and the literature, using f4-statistics of the
form f4(X, Y; Test, Chimp) that evaluate whether Test shares more alleles with X or Y. We
find that Test populations from Iran, the Caucasus, and eastern Europe share more alleles
with Minoans and Mycenaeans than with the Neolithic population of Greece (Extended Data
Fig. 2a,b). The Minoans from the Lasithi plateau in the highlands of eastern Crete and from
the coast of southern Crete (Extended Data Fig. 2c) are consistent with being a
homogeneous population. Mycenaeans differ from these Minoans in sharing significantly
fewer alleles with Neolithic people from the Levant, Anatolia, Greece, and mainland Europe
(Extended Data Fig. 2d). In comparison, the Bronze Age Anatolians share fewer alleles with
ancient Europeans and more with ancient populations of Iran and the Levant (Extended Data
Fig. 3). We used f3-statistics of the form f3(Ref1, Ref2; Test) which, if negative, show that
Test is admixed from sources related to the Ref1, Ref2 source populations. We do not find
significantly negative (Ref1, Ref2) pairs for Minoans or Bronze Age Anatolians (Z>−2.5),
but do for Mycenaeans (−4.9<Z<−3.0; Extended Data Fig. 4), involving early farmers from
the Levant, Anatolia, Greece, and the rest of Europe as one source, and Iran or the Eurasian
steppe or steppe-influenced Europeans as the other.
We modelled Bronze Age populations using qpAdm/qpWave6 framework (Methods;
Supplementary Information, section 2) which relates a set of ‘left’ populations (admixed
population and ancestral source populations) with a set of ‘right’ populations (diverse
outgroups) and allows one to test for the number of streams of ancestry from ‘right’ to ‘left’
and to estimate admixture proportions. This analysis shows that all Bronze Age populations
from the Aegean and Anatolia derived most (~62–86%) of their ancestry from an Anatolian
Neolithic-related population (Table 1). However, they also had a component (~9–32%) of
‘eastern’ (Caucasus/Iran-related) ancestry. It was previously shown that this type of ancestry
was introduced into mainland Europe via Bronze Age pastoralists from the Eurasian steppe
who were a mix of both eastern European hunter-gathers and populations from the Caucasus
and Iran4,6; our results show that it also arrived on its own, at least in the Minoans, without
Lazaridis et al. Page 4
Nature. Author manuscript; available in PMC 2018 February 02.
Author M
anuscriptA
uthor Manuscript
Author M
anuscriptA
uthor Manuscript

eastern European hunter-gatherer ancestry. This ancestry need not have arrived from regions
east of Anatolia, as it was already present during the Neolithic in central Anatolia at
Tepecik-Çiftlik17 (Supplementary Information, section 2). The eastern influence in the
Bronze Age populations from Greece and southwestern Anatolia is also supported by an
analysis of their Y-chromosomes. Four out of five males belonging to Minoans,
Mycenaeans, and southwestern Anatolians (Supplementary Information, section 3) belonged
to haplogroup J which was rare or non-existent in earlier populations from Greece and
western Anatolia which were dominated by Y-chromosome haplogroup G21,2,17.
Haplogroup J was present in Caucasus hunter-gatherers3 and a Mesolithic individual from
Iran4 and its spread westward may have accompanied the ‘eastern’ genome-wide influence.
The Minoans could be modelled as a mixture of the Anatolia Neolithic-related substratum
with additional ‘eastern’ ancestry, but the other two groups had additional ancestry: the
Mycenaeans had ~4–16% ancestry from a ‘northern’ ultimate source related to the hunter-
gatherers of eastern Europe and Siberia (Table 1), while the Bronze Age southwestern
Anatolians may have had ~6% ancestry related to Neolithic Levantine populations. The elite
Mycenaean individual from the ‘royal’ tomb at Peristeria in the western Peloponnese did not
differ genetically from the other three Mycenaean individuals buried in common graves. To
identify more proximate sources of the distinctive eastern European/north Eurasian-related
ancestry in Mycenaeans, we included later populations as candidate sources (Supplementary
Information, section 2), and could model Mycenaeans as a mixture of the Anatolian
Neolithic and Chalcolithic-to-Bronze Age populations from Armenia (Table 1). Populations
from Armenia possessed some ancestry related to eastern European hunter-gatherers4, so
they, or similar unsampled populations of western Asia, could have contributed it to
populations of the Aegean. This model makes geographical sense, since a population
movement from the vicinity of Armenia could have admixed with Anatolian Neolithic-
related farmers on either side of the Aegean. However, Mycenaeans can also be modelled as
a mixture of Minoans and Bronze Age steppe populations (Table 1; Supplementary
Information, section 2), suggesting that, alternatively, ‘eastern’ ancestry arrived in both
Crete and mainland Greece, followed by ~13–18% admixture with a ‘northern’ steppe
population in mainland Greece only. Such a scenario is also plausible: first, it provides a
genetic correlate for the distribution of shared toponyms in Crete, mainland Greece, and
Anatolia discovered by Kretschmer21; second, it postulates a single migration from the east;
third, it proposes some gene flow from geographically contiguous areas to the north where
steppe ancestry was present since at least the mid-3rd millennium BCE6,9. We validated
inferences from qpAdm by treating source populations as ‘ghosts’ and re-estimating mixture
proportions4, by examining the correspondence between qpAdm estimates and PCA4
(Extended Data Fig. 5), and by comparing simulated individuals of known ancestry against
the Mycenaeans (Extended Data Fig. 6).
Geographical structure may have prevented the spread of the ‘northern’ ancestry from the
mainland to Crete, contributing to genetic differentiation. Such structure may, in principle,
be long-standing, even prior to the advent of the Neolithic in the 7th millennium BCE.
Alternatively, both ‘northern’ and ‘eastern’ ancestry may have arrived in the Aegean at any
time between the Early Neolithic and the Late Bronze Age. Wider geographical and
temporal sampling of pre-Bronze Age populations of the Aegean may better trace the advent
Lazaridis et al. Page 5
Nature. Author manuscript; available in PMC 2018 February 02.
Author M
anuscriptA
uthor Manuscript
Author M
anuscriptA
uthor Manuscript

of ‘northern’ and ‘eastern’ ancestry in the region. However, sampled Neolithic samples from
Greece, down to the Final Neolithic ~4,100 BCE2, do not possess either type of ancestry,
suggesting that the admixture we detect probably occurred during the 4th–2nd millennium
BCE time window. Other proposed migrations, such as settlement by Egyptian or
Phoenician colonists22 are not discernible in our data, as there is no measurable Levantine or
African influence in the Minoans and Myceneans, thus rejecting the hypothesis that the
cultures of the Aegean were seeded by migrants from the old civilizations of these regions.
On the other hand, migrants from areas east or north of the Aegean, while numerically less
influential than the locals, may have contributed to the emergence of the 3rd–2nd millennium
BCE Bronze Age cultures as ‘creative disruptors’ of local traditions, bearers of innovations,
or through cultural interaction with the locals, coinciding with the genetic process of
admixture.23 Relative ancestral contributions do not determine the relative roles in the rise of
civilization of the different ancestral populations, but, nonetheless, the strong persistence of
the Neolithic substratum does suggest a key role for the locals in this process.
Phenotype prediction from genetic data has enabled the reconstruction of the appearance of
ancient Europeans1,24 who left no visual record of their pigmentation. By contrast, the
appearance of the Bronze Age people of the Aegean has been preserved in colourful frescos
and pottery, depicting people with mostly dark hair and eyes25. We used the HIrisPlex26 tool
(Supplementary Information, section 4) to infer that the appearance of our ancient samples
matched the visual representations (Extended Data Table 2), suggesting that art of this
period reproduced phenotypes naturalistically.
We estimated FST of Bronze Age populations with present-day West Eurasians, finding that
Mycenaeans are least differentiated from populations from Greece, Cyprus, Albania, and
Italy (Fig. 2), part of a general pattern in which Bronze Age populations broadly resemble
present-day inhabitants from the same region (Extended Data Fig. 7). Modern Greeks
occupy the intermediate space of the PCA along PC1 (Fig. 1b) between ancient European
and Near Eastern populations, like the ones of the Bronze Age. They are not, however,
identical to Bronze Age populations, as they are above them along PC2 (Fig. 1b). This is due
to the fact that Neolithic farmers share fewer alleles with Modern Greeks than with
Mycenaeans (Extended Data Fig. 8), consistent with additional later admixture27,28.
The Minoans and Mycenaeans, sampled from different sites in Crete and mainland Greece,
were homogeneous, supporting the genetic coherency of these two groups. Differences
between them are only relative, viewed against their broad overall similarity to each other
and to the southwestern Anatolians, sharing in both the ‘local’ Anatolian Neolithic-like
farmer ancestry and the ‘eastern’ Caucasus-related admixture. Two key questions remain to
be addressed by future studies. First, when did the common ‘eastern’ ancestry of both
Minoans and Mycenaeans arrive in the Aegean? Second, is the ‘northern’ ancestry in
Mycenaeans due to sporadic infiltration of Greece, or the result of a rapid migration as in
Central Europe6? Such a migration would support the idea that Proto-Greek speakers29
formed the southern wing of a steppe intrusion of Indo-European speakers. Yet, the absence
of ‘northern’ ancestry in the Bronze Age samples from Pisidia, where Indo-European
languages were attested in antiquity, casts doubt on this genetic-linguistic association, with
further sampling of ancient Anatolian speakers needed. Whatever the answer to these
Lazaridis et al. Page 6
Nature. Author manuscript; available in PMC 2018 February 02.
Author M
anuscriptA
uthor Manuscript
Author M
anuscriptA
uthor Manuscript

questions, the discovery of at least two migration events into the Aegean in addition to the
first farming dispersal and before the Bronze Age, and of additional population change since
that time, supports the view that the Greeks did not emerge fully-formed from the depths of
prehistory, but were, indeed, a people ‘ever in the process of becoming.’30
Methods
No statistical methods were used to predetermine sample size. The experiments were not
randomized and the investigators were not blinded to allocation during experiments and
outcome assessment.
Ancient DNA
An overview of which steps in processing the ancient samples were undertaken in which lab
is provided in Supplementary Data Table 1.
Dublin—The inner ear area of each petrous bone was identified, isolated, and then ground
to a fine powder. Cleaning and isolation of the cochlea was performed using aluminum oxide
powder in a sandblasting chamber. Once isolated, it was decontaminated by UV irradiation
for 7.5 minutes on each side, ground on a mixer mill to a weight of about 50mg, and finally
transferred to a sterile Eppendorf tube. All procedures were conducted in clean and
dedicated ancient DNA facilities.
Seattle—Teeth processed in this laboratory were decontaminated and pulverized to powder
in clean and dedicated ancient DNA facilities following previously published methods11.
Leipzig—As previously described,32 sampling, extraction and preparation of double-
indexed, double-stranded libraries took place in the clean room facilities of the Max Planck
Institute for Evolutionary Anthropology, Leipzig, Germany (MPI-EVA), followed by
enrichment of human mtDNA33. Enriched libraries were sequenced on an Illumina GAIIx
platform for 2×76+7 cycles and resulting data was mapped to the rCRS using the EAGER
pipeline to evaluate DNA preservation (Supplementary Table 2). These libraries were then
shipped to Boston, where nuclear target enrichment was performed (see below).
Tübingen—Pre-PCR steps took place in the clean room facilities of the Institute for
Archaeological Sciences at the University of Tübingen, Germany. After surface irradiation
with UV-light, the tooth was sawed apart transversally at the border of crown and root, and
dentine powder from the inside the crown was sampled using a sterile dentistry drill.
Extraction, library preparation and enrichment of human mtDNA used the same protocols as
described for MPI-EVA, with addition of a updated extraction protocol34. Sequencing of
shotgun and mtDNA-enriched libraries took place at the facilities of the Frauenklinik of the
University of Tübingen, on an Illumina MiSeq for 2×150+8 cycles or on an Illumina
HiSeq2500 for 2×101+8 cycles (Supplementary Table 2).
Additional libraries were produced including full or partial35 repair with UDG and
endonuclease VIII to remove deaminated bases. In-solution enrichment was performed using
previously reported protocols6,18. Two SNP sets of 394,577 SNPs (390k capture6) or
Lazaridis et al. Page 7
Nature. Author manuscript; available in PMC 2018 February 02.
Author M
anuscriptA
uthor Manuscript
Author M
anuscriptA
uthor Manuscript

1,237,207 SNPs (1240k capture1) were targeted. Sequencing took place in the facilities of
the Frauenklinik, University of Tübingen, on an Illumina HiSeq2500 for 2×101+8 cycles
and at the facilities of the University of Kiel on a HiSeq4000 for 2×150+8 cycles. One
UDG-treated library (I0071) was sent to Boston for nuclear target enrichment, see below.
Boston—The bone powders, prepared from petrous bones in Dublin, were sent to Boston,
where DNA extractions and barcoded library preparations without Uracil-removal was
performed in the HMS cleanroom following previously described protocols34–36. At the
screening stage, libraries were (a) shotgun sequenced, and (b) sequenced after enriching for
the human mitochondrial DNA37 together with some nuclear loci in order to approximate
the nuclear coverage and mitochondrial contamination. All four libraries (barcoded)
prepared in Boston, three libraries (indexed) prepared in Leipzig and one library (indexed)
prepared in Tuebingen, were used to perform 390k6 and 840k19 or 1240k (= 390k+840k)
targeted capture of a total of 1,233,013 SNPs, following the in-solution target enrichment
protocol in Fu at al.18 and sequenced on either an Illumina HiSeq2500 or Illumina
NextSeq500 (see Supplementary Data Table 1 for details).
For each sample, each SNP position is represented by a randomly chosen sequence,
restricting to those with a minimum mapping quality (MAPQ≥10), sites with a minimum
sequencing quality (≥20), and removing two bases at the ends of reads4.
Testing for contamination
Modern human contamination of the mitochondrial DNA was assessed using the software
schmutzi38 which takes into account that the consensus sequence should be reconstructed
from reads showing characteristics of ancient DNA and originating from a single individual
(Supplementary Data Table 2). We assessed contamination by examining heterozygosity on
the X-chromosome in five males (which possess only one copy of the X chromosome) using
ANGSD39 (Supplementary Information, section 3); this was in the range of 0.3–4%. Indirect
evidence that the females in our dataset (for which X-chromosome based contamination
estimation is impossible) are authentic is furnished by their clustering with male samples
and distinctiveness from present-day Greek or central European populations that may have
possibly contaminated them (Fig. 1b). We also computed f4-statistics of the form f4(Males,
Females; Test, Chimp) for populations that had both male and female individuals for all
ancient or present-day Test populations in our dataset. If female samples were substantially
contaminated from a source related to Test these statistics would be significantly negative;
however we find that the Z-score of these statistics is −1.6<Z<2.5. We thus included both
male and female samples in our analysis to maximize sample size instead of restricting to
damaged molecules for females8.
Modern human data
We used a dataset of 2,614 individuals genotyped on the Affymetrix Human Origins
array4,5,10,31, including 28 Modern Greek (from Greece and Cyprus) samples previously
described10. We also included data from 2 Modern Greeks from Crete whose whole genome
sequences were published as part of the Simons Genome Diversity Project40. We also
Lazaridis et al. Page 8
Nature. Author manuscript; available in PMC 2018 February 02.
Author M
anuscriptA
uthor Manuscript
Author M
anuscriptA
uthor Manuscript

analyzed Modern Greek data from Thessaly and Central Greece41 and diverse regions27,42
genotyped on Illumina arrays.
Datasets
We analyzed two datasets, HO which includes the Affymetrix Human Origins genotyping
data together with 351 ancient humans (including samples from the
literature1–5,7–10,16,17,43–51 and the newly reported data) on 591,642 autosomal SNPs and
the HOIll dataset which does not include the Human Origins data, but has a larger number of
1,054,671 autosomal SNPs4. We did not use previously performed genotype calls of
literature data, but re-processed them in-house, beginning with the original data release
format (FASTQ or BAM). The main analysis dataset was HOIll except for analyses that
include modern populations in which case the HO dataset was analyzed. For the analysis of
Illumina genotype data of Modern Greeks (Extended Data Fig. 6) a total of 489,148
autosomal SNPs were analyzed.
Abbreviations used
For brevity, we used the following abbreviations in population names, following the
convention of ref.4: CHG: Caucasus hunter-gatherers, EHG: Eastern European hunter-
gatherers, WHG: Western European hunter-gatherers, SHG: Scandinavian hunter-gatherers,
N: Neolithic, EN: Early Neolithic, MN: Middle Neolithic, ChL: Chalcolithic, LNBA: Late
Neolithic/Bronze Age, BA: Bronze Age, EBA: Early Bronze Age, EMBA: Early/Middle
Bronze Age, MLBA: Middle/Late Bronze Age, IA: Iron Age.
Principal components analysis
Principal components analysis was performed in the smartpca program of EIGENSOFT20,
using default parameters and the lsqproject: YES10 and numoutlieriter: 0 options. PCA was
performed on 1,029 present-day West Eurasians and 334 ancient samples were projected
(Fig. 1b); Upper Paleolithic individuals prior to the appearance of the Villabruna cluster8
plot in the middle of present-day West Eurasian variation and are not shown.
ADMIXTURE analysis
ADMIXTURE analysis52 of the HO dataset was performed after pruning for linkage
disequilibrium in PLINK53,54 with parameters indep-pairwise 200 25 0.4, after which
299,971 SNPs were retained. Twenty replicates of the analysis were performed with
different random seeds, and the highest likelihood replicate for each value of K was retained.
We show the K =2 to K=17 results for the 351 ancient and 30 Modern Greek samples in
Extended Data Fig. 1.
f-statistics
f3 and f4-statistics were computed in ADMIXTOOLS31 using programs qp3Pop, qpF4ratio with default parameters, and qpDstat with f4mode: YES. Standard errors were computed
with a block jack-knife55. When an ancient population was the target for f3-statistics we set
inbreed: YES parameter, as our data are represented by pseudo-haploid genotypes which
introduce artificial genetic drift that masks the negative signal of admixture31.
Lazaridis et al. Page 9
Nature. Author manuscript; available in PMC 2018 February 02.
Author M
anuscriptA
uthor Manuscript
Author M
anuscriptA
uthor Manuscript

Testing for the number of streams of ancestry and estimating mixture proportions
We used the qpWave6,56,57/qpAdm6 framework which relates a set of ‘left’ populations (the
population of interest and candidate ancestral sources) to a set of ‘right’ populations (diverse
outgroups), testing for the number of streams of ancestry from ‘right’ to ‘left’ and estimating
mixture proportions.
Simulations of admixed individuals
We simulated admixed individuals (Supplementary Information, section 2) given a set of
sources and mixture proportions by first sampling (at each SNP) one of the sources
(according to the mixture proportions), and then one of the individuals from that population
(with equal probability). Due to missingness, the data-generating mixture proportions do not
correspond precisely to the actual ancestry of simulated individuals (Supplementary
Information, section 2). We note the maximum absolute value of the Z-score of the statistic
f4(Mycenaean, Simulated; A, B), where A, B are two outgroup populations to test whether
for a particular choice of ancestry of Simulated it forms a clade with the sampled
Mycenaeans.
Estimation of FST coefficients
We estimated FST in smartpca20 with the default parameters, inbreed: YES57, and fstonly:
YES.
Phenotypic inference
The ancient samples have low coverage (median 0.87×) and thus diploid genotypes cannot
be reliably assessed for them. However, we can use the low coverage data to compute allele
frequencies in all individuals and the Bronze Age Aegean using likelihood approach1. We
then sample from the posterior distribution of the genotypes g given the read counts r of the
reference allele and t of the total reads covering a site. We took 100 random genotype
samples per individuals and submitted them to HIrisPlex26, obtaining an estimate of the
uncertainty of phenotype inference (Supplementary Information, section 4; Extended Data
Table 4).
Lazaridis et al. Page 10
Nature. Author manuscript; available in PMC 2018 February 02.
Author M
anuscriptA
uthor Manuscript
Author M
anuscriptA
uthor Manuscript

Extended Data
Extended Data Figure 1. ADMIXTURE analysisADMIXTURE analysis with K=2 to K=17 is shown. 351 ancient and 2,616 present-day
individuals were used in this analysis; ancient samples and present-day Greeks are
displayed. To avoid visual clutter of labels, individuals in populations with sample size ≤5
are shown with thicker lines.
Lazaridis et al. Page 11
Nature. Author manuscript; available in PMC 2018 February 02.
Author M
anuscriptA
uthor Manuscript
Author M
anuscriptA
uthor Manuscript

Extended Data Figure 2. Symmetry testing of Aegean Bronze Age populationsThe statistic f4(X, Y; Test, Chimp) is shown with ±3 standard errors. Each panel is titled
with the pair X, Y. Populations are ordered according to the value of the statistic. Positive
values indicate that Test shares more alleles with X than Y and negative values that it shares
more with Y than X. (a) ‘northern’ and ‘eastern’ populations share more alleles with
Minoans than with Neolithic Greece. (b) ‘northern’ and ‘eastern’ populations share more
alleles with Mycenaeans than with Neolithic Greece. (c) Minoans from Lasithi and Moni
Odigitria are symmetrically related to diverse populations. (d) Neolithic populations from
Lazaridis et al. Page 12
Nature. Author manuscript; available in PMC 2018 February 02.
Author M
anuscriptA
uthor Manuscript
Author M
anuscriptA
uthor Manuscript

Anatolia, Europe, Greece, and the Levant share fewer alleles with Mycenaeans than with
Minoans.
Extended Data Figure 3. Symmetry testing of Anatolian Bronze Age populationsThe statistic f4(X, Y; Test, Chimp) is shown with ±3 standard errors. Each panel is titled
with the pair X, Y. Populations are ordered according to the value of the statistic. Positive
values indicate that Test shares more alleles with X than Y and negative values that it shares
more with Y than X. (a) European, Siberian, and Caucasus hunter-gatherers share fewer
Lazaridis et al. Page 13
Nature. Author manuscript; available in PMC 2018 February 02.
Author M
anuscriptA
uthor Manuscript
Author M
anuscriptA
uthor Manuscript

alleles with Bronze Age Anatolians from Harmanören Göndürle than with a Chalcolithic
Anatolian from Barcın. (b) Bronze Age Anatolians differ from Neolithic ones in sharing
more alleles with populations of Iran, the Caucasus, and the Steppe than with those of
Europe. (c) Bronze Age Anatolians differ from Minoans in sharing more alleles with
populations from Neolithic Iran than Neolithic Anatolia and Europe. (d) Bronze Age
Anatolians differ from Mycenaeans in sharing more alleles with Neolithic and Bronze Age
populations of the Levant.
Lazaridis et al. Page 14
Nature. Author manuscript; available in PMC 2018 February 02.
Author M
anuscriptA
uthor Manuscript
Author M
anuscriptA
uthor Manuscript

Extended Data Figure 4. f3-statistics of Mycenaeans as a target with different pairs of reference populationsWe show the value of the statistic f3(Ref1, Ref2; Mycenaean) and ±3 standard errors; only
the population pairs (Ref1, Ref2) for which the Z-score of the statistic is <−2 are shown.
Negative values indicate that the Mycenaean population is admixed from sources related to
the two reference populations.
Extended Data Figure 5. Correspondence of qpAdm estimates with PCA
Lazaridis et al. Page 15
Nature. Author manuscript; available in PMC 2018 February 02.
Author M
anuscriptA
uthor Manuscript
Author M
anuscriptA
uthor Manuscript

As a way to validate qpAdm models of admixture for Myceneans from three ancestral
populations (Anatolia_N or Minoan_Lasithi), (Armenia_ChL or Armenia_MLBA),
(Steppe_EMBA, Steppe_MLBA, Europe_LNBA), representing substratum, ‘eastern’, and
‘northern’ ancestry respectively (Supplementary Information, section 2), we plot the
qpAdm-predicted position in the PCA space of Fig. 1 vs. the actual position of the
Mycenaean population.
Extended Data Figure 6. Comparison of Mycenaeans and simulated admixed populations
Lazaridis et al. Page 16
Nature. Author manuscript; available in PMC 2018 February 02.
Author M
anuscriptA
uthor Manuscript
Author M
anuscriptA
uthor Manuscript

We simulate admixed individuals with known ancestry from three ancestral populations
(Anatolia_N or Minoan_Lasithi), (Armenia_ChL or Armenia_MLBA), (Steppe_EMBA,
Steppe_MLBA, Europe_LNBA), representing substratum, ‘eastern’, and ‘northern’ ancestry
respectively (Methods; Supplementary Information, section 2). The maximum |Z|-score of
statistics f4(Mycenaean, Simulated; Outgroup1, Outgroup2) is plotted with circles of varying
size (proportional to log|Z|) for each assignment of ancestry proportions. The best estimate
(red) corresponds to the proportions that minimize |Z|, and they are compared against the
qpAdm estimate for the same ancestral sources (blue).
Lazaridis et al. Page 17
Nature. Author manuscript; available in PMC 2018 February 02.
Author M
anuscriptA
uthor Manuscript
Author M
anuscriptA
uthor Manuscript

Extended Data Figure 7. FST between Bronze Age and present-day West Eurasian populations(a) The population of Early Bronze Age Armenia4 shows an affinity to present-day
populations from Armenia, Anatolia, the Caucasus, and Iran, as does (b) Middle/Late
Bronze Age Armenia4,9. (c) The Bronze Age Levant4 has an affinity to Levantine and
Arabian populations. (d) Late Neolithic/Bronze Age Europeans1,6,9,43 most resemble
present-day northern/central Europeans, as do (e) Early/Middle Bronze Age steppe
populations1,6,9, who also resemble populations of the northeast Caucasus, while (f) Middle/
Late Bronze Age steppe populations resemble central/northern Europeans1,9. Jewish
Lazaridis et al. Page 18
Nature. Author manuscript; available in PMC 2018 February 02.
Author M
anuscriptA
uthor Manuscript
Author M
anuscriptA
uthor Manuscript
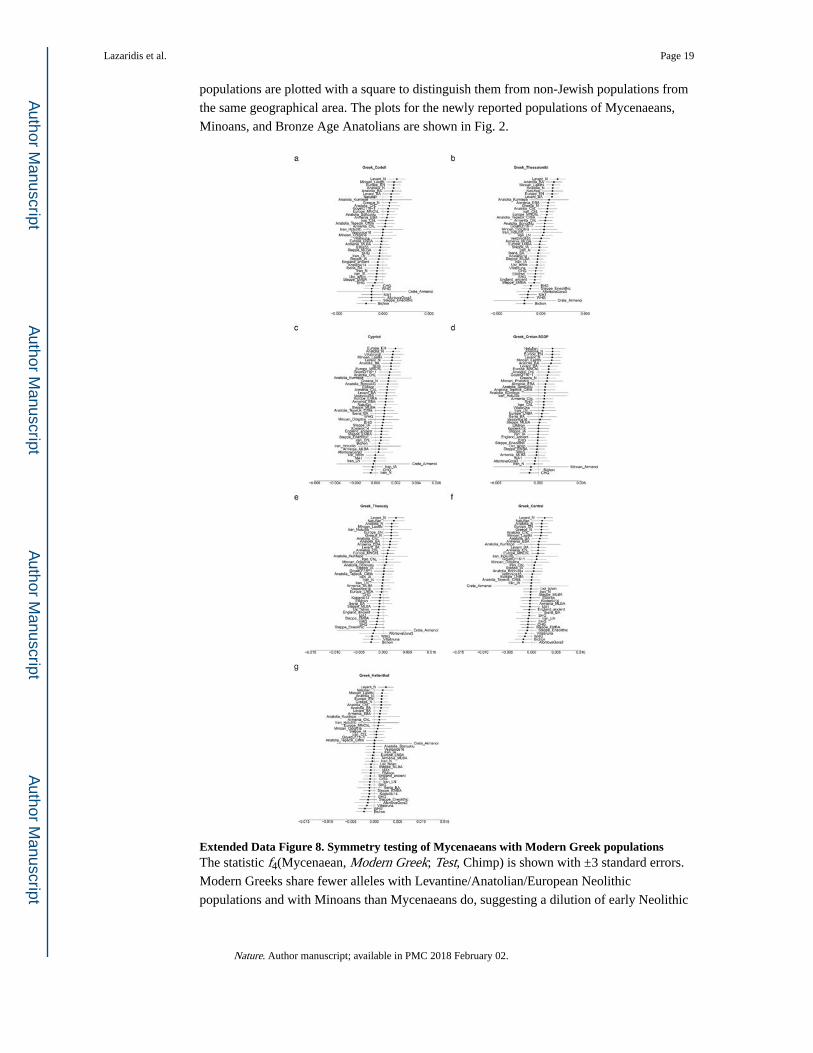
populations are plotted with a square to distinguish them from non-Jewish populations from
the same geographical area. The plots for the newly reported populations of Mycenaeans,
Minoans, and Bronze Age Anatolians are shown in Fig. 2.
Extended Data Figure 8. Symmetry testing of Mycenaeans with Modern Greek populationsThe statistic f4(Mycenaean, Modern Greek; Test, Chimp) is shown with ±3 standard errors.
Modern Greeks share fewer alleles with Levantine/Anatolian/European Neolithic
populations and with Minoans than Mycenaeans do, suggesting a dilution of early Neolithic
Lazaridis et al. Page 19
Nature. Author manuscript; available in PMC 2018 February 02.
Author M
anuscriptA
uthor Manuscript
Author M
anuscriptA
uthor Manuscript

ancestry since the Bronze Age. Human Origins genotype data: (a) Greeks from the Coriell
repository10, (b) Greeks from Thessaloniki10, (c) Cypriots10. Whole genome data: (d)
Cretans40. Illumina genotype data: (e) Greeks from Thessaly41, (f) Greeks from Central
Greece41, (g) Greeks from the study by Hellenthal et al.27
Extended Data Table 1Information on ancient samples reported in this study
Dates marked simply as BCE are based on the associated archaeology of the samples. Dates
marked as calBCE are based on radiocarbon dating of the samples (Supplementary
Information, section 1).
Individual_ID Genotype_ID Other_ID Source Date Population_Label Location Country Latitude Longitude Sex Coverage Autosomal_SNPs mtDNA Y-chromosome
I2937 I2937 A2197 1240K 5419±41cal BC
Greece_N Diros,AlepotrypaCave
Greece 36.64 22.38 F 0.870 481848 K1a26
I0071 I0071 Lasithi4 1240K 2000-1700BCE
Minoan_Lasithi HagiosCharalambosCave,Lasithi,Crete
Greece 35.08 25.83 F 7.312 953157 U5a1
I0070 I0070 Lasithi2 1240K 2000-1700BCE
Minoan_Lasithi HagiosCharalambosCave,Lasithi,Crete
Greece 35.08 25.83 M 1.267 619767 H13a1 J2a1d
I0073 I0073 Lasithi7 1240K 2000-1700BCE
Minoan_Lasithi HagiosCharalambosCave,Lasithi,Crete
Greece 35.08 25.83 M 1.481 643360 H J2a1
I0074 I0074 Lasithi9 1240K 2000-1700BCE
Minoan_Lasithi HagiosCharalambosCave,Lasithi,Crete
Greece 35.08 25.83 F 0.874 506434 H5
I9005 I9005 Lasithi17 1240K 2000-1700BCE
Minoan_Lasithi HagiosCharalambosCave,Lasithi,Crete
Greece 35.08 25.83 F 1.351 388859 H
I9006 I9006 Salamis31 1240K 1411-1262cal BCE(3067 ± 25 BP,DEM-2905)
Mycenaean AgiaKyriaki,Salamis
Greece 37.97 23.50 F 1.387 361193 X2d
I9123 I9123 S-EVA 1263Armenoi 503
1240K 1370-1340 BCE Crete_Armenoi Armenoi,Crete
Greece 35.45 24.17 F 0.041 45158 U5a1
I9127 I9127 12V t2 1240K 2900-1900BCE
Minoan_Odigitria MoniOdigitria,Heraklion,Crete
Greece 35.05 24.81 F 0.035 36475 J2b1a1
I9128 I9128 13V t2 1240K 2900-1900BCE
Minoan_Odigitria MoniOdigitria,Heraklion,Crete
Greece 35.05 24.81 F 0.016 17081 I5
I9129 I9129 14V t2 1240K 2900-1900BCE
Minoan_Odigitria MoniOdigitria,Heraklion,Crete
Greece 35.05 24.81 F 0.063 63986 H+163
I9130 I9130 16V Tholos 1240K 2900-1900BCE
Minoan_Odigitria MoniOdigitria,Heraklion,Crete
Greece 35.05 24.81 M 0.086 92186 U3b3 G2a2b2
I9131 I9131 19V t2 1240K 2900-1900BCE
Minoan_Odigitria MoniOdigitria,Heraklion,Crete
Greece 35.05 24.81 F 0.095 96946 K1a2
I9010 I9010 Galatas19 1240K 1700-1200BCE
Mycenaean GalatasApatheia,Peloponnese
Greece 37.50 23.45 F 0.379 242265 X2
I9033 I9033 Peristeria4 1240K 1416-1280cal BCE(3084 ± 24 BP,DEM-2903)
Mycenaean PeristeriaTryfilia,Peloponnese
Greece 36.92 21.70 F 0.439 248912 H
I9041 I9041 Galatas4 1240K 1700-1200BCE
Mycenaean GalatasApatheia,Peloponnese
Greece 37.50 23.45 M 1.558 417898 X2 J2a1
I2495 I2495 A4-1 1240K 2558-2295caIBCE(3925±35 BP,Poz-81111)
Anatolia_BA Harmanӧren-GӧndürleHӧyük,Isparta
Turkey 37.92 30.71 M 1.981 637146 H J1a
I2499 I2499 UC1 1240K 2836-2472caIBCE(4040±35 BP,Poz-82213)
Anatolia_BA Harmanӧren-GӧndürleHӧyük,Isparta
Turkey 37.92 30.71 F 0.285 243348 K1a2
I2683 I2683 G3-95 1240K 2500-1800BCE
Anatolia_BA Harmanӧren-GӧndürleHӧyük,Isparta
Turkey 37.92 30.71 F 3.695 749308 T2b
Lazaridis et al. Page 20
Nature. Author manuscript; available in PMC 2018 February 02.
Author M
anuscriptA
uthor Manuscript
Author M
anuscriptA
uthor Manuscript

Extended Data Table 2Phenotypic inference of ancient individuals
We list the probability assignments for different phenotypes by HIrisPlex26 and an
assessment of the phenotype. We generate 100 random replicates of the genotypes of each
individual, listing the standard deviation in parentheses (Supplementary Information, section
4).
ID Population PBlueEye PIntermediateEye PBrownEye PBlondHair PBrownHair PRedHair PBlackHair PLightHair PDarkHair Hair Color Eye Clor
I2495 Anatolia_BA 1.6 (4.4) 3.6 (3.9) 94.9 (8.3) 10.7 (6.1) 51.6 (6.4) 0.1 (0.1) 37.6 (9.3) 18.0 (11.7) 82.0 (11.7) Brown Brown
I2499 Anatolia_BA 16.6 (28.3) 7.4 (2.2) 76.0 (28.7) 2.2 (2.2) 64.7 (11.8) 2.0 (5.3) 31.1 (13.8) 12.9 (20.1) 87.1 (20.1) Brown Blue or Brown
I2683 Anatolia_BA 0.3 (0.9) 1.3 (1.7) 98.4 (2.6) 3.3 (2.5) 33.0 (4.6) 0.0 (0.0) 63.7 (7.0) 4.9 (4.5) 95.1 (4.5) Black Brown
I2937 Greece_N 0.3 (1.3) 2.2 (1.9) 97.5 (3.2) 3.6 (1.9) 33.9 (6.2) 0.1 (0.0) 62.4 (7.4) 6.7 (4.3) 93.3 (4.3) Black Brown
I0070 Minoan_Lasithi 0.4 (1.8) 2.2 (1.9) 97.4 (3.7) 30.4 (5.1) 66.4 (5.9) 3.2 (0.9) 0.0 (0.0) 100.0 (0.0) 0.0 (0.0) Brown Brown
I0071 Minoan_Lasithi 0.0 (0.0) 0.2 (0.0) 99.8 (0.0) 0.4 (0.0) 20.3 (0.0) 0.0 (0.0) 79.3 (0.0) 0.5 (0.0) 99.5 (0.0) Black Brown
I0073 Minoan_Lasithi 0.1 (0.7) 1.7 (1.4) 98.2 (2.2) 12.5 (3.4) 61.1 (1.2) 0.2 (0.1) 26.2 (2.7) 32.4 (8.8) 67.6 (8.8) Brown Brown
I0074 Minoan_Lasithi 0.0 (0.0) 1.3 (0.3) 98.7 (0.4) 9.3 (3.2) 54.8 (8.5) 0.1 (0.1) 35.8 (10.5) 18.8 (10.3) 81.2 (10.3) Brown Brown
I9005 Minoan_Lasithi 5.2 (0.0) 11.6 (0.0) 83.2 (0.0) 49.6 (1.4) 38.8 (1.2) 4.2 (0.5) 7.4 (0.7) 85.6 (1.7) 14.4 (1.7) Blond or Brown Brown
I9006 Mycenaean 0.0 (0.0) 1.1 (0.4) 98.9 (0.4) 8.7 (4.9) 59.9 (6.4) 1.8 (2.9) 29.6 (11.8) 25.7 (16.5) 74.3 (16.5) Brown Brown
I9033 Mycenaean 0.4 (1.0) 1.6 (1.9) 98.0 (3.0) 4.6 (3.9) 51.0 (6.3) 0.1 (0.5) 44.2 (9.8) 10.5 (13.2) 89.5 (13.2) Brown Brown
I9041 Mycenaean 1.4 (0.5) 5.3 (1.0) 93.3 (1.4) 7.8 (0.7) 63.2 (2.0) 0.2 (0.4) 28.7 (2.3) 21.2 (2.5) 78.8 (2.5) Brown Brown
Supplementary Material
Refer to Web version on PubMed Central for supplementary material.
Acknowledgments
We thank M. McCormick for comments and critiques, and F. Göhringer, I. Kucukkalipci and G. Brandt for wet laboratory support. We thank the Hellenic Ministry of Culture and the Hellenic Archaeological Service for reviewing and approving our studies and the personnel of the Hagios Nikolaos, Herakleion, Pireas, Olympia and Chora (Trifylia) museums for facilitating sample collection. We thank the staff of the Isparta museum and the Turkish Ministry of Culture and Tourism for facilitating work on Harmanören Göndürle samples. All maps were plotted in R using the worldHiRes map of the ‘mapdata’ package (using public domain data from the CIA World Data Bank II). Research on Hagios Charalambos cave by P.J.P.McG. was supported by the Royal Society of Great Britain and INSTAP. D.F. was supported by Irish Reseach Council grant (GOIPG/2013/36). J.K. and A.M were funded by DFG grant KR 4015/1-1 and the Max Planck Society. D.R. was supported by NIH grant GM100233, by NSF HOMINID BCS-1032255, and is a Howard Hughes Medical Institute investigator. The study of the ancient Minoans and Mycenaeans was supported by the Lucille P. Markey Charitable Trust to G.S.
References
1. Mathieson I, et al. Genome-wide patterns of selection in 230 ancient Eurasians. Nature. 2015; 528:499–503. [PubMed: 26595274]
2. Hofmanová Z, et al. Early farmers from across Europe directly descended from Neolithic Aegeans. Proceedings of the National Academy of Sciences. 2016; 113:6886–6891.
3. Jones ER, et al. Upper Palaeolithic genomes reveal deep roots of modern Eurasians. Nat Commun. 2015; 6:8912. [PubMed: 26567969]
4. Lazaridis I, et al. Genomic insights into the origin of farming in the ancient Near East. Nature. 2016; 536:419–424. [PubMed: 27459054]
5. Broushaki F, et al. Early Neolithic genomes from the eastern Fertile Crescent. Science. 2016; 353:499–503. [PubMed: 27417496]
6. Haak W, et al. Massive migration from the steppe was a source for Indo-European languages in Europe. Nature. 2015; 522:207–211. [PubMed: 25731166]
Lazaridis et al. Page 21
Nature. Author manuscript; available in PMC 2018 February 02.
Author M
anuscriptA
uthor Manuscript
Author M
anuscriptA
uthor Manuscript

7. Raghavan M, et al. Upper Palaeolithic Siberian genome reveals dual ancestry of Native Americans. Nature. 2014; 505:87–91. [PubMed: 24256729]
8. Fu Q, et al. The genetic history of Ice Age Europe. Nature. 2016; 534:200–205. [PubMed: 27135931]
9. Allentoft ME, et al. Population genomics of Bronze Age Eurasia. Nature. 2015; 522:167–172. [PubMed: 26062507]
10. Lazaridis I, et al. Ancient human genomes suggest three ancestral populations for present-day Europeans. Nature. 2014; 513:409–413. [PubMed: 25230663]
11. Evans, A. The Palace of Minos; a Comparative Account of the Successive Stages of the Early Cretan Civilization as Illustrated by the Discoveries at Knossos. Macmillan; 1921.
12. Willetts, RF. The Civilization of Ancient Crete. University of California Press; 1992.
13. Chadwick, J. The Decipherment of Linear B. 2nd. Cambridge University Press; 1967.
14. Hughey JR, et al. A European population in Minoan Bronze Age Crete. Nat Commun. 2013; 4:1861. [PubMed: 23673646]
15. Bouwman AS, Brown KA, Prag AJNW, Brown TA. Kinship between burials from Grave Circle B at Mycenae revealed by ancient DNA typing. J Archaeol Sci. 2008; 35:2580–2584.
16. Omrak A, et al. Genomic Evidence Establishes Anatolia as the Source of the European Neolithic Gene Pool. Curr Biol. 2015; 26:270–275. [PubMed: 26748850]
17. Kılınç, Gülşah M., et al. The Demographic Development of the First Farmers in Anatolia. Curr Biol. 2016; 26:2659–2666. [PubMed: 27498567]
18. Fu Q, et al. DNA analysis of an early modern human from Tianyuan Cave, China. Proc Natl Acad Sci USA. 2013; 110:2223–2227. [PubMed: 23341637]
19. Fu Q, et al. An early modern human from Romania with a recent Neanderthal ancestor. Nature. 2015; 524:216–219. [PubMed: 26098372]
20. Patterson N, Price AL, Reich D. Population structure and eigenanalysis. PLoS Genet. 2006; 2:e190. [PubMed: 17194218]
21. Kretschmer, P. Einleitung in die Geschichte der griechischen Sprache. Vandenhoeck und Ruprecht; 1896.
22. Bernal, M. Black Athena: The Afroasiatic Roots of Classical Civilization (The Fabrication of Ancient Greece 1785–1985. Vol. 1. Rutgers University Press; 1987.
23. Angel JL. Social Biology of Greek culture growth. American Anthropologist. 1946; 48:493–533. [PubMed: 20276024]
24. Wilde S, et al. Direct evidence for positive selection of skin, hair, and eye pigmentation in Europeans during the last 5,000 y. Proc Natl Acad Sci USA. 2014; 111:4832–4837. [PubMed: 24616518]
25. Dickinson, O. The Aegean Bronze Age. Cambridge University Press; 1994.
26. Walsh S, et al. The HIrisPlex system for simultaneous prediction of hair and eye colour from DNA. Forensic Science International: Genetics. 2013; 7:98–115. [PubMed: 22917817]
27. Hellenthal G, et al. A genetic atlas of human admixture history. Science. 2014; 343:747–751. [PubMed: 24531965]
28. Ralph P, Coop G. The geography of recent genetic ancestry across Europe. PLoS Biol. 2013; 11:e1001555. [PubMed: 23667324]
29. Sakellariou, MB. Les Proto-grecs. (Le peuplement de la Grace et du bassin Egéen aux hautes époques). Ekdotike Athenon; 1980.
30. Myres, JL. Who were the Greeks?. University of California Press; 1930.
31. Patterson N, et al. Ancient admixture in human history. Genetics. 2012; 192:1065–1093. [PubMed: 22960212]
32. Fu Q, et al. A Revised Timescale for Human Evolution Based on Ancient Mitochondrial Genomes. Curr Biol. 2013; 23:553–559. [PubMed: 23523248]
33. Maricic T, Whitten M, Pääbo S. Multiplexed DNA Sequence Capture of Mitochondrial Genomes Using PCR Products. PLoS ONE. 2010; 5:e14004. [PubMed: 21103372]
Lazaridis et al. Page 22
Nature. Author manuscript; available in PMC 2018 February 02.
Author M
anuscriptA
uthor Manuscript
Author M
anuscriptA
uthor Manuscript

34. Dabney J, et al. Complete mitochondrial genome sequence of a Middle Pleistocene cave bear reconstructed from ultrashort DNA fragments. Proceedings of the National Academy of Sciences. 2013; 110:15758–15763.
35. Rohland N, Harney E, Mallick S, Nordenfelt S, Reich D. Partial uracil–DNA–glycosylase treatment for screening of ancient DNA. Philosophical Transactions of the Royal Society B: Biological Sciences. 2015; 370
36. Korlevic P, et al. Reducing microbial and human contamination in DNA extractions from ancient bones and teeth. BioTechniques. 2015; 59:87–93. [PubMed: 26260087]
37. Meyer M, et al. A mitochondrial genome sequence of a hominin from Sima de los Huesos. Nature. 2013; 505:403–406. [PubMed: 24305051]
38. Renaud G, Slon V, Duggan AT, Kelso J. Schmutzi: estimation of contamination and endogenous mitochondrial consensus calling for ancient DNA. Genome Biol. 2015; 16:224. [PubMed: 26458810]
39. Korneliussen TS, Albrechtsen A, Nielsen R. ANGSD: Analysis of Next Generation Sequencing Data. BMC Bioinformatics. 2014; 15:1–13. [PubMed: 24383880]
40. Mallick S, et al. The Simons Genome Diversity Project: 300 genomes from 142 diverse populations. Nature. 2016; 538:201–206. [PubMed: 27654912]
41. Behar DM, et al. No Evidence from Genome-Wide Data of a Khazar Origin for the Ashkenazi Jews. Hum Biol. 2013; 85:859–900. [PubMed: 25079123]
42. Busby, George BJ., et al. The Role of Recent Admixture in Forming the Contemporary West Eurasian Genomic Landscape. Curr Biol. 2015; 25:2518–2526. [PubMed: 26387712]
43. Cassidy LM, et al. Neolithic and Bronze Age migration to Ireland and establishment of the insular Atlantic genome. Proceedings of the National Academy of Sciences. 2016; 113:368–373.
44. Fu Q, et al. Genome sequence of a 45,000-year-old modern human from western Siberia. Nature. 2014; 514:445–449. [PubMed: 25341783]
45. Günther T, et al. Ancient genomes link early farmers from Atapuerca in Spain to modern-day Basques. Proc Natl Acad Sci USA. 2015; 112:11917–11922. [PubMed: 26351665]
46. Llorente MG, et al. Ancient Ethiopian genome reveals extensive Eurasian admixture in Eastern Africa. Science. 2015; 350:820–822. [PubMed: 26449472]
47. Martiniano R, et al. Genomic signals of migration and continuity in Britain before the Anglo-Saxons. Nat Commun. 2016; 7:10326. [PubMed: 26783717]
48. Olalde I, et al. A common genetic origin for early farmers from Mediterranean Cardial and Central European LBK cultures. Mol Biol Evol. 2015; 32:3132–3142. [PubMed: 26337550]
49. Rasmussen M, et al. The genome of a Late Pleistocene human from a Clovis burial site in western Montana. Nature. 2014; 506:225–229. [PubMed: 24522598]
50. Rasmussen M, et al. The ancestry and affiliations of Kennewick Man. Nature. 2015; 523:455–458. [PubMed: 26087396]
51. Schiffels S, et al. Iron Age and Anglo-Saxon genomes from East England reveal British migration history. Nat Commun. 2016; 7:10408. [PubMed: 26783965]
52. Alexander DH, Novembre J, Lange K. Fast model-based estimation of ancestry in unrelated individuals. Genome Res. 2009; 19:1655–1664. [PubMed: 19648217]
53. Chang C, et al. Second-generation PLINK: rising to the challenge of larger and richer datasets. GigaScience. 2015; 4:7. [PubMed: 25722852]
54. Purcell S, et al. PLINK: a tool set for whole-genome association and population-based linkage analyses. Am J Hum Genet. 2007; 81:559–575. [PubMed: 17701901]
55. Busing FTA, Meijer E, Leeden R. Delete-m Jackknife for Unequal m. Statistics and Computing. 1999; 9:3–8.
56. Moorjani P, et al. Genetic evidence for recent population mixture in India. Am J Hum Genet. 2013; 93:422–438. [PubMed: 23932107]
57. Reich D, Thangaraj K, Patterson N, Price AL, Singh L. Reconstructing Indian population history. Nature. 2009; 461:489–494. [PubMed: 19779445]
Lazaridis et al. Page 23
Nature. Author manuscript; available in PMC 2018 February 02.
Author M
anuscriptA
uthor Manuscript
Author M
anuscriptA
uthor Manuscript

Figure 1. Samples and principal components analysis(a) Geographical locations of newly reported ancient data. Lines point to sampling locations;
jitter is added to show the number of sampled individual per location. (b) 334 ancient
individuals projected onto the first two principal components computed on a sample of 1,029
present-day West Eurasians4,5,10,31, including 30 Modern Greek samples from Greece and
Cyprus.
Lazaridis et al. Page 24
Nature. Author manuscript; available in PMC 2018 February 02.
Author M
anuscriptA
uthor Manuscript
Author M
anuscriptA
uthor Manuscript

Figure 2. Genetic differentiation of Bronze Age populations to present-day populationsWe plot the FST inbreeding coefficient (Methods) between newly reported populations and
present-day West Eurasian populations which shows a pattern of genetic affinity between
Bronze Age and present-day populations from the corresponding broad geographical
regions. (a) Mycenaeans, (b) Minoans from Hagios Charalambos (Lasithi regional unit), (c)
Minoans from Moni Odigitria (Heraklion regional unit), (d) southwestern Bronze Age
Anatolians. The same pattern also applies to Bronze Age populations from other regions of
West Eurasia (Extended Data Fig. 5).
Lazaridis et al. Page 25
Nature. Author manuscript; available in PMC 2018 February 02.
Author M
anuscriptA
uthor Manuscript
Author M
anuscriptA
uthor Manuscript

Author M
anuscriptA
uthor Manuscript
Author M
anuscriptA
uthor Manuscript
Lazaridis et al. Page 26
Tab
le 1
Adm
ixtu
re m
odel
ling
of B
ronz
e A
ge p
opul
atio
ns
For
each
test
pop
ulat
ion,
mix
ture
pro
port
ions
fro
m f
our
sour
ce p
opul
atio
ns w
ith th
eir
stan
dard
err
ors
are
give
n. A
nces
try
is in
ferr
ed f
rom
bot
h ‘u
ltim
ate’
sour
ces
repr
esen
ting
the
earl
iest
pop
ulat
ions
, and
‘pr
oxim
ate’
sou
rces
rep
rese
ntin
g po
pula
tions
dow
n to
the
Bro
nze
Age
(Su
pple
men
tary
Inf
orm
atio
n,
sect
ion
2). C
olum
n A
list
s ‘n
orth
ern’
sou
rces
fro
m e
aste
rn E
urop
e an
d Si
beri
a, in
clud
ing
the
Eur
asia
n st
eppe
; col
umn
B li
sts
‘eas
tern
’ so
urce
s fr
om I
ran,
the
Cau
casu
s, a
nd A
nato
lia (
afte
r th
e E
arly
Neo
lithi
c); c
olum
n C
list
s ‘l
ocal
’ so
urce
s fr
om A
nato
lia a
nd th
e A
egea
n; c
olum
n D
list
s so
urce
s fr
om th
e
Lev
ant.
For
abbr
evia
tions
of
popu
latio
n na
mes
see
Met
hods
.
Anc
estr
al S
ourc
esM
ixtu
re P
ropo
rtio
nsSt
anda
rd E
rror
s
Test
AB
CD
AB
CD
AB
CD
Ulti
mat
e So
urce
s
Ana
tolia
_BA
CH
GA
nato
lia_N
Lev
ant_
N0.
319
0.61
80.
063
0.02
90.
078
0.06
3
Min
oan_
Odi
gitr
iaC
HG
Ana
tolia
_N0.
144
0.85
60.
031
0.03
1
Min
oan_
Odi
gitr
iaIr
an_N
Ana
tolia
_N0.
137
0.86
30.
032
0.03
2
Min
oan_
Las
ithi
MA
1C
HG
Ana
tolia
_N0.
001
0.15
20.
847
0.01
50.
021
0.02
0
Min
oan_
Las
ithi
Mot
aC
HG
Ana
tolia
_N0.
004
0.15
40.
842
0.02
40.
026
0.02
0
Myc
enae
anA
font
ovaG
ora3
CH
GA
nato
lia_N
0.13
30.
126
0.74
10.
027
0.02
60.
024
Myc
enae
anA
font
ovaG
ora3
Iran
_NA
nato
lia_N
0.16
10.
086
0.75
40.
026
0.02
50.
024
Myc
enae
anE
HG
Iran
_NA
nato
lia_N
0.06
50.
136
0.79
90.
016
0.02
20.
024
Myc
enae
anE
HG
CH
GA
nato
lia_N
0.04
40.
176
0.78
00.
016
0.02
30.
024
Myc
enae
anM
A1
CH
GA
nato
lia_N
0.05
20.
159
0.78
90.
019
0.02
60.
024
Prox
imat
e So
urce
s
Ana
tolia
_BA
Ana
tolia
_ChL
Nat
ufia
n0.
908
0.09
20.
039
0.03
9
Ana
tolia
_BA
Ana
tolia
_ChL
Lev
ant_
BA
0.89
20.
108
0.11
40.
114
Ana
tolia
_BA
Ana
tolia
_ChL
Lev
ant_
N0.
951
0.04
90.
051
0.05
1
Ana
tolia
_BA
Ana
tolia
_ChL
Ana
tolia
_N0.
935
0.06
50.
062
0.06
2
Myc
enae
anA
rmen
ia_M
LB
AA
nato
lia_N
0.36
70.
633
0.02
00.
020
Myc
enae
anA
rmen
ia_C
hLA
nato
lia_N
0.44
10.
559
0.02
50.
025
Ana
tolia
_BA
Ana
tolia
_ChL
Min
oan_
Las
ithi
0.97
00.
030
0.10
80.
108
Myc
enae
anSt
eppe
_ML
BA
Min
oan_
Las
ithi
0.17
50.
825
0.01
70.
017
Nature. Author manuscript; available in PMC 2018 February 02.

Author M
anuscriptA
uthor Manuscript
Author M
anuscriptA
uthor Manuscript
Lazaridis et al. Page 27
Anc
estr
al S
ourc
esM
ixtu
re P
ropo
rtio
nsSt
anda
rd E
rror
s
Test
AB
CD
AB
CD
AB
CD
Myc
enae
anE
urop
e_L
NB
AM
inoa
n_L
asith
i0.
198
0.80
20.
019
0.01
9
Myc
enae
anSt
eppe
_EM
BA
Min
oan_
Las
ithi
0.13
20.
868
0.01
40.
014
Nature. Author manuscript; available in PMC 2018 February 02.