Genetic diversity of Asian water buffalo: microsatellite variation and a comparision with...
13
Summary Twenty-one microsatellite loci in 11 popula- tions of Asian water buffalo (eight swamp, three river type) were analysed and, within and among populations, genetic variability was compared with results from 25 polymorphic protein-coding loci. Within-population mean heterozygosity ranged from 0·380–0·615, approximately twice that estimated from the protein-coding loci (0·184–0·346). Only eight significant departures from Hardy–Weinberg equilibrium (involving four loci) were detected; global tests showed significant heterozygote deficiencies for these four loci. Non-amplifying alleles are likely to be segregating in some or all populations for one of these loci, and probably for the other three. There was significant differ- entiation between the swamp and river types of water buffalo, and among populations within each buffalo type. Estimates of θ (measure of population differentiation) for each locus for the eight swamp populations were all highly significant (mean θ = 0·168 ± 0·018). Mean θ for protein-coding loci was not significantly differ- ent (0·182 ± 0·041). The variance among pro- tein-coding loci was significantly higher than among microsatellite loci, suggesting balancing selection affecting allele frequencies at some protein-coding loci. Genetic distances show clear separation of the swamp and river types, which were estimated to have diverged at least 10 000–15 000 years ago. The topology of the swamp populations’ microsatellite tree is con- sistent with their geographical distribution and their presumed spread through south-east Asia. By contrast, the tree based on the protein-cod- ing loci distances is quite different, being clearly distorted by a bottleneck effect in one population, and possibly in at least two others. As many domestic livestock breeds are possibly descended from small numbers of founders, microsatellite-based trees are to be preferred in assessing breed genetic relationships. Keywords: allozymes, Asian water buffalo, Bubalus bubalis, genetic diversity, microsatel- lites, molecular phylogenetics Introduction In domestic livestock species, subdivision or structuring is generally more obvious than in wild species, in that separate breeds are recog- nized. In the broadest sense, the term breed includes strains and populations, the members of which are distinguished from other such groups in local, national or regional usage; i.e. a breed is a cultural entity, recognized as such by the community where it is found. Early studies of livestock breeds (Rendel 1967; Kidd 1974) emphasized breed relationships, not just the magnitude of differentiation, and the objectives of these and later studies have been to aid in understanding domestication, breed origins and their history and evolution, to identify geneti- cally unique breeds, to provide an objective basis for conservation decisions and to aid the formulation of breeding plans (Barker 1994). Until very recently, the many studies of genetic structure have used allele frequency data at protein coding (primarily allozyme) loci (e.g. Ward et al. 1992 summarize results for more than 300 animal species). Since the late 1970s, molecular methods have provided new markers for the study of genetic variation, even to the level of analysis at the DNA sequence itself (Hillis & Moritz 1990; Avise 1994). Among these molecular markers, simple- sequence repeat (microsatellite) loci have been found to be common in all eukaryotic genomes so far examined, with frequencies as high as one every 6 kb (Beckmann & Weber 1992). As microsatellites are also highly polymorphic, they provide extremely useful markers for com- parative studies of genetic variation, parentage assessment and studies of gene flow and hybridization (Bruford & Wayne 1993; Roy et al. 1994), and could well be the markers of choice for analyses of population structure in both wild (Scribner et al. 1994) and domesticated species (MacHugh et al. 1994; van Zeveren et al. 1995). In the study of livestock breeds where the pri- mary focus is on estimating breed relationships, it is assumed that the markers are neutral to Animal Genetics, 1997, 28, 103–115 103 Genetic diversity of Asian water buffalo (Bubalus bubalis): microsatellite variation and a compari- son with protein-coding loci J S F Barker, S S Moore, D J S Hetzel, D Evans, S G Tan, K Byrne J S F Barker Department of Animal Science, University of New England, Armidale NSW 2351, Australia S S Moore D J S Hetzel D Evans K Byrne CSIRO Division of Tropical Animal Production, Molecular Animal Genetics Centre, University of Queensland, Brisbane, Australia S G Tan Department of Biology, Universiti Pertanian Malaysia, 43400 UPM, Serdang, Malaysia Correspondence: J S F Barker. Accepted 29 November 1996 © 1997 International Society for Animal Genetics
Transcript of Genetic diversity of Asian water buffalo: microsatellite variation and a comparision with...
Summary
Twenty-one microsatellite loci in 11 popula-tions of Asian water buffalo (eight swamp, threeriver type) were analysed and, within andamong populations, genetic variability wascompared with results from 25 polymorphicprotein-coding loci. Within-population meanheterozygosity ranged from 0·380–0·615,approximately twice that estimated from theprotein-coding loci (0·184–0·346). Only eightsignificant departures from Hardy–Weinbergequilibrium (involving four loci) were detected;global tests showed significant heterozygotedeficiencies for these four loci. Non-amplifyingalleles are likely to be segregating in some or allpopulations for one of these loci, and probablyfor the other three. There was significant differ-entiation between the swamp and river types ofwater buffalo, and among populations withineach buffalo type. Estimates of θ (measure ofpopulation differentiation) for each locus forthe eight swamp populations were all highlysignificant (mean θ = 0·168 ± 0·018). Mean θ forprotein-coding loci was not significantly differ-ent (0·182 ± 0·041). The variance among pro-tein-coding loci was significantly higher thanamong microsatellite loci, suggesting balancingselection affecting allele frequencies at someprotein-coding loci. Genetic distances showclear separation of the swamp and river types,which were estimated to have diverged at least10 000–15 000 years ago. The topology of theswamp populations’ microsatellite tree is con-sistent with their geographical distribution andtheir presumed spread through south-east Asia.By contrast, the tree based on the protein-cod-ing loci distances is quite different, beingclearly distorted by a bottleneck effect in onepopulation, and possibly in at least two others.As many domestic livestock breeds are possiblydescended from small numbers of founders,microsatellite-based trees are to be preferred inassessing breed genetic relationships.
Keywords: allozymes, Asian water buffalo,
Bubalus bubalis, genetic diversity, microsatel-lites, molecular phylogenetics
Introduction
In domestic livestock species, subdivision orstructuring is generally more obvious than inwild species, in that separate breeds are recog-nized. In the broadest sense, the term breedincludes strains and populations, the membersof which are distinguished from other suchgroups in local, national or regional usage; i.e. abreed is a cultural entity, recognized as such bythe community where it is found. Early studiesof livestock breeds (Rendel 1967; Kidd 1974)emphasized breed relationships, not just themagnitude of differentiation, and the objectivesof these and later studies have been to aid inunderstanding domestication, breed origins andtheir history and evolution, to identify geneti-cally unique breeds, to provide an objectivebasis for conservation decisions and to aid theformulation of breeding plans (Barker 1994).
Until very recently, the many studies ofgenetic structure have used allele frequencydata at protein coding (primarily allozyme) loci(e.g. Ward et al. 1992 summarize results formore than 300 animal species). Since the late1970s, molecular methods have provided newmarkers for the study of genetic variation, evento the level of analysis at the DNA sequenceitself (Hillis & Moritz 1990; Avise 1994).
Among these molecular markers, simple-sequence repeat (microsatellite) loci have beenfound to be common in all eukaryotic genomesso far examined, with frequencies as high as oneevery 6 kb (Beckmann & Weber 1992). Asmicrosatellites are also highly polymorphic,they provide extremely useful markers for com-parative studies of genetic variation, parentageassessment and studies of gene flow andhybridization (Bruford & Wayne 1993; Roy et al.1994), and could well be the markers of choicefor analyses of population structure in both wild(Scribner et al. 1994) and domesticated species(MacHugh et al. 1994; van Zeveren et al. 1995).
In the study of livestock breeds where the pri-mary focus is on estimating breed relationships,it is assumed that the markers are neutral to
Animal Genetics,1997, 28, 103–115
103
Genetic diversity of Asian water buffalo (Bubalusbubalis): microsatellite variation and a compari-son with protein-coding lociJ S F Barker, S S Moore, D J S Hetzel, D Evans, S G Tan, K Byrne
J S F BarkerDepartment of AnimalScience, University ofNew England, ArmidaleNSW 2351, AustraliaS S MooreD J S HetzelD EvansK ByrneCSIRO Division ofTropical AnimalProduction, MolecularAnimal Genetics Centre,University ofQueensland, Brisbane,AustraliaS G Tan Department of Biology,Universiti PertanianMalaysia, 43400 UPM,Serdang, Malaysia
Correspondence: J S F Barker.
Accepted 29 November 1996
© 1997 International Society for Animal Genetics

selection and the populations are in equilibriumunder drift and migration, so that the breed sim-ilarities reflect common ancestry. This may notbe true for all classes of markers, or for particu-lar markers within a class, so our understandingof population structure and breed relationshipswill benefit from comparative studies utilizingdifferent classes of markers. Where results areconcordant, support for the estimated relation-ships will be increased, where they are not,investigating reasons for the difference willincrease our understanding of factors affectingstructure and relationships.
Barker et al. (1996) presented an analysis of 17water buffalo populations of south-east Asia,using data on 53 protein-coding (primarilyallozyme) loci (25 polymorphic). We presenthere the results from an analysis of 21microsatellite loci, assayed in a subset of thesame animals in 11 of these populations.Relationships between the swamp and rivertypes and among geographically distinct swamppopulations are considered, and measures ofgenetic structure and relationships, derivedfrom the allozyme and microsatellite data, arecompared.
Materials and methods
Sample collection
Blood collection and treatment was as describedby Barker et al. (1996). DNA from the whiteblood cell samples was extracted by an organicsolvent method. The white cells were washed in
phosphate-buffered saline by alternate centrifu-gation and resuspension, then lysed with SDSdetergent in the present of 10 mM Tris buffer(pH 7·8), 25 mM EDTA and 100 µg/ml pro-teinase-K. The samples were then incubated at55°C for 60 min, following which incubationwas continued overnight in a shaking waterbathat 37°C. The sample was then extracted with anequal volume mix of saturated NaCl and chloro-form. The aqueous phase of this extraction wascombined with twice its volume of ethanol toprecipitate the DNA, which was washed in 70%ethanol and, finally, resuspended in 10 mMTris/25 mM EDTA buffer.
The populations and numbers of animals (inbrackets) studied were as follows. Swamp buf-falo: Thailand - Surin (25); Malaysia -Trengganu(25), Sabah (25), Sarawak (25); Indonesia - Bogor(25), Sulawesi (25); Philippines - Musuan (26);and Australia (23). Lankan buffalo: South SriLanka (23). River buffalo: Sri Lanka - Murrah(25); and Malaysia - Murrah (14). For each popu-lation, the animals assayed were a subset ofthose used by Barker et al. (1996) (see theirFig. 1 for the location of each population).
Microsatellite isolation and genotype assay
Forty-six of a panel of 80 bovine microsatelliteswere polymorphic in a sample of five swampbuffalo; 21 of these microsatellites were chosenfor this study based solely on the ‘robustness’(yield and reproducibility) of the amplification(Moore et al. 1995). Fifty micrograms of buffaloDNA was used as template for polymerase chain
104Barker, Moore,Hetzel, Evans, Tan,Byrne
© 1997 International Society for Animal Genetics, Animal Genetics 28, 103–115
Fig. 1. Allele frequency distribution for microsatellite locus CSSM036, where the same allele was at the highestfrequency in both swamp and river buffalo. Open bars, swamp populations; filled bars, river populations.

reaction (PCR) as described by Moore et al.(1995). Visualization was achieved by incorpo-ration of [32P-dCTP] during the PCR cycles andsubsequent autoradiography of dried gels.Allele sizes were determined by comparisonwith pUC19 sequencing ladders. The numberof animals genotyped per population–locuscombination was generally less than the num-ber sampled per population. For 11 animals,the amount of DNA available enabled genotyp-ing of only 3–13 loci. A further 24 animalsfailed to amplify for three or more (up to 10)loci, presumably because of poor quality DNA.All cases, where amplification failed, werererun at least once.
Statistical analyses
Allele frequencies and mean heterozygosity esti-mates for each population were obtained usingthe BIOSYS-1 computer program (Swofford &Selander 1989). Tests of genotype frequenciesfor deviations from Hardy–Weinberg equilib-rium were carried out using the exact tests of thecomputer program GENEPOP (Raymond & Rousset1995). Significance levels for each test weredetermined by applying, to the probability esti-mates calculated by GENEPOP, the sequentialBonferroni procedure (Hochberg 1988; Lessios1992) over loci within each population.
The number of alleles expected under the infi-nite alleles neutral mutation model for eachlocus in each population was computed (Ewens1972; Ely et al. 1992 – correcting equation 5 inthe latter paper by replacing unity in the numer-ators with θ). Means of observed and expectednumbers of alleles were calculated for eachlocus, separately for swamp and river types, andpaired t-tests were performed to determine ifthere were significant differences.
Hierarchical F-statistics were computed byusing the methods of Weir & Cockerham (1984),as implemented in the computer program GDA
(P. Lewis, personal communication), and thesignificance of F-statistics estimates was deter-mined using the permutation tests in the FSTAT
program (Goudet 1995). The sequentialBonferroni procedure was applied over loci inderiving significance levels. Mean gene diver-sity for each locus and genetic distances amongpopulations (standard genetic distance of Nei(1978) and the DA distance of Nei et al. (1983))were obtained using the DISPAN computer pro-gram (T. Ota, personal communication). The(δµ)2 distances (Goldstein et al. 1995) amongpopulations were obtained using the MICROSAT
computer program (Minch et al. 1995) andReynold’s distances (Reynolds et al. 1983) using
PHYLIP 3·5c (Felsenstein 1993). The method ofSlatkin (1993), as implemented in GENEPOP, wasused to assess the genetically effective migrationrate (M̂= Nm, the number of migrants exchangedper generation), and to test for isolation by dis-tance. Pairwise values of Nm were calculatedfrom θ (Weir & Cockerham 1984). The pairwiselog (Nm) values were then correlated with log(geographic distance) between each pair of pop-ulations, and the significance of the associationestimated using Mantel’s (1967) permutationtest. A significant association indicates geneticstructuring, and limited dispersal.
Estimates of Nei’s standard genetic distance(D) and assumed mutation rates of microsatelliteloci (α) were used to estimate the time of diver-gence (t, in generations) between the swamp andriver buffalo types, between swamp and theLankan buffalo, and among swamp populations,where D = 2αt (Nei 1976).
Results
In all presentation of results, the Lankan buffalo(South Sri Lanka population) is grouped with thetwo Murrah breed populations as river buffalo,although morphologically it resembles theswamp type. This classification is based on cyto-logical evidence – both Lankan and river buffalohave the same chromosome number (2n = 50), ascompared with swamp buffalo (2n = 48)(Scheurmann et al. 1974; Bongso et al. 1977),and on the phylogenetic relationships derivedusing protein-coding loci (Barker et al. 1996).
Genetic variability
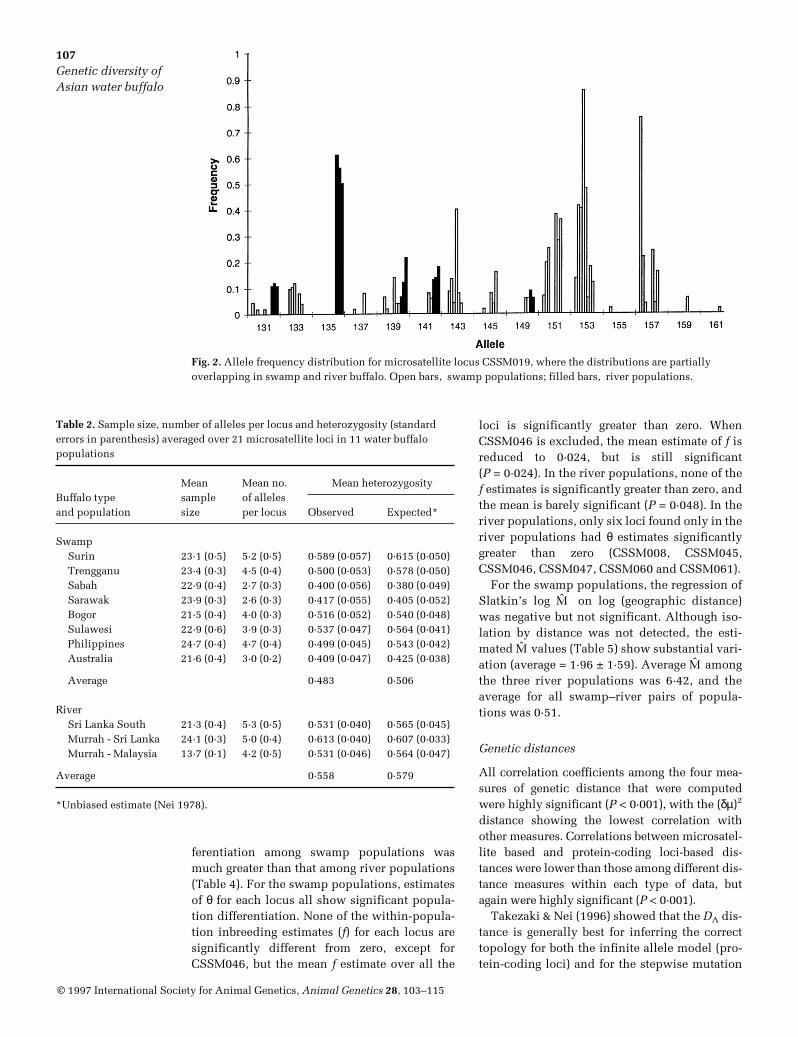
A table of allele frequencies for each of the 21microsatellite loci in each of the 11 populationsis available from the senior author of this article(J S F Barker). The number of alleles observed ateach locus in the swamp and river types, and thenumbers shared between the two types, aregiven in Table 1. The number of alleles per locusvaried from two (CSSM015) to 20 (CSSM047),but only for locus CSSM015 were all detectedalleles found in both swamp and river types.The mean number of alleles per locus is similarin the two types, but there are marked differ-ences for some loci, e.g. CSSM019 with 14 alle-les in swamp buffalo and only five in river buf-falo; CSSM047 with nine alleles in swampbuffalo and 18 in river buffalo. Other loci showsimilar numbers of alleles in the two buffalotypes, but with very few common to both (e.g.CSSM041 and CSRM060). Representative allelefrequency distributions (Figs 1 & 2) give exam-ples where (1) the same allele is at the highest
105Genetic diversity ofAsian water buffalo
© 1997 International Society for Animal Genetics, Animal Genetics 28, 103–115
frequency in both types and distributions aresimilar (CSSM036), and (2) alleles at the highestfrequency in one type are absent from the other,and the overall distribution is bimodal(CSSM019). Average gene diversity (Nei 1973)over all loci is 0·514 (Table 1) while, for individ-ual loci, average gene diversities range from0·104 (HMH1R) to 0·711 (CSSM047). Acrossloci, average gene diversity increases withincreasing number of alleles (regression coeffi-cient = 0·021 ± 0·006, P < 0·01). Two loci, HMH1Rand CSSM045, appear to be outliers with thelowest diversity estimates but, even when theseare excluded, the regression coefficient of genediversity on number of alleles remains signifi-cant (b = 0·013 ± 0·004, P < 0·01).
Seventeen loci were polymorphic in all popu-lations, while four were monomorphic in one tothree populations (namely CSSM038 in Sabahand Sarawak; CSSM045 in Sabah, Sarawak andSurin; BRN in Sarawak; and HMH1R in Sabahand Sarawak). Measures of genetic variation foreach population (mean number of alleles perlocus and observed and expected heterozygos-ity) are given in Table 2. Observed heterozygos-
ity is, on average, less than expected in bothtypes, and heterozygosity is lower in swampbuffalo than in the river type. Among popula-tions, heterozygosity is lower in Sabah, Sarawakand Australia.
Of the 231 locus–population combinations,only eight showed significant deviations ofobserved genotypic proportions from Hardy–Weinberg equilibrium. Six populations had asignificant test for only one locus, and one pop-ulation (Surin) had two, with all eight showing adeficiency of heterozygotes. These significantdeviations involved four loci (CSSM022,Trengganu; CSSM033, Sarawak and Sri LankaSouth; CSSM046, Australia, Philippines, Sabahand Surin; and CSRM060, Surin); the globaltests across populations were significant onlyfor these four loci. For locus CSSM046, all popu-lations except Murrah Sri Lanka showed anobserved deficiency of heterozygotes.
Expected numbers of alleles
The number of alleles expected, under the infi-nite alleles model of neutral mutation, was cal-culated separately for the swamp and river typesand compared with the numbers observed(Table 3). In paired t-tests for each of the 21 loci,15 were significant for swamp, and four forriver, with the observed number less thanexpected in every case. With only three popula-tions of the river type, the test is not sensitive.There is no statistical test yet available of thenumber of alleles expected under the stepwisemutation model, but the high proportion of sig-nificant differences from the infinite allelesmodel indicate a likely closer fit to the stepwisemutation than to the infinite alleles model.
Analyses of F-statistics
Although our data suggest a closer fit to the step-wise mutation model, Weir & Cockerham’s(1984) θ statistic is used here, rather than theRST statistic of Slatkin (1995), which wasderived specifically under the assumptions ofthe generalized stepwise model. RST and θ arenot expected to be greatly different for short-term differentiation of populations within aspecies (Slatkin 1995), and we wish to comparethese microsatellite results with those from pro-tein-coding loci (Barker et al. 1996). Mean esti-mates from jackknifing over loci for θT (differen-tiation between types, i.e. swamp vs. river) andθS (differentiation between populations withintypes) were 0·178 ± 0·037 and 0·295 ± 0·030,respectively. However, separate analyses ofswamp and river populations showed that dif-
106Barker, Moore,Hetzel, Evans, Tan,Byrne
© 1997 International Society for Animal Genetics, Animal Genetics 28, 103–115
Table 1. Number of microsatellite alleles at each locus in swamp and riverbuffalo, number shared between the two types and average gene diversity withinpopulations
Numbers of allelesAverage gene
Locus Total Swamp River Shared diversity
CSSM008 7 5 7 (5 0·555CSSM013* 5 5 2 (2 0·499CSSM015 2 2 2 (2 0·406CSSM019 15 14 5 (4 0·640CSSM022 6 5 6 (5 0·431CSSM029 11 10 5 (4 0·532CSSM032 9 7 6 (4 0·549CSSM033 11 9 7 (5 0·601CSSM036* 7 5 7 (5 0·583CSSM038 13 8 9 (4 0·486CSSM041 11 7 5 (1 0·514CSSM043 12 9 9 (6 0·683CSSM045 7 6 4 (3 0·249CSSM046* 6 5 4 (3 0·506CSSM047 20 9 18 (7 0·711CSSM057 11 10 7 (6 0·652CSRM060 15 8 9 (2 0·508CSSM061 12 9 10 (7 0·594CSSM062 8 5 6 (3 0·541BRN 10 9 6 (5 0·443HMH1R* 3 2 2 (1 0·104
Mean/locus 9·57 7·10 6·48 (4·00 0·514(SE) (0·94) (0·62) (0·76) (0·39)
*Same allele is at highest frequency in both types.
ferentiation among swamp populations wasmuch greater than that among river populations(Table 4). For the swamp populations, estimatesof θ for each locus all show significant popula-tion differentiation. None of the within-popula-tion inbreeding estimates (f) for each locus aresignificantly different from zero, except forCSSM046, but the mean f estimate over all the
loci is significantly greater than zero. WhenCSSM046 is excluded, the mean estimate of f isreduced to 0·024, but is still significant(P = 0·024). In the river populations, none of thef estimates is significantly greater than zero, andthe mean is barely significant (P = 0·048). In theriver populations, only six loci found only in theriver populations had θ estimates significantlygreater than zero (CSSM008, CSSM045,CSSM046, CSSM047, CSSM060 and CSSM061).
For the swamp populations, the regression ofSlatkin’s log M̂ on log (geographic distance)was negative but not significant. Although iso-lation by distance was not detected, the esti-mated M̂ values (Table 5) show substantial vari-ation (average = 1·96 ± 1·59). Average M̂ amongthe three river populations was 6·42, and theaverage for all swamp–river pairs of popula-tions was 0·51.
Genetic distances
All correlation coefficients among the four mea-sures of genetic distance that were computedwere highly significant (P < 0·001), with the (δµ)2
distance showing the lowest correlation withother measures. Correlations between microsatel-lite based and protein-coding loci-based dis-tances were lower than those among different dis-tance measures within each type of data, butagain were highly significant (P < 0·001).
Takezaki & Nei (1996) showed that the DA dis-tance is generally best for inferring the correcttopology for both the infinite allele model (pro-tein-coding loci) and for the stepwise mutation
107Genetic diversity ofAsian water buffalo
© 1997 International Society for Animal Genetics, Animal Genetics 28, 103–115
Fig. 2. Allele frequency distribution for microsatellite locus CSSM019, where the distributions are partiallyoverlapping in swamp and river buffalo. Open bars, swamp populations; filled bars, river populations.
Table 2. Sample size, number of alleles per locus and heterozygosity (standard errors in parenthesis) averaged over 21 microsatellite loci in 11 water buffalo populations
Mean Mean no. Mean heterozygosityBuffalo type sample of allelesand population size per locus Observed Expected*
SwampSurin 23·1 (0·5) 5·2 (0·5) 0·589 (0·057) 0·615 (0·050)Trengganu 23·4 (0·3) 4·5 (0·4) 0·500 (0·053) 0·578 (0·050)Sabah 22·9 (0·4) 2·7 (0·3) 0·400 (0·056) 0·380 (0·049)Sarawak 23·9 (0·3) 2·6 (0·3) 0·417 (0·055) 0·405 (0·052)Bogor 21·5 (0·4) 4·0 (0·3) 0·516 (0·052) 0·540 (0·048)Sulawesi 22·9 (0·6) 3·9 (0·3) 0·537 (0·047) 0·564 (0·041)Philippines 24·7 (0·4) 4·7 (0·4) 0·499 (0·045) 0·543 (0·042)Australia 21·6 (0·4) 3·0 (0·2) 0·409 (0·047) 0·425 (0·038)
Average 0·483 0·506
RiverSri Lanka South 21·3 (0·4) 5·3 (0·5) 0·531 (0·040) 0·565 (0·045)Murrah - Sri Lanka 24·1 (0·3) 5·0 (0·4) 0·613 (0·040) 0·607 (0·033)Murrah - Malaysia 13·7 (0·1) 4·2 (0·5) 0·531 (0·046) 0·564 (0·047)
Average 0·558 0·579
*Unbiased estimate (Nei 1978).
model (microsatellites). Therefore, to allowdirect comparison with results from protein-coding loci (Barker et al. 1996), the DA distancehas been used for detailed presentation ofgenetic distances (Table 6), and a dendrogram ofgenetic relationships among the populations(Fig. 3A) has been constructed as a neighbour-joining tree (Saitou & Nei 1987). Most nodes arestrongly supported, and the overall topology ofthe swamp populations is consistent with theirgeography. The low bootstrap value (34%) andshort branch length for the Bogor/Australia nodeis as expected, as the Australian populationdescends from some 80 animals imported fromTimor (and possibly Java) between 1826 and1843 (Letts 1962; Tulloch 1974). Neighbour-joining trees, using (δµ)2 and Reynold’s dis-tances showed some differences in topologyfrom each other, and from the DA distance tree,while the tree based on Nei’s standard geneticdistance (D) had the same topology as that usingthe Reynold’s distance. All microsatellite-basedtrees have a clear separation of the swamp andriver (including the Lankan buffalo) types, fullysupporting the cytological and protein-codingloci differentiation.
However, the DA distance tree derived fromprotein-coding loci (Fig. 3B) shows major differ-ences in branch lengths and in the topology forthe swamp populations, as compared with theDA distance microsatellite tree (Fig. 3A). Meangenetic distances among swamp populationswere 0·228 from microsatellites and 0·098 fromprotein-coding loci and, between the swampand river types, 0·897 and 0·173, respectively(using Nei’s standard genetic distance, as thismeasure has been used most commonly in pre-vious allozyme studies of population differenti-ation and relationships).
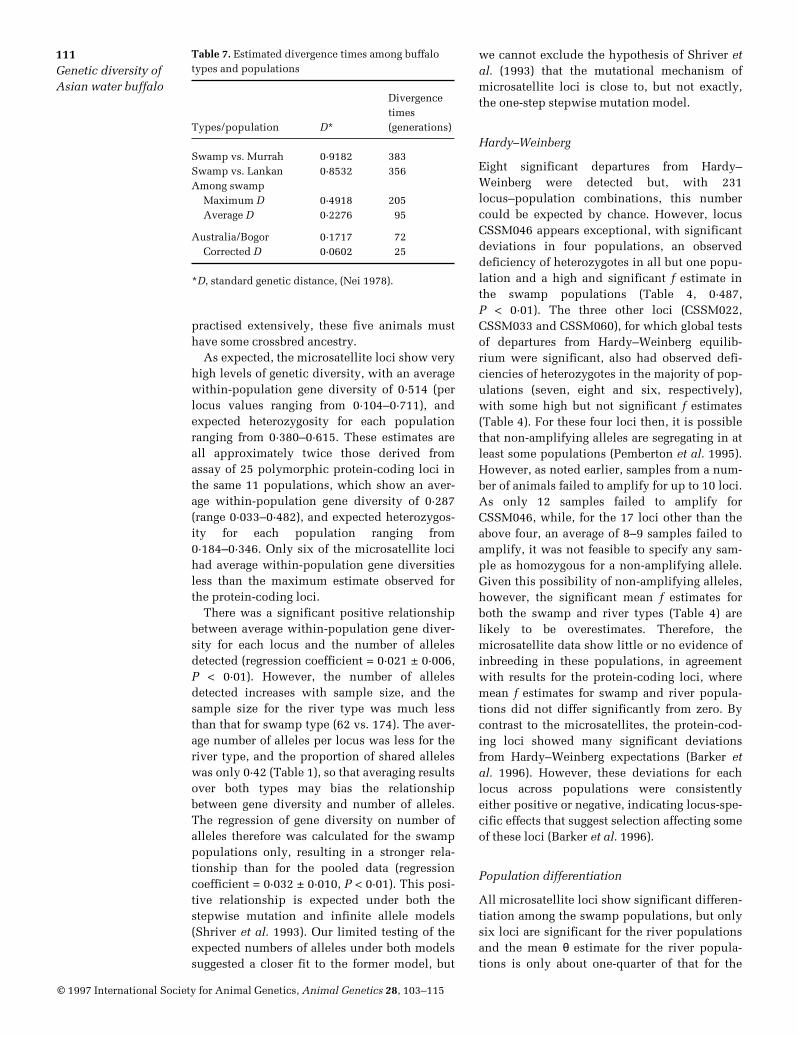
Estimation of divergence times
Rates of mutation will vary at differentmicrosatellite loci, and we have used the aver-age for 28 human loci (1·2 x 10–3) from Weber &Wong (1993) in calculating divergence times(Table 7). As noted earlier, historical evidence isavailable for the time of origin of the Australianpopulation (1826–1843) and for its source popu-lation (Timor and possibly Java). Assuming ageneration interval of 8–10 years, the Australianpopulation separated 16–20 generations ago. Ifwe take the Bogor (Java) population as repre-senting the ancestral population, the estimate ofthis separation time is too long at 72 genera-tions. However, the Australian populationdescends from only about 80 animals and,allowing for this bottleneck (Nei 1987;equation 9·64), the corrected D is 0·0602 and theestimated divergence time is 25 generations – invery good agreement with the actual time.
Discussion
Swamp and river buffalo are recognized as twotypes of a single species that are differentiatedon morphological, behavioural and cytologicalcriteria, and whose endemic distributions areparapatric. The swamp type exists throughoutsouth-east Asia, from Assam and Nepal in thewest to the Yangtze Valley of China, while theriver type is native to the Indian subcontinent,but has spread west to the Balkans, Italy andEgypt within historical times (Cockrill 1974).Furthermore, the two types are interfertile.Although Garza et al. (1995) and Moore et al.(1995) have cautioned that alleles of the samesize in different species may be non-identical bydescent, we assume that the swamp and rivertypes are sufficiently closely related that suchnon-identity by descent would be, at least, veryunlikely. More alleles were detected in theswamp type for most loci (see Table 1; CSSM047was exceptional, with twice as many alleles in
108Barker, Moore,Hetzel, Evans, Tan,Byrne
© 1997 International Society for Animal Genetics, Animal Genetics 28, 103–115
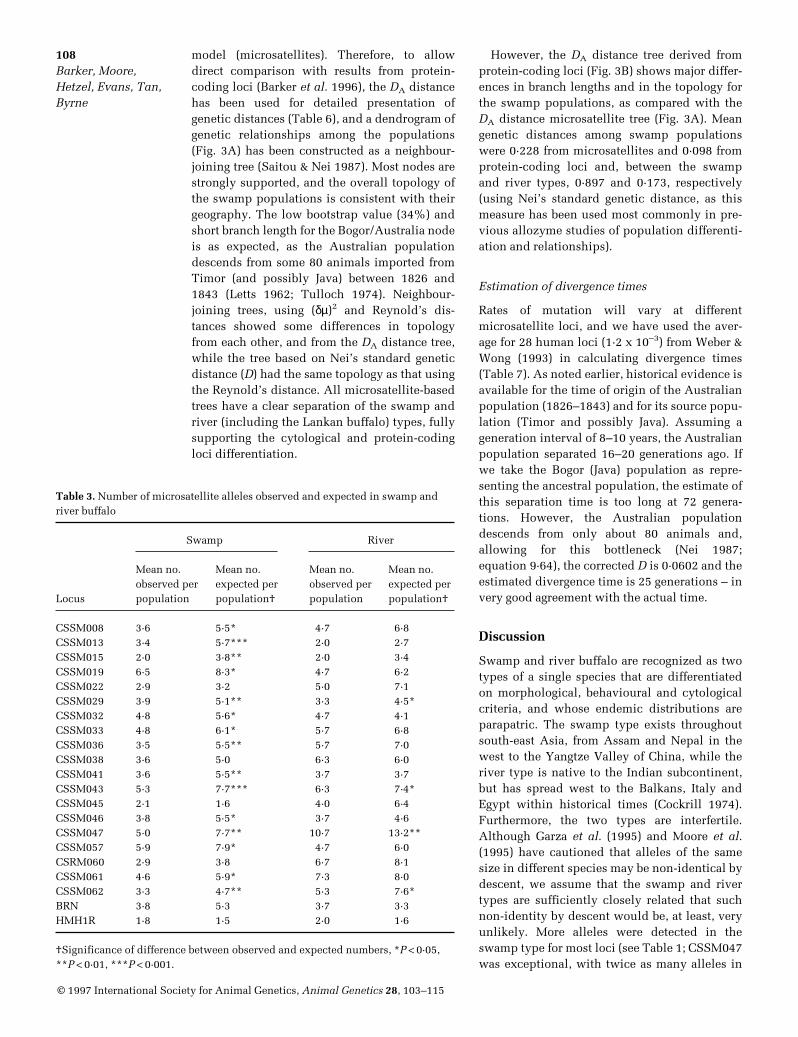
Table 3. Number of microsatellite alleles observed and expected in swamp andriver buffalo
Swamp River
Mean no. Mean no. Mean no. Mean no.observed per expected per observed per expected per
Locus population population† population population†
CSSM008 3·6 5·5* 4·7 6·8CSSM013 3·4 5·7*** 2·0 2·7CSSM015 2·0 3·8** 2·0 3·4CSSM019 6·5 8·3* 4·7 6·2CSSM022 2·9 3·2 5·0 7·1CSSM029 3·9 5·1** 3·3 4·5*CSSM032 4·8 5·6* 4·7 4·1CSSM033 4·8 6·1* 5·7 6·8CSSM036 3·5 5·5** 5·7 7·0CSSM038 3·6 5·0 6·3 6·0CSSM041 3·6 5·5** 3·7 3·7CSSM043 5·3 7·7*** 6·3 7·4*CSSM045 2·1 1·6 4·0 6·4CSSM046 3·8 5·5* 3·7 4·6CSSM047 5·0 7·7** 10·7 13·2**CSSM057 5·9 7·9* 4·7 6·0CSRM060 2·9 3·8 6·7 8·1CSSM061 4·6 5·9* 7·3 8·0CSSM062 3·3 4·7** 5·3 7·6*BRN 3·8 5·3 3·7 3·3HMH1R 1·8 1·5 2·0 1·6
†Significance of difference between observed and expected numbers, *P < 0·05,**P < 0·01, ***P < 0·001.

river buffalo as in swamp buffalo), and an aver-age of 42% of the alleles detected were sharedbetween the two types. As only 62 river-typeanimals in three populations were assayed, withtwo of these populations being the same breed,the numbers of alleles in the river type and the
proportion of shared alleles are minimal esti-mates. Even so, marked differences in the allelefrequency distributions (e.g. CSSM019; seeFig. 2) are common. For eight loci, the most fre-quent allele in one type is absent or at low fre-quency in the other type. Three further loci
© 1997 International Society for Animal Genetics, Animal Genetics 28, 103–115
109Genetic diversity ofAsian water buffalo
Table 4. F-statistics analyses for (1) each of 21 microsatellite loci in eight swamp buffalo and three river buffalo populations, and (2) meanestimates for these populations
Swamp River
f θ F f θ F
Locus†
CSSM008 –0·034 (0·073) 0·251 (0·130)*** 0·223 (0·134)** –0·033 (0·084) –0·117 (0·081)** –0·150 (0·140)CSSM013 –0·011 (0·085) 0·033 (0·018)** 0·023 (0·098) –0·001 (0·098) –0·028 (0·033) –0·032 (0·132)CSSM015 –0·040 (0·087) 0·133 (0·082)*** 0·097 (0·098) –0·192 (0·117) –0·078 (0·125) –0·105 (0·150)CSSM019 –0·082 (0·046) 0·197 (0·080)*** 0·262 (0·069)** –0·055 (0·049) –0·012 (0·016) –0·069 (0·032)CSSM022 –0·162 (0·158) 0·189 (0·068)*** 0·314 (0·104)** –0·077 (0·132) –0·040 (0·032) –0·035 (0·126)CSSM029 –0·039 (0·062) 0·239 (0·066)*** 0·208 (0·070)** –0·294 (0·100) –0·007 (0·006) –0·301 (0·108)CSSM032 –0·001 (0·073) 0·030 (0·011)*** 0·029 (0·067) –0·008 (0·051) –0·032 (0·040) –0·026 (0·089)CSSM033 –0·120 (0·078) 0·179 (0·086)*** 0·273 (0·058)** –0·206 (0·035) –0·047 (0·006) –0·243 (0·035)**CSSM036 –0·001 (0·068) 0·105 (0·034)*** 0·104 (0·068) –0·095 (0·181) –0·012 (0·030) –0·111 (0·201)CSSM038 –0·003 (0·069) 0·201 (0·069)*** 0·199 (0·085)** –0·010 (0·009) –0·011 (0·028) –0·021 (0·028)CSSM041 –0·037 (0·068) 0·061 (0·020)*** 0·027 (0·075) –0·048 (0·101) –0·028 (0·060) –0·074 (0·118)CSSM043 –0·029 (0·054) 0·064 (0·023)*** 0·090 (0·036) –0·177 (0·051) –0·002 (0·007) –0·175 (0·047)CSSM045 –0·063 (0·057) 0·222 (0·138)*** 0·281 (0·189) –0·177 (0·063) –0·078 (0·082)* –0·237 (0·042)CSSM046 –0·487 (0·069)** 0·283 (0·085)*** 0·631 (0·059)** –0·016 (0·041) –0·146 (0·095)* –0·155 (0·052)CSSM047 –0·024 (0·049) 0·113 (0·042)*** 0·133 (0·051)** –0·087 (0·062) –0·045 (0·021)* –0·129 (0·078)CSSM057 –0·065 (0·043) 0·195 (0·055)*** 0·141 (0·050)** –0·089 (0·083) –0·008 (0·013) –0·081 (0·071)CSRM060 –0·146 (0·119) 0·199 (0·041)*** 0·313 (0·081)** –0·083 (0·084) –0·060 (0·073)* –0·012 (0·151)CSSM061 –0·073 (0·057) 0·217 (0·074)*** 0·273 (0·077)** –0·041 (0·090) –0·071 (0·059)* –0·104 (0·042)CSSM062 –0·007 (0·044) 0·202 (0·081)*** 0·206 (0·083)** –0·147 (0·084) –0·037 (0·045) –0·181 (0·106)BRN –0·063 (0·049) 0·273 (0·083)*** 0·319 (0·087)** –0·195 (0·147) –0·010 (0·029) –0·201 (0·135)HMH1R –0·130 (0·189) 0·101 (0·075)*** 0·204 (0·126)* –0·234 (0·149) –0·022 (0·026) –0·256 (0·173)
Mean estimates b –0·047 (0·027)*** 0·168 (0·018)*** 0·207 (0·034)*** –0·031 (0·028)* –0·038 (0·008)*** –0·068 (0·028)***
f, Within-population inbreeding estimate; F, total inbreeding estimate; θ, measure of population differentiation.†Standard deviations in parentheses – estimate from jackknife over populations.‡Standard deviations in parentheses – estimate from jackknife over loci.*P < 0·05, **P < 0·01, ***P < 0·001, from permutation tests in FSTAT program.
Table 5. Gene flow between pairs of swamp populations (Slatkin’s (1993) M̂*= Nm†) estimated frommicrosatellite data (below the diagonal) and from 18 polymorphic protein-coding loci (above the diagonal)
Surin Trengganu Sabah Sarawak Bogor Sulawesi Philippines Australia
Surin – 6·64 1·27 3·15 3·02 6·32 2·24 1·21Trengganu 6·39 – 1·17 1·75 2·27 3·10 1·41 0·70Sabah 0·93 0·79 – 0·87 0·56 0·79 0·65 0·38Sarawak 1·00 0·81 5·10 – 0·97 1·22 0·99 0·83Bogor 3·54 2·72 0·80 0·80 – 9·59 1·06 0·65Sulawesi 2·68 2·27 0·65 0·69 5·64 – 1·75 0·94Philippines 3·19 1·97 2·41 2·60 1·93 1·52 – 0·57Australia 1·07 0·89 0·44 0·45 1·41 1·35 0·79 –
*M̂, genetically effective migration rate.†Nm, number of migrants exchanged per generation.

show the most common allele or alleles in theriver type as rare in the swamp, and present onlyin the Philippines population. One animal washeterozygous for a ‘river’ allele at two loci, andfour others were heterozygous for a ‘river’ allele
at one locus. These five animals are certainly notF1 crossbreds, as all animals sampled wereclearly swamp type. However, river buffalo werefirst imported into the Philippines in 1917(Villegas 1958) and, as crossbreeding has been
© 1997 International Society for Animal Genetics, Animal Genetics 28, 103–115
Fig. 3. Dendrograms of relationships among 11 water buffalo populations, using DA genetic distances and theneighbour-joining method of clustering, which were based on (A) 21 polymorphic microsatellite loci, and (B) 25polymorphic protein-coding loci. Numbers on the nodes are percentage bootstrap values from 1000 replicationsof resampled loci, and a scale bar for branch lengths is shown.
Table 6. Matrix of DA genetic distances among 11 water buffalo populations
RiverSwamp
Sri Lanka Murrah Murrah Trengganu Sulawesi Bogor Australia Philippines Sabah Sarawak South SL* M†
Surin 0·075 0·153 0·138 0·242 0·112 0·244 0·262 0·517 0·516 0·540Trengganu 0·139 0·148 0·243 0·149 0·259 0·283 0·520 0·540 0·566Sulawesi 0·061 0·148 0·178 0·278 0·285 0·545 0·580 0·565Bogor 0·129 0·150 0·229 0·249 0·553 0·586 0·576Australia 0·245 0·330 0·342 0·585 0·582 0·570Philippines 0·111 0·112 0·511 0·515 0·543Sabah 0·034 0·601 0·641 0·665Sarawak 0·608 0·646 0·672Sri Lanka South 0·102 0·101Murrah SL 0·088
*Murrah – Sri Lanka.†Murrah – Malaysia.
110Barker, Moore,Hetzel, Evans, Tan,Byrne
practised extensively, these five animals musthave some crossbred ancestry.
As expected, the microsatellite loci show veryhigh levels of genetic diversity, with an averagewithin-population gene diversity of 0·514 (perlocus values ranging from 0·104–0·711), andexpected heterozygosity for each populationranging from 0·380–0·615. These estimates areall approximately twice those derived fromassay of 25 polymorphic protein-coding loci inthe same 11 populations, which show an aver-age within-population gene diversity of 0·287(range 0·033–0·482), and expected heterozygos-ity for each population ranging from0·184–0·346. Only six of the microsatellite locihad average within-population gene diversitiesless than the maximum estimate observed forthe protein-coding loci.
There was a significant positive relationshipbetween average within-population gene diver-sity for each locus and the number of allelesdetected (regression coefficient = 0·021 ± 0·006,P < 0·01). However, the number of allelesdetected increases with sample size, and thesample size for the river type was much lessthan that for swamp type (62 vs. 174). The aver-age number of alleles per locus was less for theriver type, and the proportion of shared alleleswas only 0·42 (Table 1), so that averaging resultsover both types may bias the relationshipbetween gene diversity and number of alleles.The regression of gene diversity on number ofalleles therefore was calculated for the swamppopulations only, resulting in a stronger rela-tionship than for the pooled data (regressioncoefficient = 0·032 ± 0·010, P < 0·01). This posi-tive relationship is expected under both thestepwise mutation and infinite allele models(Shriver et al. 1993). Our limited testing of theexpected numbers of alleles under both modelssuggested a closer fit to the former model, but
we cannot exclude the hypothesis of Shriver etal. (1993) that the mutational mechanism ofmicrosatellite loci is close to, but not exactly,the one-step stepwise mutation model.
Hardy–Weinberg
Eight significant departures from Hardy–Weinberg were detected but, with 231locus–population combinations, this numbercould be expected by chance. However, locusCSSM046 appears exceptional, with significantdeviations in four populations, an observeddeficiency of heterozygotes in all but one popu-lation and a high and significant f estimate inthe swamp populations (Table 4, 0·487,P < 0·01). The three other loci (CSSM022,CSSM033 and CSSM060), for which global testsof departures from Hardy–Weinberg equilib-rium were significant, also had observed defi-ciencies of heterozygotes in the majority of pop-ulations (seven, eight and six, respectively),with some high but not significant f estimates(Table 4). For these four loci then, it is possiblethat non-amplifying alleles are segregating in atleast some populations (Pemberton et al. 1995).However, as noted earlier, samples from a num-ber of animals failed to amplify for up to 10 loci.As only 12 samples failed to amplify forCSSM046, while, for the 17 loci other than theabove four, an average of 8–9 samples failed toamplify, it was not feasible to specify any sam-ple as homozygous for a non-amplifying allele.Given this possibility of non-amplifying alleles,however, the significant mean f estimates forboth the swamp and river types (Table 4) arelikely to be overestimates. Therefore, themicrosatellite data show little or no evidence ofinbreeding in these populations, in agreementwith results for the protein-coding loci, wheremean f estimates for swamp and river popula-tions did not differ significantly from zero. Bycontrast to the microsatellites, the protein-cod-ing loci showed many significant deviationsfrom Hardy–Weinberg expectations (Barker etal. 1996). However, these deviations for eachlocus across populations were consistentlyeither positive or negative, indicating locus-spe-cific effects that suggest selection affecting someof these loci (Barker et al. 1996).
Population differentiation
All microsatellite loci show significant differen-tiation among the swamp populations, but onlysix loci are significant for the river populationsand the mean θ estimate for the river popula-tions is only about one-quarter of that for the
111Genetic diversity ofAsian water buffalo
© 1997 International Society for Animal Genetics, Animal Genetics 28, 103–115
Table 7. Estimated divergence times among buffalotypes and populations
Divergence times
Types/population D* (generations)
Swamp vs. Murrah 0·9182 383Swamp vs. Lankan 0·8532 356Among swamp
Maximum D 0·4918 205Average D 0·2276 95
Australia/Bogor 0·1717 72Corrected D 0·0602 25
*D, standard genetic distance, (Nei 1978).

swamp (Table 4). However, with only three riverpopulations, two of which are different popula-tions of the one breed, the estimated θ is probablyan underestimate of between-population diver-sity in the river type. The mean θ estimate for 12swamp populations, based on 25 protein-codingloci, was 0·157 ± 0·034 (Barker et al. 1996) while,for the eight populations considered here, mean θwas 0·182 ± 0·041. Therefore, the differentiationamong these eight swamp populations wasgreater when estimated from protein-coding locithan from microsatellites (0·168 ± 0·018), but theformer also showed much greater variation,among loci, in estimates of θ. For microsatellites,the highest θ estimate was 0·283 for CSSM046,but five protein-coding loci had higher estimateswith a maximum of 0·939 for catalase.
Detecting natural selection
Comparisons of geographic variation in allele fre-quencies for different classes of polymorphic lociis a powerful method for detecting effects of natu-ral selection (McDonald 1994). As the effects ofdrift and migration are the same for all alleles atall neutral polymorphic loci, all such alleles havethe same expected FST, and there should be nosignificant heterogeneity of FST estimates.Lewontin & Krakauer (1973) derived the sam-pling distribution of FST, and proposed a test ofheterogeneity by a comparison of the observedvariance with the theoretical expected variance.Problems with estimating the expected variance(Robertson 1975) preclude general application ofthis test, but if we assume the microsatellite locito be neutral to selection, the observed varianceof FST estimates from these loci can be usedinstead of an expected theoretical variance.
An alternative modified Lewontin–Krakauertest, used by Pogson et al. (1995), was to com-pare the mean FST estimates from two classes ofloci, calculating:
χ2(n-1) = (n-1)(FST(RFLPs)/FST (allozymes)
where n = number of populations and the FST foreach of the two classes are weighted means.
In fact, both tests may be necessary, as themean FST estimates may not differ, while vari-ances do, or vice versa. McDonald (1994) haspointed out that comparing FST estimates fortwo classes of loci that differ in the number ofalleles could be quite misleading and recom-mended treating all polymorphisms as two-allele polymorphisms, by using the frequenciesof the overall most common allele and poolingthe others. Therefore, for the eight swamp popu-lations, unweighted FST (as computed by BIOSYS-1) were estimated from the collapsed two-allele
data for each of the microsatellite and protein-coding loci. Mean FST and variance were 0·1714and 0·011043 for microsatellites and 0·1481 and0·023780 for protein-coding loci. Applying themodified Lewontin–Krakauer tests (as above),the means are not significantly different, but thevariances are (χ2
(7) = 15·074, P < 0·05). Thus, the25 protein-coding loci are more heterogeneousthan expected from the variation shown by themicrosatellite loci, indicating (assuming themicrosatellite loci are neutral) selection affect-ing some of the protein-coding loci. A generaltest for this selection is to treat the ratio of theFST for each protein-coding locus to the meanFST for microsatellites as a variance ratio F-test,and to perform a two-tailed test of significance(d.f. = 7,7). On this test, six protein-coding locishow a significantly lower FST estimate [Alanineaminotransferase (Aat), Alkaline phosphatase(Alp), NADPH diaphorase (Dia-2), Glucose 6-phosphate dehydrogenase (G6pd), Leucineaminopeptidase (Lap), Purine nucleoside phos-phorylase (Np)], suggesting some form of bal-ancing selection affecting genetic variation atthese loci.
Gene flow and population history
Estimates of gene flow between the swamp pop-ulations (Table 5) show reasonable agreementbetween those derived from microsatellite andprotein-coding loci (correlation coefficient= 0·71, P < 0·01) although, because of possibleselection effects on the latter, the microsatelliteestimates would be preferred. Nevertheless,even the microsatellite-based estimates shouldbe interpreted with caution, as these popula-tions are unlikely to be in equilibrium and theestimates reflect both past and current geneflow. The swamp buffalo was domesticated inChina about 7000 years ago (Chen & Li 1989),probably following the development of rice cul-tivation in the lower Yangtze region about 8000years ago (Bellwood 1992). The spread of thisagricultural system, and with it presumably theswamp buffalo, from southern China to main-land south-east Asia dates from some 5000 yearsago, and to Sumatra and Java some 3000–4000years ago. Taking Surin as the nearest (geo-graphically) to the ancestral population, thehigh M̂ estimates for Surin/Philippines andPhilippines/Sabah, Philippines/Sarawak sug-gest that the buffalo may also have spread fromChina to the Philippines and then to Sabah andSarawak. The highest estimates probably repre-sent current gene flow between geographically-near populations (Surin/Trengganu and Sabah/Sarawak) or between populations in the same
112Barker, Moore,Hetzel, Evans, Tan,Byrne
© 1997 International Society for Animal Genetics, Animal Genetics 28, 103–115

country (Bogor/Sulawesi). The generally lowestimates for Australia with other populations,but highest with Bogor and Sulawesi, are inaccordance with its known history.
Although the estimated divergence timebetween Australia and Bogor, using the correctedNei distance (Table 7), accords well with itsknown history, this is probably fortuitous as theestimation method is not likely to be accurate oversuch short periods. Taking the average Nei dis-tance among the swamp populations and an aver-age divergence time of 3000–4000 years (say300–400 generations), the mutation rate would be3 x 10–4 – 4 x 10⁻⁴. If this mutation rate range isthen used, the swamp–river divergence is esti-mated as 1000–1500 generations or 10 000–15 000years ago, possibly still a minimum estimate.
Phylogenetic relationships
A primary motivation for this study was thecomparison of between-population diversityand phylogenetic relationships estimated usingdifferent classes of markers, namely protein-coding and microsatellite loci. Scribner et al.(1994) compared allozymes and three classes ofvariable number of tandem repeat (VNTR) mark-ers (single-locus microsatellite, minisatelliteand multilocus minisatellite) in Bufo bufo popu-lations. The FST estimate from allozymes was3–6 times greater than from the VNTR loci, butgenetic distances were concordant across allfour marker classes. However, only three popu-lations, six polymorphic allozyme loci, threesingle-locus minisatellites, one multilocus min-isatellite and one microsatellite were analysed.By contrast, Pogson et al. (1995), comparing 10allozyme and 17 nuclear RFLP loci in Gadusmorhua, found significantly higher mean FST
and much larger genetic distances for RFLPsthan for allozymes. However, the topology of thephylogenetic relationships among the popula-tions was very similar for the two markerclasses. As noted previously, we found no dif-ference in mean FST estimates for microsatellitesand allozymes, yet genetic distances amongpopulations were much greater when estimatedfrom microsatellites (Fig. 3).
More significantly, there were marked differ-ences in the topologies of the swamp populationtrees derived from the two classes of markers.The topology of the microsatellite tree for theswamp populations is consistent with theirgeography and their presumed spread throughsouth-east Asia and it is concordant with thegene flow estimates. By contrast, the protein-coding tree separates Australia andSabah/Sarawak from the other five populations.
These differences between the two trees couldbe quite enigmatic, but we are fortunate in thatthe history of the Australian population isknown, and the protein-coding loci show astrong bottleneck effect owing to a small effec-tive size of the founding population (Barker etal. 1996) and a consequent increase in itsgenetic distance from ancestral populations(Chakraborty & Nei 1977). For microsatellites,the bottleneck effect is apparent in the lowermean number of alleles per locus (Table 2), butas this is primarily loss of low frequency alleles,there is less effect on heterozygosity and ongenetic distance estimates. While the protein-coding loci did not show a clear bottleneckeffect for Sabah and Sarawak, this is apparentfrom the microsatellite results, with mean num-ber of alleles per locus and expected heterozy-gosity even less than for Australia (Table 2).Whereas these bottleneck effects show as longbranch lengths for Australia and for Sabah/Sarawak in the microsatellite tree, they com-pletely distort the protein-coding tree. As manydomestic livestock breeds are possiblydescended from small founding populations,microsatellite-based trees are clearly to be pre-ferred in assessing genetic relationships amongbreeds. Furthermore, in natural populationswhere founding sizes will not be known, theseresults should serve as a caution in interpretingpopulation structure from genetic distance esti-mates based on allozymes or other markers withrelatively low levels of heterozygosity.
Acknowledgements
We gratefully acknowledge Associate ProfessorK Yusoff for provision of laboratory facilities andMr C H Lau for technical assistance with DNAextraction; the co-operation and assistance dur-ing sample collection of Professor CChantalakhana, Ms Ancharlee and the ThaiDepartment of Livestock Development; ProfessorR L Anacleto, Central Mindanao University ofthe Philippines; Dr P Abeynayake, University ofPeradeniya, Sri Lanka; Dr Sudarisman and Dr PDaniels, BALITVET, Indonesia; Dr S P Chia,Department of Animal Services, Sabah; Dr K YHsiung, Department of Agriculture, Sarawak; DrM Hilmi, Universiti Pertanian Malaysia; Mr O SSelvaraj, University of Malaya; and Ms J Purdie,Department of Primary Industry and Fisheries, NT, Australia. This work was supported by theAustralian Centre for International AgriculturalResearch, the Malaysian Program forIntensification of Research in Priority Areas(Project no. 1–07–05–057), and UniversitiPertanian Malaysia.
113Genetic diversity ofAsian water buffalo
© 1997 International Society for Animal Genetics, Animal Genetics 28, 103–115

References
Avise J.C. (1994) Molecular Markers, Natural Historyand Evolution. Chapman and Hall, New York.
Barker J.S.F. (1994) Animal breeding and conservationgenetics. In: Conservation Genetics (ed. by V.Loeschcke, J. Tomiuk & S.K. Jain), pp. 381–95.Birkhäuser Verlag, Basel.
Barker J.S.F., Tan S.G., Selvaraj O.S. & Mukherjee T.K.(1997) Genetic variation within and relationshipsamong populations of Asian water buffalo (Bubalusbubalis). Animal Genetics 28, 1–13.
Beckmann J.S. & Weber J.L. (1992) Survey of humanand rat microsatellites. Genomics 12, 627–31.
Bellwood P. (1992) Southeast Asia before history. In:The Cambridge History of south-east Asia, Vol. 1(ed. by N. Tarling), pp. 55–136. CambridgeUniversity Press, Cambridge.
Bongso T.A., Kumaratileke W.L.J.S. & Buvanendran V.(1977) The karyotype of the indigenous buffalo(Bubalus bubalis) of Sri Lanka. Ceylon VeterinaryJournal 25, 9–11.
Bruford M.W. & Wayne R.K. (1993) Microsatellitesand their application to population genetic studies.Current Opinion in Genetics and Development 3,939–43.
Chakraborty R. & Nei M. (1977) Bottleneck effects onaverage heterozygosity and genetic distance withthe stepwise mutation model. Evolution 31,347–56.
Chen Y.C. & Li X.H. (1989) New evidence of the originand domestication of the Chinese swamp buffalo(Bubalus bubalis). Buffalo Journal 1, 51–5.
Cockrill, W.R. (ed.) (1974) The Husbandry and Healthof the Domestic Buffalo. FAO, Rome.
Ely J., Deka R., Chakraborty R. & Ferrell R.E. (1992)Comparison of five tandem repeat loci betweenhumans and chimpanzees. Genomics 14, 692–8.
Ewens W.J. (1972) The sampling theory of selectivelyneutral alleles. Theoretical Population Biology 3,87–112.
Felsenstein J. (1993) PHYLIP (Phylogeny InferencePackage) version 3·5c. Distributed by the author.Department of Genetics, University of Washington,Seattle.
Garza J.C., Slatkin M. & Freimer N.B. (1995)Microsatellite allele frequencies in humans andchimpanzees, with implications for constraints onallele size. Molecular Biology and Evolution 12,594–603.
Goldstein D.B., Linares A.R., Cavalli-Sforza L.L. &Feldman M.W. (1995) Genetic absolute dating basedon microsatellites and the origin of modernhumans. Proceedings of the National Academy ofScience of the USA 92, 6723–7.
Goudet J. (1995) FSTAT (Version 1·2): A computer pro-gram to calculate F-statistics. Journal of Heredity86, 485–6.
Hillis D.M. & Moritz C (eds) (1990) MolecularSystematics. Sinauer, Sunderland, MA.
Hochberg Y. (1988) A sharper Bonferroni procedurefor multiple tests of significance. Biometrika 75,800–2.
Kidd K.K. (1974) Biochemical polymorphisms, breedrelationships, and germ plasm resources in domes-tic cattle. Proceedings of the 1st World Congress onGenetics Applied to Livestock Production 1, 321–8.
Lessios H.A. (1992) Testing electrophoretic data foragreement with Hardy–Weinberg expectations.Marine Biology 112, 517–23.
Letts G.A. (1962) Early livestock introductions to the‘top-end’ of the Northern Territory. AustralianVeterinary Journal 38, 282–7.
Lewontin R.C. & Krakauer J. (1973) Distribution ofgene frequency as a test of the theory of the selectiveneutrality of polymorphisms. Genetics 74, 175–95.
MacHugh D.E., Loftus R.T., Bradley D.G., Sharp P.M.& Cunningham P. (1994) Microsatellite DNA varia-tion within and among European cattle breeds.Proceedings of the Royal Society, London B 256,25–31.
McDonald J.H. (1994) Detecting natural selection bycomparing geographic variation in protein and DNApolymorphisms. In: Non-neutral Evolution Theoriesand Molecular Data (ed. by B. Golding), pp. 88–100.Chapman and Hall, New York.
Mantel N. (1967) The detection of disease clusteringand a generalized regression approach. CancerResearch 27, 209–20.
Minch E., Ruiz-Linares A., Goldstein D.B., FeldmanM.W. & Cavalli-Sforza L.L. (1995) MICROSAT (version1·4): a computer program for calculating variousstatistics on microsatellite allele data. WWW: http://lotka. stanford. edu/research/distance. html.
Moore S.S., Evans D., Byrne K. et al. (1995) A set ofpolymorphic DNA microsatellites useful in swampand river buffalo (Bubalus bubalis). AnimalGenetics 26, 355–9.
Nei M. (1973) Analysis of gene diversity in subdividedpopulations. Proceedings of the National Academyof Science of the USA 70, 3321–3.
Nei M. (1976) Mathematical models of speciation andgenetic distance. In: Population Genetics andEcology (ed. by S. Karlin & E. Nevo), pp. 723–65.Academic Press, New York.
Nei M. (1978) Estimation of average heterozygosityand genetic distance from a small number of indi-viduals. Genetics 89, 583–90.
Nei M. (1987) Molecular Evolutionary Genetics.Columbia University Press, New York.
Nei M., Tajima F. & Tateno Y. (1983) Accuracy of esti-mated phylogenetic trees from molecular data II.Gene frequency data. Journal of MolecularEvolution 19, 153–70.
Pemberton J.M., Slate J., Bancroft D.R. & Barrett J.A.(1995) Nonamplifying alleles at microsatellite loci:a caution for parentage and population studies.Molecular Ecology 4, 249–52.
Pogson G.H., Mesa K.A. & Boutilier R.G. (1995)Genetic population structure and gene flow in theAtlantic cod Gadus morhua: A comparison ofallozyme and nuclear RFLP loci. Genetics 139,375–85.
Raymond M. & Rousset F. (1995) GENEPOP (Version1·2): Population genetics software for exact testsand ecumenicism. Journal of Heredity 86, 248–9.
114Barker, Moore,Hetzel, Evans, Tan,Byrne
© 1997 International Society for Animal Genetics, Animal Genetics 28, 103–115

Robertson A. (1975) Gene frequency distributions as atest of selective neutrality. Genetics 81, 775–85.
Roy M.S., Geffen E., Smith D., Ostrander E.A. & WayneR.K. (1994) Patterns of differentiation andhybridization in North American wolflike canids,revealed by analysis of microsatellite loci.Molecular Biology and Evolution 11, 553–70.
Rendel J. (1967) Studies of blood groups and proteinvariants as a means of revealing similarities and dif-ferences between animal populations. AnimalBreeding Abstracts 35, 371–83.
Reynolds J., Weir B.S. & Cockerham C.C. (1983)Estimation of the coancestry coefficient: basis for ashort term genetic distance. Genetics 105, 767–79.
Saitou N. & Nei M. (1987) The neighbour-joiningmethod: a new method for reconstructing phyloge-netic trees. Molecular Biology and Evolution 4,406–25.
Scheurmann E., Wiesner R., Fischer H. & JainudeenM.R. (1974) Karyotyp, C-Banden undIdentifizierung der Geschlechtschromosomen desCeylonesischen wasserbüffels (Bubalus bubalis).Giessener Beiträge zur Erbpathologie undZuchthygiene 6, 1–7.
Scribner K.T., Arntzen J.W. & Burke T. (1994)Comparative analysis of intra- and interpopulationgenetic diversity in Bufo bufo, using allozyme, sin-gle-locus microsatellite, minisatellite, and multilo-cus minisatellite data. Molecular Biology andEvolution 11, 737–48.
Shriver M.D., Jin L., Chakraborty R. & Boerwinkle E.(1993) VNTR allele frequency distributions underthe stepwise mutation model: a computer simula-tion approach. Genetics 134, 983–93.
Slatkin M. (1993) Isolation by distance in equilibriumand non-equilibrium populations. Evolution 47,264–79.
Slatkin M. (1995) A measure of population subdivi-sion based on microsatellite allele frequencies.Genetics 139, 457–62.
Swofford D.L. & Selander R.B. (1989) BIOSYS–1 A com-puter program for the analysis of allelic variation inpopulation genetics and biochemical systematics.Release 1·7, Illinois Natural History Survey,Champaign IL. pp. 43.
Takezaki N. & Nei M. (1996) Genetic distances andreconstruction of phylogenetic trees frommicrosatellite DNA. Genetics 144, 389–99.
Tulloch D.G. (1974) The feral swamp buffaloes ofAustralia’s Northern Territory. In: The Husbandryand Health of the Domestic Buffalo (ed. by W.R.Cockrill), pp. 493–505. FAO, Rome.
Villegas V. (1958) The Indian buffalo. PhilippineJournal of Animal Industry 19, 85–90.
Ward R.D., Skibinski D.O.F. & Woodwark M. (1992)Protein heterozygosity, protein structure, and taxo-nomic differentiation. Evolutionary Biology 26,73–159.
Weber J.L. & Wong C. (1993) Mutation of human shorttandem repeats. Human Molecular Genetics 2,1123–8.
Weir B.S. & Cockerham C.C. (1984) Estimating F-statistics for the analysis of population structure.Evolution 38, 1358–70.
van Zeveren A., Peelman L., van de Weghe A. & BouquetY. (1995) A genetic study of four Belgian pig popula-tions by means of seven microsatellite loci. Journal ofAnimal Breeding and Genetics 112, 191–204.
115Genetic diversity ofAsian water buffalo
© 1997 International Society for Animal Genetics, Animal Genetics 28, 103–115