Structure and Dynamics of the Arboreal Termite Community in New Guinean Coconut Plantations21
Upload
independentCategory
view
0download
0
ORIGINAL PAPER
Genetic diversity and colony breeding structure in nativeand introduced ranges of the Formosan subterraneantermite, Coptotermes formosanus
Claudia Husseneder • Dawn M. Simms •
Jennifer R. Delatte • Changlu Wang •
J. Kenneth Grace • Edward L. Vargo
Received: 3 February 2011 / Accepted: 9 August 2011
� The Author(s) 2011. This article is published with open access at Springerlink.com
Abstract The Formosan subterranean termite,
Coptotermes formosanus is recognized as one of the
most important invasive pest species. Originating from
China, C. formosanus has spread to many tropical and
subtropical regions around the globe in the last
400 years, including Japan, Hawaii and the continental
USA. Although the current distribution is well docu-
mented, information about the patterns of invasion and
effects of introduction on the population genetics of
this species is largely lacking. We analyzed the genetic
structure of populations from two native populations
(Guangdong and Hunan provinces, China) and two
introduced populations (Maui and Kauai, Hawaii)
using microsatellite genotyping. We also reanalyzed
published data of additional populations from China,
Japan, Hawaii, and the continental USA. The popula-
tion from Hunan, the earliest introduction outside of
China (Japan) and the first introduction to the conti-
nental USA (South Carolina) showed little genetic
similarity with any of the native or introduced popu-
lations investigated. However, populations from Oahu
(HI), New Orleans (LA) and Rutherford County (NC)
showed close similarity. In general, genetic patterns
suggest multiple introductions to the USA, with, for
example, two separate introductions to the island of
Maui. Bottleneck effects were detected in almost all
recent introductions (after 1940). All populations in the
introduced range showed lower genetic diversity than
those in the native range. However, this low genetic
diversity did not result in the formation of polygynous
supercolonies as has been described for other invasive
termite and ant species.
Keywords Isoptera � Invasive insect �Microsatellites � Bottleneck � Genetic diversity
Introduction
Relatively few termite species have established
themselves as successful invaders with significant
ecological and economic impact in their introduced
ranges, despite the fact that termite species that nest
in wood, such as drywood termites (Kalotermitidae)
and subterranean termites (Rhinotermitidae), are
C. Husseneder (&) � D. M. Simms � J. R. Delatte
Department of Entomology, Louisiana State University
Agricultural Center, 404 Life Sciences Bldg.,
Baton Rouge, LA 70803, USA
e-mail: [email protected]
C. Wang
Department of Entomology, Rutgers, The State University
of New Jersey, New Brunswick, NJ 08901, USA
J. K. Grace
Department of Plant and Environmental Protection
Sciences, University of Hawaii at Manoa,
Honolulu, HI, USA
E. L. Vargo
Department of Entomology, North Carolina State
University, Raleigh, NC 27695, USA
123
Biol Invasions
DOI 10.1007/s10530-011-0087-7

easily transported to new locations by human trade
and traffic. The most destructive of these species is
the Formosan subterranean termite, Coptotermes
formosanus, which has invaded many parts of the
world including the Pacific Rim and the USA (Su and
Tamashiro 1987; Su 2003) and is considered among
the 100 worst invasive species in the world (Global
Invasive Species Database 2010). The annual costs
associated with damage repair and control of the
Formosan subterranean termite are estimated to
exceed $1 billion (Pimentel et al. 2005).
Although the common name is derived from the
first description of this termite species in 1909 from
specimens collected on the island of Formosa, i.e.,
Taiwan (Shiraki 1909), it is commonly believed that
the native range of the Formosan subterranean
termite is the southeastern part of mainland China.
This belief is based on the termitophilous beetles
associated with Formosan subterranean termite
colonies (Kistner 1985) and the high species diversity
within the genus Coptotermes in this geographical
area (Li 2000). The Formosan subterranean termite is
found in 14 provinces/autonomous regions in south-
ern China with a northern limit of 33�280 and a
western limit 104�350 (Wang et al. 2002). The earliest
known introduction of C. formosanus outside of the
original native range was to Japan prior to the 1600s
(Vargo et al. 2003). Although officially collected in
Hawaii in 1907 and reported in 1913 (Swezey 1914),
C. formosanus was probably transported to the
Hawaiian Islands earlier, presumably via the sandal-
wood trade from Canton, i.e., Guangdong, China
(Yates and Tamashiro 1990). Newspaper articles
indicate the presence of Formosan subterranean
termites on the island of Oahu as early as 1869
(Su and Tamashiro 1987; Yates and Tamashiro
1990). Introductions to other Hawaiian islands fol-
lowed with the Island of Hawaii (1925), Kauai
(1929), Lanai (1932), Maui (1933) and Molokai
(1975) (Yates and Tamashiro 1990). The infestation
on Maui and Lanai were purportedly eradicated, but a
second introduction followed in the late 1940s or
early 1950s (Yates and Tamashiro 1990). Since
infestations on most of the Hawaiian Islands were
originally concentrated around seaports, it is believed
that the main transportation was by wooden ships,
ship palettes, crates and other wooden material.
Nowadays, however, infestations are found through-
out most of Oahu and Kauai, and in several areas on
Maui and the other islands, which indicates continued
spread and/or additional introductions.
Introductions of C. formosanus into the continental
US have been associated with military ports receiving
and storing equipment and supplies from the Pacific
theater after World War II (Spink 1967). The first
record of C. formosanus on the US mainland was a
specimen collected from Charleston, South Carolina
in 1957 (Chambers et al. 1988), followed by spec-
imens from a shipyard in Houston, Texas in 1965
(Anonymous 1965). The Formosan subterranean
termite was reported in New Orleans, Louisiana
in 1966 (Spink 1967); however, the considerable
infestation rate of buildings and trees suggests that
C. formosanus had already been present in the region
for several years prior to this report (Spink 1967).
Once established, C. formosanus spread throughout
the southeastern US. Its widespread but patchy
distribution on the US mainland includes at least
ten states: from North Carolina and Tennessee south
to Florida on the East Coast, throughout the Gulf
Coast into Texas and California on the West Coast
(Woodson et al. 2001). Spread across state lines has
been suggested to occur via the transport of infested
railroad cross ties used in landscaping (Jenkins et al.
2002).
Although the putative dates of introduction and
current distribution of C. formosanus are well doc-
umented, little is known about its invasion biology,
including the origin and number of introductions
within each region and the relationships among
populations from the native and introduced ranges.
Furthermore, the impact of introductions to new
habitats on genetic diversity and colony structure of
C. formosanus is largely unknown. Although the
symbiont diversity does not seem to be affected by
the introduction of C. formosanus to new habitats
(Husseneder et al. 2010), it is conceivable that a loss
of genetic diversity in introduced termite populations
due to a limited number of founder colonies may
have far reaching consequences. For example, in
other social insects such as the red imported fire ant
(Solenopsis invicta, Suarez et al. 1999), the Argentine
ant (Linepithema humile, Giraud et al. 2002) and
the big-headed ants (Pheidole megacephala, Fournier
et al. 2009) it has been shown that loss of genetic
diversity or genetic cleansing of recognition cues
after introduction leads to a breakdown in nest mate
recognition and the formation of large supercolonies
C. Husseneder et al.
123
in the introduced range that are able to dominate
native species (e.g., Tsutsui and Suarez 2003). These
findings have been suggested to explain invasion
success of ants.
Like some invasive ant species (e.g., Solenopsis
invicta, Ross and Keller 1998), colonies of C. formos-
anus have two breeding structures: simple families
headed by a single pair of reproductives (analogous to
monogyne ant colonies) and extended families
headed by numerous reproductives in analogy to
polygynous colonies in ants, except that in termites
the reproductives are inbreeding neotenics produced
within the nest (reviewed in Vargo and Husseneder
2009). The large foraging areas of some Formosan
subterranean termite colonies extend to over
1,600 m2 (Messenger et al. 2005; Husseneder et al.
2005), and may be comparable to supercolonies in
ants. Like invasive ants, populations of some invasive
termite species, e.g., Reticuliterme flavipes and R.
urbis have reduced genetic diversity and large
colonies with exclusively extended family structures
in the introduced range (Western Europe) (Dronnet
et al. 2005; Leniaud et al. 2009, 2010).
In this study, we employed microsatellite geno-
typing to analyze the genetic structure of C. formos-
anus populations from the native (Guangdong and
Hunan provinces, China) and introduced ranges
(Kauai and Maui, Hawaii) to establish whether the
colony and population genetic structure of the
Formosan subterranean termite differs between native
and introduced populations. We compare the results
of this study to reanalyzed data from previously
published C. formosanus populations from China,
Japan, Oahu (HI) and the US mainland (Vargo 2003;
Husseneder et al. 2005, 2008; Vargo et al. 2006) to
identify potential factors that may facilitate invasive-
ness and identify possible routes of invasion and
subsequent spread. Specifically we (1) describe the
population genetic structure and relationships among
native and introduced populations of C. formosanus,
(2) test whether C. formosanus populations in the
introduced range experienced genetic bottlenecks
leading to reduced genetic diversity, and (3) compare
the colony breeding structure among native and
introduced C. formosanus populations to test the
hypothesis that introduced populations predominantly
consist of extended family colonies (in analogy to the
large polygynous supercolonies found in some inva-
sive ants and Reticulitermes species).
Materials and methods
Samples
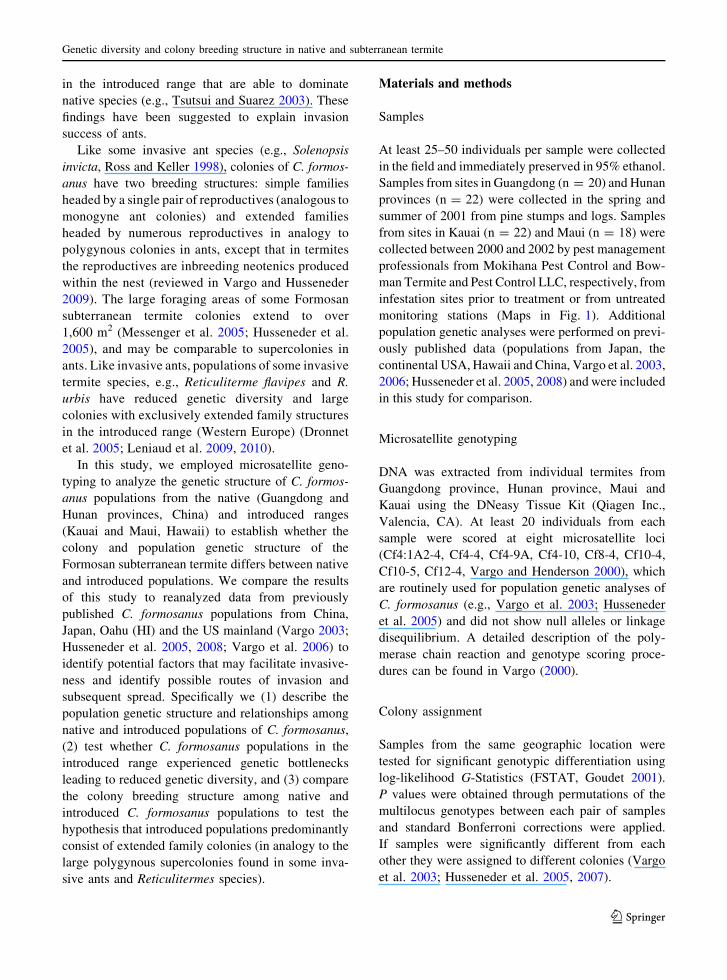
At least 25–50 individuals per sample were collected
in the field and immediately preserved in 95% ethanol.
Samples from sites in Guangdong (n = 20) and Hunan
provinces (n = 22) were collected in the spring and
summer of 2001 from pine stumps and logs. Samples
from sites in Kauai (n = 22) and Maui (n = 18) were
collected between 2000 and 2002 by pest management
professionals from Mokihana Pest Control and Bow-
man Termite and Pest Control LLC, respectively, from
infestation sites prior to treatment or from untreated
monitoring stations (Maps in Fig. 1). Additional
population genetic analyses were performed on previ-
ously published data (populations from Japan, the
continental USA, Hawaii and China, Vargo et al. 2003,
2006; Husseneder et al. 2005, 2008) and were included
in this study for comparison.
Microsatellite genotyping
DNA was extracted from individual termites from
Guangdong province, Hunan province, Maui and
Kauai using the DNeasy Tissue Kit (Qiagen Inc.,
Valencia, CA). At least 20 individuals from each
sample were scored at eight microsatellite loci
(Cf4:1A2-4, Cf4-4, Cf4-9A, Cf4-10, Cf8-4, Cf10-4,
Cf10-5, Cf12-4, Vargo and Henderson 2000), which
are routinely used for population genetic analyses of
C. formosanus (e.g., Vargo et al. 2003; Husseneder
et al. 2005) and did not show null alleles or linkage
disequilibrium. A detailed description of the poly-
merase chain reaction and genotype scoring proce-
dures can be found in Vargo (2000).
Colony assignment
Samples from the same geographic location were
tested for significant genotypic differentiation using
log-likelihood G-Statistics (FSTAT, Goudet 2001).
P values were obtained through permutations of the
multilocus genotypes between each pair of samples
and standard Bonferroni corrections were applied.
If samples were significantly different from each
other they were assigned to different colonies (Vargo
et al. 2003; Husseneder et al. 2005, 2007).
Genetic diversity and colony breeding structure in native and subterranean termite
123
Colony social organization
We tested whether colonies were headed by a single
pair of reproductives (simple family colonies) or
multiple reproductives (extended family colonies)
based on the frequencies and classes of worker
genotypes (Vargo et al. 2003; Husseneder et al.
2005). Colonies were considered simple families if
the classes of genotypes of the workers were
consistent with those expected for the offspring of a
single pair of parents and if the frequencies of the
observed genotypes did not differ from the expected
Mendelian ratios. Deviations from Mendelian ratios
were determined between observed and expected
genotypic frequencies at each locus by a G-test for
goodness-of-fit. An overall G-value for each colony
was obtained by summing the G-values across all
eight loci. Colonies were considered extended fam-
ilies when they had more genotypes than possible for
the offspring of a monogamous pair or the observed
frequencies of the genotypes deviated significantly
from those expected in simple families (P \ 0.05,
G-test).
F-statistics
To analyze the population genetic structure and
inbreeding at the levels of colony and population,
hierarchical F-statistics were calculated using the
methods of Weir and Cockerham (1984) as imple-
mented in FSTAT. As previously reviewed (Vargo
and Husseneder 2009), FIC is the coefficient of
inbreeding in individuals relative to their colony and
reflects most clearly the colony’s breeding system
(Bulmer and Traniello 2002; Thorne et al. 1999;
Bulmer et al. 2001). Empirical FIC values of colonies
were compared among populations via independent
samples t-test not assuming equal variances, and to
values predicted by the computer simulations for
different breeding systems (Bulmer et al. 2001;
Thorne et al. 1999) by one-sample t-tests (SPSS 17.0).
In addition, one-tailed one-sample t-tests were used
to test FIC values across all loci for each extended
family colony to establish the proportion of colonies
for which FIC was significantly greater than zero
(which would indicate assortative mating, mixing of
colonies, and/or budding), not significantly different
from zero (high number of neotenic reproductives) or
significantly lower than zero (low number of repro-
ductives) (Bulmer et al. 2001; Thorne et al. 1999).
From the worker genotypes present in each of the
simple family colonies, the genotypes of the parents
were reconstructed, and F-statistics for the reproduc-
tives were estimated from the inferred parental
genotypes. We used likelihood calculations in KIN-
SHIP 1.3.1 (Goodnight and Queller 1999, available at
http://www.gsoftnet.us/GSoft.html) to test if parents
were putative siblings, i.e., prior nest mates. The null
hypothesis was that pairs were unrelated (r = 0),
whereas the alternate hypothesis was that pairs were
nest mates (r as determined by the average nest
mate relatedness within all colonies of the respective
600 km
Hunan
Guangdong
8 samples 6 samples
8 samples
7 samples13 samples
(a) Southeastern China
150 km
Oahu
Hawaii
Maui
Kauai
22 km
Kauai22 samples
1 km
(11 km)
Maui18 samples
(b) HawaiianIslands
Fig. 1 Sample sites from Guangdong and Hunan province in
southeastern China (a) and from the Hawaiian Islands, Kauai
and Maui (b). Genetical analyses revealed two subpopulations
in Maui (filled circle subpopulation 1; open circle subpopula-
tion 2)
C. Husseneder et al.
123

population). Significance at the level of P = 0.05 was
determined by log likelihood tests using 10,000 series
of pairs created at random.
Genetic structure of populations and isolation
by distance
Ad hoc approximations of the number of subpopula-
tions in each geographic sample (including the previ-
ously published populations: Vargo et al. 2003, 2006;
Husseneder et al. 2005, 2008) were obtained based on
a comparison of the penalized log likelihoods over
independent simulation runs using STRUCTURE 2.3
(Evanno et al. 2005; Pritchard et al. 2000) with
different numbers of assumed genetic clusters (K).
Each colony was represented by one randomly chosen
individual. All simulations were performed based on
the admixture model with 100,000 runs in the data
collection phase following a burn-in period of 100,000
runs. Three replications of simulations for each set of
data and value of K confirmed that posterior proba-
bilities were consistent across runs. Estimated
membership coefficients in K clusters (degree of
admixture) of each colony were calculated according
to the algorithm of Pritchard et al. (2000) and plotted.
Colonies from each geographical sample were prob-
abilistically assigned to subpopulations in which they
had predominant membership. If considerable struc-
ture was detected, datasets were divided into subsets
and reanalyzed until the number of subpopulations
was established. Confirmed subpopulations were then
used as population genetic units of analysis rather than
geographical populations based on collection locali-
ties. Matrix correlations between genetic distance and
geographic distance were performed and tested for
significance using Mantel tests (one sided p-values
from 1,000 randomizations, IBD v. 1.52, Jensen et al.
2005) to test for isolation by distance.
Detection of genetic bottlenecks
We determined whether populations had experienced
a recent genetic bottleneck using the program BOT-
TLENECK v. 1.2.02 (Piry et al. 1999). Bottlenecks
were detected based on the fact that a bottleneck
reduces allele numbers faster than heterozygosity,
which leads to the observed heterozygosity being
greater than the heterozygosity expected from the
number of alleles present. Tests were performed
using datasets that were resampled five times and
contained one randomly chosen individual per colony
to avoid bias by intracolonial relatedness. Individual
genotypes were tested for heterozygote excess across
loci using a Wilcoxon sign-rank test under different
mutation models (infinite allele model, two-phased
model of mutation, Piry et al. 1999).
Genetic diversity of populations
We performed rarefaction analyses on the samples
collected for this study, and on previously published
microsatellite data (Vargo et al. 2003, 2006; Husse-
neder et al. 2005, 2008), using EstimateS Win820
(Colwell et al. 2004) to compare genetic diversity
among populations despite unequal numbers of
colonies sampled and assess whether sampling effort
was sufficient to capture the genetic diversity. Alleles
with frequencies C5% in colonies were counted as
present. The order of sampled colonies of each
population was randomized 100 times. The observed
number of alleles in each population was calculated
using Mao Tau (Colwell et al. 2004). Allele numbers
and their variance (95% confidence interval) were
plotted for each population as a function of the
number of colonies sampled. We interpolated for the
smallest number of colonies sampled to be able to
compare allelic richness independent of sample size.
The non-parametric incidence-based estimator (ICE)
of expected allele richness, based on the numbers of
singletons and doubletons in each sample (Colwell
and Coddington 1994), was used to estimate the
number of total alleles. In addition to allelic richness,
genetic diversity of each population was measured
with two indices commonly used in population
biology: the Shannon index, which weighs both allele
number and frequency and has a scale between 0 (low
diversity) and *4.6 (high diversity), and the Simpson
index, which is strongly influenced by frequency
since it reflects the likelihood that two alleles
randomly drawn from the same sample are different
(Colwell et al. 2004). To compare all native to all
introduced populations and assess whether sampling
effort at the population level was sufficient, rarefac-
tion analyses were also performed with populations,
instead of colonies, as sample units. Significant
differences were established by non-overlapping
95% confidence intervals of the rarefaction curves
and non-parametric tests (SPSS 17.0).
Genetic diversity and colony breeding structure in native and subterranean termite
123

Results
Colony assignment, population structure
and isolation by distance
The 20 samples collected from Guangdong province
(Fig. 1a) belonged to 19 different colonies. Although
colonies were dispersed over a range of 200 km,
no substructure, and only weak isolation by distance
(R2 = 0.18, P = 0.007) was detected in the popula-
tion. The 22 samples collected from Hunan province
(Fig. 1a) belonged to 21 colonies. STRUCTURE
indicated the potential presence of multiple subpop-
ulations (2–4 clusters) among the samples from Hunan
province. However, assignment of most colonies to
any one of the clusters was weak (\80%). Clusters
were not congruent with the three geographic clusters
of sample sites (Fig. 1a) and isolation by distance was
weak (R2 = 0.19, P = 0.001, over 150 km). There-
fore, we considered all Hunan colonies to belong to
one population in the further analyses.
All 22 samples collected from Kauai (Fig. 1b)
were assigned to different colonies. The population of
Kauai showed no detectable substructure and no
isolation by distance across 45 km (R2 = 0.03,
P = 0.90). Similarly, each of the 18 samples from
Maui (Fig. 1b) belonged to separate colonies. Colo-
nies from Maui were collected well within 5 km and
with no physical barriers to inhibit gene flow except
one colony, which was separated by 11 km from the
rest of the samples (Fig. 1b). Nevertheless, the Maui
population showed weak but significant isolation
by distance, which persisted even after removal of
the distant colony from the dataset (R2 = 0.16,
P = 0.005). Furthermore, results generated from
STRUCTURE indicated the presence of two genetic
clusters in the Maui population, with eight colonies
assigned to the first subpopulation (Maui-1) and
10 colonies assigned to a second subpopulation
(Maui-2, Fig. 1b). The majority (89%) of colonies
were strongly (C80%) assigned to one or the other
subpopulation. Genetic separation was supported by
13 private alleles separating subpopulation Maui-2
from Maui-1 and two private alleles separating Maui-
1 from Maui-2. Separate analyses of each subpopu-
lation, using STRUCTURE, did not reveal further
substructures. Therefore, colonies from the two Maui
subpopulations were treated separately in the follow-
ing analyses. Interestingly, there was no obvious
relationship between the genetic clusters and geo-
graphical location of the colonies (Fig. 1b).
We reanalyzed previously published data including
populations from Japan (Vargo et al. 2003), Hawaii
(Husseneder et al. 2008), the continental USA
(Husseneder et al. 2005; Vargo et al. 2006) and
one additional population from the native range
(Guangzhou City, Guangdong province, Husseneder
et al. 2008). No substructure or isolation by distance
was detected in any of these populations, confirming
that each geographical group of samples represented a
single genetic population. Although Guangzhou City
is located within Guangdong province, the samples
from Guangzhou were collected years earlier from a
rather localized urban area (Zhongshan University,
Husseneder et al. 2008) and STRUCTURE indicated
that the population from Guangzhou City largely
belonged to a separate genetic cluster than the
colonies from the rest of the province. The genetic
distance between colonies from Guangzhou City and
the other colonies from Guangdong province was
small (FST = 0.05), however, there were private
alleles separating Guangzhou City (11 unique alleles)
from the other Guangdong colonies (eight unique
alleles). Therefore, we decided to treat Guangzhou
City and Guangdong province samples as separate
populations. Overall, the combined data set included
three native populations and 10 introduced popula-
tions. Mean genetic distance among populations
(global FST) was 0.20 (SD = 0.09). The mean genetic
distance among populations within the native
range (FST = 0.09, SD = 0.05, n = 3 pairwise com-
parisons) was significantly lower than among intro-
duced populations (FST = 0.23, SD = 0.10, n = 45;
P = 0.020, Z = -2.31, two-tailed Mann–Whitney
U-test).
Evidence for genetic bottlenecks in recently
introduced populations
The populations arising from the early introduction to
Kauai (1929) and, prior to that, to Japan (1600s,
Vargo et al. 2003) and Oahu (late 1800s), showed no
evidence of a persistent bottleneck effect. Interest-
ingly, strong evidence for a recent bottleneck was
found in one Maui subpopulation (Maui-1), but not in
the other (Maui-2). Four out of five resampled
datasets for Maui-1 showed significant heterozygote
excess under the infinite allele model, and 3 out of 5
C. Husseneder et al.
123

datasets showed heterozygote excess under the two-
phase model. Similar evidence for recent genetic
bottlenecks was found in the populations from
Armstrong Park (Husseneder et al. 2005) and City
Park, in New Orleans, Louisiana, and Charleston,
South Carolina (Vargo et al. 2006). All of these
populations are known to be recent introductions
(Charleston, SC: 1957; New Orleans, LA: 1966).
Surprisingly, no bottleneck was detected in the
recently introduced (1990) North Carolina popula-
tion, which is likely due to the small sample size
(n = 8).
Genetic diversity within populations
Rarefaction analyses (Fig. 2; Table 1) showed that
allelic richness, i.e., the number of alleles, was higher
in native populations than in introduced populations.
The difference was considered significant based on
non-parametric tests (P = 0.011, Z = -2.542, two-
tailed Mann–Whitney U-test) and the fact that 95%
confidence intervals of the rarefaction curves of native
and introduced populations did not overlap, except
marginally for the curve for Kyushu, Japan. The curves
of most populations leveled off and approached the
estimated total allele number based on the ICE index.
In most cases, over 80% of total alleles were captured
(Table 1), indicating that the sample size was sufficient
to measure allelic richness in the population. When
allelic richness was interpolated for the lowest sample
sizes (eight colonies each in Maui-1 and in the North
Carolina population), allelic richness remained almost
two times higher in native populations compared to
introduced populations (P = 0.011, Z = -2.535,
two-tailed Mann–Whitney U-test, Table 1).
The higher genetic diversity in native populations
was further confirmed using the Shannon and Simp-
son indices, which take both the allele number and
frequency into account. Both indices showed that
native populations have a significantly higher genetic
diversity than introduced populations [P = 0.011,
Z = -2.539 (Shannon), Z = -2.535 (Simpson),
two-tailed Mann–Whitney U-tests]. The same result
was achieved when diversity indices were interpo-
lated for a sample size of eight colonies via
rarefaction.
Results from rarefaction analysis were also used to
assess if the sampling effort was sufficient at the level
of population (Muirhead et al. 2008). Rarefaction
curves plotting allele numbers as a function of
populations sampled, showed that samples from the
ten introduced populations and the three native
populations captured about 80% of the total allelic
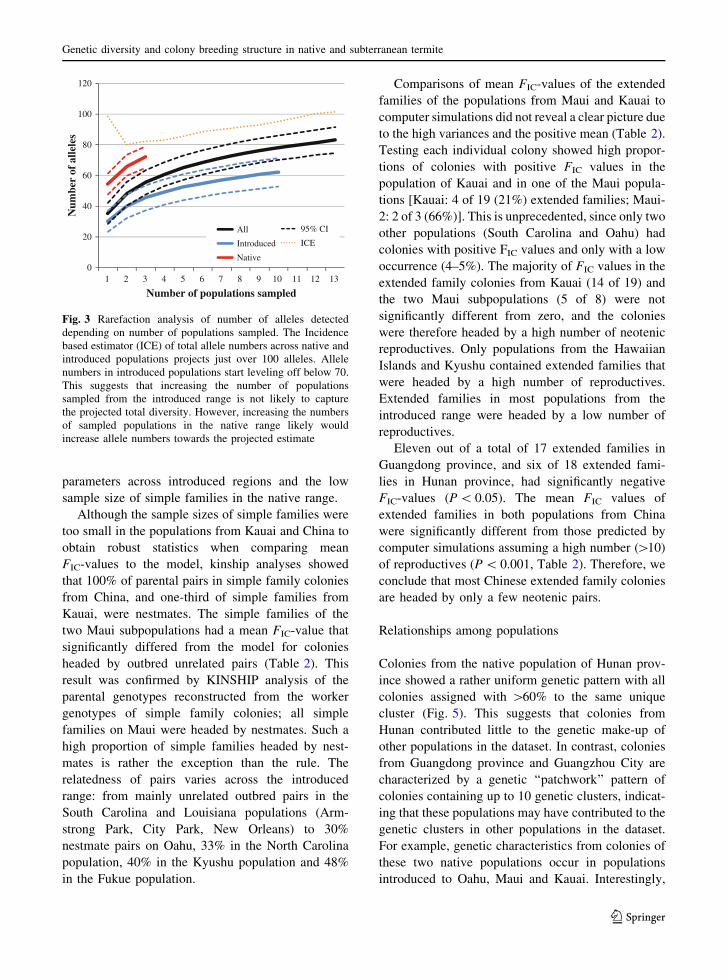
richness (Fig. 3). While the curve representing the
introduced populations started to level-off, the curve
of the native populations was not yet asymptotic,
indicating that total allelic richness in the native
range was probably underestimated and that the
sampling effort needs to be increased across the
native range.
0
10
20
30
40
50
60
70
1 2 3 4 5 6 7 8 9 10 11 12 13 14 15 16 17 18 19 20 21 22 23 24 25 26
Num
ber
of a
llele
s
Number of colonies
Guangzhou, China
Guangdong, China
Hunan, China
Kyushu, Japan
Fukue, Japan
Maui1, HI
Maui2, HI
Kauai, HI
Oahu, HI*
Armstrong Park, LA
City Park, LA
Charleston, SC
Rutherford, NC
95% CI
Native
Introduced
Fig. 2 Rarefaction analysis
shows higher allelic
richness in native
populations. *Note that the
allele number for Oahu is
underestimated since the
population was only
genotyped at five out of
eight loci
Genetic diversity and colony breeding structure in native and subterranean termite
123

Breeding structure
The C. formosanus populations from Guangdong and
Hunan province and Kauai consisted predominantly
of extended family colonies (C86%, Table 2, Fig. 4).
Similarly, about two-thirds of the colonies of Maui-1
were extended families. In contrast, Maui-2 consisted
mainly of simple families (70%). The comparison of
all investigated populations to date showed that
native populations of C. formosanus have signifi-
cantly higher percentage of extended family colonies
(P = 0.007, Z = -2.454, two-tailed Mann–Whitney
U-test. Figure 4) when compared to introduced
populations. However, this has to be confirmed by
increasing the number of population samples from the
native range.
Mean FIT-values (inbreeding of individuals vs.
population) in the Chinese populations were approx-
imately half of those found in the Kauai and Maui
populations, and relatedness within colonies was
lower with the exception of the relatedness in
extended families of Maui-2 (Table 2). However,
when previously published populations were included
in the analysis, there were no significant differences
in FIT, FST, FIC, and r-values between simple and
extended families from the native and introduced
range (P [ 0.05, two-tailed Mann–Whitney U-tests).
This was largely due to the high variability of these
Table 1 Genetic diversity of Formosan subterranean termite populations from the native and introduced range
N Allele# SD ICE SD Allele#/ICE (%) Shannon SD Simpson SD
Native range
Hunan Province, China 8 46.31 3.57 56.76 6.22 82 3.60 0.07 38.77 2.87
21 59.00 3.77 71.19 0.00 83 3.67 0.04 36.22 1.52
Guangdong Province, China 8 45.11 2.15 60.49 5.09 75 3.70 0.06 41.38 2.93
19 58.00 1.77 61.35 0.00 95 3.73 0.04 39.21 1.74
Guangzhou City, China 8 54.18 1.72 62.51 4.51 87 3.75 0.08 46.33 4.52
12 58.00 1.60 62.21 0.00 93 3.78 0.08 44.91 3.86
Introduced range
Kyushu, Japan 8 32.67 3.86 42.38 6.04 77 3.23 0.07 26.23 1.66
20 44.00 4.59 69.32 0.00 63 3.28 0.04 24.47 0.92
Fukue, Japan 8 21.33 1.14 23.30 1.39 92 2.84 0.07 18.72 1.56
10 22.00 1.13 23.56 0.00 93 2.86 0.07 18.23 1.32
Oahu, HI 8 20.45 0.24 21.40 1.20 96 2.87 0.05 19.90 1.31
19 21.00a 0.00 21.00 0.00 100 2.91 0.03 18.45 0.69
Maui-1, HI 8 32.00 2.94 38.56 0.00 83 3.16 0.10 25.82 2.66
Maui-2, HI 8 24.91 1.58 28.26 1.81 88 2.97 0.07 21.05 1.32
10 26.00 1.59 29.10 0.00 89 2.98 0.06 20.40 1.13
Kauai, HI 8 28.85 2.33 34.98 4.30 82 3.12 0.06 23.69 1.53
22 36.00 2.24 41.80 0.00 86 3.18 0.04 22.08 0.82
Armstrong Park, LA 8 23.33 0.79 23.77 1.03 98 3.03 0.04 22.96 1.03
14 24.00 0.67 24.36 0.00 99 3.04 0.03 21.71 0.68
City Park, LA 8 29.47 2.48 30.48 2.39 97 3.27 0.05 29.22 1.51
17 32.00 2.47 34.69 0.00 92 3.29 0.04 27.51 0.91
Charleston, SC 8 17.00 0.00 17.00 0.02 100 2.81 0.01 18.39 0.24
25 17.00 0.00 17.00 0.00 100 2.82 0.00 17.30 0.11
Rutherford, NC 8 31.00 1.94 35.32 0.00 88 3.16 0.09 26.01 2.39
Allele numbers, incidence based estimator of total allele numbers (ICE), percentage of total alleles captured (Allele#/ICE) and
diversity indices (Shannon and Simpson) were calculated for the minimum number of colonies sampled per population (n = 8) and
for the total number of colonies sampled in each population via rarefaction analysisa Note that the allele number for Oahu is underestimated since the population was only genotyped at five out of eight loci
C. Husseneder et al.
123
parameters across introduced regions and the low
sample size of simple families in the native range.
Although the sample sizes of simple families were
too small in the populations from Kauai and China to
obtain robust statistics when comparing mean
FIC-values to the model, kinship analyses showed
that 100% of parental pairs in simple family colonies
from China, and one-third of simple families from
Kauai, were nestmates. The simple families of the
two Maui subpopulations had a mean FIC-value that
significantly differed from the model for colonies
headed by outbred unrelated pairs (Table 2). This
result was confirmed by KINSHIP analysis of the
parental genotypes reconstructed from the worker
genotypes of simple family colonies; all simple
families on Maui were headed by nestmates. Such a
high proportion of simple families headed by nest-
mates is rather the exception than the rule. The
relatedness of pairs varies across the introduced
range: from mainly unrelated outbred pairs in the
South Carolina and Louisiana populations (Arm-
strong Park, City Park, New Orleans) to 30%
nestmate pairs on Oahu, 33% in the North Carolina
population, 40% in the Kyushu population and 48%
in the Fukue population.
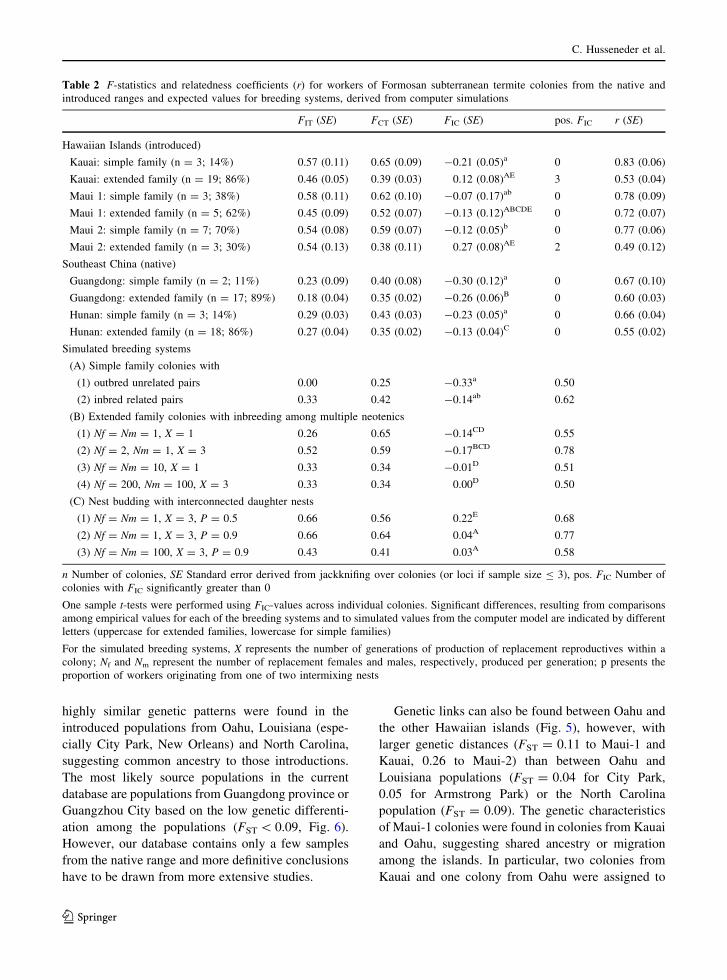
Comparisons of mean FIC-values of the extended
families of the populations from Maui and Kauai to
computer simulations did not reveal a clear picture due
to the high variances and the positive mean (Table 2).
Testing each individual colony showed high propor-
tions of colonies with positive FIC values in the
population of Kauai and in one of the Maui popula-
tions [Kauai: 4 of 19 (21%) extended families; Maui-
2: 2 of 3 (66%)]. This is unprecedented, since only two
other populations (South Carolina and Oahu) had
colonies with positive FIC values and only with a low
occurrence (4–5%). The majority of FIC values in the
extended family colonies from Kauai (14 of 19) and
the two Maui subpopulations (5 of 8) were not
significantly different from zero, and the colonies
were therefore headed by a high number of neotenic
reproductives. Only populations from the Hawaiian
Islands and Kyushu contained extended families that
were headed by a high number of reproductives.
Extended families in most populations from the
introduced range were headed by a low number of
reproductives.
Eleven out of a total of 17 extended families in
Guangdong province, and six of 18 extended fami-
lies in Hunan province, had significantly negative
FIC-values (P \ 0.05). The mean FIC values of
extended families in both populations from China
were significantly different from those predicted by
computer simulations assuming a high number ([10)
of reproductives (P \ 0.001, Table 2). Therefore, we
conclude that most Chinese extended family colonies
are headed by only a few neotenic pairs.
Relationships among populations
Colonies from the native population of Hunan prov-
ince showed a rather uniform genetic pattern with all
colonies assigned with [60% to the same unique
cluster (Fig. 5). This suggests that colonies from
Hunan contributed little to the genetic make-up of
other populations in the dataset. In contrast, colonies
from Guangdong province and Guangzhou City are
characterized by a genetic ‘‘patchwork’’ pattern of
colonies containing up to 10 genetic clusters, indicat-
ing that these populations may have contributed to the
genetic clusters in other populations in the dataset.
For example, genetic characteristics from colonies of
these two native populations occur in populations
introduced to Oahu, Maui and Kauai. Interestingly,
0
20
40
60
80
100
120
1 2 3 4 5 6 7 8 9 10 11 12 13
Num
ber
of a
llele
s
Number of populations sampled
All
Introduced
Native
95% CI
ICE
Fig. 3 Rarefaction analysis of number of alleles detected
depending on number of populations sampled. The Incidence
based estimator (ICE) of total allele numbers across native and
introduced populations projects just over 100 alleles. Allele
numbers in introduced populations start leveling off below 70.
This suggests that increasing the number of populations
sampled from the introduced range is not likely to capture
the projected total diversity. However, increasing the numbers
of sampled populations in the native range likely would
increase allele numbers towards the projected estimate
Genetic diversity and colony breeding structure in native and subterranean termite
123
highly similar genetic patterns were found in the
introduced populations from Oahu, Louisiana (espe-
cially City Park, New Orleans) and North Carolina,
suggesting common ancestry to those introductions.
The most likely source populations in the current
database are populations from Guangdong province or
Guangzhou City based on the low genetic differenti-
ation among the populations (FST \ 0.09, Fig. 6).
However, our database contains only a few samples
from the native range and more definitive conclusions
have to be drawn from more extensive studies.
Genetic links can also be found between Oahu and
the other Hawaiian islands (Fig. 5), however, with
larger genetic distances (FST = 0.11 to Maui-1 and
Kauai, 0.26 to Maui-2) than between Oahu and
Louisiana populations (FST = 0.04 for City Park,
0.05 for Armstrong Park) or the North Carolina
population (FST = 0.09). The genetic characteristics
of Maui-1 colonies were found in colonies from Kauai
and Oahu, suggesting shared ancestry or migration
among the islands. In particular, two colonies from
Kauai and one colony from Oahu were assigned to
Table 2 F-statistics and relatedness coefficients (r) for workers of Formosan subterranean termite colonies from the native and
introduced ranges and expected values for breeding systems, derived from computer simulations
FIT (SE) FCT (SE) FIC (SE) pos. FIC r (SE)
Hawaiian Islands (introduced)
Kauai: simple family (n = 3; 14%) 0.57 (0.11) 0.65 (0.09) -0.21 (0.05)a 0 0.83 (0.06)
Kauai: extended family (n = 19; 86%) 0.46 (0.05) 0.39 (0.03) 0.12 (0.08)AE 3 0.53 (0.04)
Maui 1: simple family (n = 3; 38%) 0.58 (0.11) 0.62 (0.10) -0.07 (0.17)ab 0 0.78 (0.09)
Maui 1: extended family (n = 5; 62%) 0.45 (0.09) 0.52 (0.07) -0.13 (0.12)ABCDE 0 0.72 (0.07)
Maui 2: simple family (n = 7; 70%) 0.54 (0.08) 0.59 (0.07) -0.12 (0.05)b 0 0.77 (0.06)
Maui 2: extended family (n = 3; 30%) 0.54 (0.13) 0.38 (0.11) 0.27 (0.08)AE 2 0.49 (0.12)
Southeast China (native)
Guangdong: simple family (n = 2; 11%) 0.23 (0.09) 0.40 (0.08) -0.30 (0.12)a 0 0.67 (0.10)
Guangdong: extended family (n = 17; 89%) 0.18 (0.04) 0.35 (0.02) -0.26 (0.06)B 0 0.60 (0.03)
Hunan: simple family (n = 3; 14%) 0.29 (0.03) 0.43 (0.03) -0.23 (0.05)a 0 0.66 (0.04)
Hunan: extended family (n = 18; 86%) 0.27 (0.04) 0.35 (0.02) -0.13 (0.04)C 0 0.55 (0.02)
Simulated breeding systems
(A) Simple family colonies with
(1) outbred unrelated pairs 0.00 0.25 -0.33a 0.50
(2) inbred related pairs 0.33 0.42 -0.14ab 0.62
(B) Extended family colonies with inbreeding among multiple neotenics
(1) Nf = Nm = 1, X = 1 0.26 0.65 -0.14CD 0.55
(2) Nf = 2, Nm = 1, X = 3 0.52 0.59 -0.17BCD 0.78
(3) Nf = Nm = 10, X = 1 0.33 0.34 -0.01D 0.51
(4) Nf = 200, Nm = 100, X = 3 0.33 0.34 0.00D 0.50
(C) Nest budding with interconnected daughter nests
(1) Nf = Nm = 1, X = 3, P = 0.5 0.66 0.56 0.22E 0.68
(2) Nf = Nm = 1, X = 3, P = 0.9 0.66 0.64 0.04A 0.77
(3) Nf = Nm = 100, X = 3, P = 0.9 0.43 0.41 0.03A 0.58
n Number of colonies, SE Standard error derived from jackknifing over colonies (or loci if sample size B 3), pos. FIC Number of
colonies with FIC significantly greater than 0
One sample t-tests were performed using FIC-values across individual colonies. Significant differences, resulting from comparisons
among empirical values for each of the breeding systems and to simulated values from the computer model are indicated by different
letters (uppercase for extended families, lowercase for simple families)
For the simulated breeding systems, X represents the number of generations of production of replacement reproductives within a
colony; Nf and Nm represent the number of replacement females and males, respectively, produced per generation; p presents the
proportion of workers originating from one of two intermixing nests
C. Husseneder et al.
123

Maui-1 with C80%, suggesting recent transport.
Maui-2, however, was an independent introduction, with
little intermixture with other populations in the dataset.
The two populations previously collected from
Fukue and Kyushu in Japan (Vargo et al. 2003) shared
little genetic characteristics with any of the native or
introduced populations and were, thus, not a recent
source or recipient of introduced colonies (Fig. 5).
Interestingly, three colonies from Fukue were geneti-
cally assigned to the Kyushu population with member-
ship coefficients[95%, indicating a recent transport of
these colonies to Fukue from Kyushu or a related
population. Vice versa, four of the Kyushu colonies
were assigned to the Fukue population with member-
ship coefficients[80%. Human transport probably is a
factor in the gene flow, since geographical isolation of
the Japanese islands (by approximately 100 km)
prevents spread by natural means. Like the Japanese
populations, the earliest introduction to the continental
USA, Charleston SC, was largely independent from the
other populations studied so far. Its homogenous
pattern suggests a single introduction, with a source
unrelated to other populations in this study.
Discussion
The main focus points of our case study involving
the invasion biology of the Formosan subterranean
termite are: (1) identifying the origin of introduced
populations to identify the main sources, routes and
numbers of introductions, with the ultimate goal to
devise preventative measures, (2) describing the
genetic diversity of populations and colonies to
assess viability and adaptability of the species in its
invasive ranges, and (3) determining the breeding
structures of colonies and possible genetic changes
occurring after introduction.
Origin, routes and numbers of introductions
of Formosan subterranean termites
Molecular markers have proven to be valuable in
identifying source populations of invasive insects,
including Mediterranean fruit flies (Davies et al.
1999), Asian longhorned beetle (Carter et al. 2010)
and red imported fire ants (Caldera et al. 2008,
Ascunce et al. 2011), among others. In invasive
termite species of the genus Reticulitermes, the use of
mitochondrial (mt) DNA sequences successfully
demonstrated that the North American R. flavipes is
the same species as the South American and Euro-
pean R. santonensis, and was thus introduced from
North America to France and South America (Austin
et al. 2005; Su et al. 2006). Microsatellite data, in
conjunction with mtDNA data (Perdereau 2010) and
cuticular hydrocarbons (Perdereau et al. 2010a)
indicated that Louisiana was the likely origin to
introductions of this species in France.
The lack of genetic variation in populations of
C. formosanus has hindered the precise identifica-
tion of source populations and routes of introduction
via alloenzymes (Korman and Pashley 1991; Wang
and Grace 2000) and mtDNA markers (Broughton
and Grace 1994; Austin et al. 2006). For example, a
study by Li et al. (2009) showed that the intraspecies
variation of three mtDNA genes of C. formosanus
ranged only from 0 to 0.3%, in spite of global
sampling. Suggested clades were separated by only
up to 3 bp differences. Even in the native range
mtDNA variability of C. formosanus is low (Fang
et al. 2008). Only one publication (Jenkins et al.
2002) reported a high degree of mtDNA variation in
C. formosanus, but a subsequent study by Austin
et al. (2006) concluded that this high variation may
have been an artifact of sequencing or sequence
alignment. Despite the lack of mtDNA variability,
some important information was provided by mtDNA
PopulationGuang
zhou
City
, Chin
a
Guang
dong
, Chin
a
Hunan
, Chin
a
Kyush
u, Ja
pan
Fukue
, Jap
an
Oahu,
HI
Kauai,
HI
Mau
i 1, H
I
Mau
i 2, H
I
Charle
ston,
SC
Armstr
ong P
ark, L
A
City P
ark, L
A
Rutherf
ord,
NC
Per
cent
age
of c
olon
ies
0
20
40
60
80
100
Native Introduced1600s 1900s 1929 1933-50s 1957 1966 1990
#col12 19 21 20 10 19 22 8 10 25 14 17 8
Extended Simple
Fig. 4 Comparison of the percentage of simple versus
extended family colonies between native and introduced
populations
Genetic diversity and colony breeding structure in native and subterranean termite
123

studies on large scale lineages of C. formosanus. For
example, phylogenetic analyses of samples from the
introduced and native range by Austin et al. (2006)
resulted in two clades, one mainly comprised of
several populations from China (Hong Kong,
Guangzhou), Japan (Nagasaki) and Oahu, the other
mainly of populations from the continental USA,
including Louisiana (New Orleans, Lake Charles),
North Carolina and South Carolina.
To overcome the limitations of low mtDNA
variability in C. formosanus, we employed microsat-
ellites in our studies, which have higher variability
than mtDNA markers and a different mode of
inheritance, increased the number of colonies sam-
pled per population (compared to previous studies)
and used probabilistic assignments of colonies to
populations to determine the degree of admixture
within and between populations (Pritchard et al.
2000). We have shown that Hunan province is an
unlikely source of origin for C. formosanus popula-
tions in the dataset due to the uniform and distinct
genetic pattern of its populations, but we confirmed
the close association between Guangdong province
(including Guangzhou City) and Oahu, as suggested
by Austin et al. (2006). This is not surprising
considering historic shipping and immigration routes
between Canton (Guangdong) and the Kingdom of
Hawaii, with the main port in Honolulu (Gay 1967).
Oahu’s environmental conditions (warm tempera-
tures, frequent rainfall, abundance of wooden con-
structions, and few competitors, predators, pathogens,
etc.) are certainly favorable for the establishment and
Fig. 5 Assignment of colonies to genetic clusters across all
analyzed native and introduced populations. Data from
previously published studies were reanalyzed and included:1Husseneder et al. (2008), 2Vargo et al. (2003), 3Husseneder
et al. (2005), 4Vargo et al. (2006). Columns represent colonies;
each color represent a different genetic cluster defined by
STRUCTURE (K = 13). The colors in each column represent
the likelihood with which a colony is assigned to each genetic
cluster. Note that the red color in the Chinese populations is
not the same as in the Japanese populations
C. Husseneder et al.
123
spread of C. formosanus. Finding a close association
between C. formosanus populations from Guangdong
and Oahu, however, does not preclude the existence
of additional source populations contributing to the
colonization of the invasive range, e.g. from Hong
Kong, Hainan and/or Taiwan (Fang et al. 2008; Li
et al. 2009).
The main differences between our findings and
those of Austin et al. (2006) were: (1) We could not
confirm two distinct lineages separating the conti-
nental USA and Hawaii. While some of the conti-
nental (South Carolina) and Hawaiian populations
(Maui-2) did not share many genetic characteristics
with other populations in the dataset, there was
clearly a genetic link between populations of Oahu,
New Orleans and Rutherford, NC. It is well estab-
lished that the Formosan subterranean termite was
brought to the continental USA after World War II,
via military retrograde from the Pacific Theater
(LaFage 1987). Oahu was likely a staging area and
hub for shipping wooden pallets, crates, etc. to ports
in the USA, such as New Orleans. At least one well
documented introduction to Armstrong Park, New
Orleans was traced back to Camp Leroy Johnson, one
of several military bases responsible for introducing
Formosan subterranean termites to New Orleans after
World War II (Spink 1967; Scott and Scott 1996).
From New Orleans, C. formosanus may then have
been transported to other areas in the southeast, like
Atlanta (Jenkins et al. 2002) and North Carolina, via
infested wooden materials, such as railroad ties. (2)
The Japanese populations from Fukue and Kyushu
were distinct from any of the native and introduced
populations in our dataset, which is contrary to the
placement of samples from Nagasaki in the same
clade as samples from Guangzhou by Austin et al.
(2006). This suggests that populations in Japan may
have different origins. Some populations, including
Nagasaki, may have originated from Guangzhou (or
related populations in southeast China), which is
supported by the observation that the same termi-
tophilous beetle species are found in C. formosanus
colonies originating both from southern China and
southern Japan (Kistner 1985; Maruyama and Iwata
2002). The origin of other C. formosanus populations,
including Fukue and Kyushu, has yet to be deter-
mined. Li et al. (2009) suggested that Taiwan (the
original island of Formosa) may be the center of
origin of the Formosan subterranean termite and the
main source of introductions to Japan.
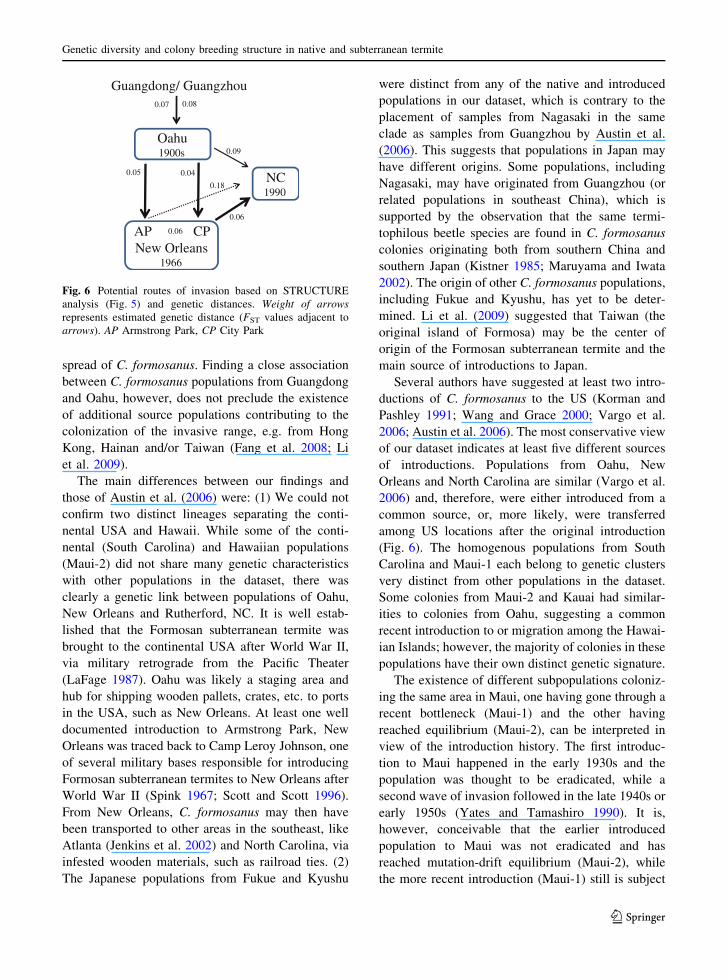
Several authors have suggested at least two intro-
ductions of C. formosanus to the US (Korman and
Pashley 1991; Wang and Grace 2000; Vargo et al.
2006; Austin et al. 2006). The most conservative view
of our dataset indicates at least five different sources
of introductions. Populations from Oahu, New
Orleans and North Carolina are similar (Vargo et al.
2006) and, therefore, were either introduced from a
common source, or, more likely, were transferred
among US locations after the original introduction
(Fig. 6). The homogenous populations from South
Carolina and Maui-1 each belong to genetic clusters
very distinct from other populations in the dataset.
Some colonies from Maui-2 and Kauai had similar-
ities to colonies from Oahu, suggesting a common
recent introduction to or migration among the Hawai-
ian Islands; however, the majority of colonies in these
populations have their own distinct genetic signature.
The existence of different subpopulations coloniz-
ing the same area in Maui, one having gone through a
recent bottleneck (Maui-1) and the other having
reached equilibrium (Maui-2), can be interpreted in
view of the introduction history. The first introduc-
tion to Maui happened in the early 1930s and the
population was thought to be eradicated, while a
second wave of invasion followed in the late 1940s or
early 1950s (Yates and Tamashiro 1990). It is,
however, conceivable that the earlier introduced
population to Maui was not eradicated and has
reached mutation-drift equilibrium (Maui-2), while
the more recent introduction (Maui-1) still is subject
Guangdong/ Guangzhou
Oahu 1900s
NC 1990
0.08
0.09
AP CPNew Orleans
1966
0.18
0.06
0.05
0.06
0.04
0.07
Fig. 6 Potential routes of invasion based on STRUCTURE
analysis (Fig. 5) and genetic distances. Weight of arrowsrepresents estimated genetic distance (FST values adjacent to
arrows). AP Armstrong Park, CP City Park
Genetic diversity and colony breeding structure in native and subterranean termite
123

to the effects of a bottleneck. This would be a more
parsimonious explanation for the existence of two
subpopulations than assuming a successful eradica-
tion and two subsequent new introductions.
The colonies of Maui-2 do not share much genetic
admixture with other populations in the dataset and
are thus of unknown origin. The genetic diversity of
Maui-2 is low, suggesting that the population is based
on only a few founder colonies or has gone through a
bottleneck event (eradication effort) too long ago to
be detected. In contrast, Maui-1 shows a bottleneck
effect and was thus likely the more recent introduc-
tion of the two. The similarity of the genetic pattern
of the Maui-1 population to that of colonies from the
neighboring island of Oahu, suggests Oahu was the
source of this introduction.
Geographical separation of the colonies of the two
subpopulations of Maui does not exceed swarming
distance (Messenger and Mullins 2005; Husseneder
et al. 2006; Simms and Husseneder 2009), yet there
is little admixture of the colonies. Apparently,
interbreeding of Maui colonies is a rare event, as
supported by the fact that all simple families in both
subpopulations are headed by nestmate pairs, i.e.,
alates or neotenic pairs from the same colony. Alate
swarms have been observed in Maui, but swarms are
not likely to be the major form of colony propagation,
because the lack of interbreeding among colonies
suggests a low probability of incipient colonies
reaching maturity. An unusually high proportion of
extended family colonies of the presumably older
introduction (Maui-2) showed positive FIC-values,
similar to populations of Kauai and Oahu. Budding
occurs when a portion of a colony gradually splits off
and becomes a separate reproductive unit. During the
process of budding genetically differentiated nests
may still exchange workers (Husseneder et al. 1998)
which results in positive FIC-values (Thorne et al.
1999; Bulmer et al. 2001). Thus, budding may be a
viable form of colony propagation in the Hawaiian
islands; although this is rare in other C. formosanus
populations (Vargo and Husseneder 2009). Propaga-
tion by budding, and the lack of successful colony
foundation after swarming may explain the small-
scale isolation by distance and the lack of admixture
in the Maui populations.
Although microsatellite genotypes are capable of
revealing even subtle substructures (e.g., subpopula-
tions on Maui) and large scale gene flow (Oahu, New
Orleans, NC), more samples will be needed to com-
plete the picture and pinpoint sources and routes of
invasions for the remaining populations that did not
share considerable genetic characteristics with any
other population in the current dataset (i.e., South
Carolina, Maui-2, Fukue, Kyushu). In this study, we
focused on a part of the native range (Guangzhou City,
Guangdong province) that is believed to be a major
source of Formosan subterranean termite spread, due to
a long-standing history of major trade routes. How-
ever, the overall lower genetic distance in these native
populations as compared to the introduced populations
suggests that a considerable number of potential source
populations were not captured by this dataset. This
was further supported by the fact that only a fraction
of estimated allele numbers were represented in the
investigated native populations (Fig. 3). Therefore, we
are currently processing samples from additional
historic trading and shipping centers in China, includ-
ing Hong Kong, Fujian province, and Taiwan, among
others. With the inclusion of additional populations
from across the native range the likelihood of success-
ful assignment to source populations is expected to
increase significantly (Muirhead et al. 2008). Knowing
the most likely origins and routes of introduction may
facilitate the search for biological control agents and
the development of cost-effective programs to prevent
new introductions.
Genetic diversity of populations
Introduced populations frequently experience a
genetic bottleneck due to transport of only a few
individuals or colonies to a new location. Bottlenecks
can only be detected across a few dozen generations
(Luikart et al. 1998). Yet there is a lingering effect in
the form of reduced genetic diversity (Holway et al.
2002; Tsutsui et al. 2000) unless repeated introduc-
tions from multiple, genetically distinct source pop-
ulations counteract the effect of genetic bottlenecks
connected to each single introduction. However,
genetically diverse introduced populations, such as
populations of the paper wasp in the USA (Johnson
and Starks 2004), are the exception.
Introduced populations of Argentine ants (Suarez
et al. 1999) and red imported fire ants (Krieger and
Keller 1997, 1999) have low genetic diversity–in some
cases with only 50% of the allelic richness of native
populations (Tsutsui et al. 2000). Populations of the
C. Husseneder et al.
123
invasive termite R. flavipes also have only half of the
allele numbers in introduced populations in France,
compared to its native range (USA) (Dronnet et al.
2005; Vargo 2003; Vargo and Carlson 2006). The
present study shows a similar reduction in allele
numbers in introduced C. formosanus populations
(Fig 2). Even if we combine the alleles found in all of
the investigated introduced populations of the Formo-
san subterranean termite, the allelic richness in the
introduced range (48 alleles) is 33% lower than in the
native range (72 alleles), even though the allele
numbers in the native range are an underestimate
due to the limited number of populations sampled
(Fig. 3). Although there were likely multiple inde-
pendent introductions outside of China, even to the
same geographical location (e.g., Maui), the effect of
genetic bottlenecks (i.e., reduction in genetic diver-
sity) with each introduction was not mitigated (John-
son and Starks 2004). Bottleneck events could still be
detected in C. formosanus introductions recorded after
the 1940s. Assuming that a newly founded termite
colony matures within 5–8 years (Huang and Chen
1984), the time span of approximately 70 years since
introduction would represent 8–14 generations, which
falls into the typical timeframe in which bottlenecks
are detectable (Luikart et al. 1998). Bottlenecks likely
occurred in the older introduced populations, too, as
evidenced by the reduced genetic diversity, but are no
longer detectable. Reduced genetic diversity is pre-
dicted to have negative consequences, and should limit
population growth, persistence and the ability of
populations to adapt to changing selective pressures
(Sakai et al. 2001). Nevertheless, invasive Reticulit-
ermes and Coptotermes spp. persist, thrive and expand
in their introduced ranges, despite reduced genetic
variability.
Colony breeding structure
Reduced genetic diversity in introduced populations
of social insects can have multiple ramifications
concerning breeding structure. In invasive Hymenop-
tera, low genetic diversity is believed to be the reason
for low intraspecific aggression, which in extreme
cases leads to unicoloniality, i.e., the formation of
large supercolonies that dominate the introduced
range (Holway et al. 2002; Tsutsui et al. 2000, 2003;
Breton et al. 2004; Suarez et al. 2008; Fournier et al.
2009). In addition, frequent occurrence of polygyny
and colony propagation by budding could facilitate
spread of invasive species after introduction (Tsutsui
and Suarez 2003).
Only a few studies on genetic diversity and
breeding structure in invasive termites have been
conducted to date. These studies seem to corroborate
the hypotheses derived from invasive ant species. For
example, R. flavipes and R. urbis both have reduced
genetic diversity and large extended family colonies
with high numbers of neotenics in the introduced
range of Western Europe (Dronnet et al. 2005;
Leniaud et al. 2009, 2010). In their native range in
North America, R. flavipes colonies are mainly
simple families (75%) or extended families (22%)
with few reproductives (Vargo and Husseneder
2009).
Furthermore, colony fusion, resulting in colonies
headed by multiple unrelated reproductives, occurs in
a greater rate in introduced populations of R. flavipes
(up to 31%, (Perdereau et al. 2010b) than in the
native range (DeHeer and Vargo 2004), and, in
general, populations with high proportions of
extended family colonies have the highest rate of
colony fusion (Bulmer et al. 2001; DeHeer and
Kamble 2008). Fusion is facilitated by low levels of
aggression among R. flavipes colonies. Incidental
aggression has been reported in native North Amer-
ican populations (Shelton and Grace 1996), but
aggression is largely lacking in the introduced range
(Canada, France) where the highest rate of fusion
occurs (Grace 1996; Perdereau et al. 2010b).
In contrast to invasive Reticulitermes spp., reduced
genetic diversity in C. formosanus populations did
not result in the predominance of extended families in
the introduced range (Fig. 4). On the contrary,
extended families seem to be predominant in the
native range, although this result needs to be
corroborated by including additional populations
from the native range into the dataset. The breeding
structure of colonies in the introduced range varies
considerably among populations, with no correlation
to the putative time of introduction (Fig. 4). Seven of
the ten populations from the introduced range con-
sisted mainly of simple families (Vargo et al. 2003,
2006; Husseneder et al. 2005, 2008). Solely, the
population of Kauai showed a predominance of
extended family colonies (86%) comparable to that
of native populations. The ratios of simple versus
extended family colonies in introduced urban
Genetic diversity and colony breeding structure in native and subterranean termite
123
populations have been shown to shift over time, after
disturbance or with reinvasion after treatment (Aluko
and Husseneder 2007; Husseneder et al. 2007). Thus,
the proportions of simple versus extended families in
introduced populations are a reflection of variable
ecological conditions, such as the degree to which the
habitat is saturated with colonies, rather than a
biological consequence of loss of genetic diversity or
an adaptive pattern of establishment in a new area.
Interestingly, the Hawaiian populations showed
high proportions of colonies with positive FIC values.
Outside of Hawaii, only 1 of 13 extended family
colonies in South Carolina (Vargo et al. 2006)
showed positive FIC values, while none of the 47
extended family colonies from three native popula-
tions from China (this study and Husseneder et al.
2008) and none of the over 43 extended families from
the introduced range of Louisiana (Husseneder et al.
2005, 2007; Vargo et al. 2006; Aluko and Husseneder
2007), North Carolina (Vargo et al. 2006) and Japan
(Vargo et al. 2003) have shown significant positive
FIC values.
Positive FIC values are caused by mixing of
genetically different groups. If unrelated colonies
fuse, like it has been shown for invasive Reticulitermes
spp. (DeHeer and Vargo 2004; Perdereau et al. 2010b),
relatedness among workers is expected to drop below
0.5 (Thorne et al. 1999; Bulmer et al. 2001), and
worker genotypes would not be consistent with being
the offspring of neotenics whose origin can be traced
back to a single founder pair. However, all Hawaiian
colonies with positive FIC showed high relatedness
(0.52–0.72), and none had more than four alleles per
locus. Thus, in contrast to fusion of unrelated
Reticulitermes colonies in the introduced range,
mixed C. formosanus colonies probably resulted
from multiple groups of neotenic reproductives
located in spatially separated reproductive centers
within the colony, as would be expected if there was
nest budding with interconnected daughter nests
(Table 2, case C). Budding is known to occur in
subterranean termites (Husseneder et al. 1998);
however, it is not a wide-spread strategy for inva-
siveness in C. formosanus. Its occurrence is rather
limited to certain geographical regions, such as
Hawaii, probably due to ecological factors less
conducive to the foundation of independent incipient
colonies, as indicated by the high rate of nestmate
pairs heading simple family colonies.
Fusion of unrelated colonies has not yet been
observed in C. formosanus and is thus a rare event if
it occurs at all in areas that have been sampled. In
contrast to the above mentioned invasive ant and
Reticulitermes species, reduced genetic diversity in
the introduced range did not lead to a breakdown in
nestmate recognition and intercolonial aggression of
Formosan subterranean termites. Although aggres-
sion among C. formosanus colonies is variable in the
introduced (Husseneder and Grace 2001; Shelton
and Grace 1996) and native ranges (Husseneder,
Vargo pers. observation) independent of breeding
structure, colony integrity is typically maintained
even with low aggression (Husseneder et al. 2005;
Messenger and Su 2005).
In conclusion, the invasion success of the Formo-
san subterranean termite cannot be attributed to a
breakdown in nest mate recognition and a shift to
unicoloniality in introduced populations, as previ-
ously found in some highly invasive ants and termite
species. There are, however, multiple, not mutually
exclusive characteristics of Formosan subterranean
termite biology that could facilitate invasiveness. For
example, since nests are hidden in wooden material,
colony propagules are protected from predation, are
easily transported by human trade and traffic, and
can usually remain undetected until the infestation
has already spread (Spink 1967). Wood, as a food
source, is almost unlimited and since efficient
digestion of wood requires a special complement
of gut symbionts (reviewed in Husseneder et al.
2010), there is limited competition for food. Multiple
reproductive strategies, including dispersal by
swarming or budding (although not frequently
observed), the high fecundity of queens, the ability
to produce neotenics after death of the colony
founders, etc. (Vargo and Husseneder 2009), might
allow populations to adapt and compete in a wide
range of environmental conditions. However, these
characteristics are true for many termite species,
while only a few are truly successful invaders. What
sets Formosan subterranean termites apart from most
non-invasive termite species is the association with
human activities and urban environments. In fact,
even in their native range, Formosan subterranean
termites are most easily found in areas inhabited or
disturbed by humans (Vargo, Husseneder pers.
observation). It has been previously shown for birds
and other vertebrates that human association
C. Husseneder et al.
123
facilitates range expansion and invasiveness (New-
some and Noble 1986, Ehrlich 1989).
Acknowledgments We thank Mokihana Pest Control of
Kauai and Bowman Termite and Pest Control LLC of Maui
for providing samples and Julian Yates for introducing us to
the respective termite control companies. Warren Booth gave
helpful technical assistance and offered many suggestions on
the manuscript. We thank Sue Garner for assisting with DNA
extraction. We also thank Amit Sethi, Lane Foil and the
anonymous reviewers for providing valuable comments on
earlier drafts of this manuscript. This work was supported by
grants from USDA-TSTAR to JKG, CH and ELV administered
by the College of Tropical Agriculture & Human Resources,
University of Hawaii at Manoa, and USDA-ARS cooperative
agreements and funds from the state of Louisiana to CH.
Open Access This article is distributed under the terms of the
Creative Commons Attribution Noncommercial License which
permits any noncommercial use, distribution, and reproduction
in any medium, provided the original author(s) and source are
credited.
References
Aluko GA, Husseneder C (2007) Colony dynamics of the
Formosan subterranean termite in a frequently disturbed
urban landscape. J Econ Entomol 100:1037–1046
Anonymous (1965) Formosan subterranean termite-Texas. US
Dep Agric Coop Econ Insect Rep 15:907–908
Ascunce MS, Yang C-C, Oakey J, Calcaterra L, Wu W-J, Shih
C-J, Goudet J, Ross KG, Shoemaker D (2011) Global
invasion history of the fire ant Solenopsis invicta. Science
25:1066–1068
Austin JW, Szalanski AL, Rudolf HS, Messenger MT (2005)
Genetic variation of Reticulitermes flavipes (Isoptera: Rhin-
otermitidae) in North America: applying the mitochondrial
rRNA 16S gene. Ann Entomol Soc Am 98:980–988
Austin JW, Szalanski AL, Scheffrahn RH, Messenger MT,
McKern JA, Gold RE (2006) Genetic evidence for two
introductions of the Formosan subterranean termite,
Coptotermes formosanus (Isoptera: Rhinotermitidae), to
the United States. Fla Entomol 89:183–193
Breton J, Delabie J, Chazeau J, Dejean A, Jourdan H (2004)
Experimental evidence of large-scale unicoloniality in the
tramp ant Wasmannia auropunctata (Roger). J Insect
Behav 17:263–271
Broughton RE, Grace JK (1994) Lack of mitochrondrial DNA
variation in an introduced population of the Formosan
subterranean termite (Isoptera: Rhinotermitidae). Socio-
biology 24:121–126
Bulmer MS, Traniello JFA (2002) Foraging range expansion
and colony genetic organization in the subterranean ter-
mite Reticulitermes flavipes (Isoptera: Rhinotermitidae).
Environ Entomol 31:293–298
Bulmer MS, Adams ES, Traniello JFA (2001) Variation in
colony structure in the subterranean termite Reticuliter-mes flavipes. Behav Ecol Sociobiol 49:236–243
Caldera E, Ross K, DeHeer C, Shoemaker D (2008) Putative
native source of the invasive fire ant Solenopsis invicta in
the USA. Biol Invasions 10:1457–1479
Carter M, Smith M, Harrison R (2010) Genetic analyses of the
Asian longhorned beetle (Coleoptera, Cerambycidae,
Anoplophora glabripennis), in North America, Europe
and Asia. Biol Invasions 12:1165–1182
Chambers DM, Zungoli PA, Hill HSJ (1988) Distribution and
habitats of the Formosan subterranean termite (Isoptera:
Rhinotermitidae) in South Carolina. J Econ Entomol
81:1611–1619
Colwell RK, Coddington JA (1994) Estimating terrestrial
biodiversity through extrapolation. Philos Trans Biol Sci
345:101–118
Colwell RK, Mao CX, Chang J (2004) Interpolating, extrapo-
lating, and comparing incidence-based species accumu-
lation curves. Ecology 85:2717–2727
Davies N, Villablanca FX, Roderick GK (1999) Bioinvasions of
the medfly Ceratitis capitata: source estimation using DNA
sequences at multiple intron loci. Genetics 153:351–360
DeHeer CJ, Kamble ST (2008) Colony genetic organization,
fusion and inbreeding in Reticulitermes flavipes from the
Midwestern US. Sociobiology 51:307–325
DeHeer CJ, Vargo EL (2004) Colony genetic organization and
colony fusion in the termite Reticulitermes flavipes as
revealed by foraging patterns over time and space. Mol
Ecol 13:431–441
Dronnet S, Chapuisat M, Vargo EL, Lohou C, Bagneres AG
(2005) Genetic analysis of the breeding system of an
invasive subterranean termite, Reticulitermes santonensis,
in urban and natural habitats. Mol Ecol 14:1311–1320
Ehrlich PR (1989) Attributes of invaders and invading pro-
cesses: vertebrates. In: Drake JA, DiCastri F, Groves RH,
Kruger FJ, Mooney HA, Rejmanek M, Williamson MH
(eds) Biological invasions: a global perspective. Wiley,
New York, pp 315–328
Evanno G, Regnaut S, Goudet J (2005) Detecting the number
of clusters of individuals using the software structure: a
simulation study. Mol Ecol 14:2611–2620
Fang R, Huang L, Zhong JH (2008) Surprising low levels of
genetic diversity of Formosan subterranean termites in
south China as revealed by the COII gene (Isoptera:
Rhinotermitidae). Sociobiology 51:1–20
Fournier D, De Biseau JC, Aron S (2009) Genetics, behaviour
and chemical recognition of the invading ant Pheidolemegacephala. Mol Ecol 18:186–199
Gay FJ (1967) A world review of introduced species of ter-
mites: CSIRO Melbourne, Australia. Bull 286:1–88
Giraud T, Pedersen JS, Keller L (2002) Evolution of super-
colonies: the Argentine ants of southern Europe. Proc Natl
Acad Sci USA 99:6075–6079
Global Invasive Species Database (2010) http://www.issg.org
Goodnight KF, Queller DC (1999) Computer software for
performing likelihood tests of pedigree relationship using
genetic markers. Mol Ecol 8:1231–1234
Goudet J (2001) FSTAT, a program to estimate and test gene
diversities and fixation indices (version 2.9.3). Available
from http://www.unil.ch/izea/softwares/fstat.html
Grace JK (1996) Absence of overt agonistic behavior in a
northern population of Reticulitermes flavipes (Isoptera:
Rhinotermitidae). Sociobiology 28:103–110
Genetic diversity and colony breeding structure in native and subterranean termite
123

Holway DA, Lach L, Suarez AV, Tsutsui ND, Case TJ (2002)
The causes and consequences of ant invasions. Annu Rev
Ecol Syst 33:181–233
Huang LW, Chen LL (1984) Biology and colony development
of Coptotermes formosanus Shiraki. Acta Entomol Sin
27:64–69
Husseneder C, Grace JK (2001) Evaluation of DNA finger-
printing, aggression tests, and morphometry as tools for
colony delineation of the Formosan subterranean termite.
J Insect Behav 14:173–186
Husseneder C, Brandl R, Epplen C, Epplen JT, Kaib M (1998)
Variation between and within colonies in the termite:
morphology, genomic DNA, and behaviour. Mol Ecol
7:983–990
Husseneder C, Messenger MT, Su NY, Grace JK, Vargo EL
(2005) Colony social organization and population genetic
structure of an introduced population of Formosan sub-
terranean termite from New Orleans, Louisiana. J Econ
Entomol 98:1421–1434
Husseneder C, Simms DM, Ring DR (2006) Genetic diversity
and genotypic differentiation between the sexes in swarm
aggregations decrease inbreeding in the Formosan sub-
terranean termite. Insect Soc 53:212–219
Husseneder C, Simms DM, Riegel C (2007) Evaluation of
treatment succes and patterns of reinfestation of the For-
mosan subterranean termite (Isoptera: rhinotermitidae).
J Econ Entomol 100:1370–1380
Husseneder C, Powell JE, Grace JK, Vargo EL, Matsuura K
(2008) Worker size in the Formosan subterranean termite
in relation to colony breeding structure as inferred from
molecular markers. Environ Entomol 37:400–408
Husseneder C, Ho H-Y, Blackwell M (2010) Comparison of
the bacterial symbiont composition of the Formosan
subterranean termite from its native and introduced range.
Open J Microbiol 4:53–66
Jenkins TM, Dean RE, Forschler BT (2002) DNA technology,
interstate commerce, and the likely origin of Formosan
subterranean termite (Isoptera: Rhinotermitidae) infesta-
tion in Atlanta, Georgia. J Econ Entomol 95:381–389
Jensen J, Bohonak A, Kelley S (2005) Isolation by distance,
web service. BMC Genet 6:13
Johnson RN, Starks PT (2004) A surprising level of genetic
diversity in an invasive wasp: Polistes dominulus in the
northeastern United States. Ann Entomol Soc Am 97:
732–773
Kistner DH (1985) A new genus and species of Termitophilousaleocharinae from mainland China associated with Coptot-ermes formosanus and its zoogeographic significance
(Coleoptera: Staphylinidae). Sociobiology 10:93–104
Korman AK, Pashley DP (1991) Genetic comparisons among
US populations of Formosan subterranean termites.
Sociobiology 19:41–50
Krieger MJB, Keller L (1997) Polymorphism at dinucleotide
microsatellite loci in fire ant Solenopsis invicta popula-
tions. Mol Ecol 6:997–999
Krieger MJB, Keller L (1999) Low polymorphism at 19
microsatellite loci in a French population of Argentine
ants (Linepithema humile). Mol Ecol 8:1078–1080
LaFage JP (1987) Practical considerations of the Formosan
subterranean termite in Louisiana: a 30-year-old problem.
In: Tamashiro M, Su N-Y (eds) Biology and control
of the Formosan subterranean termite. College of Tropical
Agriculture and Human Resources, University of Hawaii,
Honolulu, HI, pp 37–42
Leniaud L, Pichon A, Uva P, Bagneres A-G (2009) Unicolo-
niality in Reticulitermes urbis: a novel feature in a poten-
tially invasive termite species. Bull Entomol Res 99:1–10
Leniaud L, Dedeine F, Pichon A, Dupont S, Bagneres A-G
(2010) Geographical distribution, genetic diversity
and social organization of a new European termite,
Reticulitermes urbis (Isoptera: Rhinotermitidae). Biol
Invasions 12:1389–1402
Li G (2000) Coptotermes. In: Huang F, Zhu S, Ping Z, He X, Li
G, Gao D (eds) Fauna Sinica, Insecta vol. 17: Isoptera.
Science Press, Beijing, pp 299–341
Li H-F, Ye W, Su N-Y, Kanzaki N (2009) Phylogeography of
Coptotermes gestroi and Coptotermes formosanus (Isop-
tera: Rhinotermitidae) in Taiwan. Ann Entomol Soc Am
102:684–693
Luikart G, Cornuet J-M, Allendorf FW (1998) Temporal
changes in allele frequencies provide estimates of popu-
lation bottleneck size. Conserv Biol 89:238–247
Maruyama M, Iwata R (2002) Two new termitophiles of the
tribe Termitohospitini (Coleoptera: Staphylinidae: Aleo-
charinae) associated with Coptotermes formosanus(Isoptera: Rhinotermitidae). Can Entomol 134:419–432
Messenger MT, Mullins AJ (2005) New flight distance recor-
ded for Coptotermes formosanus (Isoptera: Rhinotermiti-
dae). Fla Entomol 88:99–100
Messenger MT, Su N-Y (2005) Colony characteristics and
seasonal activity of the Formosan subterranean termite
(Isoptera: Rhinotermitidae) in Louis Armstrong Park,
New Orleans, Louisiana. J Entomol Sci 40:268–279
Messenger MT, Su NY, Husseneder C, Grace JK (2005)
Elimination and reinvasion studies with Coptotermesformosanus (Isoptera : Rhinotermitidae) in Louisiana.
J Econ Entomol 98:916–929
Muirhead JR, Gray DK, Kelly DW, Ellis SM, Heath DD,
Macisaac HJ (2008) Identifying the source of species
invasions: sampling intensity versus genetic diversity.
Mol Ecol 17:1020–1035
Newsome AE, Noble IR (1986) Ecological and physiological
characters of invading species. In: Groves R, Burdon J
(eds) Ecology of biological invasions: an Australian
perspective. Australian Academy of Science, Canberra,
Australia, pp 1–20
Perdereau E (2010) Biologie de l’invasion d’un termite ame-
ricain en France: evolution de l’organisation sociale et
consequences sur le succes invasive. Dissertation,
Universite Francois Rabelais, Tours, France
Perdereau E, Dedeine F, Christides J-P, Bagneres AG (2010a)
Variations in worker cuticular hydrocarbons and soldier
isoprenoid defensive secretiions within and among intro-
duced and native populations of the subterranean termite,
Reticulitermes flavipes. J Chem Ecol 36:1189–1198
Perdereau E, Bagneres AG, Dupont S, Dedeine F (2010b) High
occurrence of colony fusion in a European population of
the American termite Reticulitermes flavipes. Insect Soc
57:393–402
Pimentel D, Zuniga R, Morrison D (2005) Update on the envi-
ronmental and economic costs associated with alien-invasive
species in the United States. Ecol Econ 52:273–288
C. Husseneder et al.
123

Piry S, Luikart G, Cornuet JM (1999) BOTTLENECK: a
computer program for detecting recent reductions in the
effective population size using allele frequency data.
J Hered 90:502–503
Pritchard JK, Stephens M, Donnelly P (2000) Inference of
population structure using multilocus genotype data.
Genetics 155:945–959
Ross KG, Keller L (1998) Genetic control of social organiza-
tion in an ant. Proc Natl Acad Sci USA 95:14232–14237
Sakai AK, Allendorf FW, Holt JS, Lodge DM, Molofsky J,
With KA, Baughman S, Cabin RJ, Cohen JE, Ellstrand
NC, McCauley DE, O’Neil P, Parker IM, Thompson JN,
Weller SG (2001) The population biology of an invasive
species. Annu Rev Ecol Syst 32:305–332
Scott RF, Scott HG (1996) The Formosan subterranean termite,
Coptotermes formosanus. River Ridge, Louisiana. 144 pp
Shelton TG, Grace JK (1996) Review of agonistic behaviors in
the Isoptera. Sociobiology 28:155–176
Shiraki T (1909) Japanese termites. Trans Entomol Soc Japan
2:229–242 (In Japanese)
Simms DM, Husseneder C (2009) Assigning individual alates
of the Formosan subterranean termite to their colonies of
origin within the context of an area-wide management
program. Sociobiology 53:631–650
Spink WT (1967) The Formosan subterranean termite in
Louisiana. Louisiana State Univ. Circ. 89, 12 pp
Su N-Y (2003) Overview of the global distribution and control
of the Formosan subterranean termite. Sociobiology
41:7–16
Su N-Y, Tamashiro M (1987) An overview of the Formosan
subterranean termite in the world. In: Tamashiro M, Su
N-Y (eds) Biology and control of the Formosan subter-
ranean termite. College of Tropical Agricultural and
Human Resources, University of Hawaii, Honolulu, HI,
pp 3–15
Su N-Y, Ye W, Ripa R, Scheffrahn RH, Giblin-Davis RM
(2006) Identification of Chilean Reticulitermes (Isoptera:
Rhinotermitidae) inferred from three mitochondrial gene
DNA sequences and soldier morphology. Ann Entomol
Soc Am 99:352–363
Suarez AV, Tsutsui ND, Holway DA, Case TJ (1999) Behav-
ioral and genetic differentiation between native and
introduced populations of the Argentine ant. Biol Inva-
sions 1:43–53
Suarez AV, Holway DA, Tsutsui ND (2008) Genetics of col-
onizing species–the invasive Argentine ant. Amer Nat
172:S72–S84
Swezey OH (1914) Notes and exhibitions. Proc Hawaii Ento-
mol Soc 3:27
Thorne BL, Traniello JFA, Adams ES, Bulmer M (1999)
Reproductive dynamics and colony structure of subterra-
nean termites of the genus Reticulitermes (Isoptera:
Rhinotermitidae): a review of the evidence from
behavioral, ecological, and genetic studies. Ethol Ecol
Evol 11:149–169
Tsutsui ND, Suarez AV (2003) The colony structure and
population biology of invasive ants. Conserv Biol 17:
48–58
Tsutsui ND, Suarez AV, Holway DA, Case TJ (2000) Reduced
genetic variation and the success of an invasive species.
Proc Natl Acad Sci USA 97:5948–5953
Tsutsui ND, Suarez AV, Grosberg RK (2003) Genetic diver-
sity, asymmetrical aggression, and recognition in a
widespread invasive species. Proc Nat Acad Sci USA
100:1078–1083
Vargo EL (2000) Polymorphism at trinucleotide microsatellite
loci in the subterranean termite Reticulitermes flavipes.
Mol Ecol 9:817–829
Vargo EL (2003) Hierarchical analysis of colony and popula-
tion genetic structure of the Eastern subterranean termite,
Reticulitermes flavipes, using two classes of molecular
markers. Evolution 57:2805–2818
Vargo EL, Carlson JR (2006) Comparative study of breeding
systems of sympatric subterranean termites (Reticuliter-mes flavipes and R. hageni) in Central North Carolina
using two classes of molecular genetic markers. Environ
Entomol 35:173–187
Vargo EL, Henderson G (2000) Identification of polymorphic
microsatellite loci in the Formosan subterranean termite,
Coptotermes formosanus Shiraki. Mol Ecol 9:1919–1952
Vargo EL, Husseneder C (2009) Biology of subterranean ter-
mites: insights from molecular studies of Reticulitermesand Coptotermes. Annu Rev Entomol 54:379–403
Vargo EL, Husseneder C, Grace JK (2003) Colony and pop-
ulation genetic structure of the Formosan subterranean
termite, Coptotermes formosanus, in Japan. Mol Ecol
12:2599–2608
Vargo EL, Husseneder C, Woodson WD, Waldvogel MG,
Grace JK (2006) Genetic analysis of colony and popula-
tion structure of three introduced populations of the
Formosan subterranean termite (Isoptera: Rhinotermitidae)
in the continental United States. Environ Entomol 35:
151–166
Wang J, Grace JK (2000) Genetic relationship of Coptotermesformosanus (Isoptera: Rhinotermitidae) populations fromthe United States and China. Sociobiology 36:7–19
Wang J, Powell J, Liu Y-Z (2002) A literature review of the
biology and ecology of Coptotermes formosanus (Isop-
tera: Rhinotermitidae) in China. Sociobiology 40:343–360
Weir BS, Cockerham CC (1984) Estimating F-statistics for the
analysis of population structure. Evolution 38:1358–1370
Woodson WD, Wiltz BA, Lax AR (2001) Current distribution
of the Formosan subterranean termite (Isoptera: Rhinot-
ermitidae) in the United States. Sociobiology 37:661–671
Yates JR, Tamashiro M (1990) The Formosan subterranean
termite in Hawaii. Res Ext Seri 117:1–4
Genetic diversity and colony breeding structure in native and subterranean termite
123
Copyright © 2022 FDOKUMEN