Genetic and Morphological Variation in Tropical and ... - Unglue.it
302
Genetic and Morphological Variation in Tropical and Temperate Plant Species Printed Edition of the Special Issue Published in Forests www.mdpi.com/journal/forests W. John Kress and Nancai Pei Edited by
-
Upload
khangminh22 -
Category
Documents
-
view
1 -
download
0
Transcript of Genetic and Morphological Variation in Tropical and ... - Unglue.it

Genetic and Morphological Variation in Tropical and Temperate Plant Species
Printed Edition of the Special Issue Published in Forests
www.mdpi.com/journal/forests
W. John Kress and Nancai PeiEdited by
Genetic and Morphological Variation in Tropical and Tem
perate Plant Species • W. John Kress and N
ancai Pei

Genetic and Morphological Variation in Tropical and Temperate Plant Species


Genetic and Morphological Variation in Tropical and Temperate Plant Species
Editors
W. John Kress
Nancai Pei
MDPI • Basel • Beijing • Wuhan • Barcelona • Belgrade • Manchester • Tokyo • Cluj • Tianjin

EditorsW. John Kress
Department of Botany, National Museum of Natural History,
Smithsonian Institution USA
Nancai Pei
Research Institute of Tropical Forestry,
Chinese Academy of Forestry China
Editorial Office
MDPISt. Alban-Anlage 66
4052 Basel, Switzerland
This is a reprint of articles from the Special Issue published online in the open access journal Forests (ISSN 1999-4907) (available at: https://www.mdpi.com/journal/forests/special issues/
Plant Genetic Morphological).
For citation purposes, cite each article independently as indicated on the article page online and as indicated below:
LastName, A.A.; LastName, B.B.; LastName, C.C. Article Title. Journal Name Year, Article Number,
Page Range.
ISBN 978-3-03936-756-6 (Hbk) ISBN 978-3-03936-757-3 (PDF)
c© 2020 by the authors. Articles in this book are Open Access and distributed under the Creative
Commons Attribution (CC BY) license, which allows users to download, copy and build upon
published articles, as long as the author and publisher are properly credited, which ensures maximum
dissemination and a wider impact of our publications.
The book as a whole is distributed by MDPI under the terms and conditions of the Creative Commons
license CC BY-NC-ND.

Contents
About the Editors . . . . . . . . . . . . . . . . . . . . . . . . . . . . . . . . . . . . . . . . . . . . . . vii
Nancai Pei and W. John Kress
Research in Forest Biology in the Era of Climate Change and Rapid UrbanizationReprinted from: Forests 2020, 11, 26, doi:10.3390/f11010026 . . . . . . . . . . . . . . . . . . . . . . 1
Huixin Gang, Guifeng Liu, Su Chen and Jing Jiang
Physiological and Transcriptome Analysis of a Yellow-Green Leaf Mutant in Birch(Betula platyphylla × B. Pendula)Reprinted from: Forests 2019, 10, 120, doi:10.3390/f10020120 . . . . . . . . . . . . . . . . . . . . . 9
Prashant Kaushik and Shashi Kumar
Transcriptome Analysis of Bael (Aegle marmelos (L.) Corr.) a Member of Family RutaceaeReprinted from: Forests 2018, 9, 450, doi:10.3390/f9080450 . . . . . . . . . . . . . . . . . . . . . . 25
Fumei Liu, Zhou Hong, Daping Xu, Hongyan Jia, Ningnan Zhang, Xiaojin Liu, Zengjiang Yang and Mengzhu Lu
Genetic Diversity of the Endangered Dalbergia odorifera Revealed by SSR MarkersReprinted from: Forests 2019, 10, 225, doi:10.3390/f10030225 . . . . . . . . . . . . . . . . . . . . . 39
Wanhong Lu, Roger J. Arnold, Lei Zhang and Jianzhong Luo
Genetic Diversity and Structure through Three Cycles of a Eucalyptus urophylla S.T.BlakeBreeding ProgramReprinted from: Forests 2018, 9, 372, doi:10.3390/f9070372 . . . . . . . . . . . . . . . . . . . . . . 57
Zhenghai Mo, Gang Feng, Wenchuan Su, Zhuangzhuang Liu and Fangren Peng Identification of miRNAs Associated with Graft Union Development in Pecan [Carya illinoinensis (Wangenh.) K. Koch]Reprinted from: Forests 2018, 9, 472, doi:10.3390/f9080472 . . . . . . . . . . . . . . . . . . . . . . . 79
Mingming Wei, Yajie Wang, Ranran Pan and Weiguo Li
Genome-Wide Identification and Characterization of MADS-box Family Genes Related to FloralOrgan Development and Stress Resistance in Hevea brasiliensis Mull. Arg.Reprinted from: Forests 2018, 9, 304, doi:10.3390/f9060304 . . . . . . . . . . . . . . . . . . . . . . 95
Lihua Xie, Xiangyu Li, Dan Hou, Zhanchao Cheng, Jun Liu, Juan Li, Shaohua Mu and Jian Gao
Genome-Wide Analysis and Expression Profiling of the Heat Shock Factor Gene Family in Phyllostachys edulis during Development and in Response to Abiotic StressesReprinted from: Forests 2019, 10, 100, doi:10.3390/f10020100 . . . . . . . . . . . . . . . . . . . . . 111
Feng Wu, Mei Li, Baowen Liao, Xin Shi and Yong Xu
DNA Barcoding Analysis and Phylogenetic Relation of Mangroves in GuangdongProvince, ChinaReprinted from: Forests 2019, 10, 56, doi:10.3390/f10010056 . . . . . . . . . . . . . . . . . . . . . . 129
Juyang Liao, Linping Zhang, Yan Liu, Qiaoyun Li, Danxia Chen, Qiang Zhang and Jianrong Li
Diversity and Utilization of Edible Plants and Macro-Fungi in Subtropical Guangdong Province, Southern ChinaReprinted from: Forests 2018, 9, 666, doi:10.3390/f9110666 . . . . . . . . . . . . . . . . . . . . . . . 143
v

Xia Mao, Xiang-Xiang Fu, Peng Huang, Xiao-Ling Chen and Yin-Quan Qu
Heterodichogamy, Pollen Viability, and Seed Set in a Population of Polyploidy CyclocaryaPaliurus (Batal) Iljinskaja (Juglandaceae)Reprinted from: Forests 2019, 10, 347, doi:10.3390/f10040347 . . . . . . . . . . . . . . . . . . . . . 153
Jiaxing Mo, Jin Xu, Yuting Cao, Liwei Yang, Tongming Yin, Hui Hua, Hui Zhao, Zhenhao Guo, Junjie Yang and Jisen Shi
Pinus massoniana Introgression Hybrids Display Differential Expression of Reproductive GenesReprinted from: Forests 2019, 10, 230, doi:10.3390/f10030230 . . . . . . . . . . . . . . . . . . . . . 167
Fei Wu, Dingchao Yang, Linping Zhang, Yanliu Chen, Xiaokang Hu, Lei Li and Junsheng Liang
Diversity Estimation and Antimicrobial Activity of Culturable Endophytic Fungi from Litsea cubeba (Lour.) Pers. in ChinaReprinted from: Forests 2019, 10, 33, doi:10.3390/f10010033 . . . . . . . . . . . . . . . . . . . . . . 185
Guihua Huang, Kunnan Liang, Zaizhi Zhou, Guang Yang and Enarth Maviton Muralidharan
Variation in Photosynthetic Traits and Correlation with Growth in Teak (Tectona grandisLinn.) ClonesReprinted from: Forests 2019, 10, 44, doi:10.3390/f10010044 . . . . . . . . . . . . . . . . . . . . . . 197
Tangchun Zheng, Bo Qin, Suzhen Li, Ming Cai, Huitang Pan, Jia Wang, Tangren Cheng and
Qixiang Zhang
Screening of Applicable SSR Molecular Markers Linked to Creeping Trait in Crape MyrtleReprinted from: Forests 2019, 10, 429, doi:10.3390/f10050429 . . . . . . . . . . . . . . . . . . . . . 209
Mirela Tulik, Jerzy Karczewski, Natalia Szeliga, Joanna Jura-Morawiec and Ingeborga Jarzyna
Morphological Characteristics and Allometric Relationships of Shoot in Two Undergrowth Plants: Polygonatum odoratum and Polygonatum multiflorumReprinted from: Forests 2018, 9, 783, doi:10.3390/f9120783 . . . . . . . . . . . . . . . . . . . . . . 223
Ivica Cehulic, Krunoslav Sever, Ida Katicic Bogdan, Anamarija Jazbec, Zeljko Skvorc and
Sasa Bogdan
Drought Impact on Leaf Phenology and Spring Frost Susceptibility in a Quercus robur L.Provenance TrialReprinted from: Forests 2019, 10, 50, doi:10.3390/f10010050 . . . . . . . . . . . . . . . . . . . . . . 235
Kristine Vander Mijnsbrugge and Astrid Janssens
Differentiation and Non-Linear Responses in Temporal Phenotypic Plasticity of SeasonalPhenophases in a Common Garden of Crataegus monogyna Jacq.Reprinted from: Forests 2019, 10, 293, doi:10.3390/f10040293 . . . . . . . . . . . . . . . . . . . . . 251
Songze Wan, Zhanfeng Liu, Yuanqi Chen, Jie Zhao, Qin Ying and Juan Liu
Effects of Lime Application and Understory Removal on Soil Microbial Communities inSubtropical Eucalyptus L’Her. PlantationsReprinted from: Forests 2019, 10, 338, doi:10.3390/f10040338 . . . . . . . . . . . . . . . . . . . . . 269
Fei Wu, Jianrong Li, Yanliu Chen, Linping Zhang, Yang Zhang, Shu Wang, Xin Shi, Lei Li
and Junsheng Liang
Effects of Phosphate Solubilizing Bacteria on the Growth, Photosynthesis, and Nutrient Uptakeof Camellia oleifera Abel.Reprinted from: Forests 2019, 10, 348, doi:10.3390/f10040348 . . . . . . . . . . . . . . . . . . . . . 281
vi

About the Editors
W. John Kress, Ph.D., Visiting Scholar, Dartmouth College and The Arnold Arboretum of Harvard University Distinguished Scientist and Curator Emeritus National Museum of Natural History Smithsonian Institution, P.O. Box 37012 Washington, DC 20013-7012; Tel: 202-633-0939 (DC Office); 202-372-7745 (Mobile); Email: [email protected]; [email protected]; Research Interests: systematic biology; evolutionary biology; conservation biology.
Nancai Pei, Dr. and Associate Research Professor in Research Institute of Tropical Forestry, Chinese Academy of Forestry; Add: No. 682, Guangshan Road 1, Tianhe District, Guangzhou 510520, P. R. China; E-Mail: [email protected]; Research Interests: forest biology; plant DNA barcoding; urban forestry.
vii


Editorial
Research in Forest Biology in the Era of ClimateChange and Rapid Urbanization
Nancai Pei 1,* and W. John Kress 2,*
1 Research Institute of Tropical Forestry, Chinese Academy of Forestry, Guangzhou 510520, China2 Department of Botany, MRC-166, National Museum of Natural History, Smithsonian Institution,
P.O. Box 37012, Washington, DC 20013-7012, USA* Correspondence: [email protected] (N.P.); [email protected] (W.J.K.)
Received: 16 December 2019; Accepted: 21 December 2019; Published: 23 December 2019
Abstract: Green plants provide the foundation for the structure, function, and interactions amongorganisms in both tropical and temperate zones. To date, many investigations have revealed patternsand mechanisms that generate plant diversity at various scales and from diverse ecological perspectives.However, in the era of climate change, anthropogenic disturbance, and rapid urbanization, newinsights are needed to understand how plant species in these forest habitats are changing and adapting.Here, we recognize four themes that link studies from Asia and Europe presented in this SpecialIssue: (1) genetic analyses of diverse plant species; (2) above- and below-ground forest biodiversity;(3) trait expression and biological mechanisms; and (4) interactions of woody plants within a changingenvironment. These investigations enlarge our understanding of the origins of diversity, trait variationand heritability, and plant–environment interactions from diverse perspectives.
Keywords: climate change; forest biodiversity; plant–environment interactions; plant traits; urbanization
1. Introduction
Investigations of plants in both little disturbed, more natural environments, as well as in urbanareas, are needed where crucial green infrastructure is ever more important for sustaining complexhuman societies. Recently, numerous studies have addressed the fundamental issues on plant evolutionand community phylogenetics via exploring patterns and mechanisms from diverse organismal levels(e.g., molecular, population, species, community, landscape, and ecosystem) [1,2], plant functionaltraits (e.g., nutrient traits and reproductive traits) [3,4], and interaction of plant species with changingenvironments (e.g., water, atmosphere, soil, human activities) [5,6].The aim of this Special Issue isto help fill this void in the current research by focusing on diversity, trait, and plant–environmentinteractions within the context of forest ecosystems. The 19 papers encompassed here can best be linkedunder four basic themes: (1) genetic analyses of diverse plant species; (2) above- and below-groundforest biodiversity; (3) trait expression and biological mechanisms; and (4) interactions of woody plantswithin a changing environment.
Together, the guest editors of this Special Issue conceptualized these four themes as a meansto progress an open discussion of forest biology, including plants and diverse environments. Ourproposal for this Special Issue coincided with the common interests of the ecological and forestryresearch communities. This Special Issue includes research performed mostly in Asia and Europe withstudies originating from Belgium, China, Croatia, India, Poland, and Spain. We could not have hopedto create a more internationally inclusive and relevant Special Issue, and are very proud to present asguest editors this collection of forest biology studies.
Forests 2020, 11, 26; doi:10.3390/f11010026 www.mdpi.com/journal/forests1

Forests 2020, 11, 26
2. Theme 1: Genetic Analyses of Diverse Plant Species
This theme includes 7 papers investigating the physiological and transcriptome analyses of6 woody plus 1 herbaceous species from 7 plant families. By studying the differentially expressedgenes (DEGs) between yellow-green leaf mutant (yl) and control plants in Birch (Betulaceae), Gang etal. find that 1163 genes and 930 genes differentially express in yl compared with WT and C11. TheKEGG pathway enrichment analysis for DEGs reveals that photosynthesis antenna proteins representthe most significant enriched pathway. The expressions of photosynthesis antenna proteins are crucialto the leaf color formation in yl. They also report that Chl accumulation, leaf anatomical structure,photosynthesis, and growth are affected in yl. This study has provided the difference in phenomenal,physiological, and gene expression characteristics in leaves between yl mutant and control plants, andpresented a new insight into the mutation underlying the chlorotic leaf phenotype in birch [7].
Kaushik and Kumar report expressed transcripts in the leaves of Aegle marmelos, a medicinal andhorticultural tree species from Rutaceae. They find that 133,616 contigs are assembled to 46,335 unigeneswith minimum and maximum lengths of 201 bp and 14,853 bp, respectively. A total of 482 transcriptsare annotated as cytochrome p450s, and 314 transcripts are annotated as glucosyltransferases. Theysuggest that the monoterpenoid biosynthesis pathway in leaves is predominant [8].
Liu et al. evaluate the genetic diversity of 42 wild individuals from seven populations ofDalbergiaodorifera, a semi-deciduous commercially importantand threatened tree species from Fabaceae,indigenous to Hainan Island in tropical China. They find 19 SSR markers harbored 54 alleles across the42 samples, and the medium genetic diversity level is inferred. Among the 7 wild populations, theexpected heterozygosity varies from 0.31 to 0.40. The AMOVA analysis shows that only 3% of geneticvariation exists among populations. Moderate population differentiation among the investigatedpopulations is indicated by pairwise Fst. Structure analysis suggests two clusters for the 42 samples.These findings provide a preliminary genetic basis for the conservation, management, and restorationof this endemic species [9].
Lu et al. evaluate the genetic diversity and structure of Eucalyptus urophylla, an importantcommercial tropical plantation species from Myrtaceae. They find that significant deviations from theHardy–Weinberg equilibrium are recorded at all 16 loci in the populations, revealing reasonably highlevels of genetic diversity. The genetic differentiation coefficient reveals low differentiation among pairsof provenances comprising the first cycle population. They also find that the majority of moleculargenetic variation exists among individuals rather than among provenances for the first cycle populationand among individuals rather than among field trial sources in the third cycle population [10].
Mo, Feng et al. construct four small RNA libraries from the graft union of Pecan, a high-value fruittree from Juglandaceae. They find that 47 conserved miRNAs belonging to 31 families and 39 novelmiRNAs are identified. For the identified miRNAs, 584 target genes are bioinformatically predicted,and 266 of them are annotated. Meanwhile, 29 miRNAs (including 16 conserved and 13 novel miRNAs)are differentially expressed during the graft process. The expression profiles of 12 miRNA are furthervalidated by qRT-PCR. They also find that miRS26 may be involved in callus formation, while miR156,miR160, miR164, miR166, and miRS10 may be associated with vascular bundle formation. Theseresults indicate that the miRNA-mediated gene regulations play important roles in the graft uniondevelopment of pecan [11].
Wei et al. perform a genome-wide identification and analysis of members of the HbMADS-boxgene family associated with floral organ and inflorescence development in Hevea brasiliensis, a rubbertree species from Euphorbiaceae. They find 20 MADS-box genes are newly identified in the H. brasiliensisgenome. Expression profiling reveals that HbMad-box genes are differentially expressed in varioustissues, which indicate that HbMad-box genes may exert different functions throughout the life cycle.Additionally, 12 genes are found to be associated with the differentiation of flower buds and may beinvolved in flower development. All of these floral-enriched HbMADS-box genes are regulated byhormone, salt, cold, high-temperature, and drought stresses. This study demonstrates that HbMad-box
2

Forests 2020, 11, 26
genes may be multifunctional regulators, and are mainly involved in the maintenance of floral organand inflorescence development [12].
In order to understand the function of heat shock transcription factors (Hsfs) in moso bamboo inthe family Poaceae, Xie et al. identify 22 non-redundant Hsf genes in the moso bamboo genome. Theyfind members of the PheHsf family can be clustered into three classes, containing stress-, hormone-and development-related cis-acting elements. They also find most PheHsfs participate in rapid shootgrowth and flower development in moso bamboo, and PheHsfA1a is expressed mainly during mosobamboo development. Two hub genes are involved in a complex protein interaction network, and fivePheHsfAsare predicted to play an important role in flower and shoot development and abiotic stressresponse of moso bamboo. This study provides an overview of the complexity of the PheHsf genefamily and sets a basis for analyzing the functions of PheHsf genes [13].
3. Theme 2: Above- and Below-Ground Forest Biodiversity
Within this theme, five papers explore the dimensions of plant DNA barcoding, reproductivebiology, and of edible plant and fungalresources in forest diversity. Wu, Li, Liao et al. evaluate theeffectiveness of DNA barcoding in identifying 23 mangrove species in Guangdong Province (GP),southern China. They find that the success rates for PCR amplification of rbcL, matK, trnH-psbA, andITS are 100%, 80.29%, 99.38%, and 97.18%, respectively, and the rates of DNA sequencing are 100%,75.04%, 94.57%, and 83.35%, respectively. These results suggest that both rbcL and trnH-psbA areuniversal in mangrove species in the sampled sites. The highest success rate for species identificationis 84.48% for trnH-psbA, followed by rbcL (82.16%), ITS (66.48%), and matK (65.09%), which increasesto 91.25% with the addition of rbcL. They suggest that rbcL and trnH-psbA are the most suitable DNAbarcode fragments for species identification in mangrove plants, and the combination of matK + rbcL +trnH-psbA + ITS is optimal when constructing the phylogenetic tree in mangrove communities [14].In addition, in GP, Liao et al. obtain diverse datasets of edible plants and macro-fungi from fieldcollections, historical publications, and community surveys across seven cities. This work is guidedon “Observation Methodology for Long-term Forest Ecosystem Research” of National Standards ofthe People’s Republic of China (GB/T 33027-2016). They find that at least 100 plant species (with64 plant species producing fruit) and 20 macro-fungi are commonly used as edible forest products insubtropical GP. There are 55 and 57 species providing edible parts in summer and autumn, respectively.Many edible plants have multiple uses. They suggest that edible plants and macro-fungi can enrichthe food supply for residents in rural and urban areas by acting as supplemental resources to supportthe increasing demand for food in the era of rapid urbanization and global change [15].
Mao et al. describe the flowering phenology pattern of Cyclocarya paliurus, a monoecious specieswith a heterodichogamous mating system, in a juvenile plantation at the individual and populationlevels for 5 consecutive years. They find that four flowering phenotypes and strongly skewedratios of protandry/protogyny and male/female occur in the juvenile population. Sexual type andratio change significantly with the growth of the population over the years, showing an increasingmonoecious group and a decreasing unisexual group, as well as a tendency for the sexual ratio tomove towards equilibrium. Two flowering phases and bimodality in gender are displayed, as in otherheterodichogamous species, thereby verifying the presence of heterodichogamy in C. paliurus [16].
In order to detect the reason for impaired cone maturation in the Pinaceae, Mo, Xu et al. comparetranscriptome libraries of Pinus massoniana and Z pine (a natural introgression hybrid) cones at sevensuccessive growth stages. They find that several cones indeed relate to reproductive processes. Atevery growth stage, these genes are expressed at a higher level in P. massoniana than in the Z pine.These data provide insights into understanding which molecular mechanisms are altered betweenP. massoniana and the Z pine that might cause changes in the reproductive process [17].
To examine the diversity and antimicrobial activities of endophytic fungi in Litsea cubeba, amedicinal plant from Lauraceae, Wu, Yang et al. obtain 970 isolates from the root, stem, leaf, andfruit segments. They find that the fungal endophytes belonged to the phylum Ascomycota and can
3

Forests 2020, 11, 26
be classified into 3 taxonomic classes, 9 orders, 12 families, and 17 genera. Colletotrichum boninense isthe dominant species. For the antimicrobial activities, 17 isolates could inhibit the growth of plantpathogenic fungi, while the extracts of 6endophytes show antimicrobial activity to all the testedpathogenic fungi [18].
4. Theme 3: Trait Expression and Biological Mechanisms
Theme three includes three papers that investigate the physiological and morphological traits andthe possible biological mechanisms that generate and maintain particular patterns in trait expression.In order to interpret the patterns of genetic variation of photosynthesis and the relationships withgrowth traits within gene resources of teak (Tectonagrandis), a commercially important tree species inthe plant family Lamiaceae found in tropical regions, Huang et al. measure gas exchange, chlorophyllfluorescence parameters, growth traits of plants in nursery, and field trials for 20 teak clones originatingfrom different countries. They report abundant genetic variation in gas exchange, chlorophyllfluorescence, and growth among the teak clones. The measured traits are found to have generallyhigh heritability. The net photosynthetic rate, seedling height, and individual volume of wood aresignificantly correlated with each other, and seedling height is significantly correlated with plantheight [19].
Zheng et al. screen creeping genes in crape myrtle (Lagerstroemia indica) in the plant familyLythraceae, which has significant good polymorphisms. They detect two SSR markers, with geneticdistances of 23.49 centimorgan and 25.86 cM from the loci controlling the plant opening angle trait andthe branching angle trait, respectively. The accuracy rate for phenotypic verification is 76.51% and74.14%, respectively, which provides basic information for the molecular marker-assisted selectivebreeding and cloning of the creeping gene to improve architecture diversity in the breeding of crapemyrtle [20].
To describe the spatial arrangement of shoot tissues (rectangular vs. cylindrical) and allometricrelationships in two contrasting species of the Polygonatum from plant family Asparagaceae, Tulik et al.measure the mass and length of the aerial shoots of the individual plants. They find that both speciesdiffer significantly with respect to the length, diameter, and thickness of the outer zone of parenchyma.Allometric relationships are stronger for P. multiflorum [21].
5. Theme 4: Interactions of Woody Plants within a Changing Environment
The four papers addressing this theme describe the investigations of adaptations and responses ofplants to the changing environment and provide feedback on forest management at specific sites. Todetermine the impact of drought on leaf phenology of Quercus robur, an economically and ecologicallyimportant tree species in the plant family Fagaceae, and spring frost susceptibility in nine provenances,Cehulic et al. expose one-year-old saplings to experimental drought, re-water, and score leaf phenologyand frost injury. They find that leaf phenology from most provenances is significantly influenced by thedrought treatment. Drought induces a carry-over effect on flushing phenology. In contrast to flushing,autumn leaf phenology is unambiguously delayed following the drought treatments for all studiedprovenances. This higher susceptibility to spring frost is most likely caused by the advanced flushingphenology, which results from the drought treatment in the previous year [22].
To explore the effect of heritable phenotypic plasticity in the adaptation of woody species to aquickly changing environment, Vander Mijnsbrugge and Janssens observe the timing of bud burst,flower opening, leaf senescence, and leaf fall in two successive years in a common garden of Crataegusmonogyna from Rosaceae. They find a strong auto-correlation is present among the spring phenophasesas well as among the autumnal phenophases, with spring phenophases being negatively correlatedwith fall phenophases. The strongest between-provenance differentiation is found for the timing of budburst in spring. Warmer spring temperatures advance the timing of bud burst. However, advancementis non-linear among the provenances. It can be hypothesized that non-local provenances display larger
4

Forests 2020, 11, 26
temporal phenotypic plastic responses in the timing of their spring phenophases compared to localprovenances when temperatures in the common garden deviate more from their home-sites [23].
The impacts of lime application, understory removal, and their interactive effects on soil microbialcommunities are tested by Wan et al., who conduct a lime application experiment combined withunderstory removal in a subtropical plantation of Eucalyptus (Myrtaceae). They find that lime applicationsignificantly decreases both fungal and bacterial phospholipid fatty acids (PLFAs). Understory removalreduces the fungal PLFAs but has no effect on the bacterial PLFAs. Changes in soil microbialcommunities caused by the lime application are mainly attributed to increases in soil pH and NO3
−-Ncontents, while changes caused by understory removal are mainly due to the indirect effects on soilmicroclimate and the decreased soil-dissolved carbon contents. Furthermore, both lime applicationand understory removal significantly reduce the litter decomposition rates, which may impact themicrobe-mediated soil ecological process. They suggest that lime applications may not be suitable forthe management of subtropical Eucalyptus plantations [24].
Wu, Li, Chen et al. examine the effects of two native phosphate solubilizing bacteria (PSB),and a mixture of both strains on the growth of seedlings of Camellia oleifera (Theaceae). They reporta significant promotion of the growth of C. oleifera plants by three inoculation treatments. All thePSB inoculation treatments can improve the leaf N and P content and have positive effects on theavailable N, P, and K content of the rhizosphere soil. A co-inoculation of the two native PSB strainscauses a synergistic effect and achieves the best benefit. PSB can convert the insoluble phosphates intoplant-available forms and may have the potential for use in sustainable agricultural practices [25].
6. Summary and Future Directions
We are pleased to present this Special Issue and believe that many of the studies included herefrom across the world will make a lasting contribution to biology, ecology, and forestry at diversescales in the era of changing climate and rapid urbanization. All of the case studies here highlight theimportant role of emerging techniques, new methods, and novel theories to promote the developmentof forest biology and plant ecology. We expect that subsequent contributions to this field might considerplant biology from the perspectives of morphology, genetics, trait function, and plant–environmentinteractions with biotic and abiotic factors [1,2,5,26–30]. Such studies may provide novel insights andnew knowledge on quantitative evaluation and description of interactions of plants with animals andmicrobes, both in natural and urban environments, including terrestrial and aquatic systems.
Author Contributions: N.P. and W.J.K., proposed and guest-edited the Special Issue and wrote this editorialtogether. All authors have read and agreed to the published version of the manuscript.
Funding: This work was supported by the National Natural Science Foundation of China (31570594),Fundamental Research Funds of CAF (CAFYBB2017QB002), Research Funds of Guangdong Academy ofSciences (2020GDASYL-20200401001), and CFERN & BEIJING TECHNO SOLUTIONS Award Funds on excellentacademic achievements.
Acknowledgments: We would like to acknowledge the contributions made by the authors and all reviewers ofthe 19 manuscripts in this Genetic and Morphological Variation in Tropical and Temperate Plant Species Special Issue.
Conflicts of Interest: The authors declare no conflict of interest.
References
1. Meineke, E.K.; Davies, T.J.; Daru, B.H.; Davis, C.C. Biological Collections for Understanding Biodiversity inthe Anthropocene. Philos. Trans. R. Soc. B Biol. Sci. 2019, 374, 20170386. [CrossRef] [PubMed]
2. Leebens-Mack, J.H.; Barker, M.S.; Carpenter, E.J.; Deyholos, M.K.; Gitzendanner, M.A.; Graham, S.W.;Grosse, I.; Li, Z.; Melkonian, M.; Mirarab, S.; et al. One Thousand Plant Transcriptomes and the Phylogenomicsof Green Plants. Nature 2019, 574, 679–685.
3. He, N.; Liu, C.; Piao, S.; Sack, L.; Xu, L.; Luo, Y.; He, J.; Han, X.; Zhou, G.; Zhou, X.; et al. Ecosystem TraitsLinking Functional Traits to Macroecology. Trends Ecol. Evol. 2019, 34, 200–210. [CrossRef] [PubMed]
5

Forests 2020, 11, 26
4. Faucon, M.-P.; Houben, D.; Lambers, H. Plant Functional Traits: Soil and Ecosystem Services. Trends PlantSci. 2017, 22, 385–394. [CrossRef] [PubMed]
5. Horváth, Z.; Ptacnik, R.; Vad, C.F.; Chase, J.M. Habitat Loss over Six Decades Accelerates Regional andLocal Biodiversity Loss via Changing Landscape Connectance. Ecol. Lett. 2019, 22, 1019–1027. [CrossRef][PubMed]
6. Pei, N.; Wang, C.; Sun, R.; Xu, X.; He, Q.; Shi, X.; Gu, L.; Jin, J.; Liao, J.; Li, J.; et al. Towards an IntegratedResearch Approach for Urban Forestry: The Case of China. Urban For. Urban Green. 2019, 46, 126472.[CrossRef]
7. Gang, H.; Liu, G.; Chen, S.; Jiang, J. Physiological and Transcriptome Analysis of a Yellow-Green Leaf Mutantin Birch (Betula platyphylla × B. pendula). Forests 2019, 10, 120. [CrossRef]
8. Kaushik, P.; Kumar, S. Transcriptome Analysis of Bael (Aegle marmelos (L.) Corr.) a Member of FamilyRutaceae. Forests 2018, 9, 450. [CrossRef]
9. Liu, F.; Hong, Z.; Xu, D.; Jia, H.; Zhang, N.; Liu, X.; Yang, Z.; Lu, M. Genetic Diversity of the EndangeredDalbergia odorifera Revealed by SSR Markers. Forests 2019, 10, 225. [CrossRef]
10. Lu, W.; Arnold, R.J.; Zhang, L.; Luo, J. Genetic Diversity and Structure through Three Cycles of a Eucalyptusurophylla S.T. Blake Breeding Program. Forests 2018, 9, 372. [CrossRef]
11. Mo, Z.; Feng, G.; Su, W.; Liu, Z.; Peng, F. Identification of miRNAs Associated with Graft Union Developmentin Pecan [Carya illinoinensis (Wangenh.) K. Koch]. Forests 2018, 9, 472. [CrossRef]
12. Wei, M.; Wang, Y.; Pan, R.; Li, W. Genome-Wide Identification and Characterization of MADS-box FamilyGenes Related to Floral Organ Development and Stress Resistance in Hevea brasiliensis Müll. Arg. Forests2018, 9, 304. [CrossRef]
13. Xie, L.; Li, X.; Hou, D.; Cheng, Z.; Liu, J.; Li, J.; Mu, S.; Gao, J. Genome-Wide Analysis and ExpressionProfiling of the Heat Shock Factor Gene Family in Phyllostachys edulis during Development and in Responseto Abiotic Stresses. Forests 2019, 10, 100. [CrossRef]
14. Wu, F.; Li, M.; Liao, B.; Shi, X.; Xu, Y. DNA Barcoding Analysis and Phylogenetic Relation of Mangroves inGuangdong Province, China. Forests 2019, 10, 56. [CrossRef]
15. Liao, J.; Zhang, L.; Liu, Y.; Li, Q.; Chen, D.; Zhang, Q.; Li, J. Diversity and Utilization of Edible Plants andMacro-Fungi in Subtropical Guangdong Province, Southern China. Forests 2018, 9, 666. [CrossRef]
16. Mao, X.; Fu, X.-X.; Huang, P.; Chen, X.-L.; Qu, Y.-Q. Heterodichogamy, Pollen Viability, and Seed Set in aPopulation of Polyploidy Cyclocarya Paliurus (Batal) Iljinskaja (Juglandaceae). Forests 2019, 10, 347. [CrossRef]
17. Mo, J.; Xu, J.; Cao, Y.; Yang, L.; Yin, T.; Hua, H.; Zhao, H.; Guo, Z.; Yang, J.; Shi, J. Pinus massoniana IntrogressionHybrids Display Differential Expression of Reproductive Genes. Forests 2019, 10, 230. [CrossRef]
18. Wu, F.; Yang, D.; Zhang, L.; Chen, Y.; Hu, X.; Li, L.; Liang, J. Diversity Estimation and Antimicrobial Activityof Culturable Endophytic Fungi from Litsea cubeba (Lour.) Pers. in China. Forests 2019, 10, 33. [CrossRef]
19. Huang, G.; Liang, K.; Zhou, Z.; Yang, G. Muralidharan EM Variation in Photosynthetic Traits and Correlationwith Growth in Teak (Tectona grandis Linn.) Clones. Forests 2019, 10, 44. [CrossRef]
20. Zheng, T.; Qin, B.; Li, S.; Cai, M.; Pan, H.; Wang, J.; Cheng, T.; Zhang, Q. Screening of Applicable SSRMolecular Markers Linked to Creeping Trait in Crape Myrtle. Forests 2019, 10, 429. [CrossRef]
21. Tulik, M.; Karczewski, J.; Szeliga, N.; Jura-Morawiec, J.; Jarzyna, I. Morphological Characteristics andAllometric Relationships of Shoot in Two Undergrowth Plants: Polygonatum odoratum and Polygonatummultiflorum. Forests 2018, 9, 783. [CrossRef]
22. Cehulic, I.; Sever, K.; Katicic Bogdan, I.; Jazbec, A.; Škvorc, Ž.; Bogdan, S. Drought Impact on Leaf Phenologyand Spring Frost Susceptibility in a Quercus robur L. Provenance Trial. Forests 2019, 10, 50. [CrossRef]
23. Vander Mijnsbrugge, K.; Janssens, A. Differentiation and Non-Linear Responses in Temporal PhenotypicPlasticity of Seasonal Phenophases in a Common Garden of Crataegus monogyna Jacq. Forests 2019, 10, 293.[CrossRef]
24. Wan, S.; Liu, Z.; Chen, Y.; Zhao, J.; Ying, Q.; Liu, J. Effects of Lime Application and Understory Removal onSoil Microbial Communities in Subtropical Eucalyptus L’Hér. Plantations. Forests 2019, 10, 338. [CrossRef]
25. Wu, F.; Li, J.; Chen, Y.; Zhang, L.; Zhang, Y.; Wang, S.; Shi, X.; Li, L.; Liang, J. Effects of Phosphate SolubilizingBacteria on the Growth, Photosynthesis, and Nutrient Uptake of Camellia oleifera Abel. Forests 2019, 10, 348.[CrossRef]
26. Dornelas, M.; Gotelli, N.J.; Shimadzu, H.; Moyes, F.; Magurran, A.E.; McGill, B.J. A Balance of Winners andLosers in the Anthropocene. Ecol. Lett. 2019, 22, 847–854. [CrossRef]
6

Forests 2020, 11, 26
27. McCallen, E.; Knott, J.; Nunez-Mir, G.; Taylor, B.; Jo, I.; Fei, S. Trends in Ecology: Shifts in Ecological ResearchThemes over the Past Four Decades. Front. Ecol. Environ. 2019, 17, 109–116. [CrossRef]
28. Brancalion, P.H.S.; Niamir, A.; Broadbent, E.; Crouzeilles, R.; Barros, F.S.M.; Almeyda Zambrano, A.M.;Baccini, A.; Aronson, J.; Goetz, S.; Reid, J.L.; et al. Global Restoration Opportunities in Tropical RainforestLandscapes. Sci. Adv. 2019, 5, eaav3223. [CrossRef]
29. Zhou, W.; Fisher, B.; Pickett, S.T. Cities are hungry for actionable ecological knowledge. Front. Ecol. Environ.2019, 17, 135. [CrossRef]
30. Maes, M.J.A.; Jones, K.E.; Toledano, M.B.; Milligan, B. Mapping Synergies and Trade-offs between UrbanEcosystems and the Sustainable Development Goals. Environ. Sci. Policy 2019, 93, 181–188. [CrossRef]
© 2019 by the authors. Licensee MDPI, Basel, Switzerland. This article is an open accessarticle distributed under the terms and conditions of the Creative Commons Attribution(CC BY) license (http://creativecommons.org/licenses/by/4.0/).
7


Article
Physiological and Transcriptome Analysisof a Yellow-Green Leaf Mutant in Birch(Betula platyphylla × B. Pendula)
Huixin Gang, Guifeng Liu, Su Chen and Jing Jiang *
State Key Laboratory of Tree Genetics and Breeding, Northeast Forestry University, 26 Hexing Road,Harbin 150040, China; [email protected] (H.G.); [email protected] (G.L.); [email protected] (S.C.)* Correspondence: [email protected]; Tel.: +86-139-4602-6246
Received: 19 December 2018; Accepted: 1 February 2019; Published: 2 February 2019
Abstract: Chlorophyll (Chl)-deficient mutants are ideal materials for the study of Chl biosynthesis,chloroplast development, and photosynthesis. Although the genes encoding key enzymes related toChl biosynthesis have been well-characterized in herbaceous plants, rice (Oryza sativa L.), Arabidopsis(Arabidopsis thaliana), and maize (Zea mays L.), yellow-green leaf mutants have not yet been fullystudied in tree species. In this work, we explored the molecular mechanism of the leaf color formationin a yellow-green leaf mutant (yl). We investigated the differentially expressed genes (DEGs)between yl and control plants (wild type birch (WT) and BpCCR1 overexpression line 11, (C11))by transcriptome sequencing. Approximately 1163 genes (874 down-regulated and 289 up-regulated)and 930 genes (755 down-regulated and 175 up-regulated) were found to be differentially expressedin yl compared with WT and C11, respectively. Kyoto Encyclopedia of Genes and Genomes (KEGG)pathway enrichment analysis for DEGs revealed that photosynthesis antenna proteins representthe most significant enriched pathway. The expressions of photosynthesis antenna proteins arecrucial to the leaf color formation in yl. We also found that Chl accumulate, leaf anatomical structure,photosynthesis, and growth were affected in yl. Taken together, our results not only provide thedifference of phenomenal, physiological, and gene expression characteristics in leaves between ylmutant and control plants, but also provide a new insight into the mutation underlying the chloroticleaf phenotype in birch.
Keywords: yellow-green leaf mutant; transcriptome; antenna protein; photosynthesis; birch
1. Introduction
Birch (Betula), a member of the tall deciduous tree family of Betulaceae, contains approximately 20taxa birch species. Birch is an ecologically important tree species native to parts of China, Siberia, Korea,Japan, and Russia that has been introduced to many northern areas of the world [1]. This species growsfast and has a high tolerance that allows it to be used for revegetation and reforestation [2]. Birch alsoplays an important role in the forestry industry as a source of timber, fuelwood, plywood, pulpwood,and furniture [3–6]. Recently, there has been an increased interest in plants with colored leaves.Betula pendula ‘Purple Rain’, an intraspecific variety of B. pendula, has been used as a decorative plantfor its purple leaves [7]. Previously, a yellow-green leaf mutant (yl) was derived from cinnamoyl-CoAreductase (BpCCR1)-overexpressing transgenic birch plants. The yl mutant displayed a distinctyellow-green phenotype, while the leaves of all the other BpCCR1-overexpressing lines were a normalcolor, the same as the wild type birch (WT). One of the BpCCR1-overexpressing lines, C11 with greenleaves, was used as control birch [8]. The yl mutant is a very valuable resource because a yellow-greenleaf is one of the most popular traits in landscape greening.
Forests 2019, 10, 120; doi:10.3390/f10020120 www.mdpi.com/journal/forests9

Forests 2019, 10, 120
Leaf color variation is one of the most common mutated traits as it is easily discovered inhigher plants. Up to now, many Chl-deficient mutants have been identified in herbaceous andwoody plants, including Arabidopsis [9], rice [10], maize [11], wheat (Triticum aestivum L.) [12], cotton(Gossypium barbadense L.) [13], and tea (Camellia sinensis (L.) O. Kuntze) [14]. It has been reportedthat a yellow-green leaf mutant (siygl1) of foxtail millet (Setaria italic L.) isolated following ethylmethanesulfonate (EMS) treatment was due to the loss function of the SiYGL1 gene. The identificationof the SiYGL1 gene that encodes Mg-chelatase ATPase subunit D facilitated the understanding ofthe biological processes of chlorophyll (Chl) biosynthesis in millet [15]. Another yellow-green leafmutant (ygl8) was proved to be controlled by the Ygl8 gene, which encodes a chloroplast-targeteduridine monophosphate (UMP) kinase and affects chloroplast development in rice [16]. Therefore,Chl-deficient mutants are valuable genetic materials for exploring the molecular mechanisms ofChl biosynthesis and regulation, chloroplast development, plastid-to-nucleus signal transduction,and photosynthesis.
Next-generation sequencing (NGS) technologies have been considered as powerful tools foradvanced research in many areas. Examples are genome and transcriptome sequencing of animals,plants, and microbes with high-throughput, high-speed, and high-accuracy sequencing data [17–19].Wang, using transcriptome sequencing, analyzed a Chl-deficient chlorina tea plant culticar and reportedthe molecular mechanisms of the chlorine tea phenotype [14]. Study of a Lagerstroemia indica yellowleaf mutant using transcriptome analysis revealed the formation pathway of a yellow leaf mutant anddiscovered novel candidate genes related to leaf color [20]. The development of NGS technologies hasincreased the rate and efficiency of gene discovery and permitted a deeper understanding of the geneexpression network.
In this work, we performed transcriptome sequencing for yl with a yellow-green leaf phenotype,BpCCR1 overexpression line 11(C11), and wild type birch (WT) with a normal green leaf phenotypeto analyze gene expression in these plants and elucidate the molecular mechanisms related to thedifferent phenotypes. In addition, comparative physiological studies were conducted to investigatethe phenotypic differences between yl and control (WT and C11) plants. This study improved ourunderstanding of the yellow-green phenotype in birch.
2. Materials and Methods
2.1. Materials
A birch (Betula platyphylla × B. pendula) Chl-deficient mutant yl, BpCCR1 overexpression line 11(C11), and wild type birch (WT) were used as the experimental materials. The yl mutant was derivedfrom BpCCR1 overexpression lines. All the plants were grown in the pots with dimensions of 8 × 8cm and substrata of 9 cm under natural conditions and were well watered at the birch breeding base,Harbin, China. Mature leaves from the new stems were collected in the spring. Immediately afterharvest, samples were frozen in liquid nitrogen and stored at −80 ◦C for RNA extraction.
2.2. Methods
2.2.1. Measurement of Growth Traits and Pigment Content
Forty plants of each line (WT, C11, and yl) were used for the measurement of plant height. Eachvalue was the average of the measurements.
Fresh leaves of WT, C11, and yl plants (from first to sixth leaf) were collected during thegrowing season and used for the measurement of pigment contents, according to the method ofLichtenthaler [21]. The first leaf was the youngest and the sixth leaf was the oldest on the mainstem. Chl and carotenoid (Car) were extracted with 80% acetone at 4 ◦C for 24 h in the dark, and thencalculated from the absorbance at 470 nm, 646 nm, and 663 nm in a Vis-UV spectrophotometer (TU-1901,Persee, China). Contents of Chl a (mg/g), Chl b (mg/g), and Car (mg/g) were calculated as follows:
10

Forests 2019, 10, 120
CChl a (mg/L) = 12.21 A663 − 2.81 A646 (1)
CChl b (mg/L) = 20.13 A646 − 5.03 A663 (2)
CCar (mg/L) = 4.37 A470 + 2.11 A663 − 9.10 A646 (3)
Chl a (mg/g) = CChl a (mg/L) × V (L) / Mfresh (g) (4)
Chl b (mg/g) = CChl b (mg/L) × V (L) / Mfresh (g) (5)
Car (mg/g) = Ccar (mg/L) × V (L) / Mfresh (g) (6)
Chl a/b ratio = Chl a / Chl b (7)
2.2.2. Light Microscopy
The fourth leaves of WT, C11, and yl were used as samples and fixed in FAA (formaldehyde,glacial acetic acid and 50% ethyl alcohol, V:V:V = 1:1:18) for 24 h, dehydrated in a graded ethanolseries and xylene, and then embedded in paraffin wax. Sections (10 μm thick) were stained withsafranine and fast green dyes. The cell structures of the samples were examined and photographedusing an Olympus DP26 digital camera (Olympus, Tokyo, Japan). Five leaf anatomical features,including lamina thickness (LT), adaxial epidermis thickness (UE), abaxial epidermis thickness (LE),palisade parenchyma thickness (PT), and spongy parenchyma thickness (ST), were examined with thecellSens Entry software. Additionally, the palisade parenchyma/mesophyll ratio was calculated. Fourpositions of each section were measured and each value of leaf anatomical feature was the average of20 measurements from five individual plants.
2.2.3. Leaf Gas-Exchange Measurement
The net photosynthetic rate (Pn) of the fourth leaves from WT, C11, and yl was measured usingan Li-6400 portable photosynthesis system (LI-COR Inc, Lincoln, NE, USA) at 9:00–11:00 am on sunnydays. CO2 concentration was controlled at 400 μmol mol−1. Relative air humidity was about 50% andleaf temperature was about 28 ◦C. The default red/blue LED light source (LI6400-02B) was chosenas the light source. The photosynthetic curves were made against the light intensity of 2000, 1800,1500, 1200, 1000, 800, 600, 400, 200, 100, 50, 20, and 0 μmol photos m−2 s−1. About 15 min lightadaptation was applied to leaves at an initial light step before CO2 measurement and then the valueswere recorded when they were stable at each light step. The measurements of WT, C11, and yl weremade under the same conditions (including time interval of illumination). The averaged values ofeach light step for each plant were used in the light-response curve.
2.2.4. RNA Extraction, Library Construction, and RNA-seq
The fourth leaves of WT, C11, and yl were used as samples. Total RNAs were extracted fromleaf samples using the CTAB (cetyltrimethylammonium bromide) method [22]. A summary of theprocedure was as follows: The samples were individually milled in a mortar with liquid nitrogenand then incubated with 2% CTAB (added 2% β-mercaptoethanol) at 65 ◦C in a water-bath for 5 min.The samples were centrifuged at 13,400 g for 10 min and an equal volume of chloroform was addedto the supernatant. A half volume of ethyl alcohol and 0.8 times volume of 5 mol/L LiCl were thenadded to the supernatant after centrifuging at 13,400 g, 4 ◦C for 10 min. After standing for 10 min,the samples were centrifuged at 13,400 g, 4 ◦C for 20 min. Then, the precipitates were washed in70% ethanol and dried. RNAs were dissolved with diethylpyrocarbonate (DEPC)-treated water andtreated with DNaseI. RNA quality, purity, and integrity were detected by 1% agrose gel electrophoresis,a NanoDrop2000 microvolume spectrophotometer (Thermo, Waltham, MA, USA) and an Agilent 2100Bioanalyzer (Agilent, Palo Alto, CA, USA), respectively. RNAs from three independent replicates weremixed by equal volume. Poly (A) mRNA was enriched using Oligo (dT)-magnetic beads and cleavedinto short fragments with fragmentation buffer. These short fragments were used as templates to
11

Forests 2019, 10, 120
synthesize the first-strand cDNA. Second-strand cDNA was synthesized using buffer, dNTPs, RNaseH,and DNA polymerase I. Purified cDNA was used as a template for PCR amplification and libraryconstruction. Lastly, the library was sequenced on an Illumina HiSeq™ 2500 platform by BiomarkerTechnology Company (Beijing, China). CTAB, β-mercaptoethanol, chloroform, ethyl alcohol, LiCl, andDEPC were bought from Sigma-Aldrich, St. Louis, MO, USA. DNaseI, dNTPs, RNaseH, and DNApolymerase I were bought from Promega, Madison, WI, USA.
2.2.5. Gene Annotation and DEG Analysis
To elucidate the reason for the different phenotype observed in yl, we explored the gene expressionof WT, C11, and yl at the molecular level. After removing adapters and low-quality sequences,we generated an average of approximately 3.46 Gb RNA-seq data with 91.28% Q30 bases and46.28% GC content for each sample in the transcriptome sequencing. More than 82.21% of theclean reads were mapped to the birch reference genome [23] using TopHat2 [24]. Gene functionswere annotated using the Nr, Swiss-Prot, Kyoto Encyclopedia of Genes and Genomes (KEGG),Eukaryotic Orthologous Groups (KOG), Clusters of Orthologous Groups (COG) and Gene Ontology(GO) databases. The expression level of each gene was calculated using FPKM (Fragments perkilobase per million mapped reads). Differentially expressed genes (DEGs) between each two-samplecomparison were defined with fold change ≥2 and FDR (false discovery rate) <0.01 as a threshold,according to the statistical analysis performed by EBSeq. The percentages of DEGs in Go classificationwere calculated as follows:
Percentages of genes = (Number DEGs in a specific term) / (Number all DEGs) × 100% (8)
KEGG pathway terms with corrected enrichment p values less than 0.05 (Fisher’s exact test) wereconsidered to be significantly enriched. The genes involved in photosynthesis-antenna proteins wereextracted according to the functional annotation information of the genes.
2.2.6. RNA Extraction and Quantitative RT-PCR
Total RNAs were extracted from the functional leaves of the WT, C11, and yl lines as describedin 2.1.4 and treated with DNaseI (Promega, Madison, WI, USA). cDNA was synthesized from 1 μgRNA of WT, C11, and yl using a ReverTreAce® qPCR RT Kit (Toyobo, Osaka, Japan), according tothe manufacturers’ instructions, respectively. The procedure was as follows: RNA was incubatedwith 5x RT Master Mix at 37 ◦C for 15 min, 50 ◦C for 5 min, and 98 ◦C for 5 min, and then diluted10-fold with nuclease-free water. The quantitative (q)RT-PCR was performed on a 7500 real-time PCRsystem (Applied Biosystems, Darmstadt, Germany) using SYBR® Green PCR master mix (Toyobo,Osaka, Japan). Each qRT-PCR reaction (total 20 μL) contained 2 μL of cDNA, 10 μL of 2× SYBR GreenReal-time PCR Master mix, 0.5 μL of each PCR primer, and 7 μL of nuclease-free water. qRT-PCRconditions were as follows: 95 ◦C for 30 s followed by 45 cycles of 95 ◦C for 15 s, 60 ◦C for 45 s, and afinal extension at 72 ◦C for 30 s. The results were calculated using the 2−ΔΔCt method [25], and Bp18SrRNA was selected as an internal control gene [26]. Primer sequences are listed in Table 1.
2.2.7. Statistical Analysis
Data were analyzed using SPSS statistics software, version 19.0 (International Business Machines,Armonk, NY, USA). Differences between the means of each line on leaf anatomical and plant heightwere determined using one-way analysis of variance and the Duncan multiple comparison procedure.A p value less than 0.05 was considered statistically significant and labeled with a different letter.The same letter represented that they were not significantly different. The correlations betweenpigment contents and Pn, stomatal conductance (Gs) and Pn, Gs and transpiration rate (Tr), and Trand Pn were evaluated using Pearson’s correlation coefficients. The relationship between Tr and Pnwas tested for linear, exponential, and logarithmic functions and the best fit regressions were selected.
12

Forests 2019, 10, 120
Correlation coefficients (R2) and equations were obtained from nonlinear regression analysis of Tr andPn using Origin Pro software, version 8.1 (OriginLab, Northampton, MA, USA).
Table 1. The primer sequences used in qRT-PCR.
Gene Forward Primer (5′-3′) Reverse Primer (5′-3′)Bpev01.c0080.g0006.m0001 GGCTCAATCCAGCATGGTTGC CCACACCTGCATGCATTGCACBpev01.c0577.g0002.m0001 CGTTCATGGTGGACCTGAGCC AGCTAAAGTGAGGGACTTTGTCGATBpev01.c0167.g0013.m0001 CACAACATAGCCAGCCACCTTC GTCGGTGCTACCCAAGGACTCBpev01.c0243.g0056.m0001 CAACGGACGTTATGCCATGTTGG TCCCAGCCGGCGGAATTACBpev01.c0264.g0036.m0001 CGGTGAGGCCGTGTGGTT CGCCCATCAGGATGACCTGTBpev01.c1040.g0049.m0001 CCCGAGACATTTGCCAAGAACC GCCTTGAACCAGACTGCCTCTCBpev01.c0190.g0044.m0001 CTTGGCCGGCGATGTGATC GCCAACATGGCCCACCTCBpev01.c0621.g0012.m0001 GCAATAGGCCTTGCCTCCTTCATAG CGAGTACCCGTCTTCTCATTCGCBpev01.c0984.g0005.m0001 GGGAGACTAAGGTACAAGCAGTGG CCAGCTGCTCAATTGCTTCAGAGBpev01.c0401.g0006.m0001 GGGAAGGCAAGGCTAGTGCAG GCCTTCAACAGCAAGGCAAGTBpev01.c0894.g0003.m0001 CCTCCAACAGGGAGTGGCAAC CTGTCAATCATCCCAGAACAGCTTGBpev01.c1891.g0003.m0001 GGCGTTCCGTATATGAGCCTCTTC GGCTACTGCTGTTTTACCGGTCT
3. Results
3.1. Pigment Contents and Leaf Anatomical Structure of Chl-Deficient Mutant yl
Previously, we transformed the BpCCR1 gene to a hybrid birch, WT (Betula platyphylla × B. Pendula)by Agrobacterium tumefaciens. We obtained 19 BpCCR1-overexpressing transgenic lines. Among them,a transgenic line (yl) displayed a yellow-green leaf phenotype, which was distinct from other transgeniclines, including C11. During the growth season, the yl mutant exhibited yellow-green leaves, whileC11 and WT exhibited green leaves (Figure 1a,b). In order to investigate the difference, we measuredthe pigment contents and leaf anatomical structure of yl. We measured the Chl and Car contents fromthe first leaf to the sixth leaf. The result showed that the pigment contents, including Chl a, Chl b, andCar, were increased from the first leaf to sixth leaf in all samples (Figure 1c). However, all pigmentlevels were lower in the leaves of yl than those of WT and C11. Chl a in yl was decreased by 44–65% ofWT, and 41–57% of C11. Chl b in yl was decreased by 62–79% of WT, and 61–73% of C11. Similarly,Car in yl was decreased by 40–55% compared with WT, and 30–54% compared with C11. The ratio ofChl a to Chl b was increased in all leaves of yl.
We then investigated the leaf anatomical structure of WT, C11, and yl, as leaves areimportant organs for photosynthesis, and their anatomical structures could affect photosyntheticand physiological activities. A significant reduction in the lamina thickness of yl leaves comparedwith the leaves of WT and C11 was observed in transverse sections of the leaf blades (Figure 2a). Also,adaxial epidermis, abaxial epidermis, palisade parenchyma, and spongy parenchyma were reducedin thickness in yl leaves (Figure 2b). However, there was no difference in the ratio of palisade tospongy parenchyma.
3.2. Changes in Photosynthesis and Growth
To examine the effect of low pigment contents on photosynthesis in the yl mutant, we measuredthe photosynthetic rate of WT, C11, and yl. The result showed that yl had a lower net photosyntheticrate and a lower transpiration rate than WT and C11 at all light intensities determined (Figure 3a,b).
We then investigated the correlations between pigment contents, transpiration rate, stomatalconductance, and Pn. The results showed that the Pn values had a strong relationship with totalChl, Chl a, Chl b, and Car under high light intensity (p < 0.05). The correlations between pigmentcontents and Pn were decreased under low light intensity, revealing that not all pigments participatedin photosynthesis under low light intensity (Table S1). In addition, we found that Pn and Tr valuesdisplayed a significant positive correlation (p < 0.01) with Gs in WT, C11, and yl plants. Similarly, therewas also a highly significant correlation (p < 0.01) between Pn and Tr in WT, C11, and yl plants (Table 2).
13

Forests 2019, 10, 120
Then, we analyzed the scatter plots between Pn and Tr and found that the exponential decay functionwas the best fit. The curve could be divided into two stages. In the first stage, the Pn value increasedwith the rising Tr and the curve was likely to be linear. Gs may be the primary limiting factor in thisstage. In the second stage, Pn increased slowly or mantained invariability along with the increase of Tr.Gs may not be the primary limiting factor in this stage (Figure 4a–c).
To explore the effect of low photosynthesis on growth, we measured the height of WT, C11, andyl plants. The heights of one-year-old WT and C11 were 36.7 cm and 37.0 cm, while the yl mutantwas 30.9 cm, about 84% and 83% of WT and C11, respectively. The result revealed that yl grew slowercompared to WT and C11 (Figure 3c).
Figure 1. Growth performance and pigment content of wild type birch (WT), BpCCR1 overexpressionline 11 (C11) and yellow-green leaf mutant (yl) lines. (a) Growth performance of one-year-old WT andyl plants. (b) The leaves from first to sixth of WT, C11, and yl lines. (c) Chl a, Chl b, Car, and Chl a/b infirst to sixth leaves of WT, C11, and yl lines. Error bars represent the standard deviation (SD) of threeindependent experiments.
14

Forests 2019, 10, 120
Figure 2. Leaf anatomical characteristics of WT, C11, and yl. (a) Leaf transections of WT, C11,and yl lines. (b) Leaf anatomical structure of WT, C11, and yl. Lamina thickness, LT. Adaxialepidermis thickness, UE. Abaxial epidermis thickness, LE. Palisade parenchyma thickness, PT. Spongyparenchyma thickness, ST. Error bars represent the standard deviation (SD) of 20 measurements fromfive individual plants.
Figure 3. Photosynthetic and growth performance of WT, C11, and yl lines. Photosynthetic rate (a) andtranspiration rate (b) of WT, C11, and yl. Error bars represent the SD of three measurements. (c) Plantheight of WT, C11, and yl. Error bars represent the SD of 40 measurements.
Table 2. The correlation analysis of transpiration rate (Tr), stomatal conductance (Gs), and Pn in WT,C11, and yl. ** Correlation is significant at the 0.01 level (2-tailed).
CorrelationGs in WT
(mol m−2 s−1)Tr in WT
(mmol m−2 s−1)Gs in C11
(mol m−2 s−1)Tr in C11
(mmol m−2 s−1)Gs in yl
(mol m−2 s−1)Tr in yl
(mmol m−2 s−1)
Tr in WT(mmol m−2 s−1) 0.987 ** - - - - -
Pn in WT(μmol m−2 s−1) 0.860 ** 0.915 ** - - - -
Tr in C11(mmol m−2 s−1) - - 0.986 ** - - -
Pn in C11(μmol m−2 s−1) - - 0.856 ** 0.895 ** - -
Tr in yl(mmol m−2 s−1) - - - - 0.991 ** -
Pn in yl(μmol m−2 s−1) - - - - 0.773 ** 0.815 **
15

Forests 2019, 10, 120
Figure 4. The scatter plots between Pn and Tr in WT, C11, and yl.
3.3. Differently Expressed Genes between yl and Control Plants
In order to generate DEGs, two transcriptome comparisons were carried-out, including C11 vs. yland WT vs. yl. As a result, 1163 genes (874 down-regulated and 289 up-regulated) were found to bedifferentially expressed in yl compared with C11. 930 genes, including 755 down-regulated and 175up-regulated that were differentially expressed in yl compared with WT (Figure 5a).
GO categories were then assigned to evaluate the potential functions of these DEGs according tothe biological process, cellular component, and molecular function ontology. In the biological process,the DEGs were classified into twenty categories, and the most three overrepresented terms werecellular process, single-organism process, and metabolic process. For cell components, there are manyDEGs involved in cells, cell parts, and organelles. For molecular functions, most of the DEGs wereparticipates in binding and catalytic activity, as shown in Figure 5b.
Figure 5. Differentially expressed genes (DEGs) analysis based on Gene ontology. (a) Number of DEGsin C11 vs. yl and WT vs. yl. (b) Gene ontology classification of DEGs in C11 vs. yl and WT vs. yl.
3.4. KEGG Pathway Analysis of DEGs
The DEGs were further subjected to KEGG pathway analysis to identify the enriched biologicalpathways. The DEGs of C11 vs. yl and WT vs. yl were mapped to 81 and 85 KEGGpathways, respectively. Among them, two pathways, including photosynthesis-antenna proteinsand phenylalanine metabolism, were considered significantly enriched at a cut-off P-value < 0.05 andFDR < 0.05 in both C11 vs. yl and WT vs. yl. Photosynthesis-antenna proteins represented the mostsignificantly enriched pathway in the DEGs of yl compared to WT and C11 (Figure 6a,b).
16

Forests 2019, 10, 120
Figure 6. KEGG-based pathway enrichment of DEGs in C11 vs. yl and WT vs. yl.
We then explored the photosynthesis-antenna proteins pathway in more detail. A totalof twenty-one Lhc (light-harvesting complex) genes were found to be related to the antennaproteins in the birch genome. However, seven of these genes were differently expressed in ylcompared to control plants and six displayed low or undetectable levels of expression in allsamples. One gene (Bpev01.c0243.g0056.m0001) involved in light-harvesting the Chl a/b bindingprotein Lhca3 of Photosystem I, three genes (Bpev01.c0362.g0012.m0001, Bpev01.c0264.g0036.m0001,Bpev01.c1767.g0010.m0001) involved in light-harvesting the Chl a/b binding protein Lhcb1, andone gene (Bpev01.c1040.g0049.m0001) involved in light-harvesting the Chl a/b binding proteinLhcb2 of Photosystem II showed significantly reduced transcript levels in yl. Two genes(Bpev01.c0190.g0044.m0001, Bpev01.c0841.g0007.m0001) were involved in light-harvesting the Chl a/bbinding protein Lhcb4 of Photosystem II, and Bpev01.c0190.g0044.m0001 was down-regulated andBpev01.c0841.g0007.m0001 was up-regulated (Figure 7a,b). These results suggested that the changes inthe photosynthesis-antenna proteins pathway were important to the unique phenotype of yl.
Figure 7. Expression pattern of genes involved in light-harvesting Chl complex in WT, C11, and yl.(a) DEGs in the pathway of light-harvesting Chl complex. Green box represents down-regulated genes.Blue box represents down-regulated and up-regulated genes. (b) Expression of all genes involved inlight-harvesting Chl complex in WT, C11, and yl.
17

Forests 2019, 10, 120
3.5. qRT-PCR Verification of RNA-seq
To test the reliability of RNA-Seq, we selected 12 functionally important and representativegenes for validation using qRT-PCR, including two non-DEGs, five down-regulated genes, and fiveup-regulated genes (Table 3). The expression of all these genes obtained via qRT-PCR showed a similarpattern to that detected by transcriptome sequencing (Figure 8).
Table 3. The genes used for qRT-PCR.
Gene C11 and WT vs. yl
Bpev01.c0080.g0006.m0001 normalBpev01.c0577.g0002.m0001 normalBpev01.c0167.g0013.m0001 down-regulatedBpev01.c0243.g0056.m0001 down-regulatedBpev01.c0264.g0036.m0001 down-regulatedBpev01.c1040.g0049.m0001 down-regulatedBpev01.c0190.g0044.m0001 down-regulatedBpev01.c0621.g0012.m0001 up-regulatedBpev01.c0984.g0005.m0001 up-regulatedBpev01.c0401.g0006.m0001 up-regulatedBpev01.c0894.g0003.m0001 up-regulatedBpev01.c1891.g0003.m0001 up-regulated
Figure 8. Quantificational real-time PCR verification of RNA-seq. Error bars represent the SD ofthree measurements.
4. Discussion
In this study, we reported a Chl-deficient mutant yl that produced yellow-green leaves in birch.The mutant was isolated from BpCCR1 transgenic lines in birch plant breeding. Physiological analysisand gene expression characterization of yl were performed to investigate the difference between yl andcontrol plants (WT and C11).
Chl and Car are the main pigments that trap light energy in leaf tissue. It has been demonstratedthat the leaves of Chl-deficient mutants always contain less Chl and Car. Some mutants also showed achange in the ratio of Chl a/b [16,27,28]. Consistent with the previous research, pigment analysis of ylshowed that Chl a, Chl b, and Car were reduced in young leaf or mature leaf specimens, comparedto WT and C11. We also found that the ratio of Chl a/b was increased in the yl plants (Figure 1).Chl b is thought to be essential to the stability of the light-harvesting Chl a/b protein complex [29].Thus, the decreased Chl content and increased Chl a/b ratio in yl indicated that there might befewer light-harvesting antenna complexes than in the WT and C11 controls. There are numerousChl-deficient mutants that have shown reduced amounts of light-harvesting proteins (LHC) in thethylakoid membranes of the chloroplast [30,31]. Andersson reported that the absence of Lhcb1 and
18

Forests 2019, 10, 120
Lhcb2 proteins in Arabidopsis showed reduced Chl levels and increased Chl a/b [32]. According totranscriptomic analysis, DEGs of yl compared with WT and C11 were both significantly enriched inphotosynthesis-antenna proteins (Figures 6 and 7). These results revealed that the expression changeof genes involved in photosynthesis-antenna proteins plays an important role in the formation of theyellow-green leaf phenotype in yl.
Green plants absorb light energy to convert CO2 and water into carbohydrates and oxygenthrough photosynthesis. Photosynthesis is the key process that provides energy for catabolic processesand growth in plants. It has been reported that photosynthesis could be influenced by manyenvironmental factors, such as intensity, spectrum and duration of illumination, mechanical wounding,and heating [33,34]. These stimulations would induce the generation and propagation of variationpotential [35]. Then, electron flow connected to pH would be changed and the light-harvestingcomplex would transfer to photosystem II (PSII). As a result, photosynthesis would be decreasedin plants [36]. Photosynthesis is a complex process. The changes in pigment contents, stomataconductance, and gene expressions may also affect photosynthesis [37]. Due to the reduced pigmentcontents, most chlorina mutants have a poorer photosynthetic performance than that observed in wildtype specimens [9,38]. However, this is not true for all chlorine mutants. For example, a chlorina ricemutant Huangyu B was found to have a higher photosynthetic efficiency than its wild type [39], andthe photosynthetic rate of a Chl-deficient mutant siygl1 in foxtail millet was even higher than that ofYugu1 plants during the reproductive growth stage [15]. In this study, yl showed a reduced pigment,including Chl a, Chl b, and Car contents (Figure 1). The photosynthetic rate, stomata conductance,and transpiration rate of the yl line were lower than WT and C11 under all light intensities set(Figure 3). Additionally, the measurement of photosynthesis in WT, C11, and yl was performed underthe same conditions. We also found that there was a significant positive correlation between stomataconductance, pigment contents, and photosynthetic rate. RNA-seq results showed that many genesrelated to photosynthesis-antenna proteins were down-regulated in yl compared to WT and C11(Figure 7). As a result, the energy absorbed, trapped, and transferred in photosystem I (PSI) andPSII would probably be affected. Taken together, the decreased photosynthesis in yl was probablymainly due to the low expression level of antenna protein genes, and reduced photosynthetic pigmentcontents. The difference in Pn may underlie the retarded growth in one-year-old yl mutant plants(Figures 1 and 3).
The molecular mechanism of leaf color mutation is complex. Mutation of genes related tochloroplast development, blocked in photosynthetic pigment biosynthesis, blocked in chloroplastprotein transport, and blocked in phytochrome regulation would lead to the formation of ayellow-green mutant [26–31]. Studies have shown that plentiful genes are related to the yellow-greenleaf phenotype in plants. Examples are cytokinin-responsive gata transcription factor1, Cga1 [40];chaperone protein ClpC, ClpC1 [41]; signal recognition particle 43 kDa protein, cpSRP43 [42];chloroplast Signal recognition particle subunit, cpSRP54 [43]; metallo-beta-lactamase, GRY79 [44];nuclear transcription factor Y, HAP3A [45]; NADPH-dependent thioredoxin reductase C, NTRC [46];protein stay-green, SGR [47]; and YbeY endoribonuclease, YbeY [38]. However, the expression of allthese genes did not change in the yl transcriptome (Table 4).
Table 4. The expression of well-known genes related to leaf color in the transcriptional level of ayl mutant.
Gene ID Annotation C11 and WT vs. yl Mutant phenotype
Cga1 Bpev01.c0051.g0036.m0001 Cytokinin-responsive gata transcription factor1 normal yellow leafClpC1 Bpev01.c1202.g0038.m0001 Chaperone protein ClpC normal chlorotic leaf
cpSRP43 Bpev01.c1171.g0012.m0001 Signal recognition particle 43 kDa protein normal yellow-green leafcpSRP54 Bpev01.c1238.g0002.m0001 Chloroplast signal recognition particle subunit normal yellow-green leafGRY79 Bpev01.c0787.g0006.m0001 Metallo-beta-lactamase normal yellow turn greenHAP3A Bpev01.c0288.g0025.m0001 Nuclear transcription factor Y normal pale-green leafNTRC Bpev01.c0029.g0129.m0001 NADPH-dependent thioredoxin reductase C normal light-green leafSGR Bpev01.c0717.g0015.m0001 Protein stay-green normal stay-greenYbeY Bpev01.c1489.g0003.m0001 YbeY endoribonuclease normal pale-green leaf
19

Forests 2019, 10, 120
Plastid-to-nucleus retrograde signaling is considered to coordinate nuclear gene expression.Nott has summarized three independent retrograde signaling pathways from previous studies,including signals generated by Mg-Protoporphyrin IX (Mg-Proto IX), chloroplast gene expression,and the redox state of photosynthetic electron transport components [48]. One possibly importantfunction of retrograde signaling is to regulate the biosynthesis of Chl with the expression of genesfor nuclear-encoded Chl-binding proteins, such as the Lhca and Lhcb proteins. Here, we found thatthe transcription of Chl-binding protein genes (Lhc gene family) was down-regulated via RNA-seqand qRT-PCR analysis (Figures 7 and 8). Members of the Golden2-like (GLK) gene family have beenreported to regulate chloroplast development in diverse plant species [49,50]. GLK genes are sensitiveto retrograde signaling from the chloroplast, and they could then operate downstream of genes forplastid retrograde signaling [51]. The expression of GLK (Bp023762) was only 0.7% of WT and 0.9%of C11 (Figure 8). In addition, the PSRP1 gene (BP012524), an encoding ribosomal-binding factor(plastid-specific ribosomal protein 1) that inhibits plastid translation by blocking tRNA-binding sites onribosomes, was upregulated in the yl mutant. These results suggest that plastid-to-nucleus retrogradesignaling triggered in yl may regulate nuclear gene expression.
5. Conclusions
In this study, about 1163 DEGs and 930 DEGs were obtained in yl compared with WT and C11,respectively. The DEGs related to the photosynthesis antenna proteins pathway were significantlyenriched. In addition, the physiological characteristics analysis showed that the yellow-green leafmutant yl had reduced amounts of Chl, an increased Chl a/b value, and reduced leaf anatomicalcompared to control plants. Based on these results, we can conclude that the expression of genesinvolved in the photosynthesis antenna proteins pathway might be responsible for the lower pigmentcontents and ratio of Chl a/b, resulting in yellow-green leaves in yl.
Supplementary Materials: The following are available online at http://www.mdpi.com/1999-4907/10/2/120/s1,Table S1: The correlation analysis between pigment contents and Pn.
Author Contributions: J.J. and S.C. designed the experiments; H.G. performed the experiments; S.C. analyzedthe data; H.G. wrote the manuscript; J.J., G.L., and S.C. revised the manuscript.
Funding: This research was funded by the National Natural Science Foundation of China (No. 31570647) and the111 Project (B16010).
Acknowledgments: We are grateful to the transgenic material yl generated by Rui Wei and Wenbo Zhang.
Conflicts of Interest: The authors declare no conflict of interest.
References
1. Zyryanova, O.A.; Terazawa, M.; Koike, T.; Zyryanov, V.I. White birch trees as resource species of Russia:Their distribution, ecophysiological features, multiple utilizations. Eurasian J. For. Res. 2010, 13, 25–40.
2. Dulamsuren, C.; Hauck, M.; Bader, M.K.-F.; Osokhjargal, D.; Oyungerel, S.; Nyambayar, S.; Runge, M.;Leuschner, C. Water relations and photosynthetic performance in Larix sibirica growing in the forest-steppeecotone of northern Mongolia. Tree Physiol. 2008, 29, 99–110. [CrossRef]
3. Bekhta, P.; Hiziroglu, S.; Shepelyuk, O. Properties of plywood manufactured from compressed veneer asbuilding material. Mater. Des. 2009, 30, 947–953. [CrossRef]
4. Liu, X.; Wang, Q.; Chen, P.; Song, F.; Guan, M.; Jin, L.; Wang, Y.; Yang, C. Four Novel CelluloseSynthase (CESA) Genes from Birch (Betula platyphylla Suk.) Involved in Primary and Secondary CellWall Biosynthesis. IJMS 2012, 13, 12195–12212. [CrossRef] [PubMed]
5. Borrega, M.; Tolonen, L.K.; Bardot, F.; Testova, L.; Sixta, H. Potential of hot water extraction of birch wood toproduce high-purity dissolving pulp after alkaline pulping. Bioresour. Technol. 2013, 135, 665–671. [CrossRef][PubMed]
6. Rubert-Nason, K.F.; Holeski, L.M.; Couture, J.J.; Gusse, A.; Undersander, D.J.; Lindroth, R.L. Rapidphytochemical analysis of birch (Betula) and poplar (Populus) foliage by near-infrared reflectancespectroscopy. Anal. Bioanal. Chem. 2012, 405, 1333–1344. [CrossRef] [PubMed]
20

Forests 2019, 10, 120
7. Lin, L.; Mu, H.; Jiang, J.; Liu, G. Transcriptomic analysis of purple leaf determination in birch. Gene 2013, 526,251–258. [CrossRef] [PubMed]
8. Zhang, W.B.; Wei, R.; Chen, S.; Jiang, J.; Li, H.Y.; Huang, H.J.; Yang, G.; Wang, S.; Wei, H.R.; Liu, G.F.Functional characterization of CCR in birch (Betula platyphylla x Betula pendula) through overexpressionand suppression analysis. Physiol. Plant. 2015, 154, 283–296. [CrossRef]
9. Córdoba, J.; Molina-Cano, J.-L.; Martínez-Carrasco, R.; Morcuende, R.; Pérez, P. Functional andtranscriptional characterization of a barley mutant with impaired photosynthesis. Plant Sci. 2016, 244,19–30. [CrossRef]
10. Liu, J.; Wang, J.; Yao, X.; Dong, X.; Chen, W.; Li, Z.K. Fine mapping and photosynthetic characteristics of thelower chlorophyllb1 mutant in rice (Oryza sativa L.). Plant Breed. 2015, 134, 661–667. [CrossRef]
11. Zhong, X.M.; Sun, S.F.; Li, F.H.; Wang, J.; Shi, Z.S. Photosynthesis of a yellow-green mutant line in maize.Photosynthetica 2015, 53, 499–505. [CrossRef]
12. Li, N.; Jia, J.; Xia, C.; Liu, X.; Kong, X. Characterization and mapping of novel chlorophyll deficient mutantgenes in durum wheat. Breed. Sci. 2013, 63, 169–175. [CrossRef] [PubMed]
13. Karaca, M.; Saha, S.; Callahan, F.E.; Jenkins, J.N.; Read, J.J.; Percy, R.G. Molecular and cytologicalcharacterization of a cytoplasmic-specific mutant in pima cotton (Gossypium barbadense L.). Euphytica 2004,139, 187–197. [CrossRef]
14. Wang, L.; Yue, C.; Cao, H.; Zhou, Y.; Zeng, J.; Yang, Y.; Wang, X. Biochemical and transcriptome analyses of anovel chlorophyll-deficient chlorina tea plant cultivar. BMC Plant Biol. 2014, 14, 239. [CrossRef]
15. Li, W.; Tang, S.; Zhang, S.; Shan, J.; Tang, C.; Chen, Q.; Jia, G.; Han, Y.; Zhi, H.; Diao, X. Gene mappingand functional analysis of the novel leaf color gene SiYGL1 in foxtail millet [Setaria italica (L.) P. Beauv].Physiol. Plant. 2016, 157, 24–37. [CrossRef] [PubMed]
16. Zhu, X.; Guo, S.; Wang, Z.; Du, Q.; Xing, Y.; Zhang, T.; Shen, W.; Sang, X.; Ling, Y.; He, G. Map-based cloningand functional analysis of YGL8, which controls leaf colour in rice (Oryza sativa). BMC Plant Biol. 2016, 16,134. [CrossRef] [PubMed]
17. Cao, J.; Schneeberger, K.; Ossowski, S.; Günther, T.; Bender, S.; Fitz, J.; Koenig, D.; Lanz, C.; Stegle, O.;Lippert, C.; et al. Whole-genome sequencing of multiple Arabidopsis thaliana populations. Nat. Genet. 2011,43, 956–963. [CrossRef]
18. Cai, Q.; Li, B.; Lin, F.; Huang, P.; Guo, W.; Zheng, Y. De novo sequencing and sssembly analysis oftranscriptome in Pinus bungeana Zucc. ex Endl. Forests 2018, 9, 156. [CrossRef]
19. Du, M.; Ding, G.; Cai, Q. The Transcriptomic Responses of Pinus massoniana to Drought Stress. Forests 2018,9, 326. [CrossRef]
20. Li, Y.; Zhang, Z.; Wang, P.; Wang, S.; Ma, L.; Li, L.; Yang, R.; Ma, Y.; Wang, Q. Comprehensive transcriptomeanalysis discovers novel candidate genes related to leaf color in a Lagerstroemia indica yellow leaf mutant.Genes Genom. 2015, 37, 851–863. [CrossRef]
21. Lichtenthaler, H.K.; Wellburn, A.R. Determinations of total carotenoids and chlorophylls a and b of leafextracts in different solvents. Biochem. Soc. Trans. 1983, 11, 591–592. [CrossRef]
22. Chang, S.; Puryear, J.; Cairney, J. A simple and efficient method for isolating RNA from pine trees. Plant Mol.Biol. Report. 1993, 11, 113–116. [CrossRef]
23. Salojärvi, J.; Smolander, O.-P.; Nieminen, K.; Rajaraman, S.; Safronov, O.; Safdari, P.; Lamminmäki, A.;Immanen, J.; Lan, T.; Tanskanen, J.; et al. Genome sequencing and population genomic analyses provideinsights into the adaptive landscape of silver birch. Nat. Genet. 2017, 49, 904–912. [CrossRef] [PubMed]
24. Dobin, A.; Gingeras, T.R. Comment on “TopHat2: Accurate alignment of transcriptomes in the presence ofinsertions, deletions and gene fusions” by Kim et al. Bioinformatics 2013, 14, 000851.
25. Livak, K.J.; Schmittgen, T.D. Analysis of Relative Gene Expression Data Using Real-Time Quantitative PCRand the 2−ΔΔCT Method. Methods 2001, 25, 402–408. [CrossRef] [PubMed]
26. Huang, H.; Wang, S.; Jiang, J.; Liu, G.; Li, H.; Chen, S.; Xu, H. Overexpression of BpAP1 induces earlyflowering and produces dwarfism in Betula platyphylla x Betula pendula. Physiol. Plant. 2014, 151, 495–506.[CrossRef] [PubMed]
27. Ma, X.; Sun, X.; Li, C.; Huan, R.; Sun, C.; Wang, Y.; Xiao, F.; Wang, Q.; Chen, P.; Ma, F.; et al. Map-based cloningand characterization of the novel yellow-green leaf gene ys83 in rice (Oryza sativa). Plant Physiol. Biochem.2017, 111, 1–9. [CrossRef]
21

Forests 2019, 10, 120
28. Dong, H.; Fei, G.-L.; Wu, C.-Y.; Wu, F.-Q.; Sun, Y.-Y.; Chen, M.-J.; Ren, Y.-L.; Zhou, K.-N.; Cheng, Z.-J.;Wang, J.-L.; et al. A rice virescent-yellow Leaf mutant reveals new insights into the role and sssembly ofplastid caseinolytic protease in higher plants. Plant Physiol. 2013, 162, 1867–1880. [CrossRef]
29. Tanaka, R.; Koshino-Kimura, Y.; Sawa, S.; Ishiguro, S.; Okada, K.; Tanaka, A. Overexpression ofchlorophyllide an oxygenase (CAO) enlarges the antenna size of photosystem II in Arabidopsis thaliana.Plant J. 2002, 26, 365–373. [CrossRef]
30. Highkin, H.R.; Boardman, N.K.; Goodchild, D.J. Photosynthetic Studies on a Pea-mutant Deficient inChlorophyll. Plant Physiol. 1969, 44, 1310–1320. [CrossRef]
31. Polle, J.E.W.; Benemann, J.R.; Tanaka, A.; Melis, A. Photosynthetic apparatus organization and functionin the wild type and a chlorophyll b -less mutant of Chlamydomonas reinhardtii. Dependence on carbonsource. Planta 2000, 211, 335–344. [CrossRef] [PubMed]
32. Andersson, J.; Wentworth, M.; Walters, R.G.; Howard, C.A.; Ruban, A.; Horton, P.; Jansson, S. Absence of theLhcb1 and Lhcb2 proteins of the light-harvesting complex of photosystem II—Effects on photosynthesis,grana stacking and fitness. Plant J. 2003, 35, 350–361. [PubMed]
33. Maxwell, K.; Johnson, G.N. Chlorophyll fluorescence—A practical guide. J. Exp. Bot. 2000, 51, 659–668.[CrossRef] [PubMed]
34. Müller, P.; Li, X.P.; Niyogi, K.K. Non-photochemical quenching. A response to excess light energy.Plant Physiol. 2001, 125, 1558–1566. [CrossRef] [PubMed]
35. Sukhov, V.; Surova, L.; Sherstneva, O.; Katicheva, L.; Vodeneev, V. Variation potential influence onphotosynthetic cyclic electron flow in pea. Front. Plant Sci. 2015, 5, 766. [CrossRef] [PubMed]
36. Sukhova, E.; Mudrilov, M.; Vodeneev, V.; Sukhov, V. Influence of the variation potential on photosyntheticflows of light energy and electrons in pea. Photosynth. Res. 2017, 136, 215–228. [CrossRef]
37. Cheng, J.; Fan, P.; Liang, Z.; Wang, Y.; Niu, N.; Li, W.; Li, S. Accumulation of End Products in Source LeavesAffects Photosynthetic Rate in Peach via Alteration of Stomatal Conductance and Photosynthetic Efficiency.J. Amer. Soc. Hort. Sci. 2009, 134, 667–676. [CrossRef]
38. Liu, J.; Zhou, W.; Liu, G.; Yang, C.; Sun, Y.; Wu, W.; Cao, S.; Wang, C.; Hai, G.; Wang, Z.; et al. The ConservedEndoribonuclease YbeY Is Required for Chloroplast Ribosomal RNA Processing in Arabidopsis. Plant Physiol.2015, 168, 205–221. [CrossRef]
39. Zhou, X.-S.; Wu, D.-X.; Shen, S.-Q.; Sun, J.-W.; Shu, Q.-Y. High photosynthetic efficiency of a rice(Oryza sativa L.) xantha mutant. Photosynthetica 2006, 44, 316–319. [CrossRef]
40. Hudson, D.; Guevara, D.R.; Hand, A.J.; Xu, Z.; Hao, L.; Chen, X.; Zhu, T.; Bi, Y.-M.; Rothstein, S.J.Rice Cytokinin GATA Transcription Factor1 Regulates Chloroplast Development and Plant Architecture.Plant Physiol. 2013, 162, 132–144. [CrossRef]
41. Sjögren, L.L.; Macdonald, T.M.; Sutinen, S.; Clarke, A.K. Inactivation of the clpC1 Gene Encoding aChloroplast Hsp100 Molecular Chaperone Causes Growth Retardation, Leaf Chlorosis, Lower PhotosyntheticActivity, and a Specific Reduction in Photosystem Content. Plant Physiol. 2004, 136, 4114–4126. [CrossRef][PubMed]
42. Lv, X.-G.; Shi, Y.-F.; Xu, X.; Wei, Y.-L.; Wang, H.-M.; Zhang, X.-B.; Wu, J.-L. Oryza sativa ChloroplastSignal Recognition Particle 43 (OscpSRP43) Is Required for Chloroplast Development and Photosynthesis.PLoS ONE 2015, 10, e0143249. [CrossRef] [PubMed]
43. Yu, B.; Gruber, M.Y.; Khachatourians, G.G.; Zhou, R.; Epp, D.J.; Hegedus, D.D.; Parkin, I.A.P.; Welsch, R.;Hannoufa, A. Arabidopsis cpSRP54 regulates carotenoid accumulation in Arabidopsis and Brassica napus.J. Exp. Bot. 2012, 63, 5189–5202. [CrossRef] [PubMed]
44. Wan, C.M.; Li, C.M.; Ma, X.Z.; Wang, Y.; Sun, C.H.; Huang, R.; Zhong, P.; Gao, Z.Y.; Chen, D.; Xu, Z.J.; et al.GRY79 encoding a putative metallo-beta-lactamase-trihelix chimera is involved in chloroplast developmentat early seedling stage of rice. Plant Cell Rep. 2015, 34, 1353–1363. [CrossRef] [PubMed]
45. Miyoshi, K.; Ito, Y.; Serizawa, A.; Kurata, N. OsHAP3genes regulate chloroplast biogenesis in rice. Plant J.2003, 36, 532–540. [CrossRef] [PubMed]
46. Perez-Ruiz, J.M. Rice NTRC Is a High-Efficiency Redox System for Chloroplast Protection against OxidativeDamage. Plant Cell 2006, 18, 2356–2368. [CrossRef] [PubMed]
47. Jiang, H.; Li, M.; Liang, N.; Yan, H.; Wei, Y.; Xu, X.; Liu, J.; Xu, Z.; Chen, F.; Wu, G.; et al. Molecular cloningand function analysis of the stay green gene in rice. Plant J. 2007, 52, 197–209. [CrossRef]
22

Forests 2019, 10, 120
48. Nott, A.; Jung, H.-S.; Koussevitzky, S.; Chory, J. Plastid-to-nucleus retrograde signaling. Annu. Rev. Plant Biol.2006, 57, 739–759. [CrossRef]
49. Rossini, L.; Cribb, L.; Martin, D.J.; Langdale, J.A. The Maize Golden2 Gene Defines a Novel Class ofTranscriptional Regulators in Plants. Plant Cell 2001, 13, 1231. [CrossRef]
50. Yasumura, Y.; Moylan, E.C.; Langdale, J.A. A Conserved Transcription Factor Mediates Nuclear Control ofOrganelle Biogenesis in Anciently Diverged Land Plants. Plant Cell 2005, 17, 1894–1907. [CrossRef]
51. Wang, P.; Korkaric, M.; Waters, M.T.; Capper, R.G.; Saunders, N.J.; Langdale, J.A. GLK transcription factorscoordinate expression of the photosynthetic apparatus in Arabidopsis. Plant Cell 2009, 21, 1109–1128.
© 2019 by the authors. Licensee MDPI, Basel, Switzerland. This article is an open accessarticle distributed under the terms and conditions of the Creative Commons Attribution(CC BY) license (http://creativecommons.org/licenses/by/4.0/).
23


Article
Transcriptome Analysis of Bael (Aegle marmelos (L.)Corr.) a Member of Family Rutaceae
Prashant Kaushik 1 and Shashi Kumar 2,*
1 Instituto de Conservación y Mejora de la Agrodiversidad Valenciana, Universitat Politècnica de València,46022 Valencia, Spain; [email protected]
2 International Center for Genetic Engineering and Biotechnology, Aruna Asaf Ali Marg,New Delhi 110 067, India
* Correspondence: [email protected]; Tel.: +91-11-26741358
Received: 13 June 2018; Accepted: 10 July 2018; Published: 26 July 2018
Abstract: Aegle marmelos (L.) Corr. is a medicinally and horticulturally important tree member ofthe family Rutaceae. It is native to India, where it is also known as Bael. Despite its importance,the genomic resources of this plant are scarce. This study presented the first-ever report of expressedtranscripts in the leaves of Aegle marmelos. A total of 133,616 contigs were assembled to 46,335 unigeneswith minimum and maximum lengths of 201 bp and 14,853 bp, respectively. There were 7002transcription factors and 94,479 simple sequence repeat (SSR) markers. The A. marmelos transcriptswere also annotated based on information from other members of Rutaceae; namely Citrusclementina and Citrus sinensis. A total of 482 transcripts were annotated as cytochrome p450s(CYPs), and 314 transcripts were annotated as glucosyltransferases (GTs). In the A. marmelos leaves,the monoterpenoid biosynthesis pathway was predominant. This study provides an importantgenomic resource along with useful information about A. marmelos.
Keywords: Aegle marmelos (L.) Corr.; transcripts; transcriptome assembly; simple sequence repeats;transcription factors; cytochrome p450; glycotransferases; metabolic pathway
1. Introduction
Aegle marmelos (L.) Corr. (2 n = 18) or Bael is an underexploited member of family Rutaceae.Believed to be native to the Indian subcontinent, it is well distributed throughout the tropical andsubtropical belts of southeast Asia [1,2]. Botanically, A. marmelos is a deciduous tree stretching upto 10 m in height that flowers during the months of May–June [3,4]. It is also commonly grown asa horticultural plant in India, and its fruits are processed as juice or candies, as well as eaten fresh.During the past few decades, a spike in its cultivation as a horticulture plant has been attributed to itsmedicinal properties, along with a hardy nature that allows it to be cultivated on marginal lands withacidic or alkaline soils [5,6].
The traditional medicine system of Ayurveda in India routinely uses every part of A. marmelosas a therapy for medical conditions [7,8]. The leaves are most easily accessible, and are thereforemore regularly used for the treatments than any other plant part. A. maremelos leaves are used totreat jaundice and help in wound-healing when applied as a paste on a wound surface [9]. Moreover,A. marmelos leaf extracts have been proved to be a better cure for gastrointestinal and hematopoieticdamage than its fruits [10]. The leaf extract of A. marmelos is used as a medication against a number ofchronic diseases such as diabetes, pancreatic cancer, and arthritis [11–14]. All of these medicinalproperties of A. marmelos leaves are attributed to various phytochemicals present in the leavessuch as aeglin, rutin, γ-sitosterole, β-sitosterol, eugenol, marmesinin, glycoside, skimmianine, etc.Broadly, these phytochemicals can be divided into three main classes: alkaloids, phenylpropanoids,and terpenoids [15,16]. However, there is no genomic data-based information about the pathways
Forests 2018, 9, 450; doi:10.3390/f9080450 www.mdpi.com/journal/forests25

Forests 2018, 9, 450
of these important metabolic compounds that are present in the A. marmelos leaf. The informationregarding the biosynthetic pathways and the encoding enzymes present in the A. marmelos leaf will behighly useful for the functional genomics in A. marmelos via transgenics and metabolic engineeringapproaches. Furthermore, A. marmelos leaf extract is used for the green synthesis of gold and silvernanoparticles [17,18].
The sum total of all of the transcripts captured in the cell of an individual organism is called itstranscriptome [19]. There are two ways to capture the expressed transcripts: either by microarray,which is limited to predefined sequences, or by performing RNA-Seq using second-generationsequencing technologies [20]. This kind of sequencing has revolutionized the understandingof non-model organisms, and has evolved as one of the first choices of methods to apply togene discovery and the expression profiling of non-model organisms [21,22]. The availability ofwell-defined computational tools, along with a well-applied methodology, has further demonstratedthe effectiveness of de novo transcriptome assemblies in organisms even without a referencegenome [23,24].
Genomic resources in A. marmelos are scarce compared with other members of Rutaceae,such as Citrus sinensis (Sweet Orange) and Citrus clementina (Clementine), both having well-annotatedgenomes [25,26]. Moreover, the unavailability of molecular markers based on the genomic informationhas further decelerated the molecular breeding efforts in A. marmelos. Earlier, a diversity study wascarried out using only 12 random amplification of polymorphic DNA (RAPDs) [1]. This limitationcan be overcome by developing an appropriate resource of genomic information-based molecularmarkers using a next-generation sequencing (NGS)-based approach such as transcriptomics [20,22].To the best of our knowledge, this is the first detailed report on the transcriptome of this medicallyimportant plant. Moreover, only six expressed sequence tag (ESTs) are available in the National Centerfor Biotechnology Information (NCBI) database (accessed on 25 May 2018) [27]. An investigation intothe leaf transcriptome of A. marmelos can help answer key questions regarding various aspects relatedto genes and their gene function, via the pathways involved in the metabolic compound formation.Therefore, we used RNA sequencing followed by the de novo transcriptome assembly of A. marmelosleaves to identify the transcription factors, simple sequence repeats (SSRs), and transcripts related toimportant metabolic pathways in the leaves of A. marmelos. Also, the information regarding cytochromeP450s (CYPs) and glucosyltransferases (GTs) extant in the leaf of A. marmelos was also accomplished.
2. Materials and Methods
2.1. RNA Isolation and Sequencing
Young and tender leaves from three mature and healthy plants of A. marmelos variety “Kaghzi”(~five years old) were collected from the Government Garden Nursery (coordinates at 29◦58′06.9” N76◦52′50.8” E) in Haryana, India. The sampled leaf tissues were stored in RNAlater (Life Technologies,Carlsbad, CA, USA) till further use. RNA was extracted with a TRIZOL reagent (Life TechnologiesCorporation, Carlsbad, CA, USA) based RNA extraction protocol for plant leaves [28,29]. The quality ofthe extracted RNA was checked on a 1% formaldehyde denaturing agarose gel, and further quantifiedusing a Nanodrop ND-1000 spectrophotometer (Nanodrop Technologies, Montchanin, DE, USA).A pooled sample of RNA from three selected plants was used for a single cDNA library preparation.The library was prepared with a TruSeq RNA Library Prep Kit v2 from Illumina® (Illumina Inc.,San Diego, CA, USA), and the library quantification was done using a Qubit Fluorometer (Qubit™dsDNA HS Assay Kit, Life Technologies Corporation, Carlsbad, California, USA) and Agilent D1000ScreenTape system (Agilent Technologies, Santa Clara, CA, USA). The library was further sequencedon the Illumina HiSeq 2500 (2 × 150 bp) platform (Illumina, Dedham, MA, USA).
26

Forests 2018, 9, 450
2.2. De Novo Assembly and Identification Coding Sequences
The cleaned reads were assembled using Trinity software (version 2.4.0) and TransDecoder v. 3.0.1(http://transdecoder.sourceforge.net/) [30] was used to identify candidate coding regions within thegenerated transcripts and look for the open reading frames (ORF) that were at least 100 amino acidslong in order to decrease the chances of false positives.
2.3. Gene Function Annotation
The transcripts with ORFs were annotated with BLASTX (default parameters, e-value cut-off 10-5)by resemblance counter to NR (non-redundant protein sequences database of NCBI), protein family(Pfam), Kyoto Encyclopedia of Genes and Genomes (KEGG) (http://www.genome.jp/kegg/) [31],e-value cut-off of 1 × 10⁻⁵, and cluster of orthologous groups (COG) (https://www.ncbi.nlm.nih.gov/COG/) [32]. The gVolantes server (https://gvolante.riken.jp) [33] was used for the assessmentof the completeness of transcriptome assembly via BUSCO_v3 selecting the plant ortholog set. Onlytranscripts pertaining to plant species were extracted and used for gene ontology. Pfam annotationwas done with Hmmerscan, while Blast2Go was used for Gene Ontology (GO) annotation [34,35].KEGG orthologies were estimated using the KEGG Automated Annotation Server (KAAS) by meansof single-directional best hit method (http://www.genome.jp/kegg/kaas/) [36].
2.4. Identification of Transcription Factors
Transcription factors families present in the leaves of A. marmelos were identified by searchingcoding sequences identified by TransDecoder against the plant transcription factor database (PlnTFDB)(http://plntfdb.bio.uni-potsdam.de/v3.0/downloads.php) [37] with an e-value cut-off of < 1 × 10⁻¹⁰.
2.5. Identification of Simple Sequence Repeats (SSRs)
The presence of SSRs was determined by using MIcroSAtelliteidentification tool v1.0 (MISA)(http://pgrc.ipk-gatersleben.de/misa/) [38]. Briefly, the transcripts were checked 10 times formonorepeats, six times for direpeats, and five times for tri/tetra/penta/hexarepeats.
3. Results
3.1. De Novo Assembly, Gene Prediction, and Functional Annotation
RNA-Seq targeting expressed coding sequences has been used successfully in many medicinaland non-model plant species that do not have a reference genome (e.g., Prosopis cineraria L. [39],Andrographis paniculata Burm.f. [40], Phyllanthus emblica L. [41], Picrorhiza kurroa [42], and Azadirachtaindica Royle ex Benth. [43]). Moreover, being a tree, A. marmelos can have a large genome size,which further restricts genome sequencing efforts [44].
The pooled RNA sample of A. marmelos leaves with RIN values around 8.0 generated a total of115.92 million paired reads of high quality (Phred score > 30). Trinity assembler was used for theassembly, and after trimming of adapters, there was a total of 133,616 contigs (only from reads of200 bp and above in length) clustered into 46,345 unigenes (Table 1). The raw data that was obtained asa result of sequencing was submitted to NCBI BioProject (PRJNA433585). The assembly completenessreport from gVolante estimated that the transcriptome assembly was 90.15% complete (Figure S1).We scrutinized for an open reading frame that was at least 100 amino acids long in order to decreasethe chances of false positives during open reading frames (ORF) predictions. The annotated transcriptswith ORFs are listed in Table 2. A total of 90,525 transcripts were annotated to GO terms (Table S1).The transcripts related to plant species were extracted and used for gene ontology (Table 2).
27

Forests 2018, 9, 450
Table 1. Assembly statistics of the leaf transcriptome.
A. marmelos Assembly Statistics
Number of assembled sequences 133,616Total length (nt) 225,969,847
Range of coding sequence length (nt) 201–14,853Mean sequence length (nt) 1691
Median sequence length (nt) 1395N50 sequence length (nt) 2544
L50 sequence count 30,077Number of sequences > 1K (nt) 81,171 (60.7%)Number of sequences > 10K (nt) 96 (0.1%)
Base composition (%) A: 29.75T: 29.75G: 20.36C: 20.14
Guanine-Cytosine content (%) 40.50
Table 2. Annotation summary of A. marmelos leaf transcripts. COG: cluster of orthologous groups, GO:gene ontology, KEGG: Kyoto Encyclopedia of Genes and Genomes, ORFs: open reading frames, Pfam:protein family.
Parameters Numbers
Total Transcripts 133,616Total ORFs 165,230
Transcript BLASTX (Plant Species) 126,101Transcript annotated with GO terms 90,525
Transcript BLASTP 82,445Transcript BLASTX against Pfam 67,451
Transcript annotations against KEGG 83,221Transcript annotated with COG 81,636
3.2. GO Annotation
In total, 600,642 Gene Ontology (GO) terms were mapped to the A. marmelos leaf contigsbelonging to all the three possible classes, i.e., biological process (227,921 transcripts), cellularcomponent (188,465 transcripts), and molecular function (184,25 transcripts) in the GO database(Figure 1). The breakdown of the proteins associated with the various biological process, cellularcomponents, and molecular functions is illustrated in Figure 2. The “integral component of membrane”(GO: 0016021) associated with various cellular components, “transcription DNA-templated”(GO: 00006351) associated with biological processes and “ATP binding” (GO: 00005524) associatedwith molecular function were the most mapped terms in their respective categories (Figure 2.).
The GO terms primarily define three categories of functions: namely, the biological, cellular,and molecular functions for a gene product. This is achieved by associating a gene with theirontologies [45,46]. Earlier studies have pointed out a higher metabolic activity in the leaves ofA. marmelos, which is because of the presence of phytochemicals such as alkaloids, flavonoids,and phenols [47,48]. We have identified a number of GO terms in the leaves of A. marmelos;this information could lead to the identification of important pathways of metabolic compoundsin A. marmelos [49].
28

Forests 2018, 9, 450
227921
184256
188465
Biological Process Molecular Function Cellular Component
Figure 1. Genes associated with the biological process, cellular components, and molecular functionsin the A. marmelos leaf transcriptome assembly.
81285959
341922972148
1810
2009519890
1346512312
104108283
1886210127
66495562
52124888
transcription, DNA-templated (GO:0006351)regulation of transcription, DNA-templated (GO:0006355)
defense response (GO:0006952)protein phosphorylation (GO:0006468)
response to salt stress (GO:0009651)protein transport (GO:0015031)
integral componenet of membrane (GO:0016021)nucleus (GO:0005634)
plasma membrane (GO:0005886)chloroplast (GO:0009507)cytoplasm (GO:0005737)
cytosol (GO:0005829)
ATP binding (GO:0005524)metal ion binding (GO:0046872)
DNA binding (GO:0003677)zinc ion binding (GO:0008270)
RNA binding (GO:0003723)protein serine kinase activity (GO:0004674)
(c)
(b)
(a)
Figure 2. Gene Ontology (GO) classification of A. marmelos transcripts. GO term are divided in threemain categories: biological process (a), cellular component (b), and molecular function (c).
3.3. Citrus Database Annotation
The A. marmelos transcripts were also annotated via Phytozome (https://phytozome.jgi.doe.gov/)with reference to the Citrus clementina and Citrus sinensis genomes. This resulted in the mapping of78.44% of the transcripts to the Citrus clementine, and 79.85% to the Citrus sinensis genome (Table 3).An almost similar number of transcripts were annotated with GO terms and KEGG annotation,respectively (Tables S2 and S3). However, recently, an extensive amount of relatedness was observedwithin the members of genus Citrus of family Rutaceae, which was based on the study performed byusing the whole genome sequences of 60 members in the Citrus genus; the authors even pointed outthe need for reformulation of the genus [50].
29

Forests 2018, 9, 450
Table 3. Annotation summary of A. marmelos leaf transcripts with Citrus sinensis and Citrus clementine genome.
Genome Citrus clementina Citrus sinensis
No. of transcripts annotated 98,917 (78.44) 100,701 (79.85)No. of transcripts annotated by Gene Ontology 98,184 100,053
No. of transcripts annotated by KEGG 48,184 48,881
3.4. Simple Sequence Repeats (SSRs) Prediction
Simple sequence repeats (SSRs), or short tandem repeats or microsatellites, are short repeat motifsthat show length polymorphism due to the insertion or deletion mutations of one or more repeattypes [51]. We analyzed for the abundance of SSRs of annotated plant transcripts for A. marmelos leaftranscripts using the MISA tool, and the predicted SSRs statistics are shown in Figure 3. There were58,354 transcripts that contained SSRs, and among these, 23,034 had more than one SSRs (Table S4).In total, 94,479 SSRs were identified, of which 65.27% were monorepeats, 19.78% were direpeats,and 13.40% were trirepeats (Figure 3). Tetra, penta and hexarepeats made up 1.01%, 0.26% and 0.24%of the total, respectively (Figure 3). However, out of a total of 94,479 identified SSRs, 11,400 (12.06%)were related to the compound formation.
61,675
18,697
12,666
957
254
230
0 10,000 20,000 30,000 40,000 50,000 60,000 70,000
Monoucleotide
Dinucleotide
Trinucleotide
Tetranucleotide
Pentanucleotide
Hexanucleotide
Number of SSRs
Type
of S
SRs
Figure 3. Simple sequence repeats (SSRs) classes identified in the leaf transcripts of A. marmelos.
SSRs are codominant markers that are well dispersed throughout plant genomes. SSRs arepopularly used for marker-assisted selection, fingerprinting, diversity assessment, and quantitativetrait loci (QTLs) identification [52]. Routinely, SSRs are identified in the medicinal plants viatranscriptome assemblies, because they are more robust and can also be transferred among differentspecies within the same genus. These identified SSRs can also be used for the marker-assisted breedingin A. marmelos i.e., to breed this tree for a particular environment or condition. Otherwise, until recently,only diversity-related studies were conducted in A. marmelos using universal primers, and researcherswere even limited to only 12 RAPDs and 16 universal ISSRs to access diversity among their A. marmelosgenotypes collection [1,53]. Furthermore, these genomic information-based SSRs can help to identifyand differentiate between homozygous and heterozygous individuals. SSRs are also commonly usedfor the map-based cloning of genes; a close association between genes and their SSRs is crucial in thecontext of genotyping and haplotyping [51,52].
3.5. Transcriptional Factors Identification
Gene expression patterns are regulated by transcription factors that in turn determine the differentbiological process [54]. A total of 7002 transcription factors were retrieved from the PlnTFDB.
30

Forests 2018, 9, 450
The 52 transcription factors were unique to the A. marmelos leaves; although these were out of atotal 6122 that were extant above 100 in the unigenes (Table S5). The most abundant were Auxinresponse factors (ARFs) (717), myeloblastosis (MYB-related) (562), a basic domain/leucine zipper(bZIP) (437), and basic helix–loop–helix (bHLH) (417), whereas HB-Other (132) and CAMATA (109)were the least abundant (Figure 4).
0
100
200
300
400
500
600
700
800
ARF
MYB
_rel
ated
bZIP
bHLH
G2-
like
AP2 B3
C3H
HD
-ZIP
SBP
SBP
NA
C
C2H
2
TALE
GA
TA
Mty
pe_M
AD
S
FAR1
MYB
WRK
Y
HB-
othe
r
CAM
TA
Num
ber o
f Uni
gene
s
Transcription Factor Family
Figure 4. Top 21 families of transcription factors identified in the A. marmelos leaf.
Auxin is the plant hormone that regulates the different plant processes from growth to senescence.Auxin response factors are necessary for the plant to response to auxin stimuli; they channelizethe response via auxin response DNA elements that are present in the primary auxin responsegenes. ARFs switch the auxin response gene on and off via their transcriptional activation domainor transcriptional repression domain [55,56]. MYB-related transcription factors play many roles likeprotection against biotic and abiotic stresses. MYB transcription factors also regulate the metabolismof the phenylpropanoid pathway, and are well studied with respect to the regulation of primaryand secondary metabolism in the plant [57,58]. Likewise, bZIP and bHLH transcription factors arealso involved in the metabolic biosynthesis in plants, especially by activation of phenylpropanoidgenes [59,60].
3.6. Transcripts Encoding Cytochrome p450s (CYPs) and Glucosyltransferase (GTs)
CYPs help in the primary and secondary metabolism of plants by catalyzing monooxygenationreactions. These cytochromes assist in the diversification of metabolic pathways in plants. Currently,these are potential targets for metabolic engineering for the overproduction of metabolites ofinterest [61]. There were 477 transcripts in total that were annotated cytochrome p450s (Table S6).Considering their vital role inmetabolic pathways, we further analyzed the abundance of SSRsannotated within these cytochrome p450 transcripts (Table 4). Among the 128 identified SSRs, 85 werewith monorepeats, seven were with direpeats, and 36 were with trirepeats (Table S7).
31

Forests 2018, 9, 450
Table 4. Prediction of simple sequence repeats (SSRs) for the annotated transcripts with cytochromep450s (CYPs) and glucosyltransferase (GTs).
Description (CYPs) (GTs)
Total number of annotated transcripts encoding 477 314Total size of annotated transcripts (bp) 1,111,258 778,664
Number of SSRs identified 128 247Number of annotated transcripts containing SSR 94 165
Number of annotated transcripts containing morethan 1 SSR 30 64
Number of SSRs present in the compoundformation 5 16
The last step in the production of plant secondary metabolites is glycosylation, which is carriedout by glycotransferases (GTs) [62–64]. A total of 314 transcripts were annotated as glucosyltransferase(Table S8). We analyzed the abundance of SSRs that were present in these transcripts (Table S9),and among the 247 identified, 109 were monorepeats, 79 were direpeats, 58 were trirepeats, and onlyone was identified as a tetrarepeat (Table 4). The SSRs that were identified as using CYPs and GTs canbe of immense potential for identifying genetic diversity among different A. marmelos accessions withdivergent metabolic profiles.
3.7. Identification of Biosynthetic Pathways in A. Marmelos Leaf
A. marmelos leaves are used for the treatment of several medical conditions in Ayurvedaand Yunani medicine systems [65]. The transcripts with the highest fragments per kilobase permillion mapped reads (FPKM) values were extracted from an annotation file along with the KyotoEncyclopedia of Genes and Genomes (KEGG) ID and sorted from the RNA-Seq by ExpectationMaximization (RSEM) file that was obtained from the assembly for transcript quantification. Usingthe KEGG ID, pathways were identified (Table S10). RSEM is commonly used to obtain informationregarding transcript abundance from the RNA-Seq data of an organism, even without a referencegenome [66]. The pathway analysis identified that monoterpenoid biosynthesis and thiamine pathwayswere the two most expressed pathways present in the A. marmelos leaves (Figure 5).
Monoterpenoid Biosynthesis
Thaimine Pathway
Lysosome
Photosysthesis- antenna proteins
Longevity Regulating Pathway
Carbon Metabolism
Trytophan Metabolism
Glyoxylate Metabolism
Dicarboxylate metabolism
Biosynthesis of antibiotics
MAPK Signal Pathway
Fox0 Signalling Pathway
Peroxisome
Photosysthesis- antenna proteins
Photosynthesis
Figure 5. The top 15 pathways in the A. marmelos leaf.
32

Forests 2018, 9, 450
A. marmelos leaves have been reported to contain monoterpenoids as the principal metabolites inthe leaves in levels as high as 93.9% [67,68]. Moreover, this monoterpenoid content is not affected bythe geographic location of the plant, as it remains unaffected by changes in altitude, unlike many othermetabolites [69]. Thiamine is naturally produced in the plants as a sulfur-comprising and water-solublecompound. A. marmelos contains thiamine, although thiamine concentration is higher in the fruits thanthe leaves, and is among the fruits with the highest thiamine content [70,71]. Detailed informationregarding the routes, reactions, and encoded enzymes of the two most expressed pathways identifiedin the leaf transcriptome of A. marmelos is provided in Figures 6 and 7. This detailed informationgenerated regarding the monoterpenoid and thiamine biosynthetic pathway will be useful for furthergenetic analysis of the production of these important metabolites and their pathway engineering.
Figure 6. A. marmelos leaf transcriptome encoded enzymes (highlighted) involved in the monoterpenoidbiosynthetic pathway identified in the leaf.
Figure 7. A. marmelos leaf transcriptome encoded enzymes (highlighted) involved in the thiaminebiosynthetic pathway identified in the leaf.
33

Forests 2018, 9, 450
4. Conclusions
In cases of underexploited plant species, there is often not enough genomic information availableto proceed with their genetic improvement, and subsequently transfer important genes from themto cultivated crops. Transcriptome assembly is a cost-effective alternative to genome sequencing forobtaining the information of expressed genes and assisting in the more effective development ofunderexploited crops and medicinal plants. RNA-Seq shines a light on genes and their functions,as well as the pathways that are present, and can subsequently lead to evolutionary studies viamolecular markers. We have successfully performed the first de novo transcriptome assembly ofA. marmelos, which is a plant with religious, medicinal, and horticultural importance. It is the first-everinformation about this plant, which will be of immense value for evolutionary studies and representsthe development of a valuable resource for A. marmelos. Also, once a transcriptome reference isavailable, anchored-based transcriptome assemblies and different types of evolutionary studies can beperformed within family Rutaceae involving genus Aegle.
Supplementary Materials: Supplementary materials can be found at http://www.mdpi.com/1999-4907/9/8/450/s1. Figure S1. Completeness assessment of A. maremelos leaf transcriptome assembly using gVolante server.Table S1. A. marmelos detailed annotation results. Table S2. Detail list of A. maremlos transcripts annotation withCitrus sinensis genome. Table S3. Detail result of A. maremlos transcripts annotation against Citrus clementinagenome. Table S4. Detailed of SSRs in the A. marmelos leaf transcriptome. Table S5. Transcriptional factors familyidentified in A. marmelos leaf. Table S6. Detail list of cytochrome 450s (CYPs) annotation result. Table S7. SSRsidentified in the cytochromes P450s transcripts. Table S8. Detail list of glycosyltransferases (GTs) annotation result.Table S9. SSRs identified in Glycosyltransferases (GTs) transcripts. Table S10. FPKM based top KEGG IDS inA. maremlos leaf transcriptome.
Author Contributions: P.K. and S.K. conceived and designed the project. P.K. performed the experiments. P.K.analyzed the data. P.K. and S.K. wrote the paper. Both authors read and approved the final manuscript.
Funding: This research received no external funding.
Acknowledgments: We thank the anonymous reviewers for their careful reading of the manuscript and providingthe insightful suggestions. P.K. would like to thank Bengaluru Genomics Centre Pvt. Limited, Bengaluru, India forletting him use their facility.
Conflicts of Interest: The authors declare no conflict of interest.
Abbreviations
BLAST Basic Local Alignment Search ToolCOG Cluster of Orthologous GroupsCYP Cytochrome p450FPKM Fragments per kilobase of exon per million fragments mappedGO Gene OntologyGT GlucosyltransferaseKEGG Kyoto Encyclopedia of Genes and GenomesKO Kyoto Encyclopedia of Genes and Genomes OrthologyKOG euKaryotic Ortholog GroupsMISA MIcroSAtelliteidentificationNCBI National Center of Biotechnology InformationNR Non-redundantNt NucleotideORF Open reading framePfam Protein familyPlnTFDB Plant Transcription Factor DataBaseRNA-Seq Ribonucleic acid sequencingRSEM RNA-Seq expression estimation by expectation maximizationSSR Simple Sequence Repeat
34

Forests 2018, 9, 450
References
1. Nayak, D.; Singh, D.R.; Sabarinathan, P.; Singh, S.; Nayak, T. Random amplified polymorphic DNA (RAPD)markers reveal genetic diversity in bael (Aegle marmelos Correa) genotypes of Andaman Islands, India.Afr. J. Biotechnol. 2013, 12. [CrossRef]
2. Ajithkumar, D.; Seeni, S. Rapid clonal multiplication through in vitro axillary shoot proliferation ofAegle marmelos (L.) Corr., a medicinal tree. Plant Cell Rep. 1998, 17, 422–426. [CrossRef]
3. Kishore, K.; Mahanti, K.K.; Samant, D. Phenological growth stages of bael (Aegle marmelos) according to theextended Biologische Bundesantalt, Bundessortenamt und Chemische Industrie scale. Ann. App. Biol. 2017,170, 425–433. [CrossRef]
4. Singhal, V.; Salwan, A.; Kumar, P.; Kaur, J. Erratum to: Phenology, pollination and breeding system ofAegle marmelos (Linn.) Correa (Rutaceae) from India. New For. 2011, 42, 85–100. [CrossRef]
5. Hiwale, S. Sustainable Horticulture in Semiarid Dry Lands; Springer: New Delhi, India, 2015; ISBN978-81-322-2243-9.
6. Khare, C.P. Indian Medicinal Plants: An Illustrated Dictionary; Springer-Verlag: New York, NY, USA, 2007;ISBN 978-0-387-70637-5.
7. Bhardwaj, R.L.; Nandal, U. Nutritional and therapeutic potential of bael (Aegle marmelos Corr.) fruit juice:A review. Nutr. Food Sci. 2015, 45, 895–919. [CrossRef]
8. Gutiérrez, S.P.; Sánchez, M.A.Z.; González, C.P.; García, L.A. Antidiarrhoeal activity of different plants usedin traditional medicine. Afr. J. Biotechnol. 2007, 6, 2988–2994. [CrossRef]
9. Arul, V.; Miyazaki, S.; Dhananjayan, R. Studies on the anti-inflammatory, antipyretic and analgesic propertiesof the leaves of Aegle marmelos Corr. J. Ethnopharmacol. 2005, 96, 159–163. [CrossRef] [PubMed]
10. Singh, P.; Dutta, S.R.; Guha, D. Gastric mucosal protection by aegle marmelos against gastric mucosaldamage: Role of enterochromaffin cell and serotonin. Saudi J. Gastroenterol. 2015, 21, 35. [CrossRef] [PubMed]
11. Manandhar, B.; Paudel, K.R.; Sharma, B.; Karki, R. Phytochemical profile and pharmacological activity ofAegle marmelos Linn. J. Integr. Med. 2018, 16, 153–163. [CrossRef] [PubMed]
12. Baliga, M.S.; Thilakchand, K.R.; Rai, M.P.; Rao, S.; Venkatesh, P. Aegle marmelos (L.) Correa (Bael) and itsphytochemicals in the treatment and prevention of cancer. Integr. Cancer Ther. 2013, 12, 187–196. [CrossRef][PubMed]
13. Shankarananth, V.; Balakrishnan, N.; Suresh, D.; Sureshpandian, G.; Edwin, E.; Sheeja, E. Analgesic activityof methanol extract of Aegle marmelos leaves. Fitoterapia 2007, 78, 258–259. [CrossRef] [PubMed]
14. Nigam, V.; Nambiar, V.S. Aegle Marmelos Leaf Juice As A Complementary Therapy To Control Type 2Diabetes-Randomised Controlled Trial In Gujarat, India (in press). Adv. Integr. Med. 2018. [CrossRef]
15. Laphookhieo, S.; Phungpanya, C.; Tantapakul, C.; Techa, S.; Tha-in, S.; Narmdorkmai, W. ChemicalConstituents from Aegle marmelos. J. Braz. Chem. Soc. 2011, 22, 176–178. [CrossRef]
16. Maity, P.; Hansda, D.; Bandyopadhyay, U.; Mishra, D.K. Biological activities of crude extracts and chemicalconstituents of Bael, Aegle marmelos (L.) Corr. Indian J. Exp. Biol. 2009, 47, 849–861. [PubMed]
17. Jha, A.K.; Prasad, K. Biosynthesis of Gold Nanoparticles Using Bael (Aegle marmelos) Leaf: MythologyMeets Technology. Int. J. Green Nanotechnol. Biomed. 2011, 3, 92–97. [CrossRef]
18. Rao, K.J.; Paria, S. Aegle marmelos Leaf Extract and Plant Surfactants Mediated Green Synthesis of Au and AgNanoparticles by Optimizing Process Parameters Using Taguchi Method. ACS Sustain. Chem. Eng. 2015, 3,483–491. [CrossRef]
19. Hancock, J.M.; Zvelebil, M.J. (Eds.) Concise Encyclopaedia of Bioinformatics and Computational Biology, 2nd ed.;John Wiley & Sons: New York, NY, USA, 2014; Available online: https://www.wiley.com/enus/Concise/Encyclopaedia/of/Bioinformatics/and/Computational+Biology%2C+2nd+Edition-p-9780470978719(accessed on 6 May 2018).
20. Martin, J.A.; Wang, Z. Next-generation transcriptome assembly. Nat. Rev. Genet. 2011, 12, 671–682. [CrossRef][PubMed]
21. Papanicolaou, A.; Stierli, R.; ffrench-Constant, R.H.; Heckel, D.G. Next generation transcriptomes for nextgeneration genomes using est2assembly. BMC Bioinformatics 2009, 10, 447. [CrossRef] [PubMed]
22. Morin, P.A.; Foote, A.D.; Hill, C.M.; Simon-Bouhet, B.; Lang, A.R.; Louis, M. SNP Discovery from Single andMultiplex Genome Assemblies of Non-model Organisms. Methods in Molecular Biology. In Next GenerationSequencing; Humana Press: New York, NY, USA, 2018; pp. 113–144. ISBN 978-1-4939-7512-9.
35

Forests 2018, 9, 450
23. Grabherr, M.G.; Haas, B.J.; Yassour, M.; Levin, J.Z.; Thompson, D.A.; Amit, I.; Adiconis, X.; Fan, L.;Raychowdhury, R.; Zeng, Q.; et al. Full-length transcriptome assembly from RNA-Seq data without areference genome. Nat. Biotechnol. 2011, 29, 644–652. [CrossRef] [PubMed]
24. Geniza, M.; Jaiswal, P. Tools for building de novo transcriptome assembly. Curr. Plant Biol. 2017, 11, 41–45.[CrossRef]
25. Xu, Q.; Chen, L.L.; Ruan, X.; Chen, D.; Zhu, A.; Chen, C.; Bertrand, D.; Jiao, W.B.; Hao, B.H.; Lyon, M.P.; et al.The draft genome of sweet orange (Citrus sinensis). Nat. Genet. 2013, 45, 59–66. [CrossRef] [PubMed]
26. Terol, J.; Naranjo, M.A.; Ollitrault, P.; Talon, M. Development of genomic resources for Citrus clementina:Characterization of three deep-coverage BAC libraries and analysis of 46,000 BAC end sequences.BMC Genom. 2008, 9, 423. [CrossRef] [PubMed]
27. National Center for Biotechnology Information (NCBI) Database. Available online: https://www.ncbi.nlm.nih.gov/nucest/?term=Aegle+marmelos (accessed on 25 May 2018).
28. Portillo, M.; Fenoll, C.; Escobar, C. Evaluation of different RNA extraction methods for small quantities ofplant tissue: Combined effects of reagent type and homogenization procedure on RNA quality-integrityand yield. Physiol. Plant. 2006, 128, 1–7. [CrossRef]
29. Rio, D.C.; Ares, M.; Hannon, G.J.; Nilsen, T.W. Purification of RNA using TRIzol (TRI reagent). Cold SpringHarb. Protoc. 2010, 2010, pdb–prot5439. [CrossRef] [PubMed]
30. Haas, B.J.; Papanicolaou, A.; Yassour, M.; Grabherr, M.; Blood, P.D.; Bowden, J.; Couger, M.B.; Eccles, D.;Li, B.; Lieber, M.; et al. De novo transcript sequence reconstruction from RNA-seq using the Trinity platformfor reference generation and analysis. Nat. Protoc. 2013, 8, 1494–1512. [CrossRef] [PubMed]
31. Kanehisa, M.; Goto, S.; Sato, Y.; Furumichi, M.; Tanabe, M. KEGG for integration and interpretation oflarge-scale molecular data sets. Nucleic Acids Res. 2011, 40, 109–114. [CrossRef] [PubMed]
32. Tatusov, R.L.; Galperin, M.Y.; Natale, D.A.; Koonin, E.V. The COG database: A tool for genome-scale analysisof protein functions and evolution. Nucleic Acids Res. 2000, 28, 33–36. [CrossRef] [PubMed]
33. Nishimura, O.; Hara, Y.; Kuraku, S. gVolante for standardizing completeness assessment of genome andtranscriptome assemblies. Bioinformatics 2017, 33, 3635–3637. [CrossRef] [PubMed]
34. Conesa, A.; Götz, S. Blast2GO: A comprehensive suite for functional analysis in plant genomics. Int. J.Plant Genomics 2008, 2008, 619832. [CrossRef] [PubMed]
35. Finn, R.D.; Clements, J.; Eddy, S.R. HMMER web server: Interactive sequence similarity searching. NucleicAcids Res. 2011, 39, W29–W37. [CrossRef] [PubMed]
36. Moriya, Y.; Itoh, M.; Okuda, S.; Yoshizawa, A.; Kanehisa, M. KAAS: An automatic genome annotation andpathway reconstruction server. Nucleic Acids Res 2007, 35, W182–W185. [CrossRef] [PubMed]
37. Pérez-Rodríguez, P.; Riaño-Pachón, D.; Corrêa, L.; Rensing, S.; Kersten, B.; Mueller-Roeber, B. PlnTFDB:Updated content and new features of the plant transcription factor database. Nucleic Acids Res. 2010,D822–D827. [CrossRef] [PubMed]
38. Thiel, T.; Michalek, W.; Varshney, R.K.; Graner, A. Exploiting EST databases for the development andcharacterization of gene-derived SSR-markers in barley (Hordeum vulgare L.). Theor. Appl. Genet. 2013, 106,411–422. [CrossRef] [PubMed]
39. Rai, M.K.; Shekhawat, J.K.; Kataria, V.; Shekhawat, N.S. De novo assembly of leaf transcriptome, functionalannotation and genomic resources development in Prosopis cineraria, a multipurpose tree of IndianThar Desert. Plant Gene 2017, 12, 88–97. [CrossRef]
40. Cherukupalli, N.; Divate, M.; Mittapelli, S.R.; Khareedu, V.R.; Vudem, D.R. De novo Assembly of LeafTranscriptome in the Medicinal Plant Andrographis paniculata. Front. Plant Sci. 2016, 7, 1203. [CrossRef][PubMed]
41. Kumar, A.; Kumar, S.; Bains, S.; Vaidya, V.; Singh, B.; Kaur, R.; Kaur, J.; Singh, K. De novo TranscriptomeAnalysis Revealed Genes Involved in Flavonoid and Vitamin C Biosynthesis in Phyllanthus emblica (L.). Front.Plant Sci. 2016, 7, 481. [CrossRef] [PubMed]
42. Kumar, V.; Sharma, N.; Sood, H.; Chauhan, R.S. Exogenous feeding of immediate precursors revealssynergistic effect on picroside-I biosynthesis in shoot cultures of Picrorhiza kurroa Royle ex Benth. Sci. Rep.2016, 6, 29750. [CrossRef] [PubMed]
43. Krishnan, N.M.; Pattnaik, S.; Jain, P.; Gaur, P.; Choudhary, R.; Vaidyanathan, S.; Deepak, S.; Hariharan, A.K.;Krishna, P.B.; Nair, J.; et al. A draft of the genome and four transcriptomes of a medicinal and pesticidalangiosperm Azadirachta indica. BMC Genom. 2012, 13, 464. [CrossRef] [PubMed]
36

Forests 2018, 9, 450
44. Schatz, M.C.; Witkowski, J.; McCombie, W.R. Current challenges in de novo plant genome sequencing andassembly. Genome Biol. 2012, 13, 243. [CrossRef] [PubMed]
45. Blake, J.A. Ten Quick Tips for Using the Gene Ontology. PLOS Comput. Biol. 2013, 9, e1003343. [CrossRef][PubMed]
46. Rhee, S.Y.; Wood, V.; Dolinski, K.; Draghici, S. Use and misuse of the gene ontology annotations.Nat. Rev. Genet. 2008, 9, 509–515. [CrossRef] [PubMed]
47. Mujeeb, F.; Bajpai, P.; Pathak, N. Phytochemical Evaluation, Antimicrobial Activity, and Determination ofBioactive Components from Leaves of Aegle marmelos. BioMed Res. Int. 2014, 2014, 1–11. Available online:https://www.hindawi.com/journals/bmri/2014/497606/ (accessed on 12 May 2018). [CrossRef] [PubMed]
48. Pati, R.; Muthukumar, M. Genetic Transformation of Bael (Aegle marmelos Corr.). In Biotechnology of Neglectedand Underutilized Crops; Springer: Dordrecht, The Netherlands, 2013; pp. 343–365. ISBN 978-94-007-5499-7.
49. Terol, J.; Tadeo, F.; Ventimilla, D.; Talon, M. An RNA-Seq-based reference transcriptome for Citrus.Plant Biotechnol. J. 2016, 14, 938–950. [CrossRef] [PubMed]
50. Wu, G.A.; Terol, J.; Ibanez, V.; López-García, A.; Pérez-Román, E.; Borredá, C.; Domingo, C.; Tadeo, F.R.;Carbonell-Caballero, J.; Alonso, R.; et al. Genomics of the origin and evolution of Citrus. Nature 2018, 554,311–316. [CrossRef] [PubMed]
51. Nadeem, M.A.; Nawaz, M.A.; Shahid, M.Q.; Dogan, Y.; Comertpay, G.; Yıldız, M.; Hatipoglu, R.; Ahmad, F.;Alsaleh, A.; Labhane, N.; et al. DNA molecular markers in plant breeding: Current status and recentadvancements in genomic selection and genome editing. Biotechnol. Biotec. Eq. 2018, 32, 261–285. [CrossRef]
52. Vieira, M.L.C.; Santini, L.; Diniz, A.L.; de Freitas Munhoz, C. Microsatellite markers: What they mean andwhy they are so useful. Genet. Mol. Biol. 2016, 39, 312–328. [CrossRef] [PubMed]
53. Mujeeb, F.; Bajpai, P.; Pathak, N.; Verma, S.R. Genetic Diversity Analysis of Medicinally ImportantHorticultural Crop Aegle marmelos by ISSR Markers. Methods Mol. Biol. 2017, 1620, 195–211. [CrossRef][PubMed]
54. Liu, L.; White, M.J.; MacRae, T.H. Transcription factors and their genes in higher plants. Eur. J. Biochem. 1999,262, 247–257. [CrossRef] [PubMed]
55. Boer, D.R.; Freire-Rios, A.; van den Berg, W.A.M.; Saaki, T.; Manfield, I.W.; Kepinski, S.; López-Vidrieo, I.;Franco-Zorrilla, J.M.; de Vries, S.C.; Solano, R.; et al. Structural basis for DNA binding specificity by theauxin-dependent ARF transcription factors. Cell 2014, 156, 577–589. [CrossRef] [PubMed]
56. Finet, C.; Berne-Dedieu, A.; Scutt, C.P.; Marlétaz, F. Evolution of the ARF gene family in land plants:Old domains, new tricks. Mol. Biol. Evol. 2013, 30, 45–56. [CrossRef] [PubMed]
57. Ambawat, S.; Sharma, P.; Yadav, N.R.; Yadav, R.C. MYB transcription factor genes as regulators for plantresponses: An overview. Physiol. Mol. Biol. Plants 2013, 19, 307–321. [CrossRef] [PubMed]
58. Baldoni, E.; Genga, A.; Cominelli, E. Plant MYB Transcription Factors: Their Role in Drought Response Mechanisms.Int. J. Mol. Sci. 2015, 16, 15811–15851. [CrossRef] [PubMed]
59. Hartmann, U.; Sagasser, M.; Mehrtens, F.; Stracke, R.; Weisshaar, B. Differential combinatorial interactionsof cis-acting elements recognized by R2R3-MYB, BZIP, and BHLH factors control light-responsive andtissue-specific activation of phenylpropanoid biosynthesis genes. Plant Mol. Biol. 2005, 57, 155–171.[CrossRef] [PubMed]
60. Baxevanis, A.D.; Vinson, C.R. Interactions of coiled coils in transcription factors: Where is the specificity?Curr. Opin. Genet. Dev. 1993, 3, 278–285. [CrossRef]
61. Kumar, S. Engineering Cytochrome P450 Biocatalysts for Biotechnology, Medicine, and Bioremediation.Expert Opin. Drug Metab. Toxicol. 2010, 6, 115–131. [CrossRef] [PubMed]
62. Chang, C.W.T. Predictable Enzymatic Glycosylation. Chem. Biol. 2009, 16, 579–580. [CrossRef] [PubMed]63. Keegstra, K.; Raikhel, N. Plant glycosyltransferases. Curr. Opin. Plant Biol. 2001, 4, 219–224. [CrossRef]64. Vogt, T.; Jones, P. Glycosyltransferases in plant natural product synthesis: Characterization of a supergene family.
Trends Plant Sci. 2000, 5, 380–386. [CrossRef]65. Rishabha, M.; Ajay, K.; Anupama, S.; Gt, K. Pharmacological Screening, Ayurvedic values and Commercial
Utility of Aegle Marmelos. Int. J. Drug Dev. Res. 2012, 4, 28–37.66. Li, B.; Dewey, C.N. RSEM: Accurate transcript quantification from RNA-Seq data with or without a
reference genome. BMC Bioinform. 2011, 12, 323. [CrossRef] [PubMed]
37

Forests 2018, 9, 450
67. Kaur, H.P.; Garg, S.N.; Sashidhara, K.V.; Yadav, A.; Naqvi, A.A.; Khanuja, S.P.S. Chemical Composition ofthe Essential Oil of the Twigs and Leaves of Aegle marmelos (L.) Correa. J. Essent. Oil Res. 2006, 18, 288–289.[CrossRef]
68. Raju, P.M.; Agarwal, S.S.; Ali, M.; Velasco-Negueruela, A.; Pérez-Alonso, M.J. Chemical Composition of theLeaf Oil of Aegle marmelos (L.) Correa. J. Essent. Oil Res. 1999, 11, 311–313. [CrossRef]
69. Verma, R.S.; Padalia, R.C.; Chauhan, A. Essential oil composition of Aegle marmelos (L.) Correa: Chemotypicand seasonal variations. J. Sci. Food Agric. 2013, 94, 1904–1913. [CrossRef] [PubMed]
70. Tarwadi, K.; Agte, V. Antioxidant and micronutrient potential of common fruits available in the Indiansubcontinent. Int. J. Food Sci. Nutr. 2007, 58, 341–349. [CrossRef] [PubMed]
71. Baliga, M.S.; Bhat, H.P.; Joseph, N.; Fazal, F. Phytochemistry and medicinal uses of the bael fruit(Aegle marmelos Correa): A. concise review. Food Res. Int. 2011, 44, 1768–1775. [CrossRef]
© 2018 by the authors. Licensee MDPI, Basel, Switzerland. This article is an open accessarticle distributed under the terms and conditions of the Creative Commons Attribution(CC BY) license (http://creativecommons.org/licenses/by/4.0/).
38

Article
Genetic Diversity of the Endangered Dalbergiaodorifera Revealed by SSR Markers
Fumei Liu 1,2,3, Zhou Hong 1, Daping Xu 1, Hongyan Jia 2, Ningnan Zhang 1, Xiaojin Liu 1,
Zengjiang Yang 1 and Mengzhu Lu 3,*
1 State Key Laboratory of Tree Genetics and Breeding, Research Institute of Tropical Forestry,Chinese Academy of Forestry, Longdong, Guangzhou 510520, China; [email protected] (F.L.);[email protected] (Z.H.); [email protected] (D.X.); [email protected] (N.Z.); [email protected] (X.L.);[email protected] (Z.Y.)
2 The Experimental Centre of Tropical Forestry, Chinese Academy of Forestry, Pingxiang 532600, China;[email protected]
3 State Key Laboratory of Tree Genetics and Breeding, Research Institute of Forestry,Chinese Academy of Forestry, Beijing 100091, China
* Correspondence: [email protected]; Tel.: +86-0106-288-9606
Received: 1 February 2019; Accepted: 25 February 2019; Published: 3 March 2019
Abstract: Dalbergia odorifera T. Chen (Fabaceae) is a semi-deciduous tree species indigenous toHainan Island in China. Due to its precious heartwood “Hualimu (Chinese)” and Chinese medicinalcomponents “Jiangxiang”, D. odorifera is seriously threatened of long-term overexploitation andhas been listed on the IUCN (International Union for Conservation of Nature’s) red list since1998. Therefore, the elucidation of its genetic diversity is imperative for conservation and breedingpurposes. In this study, we evaluated the genetic diversity of 42 wild D. odorifera trees from sevenpopulations covering its whole native distribution. In total, 19 SSR (simple sequence repeat) markersharbored 54 alleles across the 42 samples, and the medium genetic diversity level was inferredby Nei’s gene diversity (0.36), observed (0.28) and expected heterozygosity (0.37). Among theseven wild populations, the expected heterozygosity (He) varied from 0.31 (HNQS) to 0.40 (HNCJ).The analysis of molecular variance (AMOVA) showed that only 3% genetic variation existedamong populations. Moderate population differentiations among the investigated populationswere indicated by pairwise Fst (0.042–0.115). Structure analysis suggested two clusters for the42 samples. Moreover, the seven populations were clearly distinguished into two clusters fromboth the principal coordinate analysis (PCoA) and neighbor-joining (NJ) analysis. Populations fromHaikou city (HNHK), Baisha autonomous county (HNBS), Ledong autonomous county (HNLD),and Dongfang city (HNDF) comprised cluster I, while cluster II comprised the populations fromWenchang city and Sansha city (HNQS), Changjiang autonomous county (HNCJ), and Wuzhisancity (HNWZS). The findings of this study provide a preliminary genetic basis for the conservation,management, and restoration of this endemic species.
Keywords: Dalbergia odorifera T. Chen; genetic diversity; population structure; EST-SSR marker;microsatellite marker; rosewood; conservation
1. Introduction
Dalbergia odorifera T. Chen, formerly named Dalbergia hainanensis Merr. et Chun, is endemic toHainan province, southern China. It is a semi-deciduous perennial tree species (diploid) of predominantoutcrossing in the Fabaceae family and one of the most valuable timber species in China. Dalbergiaodorifera is restricted to relatively narrow tropical geographic areas in Hainan Island at altitudesbelow 600 m. Obviously, the development of D. odorifera plantations is required to alleviate the
Forests 2019, 10, 225; doi:10.3390/f10030225 www.mdpi.com/journal/forests39

Forests 2019, 10, 225
demand for this valuable wood, but so far no breeding systems have been established. In the 1950s,it was introduced to the subtropical areas of Guangdong, Guangxi, and Fujian provinces in China [1].Following several decades, the introduced trees now exhibit a satisfactory growth performance, andhave even formed valuable heartwood at most sites [1].
The heartwood of this species, locally known as “Hualimu” or “Huanghuli” (Chinese name),takes more than 50 years to mature. It is one of the most precious fragrant rosewoods with a high valueon the furniture and craft markets (especially for luxury furniture and crafts) in China. As a sourceof traditional Chinese medicine, it is also known as “Jiangxiang”, and contains a series of chemicalcomponents, such as flavonoid [2], phenolic [3], and sesquiterpene derivatives [4–6], which playimportant roles in the pharmaceutical industry for treatment of cardiovascular diseases [7], cancer,diabetes [8], blood disorders, ischemia, swelling, and rheumatic pain [9,10]. Due to its high medicinaland commercial value, D. odorifera has been overexploited for a long time and has been listed on theIUCN (International Union for Conservation of Nature’s) red list by World Conservation MonitoringCentre (WCMC) since 1998 [11]. As a result, the species became rare, only limited numbers ofindividuals are found in parts of their original habitat, which was highly fragmented in the remainingforests in Hainan Island [12]. Therefore, a comprehensive survey is urgently needed to obtaininformation on the levels and patterns of genetic variation for D. odorifera. Such information isimperative for establishing an effective strategy for conservation and breeding purposes.
Molecular markers are often used to elucidate genetic variation in tree species [13]. However,in D. odorifera there are very few studies conducted using DNA molecular markers [12,14]. Comparedto other molecular markers, microsatellite (simple sequence repeat, SSR) markers are the ideal choicesfor studying the genetic composition of wild populations because of their co-dominant characterand high variability [15,16]. The use of microsatellite markers to analyze the genetic diversity ofD. odorifera can provide an invaluable means for conservation and protection of this endangered species.Moreover, the developments of SSR markers have been innovated by next-generation sequencingbased on transcriptomes (RNA-seq), especially for species without a reference genome [17–19].This approach has been applied for SSR identification, development, and association studies in manytree species [20–22]. In the present study, we applied this approach and developed 19 polymorphicSSR markers specific for D. odorifera. The main objectives of this study were to use these developed SSRmarkers to evaluate the genetic diversity of wild D. odorifera populations, and find out the causes forthe endangered and fragmented status of this species. The findings of this study will provide usefulgenetic information for conservation and breeding strategies in D. odorifera.
2. Materials and Methods
2.1. Plant Materials and DNA Extraction Materials and Methods
In total, 42 wild individuals representing seven D. odorifera populations were sampled from thewhole Hainan Island of China (Figure 1, Table 1). We sampled all the trees with a diameter at breastheight (DBH) larger than eight cm, and the 42 individuals were the last remaining resources. Ten leaveswere collected from each individual and sealed in plastic bags with desiccants. Total genomic DNAwas extracted for each sample using the Hi-DNAsecure Plant Kit (Tiangen, Beijing, China) accordingto the manufacturer’s instructions. The quality and quantity of DNAs were determined by NanoDrop2000 (Thermo Scientific, Wilmington, DE, USA).
40

Forests 2019, 10, 225
Table 1. Geographical location of seven investigated D. odorifera populations in Hainan Island of China.
Population Size Origin Status Altitude (m) Latitude (N) Longitude (E)
HNQS 7 Wenchang city andSansha city Wild, Qiong mountain 20–80 19◦37′–19◦53′ 110◦19′–110◦23′
HNHK 3 Haikou city Wild, strand plain 10–80 20◦04′–20◦32′ 110◦21′–109◦21′
HNBS 5 Baisha autonomouscounty Wild, Li mu mountain 150–250 19◦12′–19◦23′ 109◦7′–109◦24′
HNDF 5 Dongfang city Wild, strand plain 5–100 19◦6′–19◦17′ 108◦37′–108◦39′
HNLD 7 Ledongautonomous county Wild, Jianfeng mountain 35–80 18◦34′–18◦42′ 108◦49′–109◦08′
HNCJ 5 Changjiangautonomous county Wild, Bawang mountains 125–185 19◦4′–19◦08′ 109◦03′–109◦12′
HNWZS 10 Wuzhisan city Wild, Wuzhisan mountain 60–150 18◦48′–18◦53′ 109◦30′–109◦67′
Figure 1. Geographic location of seven investigated D. odorifera populations collected from HainanIsland in China. P-HNQS—population of Wenchang city and Sansha city in Hainan province,P-HNHK—population of Haikou city, P-HNBS—population of Baisha city, P-HNDF—populationof Dongfang city, P-HNLD—population of Ledong autonomous county, P-HNCJ—population ofChangjiang autonomous county, P-HNWZS—population of Wuzhisan city. The pie charts estimatedgenetic structure of the seven populations based on STRUCTURE analysis with cluster number of two,in each chart, different color represents a different cluster accounted in each population.
2.2. RNA Sequencing and Data Deposition
To develop protocols, three leaves from three trees (H27, H98, and H100) were collected from threedifferent populations of Haikou city (HNHK), Dongfang city (HNDF), and Changjiang autonomouscounty (HNCJ), respectively, and immediately put into liquid nitrogen. RNA extraction and sequencing
41

Forests 2019, 10, 225
were done by Beijing Novogene Biological Information Technology Co., Ltd., Beijing, China (http://www.novogene.com/). The sequence data were deposited in the database of SRA (Sequence ReadArchive) at the National Center for Biotechnology Information (NCBI, https://www.ncbi.nlm.nih.gov/), under accession number SRP175426, and SRR8398210, SRR8398212, and SRR8398211 were thethree biosample accession numbers for H27, H98, and H100, respectively [23].
2.3. SSR Identification and Marker Development
The software of MISA (MIcro SAtellite; http://pgrc.ipk-gatersleben.de/misa) was employedto detect, locate, and identify SSR loci. The minimum number of motifs used to select the SSRwas ten for mono-nucleotide repeats, and six for di-nucleotide motifs, five for tri-, tetra-, penta-,and hexa-nucleotide repeats. Primers were designed using Primer 3.0 software [24] using defaultsettings with the following criteria: Predicted primer lengths of 18–24 bases, GC content of 40%–60%,annealing temperature of 56–62 ◦C, and predicted product sizes of 150–300 bp.
2.4. Validation of SSR Marker by PCR and Capillary Electrophoresis
Subsequently, DNAs from three samples (randomly selected from 42 individuals) were usedto validate the 192 randomly selected SSR loci (exclude mononucleotide repeats) with the designedprimers. PCR reactions were performed in 15 μL final volume, containing 10.25 μL water, 1.5 μL10 x DNA polymerase buffer, 1.5 μL MgCl2 (25 mM), 0.3 μL dNTPs (10 mM each), 0.15 μL of eachprimer at 10 μM, 0.3 μL Taq polymerase at 5 units/μL (TaqUBA), and 1 μL of genomic DNA (40–50 ng).Totally 35 cycles of 94 ◦C for 15 s, appropriate annealing temperature for 15 s, and 72 ◦C for 30 s wereperformed, following the pre-denaturation at 94 ◦C for 3 min. PCR products of clear, stable, and specificbands with an expected length (100–350 bp) were considered as successful PCR amplifications.All the PCR reactions were repeated at least once. Finally, 22 SSR markers were randomly selectedfrom the successful ones and used to analyze 42 samples. Their diluted PCR products mixed with12.5 Hi-Di formamide and 0.25 μL size standard (Shanghai Generay Biotech Co., Ltd., Shanghai, China)were separated by capillary electrophoresis, and genotyped with an ABI 3730 Genetic Analyzer(Applied Biosystem, Foster, CA, USA) at Shanghai Generay Biotech Co., Ltd., Shanghai, China(http://www.generay.com.cn). Peak identification and fragment sizing were done using Gene Mapperv4.0 (Applied Biosystems, Foster, CA, USA) with default settings.
2.5. Statistical Analysis
The frequency of null alleles (FNA) and scoring errors were estimated using the Micro-checkersoftware 2.2.3 [25]. POPGENE v1.3.1 software [26] was used to estimate the following geneticdiversity parameters: Allele frequency, observed number of alleles (Na), effective number of alleles(Ne), expected and observed heterozygosities (He and Ho, respectively), Nei’s gene diversity(GD), the percentage of polymorphic loci (PPB), and Wright’s fixation index (F) and gene flow(Nm). The polymorphism information content (PIC) was calculated for each locus using the onlineprogram PICcalc [27]. F-statistics, including inbreeding coefficient within individuals (FIS), geneticdifferentiation among populations (FST), were computed using GenAlEx version 6.5, so were thepairwise Fst, pairwise G’ST (Hedrick’s standardized genetic differentiation index, adjusted for bias) [28].Hardy-Weinberg equilibrium (HWE) was evaluated using chi-squared tests for each population atindividual loci [26]. The Ewens-Watterson test for neutrality at each locus was performed usingPOPGENE v1.3.1 [26]. Hierarchical analyses of molecular variance (AMOVA) were conducted usingGenAlEx version 6.5 [28].
The genetic structure of the investigated populations was analyzed using STRUCTURE 2.0 [29].The number of discontinuous K was estimated from one to seven with 20 replicates, both lengthof burn-in period and value of MCMC (Markov chain Monte Carlo) were set to 100,000 times [30].The true value of clusters (K) were harvested online (http:taylor0.biology.ucla.edu/struct_harvest/)according to the highest mean of estimated lnP(D) (log probability of data) and lnP(D)-derived
42

Forests 2019, 10, 225
delta K value [31]. Repeated sampling analysis and the genetic structural plot were performedby CLUMPAK [32]. To summarize the patterns of variation in the multi-locus dataset, principalcoordinate analysis (PCoA) was performed using GenAlEx version 6.5 software based on pairwise G’ST
matrix. Next, Mantel tests were carried out between matrixes of pairwise G’ST and geographic andgenetic distance (Nei’s unbiased genetic distance) using GenAlEx version 6.5 software, respectively.Additionally, a Neighbor-Joining (NJ) tree based on Nei’s unbiased genetic distance was drawn inMEGAX [33].
3. Results
3.1. Distribution of SSR Loci in D. odorifera
In total, 35,774 potential SSR loci were identified and distributed in 26,880 unigenes, of which6629 (24.7%) contained more than one SSR locus (Table S1). The SSR loci distributed in the leaftranscriptome were of a frequency of 1/2.18 kb. According to the unevenly distributed prediction(Figure S1), mono-nucleotide repeat motifs were the most frequent (21,623, 60.44%), followed by di-(7612, 21.28%) and tri-nucleotide (6112 or 17.09%) repeat motifs. These three motifs represented 98.81%in all, whereas only 40 and 14 penta- and hexa-nucleotide repeat motifs were found, respectively.
3.2. Development of Polymorphic SSR Markers
We randomly selected 192 SSR loci and designed primers to test the specificity of amplificationfor three samples and the informative nature of these SSR markers. Of these, 104 pairs of primers(54.2%) either did not give any amplification products or gave unexpected products, while 88 (45.8%)produced clear amplicons with the expected size of 100–350 bp. Next, 22 of the 88 primers wererandomly selected for polymorphism detection and 19 (86.4%) showed polymorphism (Table 2).Further information on these validated 88 SSR markers, including ID of cDNA sequence, SSR type,repeat motif, position in template sequence, primer sequence, annealing temperature, and expectedamplicon length (for developing alternative primers if desired) is available in Table S2. Among thepolymorphic SSR loci, three (15.79%) were confirmed to locate in coding sequences (CDSs), six (31.58%)in 5′-untranslated regions (5′UTRs), and three (15.79%) in 3′-untranslated regions (3′UTRs).
3.3. Polymorphism of 19 SSR Loci
In total, 19 SSR loci harbored 54 alleles across the 42 D. odorifera samples (File S1), the numberof alleles detected per locus was in a range of two to five, with an allele frequency range of 0.01–0.99(Table 3, Table S3). The largest number of alleles (five) was detected at locus S21, which also harboredthe largest effective number of alleles (Ne, 2.79), expected heterozygosity (He, 0.65), Nei’s gene diversity(GD, 0.64), and polymorphic information contents (PIC, 0.60). In terms of the overall PIC, both S09and S21 were highly informative with PIC values higher than 0.50, while S02, S12, S23, S26, and S27were less informative with PIC values smaller than 0.25, and the remaining 12 loci were moderatelyinformative with PIC values between 0.25 and 0.50. The average of Wright’s fixation index (F) was0.16, ranging from −0.19 (S22) to 0.44 (S24). Furthermore, null alleles were found at loci S04, S09,S21, S24, and S29. Six loci (S04, S08, S09, S24, S27, and S29) showed significant deviations from theHardy-Weinberg equilibrium across the 42 D. odorifera individuals. Additionally, all the 19 SSR lociwere selectively neutral according to the Ewens-Watterson test for neutrality (Table S4).
43

Forests 2019, 10, 225
Ta
ble
2.
Cha
ract
eris
tics
of19
SSR
(sim
ple
sequ
ence
repe
at)m
arke
rsde
velo
ped
for
D.o
dori
fera
.
Lo
cus
IDR
ep
ea
tM
oti
fF
orw
ard
Pri
me
r(5
′ -3′ )
Re
ve
rse
Pri
me
r(3
′ -5′ )
Pro
du
ctS
ize
(bp
)S
SR
Po
siti
on
Tm
(◦C
)
S01
c102
105_
g1(A
TA)6
AG
TCC
CG
CC
CA
CA
AA
ATC
AT
CTG
GTC
AG
TCA
TTC
CC
CC
AC
252–
258
Unk
now
n60
S02
c117
54_g
1(A
AG
)6G
GTC
CC
TGA
CTC
AC
TGA
AG
CC
AA
CC
TCTC
TCTG
CA
GA
AC
CA
269–
275
5′U
TR
60S0
3c1
204_
g1(A
TA)6
GC
AC
GTG
GTC
AA
AG
CA
ATC
AA
TGA
GC
CC
CTT
CTG
CA
CT
TC
263–
266
Unk
now
n60
S04
c258
68_g
1(G
AT)
6G
CTG
TGG
AG
TCA
CG
TTC
TCA
TCC
CC
AC
AG
AA
TCA
CA
AG
CC
278–
287
3′U
TR
60S0
7c2
9390
_g1
(CC
T)6
GC
CA
ATG
AC
ATA
ATG
GG
CG
GTG
CA
GA
GA
GTC
AG
GA
GC
TC
T22
6–22
9C
DS
60S0
8c3
1361
_g1
(TG
T)6
GG
AA
GA
GA
AA
TGG
AG
GG
TAG
CT
TGC
CA
GA
CA
AC
CA
GA
ATG
CT
305–
320
Unk
now
n60
S09
c334
97_g
1(C
AT)
6A
CC
CTC
CTC
CTC
CA
CC
TTTT
AC
CG
GC
TTC
AG
TGA
TTG
GT
T23
0–23
95′
UT
R60
S10
c401
72_g
1(T
GC
)7C
AC
GTA
CC
CA
AC
CG
TCA
AG
ATC
CG
AC
GA
CC
AC
CTA
ATC
CT
261–
273
5′U
TR
60S1
1c4
0452
_g1
(ATC
)6A
AA
AA
GC
GA
GG
AC
TAC
GG
CA
TGG
AG
AA
GC
AG
TGC
TCG
TT
T22
4–22
7U
nkno
wn
60S1
2c3
4672
_g2
(GA
T)7
GG
TGA
AC
AA
GC
TGG
AG
TGG
AA
AG
CC
CA
GC
ATC
TAA
AC
CC
C25
9–27
1C
DS
60S2
1c5
6000
_g1
(TC
CC
)6G
AG
CC
TTG
AG
TTC
AC
CTC
CC
TTG
GG
TGTG
AG
ATT
GA
GG
GC
238–
250
5′U
TR
60S2
2c5
3146
_g1
(TC
)10
CC
AC
CG
ATC
TTA
AC
CTC
CG
GA
CTA
CA
AG
TGC
GTG
TGA
CC
C25
4–26
0U
nkno
wn
60S2
3c5
6684
_g2
(TC
)10
TGG
CG
TTG
AC
TTC
CA
GC
ATT
GA
GC
AG
TGTC
AG
CA
TGA
TG
C27
8–28
03′
UT
R60
S24
c590
01_g
1(C
TA)7
GC
TGC
AA
ATG
CC
AG
TGC
TTA
CG
CTG
TTG
TCA
GTG
CA
TTG
G23
2–24
1U
nkno
wn
60S2
6c6
0831
_g5
(GTT
)7C
CA
ATC
CC
AC
CA
GTG
AG
GA
GG
CA
GC
AC
CTC
TGA
GA
CA
AG
T24
1–24
7C
DS
60S2
7c4
9315
_g1
(TA
C)7
GA
AC
CTT
TCC
TTC
TGC
GC
CT
CC
TATG
AA
GC
GTG
TGC
AT
GC
266–
272
3′U
TR
60S2
8c6
3495
_g1
(TA
C)7
AC
AG
CA
TTTG
TGTT
TGTG
CA
CA
GC
TGC
GC
TCTC
ATT
CC
TA24
6–24
9U
nkno
wn
60S2
9c5
7231
_g1
(TA
T)7
TCC
CC
GTT
CC
TCTC
TCTC
AG
GG
AC
TGTC
AC
ATG
GC
AC
TC
A15
0–16
85′
UT
R60
S30
c483
04_g
3(T
GT)
7TG
CC
TTG
ATC
CG
CTG
AG
ATC
TCC
CA
AA
ATC
GA
TGC
AA
AG
CA
246–
258
5′U
TR
59
44

Forests 2019, 10, 225
Table 3. Diversity statistics of the 19 SSR loci across 42 D. odorifera samples.
Locus Na Ne Ho He GD PIC FST Nm F FNA PHWEa
S01 3 1.99 0.38 0.50 0.50 0.41 0.08 2.79 0.23 0.08 0.108 nsS02 2 1.05 0.05 0.05 0.05 0.05 0.07 3.58 −0.02 0.00 0.874 nsS03 2 1.80 0.38 0.45 0.44 0.35 0.16 1.30 0.14 0.04 0.355 nsS04 3 1.71 0.29 0.42 0.42 0.37 0.11 2.08 0.31 0.09 * 0.002 **S07 2 1.83 0.36 0.46 0.45 0.35 0.12 1.85 0.21 0.07 0.173 nsS08 4 1.38 0.24 0.28 0.27 0.26 0.05 4.68 0.13 0.03 0.001 **S09 3 2.57 0.36 0.62 0.61 0.54 0.17 1.22 0.42 0.16 * 0.001 ***S10 3 1.97 0.48 0.50 0.49 0.44 0.09 2.65 0.03 0.01 0.412 nsS11 2 1.75 0.38 0.43 0.43 0.34 0.14 1.48 0.11 0.03 0.481 nsS12 2 1.21 0.14 0.17 0.17 0.16 0.13 1.70 0.17 0.03 0.268 nsS21 5 2.79 0.45 0.65 0.64 0.60 0.10 2.20 0.30 0.12 * 0.067 nsS22 4 1.56 0.43 0.36 0.36 0.33 0.11 1.96 −0.19 −0.05 0.793 nsS23 2 1.02 0.02 0.02 0.02 0.02 0.06 3.79 −0.01 0.00 0.938 nsS24 3 2.05 0.29 0.52 0.51 0.46 0.22 0.87 0.44 0.15 * 0.002 **S26 2 1.02 0.02 0.02 0.02 0.02 0.09 2.63 −0.01 0.00 0.938 nsS27 3 1.27 0.21 0.21 0.21 0.19 0.09 2.42 −0.01 0.00 0.032 *S28 2 1.80 0.26 0.42 0.44 0.35 0.10 2.19 0.25 0.08 0.105 nsS29 4 1.71 0.26 0.42 0.42 0.35 0.12 1.75 0.37 0.11 * 0.000 ***S30 3 1.81 0.33 0.45 0.45 0.37 0.03 7.77 0.25 0.08 0.135 ns
Mean 2.84 1.70 0.28 0.37 0.36 0.31 0.11 2.58 0.16 0.03
Na—observed number of alleles, Ne—effective number of alleles, Ho—observed heterozygosity, He—expectedheterozygosity, GD—Nei’s gene diversity, PIC—polymorphic information content, FST—genetic differentiationcoefficient, Nm—Gene flow, estimated from Fst, Nm = [(1/Fst) − 1]/4, F Wright’s (1978) fixation index,FNA—frequency of null alleles, * p < 0.05, likely contained null alleles, PHWE
a p-value for deviation fromHardy-Weinberg equilibrium: ns not significant, * p < 0.05, ** p < 0.01, *** p < 0.001.
3.4. Genetic Diversity in D. odorifera
Among the seven populations investigated, the number of polymorphic loci varied from 13 to17, along with the percentage of polymorphic loci (PPB) from 68.42% to 89.47% (Table 4). Presentingthe largest PPB, population HNLD also had the largest alleles number of 46 (Alleles), whereasHNHK, with the smallest PPB, had the smallest number of 35 (Alleles). In total, eight private allelesappeared among the investigated populations, of which, three appeared in HNDF, two in HNLD,and one in HNQS, HNBS and HNWZS, respectively. The observed heterozygosity (Ho) ranged from0.24 (HNWZS) to 0.38 (HNDF) and expected heterozygosity (He) from 0.31 (HNQS) to 0.40 (HNCJ),with an average of 0.28 and 0.37, respectively. At the population and species level, the expected (He)heterozygosity was 0.36 and 0.37, respectively. Additionally, population HNCJ possessing the highestgenetic diversity level (He, 0.40) also showed the largest value of Nei’s gene diversity (0.36).
Table 4. Summary of different D. odorifera population diversity statistics averaged over the 19 SSR loci.
Population Size Alleles Na Ne Np Ho He GD FIS PPB %
HNQS 7 40 2.11 1.52 1 0.25 0.31 0.28 0.09 73.68HNHK 3 35 1.84 1.54 0 0.26 0.34 0.28 0.00 68.42HNBS 5 40 2.11 1.69 1 0.31 0.36 0.32 0.02 78.95HNDF 5 41 2.16 1.59 3 0.38 0.37 0.33 −0.11 89.47HNLD 7 46 2.42 1.64 2 0.26 0.38 0.35 0.20 89.47HNCJ 5 40 2.11 1.77 0 0.36 0.40 0.36 −0.03 78.95
HNWZS 10 44 2.32 1.63 1 0.24 0.34 0.33 0.22 78.95Mean 5.25 40 2.15 1.63 - 0.29 0.36 0.32 0.06 79.70Total a 42 b 56 2.84 1.70 - 0.28 0.37 0.36 0.21 100.00
Population see Table 1, Size—number of sampled individuals, Alleles—total number of detected alleles,Na—observed mean number of alleles, Ne—mean effective number of alleles, Np—number of private alleles,Ho—observed heterozygosity, He—expected heterozygosity, GD—Nei’s gene diversity, FIS—inbreeding coefficient,PPB %—the percentage of polymorphic loci, a diversity indices averaged over the 19 loci across all D. odoriferapopulations, b total number of sampled individuals.
45

Forests 2019, 10, 225
Both AMOVA and pairwise Fst analysis were performed to investigate the genetic variationsamong these populations. The AMOVA analysis was conducted without grouping the investigatedpopulations (population HNHK was not in this analysis for individuals below five). The resultshowed that only 3% of the total genetic variation occurred among populations, and 20% of thewithin population variation was due to the heterozygosity of the individuals within each population(Table 5). The overall FST was very small (0.03, Table 5), the overall gene flow was 2.58 (Nm) estimatedamong all these populations (Table 3). Furthermore, the pairwise Fst ranged from 0.042 to 0.115(Table 6). The highest level appeared between populations HNQS and HNDF (0.115), whereas thelowest appeared between HNLD and HNCJ (0.042).
Table 5. Analysis of molecular variance (AMOVA) for six populations of D. odorifera.
Source d.f. Sum of Square Mean of SquareVariance
ComponentsPercentageof Variation
FST FIS
Among populations 5 27.864 5.573 0.111 3%Within populationsAmong Individuals 33 136.893 4.148 0.715 20%Within Individuals 39 106.000 2.718 2.718 77%
Total 77 270.756 3.544 100% 0.03 * 0.21 ***
d.f. degrees of freedom, population HNHK was not in this analysis for individuals below five, FST and FIS is basedon standard permutation across the full data set, * p < 0.05, *** p < 0.001.
Table 6. Pairwise Genetic Differentiation Index (Fst) between the seven populations.
Population HNQS HNHK HNBS HNDF HNLD HNCJ HNWZS
HNQSHNHK 0.088HNBS 0.095 0.055HNDF 0.115 0.090 0.062HNLD 0.074 0.055 0.043 0.051HNCJ 0.071 0.100 0.087 0.090 0.042
HNWZS 0.061 0.078 0.051 0.051 0.044 0.054
Population see Table 1.
3.5. Population Structure of D. odorifera
An admixture model-based approach was implemented to evaluate the population structureof the 42 D. odorifera individuals. The optimum cluster number (K) of the investigated populationswas two, with the largest values of both ln P(D) (log probability of data, −978) and delta K (15)harvested from the STRUCTURE HARVESTER website (Figure 2a,b). Based on K of two, a graphicrepresentation of estimated membership coefficients of each individual was exhibited in Figure 2c.Each color showed the proportion of membership of each individual, represented by a vertical line,to the two clusters. The individual with the probability higher than a score of 0.75 was considereda pure one, and lower than 0.75 an admixture one. In this analysis, the yellow cluster included17 individuals with 14 pure and 3 admixture ones, while the blue cluster included 25 individuals with14 pure and 11 admixture ones. However, only HNBS and HNDF entirely consisted of individualsfrom the blue cluster, other populations consisted of individuals from both clusters.
The pairwise G’ST matrix was used for the principal coordinate analysis (PCoA). The first andsecond axis explained 63.25% and 22.13% of the variance within the molecular data, respectively(Figure 3a). Two clusters were clearly distinguished by PCoA analysis: Populations from HNHK,HNBS, HNLD and HNDF were grouped as cluster I, the other three populations (HNQS, HNCJ andHNWZS) grouped as cluster II. Moreover, the NJ (Neighbor-joining) dendrogram tree showed similarresults based on Nei’s unbiased genetic distance among the investigated populations (Figure 3b).
46

Forests 2019, 10, 225
Figure 2. Results of STRUCTURE analysis for 42 D. odorifera individuals based on microsatellite data.(a) Estimation of population using mean of estimated lnP(D) (log probability of data) with clusternumber (K) ranged from one to seven. (b) Estimation of population using lnP(D)-derived delta K withcluster number (K) ranged from one to seven. (c) Estimated genetic structure of the seven populationsbased on STRUCTURE analysis with cluster number (K) of two. In each plot, different color representsa different cluster and black segments separate the populations.
Figure 3. Relationships among the seven wild D. odorifera populations in Hainan Island. (a) Principalcoordinate analysis (PCoA) based on pairwise G’ST (Hedrick’s standardized Gst, analog of Fst, adjustedfor bias), Coord.1 (63.25%): The first principal coordinate, explained 63.25% of variation; Coord.2(22.13%): The second principal coordinate, explained 22.13% of variation. (b) Neighbour-joining (NJ)tree based on Nei’s unbiased genetic distance among seven populations of D. odorifera in Hainan Island.
47

Forests 2019, 10, 225
Subsequently, Mantel tests between the matrixes of pairwise G’ST and geographic distance(Figure 4a) and genetic distance (Figure 4b) were carried out, respectively. The results showed thatgenetic differentiations among the investigated populations were more attributed to the geneticdistance (91.2%, Figure 4b) rather than to the geographic distance (27.7%, Figure 4a). Hence, there wasno clear geographic origin-based structuring, or predominate isolation by distance among theinvestigated populations.
Figure 4. Mantel tests for pairwise G’ST matrix correspondence on relationships between geographicand genetic distance for D. odorifera populations in Hainan Island. (a) Relationships between pairwiseG’ST and geographic distance. There is a positive relationship between the two elements (Rxy: 27.7%,p < 0.05). (b) Relationships between pairwise G’ST and Nei’s unbiased genetic distance. There isa positive relationship between the two elements (Rxy: 91.2%, p < 0.05).
4. Discussion
4.1. Development of SSR Marker for D. odorifera
Measuring levels of genetic diversity within and among populations is essential to understandthe adaptability to environments of a species, in particular for conservation studies to explore thecauses of rare and/or endangered plant species [34]. However, reports on the genetic diversity ofD. odorifera is scarce, as a shortage of molecular markers restricted to six RAPD (random amplifiedpolymorphic DNA) [12] and 25 SRAP (sequence-related amplified polymorphism) [14] loci. The useof such dominant markers could give a biased estimation of genetic variation when populationsare not in the Hardy-Weinberg equilibrium [35], which may be true for the D. odorifera fragmentedpopulations. In the present study, six loci showed significant deviations from the Hardy-Weinbergequilibrium. Therefore, the development of co-dominant SSR markers for D. odorifera is of great use forgenetic studies. In this study, we have identified 35,774 putative SSR loci from the leaf transcriptome
48

Forests 2019, 10, 225
dataset, substantially more than those reported for other legume species such as 5956 in Prosopis albaGriseb. [36], 5710 in Millettia pinnata (L.) Panigrahi [18], and 7493 in Mucuna pruriens (L.) DC. [37].In addition, the dominant repeats and motif types of SSR also vary among the transcriptomes fromdifferent species. These differences may be attributable to different genome structure and compositionin these species.
The effectiveness and success of SSR development rely considerably on the quality and theaccuracy of the sequence data [38]. Therefore, the identified SSR loci need to be further validated.Of the 192 primer pairs selected, 45.8% (88) yielded the expected amplicons for each locus, indicatingthat no introns presented within the amplified regions. From those validated SSR markers, 22 wererandomly selected for polymorphism detection, of which 86.4% (19) exhibited polymorphism amongthe 42 wild D. odorifera trees. The PIC content provides an estimation of the information content oflocus. The average PIC value of these newly developed SSR markers is 0.31, which is comparable toor lower than that in other legumes, such as Vigna umbellata (Thunb.) Ohwi & Ohashi (0.2898) [39],Mucuna pruriens (L.) DC. (0.24) [37], and Melilotus species (0.79) [40], but relatively higher than thatbased on ISSR (inter simple sequence repeat) and RAPD markers in other Dalbergia species, such asDalbergia cochinchinensis Pierre ex Laness (ISSR 0.101; RAPD 0.088) [41] and Dalbergia oliveri Prain (ISSR0.147; RAPD 0.116) [42]. Both high and low allelic PIC value markers are useful for genetic diversity toavoid a biased estimation [43,44]. Therefore, these SSR markers developed in our present study appearto be useful for genetic studies of D. odorifera populations.
4.2. Genetic Diversity of D. odorifera
Genetic diversity is essential to the long-term survival of species and plays an important rolein the genetic improvement through breeding programs. However, limited information on geneticdiversity of D. odorifera is available. Prior to the present study, only one report has been conductedusing six RAPD markers, indicating medium genetic diversity level (six populations) inferred by thepercentage of polymorphic loci (PPB) of 54.55% and Nei’s gene diversity (GD) of 0.21 [12]. Comparedto which, our results exhibited a higher genetic diversity level with the higher values of 100% (PPB) and0.36 (GD) using the 19 newly developed SSR markers. These differences may be due to the differentnumbers [45] and types of molecular markers [16] used in the studies, or alternatively, due to thedifferent population sizes in the two studies.
Genetic diversity in wild plant species is often related to the geographic range, population size,longevity, mating system, migration, and balancing selection [34,45,46]. Higher genetic diversity isexpected to reflect a better adaption to the environments of a species [47]. However, the mediumgenetic diversity level of D. odorifera was indicated by the observed and expected heterozygosity of0.28 and 0.37, respectively. Most of studies have been concordant with the general trend or predictionthat species with narrow or endemic distributions maintain significantly lower levels of geneticdiversity than species with widespread distributions [48–51]. Notably, the native habitat of D. odoriferais restricted to small regions in Hainan Island. It is no wonder then that the genetic diversity values inthe present study are much smaller than those in wide spread tropical tree species such as Olea europaeaLinn. (12 SSR markers, Ho = 0.75, He = 0.6) [20], Prunus africana (Hook.f.) Kalkman (6 SSR markers,Ho = 0.68, He = 0.73) [52], and Eugenia dysenterica DC. (9 SSR markers, Ho = 0.545, He = 0.62) [53].However, the diversity of D. odorifera is even lower than in some rare and endemic tree specieslike Boswellia papyrifera (Del. ex Caill.) Hochst (He = 0.69) [54], D. cochinchinenesis (He = 0.55),and D. oliveri (He = 0.75) [55]. Similar observations were reported for Ottelia acuminate (He = 0.35,endemic to southwestern China) [56] and Dipterocarpus alatus Roxb. ex G.Don (He = 0.22, endemicto southeastern Vietnam) [57], resulting from the extensive reduction in population sizes caused byhuman disturbance. Similarly, due to the long-time over-logging for the valuable fragrant heartwood,the distributions of D. odorifera populations in Hainan Island have been dramatically reduced in thepast thirty years. The present populations were highly fragmented into subpopulations, each composedof only a few individuals and large trees are seldom [12]. This is consistent with the suggestion that
49

Forests 2019, 10, 225
the distribution-restricted plant species are associated with a relatively low genetic diversity primarilyfrom over-exploitation of their resources.
In the present study, the mean observed heterozygosity (0.28) was much lower than the meanexpected heterozygosity (0.37), and the Wright’s (1978) fixation index (F) was up to 0.16 across the42 wild trees (Table 3), indicating a modest heterozygote deficiency existed within the entire wilddistribution range for D. odorifera. This result may be attributed to the botanical characteristics ofD. odorifera, more specifically, to its complicated reproduction system which causes a relatively highinbreeding coefficient (Table 5) [58]. Dalbergia odorifera is a predominantly outcrossing species [12].Its flowers are entomophilous pollinated by small insects and fruits with flattened seedpods aredispersed by wind [59,60], which limits longer distance dispersal. Moreover, D. odorifera has the abilityof coppice regeneration especially stimulated by trunk injuries [12]. These characters are consistentwith a predominantly outcrossing mating system that includes at least some extent of inbreeding.Alternatively, it is due to the small populations in which mating between relatives occurred morefrequently than in large populations [61].
4.3. Genetic Differentiation and Population Structure
Woody species with predominately outcrossing tend to have less differentiation amongpopulations and high variation within populations [34]. Similarly, our AMOVA analysis showedthat most of the genetic variation was within the investigated populations of D. odorifera, while only3% genetic variation components existed among populations, which is much lower compared toother Dalbergia species (0.236, D. cochinchinensis; 0.126, D. oliveri) [55]. Genetic differentiation amongdifferent populations is strongly influenced by gene flow (Nm) and genetic drift [62]. For neutralgenes, the value of Nm below one indicates that genetic drift is a predominant factor affectingpopulation structure, whereas the value above four indicates that gene flow can replace a geneticdrift [48,63]. In the present study, the 19 SSR markers, which were selectively neutral according tothe results of the Ewens-Watterson test (Table S4), are excellent for investing the effects of gene flowand genetic drift, showing overall gene flow of 2.58 (Table 3). This relatively high gene flow couldcurtail parts of the dispersive effects caused by genetic drift, reducing the genetic variation amongpopulations while increasing the diversity within populations. However, the frequent migrationindicated by the relatively high gene flow was opposite to the fragmented distributions of theinvestigated populations, for which, the putative explanation may be that of frequent human actions,primarily due to overexploitation and illegal logging [12]. Similar observations were also found forAcer miaotaiense (P. C. Tsoong) [34] and Plectranthus edulis (Vatke) Agnew [47]. Additionally, a geneticdrift could not be ignored, since the population sizes are so small that any reduction in size couldresult in genetic drift.
Pairwise Fst was in a range of 0.042–0.115 (Table 6), suggested that moderate populationdifferentiation were found among these wild populations. The highest level of genetic differentiation(0.115) was found between populations HNDF and HNQS, and the distance between them was about220 km, which was matching with the indication that long-term isolation may limit the level ofgene flow between two populations [34]. However, the genetic differentiation level between HNLDand HNHK was only 0.055, the distance between them was also 220 km, which was opposite tothe indication. An admixture model-based approach was implemented to evaluate the populationstructure, and suggested two clusters were the best for the 42 D. odorifera trees. Similar results weregenerated from both neighbor-joining and PCoA analysis. They all distinguished the investigatedpopulations into two clusters—cluster I consisted of populations from Haikou city (HNHK), Baishaautonomous county (HNBS), Ledong autonomous county (HNLD), and Dongfang city (HNDF);while cluster II consisted of populations from Wenchang city and Sansha city (HNQS), Changjiangautonomous county (HNCJ), and Wuzhisan city (HNWZS). Moreover, genetic differentiation amongthe investigated populations showed positive relationships with both geographic distance (27.7%,Figure 4a) and genetic distance (91.2%, Figure 4b) distinguished by the Mantel tests, which was
50

Forests 2019, 10, 225
attributed more to the genetic distance rather than the geographic distance. Across all theseanalyses, no clear geographic origin-based structuring or predominant signs of “isolation by distance”were found, the present population structure of D. odorifera was more likely to be inferred byhuman activities.
4.4. Conservation
The main goal of conservation is to establish a suitable strategy for maintaining current geneticdiversity and ensuring the long-term evolution of an endangered species [64]. The current state of D.odorifera is: Medium genetic diversity level along with modest heterozygosity deficiency, low geneticdifferentiation, and really small population size. This pattern mainly results from extensive humanactivities, primarily due to the over-logging. Many necessary approaches have been implemented bythe Chinese government: (1) Dalbergia odorifera has been promoted to a second-grade state-protectedspecies and it is forbidden to exploit natural resources; (2) national parks and sanctuaries have beenestablished for in situ conservation covering almost every habitat in Hainan Island, such as HainanJianfengling national reservation, Bawangling national park, and Wangning Botany Park, etc. However,the population size of D. odorifera is still decreasing due to illegal-logging. Therefore, impactful ex situconservation strategies should be the best choice, to avoid the loss of genetic diversity due to illegallogging and increase the variability of progenies by “outcrossing” the trees available.
5. Conclusions
The present study provides an initial assessment on genetic diversity and structure of D. odoriferaconducted using 19 SSR markers. Medium genetic diversity at the species level and low geneticdifferentiations among populations were found in this endangered endemic tree species. This patternof genetic variation may be primarily caused by extensive human activities, and this informationcould be used in the establishment of conservation strategies of this endangered species. In addition,the large number of SSR loci may serve as tools for assisting breeding programs in future studies.
Supplementary Materials: The following are available online at http://www.mdpi.com/1999-4907/10/3/225/s1,Figure S1: SSR motifs distribution, Table S1: Summary of SSR identified from the transcriptome. Table S2: Detailsof 88 validate SSR markers. Table S3: Allele frequency distribution across 42 Dalbergia odorifera. Table S4:The Ewens-Watterson test for neutrality across 19 microsatellite loci in Dalbergia odorifera. File S1: Raw data. Zip,contains three files: file a: 1-Allele-PDF, Allele reports, captured all the peaks in **.pdf. (** locus code, S01-S30);file b: 2-Raw and Statistical data-Excel, the 42 samples are identified to the “SAMPLE” labeled in the Allele reports.Scored raw data in “Raw-S01-S30. xlsx”, then corrected the wrong captures and defined the allele series as integersto generate “S01-S30.xlsx” for statistics; file c: 3-Status of 42 wild D. odorifera trees.
Author Contributions: Data curation, Z.H. and N.Z.; formal analysis, F.L., H.J.; funding acquisition, Z.H., D.X.and N.Z.; investigation, N.Z. and Z.Y.; methodology, Z.H., D.X., X.L., Z.Y. and M.L.; project administration, Z.H.and D.X.; resources, X.L., H.J.; supervision, D.X.; writing—original draft, F.L.; writing—review & editing, F.L.and M.L.
Funding: This research was funded by Research Funds for the Central Non-profit Research Institution ofChinese Academy of Forestry (CAFYBB2017ZX001-4), National Natural Science Foundation of China (31500537),and Science Innovation Projects of Guangdong Province (2016KJCX009).
Acknowledgments: The authors are very grateful to Szmidt, A.E. (Department of Biology, Kyushu University)for the helpful comments on this manuscript.
Conflicts of Interest: The authors declare no conflict of interest.
References
1. Liu, X.; Xu, D.; Yang, Z.; Zhang, N. Geographic variations in seed germination of Dalbergia odorifera T. Chenin response to temperature. Ind. Crop. Prod. 2017, 102, 45–50. [CrossRef]
2. Lee, D.S.; Kim, K.S.; Ko, W.; Li, B.; Keo, S.; Jeong, G.S.; Oh, H.; Kim, Y.C. The neoflavonoid latifolin isolatedfrom MeOH extract of Dalbergia odorifera attenuates inflammatory responses by inhibiting NF-kappaBactivation via Nrf2-mediated heme oxygenase-1 expression. Phytother. Res. 2014, 28, 1216–1223. [CrossRef][PubMed]
51

Forests 2019, 10, 225
3. Wang, H.; Dong, W.H.; Zuo, W.J.; Wang, H.; Zhong, H.M.; Mei, W.L.; Dai, H.F. Three new phenoliccompounds from Dalbergia odorifera. J. Asian Nat. Prod. Res. 2014, 16, 1109–1118. [CrossRef] [PubMed]
4. Meng, H.; Chen, D.L.; Yang, Y.; Liu, Y.Y.; Wei, J.H. Sesquiterpenoids with cytotoxicity from heartwood ofDalbergia odorifera. J. Asian Nat. Prod. Res. 2018. [CrossRef] [PubMed]
5. Tao, Y.; Wang, Y. Bioactive sesquiterpenes isolated from the essential oil of Dalbergia odorifera T. Chen.Fitoterapia 2010, 81, 393–396. [CrossRef] [PubMed]
6. Wang, H.; Dong, W.H.; Zuo, W.J.; Liu, S.; Zhong, H.M.; Mei, W.L.; Dai, H.F. Five new sesquiterpenoids fromDalbergia odorifera. Fitoterapia 2014, 95, 16–21. [CrossRef] [PubMed]
7. Fan, Z.M.; Wang, D.Y.; Yang, J.M.; Lin, Z.X.; Lin, Y.X.; Yang, A.L.; Fan, H.; Cao, M.; Yuan, S.Y.; Liu, Z.J.; et al.Dalbergia odorifera extract promotes angiogenesis through upregulation of VEGFRs and PI3K/MAPKsignaling pathways. J. Ethnopharmacol. 2017, 204, 132–141. [CrossRef] [PubMed]
8. Lee, D.S.; Li, B.; Keo, S.; Kim, K.S.; Jeong, G.S.; Oh, H.; Kim, Y.C. Inhibitory effect of 9-hydroxy-6,7-dimethoxydalbergiquinol from Dalbergia odorifera on the NF-kappaB-related neuroinflammatory responsein lipopolysaccharide-stimulated mouse BV2 microglial cells is mediated by heme oxygenase-1.Int. Immunopharmacol. 2013, 17, 828–835. [CrossRef] [PubMed]
9. Choi, H.S.; Park, J.A.; Hwang, J.S.; Ham, S.A.; Yoo, T.; Lee, W.J.; Paek, K.S.; Shin, H.C.; Lee, C.H.; Seo, H.G.A Dalbergia odorifera extract improves the survival of endotoxemia model mice by inhibiting HMGB1 release.BMC Complement. Altern. Med. 2017, 17, 212. [CrossRef] [PubMed]
10. Wang, W.; Weng, X.C.; Cheng, D.L. Antioxidant activities of natural phenolic components from Dalbergiaodorifera T. Chen. Food Chem. 2000, 71, 45–49. [CrossRef]
11. Dalbergia Cochinchinensis. The IUCN Red List of Threatened Species. Available online: http://www.iucnredlist.org/details/32398/0 (accessed on 18 July 2018).
12. Yang, Q.X.; Feng, J.D.; Wei, J.H.; Li, R.T.; He, M.J. Genetic diversity of China’s endangered medicinalplant Dalbergia odorifera. World Sci. Technol. Mod. Tradit. Chin. Med. Mater. Med. 2007, 9, 73–79. Availableonline: http://kns.cnki.net/KCMS/detail/detail.aspx?dbcode=CJFQ&dbname=CJFD2007&filename=SJKX200702016&v=MTgxNzJGeUhuVmJ2TE5pZkFkckc0SHRiTXJZOUVZb1I4ZVgxTHV4WVM3RGgxVDNxVHJXTTFGckNVUkxLZVplZHE=(accessed on 20 June 2018).
13. Nybom, H. Comparison of different nuclear DNA markers for estimating intraspecific genetic diversity inplants. Mol. Ecol. 2004, 13, 1143–1155. [CrossRef] [PubMed]
14. Yang, Y.; Meng, H.; Wu, Y.; Chen, B.; Gan, B.C. Primer screening of SRAP molecular marker in Dalbergiaodorifera. Acta Agric. Jiangxi. 2011, 23, 29–31.
15. Fregene, M.A.; Suarez, M.; Mkumbira, J.; Kulembeka, H.; Ndedya, E.; Kulaya, A.; Mitchel, S.; Gullberg, U.;Rosling, H.; Dixon, A.G.O.; et al. Simple sequence repeat marker diversity in cassava landraces: Geneticdiversity and differentiation in an asexually propagated crop. Theor. Appl. Genet. 2003, 107, 1083–1093.[CrossRef] [PubMed]
16. Powell, W.; Morgante, M.; Andre, C.; Hanafey, M.; Vogel, J.; Tingey, S.; Rafalski, A. The comparison ofRFLP, RAPD, AFLP and SSR (microsatellite) markers for germplasm analysis. Mol. Breed. 1996, 2, 225–238.[CrossRef]
17. Dai, F.; Tang, C.; Wang, Z.; Luo, G.; He, L.; Yao, L. De novo assembly, gene annotation, and markerdevelopment of mulberry (Morus atropurpurea) transcriptome. Tree. Genet. Genomes. 2015, 11, 26. [CrossRef]
18. Huang, J.; Guo, X.; Hao, X.; Zhang, W.; Chen, S.; Huang, R.; Gresshoff, P.M.; Zheng, Y. De novo sequencingand characterization of seed transcriptome of the tree legume Millettia pinnata for gene discovery and SSRmarker development. Mol. Breed. 2016, 36, 75. [CrossRef]
19. Taheri, S.; Lee Abdullah, T.; Yusop, M.; Hanafi, M.; Sahebi, M.; Azizi, P.; Shamshiri, R. Mining anddevelopment of novel SSR markers using next generation sequencing (NGS) data in plants. Molecules2018, 23, 399. Available online: http://www.mdpi.com/1420-3049/23/2/399 (accessed on 2 January 2019).[CrossRef] [PubMed]
20. Dervishi, A.; Jakše, J.; Ismaili, H.; Javornik, B.; Štajner, N. Comparative assessment of genetic diversity inAlbanian olive (Olea europaea L.) using SSRs from anonymous and transcribed genomic regions. Tree Genet.Genomes 2018, 14. [CrossRef]
21. Dong, M.; Wang, Z.; He, Q.; Zhao, J.; Fan, Z.; Zhang, J. Development of EST-SSR markers in Larixprincipis-rupprechtii Mayr and evaluation of their polymorphism and cross-species amplification. Trees 2018.[CrossRef]
52

Forests 2019, 10, 225
22. Li, N.; Zheng, Y.; Ding, H.; Li, H.; Peng, H.; Jiang, B.; Li, H. Development and validation of SSR markersbased on transcriptome sequencing of Casuarina equisetifolia. Trees-Struct. Funct. 2018, 32, 41–49. [CrossRef]
23. Liu, F.-M.; Hong, Z.; Yang, Z.-J.; Zhang, N.-N.; Liu, X.-J.; Xu, D.-P. De novo transcriptome analysis of Dalbergiaodorifera and transferability of SSR markers developed from the transcriptome. Forests 2019, 10, 98. Availableonline: http://www.mdpi.com/1999-4907/10/2/98 (accessed on 28 January 2019). [CrossRef]
24. Untergasser, A.; Cutcutache, I.; Koressaar, T.; Ye, J.; Faircloth, B.C.; Remm, M.; Rozen, S.G. Primer3–newcapabilities and interfaces. Nucleic Acids Res. 2012, 40, e115. [CrossRef] [PubMed]
25. Van Oosterhout, C.; Hutchinson, W.F.; Wills, D.P.M.; Shipley, P. Micro-checker: Software for identifying andcorrecting genotyping errors in microsatellite data. Mol. Ecol. Notes 2004, 4, 535–538. [CrossRef]
26. Popgene, Version 1.32; The User-Friendly Shareware for Population Genetic Analysis Molecular Biology andBiotechnology Center. University of Alberta Edmonton. Available online: http://www.ualberta.ca/~{}fyeh(accessed on 23 November 2017).
27. Nagy, S.; Poczai, P.; Cernák, I.; Gorji, A.M.; Hegedus, G.; Taller, J. PICcalc: An online program to calculatepolymorphic information content for molecular genetic studies. Biochem. Genet. 2012, 50, 670–672. [CrossRef][PubMed]
28. Peakall, R.; Smouse, P.E. GenAlEx 6.5: Genetic analysis in Excel. Population genetic software for teachingand research—An update. Bioinformatics 2012, 28, 2537–2539. [CrossRef] [PubMed]
29. Evanno, G.; Regnaut, S.; Goudet, J. Detecting the number of clusters of individuals using the softwarestructure: A simulation study. Mol. Ecol. 2010, 14, 2611–2620. [CrossRef] [PubMed]
30. Porras-Hurtado, L.; Ruiz, Y.; Santos, C.; Phillips, C.; Carracedo, A.; Lareu, M.V. An overview of STRUCTURE:Applications, parameter settings, and supporting software. Front. Genet. 2013, 4, 98. [CrossRef] [PubMed]
31. Earl, D.A.; Vonholdt, B.M. STRUCTURE HARVESTER: A website and program for visualizing STRUCTUREoutput and implementing the Evanno method. Conserv. Genet. Resour. 2012, 4, 359–361. [CrossRef]
32. Kopelman, N.M.; Jonathan, M.; Mattias, J.; Rosenberg, N.A.; Itay, M. Clumpak: A program for identifyingclustering modes and packaging population structure inferences across K. Mol. Ecol. Resour. 2015, 15, 1179–1191.[CrossRef] [PubMed]
33. Kumar, S.; Stecher, G.; Li, M.; Knyaz, C.; Tamura, K. MEGA X: Molecular evolutionary genetics analysisacross computing platforms. Mol. Biol. Evol. 2018, 35, 1547–1549. [CrossRef] [PubMed]
34. Li, X.; Li, M.; Hou, L.; Zhang, Z.; Pang, X.; Li, Y. De novo transcriptome assembly and population geneticanalyses for an endangered Chinese endemic Acer miaotaiense (Aceraceae). Genes 2018, 9, 378. [CrossRef][PubMed]
35. Szmidt, A.E.; Wang, X.R.; Lu, M.Z. Empirical assessment of allozyme and RAPD variation in Pinus sylvestris(L.) using haploid tissue analysis. Heredity 1996, 76, 412–420. [CrossRef]
36. Torales, S.L.; Rivarola, M.; Pomponio, M.F.; Gonzalez, S.; Acuña, C.V.; Fernández, P.; Lauenstein, D.L.;Verga, A.R.; Hopp, H.E.; Paniego, N.B.; et al. De novo assembly and characterization of leaf transcriptome forthe development of functional molecular markers of the extremophile multipurpose tree species Prosopis alba.BMC. Genom. 2013, 14, 705. [CrossRef] [PubMed]
37. Sathyanarayana, N.; Pittala, R.K.; Tripathi, P.K.; Chopra, R.; Singh, H.R.; Belamkar, V.; Bhardwaj, P.K.;Doyle, J.J.; Egan, A.N. Transcriptomic resources for the medicinal legume Mucuna pruriens: De novotranscriptome assembly, annotation, identification and validation of EST-SSR markers. BMC Genom. 2017,18, 409. [CrossRef] [PubMed]
38. Liu, S.; Liu, H.; Wu, A.; Hou, Y.; An, Y.; Wei, C. Construction of fingerprinting for tea plant (Camellia sinensis)accessions using new genomic SSR markers. Mol. Breed. 2017, 37, 93. [CrossRef]
39. Chen, H.; Chen, X.; Tian, J.; Yang, Y.; Liu, Z.; Hao, X.; Wang, L.; Wang, S.; Liang, J.; Zhang, L.; et al.Development of gene-based SSR markers in rice bean (Vigna umbellata L.) based on transcriptome data.PLoS ONE 2016, 11, e0151040. [CrossRef] [PubMed]
40. Yan, Z.; Wu, F.; Luo, K.; Zhao, Y.; Yan, Q.; Zhang, Y.; Wang, Y.; Zhang, J. Cross-species transferability ofEST-SSR markers developed from the transcriptome of Melilotus and their application to population geneticsresearch. Sci. Rep.-UK 2017, 7, 17959. [CrossRef] [PubMed]
41. Vu Thi Thu, H. Genetic diversity among endangered rare Dalbergia cochinchinensis (Fabaceae) genotypes inVietnam revealed by random amplified polymorphic DNA (RAPD) and inter simple sequence repeats (ISSR)markers. Afr. J. Biotechnol. 2012, 11. [CrossRef]
53

Forests 2019, 10, 225
42. Phong, D.T.; Hien, V.T.; Thanh, T.T.; Tang, D.V. Comparison of RAPD and ISSR markers for assessment ofgenetic diversity among endangered rare Dalbergia oliveri (Fabaceae) genotypes in Vietnam. Genet. Mol. Resh.2011, 10, 2382–2393. [CrossRef] [PubMed]
43. Liu, S.; An, Y.; Li, F.; Li, S.; Liu, L.; Zhou, Q.; Zhao, S.; Wei, C. Genome-wide identification of simple sequencerepeats and development of polymorphic SSR markers for genetic studies in tea plant (Camellia sinensis).Mol. Breed. 2018, 38, 59. [CrossRef]
44. Väli, Ü.; Einarsson, A.; Waits, L.; Ellegren, H. To what extent do microsatellite markers reflect genome-widegenetic diversity in natural populations? Mol. Ecol. 2008, 17, 3808–3817. [CrossRef] [PubMed]
45. Ferrer, M.M.; Eguiarte, L.E.; Montana, C. Genetic structure and outcrossing rates in Flourensia cernua(Asteraceae) growing at different densities in the South-western Chihuahuan Desert. Ann. Bot. 2004,94, 419–426. [CrossRef] [PubMed]
46. White, T.L.; Adams, W.T.; Neale, D.B. Forest Genetics; CABI Publishing: Boston, MA, USA, 2007; pp. 149–186.47. Gadissa, F.; Tesfaye, K.; Dagne, K.; Geleta, M. Genetic diversity and population structure analyses of
Plectranthus edulis (Vatke) Agnew collections from diverse agro-ecologies in Ethiopia using newly developedEST-SSRs marker system. BMC Genet. 2018, 19, 92. [CrossRef] [PubMed]
48. Kang, S.S.; Chung, M.G. Genetic variation and population structure in Korean endemic species: IV.Hemerocallis hakuunensis (Liliaceae). J. Plant. Res. 1997, 110, 209–217. [CrossRef]
49. Zhong, T.; Zhao, G.; Lou, Y.; Lin, X.; Guo, X. Genetic diversity analysis of Sinojackia microcarpa, a rare treespecies endemic in China, based on simple sequence repeat markers. J. For. Res. 2018. [CrossRef]
50. Gichira, A.W.; Li, Z.-Z.; Saina, J.K.; Hu, G.-W.; Gituru, R.W.; Wang, Q.-F.; Chen, J.-M. Demographic historyand population genetic structure of Hagenia abyssinica (Rosaceae), a tropical tree endemic to the Ethiopianhighlands and eastern African mountains. Tree Genet. Genomes 2017, 13. [CrossRef]
51. Hamrick, J.L.; Godt, M.J.W.; Sherman-Broyles, S.L. Factors influencing levels of genetic diversity in woodyplant species. New For. 1992, 6, 95–124. [CrossRef]
52. Mihretie, Z.; Schueler, S.; Konrad, H.; Bekele, E.; Geburek, T. Patterns of genetic diversity of Prunus africanain Ethiopia: Hot spot but not point of origin for range-wide diversity. Tree Genet. Genomes 2015, 11, 118.[CrossRef]
53. Boaventura-Novaes, C.R.D.; Novaes, E.; Mota, E.E.S.; Telles, M.P.C.; Coelho, A.S.G.; Chaves, L.J. Genetic driftand uniform selection shape evolution of most traits in Eugenia dysenterica DC. (Myrtaceae). Tree Genet. Genomes2018, 14, 76. [CrossRef]
54. Addisalem, A.B.; Duminil, J.; Wouters, D.; Bongers, F.; Smulders, M.J.M. Fine-scale spatial genetic structure inthe frankincense tree Boswellia papyrifera (Del.) Hochst. and implications for conservation. Tree Genet. Genomes2016, 12, 86. [CrossRef]
55. Hartvig, I.; So, T.; Changtragoon, S.; Tran, H.T.; Bouamanivong, S.; Theilade, I.; Kjær, E.D.; Nielsen, L.R.Population genetic structure of the endemic rosewoods Dalbergia cochinchinensis and D. oliveri at a regionalscale reflects the Indochinese landscape and life-history traits. Ecol. Evol. 2018, 8, 530–545. [CrossRef][PubMed]
56. Zhai, S.H.; Yin, G.S.; Yang, X.H. Population genetics of the endangered and wild edible plant Ottelia acuminatain southwestern China using novel SSR markers. Biochem. Genet. 2018, 56, 235–254. [CrossRef] [PubMed]
57. Vu, D.-D.; Bui, T.T.-X.; Nguyen, M.-D.; Shah, S.N.M.; Vu, D.-G.; Zhang, Y.; Nguyen, M.-T.; Huang, X.-H.Genetic diversity and conservation of two threatened dipterocarps (Dipterocarpaceae) in southeast Vietnam.J. For. Res. 2018. [CrossRef]
58. Mutegi, E.; Snow, A.A.; Rajkumar, M.; Pasquet, R.; Ponniah, H.; Daunay, M.-C.; Davidar, P. Geneticdiversity and population structure of wild/weedy eggplant (Solanum insanum, Solanaceae) in southern India:Implications for conservation. Am. J. Bot. 2015, 102, 140–148. [CrossRef] [PubMed]
59. Institute of Botany, the Chinese Academy of Sciences. Flora Reipublicae Popularis Sinicae; Science Press: Beijing,China, 1994; Volume 40, p. 114.
60. The, S.N. A review on the medicinal plant Dalbergia odorifera species: Phytochemistry and biological activity.Evid-Based. Complement. Altern. 2017. [CrossRef]
61. Moritsuka, E.; Chhang, P.; Tagane, S.; Toyama, H.; Sokh, H.; Yahara, T.; Tachida, H. Genetic variation andpopulation structure of a threatened timber tree Dalbergia cochinchinensis in Cambodia. Tree Genet. Genomes2017, 13, 115. [CrossRef]
54

Forests 2019, 10, 225
62. Schaal, B.A.; Hayworth, D.A.; Olsen, K.M.; Rauscher, J.T.; Smith, W.A. Phylogeographic studies in plants:Problems and prospects. Mol. Ecol. 1998, 7, 465–474. [CrossRef]
63. Slatkin, M. Gene flow and the geographic structure of natural populations. Science 1987, 236, 787–792.[CrossRef] [PubMed]
64. Forest, F.; Grenyer, R.; Rouget, M.; Davies, T.J.; Cowling, R.M.; Faith, D.P.; Balmford, A.; Manning, J.C.;Proches, S.; van der Bank, M.; et al. Preserving the evolutionary potential of floras in biodiversity hotspots.Nature 2007, 445, 757–760. [CrossRef] [PubMed]
© 2019 by the authors. Licensee MDPI, Basel, Switzerland. This article is an open accessarticle distributed under the terms and conditions of the Creative Commons Attribution(CC BY) license (http://creativecommons.org/licenses/by/4.0/).
55


Article
Genetic Diversity and Structure through Three Cyclesof a Eucalyptus urophylla S.T.Blake Breeding Program
Wanhong Lu 1, Roger J. Arnold 1,*, Lei Zhang 2 and Jianzhong Luo 1
1 China Eucalypt Research Centre, Chinese Academy of Forestry, 30 Mid Renmin Dadao,Zhanjiang 524022, China; [email protected] (W.L.); [email protected] (J.L.)
2 Forest Science Institute, Dongmen State Forest Farm, Fusui 532108, China; [email protected]* Correspondence: [email protected]; Tel.: +86-158-1170-6013
Received: 17 April 2018; Accepted: 15 June 2018; Published: 21 June 2018
Abstract: Eucalyptus urophylla S.T.Blake is an important commercial tropical plantation speciesworldwide. In China, a breeding program for this species has progressed through three cyclesbut genetic diversity and structure in the breeding populations are uncertain. A sampling of fieldtrials from these populations was carried out to evaluate their genetic diversity and structure using16 microsatellite loci. Significant deviations from Hardy-Weinberg equilibrium were recorded at all16 loci in the populations. Overall expected and observed heterozygosity (He and Ho) estimatesof 0.87 and 0.59 respectively for the first cycle population, and 0.88 and 0.60 respectively for thethird cycle population, revealed reasonably high levels of genetic diversity. The genetic differentiationcoefficient (Fst) revealed low differentiation among pairs of provenances (from the species’ nativerange) comprising the first cycle population (range: 0.012–0.108), and AMOVA results showed thatthe majority of molecular genetic variation existed among individuals rather than among provenancesfor the first cycle population and among individuals rather than among field trial sources in thethird cycle population. Levels of genetic diversity appeared to remain unchanged from the first tothird cycle populations, and the results indicate prospects for maintaining if not increasing diversitythrough recurrent breeding. Likely effects of artificial directional selection, prior to sampling, on bothpopulations examined are discussed along with implications for future E. urophylla breeding.
Keywords: microsatellite locus; Hardy-Weinberg equilibrium; genetic differentiation; breeding population;artificial selection
1. Introduction
Eucalyptus urophylla S.T.Blake is a tall forest tree that has a natural distribution spanning sevenof the Lesser Sunda Islands in eastern Indonesia, where it is mostly found growing on volcanicallyderived soils, and it also extends into East Timor. Across this natural range, the species can vary froma tall forest tree up to 45 m high to a shrub like form of less than 2 m [1,2]. Cross-pollination in thespecies is mostly effected by insects and birds [3] and though self-compatible, it is predominantlyoutcrossing but with a mixed mating system in natural stands [4]. On lower slopes it often co-occurswith Eucalyptus alba Reinw. ex Blume in mosaic stands [1] and it was only in 1977 that E. urophylla wasdescribed as a species separate from E. alba [3].
As an exotic forest plantation species E. urophylla is now one of the most commercially importanthardwood species worldwide. Both the pure species and hybrid varieties involving this species(most commonly with Eucalyptus grandis W.Hill ex Maiden) are the foundation of substantial areas ofcommercial plantations in tropical and warmer subtropical regions for the production of pulpwood,fuelwood, poles, veneer logs and even saw logs [2,5,6]. It was first introduced to China in 1971 [7]and by mid-1990s the species and its hybrids had become leading genetic material for commercialplantations established in tropical and warmer sub-tropical areas of southern China [8,9]. Today in this
Forests 2018, 9, 372; doi:10.3390/f9070372 www.mdpi.com/journal/forests57

Forests 2018, 9, 372
country, there are over three million hectares of plantations established with hybrid varieties of thisspecies, and this resource provides livelihoods for hundreds of thousands of people [10].
Following the phenotypic diversity observed in the species for growth and stem-form through itsnatural range, high levels of genetic diversity have been recorded across this range through designedgenetic field trials. Phenotypic observations/measurements on quantitative traits have been carried outin various statistically designed provenance/family cum progeny field trials of this species to examinegenetic variability and diversity in adaptive and economically important growth, stem form andwood quality traits. Examples of such work with E. urophylla are provided by Hodge and Dvorak [11],who reported results for 65 provenances originating from the seven Indonesian islands where thespecies occurs naturally, that were tested in a series of 125 provenance/progeny trials planted in fivecountries, and by Kien et al. [12] who reported results on 144 families, representing 9 provenances,tested in two field trials located in northern Vietnam.
Genetic variation and relationships among and within natural populations of E. urophylla have alsobeen examined in a number of molecular genetic studies. House and Bell [4] examined material fromacross the species’ full natural range by using isozymes and found that most of the genetic diversityof the species was attributed to variation within populations. In contrast, they found that geneticdifferences between populations, at least for the isozymes examined, appeared to be small, while nostriking patterns relating to geography were detected. Similarly, Payn et al. [13] and Payn et al. [14]investigated genetic diversity and geographical distribution of chloroplast DNA variations in thespecies and found moderate to high levels of genetic diversity throughout its geographic range(He = 0.70–0.78). However, the latter of these studies also found relatively low genetic differentiationamong populations (Fst = 0.03), which the authors took to indicate low levels of recurrent gene flowamong the Indonesian islands of the species occurrence.
In a separate study Tripiana et al. [15] used 10 microsatellite markers to study 360 seedlings,representing 49 provenances (referred to by them as “subpopulations”), spanning E. urophylla’s naturalrange in Indonesia and East Timor, which they grouped into 17 “natural populations”, in order to assessthe species’ genetic diversity and structure. They found that microsatellite heterozygosity was moderateto high within populations (Ho = 0.51–0.72) based on the loci they examined. They also found that theindex of fixation was significantly different from zero for all populations (FIS = 0.13–0.31), whilst thedifferentiation among populations was low (Fst = 0.04) and not significantly different from zero, due toextensive gene flow across the species’ natural range via pollen flow. They also suggested that the FIS
values observed might have been due to a Wahlund effect. The latter effect arises when two geneticallydistinct groups are (inadvertently or intentionally) lumped into a single sampling unit, either becausethey co-occur but rarely interbreed, or because the spatial scale chosen for sampling is larger than thetrue scale of a population (or of a subpopulation, depending on the definitions used for these terms).This Wahlund effect (substructure within populations) can lead to heterozygote deficits and deviationsfrom Hardy-Weinberg equilibrium (HWE) [16,17].
However, despite the convincing evidence presented by such molecular genetic studies onE. urophylla, it is noteworthy that House and Bell [4] saw a paradox in that an apparent lackof, or at least relative minor, differentiation between populations of E. urophylla from its naturalrange found in isozyme, and subsequently also in molecular genetics studies, seemed somewhatcontradictory compared to a high degree of population differentiation for morphological/adaptivetraits. Pryor et al.’s [1] detailed study on morphological features from 23 populations acrossE. urophylla’s natural range supported the identification of three separate taxa from within the species:E. urophylla, Eucalyptus orophila L.D.Pryor and Eucalyptus wetarensis L.D. Pryor. Indeed House andBell’s [4] study identified a large degree of allelic diversity between the genetic material originatingfrom the island of Wetar and that originating from other islands; the former populations having beenclassified as E. wetarensis by Pryor et al. [1]. Although such division into separate species has generallynot yet been accepted either by eucalypt growers or researchers, a recently published taxonomic
58

Forests 2018, 9, 372
classification of Eucalyptus species does identify E. urophylla, E. orophila and E. wetarensis as separatespecies [18].
Though studies such as those cited above [1,4,11,12,14,15] have provided excellent insights intothe natural populations of E. urophylla, today most commercial growers of the species no longerfocus on genetic material collected directly from natural populations. Worldwide, many E. urophyllaimprovement programs have already captured in their breeding populations diverse genetic materialoriginating from the species’ natural range, and out of the initial breeding populations most of themhave by now progressed through several cycles of selection and breeding.
During the 1980s and 1990s genetically diverse seedlots of E. urophylla were imported to Chinafor the establishment of a base population to support ongoing genetic improvement [9,19]. With thismaterial a first cycle breeding population of E. urophylla was established as a series of field trials duringthe period 1988 to 1998 and included over 400 open-pollinated families representing 30 provenancesfrom the species’ natural range along with families and seedlots from various planted stands/exoticseed sources. Then in 2004 a second cycle breeding population of E. urophylla was established in Chinaas a single field trial, with open-pollinated (OP) seed collected from selected plus-trees of the firstcycle population (i.e., OP families). In 2006, a Chinese cooperative tree improvement program wasinitiated involving commercial growers and a number of government research institutes. Throughthis cooperative program, a third cycle breeding population for E. urophylla was established in 2010,with material selected from both the first and the second cycle populations.
How much genetic diversity is currently present in the third cycle breeding population ofE. urophylla in China, and how this has been affected by the preceding cycles of selection, are criticalquestions. Maintaining broad genetic diversity through the successive cycles of breeding is essentialfor achieving genetic gains from both the current and future cycles of this species. Variation isneeded in key economic traits, so that artificial selection can ultimately result in heritable geneticimprovements [2]. The genetic diversity—quantifiable, unquantifiable and/or “cryptic”—will serveas the primary basis for adaptation to future biotic and abiotic challenges, and selection for traits notcurrently seen or linked to economic values, e.g. adaptation to future climatic shifts and/or emergenceof new pathogens [15].
Thus, the present study was initiated in order to examine the first and third cycle E. urophyllabreeding populations in China, using molecular genetic markers with the following specific objective:To evaluate the potential loss of genetic diversity through breeding cycles by comparing the geneticdiversity, being assessed by molecular markers, between the founding (first cycle) and the descendent(third cycle) breeding populations. The parameters estimated in this study will also providea benchmark for comparison with future, successive breeding populations.
2. Materials and Methods
2.1. Plant Material
The natural stand origins of some of the genetic materials included in the breeding populationsand examined in this study are known to be on the island of Wetar, Indonesia, and thus could beclassified as E. wetarensis according to Pryor et al. [1] and Nicole [18]. However, for the purpose of thestudy reported here, the taxonomic classification of E. urophylla according to Brooker [20], is followedand all material involved is referred to as E. urophylla.
Samples were obtained from the first cycle breeding population of E. urophylla in China; see Table 1,Figure 1, and Supplementary Material Table S1 and Figure S1. In mid-2016 three out of the five fieldtrials comprising this population (T46, T77 and T94) were sampled. Regarding the two other trialsof the same cycle that were not sampled, trial T54 was terminated some years ago and therefore notavailable for sampling, and trial TJJ was just a duplicate of trial T94.
59

Forests 2018, 9, 372
Table 1. Details of the samples obtained from 3 field trials (T46, T77 and T94) of the first cycle breedingpopulation of E. urophylla.
Trial (year)
Provenance Origins of Families in Trial * (Locations of the Mothers of Trees Sampled)No. Families
Sampled (in Trial)Provenance GeographicLocation **
Island, CountryLatitude
& LongitudeAltitude(m a.s.l.)
T46 (1988)1. Mt Lewotobi I Flores, Ind. 8◦31′ S, 122◦45′ E 398 10 (14)
2. Mt Egon *** Flores, Ind. 8◦38′ S,122◦27′ E 450 14 (17)3. Ulanu River Alor, Ind. 8◦20′ S,124◦27′ E 500 9 (11)
subtotals 3 provenances 33 (42)
T77 (1992)
4. Mandiri Flores, Ind. 8◦45′ S,122◦50′ E 410 9 (15)5. Mt Lewotobi II Flores, Ind. 8◦32′ S,122◦48′ E 375 25 (30)
6. Wukoh Flores, Ind. 8◦35′ S,122◦48′ E 375 9 (14)2. Mt Egon *** Flores, Ind. 8◦38′ S,122◦27′ E 450 22 (31)
7. Bangat Flores, Ind. 8◦38′ S,122◦27′ E 330 10 (14)8. Wairteban Flores, Ind. 8◦38′ S,122◦27′ E 525 10 (13)9. Iling Gele Flores, Ind. 8◦37′ S,122◦27′ E 600 7 (14)10. Andalan Flores, Ind. 8◦36′ S,122◦28′ E 725 10 (13)11. Jawaghar Flores, Ind. 8◦36′ S,122◦28′ E 725 10 (14)12. DMFF I China 22◦23′ N,107◦30′ E 200 23 (29)
subtotals 10 provenances 135 (190)
T94 (1998)
13. Waikui Alor, Ind. 8◦14′ S,124◦44′ E 540 2 (7)14. Arnau Wetar, Ind. 7◦49′ S, 126◦10′ E 315 3 (7)15. Uhak Wetar, Ind. 7◦39′ S, 126◦29′ E 350 5 (27)16. Apui Alor, Ind. 8◦17′ S, 124◦40′ E 1115 2 (19)
17. Piritumas Alor, Ind. 8◦19′ S, 124◦31′ E 355 4 (24)18. Ilwaki Wetar, Ind. 7◦52′ S, 126◦27′ E 515 5 (35)
19. Telemar Wetar, Ind. 7◦54′ S, 125◦58′ E 180 1 (3)20. Carbubu Wetar, Ind. 7◦56′ S, 125◦53′ E 175 1 (3)
21. Dalaki Pantar, Ind. 8◦31′ S, 124◦5′ E 440 2 (8)22. DMFF II China 22◦23′ N,107◦30′ E 200 9 (24)
subtotals 10 provenances 34 (157)
Totals 22 provenances/ seed sources 202 (389) families
Note: * Key to abbreviations: Mt = Mount; DMFF = Dongmen State Forest Farm, Guangxi, China; Ind. = Indonesia.** numerical ID’s of provenances relate to locations indicated by numbered blue dots in Figure 2; *** The Mt Egonprovenance was included in both T46 and T77 trials, but was represented by different families each trial (i.e., familiesin the 2 trials were mutually exclusive).
Figure 1. Development of three successive cycles of Eucalyptus urophylla S.T.Blake breeding in China.Trials shaded in grey were not sampled for this study; circled numbers indicate number of familiescontributing to the succeeding trial indicated by the associated arrow.
From the first cycle breeding population, 202 families were sampled; Table 1. Of thesefamilies, 170 were first generation progeny from mother trees originating from 20 natural standprovenances (i.e., provenances from the species’ native range) from 4 Indonesian Islands (see Figure 2),and 32 families were progeny from plus-trees selected in earlier trials at Dongmen Forest Farm inChina and presumed to be second generation genetic material. Unfortunately, the origins of thelatter material are now not known as clear records are not available. The provenance categorizationacross the native range of the species was based on designations provided originally by CSIRO
60

Forests 2018, 9, 372
(Commonwealth Scientific and Industrial Research Organization)’s Australian Tree Seed Centre,which was the supplier of the seedlots.
The single trial that comprised the second cycle breeding population (T135) had been intensivelythinned and then suffered wind/typhoon damage over 5 years ago and was unsuitable for sampling.From the descendant third cycle breeding population, 125 families were sampled from one field trial(T164) that (initially) included almost a comprehensive set of the seed sources and families of thirdcycle breeding population, planted in 2010; Table 2 and Supplementary Material Table S1, Table S2 andFigure S1. Though this third cycle population comprised multiple field trials, each contained aboutthe same set of families so just one trial was sampled for this study. Of the third cycle familiessampled: 91 were progeny from mother trees selected in 4 trials of the first cycle breeding population(their mother trees represented 20 provenances from 4 Indonesian Islands of the species’ natural range);20 were progeny from mother trees selected in the first cycle breeding population which themselveswere progeny of plus-trees selected in earlier trials at Dongmen Forest Farm; 14 were progeny frommother trees selected in the trial (T135), which comprised the second cycle breeding population,that were maternal descendants of first cycle families not related (maternally) to other families sampledfrom the third cycle population.
Figure 2. Geographic locations of E. urophylla natural stand provenances in Indonesia from which thegenetic material included in the trials of the first cycle breeding population originated—the numberslinked to blue dots indicate the locations of the numbered provenances listed in Table 1.
Whilst each cycle of the breeding population might ‘nominally’ be considered as a generation,there is some variation among the families comprising each cycle with respect to the number ofgenerations, at least on the maternal sides, and their descent from mother trees in natural standsin Indonesia and East Timor. The number of families sampled from the first and third cycles werea compromise between: (1) balancing the number of samples to represent the provenances/seedsources and their respective sizes (i.e., number of families from them) in each population; (2) treesavailable for sampling (considerations mostly for first cycle populations where thinning and sometyphoon damage had reduced representation); and, (3) resources available for this study.
From each family sampled in each breeding cycle, fresh leaf tissue was collected from one tree(i.e., samples obtained from one tree per family, each family having originated from a different mothertree) for DNA extraction, in accordance with the methodologies used by Payn et al. [13], Payn et al. [14]and Tripiana et al. [15]. The one tree sampled per family in each cycle, was selected randomly, beingthe first tree found within each target family of the respective trials, starting from replicate 1 andworking methodically through the replicates in numerical sequence.
61

Forests 2018, 9, 372
Table 2. Details of the samples obtained from one of the field trials (T164), planted in 2010, of the thirdcycle breeding population of E. urophylla.
Mothers of Trees Sampled Origins of Grandmothers of Families Sampled *
Trial IDNo. Families
Sampled (in Trial)No. Families
Sampled (in Trial)Provenance Geographic
Location **Island, Country
T46 20 (38)
6 (11) 2. Mt Egon Flores, Ind. **6 (14) 1. Mt Lewotobi I Flores, Ind.5 (5) 3. Ulanu River Alor, Ind.3 (9) 23. DMFF III China
T77 43 (52)
1 (1) 4. Mandiri Flores, Ind.20 (21) 5. Mt Lewotobi II Flores, Ind.9 (10) 2. Mt Egon Flores, Ind.2 (2) 8. Wairteban Flores, Ind.2 (2) 9. Iling Gele Flores, Ind.1 (1) 10. Andalan Flores, Ind.
8 (12) 12. DMFF I China
T94 32 (50)
1 (7) 13. Waikui Alor, Ind.1 (7) 14. Arnau Wetar, Ind.
1 (27) 15. Uhak Wetar, Ind.1 (19) 16. Apui Alor, Ind.2 (24) 17. Piritumas Alor, Ind.2 (35) 18. Ilwaki Wetar, Ind.1 (3) 19. Telemar Wetar, Ind.1 (3) 20. Carbubu Wetar, Ind.
9 (32) 22. DMFF II China
TJJ 16 (21)
0 (7) 13. Waikui Alor, Ind.2 (7) 14. Arnau Wetar, Ind.
5 (27) 15. Uhak Wetar, Ind.0 (19) 16. Apui Alor, Ind.0 (24) 17. Piritumas Alor, Ind.9 (35) 18. Ilwaki Wetar, Ind.0 (3) 19. Telemar Wetar, Ind.0 (3) 20. Carbubu Wetar, Ind.
0 (32) 22. DMFF II China
T135 14 (24)6 (22) Trial T77 China4 (14) Trial T54 China4 (9) Trial T46 China
125 (185) families Grandmothers represent 22 provenances/seed sources
Note: * Key to abbreviations: Mt = Mount; DMFF = Dongmen State Forest Farm, Guangxi, China; Ind. = Indonesia.** numerical ID’s of provenances relate to locations indicated by numbered blue dots in Figure 2.
2.2. DNA Isolation and Microsatellite PCR Amplification
Total genomic DNA was extracted from 300 mg of fresh leaf (from each tree sampled) using themodified cetyltrimethyl ammonium bromide (CTAB) method, following the methodology describedby Wang [21]. DNA quality and quantity were determined by applying agarose gel electrophoresisand spectrophotometery, using a NanoDrop 2000 spectrophotometer (Thermo Fisher Scientific Inc.,Waltham, MA, USA).
Sixteen microsatellite loci were used in the study, all of which had been previously described andused in Eucalyptus species (Table 3). These loci were selected from among a total of 608 publishedmicrosatellite loci, as described by He et al. [22] and Brondani et al. [23], for their high polymorphismand allelic frequency differences between pools selected for genotyping a ‘discovery’ populationfollowing procedures described by Wang et al. [24].
62

Forests 2018, 9, 372
Table 3. Details of 16 microsatellite loci examined in this study.
No. Locus Reference No. Locus Reference
1 EUCeSSR805 [22] 9 Embra165 [23]2 Embra57 [23] 10 Embra186 [23]3 Embra78 [23] 11 Embra192 [23]4 Embra86 [23] 12 Embra198 [23]5 Embra94 [23] 13 Embra226 [23]6 Embra119 [23] 14 Embra333 [23]7 Embra130 [23] 15 Embra368 [23]8 Embra145 [23] 16 Embra377 [23]
Note: EUCeSSR805 is an expressed sequence tag marker while all others are neutral markers across thewhole genome.
Polymerase chain reactions (PCRs) were performed in a total volume of 10 μL, followinga touchdown PCR procedure, as described by Li and Gan [25]. This procedure involved: Incubation at94 ◦C for 1 min; 20 cycles of incubation at 94 ◦C for 20 s, 66 ◦C for 30 s with a decrease of 0.5 ◦Cper cycle, and 72 ◦C for 1 min; 25 cycles of 94 ◦C for 20 s, 56 ◦C for 30 s, 72 ◦C for 30 s; then, a finalextension at 72 ◦C for 10 min. Fluorescein-12-dUTP1 mM aqueous solution (MBI Fermentas Inc.,Burlington, ON, Canada) was added to facilitate subsequent detection of PCR products using anApplied Biosystems 3130xl Series Genetic Analyzer (Applied Biosystems, Foster City, CA, USA).
2.3. Statistical Analyses
GenePop v4.2 [26] software was used to test the breeding populations studied for Hardy-Weinbergequilibrium, heterozygote deficits and for heterozygote excesses based on the Markov chain methodusing 10,000 dememorizations, 20 batches and 5000 iterations per batch. The above providedprobability test parameters for Hardy-Weinberg equilibrium (PHWE) separately for each one of the16 microsatellite loci. Analyses with this software also provided estimates of the frequencies of nullalleles at each locus.
The polymorphism information content (PIC) for every microsatellite locus was estimatedseparately for each breeding population by using the software PowerMarker v3.25 [27]. The number ofalleles (Na), effective number of alleles (Ne), Shannon’s Information Index (I), observed heterozygosity(Ho), expected heterozygosity (He), and Wright’s fixation index (FIS) were also calculated separatelyfor each locus (by population) using the software GenAlEx v6.4.1 [28], and then averaged across locifor each population. The same software was also used to determine counts of the number of privatealleles (Npa) for each provenance and seed source [29]. Meanwhile, FSTAT v2.9.3.2 [30] software wasused to evaluate genetic differentiation index (Fst) values on a pairwise basis between provenances ofthe first cycle breeding population.
2.4. Population Genetic Structure
Analyses of molecular variance (AMOVA) were carried out separately for the first and third cyclepopulations using GenAlEx v6.4.1 to apportion genetic variance within each population, based on999 permutations. For the first cycle population, data from provenances represented by four or fewerfamilies was omitted (i.e., 5 provenances omitted), and across the other 15 provenances the geneticvariance was apportioned into that attributed to variation among provenances, where ‘provenance’refers to both natural stand provenances and exotic seed sources (i.e., collections from trials atDongmen), and to variation among individuals within provenances. As origins of two provenancesincluded in the first cycle—DMFF I and DMFF II—were somewhat uncertain, the AMOVA was thenrepeated for the first cycle population without these two provenances. For the third cycle population,genetic variance was attributed to variation among seed sources, with each trial contributing materialdesignated as a separate seed source, and to variation among individuals within seed sources.
63

Forests 2018, 9, 372
Nei’s genetic distance between the 15 provenances that contributed to the first cycle population(represented by ≥5 or more families in our sample), was estimated using Powermarker v3.25.These estimates were then used to create a neighbor-joining (NJ) dendrogram by applying clusteranalysis using the unweighted pair group method with arithmetic means (UPGMA) and a bootstrapresampling number of 1000. MEGA v7 software [31] was used to edit the UPGMA-NJ dendrogram.
The number of genetically homogeneous clusters (K) in both the first and third cycle populations,were estimated using the software STRUCTURE v2.3.4 [32], which uses a Bayesian model-basedclustering method that does not require prior information on either the number of sampling sites orthe locations from which the individuals were sampled. The program parameters in STRUCTUREv2.3.4 were set as recommended by Pritchard et al. [33], including the assumption of admixture amongpopulations and correlated allele frequencies. A burn-in period of 50,000 iterations was followed by100,000 iterations of the Markov Chain Monte Carlo model (MCMC). The model was run for a range ofK values varying from 2 to 16 and with 5 replications in each iteration. The optimal K value supportedby the data was assessed according to the recommendations of Evanno et al. [34], whereby the statisticΔK was calculated based on the rate of change in the log probability of data between successive Kvalues. The optimal K value was determined with the highest ΔK method, and this was carried outusing the software STRUCTURE Harvester v0.6 [35].
3. Results
3.1. Microsatellite Loci Diversity and Polymorphism
In total 459 and 428 alleles were identified across the 16 microsatellite loci examined in the firstand third cycle populations respectively (Table 4). The average number of alleles per locus (Na)and the average effective number alleles per locus (Ne) were similar in both populations at 28.7 and10.6 respectively for the first cycle, and at 26.8 and 10.4 respectively for the third cycle. Averaged acrossloci, both the polymorphism information content (PIC) and Shannon’s information index (I) values forthe third cycle population, being 0.87 and 2.58 respectively, showed little change from the first cyclepopulation (0.86 and 2.56 respectively). Similarly, the values of average observed heterozygosity (Ho)and average expected heterozygosity (He) remained similar from the first to third cycle population,as did the values of Wright’s fixation index (FIS) (0.32 and 0.31 respectively) (Table 4); values whichsuggest an excess of homozygotes in both populations.
Table 4. Loci genetic diversity indices for the first and third cycle breeding populations of E. urophylla;except for ‘N’ and ‘Na total’ the numbers for each trait in each population represent means across the16 loci analyzed with standard deviations of these means given in brackets.
Population N Na Total Na Ne PIC I Ho He FIS
1st 202 459 28.7(2.7)
10.6(1.8)
0.86(0.02)
2.56(0.14)
0.59(0.06)
0.87(0.02)
0.32(0.07)
3rd 125 428 26.8(2.0)
10.4(1.5)
0.87(0.02)
2.58(0.12)
0.60(0.06)
0.88(0.01)
0.31(0.07)
Note: N, number of trees and families sampled; Na Total, total number of alleles observed across all loci; Na, observednumber of alleles per locus averaged across the 16 loci for each population; Ne, effective number of alleles per locusaveraged across loci; PIC, polymorphism information content, averaged across loci; I, Shannon’s information index,averaged across loci; Ho, observed heterozygosity averaged across loci; He, expected heterozygosity, averagedacross loci; FIS, Wright’s fixation index averaged across loci.
3.2. Hardy-Weinberg Equilibrium and Null Alleles
Both the first and third cycle populations showed marked deviations from Hardy-Weinbergequilibrium; at all 16 loci analyzed, the probabilities of Hardy–Weinberg equilibrium werenon-significant (probability test parameters for Hardy-Weinberg equilibrium—PHWE—were less than
64

Forests 2018, 9, 372
0.01 at each of the 16 loci). These results are in agreement with the excess of homozygotes suggestedby some of the indices presented for both populations in Table 4.
Together with the indications of deviations from equilibrium at each locus, relatively highestimated frequencies of null alleles (from over 0.10 up to 0.36) were found at some loci in bothpopulations studied (9 loci in both the first and third cycle populations). Although such null alleleswere likely to have biased homozygote frequencies and hence the magnitudes of departure from theHardy–Weinberg equilibrium, it is worth noting that all loci with low frequencies of null alleles (<0.05)also showed a departure from Hardy–Weinberg equilibrium.
3.3. Population Diversity and Variation
The portion of the first cycle population sampled in this study comprised predominantly firstgeneration progeny (170 out of 202 families, representing 20 provenances) from the species’ nativerange. The other families sampled (32 out of 202) were from mother trees selected at Dongmen ForestFarm (DMFF) and assumed to be second generation progeny. Among the 15 provenances representedby ≥5 families, Na by provenance (over all loci) ranged from 5.7 (Ilwaki) to 16.0 (Mt Egon) and Ne
ranged from 3.8 (Ulanu River) to 8.3 (Mt Egon) and Shannon’s information index (I) ranged from1.44 (Ulanu River) to 2.25 (Mt Egon) (Table 5). Three of these 15 provenances—Andalan, Bangatand Wukoh—had no private alleles (i.e., Npa = 0) whilst in the other 12 of these provenances Npa
varied from 2 (Jawaghar and Mt Lewotobi I) up to 18 (Mt Egon). Expected heterozygosity (He) byprovenance ranged from 0.71 (Ulanu River) to 0.88 (Andalan) and observed heterozygosity (Ho)ranged from 0.33 (Ulanu River) to 0.69 (Jawaghar). The average of Wright’s fixation index (FIS)across the 15 provenances was 0.28, and by provenance this parameter ranged from 0.13 (Jawaghar)to 0.54 (Ulanu River) indicating significant heterozygotic deficits and excesses of homozygotes formost provenances.
Table 5. Genetic diversity indices for the provenances comprising the first cycle breeding populationof E. urophylla—results presented only for the 15 provenances which had 5 or more families sampled.
Provenance N Na Ne I Npa Ho He FIS
Andalan, Flores 10 9.4 7.2 2.03 0 0.62 0.88 0.26Bangat, Flores 10 8.9 6.5 1.96 0 0.64 0.87 0.23DMFF I, China 18 11.9 7.4 2.14 6 0.62 0.87 0.28DMFF II, China 14 9.2 6.0 1.89 8 0.53 0.83 0.35
Iling Gele, Flores 7 6.9 5.4 1.74 3 0.61 0.85 0.23Ilwaki, Wetar 5 5.7 4.7 1.57 7 0.58 0.84 0.26
Jawaghar, Flores 10 9.1 6.8 1.91 2 0.69 0.84 0.13Mandiri, Flores 9 7.4 5.4 1.74 4 0.55 0.82 0.31Mt Egon, Flores 36 16.0 8.3 2.25 18 0.59 0.85 0.30
Mt Lewotobi I, Flores 10 8.4 6.1 1.86 2 0.63 0.84 0.20Mt Lewotobi II, Flores 25 13.2 8.3 2.19 14 0.66 0.86 0.23
Uhak, Wetar 5 5.8 4.8 1.59 9 0.61 0.84 0.21Ulanu River, Alor 9 6.1 3.8 1.44 10 0.33 0.71 0.54Wairteban, Flores 10 8.6 6.2 1.89 5 0.56 0.85 0.32
Wukoh, Flores 9 7.6 5.6 1.80 0 0.54 0.84 0.33Average 12.5 8.9 6.2 1.87 5.9 0.58 0.84 0.28Std. dev. 8.2 2.9 1.3 0.23 5.3 0.08 0.04 0.09
Note: N, number of trees and families sampled; Na, number of alleles per locus averaged across the 16 loci; Ne,number of effective alleles per locus averaged across loci; I, Shannon’s information index, averaged across loci; Npa,total number of private alleles across all 16 loci; Ho, observed heterozygosity averaged across loci; He, expectedheterozygosity averaged across loci; FIS, Wright’s fixation index averaged across loci; Mt: Mount; Std. dev.:standard deviation.
For all the above genetic diversity indices, the two second generation seed sources were notexceptional; though DMFF I indices values were generally above those of DMFF II, both of themwere only slightly above average. However, differences between these two sources may have been
65

Forests 2018, 9, 372
affected somewhat by the sample sizes; 23 families sampled represented DMFF I, but only 9 familiesrepresented DMFF II.
An AMOVA of hierarchical genetic variance across the 15 provenances of the first cycle breedingpopulation represented by 5 or more families, revealed that only 3.4% of the total variance wasattributed to variation among provenances, whilst most of the variance was due to variation amongindividuals within provenances (Table 6). When the AMOVA for the first cycle population was repeatedafter the two provenances of uncertain origins were removed—DMFF I and DMFF II—it yieldedalmost identical results to the previous one, indicating that those two sources, despite being potentiallyhomogeneous with respect to provenance origins, had little effect on the AMOVA estimate regardingthe level of among provenance variation. A separate AMOVA, based on the same loci, was carried outfor the third cycle population and revealed similar results; genetic variation among individuals withinseed sources accounted for almost 99% of the total molecular variance, whilst only 1% was attributedto variation among the seed sources (i.e., the five field trials of the first and second cycles from whichthe families were sourced).
Table 6. Analyses of molecular variance (AMOVA) based on 16 microsatellite loci across: 15 provenances ofthe first cycle breeding population of E. urophylla that were represented by 5 or more families; and, across thefive field trial sources that contributed to the third cycle breeding population of E. urophylla.
Source of Variation Degrees of Freedom Sum of Squares Variance Components 1 Percentage of Variation
1st cycle populationAmong provenances 14 174.9 0.24 * 3.4
Among Individuals within provenances 359 2423.5 6.75 * 96.6
Total 373 2598.4 6.99 100
3rd cycle populationAmong seed sources 4 85.7 0.13 * 1
Among Individuals within seed sources 120 2212.4 18.44 * 99
Total 124 2298.1 18.56 100
1 Significance levels of variance components were based on 999 permutations; * indicates significant at p < 0.001.
3.4. Genetic Structure of Populations
The average genetic differentiation index values (Fst) for all pairwise provenance comparisonsin the first cycle population was 0.044 and between any two provenances this index ranged from0.012 (Egon vs. DMFF I) to 0.108 (Ulanu River vs. Jawaghar) (Table 7), suggesting a low degree ofgenetic differentiation among these E. urophylla provenances. The highest value achieved for this indexwas between two provenances from geographically distant origins; Ulanu River (Alor) and Jawaghar(Flores) which have a straight line distance of separation of approximately 220 km. Similarly, the Fst
values of Ulanu River vs. Iling Gele, Ulanu River vs. Mandiri, and Ulanu River vs. Wukoh were alsohigher than other pairwise provenance comparisons and in each of these pairs the provenances hadstraight line distances of separation varying from around 184 to 222 km.
66

Forests 2018, 9, 372
Ta
ble
7.
Pair
wis
ege
neti
cdi
ffer
enti
atio
nin
dice
s(F
st)f
orth
epr
oven
ance
sco
mpr
isin
gth
efir
stcy
cle
bree
ding
popu
lati
onof
E.ur
ophy
lla—
grey
shad
ing.
Pro
ve
na
nce
An
da
lan
Ap
ui
Arn
au
Ba
ng
at
Ca
rbu
bu
Da
lak
iD
MF
FI
DM
FF
IIM
tE
go
nIl
ing
Ge
leIl
wa
ki
Jaw
ag
-ha
rL
ew
oto
bi
IL
ew
oto
bi
IIM
an
-dir
iP
irit
-um
as
Te
le-m
ar
Uh
ak
Ula
nu
RW
aik
ui
Wa
ir-t
eb
an
Apu
i0.
032
Arn
au0.
030
0.04
2Ba
ngat
0.02
40.
034
0.03
4C
arbu
bu0.
035
0.04
40.
046
0.04
1D
alak
i0.
036
0.04
60.
034
0.04
10.
047
DM
FFI
0.01
80.
024
0.02
70.
022
0.02
90.
030
DM
FFII
0.02
80.
040
0.02
20.
033
0.03
30.
026
0.02
3M
tEgo
n0.
018
0.03
10.
027
0.02
40.
027
0.02
90.
012
0.01
8Il
ing
Gel
e0.
031
0.04
90.
034
0.03
30.
049
0.04
10.
032
0.03
80.
030
Ilw
aki
0.03
70.
040
0.05
00.
047
0.04
60.
055
0.03
40.
042
0.03
00.
059
Jaw
agha
r0.
037
0.04
40.
045
0.04
70.
040
0.04
50.
035
0.03
90.
024
0.04
70.
050
Lew
otob
iI0.
037
0.03
80.
042
0.03
70.
041
0.04
30.
031
0.03
50.
027
0.05
70.
048
0.03
6Le
wot
obiI
I0.
026
0.03
10.
030
0.02
70.
031
0.02
90.
022
0.02
60.
018
0.03
10.
039
0.02
00.
026
Man
diri
0.04
60.
043
0.05
40.
049
0.05
40.
053
0.03
90.
051
0.03
70.
066
0.04
40.
062
0.04
50.
043
Piri
tum
as0.
036
0.04
20.
054
0.04
60.
039
0.05
60.
021
0.03
10.
024
0.05
40.
047
0.04
00.
045
0.03
90.
054
Tele
mar
0.04
30.
046
0.04
90.
054
0.05
80.
047
0.03
20.
044
0.03
50.
057
0.04
90.
052
0.05
40.
042
0.03
80.
044
Uha
k0.
043
0.04
50.
049
0.04
00.
045
0.04
90.
034
0.03
50.
028
0.05
70.
041
0.05
90.
043
0.04
20.
047
0.05
10.
055
Ula
nuR
0.08
60.
093
0.09
60.
081
0.10
50.
075
0.06
70.
069
0.06
80.
101
0.09
60.
108
0.08
50.
088
0.09
70.
082
0.09
10.
070
Wai
kui
0.03
60.
038
0.05
00.
044
0.04
30.
043
0.03
00.
037
0.02
40.
057
0.04
10.
045
0.03
80.
037
0.03
50.
043
0.04
40.
037
0.08
3W
airt
eban
0.04
00.
040
0.04
30.
048
0.04
60.
036
0.02
90.
034
0.02
60.
053
0.04
70.
047
0.04
20.
041
0.04
20.
038
0.02
70.
048
0.07
90.
022
Wuk
oh0.
035
0.04
40.
042
0.03
10.
040
0.04
70.
032
0.03
60.
028
0.04
10.
035
0.05
10.
051
0.03
50.
056
0.05
00.
058
0.03
10.
095
0.04
30.
050
67

Forests 2018, 9, 372
3.5. Structure
Relationships between the 15 provenances from the first cycle population (that had 5 or morefamilies sampled for this study) are summarized in an unrooted neighbor-joining dendrogram, which isbased on Nei’s genetic distance estimates, as shown in Figure 3. While the dendrogram generally doesnot show a strong connection to provenance geographic origins, it must be noted that many clustersand nodes identified in this are poorly supported (i.e. bootstrap values <50—see [36]). On account ofthis there can be little confidence in the patterns and genetic associations observed in the dendrogram.Of the two seed sources originating from previous trials (of exotic genetic material), DMFF I was closestto the provenances of Anadalan, Bangat and Iling Gele from the island of Flores, whilst DMFF II wasclosest to the provenance Ulanu from Alor Island, but these associations are dubious and uncertain onaccount of low bootstrap values associated with their branches.
Figure 3. Unrooted neighbor joining (NJ) dendrogram for the 15 E. urophylla provenances (from which5 or more families were sampled) represented in the first cycle breeding population in China, numbersplaced at the head of branches are bootstrap values (based on 1000 iterations).
Bayesian cluster analysis performed using STRUCTURE software on the first cycle population(all provenances and families sampled) initially suggested the existence of 12 genetically homogenousclusters within this population; log-likelihoods of the number of clusters plateaued at K = 12. However,methodology of Evanno et al. [34] strongly supported K = 4 as the correct number of clusters withinthis population. As STRUCTURE has been found to work “extremely well for inferring the number ofclusters” even with Fst values down as low as 0.02 [37], there can be reasonable confidence in thesecluster numbers; in the present study only 5 of the 231 relevant pair-wise provenance comparisons(first cycle population) had Fst values of less than 0.02.
Whilst the 12 clusters indicated by the initial analysis showed no discernible associations withgeographic origins, the subsequently indicated 4 clusters aligned somewhat weakly with geographicprovenance origins (Figure 4a). Individuals originating from earlier trials in China (i.e., DMFF I andDMFF II) were predominantly allocated to cluster 2, individuals from Flores Island were predominantlyallocated to cluster 4 and those from Alor and Wetar were predominantly allocated to cluster 3.The members of cluster 1 were mixed, with only 34% or less of individuals originating from anyparticular island/seed source being allocated to this cluster. However, it must be noted that some
68

Forests 2018, 9, 372
individuals might have been assigned to the wrong cluster, as Fst needs to be over 0.05 to achieve anassignment accuracy of 95% or more [37]; in the present study, the average of Fst across all relevantpair wise provenance comparisons was 0.044.
Similar cluster analyses conducted on the third cycle population suggested that it could beseparated into just three genetically homogeneous clusters, i.e., K = 3 from the methodologyof Evanno et al. [34] (Figure 4b). Weak patterns were also evident in the membership of thesethree clusters, with progeny from trials E94, TJJ and E135 being predominantly assigned tocluster 1; the former two of these trials comprised predominantly provenances from the islandsof Wetar and Alor, whilst the latter trial itself comprised the second cycle population (and waspredominantly second generation trees). Progeny from trials E46 and E77 were predominantly allocatedto cluster 3; both of these trials contained predominantly progeny from provenances originating fromthe island of Flores. For cluster 2, membership was mixed with only 33% or less of individuals fromany source (field trial) being allocated to this cluster.
Figure 4. Proportions from each source group belonging to genetically homogenous clusters,determined by Bayesian cluster analyses with number of clusters determined by methods of Evannoet al. [34], for: (a) the first cycle population (presented by source groups comprising island/countryof origin); and, (b) the third cycle population (presented by source groups comprising field trials oforigin) of E. urophylla. Categories on X-axes represent geographic origins (parent locations), and theseare for: (a) DMFF = Dongmen Forest Farm, China; Flores = Flores Island, Indonesia; Alor = Alor Island,Indonesia; Wetar = Wetar Island, Indonesia; for (b) E46, E77, E94 and TJJ are first cycle family trials,and E135 is the second cycle family trial.
4. Discussion
4.1. First Cycle Population
The first cycle breeding population, which included over 25 E. urophylla provenances originatingfrom its natural distribution and 5 or possibly more exotic seed sources (though only 20 provenancesand 2 exotic seed sources sampled in this study), was established to provide a foundation for longterm breeding through recurrent cycles of selection and inter-mating. The intentionally broad selectionof provenances, representing 5 of the 7 islands where the species grows naturally in Indonesia andEast Timor, was anticipated to provide broad genetic diversity and hence a solid foundation for longterm genetic gains.
The diversity indices estimated in this study for the provenances included in the first cyclepopulation, Na = 5.7–16.0 alleles/locus and average Ho and He of 0.58 and 0.84 respectively, indicatethat it harbors reasonable levels of genetic diversity. While these results provide clear insights onthe breeding population, it must be emphasized that they do not necessarily reflect the populationgenetic parameters of the 20 provenances of the natural range, nor when considered collectively dothey reflect the genetic diversity within the species’ entire natural range. Five of the provenances wererepresented by four or fewer families (thus DNA samples were only collected from four or less trees
69

Forests 2018, 9, 372
per provenance), and the trees that were sampled as representatives of those provenances had beensubject to intensive artificial selection well before the sampling for this study was carried out.
Despite the above limitations, the genetic diversity parameters estimated for the first cycle breedingpopulation were similar to those found by previous studies carried out on natural populations of thisspecies not subjected to prior selection. The values estimated were also higher than those estimated fora number of other Eucalyptus species. For example, Jones et al. [38] obtained a He estimate of 0.62 froman E. globulus study that included 158 trees from four natural populations of the species, and Elliot andByrne [39] reported He estimates, by population, in E. occidentalis ranging from 0.30 to 0.41.
The relatively low genetic differentiation observed for the first cycle population, as indicated bythe pairwise Fst values that ranged from 0.008 to 0.108, was not unexpected. Similar values (for Fst)have been reported for natural populations of a range of other Eucalyptus species; i.e., Fst = 0.03 inE. populnea [40], Fst = 0.045 in E. marginata [41], Fst = 0.044–0.065 in E. camaldulensis [42], and Fst = 0.08 inE. globulus [38]. In the case of the species involved in the current study, House and Bell [4] suggestedthat pollen flow among populations and even among islands, mediated by birds and bats, may havecontributed to the low differentiation between its geographically disparate populations.
The diversity indices estimated in this study from material sampled from the first cycle population(Table 5) were generally slightly lower than those found for “populations” of E. urophylla’s native range bytwo previous studies, though most “populations” in those previous studies encompassed multiple naturalstand provenances. Payn et al.’s [13] study of 357 families from 19 populations (encompassing 45 naturalstand provenances), representing all 7 islands, reported average number of alleles (Na) per locus perpopulation of 7.7 to 12.0, expected heterozygosities (He) per population of 0.44 to 0.90 and observedheterozygosities (Ho) per population of 0.44 to 0.78. Tripiana et al.’s [15] study of 17 populations(encompassing 49 natural stand provenances) found Ho’s per population of 0.51 to 0.72 and average Na’sper marker loci, by population, of 5.2 to 10.6. As well as sampling differences arising from examination ofpopulations (each comprising multiple provenances) vs. individual provenances, the lower indices of thepresent study might also be due to the use of different microsatellite markers than what were used by theearlier studies and/or the effects of artificial selection (prior to sampling) on the provenances examined inthis present study.
Notable differences between this current study and both Payn et al.’s [13] and Tripiana et al.’s [15]studies regarding the indices estimated, were for Wright’s fixation index (FIS). In the current study theestimates for this index for the first cycle population ranged from 0.13 to 0.54 at a provenance level(while when averaged across the 15 provenances represented by ≥5 families it was 0.28), and weregenerally higher than those reported by Payn et al. [13], who found values (per population) of just0.017 to 0.150 and a little higher than those of Tripiana et al. [15], who reported values (per population)of 0.13 to 0.31. It is noteworthy that the latter authors suggested that the fixation index (FIS) valuesthey reported could have been overestimated, as their DNA samples were extracted from non-selectedseedlings that might have also included some seedlings originating from selfed seed. Given thatintensive selection for growth and form had been a factor in the breeding populations sampled in thisstudy, such a factor is quite unlikely to have contributed to our results.
Several factors might have contributed to the elevated fixation index values of the current study,compared to natural stand populations not subjected to artificial selection. In the first cycle populationa number of provenances had relatively high and positive fixation index (FIS) values (>0.30), suggestingpossible inbreeding; the provenance with the highest FIS value (Ulanu River, FIS = 0.54) had the lowestobserved heterozygosity (Ho = 0.33).
The positive and relatively high fixation index values (FIS) found in the first cycle populationof this study indicate a marked deviation from Hardy-Weinberg expectations, corroborating theHardy-Weinberg test results obtained by individual loci. The latter result was not unexpected;both Tripiana et al. [15] and Faria et al. [43] had previously observed deviations from theHardy-Weinberg equilibrium in natural stand genetic material of this species, a situation theyattributed to an excess of homozygotes across most microsatellite loci they examined. At least three
70

Forests 2018, 9, 372
factors may have contributed to this situation in the first cycle population studied here. Firstly,the presence of directional selection: a key requirement for equilibrium to be reached is the absenceof directional selection [44], yet when sampled for this study, prior heavy selective thinning hadalready been performed on the population resulting in less than 15% of the trees originally planted(and 75% of families) remaining. But while such selection may have contributed to deviation fromthe Hardy-Weinberg equilibrium, it’s hard to explain how the selection for traits of relatively lowheritabilities—Kien et al. [12] and Hodge and Dvorak [11] reported within provenance narrow senseheritabilities for growth traits of mostly less than 0.25—could have resulted in marked selectivepressure on the alleles of the 16 microsatellite loci examined in this study, as most or all of these lociwere likely neutral for traits of selection (growth and form). Secondly, the Wahlund effect; such aneffect was suggested by Tripiana et al. [15] based on results of their study on 17 “natural populations”of E. urophylla which included 49 provenances. Their aggregation of provenances resulted in their“populations” (within the total population they studied) having originated from wide geographicalranges and each likely “consisted of several possibly differentiated subpopulations”. But, for thepresent study, any Wahlund effect could not have come from lumping of geographically distinctgroups into single sampling units: we examined heterozygosity (in the first cycle) by provenance(Table 5) and all but two of the provenances were natural stand provenances. But rather than beingdue to lumping, it’s possible that variable levels of inbreeding and/or hybrid introgression withinprovenances might have resulted in some unknown substructuring within provenances resulting in anapparent Wahlund effect. On all of the islands of E. urophylla’s natural range except Timor, the speciesand E. alba are sympatric at elevations between 400 and 800 m, and occasional natural hybrids betweenthese two species have been recorded in their natural ranges [3,45]. On the island of Timor thetwo species occasionally co-occur [45]. Dvorak et al. [46] suggested that natural introgression withE. alba, may have had great influence on the genetic architecture of E. urophylla, as natural hybridizationand introgression is often apparent in field trials. Indeed, Hodge and Dvorak [11] noted that someE. urophylla provenances in their extensive trials had up to 50% of progeny being white-barked trees,which they considered as indicating high levels of introgression with E. alba. Bark characteristics ofthe two ‘pure’ species are distinct, with E. alba having a smooth white bark and E. urophylla havingrough brown fibrous bark that varies from a short basal stocking through to covering the trunk andextending to small branches [3,46]. Besides such introgression, inbreeding might also have beena factor contributing to an apparent Wahlund effect in the first cycle E. urophylla population (as wellas directly contributing to a violation of Hardy-Weinberg Equilibrium through creating homozygoticexcesses). While inbreeding due to selfing was unlikely, as House and Bell [4] found E. urophylla tobe predominantly outcrossing (at least in natural stands) with mean multi-locus outcrossing rates (t)of around 0.90 and low variations between individual trees in outcrossing rates, the species’ mixedmating system could have contributed to inbreeding. The latter authors had found high levels ofWright’s fixation index (FIS), as is the case in the current study, a situation they attributed to breedingamong close relatives (individuals with high coancestry) being prevalent in natural stands that hadresulted in a lower level of inbreeding compared to actual selfing. Thirdly, the amplification failure ofcertain alleles at individual loci resulted in some null alleles and likely led to some heterozygotes beinggenotyped as homozygotes [17]. We estimated that null alleles occurred at frequencies (per locus) of0.00 to 0.36 across the 16 microsatellite loci examined in the first cycle population. However, it must benoted that even at the seven loci where the frequencies of null alleles were low (below 0.05), significantdeviations from the Hardy–Weinberg Equilibrium still occurred.
Out of the total molecular genetic variance recorded in the first cycle population, the vast majority(96.6%) was associated with variation among individuals within provenances. Despite the artificialselection that this population had been subject to, the percentage of variance attributed to variationamong individuals was almost the same as that reported by Payn et al. [13], whose AMOVA showedthat variation among unselected individuals within populations (most of which incorporated a range ofgeographically proximal provenances) also accounted for around 96.6% of the total molecular variance.
71

Forests 2018, 9, 372
Even so, artificial selection probably played some role in the generally poor support (low bootstrapvalues), and hence lack of clear patterns, in the topology of the dendrogram illustrating genetic distancesand clustering of the provenances, that was generated for the first cycle population. This result wascontrary to results obtained by Payn et al. [13], whose dendrogram generated for 19 E. urophylla‘populations’ of the species’ native range coincided to a large extent with the geographic origins;their populations were generally clustered by island of origin. The latter authors identified two geneticallyhomogenous groups (clusters), with strong geographic patterns; one of the clusters was clearly dominatedby populations from the western islands (i.e., Flores, Pantar, Alor, Lomblen and Adanara) and the otherone by populations from the eastern islands (Wetar and Timor). A number of factors in addition toartificial selection likely contributed to the differences between Payn et al.’s [13] cluster analysis resultsand those obtained from the present study (for the first cycle population), including sampling differencesand loci differences, besides the fact that alignment of genetic differentiation with geographic origins isgenerally weak for E. urophylla for a variety of traits [4,13].
4.2. Third Cycle Population
The third cycle E. urophylla population involved in this study included families selected fromthe populations of both preceding cycles. This strategy was implemented in order to capture moregenetic diversity than would have likely been available from just the single somewhat limited trialthat comprised the second cycle population (it omitted selections from two of the first cycle trials).Indeed, the genetic diversity indices estimated for the third cycle population, with the total numberof alleles (Na) being 26.8, observed heterozygosity (Ho) being 0.60 and expected heterozygosity (He)being 0.88, indicate that it does indeed contain a reasonable amount of genetic diversity which is veryclose to what was found in the first cycle population. This result was obtained even though the thirdpopulation (and the sample obtained from it) was smaller, with respect to the number of families,than the first cycle population (and the sample obtained from it).
Departure from Hardy-Weinberg Equilibrium persisted in the third cycle too. This was indicatedby the expected and observed heterozygosity estimates, along with the value estimated for Wright’sfixation index (FIS), and the Hardy-Weinberg equilibrium probability test parameters for each oneof the 16 microsatellite loci. But, had panmixia been achieved among the individuals selected forretention in the trials of the first and second cycle populations, the descendent third cycle populationwould have been expected to have a somewhat closer approximation to equilibrium. But this was notthe case and we need to consider the reasons for this outcome.
One factor contributing to the third cycle population’s deviation from Hardy-Weinbergequilibrium would have been artificial selection. Parents of all families included were superiortrees selected within the field trials comprising the first and second cycle populations. Then, within thethird cycle population, additional selection had been carried out prior to sampling: at the time ofsampling for this study only 25% of trees originally planted remained in the trials, representing 158 outof the 195 families initially included.
Could the Wahlund effect, whatever its actual cause, also have persisted through to the thirdcycle and contributed to the observed departure from Equilibrium? This population comprisedfamilies that were second and third generation descendants from a wide range of provenances thatexhibited generally limited genetic differentiation, while a range of factors discussed above couldhave contributed to a substructuring of the population groups examined into gene pools differingin their allele frequencies. Substructuring might have arisen due to provenance origins, with effectspersisting through the cycles on account of inadequate panmixia, and/or due to some individualshaving originated through hybridization with E. alba, and/or having varying levels of inbreeding.
Panmixia might not been achieved in the first and second cycle populations due to a combinationof differences in phenology associated with geographic ancestral origins (i.e., between islands oforigin and even between provenances within islands) and/or spatial separation of the separatefield trials comprising the first cycle population. Swain et al. [47] found that ancestral provenance
72

Forests 2018, 9, 372
origins had a significant influence on genetic parameters into at least the second generation of anE. nitens breeding population (i.e., grand-maternal provenances effects were evident). Differences inphenology could have been a factor in maintenance of provenances effects through generations ofopen pollinated breeding.
Differences between the field trials of origin (i.e., immediate parents) in regards to averageeffective outcrossing rates between the selected parental plus-trees may also have been a contributorto substructuring. It is well known that outcrossing rates can affect the genetic quality of seedfrom Eucalyptus species [48], and despite that the overall genetic diversity of the third cyclepopulation seemed reasonable (compared to the first cycle population), outcrossing rates weren’texamined specifically.
Also, even into the third cycle population differential introgression (from E. alba) might still beleading to some substructuring. Parent tree selection in the first and second cycles was based on growthand form, irrespective of bark characteristics and/or leaf morphology, and thus some of the parent treesselected could well have carried significant amounts of E. alba alleles. In an intensive, well advancedbreeding program (>3 generations) for E. urophylla in Indonesia, it was found that even after severalgenerations of selection as E. urophylla, distinct E. alba traits were still present in some individuals [49].
Results from the cluster analyses of the third cycle population, when considered together withthose from the first cycle population, accord somewhat with results from the studies of House andBell [4] and Payn et al. [13], in that populations from the island Wetar exhibited a level of geneticdifferentiation from populations on Flores and closely adjacent islands, i.e., on Payn et al.’s [13]“western islands”. However, the cluster analysis together with the AMOVA carried out in the currentstudy also generally concur with House and Bell’s [4] conclusions in that genetic differences anddifferentiation between populations originating across E. urophylla’s natural range are generally small.
While the observed heterozygosity was around 30% below the expected heterzogosity in thethird cycle population, there was almost no change in the fixation index estimated for the firstcycle population. This lack of change suggests no change in genetic variability between the studiedpopulations. Reasons for the discrepancy between the observed and expected heterozygosity areuncertain, and even if inbreeding might have been expected to be a factor contributing to suchdiscrepancies in the first cycle population (as it mainly comprised natural stand progeny), in thethird cycle population lower rates of inbreeding were expected due to the crossing between unrelatedindividuals in the preceding one to two generations.
4.3. Practical Implications
Domesticated populations of many forest tree species have been found to show relatively littlereduction in overall expected heterozygosity compared to the native distributions from which theywere derived [50]. The current study shows that this also holds for the E. urophylla breeding populationsin China, at least up to the third cycle. Lefevre [50] also suggested that apparent genetic diversity inthe breeding population of a domesticated tree species might be increased, relative to the originalpopulations, due to crossing between differentiated native populations. However, results fromHouse and Bell [4], Tripiana et al. [15] and Payn et al. [13], as well as the current study, suggest thatthe differentiation between the native populations of E. urophylla is relatively minor. Payn et al. [13]found that significant gene flow among E. urophylla’s geographically separate island populationshas had continuous influence on the genetic diversity of the species in its natural range. Thus,crossing, within a diverse breeding population of this species, between geographically disparate nativeprovenances, might be unlikely to result in much change to genetic diversity. Indeed the resultsobtained from the third cycle population of this current study support this.
Even so, evidence from other studies attest to real prospects for increasing diversity somewhatthrough future E. urophylla breeding cycles in China. Across 4 generations of E. urophylla breedingin Brazil, Pigato and Lopes [51] found genetic distances between individuals to be markedly higherin their third and fourth generations than their first and second generations, which they took as
73

Forests 2018, 9, 372
indicating an increase in genetic variability with the advance of their program. In an E. regnansprogram in New Zealand that had progressed through three cycles of breeding, Suontama et al. [52]found that some of their third cycle field trials provided the largest heritabilities and additive geneticvariances (for height at age 3 years).
In order to better understand the genetic architecture of the current and future cycles of theE. urophylla breeding program in China, it would be of value in the future assessments to score treesselected (as parents for a subsequent cycle) for E. alba characteristics. Such characteristics include largeand roundish leaves with a blunt tip and/or smooth white bark on the mature tree stems, compared toE. urophylla with broad-lanceolate leaves narrowing abruptly to a short point and a variable stocking ofrough, sub-fibrous bark [3,45]. Such phenotypic data would enable some examination of the potentialproportion of individuals that potentially express some level of introgression, and hence enable a betterunderstanding of sources of variation within the breeding population.
The question of whether panmixia can be achieved in the E. urophylla breeding populations studiedis also of critical importance; results from the current study suggest that it has not been achievedin at least the first and/or second cycles. An assessment of phenology to understand any temporaldifferences on account of ancestral geographical origins (i.e., island and provenances within islandorigins) is needed to understand if there is asynchronous flowering within the third cycle population,a process that might be creating unwanted substructure within the population. If real substructuresand/or barriers to free interbreeding do exist, then measures such as controlled pollinations and/orsublining of the main population might be required to manage barriers to panmixia and preventunwanted substructures limiting the potential for future genetic gains.
That null alleles were recorded at relatively high frequencies at some of the loci examined in both thefirst and third cycle populations, indicates a possible shortcoming in the current study’s methodology.Such null alleles might be biasing some parameter estimates as they can result in inflated heterozygotedeficits, and decreased estimates of Ho, He, and even genetic diversity [53]. For all or at least a randomsubset of the samples examined in the current study, no repeated marker amplifications were carried out,so estimation of error rates on locus scoring was not possible. Although this shortcoming is commonamong the majority of published studies on microsatellites in eucalypts, as well as in other plants (see [17]),it would be better if it was avoided. In any future work on E. urophylla and/or other species, we wouldundertake repeated marker amplification of at least a random subset (10–15%) of samples, to enableerror rates to be calculated from the number of inconsistent genotypes between the first and secondamplification attempts [54].
5. Conclusions
On account of a number of factors, including the origin of genetic materials used to developthe founding (first cycle) population for the E. urophylla breeding program in China, deficits ofheterozygotes were found for the 16 microsatellite loci examined in both the founding (first cycle) andthe descendant (third cycle) breeding populations of E. urophylla. Even so, the high allelic diversityobserved in the founding population was maintained through cycles of intensive selection into thedescendant third cycle population.
Most of the genetic variation within the two populations examined in this study existed amongindividuals, rather than between provenances or seed sources. This finding reaffirms that the numberof (unrelated) individuals included in the populations was the key to capturing adequate geneticvariation, rather than the number of seed sources/provenances represented by such individuals.Similarly, the results suggested that maintaining a high number of unrelated individuals in descendantpopulations should contribute to maintenance of genetic variation.
In general, the level of genetic diversity was maintained through the successive cycles observedin the current study. This indicates good prospects for maintaining if not increasing diversity throughfuture descendant cycles of breeding E. urophylla.
74

Forests 2018, 9, 372
6. Data Archiving
The data obtained in the course of this study, consisting of genotypic data for 16 microsatellite locifrom 202 individuals of the first cycle population and 125 individuals from the third cycle populationalong with the necessary pedigree data, will be submitted to an appropriate online data repositoryupon article acceptance.
Supplementary Materials: The following are available online at http://www.mdpi.com/1999-4907/9/7/372/s1,Table S1: Details of the E. urophylla trials comprising the first, second and third cycle breeding populations for thisspecies in China. Table S2: Additional details on Trial T164 (third cycle breeding population). Figure S1: Locationsof the E. urophylla trials comprising the first, second and third cycle breeding populations for this species in China.
Author Contributions: W.L. and J.L. conceived and designed the study; W.L. and L.Z. organized and conductedthe trial sampling and managed the samples; W.L. carried out the laboratory analyses; W.L., L.Z., J.L. and R.J.A.collated, managed and analyzed data; W.L. and R.J.A. wrote the paper.
Funding: This research was funded by Fundamental Research Funds of Chinese Academy of Forestry project[project number CAFYBB2017MA022], National Natural Science Foundation of China (project number 31700599).
Acknowledgments: We are grateful to Lan Jun from Dongmen State Forest Farm for the assistance in accessingthe field trials sampled in this study, and to Paul Macdonell from Queensland, Australia, for preparation ofFigure 1. Two anonymous reviewers provided numerous suggestions for significantly improving the content ofthis paper and we greatly appreciate their guidance.
Conflicts of Interest: The authors declare no conflict of interest.
References
1. Pryor, L.D.; Williams, E.R.; Gunn, B.V. A morphometric analysis of Eucalyptus urophylla and some relatedtaxa with descriptions of two new species. Aust. Syst. Bot. 1995, 8, 57–70. [CrossRef]
2. Eldridge, K.; Davidson, J.; Harwood, C.; Van Wyk, G. Eucalypt Domestication and Breeding; Oxford UniversityPress: Oxford, UK, 1993; ISBN 019854149X9780198541493.
3. Centre for Agriculture and Biosciences International. Eucalyptus urophylla. In The Forestry Compendium:Global Module; CAB International: Oxon, UK, 2000.
4. House, A.P.N.; Bell, J.C. Isozyme variation and mating system in Eucalyptus urophylla S.T. Blake. Silvae Genetica1994, 43, 167–176.
5. Pepe, B.; Surata, K.; Suhartono, F.; Sipayung, M.; Purwanto, A.; Dvorak, W.S. Conservation status of naturalpopulations of Eucalyptus urophylla in Indonesia and international efforts to protect dwindling genepools.For. Gen. Res. 2004, 31, 62–64.
6. Arnold, R.J.; Xie, Y.J.; Midgley, S.J.; Luo, J.Z.; Chen, X.F. Emergence and rise of eucalypt veneer production inChina. Int. For. Rev. 2013, 15, 33–47. [CrossRef]
7. Turnbull, J.W. Eucalypts in China. Aust. For. 1981, 44, 222–234. [CrossRef]8. Wei, J. Research achievements of the Dongmen Eucalyptus demonstration project, Guangxi State Forest Farm
Company, Guangxi, China. In Proceedings of the Regional Expert Consultation on Eucalyptus, Bangkok,Thailand, 4–8 October 1996; Kashio, M., White, K., Eds.; FAO Regional Office for Asia and the Pacific:Bangkok, Thailand, 1996; Volume II, pp. 33–45.
9. Turnbull, J.W. Development of Sustainable Forestry Plantations in China: A Review; ACIAR Impact AssessmentSeries Report No. 45; Australian Centre for International Agricultural Research: Canberra, Australia, 2007;ISBN 1832-1879.
10. Xie, Y.; Arnold, R.J.; Wu, Z.; Chen, S.; Du, A.; Luo, J. Advances in eucalypt research in China. Front. Agric. Sci. Eng.2017, 4, 380–390. [CrossRef]
11. Hodge, G.R.; Dvorak, W.S. Provenance variation and within-provenance genetic parameters in Eucalyptusurophylla, across 125 test sites in Brazil, Colombia, Mexico, South Africa and Venezuela. Tree Genet. Genomes2015, 11, 57. [CrossRef]
12. Kien, N.D.; Jansson, G.; Harwood, C.; Thinh, H.H. Genetic control of growth and form in Eucalyptus urophyllain northern Vietnam. J. Trop. For. Sci. 2009, 21, 50–65.
13. Payn, K.G.; Dvorak, W.S.; Janse, B.J.H.; Myburg, A.A. Microsatellite diversity and genetic structure ofthe commercially important tropical tree species Eucalyptus urophylla, endemic to seven islands in easternIndonesia. Tree Genet. Genomes 2008, 4, 519–530. [CrossRef]
75

Forests 2018, 9, 372
14. Payn, K.G.; Dvorak, W.S.; Myburg, A.A. Chloroplast DNA phylogeography reveals the island colonisationroute of Eucalyptus urophylla (Myrtaceae). Aust. J. Bot. 2007, 55, 673–683. [CrossRef]
15. Tripiana, V.T.; Bourgeoi, S.M.; Verhaegen, D.V.; Vigneron, P.V.; Bouvet, J.M.M. Combining microsatellites,growth, and adaptive traits for managing in situ genetic resources of Eucalyptus urophylla. Can. J. For. Res.2007, 37, 773–785. [CrossRef]
16. Wahlund, S. Zusammensetzung von population und correlation serscheinung vom standpunkt dervererbungslehre aus betrachtet. Hereditas 1928, 11, 65–106. [CrossRef]
17. Selkoeobe, K.A.; Toonen, R.J. Microsatellites for ecologists: A practical guide to using and evaluatingmicrosatellite markers. Ecol. Lett. 2006, 9, 615–629. [CrossRef] [PubMed]
18. Nicolle, D. Classification of the Eucalypts (Angophora, Corymbia and Eucalyptus) Version 3. Available online:http://www.dn.com.au/Classification-Of-The-Eucalypts.pdf (accessed on 19 March 2018).
19. Arnold, R.J.; Luo, J.Z.; Lu, W.H.; Wang, C.B.; Lin, Y. Co-operative Improvement of Key Eucalypt Species in China.In Scientific Cultivation and Green Development to Enhance the Sustainability of Eucalypt Plantations, Proceedings ofIUFRO Eucalypt Conference, Zhanjiang, China, 21–24 October 2015; IUFRO: Vienna, Austria, 2015; p. 53.
20. Brooker, M.I.H. A new classification of the genus Eucalyptus L’Hér. (Myrtaceae). Aust. Syst. Bot. 2000, 13,79–148. [CrossRef]
21. Wang, Y. Development of EST-SSR markers and their application to construction of genetic maps inEucalyptus. Ph.D. Thesis, Nanjing Forestry University, Nanjing, China, 2009.
22. He, X.; Wang, Y.; Li, F.; Weng, Q.; Li, M.; Xu, L.; Shi, J.; Gan, S. Development of 198 novel EST-derivedmicrosatellites in Eucalyptus (Myrtaceae). Am. J. Bot. 2012, 99, e134–e148. [CrossRef] [PubMed]
23. Brondani, R.P.V.; Williams, E.R.; Brondani, C.; Grattapaglia, D. A microsatellite-based consensus linkagemap for species of Eucalyptus and a novel set of 230 microsatellite markers for the genus. BMC Plant Biol.2006, 6, 20. [CrossRef] [PubMed]
24. Wang, Y.H.; Bible, P.; Loganantharaj, R.; Upadhyaya, H.D. Identification of SSR markers associated withheight using pool-based genome-wide association mapping in sorghum. Mol. Breed. 2012, 30, 281–292.[CrossRef]
25. Li, F.; Gan, S. An optimised protocol for fluorescent-dUTP based SSR genotyping and its application togenetic mapping in Eucalyptus. Silvae Genetica 2011, 60, 18–25. [CrossRef]
26. Rousset, F. Genepop’007: A complete reimplementation of the Genepop software for Windows and Linux.Mol. Ecol. Resour. 2008, 8, 103–106. [CrossRef] [PubMed]
27. Liu, K.; Muse, S.V. PowerMarker: An integrated analysis environment for genetic marker analysis.Bioinformatics 2005, 21, 2128–2129. [CrossRef] [PubMed]
28. Peakall, R.; Smouse, P. GenAlEx 6: Genetic analysis in Excel. Population genetic software for teaching andresearch. Mol. Ecol. Notes 2006, 6, 288–295. [CrossRef]
29. Song, Z.J.; Yang, H.Y.; Weng, Q.J.; Zhou, C.P.; Li, F.G.; Li, M.; Lu, W.H.; Luo, J.Z.; Gan, S.M. Genetic Diversityand Selective Loci in Eucalyptus tereticornis Populations. Sci. Silvae Sin. 2016, 52, 39–47. [CrossRef]
30. FSTAT v2.9.3.2. Available online: http://www2.unil.ch/popgen/softwares/fstat.htm (accessed on14 October 2016).
31. Kumar, S.; Stecher, G.; Tamura, K. MEGA7: Molecular Evolutionary Genetics Analysis Version 7.0 for BiggerDatasets. Mol. Biol. Evol. 2016, 33, 1870–1874. [CrossRef] [PubMed]
32. Pritchard, J.K.; Stephens, M.; Donnelly, P. Inference of population structure using multilocus genotype data.Genetics 2000, 155, 945–959. [PubMed]
33. Pritchard, J.K.; Wen, X.; Falush, D. Documentation for structure software: Version 2.3. J. Pediatr. Surg. 2010,41, 55–63.
34. Evanno, G.; Regnaut, S.; Goudet, J. Detecting the number of clusters of individuals using the softwareSTRUCTURE: A simulation study. Mol. Ecol. 2005, 14, 2611–2620. [CrossRef] [PubMed]
35. Earl, D.A.; von Holdt, B.M. STRUCTURE HARVESTER: A website and program for visualizing STRUCTUREoutput and implementing the Evanno method. Conserv. Genet. Resour. 2012, 4, 359–361. [CrossRef]
36. Hillis, D.M.; Bull, J.J. An empirical test of bootstrapping as a method for assessing confidence in phylogeneticanalysis. Syst. Biol. 1993, 42, 82–192. [CrossRef]
37. Latch, E.K.; Dharmarajan, G.; Glaubitz, J.C.; Rhodes, O.E. Relative performance of Bayesian clusteringsoftware for inferring population substructure and individual assignment at low levels of populationdifferentiation. Conserv. Genet. 2006, 7, 295–302. [CrossRef]
76

Forests 2018, 9, 372
38. Jones, R.C.; Steane, D.A.; Potts, B.M.; Vaillancourt, R.E. Microsatellite and morphological analysis ofEucalyptus globulus populations. Can. J. For. Res. 2002, 32, 59–66. [CrossRef]
39. Elliott, C.; Byrne, M. Genetic diversity within and between natural populations of Eucalyptus occidentalis(Myrtaceae). Silvae Genetica 2003, 52, 169–173.
40. Holman, J.E.; Hughes, J.M.; Fensham, R.J. A morphological cline in Eucalyptus: A genetic perspective.Mol. Ecol. 2003, 12, 3013–3025. [CrossRef] [PubMed]
41. Wheeler, M.A.; Byrne, M.; McComb, J.A. Little genetic differentiation within the dominant forest tree,Eucalyptus marginata (Myrtaceae) of south-western Australia. Silvae Genetica 2003, 52, 254–259.
42. Butcher, P.A.; Otero, A.; McDonald, M.W.; Moran, G.F. Nuclear RFLP variation in Eucalyptus camaldulensisDehnh. from northern Australia. Heredity 2002, 88, 402–412. [CrossRef] [PubMed]
43. Faria, D.A.; Mamani, E.M.C.; Pappas, M.R.; Pappas, G.J.; Grattapaglia, D. A selected set of EST-derivedmicrosatellites, polymorphic and transferable across 6 species of Eucalyptus. J. Heredity 2010, 101, 512–520.[CrossRef] [PubMed]
44. Hartl, D.L.; Clarke, A.G. Principles of Population Genetics; Sinauer Associates: Sunderland, MA, USA, 2007;ISBN 9780878933068.
45. Martin, B.; Cossalter, C. Les Eucalyptus des îles de la Sonde. Bois For. Trop. 1975, 164, 3–14.46. Dvorak, W.S.; Hodge, G.R.; Payn, K.G. The conservation and breeding of Eucalyptus urophylla: A case study
to better protect important populations and improve productivity. South For. 2008, 70, 77–85. [CrossRef]47. Swain, T.L.; Verryn, S.D.; Laing, M.D. An investigation of assumptions made in estimating genetic parameters
and predicting genetic gain in a Eucalyptus nitens breeding programme in South Africa. New For. 2014, 46,7–21. [CrossRef]
48. Burgess, I.P.; Williams, E.R.; Bell, J.C.; Harwood, C.E.; Owen, J.V. The effect of outcrossing rate on the growthof selected families of Eucalyptus grandis. Silvae Genetica 1996, 45, 97–100.
49. Clegg, P.A.; Toba Pulp Lestari, Medan, Sumatra, Indonesia. Personal communication, 2018.50. Lefevre, F. Human impacts on forest genetic resources in the temperate zone: An updated review. For. Ecol. Manag.
2004, 197, 257–271. [CrossRef]51. Pigato, S.M.P.C.; Lopes, C.R. The evaluation of genetic variability in four generations of Eucalyptus urophylla
S.T. Blake by RAPD marker. Sci. For. 2001, 60, 119–133.52. Suontama, M.; Low, C.B.; Stovold, G.T.; Miller, M.A.; Fleet, K.R.; Li, Y.; Dungey, H.S. Genetic parameters and
genetic gains across three breeding cycles for growth and form traits of Eucalyptus regnans in New Zealand.Tree Genet. Genomes 2015, 11, 133. [CrossRef]
53. Paetkau, D.; Waits, L.P.; Clarkson, P.L. An empirical evaluation of genetic distance statistics usingmicrosatellite data from bear (Ursidae) populations. Genetics 1997, 147, 1943–1957. [PubMed]
54. Hoffman, J.I.; Amos, W. Microsatellite genotyping errors: Detection approaches, common sources andconsequences for paternal exclusion. Mol. Ecol. 2005, 14, 599–612. [CrossRef] [PubMed]
© 2018 by the authors. Licensee MDPI, Basel, Switzerland. This article is an open accessarticle distributed under the terms and conditions of the Creative Commons Attribution(CC BY) license (http://creativecommons.org/licenses/by/4.0/).
77


Article
Identification of miRNAs Associated with GraftUnion Development in Pecan [Carya illinoinensis(Wangenh.) K. Koch]
Zhenghai Mo 1,2,3, Gang Feng 1, Wenchuan Su 1, Zhuangzhuang Liu 1 and Fangren Peng 1,*
1 Co-Innovation Center for the Sustainable Forestry in Southern China, Nanjing Forestry University,Nanjing 210037, China; [email protected] (Z.M.); [email protected] (G.F.);[email protected] (W.S.); [email protected] (Z.L.)
2 Institute of Botany, Jiangsu Province and Chinese Academy of Sciences, Nanjing 210014, China3 Green Universe Pecan Science and Technology Co., Ltd., 38 Muxuyuan Street, Nanjing 210007, China* Correspondence: [email protected]; Tel.: +86-025-8542-7995
Received: 23 May 2018; Accepted: 31 July 2018; Published: 3 August 2018
Abstract: Pecan [Carya illinoinensis (Wangenh.) K. Koch] is a high-value fruit tree with a longjuvenile period. The fruiting process of pecan seedlings can be largely accelerated through grafting.As non-coding small RNAs, plant miRNAs participate in various biological processes throughnegative regulation of gene expression. To reveal the roles of miRNAs in the graft union developmentof pecan, four small RNA libraries were constructed from the graft union at days 0, 8, 15, and 30 aftergrafting. A total of 47 conserved miRNAs belonging to 31 families and 39 novel miRNAs wereidentified. For identified miRNAs, 584 target genes were bioinformatically predicted, and 266 ofthem were annotated; 29 miRNAs (including 16 conserved and 13 novel miRNAs) were differentiallyexpressed during the graft process. The expression profiles of 12 miRNA were further validated byquantitative reverse transcription PCR (qRT-PCR). In addition, qRT-PCR revealed that the expressionlevels of 3 target genes were negatively correlated with their corresponding miRNAs. We found thatmiRS26 might be involved in callus formation; miR156, miR160, miR164, miR166, and miRS10 mightbe associated with vascular bundle formation. These results indicate that the miRNA-mediated generegulations play important roles in the graft union development of pecan.
Keywords: grafting; pecan; miRNA; graft union; sequencing
1. Introduction
Grafting, as an asexual propagation technology, has been applied extensively in fruit trees to aidthe adaptation of scion cultivars to potentially disadvantageous soil and climatic conditions, avoid thejuvenile period, increase productivity, and improve quality [1]. Successful grafting is a complicatedprocess that involves the initial adhesion of rootstock and scion, callus formation, and vascularconnection at the graft union [2]. It has been reported that phytohormones (especially auxin)and antioxidant enzymes are important players during graft union development [3–6]. At themolecular level, a successful graft is controlled by numerous genes in plants, especially for thegenes involved in hormone signaling. cDNA amplified fragment length polymorphism (AFLP) analysisof graft union in hickory [Carya tomentosa (Lam.) Nutt.] indicated that some genes related to signaltransduction, metabolism, auxin transportation, wound response, cell cycle, and cell wall synthesiswere responsive to grafting [7]. In Arabidopsis, genes involved in hormone signaling, wounding,and cellular debris clearing were induced during graft union development [8]. In grapevine, graft unionformation activated the differential expression of genes participated in secondary metabolism, cell wallmodification, and signaling [9]. Transcriptomic analysis of graft union in Litchi chinensis Sonn. revealed
Forests 2018, 9, 472; doi:10.3390/f9080472 www.mdpi.com/journal/forests79

Forests 2018, 9, 472
that 9 unigenes annotated in auxin signaling had higher expression levels in the compatible graftscompared with the incompatible ones [10].
miRNAs, a category of non-coding RNAs with approximate 22 nucleotides (nt), are criticalregulatory molecules of gene expression; they induce either post-transcriptional degradation ortranslational inhibition of their target mRNAs [11]. In plants, miRNAs bind to their target mRNAsequences with perfect or near-perfect complementarity, and negatively regulate gene expressionmainly via targeted cleavage [12]. The binding sites of plant miRNAs are almost exclusively locatedwithin the open reading frames of their target genes [13]. In recent years, with the development ofsecond-generation sequencing technology, miRNAs could be identified from non-model plants [14,15].Numerous studies have suggested that miRNAs play regulatory roles in plant resistance to biotic andabiotic stresses, such as cold [16], heat [17], and virus infection [18]. In addition, miRNAs have beenconfirmed to participate in various development processes [19–21]. In grafted plants, miRNA has beenreported to be involved in the regulation of scion and rootstock interaction. In watermelon cultivation,grafting is commonly used to increase resistance to environmental stresses. With high-throughputsequencing, Liu et al. [22] found that miRNAs would differentially express in grafted watermelonto regulate plant adaptation to stresses. Li et al. [23] identified grafted-responsive miRNAs incucumber/pumpkin, pumpkin/cucumber heterografts, and found that miRNAs were involved inregulating physiological process of hetrografts. Khaldun et al. [24] investigated the expression profilesof miRNAs within a distant grafting of tomato/goji, and the result showed that when comparedwith tomato autografts, tomato/goji heterografts had 43 and 163 differently expressed miRNAs inshoot and fruit, respectively. Although mounting evidence indicates the involvement of miRNAs inscion-rootstock interactions, there was only one published report concerning the functions of miRNAswhich participate in the graft process, which was presented in hickory [25].
Pecan [Carya illinoinensis (Wangenh.) K. Koch] is an economic nut tree which belongs to the familyJuglandaceae and genus Carya. It has been widely planted in China in recent years. As a woody plant,the juvenile phase of pecan seedlings is very long, lasting about 10 years. To accelerate the fruit bearingprocess, grafting is widely used in the cultivation of pecan, by which, trees can begin to producefruit in 5–7 years. In industrial pecan cultivation, grafting success rate is very low; 75% graftingsuccess is considered to be good [26]. Nowadays, in China, using the graft technique of patch buddingcan sometimes achieve a grafting success of 90% for some cultivars of pecan, such as ‘Pawnee’,‘Stuart’, and ‘Shaoxing’. However, a low grafting success rate still exists in some cultivars, such as‘Mahan’ and ‘Jinhua’. To improve the graft survival rate of industrial pecan, a better understandingof the mechanism associated with the graft union development is needed. In our previous studies,morphological, proteomic, and transcriptomic analyses have been conducted in the graft process ofpecan [27,28]. In this work, we investigated miRNA expression during the graft process of pecan usingRNA-sequencing technology. Four small RNA libraries from the graft union collected at differenttime points (days 0, 8, 15, and 30 after grafting) were constructed, and the differentially expressedmiRNAs were analyzed. Subsequently, the potential roles of these miRNAs and their target geneswere discussed.
2. Materials and Methods
2.1. Plant Materials
Pecan homograft was performed through patch grafting in August at the experimental farm atNanjing Forestry University. The pecan cultivar ‘Pawnee’ was used as scion, and one-year-old seedlingspropagated from pecan seeds were used as rootstock. Based on our morphological observation ofgraft union development, samples from the graft unions (approximately 5 mm in length, the buddingsegment that includes the tissues of scion, and the developing xylem of rootstock) were collected atday 0 (ungrafted materials, and were used as control), day 8 (the stage of initial callus proliferation),day 15 (the stage of massive callus proliferation along with cambium establishment), and day 30 (the stage
80

Forests 2018, 9, 472
of vascular bundles formation). For each sample, three different graft unions were pooled and frozen inliquid nitrogen immediately, and then stored at −80 ◦C until required for use.
2.2. RNA Extraction and Deep Sequencing of Small RNA
Total RNA was isolated from graft unions at four time points using the trizol reagent (Invitrogen,Carlsbad, CA, USA), following the manufacturer’s instructions, and then digested with RNA-freeDNase I (Takara, Kyoto, Japan) to degrade genomic DNA. Sequencing libraries were constructedby NEBNext® UltraTM small RNA Sample Library Prep Kit for Illumina® (NEB, Boston, MA, USA)according to the protocol. Briefly, approximately 1.5 μg RNA was ligated to 5′ and 3′ adapter byT4 RNA ligase for each of the samples. Next, reverse transcription synthetic first chain and PCRamplification was conducted. The resulting PCR products were subjected to polyacrylamide gelelectrophoresis, and the 140–160 bp fragments were screened for sequencing. The sequencing raw datawas deposited in the NCBI Sequence Read Archive (SRA) with the accession number SRP131300.
2.3. Sequence Analysis and Target Prediction of Pecan miRNA
Following sequencing, raw reads of the four libraries were processed through in-house Perl scripts.In this step, clean reads were obtained by removing low-quality reads and trimming adapter sequences.Reads smaller than 18 nt or longer than 30 nt were also abandoned. By using Bowtie software, cleanreads with 18–30 nt in length were subsequently blasted against the Rfam (http://www.sanger.ac.uk/software/Rfam) and Repbase databases (http://www.girinst.org/) to filter rRNA, tRNA, snRNA,snoRNA, other ncRNA and repeats. The remaining sequences were aligned with the miRBase 21.0database (http://www.mirbase.org/index.shtml) to identify putative conserved miRNAs, allowingno more than two mismatches. The remaining non-annotated reads were mapped to the pecan graftunion development’s transcriptome data (accession number SRP118757 and GGRT00000000 in NCBIdatabase) to predict potential novel miRNAs by miRDeep2. The criteria for novel miRNA identificationwas as follows: (1) miRNA precursors could form hairpin-like structures; (2) miRNA should havea corresponding miRNA * in sequencing data, and the two could form a duplex with 2 nt 3′ overhangs;(3) in miRNA *-deficient cases, candidate miRNAs should derive from multiple and independentlibraries [29]. The secondary structures of novel miRNAs were predicted by Randfold software.Putative targets of miRNA were predicted by TargetFinder, and then annotated based on the databasesof Nr (NCBI non-redundant protein sequences), Protein family (Pfam) and GO (Gene Ontology).The expression value of putative target genes were obtained from the supplementary materials of ourpreviously published paper (http://www.mdpi.com/2073-4425/9/2/71/s1) [27].
2.4. Analysis of Differentially Expressed miRNAs
To calculate the expression levels of miRNAs in four libraries, miRNA counts were first normalizedas transcripts per million (TPM) using the following formula: TPM = mapped read count/total reads× 106. Fold changes of miRNA in three comparisons (day 8/day 0, day 15/day 0, and day 30/day 0)were analyzed by IDEG6, and the miRNA were considered to be differentially expressed with thecorrected p value (q value) < 0.05 and absolute log2 fold change >1.
2.5. Quantitative Real-Time PCR (qRT-PCR)
To validate the expression profiles of miRNAs, graft unions were collected at days 0, 8, 15,and 30 after grafting, with three biological repetitions. miRNAs were isolated by the Universal PlantmicroRNA Kit (BioTeke, Beijing, China). The subsequent reverse transcription and real-time PCRwere carried out using BioTeke miRNA First Strand cDNA synthesis kit (BioTeke, Beijing, China) andBioTeke miRNA qPCR Detection Kit (BioTeke, Beijing, China), respectively. For target gene detection,total RNAs were extracted from the same samples, as mentioned above. First-strand cDNA synthesisand the following real-time qPCR were conducted by Prime-Script™ II First Strand cDNA synthesis kit(Takara, Dalian, China) and SYBR Premix Ex Taq™ II kit (Takara, Dalian, China), respectively. Primers
81

Forests 2018, 9, 472
were designed based on the sequence of corresponding miRNAs and mRNAs, and were availablein Table S1. 5.8S rRNA was chosen as an internal reference for miRNA normalization, while theActin was used as an endogenous reference for mRNA analysis. All qPCR was run in three technicalreplicates. The relative expression levels of miRNAs and mRNA were calculated using the comparative2−ΔΔCt method.
To explore tissue-specific expression, miRNAs and total RNAs were extracted from differentorgans, including wound-induced calluses, xylem, phloem, and leaves. The qPCR primes are listedin Table S1.
3. Results
3.1. Analysis of Small RNA Sequencing
To identify miRNAs associated with graft union development in pecan, four small RNA librarieswere constructed from the graft unions harvested at days 0, 8, 15, and 30 after grafting. Deep sequencingproduced 20,691,228, 21,849,708, 22,850,876, and 34,439,863 raw reads for the four libraries, respectively(Table 1). After removing low-quality reads, 17,060,180 (day 0), 19,032,782 (day 8), 19,780,849 (day 15),and 28,632,161 (day 30) clean reads were obtained. Among the clean reads, 6,579,996 (day 0),6,865,905 (day 8), 6,935,788 (day 15), and 7,815,688 (day 30) reads were unique, and 1,506,852 (day 0),2,537,261 (day 8), 1,759,479 (day 15), and 2,290,283 (day 30) reads could map to the reference unigene(accession number GGRT00000000 in NCBI database). By aligning to Rfam and Repbase database,clean reads were classified into rRNA, snRNA, snoRNA, tRNA, and repeat-associated sRNA for almostall the libraries, except for day 0, which had no snRNA. The remaining unannotated reads were usedfor conserved miRNA identification and novel miRNAs predication.
The length distribution of unique clean reads ranging from 18 nt to 30 nt was summarized(Figure 1). We found that the most abundant class was the 24 nt sRNAs, which was consistent withprevious studies in hickory [25,30,31]. The second most numerous was 23 nt sRNAs, and the majorityof the sRNAs were generally distributed between 21 and 24 nt.
Table 1. Analysis of small RNAs from libraries of days 0, 8, 15, and 30 in pecan.
Libraries Day 0 Day 8 Day 15 Day 30
Raw reads 20,691,228 21,849,708 22,850,876 34,439,863Clean reads 17,060,180 19,032,782 19,780,849 28,632,161
Unique reads 6,579,996 6,865,905 6,935,788 7,815,688rRNA 7,103,064 6,569,083 8,616,736 12,273,558
snRNA 0 1 1 54snoRNA 4481 32,307 6889 6924
tRNA 278,816 217,321 280,911 279,464Repbase 19,799 31,233 19,735 24,141
Unannotated reads 9,654,020 12,182,837 10,856,577 16,048,020Mapped reads 1,506,852 2,537,261 1,759,479 2,290,283
Note: Raw reads, reads generated from squencing platform; Clean reads, reads after quality control; Unique reads,clean reads after clustering; rRNA, ribosomal ribonucleic acid; snRNA, small nuclear ribonucleic acid; tRNA,transfer RNA; Repbase, repeat sequence; Unannotated reads, reads can not align to Rfam and Repbase databases;Mapped reads, the unannotated reads that can map to reference unigenes.
82

Forests 2018, 9, 472
Figure 1. Size distribution of sRNAs from the libraries of days 0, 8, 15, and 30 in pecan. For each library,sRNAs were based on the total unique clean reads.
3.2. Identification of Conserved miRNAs in Pecan
To obtain conserved miRNAs in pecan, all unannotated reads in Rfam and Repbase were pooledand used to do a blast against miRbase, allowing two mismatches. Based on miRbase results andhairpin prediction, a total of 47 conserved miRNAs with their corresponding star strands wereidentified from the four libraries (Table S2). These 47 conserved miRNAs were classified into 31 miRNAfamilies, among them, the miR482 family possessed the maximum members (four), followed bymiR166 and miR396, while the remaining families have only one or two members. The 47 miRNAsshowed great difference in expression levels, of these, miR159a–b, miR166a–c, and miR319a–b hadrelatively high expression level, in contrast, members such as miR4998, miR5998, miR6135, miR7504,and miR7717 presented low expression levels.
3.3. Identification of Novel miRNAs in Pecan
To identify novel miRNAs, all the remaining unannotated sRNAs were blasted against ourtranscriptome data. In total, 39 novel miRNAs corresponding to 39 distinct precursor sequences wereobtained from the four libraries (Table S3), and all the precursors of these candidate miRNAs werefound to have typical stem-loop structures (Figure S1). Star sequences were detected for all the novelmiRNAs, an important evidence of being bona fide miRNAs [29]. The most common base for thefirst nucleotide of novel miRNAs was Uracil (U), a common pattern observed in other studies [25,32].The length of these mature miRNAs ranged from 18 nt to 25 nt, and the most common was 24 nt.The range of the minimal free energy (MFE) for these novel miRNA precursors was from −96.9 to−31.8 kcal/mol, with −69.0 kcal/mol on average. The expression level of most novel miRNAs weregenerally low (TPM < 100), while some miRNAs such as miRS19 and miRS33 presented high levelwith dynamic TPM > 1000.
3.4. Prediction and Functional Annotation of Target Genes of miRNAs
We searched for putative targets by blasting the miRNAs against our transcriptome sequenceswith perfect or near-perfect complementarity. As a result, a total of 584 targets were predicted for the86 miRNAs (with an average of 6.8 targets per miRNA), and 266 of them were annotated (Table S4).For functional classification, these targets were subjected to GO (Gene Ontology) analysis. As shown
83

Forests 2018, 9, 472
in Figure 2, targets of miRNAs fell into 17 biological processes, with the three most abundant beingmetabolic process, cellular process, and single-organism process. Targets in the cellular componentcategory were classified into 11 terms, with the three most frequent being cell, cell part, and organelle.With respect to molecular function, targets were assigned to 10 terms, with the two most frequentbeing binding and catalytic activity.
Figure 2. GO annotation of targets of identified miRNAs. Targets were functionally categorized bybiological process, cellular component and molecular function according to the ontological definitionsof the GO terms.
3.5. Differential Expressed miRNAs during the Graft Process of Pecan
To obtain insight into the possible roles of miRNAs in the graft union development of pecan,differential expressions were analyzed by comparing days 8, 15, 30 to day 0, with the criteria ofabsolute log2 fold change >1 and q value < 0.05. In total, 29 miRNAs with 16 conserved and13 novel were considered to be differentially expressed in the three comparisons (Table 2). Of these,10 miRNAs were differentially expressed in the comparison of day 8/day 0, with 7 down-regulated and3 up-regulated. Fourteen differential expressed miRNAs were identified in day 15/day 0 comparison,with 4 down-regulated and 10 up-regulated. In the comparison of day 30/day 0, 23 differentialexpressed miRNAs were found, with 19 down-regulated and 4 up-regulated. There were 10 miRNAswhose expression changed significantly in two comparisons, and 4 miRNAs changed obviously inthree comparisons. We compared the differential expressed value between miRNAs and their targetsusing our transcriptome data, and found that miRNAs were generally negatively correlated with theircorresponding targets (Figure 3).
84

Forests 2018, 9, 472
Ta
ble
2.
Diff
eren
tial
lyex
pres
sed
miR
NA
sdu
ring
the
graf
tpro
cess
ofpe
can.
miR
NA
Ma
ture
_S
eq
ue
nce
(5′ →
3′ )
TP
ML
og
2F
old
Ch
an
ge
(Tre
atm
en
tv
s.C
on
tro
l)P
uta
tiv
eT
arg
et
Da
y0
Da
y8
Da
y1
5D
ay
30
Da
y8
/Da
y0
Da
y1
5/D
ay
0D
ay
30
/Da
y0
cil-
miR
156
uuga
caga
agau
agag
agca
c10
53.6
473
8.88
2066
.88
496.
77−0
.51
0.97
−1.0
8SP
Lci
l-m
iR16
0aug
ccug
gcuc
ccug
uaug
cc17
4.90
94.6
611
8.25
51.9
9−0
.89
−0.5
6−1
.75
AR
Fci
l-m
iR16
0bug
ccug
gcuc
ccug
aaug
cc19
1.96
103.
3418
5.09
66.4
3−0
.89
−0.0
5−1
.53
AR
Fci
l-m
iR16
4aca
ugug
cucu
agcu
cucc
agc
25.5
921
.04
87.4
120
.22
−0.2
81.
77−0
.34
NA
Cci
l-m
iR16
4bug
gaga
agca
gggc
acgu
gca
2337
.62
1761
.75
2154
.29
768.
26−0
.41
−0.1
2−1
.61
NA
Cci
l-m
iR16
6buc
ggac
cagg
cuuc
auuc
ccc
79,2
83.0
133
,244
.46
39,6
32.8
910
5,56
6.42
−1.2
5−1
.00
0.41
Cla
ssII
IHD
-ZIP
cil-
miR
171b
aggu
auug
augu
ggcu
caau
u47
3.50
270.
8414
3.96
147.
30−0
.81
−1.7
2−1
.68
cil-
miR
390
aagc
ucag
gagg
gaua
gcgc
c16
12.4
513
54.1
819
33.2
070
4.72
−0.2
50.
26−1
.19
cil-
miR
394
uugg
cauu
cugu
ccac
cucc
695.
3232
0.80
719.
8120
7.95
−1.1
20.
05−1
.74
F-bo
xon
lypr
otei
n6-
like
cil-
miR
396b
guuc
aaua
aagc
ugug
ggau
g38
,707
.31
95,0
55.5
311
0,47
0.14
30,5
83.1
01.
301.
51−0
.34
Seri
neca
rbox
ypep
tida
se-l
ike
cil-
miR
399
aggg
cuuc
ucuc
cuuu
ggca
gg76
.78
18.4
166
.84
25.9
9−2
.06
−0.2
0−1
.56
cil-
miR
482a
ggaa
uggg
cugu
uugg
gaug
a30
,943
.67
36,3
41.9
839
,209
.03
6830
.58
0.23
0.34
−2.1
8ci
l-m
iR48
2baa
uggg
aaga
uagg
aaag
aac
4146
.30
3168
.52
3578
.48
1614
.50
−0.3
9−0
.21
−1.3
6ci
l-m
iR48
2cug
gaca
uggg
ugaa
uugg
uaag
16,0
60.5
111
,832
.64
35,2
29.5
267
26.6
1−0
.44
1.13
−1.2
6ci
l-m
iR81
8ca
cgac
gucg
guuu
auuu
aaca
gg25
.59
12.7
641
.13
92.4
2−1
.00
0.68
1.85
cil-
miR
860a
caua
ucuu
ugac
uaug
uacu
gau
29.8
610
3.34
174.
8111
8.42
1.79
2.55
1.99
cil-
miR
S2uu
uugu
aaga
ucuc
ugug
uag
452.
1770
7.33
1007
.73
872.
230.
651.
160.
95Sy
ntax
in-1
31ci
l-m
iRS6
caag
gaaa
auag
gcuu
uugu
g22
1.82
68.3
710
.28
57.7
6−1
.70
−4.4
3−1
.94
AT
Psy
ntha
sega
mm
ach
ain
cil-
miR
S7ca
ucag
uuug
uggg
auua
cuuu
46.9
244
.70
174.
8169
.32
−0.0
71.
900.
56ci
l-m
iRS8
agug
uggu
cggg
aacc
cgga
acu
81.0
552
.59
359.
9031
.77
−0.6
22.
15−1
.35
cil-
miR
S9a
ugac
agaa
gaga
gaga
gcac
34.1
323
.67
25.7
10.
00−0
.53
−0.4
1−6
.64
SPL
cil-
miR
S9b
ugac
agaa
gaga
gaga
gcac
34.1
323
.67
25.7
10.
00−0
.53
−0.4
1−6
.64
SPL
cil-
miR
S10
ugac
agaa
gaga
guga
gcac
1847
.06
2987
.08
3928
.10
557.
420.
691.
09−1
.73
Cin
nam
oyl-
CoA
redu
ctas
e1
cil-
miR
S18
caaa
auga
cuag
ucaa
ugau
81.0
542
.07
97.6
928
.88
−0.9
50.
27−1
.49
Este
rase
-lik
eis
ofor
mX
1ci
l-m
iRS2
3ug
uuac
uagu
uugg
cuuu
gaua
cu46
.92
2.63
5.14
0.00
−4.1
6−3
.19
−6.6
4ci
l-m
iRS2
6uu
uucg
uugc
uaua
aauu
ggu
34.1
316
.38
138.
8286
.65
−1.0
62.
021.
34cy
clin
-D1-
1is
ofor
mX
1ci
l-m
iRS2
9gg
uggc
ugga
uuga
aucc
230.
3519
9.84
534.
725.
78−0
.20
1.21
−5.3
2W
D-4
0re
peat
fam
ilypr
otei
nci
l-m
iRS3
3ca
aaag
ugau
ugua
ugua
acau
u39
11.6
835
12.9
835
83.6
210
,232
.88
−0.1
6−0
.13
1.39
Cel
ldiv
isio
nco
ntro
lpro
tein
cil-
miR
S38
uggc
ugcc
augc
aucg
ucua
gc48
50.1
413
,539
.17
7979
.60
8863
.87
1.48
0.72
0.87
Not
e:SP
L,
squ
amos
ap
rom
oter
-bin
din
gp
rote
in-l
ike;
NA
C,
NA
Ctr
ansc
rip
tion
fact
or;
HD
-ZIP
,ho
meo
box-
leu
cine
zip
per
;A
TP,
aden
ine
trip
hosp
hate
;C
oA,
coen
zym
eA
;W
D,
tryp
toph
an-a
spar
tic
acid
.
85

Forests 2018, 9, 472
Figure 3. Expression profile of some miRNAs and their targets in the graft process. Columns in theheatmap reprent different comparisons (experiment/control: day 8/day 0, day 15/day 0, and day 30/day 0).Comparisons were made to calculate expression changes (fold change). Rows in the heatmap symbolizemiRNAs or target genes. The data in the heapmap are the value of log2 (fold change). Red and greenindicate up-regulation and down-regulation respectively.
3.6. Differential Expressed miRNAs during the Graft Process of Pecan
To validate the dynamic expression of miRNAs at different time points after grafting obtainedby sequencing, 12 miRNAs, including 8 conserved and 4 novel, were chosen for qRT-PCR analysis(Figure 4). Results showed that most of the expression profiles of studied miRNAs based on qRT-PCRwere similar to those detected by high-throughput sequencing, except miR394. The expression ofmiR394 at day 30 was down-regulated based on high-throughput sequencing, while it was up-regulateddetected by qRT-PCR. Also, for specific time points after grafting, the relative expression levelof miRNAs detected by these two methods did not match exactly. For instance, sequencing dataindicated that the ratio of miRS23 in day 15/day 0 was 0.11, but it was 0.60 with the correspondingqRT-PCR date. This inconsistency might result from the difference in data normalization protocolsof the sequencing data and qRT-PCR. The sequencing was normalized to the global abundance ofmapped reads sequenced by illumina, while qRT-PCR was normalized to the level of 5.8S rRNA.A correlation analysis of the fold change of miRNA expression between sequencing and qRT-PCRshowed a significant similarity with R2 = 0.84 (Figure S2), confirming the reliability of results obtainedby sequencing. Additionally, to further validate the dynamic correlation between miRNAs and theirtargets, the expression of potential targets were also subjected to qRT-PCR assay. Results showed thatall the three targets had an inverse expression profile with their corresponding miRNAs (Figure 5).
3.7. Expression Patterns of miRNAs and Their Targets in Different Tissues of Pecan
To understand the main roles of miRNAs and their targets, we analyzed the tissue-specificexpression profiles of miRNAs and mRNAs in different organs of pecan. Generally, miRNAs and theirtargets were negatively correlated, and were preferentially expressed in specific tissues (Figure 6).miR156 showed lower expression level in xylem and phloem, while its target had higher expressionvalues in those tissues. miR160, miR164, miR166, and miRS10 exhibited low expression levels in xylem,while their corresponding targets, expect NAC, were highly expressed in xylem. The target of miRS26displayed the highest expression in callus.
86

Forests 2018, 9, 472
Figure 4. qRT-PCR validation of miRNAs in the graft process of pecan. The histograms and linesindicate miRNA expression results obtained by sequencing and qRT-PCR, respectively. The x-axisrepresents samples collected at different time points after grafting, while the y-axis represents therelative expression level of miRNAs. The expression levels of miRNAs are normalized to the level of5.8S rRNA. The normalized miRNA levels at day 0 are arbitrarily set to 1. Data from qRT-PCR aremeans of three replicates and bars represent SE (standard error).
Figure 5. The expression of miRNAs and their targets. The relative expression levels of miRNAs andtheir corresponding target genes are shown in grey and green histograms, respectively. The x-axisrepresents samples collected at different time points after grafting, while the y-axis represents therelative expression level of miRNAs and their target genes. The expression level of miRNAs and targetgenes are normalized to the level of 5.8S rRNA and Actin gene. For each miRNA and target gene,the expression levels at day 0 are arbitrarily set to 1. Data from qRT-PCR are means of three replicatesand bars represent SE.
87

Forests 2018, 9, 472
Figure 6. Expression of miRNAs and their targets in different tissues of pecan. The relative expressionlevels of miRNAs and their corresponding target genes are shown in blue and green histograms,respectively. The x-axis represents different tissues collected from pecan, while the y-axis representsthe relative expression level of miRNAs and their target genes. The expression level of miRNAs andtarget gene are normalized to the level of 5.8S rRNA and Actin gene. For each miRNA and targetgene, the expression levels at day 0 are arbitrarily set to 1. Data are means of three replicates andbars represent SE. SPL, squamosa promoter-binding protein-like; ARF, auxin response factor; NAC,NAC transcription factor; HD-ZIP, homeobox-leucine zipper; CCR, cinnamoyl-CoA reductase; CYCD,D-type cyclin.
4. Discussion
Although grafting has been extensively used in horticulture, our knowledge regarding themolecular mechanism of successful graft remains insufficient. Plant miRNAs are non-coding RNAsthat play important roles in various biological processes at post-transcriptional level. In this study,we used high throughput sequencing to explore the conserved and novel miRNAs in pecan, and thenanalyzed the differentially expressed miRNAs to better understand the function of miRNAs ina successful grafting.
miRNAs are reported to be widely distributed throughout almost all eukaryotes, and somemiRNAs are deeply conserved in plant kingdom [33]. In our work, 47 conserved miRNAs belongingto 31 miRNA families were identified. Of those, miRNAs including miR156, miR159, miR160, miR164,miR166, miR167, miR171, miR172, miR390, miR393, miR394, miR396, miR399, and miR403 wereconfirmed to be well-conserved in both monocot and dicot model plants [33]. We obtained a total of39 novel miRNAs in the graft process of pecan. Those newly identified miRNAs might be pecan-specific.We detected that the novel miRNAs generally exhibited a lower expression level than the conservedones, which was consistent with previous literature [34,35].
A total of 16 conserved and 13 novel miRNAs were differentially expressed during the graftprocesses. Since successful grafting is a developmental processes involving callus formation andvascular bundle formation, the differential expression of a cascade of miRNAs concerning thoseprocesses might suggest their involvement in the graft process as well. Previously, it has been reportedthat miR159, miR169, miR171, and miR172 were identified as being responsive to embryogeniccallus formation of Larix leptolepis Gordon [36]. miR396 expressed at high level would attenuate cellproliferation in the developing leaves of Arabidopsis thaliana [37]. miR166 has been reported to beinvolved in xylem development of Acacia mangium (Willd.) [38]. In Arabidopsis, miR166 was found
88

Forests 2018, 9, 472
to be involved in vascular development through negatively regulating the expression of ATHB15,a class III homeodomain-leucine zipper (HD-ZIP III) gene [39]. miRNAs including miR156, miR159,miR160, miR172, miR390, and miR482 have been confirmed to participate in the graft process ofhickory [25]. Consistent with these previous research, miR156, miR160, miR166, miR171, miR390,miR396, and miR482 showed significantly differential expression for our research, suggesting theymight function for graft union development.
The putative target of the differentially expressed miR156, squamosa promoter-binding protein-like(SPL), encodes a plant-specific transcription factor that functions in multiple biological processes,including plant architecture, leaf development, juvenile-to-adult transition, flower and fruitdevelopment, as well as gibberellin (GA) signaling [40]. Among its divergent functions, SPL responsesto GA signaling by affecting the genes involved in GAs biosynthesis. Studies have verified thatGAs are important regulators in xylem differentiation [41]. In our study, miR156 was significantlydown-regulated at day 30, which might induce the up-regulation of SPL during the stage of vasculatureformation. It was presumed that the miR156-SPL interaction might involve in vascular bundleformation through regulating GA signaling indirectly.
A putative target of miR160 is auxin response factor (ARF). In the graft process, auxin has beenconfirmed to be critical in regulating callus formation and vascular development [8,42]. Auxin signalingis transduced via ARFs to regulate the expression of genes containing auxin response elements(AuxREs) in their promoter areas [43]. In Arabidopsis, ARF6 and ARF8 mutants reduced cell proliferationin response to cutting [42], and ARF5 mutants showed abnormality in vascular development [44].In the present study, we hypothesized that the down-regulated miR160a-b at day 30 may induce theaccumulation of ARF, resulting in vascular connection.
A putative gene targeted by miR164 was the NAC transcription factor, which was in accordancewith Arabidopsis [45], Medicago truncatula Gaertn [46], and Triticum aestivum L. [34]. NAC transcriptionfactors are the master regulators in controlling secondary cell wall formation [47], and overexpressionNAC1 in Arabidopsis was shown to produce thicker stems than the untransformed control plants [48].Previous studies have reported that secondary cell-wall formation was indispensable for vascularsystem development [49]; thus, the down-regulated miR164b at day 30 in this work might stimulateNAC1 expression to regulate vascular development.
miR166b belongs to the miR166 family, and targets the homeobox-leucine zipper (HD-ZIP) gene.Members of HD-ZIP gene family have been reported to function in various stress conditions, suchas drought, salinity, and wounding [50,51]. The class III HD-ZIP gene family plays important rolesin vascular bundle development. It was reported to be highly expressed in cambium tissue [52,53].In Arabidopsis, the class III HD-ZIP proteins were also showed to control cambium activity throughinducing axial cell elongation and xylem differentiation [54]. Overexpressing a populus class III HD-ZIPgene would lead to ectopic formation of vascular cambium within cortical parenchyma in poplar [55].For a successful grafting, the formation of vascular bundles results from the promotion of vascularcambium activity. In our study, miR166 was down-regulated at day 15, suggesting class III HD-ZIPmight be up-regulated at the stage of new cambium establishment. It is speculated that the increasedclass III HD-ZIP may stimulate the cambium activity for the subsequent xylem formation. Interestingly,we found that miR166 was significantly down-regulated at day 8 as well, indicating that the initialxylem differentiation might happen before new cambium establishment, as demonstrated by thereports of Pina [2].
A putative target of miRS10, cinnamoyl-CoA reductase (CCR), is a gene dedicated to monolignolbiosynthesis. Down-regulation of CCR in poplar exhibited up to 50% reduced lignin level in outerxylem [56]. Since lignin is essential for vascular development, the down-regulated miRS10 at day 30might induce the up-regulation of CCR, and then lead to the lignification of vasculature during thegraft process of pecan.
A predicted target of miRS26 was D-type cyclin (CYCD). CYCD is a critical regulator that promotesthe progression of cell cycle by binding to cyclin-dependent kinases A, which plays vital role in cell
89

Forests 2018, 9, 472
proliferation [57]. It was found to be induced by auxin and cytokinin [58]. Arabidopsis hypocotylexplants of overexpressing CYCD4 showed faster induction of callus than the control explants ona media with lower auxin concentration [59]. In this study, miRS26 was down-regulated at day 8,a stage during initial callus formation, and then up-regulated at the following time-points, while CYCDwas up-regulated throughout the grafting process, indicating that a negative correlation betweenmiRS26 and CYCD at days 15 and 30 did not exist. However, the expressions of miRS26 and CYCD indifferent tissues indicated that they were negatively correlated. Considering the negative interactionexiting between miRS26 and CYCD during the stage of initial callus formation, and CYCD displayinghighest expression abundance in callus tissue, we deduced that miRS26 might play a vital role instimulating callus proliferation during graft union development.
In our study, the tissue-specific expression profiles of miRNAs and their targets might indirectlysuggest their specific roles for the graft union development. The low expression of miRNAs in xylemtissues, such as miR156, miR160, miR164, miR166, and miRS10 might be indicative of their specificroles during vascular development. miRS26 showed low expression in callus tissues, suggest itspossible involvement in callus formation for a successful graft.
5. Conclusions
Our study constructed four sRNA libraries from the graft unions of pecan collected at days 0,8, 15, and 30 after grafting. We identified a total of 47 conserved miRNAs belonging to 31 familiesand 39 novel miRNAs. Among them, 29 miRNAs with 16 conserved and 13 novel were differentiallyexpressed in the graft process, suggesting their critical roles in successful grafting. Particularly, for thegraft union development of pecan, miRS26 might play an important role in callus formation; miR166,miR156, miR160, miR164, and miRS10 might contribute to vascular bundle formation (Figure 7).
Figure 7. Putative regulatory mechanism involving differentially expressed miRNAs and their targetsin graft union formation of pecan. The upper arrow indicates upregulation, and the down arrowrepresents downregulation. CYCD, D-type cyclin; SPL, squamosa promoter-binding protein-like;ARF, auxin response factor; NAC, NAC transcription factor; CCR, cinnamoyl-CoA reductase; HD-ZIP,homeobox-leucine zipper.
90

Forests 2018, 9, 472
Supplementary Materials: The following are available online at http://www.mdpi.com/1999-4907/9/8/472/s1,Figure S1: The hairpin structures of novel miRNAs. The mature miRNAs are in red, and the miRNA *s are in blue,Figure S2: Correlation analysis between sequencing and qRT-PCR. Scatter plots show fold-change measured bysequencing and qRT-PCR, Table S1: Primers used in this study, Table S2: Conserved miRNAs identified in pecan,Table S3: Novel miRNAs identified in pecan, Table S4: Target genes of identified miRNAs in pecan.
Author Contributions: F.P. conceived and designed the study. Z.M. performed the data analysis and wrote themanuscript. G.F. and W.S. carried out qRT-PCR. Z.L. was involved in sample collection. All authors read andapproved the final manuscript.
Funding: The authors appreciate the financial support from the SanXin project of Jiangsu province (LYSX(2016)44),the state bureau of forestry 948 project (2015-4-16) and the Priority Academic Program Development of JiangsuHigher Education Institutions (PAPD).
Conflicts of Interest: The authors declare that they have no competing interests.
References
1. Mudge, K.; Janick, J.; Scofield, S.; Goldschmidt, E.E. A history of grafting. Hortic. Rev. 2009, 437–493.2. Pina, A.; Errea, P. A review of new advances in mechanism of graft compatibility–incompatibility. Sci. Hortic.
2005, 106, 1–11. [CrossRef]3. Aloni, B.; Karni, L.; Deventurero, G.; Levin, Z.; Cohen, R.; Katzir, N.; Lotan-Pompan, M.; Edelstein, M.;
Aktas, H.; Turhan, E. Physiological and biochemical changes at the rootstock-scion interface in graftcombinations between cucurbita rootstocks and a melon scion. J. Hortic. Sci. Biotechnol. 2008, 83, 777–783.[CrossRef]
4. Fernández-García, N.; Carvajal, M.; Olmos, E. Graft union formation in tomato plants: Peroxidase andcatalase involvement. Ann. Bot. 2004, 93, 53–60. [CrossRef] [PubMed]
5. Asahina, M.; Iwai, H.; Kikuchi, A.; Yamaguchi, S.; Kamiya, Y.; Kamada, H.; Satoh, S. Gibberellin produced inthe cotyledon is required for cell division during tissue reunion in the cortex of cut cucumber and tomatohypocotyls. Plant Physiol. 2002, 129, 201–210. [CrossRef] [PubMed]
6. Melnyk, C.W.; Schuster, C.; Leyser, O.; Meyerowitz, E.M. A developmental framework for graft formationand vascular reconnection in arabidopsis thaliana. Curr. Biol. 2015, 25, 1306–1318. [CrossRef] [PubMed]
7. Zheng, B.S.; Chu, H.L.; Jin, S.H.; Huang, Y.J.; Wang, Z.J.; Chen, M.; Huang, J.Q. Cdna-aflp analysis of geneexpression in hickory (carya cathayensis) during graft process. Tree Physiol. 2009, 30, 297–303. [CrossRef][PubMed]
8. Yin, H.; Yan, B.; Sun, J.; Jia, P.; Zhang, Z.; Yan, X.; Chai, J.; Ren, Z.; Zheng, G.; Liu, H. Graft-uniondevelopment: A delicate process that involves cell–cell communication between scion and stock for localauxin accumulation. J. Exp. Bot. 2012, 63, 4219–4232. [CrossRef] [PubMed]
9. Cookson, S.J.; Moreno, M.J.C.; Hevin, C.; Mendome, L.Z.N.; Delrot, S.; Trossatmagnin, C.; Ollat, N.Graft union formation in grapevine induces transcriptional changes related to cell wall modification,wounding, hormone signalling, and secondary metabolism. J. Exp. Bot. 2013, 64, 2997–3008. [CrossRef][PubMed]
10. Chen, Z.; Zhao, J.; Hu, F.; Qin, Y.; Wang, X.; Hu, G. Transcriptome changes between compatible andincompatible graft combination of litchi chinensis by digital gene expression profile. Sci. Rep. 2017, 7, 3954.[CrossRef] [PubMed]
11. Bartel, D.P. Micrornas: Genomics, biogenesis, mechanism, and function. Cell 2004, 116, 281–297. [CrossRef]12. Mallory, A.C.; Vaucheret, H. Erratum: Functions of micrornas and related small rnas in plants. Nat. Genet.
2006, 38, S31. [CrossRef]13. Millar, A.A.; Waterhouse, P.M. Plant and animal micrornas: Similarities and differences. Funct. Integr. Genom.
2005, 5, 129–135. [CrossRef] [PubMed]14. Xu, S.; Jiang, Y.; Wang, N.; Xia, B.; Jiang, Y.; Li, X.; Zhang, Z.; Li, Y.; Wang, R. Identification and differential
regulation of micrornas in response to methyl jasmonate treatment in lycoris aurea by deep sequencing.BMC Genom. 2016, 17, 789. [CrossRef] [PubMed]
15. Liu, F.; Wang, W.; Sun, X.; Liang, Z.; Wang, F. Conserved and novel heat stress-responsive micro rnas wereidentified by deep sequencing in s accharina japonica (l aminariales, p haeophyta). Plant Cell Environ. 2015,38, 1357–1367. [CrossRef] [PubMed]
91

Forests 2018, 9, 472
16. Ferreira, T.H.; Gentile, A.; Vilela, R.D.; Costa, G.G.; Dias, L.I.; Endres, L.; Menossi, M. Micrornas associatedwith drought response in the bioenergy crop sugarcane (Saccharum spp.). PLoS ONE 2012, 7, e46703.[CrossRef] [PubMed]
17. Li, H.; Hu, T.; Amombo, E.; Fu, J. Genome-wide identification of heat stress-responsive small rnas in tallfescue (Festuca arundinacea) by high-throughput sequencing. J. Plant Physiol. 2017, 213, 157–165. [CrossRef][PubMed]
18. Wang, Z.; Jiang, D.; Zhang, C.; Tan, H.; Li, Y.; Lv, S.; Hou, X.; Cui, X. Genome-wide identification of turnipmosaic virus -responsive micrornas in non-heading chinese cabbage by high-throughput sequencing. Gene2015, 571, 178–187. [CrossRef] [PubMed]
19. Li, T.; Ma, L.; Geng, Y.; Hao, C.; Chen, X.; Zhang, X. Small rna and degradome sequencing reveal complexroles of mirnas and their targets in developing wheat grains. PLoS ONE 2015, 10, e0139658. [CrossRef][PubMed]
20. Sun, Y.; Qiu, Y.; Zhang, X.; Chen, X.; Shen, D.; Wang, H.; Li, X. Genome-wide identification of micrornasassociated with taproot development in radish (Raphanus sativus L.). Gene 2015, 569, 118–126. [CrossRef][PubMed]
21. Zhang, S.; Han, S.; Li, W.; Zhou, J.; Li, X.; Qi, L. Mirna regulation in fast- and slow-growing hybrid larix trees.Trees 2012, 26, 1597–1604. [CrossRef]
22. Liu, N.; Yang, J.; Guo, S.; Xu, Y.; Zhang, M. Genome-wide identification and comparative analysis ofconserved and novel micrornas in grafted watermelon by high-throughput sequencing. PLoS ONE 2013,8, e57359. [CrossRef] [PubMed]
23. Li, C.; Li, Y.; Bai, L.; Zhang, T.; He, C.; Yan, Y.; Yu, X. Grafting-responsive mirnas in cucumber and pumpkinseedlings identified by high-throughput sequencing at whole genome level. Physiol. Plant. 2014, 151, 406–422.[CrossRef] [PubMed]
24. Khaldun, A.; Huang, W.; Lv, H.; Liao, S.; Zeng, S.; Wang, Y. Comparative profiling of mirnas and targetgene identification in distant-grafting between tomato and lycium (goji berry). Front. Plant Sci. 2016, 7, 1475.[CrossRef] [PubMed]
25. Sima, X.; Jiang, B.; Fang, J.; He, Y.; Fang, Z.; Saravana Kumar, K.M.; Ren, W.; Qiu, L.; Chen, X.; Zheng, B.Identification by deep sequencing and profiling of conserved and novel hickory micrornas involved in thegraft process. Plant Biotechnol. Rep. 2015, 9, 115–124. [CrossRef]
26. Nesbitt, M.L. Effect of scionwood packing moisture and cut-end scaling on pecan graft success. Horttechnology2002, 12, 257–260.
27. Mo, Z.; Feng, G.; Su, W.; Liu, Z.; Peng, F. Transcriptomic analysis provides insights into grafting uniondevelopment in pecan (Carya illinoinensis). Genes 2018, 9, 71. [CrossRef] [PubMed]
28. Mo, Z.; He, H.; Su, W.; Peng, F. Analysis of differentially accumulated proteins associated with graft unionformation in pecan (Carya illinoensis). Sci. Hortic. 2017, 224, 126–134. [CrossRef]
29. Meyers, B.C.; Axtell, M.J.; Bartel, B.; Bartel, D.P.; Baulcombe, D.; Bowman, J.L.; Cao, X.; Carrington, J.C.;Chen, X.; Green, P.J. Criteria for annotation of plant micrornas. Plant Cell 2008, 20, 3186–3190. [CrossRef][PubMed]
30. Wang, Z.; Huang, J.; Huang, Y.; Li, Z.; Zheng, B. Discovery and profiling of novel and conserved micrornasduring flower development in carya cathayensis via deep sequencing. Planta 2012, 236, 613–621. [CrossRef][PubMed]
31. Wang, Z.; Huang, R.; Sun, Z.; Zhang, T.; Huang, J. Identification and profiling of conserved and novelmicrornas involved in oil and oleic acid production during embryogenesis in carya cathayensis sarg.Funct. Integr. Genom. 2017, 17, 1–9. [CrossRef] [PubMed]
32. Chen, L.; Zhang, Y.; Ren, Y.; Xu, J.; Zhang, Z.; Wang, Y. Genome-wide identification of cold-responsive andnew micrornas in populus tomentosa by high-throughput sequencing. Biochem. Biophys. Res. Commun. 2012,417, 892–896. [CrossRef] [PubMed]
33. Jonesrhoades, M.W.; Bartel, D.P.; Bartel, B. Micrornas and their regulatory roles in plants. Annu. Rev. Plant Biol.2006, 57, 19–53. [CrossRef] [PubMed]
34. Ma, X.; Xin, Z.; Wang, Z.; Yang, Q.; Guo, S.; Guo, X.; Cao, L.; Lin, T. Identification and comparative analysis ofdifferentially expressed mirnas in leaves of two wheat (Triticum aestivum L.) genotypes during dehydrationstress. BMC Plant Biol. 2015, 15, 21. [CrossRef] [PubMed]
92

Forests 2018, 9, 472
35. Rajagopalan, R.; Vaucheret, H.; Trejo, J.; Bartel, D. A diverse and evolutionarily fluid set of micrornas inarabidopsis thaliana. Genes Dev. 2006, 20, 3407–3425. [CrossRef] [PubMed]
36. Zhang, S.G.; Zhou, J.; Han, S.Y.; Yang, W.H.; Li, W.F.; Wei, H.L.; Li, X.M.; Qi, L.W. Four abioticstress-induced mirna families differentially regulated in the embryogenic and non-embryogenic callustissues of Larix leptolepis. Biochem. Biophys. Res. Commun. 2010, 398, 355–360. [CrossRef] [PubMed]
37. Rodriguez, R.E.; Mecchia, M.A.; Debernardi, J.M.; Schommer, C.; Weigel, D.; Palatnik, J.F. Control of cellproliferation in arabidopsis thaliana by microrna mir396. Development 2010, 137, 103–112. [CrossRef][PubMed]
38. Ong, S.S.; Wickneswari, R. Characterization of micrornas expressed during secondary wall biosynthesis inAcacia mangium. PLoS ONE 2012, 7, e49662. [CrossRef] [PubMed]
39. Kim, J.; Jung, J.H.; Reyes, J.L.; Kim, Y.S.; Kim, S.Y.; Chung, K.S.; Kim, J.A.; Lee, M.; Lee, Y.; Narry Kim, V.Microrna-directed cleavage of athb15 mrna regulates vascular development in arabidopsis inflorescencestems. Plant J. 2005, 42, 84–94. [CrossRef] [PubMed]
40. Chen, X.B.; Zhang, Z.L.; Liu, D.M.; Zhang, K.; Li, A.L.; Mao, L. Squamosa promoter-binding protein-liketranscription factors: Star players for plant growth and development. J. Integr. Plant Biol. 2010, 52, 946–951.[CrossRef] [PubMed]
41. Milhinhos, A.; Miguel, C.M. Hormone interactions in xylem development: A matter of signals. Plant Cell Rep.2013, 32, 867–883. [CrossRef] [PubMed]
42. Pitaksaringkarn, W.; Ishiguro, S.; Asahina, M.; Satoh, S. Arf6 and arf8 contribute to tissue reunion in incisedarabidopsis inflorescence stems. Plant Biotechnol. 2014, 31, 49–53. [CrossRef]
43. Li, S.; Xie, Z.; Hu, C.; Zhang, J. A review of auxin response factors (arfs) in plants. Front. Plant Sci. 2016, 7, 47.[CrossRef] [PubMed]
44. Hardtke, C.S.; Berleth, T. The arabidopsis gene monopteros encodes a transcription factor mediating embryoaxis formation and vascular development. EMBO J. 1998, 17, 1405–1411. [CrossRef] [PubMed]
45. Guo, H.S.; Xie, Q.; Fei, J.F.; Chua, N.H. Microrna directs mrna cleavage of the transcription factor nac1to downregulate auxin signals for arabidopsis lateral root development. Plant Cell 2005, 17, 1376–1386.[CrossRef] [PubMed]
46. Zhao, M.; Chen, L.; Wang, T.; Tian, Q.; Zhang, W. Identification of drought-responsive micrornas in medicagotruncatula by genome-wide high-throughput sequencing. BMC Genom. 2011, 12, 367.
47. Zhong, R.; Lee, C.; Zhou, J.; McCarthy, R.L.; Ye, Z.-H. A battery of transcription factors involved in theregulation of secondary cell wall biosynthesis in arabidopsis. Plant Cell 2008, 20, 2763–2782. [CrossRef][PubMed]
48. Xie, Q.; Frugis, G.; Colgan, D.; Chua, N. Arabidopsis nac1 transduces auxin signal downstream of tir1 topromote lateral root development. Genes Dev. 2000, 14, 3024–3036. [CrossRef] [PubMed]
49. Ye, Z.; Zhong, R. Molecular control of wood formation in trees. J. Exp. Bot. 2015, 66, 4119–4131. [CrossRef][PubMed]
50. Manavella, P.A.; Dezar, C.A.; Bonaventure, G.; Baldwin, I.T.; Chan, R.L. Hahb4, a sunflower hd-zip protein,integrates signals from the jasmonic acid and ethylene pathways during wounding and biotic stress responses.Plant J. 2008, 56, 376–388. [CrossRef] [PubMed]
51. Zhao, Y.; Ma, Q.; Jin, X.; Peng, X.; Liu, J.; Deng, L.; Yan, H.; Sheng, L.; Jiang, H.; Cheng, B. A novel maizehomeodomain–leucine zipper (hd-zip) i gene, zmhdz10, positively regulates drought and salt tolerance inboth rice and arabidopsis. Plant Cell Physiol. 2014, 55, 1142–1156. [CrossRef] [PubMed]
52. Baima, S.; Possenti, M.; Matteucci, A.E.; Altamura, M.M.; Ruberti, I. The arabidopsis athb-8 hd-zip protein actsas a differentiation-promotingtranscription factor of the vascular meristems. Plant Physiol. 2001, 126, 643–655.[CrossRef] [PubMed]
53. Schrader, J.; Sandberg, G. A high-resolution transcript profile across the wood-forming meristem of poplaridentifies potential regulators of cambial stem cell identity. Plant Cell 2004, 16, 2278–2292. [CrossRef][PubMed]
54. Ilegems, M.; Douet, V.; Meylanbettex, M.; Uyttewaal, M.; Brand, L.; Bowman, J.L.; Stieger, P.A. Interplayof auxin, kanadi and class iii hd-zip transcription factors in vascular tissue formation. Development 2010,137, 975–984. [CrossRef] [PubMed]
55. Robischon, M.; Du, J.; Miura, E.; Groover, A. The populus class iii hd zip, poprevoluta, influences cambiuminitiation and patterning of woody stems. Plant Physiol. 2011, 155, 1214–1225. [CrossRef] [PubMed]
93

Forests 2018, 9, 472
56. Leple, J.; Dauwe, R.; Morreel, K.; Storme, V.; Lapierre, C.; Pollet, B.; Naumann, A.; Kang, K.; Kim, H.; Ruel, K.Downregulation of cinnamoyl-coenzyme a reductase in poplar: Multiple-level phenotyping reveals effectson cell wall polymer metabolism and structure. Plant Cell 2007, 19, 3669–3691. [CrossRef] [PubMed]
57. Ikeuchi, M.; Sugimoto, K.; Iwase, A. Plant callus: Mechanisms of induction and repression. Plant Cell 2013,25, 3159–3173. [CrossRef] [PubMed]
58. Fehér, A.; Magyar, Z. Coordination of cell division and differentiation in plants in comparison to animals.Acta Biol. Szeged. 2015, 59, 275–289.
59. Kono, A.; Ohno, R.; Umeda-Hara, C.; Uchimiya, H.; Umeda, M. A distinct type of cyclin d, cycd4;2, involvedin the activation of cell division in arabidopsis. Plant Cell Rep. 2006, 25, 540–545. [CrossRef] [PubMed]
© 2018 by the authors. Licensee MDPI, Basel, Switzerland. This article is an open accessarticle distributed under the terms and conditions of the Creative Commons Attribution(CC BY) license (http://creativecommons.org/licenses/by/4.0/).
94

Article
Genome-Wide Identification and Characterization ofMADS-box Family Genes Related to Floral OrganDevelopment and Stress Resistance inHevea brasiliensis Müll. Arg.
Mingming Wei 1, Yajie Wang 2, Ranran Pan 2 and Weiguo Li 1,*
1 Ministry of Agriculture Key Laboratory of Biology and Genetic Resources of Rubber Tree & State KeyLaboratory Breeding Base of Cultivation and Physiology for Tropical Crops, Rubber Research Institute,Chinese Academy of Tropical Agricultural Sciences, Danzhou 571737, China; [email protected]
2 Agricultural College, Hainan University, Haikou 570228, China; [email protected] (Y.W);[email protected] (R.P)
* Correspondence: [email protected] or [email protected]; Tel.: +86-0898-2330-1306
Received: 26 April 2018; Accepted: 28 May 2018; Published: 29 May 2018
Abstract: Elucidating the genetic mechanisms associated with the transition from the vegetativeto reproductive phase in the rubber tree has great importance for both theoretical guidanceand practical application to yield genetic improvement. At present, many transcription factors,including those that belong to the MADS-box gene family, have been revealed to have roles inregulating the transition from vegetative growth to reproductive growth. However, to the best ofour knowledge, the Mad-box gene family from H. brasiliensis Müll. Arg. has not been characterizedin detail. To investigate members of the HbMADS-box gene family associated with floral organand inflorescence development in H. brasiliensis, we performed genome-wide identification andanalysis of the MADS-box gene family related to flower development in H. brasiliensis, and a totalof 20 MADS-box genes were newly identified in the H. brasiliensis genome. Expression profilingrevealed that HbMad-box genes were differentially expressed in various tissues, which indicatedthat HbMad-box genes may exert different functions throughout the life cycle. Additionally, 12 genes(HbSEP, HbAGL9.1, HbAGL9.2, HbCMB1, HbCMB1-L, HbAGL6, HbAGL8, HbAP1, HbAG, HbDEFL,HbTT16, and HbPADS2) were found to be associated with the differentiation of flower buds andmay be involved in flower development in H. brasiliensis. All of these floral-enriched HbMADS-boxgenes were regulated by hormone, salt, cold, high-temperature, and drought stresses. The presentstudy is the first to carry out the genome-wide identification and analysis of the MADS-box genefamily related to flower development in H. brasiliensis, and 20 new HbMad-box genes were identifiedin H. brasiliensis. Most of the newly identified HbMad-box genes were found to be associated withthe differentiation of flower buds and may be involved in flower development in H. brasiliensis.Our results demonstrated that HbMad-box genes may be multifunctional regulators that have rolesin distinct aspects of development, and are mainly involved in the maintenance of floral organ andinflorescence development.
Keywords: Hevea brasiliensis Müll. Arg.; HbMad-box genes; conserved domains; gene structures;expression profiles; stress treatments
1. Introduction
Natural rubber (NR) is an important industrial and strategic raw material, and has been appliedto many aspects of social production [1]. Although more than 2000 plant species in the world areconsidered to be latex producers, the rubber tree (Hevea brasiliensis Müll. Arg.) is the only commercial
Forests 2018, 9, 304; doi:10.3390/f9060304 www.mdpi.com/journal/forests95

Forests 2018, 9, 304
source of NR because of its high yield and the excellent physical properties of its rubber products [2],and it supplied 92% of the 10.2 million tons of NR consumed worldwide in 2016 [3].
With the rapid development of the world economy, the consumption of NR in major industrialcountries is increasing year by year. To meet the growing demand for NR, it is necessary to expand theplanting area of rubber trees. However, the rubber tree originates from the Amazon rainforest, so theplanting area must be located in sub-tropical to tropical zones [4]. At present, 95% of rubber trees inthe world are now mainly cultivated in South-East Asia, so the regions suitable for planting rubbertrees are very limited. Therefore, there is an urgent need to improve the rubber yield per area.
To the best of our knowledge, breeding new varieties is one of the most effective approaches toincreasing rubber yield per hectare. However, breeding experiments to yield genetic improvementof rubber trees are very inefficient and time-consuming, mainly because of the rubber tree’s long lifecycle of more than 30–35 years; it is immature for five to eight years until the rubber tree reaches theage of commercial productivity [5,6], and takes more than three decades to breed and select new clonesfor commercial production [7]. Furthermore, due to the low rate of success for controlled pollinations,genetic improvements of H. brasiliensis are very difficult and slow [8]. Therefore, research on thegenetic mechanisms that affect the transition from the vegetative to reproductive phase in H. brasiliensiscan provide insight for producing advantageous genetic improvement methods for controllingreproduction by genetic engineering and accelerate Hevea breeding.
In flowering plants, the transition from vegetative growth to reproductive growth is an importantdevelopmental process that involves many gene regulatory processes [9]. To date, many researchershave attempted to elucidate the functional genes in association with the transition from the vegetativegrowth to reproductive growth of plants. It is worth noting that many transcription factors (TFs),including those that belong to the MADS-box gene family, have been demonstrated to have roles inregulating the transition from vegetative growth to reproductive growth [10]. However, to the best ourknowledge, the rubber tree Mad-box gene family has not been characterized in detail.
As a floral homeotic gene family, the Mad-box gene family was previously identified and investigatedin the model plants Arabidopsis Heynh. in Holl & Heynh. and Nicotiana tabaccum L. [11–13], and hasevolutionarily conserved DNA-binding domains, called the MADS-box [14]. Typically, the MADS-boxprotein sequences can be divided into four characteristic domains from the N to the C terminus:the MADS-box (M), intervening (I), keratin-like (K), and C-terminal (C) domains [15]. In plants, based onthe structural features, MADS-box TFs usually contain two main groups–type I (M-type) and type II(MIKC-type) genes [16]; whereas, the type II genes can be categorized into MIKCc- and MIKC*-type [17].In previous studies, it has been reported that this superfamily encodes transcriptional regulators thatare involved in various processes, including floral organ development [18,19], root development [20],leaf development [21], fruit development and maturation [22–24], and embryonic development [25,26].In addition to growth and development-related functions, some MADS-box genes also play importantroles in response to stress stimuli [27,28]. For instance, MADS-box genes have already been proved toplay important roles under low temperature stress in tomato plants [29], while several MADS-box geneshave been demonstrated to take part in cold, salt, and drought responses in rice [30]. Furthermore, a fewMADS-box genes have been shown to be affected by the application of hormones and they exhibiteddifferential expression in response to cytokinin, gibberellin [31], ethylene [32], and auxin [33] applicationin other plants.
Despite the fact that the MADS-box gene plays a great role in plant growth and development,only a few MADS-box genes have been identified and characterized in the rubber tree to date [34].For example, previous studies have found that HbAGL62 is a specific expression in flowers andembryos, and highly expressed in the flower bud differentiation stage, which indicated that HbAGL62might play an important role in flowering regulation of the rubber tree [35]; MADS27 is highlyexpressed in the flower buds of rubber trees and may participate in the flowering process ofrubber trees [36]; HbMADS1 and HbMADS3 have highly frequent transcriptions in the laticifercells and somatic embryogenesis, and their transcriptions are induced in the laticifer cells by
96

Forests 2018, 9, 304
jamonic acid, which indicates that HbMADS1 and HbMADS3 may be important in natural rubberbiosynthesis and somatic embryogenesis in the rubber tree [37]. In the present research, we newlyidentified 20 MADS-box genes in the rubber tree, and analyzed their gene structure and phylogeneticrelationships. To identify differentially expressed patterns of Mad-box genes in various tissues,the 20 MADS-box genes of H. brasiliensis were detected and analyzed using real-time quantitativePCR (RT-qPCR). Furthermore, to understand the responses of HbMADS-box genes to various stresses,the expression profiles of 12 floral organ-specific HbMADS-box genes were examined in leaves ofHevea seedlings after hormone, salt, cold, high-temperature, and drought stress treatments.
2. Materials and Methods
2.1. Plant Materials and Treatments
12-year-old rubber tree clones CATAS 7-33-97 were used as the experimental material in this study.The rubber trees were grown under normal field conditions at the Experimental Station of the RubberResearch Institute, the Chinese Academy of Tropical Agricultural Sciences (Danzhou, Hainan, China).The fresh tissues and organs (including roots, stem, stem tips, leaves, labeled bark, xylem, latex,fruits, inflorescence, male flowers, and female flowers) were collected from 12-year-old mature trees ofCATAS 7-33-97 during the flowering period. Each sample was harvested on average from five trees,and three biological replicates were taken from each sample (the image of some samples shown inFigure S1). Then, the prepared samples were frozen in liquid nitrogen and transferred to a −80 ◦Crefrigerator for RNA separation.
The tissue culture seedlings of CATAS 7-33-97 were treated with cold, high temperature,and drought stress. Each treatment was set up with three replicates, and each replicate consisted offive seedlings. Under the cold stress condition, the seedlings were grown in a culture incubator set at5 ◦C and continuous illumination. For high-temperature stress treatment, the tissue-cultured seedlingswere planted at 40 ◦C and maintained at a relative humidity of 80% in the incubator. Leaf samplesof 0, 3, 6, 12, and 24 h treated with low and high temperature stresses were collected for RNAextraction. For drought stress treatments, the tissue-cultured plants were grown in Hoagland nutrientsolutions [38] containing 20% PEG6000, and incubated at different times (0 h, 3 h, 6 h, 12 h, 1 day, 3 day,4 day, and 7 day). Then, the leaf samples of each drought-treated time point were collected for RNAextraction, and samples from untreated plants were used as controls.
For hormone and salt treatments, the tissue-cultured seedlings were treated with abscisicacid (ABA) (200 μmol/L), gibberellin (GA) (100 μmol/L), and high salt (1 M NaCl), respectively.Among these chemicals, ABA and GA were diluted in distilled water that contained 0.05% (v/v)ethanol. The diluted ABA, GA, and NaCl solutions were sprayed on the leaves and stems of seedlingsuntil the runoff occurred. For control plants, the distilled water that contained 0.05% (v/v) ethanol wassprayed on the leaves and stems of seedlings. Leaf samples were harvested 0, 0.5, 2, 6, 12, 24, and 48 hafter treatments. In all treatments, one leaf from each of the five plants was taken and mixed togetherfor RNA extraction.
2.2. RNA Isolation and First-Strand cDNA Synthesis
Total RNA was isolated from the collected samples by the described methods [39], and theextracted RNA was digested with DNase (Promega, Madison, WI, USA) to remove genomic DNAcontamination. The integrity and concentration of the RNA samples was detected by 1.5% agarosegel electrophoresis and NanoDrop 2000 (Thermo Scientific Inc., Waltham, MA, USA), respectively.Then, the RNA samples were reverse transcribed into First-strand cDNA with the RevertAid™ FirstStrand cDNA Synthesis Kit (TaKaRa, Shiga, Japan).
97

Forests 2018, 9, 304
2.3. Identification and Isolation of Mad-box Genes in H. brasiliensis
Twenty full-length cDNA sequences of H. brasiliensis Mad-box genes were obtained from RNAsequencing. The cDNA sequences of these genes were compared with the Transcriptome ShotgunAssembly (TSA) and Expressed Sequence Tags (EST) of H. brasiliensis in the NCBI database (http://www.ncbi.nlm.nih.gov/), or searched against the Hevea genome database. Then, the NCBI ORFFinder (http://www.ncbi.nlm.nih.gov/gorf/gorf.html) and Softberry (http://linux1.softberry.com/)were used to determine open reading frames (ORFs) of candidate mRNA or genome DNA sequences.In addition, in order to confirm the presence of the Mad-box domain, all the candidate HbMad-boxgenes were further validated by conserved domain searching using CDD (http://www.ncbi.nlm.nih.gov/Structure/cdd/wrpsb.cgi) and InterProScan (http://www.ebi.ac.uk/interpro/scan.html).After the similarity comparison, ORF Finder, and conserved domain searching, redundant sequenceswere removed and the sequences of the HbMad-box gene were obtained.
The gene-specific primers used to amplify the corresponding full-length cDNA sequences ofHbMad-box genes were designed by Primer 3.0 (http://primer3.ut.ee/). The primer pairs for allHbMad-box genes are listed in Table S1. RT-PCR amplification of HbMad-box genes was conductedusing Pyrobest™ DNA polymerase (TaKaRa, Japan) according to the instructions.
2.4. Protein Properties and Gene Structure Analysis of HbMad-box Genes
We used the ProtParam tool (http://web.expasy.org/protparam/) to predict the theoreticalmolecular weight (Mw) and isoelectric point (PI) of HbMad-box gene proteins. To further analyzethe structural diversity of HbMADS-box genes, the exon–intron structures of HbMad-box genes wereidentified by comparing the coding sequence with their corresponding genomic sequence using theFGENESH-C tool (http://linux1.softberry.com), as previously described [40].
2.5. Multiple Sequence Alignments and Phylogenetic Analysis
In the present study, amino acid sequence identities and multiple alignments of 26 HbMad-boxproteins were calculated using DNAMAN6.0. To examine the evolutionary history and phylogeneticrelationships of the HbMADS-box genes, we constructed a phylogenetic tree using MEGA6.0 (http://www.megasoftware.net/) based on multiple sequence alignment of HbMADS-box TFs from Arabidopsis,Oryza sativa L., Vitis vinifera L., Jatropha carcas L., and H. brasiliensis.
2.6. Quantitative Real-Time PCR (qRT-PCR) Analysis
The real-time quantitative RT-PCR (qRT-PCR) was performed according to the followingprocedures: 94 ◦C for 30 s, 94 ◦C for 5 s, followed by 40 cycles, 60 ◦C for 15 s, and 72 ◦C for 10 s.The reaction volume was 20 μL: including 60 ng cDNA per sample, 1×SYBR® Premix Ex Taq™(TaKaRa, Shiga, Japan), and 0.4 μM per primer. The reaction was carried out in 96-well plates using theCFX96™ Real-Time System (Bio-Rad, Hercules, CA, USA). The 18S rRNA gene (GenBank accessionNo.: AB268099) was used as a reference gene in the qRT-PCR reaction [41]. After the reaction, we usedBio-Rad CFX Manager Software 3.0 (Bio-Rad, Hercules, CA, USA) to analyze and visualize the dataas previously described [42]. All primers used for qRT-PCR analysis were designed by Primer3.0(http://frodo.wi.mit.edu/primer3). The primer sequences are given in Table S2.
2.7. Statistical Analysis
Data and graphical analysis was performed with Sigma Plot 12 software (Systat Software Inc.,San Jose, CA, USA). The 2−ΔΔCT method was used to calculate the relative expression levels of allHbMad-box genes [43]. The data are represented by the mean ± SD (standard deviation) of the threebiological repeats. The statistical significance of the values was determined by a t-test.
98

Forests 2018, 9, 304
3. Results
3.1. Subsection Identification and Characterization of HbMad-box Genes in H. brasiliensis
The 76 candidate HbMADS-box genes were checked by CDS and Inter-ProScan to confirmthe existence of the MADS-box domain. After deleting the redundant sequences, a total of26 non-redundant HbMADS-box genes (designated as HbSEP, HbAGL9.1, HbAGL9.2, HbCMB1,HbCMB1-L, HbAGL6, HbAGL8, HbAP1, HbAGL12, HbAG, HbAGL11, HbAGL15, HbSVP1, HbSVP2,HbTT16, HbDEFL, HbPMADS2, HbAGL30, HbAGL61, HbAGL65, HbMADS1, HbMADS2, HbMADS3,HbMADS4, HbMADS5, and HbMADS27) with complete open reading frames (ORFs) were identifiedin the rubber tree (Table 1), which included six previously reported HbMADS-box TFs (HbMADS1,HbMADS2, HbMADS3, HbMADS4, HbMADS5, and HbMADS27).
Table 1. Characteristics of HbMADS-box genes family in Hevea brasiliensis Müll. Arg.
Gene Name GenBank Accession No. ORF Length (bp)Protein
Length (aa) Mw (kDa) PI
HbSEP KY471153 732 243 28.00 8.88HbAGL9.1 KY471149 732 243 27.77 8.21HbAGL9.2 KY471165 723 240 27.40 8.8HbCMB1 KY471159 729 242 27.57 8.36
HbCMB1-L KY471157 729 242 27.87 7.6HbAGL6 KY471160 729 242 27.63 8.73HbAGL8 KY471148 759 252 29.16 7.72HbAP1 KY471161 726 241 28.16 8.19
HbMADS3 GU142915 720 239 27.61 9.16HbAGL12 KY471152 609 202 23.09 6.92
HbAG KY471158 726 241 27.78 9.08HbAGL11 KY471166 669 222 25.52 9.34HbMADS2 GU142914 654 217 24.93 9.23HbAGL15 KY471151 768 255 29.27 6.68
HbMADS27 KY486278 717 238 27.49 9.25HbSVP1 KY471154 633 210 23.69 6.86HbSVP2 KY471156 702 234 26.60 6.06
HbMADS4 KY486276 633 210 23.67 6.36HbTT16 KY471155 705 234 27.46 7.69HbDEFL KY471162 675 224 26.23 8.43
HbPMADS2 KY471147 639 212 25.12 8.4HbAGL30 KY471163 1116 371 41.86 7.14HbAGL61 KY471164 642 213 24.24 8.32HbAGL65 KY471150 741 246 28.41 8.68HbMADS5 KY486277 1077 358 40.74 6.38HbMADS1 GU142913 738 245 27.78 8.34
ORF, open reading frame; bp, base pair; aa, amino acids; Mw, molecular weight; PI, isoelectric point.
To confirm the putative HbMADS-box genes, the complete ORF sequences of HbMADS-boxgenes were isolated through RNA-sequencing and PCR-based approaches. Accurate sequences ofHbMADS-box genes were submitted to GenBank, and the accession numbers of HbMADS-box genesare listed in Table 1. The ORF lengths of HbMADS-box genes ranged from 609 bp (HbAGL12) to1116 bp (HbAGL30), and encoded polypeptides that ranged from 202 to 371 amino acids (Table 1).The corresponding Mw ranged from 23.09 to 41.86 kDa, and the predicted PI varied from 6.06 (HbSVP2)to 9.34 (HbAGL11). The distribution of PI was similar to that of AtMADS-box genes; however, the lengthand Mw of the HbMADS-box TFs were slightly lower than those of AtMADS-box genes (Table S3).
Pairwise sequence comparisons were performed to check the sequence identities betweenHbMADS-box proteins. The results showed that the identities between two HbMADS-box genesranged from 13.67% to 98.57% (Table S4). The average sequence homology between two HbMADS-boxgenes was 39.99%. The largest sequence identity was observed between HbMADS4 and HbSVP1(98.5%). HbAGL30 and HbMADS3 showed the least sequence identity (13.67%).
99

Forests 2018, 9, 304
3.2. Analysis of Conserved Domains and Structural Features of HbMad-box Proteins
Analysis of conserved domains showed that all of the deduced HbMADS-box proteinscontained a highly conserved MADS-box domain of approximately 50 amino acid residues in length,a semi-conservative K domain with an obvious coiled-coil region, a less conservative I domain, and anon-conservative C domain (Figure 1), which indicates that they belonged to the MADS-box TF family.We further analyzed the conserved domain of HbMADS-box proteins, and the results indicated thatfor amino acids 3 (R), 17 (R), 20 (T), 23–24 (KR), 27 (G), 30–31 (KK), 34 (E), 38–39 (LC), 48 (F), and 52 (G),up to 13 sites were conserved in the MADS-box domains (Figure 1), indicating that the deduced aminoacid sequences of HbMADS-box proteins shared significant homology with each other.
Figure 1. Phylogenetic analysis of HbMADS-box genes related proteins. MADS-box, I domain,K domain, and C domain are marked, respectively; coiled-coil domain is boxed.
The conserved motifs and structural characteristics analysis showed that all HbMADS-box genesincluded four conserved motifs: motifs 1 and 3 belonged to the MADS-box domains, whereas motifs 2and 4 belonged to the K-box domains. Most HbMADS-box proteins (except HbAGL30 and HbAGL61)
100

Forests 2018, 9, 304
contained the MADS-box and K-box domains (Figure S2), which is similar to the previously reportedMADS-box conserved motifs in other species [44].
3.3. Gene Structures and Sequence Characteristics of HbMad-box Genes
Sequence analysis revealed that all of the deduced H. brasiliensis MADS-box genes belong tothe type II (MIKC-type) MADS-box genes. These HbMad-box genes usually contained multipleintrons and exons, with a maximum of 11 exons (Figure S3). According to their predicted structures,the 26 candidate HbMADS-box genes could be divided into eight groups (Table S5). The firstgroup of HbMADS-box genes consisted of eight exons interrupted by seven introns, including eighttype II HbMADS-box genes (HbSEP, HbAGL9.2, HbCMB1, HbCMB1-L, HbSVP1, HbMADS4,HbAGL65, and HbMADS5). The second and third groups included five type II HbMADS-box genes,which contained six exons interrupted by five introns (HbAGL6, HbMADS2, HbMADS27, HbSVP2,and HbTT16), and seven exons interrupted by six introns (HbAP1, HbMADS3, HbAGL12, HbAG,and HbDEFL), respectively. The fourth and fifth groups consisted of two type II HbMADS-box genes,which contained 10 exons interrupted by nine introns (HbAGL9.1 and HbAGL8), and five exonsinterrupted by four introns (HbAGL11 and HbPMADS2), respectively. The sixth group included twotype II HbMADS-box genes (HbAGL30 and HbMADS1), which contained 11 exons interrupted by10 introns. The seventh and eighth groups each contained one type II HbMADS-box gene (HbAGL15and HbAGL61), which consisted of four exons interrupted by three introns, and only one exon,respectively. These results revealed that most of the HbMADS-box genes (69.2% belong to the first,second, and third groups) within the same group shared conserved exon–intron structures, and theother HbMADS-box genes (30.8% of the fourth to eighth groups) with the different exon–intronstructures may belong to distinct types of HbMADS-box genes in the rubber tree (Table S5).These characteristics are consistent with the features of MADS-box genes in other flowering plants,such as Arabidopsis, Oryza sativa, and Vitis vinifera [45–47].
3.4. Phylogenetic Analysis of HbMad-box TFs
Based on the phylogenetic tree analysis, the 26 HbMADS-box genes could be divided intothree clades (I, II, and III), which contained 11 main branches: SEP, AGL6, FUL/AP1, AGL12, AG,SOC1, AGL15, AGL17, SVP, BS, and AP3/PI subfamilies (Figure 2). Clade I contained 12 type IIHbMADS-box genes, and it could be further categorized into two subclades, which contained nine andthree members. Clade II contained six type II HbMADS-box genes, and it could also be divided intotwo subclades, and one subclade contained one member, whereas the other contained five members.Clade III contained eight type II MADS-box genes, which had two subclades, one of which containedthree members and the other contained five members.
101

Forests 2018, 9, 304
Figure 2. Phylogenetic analysis of HbMADS-box genes with other MADS-box genes by MEGA version 6.0.A phylogenetic tree of MADS-box genes was generated by the neighbor-joining (NJ) method. The multiplesequence alignment and construction of phylogenetic tree were performed with MEGA6.06 using theneighbor joining method with 1000 bootstrap replicates. The proteins were clustered and divided intothree distinct sub-families. The three sub-families were further divided into 12 sub-groups.
3.5. Expression Profiles of HbMad-box Genes in Various Developmental Stages during Rubber TreeReproductive Development
In the present study, analyzing the expression patterns of HbMADS-box genes in different tissuesand organs (including roots, stem, stem tips, leaves, labeled bark, xylem, latex, fruits, inflorescence,male flowers, and female flowers) of H. brasiliensis by qRT-PCR, the results showed that most ofthe deduced HbMADS-box genes might be primarily involved in floral organ differentiation andinflorescence development. For example, HbSEP, HbAGL9.1, HbAGL9.2, HbCMB1, HbCMB1-L,HbAGL6, HbAG, HbDEFL, and HbPADS2 had significantly higher expression in stem tips and floralorgans than other tissues; HbAP1 showed the highest expression pattern in stem tips compared toother tissues (Figure 3); HbAGL8 was significantly higher expressed in stem tips and leaves thanother tissues (Figure 3); the MADS-box genes HbAGL15, HbTT16, HbMADS2, and HbAG were higherexpressed in fruits than other tissues (Figure 3); and the MADS-box genes HbAGL9.2 and HbAGL6were specifically expressed in floral organs and they were higher expressed in male flowers thanother tissues (Figure 3). The higher expression of the HbMad-box genes in floral organs and shoottips suggests that they may play a specific role in the corresponding tissues. However, in contrast,some MADS-box genes displayed different tissue expression patterns, such as HbAGL15, HbAGL30,
102

Forests 2018, 9, 304
HbAGL61, and HbAGL65, which were almost constitutively expressed in all tested tissues (Figure 3).In addition, we also found that some HbMADS-box genes showed higher expression patterns inother specific tissues; for example, HbMADS1 and HbMADS3 were higher expressed in latex thanother tissues (Figure 3), which was consistent with the findings of a previous report that found thatHbMADS1 and HbMADS3 were highly expressed in laticifer cells.
Figure 3. Relative expression levels of HbMad-box genes were determined by qRT-PCR and normalizedby 18S rRNA gene expression. Relative expression levels of HbMad-box genes were determinedby qRT-PCR and normalized by the 18S rRNA gene expression. For each gene, the transcriptlevel in the root was used to normalize the transcript levels in other tissues. Values are means± SD (standard deviation) of three biological replicates. 1–14 represent roots; stem; stem tips;leaves; labeled bark; xylem; latex; fruits; 3 cm inflorescence; 6 cm inflorescence; 9 cm inflorescence;12 cm inflorescence; male flowers; and female flowers, respectively.
103

Forests 2018, 9, 304
3.6. Expression Patterns of HbMADS-box Genes in Response to Abiotic Stress
Analyzing the expression patterns of 12 floral-enriched HbMADS-box genes under cold,high-temperature, drought, and salt stresses by qRT-PCR, the results indicated that the expressions of12 HbMADS-box genes specifically related to the floral organ were affected by low-temperature stress(Figure S4). Among the 12 cold-regulated HbMADS-box genes related to floral organ development,most of them (HbSEP, HbAGL9.1, HbAGL9.2, HbCMB1, HbCMB1-L, HbAGL6, HbAG, HbDEFL,and HbMADS2) were rapidly induced by cold stress, and reached the highest levels at 3 or 6 h aftertreatment, and then declined at 12 or 24 h after treatment. Only three HbMADS-box genes, HbAGL8,HbAP1, and HbTT16, exhibited down-regulated expression at all analyzed time-points in response tocold stress.
Under high-temperature stress, only HbDEFL expression did not significantly change (Figure S5).Of the 11 high temperature-responsive HbMADS-box genes, two genes (HbSEP and HbCMB1) weresignificantly up-regulated at all treated time points. Seven genes (HbAGL9.1, HbAGL9.2, HbCMB1-L,HbAGL6, HbAP1, HbAG, and HbTT16) were significantly up-regulated at at least one time point(Figure S5). By contrast, HbAGL8 and HbPADS2 were significantly down-regulated at all analyzedtime points.
Under polyethylene glycol induced drought stress, the expression patterns of 12 HbMADS-boxgenes related to floral organ development were markedly affected (Figure S6). Of the12 drought-responsive HbMADS-box genes, 10 genes (HbSEP, HbAGL9.1, HbAGL9.2, HbCMB1,HbCMB1-L, HbAP1, HbAG, HbTT16, HbDEFL, and HbMADS2) were significantly up-regulatedduring at least one time point after drought stress (Figure S6). Among them, HbAGL9.1, HbCMB1-L,HbAG, HbTT16, and HbDEFL were strongly affected by drought stress, reaching the highest levelsthat were 2-, 2.5-, 3.7-, 4-, and 5.8-fold increases compared with the control at 6 h, 12 h, 24 h, 7 day,and 4 day after treatment, respectively. Interestingly, the expression of HbAGL6 and HbAGL8 increasedcontinuously after drought stress, and resulted in a 120- and 11-fold increase, respectively, at 7 dayafter treatment.
Under salt stress, the expressions of 12 floral-enriched HbMADS-box genes were regulatedby salt stress. Eight genes (HbAGL9.1, HbAGL9.2, HbAGL6, HbAGL8, HbAP1, HbAG, HbDEFL,and HbPADS2) were significantly up-regulated at all of the treated time points (Figure S7).Their expression levels showed rapid up-regulation under salt stress, which peaked at 2, 48, 48, 12, 24,48, 2, and 48 h of treatment, respectively. Four genes (HbSEP, HbCMB1, HbCMB1-L, and HbTT16) weresignificantly up-regulated at at least one time point under salt stress (Figure S7), and their transcriptsreached maximum levels that were 2-, 2.9-, 12-, and 24-fold up-regulated compared with the control at12, 2, 2, and 2 h after treatment, respectively.
3.7. Expression Patterns of HbMADS-box Genes in Response to Phytohormones
After ABA treatment, HbAGL9.1, HbAGL6, HbAP1, and HbPADS2 displayed obviousup-regulation across all time points (Figure S8). Their expression levels exhibited rapid up-regulationunder ABA treatment, and peaked at 48, 48, 12, and 48 h after treatment, respectively. HbAGL9.2 andHbCMB1-L showed similar expression patterns; their transcripts exhibited down-regulated expressionat the 6-h time point, but they were significantly up-regulated at other time points. HbSEP, HbCMB1,HbAGL8, HbAG, and HbDEFL were down-regulated at the time points of 24, 12, 0.5, 24, and 24 hcompared with the control, respectively, but they displayed obvious up-regulation at other timepoints. In comparison, HbTT16 showed an irregular expression pattern under ABA treatment; it wasup-regulated at 48 h, but was down-regulated at 0.5, 2, 12, and 24 h.
After GA3 treatment, HbSEP, HbAGL9.1, HbAGL9.2, HbCMB1, HbAGL6, HbAGL8, HbAP1,HbTT16, and HbDEFL showed obvious up-regulation across all time points (Figure S9).Their expression levels exhibited rapid up-regulation under GA3 treatment, and reached a maximumlevel at 0.5, 12, 6, 48, 12, 48, 6, and 48 h after treatment, respectively. However, HbAG and HbPADS2were slightly down-regulated at the 24-h time point, but their expression levels showed obvious
104

Forests 2018, 9, 304
up-regulation at other time points. By contrast, HbCMB1-L displayed an irregular expression pattern;it was strongly up-regulated at 0.5, 2, and 48 h, but was down-regulated at 6, 12, and 24 h.
4. Discussion
Understanding the flowering regulation of H. brasiliensis is important for accelerating the breedingprocess of this species. Based on studies of Arabidopsis and other plants, extensive efforts havebeen devoted to clarifying the molecular mechanism of reproductive development in plants [48,49],and techniques such as RT-qPCR and high-throughput RNA sequencing have been used in manytranscriptional-level studies to identify the genes that regulate the metabolism of plant reproductivedevelopment. However, available information about TFs related to reproductive development inH. brasiliensis is still limited. To date, no study has been performed to determine the expression patternsof HbMad-box genes relative to rubber tree reproductive development.
As an important gene family, Mad-box genes are widespread in the plant kingdom. The numberof Mad-box genes varies considerably in genomes of different species, from 20 in Physcomitrella patens(Hedw.) Bruch & Schimp. to 167 in Brassica rapa L. [50,51]. In this study, we performed genome-wideidentification and analysis of the MADS-box gene family related to flower development in H. brasiliensis.A total of 20 MADS-box genes were newly identified in the H. brasiliensis genome, which was lowerthan the number of MADS-box genes in the woody plant Malus pumila Mill. [52]. A domain searchusing EMBL with the corresponding H. brasiliensis candidate protein sequences confirmed that 26 of thesequences contained a ‘MADS’ domain. We classified all 26 putative H. brasiliensis MADS-box proteinsinto three clades, which were consistent with the classifications of MADS-box gene family members inother flowering plants [53]. Sequence alignment analysis of 26 MADS-box genes revealed that theirORFs ranged from 609 to 1116 bp, and predicted protein lengths that ranged from 202 to 371 amino acids(Table 1). Subsequent gene structures analysis showed that most of the HbMad-box genes usuallycontained multiple introns, with a maximum of 11 introns; the exception was HbAGL61, which did nothave any introns. Interestingly, we observed that only MIKC-type (no M-type) MADS-box genes existedin H. brasiliensis. In contrast, the number of M-type MADS-box genes in Arabidopsis is more than thatof the MIKCC-type [54]. Furthermore, we found that the expansion of MIKCC-type and MIKC*-typeMADS-box genes was disproportionate, and there were more MIKCC-type (twenty-one members)than MIKC*-type (five members) MADS-box genes presented in H. brasiliensis, which might be relatedto the fact that MIKCC-type genes conducted as functional genes to perform more complex functionsin H. brasiliensis flower organogenesis.
Most studies on the functional identification of MADS-box genes were conducted on modelplants [55–57], which also substantially contributed to revealing the diverse functions of MADS-boxgenes. In order to detect the expression of HbMADS-box genes in different tissues, we analyzedthe expression patterns of HbMADS-box genes in 11 sample tissues and four stages of inflorescencedevelopment by qRT-PCR. The results revealed that for close orthologs of SEP and AGL6 in therubber tree, HbSEP, HbAGL9.1, HbAGL9.2, HbCMB1, HbCMB1-L, and HbAGL6 showed higherexpression during stem tip and floral organ development; for close orthologs of FUL-AP1 and AGin the rubber tree, HbAGL8, HbAP1, and HbAG, also exhibited higher expression during stem tipand floral organ development (Figure 3). The same expression pattern was also observed in subcladeAP3-PI; HbDEFL and HbPADS2 were found to be highly expressed during stem tip and floral organdevelopment, which indicates association with the development of reproductive organs. These findingsare consistent with those of previous results that revealed the MIKC-type MADS-box gene as theflower homeotic gene that plays a dominant role in floral organ development [58].
Interestingly, HbAGL6 was progressively increased in four stages of inflorescence development,and the expression level of HbAGL6 in the male flowers was almost four-fold more than the femaleflowers in H. brasiliensis, which indicates that HbAGL6 may be involved in the development ofinflorescence and floral organs, and especially participates in the development of male flowersorgans (Figure 3). In addition, HbDEFL also displayed strong expression in inflorescence and
105

Forests 2018, 9, 304
was almost four-fold more abundant in the male flowers than the female flowers in H. brasiliensis,which indicates that HbDEFL may play an important role in the development of male flowers.In contrast, HbTT16 showed strong expression in the fruits and female flowers, and the expressionlevel of HbTT16 in the female flowers was almost 40-fold more than the male flowers in H. brasiliensis,which indicates association with the development of female organs in the rubber tree. In other plantspecies, TT16 homologs were also demonstrated to mediate the crosstalk between the endotheliumand nucellus for the development of female organs [59,60].
Besides being involved in the essential regulation of the development of floral organs,many studies have shown that MADS-box genes also play an essential role in the response to variousstresses and exhibit differential expression patterns under abiotic stress [61,62]. Rubber trees originatedin the Amazon Basin of South America, but are now widely planted in the northern margin of tropicalareas, such as Southeast Asia countries (e.g., Thailand, Vietnam, and southern China), which are oftensuffer from cold, drought, typhoon, and other abiotic stresses.
To understand the responses of HbMADS-box genes to various stresses, the expression profilesof 12 floral-enriched HbMADS-box genes were examined in leaves of Hevea seedlings after hormone,salt, cold, high-temperature, and drought stress treatments. In the present study, almost all of theHbMADS-box genes specifically related to floral organs exhibited changes in expression patterns whenresponding to hormone, salt, cold, high-temperature, and drought stresses (Figures S4–S9). Our resultsshow that different HbMADS-box genes responded differently to abiotic stress, which indicates thatstress responses of H. brasiliensis are regulated by many factors, involving a variety of signaling pathways.In addition, the hormone and salt stress responses of 12 floral-enriched HbMADS-box genes were moreintense than those of temperature and drought stress responses. Among them, HbAGL9.2, HbAGL6,and HbAP1 were strongly induced by ABA; HbAGL9.1, HbAGL9.2, HbCMB1-L, HbAGL6, HbAGL8,HbAP1, HbTT16, and HbPADS2 were strongly induced by GA3; and HbAGL9.2, HbCMB1-L, HbAGL6,HbAGL8, HbAP1, HbTT16, and HbPADS2 were strongly induced by salt treatments, whereas theirexpressions were slightly affected by cold, high-temperature, and drought stresses. The expressions ofHbAGL9.2, HbAGL6, and HbAP1 were strongly induced by a variety of hormones, which revealed thatthese genes might play a crucial role in hormone signaling in H. brasiliensis.
Overall, we characterized HbMADS-box genes as multifunctional regulators in H. brasiliensisbased on tissue specific expression analysis, as well as various stress responses. Our results revealedthat HbSEP, HbAGL9.1, HbAGL9.2, HbCMB1, HbCMB1-L, HbAGL6, HbAGL8, HbAP1, HbAG,HbDEFL, and HbPADS2 may mainly regulate the differentiation of flower buds and could helpregulate reproduction in H. brasiliensis; whereas HbTT16 may mainly regulate the development offruits and female organs in the rubber tree. Expression profiling revealed that different HbMADS-boxgenes responded differently to abiotic stresses, which indicates that abiotic stresses in H. brasiliensis areregulated by many factors and various signaling pathways. Our findings will promote the developmentof technology that can control the reproduction of H. brasiliensis by genetic engineering. In the nearfuture, we will be able to verify the role of these HbMADS-box genes in the transition of vegetative toreproductive development using transgenic H. brasiliensis, as well as transgenic Arabidopsis.
5. Conclusions
In this study, 20 new HbMad-box genes were identified in the rubber tree.Subsequently, the bioinformatics characteristics, sequence identity, conserved domains, gene structure,and phylogenetic relationship of these genes were systematically analyzed. Expression profilingrevealed that HbMad-box genes were differentially expressed in various tissues, which indicatedthat HbMad-box genes may exert different functions throughout the life cycle. Additionally, HbSEP,HbAGL9.1, HbAGL9.2, HbCMB1, HbCMB1-L, HbAGL6, HbAGL8, HbAP1, HbAG, HbDEFL, HbTT16,and HbPADS2 were found to be associated with the differentiation of flower buds and may beinvolved in flower development. All of these floral-enriched HbMADS-box genes were regulated byhormone, salt, cold, high-temperature, and drought stresses, which revealed that abiotic stresses in
106

Forests 2018, 9, 304
H. brasiliensis are regulated by many factors and various signaling pathways. Our results provide acomprehensive overview of the HbMADS-box gene family related to floral development and lay thefoundation for further functional characterization of this gene family in H. brasiliensis.
Supplementary Materials: The following are available online at www.mdpi.com/1999-4907/9/6/304/s1, FigureS1: Tissue samples of rubber tree flowers, Figure S2: The conserved domain logo and motif composition ofHbMADS-box genes, Figure S3: Exon-intron structures of HbMads-box genes, Figure S4: Expression profilesof the floral-enriched HbMad-box genes under cold stress, Figure S5: Expression profiles of the floral-enrichedHbMad-box genes under high temperature stress, Figure S6: Expression profiles of the floral-enriched HbMad-boxgenes under drought stress, Figure S7: Expression profiles of the floral-enriched HbMad-box genes under saltstress, Figure S8: Expression profiles of the floral-enriched HbMad-box genes responding to ABA treatment,Figure S9: Expression profiles of the floral-enriched HbMad-box genes responding to GA3 treatment, Table S1:List of primer sequences used for HbMad-box TFs amplification, Table S2: List of primer sequences used forqRT-PCR analysis, Table S3: Sequence features of AtMADSs in A. thaliana. (L.) Heynh. Gene IDs, protein length,PI, and molecular weight of corresponding AtMADSs in A. thaliana are shown, Table S4: Percent identity matrixof HbMad-box TFs proteins, Table S5: Statistics of exon and intron number distribution among HbMad-box TFs.
Author Contributions: M.W. and W.L. designed the experiments. R.P. performed the tissue and organ collection.M.W. and Y.W. performed the experiments. All authors read and approved the final manuscript.
Funding: This research was funded by the Central Public-interest Scientific Institution Basal Research Fund forChinese Academy of Tropical Agricultural Sciences (No. 1630022017010) and the earmarked Fund for ModernAgro-industry Technology Research System (CARS-34).
Conflicts of Interest: The authors declare no conflict of interest.
References
1. Li, D.; Zeng, R.; Yan, L.; Zhao, M.; Chao, J.; Yu, L. Gene expression analysis and SNP/InDel discovery toinvestigate yield heterosis of two rubber tree F1 hybrids. Sci. Rep. 2016, 6, 24984. [CrossRef] [PubMed]
2. Mooibroek, H.; Cornish, K. Alternative sources of natural rubber. Appl. Microbiol. Biotechnol. 2000, 53, 355–365.[CrossRef] [PubMed]
3. Ahmad, N.; Abnisaa, F.; Daud, W. Potential use of natural rubber to produce liquid fuels using hydrouspyrolysis—A review. RSC Adv. 2016, 6, 68906–68921. [CrossRef]
4. Pethin, D.; Nakkanong, K.; Nualsri, C. Performance and genetic assessment of rubber tree clones inSouthern Thailand. Sci. Agric. 2015, 72, 306–313. [CrossRef]
5. Ahrends, A.; Hollingsworth, P.M.; Ziegler, A.D.; Fox, J.M.; Chen, H.; Su, Y. Current trends of rubberplantation expansion may threaten biodiversity and livelihoods. Glob. Environ. Chang. 2015, 34, 48–58.[CrossRef]
6. Dornelas, M.C.; Rodriguez, A.P. The rubber tree (Hevea brasiliensis Muell. Arg.) homologue of theLEAFY/FLORICAULA gene is preferentially expressed in both male and female floral meristems. J. Exp. Bot.2005, 56, 1965–1974. [CrossRef] [PubMed]
7. Cubry, P.; Pujade-Renaud, V.; Garcia, D.; Espeout, S.; Le, G.V.; Granet, F. Development and characterizationof a new set of 164 polymorphic EST-SSR markers for diversity and breeding studies in rubber tree(Hevea brasiliensis Mull. Arg.). Plant Breed. 2014, 133, 419–426. [CrossRef]
8. Ó’Maoiléidigh, D.S.; Wuest, S.E.; Rae, L.; Raganelli, A.; Ryan, P.T.; Kwasniewska, K.; Wellmer, F. Controlof reproductive floral organ identity specification in Arabidopsis by the C function regulator AGAMOUS.Plant Cell 2013, 25, 2482–2503. [CrossRef] [PubMed]
9. Yu, H.; Ito, T.; Wellmer, F.; Meyerowitz, E.M. Repression of AGAMOUS-LIKE 24 is a crucial step in promotingflower development. Nat. Genet. 2004, 36, 157–161. [CrossRef] [PubMed]
10. Patharkar, O.R.; Walker, J.C. Floral organ abscission is regulated by a positive feedback loop. PNAS 2015,112, 2906–2911. [CrossRef] [PubMed]
11. Adamczyk, B.J.; Lehtishiu, M.D.; Fernandez, D.E. The MADS domain factors AGL15 and AGL18 actredundantly as repressors of the floral transition in Arabidopsis. Plant J. 2007, 50, 1007–1019. [CrossRef][PubMed]
12. García-Maroto, F.; Carmona, M.J.; Garrido, J.A.; Vilches-Ferrón, M.; Rodríguez-Ruiz, J.; Alonso, D.L.New roles for MADS-box genes in higher plants. Biol. Plant. 2003, 46, 321–330. [CrossRef]
107

Forests 2018, 9, 304
13. Nam, J.; Ma, H.; Nei, M. Antiquity and evolution of the MADS-box gene family controlling flowerdevelopment in plants. Mol. Biol. Evol. 2003, 20, 1435–1447. [CrossRef] [PubMed]
14. Wong, C.E.; Singh, M.B.; Bhalla, P.L. Novel members of the AGAMOUS LIKE 6 subfamily of MIKCc-typeMADS-box genes in soybean. BMC Plant Biol. 2013, 13, 105. [CrossRef] [PubMed]
15. Leseberg, C.H.; Li, A.; Kang, H.; Duvall, M.; Mao, L. Genome-wide analysis of the MADS-box gene family inpopulus trichocarpa. Gene 2006, 378, 84–94. [CrossRef] [PubMed]
16. Kofuji, R.; Sumikawa, N.; Yamasaki, M.; Kondo, K.; Ueda, K.; Ito, M.; Hasebe, M. Evolution and divergence ofthe MADS-box gene family based on genome-wide expression analyses. Mol. Biol. Evol. 2003, 20, 1963–1977.[CrossRef] [PubMed]
17. Torti, S.; Fornara, F.; Vincent, C.; Andrés, F.; Nordström, K.; Göbel, U. Analysis of the Arabidopsis shootmeristem transcriptome during floral transition identifies distinct regulatory patterns and a leucine-richrepeat protein that promotes flowering. Plant Cell 2012, 24, 444–462. [CrossRef] [PubMed]
18. Honma, T.; Goto, K. Complexes of MADS-box proteins are sufficient to convert leaves into floral organs.Nature 2001, 409, 525–529. [CrossRef] [PubMed]
19. Lalusin, A.G.; Nishita, K.; Kim, S.H.; Ohta, M.; Fujimura, T. A new MADS-box gene (IbMADS10) from sweetpotato (Ipomoea batatas L. Lam) is involved in the accumulation of anthocyanin. Mol. Genet. Genom. 2006, 275, 44–54.[CrossRef] [PubMed]
20. Zhang, B.; Su, X.; Zhou, X. A MADS-box gene of Populus deltoides expressed during flower development andin vegetative organs. Tree Physiol. 2008, 28, 929–934. [CrossRef] [PubMed]
21. Liu, J.; Xu, B.; Hu, L.; Li, M.; Su, W.; Wu, J. Involvement of a banana MADS-box transcription factor gene inethylene-induced fruit ripening. Plant Cell Rep. 2009, 28, 103–111. [CrossRef] [PubMed]
22. Tani, E.; Polidoros, A.N.; Tsaftaris, A.S. Characterization and expression analysis of Fruitfull- and shatterproof-likegenes from peach (Prunus persica) and their role in split-pit formation. Tree Physiol. 2007, 27, 649–659. [CrossRef][PubMed]
23. Ge, J.; Zhao, D.; Han, C.; Wang, J.; Hao, Z.; Tao, J. Cloning and expression of floral organ development-relatedgenes in herbaceous peony (Paeonia lactiflora, Pall.). Mol. Biol. Rep. 2014, 41, 6493–6530. [CrossRef] [PubMed]
24. Bemer, M.; Heijmans, K.; Airoldi, C.; Davies, B.; Angenent, G. An atlas of type I MADS box gene expressionduring female gametophyte and seed development in Arabidopsis. Plant Physiol. 2010, 154, 287–300. [CrossRef][PubMed]
25. Thakare, D.; Tang, W.; Hill, K.; Perry, S.E. The MADS-domain transcriptional regulator AGAMOUS-LIKE15promotes somatic embryo development in Arabidopsis and soybean. Plant Physiol. 2008, 146, 1663–1672.[CrossRef] [PubMed]
26. Colombo, M.; Masiero, S.; Vanzulli, S.; Lardelli, P.; Kater, M. M.; Colombo, L. AGL23, a type I MADS-boxgene that controls female gametophyte and embryo development in Arabidopsis. Plant J. 2008, 54, 1037–1048.[CrossRef] [PubMed]
27. Lee, S.; Woo, Y.; Ryu, S.; Shin, Y.; Kim, W.; Park, K.; Lee, I.; An, G. Further characterization of a rice AGL12group MADS-Box gene, OsMADS26. Plant Physiol. 2008, 147, 156–168. [CrossRef] [PubMed]
28. Elitzur, T.; Vrebalov, J.; Giovannoni, J.J.; Goldschmidt, E.E.; Friedman, H. The regulation of MADS-box geneexpression during ripening of banana and their regulatory interaction with ethylene. J. Exp. Bot. 2010, 61, 1523–1535.[CrossRef] [PubMed]
29. Lozano, R.; Angosto, T.; Gomez, P.; Payan, C.; Capel, J.; Huijser, P. Tomato flower abnormalities induced by lowtemperatures are associated with changes of expression of MADS-Box genes. Plant Physiol. 1998, 117, 91–100.[CrossRef] [PubMed]
30. Arora, R.; Agarwal, P.; Ray, S.; Singh, A.K.; Singh, V.P.; Tyagi, A.K. MADS-box gene family in rice:Genome-wide identification, organization and expression profiling during reproductive development andstress. BMC Genom. 2007, 8, 242. [CrossRef] [PubMed]
31. Bonhomme, F.; Kurz, B.; Melzer, S.; Bernier, G.; Jacqmard, A. Cytokinin and gibberellin activate SaMADSA, a gene apparently involved in regulation of the floral transition in Sinapis alba. Plant J. 2000, 24, 103–111.[CrossRef] [PubMed]
32. Ando, S.; Sato, Y.; Kamachi, S.; Sakai, S. Isolation of a MADS-box gene (ERAF17) and correlation of its expressionwith the induction of formation of female flowers by ethylene in cucumber plants (Cucumis sativus L.). Planta2001, 213, 943–952. [CrossRef] [PubMed]
108

Forests 2018, 9, 304
33. Zhu, C.; Perry, S.E. Control of expression and auto regulation of AGL15, a member of the MADS-box family.Plant J. 2005, 41, 583–594. [CrossRef] [PubMed]
34. Li, H.L.; Wei, L.R.; Guo, D.; Wang, Y.; Zhu, J.H.; Chen, X.T. HbMADS4, a MADS-box transcription factor fromHevea brasiliensis, negatively regulates HbSRPP. Front. Plant Sci. 2016, 7, 1709–1712. [CrossRef] [PubMed]
35. Cai, H.B.; Tu, M.; Hua, Y.W.; Huang, H.S. Cloning and expression analysis of HbAGL62 of rubber tree(Hevea brasiliensis Arg.). Chin. J. Trop. Crops. 2012, 33, 1766–1771.
36. Wang, H.; Li, L.; Liang, Z.; Wu, Y.J. Cloning and bioinformatic analysis of the gene HbMADS-27 fromHevea brasiliensis. Chin. J. Trop. Agric. 2013, 33, 19–24.
37. Li, H.L.; Wang, Y.; Guo, D.; Tian, W.M.; Peng, S.Q. Three MADS-box genes of Hevea brasiliensis expressed duringsomatic embryogenesis and in the laticifer cells. Mol. Biol. Rep. 2011, 38, 4045–4052. [CrossRef] [PubMed]
38. Cheng, H.; Chen, X.; Zhu, J.S.; Huang, H.S. Overexpression of a Hevea brasiliensis ErbB-3 Binding protein 1Gene Increases Drought Tolerance and Organ Size in Arabidopsis. Front. Plant Sci. 2016, 7, 1703. [CrossRef][PubMed]
39. Xu, J.; Aileni, M.; Abbagani, S.; Zhang, P. A reliable and efficient method for total RNA isolation from variousmembers of spurge family (Euphorbiaceae). Phytochem. Anal. 2010, 21, 395–398. [CrossRef] [PubMed]
40. Solovyev, V. Statistical Approaches in Eukaryotic Gene Prediction. In Handbook of Statistical Genetics;John Wiley & Sons, Ltd.: Clifton, NJ, USA, 2004; pp. 7–39.
41. Tang, C.; Huang, D.; Yang, J.; Liu, S.; Sakr, S.; Li, H. The sucrose transporter HbSUT3 plays an active role insucrose loading to laticifer and rubber productivity in exploited trees of Hevea brasiliensis (para rubber tree).Plant Cell Environ. 2010, 33, 1708–1720. [CrossRef] [PubMed]
42. Long, X.; He, B.; Wang, C.; Fang, Y.; Qi, J.; Tang, C. Molecular identification and characterization of thepyruvate decarboxylase gene family associated with latex regeneration and stress response in rubber tree.Plant Physiol. Biochem. 2015, 87, 35–44. [CrossRef] [PubMed]
43. Livak, K.J.; Schmittgen, T.D. Analysis of relative gene expression data using real-time quantitative PCR andthe 2−ΔΔCT method. Methods 2001, 25, 402–408. [CrossRef] [PubMed]
44. Nakatsuka, T.; Saito, M.; Yamada, E.; Fujita, K.; Yamagishi, N.; Yoshikawa, N. Isolation and characterization ofthe C-class MADS-box gene involved in the formation of double flowers in Japanese gentian. BMC Plant Biol.2015, 15, 182. [CrossRef] [PubMed]
45. Liu, Y.; Zhang, D.; Ping, J.; Li, S.; Chen, Z.; Ma, J. Innovation of a regulatory mechanism modulatingsemi-determinate stem growth through artificial selection in soybean. PLoS Genet. 2016, 12, e1005818. [CrossRef][PubMed]
46. Par Enicová, L.; Folter, S.D.; Kieffer, M.; Horner, D.S.; Favalli, C.; Busscher, J. Molecular and PhylogeneticAnalyses of the Complete MADS-Box Transcription Factor Family in Arabidopsis: New openings to theMADS world. Plant Cell 2003, 15, 1538–1551. [CrossRef]
47. Díazriquelme, J.; Lijavetzky, D.; Martínezzapater, J.M.; Carmona, M.J. Genome-wide analysis of MIKCc-typeMADS-box genes in grapevine. Plant Physiol. 2009, 149, 354–369. [CrossRef] [PubMed]
48. Zinta, G.; Khan, A.; Abdelgawad, H.; Verma, V.; Srivastava, A.K. Unveiling the redox control of plantreproductive development during abiotic stress. Front. Plant Sci. 2016, 7, 700. [CrossRef] [PubMed]
49. Fromm, S.; Braun, H.; Peterhansel, C. Mitochondrial gamma carbonic anhydrases are required for complex Iassembly and plant reproductive development. New Phytol. 2016, 211, 194–207. [CrossRef] [PubMed]
50. Yi, J.M.; Huang, T.; Huang, Y.; Chen, D.H. Phylogenetic analysis of MADS-box gene family inPhyscomitrella patens. Plant Physiol. J. 2015, 51, 197–206. [CrossRef]
51. Saha, G.; Park, J.I.; Jung, H.J.; Ahmed, N.U. Genome-wide identification and characterization of MADS-boxfamily genes related to organ development and stress resistance in Brassica rapa. BMC Genom. 2015, 16, 178.[CrossRef] [PubMed]
52. Kumar, G.; Arya, P.; Gupta, K.; Randhawa, V.; Acharya, V.; Singh, A.K. Comparative phylogenetic analysisand transcriptional profiling of MADS-box gene family identified DAM and FLC-like genes in apple(Malusx domestica). Sci. Rep. 2016, 6, 20695. [CrossRef] [PubMed]
53. Grimplet, J.; Martínez-Zapater, J.M.; Carmona, M.J. Structural and functional annotation of the MADS-boxtranscription factor family in grapevine. BMC Genom. 2016, 17, 80. [CrossRef] [PubMed]
54. Nam, J.; Kim, J.; Lee, S.; An, G.; Ma, H.; Nei, M. Type I MADS-box genes have experienced fasterbirth-and-death evolution than type II MADS-box genes in angiosperms. PNAS 2004, 101, 1910–1915.[CrossRef] [PubMed]
109

Forests 2018, 9, 304
55. Smaczniak, C.; Immink, R.G.; Angenent, G.C.; Kaufmann, K. Developmental and evolutionary diversityof plant MADS-domain factors: Insights from recent studies. Development 2012, 139, 3081–3098. [CrossRef][PubMed]
56. Masiero, S.; Li, M.A.; Will, I.; Hartmann, U.; Saedler, H.; Huijser, P. Incomposita: A MADS-box gene controllingprophyll development and floral meristem identity in antirrhinum. Development 2004, 131, 5981–5990. [CrossRef][PubMed]
57. Toshitsugu, N.; Junji, K.; Masaki, F.; Mamiko, K.; Nao, I.; Hideo, M. Macrocalyx and jointless interact in thetranscriptional regulation of tomato fruit abscission zone development. Plant Physiol. 2012, 158, 439–450.[CrossRef]
58. Huang, Q.; Li, W.; Fan, R.; Chang, Y. New mads-box gene in fern: Cloning and expression analysis ofdfmads1 from Dryopteris fragrans. PLoS ONE 2014, 9, e86349. [CrossRef] [PubMed]
59. Lepiniec, L.; Debeaujon, I.; Routaboul, J.M.; Baudry, A.; Pourcel, L.; Nesi, N.; Caboche, M. Genetics andbiochemistry of seed flavonoids. Annu. Rev. Plant Biol. 2006, 57, 405–430. [CrossRef] [PubMed]
60. Xu, W.; Fiume, E.; Coen, O.; Pechoux, C.; Lepiniec, L.; Magnani, E. Endosperm and nucellus developantagonistically in Arabidopsis seeds. Plant Cell 2016, 28, 1343–1360. [CrossRef] [PubMed]
61. Chen, G.; Deng, W.; Peng, F.; Truksa, M.; Singer, S.; Snyder, C.L. Brassica napus TT16 homologs with differentgenomic origins and expression levels encode proteins that regulate a broad range of endothelium-associatedgenes at the transcriptional level. Plant J. 2013, 74, 663–677. [CrossRef] [PubMed]
62. Zhang, Z.; Li, H.; Zhang, D.; Liu, Y.; Fu, J.; Shi, Y. Characterization and expression analysis of six MADS-boxgenes in maize (Zea mays L.). J. Plant Physiol. 2012, 169, 797–806. [CrossRef] [PubMed]
© 2018 by the authors. Licensee MDPI, Basel, Switzerland. This article is an open accessarticle distributed under the terms and conditions of the Creative Commons Attribution(CC BY) license (http://creativecommons.org/licenses/by/4.0/).
110

Article
Genome-Wide Analysis and Expression Profiling ofthe Heat Shock Factor Gene Family inPhyllostachys edulis during Development and inResponse to Abiotic Stresses
Lihua Xie, Xiangyu Li, Dan Hou, Zhanchao Cheng, Jun Liu, Juan Li, Shaohua Mu and Jian Gao *
Key Laboratory of Bamboo and Rattan Science and Technology, International Center for Bamboo and Rattan,State Forestry and Grassland Administration, Beijing 100102, China; [email protected] (L.X.);[email protected] (X.L.); [email protected] (D.H.); [email protected] (Z.C.);[email protected] (J.L.); [email protected] (J.L.); [email protected] (S.M.)* Correspondence: [email protected] or [email protected]; Tel.: +86-010-8478-9801
Received: 3 December 2018; Accepted: 23 January 2019; Published: 26 January 2019
Abstract: Heat shock transcription factors (Hsfs) play crucial roles in regulating plant responses toheat and other stresses, as well as in plant development. As the largest monopodial bamboo speciesin the world, how to adapt to various stresses under the background of global climate change isvery important for the sustainable development of bamboo forest. However, our understandingof the function of Hsfs in moso bamboo (Phyllostachys edulis) is limited. In this study, a total of22 non-redundant Hsf genes were identified in the moso bamboo genome. Structural characteristicsand phylogenetic analysis revealed that members of the PheHsf family can be clustered into threeclasses (A, B and C). Furthermore, PheHsfs promoters contained a number of stress-, hormone-and development-related cis-acting elements. Transcriptome analysis indicated that most PheHsfsparticipate in rapid shoot growth and flower development in moso bamboo. Moreover, the expressionpatterns of all 12 members of class A were analyzed under various stresses (heat, drought, salt andcold treatment) through Figurereal-time quantitative polymerase chain reaction (qRT-PCR). Withinthe class A PheHsf members, PheHsfA1a was expressed mainly during moso bamboo development.Expression of four PheHsfA4s and one PheHsfA2 (PheHsfA4a-1, PheHsfA4a-2, PheHsfA4d-1, PheHsfA4d-2,and PheHsfA2a-2) was up-regulated in response to various stresses. PheHsfA2a-2, PheHsfA4d-1and PheHsfA4d-2 were strongly induced respectively by heat, drought and NaCl stress. Throughco-expression analysis we found that two hub genes PheHsfA4a-2 and PheHsfA4a-1 were involved ina complex protein interaction network. Based on the prediction of protein interaction networks, fivePheHsfAs (PheHsfA4a-1, PheHsfA4a-2, PheHsfA4d-1, PheHsfA4d-2, and PheHsfA2a-2) were predictedto play an important role in flower and shoot development and abiotic stress response of mosobamboo. This study provides an overview of the complexity of the PheHsf gene family and a basisfor analyzing the functions of PheHsf genes of interest.
Keywords: moso bamboo; heat shock factor gene; abiotic stresses; co-expression
1. Introduction
Moso bamboo (Phyllostachys edulis (Carrière) J. Houzeau, synonym Phyllostachys heterocycla (Carrière)is a large woody bamboo of high ecological, economical and cultural value in Asia. Under suitable springconditions, its shoot can grow from 0 to 20 m in 45–60 days [1]. Moso bamboo forest covers an area of3.87 million hm2, accounting for up to 70% of the Chinese bamboo forest area [2,3]. Because of its rapidgrowth and highly lignified culms, the annual economic value of moso bamboo production, includingtimber and wood production, reaches 184 billion dollars [4]. Moreover, carbon sequestration in moso
Forests 2019, 10, 100; doi:10.3390/f10020100 www.mdpi.com/journal/forests111
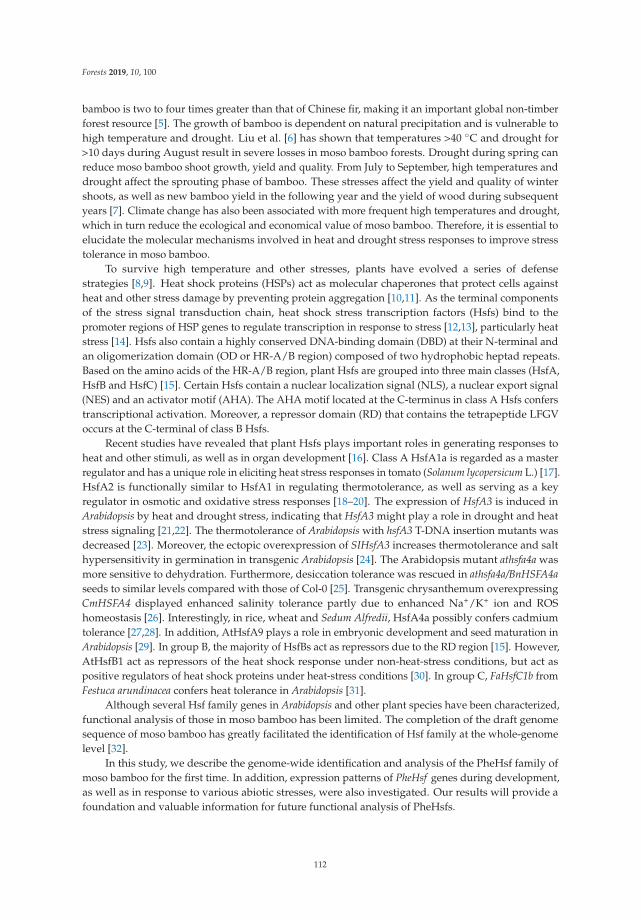
Forests 2019, 10, 100
bamboo is two to four times greater than that of Chinese fir, making it an important global non-timberforest resource [5]. The growth of bamboo is dependent on natural precipitation and is vulnerable tohigh temperature and drought. Liu et al. [6] has shown that temperatures >40 ◦C and drought for>10 days during August result in severe losses in moso bamboo forests. Drought during spring canreduce moso bamboo shoot growth, yield and quality. From July to September, high temperatures anddrought affect the sprouting phase of bamboo. These stresses affect the yield and quality of wintershoots, as well as new bamboo yield in the following year and the yield of wood during subsequentyears [7]. Climate change has also been associated with more frequent high temperatures and drought,which in turn reduce the ecological and economical value of moso bamboo. Therefore, it is essential toelucidate the molecular mechanisms involved in heat and drought stress responses to improve stresstolerance in moso bamboo.
To survive high temperature and other stresses, plants have evolved a series of defensestrategies [8,9]. Heat shock proteins (HSPs) act as molecular chaperones that protect cells againstheat and other stress damage by preventing protein aggregation [10,11]. As the terminal componentsof the stress signal transduction chain, heat shock stress transcription factors (Hsfs) bind to thepromoter regions of HSP genes to regulate transcription in response to stress [12,13], particularly heatstress [14]. Hsfs also contain a highly conserved DNA-binding domain (DBD) at their N-terminal andan oligomerization domain (OD or HR-A/B region) composed of two hydrophobic heptad repeats.Based on the amino acids of the HR-A/B region, plant Hsfs are grouped into three main classes (HsfA,HsfB and HsfC) [15]. Certain Hsfs contain a nuclear localization signal (NLS), a nuclear export signal(NES) and an activator motif (AHA). The AHA motif located at the C-terminus in class A Hsfs conferstranscriptional activation. Moreover, a repressor domain (RD) that contains the tetrapeptide LFGVoccurs at the C-terminal of class B Hsfs.
Recent studies have revealed that plant Hsfs plays important roles in generating responses toheat and other stimuli, as well as in organ development [16]. Class A HsfA1a is regarded as a masterregulator and has a unique role in eliciting heat stress responses in tomato (Solanum lycopersicum L.) [17].HsfA2 is functionally similar to HsfA1 in regulating thermotolerance, as well as serving as a keyregulator in osmotic and oxidative stress responses [18–20]. The expression of HsfA3 is induced inArabidopsis by heat and drought stress, indicating that HsfA3 might play a role in drought and heatstress signaling [21,22]. The thermotolerance of Arabidopsis with hsfA3 T-DNA insertion mutants wasdecreased [23]. Moreover, the ectopic overexpression of SIHsfA3 increases thermotolerance and salthypersensitivity in germination in transgenic Arabidopsis [24]. The Arabidopsis mutant athsfa4a wasmore sensitive to dehydration. Furthermore, desiccation tolerance was rescued in athsfa4a/BnHSFA4aseeds to similar levels compared with those of Col-0 [25]. Transgenic chrysanthemum overexpressingCmHSFA4 displayed enhanced salinity tolerance partly due to enhanced Na+/K+ ion and ROShomeostasis [26]. Interestingly, in rice, wheat and Sedum Alfredii, HsfA4a possibly confers cadmiumtolerance [27,28]. In addition, AtHsfA9 plays a role in embryonic development and seed maturation inArabidopsis [29]. In group B, the majority of HsfBs act as repressors due to the RD region [15]. However,AtHsfB1 act as repressors of the heat shock response under non-heat-stress conditions, but act aspositive regulators of heat shock proteins under heat-stress conditions [30]. In group C, FaHsfC1b fromFestuca arundinacea confers heat tolerance in Arabidopsis [31].
Although several Hsf family genes in Arabidopsis and other plant species have been characterized,functional analysis of those in moso bamboo has been limited. The completion of the draft genomesequence of moso bamboo has greatly facilitated the identification of Hsf family at the whole-genomelevel [32].
In this study, we describe the genome-wide identification and analysis of the PheHsf family ofmoso bamboo for the first time. In addition, expression patterns of PheHsf genes during development,as well as in response to various abiotic stresses, were also investigated. Our results will provide afoundation and valuable information for future functional analysis of PheHsfs.
112

Forests 2019, 10, 100
2. Materials and Methods
2.1. Database Searches for Hsf Genes in Moso Bamboo and Analyses of Physicochemical Characteristics
For more accurate identification of Hsf genes in Moso bamboo, multiple database searches wereperformed according Hou et al. [33]. First, Hsf mRNA sequences of Oryza sativa and Brachypodium distachyon,obtained from NCBI Nucleotide database (https://www.ncbi.nlm.nih.gov/) as query sequences toblast against the moso bamboo genome database. For the filtration step of the blast process, the Hsfgenes were obtained by blast bamboo transcriptome using Hsf mRNA from some other speciesidentified as query with loose e-value of <0.00001. Next, the protein sequences of putative genesobtained from the first step were blast against the NCBI non-redundant protein database with e-valueof <0.0000000001 by Blast2GO to confirm the identification. The putative genes described as Hsfproteins or proteins belonging to Hsf family were kept, and genes described as other family proteinswere abandoned. Then the HSF domain (PF00447) of the HSF family were researched in theseputative Hsf proteins to reconfirm our data using the Pfam database (http://pfam.sanger.ac.uk/)and Conserved Domains Database (http://www.ncbi.nlm.nih.gov/Structure/cdd/cdd.shtml) withe-values <0.001. Only the gene models containing HSF domain were considered to belong to the Hsffamily. Finally, the selected Hsfs were further screened using the full-length non-chimeric (FLNC)reads (http://www.forestrylab.org/db/PhePacBio/) [34]. The moso bamboo Hsf genome sequences,coding sequences, protein sequences, and putative novel or mis-annotated Hsf genes were obtainedfrom moso bamboo genome database. The amino acid sequences of Arabidopsis, rice (Oryza sativa), andB. distachyon Hsf proteins were downloaded from Plant Transcription Factor Database v4.0 (PlantTFDB4.0, http://planttfdb.cbi.pku.edu.cn/) and Heatster (http://www.cibiv.at/services/Hsf/) [35,36].Molecular weights and theoretical isoelectric point (pI) were determined using ExPASY (http://web.expasy.org/compute_pi/). CELLO v2.5 Server (http://cello.life.nctu.edu.tw/) was used to predict theprotein subcellular locations for candidate PheHsfs [37]
2.2. Phylogenetic Analysis
Arabidopsis and rice Hsf gene datasets [38] were used to classify the moso bamboo Hsf genesand predict their functional roles. Multiple sequence alignments of full-length Hsf proteins fromArabidopsis, rice, B. distachyon, and moso bamboo were performed using ClustalX 1.83 (http://www.clustal.org/) and two online programs (Clustal Omega and MUSCLE) [27,39–41]. An unrootedneighbor-joining (NJ) phylogenetic tree was constructed using MEGA7.0 with 1000 bootstrap replicates.Another phylogenetic tree with only the Moso bamboo Hsfs was also constructed using the aminoacid sequences according to the same method.
2.3. Structural and Motif Analyses of PheHsf Genes
To confirm subgroup designation through phylogenetic analysis, the Gene Structure DisplayServer (http://gsds.cbi.pku.edu.cn/) was used to illustrate exon-intron organization by aligningevery cDNA sequence and its corresponding genomic DNA sequence [42]. The conserved motifsin the candidate PheHsf sequence were defined by MEME version 4.12.0 (http://meme-suite.org/tools/meme) [43] using the following parameters: number of repetitions = any, maximum number ofmotifs = 30, minimum width ≥4, maximum width ≤200, and only motifs with an e-value <0.01 wereretained for further analysis. The DBD (DNA Binding domain) and HR-A/B domains were identifiedusing Heatster (http://www.cibiv.at/services/Hsf/). NES domains in the PheHsfs were predictedwith the NetNES 1.1 server software (http://www.cbs.dtu.dk/services/NetNES/). NLS domains werepredicted using cNLS Mapper software (http://nls-mapper.iab.keio.ac.jp/cgi-bin/NLS_Mapper_form.cgi). AHA domains were predicted according to the conserved motif sequence FWxxF/L, F/I/L [16].
113

Forests 2019, 10, 100
2.4. Cis-Regulatory Element Analysis of PheHsf Genes
The 1500-bp sequence upstream from the initiation codon of each PheHsf gene was obtained fromthe moso bamboo genome database. These sequences were used to identify cis-acting regulatoryelements with the online program Plant CARE (http://bioinformatics.psb.ugent.be/webtools/plantcare/html/).
2.5. Plant Material
After the surface was sterilized with 1% formaldehyde, the moso bamboo seeds were germinatedin Petri dishes (12-cm diameter) lined with filter paper and containing 10 mL of sterile water.After 4 days, the germinated seedlings were planted in vermiculite and watered with 1/2 Hoagland’snutrient medium weekly (all plants were grown in 16 h day/8 h night at 22 ◦C). Two-month-oldseedlings were used for abiotic stress treatments. According to Cheng et al. [44], drought and stresswas conducted by incubated seedlings with 20% (m/v) PEG6000 and 200 mM NaCl, respectively.Heat stress and low temperature treatments were respectively created by placing seedlings in a 42 ◦Cand 4 ◦C lighted growth chamber according to Liu et al. [45]. The control seedlings were grownwithout any stress treatment. The second or third mature leaves were collected at 0 h, 15 min, 30 min,1 h, 3 h, 6 h, 12 h, and 24 h after abiotic stress treatments. These materials were immediately frozenand stored in liquid nitrogen until total RNA extraction and real-time quantitative polymerase chainreaction (qRT-PCR).
2.6. RNA Isolation and Relative Expression Level Analysis of PheHsfs
For the tissue-specific expression analysis, the RPKM (the reads per kilobase of exon model permillion mapped reads) values of PheHsfs were retrieved from transcriptome sequencing of developingflowers (four stages of flowering and leaves) and shoots of moso bamboo (winter shoots, six shootheights, and culms) [1,46]. RPKM values were used to analyze the relative expression levels of thePheHsf genes. For the flower development samples, four developmental stages (F1: the floral budsbegun to form; F2: the floral organs gradually matured; F3: the flowers were in full blossom; andF4: the embryo formation stage) were defined based on the anatomical structure of floral organs byGao et al. [46]. For F1 and F2, the buds were collected, respectively. For F3 and F4, spikelets werecollected, respectively. Leaves collected from non-flowering moso bamboo were defined as CK1.For the shoot development stage sample, four development stages of shoots were defined based onthe continuing measurement of bamboo shoot height and anatomical changes by Li et al. [1]. The eightsamples according to the four developmental stages of moso bamboo shoots were as follows: S1(winter shoots), S2–S5 (0.5 m, 1 m, 3 m, and 6 m, early growth period), S6–S7 (9 m and 12 m, lategrowth), and CK (clum after leaf expansion, mature period). For S1–S7, the shoot tips of differentheights were collected, respectively. For CK2, each top internode was cut from the top to 1/2, theneach top internode was divided into basal, middle and top. After that, the samples were cut from thetissue located in the top part of the three internodes above and then mixed.
For qRT-PCR, PheHsfs primers were designed using Primer 3.0 (http://primer3.ut.ee/). Primersequences, amplicon Length, amplification efficiency, and correlation coefficients are listed in TableS1, and their specificity was verified using the online tool Primer-BLAST (https://www.ncbi.nlm.nih.gov/tools/primer-blast/index.cgi) and the melting curves of PCR products. For every primerpair, a standard curve was constructed to calculate the gene-specific PCR efficiency from the 10-foldseries dilution of the mix cDNA template. The R2 (correlation coefficients) and slope values can beobtained from the standard curve. The following formula was used to calculate the correspondingPCR amplification efficiencies (E): E = (10−1/slope − 1) × 100 [47]. Tonoplast intrinsic protein 41 gene(TIP41) was used as an internal control [48]. The qRT-PCR reactions were conducted using a SYBRGreen I master mix (Roche, Mannheim, Germany). The qRT-PCR conditions were as follows: 45 cycles
114

Forests 2019, 10, 100
of 95 ◦C for 10 s, 60 ◦C for 10 s, and 72 ◦C for 20 s. Three replicates were performed for each gene.Gene expression was evaluated using the 2−ΔΔ Ct method [49].
2.7. Co-Expression Network and Protein Interactions of PheHsfs
The expression correlation of the PheHsfs was calculated by Pearson correlation coefficient (PCC;R-value) using gene expression RPKM values from the high-throughput transcriptome data in R.Expression correlation data were used for the correlation network, and co-expressed gene pairs werefiltered with a PCC cut-off of 0.85 as previously described [50]. Cytoscape version 3.4.0 were used toanalyze and visualize the network [51].
For the protein interaction networks, the homolog Hsf proteins in rice were constructed bySTRING (http://stringdb.org/) using an option value >0.7. The homolog proteins of the determinedinteractive rice proteins were identified in moso bamboo by BLASTP analysis.
3. Results
3.1. The Hsf Family Genes in Moso Bamboo
To identify Hsf genes in moso bamboo, a total of 41 candidate PheHsf genes were retrievedfrom the annotation in the Bamboo Genome Database. From these, 19 candidate PheHsf geneswith incomplete HSF domains were considered as PheHsf-like genes, which were not selected forsubsequent analysis in this study. Twenty-two putative moso bamboo PheHsf genes containing fullHSF domains (PF00447) were confirmed by searching the Pfam and the Conserved Domain Databases.However, the CDS sequence for PheHsfA5, PheHsfB4a-1 and PheHsfB4c-1 contained 42 bases (from268 to 309 base), 102 bases (233 to 336) and 123 base (256 to 377) inserts, respectively, when comparedto the cloned cDNA sequence (Fasta S3). For this analysis, the CDS and amino acid sequences ofthese three genes are based on the cDNA sequences. The CDS and amino acid sequences are listedin supplementary files (Fasta S1 and S2). The identified 22 PheHsf genes were distributed among22 scaffolds (Table 1). The sequences of 22 PheHsf genes were named according to the correspondingrelationship among in rice, B. distachyon and moso bamboo. The number of amino acid (aa) sequencesof PheHsf proteins ranged from 247 (PheHsfC1b-1) to 679 (PheHsfA1a), the predicted isoelectric points(pI) varied between 4.70 (PheHsfA6a) and 9.81 (PheHsfB4c-1), and the molecular weight (MW) rangedfrom 26.77 kDa (PheHsfC1b-1) to 75.05 kDa (PheHsfA1a) (Table 1).
3.2. Phylogenetic Relationships and Multiple Sequence Alignment of PheHsf Genes
To predict the potential function, an unrooted phylogenetic tree was constructed from analignment of 94 full length Hsf protein sequences from different species (23 AtHsf, 25 OsHsf, 24 BdHsf,and 22 PheHsf) (Figure 1). Because the alignment results of Hsf proteins in moso bamboo usingClustalX 1.83, MUSCLE, and Clustal Omega were similar, we employed the results of ClustalX 1.83and MEGA7.0 to illustrate the phylogenetic relationships of the PheHsf family. The PheHsf geneswere also grouped into three subgroups, including class A (PheHsfA1a, PheHsfA2a-1, PheHsfA2a-2,PheHsfA4a-1, PheHsfA4a-2, PheHsfA4d-1, PheHsfA4d-2, PheHsfA6b-2, PheHsfA6b-1, PheHsfA6a,PheHsfA5, and PheHsfA7a), class B (PheHsfB1, PheHsfB2a, PheHsfB2c, PheHsfB4c-1, PheHsfB4c-2,PheHsfB4a-2, and PheHsfB4a-1), and class C (PheHsfC1b-1, PheHsfC1b-2, and PheHsfC2b), which issimilar to that described in Arabidopsis [52], rice [38], and B. distachyon [53]. In moso bamboo, class Awas the largest and consisted of 12 members from six subclasses, however, three subclasses (A3, A8,and A9) in this class were not detected. There were seven members in class B from subclasses B1, B2,and B4, but no members in subclass B3. Class C was the smallest, with only three members.
115

Forests 2019, 10, 100
Table 1. Overview of PheHsf genes in moso bamboo.
Name Gene ID ScaffoldsNumber
(aa)MW
(kDa)PI
CELLO Localization(Reliability)
PheHsfA4a-1 PH01000018G0140 PH01000018 443 49.07 5.22 Nuclear (3.717)PheHsfB2c PH01000314G0470 PH01000314 382 40.12 4.86 Nuclear (2.907)
PheHsfC1b-1 PH01000333G0160 PH01000333 247 26.77 8.71Cytoplasmic (1.219)
Mitochondrial (1.205)Chloroplast (1.221)
PheHsfA1a PH01000371G0730 PH01000371 679 75.05 6.06 Nuclear (2.682)
PheHsfB4a-1 PH01000700G0690 PH01000700 385 41.99 8.87Cytoplasmic (1.061)
Nuclear (1.481)PheHsfC1b-2 PH01000701G0030 PH01000701 296 32.24 8.84 Cytoplasmic (1.557)PheHsfA4a-2 PH01000746G0370 PH01000746 444 49.50 5.36 Nuclear (3.999)PheHsfA4d-1 PH01000814G0580 PH01000814 554 61.26 4.95 Nuclear (2.593)PheHsfC2b PH01000849G0330 PH01000849 276 29.22 7.46 Extracellular (1.087)PheHsfA5 PH01001018G0530 PH01001018 499 55.33 5.21 Nuclear (3.607)PheHsfA7a PH01001028G0180 PH01001028 381 42.51 5.94 Cytoplasmic (1.751)
PheHsfB4c-2 PH01001228G0360 PH01001228 276 29.72 8.34 Nuclear (3.293)PheHsfB4c-1 PH01001554G0080 PH01001554 420 45.70 9.81 Nuclear (1.699)PheHsfA4d-2 PH01002437G0340 PH01002437 453 51.34 5.18 Nuclear (4.154)
PheHsfB4a-2 PH01004959G0060 PH01004959 275 30.24 8.37Chloroplast (1.119)
Nuclear (1.604)PheHsfB2a PH01000000G3800 PH01000000 292 31.22 4.98 Nuclear (3.984)
PheHsfA6b-2 PH01000081G0140 PH01000081 362 41.44 4.97 Nuclear (3.466)PheHsfA2a-2 PH01000174G0590 PH01000174 342 38.47 5.32 Nuclear (4.565)PheHsfA6a PH01000194G0800 PH01000194 378 42.59 4.70 Nuclear (1.785)
PheHsfA6b-1 PH01000208G0690 PH01000208 348 40.04 4.89Cytoplasmic (2.207)
Nuclear (2.182)PheHsfA2a-1 PH01003916G0010 PH01003916 358 40.31 5.49 Nuclear (3.869)
PheHsfB1 PH01000149G1320 PH01000149 297 32.42 8.55 Nuclear (3.609)
Gene ID: refer to Bamboo Genome Datebase (http://202.127.18.221/bamboo/index.php); MW: molecular weightrepresents the predicted weights of PheHsf proteins; PI: represents the predicted isoelectric point of PheHsf proteins.
3.3. Structure and Motif Analyses of PheHsf Genes
To better understand the gene structure diversity of PheHsfs, we compared the intron-exonarrangements and the conserved motifs (Figure S1). The number of introns in the Hsf genes ofmoso bamboo ranged from zero to three. Most of the PheHsfs (19/22) contained one to two introns(Figure S1b). Three introns were found in PheHsf4, whereas none were detected in PheHsfB4a-1and PheHsfB4c-1.
Based on the known information on functional domains of Hsfs in some model plants [15,54],the sequence and positions of similar domains were identified in the PheHsfs by sequence alignment.As shown in Table 2, five conserved domains (DBD, HR-A/B, NLS, NES, and AHA) were identified.The DBD domain comprised of three α-helices (α1–3) and four β-sheets (β1–4) were found in allPheHsfs (Figure S2a). HR-A/B domain is critical for one Hsf interacting with other Hsfs to formtrimer [15]. All class A PheHsfs have a 21 amino-acid (aa) insertion between HR-A and HR-B regions;class C PheHsfs have seven aa insertions; all class B PheHsfs have no insertion (Figure S2b). NLS andNES domain function in the assembly of a nuclear import complex and the receptor-mediated exportin complex with the NES receptor [15]. The majority of the PheHsfs showed the presence of a NESand/or NLS domain. In addition, the activation domain AHA was found in all class A members butnot in classes B and C (Table 2).
116

Forests 2019, 10, 100
Figure 1. Phylogenetic relationship of PheHsf, AtHsf and OsHsf proteins. Neighbor-joining methodand MEGA 7.0 software were used for phylogenetic analysis of Hsf proteins from Phyllostachys edulis(22 PheHsfs), Arabidopsis thaliana (23 AtHsfs), Oryza sativa (25 OsHsfs), and Brachypodium distachyon(24 BdHsfs). The names of subclass are shown outside of the circle. Branch lines of subclass are colored,indicating different Hsf subclasses.
A MEME motif search revealed a total of 19 motifs in the PheHsfs (Figure S1c). Three motifs (1, 2,and 4) constituting the DBD domain were identified. Motif 3 and 5 for the OD domain were detectedin class A and C, and motif 6 for the OD domain was observed in class B. Motif 6 and motif 11, motif 8,and motif 17 (NSL) were observed in class A, class B and C, respectively. In general, the structure ofthe PheHsf proteins is conserved in moso bamboo. Furthermore, motif 7 represented the AHA domainclose to the PheHsfA C-terminus (Figure S1c and Table 2).
117

Forests 2019, 10, 100
Table 2. Functional domains of PheHsfs.
Gene DBD HR-A/B NLS AHA RD NES
PheHsfA1a 1–84 121–171 (201) ANKKRRLPKQ (410) SFWEQFLVA nd ndPheHsfA2a-1 39–128 151–202 (237) ISKKRRRRID (314) DDFWEDLLHE nd ndPheHsfA2a-2 40–129 156–197 (238) ISKKRRRRID (315) DDFWEDLLHE nd (165) LLMPheHsfA4a-1 14–103 124–165 (204) DHHRKKRRLPKPISF (379) GFWQQFLTE nd ndPheHsfA4a-2 14–103 124–172 (204) DHHRKKRRLPKPISF (380) GFWQQFLTE nd ndPheHsfA4d-1 13–96 112–140 (199) FSKKRRAPKI (363) LFWERFLTE nd ndPheHsfA4d-2 16–105 120–149 (208) FSKKRRVPKI (382) LFWERFLTE nd (252) MELAL
PheHsfA5 30–134 152–179 (241) FQKKRRLTGL (446) KFWEQFLTE nd ndPheHsfA6a 46–135 165–206 (247) ISKKRRRPID (319) DDFWAELLVE nd (288) LENLAL
PheHsfA6b-1 45–134 163–204 (133) LLKMIKRRRLLYY (318) DDFWEELLNE nd ndPheHsfA6b-2 45–134 163–204 (135) KMIKRRRPLS (318) EDFWEELLNE nd ndPheHsfA7a 74–165 193–227 (166) KNIKRRRASK (329) DDVWEELDAI nd ndPheHsfB1 30–117 176–205 (253) EDATRKRKRCEEAAARERPFKMIRI nd (246) KLFGVLL ndPheHsfB2a 7–100 160–183 nd nd (203) TLFGVTI (264) LDVLALSLPheHsfB2c 29–118 199–232 nd nd (304) RLFGVSI nd
PheHsfB4a-1 19–112 110–139 (237) RKRLLQEQPPTSPEWKRSMV nd (215) KLFGVNL ndPheHsfB4a-2 19–103 201–230 (347) RKRSLQEQPPTSPDWKRSMV nd (325) KLFGVDL ndPheHsfB4c-1 26–116 256–285 nd nd (323) KLFGVHI ndPheHsfB4c-2 26–116 124–143 nd nd (213) KLFGVHL (251) LESDDLSLPheHsfC1b-1 25–114 136–165 (209) PGKKRRIGAE nd nd ndPheHsfC1b-2 72–161 186–213 (257) TPGKRRRIG nd nd ndPheHsfC2b 12–105 140–176 nd nd nd (173) LKV
DBD: DNA-binding domain; HR–A/B: OD (oligomerisation domain); NLS: Nuclear localization signal; AHA:Activator motifs; RD: Tetrapeptid motif LFGV as core of repressor domain; NES: Nuclear export signal; nd, nomotifs detectable by sequence similarity search.
3.4. Cis-Regulatory Element Analysis in Promoters of PheHsfs
To predict the biological function of PheHsfs, the 1500 bp upstream sequence from the translation startsites of PheHsf genes were analyzed using the PlantCARE database. The results show that the promoterof each PheHsf has several cis-regulatory elements such as phytohormone- (abscisic acid, jasmonic acidand gibberellic acid), abiotic stress- (low temperature, heat stress, drought, and fungal elicitor), anddevelopmental process-related elements. Figure S3 shows that the ABA-responsive element (ABRE),the MeJA-responsive element (CGTCA-motif), and SA-responsive element (TCA-element) were foundin the promoters of 17, 16, and 11 PheHsf genes, respectively. The promoters of 12 and 10 PheHsf genescontained the HSE and LTR, respectively. MYB-binding sites involved in drought inducibility (MBS),fungal elicitor-responsive elements (Box-W1) and defense- and stress-responsive elements (TC-rich)were found in 17, 15 and 8 PheHsf genes, respectively. Additionally, meristem expression (CAT-box),meristem-specific activation (CCGTCC-box), and endosperm expression (Skn-1_motif) motifs werefound in the 13, 10 and 18 PheHsf genes, respectively. These findings indicate that PheHsfs mightbe associated with different transcriptional regulatory mechanisms for developmental, hormone andstress processes.
3.5. Expression Pattern of the PheHsf Genes in Shoot and Flower Development
Based on the RNA-Seq data of different flowering developmental stages [43] and the internodesof shoots at different heights [1], a heat map was constructed according to the RPKM of 22 PheHsfs(Figure 2). During four flowering developmental stages of moso bamboo, PheHsf genes could beclassified into four groups (A, B, C, and D) according to their relative expression levels (Figure 2a).Most of the PheHsfs were highly expressed (RPKM > 10) in at least one stage, and only four PheHsfgenes were expressed at low levels (RPKM < 2) in at least two stages during floral development(Table S2). Four members (PheHsfB4a-1, PheHsf15, PheHsf12, and PheHsfB4c-1) of group C had highertranscript accumulation during two earlier stages (F1 and F2) and were downregulated at two laterstages (F3 and F4 stage). Group D consisted of 10 PheHsf genes (PheHsfA4a-1, PheHsfB2c, PheHsfA1a,PheHsfA4a-2, PheHsfC2b, PheHsfA7a, PheHsfB2a, PheHsfA2a-2, PheHsfA6b-1, and PheHsfB1), and theirexpression levels steadily increased at the F3 and F4 stages. Group B comprised of six PheHsfs(PheHsfA4d-1, PheHsfA4d-2, PheHsfA5, PheHsfA6b-2, PheHsfA6a, and PheHsfA2a-1), showing highertranscript accumulation at two later stages (F3 and F4) and in the leaves. Group A only had twogenes, PheHsfC1b-1 and PheHsfC1b-2, with expression levels six times and three times higher in leavesthan the four stages of floral development, respectively. During shoot growth, Most PheHsfs (19/22)
118

Forests 2019, 10, 100
showed very low expression levels (RPKM < 8) at all seven stages, and only two genes (PheHsfA1aand PheHsfA6b-2) had higher expression levels (RPKM > 20) in at least one stage of bamboo shootgrowth (Table S3). Based on the expression profiles, the PheHsfs were classified into four groups(Figure 2b). Among these, PheHsfA1a and PheHsfA2a-2 were clustered into the same group withcontinuous down-regulated expression from the S1 to S7 stage. However, PheHsfA6b-2 and PheHsfB2cwere clustered in the same group, which showed twin peaks during the S2 and S5 stage, respectively.
Figure 2. Expression pattern of PheHsfs in developmental flowers and shoots of moso bamboo.(a) The expression profile of PheHsfs in different stages of flowering. F1–F4: The four stages ofdevelopmental flowers (the floral buds begun to form, the floral organs gradually matured but did notundergo flowering, the flowers were in full blossom, and the embryo formation stage); CK1: leaves.(b) The expression profile of PheHsfs in different stages of shoots. S1: winter shoot; S2–S7: differentheights of shoots (0.5 m, 1 m, 3 m, 6 m, 9 m and 12 m), and CK2 (culms after leaf expansion). All thesamples had one repeat. The heatmap was pictured using R based on the RPKM of Phehsfs in eachsample. Details of the RPKM are shown in Tables S2 and S3.
For different periods of flower and shoot development in moso bamboo, the PheHsfA1aand PheHsfA6b-2 genes showed high transcript accumulation in all 11 stages, whereas fourgenes (PheHsfB4a-1, PheHsfA4d-1, PheHsfA7a, and PheHsfB4a-2) exhibited extremely low transcriptaccumulation at all stages. Moreover, the other 15 PheHsfs depicted significantly higher transcriptlevels during flower development than during shoot growth. These findings indicate that these geneshave different regulatory roles in moso bamboo flower development and shoot growth.
3.6. PheHsfAs Expression in Moso Bamboo in Response to Various Stresses
The expression of 12 PheHsfAs were analyzed by qRT-PCR under four abiotic stresses: hightemperature, cold, drought and salt (Figure 3). The expression levels of all members of subclass A wereupregulated (>2 folds) after at least one treatment (Table S4, Figure 3b). For heat stress, eight PheHsfAswere upregulated (>2 folds). PheHsfA4d-1, PheHsfA2a-2, and PheHsfA6b-1 rapidly responded tohigh temperatures, showing upregulation up to ~nine-fold within 0–1 h of 42 ◦C (Table S4) treatment.Among these, PheHsfA2a-2 (~22-fold higher than the control) was the most strongly induced gene.For cold stress, the expression levels of seven PheHsfAs (PheHsfA4a-1, PheHsfA1a, PheHsfA4a-2,PheHsfA4d-2, PheHsfA4d-2, PheHsfA5 and PheHsfA2a-2) were at least two-fold greater than thecontrol for at least one of the time points. For drought and salt stress, eight PheHsfAs (PheHsfA4a-1,PheHsfA4a-2, PheHsfA4d-1, PheHsfA4d-2, PheHsfA5, PheHsfA7a, and PheHsfA6a) were upregulated.The expression level of PheHsfA4d-2 was ~20-fold higher than control after 3 h of 20% PEG treatment.The expression level of PheHsfA4d-1 was ~70-fold higher than the control after 3 h of 200 mM NaCltreatment (Table S4). Among the PheHsfA genes, five genes (PheHsfA4a-1, PheHsfA4a-2, PheHsfA4d-1,PheHsfA4d-2, and PheHsfA2a-2) were upregulated relative to the control treatment. (Figure 3b).These findings indicate that these genes might play vital roles in different stress response pathways.
119

Forests 2019, 10, 100
Figure 3. Expression analysis of PheHsfAs under different abiotic stress treatments in moso bamboo.(a) Heat map representation for the expression patterns of PheHsfAs after 15 min, 30 min, 1 h, 3 h,6 h, 12 h, and 24 h of heat, cold, drought, and salt stresses: expression levels under stress vs. control;the expression results were obtained by qRT-PCR. The different colors correspond to log2 transformedvalue. (b) Venn diagram showing the number of overlapping PheHsfAs that are up-regulated >two-fold under abiotic stress: heat, cold, salt, and drought. Details of the expression data are shown inTable S4.
3.7. Expression Correlation and Interaction Networks
To further investigate the PheHsf proteins and how they interact with each other, a co-expressionnetwork was constructed using expression values of PheHsf genes during shoot and flowerdevelopment. The connecting gene with PCC magnitude >0.85 was recognized as strongly co-expressedgenes [36]. The result showed that 18 PheHsf genes and 38 correlations in a co-expression networkwith PPC >0.85 cutoffs were obtained (Figure 4a). Genes with stronger correlation might play roles asinteracting partners in similar biological pathways. Based on the results, PheHsfA4a-1 and PheHsfA4a-2were recognized as hub genes as nodes with 10 and 9 connectivity in the whole network, respectively,which had more connectivity than other PheHsf genes. Both PheHsfA4a-1 and PheHsfA4a-2 had anup-regulated expression in response to different stress treatments (heat stress, cold, drought and salt).These results indicated that the two PheHsfA4s with a greater role in shoot and flower developmentalso had an important role in stress responses.
To identify the two PheHsfA4a-associated proteins and protein complexes, prediction networkswere built with STRING (http://www.string-db.org/) based on the interaction network of riceorthologous genes (Figure 4b). Because the rice orthologous gene of both PheHsfA4a-1 and PheHsfA4a-2were OsHsfA4a, the identified moso bamboo proteins predicted to participate in the interaction networkwith PheHsfA4a-1 and PheHsfA4a-2 were the same. They interacted directly with 10 identified proteins,including five HSP70 proteins, one HSP90 protein, and four MAPK proteins. Because PheHsfA2a-2(~22-fold higher than the control), PheHsfA4d-2 (~20-fold higher than the control) and PheHsfA4d-1(~79-fold higher than the control) were strongly induced by heat, drought and NaCl stress, respectively.We also identified the two PheHsfA4d- and PheHsfA2a-2- associated proteins and protein complexes,and PheHsfA4ds and PheHsfA2a-2 were also predicted to interact with HSP70 proteins, HSP90 protein,and MAPK proteins (Figure 4c,d).
120

Forests 2019, 10, 100
c
Figure 4. Co-expression network and interaction network of selected PheHsf genes in moso bamboo.(a) The model was built based on RPKM of RNA-seq of shoot and flower development. (b–d) Interactionnetwork of PheHsfA4as, PheHsfA4ds and PheHsfA2a-2 in moso bamboo, respectively. Colored balls(protein nodes) in the network were used as a visual aid to indicate different input proteins andpredicted interactors. Protein nodes which are enlarged indicate the availability of 3D protein structureinformation. Gray lines connect proteins which are associated by recurring textmining evidence.Line thickness indicates the strength of data support.
4. Discussion
4.1. Characterization of the Moso Bamboo Hsf Genes Family
Hsf genes play essential roles in plant development and in responding to various stressconditions [55,56]. To explore the functions of PheHsf s in moso bamboo for the first time, the presentstudy identified a total of 22 PheHsf genes according to the moso bamboo genome database and FLNCreads database [32,34,57].
We found that the moso bamboo has a similar number of Hsf s as rice, B. distachyon, maize,and A. thaliana (22–25). This partially accounts for the support of Hsf conservation during evolution.Phylogenetic analysis of Hsfs in moso bamboo, O. sativa, B. distachyon, and A. thaliana indicated thatPheHsfs have a higher degree of sequence similarity with OsHsfs and BdHsfs than AtHsfs, whichcoincides with the evolutionary relationships among the four species. All three Hsf classes (A, B, andC) were identified in the three monocots and one dicot, implying that the Hsf genes originated prior tothe divergence of monocots and dicots.
121

Forests 2019, 10, 100
In the investigation of conserved Hsf domains and intron-exon structures, all 22 of the PheHsfscontain the necessary (DBD and OD) and/or specific protein domains (NLS, NES, and AHA).The hydrophobic core of DBD domain ensures precise positioning and highly selective interaction withheat stress promoter elements [15]. The OD of plant Hsfs confers distinct patterns of specificity forhetero oligomerization [15]. These AHA motifs, which are located in the C-terminal, are characterizedby aromatic (W, F, Y), large hydrophobic (L, I, V) and acidic (E, D) amino acid residues [15].Those domains might be essential for functional conservation [56]. Twenty of twenty-two PheHsf geneshave one intron in their DBD domain (Figure S1), which is an evolutionarily conserved intron [13].However, no intron was identified in PheHsfB4a-1 and PheHsfB4c-1 of subclass B4, which is differentfrom subclass B4 of rice and B. distachyon [53].
4.2. Cis-Regulatory Element Analysis in the Promoters of PheHsfs
Previous studies have illustrated the key roles of Hsf s in developmental processes and stresstolerance through their regulation of target genes [58]. The number and form of cis-elements in thepromoter region might play an essential function in the regulation of gene expression in relation tometabolic pathways [59]. The in silico survey of putative cis-elements using PlantCARE showed that 12 ofthe 22 PheHsfs promoters contained HSEs. This implies that PheHsfs might regulate themselves [55].Additionally, the promoter region of PheHsfA1a contained more types of development-relatedcis-elements (Figure S3), which coincides with its constitutive expression during shoot and flowerdevelopment in moso bamboo (Figure 2).
4.3. PheHsfAs Involvement in Development Processes
The 22 PheHsfs exhibited diverse expression patterns during shoot and flower developmentof moso bamboo under normal conditions. PheHsfA1a was upregulated during shoot and flowerdevelopment and was constitutively expressed in different tissues (Figure 2). These findings aresimilar to that in Arabidopsis [60] and Salix suchowensis [61]. Under normal conditions, class A1Hsfs of Arabidopsis are involved in housekeeping processes, and SsuHsf-A1a of Salix suchowensis areconstitutively expressed in different tissues [60,61]. In rice, nearly all classA members showed highexpression levels in all tissues [45,62]. In this study, nearly all the PheHsfAs (except PheHsfA7a)were found to show high transcription levels in the leaves, culms, and the four stages of flowerdevelopment, similar to that in rice. Only two members of PheHsfAs (PheHsfA1a and PheHsfA6b-2)have high transcription levels in the seven stages of shoot development. This indicated that thefunction of PheHsfAs is conserved and/or specific in regulating flower development and shoot growthin moso bamboo.
4.4. PheHsfAs are Involved in Stress Responses
Under heat or other stress conditions, plant Hsfs regulate the transcription of target genes (Hspsand other stress-inducible genes) to enhance stress resistance. Recent genome-wide expression profileanalyses showed that most of the Hsf genes are upregulated after heat, cold, drought, and saltstress [56,58,60]. An increase in the number of Hsf genes has been shown to improve plant stresstolerance [54,63]. In moso bamboo, Zhao et al. identified seven and two PheHsfs that were upregulatedafter 0.5 h and 8 h of high light stress (1200 μmol · m−2 · s−1), suggesting that these play vital rolesboth in response to short-term (0.5 h) and mid-term (8 h) high light [64]. However, the regulatory rolesof Hsfs in response to other abiotic stresses are unclear. Classes B and C do not harbor AHA motifs,which are essential for the activity of class A Hsfs [16]. Therefore, class A PheHsf genes were selectedto further study their response patterns under stress and hormone treatments.
Under heat treatment, 9 of 12 OsHsfAs and 9 of 13 BdHsfAs were upregulated in rice andB. distachyon, respectively [59,62]. In our study, 8 of 12 PheHsfAs were found to be induced byhigh temperature. Of these, PheHsfA4d-1, PheHsfA2a-2 and PheHsfA6b responded more quicklyto heat stress than others. PheHsfA2a-2 showed stronger induced under-heat stress conditions,
122

Forests 2019, 10, 100
which is similar to that of its homologous genes in rice, Arabidopsis, and B. distachyon [18,45,53].These findings suggest that PheHsfA2a-2 plays an important role in response to heat stress of mosobamboo. However, PheHsfA2a-1, which is the most similar to PheHsfA2a-2 and also belongs to A2a-typePheHsfs, was slightly upregulated 1 h after heat stress application. PheHsfA4d-2, which is the mostsimilar to PheHsfA4d-1, was less upregulated by heat and salt stress compared to PheHsfA4d-1, butshowed higher relative expression levels than PheHsfA4d-1 with cold and drought stresses.
HsfA4a of wheat (Triticum aestivum) and rice conferred cadmium tolerance in yeast and plants,but other Hsfs with similar structure (OsHsfA4d, AtHsfA4a, and AtHsfA4c) did not [27]. HsfA4aof Arabidopsis and chrysanthemum (chrysanthemum cultivar ‘Jinba’) confers salt and oxidativestress [26,65]. In this study, PheHsfA4a-1, PheHsfA4a-2, PheHsfA4d-1 and PheHsfA4d-2 were upregulatedin response to these four abiotic stress (heat, cold, drought and salt). These findings indicate that thethree PheHsfA4s could act as potential “nodes” for connecting the above four abiotic stresses.
4.5. Expression Correlation and Interaction Networks
In addition, the expression values of PheHsf genes in shoot and flower developmental stages wereused to identify potential underlying co-expression networks using Cytoscape. Based on their degreeof connectivity, the hub genes PheHsfA4a-1 and PheHsfA4a-2 were identified to play a regulatory roleand correlated with other PheHsfs in the complex feedback network. According to the prediction of fivePheHsf proteins (four PheHsfA4s and one PheHsfA2a-2) interaction networks, the interactive proteinsmight include MAPKs and heat shock proteins. MPK5 protein in rice acts as a positive regulatorof drought, salt and cold tolerance; is involved in disease resistance and abiotic stress tolerancesignaling pathways; and also negatively modulates pathogenesis-related (PR) gene expression andbroad-spectrum disease resistance [66]. The MPK1 protein in rice acts downstream of heterotrimericG protein alpha subunit and small GTPase RAC1 and may regulate the expression of various genesinvolved in biotic and abiotic stress response [67]. Base on the above information and our results, fourPheHsfA4s and one PheHsfA2a-2 may play a very important role in shoot and flower developmentand stress response.
5. Conclusions
In this study, 22 PheHsf genes in moso bamboo were identified for the first time. These genescould be classified into three classes (A, B and C) according to the comparison of the phylogeneticrelationships with O. sativa, B. distachyon and A. thaliana Hsf genes. Expression analyses revealed thattwo hub genes, PheHsfA4a-1 and PheHsfA4a-2, might act as a potential “node” for crosstalk betweendevelopmental processes and abiotic stress responses. Furthermore, PheHsfA2a-2, PheHsfA4d-1 andPheHsfA4d-2 might also act as essential parts in response to stress. These results provide insightsinto the responses of PheHsfAs to abiotic stresses treatments, although their underlying molecularmechanism requires further study.
Supplementary Materials: The following are available online at http://www.mdpi.com/1999-4907/10/2/100/s1,Figure S1: Phylogenetic tree and gene structure of PheHsf genes, Figure S2: Multiple sequence alignment of theDBD domains and OD region of the PheHsf proteins, Figure S3: Various cis-acting elements in PheHsf genespromoter regions, Table S1: Primer sequences used in gene expression with qRT-PCR experiments, Table S2:The relative level of gene expression of PheHsf genes during developmental flowers (F1 to F4) and leaves(CK)(RPKM), Table S3: The relative level of gene expression of PheHsf genes during growing shoots (S1–S7)and clum (CK)(RPKM), Table S4: Expression analysis of PheHsfAs under different abiotic stress in moso bamboo,Fasta S1: PheHsfs and PheHsfs-like CDS sequence, Fasta S2: PheHsfs and PheHsfs-like protein sequence, Fasta S3:The cloned cDNA sequence of PheHsfA5, PheHsfB4a-1 and PheHsfB4c-1.
Author Contributions: X.L. and J.G. designed the experiments; X.L. and J.L. (Juan Li) performed the tissueand organ collection; L.X. and X.L. performed the experiments; Z.C. formal analysis; J.L. (Jun Liu) and S.M.assisted in equipment maintenance and sample collection; L.X. writing—original draft preparation; X.L. and D.H.writing—review and editing; J.G. review and funding acquisition. L.X. and X.L. contributed equally in this workand should be considered first co-authors.
123

Forests 2019, 10, 100
Funding: This project was supported by National Keypoint Research and Invention Program in 13th Five-Year(Grant No. 2018YFD0600100).
Conflicts of Interest: The authors declare that they have no conflict of interest.
References
1. Li, L.; Cheng, Z.; Ma, Y.; Bai, Q.; Li, X.; Cao, Z.; Wu, Z.; Gao, J. The association of hormone signaling genes,transcription, and changes in shoot anatomy during moso bamboo growth. Plant Biotechnol. J. 2017, 16,72–85. [CrossRef] [PubMed]
2. Lobovikov, M.; Paudel, S.; Piazza, M.; Ren, H.; Wu, J. World Bamboo Resources: A Thematic Study Prepared inthe Framework of the Global Forest Resources Assessment 2005; Food and Agriculture Organization of the UnitedNations: Rome, Italy, 2007; pp. 1–73, 1020–3370.
3. Song, X.; Zhou, G.; Jiang, H.; Yu, S.; Fu, J.; Li, W. Carbon sequestration by Chinese bamboo forests and theirecological benefits: Assessment of potential, problems, and future challenges. Environ. Rev. 2011, 19, 418–428.[CrossRef]
4. Li, L.; Hu, T.; Li, X.; Mu, S.; Cheng, Z.; Ge, W.; Gao, J. Genome-wide analysis of shoot growth-associatedalternative splicing in moso bamboo. Mol. Genet. Genom. 2016, 291, 1695–1714. [CrossRef]
5. Zhou, G.M.; Wu, J.S.; Jiang, P.K. Effects of different management models on carbon storage inPhyllostachys pubescens forests. J. Beijing For. Univ. 2006, 28, 51–55. [CrossRef]
6. Liu, L.; Dong, D.; Li, Y.; Li, X.; Bureau, A.M. Investigation of moso bamboo forest under high temperatureand drought disaster. World Bamboo Rattan 2014, 12, 24–27. [CrossRef]
7. Zhang, P.; Wang, J.; Zhang, H. Measures of water management and increasing drought resistance of mosoforests in Anji County, Zhejiang Province. World Bamboo Rattan 2008, 6, 23–24. [CrossRef]
8. Rizhsky, L.; Liang, H.; Mittler, R. The combined effect of drought stress and heat shock on gene expression intobacco. Plant Physiol. 2002, 130, 1143–1151. [CrossRef]
9. Chauhan, H.; Khurana, N.; Agarwal, P.; Khurana, P. Heat shock factors in rice (Oryza sativa L.): Genome-wideexpression analysis during reproductive development and abiotic stress. Mol. Genet. Genom. 2011, 286,171–187. [CrossRef]
10. Hartl, F.U.; Hayerhartl, M. Molecular chaperones in the cytosol: From nascent chain to folded protein. Science2002, 295, 1852–1858. [CrossRef]
11. Queitsch, C.; Hong, S.W.; Vierling, E.; Lindquist, S. Heat shock protein 101 plays a crucial role inthermotolerance in Arabidopsis. Plant Cell 2000, 12, 479–492. [CrossRef]
12. Döring, P.; Treuter, E.; Kistner, C.; Lyck, R.; Chen, A.; Nover, L. The role of AHA motifs in the activatorfunction of tomato heat stress transcription factors HsfA1 and HsfA2. Plant Cell 2000, 12, 265–278. [CrossRef][PubMed]
13. Pelham, H.R.; Bienz, M. A synthetic heat-shock promoter element confers heat-inducibility on the herpessimplex virus thymidine kinase gene. EMBO J. 1982, 1, 1473–1477. [CrossRef] [PubMed]
14. Von Koskull-Döring, P.; Scharf, K.; Nover, L. The diversity of plant heat stress transcription factors. TrendsPlant Sci. 2007, 12, 452–457. [CrossRef] [PubMed]
15. Scharf, K.D.; Berberich, T.; Ebersberger, I.; Nover, L. The plant heat stress transcription factor (Hsf) family:Structure, function and evolution. Biochim. Biophys. Acta 2012, 1819, 104–119. [CrossRef] [PubMed]
16. Kotak, S.; Port, M.; Ganguli, A.; Bicker, F.; von Koskull-Döring, P. Characterization of C-terminal domains ofArabidopsis heat stress transcription factors (Hsfs) and identification of a new signature combination of plantclass A Hsfs with AHA and NES motifs essential for activator function and intracellular localization. Plant J.2004, 39, 98–112. [CrossRef] [PubMed]
17. Mishra, S.K.; Tripp, J.; Winkelhaus, S.; Tschiersch, B.; Theres, K.; Nover, L.; Scharf, K.D. In the complex familyof heat stress transcription factors, HsfA1 has a unique role as master regulator of thermotolerance in tomato.Genes Dev. 2002, 16, 1555–1567. [CrossRef] [PubMed]
18. Ogawa, D.; Yamaguchi, K.; Nishiuchi, T. High-level overexpression of the Arabidopsis HsfA2 gene confers notonly increased themotolerance but also salt/osmotic stress tolerance and enhanced callus growth. J. Exp. Bot.2007, 12, 3373–3383. [CrossRef]
124

Forests 2019, 10, 100
19. Wang, X.; Huang, W.; Liu, J.; Yang, Z.; Huang, B. Molecular regulation and physiological functions of anovel FaHsfA2c cloned from tall fescue conferring plant tolerance to heat stress. Plant Biotechnol. J. 2017, 15,237–248. [CrossRef]
20. Zhang, L.; Li, Y.; Xing, D.; Gao, C. Characterization of mitochondrial dynamics and subcellular localizationof ROS reveal that HsfA2 alleviates oxidative damage caused by heat stress in Arabidopsis. J. Exp. Bot. 2009,60, 2073–2091. [CrossRef]
21. Sakuma, Y.; Maruyama, K.; Qin, F.; Osakabe, Y.; Shinozaki, K. Yamaguchi-Shino-zaki, K. Dual function ofan Arabidopsis transcription factor DREB2A in water-stress-responsive and heat-stress-responsive geneexpression. Proc. Natl. Acad. Sci. USA 2006, 103, 18822–18827. [CrossRef]
22. Schramm, F.; Larkindale, J.; Kiehlmann, E.; Ganguli, A.; Englich, G.; Vierling, E.; von Koskull-Döring, P.A cascade of transcription factor DREB2A and heat stress transcription factor HsfA3 regulates the heat stressresponse of Arabidopsis. Plant J. 2008, 53, 264–274. [CrossRef] [PubMed]
23. Yoshida, T.; Sakuma, Y.; Todaka, D.; Maruyama, K.; Qin, F.; Mizoi, J.; Kidokoro, S.; Fujita, Y.; Shinozaki, K.;Yamaguchi-Shinozaki, K. Functional analysis of an Arabidopsis heat-shock transcription factor HsfA3 inthe transcriptional cascade downstream of the DREB2A stress-regulatory system. Biochem. Biophys. Res.Commun. 2008, 368, 515–521. [CrossRef] [PubMed]
24. Li, Z.; Zhang, L.; Wang, A.; Xu, X.; Li, J. Ectopic Overexpression of SlHsfA3, a Heat Stress Transcription Factorfrom Tomato, Confers Increased Thermotolerance and Salt Hypersensitivity in Germination in TransgenicArabidopsis. PLoS ONE 2013, 8, e54880. [CrossRef] [PubMed]
25. Lang, S.; Liu, X.; Xue, H.; Li, X.; Wang, X. Functional characterization of BnHSFA4a as a heat shocktranscription factor in controlling the re-establishment of desiccation tolerance in seeds. J. Exp. Bot. 2017, 68,2361–2375. [CrossRef] [PubMed]
26. Li, F.; Zhang, H.; Zhao, H.; Gao, T.; Song, A.; Jiang, J.; Chen, F.; Chen, S. Chrysanthemum CmHSFA4 genepositively regulates salt stress tolerance in transgenic chrysanthemum. Plant Biotechnol. J. 2017, 16, 1311–1321.[CrossRef] [PubMed]
27. Shim, D.; Hwang, J.U.; Lee, J.; Lee, S.; Choi, Y.; An, G.; Martinoia, E.; Lee, Y. Orthologs of the class A4 heatshock transcription factor HsfA4a confer cadmium tolerance in wheat and rice. Plant Cell 2009, 21, 4031–4043.[CrossRef] [PubMed]
28. Chen, S.S.; Jiang, J.; Han, X.J.; Zhang, Y.X.; Zhuo, R.Y. Identification, expression analysis of the Hsf family,and characterization of class A4 in Sedum Alfredii hance under cadmium stress. Int. J. Mol. Sci. 2018, 19, 1216.[CrossRef] [PubMed]
29. Kotak, S.; Vierling, E.; Bäumlein, H.; von Koskull-Döring, P. A novel transcriptional cascade regulatingexpression of heat stress proteins during seed development of Arabidopsis. Plant Cell 2007, 19, 182–195.[CrossRef]
30. Ikeda, M.; Ohme-Takagi, M. Arabidopsis HsfB1 and HsfB2b act as repressors of the expression ofheat-inducible Hsfs but positively regulate the acquired thermotolerance. Plant Physiol. 2011, 157, 1243–1254.[CrossRef]
31. Zhuang, L.L.; Cao, W.; Wang, J.; Yu, J.J.; Yang, Z.M.; Huang, B.G. Characterization and functional analysis ofFaHsfC1b from Festuca arundinacea conferring heat tolerance in Arabidopsis. Int. J. Mol. Sci. 2018, 19, 2702.[CrossRef]
32. Peng, Z.; Lu, Y.; Li, L.; Zhao, Q.; Feng, Q.; Gao, Z.; Lu, H.; Hu, T.; Yao, N.; Liu, K.; et al. The draft genomeof the fast-growing non-timber forest species moso bamboo (Phyllostachys heterocycla). Nat. Genet. 2013, 45,456–461. [CrossRef] [PubMed]
33. Hou, D.; Cheng, Z.; Xie, L.; Li, X.; Li, J.; Mu, S.; Gao, J. The R2R3MYB Gene Family in Phyllostachys edulis:Genome-Wide Analysis and Identification of Stress or Development-Related R2R3MYBs. Front. Plant Sci.2018, 9, 738. [CrossRef] [PubMed]
34. Wang, T.; Wang, H.; Cai, D.; Gao, Y.; Zhang, H.; Wang, Y.; Lin, C.; Ma, L.; Gu, L. Comprehensiveprofiling of rhizome-associated alternative splicing and alternative polyadenylation in moso bamboo(Phyllostachys edulis). Plant J. 2017, 91, 684–699. [CrossRef]
35. Jin, J.; He, K.; Tang, X.; Li, Z.; Lv, L.; Zhao, Y.; Luo, J.; Gao, G. An Arabidopsis transcriptional regulatory mapreveals distinct functional and evolutionary features of novel transcription factors. Mol. Biol. Evol. 2015, 32,1767–1773. [CrossRef] [PubMed]
125

Forests 2019, 10, 100
36. Jin, J.; Tian, F.; Yang, D.C.; Meng, Y.Q.; Kong, L.; Luo, J.; Gao, G. PlantTFDB 4.0: Toward a central hub fortranscription factors and regulatory interactions in plants. Nucleic Acids Res. 2017, 45, 1040–1045. [CrossRef]
37. Yu, C.S.; Lin, C.J.; Hwang, J.K. Predicting subcellular localization of proteins for Gram-negative bacteria bysupport vector machines based on n-peptide compositions. Protein Sci. 2004, 13, 1402–1406. [CrossRef]
38. Guo, J.; Wu, J.; Ji, Q.; Wang, C.; Luo, L.; Yuan, Y.; Wang, Y.; Wang, J. Genome-wide analysis of heat shocktranscription factor families in rice and Arabidopsis. J. Genet. Genom. 2008, 35, 105–118. [CrossRef]
39. Edgar, R.C. MUSCLE: Multiple sequence alignment with high accuracy and high throughput. Nucleic AcidsRes. 2004, 32, 1792–1797. [CrossRef]
40. Sievers, F.; Higgins, D.G. Clustal Omega, accurate alignment of very large numbers of sequences. MethodsMol. Biol. 2014, 1079, 105–116. [CrossRef]
41. Thompson, J.D.; Gibson, T.J.; Plewniak, F.; Jeanmougin, F.; Higgins, D.G. The CLUSTAL_X windows interface:Flexible strategies for multiple sequence alignment aided by quality analysis tools. Nucleic Acids Res. 1997,25, 4876–4882. [CrossRef]
42. Hu, B.; Jin, J.; Guo, A.Y.; Zhang, H.; Luo, J.; Gao, G. GSDS 2.0: An upgraded gene feature visualization server.Bioinformatics 2015, 31, 1296. [CrossRef]
43. Bailey, T.L.; Boden, M.; Buske, F.A.; Frith, M.; Grant, C.E.; Clementi, L.; Ren, J.Y.; Li, W.W.; Noble, W.S. MEMESuite: Tools for motif discovery and searching. Nucleic Acids Res. 2009, 37, W202–W208. [CrossRef]
44. Cheng, Z.C.; Hou, D.; Liu, J.; Li, X.Y.; Xie, L.H.; Ma, Y.J.; Gao, J. Characterization of moso bamboo(Phyllostachys edulis) Dof factors in floral development and abiotic stress responses. Genome 2018, 61, 151–156.[CrossRef]
45. Liu, A.L.; Zou, J.; Zhang, X.W.; Zhou, X.Y.; Wang, W.F.; Xiong, X.Y.; Chen, L.Y.; Chen, X.B. Expression profilesof class A rice heat shock transcription factor genes under abiotic stresses. J. Plant Biol. 2010, 53, 142–149.[CrossRef]
46. Gao, J.; Zhang, Y.; Zhang, C.; Qi, F.; Li, X.; Mu, S.; Peng, Z. Characterization of the floral transcriptome ofmoso bamboo (Phyllostachys edulis) at different flowering developmental stages by transcriptome sequencingand RNA-Seq analysis. PLoS ONE 2014, 9, e98910. [CrossRef]
47. Bustin, S.A.; Benes, V.; Garson, J.A.; Hellemans, J.; Huggett, J.; Kubista, M.; Mueller, R.; Nolan, T.; Pfaffl, M.W.;Shipley, G.L.; et al. The MIQE guidelines: Minimum information for publication of quantitative real-timePCR experiments. Clin. Chem. 2009, 55, 611–622. [CrossRef]
48. Fan, C.; Ma, J.; Guo, Q.; Li, X.; Wang, H.; Lu, M. Selection of reference genes for quantitative real-time PCRin bamboo (Phyllostachys edulis). PLoS ONE 2013, 8, e56573. [CrossRef]
49. Livak, K.; Schmittgen, T. Analysis of relative gene expression data using real-time quantitative PCR and the2−ΔΔCT Method. Methods 2001, 25, 402–408. [CrossRef]
50. Smita, S.; Katiyar, A.; Chinnusamy, V.; Pandey, D.M.; Bansal, K.C. Transcriptional regulatory networkanalysis of MYB transcription factor family genes in rice. Front. Plant Sci. 2015, 6, 1157. [CrossRef]
51. Shannon, P.; Markiel, A.; Ozier, O.; Baliga, N.S.; Wang, J.T.; Ramage, D.; Amin, N.; Schwikowski, B.; Ideker, T.Cytoscape: A software environment for integrated models of biomolecular interaction networks. Genome Res.2003, 13, 2498–2504. [CrossRef]
52. Sultan, S.; Ali, M.; Nawaz, S.; Ali, M.A.; Shahzad, A. Genome wide analysis of heat shock factors (HSF) genefamily of Arabidopsis Thaliana. J. Biol. Agric. Healthc. 2016, 6, 69–77.
53. Li, P.S.; Zheng, W.J.; Zhou, Y.B.; Chen, M.; Chai, S.C.; Ma, L.J.; Xu, Z.S. Genome-wide identification,classification and high temperature responses of Hsf family in Brachypodium distachyon. J. China Agric. Univ.2015, 20, 8–18. [CrossRef]
54. Nover, L.; Bharti, K.; Döring, P.; Mishra, S.K.; Ganguli, A.; Scharf, K. Arabidopsis and the heat stresstranscription factor world: How many heat stress transcription factors do we need? Cell Stress Chaperones2001, 6, 177–189. [CrossRef]
55. Guo, M.; Liu, J.H.; Ma, X.; Luo, D.X.; Gong, Z.H.; Lu, M.H. The plant heat stress transcription factors (HSFs):Structure, regulation, and function in response to abiotic stresses. Front. Plant Sci. 2016, 7, 114. [CrossRef]
56. Xue, G.; Sadat, S.; Drenth, J.; McIntyre, C.L. The heat shock factor family from Triticum aestivum in responseto heat and other major abiotic stresses and their role in regulation of heat shock protein genes. J. Exp. Bot.2014, 65, 539–557. [CrossRef]
57. Zhao, H.; Peng, Z.; Fei, B.; Li, L.; Hu, T.; Gao, Z.; Jiang, Z. BambooGDB: A bamboo genome database withfunctional annotation and an analysis platform. Database 2014, 2014, bau006. [CrossRef]
126

Forests 2019, 10, 100
58. Giorno, F.; Guerriero, G.; Baric, S.; Mariani, C. Heat shock transcriptional factors in Malus domestica:Identification, classification and expression analysis. BMC Genom. 2012, 13, 639. [CrossRef]
59. Lescot, M.; Déhais, P.; Thijs, G.; Marchal, K.; Moreau, Y.; Van de Peer, Y.; Rouzé, P.; Rombauts, S. PlantCARE,a database of plant cis-acting regulatory elements and a portal to tools for in silico analysis of promotersequences. Nucleic Acids Res. 2002, 30, 325–327. [CrossRef]
60. Busch, W.; Wunderlich, M.; Schöffl, F. Identification of novel heat shock factor-dependent genes andbiochemical pathways in Arabidopsis thaliana. Plant J. 2010, 41, 1–14. [CrossRef]
61. Zhang, J.; Li, Y.; Jia, H.X.; Li, J.B.; Huang, J.; Lu, M.Z.; Hu, J.J. The heat shock factor gene family inSalix suchowensis: A genome-wide survey and expression profiling during development and abiotic stresses.Front. Plant Sci. 2015, 6, 748. [CrossRef]
62. Mittal, D.; Chakrabarti, S.; Sarkar, A.; Singh, A.; Grover, A. Heat shock factor gene family in rice: Genomicorganization and transcript expression profiling in response to high temperature, low temperature andoxidative stresses. Plant Physiol. Biochem. 2009, 47, 785–795. [CrossRef]
63. Liu, A.L.; Zou, J.; Liu, C.F.; Zhou, X.Y.; Zhang, X.W.; Luo, G.Y.; Chen, X.B. Over-expression of OsHsfA7enhanced salt and drought tolerance in transgenic rice. BMB Rep. 2013, 46, 31–36. [CrossRef]
64. Zhao, H.; Lou, Y.; Sun, H.; Li, L.; Wang, L.; Dong, L.; Gao, Z. Transcriptome and comparative gene expressionanalysis of Phyllostachys edulis in response to high light. BMC Plant Biol. 2016, 16, 34. [CrossRef]
65. Pérez-Salamó, I.; Szabados, L. The heat shock factor A4A confers salt tolerance and is regulated by oxidativestress and the mitogen-activated protein kinases MPK3 and MPK6. Plant Physiol. 2014, 165, 319–334.[CrossRef]
66. Xie, K.; Chen, J.; Wang, Q.; Yang, Y. Direct phosphorylation and activation of a mitogen-activated proteinkinase by a calcium-dependent protein kinase in rice. Plant Cell 2014, 26, 3077–3089. [CrossRef]
67. Shi, B.; Ni, L.; Liu, Y.; Zhang, A.; Tan, M.; Jiang, M. OsDMI3-mediated activation of OsMPK1 regulates theactivities of antioxidant enzymes in abscisic acid signalling in rice. Plant Cell Environ. 2014, 37, 341–352.[CrossRef]
© 2019 by the authors. Licensee MDPI, Basel, Switzerland. This article is an open accessarticle distributed under the terms and conditions of the Creative Commons Attribution(CC BY) license (http://creativecommons.org/licenses/by/4.0/).
127


Article
DNA Barcoding Analysis and Phylogenetic Relationof Mangroves in Guangdong Province, China
Feng Wu 1,2, Mei Li 1, Baowen Liao 1,*, Xin Shi 1 and Yong Xu 3,4
1 Key Laboratory of State Forestry Administration on Tropical Forestry Research, Research Institute ofTropical Forestry, Chinese Academy of Forestry, Guangzhou 510520, China; [email protected] (F.W.);[email protected] (M.L.); [email protected] (X.S.)
2 Zhaoqing Xinghu National Wetland Park Management Center, Zhaoqing 526060, China3 Key Laboratory of Plant Resources Conservation and Sustainable Utilization, South China Botanical Garden,
Chinese Academy of Sciences, Guangzhou 510650, China; [email protected] University of Chinese Academy of Sciences, Beijing 100049, China* Correspondence: [email protected]; Tel.: +86-020-8702-8494
Received: 9 December 2018; Accepted: 4 January 2019; Published: 12 January 2019
Abstract: Mangroves are distributed in the transition zone between sea and land, mostly in tropicaland subtropical areas. They provide important ecosystem services and are therefore economicallyvaluable. DNA barcoding is a useful tool for species identification and phylogenetic reconstruction.To evaluate the effectiveness of DNA barcoding in identifying mangrove species, we sampled135 individuals representing 23 species, 22 genera, and 17 families from Zhanjiang, Shenzhen,Huizhou, and Shantou in the Guangdong province, China. We tested the universality of four DNAbarcodes, namely rbcL, matK, trnH-psbA, and the internal transcribed spacer of nuclear ribosomalDNA (ITS), and examined their efficacy for species identification and the phylogenetic reconstructionof mangroves. The success rates for PCR amplification of rbcL, matK, trnH-psbA, and ITS were 100%,80.29% ± 8.48%, 99.38% ± 1.25%, and 97.18% ± 3.25%, respectively, and the rates of DNA sequencingwere 100%, 75.04% ± 6.26%, 94.57% ± 5.06%, and 83.35% ± 4.05%, respectively. These results suggestthat both rbcL and trnH–psbA are universal in mangrove species from the Guangdong province.The highest success rate for species identification was 84.48% ± 12.09% with trnH-psbA, followed byrbcL (82.16% ± 9.68%), ITS (66.48% ± 5.97%), and matK (65.09% ± 6.00%), which increased to 91.25% ±9.78% with the addition of rbcL. Additionally, the identification rate of mangroves was not significantlydifferent between rbcL + trnH-psbA and other random fragment combinations. In conclusion, rbcLand trnH-psbA were the most suitable DNA barcode fragments for species identification in mangroveplants. When the phylogenetic relationships were constructed with random fragment combinations,the optimal evolutionary tree with high supporting values (86.33% ± 4.16%) was established usingthe combination of matK + rbcL + trnH-psbA + ITS in mangroves. In total, the 476 newly acquiredsequences in this study lay the foundation for a DNA barcode database of mangroves.
Keywords: mangroves; DNA barcoding; species identification; phylogenetic relation
1. Introduction
In 2003, Hebert [1] proposed a novel DNA barcoding technology to expedite the process ofspecies identification. Around 2005, the concept of DNA barcoding was introduced into botanicalresearch [2,3]. In 2009, the CBOL(Consortium for the Barcode of Life) Plant Working Group initiallyidentified and recommended the use of the chloroplast-derived DNA barcode fragments rbcL andmatK [4]. In addition, trnH-psbA, the internal spacer region of the chloroplast gene, and the ITS region ofthe nuclear genome were also investigated [5–7]. Further research is required to compare DNA barcodefragments to test their efficacy for species identification [8–11]. Previous studies on the DNA barcoding
Forests 2019, 10, 56; doi:10.3390/f10010056 www.mdpi.com/journal/forests129

Forests 2019, 10, 56
of plants have mainly focused on tropical and subtropical forests [12–15]. In addition, sequencesobtained from DNA barcode fragments can also be used to reconstruct the phylogenetic relationshipsof specific biological groups, and this has become a new research hotspot in recent years [16–18]. Thisresearch promotes the integration of phylogenetic analysis, ecology, and barcoding technology anddevelops our understanding of evolutionary biology and other related disciplines [19–22].
Mangroves, in the broad sense, are woody plant communities growing in tropical and subtropicalintertidal zones, which play an important role in maintaining the ecological balance of coastalzones [23,24]. There are 84 species of 24 genera and 16 families of mangrove plants in the world,including 70 species of 16 genera and 11 families of true mangrove plants and 14 species of eightgenera and five families of semi-mangrove plants [25]. There are 25 species of mangrove plants fromGuangdong, including 16 true mangroves and 9 semi-mangroves [26]. There are many similar speciesof mangroves, and their distribution areas are overlapped. It is difficult to identify similar mangrovespecies using the external morphology of plants, such as Sonneratia alba J. Smith, Sonneratia caseolaris(L.) Engl., Sonneratia Hainanesis Ko, E. Y. Chen et W. Y. Chen, Sonneratia paracaseolaris W. C. Ko et al. orBruguiera sexangula (Lour.) Poir and Bruguiera sexangula (Lour.) Poir. var. rhynchopetala Ko. Moreover,it is hard to understand the evolutionary relationship between mangrove species with traditionalclassification methods. DNA barcoding in animals [27,28], insects [29,30], tropical and subtropicalplants [19,31], and microorganisms [32,33] have achieved reliable reconstructions of evolutionaryrelationships, successfully identified species of the same genus, and discovered new species or crypticspecies. In this study, we aimed to investigate the universality of DNA barcoding in the mangroveflora, which is in the transition zone between land and water, and to construct the phylogenetic treesof mangrove flora, to provide a scientific basis for the conservation of mangrove biodiversity.
2. Materials and Methods
2.1. Plant Material
In this study, the main distribution areas of mangroves in Guangdong were selected, namely themangrove protection areas in Shenzhen, Huizhou, and Shantou in Eastern Guangdong and Zhanjiangin Western Guangdong. Specific sampling location information is shown in Table 1. According to theDNA barcode sample collection specifications of Gao [34], two to three individuals of each mangrovespecies were sampled. This involved taking fresh leaves and buds to facilitate the extraction of DNAmolecular materials. Each individual sampled was more than 20 m apart. The test material was driedwith silica gel after collection. A total of 135 individuals of mangrove plants were collected. Basedon expert (LIAO and LI) identification, the individuals were classified into 23 species (including twomangrove companion species) of 22 genera belonging to 17 families. The number of true mangrove andsemi-mangrove species sampled in this study accounted for 84% of the 25 species of mangrove plantsin Guangdong province [26]. Among them, B. sexangula (Lour.) Poir and B. sexangula (Lour.) Poir. var.rhynchopetala Ko, which were introduced by humans, are almost extinct, so they were not sampled.
Table 1. The information of mangrove samples collected in the Guangdong province.
Site Collection Places Longitude Latitude Numbers of Tree Species
Zhanjiang Baitoupo 109◦45′38′′ 21◦34′03′′16Fengdi 109◦46′21′′ 21◦32′36′′
Shenzhen Mangrove reserve 114◦00′33′′ 22◦31′33′′ 12
HuizhouYanzhou island 114◦56′17′′ 22◦43′47′′
14Xiezhouwan 114◦47′00′′ 22◦49′40′′Haozhaolou 114◦52′02′′ 22◦45′58′′
ShantouSu aiwan 116◦43′36′′ 23◦19′16′′
9Waishahe 116◦48′11′′ 23◦23′09′′Yifengxi 116◦53′11′′ 23◦32′45′′
130

Forests 2019, 10, 56
2.2. DNA Extraction and Sequence Analysis
The DNA of mangrove plants was extracted from silica gel-dried leaf material followinga modified version of the cetyltrimethyl ammonium bromide (CTAB) protocol of DoyleandDoyle [35].According to the recommendation of the international union for biological barcoding [4] and previousstudies [13,36,37] on regional plant DNA barcoding, a total of four molecular sequences includingchloroplast rbcL, matK, trnH–psbA, and nuclear genome ITS were selected for use as amplificationfragments. Referrals to the PCR system recommended by the plant working group of the internationalDNA barcode alliance for life, optimization, and adjustment were made. Primer information andamplification procedures are provided in Table 2. All amplification products were sent to Guangzhouafter gel electrophoresis detection for complete sequencing; BLAST (Basic Local Alignment Search Tool)searches were performed using GenBank for the sequences obtained after bidirectional sequencing ofthe four fragments. If significant inconsistencies were found between the sequences and the originalspecies, reasons were found and reextracted or reconfirmed by consulting experts, until the BLASTresults of the sequences and the original species were of the same genus or family. SeqMan 5.00(DNASTAR package, Madison, WI, USA) was used to splice and proofread the obtained sequences.The sequences were aligned in Geneious 11.1.3 (Biomatters Ltd, Auckland, New Zealand) using theMAFFT (Multiple Alignment using Fast Fourier Transform) algorithm with the default parameters.
Table 2. The primers used to amplify DNA barcodes and the amplification protocol.
DNAFragment
Primers Sequences (5′–3′) References Amplification Protocol
rbcLrbcLa_F ATGTCACCACAAACAGAGACTAAAGC
Kress [19]94 ◦C 3 min; 94 ◦C 30 s, 55 ◦C 1 min,72 ◦C 1 min, 35 cycles; 72 ◦C 7 minrbcLa_R GTAAAATCAAGTCCACCRCG
matKKim_3F CGTACAGTACTTTTGTGTTTACGAG Kim,
unpublished94 ◦C 3 min; 94 ◦C 45 s, 51 ◦C 45 s,72 ◦C 1 min, 35 cycles; 72 ◦C 7 minKim_1R ACCCAGTCCATCTGGAAATCTTGGTTC
trnH-psbApsbA3 GTTATGCATGAACGTAATGCTC Sang [38] 94 ◦C 3 min; 94 ◦C 30 s, 55 ◦C 1 min,
72 ◦C 1 min,35 cycles; 72 ◦C 7 mintrnH05 CGCGCATGGTGGATTCACAATCC Tate [39]
ITSITS-leu1 GTCCACTGAACCTTATCATTTAG Urbatsh 94 ◦C 3 min; 94 ◦C 30 s, 55 ◦C 1 min,
72 ◦C 1 min, 35 cycles; 72 ◦C 7 minITS4 TCCTCCGCTTATTGATATGC White [40]
ITS: The internal transcribed spacer of nuclear ribosomal DNA.
2.3. Statistical Analysis
PCR amplification success rates and sequencing success rates were calculated following Kress [19].The success rate of PCR amplification refers to the percentage of successful individuals of a segment inall individuals of the segment. BLAST was used to evaluate the efficacy of the species identificationmethod. Firstly, a local database was established for the four DNA fragments in Geneious 11.1.3 [41],and all sequence comparisons were saved as *. fasta files to adjust the sequence direction and clear thegap between sequences. BLAST-2.7.1+ (https://www.ncbi.nlm.nih.gov/ package, National Centerfor Biotechnology Information, USA) was used to compare each sequence with all sequences in thedatabase, and the percentage of identical sites was used as the quantification standard. If the minimumvalue of the identical sites of the same species was greater than the value between individuals of allother species, then we considered that the sequence of this species had been accurately identified.The success rate of identifications was determined by multiplying the percentage of species successfullyidentified by the success rate of sequencing the segment. Joint fragment identification is the result ofaccumulation on a single fragment [13,41].
131

Forests 2019, 10, 56
3. Results
3.1. Sequence Universality
Sequence statistics were calculated for 135 individuals of 23 species of mangrove plants. Theresults (Table 3) showed a total of 496 DNA barcode fragments were obtained, with a sequenceacquisition rate of 88.15% (476 divided by 540). Among them, a total of 118 sequences of mangroveplants from the Zhanjiang mangrove reserve were obtained. The highest success rate for PCRamplification were with rbcL and trnH-psbA fragments, followed by ITS and matK. The highestsequencing success rate was 100% with the rbcL fragment, followed by trnH-psbA, ITS, and matK.
Table 3. The success rates of PCR amplification and sequencing of the four barcoding fragments in thefour mangrove forests.
Plot DNA FragmentPCR Amplification
Success Rate (%)Sequencing
Success Rate (%)Individuals
Resolution Rate
Zhanjiang
rbcL 100 100 35matK 71.43 65.71 23
trnH-psbA 100 88.57 31ITS 94.29 82.86 29
Shenzhen
rbcL 100 100 36matK 80.56 77.78 28
trnH-psbA 100 97.22 35ITS 94.44 88.89 32
Huizhou
rbcL 100 100 40matK 77.5 77.5 31
trnH-psbA 97.5 92.5 37ITS 100 82.5 33
Shantou
rbcL 100 100 24matK 91.67 79.17 19
trnH-psbA 100 100 24ITS 100 79.17 19
Total 476
A total of 131 sequences of mangrove plants from the mangrove reserve of Shenzhen wereobtained. The highest amplification success rates were with both rbcL and trnH-psbA, followed byITS and matK. The highest sequencing success rate was 100% with rbcL, followed by trnH-psbA, ITS,and matK. A total of 141 sequences of mangrove plants from the Huizhou mangrove reserve wereobtained. The highest amplification success rates were with rbcL, followed by ITS, trnH-psbA, andmatK. The highest sequencing success rate was 100% with rbcL, followed by trnH-psbA, ITS, and matK.A total of 86 sequences of mangrove plants from the Shantou mangrove reserve were obtained. Theamplification success rates were 100% with rbcL, trnH-psbA or ITS, and 91.67% with matK. The highestsequencing success rate was 100% for rbcL, followed by trnH-psbA, ITS, and matK.
3.2. Species Delimitation
The true mangroves and semi-mangroves distributed in Guangdong are all single-genus andsingle-species, except Sonneratia and Bruguiera. Therefore, only the success rates of species-levelidentification are discussed here. BLAST results showed that the highest success rate of speciesidentification was 84.48% ± 12.09% with trnH-psbA, followed by 82.16% ± 9.68% with rbcL, 66.48% ±5.97% with ITS, and 65.09% ± 6.00% with matK (Figure 1). However, more species were successfullyidentified with rbcL fragments than with trnH-psbA fragments in any region, except for Shantou.The main difference was that trnH-psbA could accurately distinguish S. caseolaris (L.) Engl. andSonneratia apetala Buch.-Ham, but rbcL could not.
132

Forests 2019, 10, 56
According to the statistical analysis of different combinations of multiple fragments, the identificationsuccess rate of rbcL + trnH-psbA was 91.25% ± 9.78%, which increased to 91.88% ± 8.62% with the additionof ITS. The success rate of species identification with all fragments was consistent with that of rbcL +trnH-psbA + matK (94.38% ± 4.48%). These results suggest that the combination of certain fragments canincrease the success rate of barcoding for species identification.
Figure 1. Mangrove species discrimination rate of all single and multi-DNA barcoding fragments.R, rbcL; M, matK; T, trnH–psbA; I, ITS; All, the database consisted of all species.
3.3. Phylogenetic Trees
Phylogenetic trees were constructed in MEGA6.0 (Tamura, Stecher, Peterson, Filipski, and Kumar)using the neighbor-joining (NJ) method based on the Kimura’2-parameter model. Phylogenetic treeswere constructed with the individual or random combined fragments and the average node supportrate was calculated. The results showed that the highest average node support rate of phylogenetic treesusing the combination rbcL + matK + trnH-psbA + ITS was 86.33% ± 4.16% (as shown in Figures 2–5).Phylogenetic trees were fan-shaped, with one branch of the same or similar species. The average nodesupport rate for mangrove phylogenetic trees in the four regions was 89.66% ± 18.50% in Zhanjiang,88.49% ± 17.25% in Huizhou, 86.85% ± 15.60% in Shenzhen, and 80.33% ± 19.89% in Shantou.
133

Forests 2019, 10, 56
Figure 2. The phylogenetic tree of mangroves in Zhanjiang using fragment of matK + rbcL + trnH-psbA+ ITS.
134

Forests 2019, 10, 56
Figure 3. The phylogenetic tree of mangroves in Shenzhen using fragment of matK + rbcL + trnH-psbA+ ITS.
135

Forests 2019, 10, 56
Figure 4. The phylogenetic tree of mangroves in Huizhou using fragment of matK + rbcL + trnH-psbA+ ITS.
136

Forests 2019, 10, 56
Figure 5. The phylogenetic tree of mangroves in Shantou using fragment of matK + rbcL + trnH-psbA+ ITS.
4. Discussion
Our study investigated mangrove plants in the Guangdong province using DNA barcodingtechnology. The purpose of this study was to evaluate the performance of DNA barcoding in terms ofprimer universality, successful identification rate, and phylogenetic tree construction.
4.1. The Universality of DNA Barcoding in Mangrove Communities
The success rate of PCR amplification and the sequencing of rbcL fragments in core barcodesof mangrove DNA samples reached 100%. Compared with Kress [19], our results showed higheruniversality and success rates, and were the same as those of Pei [42], with 90%–100% in the forestplant communities in tropical and subtropical regions. This indicates that rbcL has the fewest numbersof variable sites and that the selected primer sequence has strong universality. Therefore, rbcL isrecommended as an effective fragment for DNA barcoding in mangroves. The success rate of anothercore fragment, matK, was the lowest of the four fragments. With this fragment, the amplification orsequencing of Ceriops tagal (perr.) C. B. Rob. and Kandelia candel (L.) Druce were not successful, andonly a small number of individuals were successfully sequenced in, e.g., Bruguiera gymnorrhiza (L.)Poir., Acrostichum aureum L., and Rhizophora stylosa Griff., indicating a lack of universality for this
137

Forests 2019, 10, 56
fragment compared to rbcL. This may be due to the existence of single nucleotide repeat sequences.The amplification rate of matK fragments in previous studies was lower, e.g., 68.18% [43], as was thesuccess rate, e.g., 64% [14]. Similarly low results were reported in other studies of Liu [13], Lu [44], andWei [45]. Generally, in this situation, the number of primers increases, and the procedure is repeatedmultiple times.
The barcode trnH-psbA has high universality, and the amplification rate and sequencing successrate can be 99.38% ± 1.25% and 94.57% ± 5.06%, respectively, with only one pair of primers, whichis second only to the rbcL fragment. This fragment can also successfully distinguish Sonneratia.The success rate of the nuclear gene ITS amplification was 97.18% ± 3.25%; the amplifications ofA. aureum, B. gymnorrhiza, C. tagal, and R. stylosa were not successful. The sequencing success rate ofthe nuclear gene ITS was 83.35% ± 4.05%, and only a few individuals were successfully sequencedin K. candel and Acanthus ilicifolius L. Previous studies, such as that of Tripathi [46], showed that thesequencing success rate of ITS sequences in tropical forest species in India was 62.0%. Kang [47]showed that the success rate of ITS sequencing in Hainan tropical cloud forests was 47.20% ± 5.76%.In conclusion, the rbcL fragment and trnH-psbA fragment are recommended for the amplification andsequencing of mangrove plants.
4.2. Species Identification Ability
CBOL Plant Working Group recommend rbcL and matK for the core DNA barcoding for plants.Burgess [41] found that the core barcode can successfully identify 93% of species in the temperate floraof Canada, and de Vere [48] found that rbcL + matK can identify 69.4%–74.1% of flowering plants inWales, UK. Kress [19] studied 296 woody species in Panama and found that the species identificationrate of matK + rbcL was as high as 98%. In this study, the species identification rate of the core barcoderbcL + matK combination fragment can reach 90.56% ± 6.94%. This indicates that the core barcodeis effective for species identification and is consistent with previous research results. However, theidentification rate of mangroves decreased when only one of them was used. Either rbcL or trnH-psbAhad a higher identification rate of mangroves than that of matK. Additionally, the rate for rbcL +trnH-psbA was higher than that for rbcL + matK. Furthermore, the identification rate of mangroves hadno significant differences between rbcL + trnH-psbA and other random fragment combinations.
Although the number of bases of trnH-psbA varies greatly among different plant groups,a large number of insertions and deletions make sequencing difficult, as well as the existence ofsingle-nucleotide repeats and other special structures in some groups. In this study, the successrate of trnH-psbA sequencing was second only to rbcL. At the same time, this fragment was able tosuccessfully identify S. caseolares and S. apetala. The species identification rate of trnH-psbA was thehighest among the four single fragments, Gonzalez [12] and Tripathi [46] also showed that trnH-psbAis one of the most promising barcodes for species identification. This suggests that trnH-psbA may actas a complementary fragment to rbcL.
Although studies by Kress [19], Sass [49], and Li [7] support the incorporation of ITS into thecore barcode of plant DNA, the supplementary ITS fragment was found to be of low universalityin the present study, and the species identification rate, when used singly, was 66.48% ± 5.97%.However, the ITS fragment could identify Laguncularia racemosa C.F.Gaertn but not rbcL and trnH-psbA.In addition, the ITS region of the nuclear genome can provide more genetic information from parentsthan the chloroplast genes. Given the above, rbcL and trnH-psbA were effective fragments for mangroveidentification, and ITS fragment could be used for specific mangroves.
4.3. Phylogenetic Trees
rbcL + matK + trnH-psbA fragments had been used to construct phylogenetic trees in differentlocalities, e.g., Barro Colorado Island [19], the Dinghu mountain forest [50], the Ailao mountainforest [44], and tropical cloud forests in Hainan [47]. However, the average node support forphylogenetic trees of mangrove species in these four subtropical regions constructed with rbcL +
138

Forests 2019, 10, 56
matK + trnH-psbA + ITS was 5.59% higher than that with rbcL + matK + trnH-psbA, which saw nosignificant difference. In addition, in Figures 2–5, most of the same species were clustered into onebranch, also indicating that DNA barcoding can be used to identify species. Due to the differentgeographical locations of the mangroves, environmental conditions are also different (Table 1), whichleads to differences in selective pressure. This could lead to differences in the evolutionary trajectoryof mangrove species in the four regions. For example, community composition was observed to bedifferent at different locations, whereby true mangrove species gradually decreased from south to north.
5. Conclusions
The results of the present study suggest that rbcL and trnH-psbA have high success rates foramplification and sequencing, indicating that these two barcodes are common in mangrove species.In terms of species identification, these fragments were relatively successful compared to the otherfragments tested. The phylogenetic trees of mangrove plants constructed with a combination of rbcL +matK + trnH-psbA + ITS had the highest node support rate. Due to the low efficiency of matK fragmentamplification and identification in mangrove plants. And the identification success rate of rbcL washigher than that of trnH-psbA, except for Shantou region, where the fragment of trnH-psbA can be usedto identify specific species which cannot be identified by rbcL. Thus, this study concluded that rbcL andtrnH-psbA were the most suitable DNA barcode fragments for species identification in mangrove plants.
Data collection for mangrove DNA barcoding in the Guangdong province is ongoing. A total of476 sequences were obtained, from 135 individuals of 23 species of mangrove plants, accounting for55.26% of the mangrove plants in China (21/38). In future research, the sampling range can be furtherexpanded to include the DNA barcoding of other mangrove tree species and mangrove companionplants, to build a complete and high-coverage mangrove plant DNA barcoding database.
Author Contributions: Conceptualization, B.L. and M.L.; methodology, F.W.; software, F.W., Y.X.; formal analysis,F.W., Y.X.; investigation, F.W., B.L., M.L., X.S.; supervision, B.L., M.L.; writing, F.W.
Funding: This research was funded by the Ministry of Science and Technology of China (No. 2017FY100705 andNo. 2017FY100700), and the National Natural Science Foundation of China (No. 31570594).
Acknowledgments: The authors would like to thank Jiang, Z.M. and Xu, Y.W. for collecting material, andadditional help. Our sincere thanks are extended to Yan, H.F. for providing a scientific research platform.
Conflicts of Interest: The authors declare no conflict of interest.
References
1. Hebert, P.D.; Cywinska, A.; Ball, S.L.; de Waard, J.R. Biological identifications through DNA barcodes.Proc. Biol. Sci. 2003, 270, 313–321. [CrossRef] [PubMed]
2. Chase, M.W.; Salamin, N.; Wilkinson, M.; Dunwell, J.M.; Kesanakurthi, R.P.; Haider, N.; Savolainen, V. Landplants and DNA barcodes: Short-term and long-term goals. Philos. Trans. R. Soc. Lond. B. Biol. Sci. 2005, 360,1889–1895. [CrossRef] [PubMed]
3. Kress, W.J.; Wurdack, K.J.; Zimmer, E.A.; Weigt, L.A.; Janzen, D.H. Use of DNA barcodes to identify floweringplants. Proc. Natl. Acad. Sci. USA 2005, 102, 8369–8374. [CrossRef] [PubMed]
4. CBOL Plant Working Group. A DNA barcode for land plants. Proc. Natl. Acad. Sci. USA 2009, 106,12794–12797. [CrossRef] [PubMed]
5. Kress, W.J.; Erickson, D.L. A two-locus global DNA barcode for land plants: The coding rbcL genecomplements the non-coding trnH-psbA spacer region. PLoS ONE 2007, 2, e508. [CrossRef] [PubMed]
6. Chen, S.; Yao, H.; Han, J.; Liu, C.; Song, J.; Shi, L.; Zhu, Y.; Ma, X.; Gao, T.; Pang, X.; et al. Validation ofthe ITS2 region as a novel DNA barcode for identifying medicinal plant species. PLoS ONE 2010, 5, e8613.[CrossRef]
7. Li, D.Z.; Gao, L.M.; Li, H.T.; Wang, H.; Ge, X.J.; Liu, J.Q.; Chen, Z.D.; Zhou, S.L.; Chen, S.L.; Yang, J.B.; et al.Comparative analysis of a large dataset indicates that internal transcribed spacer (its) should be incorporatedinto the core barcode for seed plants. Proc. Natl. Acad. Sci. USA 2011, 108, 19641–19646.
139

Forests 2019, 10, 56
8. Kress, W.J.; Erickson, D.L.; Swenson, N.G.; Thompson, J.; Uriarte, M.; Zimmerman, J.K. Advances in the useof DNA barcodes to build a community phylogeny for tropical trees in a Puerto Rican forest dynamics plot.PLoS ONE 2010, 5, e15409. [CrossRef]
9. Hollingsworth, P.M. Refining the DNA barcode for land plants. Proc. Natl. Acad. Sci. USA 2011, 108,19451–19452. [CrossRef]
10. Li, H.Q.; Chen, J.Y.; Wang, S.; Xiong, S.Z. Evaluation of six candidate DNA barcoding loci in Ficus (Moraceae)of China. Mol. Ecol. Resour. 2012, 12, 783–790. [CrossRef]
11. Braukmann, T.W.; Kuzmina, M.L.; Sills, J.; Zakharov, E.V.; Hebert, P.D. Testing the efficacy of DNA barcodesfor identifying the vascular plants of Canada. PLoS ONE 2017, 12, e169515. [CrossRef] [PubMed]
12. Gonzalez, M.A.; Baraloto, C.; Engel, J.; Mori, S.A.; Petronelli, P.; Riera, B.; Roger, A.; Thebaud, C.; Chave, J.Identification of Amazonian trees with DNA barcodes. PLoS ONE 2009, 4, e7483. [CrossRef] [PubMed]
13. Liu, J.; Yan, H.F.; Newmaster, S.G.; Pei, N.; Ragupathy, S.; Ge, X.J.; Lowe, A. The use of DNA barcoding as atool for the conservation biogeography of subtropical forests in China. Divers. Distrib. 2015, 21, 188–199.[CrossRef]
14. Parmentier, I.; Duminil, J.; Kuzmina, M.; Philippe, M.; Thomas, D.W.; Kenfack, D.; Chuyong, G.B.; Cruaud, C.;Hardy, O.J. How effective are DNA Barcodes in the identification of African rainforest trees. PLoS ONE 2013,8, e54921. [CrossRef] [PubMed]
15. Kress, W.J.; Erickson, D.L. DNA barcodes: Methods and protocols. Methods Mol. Biol. 2012, 858, 3–8. [PubMed]16. Li, D.Z.; Zeng, C.X. Prospects for plant DNA barcoding. Biodivers. Sci. 2015, 23, 297–298. [CrossRef]17. Kress, W.J.; Garcia-Robledo, C.; Uriarte, M.; Erickson, D.L. DNA barcodes for ecology, evolution, and
conservation. Trends Ecol. Evol. 2015, 30, 25–35. [CrossRef]18. Pei, N.C.; Chen, B.F.; Kress, W.J. Advances of community-level plant DNA barcoding in China. Front. Plant
Sci. 2017, 8, 225. [CrossRef]19. Kress, W.J.; Erickson, D.L.; Jones, F.A.; Swenson, N.G.; Perez, R.; Sanjur, O.; Bermingham, E. Plant DNA
barcodes and a community phylogeny of a tropical forest dynamics plot in Panama. Proc. Natl. Acad.Sci. USA 2009, 106, 18621–18626. [CrossRef]
20. Pei, N.C.; Zhang, J.L.; Mi, X.C.; Ge, X.J. Plant DNA barcodes promote the development of phylogeneticcommunity ecology. Biodivers. Sci. 2011, 19, 284–294. (In Chinese)
21. Valentini, A.; Pompanon, F.; Taberlet, P. DNA barcoding for ecologists. Trends Ecol. Evol. 2009, 24, 110–117.[CrossRef] [PubMed]
22. Gonzalez, M.A.; Roger, A.; Courtois, E.A.; Jabot, F.; Norden, N.; Paine, C.E.T.; Baraloto, C.; Thébaud, C.;Chave, J.M. Shifts in species and phylogenetic diversity between sapling and tree communities indicatenegative density dependence in a lowland rain forest. J. Ecol. 2010, 98, 137–146. [CrossRef]
23. Lin, P. Chinese Mangrove Ecosystem; Science Press: Beijing, China, 1997; pp. 124–156. ISBN 9787030056924.(In Chinese)
24. Dan, X.Q.; Liao, B.W.; Wu, Z.B.; Wu, H.J.; Bao, D.M. resources, conservation status and main threats ofmangrove wetlands in China. Ecol. Environ. Sci. 2016, 25, 1237–1243. (In Chinese)
25. Wang, B.J.; Liang, S.C.; Zhang, W.Y.; Zan, Q.J. Mangrove flora of the world. Acta Bot. Sin. 2003, 45, 644–653.(In Chinese)
26. Liao, B.W.; Zhang, Q.M. Area, distribution and species composition of mangroves in China. Wetl. Sci. 2014,12, 435–440. (In Chinese)
27. Murphy, R.W.; Crawford, A.J.; Bauer, A.M.; Che, J.; Donnellan, S.C.; Fritz, U.; Haddad, C.F.B.; Nagy, Z.T.;Poyarkov, N.A.; Vences, M.; et al. Cold Code: The global initiative to DNA barcode amphibians and nonavianreptiles. Mol. Ecol. Resour. 2013, 13, 161–167. [CrossRef]
28. Shen, Y.Y.; Chen, X.; Murphy, R.W. Assessing DNA barcoding as a tool for species identification and dataquality control. PLoS ONE 2013, 8, e57125. [CrossRef]
29. Martoni, F.; Bulman, S.; Pitman, A.; Taylor, G.; Armstrong, K. DNA barcoding highlights cryptic diversity inthe New Zealand Psylloidea (Hemiptera: Sternorrhyncha). Diversity 2018, 10, 50. [CrossRef]
30. Pfeiler, E. DNA barcoding and taxonomic challenges in describing new putative species: Examples fromsootywing and cloudywing butterflies (Lepidoptera: Hesperiidae). Diversity 2018, 10, 111. [CrossRef]
31. Pei, N.C.; Lian, J.Y.; Erickson, D.L.; Swenson, N.G.; Kress, W.J.; Ye, W.H.; Ge, X.J. Exploring tree-habitatassociations in a Chinese subtropical forest plot using a molecular phylogeny generated from DNA barcodeLoci. PLoS ONE 2011, 6, e21273. [CrossRef]
140

Forests 2019, 10, 56
32. Pawlowski, J.; Audic, S.; Adl, S.; Bass, D.; Belbahri, L.; Berney, C.; Bowser, S.; Cepicka, I.; Decelle, J.;Dunthorn, M.; et al. CBOL protist working group: Barcoding eukaryotic richness beyond the animal, plant,and fungal kingdoms. PLoS Biol. 2012, 10, e1001419. [CrossRef] [PubMed]
33. Galimberti, A.; de Mattia, F.; Losa, A.; Bruni, I.; Federici, S.; Casiraghi, M.; Martellos, S.; Labra, M. DNAbarcoding as a new tool for food traceability. Food Res. Int. 2013, 50, 55–63. [CrossRef]
34. Gao, L.M.; Liu, J.; Cai, J.; Yang, J.B.; Zhang, T. A synopsis of technical notes on the standards for plant DNAbarcoding. Plant Divers. Resour. 2012, 34, 592–606. (In Chinese) [CrossRef]
35. Doyle, J.; Doyle, J. A rapid DNA isolation procedure for small quantities of fresh leaf tissue. Phytochem. Bull.1987, 19, 11–15.
36. Yan, H.F.; Liu, Y.J.; Xie, X.F.; Zhang, C.Y.; Hu, C.M.; Hao, G.; Ge, X.J. DNA barcoding evaluation and itstaxonomic implications in the species-rich genus Primula L. in China. PLoS ONE 2015, 10, e122903. [CrossRef][PubMed]
37. Liu, J. DNA Barcoding Evaluation of the Dinghusahn Woody Species and the Genus Gentiana L.(Gentianaceae). Ph.D. Thesis, South China Botanical Garden, The Chinese Academy of Sciences, Guangzhou,China, 2014; pp. 27–28. (In Chinese)
38. Sang, T.; Crawford, D.; Stuessy, T. Chloroplast DNA phylogeny, reticulate evolution, and biogeography ofPaeonia (Paeoniaceae). Am. J. Bot. 1997, 84, 1120. [CrossRef] [PubMed]
39. Tate, J.A.; Simpson, B.B. Paraphyly of Tarasa (Malvaceae) and diverse origins of the polyploid species.Syst. Bot. 2003, 28, 723–737.
40. White, T.J.; Bruns, T.; Lee, S.; Taylor, J. Amplification and direct sequencing of fungal ribosomal RNA genesfor phylogenetics. In PCR Protocols: A Guide to Methods and Applications; Academic: San Diego, CA, USA,1990; pp. 315–322.
41. Burgess, K.S.; Fazekas, A.J.; Kesanakurti, P.R.; Graham, S.W.; Husband, B.C.; Newmaster, S.G.; Percy, D.M.;Hajibabaei, M.; Barrett, S.C.H. Discriminating plant species in a local temperate flora using the rbcL+matKDNA barcode. Methods Appl. Fluores 2011, 2, 333–340. [CrossRef]
42. Pei, N.; Erickson, D.L.; Chen, B.; Ge, X.; Mi, X.; Swenson, N.G.; Zhang, J.; Jones, F.A.; Huang, C.; Ye, W.;et al. Closely-related taxa influence woody species discrimination via DNA barcoding: Evidence from globalforest dynamics plots. Sci. Rep. 2015, 5, 15127. [CrossRef]
43. Costion, C.; Ford, A.; Cross, H.; Crayn, D.; Harrington, M.; Lowe, A. Plant DNA barcodes can accuratelyestimate species richness in poorly known floras. PLoS ONE 2011, 6, e26841. [CrossRef]
44. Lu, M.M.; Ci, X.Q.; Yang, G.P.; Li, J. DNA barcoding of subtropical forest trees—A study from Ailaomountains nature reserve, Yunnan, China. Plant Divers. Resour. 2013, 35, 733–741. (In Chinese)
45. Wei, Y.N.; Wang, X.M.; Yao, P.C.; Chen, X.Y.; Li, H.Q. Comparison of species resolution rates of DNAbarcoding for Chinese coastal halo-tolerant plants. Biodivers. Sci. 2017, 25, 1095–1104. (In Chinese) [CrossRef]
46. Tripathi, A.M.; Tyagi, A.; Kumar, A.; Singh, A.; Singh, S.; Chaudhary, L.B.; Roy, S. The internal transcribedspacer (its) region and trnH-psbA [corrected] are suitable candidate loci for DNA barcoding of tropical treespecies of India. PLoS ONE 2013, 8, e57934. [CrossRef] [PubMed]
47. Kang, Y.; Deng, Z.; Zang, R.; Long, W. DNA barcoding analysis and phylogenetic relationships of tree speciesin tropical cloud forests. Sci. Rep. 2017, 7, 12564. [CrossRef] [PubMed]
48. De Vere, N.; Rich, T.C.; Ford, C.R.; Trinder, S.A.; Long, C.; Moore, C.W.; Satterthwaite, D.; Davies, H.;Allainguillaume, J.; Ronca, S.; et al. DNA barcoding the native flowering plants and conifers of Wales.PLoS ONE 2012, 7, e37945. [CrossRef] [PubMed]
49. Sass, C.; Little, D.P.; Stevenson, D.W.; Specht, C.D. DNA barcoding in the cycadales: Testing the potentialof proposed barcoding markers for species identification of cycads. PLoS ONE 2007, 2, e1154. [CrossRef][PubMed]
50. Pei, N.C. Building a subtropical forest community phylogeny based on plant DNA barcodes fromDinghushan plot. Plant Divers. Resour. 2012, 34, 263–270. (In Chinese) [CrossRef]
© 2019 by the authors. Licensee MDPI, Basel, Switzerland. This article is an open accessarticle distributed under the terms and conditions of the Creative Commons Attribution(CC BY) license (http://creativecommons.org/licenses/by/4.0/).
141


Article
Diversity and Utilization of Edible Plants andMacro-Fungi in Subtropical Guangdong Province,Southern China
Juyang Liao 1,2, Linping Zhang 3, Yan Liu 2, Qiaoyun Li 2, Danxia Chen 2, Qiang Zhang 4 and
Jianrong Li 5,*
1 College of Forestry, Beijing Forestry University, Beijing10083, China; [email protected] Hunan Forest Botanical Garden, Changsha 410116, China; [email protected] (Y.L.);
[email protected] (Q.L.); [email protected] (D.C.)3 Key Laboratory of State Forestry Administration on Forest Ecosystem Protection and Restoration of Poyang
Lake Watershed (JXAU), Nanchang 330045, China; [email protected] Guangdong Institute of Applied Biological Resources, Guangzhou 510260, China; [email protected] South China Botanical Garden, Chinese Academy of Sciences, Guangzhou 510650, China* Correspondence: [email protected]; Tel.: +86-20-3725-2692
Received: 17 September 2018; Accepted: 22 October 2018; Published: 25 October 2018
Abstract: Food supply from forests is a fundamental component of forest ecosystem services,but information relating to suitability for human consumption and sustainable utilization ofnon-timber forest products (NTFPs) in developing countries is lacking. To address this gap inknowledge, diverse datasets of edible plants and macro-fungi were obtained from field collections,historical publications, and community surveys across seven cities in Guangdong Province (GP),southern China. Seven edible parts and five food categories of plant species were classified accordingto usage and specific nutrient components. Edible plant species were also categorized into differentseasons and life forms. Our results show that at least 100 plant species (with 64 plant speciesproducing fruit) and 20 macro-fungi were commonly used as edible forest products in subtropicalGP. There were 55 and 57 species providing edible parts in summer and autumn, respectively. Manyedible plants had multiple uses. Tree and herbaceous species made up the majority of the total.Our study provides evidence that both edible plants and macro-fungi can enrich the food supplyfor residents in rural and urban areas by acting as supplemental resources. We therefore suggestthat, in spite of the prevalence of imported foods due to modern infrastructure, edible NTFPs fromsubtropical forests might be leveraged to support the increasing demand for food in an era of rapidurbanization and global change.
Keywords: edible forest product; forest biology; macro-fungi; non-timber forest products (NTFPs);Pan-Pearl River Delta
1. Introduction
Forests and trees are principal components of terrestrial ecosystems, providing the earth witha vast array of socio-ecological benefits [1–3]. Among these benefits, forest biodiversity is a crucialdimension, important for valuing ecosystem services, and has been attracting growing attention frommunicipal authorities, research agencies, and the public. The diversity of edible plants and macro-fungiis a special category of forest biodiversity. From a global perspective, food security is a major concernand will remain a great challenge for the rest of the 21st century, since crop yields have fallen inmany countries and regions due to insufficient investments, irregular climate, and intense disturbancefrom agroforestry [4–7]. Forests, including natural and urban forests, are highly valuable to worldfood security, annually providing livelihoods and food for over 300 million people [8–11]. Moreover,
Forests 2018, 9, 666; doi:10.3390/f9110666 www.mdpi.com/journal/forests143

Forests 2018, 9, 666
urban greenspaces contribute to and preserve a considerable proportion of terrestrial biodiversity [12].Investigation and evaluation of edible species diversity from natural forests and urban green spaces canincrease our understanding of the food supply required to meet the demands of a growing population.Furthermore, efforts to describe edible species diversity are of theoretical significance to understanddiversity patterns of local food species, in addition to increasing citizens’ awareness of biodiversityprotection. Currently, edible fungi, wheat, rice, corn, sorghum, cassava, and potato are the top sevenmajor food crops in the world [9,13]. Edible forest products from diverse ecosystems are importantsupplements for the global food supply. As the largest developing country in the world and a majoreconomic entity, China has the largest population in Asia—more than 1.41 billion as of 2016—and hasdiverse forest types, including tropical, subtropical, and temperate zones. Therefore, enriching thefood supply and achieving food security are important tasks for the international community, regionalgovernments, and local authorities.
Food diversity from forests (i.e., edible plants and macro-fungi) is described in order to reveala vital component of forest biodiversity in subtropical Guangdong Province (GP), southern China.The objectives of the present study were three fold: (1) to obtain a comprehensive species list of edibleplants and macro-fungi commonly used in the region; (2) to explore general patterns of edible plantsamong different edible parts, categories, seasons, and life forms; and (3) to evaluate the utilization andconservation of edible forest products. Overall, exploring the diversity of edible forest products addsto our understanding of the socio-ecological benefits of forests. These efforts assess the suitability ofnon-timber forest products (NTFPs) for human consumption, as well as the necessity and feasibility ofgreen infrastructure construction in urbanizing regions.
2. Materials and Methods
2.1. Research Area
Guangdong Province (20◦09′–25◦31′ N, 109◦45′–117◦20′ E) is located in southern China (Figure 1),geographically adjacent to Hong Kong SAR, Macao SAR, and 4 other provinces. GP consists of21 prefecture-level cities and covers an area of 179,700 km2, with urbanized areas in the southeastand relatively rural areas in northwest. The typical vegetation is subtropical evergreen broadleavedforest, with natural habitats mainly distributed in the northwest, while there is a large proportion ofurban forests and green spaces in the southeast. GP has a massive pool of forest resources, estimated toexceed 7400 vascular plant species and 1100 known macro-fungi [14,15]. Several major socioeconomicindicators were retrieved from the Guangdong Statistical Yearbook (2003–2016) (http://www.gdstats.gov.cn/) (Table 1). As a highly urbanized region and major municipality in southern China, GP isrepresentative of China’s modernization process and forest biodiversity patterns. According to theofficial statistics, as of 2016 GP hosted ~110 million residents and thus requires a large amount ofimported food.
144

Forests 2018, 9, 666
Figure 1. Location of Guangdong Province, southern China (highlighted in black).
2.2. Edible Species Diversity and Taxonomic Information
Records of edible species diversity (plants and fungi) and their illustrations were obtained fromfield observations and historical publications focusing on provincial forests (mostly natural reservesand forest parks), accompanied by community surveys at fruit stores and supermarkets. Samplingsites occurred in 4 cities (Foshan, Guangzhou, Shenzhen, and Zhongshan) located in highly urbanizedareas of GP, and another 3 cities (Shaoguan, Zhanjiang, and Zhaoqing) located in relatively ruralareas. Taxonomic information on all plant species (Supplementary Materials) refer to the Englishrevision of Flora of China (http://foc.eflora.cn/). Specifically, species name, family name, lifestyle, lifeform, and harvest time were collected. The names of fungi and their taxonomy are from Mycobank(http://www.mycobank.org/).
Each edible plant species was classified into 1 of the following 7 categories: root (tuber), stalk(bark, and/or shoot), leaf, flower, fruit, seed, and/or whole plant. For fungi, the whole sporocarpwas considered an edible part; these are usually used as vegetables and medicinal supplements. Fourseasons of food harvest were classified according the climatic conditions in Guangdong Provinceas follows: March to May, spring; June to August, summer; September to November, autumn; andDecember to February of the second year, winter. Five food types were included in this study accordingto their specific nutrient components: cereals and saccharides (providing carbohydrate and starch),fruits (including all fruit types, providing vitamins and protein), vegetables (providing vitamins),oil plants (including oil crops and products, providing vegetable fat), medicinal plants (providingprimary healthcare), and spice plants (providing flavoring agents). Field surveys and samplingmethods were conducted according to the “Observation Methodology for Long-term Forest EcosystemResearch” of the National Standards of the People’s Republic of China (GB/T 33027-2016). All figureswere produced using Adobe Photoshop CC 2015 (Adobe Systems Inc, San Jose, CA, USA). Statisticaldifference (one-sample test) was performed using SPSS (Standard version 13.0; SPSS, Chicago, IL,USA) among the 6 edible parts, 4 seasons, 5 categories, and 4 life forms.
145

Forests 2018, 9, 666
Ta
ble
1.
Gen
eral
stat
isti
csof
edib
lepl
ants
inG
uang
dong
Prov
ince
(200
3–20
16).
Ye
ar
Pro
vin
cia
lG
DP
(Bil
lio
nC
YN
)P
rim
ary
Ind
ust
ry(B
illi
on
CY
N)
Pro
po
rtio
no
fP
rim
ary
Ind
ust
ry(%
)
Co
mp
on
en
tso
fE
dib
leP
lan
tsP
op
ula
tio
n(M
illi
on
)P
rop
ort
ion
of
Urb
an
Po
pu
lati
on
(%)
Fo
rest
Co
ve
rag
e(%
)C
ere
als
(10
9k
g)
Sa
cch
ari
de
s(1
09
kg
)O
ils
(10
9k
g)
Ve
ge
tab
les
(10
9k
g)
Fru
its
(10
9k
g)
Te
a(1
06
kg
)
2003
1344
.99
105.
167.
8214
.88
9.53
0.82
25.8
47.
1941
.40
79.5
4N
A57
.320
0416
03.9
512
4.54
7.76
13.9
09.
410.
7825
.58
7.88
40.4
083
.04
NA
57.4
020
0521
70.1
313
7.46
6.33
13.9
59.
460.
7725
.96
8.32
44.5
091
.94
NA
57.5
020
0625
96.8
615
7.14
6.05
13.8
811
.24
0.78
26.4
48.
9347
.40
93.0
463
.00
NA
2007
3067
.37
174.
625.
6912
.85
10.5
60.
7926
.54
9.51
48.9
094
.49
63.1
056
.00
2008
3569
.65
197.
025.
5212
.43
10.7
90.
8224
.31
9.83
48.4
095
.44
63.4
056
.30
2009
3908
.16
200.
605.
1313
.14
11.1
60.
8525
.67
10.6
251
.40
96.3
863
.40
56.7
020
1045
47.2
822
8.69
5.03
13.1
711
.34
0.88
27.2
111
.29
52.6
0N
AN
A57
.00
2011
5267
.36
265.
985.
0513
.61
12.0
30.
9228
.60
12.1
058
.10
105.
0566
.50
57.3
020
1257
06.7
928
4.89
4.99
13.9
612
.79
0.97
29.8
312
.79
63.1
010
5.94
67.4
057
.70
2013
6216
.40
304.
754.
9013
.16
13.5
91.
0131
.44
13.6
969
.80
106.
4467
.76
58.2
020
1467
79.2
231
6.67
4.67
13.5
713
.08
1.05
32.7
514
.36
73.9
010
7.24
68.0
058
.70
2015
7281
.26
334.
484.
5913
.58
12.5
11.
1034
.39
15.2
179
.30
108.
4968
.71
58.8
820
1679
51.2
036
9.36
4.64
13.6
012
.70
1.13
35.8
015
.80
85.0
010
9.99
69.2
058
.98
146

Forests 2018, 9, 666
3. Results
3.1. Major Crops in Guangdong Province
In recent years, social and economic growth has increased in Guangdong Province (Table 1).Provincial gross domestic product (GDP) and primary industry increased by 490% and 250% from 2003to 2016, respectively. Primary industry accounted for a relatively low and stable proportion of GDPin GP, ranging from 4.59% in 2015 to 7.82% in 2003. The permanent resident population increased by38% (30.45 million), whereas the proportion of urban population increased by 6%, to nearly 70%, from2006 to 2016. Cereals decreased by 8% from 2003 to 2016, although yield remained relatively stable.Saccharides, oils, and vegetables all increased by one-third. Fruits increased by 120%; interestingly,the famous local lychee fruit tree (Litchi chinensis Sonn.) contributed slightly over 10% of the totalfruit yield.
3.2. Patterns of Species Diversity and Edible Parts
Species diversity of edible plants was found to be relatively high in the study region. As manyas 100 plant species (including var. and cv.) belonging to 88 genera in 51 families were identified(Supplementary Materials). Interestingly, 37% of edible plants were from several common families:nine species from Rosaceae; six species from Fabaceae, Myrtaceae, and Rutaceae; and five speciesfrom Poaceae. Species producing fruit parts contributed >60% of the total species, and some plantshad multiple edible parts. Specifically, 64 species were identified with edible fresh or dried fruits,11 species with edible roots or tubers, 10 species with edible seeds, 7 species with edible leaves, 6species with edible flowers or whole plant, and 3 species with edible bark, stalks, or shoots. Statisticaldifference was not significant (t = 1.771, df (degree of freedom) = 5, p = 0.137; t = 2.402, p = 0.061 whensix species with edible whole plant were accumulated to each part accordingly) among the six edibleparts (Figure 2A).
Figure 2. Categories of edible plant species commonly found in Guangdong Province, southern China:(A) edible parts; (B) food categories; (C) seasonal patterns; and (D) life forms.
147

Forests 2018, 9, 666
3.3. Seasonal Patterns and Food Categories of Edible Forest Products
Over half of the total plant species provided edible parts in the summer and autumn, with someplants spanning multiple seasons (Supplementary Materials). Specifically, 57 species were availablein autumn, 55 species in summer, 20 species in spring, and 18 species in winter. Furthermore, eightspecies were available across all four seasons. Statistical difference was significant (t = 3.506, df = 3,p = 0.039; t = 4.254, p = 0.024 when eight species available during the full year were accumulatedto each season accordingly) among the four seasons (Figure 2C). Many edible plants had multipleuses. Specifically, 53 species were used as fruits, 27 species as medicinal or spice plants, 23 speciesas vegetables, 14 species as cereals or saccharides, and 12 species as oil plants. Statistical differencewas significant (t = 3.513, df = 4, p = 0.025) among the five categories (Figure 2B). Tree and herbaceousspecies made up approximately half and one-third of the total, respectively, while shrub speciesaccounted for only 5% of the total. Statistical difference was not significant (t = 2.579, df = 3, p = 0.082)among the four life forms (Figure 2D).
Furthermore, 20 common edible macro-fungi were recorded, belonging to 16 families(Supplementary Materials). Three out the 20 species were from the family Pleurotaceae. The majorityof fungus species were cultivated, accompanied by some wild species found in forests. For instance,wild species Boletus speciosus Frost and Russula vinosa Lindblad usually appeared in the summer andautumn. The whole sporocarp was edible, mostly used as a vegetable. Moreover, about two-thirds ofthe species pool could be used as medicinal supplements.
4. Discussion
The benefits of forest ecosystems are extremely diverse. The composition of food consumption,from the global perspective, is trending toward better, healthier, and more diverse foods [4,7,16,17].Edible plants and macro-fungi are important because they provide livelihoods for people [11,18,19].A growing number of Chinese people pursue a high-quality lifestyle (e.g., realizing the importance ofa vegetarian diet) [16,20]. The reported 100 edible plants and 20 macro-fungi were identified based ona preliminary investigation within Guangdong Province, southern China. Particularly, biodiversityconservation and food supply in the region were investigated in order to understand how they mightaddress poverty alleviation and sustainable utilization, which are increasingly important due toglobal changes and rapid urbanization. Our findings might also be utilized by local authorities andstakeholders adjacent to GP (such as Hunan and Jiangxi Provinces and the Pan-Pearl River Delta).
4.1. Biodiversity Conservation of Forest Resources
Species diversity is the basis of biodiversity conservation. High species diversity can helpcounteract homogeneous food resources in the region [6,13,21]. In light of the more than 7400woody species and 300 macro-fungi already described in GP, additional species are likely to beedible [15,22]. In particular, the presence of endemic species (e.g., fruit species Dimocarpus longanLour., Litchi chinensis Sonn., and Mangifera indica L.; vegetable species Hylocereus undatus Haw.,Lycium chinense Mill. var. chinense, and Sechium edule (Jacq.) Swartz; and medicine species Ficushirta Vahl., Archidendron clypearia Jack., and Plumeria rubra L.) demonstrates the value of preservingregional biodiversity. Genetic diversity serves as another important component of biodiversity. Highgenetic diversity is important to maintain phylogenetic community structure [23–26]. Interestingly,numerous studies have reported that hidden/cryptic genetic biodiversity can be revealed throughmodern taxonomic methods such as DNA barcoding [27,28]. Our results show that there is a moderateproportion of wild plants (14% wild, i.e., the species seldom exists in the form of a cultivar; and another23% partially wild, i.e., the species has the potential to be domesticated) (Supplementary Materials),which suggests that the genetic diversity of edible plants needs to be improved, and may functionas a reservoir of biodiversity in the region. In terms of landscape diversity, the third component ofbiodiversity, the present study provides very little information. However, we agree with previous
148

Forests 2018, 9, 666
findings that actions and policies that protect living habitats and landscape components for wild plants,animals, and fungi are vital to regional biodiversity conservation in natural forests and urban greenspaces [29,30].
Forests provide humans with multiple benefits, from subsistence to safety nets and cash income.In most cases, however, trade-offs may exist between exploitation and protection of forest resources.People could largely depend on local forest products, but deforestation and overexploitation mightprevail in the absence of adequate protection, especially in face of strong global demand [31,32].We suggest that one way to protect forest-based livelihoods while avoiding overexploitation wouldbe to use an alternative solution that synergizes social and ecological benefits [33–35], with goals forsustainable forestry practices and win-win solutions. Future efforts might include the regions adjacentto GP, such as Hunan and Jiangxi Provinces, which geographically share the Nanling Mountains, aglobal biodiversity hotspot [36,37].
4.2. Food Supply in Different Seasons
Urban landscapes (e.g., ground-level and green rooftop gardens) have the potential to produce alarge proportion of food crops (e.g., fresh fruits and vegetables) for a dense population, developinga local urban food system and providing eco-environmental benefits [38–40]. Due to the rapidsocioeconomic development in China, attributed to the reform and opening-up policy (since 1978) andentry into the World Trade Organization (WTO) (since 2001), the dietary structure of residents hasdramatically changed in GP with the availability of a diverse food supply throughout the year. It isnow easy to obtain fresh fruits and vegetables via novel technologies like soilless culture, greenhousecropping, and convenient transportation. However, we should also respect the natural life cycleof plants. Our results show that only a small proportion (~20%) of edible plant species wereavailable in GP in the winter (such as Chrysanthemum morifolium cv. Hangju, Garcinia mangostanaL., Manihot esculenta Crantz, Trachycarpus fortune (Hook.) H. Wendl, Puerariamontana var. thomsonii(Willd.), etc.) or spring (such as Ananascomosus L., Bombax ceiba L., Houttuynia cordata Thunb., etc.),though without specific everyday consumption, similar to previous studies calling for sustainableagroforestry and uninterrupted supplies of edible crops [9,19,41,42].
Edible forest products could be treated as an alternative defense against crises that affect foodsupply. Cereals are the most important food type supporting the current and projected global humanpopulation [43]. However, the yield of cereals largely depends on nutrient investments, climatechange, and human activities, which might result in an imbalance of food supply at a particular timeor place [44]. Our results show that there is tremendous potential for fruit trees, garden vegetables,and edible macro-fungi from nature to supplement the human food supply in the future. Theseedible forest products, though they are inflexible and sometimes have low returns, may still ensuresustainable food security for communities and generate as much income as cultivating crops in thelong term [16,23,45].
4.3. Estimation of Livelihoods from Forests
Foods from forests and urban green spaces contribute a small proportion of everyday foodconsumption. In Guangdong Province, Flammulina velutipes (Curtis) Singer and Pleurotus ostreatus(Jacq.) P. Kumm. were the top two edible fungi, with a yield of 1.71 × 10⁸ kg and 1.36 × 10⁸ kg,respectively, according to a public report released by the Edible Fungus Index (http://www.mushroommarket.net/datas/). Among the species pool of 100 edible plants in this study, at leastone-third were wild or partially wild species, which are not yet domesticated and exploited as areother major cultivars (e.g., lychee). Compared to the high regional species diversity, the proportions ofedible plant diversity (~1.35%; 100/7400) and known macro-fungi (~1.82%; 20/1100) were relativelylow [46], which indicates that wild plant and fungus resources were not overexploited and in situconservation generally works well in GP. Meanwhile, many more wild species are likely to be edibleand are expected to enrich the species diversity of forest food in this region. However, it should be
149

Forests 2018, 9, 666
noted that many wild plants and fungi are poisonous (sometimes fatal) if eaten by mistake, which callsfor the involvement of knowledgeable professionals.
Currently, poverty remains an important problem for over 1.2 billion people, mostly in developingcountries and especially in rural areas [9,11,18,47]. Three principal ideas may achieve forest-basedpoverty alleviation: prevent forest resources from shrinking, if they are necessary to maintainwell-being (protect the pie); make forests accessible and redistribute resources and rents (dividethe pie differently); and increase the value of forest production (enlarge the pie) [48]. It is estimatedthat the livelihoods of ~20% of the global population are supported by forest products, servingas subsistence, safety nets, and pathways to prosperity [11]. Environmental income (e.g., transferof ownership of natural forests and other urban green spaces to local communities, coupled withpayments for improved ecosystem services) accounts for one-third of total household income [18,49].In addition to plants and macro-fungi, animal proteins provided by wildlife and insects could benefithuman nutrition and provide special livelihoods in some rural areas [17,50,51].
5. Conclusions
This study reports state-of-the-art knowledge on common forest products (i.e., edible plants andmacro-fungi) in lower subtropical forests in southern China. Efforts to protect natural forests andurban green spaces should continue in order to prevent biodiversity loss. Domestication of edible wildplants could be reinforced to enrich livelihoods for highly urbanized regions. Exploration of moreedible plants, macro-fungi, and insects might be expected to add to the food supply. We show thatendeavors to explore the diversity of edible forest products could strengthen our understanding of thesocio-ecological benefits of subtropical forests.
Supplementary Materials: The following are available online at http://www.mdpi.com/1999-4907/9/11/666/s1.
Author Contributions: J.L. (Jianrong Li), J.L. (Juyang Liao) and L.Z. conceived the idea, compiled the datasets,and conducted analyses. J.L. (Juyang Liao), L.Z., Y.L., Q.L., Q.Z., and J.L. (Jianrong Li) established the direction.J.L. (Juyang Liao) and J.L. (Jianrong Li) wrote the first draft of the manuscript. J.L. (Juyang Liao), L.Z., Y.L., Q.L.,D.C., Q.Z., and J.L. (Jianrong Li) contributed with suggestions and corrections, and approved the final manuscript.
Funding: This study was funded by the Fundamental Research Funds of CAF (CAFYBB2017QB002), Science andTechnology Key R & D Program of Hunan Province (2017SK2332), National Natural Science Foundation of China(31660189), Pearl River S&T Nova Program of Guangzhou (201610010001), and CFERN & BEIJING TECHNOSOLUTIONS Award Funds on excellent academic achievements.
Acknowledgments: We are grateful to three anonymous reviewers for valuable ideas and/or comments onthe manuscript.
Conflicts of Interest: The authors declare no conflict of interest.
References
1. Boyd, I.L.; Freer-Smith, P.H.; Gilligan, C.A.; Godfray, H.C.J. The Consequence of Tree Pests and Diseases forEcosystem Services. Science 2013, 342, 1235773. [CrossRef] [PubMed]
2. Nowak, D.J.; Crane, D.E.; Stevens, J.C.; Hoehn, R.E.; Walton, J.T.; Bond, J. A ground-based method ofassessing urban forest structure and ecosystem services. Arboricult. Urban For. 2008, 34, 347–358.
3. Costanza, R.; de Groot, R.; Sutton, P.; van der Ploeg, S.; Anderson, S.J.; Kubiszewski, I.; Farber, S.; Turner, R.K.Changes in the global value of ecosystem services. Glob. Environ. Chang. 2014, 26, 152–158. [CrossRef]
4. Poleman, T.T. World Food: A Perspective. Science 1975, 188, 510–518. [CrossRef] [PubMed]5. Schmidhuber, J.; Tubiello, F.N. Global food security under climate change. Proc. Natl. Acad. Sci. USA
2007, 104, 19703–19708. [CrossRef] [PubMed]6. Campbell, B.M.; Vermeulen, S.J.; Aggarwal, P.K.; Corner-Dolloff, C.; Girvetz, E.; Loboguerrero, A.M.;
Ramirez-Villegas, J.; Rosenstock, T.; Sebastian, L.; Thornton, P.K.; et al. Reducing risks to food security fromclimate change. Glob. Food Secur. 2016, 11, 34–43. [CrossRef]
7. Vermeulen, S.J.; Campbell, B.M.; Ingram, J.S.I. Climate Change and Food Systems. Annu. Rev. Environ. Resour.2012, 37, 195–222. [CrossRef]
150

Forests 2018, 9, 666
8. Pimentel, D.; McNair, M.; Buck, L.; Pimentel, M.; Kamil, J. The Value of Forests to World Food Security.Hum. Ecol. 1997, 25, 91–120. [CrossRef]
9. Alexandratos, N.; Bruinsma, J. World Agriculture towards 2030/2050: The 2012 Revision; Food and AgricultureOrganization of the United Nations: Rome, Italy, 2012.
10. Rosegrant, M.W.; Cline, S.A. Global Food Security: Challenges and Policies. Science 2003, 302, 1917–1919.[CrossRef] [PubMed]
11. Cheng, S.H.; Ahlroth, S.; Onder, S.; Shyamsundar, P.; Garside, R.; Kristjanson, P.; McKinnon, M.C.; Miller, D.C.What is the evidence for the contribution of forests to poverty alleviation? A systematic map protocol.Environ. Evid. 2017, 6, 10. [CrossRef]
12. MacGregor-Fors, I.; Escobar, F.; Rueda-Hernández, R.; Avendaño-Reyes, S.; Baena, M.; Bandala, V.;Chacón-Zapata, S.; Guillén-Servent, A.; González-García, F.; Lorea-Hernández, F.; et al. City “Green”Contributions: The Role of Urban Greenspaces as Reservoirs for Biodiversity. Forests 2016, 7, 146. [CrossRef]
13. Pimentel, D.; Wilson, C.; McCullum, C.; Huang, R.; Dwen, P.; Flack, J.; Tran, Q.; Saltman, T.; Cliff, B. Economicand Environmental Benefits of Biodiversity. BioScience 1997, 47, 747–757. [CrossRef]
14. Song, B.; Zhong, Y.; Deng, W.; Shen, Y.; Li, J.; Lin, M. Resouces of wild macrofungi and prospects of theirexploitation in Guangdong China. J. Microbiol. 2007, 27, 59–63. (In Chinese)
15. Ye, H.; Xing, F. Checklist of Guangdong Plants; World Publishing Guangdong Corporation: Guangzhou,China, 2005.
16. Fan, S.; Brzeska, J. Sustainable food security and nutrition: Demystifying conventional beliefs. Glob. FoodSecur. 2016, 11, 11–16. [CrossRef]
17. Golden, C.D.; Fernald, L.C.H.; Brashares, J.S.; Rasolofoniaina, B.J.R.; Kremen, C. Benefits of wildlifeconsumption to child nutrition in a biodiversity hotspot. Proc. Natl. Acad. Sci. USA 2011, 108, 19653–19656.[CrossRef] [PubMed]
18. Angelsen, A.; Jagger, P.; Babigumira, R.; Belcher, B.; Hogarth, N.J.; Bauch, S.; Börner, J.; Smith-Hall, C.;Wunder, S. Environmental Income and Rural Livelihoods: A Global-Comparative Analysis. World Dev.2014, 64, S12–S28. [CrossRef]
19. Russo, A.; Escobedo, F.J.; Cirella, G.T.; Zerbe, S. Edible green infrastructure: An approach and review ofprovisioning ecosystem services and disservices in urban environments. Agric. Ecosyst. Environ. 2017, 242,53–66. [CrossRef]
20. Wang, Z.H.; Zhai, F.Y.; Du, S.F.; Popkin, B. Dynamic shifts in Chinese eating behaviors. Asia Pac. J. Clin. Nutr.2008, 17, 123–130. [PubMed]
21. Kirkpatrick, J.B.; Davison, A. Home-grown: Gardens, practices and motivations in urban domestic vegetableproduction. Landsc. Urban Plan. 2018, 170, 24–33. [CrossRef]
22. Zhou, L.; Yang, Z.; Wen, H.; Bau, T.; Li, T. A revised checklist of edible fungi in China. Mycosystema 2010, 29,1–21. (In Chinese)
23. Charnley, S.; Poe, M.R. Community Forestry in Theory and Practice: Where Are We Now?Annu. Rev. Anthropol. 2007, 36, 301–336. [CrossRef]
24. Pereira, H.M. A latitudinal gradient for genetic diversity. Science 2016, 353, 1494–1495. [CrossRef] [PubMed]25. Harlan, J.R. Our Vanishing Genetic Resources. Science 1975, 188, 618–621. [CrossRef] [PubMed]26. Swenson, N.G.; Erickson, D.L.; Mi, X.; Bourg, N.A.; Forero-Montana, J.; Ge, X.; Howe, R.; Lake, J.K.; Liu, X.;
Ma, K.; et al. Phylogenetic and Functional Alpha and Beta Diversity in Temperate and Tropical TreeCommunities. Ecology 2012, 93, S112–S125. [CrossRef]
27. Lahaye, R.; van der Bank, M.; Bogarin, D.; Warner, J.; Pupulin, F.; Gigot, G.; Maurin, O.; Duthoit, S.;Barraclough, T.G.; Savolainen, V. DNA barcoding the floras of biodiversity hotspots. Proc. Natl. Acad.Sci. USA 2008, 105, 2923–2928. [CrossRef] [PubMed]
28. Janzen, D.H.; Burns, J.M.; Cong, Q.; Hallwachs, W.; Dapkey, T.; Manjunath, R.; Hajibabaei, M.; Hebert, P.D.N.;Grishin, N.V. Nuclear genomes distinguish cryptic species suggested by their DNA barcodes and ecology.Proc. Natl. Acad. Sci. USA 2017, 114, 8313–8318. [CrossRef] [PubMed]
29. Ashley, R.; Russell, D.; Swallow, B. The Policy Terrain in Protected Area Landscapes: Challenges forAgroforestry in Integrated Landscape Conservation. Biodivers. Conserv. 2006, 15, 663–689. [CrossRef]
30. Livesley, S.J.; McPherson, E.G.; Calfapietra, C. The Urban Forest and Ecosystem Services: Impacts on UrbanWater, Heat, and Pollution Cycles at the Tree, Street, and City Scale. J. Environ. Qual. 2016, 45, 119–124.[CrossRef] [PubMed]
151

Forests 2018, 9, 666
31. DeFries, R.S.; Rudel, T.; Uriarte, M.; Hansen, M. Deforestation driven by urban population growth andagricultural trade in the twenty-first century. Nat. Geosci. 2010, 3, 178. [CrossRef]
32. Edwards, D.P.; Magrach, A.; Woodcock, P.; Ji, Y.; Lim, N.T.L.; Edwards, F.A.; Larsen, T.H.; Hsu, W.W.;Benedick, S.; Khen, C.V.; et al. Selective-logging and oil palm: Multitaxon impacts, biodiversity indicators,and trade-offs for conservation planning. Ecol. Appl. 2014, 24, 2029–2049. [CrossRef] [PubMed]
33. Laurance, W.F.; Carolina Useche, D.; Rendeiro, J.; Kalka, M.; Bradshaw, C.J.A.; Sloan, S.P.; Laurance, S.G.;Campbell, M.; Abernethy, K.; Alvarez, P.; et al. Averting biodiversity collapse in tropical forest protectedareas. Nature 2012, 489, 290–294. [CrossRef] [PubMed]
34. Lindenmayer, D.B.; Laurance, W.F. The ecology, distribution, conservation and management of large oldtrees. Biol. Rev. 2017, 92, 1434–1458. [CrossRef] [PubMed]
35. Persha, L.; Agrawal, A.; Chhatre, A. Social and Ecological Synergy: Local Rulemaking, Forest Livelihoods,and Biodiversity Conservation. Science 2011, 331, 1606–1608. [CrossRef] [PubMed]
36. Chen, Y.-S.; Deng, T.; Zhou, Z.; Sun, H. Is the East Asian flora ancient or not? Natl. Sci. Rev. 2018, in press.[CrossRef]
37. Myers, N.; Mittermeier, R.A.; Mittermeier, C.G.; Fonseca, G.A.B.D.; Kent, J. Biodiversity hotspots forconservation priorities. Nature 2000, 403, 853–858. [CrossRef] [PubMed]
38. Saha, M.; Eckelman, M.J. Growing fresh fruits and vegetables in an urban landscape: A geospatial assessmentof ground level and rooftop urban agriculture potential in Boston, USA. Landsc. Urban Plan. 2017, 165,130–141. [CrossRef]
39. Dieleman, H. Urban agriculture in Mexico City; balancing between ecological, economic, social and symbolicvalue. J. Clean. Prod. 2017, 163, S156–S163. [CrossRef]
40. Camps-Calvet, M.; Langemeyer, J.; Calvet-Mir, L.; Gómez-Baggethun, E. Ecosystem services provided byurban gardens in Barcelona, Spain: Insights for policy and planning. Environ. Sci. Policy 2016, 62, 14–23.[CrossRef]
41. Guarrera, P.M.; Savo, V. Wild food plants used in traditional vegetable mixtures in Italy. J. Ethnopharmacol.2016, 185, 202–234. [CrossRef] [PubMed]
42. Lindenmayer, D.B.; Franklin, J.F.; Lõhmus, A.; Baker, S.C.; Bauhus, J.; Beese, W.; Brodie, A.; Kiehl, B.; Kouki, J.;Pastur, G.M.; et al. A major shift to the retention approach for forestry can help resolve some global forestsustainability issues. Conserv. Lett. 2012, 5, 421–431. [CrossRef]
43. Ladha, J.K.; Tirol-Padre, A.; Reddy, C.K.; Cassman, K.G.; Verma, S.; Powlson, D.S.; van Kessel, C.;de B. Richter, D.; Chakraborty, D.; Pathak, H. Global nitrogen budgets in cereals: A 50-year assessmentfor maize, rice, and wheat production systems. Sci. Rep. 2016, 6, 19355. [CrossRef] [PubMed]
44. Lyu, Y.; Tang, H.; Li, H.; Zhang, F.; Rengel, Z.; Whalley, W.R.; Shen, J. Major Crop Species ShowDifferential Balance between Root Morphological and Physiological Responses to Variable PhosphorusSupply. Front. Plant Sci. 2016, 7, 1939. [CrossRef] [PubMed]
45. Wunder, S.; Angelsen, A.; Belcher, B. Forests, Livelihoods, and Conservation: Broadening the Empirical Base.World Dev. 2014, 64, S1–S11. [CrossRef]
46. Zhang, W.; Li, T.; Song, B. A survey on the macrofungi in Guangdong province. Ecol. Sci. 2001, 20, 48–58.47. Zhuo, L.; Wang, L.; Chen, Q.; Liu, W. Wild fruit resources and exploitation in Xiaoxing’an Mountains. J. For.
Res. 1999, 10, 31–33.48. Sunderlin, W.D.; Angelsen, A.; Wunder, S. Forests and poverty alleviation. In State of the World’s Forests;
Center for International Forestry Research: Bogor Barat, Indonesia, 2003; pp. 61–73.49. Chhatre, A.; Agrawal, A. Trade-offs and synergies between carbon storage and livelihood benefits from
forest commons. Proc. Natl. Acad. Sci. USA 2009, 106, 17667–17670. [CrossRef] [PubMed]50. Yen, A.L. Edible insects: Traditional knowledge or western phobia? Entomol. Res. 2009, 39, 289–298.
[CrossRef]51. Lee, T.M.; Sigouin, A.; Pinedo-Vasquez, M.; Nasi, R. The Harvest of Wildlife for Bushmeat and Traditional
Medicine in East, South and Southeast Asia: Current Knowledge Base, Challenges, Opportunities and Areas forFuture Research; CIFOR: Bogor, Indonesia, 2014; Volume 115.
© 2018 by the authors. Licensee MDPI, Basel, Switzerland. This article is an open accessarticle distributed under the terms and conditions of the Creative Commons Attribution(CC BY) license (http://creativecommons.org/licenses/by/4.0/).
152

Article
Heterodichogamy, Pollen Viability, and Seed Set in aPopulation of Polyploidy Cyclocarya Paliurus (Batal)Iljinskaja (Juglandaceae)
Xia Mao, Xiang-Xiang Fu *, Peng Huang, Xiao-Ling Chen and Yin-Quan Qu
Co-Innovation Centre for Sustainable Forestry in Southern China, College of Forestry, Nanjing ForestryUniversity, Nanjing 210037, China; [email protected] (X.M.); [email protected] (P.H.);[email protected] (X.-L.C.); [email protected] (Y.-Q.Q.)* Correspondence: [email protected]; Tel.: +86-025-85427403; Fax: +86-025-85427402
Received: 21 February 2019; Accepted: 17 April 2019; Published: 19 April 2019
Abstract: Research Highlights: Cyclocarya paliurus, native to the subtropical region of China, is amonoecious species with a heterodichogamous mating system. Its flowering phenology and low seedsuccess characteristics differ from other typical heterodichogamous Juglandaceae species. This couldbe caused by the existence of polyploidy in the population. Background and Objectives: C. paliurushas been attracting more attention as a result of its medicinal value. To meet the needs for leafharvest, cultivation expansion is required, but this is limited by a shortage of seeds. This study aimsto profile the flowering phenology and the efficacy of pollen dispersal as well as elucidate on themechanism of low seed success in the population. Materials and Methods: The flowering phenologypattern of C. paliurus was observed in a juvenile plantation containing 835 individuals of 53 familiesfrom 8 provenances at the individual (protandry, PA and protogyny, PG) and population levels for 5consecutive years (2014–2018). Slides with a culture medium of 10% sucrose and 0.01% boric acidwere used to estimate pollen density and viability in the population, and seeds were collected from20 randomly selected PA and PG individuals to assess seed success during 2017–2018. Results: Fourflowering phenotypes and strongly skewed ratios of PA/PG and male/female occurred in the juvenilepopulation. Sexual type and ratio changed significantly with the growth of the population overthe years, showing an increasing monoecious group (11.1% to 57.2%) and a decreasing unisexualgroup (33.6% to 16.3%), as well as a tendency for the sexual ratio to move towards equilibrium (5.42:1to 1.39:1 for PG:PA). Two flowering phases and bimodality in gender were displayed, as in otherheterodichogamous species. However, the high overlap of inter-phases and within individuals wasquite different from many previous reports. Owing to the low pollen viability of C. paliurus (~30%),low seed success was monitored in the plantation, as well as in the investigated natural populations.Conclusions: Female-bias (PG and F) and a skewed ratio of mating types corresponded to nutrientaccumulation in the juvenile population. Heterodichogamy in C. paliurus was verified, but wasshown to be different from other documented species in Juglandaceae. The latest finding of majortetraploidy in a natural population could explain the characteristics of the flowering phenology andseed set of C. paliurus and also give rise to more questions to be answered.
Keywords: protogyny (PG); protandry (PA); pollen viability; seed success; polyploidy
1. Introduction
Heterodichogamy, a transitional type from dichogamy to dioecy, is a polymorphic phonologicsexual system [1,2]. It is defined as two complementary morphs, protogyny (PG, female function beforemale) and protandry (PA, male function before male), that function synchronously and reciprocally toone another at a population level [3]. Generally, disassortative mating between two morphs, regarded
Forests 2019, 10, 347; doi:10.3390/f10040347 www.mdpi.com/journal/forests153

Forests 2019, 10, 347
as the main pattern for heterodichogamous species, promotes proficient inter-morph cross-pollination,avoids selfing, and reduces inbreeding of intra-morph through temporal separation of the maleand female functions in flowers [1,4]. To avoid frequency-dependent selection, the population hasevolved to have a 1:1 morph ratio [5]. Based on this equilibrium ratio, genetic theory suggests thatheterodichogamy was simply inherited with a single diallelic Mendelian locus [1], which has beenconfirmed in both Juglans and Carya genera from the Juglandaceae family [6,7].
Hitherto, plants with heterodichogamy have been documented in 13 families and 21 generaof flowering plants [8,9]. Heterodichogamy is particular found in Juglandaceae genera, includingJuglans, Carya, Peterocarya, Platycarya, and Cyclocarya [1,9,10]. Renner [1] reported that about halfof the heterodichogamous taxa are self-incompatible, but the Juglandaceae family is completelyself-compatible [6,7]. However, Bai [11] demonstrated that the mating system of J. mandshurica iscompletely out-crossing.
Walnut and pecan species are regarded as a group of economically useful plants whoseheterodichogamous features have gained extensive attention. This includes J. regia, J. mandshurica,J. ailanthifolia, J.nigra, J. hindsii, J. cinerea, and J. cordiformis in Juglans; C. illinoensis, C. ovata, C. tomentosa,and C. laciniosa in Carya; and some inter-specific hybrids in this family [7,8]. Different from nut-and/or timber-use juglandaceous plants, C. paliurus is important for its leaf-use value. In the past twodecades, an extraordinary amount of progress has been made in determining the medicinal functionsof this species. Publications have mostly stressed the actions of bioactive components, includingcyclocariosides, cyclocaric acids, flavonoids, and steroids. These leaf metabolites have been verified toexert important medicinal and health functions on conditions such as hypoglycemia, hypolipidemia,and diabetes mellitus, as well as carrying out antioxidant activities [12–16]. However, leaf resourcesonly from natural stands limited its wide applications. Therefore, the cultivation of C. paliurus withimproved accumulation of bioactive metabolites for leaf harvest is concerned [17,18]. To date, sexualrather than vegetative propagation has been successful for extensive cultivation. Importantly, therelease of deep seed dormancy has greatly driven the development of plantations [19]. However, seedshortages resulting from low plumpness is now the main issue for large-scale plantations. Therefore, thefollowing questions need to be answered: Why does such a low seed plumpness occur in populationsof C. paliurus? Is this affected by genetic heterodichogamy or yearly changing climatic factors? Is theflowering phenology in C. paliurus similar to that of other recorded heterodichogamous Juglandaceaespecies? Therefore, the aims of this study are the following: (1) To profile the flowering patterns ofthe two mating types of C. paliurus (PA and PG) and the population as a whole using consecutive5-year observations on the juvenile plantation; (2) to monitor the density and viability of pollen at thepopulation level during the flowering season; (3) to analyze and hypothesize the reasons for the lowseed success in the population using the chromosomal ploidy level of C. paliurus.
2. Materials and Methods
2.1. Study Species
Cyclocarya paliurus, a species of monotypic genus in Juglandaceae, is endemic in subtropical regionof China (from 24◦16′12′′ N to 33◦22′12′′ N and from 103◦28′12′′ E to 119◦22′48′′ E). Often, smallpopulations (<25 individuals) grow in moist valleys in mountain regions at an altitude of 390–1836 m,and mature trees reach a height of 10–30 (40) m because of their heliophilous characteristic [20].
A single female inflorescence of C. paliurus is found at the apex of the growing shoot (Figure 1A);rarely, a single male instead of a female inflorescence is observed at this position (Figure 1C). A clustercontaining 2–4 catkins is found at the lateral short branch (Figure 1A). Besides unisexual inflorescences,a small number of female inflorescences mixed with male flower(s) are observed in some individualsat certain years (Figure 1D). However, similar to maples, the male flowers in female inflorescence areabortive [21]. Previous studies revealed that C. paliurus is a typically heterodichogamous species thatundergoes wind-pollination [10,22].
154

Forests 2019, 10, 347
A B
C D Figure 1. Expressions of male and female inflorescences in Cyclocarya paliurus. (A) Male and femaleinflorescences of the protogyny (PG) type. The female flowers are mature, while the male flowers arestill enclosed. (B) Protandry (PA) inflorescences at the elongation stage, showing the developmentaldifferences between the two sexual inflorescences. Abnormal inflorescences include (C) a single maleinstead of a female inflorescence at the apex of growing shoot and (D) a female inflorescence mixedwith a male flower.
2.2. Plantation of C. paliurus
A plantation of C. paliurus used in this study is located on Hongya Mountain and in Chuzhou Cityand Anhui Province, China (32◦21′ N, 117◦58′ E), where the climate is classified as northern subtropicalhumid monsoon, with an annual mean temperature of 15.5 ◦C, an annual rainfall of 1038 mm, and afrost-free period of 210 days. The site is dominated by a gravel mountain with a slight slope (5◦–6◦).
The plantation was established in 2008, containing 835 individuals of 53 families from 8 provenances(Lushan, Jiangxi; Hefeng Hubei; Shucheng, Anhui; Jianhe, Guizhou). The plant spacing was 3 m × 4 m,and the stand was not closed until 2018. A small number of flowering plants (mostly only one sexualinflorescence occurred) were observed in 2012; subsequently, an increasing number of plants exhibitedsexual polymorphism.
2.3. Investigation of Flowering Phenology
Phenological monitoring was performed for a 5-year consecutive period (2014–2018), andobservations were recorded from 2015, when at least one sexual flower (male/female) occurredin 3/8 individuals in the population. Characteristics recorded included flowering phenotype, flowering
155

Forests 2019, 10, 347
progress, and sex expression for all individuals. We also observed whether the flowering phenotypeinvolved flowering or not, as well as the dates of onset, duration, and termination for male and femaleflowering each year.
The female flowering period was determined by two feathery stigmas with an angle of 120◦ andthe change of the stigma color from green to brown (withering); the period of male flowering wasfrom pollen shedding to shedding completion. The full-bloom stage for the population was defined as50%–75% of flowers being in each flowering phase for monoecious individuals. Observations weremade on male and female inflorescences tagged in the middle section of each plant.
2.4. Pollen Dispersal
To monitor the density and viability of pollen within the flowering season, pollen was collectedfrom 5 trapping sites on stocks at a height of 1.5 m along a line of “S” in the stand. Six slides coveredwith a culture medium of 10% sucrose and 0.01% boric acid were placed on each stock. Three slidescollected every two days, each for 24 h, were used for pollen density counting, while the remaining 3slides were collected from 9:00–11:00 (when the highest pollen viability is observed) each day (except forrainy days) during flowering duration and used for pollen viability testing.
The slides were examined by (1) counting the number of pollen grains adhering to the surface ofthe culture medium under a microscope at ×50 magnification, and (2) culturing pollen in an incubatorat 25 ◦C for 8 h. The pollen grain was considered viable when the pollen tube grew to the length ofitself. The mean and standard error of the pollen density and viability were calculated over ten visualfields for each side.
2.5. Seed Collection
Respectively, 20 PA and 20 PG plants were randomly selected in 2017 and 2018, a total of 300–500seeds were collected from the middle of each selected tree. Seed plumpness was judged by cuttingseed along the hilum linear direction.
Values of pollen density and viability and seed plumpness are presented as mean ± SE, and anANOVA analysis was conducted to determine differences among years and between mating typesusing SAS 18.1.
3. Results
3.1. Sex Expression of the Juvenile Population
As reported in the previous document, the flowering season of C. paliurus lasted about one month,from mid-April to the end of May. Two separated flowering phases occurred in the population: oneduring late-April to mid-May, while the other happened across all of May.
3.1.1. Sexual Diversity
A total of five phenotypes from three groups were recognized for individuals in the population:The monoecious group (MO) containing individuals with both male and female inflorescences,including protogyny (PG) and protandry (PA); the unisexual group (UN) including individuals withonly one sexual inflorescence, either male (M) or female (F); and unflowering trees (UF). MO and UNwere both classified as flowering plants (FP).
3.1.2. Expression Features of Various Flowering Phenotypes
In a natural population, initial flowering usually occurs at the age of 10–15 years. However, theonset of flowering in a plantation is significantly earlier than in a natural population. In the 5-year-oldplantation (in 2013), the F type was predominant among FP plants, up to 75.7% and 53.8% in 2014 and2015, respectively; the second most dominant type was the PG type. Comparatively, few plants wereof the PA type, and this minority was assigned to the M type (Table 1).
156

Forests 2019, 10, 347
Table 1. Annual expression of various flowering phenotypes in the juvenile plantation of C. paliurus.
Flowering Group (FP) Mating TypeObserved Year
2014 2015 2016 2017 2018
Monoecious group (MO)
number of PA 12 40 127 151 185number of PG 65 86 173 200 257
PA:PG 5.42:1 2.15:1 1.36:1 1.32:1 1.39:1PG/MO (%) 84.4 68.3 57.7 57.0 58.1PG/FP (%) 18.8 28.8 37.5 37.0 45.2MO/T (%) 11.1 15.8 38.4 45.1 57.2
Unisexual group (UN)
number of F 262 161 147 169 98number of M 7 12 14 20 28
F:M 37.4:1 13.4:1 10.5:1 8.5:1 3.5:1F/UN (%) 97.4 93.1 91.3 89.4 77.8F/FP (%) 75.7 53.8 39.0 31.3 17.3
UN/T (%) 33.6 21.6 20.6 24.3 16.3FP/T (%) 43.2 37.4 59.0 69.4 73.5
Total plants in the population (T) * 801 800 781 778 773
* Data changed annually because of the death of individuals. PA: protandry, PG: protogyny; MO: monoeciousgroup, FP: flowering plants, UN: Unisexual group; F: females, M: males; T: total individuals in population.
With the growth of the population, more individuals flowered. The FP/T showed a tendency toincrease, from 43.2% in 2014 to 73.5% in 2018 (Table 1). More significantly, the promotion of MO/Tincreased rapidly from 11.1% (in 2014) to 57.2% (in 2018), whereas there was a descent in UN/T, from33.6% (2014) to 16.3% (2018).
This data suggests that the ages of 6–10 years (defined as the juvenile population) could beregarded as the transitional stage towards maturation for C. paliurus.
3.1.3. Changing Patterns of Mating Types across Years
Although there was a tendency for the number of flowering individuals to increase (Table 1), thechanging trends were divergent for various flowering phenotypes (Figure 2). In 2016, there were rapidincrements of PA and PG morphs, accompanied by a rapid decrease in individuals of the F type. Of thefour flowering phenotypes, similar increasing tendencies were observed in PA and PG types, but theproportion of PA was always less than that of PG. In addition, only a slight increment was observed inthe M type, rising from 0.9% to 3.2%. On the contrary, the proportion of F type individuals droppedsignificantly from 32.71% to 12.68% across the five-year period (Figure 2).
Meanwhile, strongly skewed ratios of mating types, namely, PG/PA or F/M, always existed inthe juvenile population (Table 1). Significantly, the ratio of PA/PG fell obviously from 5.42:1 in 2014to 1.39:1 in 2018. Further the F/M ratio fell from 37.43:1 in 2014 to 3.5:1 in 2018. An X2 test indicatedthe protogynous-biased ratio in the population during 2014 to 2018 (PG/PA: 65/12, x2 = 36.5, d.f = 1,p < 0.01 in 2014; 86/40, x2 = 16.8, d.f = 1, p < 0.01 in 2015; 173/127, x2 = 7.2, d.f = 1, p < 0.01 in 2016;200/151, x2 = 7.7, d.f = 1, p < 0.01 in 2017; and 257/185, x2 = 11.7, d.f = 1, p < 0.01 in 2018) significantlydeviated from the equilibrium ratio of 1:1, but showed a tendency towards relative equilibrium.
157

Forests 2019, 10, 347
PA PG F M
Figure 2. Changing trends of flowering phenotypes with the growth of the C. paliurus population.*Number of each flowering phenotypes/total plants in the population. F: females, M: males.
3.1.4. Reciprocal Transitions between Mating Types
Owing to the immaturity of the juvenile population, plants were sensitive to nutrient shortage andunstable environmental factors. Therefore, reciprocal transitions among five phenotypes happenedfrequently between adjacent years (Table 2). As a whole, with the growth of population, the ratioof transition from UF to FP showed a decreasing trend from 68.8% to 51.2%, whereas there was anopposite tendency for the transition from UN to MO (Table 2).
It seems that F and PG types played the core roles for all transitions. As shown in Table 2,reciprocal transitions happened more often between UF↔F, UF↔/PG, and F↔PG/PA, and scarcelybetween M↔F and PA↔PG. Remarkably, observed transitions between PA and PG were usuallyambiguous and mainly happened in individuals with a high overlap of male and female flowering(Figure 3).
Table 2. Transitions between flowering phenotypes in the juvenile plantation of C. paliurus.
Transition PatternNumber of Transitions between Phenotypes/Total Number of Transitions (%)
2014–2015 2015–2016 2016–2017 2017–2018
UF↔FP
UF→F, F→UF 53/20.2, 101/38.4 91/30.3, 3/1.0 85/31.7, 30/11.2 38/13.3, 32/11.2UF→M,M→UF 5/1.9, 4/1.5 9/3.0, – 3/1.1, 4/1.5 5/1.8, 2/0.7
UF→PG,PG→UF 6/2.3, 8/3.0 42/14.0, – 15/5.6, 3/1.1 24/8.4, 10/3.5
UF→PA,PA→UF 3/1.1, 1/0.4 38/12.7, – 11/4.1, 4/1.5 23/8.1, 12/4.2
Subtotal of UF 181/68.8 183/61.0 155/57.8 146/51.2
UN↔MO
F→PG, PG→F 36/13.7, 8/3.0 46/15.3, 5/1.7 36/13.4, 14/5.2 48/16.8, 2/0.7F→PA, PA→F 28/10.6, 4/1.5 43/14.3, 5/1.7 18/6.7, 18/6.7 39/13.7, 10/3.5
M→PG,PG→M 2/0.8, 2/0.8 4/1.3, 2/0.7 9/3.4, 3/1.1 3/1.1, 11/3.9
M→PA, PA→M –, – 8/2.7, 1/0.3 7/2.6, 1/0.4 6/2.1, 2/0.7subtotal 80/30.1 114/38.0 106/39.6 121/42.5
MO↔MO PG→PA,PA→PG –, – 1/0.3 –, – 5/1.8, 3/1.1
UN↔UN F→M, M→F 1/0.4, 1/0.4 2/0.7, – 5/1.7, 2/0.7 9/3.2, 1/0.4total 263 300 268 285
158

Forests 2019, 10, 347
3.2. Flowering Phenology of PG and PA Types across Years
Over the five-year period, 21 PA and 30 PG plants were screened via consecutive observations.As shown in Figure 3, for all marked individuals, a longer flowering duration was observed in femalesthan in males; phenology also coincided with the sequence of flowering expression, but differed interms of the separation of male and female functions across years. Such labile phenological characterscould be mainly affected by environmental factors (e.g., temperature, rain, and wind).
Within each PA individual, the separation between two sexual functions gradually shortened andtended to overlap over the years. In 2015, separation occurred in 17 PA trees; however, it only occurredin four trees in 2018. Although overlap was common within PG individuals, it varied across years. Thisis in accordance with the statistical data for all monoecious plants, which displayed more overlap inthe PG type (50%–90%) than in the PA type (14.3%–47.6%). Therefore, the potential mating probabilitywithin PA/PG individuals seems to be dependent on the overlap degree of two sexual functions.
2015 2016
2017 2018 4/25 4/30 5/5 5/10 5/15 5/20
13579
111315171921232527293133353739414345474951
code
of i
ndiv
idua
l
4/29 5/4 5/9 5/14 5/19 5/24
4/27 5/2 5/7 5/12 5/17 5/22 5/2713579
111315171921232527293133353739414345474951
code
of i
ndiv
idua
l
4/25 4/30 5/5 5/10 5/15 5/20 5/25
Figure 3. Flowering phenology of males and females within individuals based on 21PA and 30PG treesof C. paliurus during 2015–2018.
3.3. Phenological Characteristics of the Population
PA and PG morphs are the two main types of heterodichogamous species. However, in thejuvenile population of C. paliurus, monoecious plants were not more than half of the total (57.2%)until 2018 (Table 1). Moreover, some monoecious plants could transfer to other phenotypes, such as For unflowering ones (Table 2). Here, all individuals of PA or PG morphs were clustered together todescribe the flowering characteristics of the population.
159

Forests 2019, 10, 347
Figure 4 illustrates that two incomplete separation flowering phases existed in the population.In the first phase, from 22–26 April to 12–18 May, PG females and PA males were in bloom, whileduring the second phase, from 28 April 28–1 May to 20–26 May, PG males and PA females were inbloom. Each phase lasted 20–25 days and the obvious overlap (7–10 days) of inter-phases varied acrossyears. Generally, the female flowering duration (>25% individuals in the population in bloom) for twomorphs was significantly longer than that of the males (one week).
Comparatively, the male flowering duration was shorter by 4–5 days in the first phase than inthe second one. In the first phase, the peak of male flowering was reached earlier than that of femaleflowering, which lowered the opportunity for inter-morph pollination. In contrast, the floweringpeaks of the complementary sexes were rather well synchronized in the second phase (Figure 4).This difference in inter-morph synchronism for each phase could result in higher seed success in PA(pollinated in the second phase) than in PG (pollinated in the first phase) and a lower chance for pollenfrom PA males than PG males as contributors to pollinate the PG females. In addition, the overlapof inter-phases mainly happened between PG males and PG females, increasing the intra-morphinbreeding probability (Figure 4).
4/27 5/1 5/5 5/9 5/13 5/17 5/21 5/25
2015
0
40
80
120
160
200
4/22 4/26 4/30 5/4 5/8 5/12 5/16 5/20
num
ber
of in
divi
dual
s
2016
4/26 5/1 5/6 5/11 5/16 5/21 5/26
2017
0
40
80
120
160
200
240
280
4/22 4/28 5/4 5/10 5/16 5/22
nom
ber o
f ind
ivid
uals
2018
Figure 4. Number dynamic patterns of PA and PG flowering individuals in the population of C. paliurusduring 2015–2018. The back lines describe the first flowering phase, while the blue lines describe thesecond phase. High overlap was obvious between the two phases and the two sexual functions withineach phase.
We found that the flowering expression of population was more complicated than the assembly ofPA/PG individuals. Separation of the two sexual functions mainly existed within individuals ratherthan in the population (Figures 3 and 4). Rather than selfing within individuals, inter-morph andintra-morph pollination were dominant at the population level.
160

Forests 2019, 10, 347
3.4. Pollen Dispersal Characteristics of the Population
A sufficient quantity and high viability of pollen guarantee for seed success. To illustrate theeffect of pollen on seed bearing, pollen density and viability during flowering in the population weresurveyed for three consecutive years.
Generally, pollen density displayed an obviously rising trend with the maturation of the population.In the first phase, the maximum pollen density in 2018 was up to 305 ± 56 grain/cm2, far above thatof 2016 (113 ± 19.7 grain/cm2) and 2017, in the second phase, a similar maximum was observed overthree years. The pollen density among inter-phases showed significant differences in 2016 and 2017but was similar in 2018. This indicates that pollen dispersal is affected not only by nutrient conditions,but also by annual climate change.
In addition, the pollen viability kept rising with the growth of the population, showing maximumsof 27.6% and 31.1% in 2018, higher than that of 16.4% and 28.6% in 2017 for the two flowering phases,respectively. Overall, the low pollen viability (30% or so) did not show a positive correlation withpollen density; moreover, irregular dynamics were monitored in the population over the three years(Table 3).
Table 3. Pollen density and viability during the flowering period in 2017 and 2018.
FloweringStage
Observation Date(Month/Date)
Pollen Density (Grain/cm2) Pollen Viability (%)
2017 2018 2017 2018
First stage
4/30 136 ± 25 305 ± 56 20.5 ± 3.9 18.3 ± 3.95/01 / 262 ± 31 16.4 ± 4.2 27.6 ± 6.55/03 178 ± 34 / 6.0 ± 3.2 11.0 ± 5.05/04 / 47 ± 12 / 6.5 ± 2.65/06 105 ± 12 / 13.9 ± 2.9 /
Second stage
5/08 151 ± 16 / 20.2 ± 6.8 26.4 ± 7.15/10 247 ± 33 281 ± 29 28.6 ± 4.7 31.1 ± 5.95/12 216 ± 26 / 20.0 ± 4.4 28.8 ± 3.45/14 128 ± 23 33 ± 7 20.3 ± 5.7 13.9 ± 4.35/16 23 ± 5 9 ± 4 5.6 ± 5.6 16.6 ± 12.65/18 12 ± 5 0 0 0
Note: data was listed as average ± SE; ‘/’ means no data offered because of rainfall; data in red was not from thesame day but instead was from the previous/next day to show the changing tendency.
4. Discussion
Usually, mature trees (flowering individuals) of C. paliurus are up to 10–30 (40) m tall, and bothmale and female inflorescences cover the outer crown above the canopy of the forest. It is difficult tofind natural populations of a sufficient size to monitor flowering phenology; thus, plantation could bea better option for phenological observation [20]. Plants in our plantation included 53 families fromeight provenances, representing the majority of the natural germplasm.
4.1. Sexual Polymorphism and Bias Associated with Nutrient Conditions and Climatic Factors
In natural populations, several heterodichogamous species (e.g., A. japonicum) were reported toinclude not only monoecious trees (PA/PG), but also unisexual trees (M/F) [23–25]. Similar findingswere also observed in the C. paliurus population. For the first time, we showed that the F type isoverwhelmingly superior in juvenile stands (2014), followed by the PG type. Opposite changingtrends—an increment in PG and a reduction in F type-were then monitored over 5 years. Meanwhile,the number of PA trees tended to increase, though this was at a slower rate than the PG trees (Figure 2).
Levy and Dean [26] pointed out that most woody plants can flower only when they reach acertain age or size; flowering expression can be linked to factors such as nutrient supply and adversity.A low nutrient supply may support the formation of female flowers for C. paliurus. Therefore, thefemale superiority (F/PG) could be associated with the nutrient conditions in the juvenile population.This hypothesis is supported by our previous findings that flowering expressions are significantly
161

Forests 2019, 10, 347
related to the plant size of C. paliurus [10]. Alternatively, adaptive interpretation considers thatfemale-bias favors the production of more seeds for species survival under adverse conditions, likenutrient shortage and changing climatic factors (dry, cold, etc.). However, more extensive studies forlonger periods need to be conducted to confirm this.
4.2. Morph Ratio and Transition
Generally, an equal morph ratio (PA:PG = 1:1) should occur in a heterodichogamous population,as shown in Juglans species, such as J. regia, J. ailanthifolia, and J. mandshurica, as well as in someAcer species (e.g., A. opalus and A. japonicum) (reviewed by Liu [8]). However, derivations from thisequilibrium have been found in some species (e.g., A. pseudoplatanus) [24] and under certain situations(e.g., small population or human disturbance, like intentional selection) [27]. Similarly, a distinctivebias was found in our study. We speculate that the “juvenile” population is the main reason for thisdeviation, and the change in the morph ratio (PG/PA) from 5.42:1 in 2014 to 1.39:1 in 2018 predicts astate of equilibrium in the mature population.
Labile sex expression was documented in some heterodichogamous trees across years, like inAcer pseudoplatanus [24,28]. It is reported that the sexual phenotype changed mainly from unisexual tothe monoecious type, with few or no changes between PA and PG [8,9]. We found that unisexualityis a temporary trait based on the reduction of the ratio of M and F types with the maturation of thestand (Table 2). Similar findings were reported in J. ailanthifolia and J. mandshurica [9,29]. Researchersbelieve that the unisexual trait (F and/or M) is an environmental and/or nutrient (young age) responsephenotype rather than a separate morph [9,24,25].
Morphs of PA and PG are expected to be stable according to the theory that sex morphs aregenetically determined [6,7], which has been demonstrated by some observations in J. regia andP. strobilacea. [9,29]. However, documents involving transitions between two morphs in C. ovata,C. tomentosa, and A. japonica have been published [24,25,30]. Such a transition in C. paliurus was alsorecorded in several individuals. On these plants, highly overlapping flowering durations of two sexualflowers led to the ambiguous judgment of mating type in 2018 (Figure 3). Thus, further observationneeds to be made to confirm such transitions.
4.3. Flowering Phenology of the Individual and Population
Heterodichogamous populations showed two flowering phases and bimodality in gender for twodistinct sexual morphs. This has been described in J. regia, J. hindii, J. ailanthifolia, and J. mandshurica,and Platycarya strobilacea [4,6,9,29,31]. Moreover, sufficiently long separation between individuals canavoid selfing but does not prevent intra-morph inbreeding [4]. Therefore, flowering separation andthe overlap of two sex inter-phases as well as within-phase and within-individual are the key factorsaffecting mating patterns. As described by numerous publications, both features are divergent amongheterodichogamous species, varying from complete separation to high overlap. In contrast to thepattern of no overlap within individuals and inter-phases in J. mandshurica [4] and a short period ofoverlap in the PG type of J. ailanthifolia [29], high overlap occurs extensively, not only inter-phasebut also intra-morph and within individuals in C. paliurus. High overlap within individuals andintra-morphs seems to favor selfing and inbreeding but is contrary to the mechanism of avoidingassortative mating for heterodichogamous plants [4,32].
Mating fitness also depends on the synchronism of each sexual flower-very early/or late individualswould suffer low reproductive success. Bai et al. [4] observed that female flowering peaks were earlierthan male peaks for two periods in J. mandshurica, and the PG morphs had a higher level of assortativemating than PA ones. We found that the flourish flowering period of the male preceded that of thefemale in the first stage, but the female flowering period covered the complete duration in the secondstage for four consecutive years (Figure 5), suggesting that a higher seed set could be more successfulin PA than in PG. This prediction was further supported by the result that seed plumpness in PA(22% ± 8.2%) was significantly higher than in PG (12% ± 6.8%) (p < 0.05).
162

Forests 2019, 10, 347
5/2 5/6 5/10 5/14 5/18 5/22
2015
2016
2017
2018
the second stage
flowering duration of PA flowering duration of PG
4/26 4/30 5/4 5/8 5/12
the first stage
flowering duration of PA flowering duration of PGmonth/date
year
Figure 5. Flourish flowering duration (>50% individuals of PA and PG in bloom) of two stages in thepopulation of C. paliurus.
4.4. Reasons for Low Seed Success in C. paliurus
Heterodichogamy is recognized as a key factor affecting seed production, and high fruit productionhas been reported in many species, such as J. regia and C. illinoinesis [33,34]. Strangely, seeds withlow plumpness of 10%–30%, and rarely 50%, were collected from natural populations of C. paliurusfor nearly ten years. The low seed success (0–30%) in our plantation during 2016–2018 was also inaccordance with the natural situation.
Low seed success in a small population can result from the bias of two mating types, like inA. pseudoplatanus [28]. Limited by the habitat of C. paliurus or by human disturbance, the size of morethan two-thirds of the natural populations investigated was less than 25 individuals [20]. This might beone of the reasons for the low seed set in the natural population; however, it cannot be the explanationfor our plantation. Furthermore, the overlap of the flowering phenology in C. paliurus seems toprovide a better chance of pollination, including crossing, inbreeding, and even selfing, and a high seedsuccess should be expected, according to the 100% rate of self-compatibility in Juglandaceae species [1].However, the investigated data did not support these speculations.
4.5. Polyploid C. Paliurus Relating to Characters of Flowering and Seed Success
Different from documented heterodichogamous species in Juglandaceae, observations over fiveyears demonstrated a high overlap between the two flowering phases and within individuals, lowpollen viability rather than pollen density in the population (Table 3), and low seed plumpness not onlyin the natural stands and plantation, but also in the control pollination (12%–38%, data unpublished).This infers that unknown reason(s) could be responsible for the previously mentioned phenomenon.
Unexpectedly, data based on a genomic survey found the existence of a tetraploid individual.Subsequently, by screening 1087 individuals collected in our germplasm from 42 provenances from13 provinces using a cell flow meter, we discovered that tetraploid plants occupied about 95%, anddiploid and triploid (uncertain) ones accounted for about 5%. In a word, diploid-tetraploid plantscoexist in a natural population. C. paliurus is the first species found to have both polyploidy andheterodichogamy characteristics.
Based on these findings, many differences observed in C. paliurus from other heterodichogamousspecies can be elucidated. The dominance of multi-allele rather than two-allele in polyploid C. paliuruscontrolled heterodichogamy might trigger the inter-phase overlap of flowering characteristics as wellas within individuals. As we know, low pollen viability from polyploidy [35] could result in low seedsuccess. However, based on the theory that heterodichogamy is simply inherited with a single diallelicMendelian locus in diploid species [1], it is unclear how heterodichogamy is determined in polyploidC. paliurus. Further, it is unknown how C. paliurus with its low seed success rate ensures its succession.Thus, further research should be done in C. paliurus to disclose these secrets.
163

Forests 2019, 10, 347
5. Conclusions
The female-bias (PG and F) and skewed ratio of mating types that occur in C. paliurus correspond tothe nutrient accumulation in the juvenile population. Heterodichogamy in C. paliurus was demonstrated,but with a substantial difference from other recorded species. Low seed success in the populationmainly results from low pollen viability. However, the latest finding of a polyploidy majority in thenatural population could explain the flowering phenology and seed set characteristics of C. paliurus,but also raises more questions that need to be answered.
Author Contributions: This work was designed, directed, and coordinated by X.-X.F., who provided technicalguidance for all aspects of the project and wrote the manuscript. X.M. was the principal investigator, contributedto the fieldwork and data analysis, performed the literature search, and helped with the writing of the manuscript.P.H. monitored the density and viability of pollens. X.-L.C. and Y.-Q.Q. assisted with the fieldwork and analysis ofpolyploidy for all individuals.
Funding: This research was funded by the National Natural Science Foundation of China (No. 31470637) andPriority Academic Programme Development of Jiangsu Higher Education Institutions, PAPD.
Acknowledgments: We also thank Jiaqiu Yuan, JingJing Liu, Qiang Lu, and Biqing Chen for help with fieldwork,and anonymous referees and the editor for valuable comments on the manuscript.
Conflicts of Interest: The authors declare no conflicts of interest.
References
1. Renner, S.S. How common is heterodichogamy? Trends Ecol. Evol 2002, 16, 595–597. [CrossRef]2. Barrett, S.C. The evolution of plant sexual diversity. Nat. Rev. Genet. 2002, 3, 274–284. [CrossRef] [PubMed]3. Webb, D.J.; Lloyd, D.G. The avoidance of interference between the presentation of pollen and stigmas in
angiosperms II. Herkogamy. N. Z. J. Bot. 1986, 24, 16. [CrossRef]4. Bai, W.N.; Zeng, Y.F.; Liao, W.J.; Zhang, D.Y. Flowering phenology and wind-pollination efficacy of
heterodichogamous Juglans mandshurica (Juglandaceae). Ann. Bot. 2006, 98, 397–402. [CrossRef] [PubMed]5. Clark, B.C.; Partridge, L.; Robertson, A. Frequency-Dependent Selection; Cambridge University Press: New
York, NY, USA, 1988.6. Gleeson, S.K. Heterodichogamy in walnuts: Inheritance and s ratios. Evolution 1982, 36, 892–902. [CrossRef]
[PubMed]7. Thompson, T.E.; Romberg, L.D. Inheritance of heterodichogamy in pecan. Heredity 1985, 76, 456–458.
[CrossRef]8. Liu, J.J.; Mao, X.; Li, X.C. A review on flowering mechanism in heterodichogamous plants. J. Nanjing For. Univ.
2016, 40, 147–154. (In Chinese) [CrossRef]9. Fukuhara, T.; Tokumaru, S. Inflorescence dimorphism, heterodichogamy and thrips pollination in Platycarya
strobilacea (Juglandaceae). Ann. Bot. 2014, 113, 467–476. [CrossRef]10. Mao, X.; Liu, J.J.; Li, X.C.; Qin, J.; Fu, X.X. Flowering biological characteristics and mating system in immature
plantations of heterodichogamous Cyclocarya paliurus. J. Nanjing For. Univ. 2016, 40, 47–55. (In Chinese)[CrossRef]
11. Bai, W.N.; Zeng, Y.F.; Zhang, D.Y. Mating patterns and pollen dispersal in a heterodichogamous tree, Juglansmandshurica (Juglandaceae). New Phytol. 2007, 176, 699–707. [CrossRef] [PubMed]
12. Shu, R.G.; Xu, C.R.; Li, L.N.; Zhi, L.Y. Cyclocariosides II and III: Two secodammarane triterpenoid saponinsfrom Cyclocarya paliurus. Planta Med. 1995, 61, 551–553. [CrossRef] [PubMed]
13. Xie, M.Y.; Wang, Y.X.; Wen, H.L.; Yi, X. Determination of flavonoid compounds and vitamins in the leaves ofCyclocarya paliurus (Batal.) Iljinsk. Food Sci. 2001, 22, 66–68. (In Chinese) [CrossRef]
14. Wu, Z.F.; Meng, F.C.; Jiang, C.H.; Zhao, M.G.; Shang, X.L.; Fang, S.Z.; Ye, W.C.; Zhang, Q.W.; Zhang, J.;Yin, Z.Q. Triterpenoids from Cyclocarya paliurus and their inhibitory effect on the secretion of apoliproteinB48 in Caco-2 cells. Phytochemistry 2017, 142, 76–84. [CrossRef]
15. Yang, H.M.; Yin, Z.Q.; Zhao, M.G.; Jiang, C.H.; Zhang, J.; Pan, K. Pentacyclic triterpenoids from Cyclocaryapaliurus and their antioxidant activities in FFA-induced HepG2 steatosis cells. Phytochemistry 2018, 151,119–127. [CrossRef] [PubMed]
164

Forests 2019, 10, 347
16. Liu, Y.; Wang, T.L.; Fang, S.Z.; Zhou, M.M.; Qin, J. Responses of morphology, gas Exchange, photochemicalactivity of photosystem II, and antioxidant balance in Cyclocarya paliurus to light spectra. Front. Plant Sci.2018, 23, 1042. [CrossRef] [PubMed]
17. Liu, Y.; Qian, C.Y.; Ding, S.H.; Shang, X.L.; Yang, W.X.; Fang, S.Z. Effect of light regime and provenance onleaf characteristics, growth and flavonoid accumulation in Cyclocarya paliurus (Batal) Iljinskaja coppices.Bot. Stud. 2016, 57, 28–41. [CrossRef]
18. Liu, Y.; Liu, Q.L.; Wang, T.L.; Fang, S.Z. Leaf nitrogen and phosphorus stoichiometry of Cyclocarya paliurusacross China. Forests 2018, 9, 771. [CrossRef]
19. Fang, S.Z.; Wang, J.Y.; Wei, Z.Y.; Zhu, Z.X. Methods to break seed dormancy in Cyclocarya paliurus (Batal).Iljinskaja. Sci. Hortic. 2006, 110, 305–309. [CrossRef]
20. Li, X.C.; Fu, X.X.; Shang, X.L.; Yang, W.X.; Fang, S.Z. Natural population structure and genetic differentiationfor heterodicogamous plant: Cyclocarya paliurus (Batal.) Iljinskaja (Juglandaceae). Tree Genet. Genomes 2017,13, 80. [CrossRef]
21. De Jong, P.C. Flowering and Sex Expression in Acer L.: A Biosystematic Study; Mededelingen Land BouwbogeSchool: Wageningen, The Netherlands, 1976; Volume 76, pp. 1094–1098.
22. Mao, X.; Li, X.C.; Liu, J.J.; Fu, X.X. Scanning electron microscope observation on pollen morphology of sixtree species in Juglandaceae. J. Plant Resour. Environ. 2016, 25, 104–106. (In Chinese) [CrossRef]
23. Dommée, B.; Bompar, J.L.; Denelle, N. Sexual tetra-morphism in Thymelaea hirsuta (Thymelaeaceae): Evidenceof the pathway from heterodichogamy to dioecy at the infra-specific level. Am. J. Bot. 1990, 77, 1449–1462.[CrossRef]
24. Asai, T. Dichogamy in Full Moon Maple (Acer japonicum Thunb.); Bulletin of the Hokkaido Forestry ResearchInstitute: Tokyo, Japan, 2000; Volume 37, pp. 27–40.
25. Sato, T. Phenology of sex expression and gender variation in a heterodichogamous maple, Acer japonicum.Ecology 2002, 83, 1226–1238. [CrossRef]
26. Levy, Y.Y.; Dean, C. The transition to flowering. Plant Cell 1998, 10, 1973–1990. [CrossRef] [PubMed]27. Pollegioni, P.; Olimpieri, I.; De Simoni, G.; Gras, M.; Malvolti, M. Barriers to interspecific hybridization
between Juglans nigra L. and J. regia L. species. Tree Genet. Genomes 2013, 9, 291–305. [CrossRef]28. Tal, O. Acer pseudoplatanus (Sapindaceae): Heterodichogamy and thrips pollination. Plant Syst. Evol. 2009,
278, 211–221. [CrossRef]29. Kimura, M.; Seiwa, K.; Suyama, Y.; Ueno, N. Flowering system of heterodichogamous Juglans ailanthifolia.
Plant Species Biol. 2003, 18, 75–84. [CrossRef]30. McCarthy, B.C.; Quinn, J.A. Reproductive ecology of system of two sympatric tree species. Am. J. Bot. 1990,
77, 261–273. [CrossRef]31. Knuth, P. Handbook of Flower Pollination; Clarendon Press: Oxford, UK, 1906.32. Darwin, C. The Different Forms of Flowers on Plants of the Same Species; John Murray: London, UK, 1877.33. Polito, V.S.; Pinney, K. The relationship between phenology of pistillate flower organogenesis and mode of
heterodichogamy in Juglans regia L. (Juglandaceae). Sex. Plant Reprod. 1997, 10, 36–39. [CrossRef]34. Zhang, R.; Peng, F.R.; Li, Y. Pecan production in China. Sci. Hortic. 2015, 197, 719–727. [CrossRef]35. Solis Neffa, V.G.; Fernández, A. Chromosome studies in Turnera (Turneraceae). Genet. Mol. Biol. 2000, 23,
925–930. [CrossRef]
© 2019 by the authors. Licensee MDPI, Basel, Switzerland. This article is an open accessarticle distributed under the terms and conditions of the Creative Commons Attribution(CC BY) license (http://creativecommons.org/licenses/by/4.0/).
165


Article
Pinus massoniana Introgression Hybrids DisplayDifferential Expression of Reproductive Genes
Jiaxing Mo 1,2, Jin Xu 1,2,*, Yuting Cao 1,2, Liwei Yang 1,2, Tongming Yin 1,2, Hui Hua 1,2,
Hui Zhao 1,2, Zhenhao Guo 1,2, Junjie Yang 1,2 and Jisen Shi 1,2
1 Co-Innovation Center for Sustainable Forestry in Southern China, Nanjing Forestry University,Nanjing 210037, China; [email protected] (J.M.); [email protected] (Y.C.);[email protected] (L.Y.); [email protected] (T.Y.); [email protected] (H.H.);[email protected] (H.Z.); [email protected] (Z.G.); [email protected] (J.Y.);[email protected] (J.S.)
2 College of Forestry, Nanjing Forestry University, Nanjing 210037, China* Correspondence: [email protected]; Tel.: +86-25-8542-7319
Received: 23 January 2019; Accepted: 28 February 2019; Published: 5 March 2019
Abstract: Pinus massoniana and P. hwangshanensis are two conifer species located in southern China,which are of both economic and ornamental value. Around the middle and lower reaches of theYangtze River, P. massoniana occurs mainly at altitudes below 700 m, while P. hwangshanensis can befound above 900 m. At altitudes where the distribution of both pines overlaps, a natural introgressionhybrid exists, which we will further refer to as the Z pine. This pine has a morphological characterthat shares attributes of both P. massoniana and P. hwangshanensis. However, compared to the othertwo pines, its reproductive structure, the pinecone, has an ultra-low ripening rate with seeds thatgerminate poorly. In this study, we aimed to find the reason for the impaired cone maturation bycomparing transcriptome libraries of P. massoniana and Z pine cones at seven successive growthstages. After sequencing and assembly, we obtained unigenes and then annotated them againstNCBI’s non-redundant nucleotide and protein sequences, Swiss-Prot, Clusters of OrthologousGroups, Gene Ontology and KEGG Orthology databases. Gene expression levels were estimatedand differentially expressed genes (DEGs) of the two pines were mined and analyzed. We foundthat several of them indeed relate to reproductive process. At every growth stage, these genes areexpressed at a higher level in P. massoniana than in the Z pine. These data provide insight intounderstanding which molecular mechanisms are altered between P. massoniana and the Z pine thatmight cause changes in the reproductive process.
Keywords: Pinus massoniana; introgression hybrid; RNA sequencing; DEGs; reproduction
1. Introduction
Gymnosperms have their own unique way of reproduction. Microspores grow into pollencarrying sperm cells, while megaspores develop into the megagametophyte. The archegonium formsduring development of the megagametophyte. Then, pollen enter ovule through micropyle, they movetowards the egg by way of extending a pollen tube, after which fertilization occurs. Finally, the embryois formed and develops into a gymnosperm seed.
Conifers possess a series of properties that makes exploring their molecular biology through agenomics approach challenging, such as a long life cycle, a reproductive process lasting months oreven years, a gigantic genome size and so forth [1,2]. We aimed to explore the molecular mechanismof conifer reproduction by generating transcriptome data through RNA-seq, of successive stages ofthe developing pinecone. RNA-seq technology has advanced to the stage where it is highly efficient,sensitive and accurate.
Forests 2019, 10, 230; doi:10.3390/f10030230 www.mdpi.com/journal/forests167

Forests 2019, 10, 230
By studying the expression dynamics of differentially expressed genes (DEGs) in pinecones,we sought to gain insight into the relevant genes that control the reproductive process of conifers.Previous empirical studies have suggested several genes linked to reproduction, such as DAL [3],MADS-box [4,5], MYB [6] and MSI [7] and so forth. However, studies of the determinants ofdevelopment and regulation of reproduction have concentrated on model angiosperm species sofar, while gymnosperms remain largely understudied.
We centered our studies around two types of conifers, naturally occurring in China. First,Pinus massoniana, also known as the masson pine, is an economically important conifer species. It ismainly distributed in various southern Chinese provinces, at altitudes below 700 m around the middleand lower reaches of the Yangtze River. It offers wood and pulp for manufacturing furniture and paperand also supplies natural resin, which can be further manufactured into ‘resin,’ a crucial product usedin the maintenance of instrument strings and as an ingredient in medicine. Furthermore, P. massonianafulfills a significant ecological role by replacing or compensating natural forest destruction due to itsfast growth and abundant biomass.
The second, Pinus hwangshanensis, primarily grows in southeastern China. It grows mostabundantly at an altitude above 900 m around the middle and lower reaches of the Yangtze River.Growing at a higher altitude limits its speed of growth, as well as accumulation of biomass and theresin compared to P. massoniana. P. hwangshanensis is often viewed as luxurious and graceful, making itan ideal ornamental tree.
Mountain Lushan (Figure 1a) is located within the distribution area of both conifer species.Its peak has an altitude of 1474 m and it supports both P. massoniana and P. hwangshanensis vegetation atthe afore mentioned altitudes. Where P. massoniana and P. hwangshanensis distribution overlaps,a natural introgression hybrid of both species occurs, sharing phenotypic characters of both itsparents (Figure 1b) [8,9]. Due to the hybrid not being named yet, we refer to it as the ‘Z pine’ inthis article. The Z pine has an extremely low germination and ripening rate compared to bothP. massoniana and P. hwangshanensis [10]. These characters could indicate that the Z pine displaysgenetic incompatibilities during fertilization and/or even embryonic development. What causes thisphenomenon is still unknown.
In this study, we collected seven successive development stages of open-pollinated conesP. massoniana and the Z pine, respectively. Then we characterized the transcriptome of these cones usingIllumina high-throughput sequencing technology and forty two cDNA libraries were constructed.A series of experiments was performed to mine candidate genes, focusing on differential expressionpatterns between these two species. Moreover, differentially expressed genes related to fertilizationand embryonic development were determined and analyzed in both taxa. This study could helpexplaining the defect of the Z pine of its unusual low ripening rate and germination rate, comparingto P. massoniana and may provide an approach to understanding difference between species and itsintrogressive hybrid at the transcriptome level.
168

Forests 2019, 10, 230
(a)
(b)
Figure 1. (a) Location of Mountain Lushan. Mt. Lushan lies in Jiujiang City, Jiangxi Province, China.The Great Han Yang Peak, the highest point of the mountain, is 1474 m high. The local climate ishumid, subtropical; (b) Schematic diagram of main distribution area of P. hwangshanensis, the Z pineand P. massoniana on Mt. Lushan.
2. Materials and Methods
2.1. Sample Collection
Differently staged, openly pollinated cones of P. massoniana and the Z pine were collected onMt. Lushan, Jiujiang, China (Table 1, Figure 2). Due to complex environment of forest land andwind-pollinated way of pine, sampled individuals (especially the Z pine) may possess different level of
169

Forests 2019, 10, 230
introgressive background. In order to minimize the different between them, we assigned five maternaltrees of each taxa (P. massoniana or the Z pine) in its sample plot. Experience tells us that P. massonianacarries out its pollination at around 10 April while the Z pine at around 20 April at sample plots.Aware of this condition, we conducted our first sample collection on 27 April (Table 1), when bothP. massoniana and the Z pine are already pollinated. The cones were packed with aluminum-foil shortlyafter collection and then immediately submerged in liquid nitrogen, after which they were stored in a−80 ◦C freezer until RNA extraction.
Table 1. Information on the geographical sites of sample collection of P. massoniana and the Z pine.
Species
Sample Code Location
Open Pollinated Cones of the1st Year
Open Pollinated Cones ofthe 2nd Year Longitude
(E)Latitude
(N)Altitude
(m)APR.27
MAY25
JUL.27
SEPT.25
APR.27
JUL.27
SEPT.25
P. massoniana MA MB MC MD ME MF MG 116.04 29.50 78
the Z pine ZA ZB ZC ZD ZE ZF ZG 115.98 29.54 730
Figure 2. Successively staged pine cones of P. massoniana (a) and the Z pine (c). Details of mature conesof MG (b) and ZG (d) stages are shown. The scale shields of P. massoniana are flat or slightly bulged,the transverse ridge is not very obvious, and the scale umbilical has no thorn. The scale shield of theZ pine is bulged, the transverse ridge is obvious, and the scale umbilical is thorny. Codenames forcollected cones are explained in Table 1. (Scale = 10 mm.).
2.2. RNA Extraction and Sequencing
We randomly collected three to six cones for RNA isolation of each sample code to make surethat these cones and their RNA could be representative. Cones were taken from the −80◦C freezerand briefly re-frozen in liquid nitrogen to further weaken tissue, cut into pieces, after which sectionscontaining ovules (or seeds) were collected and crushed. RNA was extracted from each sample usingthe Bioteke Plant RNA Extraction Kit (Beijing, China). Three replications of RNA were extracted foreach sample code. Purity and quality of the RNA samples was checked respectively by measuring260 nm/280 nm UV absorption values with a Nanodrop 2000 (Thermo Fisher Scientific, Waltham, MA,
170

Forests 2019, 10, 230
USA) and examining the RIN (RNA Integrity Number) with an Agilent 2100 Bioanalyzer (AgilentTechnologies, Santa Clara, CA, USA).
After RNA extraction, magnetic oligo (dT) beads were used to purify mRNA, which was thencollected using RNeasy RNA reagent. The mRNA was then cut into small fragments using the RNAFragment Reagent (Illumina, San Diego, CA, USA) and subsequently cleaned using an RNeasyRNA Cleaning Kit (Qiagen, Germany). First-strand cDNA was then synthesized using MMLVreverse transcriptase (Takara, Japan), while second-strand cDNA synthesis was performed usingDNA Polymerase I and RNase H. cDNA was finally sequenced on an Illumina Hiseq X Ten (Illumina,USA). The sequencing raw data were submitted to the NCBI Short Reads Archive (SRA) databaseunder the BioProject accession number PRJNA482692.
2.3. Data Processing and Assembly
The raw RNA-seq data was screened by removing adaptor and low quality sequences usingTrimmomatic [11]. Qualified reads were assembled into non-redundant transcripts by Trinity [12,13],using the following parameters: –min_contig_length 200 –min_kmer_cov 2 –min_glue 3 –seqType fq,other parameters use default settings. Contigs were assembled by Trinity, gathered and processedby TGICL [14], the parameters of TGICL are as follows: -l 40 -c 10 -v 25 -O -repeat_stringency 0.95-minmatch 35 -minscore 35. After which unigenes were collected.
2.4. Functional Annotation
Unigenes were generally annotated by aligning against SwissProt (Release-2016_07) [15],NCBI non-redundant protein sequences (Nr, Release-20160314), NCBI non-redundant nucleotidesequences (Nt, Release-20140514) [16], Kyoto Encyclopedia of Genes and Genomes (KEGG, Release59.3) [17,18], Cluster of Orthologous Groups of proteins (COG, Release-20090331) [19] and GeneOntology (GO) [20] databases, selecting the most likely annotations. Blast2GO (v2.5.0) [21] wasconducted as GO annotation tool against GO database (Release-201604) under default settings.Furthermore, analysis of GO function and KEGG pathways of differentially expressed geneswas performed.
2.5. Differentially Expressed Genes (DEGs) and Gene Expression Pattern Analysis
Calculation of unigene read counts was performed using RNA-Seq by Expectation-Maximization(RSEM) software [22]. RSEM results were transformed into FPKM [23] values (expected numberof Fragments Per Kilobase of transcript sequence per Millions base pairs sequenced), commonlyused for measuring gene expression levels. DESeq was used to determine differentially expressedgenes of different transcript libraries [24]. Differentially expressed genes were assigned based on athreshold value of FDR (false discovery rate) ≤ 0.001 and|log2Ratio| ≥ 2. Gene expression patterns ofP. massoniana and the Z pine were assembled by Short Time-series Expression Miner (STEM) [25].
2.6. Validation by Quantitative Real-Time PCR (qRT-PCR)
Quantitative real-time PCR was applied for validating differentially expressed genes detected byour RNA-seq analysis. Primers were designed using the NCBI Primer-Blast Tool [26] and synthesizedby Generay Biotech Co., Ltd. (Shanghai, China). cDNA samples for qRT-PCR were synthesized usingthe Vazyme HiScript II Q RT SuperMix for qPCR (Nanjing, China). qRT-PCR was carried out using anApplied Biosystems 7500 PCR cycler (Thermo Fisher Scientific Corporation, CA, USA) and VazymeChamQ SYBR qPCR Master Mix (Nanjing, China) as reaction reagent kit. Each sample was run intriplicate, with samples having a final volume of 20 μL: containing 10 μL of ChamQ SYBR qPCRMaster Mix (2×), 0.4 μL of each primer, 2 μL of cDNA and 7.2 μL of ddH2O. The reaction programwas according to standard product instructions. An Actin gene that was discovered from RNA-seqdata (Unigene69821_All) was utilized as reference gene. The qRT-PCR data was analyzed with the2−ΔΔCt method [27].
171

Forests 2019, 10, 230
3. Results
3.1. Illumina Sequencing and Assembly
A total of 160 Gb raw data was obtained. It has an average of 53 million reads per library.We evaluated the quality of the original and clean sequencing data of all samples. The Q30 value has arange of 88.49~92.33 % for the original sequencing data (Table S1) and a range of 91.75~94.31% for theclean data (Table S2), indicating that this data set is ready for further assembly. All transcripts that weobtained from the staged pine cones of our two conifer species were assembled into 93,291 unigenes(see Materials and methods for details, Table 2). About 39.88% of them exceeded 2 kb in length, while37.02% unigenes have a length from 1 kb to 2 kp and 23.1% were 100 bp to 1 kb (Figure S1). The averagelength of unigenes is 1987 nt, while N50 is 2494 nt.
Table 2. Number and length of unigenes.
Sample Total Number Total Length (nt) Mean Length (nt) N50
MA 77,051 89,621,989 1163 1875MB 75,111 86,567,730 1153 1838MC 85,801 96,687,090 1127 1833MD 78,553 88,590,120 1128 1834ME 78,223 87,067,948 1113 1813MF 76,159 84,583,542 1111 1800MG 100,035 87,128,148 871 1400ZA 68,015 80,547,061 1184 1893ZB 76,206 88,922,013 1167 1882ZC 81,570 90,787,807 1113 1824ZD 74,227 84,044,527 1132 1823ZE 66,146 76,428,873 1155 1833ZF 73,004 79,225,689 1085 1789ZG 85,392 86,084,303 1008 1708All 93,291 185,359,493 1987 1 2494 2
1,2 When all samples are assembled, they would express much higher abundance than single samples, therefore thedata of ‘All’ is usually higher than others.
3.2. Functional Annotation of P. massoniana and Z Pine Unigenes
The assembled unigenes were annotated against the SwissProt, NCBI non-redundant protein andnucleotide sequences (Nr and Nt), Kyoto Encyclopedia of Genes and Genomes (KEGG), Cluster ofOrthologous Groups of proteins (COG) and Gene Ontology (GO) databases. A total of 86,006 unigeneswere annotated in P. massoniana and the Z pine, of which 25,150 unigenes were annotated against allsix databases (Figure S2).
We were able to annotate most genes using the Nr database, using sequences from Picea sitchensisfor the bulk of the annotation (30,943), after which Amborella trichopoda (7055) and Indian lotus (4504)provided most annotations, suggesting that these sequenced species are most closely related toP. massoniana and the Z pine (Figure S3).
We then used data from the COG, GO and KEGG databases for unigene functional prediction.Using the COG database, 30,017 unigenes could be annotated and were classified into 24 functionalcategories. The ‘general function prediction only’ was the most abundant, followed by ‘transcription’and ‘replication, recombination and repair,’ ’function unknown’ and ‘signal transduction mechanisms’(Figure 3).
A total of 229,950 redundant unigenes (with 38,619 nonredundant unigenes) were annotated into56 sub-categories under three primary GO categories: biological process, cellular component andmolecular function (Figure 4). The top three sub-categories were metabolic process (23,854 unigenes),cellular process (22,439 unigenes) and catalytic activity (20,324 unigenes).
172

Forests 2019, 10, 230
The KEGG classification placed 41,931 unigenes into 5 pathway functional categories(Figure 5): organismal systems (5474 unigenes), metabolism (37,045 unigenes), genetic informationprocessing (9684 unigenes), environmental information processing (2871 unigenes) and cellularprocesses (1487 unigenes). The top three sub-categories out of a total of 18 were ‘global map,’‘environmental adaptation’ and ‘carbohydrate metabolism,’ which contains 14,748, 5350 and 4965unigenes, respectively.
Figure 3. COG functional classification of P. massoniana and the Z pine unigenes.
Figure 4. Gene ontology (GO) functional classification of P. massoniana and the Z pine unigenes.
173

Forests 2019, 10, 230
Figure 5. Histogram of the KEGG Pathway classification of P. massoniana and the Z pine unigenes.
3.3. Analysis of Expected Number of Fragments per Kilobase of Transcript Sequence per Million Base PairsSequenced (FPKM)
FPKM values were calculated using RSEM software. The general density distribution ofexpression quantity (Figure 6) was analyzed and showed that the average total of expressed mRNAsacross all unigenes of P. massoniana and the Z pine varies between species and stages.
(a) (b)
Figure 6. (a) General density distribution of P. massoniana and Z pine unigenes by FPKM analysis;(b) Pairwise comparison of general density distribution of same stage P. massoniana and Z pine unigenesby FPKM analysis, M: P. massoniana (red curve), Z: Z pine (green curve), A~G: the seven successivestages of pinecone development. X-axis: logarithm to base 10 of FPKM, y-axis: density of distribution.
3.4. GO Classification and KEGG Enrichment Assessment of Differentially Expressed Genes (DEGs) atSuccessive Pinecone Stages
We determined and compared the number of up- and down-regulated genes between the two pinespecies at the seven different developmental stages of the pine cones collected (Figure 7 and Figure S4).
174

Forests 2019, 10, 230
In comparison group A, C and G, more down-regulated genes were found than up-regulated ones,while in group B, D, E and F, there was more up-regulated genes than down-regulated ones (Figure 7).
Figure 7. Statistics of differentially expressed genes of same stages of two pines (FDR ≤ 0.001 and|log2Ratio| ≥ 2). Red indicates up-regulated genes while green indicates down-regulated genes.The first two bars show that compare to ZA, MA has more down-regulated genes than up-regulatedones, the rest can be read in this manner.
To gain more insight in differential regulation of genes related to the pinecone reproductiveprocess, we performed GO classification of all DEGs at every developmental stage (Figure S5).The number of differentially expressed unigenes classified in the ‘reproduction’ category under‘biological process’ at each stage is listed (Figure S6). Three groups displayed more up- thandown-regulated genes: ZA-MA, ZD-MD and ZF-MF. While the other four groups showed moredown- than up-regulated genes: ZB-MB, ZC-MC, ZE-ME and ZG-MG. The ZG-MG group contains101 down-regulated genes, almost double the number of up-regulated genes (51 genes).
We then determined whether specific cellular processes are differentially affected at each pineconestage by performing a KEGG pathway enrichment analysis (Figure S7).
3.5. Quantitative Real-Time PCR Validation
We randomly selected five unigenes for validation of the accuracy of our RNA-seq data set usingqRT-PCR. The following unigenes were randomly chosen: Unigene12135_All, Unigene31229_All,Unigene5965_All, Unigene69986_All and Unigene71003_All. We tested cDNA derived from foursamples: MA, ME, ZA, ZE, which were collected in different years from the two different species.Details of sequences and primers were list on Tables S3 and S4, respectively. Validation results shows areliable correlation between RNA-seq and qRT-PCR (Figure S8).
3.6. Temporal Gene Expression Profiles of P. massoniana and the Z Pine
We analyzed gene expression dynamics of all unigenes across pinecone developmental stagesfor both species and clustered these into 49 unique expression profiles. The eighteen most frequentlyoccurring profiles for each species are shown in Figure 8a. Within P. massoniana, the top five expressionprofile types are 16, 10, 31, 34 and 40, with respectively 8416, 7967, 5532, 3291 and 3092 genes showingthese expression dynamics. In the Z pine the most frequently occurring profiles are profile types 40,10, 27, 29 and 44, represented by 5610, 4336, 3441, 3371 and 3361 genes. P. massoniana and the Z pineshared fourteen profile types among their respective top 18 profiles (Figure 8a). In addition, we carried
175

Forests 2019, 10, 230
out a profile comparison between P. massoniana and the Z pine. Every single profile of P. massoniana islisted and similar ones of Z pine are placed on the right of it in Figure 8b.
(a)
(b)
Figure 8. (a) Eighteen expression patterns of P. massoniana (M) and the Z pine (Z) based on the highestnumber of genes having these particular patterns. The number on the upper left of each squareindicates profile type, the number on the lower left indicates the number of genes within each profile,the fold line shows the expression pattern, colored squares are significant profiles while white ones areinsignificant profiles; (b) All P. massoniana (M) patterns compare to its similar ones in the Z pine (Z).The most left column of each part is profiles of P. massoniana while their similar Z pine counterparts arelist on the right, significant profiles of M are marked profile numbers and colors.
3.7. Reproductive Genes Are Differentially Expressed between P. massoniana and the Z Pine
Next, we aimed to see whether genes related to reproduction might be differentially expressedbetween P. massoniana and the Z pine, potentially explaining the reproductive problems that the Z
176

Forests 2019, 10, 230
pine experiences. We looked for several DEGs involved in processes such as pollen development,pollen exine formation, pollen tube growth and development of the female gametophyte, endosperm,embryo and/or embryo sac according to recent reports (Table S5). Some of these genes showconsistently higher expression in P. massoniana than in the Z pine, including: ACA7 (Ca2+-ATPase),MPK4 (mitogen-activated protein kinase), QRT2 (polygalacturonase), TKPR1 (tetraketide alpha-pyronereductase 1), PI5K (phosphatidylinositol 4-phosphate 5-kinase), PMEs (pectin methylesterase),SEC6 (exocyst complex component 6), SEC15 (exocyst complex component 15), SWK2 (slow walker 2),PPR (pentatricopeptide repeat-containing protein), EMB (embryo), LEA (late embryogenesis abundantprotein), SERK (somatic embryogenesis receptor kinase), BLH (BEL1-like homeodomain protein)(Figure 9). Some genes relate to reproduction show a similar expression level in both pines, such as:SHT (spermidine hydroxycinnamoyl transferase), SEC5 (exocyst complex component 5), SEC8 (exocystcomplex component 8), EYE (embryo yellow), EDD1 (embryo defective development 1) and EDA(embryo sac development arrest).
Figure 9. Cont.
177

Forests 2019, 10, 230
Figure 9. Expression levels of DEGs related to the reproductive process at successive pineconedevelopmental stages of P. massoniana and the Z pine. Expression level values in this figure havebeen transformed to a log10(FPKM+1) value. (a) pollen development; (b) pollen exine formation; (c)pollen tube growth; (d) female gametophyte; (e) embryo development; (f) embryo sac.
ACA7 belongs to the auto-regulated Ca2+-ATPase family, which is exclusively detected indeveloping flowers of Arabidopsis and participates in the regulation of Ca2+ homeostasis [28]. MPK4plays an important role in plant growth, development and male fertility [29]. QRT2 is necessaryfor pollen grain separation and is also involved in pollen development [30]. TKPR1 takes partin a biosynthetic pathway leading to hydroxylated α-pyrone compounds [31]. SHT encodes anacyltransferase that conjugates spermidine to hydroxycinnamic acids, impacting the composition of theArabidopsis pollen wall [32,33]. NPG1 in Arabidopsis is specifically required for pollen germination [34]and not for pollen development [35]. A type B PI5K mediates Arabidopsis and Nicotiana pollen tubegrowth by regulating apical pectin secretion [36]. PMEs and its pro-region adjust cell wall dynamicsof growing pollen tubes in Nicotiana tabacum [37]. The exocyst contributes to the morphogenesisof polarized cells in many eukaryotes, for example, SEC8 facilitates the initiation and maintenanceof polarized growth of pollen tubes [38]. SWK2 has an essential role in the coordinated mitoticprogression of the female gametophyte in Arabidopsis [39]. Absence of CRINKLY4 could cause aninhibition of aleurone, which is in charge of differentiation normal progression over the endospermsurface development [40]. PPR is required for embryo and seed viability in Arabidopsis, its absenceleading to embryo abortion [41,42]. EYE controls golgi-localized proteins, that have an importantrole in cell and organ expansion [43]. EDD1 encodes plastid and mitochondria, functional absencemutation of EDD1 causes embryo lethality [44]. LEA and SERK play key roles during embryogenesisand SERK is essential for embryogenic competence [45,46]. Misexpression of BLH1 leads to a cell-fateswitch of synergid to egg cell in the Arabidopsis eostre mutant embryo sac [47].
178

Forests 2019, 10, 230
4. Discussion
4.1. Gymnosperm Gene Annotation Using Transcriptome Data
Transcriptome analysis based on RNA sequencing is an effective way to explore the hugegenomes of plants like gymnosperms. Several RNA sequencing studies related to gymnosperms havepreviously been reported [48–51]. Yet until now few studies have focused on the development of Pinusreproductive organs. In Pinus tabuliformis, unusual bisexual cones were found; here, the gene expressionpattern of MADS-box transcription factors, FT/TFL1-like and LFY/NDLY genes was compared betweenunisexual and bisexual cones [52]. In Pinus bungeana, 39.62 Gb of RNA sequencing data was analyzedfrom two kinds of sexual cones, obtaining 85,305 unigenes, 53,944 (63.23%) of which were annotated inpublic databases [53].
In this study, we collected a total of 160 Gb of RNA sequence data from P. massoniana and itsintrogression hybrid at seven different stages of pinecone development. N50 is a key parameter ingenome or transcriptome assembly. It is defined as the sequence length of the shortest contig at 50%of the entire genome or transcriptome length. In principle, the higher the N50 value, the better thesequencing quality. We obtained an N50 of 2494 bp in all-unigene, compared to previously obtainedvalues of (N50 = 551 bp) for Picea abies [48] and (N50 = 1942 bp) for P. bungeana [53], which means thequality of our sequencing data improves on previously available data.
A total of 30,943 genes (47.05%, rank 1) were annotated to Picea sitchensis through the Nr database,with further annotations being 1174 (1.79%, rank 7) to Pinus tabuliformis, 1074 (1.63%, rank 8) to Pinustaeda, 697 (1.06%, rank 12) to Pinus monticola, 401 (0.61%, rank 18) to Pinus radiata and 376 (0.57%,rank 19) to Picea abies; all these species are conifers and belong to the Pinaceae family. Out of these,two (Pinus taeda and Picea abies) had their genomes sequenced [1,54]. The genome sizes of Pinus taedaand Picea abies are 21.6 Gb and 19.7 Gb, respectively. Pines have an estimated genome size rangingfrom 18 Gb to 40 Gb [55–57]. This indicated that a lot of novel genes in P. massoniana and the Z pinestill completely unknown and expect to discover more in the future.
4.2. Impact of Introgression in Expression Levels
Introgressive hybridization implies repeated backcrossing of hybrids with parental species [58].Hybridization between pines exists frequently in nature [59,60]. As the pollen of pines is mainlymoved by wind, it could spread to a vast area. In that case, the element consisting of individuals couldbe with various proportions of parental genomes. Therefore, those differences between individualscould lead to diversity on gene expression, particularly in genes relate to reproduction. In samplecollection, we conducted mixture of cones for each sample code and also made a mixture apply toRNA isolation to reduce the possible expression bias through analysis process.
4.3. Differential Expression of Reproductive Genes Could Relate to Delayed Maturation of Z Pinecones
Within the Pinus genus, some female cones take 1.5 to 3 years to mature after pollination, while forP. massoniana and the Z pine specifically, it takes around 1.5 years to do that. Around the middle andlower reaches of the Yangtze River, these two pines are often pollinated in April and mature conesemerge in November of the next year, a long time compared to most angiosperms. The structure ofa pinecone is rather complex compared to an angiosperm flower. Therefore, more genes relate toreproduction may exist in cone than in flower and more pathways of these genes may occur in thisprocess also.
Genes directly related to reproduction in gymnosperms have only rarely been reported. Oneof them is MADS genes, which are well studied relatively, for example in Gnetum spp. [61,62],Ginkgo biloba [63], Picea abies [64] and Cryptomeria japonica [4]. LEAFY is also a crucial kind of gene thatinvolve in reproductive process in Welwitschia mirabilis [65] and Pinus caribaea var. Caribaea [66], as wellas NEEDLY in Pinus radiata [67]. We collected several such genes from model plants (e.g., Arabidopsisthaliana) and analyzed their expression level in the two pines. We found that ACA7, MPK4, QRT2,
179

Forests 2019, 10, 230
TKPR1, PI5K, PMEs, SEC6, SEC15, SWK2, PPR, EMB, LEA, SERK, BLH1 showed a higher expressionlevel in P. massoniana than in the Z pine. This result indicates that the Z pine may have a loweredexpression level of genes related to pollen development, pollen exine formation, pollen tube growthand female gametophyte, embryo and/or embryo sac development, compared to P. massoniana. Thisoutcome provides further understanding towards a possible molecular mechanism responsible for thealtered reproduction process of the Z pine in comparison to P. massoniana.
5. Conclusions
P. massoniana and P. hwangshanensis mainly grow in southern China and produce an introgressionhybrid, which we here temporarily named ‘the Z pine,’ on Mt. Lushan, where both species can befound. This Z pine has morphological characters derived from both parent species, yet has an ultra-lowgermination and ripening rate. In order to understand the molecular mechanism that might be causingthis delayed reproduction, we collected cones from P. massoniana and the Z pine of seven successivedevelopmental stages and determined their transcriptome. Herein we might discover differentiallyexpressed genes underlying the observed reproductive delay. We obtained 93,291 unigenes with anaverage length size of 1987 bp and 2494 bp of N50. We identified significantly differentially expressedgenes (DEGs) in all seven cone growth stages. We screened for DEGs related to reproduction, such aspollen tube growth, development of the female gametophyte and embryo and so forth. Severalpotentially vital genes were identified and the expression levels of the two pines were compared andanalyzed. These results may offer insight into the molecular mechanisms of reproductive processbetween the two pines and several other plants that with similar differential mode.
Supplementary Materials: The following are available online at http://www.mdpi.com/1999-4907/10/3/230/s1.Table S1: Quality of original sequencing data of P. massoniana and the Z pine; Table S2: Quality of clean dataof P. massoniana and the Z pine; Table S3: Sequences of unigenes for qRT-PCR validation; Table S4: Primers forqRT-PCR; Table S5. Genes relate to reproduction process in P. massoniana and the Z pine; Figure S1: Lengthdistribution of all unigene sequences; Figure S2: Venn diagram of annotation against to five databases: NCBI Nr,NCBI Nt, SwissProt, COG and KEGG for all unigenes; Figure S3. The species distribution of P. massoniana andthe Z pine unigenes against the NCBI Nr database; Figure S4: Differentially expressed genes analysis betweenP. massoniana and the Z pine of each stage; Figure S5: Gene ontology (GO) functional classification of Z pineversus P. massoniana DEGs in seven stages; Figure S6: DEGs relate to reproduction in GO classification of Zpine versus P. massoniana in seven stages; Figure S7: KEGG pathway enrichment analysis of Z pine versus P.massoniana in seven stages; Figure S8: Comparison of unigene expression results between RNA sequencing(FPKM) and qRT-PCR.
Author Contributions: Conceptualization, J.X., T.Y. and J.S.; Formal analysis, J.M., Y.C., L.Y., H.H., H.Z., Z.G. andJ.Y.; Funding acquisition, J.X.; Investigation, J.M., Y.C., L.Y., H.H., H.Z., Z.G. and J.Y.; Project administration, J.X.;Writing—original draft, J.M.; Writing—review & editing, J.M.
Funding: This research was funded by National Natural Science Foundation of China (31270661) and the PriorityAcademic Program Development of Jiangsu Higher Education Institutions (PAPD).
Acknowledgments: We would like to give thanks to Youxin Du, Qiang Huang and Benzhong Zhou from LushanBotanical Garden, Jiangxi Province and Chinese Academy of Sciences for collecting samples on the Mt. Lushan.We also thank two reviewers for insightful comments on this article. Special thanks go to editors for their help informulating the revisions.
Conflicts of Interest: The authors declare no conflict of interest.
References
1. Nystedt, B.; Street, N.R.; Wetterbom, A.; Zuccolo, A.; Lin, Y.C.; Scofield, D.G.; Vezzi, F.; Delhomme, N.;Giacomello, S.; Alexeyenko, A. The Norway spruce genome sequence and conifer genome evolution. Nature2013, 497, 579–584. [CrossRef] [PubMed]
2. Syring, J.; Farrell, K.; Businský, R.; Cronn, R.; Liston, A. Widespread genealogical nonmonophyly in speciesof Pinus subgenus Strobus. Syst. Biol. 2007, 56, 163–181. [CrossRef] [PubMed]
180

Forests 2019, 10, 230
3. Carlsbecker, A.; Sundström, J.F.; Englund, M.; Uddenberg, D.; Izquierdo, L.; Kvarnheden, A.; Vergara Silva, F.;Engström, P. Molecular control of normal and acrocona mutant seed cone development in Norway spruce(Picea abies) and the evolution of conifer ovule-bearing organs. New Phytol. 2013, 200, 261–275. [CrossRef][PubMed]
4. Katahata, S.; Futamura, N.; Igasaki, T.; Shinohara, K. Functional analysis of SOC1-like and AGL6-likeMADS-box genes of the gymnosperm Cryptomeria japonica. Tree Genet. Genomes 2014, 10, 317–327. [CrossRef]
5. Uddenberg, D.; Reimegård, J.; Clapham, D.; Almqvist, C.; von Arnold, S.; Emanuelsson, O.; Sundström, J.F.Early cone setting in Picea abies acrocona is associated with increased transcriptional activity of a MADS boxtranscription factor. Plant Physiol. 2013, 161, 813–823. [CrossRef] [PubMed]
6. Dubos, C.; Stracke, R.; Grotewold, E.; Weisshaar, B.; Martin, C.; Lepiniec, L. MYB transcription factors inArabidopsis. Trends Plant Sci. 2010, 15, 573–581. [CrossRef] [PubMed]
7. Hennig, L.; Taranto, P.; Walser, M.; Schönrock, N.; Gruissem, W. Arabidopsis MSI1 is required for epigeneticmaintenance of reproductive development. Development 2003, 130, 2555–2565. [CrossRef] [PubMed]
8. Zhai, D.; He, Z.; Feng, J.; Zheng, Y. Study on introgression between Pinus hwangshanensis and Pinus massonianaby using inter-simple sequence repeat marker (ISSR). For. Sci. Technol. 2012, 37, 4–6. (In Chinese)
9. Luo, S.; Zou, H.; Liang, S. Study on the introgressive hybridization between Pinus hwangshanensis andP. massoniana. Sci. Silvae Sin. 2001, 37, 118–122. (In Chinese)
10. Li, S.; Chen, Y.; Gao, H.; Yin, T. Potential chromosomal introgression barriers revealed by linkage analysis ina hybrid of Pinus massoniana and P. hwangshanensis. BMC Plant Biol. 2010, 10, 37. [CrossRef] [PubMed]
11. Bolger, A.M.; Lohse, M.; Usadel, B. Trimmomatic: A flexible trimmer for Illumina sequence data.Bioinformatics 2014, 30, 2114–2120. [CrossRef] [PubMed]
12. Haas, B.J.; Papanicolaou, A.; Yassour, M.; Grabherr, M.; Blood, P.D.; Bowden, J.; Couger, M.B.; Eccles, D.;Li, B.; Lieber, M. De novo transcript sequence reconstruction from RNA-seq using the Trinity platform forreference generation and analysis. Nat. Protoc. 2013, 8, 1494–1512. [CrossRef] [PubMed]
13. Grabherr, M.G.; Haas, B.J.; Yassour, M.; Levin, J.Z.; Thompson, D.A.; Amit, I.; Xian, A.; Fan, L.;Raychowdhury, R.; Zeng, Q. Trinity: Reconstructing a full-length transcriptome without a genome fromRNA-Seq data. Nat. Biotechnol. 2011, 29, 644–652. [CrossRef] [PubMed]
14. Pertea, G.; Huang, X.; Liang, F.; Antonescu, V.; Sultana, R.; Karamycheva, S.; Lee, Y.; White, J.; Cheung, F.;Parvizi, B. TIGR Gene Indices clustering tools (TGICL): A software system for fast clustering of large ESTdatasets. Bioinformatics 2003, 19, 651–652. [CrossRef] [PubMed]
15. Schneider, M.; Lane, L.; Boutet, E.; Lieberherr, D.; Tognolli, M.; Bougueleret, L.; Bairoch, A. TheUniProtKB/Swiss-Prot knowledgebase and its Plant Proteome Annotation Program. J. Proteom. 2009,72, 567–573. [CrossRef] [PubMed]
16. Pruitt, K.D.; Tatusova, T.; Maglott, D.R. NCBI Reference Sequence (RefSeq): A curated non-redundantsequence database of genomes, transcripts and proteins. Nucleic Acids Res. 2005, 33, 501–504. [CrossRef][PubMed]
17. Kanehisa, M.; Araki, M.; Goto, S.; Hattori, M.; Hirakawa, M.; Itoh, M.; Katayama, T.; Kawashima, S.;Okuda, S.; Tokimatsu, T. KEGG for linking genomes to life and the environment. Nucleic Acids Res. 2008, 36,480–484. [CrossRef] [PubMed]
18. Ogata, H.; Goto, S.; Sato, K.; Fujibuchi, W.; Bono, H.; Kanehisa, M. KEGG: Kyoto Encyclopedia of Genes andGenomes. Nucleic Acids Res. 1999, 27, 29–34. [CrossRef] [PubMed]
19. Tatusov, R.L.; Fedorova, N.D.; Jackson, J.D.; Jacobs, A.R.; Kiryutin, B.; Koonin, E.V.; Krylov, D.M.;Mazumder, R.; Mekhedov, S.L.; Nikolskaya, A.N.; et al. The COG database: An updated version includeseukaryotes. BMC Bioinf. 2003, 4, 41. [CrossRef] [PubMed]
20. Young, M.D.; Wakefield, M.J.; Smyth, G.K.; Oshlack, A. Gene ontology analysis for RNA-seq: Accounting forselection bias. Genome Biol. 2010, 11, R14. [CrossRef] [PubMed]
21. Conesa, A.; Terol, J.; Robles, M. Blast2GO: A universal tool for annotation, visualization and analysis infunctional genomics research. Bioinformatics 2005, 21, 3674–3676. [CrossRef] [PubMed]
22. Li, B.; Dewey, C.N. RSEM: Accurate transcript quantification from RNA-Seq data with or without a referencegenome. BMC Bioinf. 2011, 12, 323. [CrossRef] [PubMed]
23. Trapnell, C.; Williams, B.A.; Pertea, G.; Mortazavi, A.; Kwan, G.; Van Baren, M.J.; Salzberg, S.L.; Wold, B.J.;Pachter, L. Transcript assembly and quantification by RNA-Seq reveals unannotated transcripts and isoformswitching during cell differentiation. Nat. Biotechnol. 2010, 28, 511. [CrossRef] [PubMed]
181

Forests 2019, 10, 230
24. Anders, S. Analysing RNA-Seq data with the DESeq package. Mol. Biol. 2010, 43, 1–17.25. Ernst, J.; Bar-Joseph, Z. STEM: A tool for the analysis of short time series gene expression data. BMC Bioinf.
2006, 7, 191. [CrossRef] [PubMed]26. Ye, J.; Coulouris, G.; Zaretskaya, I.; Cutcutache, I.; Rozen, S.; Madden, T.L. Primer-BLAST: A tool to design
target-specific primers for polymerase chain reaction. BMC Bioinf. 2012, 13, 134. [CrossRef] [PubMed]27. Livak, K.J.; Schmittgen, T.D. Analysis of relative gene expression data using real-time quantitative PCR and
the 2−ΔΔCT method. Methods 2001, 25, 402–408. [CrossRef] [PubMed]28. Lucca, N.; León, G. Arabidopsis ACA7, encoding a putative auto-regulated Ca2+-ATPase, is required for
normal pollen development. Plant Cell Rep. 2012, 31, 651–659. [CrossRef] [PubMed]29. Zeng, Q.; Chen, J.G.; Ellis, B.E. AtMPK4 is required for male-specific meiotic cytokinesis in Arabidopsis. Plant
J. 2011, 67, 895–906. [CrossRef] [PubMed]30. Ogawa, M.; Kay, P.; Wilson, S.; Swain, S.M. Arabidopsis dehiscence zone polygalacturonase 1 (ADPG1),
ADPG2, and QUARTET2 are polygalacturonases required for cell separation during reproductivedevelopment in Arabidopsis. Plant Cell 2009, 21, 216–233. [CrossRef] [PubMed]
31. Grienenberger, E.; Kim, S.S.; Lallemand, B.; Geoffroy, P.; Heintz, D.; de Azevedo Souza, C.; Heitz, T.;Douglas, C.J.; Legrand, M. Analysis of TETRAKETIDE α-PYRONE REDUCTASE function in Arabidopsisthaliana reveals a previously unknown, but conserved, biochemical pathway in sporopollenin monomerbiosynthesis. Plant Cell 2010, 110. [CrossRef]
32. Grienenberger, E.; Besseau, S.; Geoffroy, P.; Debayle, D.; Heintz, D.; Lapierre, C.; Pollet, B.; Heitz, T.;Legrand, M. A BAHD acyltransferase is expressed in the tapetum of Arabidopsis anthers and is involved inthe synthesis of hydroxycinnamoyl spermidines. Plant J. 2009, 58, 246–259. [CrossRef] [PubMed]
33. Dobritsa, A.A.; Geanconteri, A.; Shrestha, J.; Carlson, A.; Kooyers, N.; Coerper, D.; Urbanczyk-Wochniak, E.;Bench, B.J.; Sumner, L.W.; Swanson, R. A large-scale genetic screen in Arabidopsis thaliana to identify genesinvolved in pollen exine production. Plant Physiol. 2011, 157, 947–970. [CrossRef] [PubMed]
34. Shin, S.; Golovkin, M.; Reddy, A.S. A pollen-specific calmodulin-binding protein, NPG1, interacts withputative pectate lyases. Sci. Rep. 2014, 4, 5263. [CrossRef] [PubMed]
35. Golovkin, M.; Reddy, A.S. A calmodulin-binding protein from Arabidopsis has an essential role in pollengermination. Proc. Natl. Acad. Sci. USA 2003, 100, 10558–10563. [CrossRef] [PubMed]
36. Ischebeck, T.; Stenzel, I.; Heilmann, I. Type B phosphatidylinositol-4-phosphate 5-kinases mediate Arabidopsisand Nicotiana tabacum pollen tube growth by regulating apical pectin secretion. Plant Cell 2008, 20, 3312–3330.[CrossRef] [PubMed]
37. Bosch, M.; Cheung, A.Y.; Hepler, P.K. Pectin methylesterase, a regulator of pollen tube growth. Plant Physiol.2005, 138, 1334–1346. [CrossRef] [PubMed]
38. Cole, R.A.; Synek, L.; Zarsky, V.; Fowler, J.E. SEC8, a subunit of the putative Arabidopsis exocyst complex,facilitates pollen germination and competitive pollen tube growth. Plant Physiol. 2005, 138. [CrossRef][PubMed]
39. Li, N.; Yuan, L.; Liu, N.; Shi, D.; Li, X.; Tang, Z.; Liu, J.; Sundaresan, V.; Yang, W. SLOW WALKER2,a NOC1/MAK21 homologue, is essential for coordinated cell cycle progression during female gametophytedevelopment in Arabidopsis. Plant Physiol. 2009, 151, 1486–1497. [CrossRef] [PubMed]
40. Becraft, P.W.; Stinard, P.S.; McCarty, D.R. CRINKLY4: A TNFR-like receptor kinase involved in maizeepidermal differentiation. Science 1996, 273, 1406–1409. [CrossRef] [PubMed]
41. Lurin, C.; Andrés, C.; Aubourg, S.; Bellaoui, M.; Bitton, F.; Bruyère, C.; Caboche, M.; Debast, C.; Gualberto, J.;Hoffmann, B.; et al. Genome-wide analysis of Arabidopsis pentatricopeptide repeat proteins reveals theiressential role in organelle biogenesis. Plant Cell 2004, 16, 2089–2103. [CrossRef] [PubMed]
42. Cushing, D.A.; Forsthoefel, N.R.; Gestaut, D.R.; Vernon, D.M. Arabidopsis emb175 and other ppr knockoutmutants reveal essential roles for pentatricopeptide repeat (PPR) proteins in plant embryogenesis. Planta2005, 221, 424–436. [CrossRef] [PubMed]
43. Ishikawa, T.; Machida, C.; Yoshioka, Y.; Ueda, T.; Nakano, A.; Machida, Y. EMBRYO YELLOW gene, encodinga subunit of the conserved oligomeric Golgi complex, is required for appropriate cell expansion and meristemorganization in Arabidopsis thaliana. Genes Cells 2008, 13, 521–535. [CrossRef] [PubMed]
44. Berg, M.; Rogers, R.; Muralla, R.; Meinke, D. Requirement of aminoacyl-tRNA synthetases for gametogenesisand embryo development in Arabidopsis. Plant J. 2005, 44, 866–878. [CrossRef] [PubMed]
182

Forests 2019, 10, 230
45. Galau, G.A.; Bijaisoradat, N.; Hughes, D.W. Accumulation kinetics of cotton late embryogenesis-abundantmRNAs and storage protein mRNAs: Coordinate regulation during embryogenesis and the role of abscisicacid. Dev. Biol. 1987, 123, 198–212. [CrossRef]
46. Hecht, V.; Vielle-Calzada, J.; Hartog, M.V.; Schmidt, E.D.; Boutilier, K.; Grossniklaus, U.; de Vries, S.C.The Arabidopsis SOMATIC EMBRYOGENESIS RECEPTOR KINASE 1 gene is expressed in developing ovulesand embryos and enhances embryogenic competence in culture. Plant Physiol. 2001, 127, 803–816. [CrossRef][PubMed]
47. Pagnussat, G.C.; Yu, H.; Sundaresan, V. Cell-fate switch of synergid to egg cell in Arabidopsis eostre mutantembryo sacs arises from misexpression of the BEL1-like homeodomain gene BLH1. Plant Cell 2007, 19,3578–3592. [CrossRef] [PubMed]
48. Chen, J.; Uebbing, S.; Gyllenstrand, N.; Lagercrantz, U.; Lascoux, M.; Källman, T. Sequencing of the needletranscriptome from Norway spruce (Picea abies Karst L.) reveals lower substitution rates, but similar selectiveconstraints in gymnosperms and angiosperms. BMC Genom. 2012, 13, 589. [CrossRef] [PubMed]
49. Liu, J.J.; Sturrock, R.N.; Benton, R. Transcriptome analysis of Pinus monticola primary needles by RNA-seqprovides novel insight into host resistance to Cronartium ribicola. BMC Genom. 2013, 14, 884. [CrossRef][PubMed]
50. Cañas, R.A.; Feito, I.; Fuentemaqueda, J.F.; Ávila, C.; Majada, J.; Cánovas, F.M. Transcriptome-wide analysissupports environmental adaptations of two Pinus pinaster populations from contrasting habitats. BMCGenom. 2015, 16, 909. [CrossRef] [PubMed]
51. Wu, Y.; Guo, J.; Zhou, Q.; Xin, Y.; Wang, G.; Xu, L.A. De novo transcriptome analysis revealed genes involvedin flavonoid biosynthesis, transport and regulation in Ginkgo biloba. Ind. Crops Prod. 2018, 124, 226–235.[CrossRef]
52. Niu, S.; Yuan, H.; Sun, X.; Porth, I.; Li, Y.; El-Kassaby, Y.A.; Li, W. A transcriptomics investigation into pinereproductive organ development. New Phytol. 2016, 209, 1278–1289. [CrossRef] [PubMed]
53. Duan, D.; Jia, Y.; Yang, J.; Li, Z.H. Comparative Transcriptome Analysis of Male and Female Conelets andDevelopment of Microsatellite Markers in Pinus bungeana, an Endemic Conifer in China. Genes 2017, 8, 393.[CrossRef] [PubMed]
54. Neale, D.B.; Wegrzyn, J.L.; Stevens, K.A.; Zimin, A.V.; Puiu, D.; Crepeau, M.W.; Cardeno, C.; Koriabine, M.;Holtz-Morris, A.E.; Liechty, J.D.; et al. Decoding the massive genome of loblolly pine using haploid DNAand novel assembly strategies. Genome Biol. 2014, 15, R59. [CrossRef] [PubMed]
55. Grotkopp, E.; Rejmánek, M.; Sanderson, M.J.; Rost, T.L. Evolution of genome size in pines (Pinus) and itslife-history correlates: Supertree analyses. Evolution 2004, 58, 1705–1729. [CrossRef] [PubMed]
56. Wakamiya, I.; Newton, R.J.; Johnston, J.S.; Price, H.J. Genome size and environmental factors in the genusPinus. Am. J. Bot. 1993, 80, 1235–1241. [CrossRef]
57. Ohri, D.; Khoshoo, T.N. Genome Size in Gymnosperms. Plant Syst. Evol. 1986, 153, 119–132. [CrossRef]58. Anderson, E.; Hubricht, L. Hybridization in Tradescantia. III. The evidence for introgressive hybridization.
Am. J. Bot. 1938, 25, 396–402. [CrossRef]59. Wang, B.; Mao, J.F.; Gao, J.; Zhao, W.E.; Wang, X.R. Colonization of the Tibetan Plateau by the homoploid
hybrid pine Pinus densata. Mol. Ecol. 2011, 20, 3796–3811. [CrossRef] [PubMed]60. Watano, Y.; Kanai, A.; Tani, N. Genetic structure of hybrid zones between Pinus pumila and P. parviflora var.
pentaphylla (Pinaceae) revealed by molecular hybrid index analysis. Am. J. Bot. 2004, 91, 65–72. [CrossRef][PubMed]
61. Shindo, S.; Ito, M.; Ueda, K.; Kato, M.; Hasebe, M. Characterization of MADS genes in the gymnospermGnetum parvifolium and its implication on the evolution of reproductive organs in seed plants. Evol. Dev.1999, 1, 180–190. [CrossRef] [PubMed]
62. Becker, A.; Saedler, H.; Theissen, G. Distinct MADS-box gene expression patterns in the reproductive conesof the gymnosperm Gnetum gnemon. Dev. Genes Evol. 2003, 213, 567–572. [CrossRef] [PubMed]
63. Jager, M.; Hassanin, A.; Manuel, M.; Le Guyader, H.; Deutsch, J. MADS-box genes in Ginkgo biloba and theevolution of the AGAMOUS family. Mol. Biol. Evol. 2003, 20, 842–854. [CrossRef] [PubMed]
64. Carlsbecker, A.; Tandre, K.; Johanson, U.; Englund, M.; Engström, P. The MADS-box gene DAL1 is a potentialmediator of the juvenile-to-adult transition in Norway spruce (Picea abies). Plant J. 2004, 40, 546–557.[CrossRef] [PubMed]
183

Forests 2019, 10, 230
65. Moyroud, E.; Monniaux, M.; Thévenon, E.; Dumas, R.; Scutt, C.; Frohlich, M.; Parcy, F. A link betweenLEAFY and B-gene homologues in Welwitschia mirabilis sheds light on ancestral mechanisms prefiguringfloral development. New Phytol. 2017, 216, 469–481. [CrossRef] [PubMed]
66. Dornelas, M.; Rodriguez, A. A FLORICAULA/LEAFY gene homolog is preferentially expressed in developingfemale cones of the tropical pine Pinus caribaea var. caribaea. Genet. Mol. Biol. 2005, 28, 299–307. [CrossRef]
67. Mouradov, A.; Glassick, T.; Hamdorf, B.; Murphy, L.; Fowler, B.; Marla, S.; Teasdale, R. NEEDLY, a Pinusradiata ortholog of FLORICAULA/LEAFY genes, expressed in both reproductive and vegetative meristems.Proc. Natl. Acad. Sci. USA 1998, 95, 6537–6542. [CrossRef] [PubMed]
© 2019 by the authors. Licensee MDPI, Basel, Switzerland. This article is an open accessarticle distributed under the terms and conditions of the Creative Commons Attribution(CC BY) license (http://creativecommons.org/licenses/by/4.0/).
184

Article
Diversity Estimation and Antimicrobial Activity ofCulturable Endophytic Fungi from Litsea cubeba(Lour.) Pers. in China
Fei Wu 1,†, Dingchao Yang 1,†, Linping Zhang 1,*, Yanliu Chen 1, Xiaokang Hu 2, Lei Li 3
and Junsheng Liang 3
1 2011 Collaborative Innovation Center of Jiangxi Typical Trees Cultivation and Utilization, JiangxiAgricultural University, Nanchang 330045, China; [email protected] (F.W.); [email protected] (D.Y.);[email protected] (Y.C.)
2 Gannan Arboretum, Ganzhou 341200, China; [email protected] Hunan Academy of Forestry, Changsha 410004, China; [email protected] (L.L.); [email protected] (J.L.)* Correspondence: [email protected]; Tel.: +86-0791-8381-3243† These authors contributed equally to this work.
Received: 6 December 2018; Accepted: 31 December 2018; Published: 6 January 2019
Abstract: Endophytes are important components of forest ecosystems, and have potential use in thedevelopment of medical drugs and the conservation of wild medicinal plants. This study aimedto examine the diversity and antimicrobial activities of endophytic fungi from a medicinal plant,Litsea cubeba (Lour.) Pers. The results showed that a total of 970 isolates were obtained from root, stem,leaf, and fruit segments of L. cubeba. All the fungal endophytes belonged to the phylum Ascomycotaand could be classified into three taxonomic classes, nine orders, twelve families, and seventeengenera. SF15 (Colletotrichum boninense) was the dominant species in L. cubeba. Leaves harboreda greater number of fungal endophytes but lower diversity, while roots harbored the maximumspecies diversity of endophytic fungi. For the antimicrobial activities, seventeen isolates could inhibitthe growth of plant pathogenic fungi, while the extracts of six endophytes showed antimicrobialactivity to all the tested pathogenic fungi. Among these endophytes, SF22 (Chaetomium globosum)and SF14 (Penicillium minioluteum) were particularly effective in inhibiting seven plant pathogenicfungi growths and could be further explored for their potential use in biotechnology, medicine,and agriculture.
Keywords: endophytes; medicinal plants; pathogen; molecular identification; plant-microbe interaction
1. Introduction
The demand for new and useful compounds for disease prevention and control is ever growing [1].Antibiotic resistance, the increasing incidence of fungal diseases, and the development of superbugscause biodiversity loss and constantly bring challenges to the field of medicine [2,3]. Thus, there isan urgent need to find new antibiotics that are more effective, have lower toxicity, and a smallerenvironmental impact.
Forest ecosystems cover an area of approximately 38 million square kilometers and containsubstantial resources [4,5]. Endophytes are an important component of the forest ecosystem,which inhabit the internal tissues of plants, have no detrimental effects on plants, and can sometimesimprove plant growth performance [6,7]. Most of the natural compounds produced by endophyteshave exhibited antimicrobial activity and, in many cases, these are related to the protection ofthe host from phytopathogenic microorganisms [8]. The endophyte Beauveria bassiana has beenable to inhibit fungal pathogens by the production of bioactive metabolites [9]. The endophytic
Forests 2019, 10, 33; doi:10.3390/f10010033 www.mdpi.com/journal/forests185

Forests 2019, 10, 33
fungus Gliocladium catenulatum can reduce the incidence of witches’ broom disease in cacao by upto 70% [10]. Furthermore, some endophytic fungi can produce the same chemical compounds asthe host, such as the paclitaxel producing fungus Taxomyces andreanae from Taxus brevifolia [11,12],and the podophyllotoxin generating fungus Fusarium oxysporum from Juniperus recurva [13]. There havebeen over 8600 discovered bioactive metabolites of fungal origin [14]. It is estimated that there areapproximately 1 million fungal species of endophytic fungi in nature [15], whereas only a smallpercentage of endophytes have been discovered [16]. The enormous biodiversity and abundant fungalendophytes that occur in plant tissues show the potential role of endophytes in the production of novelnatural antimicrobial compounds.
Litsea cubeba (Lour.) Pers. (Lauraceae) is a native woody species in China, Indonesia,and other countries in Southeast Asia [17]. It is a valuable traditional Chinese medicinal plantthat has been used to treat rheumatic diseases, stomach aches, and common cold for thousands ofyears [18,19]. The active components of L. cubeba were reported to be antibacterial [20], anticancer [21],and anti-inflammatory [19]. Intercropping of L. cubeba and Camellia oleifera Abel. can reduce theincidence of C. oleifera disease, suggesting the role of L. cubeba in protecting economic plants fromdiseases. Colletotrichum gloeosporioides (Penz.) Penz. & Sacc. [22], Fusarium andiyazi Marasas, Rheeder,Lampr., K.A. Zeller & J.F. Leslie [23], Alternaria alternata (Fr.) Keissl. [24], Phomopsis sp. [25], Ceratosphaeriaphyllostachydis Zhang [26], Rhizoctonia solani Kühn [27], and Phytophthora capsici Leonian [28] causediseases in main economic crops in South China, leading to a heavy decline in crop yield and quality.Currently, the associated microflora of medicinal plants is being paid increased amounts of attentionfor the exploitation of antimicrobial drugs [29]. However, to our knowledge, there are no reports onthe biodiversity and bioactivity of endophytic fungi in L. cubeba. This study aimed to investigate thediversity and antimicrobial activities of endophytic fungi of L. cubeba, and, further, to screen them aspotential biocontrol agents against seven plant pathogens.
2. Materials and Methods
2.1. Collection of Samples and Isolation of Endophytic Fungi
The leaves, branches, roots, and fruits of Litsea cubeba were collected from a planting base inLichuan county of Jiangxi Province, China, in May 2016. The leaves and fruits samples were cut intosmall pieces of about 0.5 × 0.5 cm using a sterile knife, and the branch and root samples were cut intosmall segments 1 cm in length. These fragments were surface sterilized with 70% (v/v) ethanol for3 min, 3% (v/v) NaClO for 3–5 min, and then rinsed with sterile water four times. Excess moisture wasblotted by sterile filter papers [30]. Then, they were cultured on potato dextrose agar (PDA) mediumsupplemented with streptomycin (50 U/mL) and penicillin (30 U/mL) at 25 ◦C under dark conditionsfor 7–15 days. Pure fungal cultures were obtained by picking hyphal tips of the developing fungalcolonies. The acquired isolates were preserved on PDA slants and deposited at 4 ◦C for identification.
2.2. Genomic DNA Extraction, PCR Amplification and Molecular Identification
The isolates were first identified based on the morphological characteristics of the colony cultureand spores. Fungal genomic DNA was extracted from the mycelia using an Ezup Column FungiGenomic DNA Purification Kit (Sangon Biotech, Inc., Shanghai, China) according to the manufacturer’sprotocol. The internal transcribed spacer (ITS) regions were amplified using the universal primers ITS1(5′-TCCGTAGGTGAACCTGCGC-3′) and ITS4 (5′-TCCTCCGCTTATTGATATGC-3′) [31]. The reactionmixtures (50 μL) contained 25 μL 2 × Taq PCR Master mixture (Sangon Biotech, Inc., Shanghai, China),2 μL of ITS4, 2 μL of ITS5, 2 μL of Template DNA, and 19 μL of ddH2O. The reaction conditions were94 ◦C for 5 min, 30 cycles at 94 ◦C for 50 s, 52 ◦C for 50 s, 72 ◦C for 1 min, and a final extension at 72 ◦Cfor 7 min. The PCR products were examined by electrophoresis in 1% (w/v) agarose gels and thenpurified using the Agarose Gel DNA Extraction Kit (Takara, Japan) and sequenced.
186

Forests 2019, 10, 33
The resultant sequences were compared with previously deposited sequences in theGenBank, NCBI (http://www.ncbi.nlm.nih.gov) using a basic local alignment search tool (BLAST).Sequence alignment and phylogenetic analysis were conducted using MEGA version 7 [32].Phylogenetic trees were constructed using a neighbor-joining method. The ITS gene sequences of thepotential novel isolates were deposited in GenBank under the accession numbers MF962537–MF962573.
2.3. Estimation and Quantification of Fungal Diversity
Fungal diversity and richness in different plant tissues were measured and quantified usingvarious indices, including the colonization rate (CR), isolation rate (IR), and Shannon-Wiener (H’),Simpson’s (Ds) diversity index and evenness index (E). The calculations were as follows.
CR = Nf /Nt × 100, (1)
IR = Ng/Nt × 100, (2)
H’ = −∑Pi × Ln(Pi), (3)
Ds = 1 − ΣPi2, (4)
E = H’/Ln(S), (5)
where Nf was the number of fragments with fungal growth, Nt was the total number of fragments, andNg was the number of isolates of a given type isolated [33]. Pi = ni/N, is the relative abundance of theendophytic fungal species, ni is the number of isolates of one species, and N is the total species numberof isolates [34,35]. S was the total number of the taxa (ITS genotype) present within each sample [16].
2.4. Antimicrobial Activity of Endophytic Fungi
The indicator strains include the following plant pathologens: the fungi Colletotrichumgloeosporioides, F. andiyazi, A. alternata, Phomopsis sp., Ceratosphaeria phyllostachydis, R. solani, and theChromista Phytophthora capsici, provided by the Plant Pathology Laboratory, College of Forestry, JiangxiAgricultural University, China.
A dual culture technique was applied to examine the antimicrobial activity of endophytic fungifrom L. cubeba against fungal pathogens [36]. The mycelial discs (6 mm in diameter) of actively growingendophytes were placed at the periphery of the PDA plate. The mycelial discs of the pathogen wereplaced on the other side of the PDA plate, 4 cm away from the endophyte disc. The plate with onlythe pathogen was used as a control. Each treatment replicated 3 times. The dual culture plates wereincubated for 3–8 days at 25 ◦C. The inhibition rate against pathogens was calculated according to theformula below.
Inhibition rate (%) = (R1 − R2)/(R1 − 0.6) × 100, (6)
where R1 is the colony diameter of the control, R2 is the colony diameter under experimental treatments,and 0.6 mm represents the mycelial discs.
The endophytes with high antimicrobial activity were selected and investigated for the in vitroantimicrobial activity of their extracts. Each of the endophytes were separately cultured on 200 mLPDA liquid medium at 25 ◦C, by shaking at 150 rpm for 8–12 days. The culture broth was collectedby filtration and extracted with an equal amount of ethyl acetate three times. The organic phase wasevaporated to dryness using a rotary evaporator. The dry extract was dissolved in 3 mL of methanoland formulated into 15 μg/mL of mycelia broth.
In vitro antimicrobial tests were conducted by testing the growth rate of the pathology fungi.The mycelial discs (6 mm in diameter) of the pathogen were placed in the center of the PDA platecontaining 1.5 mL mycelia broth. The PDA plate without mycelia broth (containing only 1.5 mLmethanol) was used as the control. The tested plates were cultured at 25 ◦C for 3–7 days. The formulafor calculating the inhibition rate is the same as Formula (6).
187

Forests 2019, 10, 33
2.5. Statistical Analyses
Statistical tests were performed using SPSS 13.0 (SPSS Inc., Chicago, IL, USA). Turkey’s multiplerange test was used to pairwise multiple comparisons between treatments.
3. Results
3.1. Identification and Composition of Endophyte Assemblage
A total of 970 isolates were obtained from root, stem, leaf, and fruit segments of L. cubeba(Table 1). The maximum number of isolates was obtained from the leaves (438 isolates), followed bystems (241 isolates), fruits (149 isolates), and roots (142 isolates). Molecular identification of theisolates was conducted based on a comparative analysis of ITS gene sequences and their similarityto reference sequences (Figure 1). The results showed that the isolated endophytic fungi couldbe allocated to 36 operational taxonomic units (OTUs). All of them belonged to the Ascomycotaphylum and were classified into three taxonomic classes (Eurotiomycetes, Dothideomycetes,and Sordariomycetes), nine orders (Eurotiales, Botryosphaeriales, Pleosporales, Hypocreales,Chaetosphaeriales, Sordariales, Diaporthales, Xylariales, and an unassigned order), twelve familiesand seventeen genera. Twenty-three fungal morphotypic groups were taxonomically assigned tospecies, and the other 13 were classified at the genus level (Table 1). SF15 (Colletotrichum boninense)accounted for 39.79% of the total isolates and was the dominant species in the whole fungal endophyticcommunity, followed by SF4 (Botryosphaeria dothidea) (6.60%).
3.2. Diversity Estimation of Endophytic Fungi
The biodiversity of endophytic fungi in L. cubeba was quantitatively investigated in terms of thecolonization rate (CR), isolation rate (IR), Shannon-Wiener (H’), and Simpson’s (Ds) diversity indexand evenness index (E) (Table 2). The total H’ and Ds were 2.52 and 0.82, respectively. The highestbiodiversity of endophytic fungi was observed in roots (H’ = 2.74, Ds = 0.90), followed by stems(H’ = 2.56, Ds = 0.90), fruits (H’ = 1.99, Ds = 0.76), and leaves (H’ = 1.43, Ds = 0.56). The leaf samples hadthe highest endophytic fungi colonization rate but the lowest species evenness (E = 0.51) compared tothe other plant parts.
3.3. In Vitro Antimicrobial Activity of Endophytic Fungi
The results of dual culture experiments showed that 17 isolates inhibited the growth of pathogenicfungi, which was manifested by the occurrence of the inhibition zone or mycelial atrophy of pathogens(Table 3). Among them, 10 isolates exhibited antibiotic effects on all the tested pathogenic microbes.SF22 (Chaetomium globosum) showed the strong activity against Ceratosphaeria phyllostachydis, Phomopsissp., and Alternaria alternata, with inhibition rates of 78.43, 73.20, and 70.23%, respectively.
The results of the antimicrobial test on the fermentation products support that the fermentationproducts of SF14, SF22, SF23, SF27, SF29 and SF32 showed antimicrobial activity against all the testedpathogen fungi (Table 4). The antimicrobial activity of the fermentation products was stronger thanthe endophytic fungi. The inhibition rate of SF22 (Chaetomium globosum) extracts against Ceratosphaeriaphyllostachydis was 93.24%. The inhibition rate of SF14 (Penicillium minioluteum) extracts againstPhomopsis sp. was 87.87%. The inhibition rates of the fermentation products of these two isolatesagainst the other six pathogens were over 60%.
188

Forests 2019, 10, 33
Ta
ble
1.
Iden
tific
atio
n,ab
unda
nce,
and
perc
enta
gere
cove
ryof
endo
phyt
icfu
ngii
sola
ted
from
diff
eren
ttis
sues
ofLi
tsea
cube
ba(L
our.)
Pers
.
En
do
ph
yti
cF
un
gal
Taxo
nIs
ola
teC
od
es
Acc
ess
ion
Nu
mb
ers
Th
eC
lose
tG
en
ban
kT
axa
Sim
ilari
ty(%
)N
um
bers
of
Iso
late
sfr
om
Pla
nt
Tis
sues
To
tal
Ab
un
dan
ce(P
erc
en
tag
eR
eco
very
)
Ro
ots
Ste
ms
Leav
es
Fru
its
Asp
ergi
llus
fum
igat
us1
SF25
MF9
6255
5A
sper
gillu
sfu
mig
atus
(KP1
3156
6.1)
996
00
00.
62A
sper
gillu
sfu
mig
atus
2SF
48M
F962
572
Asp
ergi
llus
fum
igat
us(E
U83
3205
.1)
991
00
00.
10Bo
tryo
spha
eria
doth
idea
SF4
MF9
6253
9Bo
tryo
spha
eria
doth
idea
(FJ4
7812
9.1)
991
4611
66.
60C
lono
stac
hys
sp.
SF31
MF9
6256
1C
lono
stac
hys
sp.(
LC13
3855
.1)
995
23
01.
03C
alon
ectr
iacu
rvis
pora
SF39
MF9
6256
6C
alon
ectr
iacu
rvis
pora
(GQ
2805
68.1
)99
252
00
2.78
Cha
etom
ium
glob
osum
SF22
MF9
6255
2C
haet
omiu
mgl
obos
um(K
M26
8652
.1)
991
01
00.
21C
olle
totr
ichu
mbo
nine
nse
SF15
MF9
6254
8C
olle
totr
ichu
mbo
nine
nse
(MF0
7658
5.1)
990
13
00.
41C
olle
totr
ichu
mgl
oeos
pori
oide
s1
SF40
MF9
6256
7C
olle
totr
ichu
mgl
oeos
pori
oide
s(E
U55
2111
.1)
992
3228
468
39.7
9C
olle
totr
ichu
mgl
oeos
pori
oide
s2
SF3
MF9
6253
8C
olle
totr
ichu
mgl
oeos
pori
oide
s(K
U53
4983
.1)
994
041
45.
06D
iapo
rthe
phas
eolo
rum
1SF
8M
F962
542
Dia
port
heph
aseo
loru
m(K
X86
6868
.1)
997
3718
46.
80D
iapo
rthe
phas
eolo
rum
2SF
45M
F962
570
Dia
port
heph
aseo
loru
m(A
F001
018.
2)99
00
09
0.93
Dia
port
heer
esSF
30M
F962
560
Dia
port
heer
es(K
X86
6867
.1)
970
110
01.
13D
iapo
rthe
sp.
SF34
MF9
6256
3D
iapo
rthe
sp.(
EF42
278.
1)97
07
00
0.72
Fusa
rium
gram
inea
rum
SF35
MF9
6256
4Fu
sari
umgr
amin
earu
m(K
F624
778.
1)99
54
1110
3.09
Nig
rosp
ora
spha
eric
aSF
13M
F962
546
Nig
rosp
ora
spha
eric
a(K
M51
0416
.1)
100
00
16
0.72
Nem
ania
diffu
saSF
10M
F962
543
Nem
ania
diffu
sa(K
P133
219.
1)99
34
00
0.72
Phom
opsi
ssp
.1SF
5M
F962
540
Phom
opsi
ssp
.(K
P184
328.
1)99
08
290
3.82
Phom
opsi
ssp
.2SF
7M
F962
541
Phom
opsi
ssp
.(JX
4367
95.1
)98
1412
1013
5.05
Phom
opsi
ssp
.3SF
21M
F962
551
Phom
opsi
ssp
.(A
B505
410.
1)97
33
04
1.03
Phom
opsi
ssp
.4SF
38M
F962
565
Phom
opsi
ssp
.(H
Q83
2822
.1)
991
220
02.
37Ph
omop
sis
sp.5
SF44
MF9
6256
9Ph
omop
sis
sp.(
HM
5955
06.1
)99
00
09
0.93
Phom
opsi
sfu
kush
iiSF
11M
F962
544
Phom
opsi
sfu
kush
ii(K
T951
302.
1)97
10
21
0.41
Phyl
lost
icta
capi
tale
nsis
SF1
MF9
6253
7Ph
yllo
stic
taca
pita
lens
is(K
R05
6285
.1)
100
115
99
3.51
Pest
alot
iops
issp
.1SF
24M
F962
554
Pest
alot
iops
issp
.(H
Q60
7806
.1)
990
90
00.
93Pe
stal
otio
psis
sp.2
SF46
MF9
6257
1Pe
stal
otio
psis
sp.(
HE6
0879
7.1)
992
00
00.
21Pe
stal
otio
psis
sp.3
SF49
MF9
6257
3Pe
stal
otio
psis
sp.(
EF42
3541
.1)
100
10
05
0.62
Pest
alot
iops
isdi
ssem
inat
aSF
28M
F962
558
Pest
alot
iops
isdi
ssem
inat
e(J
Q32
3000
.1)
993
130
10.
62Pe
stal
otio
psis
vism
iae
SF12
MF9
6254
5Pe
stal
otio
psis
vism
iae
(KM
0152
17.1
)99
21
30
1.75
Peni
cilli
umru
bens
SF18
MF9
6255
0Pe
nici
llium
rube
ns(L
T558
865.
1)10
00
10
00.
10Pe
nici
llium
jant
hine
llum
SF27
MF9
6255
7Pe
nici
llium
jant
hine
llum
(KM
2686
48.1
)99
290
00
2.99
Peni
cilli
umci
trin
umSF
32M
F962
562
Peni
cilli
umci
trin
um(L
T558
897.
1)10
05
00
00.
52Pe
nici
llium
min
iolu
teum
SF14
MF9
6254
7Pe
nici
llium
min
iolu
teum
(L14
505.
1)99
30
00
0.31
Phom
asp
.SF
26M
F962
556
Phom
asp
.(H
Q63
1000
.1)
995
911
02.
58Th
ozet
ella
sp.
SF16
MF9
6254
9Th
ozet
ella
sp.(
KU
0598
40.1
)96
11
00
0.21
Tala
rom
yces
sp.
SF23
MF9
6255
3Ta
laro
myc
essp
.(K
U55
6510
.1)
993
00
00.
31Ta
laro
myc
esam
esto
lkia
eSF
29M
F962
559
Tala
rom
yces
ames
tolk
iae
(LT5
5895
6.1)
998
11
01.
03
Tota
l14
224
143
814
910
0.00
189

Forests 2019, 10, 33
Ta
ble
2.
The
Inde
xof
endo
phyt
icfu
ngifl
ora
dive
rsit
yof
Lits
eacu
beba
(Lou
r.)Pe
rs.
Pa
rts
No
.o
fT
issu
eN
o.
of
Fu
ng
iN
o.
of
Str
ain
sN
o.
of
Ge
nu
sC
R%
IR%
H’
Ds
E
Roo
t45
014
214
227
32.2
231
.56
2.74
0.90
0.83
Stem
450
232
241
2151
.56
53.5
62.
560.
900.
84Le
af45
041
343
816
91.7
897
.33
1.43
0.56
0.51
Frui
t45
013
914
914
30.8
933
.11
1.99
0.76
0.75
Tota
l18
0092
697
036
51.4
453
.89
2.52
0.82
0.70
Abb
revi
atio
ns:N
o.:n
umbe
r;C
R:c
olon
izat
ion
rate
;IR
:iso
lati
onra
te;H
’:Sh
anno
n-W
iene
rdi
vers
ity
inde
x;D
s:Si
mps
on’s
dive
rsit
yin
dex;
E:ev
enne
ssin
dex.
Ta
ble
3.
Ant
imic
robi
alac
tivi
ties
ofen
doph
ytic
fung
ifro
mLi
tsea
cube
ba(L
our.)
Pers
.
No
.E
nd
op
hy
tic
fun
gi
Inh
ibit
ion
Rati
oo
fP
ath
og
en
My
celi
um
Gro
wth
(%)
1 ©2 ©
3 ©4 ©
5 ©6 ©
7 ©SF
11Ph
omop
sis
fuku
shii
46.1
5±
0.33
W−
55.5
6±
0.53
W−
45.9
1±
0.71
W+
29.5
2±
0.32
W+
46.5
6±
0.52
W−
55.3
5±
1.61
W+
—SF
14Pe
nici
llium
min
iolu
teum
39.2
3±
0.27
W+
58.8
2±
0.28
W+
52.2
0±
0.21
W+
60.9
5±
0.41
W−
52.6
7±
0.47
W+
53.4
6±
0.31
W+
55.4
9±
0.37
W+
SF22
Cha
etom
ium
glob
osum
58.6
1±
0.44
W+
73.4
3±
0.43
W+
53.1
2±
0.14
W+
70.2
3±
0.30
W+
73.2
0±
0.24
W+
78.4
3±
0.49
W+
56.6
0±
0.35
W+
SF23
Tala
rom
yces
sp.
42.3
1±
0.27
W+
64.0
5±
0.18
W+
49.0
6±
0.21
W+
42.8
6±
0.24
W+
55.7
3±
0.27
W+
52.8
3±
0.28
W+
52.4
4±
0.34
W−
SF24
Pest
alot
iops
issp
.146
.92±
0.25
W+
52.9
4±
0.31
W−
56.6
0±
0.29
W+
68.5
7±
0.43
W−
57.2
5±
0.14
W+
50.3
1±
0.28
W+
39.6
3±
0.39
W−
SF27
Peni
cilli
umja
nthi
nellu
m38
.46±
0.41
W+
39.2
2±
0.20
W+
47.1
7±
0.41
W−
31.4
3±
0.40
W−
53.4
4±
0.32
W+
40.8
8±
0.37
W+
35.3
7±
0.21
W+
SF28
Pest
alot
iops
isdi
ssem
inat
a50
.00±
0.23
W+
58.1
7±
0.21
W+
57.2
3±
0.27
W+
39.0
5±
0.21
W−
45.0
4±
0.21
W−
48.4
3±
0.31
W−
25.6
1±
0.37
W−
SF29
Tala
rom
yces
ames
tolk
iae
60.7
7±
0.43
W−
78.4
3±
0.18
W−
60.3
8±
0.37
W−
59.0
5±
0.19
W+
73.2
8±
0.27
W−
64.7
8±
0.42
W+
51.2
2±
0.43
W−
SF31
Clo
nost
achy
ssp
.33
.08±
0.38
W+
47.0
6±
0.35
W+
48.4
3±
0.41
W+
28.5
7±
0.33
W−
32.0
6±
0.25
W−
——
SF32
Peni
cilli
umci
trin
um50
.77±
0.45
W+
62.7
5±
0.29
W+
61.0
1±
0.32
W+
39.0
5±
0.21
W+
——
80.4
9±
0.27
W−
SF35
Fusa
rium
gram
inea
rum
36.9
2±
0.43
W+
49.6
7±
0.33
W+
53.4
6±
0.31
W+
37.1
4±
0.26
W+
49.6
2±
0.28
W+
40.8
8±
0.36
W−
32.9
3±
0.17
W−
SF39
Cal
onec
tria
curv
ispo
ra45
.38±
0.25
W+
——
—70
.13±
0.19
W+
59.1
2±
0.18
W−
—SF
44Ph
omop
sis
sp.5
50.7
7±
0.40
W+
71.4
2±
0.25
W+
57.8
6±
0.32
W−
40.9
5±
0.44
W−
49.6
2±
0.36
W+
55.3
5±
0.23
W+
—SF
49Pe
stal
otio
psis
sp.3
46.9
2±
0.24
W+
70.2
1±
0.35
W+
56.6
0±
0.35
W+
52.3
8±
0.33
W−
51.9
1±
0.39
W+
57.2
3±
0.31
W+
—
Not
e:D
ata
pres
ente
dar
eth
em
eans
±SD
(n=
3).
1 ©C
olle
totr
ichu
mgl
oeos
pori
oide
s(P
enz.
)Pe
nz.&
Sacc
.;2 ©
Phyt
opht
hora
caps
iciL
eoni
an;
3 ©Fu
sari
uman
diya
ziM
aras
as,R
heed
er,L
ampr
.,K
.A.Z
elle
r&
J.F.L
eslie
;4 ©
Alte
rnar
iaal
tern
ata
(Fr.)
Kei
ssl.;
5 ©Ph
omop
sis
sp.;
6 ©C
erat
osph
aeri
aph
yllo
stac
hydi
sZ
hang
;7 ©
Rhi
zoct
onia
sola
niK
ühn;
−:N
oin
hibi
tion
zone
;+:I
nhib
ition
zone
;w
:Pat
hoge
nhy
phae
shri
nk;–
:No
inhi
biti
on.
190

Forests 2019, 10, 33
Ta
ble
4.
Ant
imic
robi
alac
tivi
tyof
the
met
abol
ites
ofen
doph
ytic
fung
ifro
mLi
tsea
cube
ba(L
our.)
Pers
.
No
.E
nd
op
hy
tic
fun
gi
Inh
ibit
ion
Rati
oo
fP
ath
og
en
My
celi
um
Gro
wth
(%)
1 ©2 ©
3 ©4 ©
5 ©6 ©
7 ©SF
14Pe
nici
llium
min
iolu
teum
76.3
2±
1.35
aB75
.21±
1.63
bBC
69.0
0±
2.40
aC61
.08±
1.85
bD87
.87±
1.97
aA84
.73±
4.03
aA60
.01±
3.03
bD
SF22
Cha
etom
ium
glob
osum
66.1
8±
3.98
bC91
.73±
1.67
aA66
.67±
3.39
aC77
.60±
2.72
aB80
.00±
6.25
abB
93.2
4±
2.10
aA61
.00±
3.82
bC
SF23
Tala
rom
yces
sp.
79.3
4±
3.22
aAB
55.1
0±
0.85
dD37
.33±
1.31
bF45
.21±
3.25
cE80
.63±
3.55
abA
65.0
0±
2.19
bC73
.60±
1.36
aB
SF27
Peni
cilli
umja
nthi
nellu
m80
.66±
2.80
aA71
.07±
3.87
bcA
B29
.87±
6.01
bcE
42.1
6±
3.55
cDE
74.8
0±
4.02
bAB
56.0
8±
8.85
bcC
D64
.78±
3.76
bBC
SF29
Tala
rom
yces
ames
tolk
iae
27.3
7±
4.30
dCD
64.1
9±
6.58
cdA
25.3
3±
6.73
cD46
.73±
6.43
cB50
.65±
4.27
cAB
45.0
0±
5.53
cdB
42.1
4±
3.30
cBC
SF32
Peni
cilli
umci
trin
um50
.34±
3.70
cB60
.24±
5.04
dA61
.23±
2.53
aA42
.23±
3.57
cBC
32.7
6±
1.55
dD33
.78±
2.70
dCD
45.1
2±
2.91
cB
Not
e:D
ata
pres
ente
dar
eth
em
eans
±SD
(n=
3).M
eans
follo
wed
byth
esa
me
low
erca
sele
tter
sw
ithin
aco
lum
nan
dby
the
sam
eup
perc
ase
lett
ers
with
ina
row
dono
tdiff
ersi
gnifi
cant
lyat
p≤
0.05
acco
rdin
gto
Turk
ey’s
test
.1 ©
Col
leto
tric
hum
gloe
ospo
rioi
des
(Pen
z.)
Penz
.&Sa
cc.;
2 ©Ph
ytop
htho
raca
psic
iLeo
nian
;3 ©
Fusa
rium
andi
yazi
Mar
asas
,Rhe
eder
,Lam
pr.,
K.A
.Zel
ler
&J.F
.Les
lie;
4 ©A
ltern
aria
alte
rnat
a(F
r.)K
eiss
l.;5 ©
Phom
opsi
ssp
.;6 ©
Cer
atos
phae
ria
phyl
lost
achy
dis
Zha
ng;
7 ©R
hizo
cton
iaso
lani
Küh
n.
191

Forests 2019, 10, 33
Figure 1. Neighbor-joining phylogenetic tree based on internal transcribed spacer (ITS)–rDNA genesequences of endophytic fungi associated with Litsea cubeba (Lour.) Pers. Bootstrap percentages (>50)after 1000 replications are shown.
192

Forests 2019, 10, 33
4. Discussion
Medicinal plants are legitimate targets to isolate endophytic fungi for their role in producingpharmacologically important secondary metabolites [37]. These fungal endophytes can be used totreat plant diseases. This is the first study that demonstrates the diversity, phylogeny, and bioactivepotential of endophytic fungi associated with a medicinal plant, L. cubeba. In this study, all the fungalisolates were identified as Ascomycota, which is consistent with previous findings on Ophiopogonjaponicas [38], Calotropis procera [39], and Cannabis sativa [35]. It is estimated that the phylumAscomycota covers about 8% of the Earth’s land and is among the most prevalent and diversephyla of eukaryotes [37,40]. Endophytic fungi are ubiquitously distributed thoughout variousclasses of Ascomycota, including Eurotiomycetes, Dothideomycetes, Leotiomycetes, Pezizomycetes,and Sordariomycetes [6,41]. Katoch et al. [37] observed that the endophytic fungi in Monarda citriodora,a medicinal plant, were mainly distributed in the Sordariomycetes class, followed by Eurotiomycetesand Dothideomycetes. A similar presentation of classes was found in this study, indicating thatendophytic fungi isolated in this study were cosmopolitan endophytes.
The fungal endophytes discovered in L. cubeba in this study were not identical to those reportedin other studies. Ho et al. (2012) [42] isolated endophytic fungi from twigs of seven medicinal herbsbelonging to the Lauraceae family (including L. cubeba) and found that the endophytes from L. cubebabelonged to six genera (Pestalotiopsis, Arthrinium, Diaporthe, Xylaria, Hypoxylon, and Pyrenochaeta).Only two genera (Pestalotiopsis and Diaporthe) were consistent with the results of the present study.This may due to the differences in sites, seasons, and climates [6].
The variation in endophytic communities was also found in spatial distribution. The endophyticcommunity in L. cubeba exhibited tissue specificity. A similar phenomenon was also observed inDendrobium officinale [16], which may be caused by the different external environments or by thebiological differences among tissues and organs [6]. Microorganisms in the environment usuallyshow low diversity and low abundance compared with the soil [43]. The results of the present studysupport this point that roots harbor the maximum species diversity of endophytic fungi. Leavesharbor a greater number of fungal endophytes but with a lower diversity than other plant samples.This may be because the large surface area and the presence of stomata in leaves exposed to theexternal environment provide access for the entry of fungal mycelium, so that leaves may harbor agreater number of endophytic fungi [36]. However, the substantial organic compounds in leaves werelargely inaccessible to foliar microorganisms, and microorganisms may present in the leaves in theform of co-metabolism, thus limiting the diversity of endophytic fungi in leaves [4,44,45].
Some fungal endophytes have been considered as beneficial mutualisms in protecting the hostfrom pathogens [46]. In this study, the fungal endophytes were investigated for antifungal activityusing a dual culture method. The results showed that 17 isolates inhibited the growth of plantpathogenic fungi. SF22 (Chaetomium globosum) showed strongest anti-pathogen activity. Previousstudies demonstrated that some endophytic fungi could produce metabolites with antimicrobialfunction [6,37]. The endophytic extracts were screened for antifungal activity, and the resultsindicate that there were six endophytes exhibiting strong anti-pathogen activity. The extractsof SF22 (C. globosum) and SF14 (Penicillium minioluteum) were particularly effective in inhibitingpathogen growth. The dominant fungi, SF15 (Colletotrichum boninense), was less efficacious, thoughprevious studies reported that Colletotrichum sp. showed a broad range of antifungal activity [47].This phenomenon showed that there was no direct relationship between antifungal activity and fungalcolonization rate [36]. Chaetomium globosum was reported to have disease control capacity by producingchaetoviridins and chaetoglobosin [48,49]. The application of the culture filtrates of C. globosum tomaize showed efficacy in the inhibition of northern corn leaf blight [48]. Penicillium sp. was alsoreported to be efficacious against plant pathogenic fungi [50] and, interestingly, P. minioluteum attractedmore attention for its beneficial effects on plant stress tolerance [51]. The growth inhibitory activityagainst plant pathogenic fungi by these endophytes indicates that endophytic fungi have the potentialto be used as biocontrol agents in the future.
193

Forests 2019, 10, 33
5. Conclusions
This study is the first to investigate the diversity of endophytic fungi in L. cubeba. The resultsdemonstrated that L. cubeba harbors a rich fungal endophytic community with antimicrobial activities.SF22 (C. globosum) and SF14 (P. minioluteum) were found to have anti-pathogenic fungi properties and,thus, could be sources of novel natural antimicrobial compounds. Meanwhile, the results highlightedthe potential use of endophytes in the development of drugs and the conservation of medicinal plants.
Author Contributions: L.Z. designed the study; D.Y. and Y.C. carried out the experiment and analyzed the data.F.W. wrote the first draft of the manuscript; F.W., D.Y., L.Z., Y.C., X.H., L.L. and J.L. contributed with suggestionsand corrections, and approved the final manuscript. F.W. and D.Y. contributed equally to this work.
Funding: This work was supported by the National Natural Science Foundation of China [grant numbers31660189, 31570594], and Hunan Provincial Natural Science Foundation of China (2018JJ2217, 2018JJ3281).
Acknowledgments: The authors thank Key Laboratory of State Forestry Administration on Forest EcosystemProtection and Restoration of Poyang Lake Watershed (JXAU) for providing experimental equipment support.
Conflicts of Interest: The authors declare no conflict of interest.
References
1. Marr, A.K.; Gooderham, W.J.; Hancock, R.E. Antibacterial Peptides for Therapeutic Use: Obstacles andRealistic Outlook. Curr. Opin. Pharmacol. 2006, 6, 468–472. [CrossRef] [PubMed]
2. Strobel, G.; Daisy, B. Bioprospecting for Microbial Endophytes and Their Natural Products. Microbiol. Mol.Biol. Rev. 2003, 67, 491–502. [CrossRef] [PubMed]
3. Petersen, P.J.; Wang, T.; Dushin, R.G.; Bradford, P.A. Comparative in Vitro Activities of Ac98-6446, a NovelSemisynthetic Glycopeptide Derivative of the Natural Product Mannopeptimycin A, and Other AntimicrobialAgents against Gram-Positive Clinical Isolates. Antimicrob. Agents Chemother. 2004, 48, 739–746. [CrossRef][PubMed]
4. Baldrian, P. Forest Microbiome: Diversity, Complexity and Dynamics. Fems Microbiol. Rev. 2017, 41, 109–130.[CrossRef]
5. Lewis, S.L.; Edwards, D.P.; Galbraith, D. Increasing Human Dominance of Tropical Forests. Science2015, 349, 827–832. [CrossRef] [PubMed]
6. Porrasalfaro, A.; Bayman, P. Hidden Fungi, Emergent Properties: Endophytes and Microbiomes. Annu. Rev.Phytopathol. 2011, 49, 291–315. [CrossRef] [PubMed]
7. Suryanarayanan, T.S.; Thirunavukkarasu, N.; Rajulu, M.B.G.; Venkatesan, G.; Sukumar, R. EndophyticFungal Communities in Woody Perennials of Three Tropical Forest Types of the Western Ghats, SouthernIndia. Biodivers. Conserv. 2011, 20, 913–928. [CrossRef]
8. Aly, A.H.; Debbab, A.; Kjer, J.; Proksch, P. Fungal Endophytes from Higher Plants: A Prolific Source ofPhytochemicals and Other Bioactive Natural Products. Fungal Divers. 2010, 41, 1–16. [CrossRef]
9. Ownley, B.H.; Gwinn, K.D.; Vega, F.E. Endophytic Fungal Entomopathogens with Activity against PlantPathogens: Ecology and Evolution. BioControl 2010, 55, 113–128. [CrossRef]
10. Rubini, M.R.; Silva-Ribeiro, R.T.; Pomella, A.W.V.; Maki, C.S.; Araújo, W.L.; Santos, D.R.D.; Azevedo, J.L.Diversity of Endophytic Fungal Community of Cacao (Theobroma cacao L.) and Biological Control of Crinipellisperniciosa,Causal Agent of Witches’ Broom Disease. Int. J. Biol. Sci. 2005, 1, 24–33. [CrossRef]
11. Stierle, A.; Strobel, G.; Stierle, D. Taxol and Taxane Production by Taxomyces Andreanae, an EndophyticFungus of Pacific Yew. Science 1993, 260, 214–216. [CrossRef] [PubMed]
12. Stierle, A.; Strobel, G.; Stierle, D.; Grothaus, P.; Bignami, G. The Search for a Taxol-Producing Microorganismamong the Endophytic Fungi of the Pacific Yew, Taxus Brevifolia. J. Nat. Prod. 1995, 58, 1315–1324. [CrossRef][PubMed]
13. Kour, A.; Shawl, A.S.; Rehman, S.; Sultan, P.; Qazi, P.H.; Suden, P.; Khajuria, R.K.; Verma, V. Isolation andIdentification of an Endophytic Strain of Fusarium Oxysporum Producing Podophyllotoxin from JuniperusRecurva. World J. Microbiol. Biotechnol. 2008, 24, 1115–1121. [CrossRef]
14. Bérdy, J. Bioactive Microbial Metabolites. J. Antibiot. 2005, 58, 1–26. [CrossRef] [PubMed]
194

Forests 2019, 10, 33
15. Ganley, R.J.; Brunsfeld, S.J.; Newcombe, G. A Community of Unknown, Endophytic Fungi in Western WhitePine. Proc. Natl. Acad. Sci. USA 2004, 101, 10107–10112. [CrossRef] [PubMed]
16. Jin, Z.; Li, D.; Liu, T.; Yu, F.; Zhang, Z.; Su, C.; Wang, Y.; Guo, Q.; Liu, Z. Cultural Endophytic FungiAssociated with Dendrobium Officinale: Identification, Diversity Estimation and Their Antimicrobial Potential.Curr. Sci. 2017, 112, 1690–1697. [CrossRef]
17. Wang, F.; Chang, Z.; Duan, P.; Yan, W.; Xu, Y.; Zhang, L.; Miao, J.; Fan, Y. Hydrothermal Liquefaction of LitseaCubeba Seed to Produce Bio-Oils. Bioresour. Technol. 2013, 149, 509–515. [CrossRef] [PubMed]
18. Feng, T.; Xu, Y.; Cai, X.H.; Du, Z.Z.; Luo, S.D. Antimicrobially Active Isoquinoline Alkaloids from LitseaCubeba. Planta Med. 2009, 75, 76–79. [CrossRef]
19. Lin, B.; Zhang, H.; Zhao, X.X.; Rahman, K.; Wang, Y.; Ma, X.Q.; Zheng, C.J.; Zhang, Q.Y.; Han, T.;Qin, L.P. Inhibitory Effects of the Root Extract of Litsea cubeba (Lour.) Pers. on Adjuvant Arthritis inRats. J. Ethnopharmacol. 2013, 147, 327–334. [CrossRef] [PubMed]
20. Wang, H.W.; Liu, Y.Q. Chemical Composition and Antibacterial Activity of Essential Oils from DifferentParts of Litsea cubeba. Chem. Biodivers. 2010, 7, 229–235. [CrossRef]
21. Ho, C.L.; Jie-Ping, O.; Liu, Y.C.; Hung, C.P.; Tsai, M.C.; Liao, P.C.; Wang, E.I.; Chen, Y.L.; Su, Y.C. Compositionsand in Vitro Anticancer Activities of the Leaf and Fruit Oils of Litsea cubeba from Taiwan. Nat. Prod. Commun.2010, 5, 617–620. [PubMed]
22. Wang, Y.; Chen, J.; Li, D.W.; Zheng, L.; Huang, J. CglCUT1 gene required for cutinase activity andpathogenicity of Colletotrichum gloeosporioides causing anthracnose of Camellia oleifera. Eur. J. Plant Pathol.2017, 147, 103–114. [CrossRef]
23. Wulff, E.G.; Sorensen, J.L.; Lubeck, M.; Nielsen, K.F.; Thrane, U.; Torp, J. Fusarium spp. associated with riceBakanae: Ecology, genetic diversity, pathogenicity and toxigenicity. Environ. Microbiol. 2010, 12, 649–657.[CrossRef] [PubMed]
24. Tanaka, A.; Shiotani, H.; Yamamoto, M.; Tsuge, T. Insertional mutagenesis and cloning of the genes requiredfor biosynthesis of the host-specific AK-toxin in the Japanese pear pathotype of Alternaria alternata. Mol. PlantMicrob. Interact. 1999, 12, 691–702. [CrossRef]
25. Jaegoon, L.; Donghyun, L.; Sookyoung, P.; Jaeseoun, H.; Youngjin, K. First report of Diaporthe actinidiae,the causal organism of stem-end rot of kiwifruit in Korea. Plant Pathol. J. 2001, 17, 110–113.
26. Boa, E.R. Recent Research on Bamboos; The Chinese Academy of Forestry: Hanzhou, China, 1985.27. Nagarajkumar, M.; Bhaskaran, R.; Velazhahan, R. Involvement of secondary metabolites and extracellular
lytic enzymes produced by Pseudomonas fluorescens in inhibition of Rhizoctonia solani, the rice sheath blightpathogen. Microbiol. Res. 2004, 159, 73–81. [CrossRef]
28. Foster, J.M.; Hausbeck, M.K. Managing Phytophthora Crown and Root Rot in Bell Pepper Using Fungicidesand Host Resistance. Plant Dis. 2010, 94, 697–702. [CrossRef]
29. Jin, Z.; Gao, L.; Zhang, L.; Liu, T.; Yu, F.; Zhang, Z.; Guo, Q.; Wang, B. Antimicrobial Activity of SaponinsProduced by Two Novel Endophytic Fungi from Panax notoginseng. Nat. Prod. Res. 2017, 31, 2700–2703.[CrossRef]
30. Morakotkarn, D.; Kawasaki, H.; Seki, T. Molecular Diversityof Bamboo-Associated Fungi Isolated fromJapan. FEMS Microbiol. Lett. 2007, 266, 10–19. [CrossRef]
31. White, T.J.; Bruns, T.; Lee, S.; Taylor, J. Amplification and Direct Sequencing of Fungal Ribosomal Rna Genesfor Phylogenetics. In PCR Protocols: A Guide to Methods and Applications; Academic Press: San Diego, CA,USA, 1990; Volume 18, pp. 315–322.
32. Tamura, K.; Peterson, D.; Peterson, N.; Stecher, G.; Nei, M.; Kumar, S. Mega5: Molecular EvolutionaryGenetics Analysis Using Maximum Likelihood, Evolutionary Distance, and Maximum Parsimony Methods.Mol. Biol. Evol. 2011, 28, 2731–2739. [CrossRef]
33. Nascimento, T.L.; Oki, Y.; Lima, D.M.M.; Almeida-Cortez, J.S.; Fernandes, G.W.; Souza-Motta, C.M.Biodiversity of Endophytic Fungi in Different Leaf Ages of Calotropis procera and Their AntimicrobialActivity. Fungal Ecol. 2015, 14, 79–86. [CrossRef]
34. Yuan, Z.L.; Zhang, C.L.; Lin, F.C.; Kubicek, C.P. Identity, Diversity, and Molecular Phylogeny of theEndophytic Mycobiota in the Roots of Rare Wild Rice (Oryza granulate) from a Nature Reserve in Yunnan,China. Appl. Environ. Microbiol. 2010, 76, 1642–1652. [CrossRef]
195

Forests 2019, 10, 33
35. Kusari, P.; Kusari, S.; Spiteller, M.; Kayser, O. Endophytic Fungi Harbored in Cannabis sativa L.: Diversity andPotential;as Biocontrol Agents against Host Plant-Specific Phytopathogens. Fungal Divers. 2013, 60, 137–151.[CrossRef]
36. Gond, S.K.; Mishra, A.; Sharma, V.K.; Verma, S.K.; Kumar, J.; Kharwar, R.N.; Kumar, A. Diversity andAntimicrobial Activity of Endophytic Fungi Isolated from Nyctanthes arbor-tristis, a Well-Known MedicinalPlant of India. Mycoscience 2012, 53, 113–121. [CrossRef]
37. Katoch, M.; Phull, S.; Vaid, S.; Singh, S. Diversity, Phylogeny, Anticancer and Antimicrobial Potentialof Fungal Endophytes Associated with Monarda citriodora L. BMC Microbiol. 2017, 17, 44–57. [CrossRef][PubMed]
38. Liang, H.; Xing, Y.; Chen, J.; Zhang, D.; Guo, S.; Wang, C. Antimicrobial Activities of Endophytic FungiIsolated from Ophiopogon japonicus (Liliaceae). BMC Complement. Altern. Med. 2012, 12, 238–244. [CrossRef][PubMed]
39. Gherbawy, Y.A.; Gashgari, R.M. Molecular Characterization of Fungal Endophytes from Calotropis proceraPlants in Taif Region (Saudi Arabia) and Their Antifungal Activities. Plant Biosyst. 2014, 148, 1085–1092.[CrossRef]
40. Schoch, C.L.; Gi-Ho, S.; Francesc, L.G.; Townsend, J.P.; Jolanta, M.; Valérie, H.; Barbara, R.; P Brandon, M.;Frank, K.; Zheng, W. The Ascomycota Tree of Life: A Phylum-Wide Phylogeny Clarifies the Origin andEvolution of Fundamental Reproductive and Ecological Traits. Syst. Biol. 2009, 58, 224–239. [CrossRef]
41. Jumpponen, A.; Jones, K. Massively Parallel 454 Sequencing Indicates Hyperdiverse Fungal Communities inTemperate Quercus Macrocarpa phyllosphere. New Phytol. 2009, 184, 438–448. [CrossRef]
42. Ho, M.Y.; Chung, W.C.; Huang, H.C.; Chung, W.H.; Chung, W.H. Identification of Endophytic Fungi ofMedicinal Herbs of Lauraceae and Rutaceae with Antimicrobial Property. Taiwania 2012, 57, 229–241.
43. Šamonil, P.; Valtera, M.; Bek, S.; Šebková, B.; Vrška, T.; Houška, J. Soil Variability through Spatial Scales in aPermanently Disturbed Natural Spruce-Fir-Beech Forest. Eur. J. For. Res. 2011, 130, 1075–1091. [CrossRef]
44. Lebeis, S.L. Greater Than the Sum of Their Parts: Characterizing Plant Microbiomes at the Community-Level.Curr. Opin. Plant Biol. 2015, 24, 82–86. [CrossRef] [PubMed]
45. Vorholt, J.A. Microbial Life in the Phyllosphere. Nat. Rev. Microbiol. 2012, 10, 828–840. [CrossRef] [PubMed]46. Tan, R.X.; Zou, W.X. Endophytes: A Rich Source of Functional Metabolites. Nat. Prod. Rep. 2001, 18, 448–459.
[CrossRef] [PubMed]47. Zou, W.; Meng, J.; Lu, H.; Chen, G.; Shi, G.; Zhang, T.; Tan, R. Metabolites of Colletotrichum gloeosporioides,
an Endophytic Fungus in Artemisia Mongolica. J. Nat. Prod. 2000, 63, 1529–1530. [CrossRef] [PubMed]48. Zhang, G.; Wang, F.; Qin, J.; Wang, D.; Zhang, J.; Zhang, Y.; Zhang, S.; Pan, H. Efficacy Assessment of
Antifungal Metabolites from Chaetomium globosum No. 05, a New Biocontrol Agent, against Setosphaeriaturcica. Biol. Control 2013, 64, 90–98. [CrossRef]
49. Park, J.H.; Choi, G.J.; Jang, K.S.; Lim, H.K.; Kim, H.T.; Cho, K.Y.; Kim, J.C. Antifungal Activity againstPlant Pathogenic Fungi of Chaetoviridins Isolated from Chaetomium globosum. FEMS Microbiol. Lett.2005, 252, 309–313. [CrossRef]
50. Yang, L.; Xie, J.; Jiang, D.; Fu, Y.; Li, G.; Lin, F. Antifungal Substances Produced by Penicillium oxalicum StrainPy-1—Potential Antibiotics against Plant Pathogenic Fungi. World J. Microbiol. Biotechnol. 2008, 24, 909–915.[CrossRef]
51. Sahoo, S.; Sarangi, S.; Kerry, R.G. Bioprospecting of Endophytes for Agricultural and EnvironmentalSustainability. Microb. Biotechnol. 2017, 429–458.
© 2019 by the authors. Licensee MDPI, Basel, Switzerland. This article is an open accessarticle distributed under the terms and conditions of the Creative Commons Attribution(CC BY) license (http://creativecommons.org/licenses/by/4.0/).
196

Article
Variation in Photosynthetic Traits and Correlationwith Growth in Teak (Tectona grandis Linn.) Clones
Guihua Huang 1,*, Kunnan Liang 1, Zaizhi Zhou 1, Guang Yang 1 and
Enarth Maviton Muralidharan 2
1 Research Institute of Tropical Forestry, Chinese Academy of Forestry, Guangzhou 510520, China;[email protected] (K.L.); [email protected] (Z.Z.); [email protected] (G.Y.)
2 Kerala Forest Research Institute, Peechi, Kerala 680653, India; [email protected]* Correspondence: [email protected]; Tel.: +86-20-8703-2929
Received: 24 July 2018; Accepted: 10 September 2018; Published: 10 January 2019
Abstract: In order to interpret the patterns of genetic variation of photosynthesis and the relationshipswith growth traits within gene resources of teak (Tectona grandis Linn.), gas exchange, and chlorophyllfluorescence parameters, growth traits of plants in nursery and field trials were measured for 20 teakclones originated from different countries. The results show that there was abundant genetic variationin gas exchange, chlorophyll fluorescence, and growth among the teak clones. The measured traitswere found to have generally high heritability (h2) except for intercellular concentration of carbondioxide (CO2) (Ci). The net photosynthetic rate (Pn), seedling height, and individual volume of woodwere significantly correlated with each other, and seedling height was significantly correlated withplant height in field trials, suggesting that Pn and seedling height can be useful in teak breeding.Teak clones 7029, 71-5, 7219, 7412, and 7122, and provenances 3070, 3074, and 3071 had higherphotosynthetic rates, and can be regarded as a key resource in teak improvement programs. This workprovides useful information for teak breeding and germplasm resource management.
Keywords: gas exchange; chlorophyll fluorescence; growth trait; genetic variation; early selection
1. Introduction
Teak (Tectona grandis Linn.) is naturally distributed in India, Thailand, Myanmar, and Laos [1,2].Its desirable hardwood properties, fine grain, and durability have made teak the luxury timber forfurniture making, carving, and building around the world [3,4]. Due to its economical importance,teak has been introduced widely in the tropical regions since the 19th century, especially in Asia, Africa,Central America, and South America [5].
As one of the most valuable wood species in international markets, teak plantations havedeveloped rapidly in the recent decade. Developing high productivity and uniform clones thatcan be used for plantations in different regions has become an important objective of teak breeding.Information on variation of photosynthetic parameters and their relationship with growth traitshelp us understand underlying processes and responses, and will be useful in tree improvementprograms. During the growth process of plants, organic compounds are generated by photosynthesis,and gradually accumulate in trunks. The photosynthetic characteristics are the main measurableindicators of plant growth rates [6]. Numerous studies on breeding for high photosynthetic ability incrops have been conducted, to improve the yield [7–9], but studies on forest trees are limited [10–12].Chu et al. 2010 [10] studied gas exchange and chlorophyll fluorescence parameters, as well as theirrelationship with the growth of Populus nigra, and found that the species originating in Serbia,southern and east Europe can be regarded as a resource with high light-use efficiency for futurebreeding. Teak has broad leaves and prefers warmth and sunlight, and developing clones with
Forests 2019, 10, 44; doi:10.3390/f10010044 www.mdpi.com/journal/forests197

Forests 2019, 10, 44
high productivity and uniformity by evaluating photosynthetic characteristics can be an importantgoal in teak breeding. In the past, teak breeding was mainly focused on the analysis of growthindices in field experiments [13,14], and studies on photosynthetic physiology of teak are limited tothose on photosynthetic responses of a single clone to simulated acid rain stress [15], photosyntheticphysiological characteristics under different disturbance intensities among teak plants [16], and diurnaland seasonal photosynthetic characteristics in teak clones [17]. However, studies on teak germplasmor clones, which systematically estimate photosynthetic characteristics and correlation with growth,have not been reported.
The purpose of this study was (1) to investigate the genetic variation of photosynthetic parametersand growth traits of teak clones, (2) to reveal the correlation, if any, between photosyntheticcharacteristics and growth traits within the gene resources of teak, and (3) to evaluate and selectsuperior teak resources possessing high photosynthetic efficiency for breeding.
2. Materials and Methods
2.1. Materials
A total of 20 widely cultivated teak clones propagated through tissue culture were investigated inthis study. The 20 clones were selected from international provenance trial planted at Jianfeng, Hainan,China, by the Research Institute of Tropical Forestry of Chinese Academy of Forestry (RITF-CAF).A complete list of accessions with descriptions and origins is given in Table 1. Among these accessions,10 were clones originating from India, 9 were from Myanmar sources and 1 from Nigeria.
Table 1. Information of 20 commercial teak clones investigated in the study.
Clone Name Provenance Name Longitude Latitude Altitude (m) Annual Rain Fall (mm)
Clones from India provenances
7013 3070 77◦20′ E 08◦00′ N 700 12707029 3070 77◦20′ E 08◦00′ N 700 127071-5 3071 76◦47′ E 10◦30′ N 640 20307114 3071 76◦47′ E 10◦30′ N 640 20307122 3071 76◦47′ E 10◦30′ N 640 20307146 3071 76◦47′ E 10◦30′ N 640 20307137 3071 76◦47′ E 10◦30′ N 640 20307210 3072 76◦10′ E 11◦55′ N 823 12707219 3072 76◦10′ E 11◦55′ N 823 12707412 3074 74◦28′ E 15◦12′ N 43 2032
Clones from planted provenances in China (Myanmar source but no detailed records of origin)
Z408 20001 110◦14′ E 21◦07′ N 60 16507509 8204 108◦42′ E 18◦51′ N 60 16007514 8204 108◦42′ E 18◦51′ N 60 16007531 8204 108◦42′ E 18◦51′ N 60 16007544 8204 108◦42′ E 18◦51′ N 60 16007549 8204 108◦42′ E 18◦51′ N 60 16007555 8204 108◦42′ E 18◦51′ N 60 16007559 8204 108◦42′ E 18◦51′ N 60 16008301 8204 108◦42′ E 18◦51′ N 60 1600
Clone from Nigeria provenance
3078-5 3078 03◦52′ E 07◦10′ N 700 1900
2.2. Experimental Design and Growth Parameter Measurement
The young in vitro plantlets of teak clones were transplanted to a sterilized sand bed in thegreenhouse at the Research Institute of Tropical Forestry, Chinese Academy of Forestry (RITF-CAF),in Guangzhou (113◦18′ E, 23◦06′ N). One month later, healthy and uniform seedlings (Ramets derived
198

Forests 2019, 10, 44
from each clone) about 6 cm in height were transplanted into plastic pots filled with a mixture of lateriticred soil, black peat, vermiculite, and perlite (2:2:1:1, v/v/v/v)—one seedling per pot. A completelyrandomized block design was used in this nursery experiment with 5 seedlings in one row per plot,6 repeats in total with 40 cm × 40 cm pot space. Seedling height and collar diameter of all seedlings inthe nursery were measured at the age of one year.
Field trial was carried out at Dingan in Hainan Island (110◦19′ E, 19◦39′ N) and a completelyrandomized block design was used with 6 plants in one row per plot, 6 repeats in total,with 2.5 m × 4 m space. Plant height (H) and diameter at breast height (DBH) of each plant in fieldtrial were measured at the age of four years.
2.3. Physiological Parameter Measurement
Three seedlings in the nursery were randomly selected for each clone, 1 seedling per plot,3 repeats in total, in a completely randomized block design (to make sure the test was randomfor all 60 selected seedlings) and 3 functional leaves per seedling exposed to sunlight were chosenfor study. The gas exchange parameters including net photosynthetic rate (Pn), stomatal conductance(Gs), intercellular CO2 concentration (Ci), and transpiration rate (Tr) were measured on sunny daysbetween 8:45 and 11:30 in August 2013 with a Li-6400 portable photosynthetic apparatus (LI-CORCo. Lincoln, NE, USA) at the nursery of RITF-CAF, in Guangzhou. A leaf chamber automatic light(800 μmol·m−2·s−1) was used when testing, with CO2 concentration 380 ± 15 μmol·mol−1, temperatureof the leaf chamber 30–38 ◦C, and a relative humidity 58%–68% recorded by the photosyntheticapparatus under natural conditions. Three stable values were recorded for each leaf. Chlorophyllfluorescence characteristics were measured at the same time using the German PAM-2500 Walz portablefluorescence spectrometer, the saturation pulse intensity was 4500 mol·m−2·s−1, and actinic intensitywas 1000 mol·m−2·s−1. The actual quantum yield PSII (Yield), non-photochemical quenching (NPQ)and maximum photochemical efficiency of PSII (Fv/Fm) were also measured [18,19]. The calculationformula for Yield is Yield = (Fm’ − Ft)/Fm’, where Fm’ is referred to maximum fluorescence under lightadaptation, and Ft denotes real fluorescence at any given time. The formula of NPQ = Fm/Fm’ − 1;(Fv/Fm) = (Fm − Fo)/Fm, and Fo, Fm, and Fv refer to dark-adapted initial fluorescence, maximumfluorescence, and variable fluorescence, respectively. Before testing, 20 min shading treatment wascarried out with a blade holder to ensure selected leaves had dark adaptation for a long enough periodof time.
2.4. Data Analysis
Water use efficiency (WUE) was calculated by the formula WUE = Pn/Tr [20], and the coefficient ofvariation was calculated by the formula C = S/X, where S is the standard deviation, and X is the overallaverage value of each index. Clone heritability was calculated with the formula h2 = 1 − 1/F [21],where F is test statistic of clones in variance analysis. Individual volume of wood was calculatedby the formula V = 0.4787D2H, where D is DBH, and H is plant height of field trial [22]. Varianceand Duncan’s multiple comparison analyses were conducted for each parameter, and correlationanalyses (using Pearson’s product-moment correlations) between photosynthetic parameters, wateruse efficiency, and growth index, were performed using SAS software (version 8.1).
3. Results
3.1. Gas Exchange, Chlorophyll Fluorescence, and Growth Traits of Different Teak Clones
Variance analysis of gas exchange, chlorophyll fluorescence, and growth parameters among teakclones are shown in Table 2. There is a significant difference in the photosynthetic parameters, wateruse efficiency, and growth index but not for intercellular CO2 concentration (Ci). In addition, apartfrom Ci (h2 = 0.145) and NPQ (h2 = 0.168), other parameters had high heritability (h2 = 0.670–0.903),
199

Forests 2019, 10, 44
with actual quantum yield PSII (Yield) having the highest heritability (h2 = 0.903), suggesting a stronggenetic influence on the function, and that it is less affected by environment.
Table 2. Variance analysis (ANOVA) of gas exchange, chlorophyll fluorescence, water use efficiency,and growth parameters among teak clones.
Category Parameter F p Heritability (h2) Variation Coefficient
Gas exchange
Pn 5.46 <0.0001 *** 0.817 0.401Gs 4.53 <0.0001 *** 0.779 0.474Ci 1.17 0.3213 ns 0.145 0.111Tr 3.38 0.0004 *** 0.704 0.349
Chlorophyll fluorescenceNPQ 5.93 <0.0001 *** 0.168 0.447Yield 10.32 <0.0001 *** 0.903 0.294
Fv/Fm 3.03 0.0011 ** 0.670 0.028Water use efficiency WUE 10.32 <0.0001 *** 0.903 0.474
Seedling growth at 1 year Seedling height 3.39 <0.0001 *** 0.705 0.116Collar diameter 3.29 <0.0001 *** 0.696 0.102
Field growth at 4 years H 7.88 <0.0001 *** 0.873 0.092DBH 6.74 <0.0001 *** 0.852 0.167
Individual volume at 4 years V 7.24 <0.0001 *** 0.863 0.327
Note: Pn: net photosynthetic rate, Gs: stomatal conductance, Ci: intercellular CO2 concentration, Tr: transpirationrate, NPQ: non-photochemical quenching, Yield: the actual quantum yield PSII, Fv/Fm: maximum photochemicalefficiency of PSII, WUE: water use efficiency, H: height of field growth at 4 years, DBH: diameter at breast height offield growth at 4 years, V: individual volume at 4 years. ** indicate highly significant difference at p < 0.01 level ofprobability, *** more highly significant difference at p < 0.001 level of probability, and ns no significance.
Duncan’s multiple comparison analysis of photosynthetic and growth traits are listed in Tables 3–5.The ranges of the main parameters, such as Pn and Fv/Fm, were 4.45 ± 1.62–14.47 ± 0.32 μmol·m−2·s−1,0.67 ± 0.02–0.75 ± 0.01, respectively. Water use efficiency (WUE) was between 1.02 ± 0.36 and6.38 ± 1.25. Apart from the maximum photochemical efficiency of PSII Fv/Fm (0.028), the variationcoefficients of other parameters (0.092–0.474) were great, suggesting that the teak genotypes possessedextensive variation in these traits. Results indicated that there are suitable germplasm resources forbreeding of teak for high photosynthetic efficiency. Teak clones 7029, 71-5, 7219, 7412, and 7122 wereselected as clones with high net photosynthetic rate based on the results.
Table 3. Values of gas exchange parameters among teak clones from different countries.
Clone Pn (μmol·m−2·s−1) Gs (mol·m−2·s−1) Ci (μmol·mol−1) Tr (mmol·m−2·s−1)
7013 8.09 ± 3.76 defgh 0.14 ± 0.09 cdefgh 263.98 ± 7.95 ab 3.34 ± 1.58 abcde7029 14.19 ± 1.17 ab 0.23 ± 0.04 abcde 261.92 ± 7.42 ab 2.69 ± 0.28 cdefg71-5 13.50 ± 2.34 abc 0.28 ± 0.07 ab 290.25 ± 5.21 ab 3.04 ± 0.70 abcdef7114 9.87 ± 4.09 abcdefg 0.18 ± 0.10 bcdefg 237.06 ± 18.08 b 3.81 ± 1.61 abc7122 11.58 ± 2.02 abcd 0.25 ± 0.07 abcde 287.70 ± 8.14 ab 3.91 ± 0.71 abc7146 9.59 ± 1.30 bcdefgh 0.20 ± 0.03 abcdef 280.00 ± 3.58 ab 4.02 ± 0.59 abc7210 6.16 ± 0.77 efghij 0.08 ± 0.02 fgh 219.18 ± 28.34 b 2.07 ± 0.56 cdefg7219 14.47 ± 0.32 a 0.32 ± 0.02 a 287.80 ± 6.16 ab 3.97 ± 0.25 abc
3078-5 9.66 ± 2.87 abcdefgh 0.22 ± 0.07 abcde 292.56 ± 4.91 ab 3.80 ± 0.66 abc7412 11.01 ± 2.66 abcde 0.29 ± 0.09 ab 298.57 ± 18.78 ab 4.73 ± 0.97 a7509 7.04 ± 2.62 efghi 0.09 ± 0.05 fgh 220.30 ± 45.30 b 1.34 ± 0.80 fg7514 10.19 ± 0.66 abcdef 0.25 ± 0.03 abcd 295.67 ± 20.91 ab 3.33 ± 0.41 abcde7531 5.23 ± 3.07 ghij 0.12 ± 0.08 efgh 281.11 ± 3.07 ab 3.05 ± 1.80 abcdef7544 7.74 ± 2.27 defgh 0.17 ± 0.09 bcdefgh 284.34 ± 18.03 ab 2.97 ± 1.01 abcdef7549 4.92 ± 3.96 ij 0.07 ± 0.06 h 345.30 ± 199.15 a 0.95 ± 0.72 g7555 4.45 ± 1.62 j 0.06 ± 0.04 h 270.91 ± 41.52 ab 2.21 ± 0.89 cdefg7559 5.68 ± 4.55 fghij 0.12 ± 0.12 efgh 272.62 ± 33.65 ab 2.72 ± 2.32 bcdefg8301 7.40 ± 1.80 defgh 0.15 ± 0.04 cdefgh 268.42 ± 10.16 ab 3.55 ± 0.71 abcdZ408 8.78 ± 0.78 cdefgh 0.25 ± 0.03 abcde 310.87 ± 2.85 ab 4.30 ± 0.28 ab7137 10.04 ± 3.10 abcdefg 0.14 ± 0.09 cdefgh 224.10 ± 59.08 b 1.80 ± 0.87 defg
Note: Pn: net photosynthetic rate, Gs: stomatal conductance, Ci: intercellular CO2 concentration, Tr: transpirationrate. Values followed by the different letter of each group were significantly different at p < 0.05 level of probability.
200

Forests 2019, 10, 44
Table 4. Values of chlorophyll fluorescence parameters and WUE among teak clones.
Clone NPQ Yield Fv/Fm WUE
7013 0.773 ± 0.256 def 0.42 ± 0.07 bcd 0.69 ± 0.02 bcdef 2.43 ± 0.06 def7029 1.547 ± 0.397 abcde 0.35 ± 0.09 cdefg 0.72 ± 0.01 abcd 5.29 ± 0.12 ab71-5 1.785 ± 0.268 abc 0.21 ± 0.05 hi 0.70 ± 0.03 bcdef 4.48 ± 0.30 bc7114 0.891 ± 0.192 cdef 0.47 ± 0.01 ab 0.75 ± 0.01 a 2.60 ± 0.03 de7122 0.585 ± 0.104 ef 0.44 ± 0.01 bc 0.70 ± 0.01 bcdef 2.96 ± 0.03 de7146 0.834 ± 0.172 cdef 0.40 ± 0.03 bcde 0.70 ± 0.02 bcdef 2.39 ± 0.08 def7210 0.800 ± 0.285 def 0.41 ± 0.05 bcde 0.68 ± 0.01 def 3.05 ± 0.45 de7219 2.165 ± 0.147 a 0.25 ± 0.01 ghi 0.72 ± 0.03 abcd 3.66 ± 0.30cd
3078-5 1.528 ± 0.060 abcde 0.32 ± 0.01 defgh 0.71 ± 0.02 bcde 2.51 ± 0.31 def7412 0.421 ± 0.179 f 0.56 ± 0.04 a 0.72 ± 0.02 abcd 2.33 ± 0.34 def7509 2.079 ± 0.258 a 0.20 ± 0.05 i 0.67 ± 0.03 f 6.38 ± 2.82 a7514 1.978 ± 0.582 ab 0.20 ± 0.07 i 0.70 ± 0.01 bcdef 3.09 ± 0.37 de7531 1.006 ± 0.547 cdef 0.41 ± 0.10 bcde 0.71 ± 0.01 bcde 1.78 ± 0.30 ef7544 1.997 ± 0.531 ab 0.23 ± 0.04 hi 0.70 ± 0.01 bcdef 2.66 ± 0.36 de7549 1.646 ± 0.730 abcd 0.25 ± 0.10 ghi 0.73 ± 0.02 ab 5.16 ± 1.04 ab7555 1.578 ± 0.046 abcd 0.32 ± 0.03 defgh 0.69 ± 0.01 cdef 1.02 ± 0.36 f7559 1.737 ± 0.446 abcd 0.26 ± 0.06 fghi 0.67 ± 0.02 f 2.03 ± 0.49 ef8301 1.085 ± 0.166 bcdef 0.37 ± 0.05 bcdef 0.70 ± 0.02 bcdef 2.07 ± 0.19 efZ408 1.215 ± 0.732 abcdef 0.36 ± 0.12 cdefg 0.71 ± 0.01 bcde 2.04 ± 0.08 ef7137 1.398 ± 0.212 abcde 0.31 ± 0.04 efghi 0.73 ± 0.03 abc 5.98 ± 1.25 a
Note: NPQ: non-photochemical quenching, Yield: the actual quantum yield PSII, Fv/Fm: maximum photochemicalefficiency of PSII, WUE: water use efficiency. Values followed by the different letter of each group were significantlydifferent at p < 0.05 level of probability.
Table 5. Values of growth traits among teak clones from different countries.
CloneSeedling Height
(cm)Collar Diameter
(mm)H (m) DBH (cm)
IndividualVolume (dm3)
7013 48.67 ± 8.16 cdefg 10.19 ± 2.18 bcdef 4.35 ± 1.03 cdefg 4.38 ± 1.40 bcde 6.25 ± 4.50 efghi7029 61.13 ± 15.51 a 11.12 ± 2.39 abcd 4.87 ± 0.92 ab 5.37 ± 1.58 ab 11.01 ± 7.56 ab71-5 53.63 ± 6.85 abcd 10.32 ± 1.79 bcde 3.98 ± 0.66 fghi 4.44 ± 1.59 bcde 6.79 ± 4.80 defghi7114 44.33 ± 12.64 defg 9.53 ± 2.37 def 4.43 ± 0.68 bcdefg 5.03 ± 1.27 abc 9.12 ± 5.04 bcde7122 59.53 ± 13.65 ab 12.63 ± 3.03a 4.88 ± 0.60 ab 5.32 ± 1.10 ab 9.97 ± 4.21 bcd7146 48.87 ± 11.21 cdefg 10.97 ± 2.63 abcde 4.24 ± 1.02 defgh 4.78 ± 1.76 bcd 8.01 ± 6.75 bcdefg7210 52.07 ± 10.82 abcde 8.65 ± 1.58 f 4.19 ± 0.81 efgh 3.88 ± 1.25 cdef 6.39 ± 3.29 efghi7219 51.07 ± 10.03 bcdef 9.97 ± 2.23 cdef 3.97 ± 0.61 fghi 4.48 ± 1.48 bcde 8.26 ± 6.95 bcdef
3078-5 49.80 ± 9.40 cdef 9.95 ± 1.53 cdef 5.07 ± 0.99 a 6.05 ± 1.91 a 13.59 ± 7.06 a7412 44.53 ± 11.45 defg 9.95 ± 2.08 cdef 4.28 ± 0.77 defgh 4.68 ± 1.53 bcde 8.63 ± 7.49 bcdef7509 41.07 ± 10.71 gf 9.75 ± 2.00 def 4.41 ± 1.13 bcdefg 5.96 ± 5.79 a 8.26 ± 5.85 bcdef7514 44.93 ± 15.40 defg 9.28 ± 1.43 def 4.71 ± 0.84 abcd 4.79 ± 1.27 bcd 10.75 ± 6.18 abc7531 39.40 ± 12.33 g 9.35 ± 2.42 def 3.65 ± 1.11 ij 3.53 ± 1.52 ef 2.81 ± 2.05 j7544 46.80 ± 9.84 cdefg 10.76 ± 2.47 abcde 4.36 ± 0.89 cdefg 4.20 ± 1.43 bcdef 5.71 ± 3.46 fghij7549 42.20 ± 17.77 efg 9.40 ± 3.57 def 4.18 ± 0.80 efgh 4.34 ± 1.17 bcde 5.38 ± 3.39 fghij7555 46.60 ± 7.40 cdefg 11.84 ± 1.45 abc 4.38 ± 0.63 cdefg 4.36 ± 0.83 bcde 6.18 ± 3.14 efghi7559 55.60 ± 12.16 abc 12.33 ± 2.54 a 4.59 ± 1.00 bcde 5.09 ± 1.77 abc 9.18 ± 5.61 bcde8301 50.47 ± 15.18 bcdef 10.30 ± 2.81 bcdef 4.79 ± 1.07 abc 4.18 ± 1.11 bcdef 8.00 ± 5.43 bcdefgZ408 45.87 ± 10.12 defg 12.01 ± 2.37ab 3.97 ± 0.82 fghi 3.62 ± 1.22 def 4.06 ± 2.66 ij7137 45.00 ± 8.60 defg 9.95 ± 2.26 cdef 4.33 ± 0.82 cdefg 4.23 ± 1.57 bcdef 8.33 ± 3.83 bcdef
Note: H: height of field growth at 4 years, DBH: diameter at breast height of field growth at 4 years. Values followedby the different letter of each group were significantly different at p < 0.05 level of probability.
3.2. Characteristics of Gas Exchange and Chlorophyll Fluorescence of Teak Resources from Different Regions
As shown in Table 6, net photosynthetic rate (Pn), stomatal conductance (Gs), transpirationrate (Tr), and non-photochemical quenching (NPQ), and actual quantum yield (Yield) of PSII weresignificantly different among teak provenances.
201

Forests 2019, 10, 44
Table 6. Variance analysis of photosynthetic parameters among teak clones from different provenances.
Category ParameterAmong Provenances
F p
Gas exchange
Pn 3.52 0.0033 **Gs 3.19 0.0062 **Ci 1.13 0.3667 ns
Tr 5.40 0.0001 ***
Chlorophyll fluorescenceNPQ 3.38 0.007 **Yield 5.59 <0.0001 ***
Fv/Fm 1.95 0.0758 ns
Note: Pn: net photosynthetic rate, Gs: stomatal conductance, Ci: intercellular CO2 concentration, Tr: transpirationrate, NPQ: non-photochemical quenching, Yield: the actual quantum yield PSII, Fv/Fm: maximum photochemicalefficiency of PSII. ** indicate highly significant difference at p < 0.01 level of probability, *** more highly significantdifference at p < 0.001 level of probability, and ns no significance.
Among the teak provenances (Table 7), 3070, 3074, and 3071 had higher Pn, 3074 had higher Gs
and Tr, while 20001 and 3074 had a higher Ci value. While 8204, 3078, and 3072 showed high NPQvalue (Table 8), 3074, 3071, and 3070 had higher Yield and Fv/Fm values. These results suggest thatdifferent teak provenances have different photosynthetic physiological characteristics. Provenances3070, 3074, and 3071 can be considered to have high photosynthetic rates.
Table 7. Values of gas exchange parameters among teak clones from different provenances.
Provenance Pn (μmol·m−2 s−1) Gs (mol·m−2 s−1) Ci (μmol·mol−1) Tr (mmol·m−2 s−1)
20001 8.775 ± 0.776 ab 0.248 ± 0.032 abc 310.865 ± 2.848 a 4.296 ± 0.280 ab3070 11.142 ± 4.169 a 0.187 ± 0.075 abc 262.948 ± 6.970 a 3.014 ± 1.075 bc3071 10.914 ± 2.769 ab 0.210 ± 0.084 abc 263.820 ± 37.149 a 3.317 ± 1.189 abc3072 10.316 ± 4.583 ab 0.196 ± 0.133 abc 253.485 ± 41.822 a 3.022 ± 1.112 bc3074 11.011 ± 2.663 a 0.287 ± 0.091 a 298.570 ± 18.778 a 4.730 ± 0.967 a8204 6.333 ± 3.189 bc 0.129 ± 0.084 cd 279.833 ± 67.715 a 2.515 ± 1.303 cd3078 9.657 ± 2.869 ab 0.223 ± 0.072 abc 292.562 ± 4.907 a 3.798 ± 0.657 abc
Note: Pn: net photosynthetic rate, Gs: stomatal conductance, Ci: intercellular CO2 concentration, Tr: transpirationrate. Values followed by the different letter of each group were significantly different at p < 0.05 level of probability.
Table 8. Values of chlorophyll fluorescence parameters among teak clones from different provenances.
Provenance NPQ Yield Fv/Fm
20001 1.215 ± 0.732 a 0.359 ± 0.120 b 0.706 ± 0.007 ab3070 1.160 ± 0.519 a 0.385 ± 0.085 b 0.709 ± 0.022 ab3071 1.098 ± 0.478 ab 0.368 ± 0.102 b 0.714 ± 0.028 a3072 1.483 ± 0.775 a 0.329 ± 0.090 b 0.703 ± 0.028 ab3074 0.421 ± 0.179 b 0.564 ± 0.045 a 0.718 ± 0.022 a8204 1.638 ± 0.550 a 0.281 ± 0.087 b 0.695 ± 0.025 b3078 1.528 ± 0.060 a 0.318 ± 0.012 b 0.707 ± 0.016 ab
Note: NPQ: non-photochemical quenching, Yield: the actual quantum yield PSII, Fv/Fm: maximum photochemicalefficiency of PSII. Values followed by the different letter of each group were significantly different at p < 0.05 levelof probability.
3.3. Correlations between Photosynthetic and Growth Traits
Correlation analyses (Table 9) of teak clone parameters showed that Pn had significant positivecorrelation with Gs, Tr, Fv/Fm, seedling height and individual volume, respectively. Pn values cantherefore be regarded as a critical parameter in teak breeding, indicating potential for faster growth.
202

Forests 2019, 10, 44
Ta
ble
9.
Cor
rela
tion
anal
ysis
amon
gph
otos
ynth
etic
char
acte
rist
ics,
grow
thtr
aits
,and
ecol
ogic
alfa
ctor
sof
teak
clon
es.
Pn
Gs
Ci
Tr
NP
QY
ield
F v/F
mW
UE
Seed
lin
gH
eig
ht
Co
llar
Dia
mete
rH
DB
HV
P n Gs
0.89
1**
Ci
0.05
70.
345
Tr
0.56
8**
0.80
2**
0.28
6N
PQ0.
062
−0.0
090.
090
−0.4
26Yi
eld
0.13
50.
228
0.03
00.
580
**−0
.944
**F v
/Fm
0.43
0*
0.40
50.
254
0.31
8−0
.164
0.39
1W
UE
0.38
00.
030
0.25
40.
469
*0.
404
−0.3
960.
143
Seed
ling
Hei
ght
0.46
3*
0.34
30.
029
0.21
9−0
.061
0.03
8−0
.184
0.01
5C
olla
rdi
amet
er−0
.048
0.03
90.
162
0.11
2−0
.04
−0.1
14−0
.319
−0.2
620.
498
*H
0.15
60.
058
0.10
40.
067
0.00
7−0
.003
−0.0
960.
029
0.48
6*
0.25
8D
BH0.
294
0.15
0.15
4−0
.004
0.19
7−0
.139
−0.1
110.
314
0.29
40.
136
0.70
7**
V0.
491
*0.
369
0.13
30.
208
0.10
3−0
.036
0.07
40.
183
0.45
6*
0.06
10.
832
**0.
830
**
Not
e:P n
:net
phot
osyn
thet
icra
te,G
s:st
omat
alco
nduc
tanc
e,C
i:in
terc
ellu
lar
CO
2co
ncen
trat
ion,
Tr:
tran
spir
atio
nra
te,N
PQ:n
on-p
hoto
chem
ical
quen
chin
g,Yi
eld:
the
actu
alqu
antu
myi
eld
PSI
I,F v
/F m
:m
axim
um
pho
toch
emic
alef
fici
ency
ofP
SII,
WU
E:w
ater
use
effi
cien
cy,S
eed
ling
Hei
ght:
heig
htof
seed
ling
grow
that
nurs
ery
at1
year
,Col
lar
Dia
met
er:
colla
rd
iam
eter
ofse
edlin
ggr
owth
atnu
rser
yat
1ye
ar,H
:hei
ghto
ffiel
dgr
owth
at4
year
s,D
BH
:dia
met
erat
brea
sthe
ight
offi
eld
grow
that
4ye
ars,
V:i
ndiv
idu
alvo
lum
eat
4ye
ars.
**in
dica
tehi
ghly
sign
ifica
ntdi
ffer
ence
atp
<0.
01le
velo
fpro
babi
lity,
*si
gnifi
cant
diff
eren
ceat
p<
0.05
leve
lofp
roba
bilit
y.
203

Forests 2019, 10, 44
In addition, seedling height was positively correlated with collar diameter, plant height (H),and individual volume. WUE was significantly negatively correlated with Tr, suggesting that teakclones with high transpiration could show low WUE; Gs was positively correlated with Tr, indicatingthat high stomatal conductance contributed to higher transpiration; Tr was positively correlated withthe actual quantum yield of PSII, suggesting that the higher the transpiration rate, higher the actualquantum yield of PSII would be.
4. Discussion
Plant growth and yield depend largely on photosynthesis [23,24]. Plant photosynthesis is notonly affected by environmental factors, but also affected by plant genetic characteristics. It is thecomplex process of interaction between plant genetic and environmental factors that influencesphotosynthetic activity [25]. To date, ecophysiological studies on photosynthesis in forest trees werethose that examined the effects of stress on photosynthetic physiology [26–29], and the photosyntheticresponses to light intensity [30] and CO2 concentration [31]. The present study chiefly focused onsystematically measuring photosynthetic gas exchange and chlorophyll fluorescence parameters,correlating the photosynthetic characteristics with growth, and providing a means of rapid evaluationof teak germplasm, for introduction, utilization, and improvement of teak resources in futurebreeding programs.
Our study showed that teak clones had high variation and high heritability (h2) for many growthand physiological traits. The results were generally consistent with the findings reported for Populustrichocarpa by McKown [32]. The gas exchange, chlorophyll fluorescence, and growth parameters of teakclones were highly controlled by genetic factors, especially for the actual quantum yield (Yield) of PSII.Therefore, such a parameter has high practical significance and can be effectively used for improvingthe efficiency of teak breeding. However, it is worth emphasizing that intercellular CO2 concentration(Ci) and non-photochemical quenching (NPQ) were greatly influenced by the environment.
Further analysis showed that teak clones and resources from different regions vary in theirphotosynthetic characteristics. In this study, teak clones 7029, 71-5, 7219, 7412, 7122, and provenances3070, 3074, 3071, which had higher Pn, can be regarded as the key resource in future breeding andmanagement programs. However, more teak clones from different provenances and countries needto be included in this kind of study in the future. Huang et al., 2016 [33] had suggested, after SSRmolecular marker testing, that the Nigerian provenance 3078, investigated in this paper, may haveoriginated from India. The present studies, that reveal their similar photosynthetic characteristics,further corroborates this conclusion.
The significantly positive correlation that the net photosynthetic rate has with seedling height,individual volume, Fv/Fm, Gs, and Tr, is an interesting finding of this study. In addition, seedlingheight was significantly and positively correlated with plant height and individual volume. Both resultsindicate that teak clones of high Pn and high seedling height result in fast-growing clones. However,it is known that photosynthetic processes are influenced by environmental conditions such as light,temperature, water, and nutrients [25]. Photosynthetic rate is not the only limiting factor for growth [34].These factors may affect growth differently for different clones, resulting in no significant relationshipbetween Pn and plant height or DBH of field growth at 4 years, the result being similar to previousreports [12,35].
Correlation analysis also revealed that water use efficiency was significantly but negativelycorrelated with Tr, suggesting that teak clone WUE may decrease when transpiration rate is highin daytime. Such results were consistent with the study by Huang et al., 2016 [17], in that diurnalvariation possessed a double peaked curve, with a “midday depression” phenomenon in summer,when strong sunshine often accompanied by high temperature produces excessive transpiration,followed by decline of water use efficiency. There was no significant correlation between seedlingcollar diameter and other parameters, except for seedling height, consistent with the results of thestudy on photosynthesis and growth of Populus nigra [10]. At the same time, the coefficient of genetic
204

Forests 2019, 10, 44
variation of Ci and Fv/Fm were lower than other photosynthetic indices in the present study, similarto photosynthetic characteristics of the clones [10]. The variation coefficients of Fv/Fm were smallin this study (0.028) and in Populus nigra clones (0.024) [10]. This may be due to CO2 concentration,leaf temperature, and relative humidity fluctuating significantly under natural conditions, reducingthe Fv/Fm compared to conditions where they remain constant [25].
Farquhar et al., 1982 [36] concluded that photosynthetic rate was controlled by stomatal factorswhen Pn, Ci, and Gs increased or decreased at the same time. In this study, correlation analysisindicates that there was significant positive correlation between Pn and Gs, a positive but not significantcorrelation between Pn and Ci, Gs, and Ci, suggesting that the photosynthetic rate of teak was mostlycontrolled by stomatal factors. Plant dynamic photosynthesis was affected by many environmentalfactors such as light intensity, CO2 concentration, leaf temperature, and relative humidity. Fluctuatingenvironments would have a large impact on photosynthesis. Plants have a highly responsive regulatorysystem to make rapid photosynthetic responses to fluctuating environments, and a number ofphotoprotective mechanisms allow plants to maintain photosynthesis under stressful fluctuatingenvironments [25].
For further research, the following points need to be considered in the future studies on teak.Firstly, it is desirable that more clones from different provenances be included in this kind of study inorder to analyze variation among teak resources of different provenances more efficiently. Secondly,the differences in Pn among teak clones in this study was greater than that seen in Populus nigra [10]and Populus deltoides clones [11]. It is to be ascertained whether such a difference was caused byinherent differences in photosynthetic characteristics between the tree species, or if is due to otherreasons. Thirdly, further evaluation of differences in leaf area between teak clones is needed since treegrowth is restricted not only by photosynthetic efficiency, but also by photosynthetic leaf area [37,38].Lastly, we found that photosynthetic rates of teak plants in the field trial measured at the age of 2 yearswere higher than that of the potted seedlings and, therefore, correlation analysis among photosyntheticparameters, photosynthetic leaf area, and growth traits in field trials need to be executed in future teakbreeding programs.
5. Conclusions
Our findings have at least three important implications. First, photosynthetic parametersother than intercellular CO2 concentration (Ci) are highly controlled by genetic factors. In addition,photosynthetic parameters and growth traits in different clones revealed abundant genetic variation.Second, the net photosynthetic rate (Pn), seedling height, and individual volume of wood significantlycorrelated between each other, and seedling height was significantly correlated with plant height infield trials, suggesting Pn and seedling height can help us in teak breeding. Third, teak clones 7029, 71-5,7219, 7412, and 7122, and provenances 3070, 3074, and 3071, revealed to have higher photosyntheticrate, can be regarded as key resources for future breeding and germplasm resource management.
Author Contributions: G.H. designed and supervised implementation of the studies, supervised the statisticalanalyses, constructed the tables, wrote the manuscript, and crafted the final version. K.L. and Z.Z. carried outthe statistical analyses and wrote the first draft of the manuscript. G.Y. supervised and carried out all technicalaspects. E.M.M. participated in writing and editing the manuscript.
Funding: This work was supported by the [“Fundamental Research Funds for the Central Non-profit ResearchInstitution of CAF” (grant number:No. CAFYBB2017ZA001-7)] and [the National Key Research and DevelopmentProgram of China “Research Project on Teak Cultivation Techniques” (grant number: 2016YFD0600602)].
Acknowledgments: The authors are grateful to Bingshan Zeng and Zhenfei Qiu for providing the materials usedin this study. We would like to thank anonymous reviewers for their valuable comments.
Conflicts of Interest: The authors declare no conflict of interest.
205

Forests 2019, 10, 44
References
1. Kaosa-ard, A. Teak (Tectona grandis): Its natural distribution and related factors. Nat. Hist. Bull. Siam Soc.1981, 29, 55–74.
2. Mohanan, C.; Sharma, J.K.; Florence, E.J.M. Nursery diseases of teak in India. In Proceedings of theInternational Teak Symposium, Thiruvananthapuram, Kerala, India, 2–4 December 1991; Chand Basha, S.,Mohanan, C., Sankar, S., Eds.; Kerala Forest Department and Kerala Forest Research Institute: Thrissur,Kerala, India, 1997; pp. 107–112.
3. Liu, P.; Yang, J.J.; Lu, H.J. Southeast Asian Tropical Timber; China Forestry Publishing House: Beijing, China,1993; p. 280, ISBN 9787503809330.
4. Liang, K.N. Teak. In Cultivation Techniques of Valuable Tree Species in South China; Xu, D.P., Qiu, Z.W.,Eds.; Guangdong Science and Technology Publishing House: Guangzhou, China, 2013; pp. 213–230,ISBN 978-7-5359-5807-5.
5. Alcantara, B.K.; Veasey, E.A. Genetic diversity of teak (Tectona grandis L.F.) from different provenances usingmicrosatellite markers. Rev. Arvore 2013, 37, 747–758. [CrossRef]
6. Blake, T.J.; Yeatman, C.W. Water relations, gas exchange, and early growth rates of outcrossed and selfedPinus banksiana families. Can. J. Bot. 1989, 67, 1618–1623. [CrossRef]
7. Hou, A.J.; Xu, D.C. Current advance of high photosynthetic efficiency breeding by gene engineer in plants.China Biotechnol. 2005, 25, 19–23.
8. Chen, Y.; Yuan, L.P.; Wang, X.H.; Zhang, D.Y.; Chen, J.; Deng, Q.Y.; Zhao, B.R.; Xu, D.Q. Relationship betweengrain yield and leaf photosynthetic rate in super hybrid rice. J. Plant Physiol. Mol. Biol. 2007, 3, 235–243.
9. Long, S.P.; Zhu, X.G.; Naidu, S.L.; Ort, D.R. Can improvement in photosynthesis increase crop yields?Plant Cell Environ. 2006, 29, 315–330. [CrossRef] [PubMed]
10. Chu, Y.G.; Su, X.H.; Huang, Q.J.; Zhang, X.H. Relationships between Photosynthetic Characteristics andGrowth Traits in Gene Resources of Populus nigra. Sci. Silvae Sin. 2010, 46, 77–83.
11. Gao, M.; Ding, C.J.; Su, X.H.; Huang, Q.J. Comparison of photosynthetic characteristics of Populus deltoidesand their Fl hybrid clones. For. Res. 2014, 27, 721–728.
12. Sulzer, A.M.; Greenwood, M.S.; Livingston, W.H.; Adams, G. Early selection of black spruce usingphysiological and morphological criteria. Can. J. For. Res. 1993, 23, 657–664. [CrossRef]
13. Liang, K.N.; Lai, M.; Huang, G.H.; Ling, M.P.; Zhou, Z.Z.; Ma, H.M. Growth and adaptability of tenprovenances of Tectona grandis at 27-year-old. J. Cent. South Univ. For. Technol. 2011, 31, 8–12.
14. Lai, M.; Liang, K.N.; Huang, G.H.; Ling, M.P.; Zhou, Z.Z.; Ma, H.M. Genetic variation and comprehensiveevaluation in growth and wood relevant properties of different provenances of Tectona grandis. For. Res. 2011,24, 234–238.
15. Zheng, F.X.; Wen, D.Z.; Kuang, Y.W. Effects of simulated acid rain on the growth, photosynthesis and wateruse efficiency in Tectona grandis. J. Trop. Subtrop. Bot. 2006, 14, 93–99.
16. Chen, D.X.; Ban, X.Q.; Li, Y.D.; Xiao, W.F.; Luo, T.S.; Lin, M.X.; Xu, H. Responses of gas exchange toneighborhood interference in leaves of teak (Tectona grandis L. f.) in a tropical plantation forest. Acta Ecol. Sin.2008, 28, 4059–4069.
17. Huang, G.H.; Liang, K.N.; Zhou, Z.Z.; Ma, H.M. Diurnal and seasonal Photosynthetic characteristics andinfluencing factors in teak clones. J. Cent. South Univ. For. Technol. 2016, 36, 11–16.
18. Maxwell, K.; Johnson, G.N. Chlorophyll fluorescence—A practical guide. J. Exp. Bot. 2000, 51, 659–668.[CrossRef]
19. Schreiber, U. Pulse amplitude modulation (PAM) fluorometry and saturation pulse method. In Chlorophyll aFluorescence: A Signature of Photosynthesis; Papageorgiou, G., Govind, J., Eds.; Kluwer Academic Publishers:Dordrecht, The Netherlands, 2004; pp. 279–319.
20. Wang, R.Z.; Gao, Q. Photosynthesistranspiration and water use efficiency in two divergent Leymus chinensispopulations from northeast China. Photosynthetica 2001, 39, 123–126.
21. Duan, A.G.; Zhang, X.Q.; Zhang, J.G.; Zhong, J.D. Growth and genetic evaluation of 21-year-old Chinese firclonal plantation. For. Res. 2014, 27, 672–676.
22. Zhou, Z.Z. Calcium Nutrition of Teak in Acidic Soils. Doctoral Thesis, Chinese Academy of Forestry, Beijing,China, 2009.
206

Forests 2019, 10, 44
23. Yamori, W.; Kondo, E.; Sugiura, D.; Terashima, I.; Suzuki, Y.; Makino, A. Enhanced leaf photosynthesis as atarget to increase grain yield: Insights from transgenic rice lines with variable Rieske FeS protein content inthe cytochrome b6/f complex. Plant Cell Environ. 2016, 39, 80–87. [CrossRef]
24. Zhu, X.G.; Long, S.P.; Ort, D.R. Improving photosynthetic efficiency for greater yield. Annu. Rev. Plant Biol.2010, 61, 235–261. [CrossRef]
25. Yamori, W. Photosynthetic response to fluctuating environments and photoprotective strategies under abioticstress. J. Plant Res. 2016, 129, 379–395. [CrossRef]
26. Wu, Y.B.; Xu, J.H. Impacts of salt stress on the growth and photosynthesis of three Fraxinus species. J. NanjingFor. Univ. (Nat. Sci. Ed.) 2002, 26, 19–22.
27. Cao, F.L.; Cai, J.F.; Wang, G.B.; Zhang, W.X. Effects of Waterlogging Stress on the Growth and Photosynthesisof Sapium sebiferum. Sci. Silvae Sin. 2010, 46, 57–61.
28. Zhang, L.Y.; Wen, X.; Lin, Y.M.; Li, J.; Chen, C.; Wu, C.Z. Effect of salt stress on photosynthetic and chlorophyllfluorescent characteristics in Alnus formosana seedlings. J. Fujian Coll. For. 2013, 33, 193–199.
29. Feng, Y.L.; Ju, G.S.; Zhu, C.Q. Responses of photosynthesis and pv-parameters to water stress in poplar cloneseedlings. Sci. Silvae Sin. 2003, 39, 30–36.
30. Zhang, W.X.; Wu, J.S.; Cao, F.L. Influence of photosynthetically active radiation on photosynthesis andphotochemistry efficiency in leaves of Ginkgo. J. Nanjing For. Univ. (Nat. Sci. Ed.) 2002, 26, 5–9.
31. Su, P.X.; Zhang, L.X.; Du, M.W.; Bi, Y.R.; Zhao, A.F.; Liu, X.M. Photosynthetic character and water useefficiency of different leaf shapes of Populus euphratica and their response to CO2 enrichment. Acta Phytoecol.Sin. 2003, 27, 34–40.
32. McKown, A.; Guy, R.; Klápšte, J.; Geraldes, A.; Friedmann, M.; Cronk, Q.; El-Kassaby, Y.; Mansfield, S.;Douglas, C. Geographical and environmental gradients shape phenotypic trait variation and genetic structurein Populus trichocarpa. New Phytol. 2014, 201, 1263–1276. [CrossRef]
33. Huang, G.H.; Liang, K.N.; Zhou, Z.Z.; Ma, H.M. SSR Genotyping—Genetic diversity and fingerprinting ofteak (Tectona grandis) clones. J. Trop. For. Sci. 2016, 28, 48–58.
34. Ceulemans, R.; Impens, I.; Steenackers, V. Variation in photosynthetic, anatomical and enzymatic leaftraits and correlations with growth in recently selected Populus clones. Can. J. For. Res. 1987, 17, 273–283.[CrossRef]
35. Larsen, J.B.; Wellendorf, H. Early test in Picea abies fullsibs by applying gas exchange, frost resistance andgrowth measurements. Scand. J. For. Res. 1990, 5, 369–380. [CrossRef]
36. Farquhar, G.D.; Sharkey, T.D. Stomatal conductance and photosynthesis. Ann. Rev. Plant Physiol. 1982,33, 317–345. [CrossRef]
37. Fujimoto, R.; Taylor, J.M.; Shirasawa, S.; Peacock, J.; Dennis, E. Heterosis of Arabidopsis hybrids between C24
and Col is associated with increased photosynthesis capacity. Proc. Natl. Acad. Sci. USA 2012, 109, 7109–7114.[CrossRef] [PubMed]
38. Turnbull, M.H.; Murthy, R.; Griffin, K.L. The relative impacts of day-time and night-time warming onphotosynthetic capacity in Populus deltoids. Plant Cell Environ. 2002, 25, 1729–1737. [CrossRef]
© 2019 by the authors. Licensee MDPI, Basel, Switzerland. This article is an open accessarticle distributed under the terms and conditions of the Creative Commons Attribution(CC BY) license (http://creativecommons.org/licenses/by/4.0/).
207


Article
Screening of Applicable SSR Molecular MarkersLinked to Creeping Trait in Crape Myrtle
Tangchun Zheng 1,2,3,4,5, Bo Qin 1,2,3,4,5,6, Suzhen Li 1,2,3,4,5,6, Ming Cai 1,2,3,4,5,
Huitang Pan 1,2,3,4,5, Jia Wang 1,2,3,4,5, Tangren Cheng 1,2,3,4,5 and Qixiang Zhang 1,2,3,4,5,6,*
1 Beijing Key Laboratory of Ornamental Plants Germplasm Innovation & Molecular Breeding, Beijing ForestryUniversity, Beijing 100083, China; [email protected] (T.Z.); [email protected] (B.Q.);[email protected] (S.L.); [email protected] (M.C.); [email protected] (H.P.);[email protected] (J.W.); [email protected] (T.C.)
2 National Engineering Research Center for Floriculture, Beijing Forestry University, Beijing 100083, China3 Beijing Laboratory of Urban and Rural Ecological Environment, Beijing Forestry University,
Beijing 100083, China4 Engineering Research Center of Landscape Environment of Ministry of Education, Beijing Forestry
University, Beijing 100083, China5 Key Laboratory of Genetics and Breeding in Forest Trees and Ornamental Plants of Ministry of Education,
Beijing Forestry University, Beijing 100083, China6 Beijing Advanced Innovation Center for Tree Breeding by Molecular Design, Beijing Forestry University,
Beijing 100083, China* Correspondence: [email protected]; Tel.: +86-010-6233-8005
Received: 26 April 2019; Accepted: 17 May 2019; Published: 18 May 2019
Abstract: Creeping plants have unique ornamental value because they have more branches andflowers and the creeping trait is rare in crape myrtle (Lagerstroemia indica L.). In this study, the firstfilial generation (F1) population was derived from Lagerstroemia fauriei Koehne (standard) and L. indica“Creole” (creeping) and the backcross1 (BC1) population was derived from the backcross of F1
individual S82 (creeping) and L. fauriei. The segregation of the creeping trait was analyzed for174 seedlings of the BC1 population to examine the linkage relationship between simple sequencerepeat (SSR) molecular markers and the creeping trait. Creeping genes were screened using bulkedsegregant analysis combined with 322 SSR primers, which were detected with good polymorphism.The results show that two SSR markers (S364 and LYS12) were detected, with genetic distances of23.49 centimorgan (cM) and 25.86 cM from the loci controlling the plant opening angle trait and thebranching angle trait, respectively. The accuracy rate for phenotypic verification using S364 andLYS12 was 76.51% and 74.14%, respectively. Our results provide basic information for the molecularmarker-assisted selective breeding and cloning of the creeping gene to improve architecture diversityin the breeding of crape myrtle.
Keywords: Lagerstroemia species; simple sequence repeat markers; bulked segregant analysis;creeping trait; plant architecture
1. Introduction
Plant architecture is the result of long-term evolution and natural selection, which involve complexregulatory processes based on genetic and environmental interactions [1]. According to the differentgrowth angles and branching directions, plant architecture can be roughly classified as standard,weeping, pillar, upright, brachytic, and dwarf [2]. Plant architecture traits have important applicationvalue for the improvement of crop production; for example, the cultivation of dwarf or semi-dwarfhorticultural or agronomic crops improves yield and production efficiency because mechanizedmanagement is more conducive. The discovery and utilization of dwarf genes in rice, which greatly
Forests 2019, 10, 429; doi:10.3390/f10050429 www.mdpi.com/journal/forests209

Forests 2019, 10, 429
promoted grain production, led to the first “green revolution” in agriculture, demonstrating theimportance of genetic resources [3,4]. The genetic regulation of plant architecture traits in woodyplants is more complex than in herbaceous plants and plant architecture traits are susceptible toexternal environmental conditions [5]. Many studies have been performed on plant architecture forextreme plant types of trees, including pillar and weeping peach [6], dwarf and compact peach (Prunuspersica L.) [7], weeping Prunus mume [8], weeping Cercis chinensis [9], and columnar and weeping apple(Malus × domestica) [10,11].
Molecular marker technology can reflect the differences between DNA sequences for differentspecies and is widely used in plant genetic diversity analysis, genetic map construction, map-basedcloning, and marker-assisted selective breeding [12–14]. Individual hybrids with target traits can beselected at the seedling stage using molecular marker-assisted selection, which reduces resource wasteand breeding cost and speeds up the breeding process [15]. Bulked segregant analysis (BSA) is derivedfrom near-isogenic line analysis, which was reported for the first time in 1991 [16]. SSR markers arewidely used in relationship analysis, genetic diversity analysis, mapping quantitative trait locus (QTL),and so on. Four expressed sequence tag (EST)-SSR marker loci closely linked to the dwarf trait in pearwere found by BSA technology. In Actinidia chinensis Planch, an EST-SSR marker was screened andthe genetic distance between the marker and dwarf gene was 8.8 cM [17]. Three selected EST-SSRmarkers were used to determine genetic structure in 29 cultivars and were used for fruit color selectionin Prunus salicina breeding [18]. In addition, DNA markers associated with the dwarf trait from Brassicanapus [19], Prunus persica [20], and Avena sativa [21] have been studied.
Lagerstroemia L. (crape myrtle) belongs to the Lythraceae family, which includes at least 50 speciesof deciduous or evergreen shrubs or trees native to Southeast Asia [22]. China is located in the centerof the worldwide Lagerstroemia distribution and origin [23]. Crape myrtle was first cultivated as anornamental species in China approximately 1800 years ago [24]. Species in this genus are highlyvalued in landscaping for their graceful plant architecture, long-lasting flowering period, and colorfulflowers during the summer [25]. When exposed to natural conditions, crape myrtle is a diploid plant(2n = 2x = 48) [26]. Crape myrtle is susceptible to powdery mildew; therefore, the initial purposefor hybrid breeding by interspecific hybridization between L. indica and L. fauriei was for diseaseresistance and then a series of excellent varieties with various plant architecture types and colorfulflowers was selected from the resistant hybrid offspring (‘Pocomoke”) [27–29]. Lagerstroemia speciesare self-compatible and easily produce interspecific hybrids with related species. To further improvethe ornamental value of hybrids with a larger flower diameter, Lagerstroemia speciosa and L. indica wereused for interspecific hybridization and hybrid seedlings with traits of the parents were obtained;however, only plant height and plant width had the characteristics of the hybrids and no variation inflower color or flower size was observed [30]. Recently, research in America, Japan, and China hasfocused on breeding new cultivars with unique plant architecture, especially dwarf or potted crapemyrtle. A few dwarf crape myrtle cultivars with many branches and large flowers were bred throughintraspecific hybridization (L. indica) with the aim of generating dwarf plant architecture [31–35].
The molecular study of Lagerstroemia species has led to the development of a series of genomicSSR markers [26,36–40]. Two single nucleotide polymorphism (SNP) markers (M16337 and M38412)that are highly correlated with internode length and one SNP marker (M25207) that is highly correlatedwith primary lateral branch height were validated in the F1 population of L. indica [41]. In addition,an SSR marker linked to the dwarf gene, with a genetic distance of 23.33 cM, was screened fromthe L. fauriei × L. indica “Pocomoke” F1 population [35]. Currently, less is known about the plantarchitecture of the crape myrtle, especially the creeping trait. To analyze the linkage relation betweenSSR molecular markers and creeping trait, the segregation of the creeping trait was analyzed by theBSA method using the BC1 population with 174 hybrids and 322 SSR primers. Our results provide animportant technical and theoretical basis for plant architecture molecular marker-assisted selectivebreeding for the Lagerstroemia species.
210

Forests 2019, 10, 429
2. Materials and Methods
2.1. Plant Materials
The F1 population was derived from L. fauriei (♀, standard) and L. indica “Creole” (♂, creeping).To analyze the linkage relation between SSR markers and creeping trait, the BC1 segregation populationwas derived from a backcross of the F1 creeping individual S82 (♀) × L. fauriei (♂). The F1 female parentwas a tree (>3 m) with standard branching and the male parent was a dwarf plant (0.3–0.5 m) withcreeping branching. The F1 individual S82 had the same phenotype as L. indica “Creole”. The linkagerelationship between SSR markers was analyzed for 174 individuals of the BC1 population. All ofthe materials were planted in a breeding nursery at the National Engineering Research Center forFloriculture (Beijing) (40◦02’ N, 115◦50’ E) (Figure 1).
Figure 1. Plant materials and method of measurement used in this study. (a) L. fauriei; (b) L. indica“Creole”; (c) S82 the creeping individual of F1; (d,e) creeping and standard offsprings in BC1 population(in summer); (f) creeping and standard offsprings in BC1 population (in autumn); (g,h) methods ofmeasuring branch angle and plant canopy angle. θ1 and θ2 are the angles of inclination of the widestposition of the canopy from vertical orientation on both sides. Plant canopy angle is the sum of θ1
and θ2.
2.2. Phenotypic Measurement and Data Analysis
Phenotypic traits related to plant architecture, i.e., plant height (PH), plant width (PW), plant canopyangle (PCA), branching angle of the main branch (BA), the number of main branches (NMB),and branching height (BH), were measured for 174 individuals from the S82 (♀) × L. fauriei (♂)population at the end of the growing season. In addition, leaf length (LL) and leaf width (LW)were measured during the peak of the growing season. PH and BH were measured at the highestpoint, and PW was measured at horizontal direction by ruler. LL and LW were measured with anelectronic vernier caliper. Each trait was measured more than three times. NMB was directly visualized.The measurements of the above phenotypic traits were described by Ye et al. [35,37].
211

Forests 2019, 10, 429
The branching angle of the main branch corresponds to the angle between the main branch andthe horizontal direction. In [42], it is reported that the angle between the horizontal direction and theline connecting the basal branch and apical branch (angle α in Figure 1g) is a more reliable parameterthan branch growing angle (angle β in Figure 1g). Moreover, this more reliable angle is more closelyrelated to plant architecture and measures the branching angle of the main branch by the measurementof angle α. PCA and BA were measured by a huge protractor suspended at the origin. The plantcanopy angle (θ = θ1 + θ2, Figure 1h) was measured according to Thakur et al. [43].
Genetic variation analyses were performed on phenotype traits of BC1 population using SPSS22.0 software (SPSS, Chicago, IL, USA). Statistical parameters included mean, maximum, minimum,variance, standard deviation, skewness, peakness, and coefficient of variation and plot the frequencydistribution. The Pearson correlation coefficient between traits was calculated by the Correlationsmodule in SPSS software and significant difference tests were performed at different levels.
2.3. DNA Extraction and Detection
Genomic DNA was extracted from fresh young leaves using the Fast DNA kit (Tiangen Biotech,Beijing, China) following the manufacturer’s protocol. DNA quality and concentration were measuredby 1% agarose gel electrophoresis with Gel Red [44].
2.4. Construction of Near-Isogenic Pools
The construction of near-isogenic pools was based on the methods reported by Michelmoreet al. [16]. Five extremely standard individuals and five extremely creeping individuals (as describedin Figure 1f) were randomly selected from 174 individuals in BC1 population and their genomic DNAwas mixed to construct standard and creeping gene pools, respectively. The standard gene pool wasdenoted BZ, whereas the creeping gene pool was denoted BP.
2.5. Screening SSR Markers Linked to Creeping Strains
DNA from eight BC1 individuals was selected randomly to detect the polymorphism of the newSSR primers. Based on all the highly polymorphic primers in crape myrtle, two near-isogenic pools(BZ, BP) and three standard and three creeping individuals were then randomly selected and screenedby SSRs. The 322 pairs of primers used in the experiment were developed using the transcriptomedata from a previous study [45] (Table S1).
PCR products were detected by non-denaturing polyacrylamide gel electrophoresis. If the productstrips with polymorphisms in two pools were similar for six plants, it was initially concluded thatit may relate to plant architecture of crape myrtle. These primers were detected in parents andsegregating populations and were correlated with phenotypic data and genetic distance (cM) betweenthe SSR markers. The genes related to plant architecture were identified by Kosambi’s method [46].Furthermore, the validity of the screened polymorphic marker was verified by varieties in a germplasmresource nursery.
3. Results
3.1. Segregation Analysis of Phenotypic Variation in BC1 Populations
Eight statistical parameters were calculated from eight phenotypic characters (PH, PW, PCA,BA, NMB, BH, LL, and LW), and the frequency distribution histogram was constructed using SPSS22.0 and Excel (Figure 2). In the S82 × L. fauriei population, the coefficients of genetic variation werebetween 20.09% and 35.49%, except for the BH genetic variation coefficient. The highest degree ofvariation was observed for PH followed by NMB, whereas the smallest variation was observed for PCA.The variability in the measured traits among individuals was greater than 10%, indicating significantgenetic variation in these traits (Table 1).
212

Forests 2019, 10, 429
Figure 2. Distribution of eight phenotypic traits of 174 individuals in S82 × L. fauriei population.(a) Plant height (PH); (b) plant width (PW); (c) plant canopy angle (PCA); (d) branching angle of themain branch (BA); (e) the number of main branches (NMB); (f) branching height (BH); (g) leaf length(LL); (h) leaf width (LW).
Table 1. Descriptive statistics of phenotypic characters in S82 × L. fauriei population.
Traits Mean Minimum MaximumStandardDeviation
Variance Skewness PeaknessCoefficientof Variation
PH (cm) 50.70 19.00 101.00 17.99 322.83 0.44 −0.25 35.49%PW (cm) 63.74 31.00 101.50 13.40 179.57 0.26 0.10 21.02%PCA (◦) 105.64 60.70 163.45 21.23 533.00 0.48 −0.18 20.09%BA (◦) 55.19 21.27 78.90 12.84 167.95 −0.56 −0.35 23.27%NMB 3.30 2.00 7.00 1.01 1.01 0.71 0.75 30.57%
BH (cm) 1.98 0.00 26.00 3.17 9.92 3.56 20.05 159.69%LL (mm) 40.29 19.66 64.19 8.32 69.30 0.36 0.32 20.66%LW (mm) 20.00 6.98 49.32 5.07 25.75 1.37 6.08 25.37%
Note: PH: plant height; PW: plant width; PCA: plant canopy angle; BA: branching angle of the main branch;NMB: the number of main branches; BH: branching height; LL: leaf length; LW: leaf width. The phenotype units areonly used for the mean, standard deviation, maximum, and minimum.
3.2. Correlation Analysis of Population Phenotypic Traits
The correlation between the eight phenotypic characters was analyzed by SPSS (Table 2).PCA showed a significant positive correlation with NMB and a significant negative correlationwith PH and BA. BA showed a significant positive correlation with PH and a significant negativecorrelation with PCA and NMB.
Table 2. Correlation analysis of phenotypic characters in S82 × L. fauriei population.
Traits PH PW PCA BA NMB BH LL LW
PH 1PW 0.282** 1PCA −0.538** 0.126 1BA 0.545** 0.009 −0.703** 1
NMB −0.143 0.052 0.214* −0.319** 1BH 0.073 −0.005 −0.091 −0.075 −0.241** 1LL 0.383** 0.259** −0.12 0.095 −0.008 0.013 1LW 0.354** 0.210* −0.074 0.058 0.06 −0.042 0.681** 1
Note: PH: plant height; PW: plant width; PCA: plant canopy angle; BA: branching angle of the main branch;NMB: the number of main branches; BH: branching height; LL: leaf length; LW: leaf width. ** means highlysignificant at the 0.01 level; * means significant at the 0.05 level.
213

Forests 2019, 10, 429
3.3. Detection of Near-Isogenic Pools, Parents, and BC1 Segregation Populations by SSR Markers
High polymorphism was detected for 322 pairs of SSR primers for eight BC1 individuals (selectedrandomly from BC1). The 322 pairs of primers with high polymorphism were screened using thestandard gene pool BZ and creeping gene pool BP as templates. Finally, four pairs of SSR primers withpolymorphic strips were screened in two gene pools (Figure 3).
Primers that are polymorphic in both gene pools were further amplified in the parents and otherhybrids to determine strip type. Of the above four primers, only S364 and LYS12 were able to amplifystrips based on the phenotype of the parents (Figure S1, Table 3) and 174 individuals of the segregatingpopulation (Figure S2 and Figure S3).
Figure 3. Electrophoresis of four primers’ amplification products in parents and gene pools.(a) Electrophoretic results of Q111 primers; (b) electrophoretic results of S364 primers; (c) electrophoreticresults of LYS12 primers; (d) electrophoretic results of LYS13 primers. BZ: Standard creeping gene pool;BP: Creeping gene pool; Z1, Z2, and Z3: Three standard individuals; P1, P2, and P3: Three creepingindividuals; M: DNA marker.
Table 3. Phenotypes and amplified strips of parents and near isogenic pools.
Code Phenotype Strip Type Strip Type
L. f aurei Z b mS82 P a n
L. indica ‘Creole’ P a n
Note: Z: Standard individual; P: creeping individual; a: Single strip in primer S364; b: Double strip in primer S364;m: Single strip in primer LYS12; n: Double strip in primer LYS12.
3.4. Linkage Analysis of Markers and Phenotypes
From the continuous observation of the BC1 population, we found that PH, PW, NMB, and BHchanged over time, whereas the ratio between the plant width and plant height (PW/PH), PCA, and BAmaintained a relatively stable state. The statistical results of the phenotypes of the BC1 population andparents were listed in Table S2. A histogram of the frequency distribution for three traits (PW/PH, PCA,and BA) of the parents for the BC1 population was drawn using Excel software (Figure S4). Based onthe phenotypic data for parents and hybrids, the plant architecture of crape myrtle was classified into
214

Forests 2019, 10, 429
six classes using PW/PH, PCA, and BA. Artificially, PW/PH less than 1.5 were classified as G-typeand all others were H-type. PCA was classified as J-type or K-type depending on whether valueswere less than 90◦. Similarly, BA was classified as U-type or V-type depending on whether valueswere greater than 60◦ (Table 4). It can be seen that types G, J, and U correspond to plants with smallerPW/PH, smaller PCA, and larger BA, respectively; namely, plant architecture will be creeping andflat. Conversely, H-, K-, and V-types correspond to those with larger PW/PH, larger PCA, and smallerBA, which means that the plant architecture is more vertical. The segregation ratio of traits in thehybrids of the population implies that the upright type has a dominant effect on the creeping type. It ispreliminarily considered that the upright/creeping type of Lagerstroemia species is controlled by boththe major gene and the minor genes.
Table 4. Classification of the phenotype of 174 individuals in S82 × L. fauriei population.
Traits Grade Type No. of BC1
PW/PH <1.5 G 122≥1.5 H 52
PCA (◦) <90 J 98≥90 K 76
BA (◦) >60 U 81≤60 V 93
Plant architecture Not satisfied H-, K-, V Upright 138Satisfied H-, K-, V Creeping 36
Note: PH, plant height; PW, plant width; PCA, plant canopy angle; BA, branching angle of the main branch.
According to phenotypic grading standards, phenotypic statistics, and the strip type of the parentsand two gene pools, the phenotypes and strips of 174 individuals were comparatively analyzed.The results showed that phenotypes G, J, and U correspond to the strip type “m” for primer S364 andstrip type “b” for primer LYS12. Phenotypes H, K, and V correspond to strip type “a” for primer S364and strip type “n” for primer LYS12 (Table S3). Statistical analysis showed that primer S364 correlatedwith PCA (J-type and K-type) and primer LYS12 correlated with BA (U-type and V-type).
Among the 174 tested individuals, eight individuals did not amplify the objective strips in primerS364, whereas all individuals amplified objective strips in primer LYS12. There are 127 and 129 stripsthat conformed to the phenotype in primers S364 and LYS12, respectively (Table 5). Based on statisticalresults, the genetic distance between the S364 molecular marker and the gene that controls PCA wasapproximately 23.49 cM. The genetic distance between the LYS12 molecular marker and the genethat controls BA was approximately 25.86 cM. Two SSR molecular markers were verified in the BC1
population and the accuracy rate of phenotypic verification using S364 and LYS12 was 76.51% and74.14%, respectively (Table 6).
Table 5. Statistics of two primer strip types in BC1 plants.
Marker Strip Type Number
S364 a 95b 71– 8
LYS12 m 91n 83– 0
Note: “a” and “b” mean single strip and double strip in primer S364, respectively; “m” and “n” mean single stripand double strip in primer LYS12, respectively; “–” means no strip.
215

Forests 2019, 10, 429
Table 6. Number of phenotypes and strip type of BC1 plants.
Marker Coincidence Inconformity Total
S364 127 39 166LYS12 129 45 174
Two markers, S364 and LYS12, were further identified in 20 Lagerstroemia species or cultivars(16 were upright trees or shrubs and 4 were low shrubs with creeping or flat branches) and the striptypes were recorded. As shown in Table 7, the comparison of plant architecture types and two markerstrip types showed that 15 of 20 cultivars were identified by the S364 marker and the accuracy rate ofphenotypic identification was 75%. Eighteen cultivars were identified with LYS12 marker bands andthe accuracy rate of phenotypic identification was 90%. These results indicate that the two markerswere able to accurately identify phenotypic traits in crape myrtle cultivars.
Table 7. Identification of two markers in 20 Lagerstroemia stocks with diverse plant architectures.
Species and Cultivars Description of Plant Type Strip Strip
L. fauriei Upright, tree b mL. limii Upright, tree b m
L. excelsa Upright, tree b mL. subcostata Upright, tree b m
L. indica “Osage” Upright, large shrub or small tree a mL. indica “Queens Lace” Upright, large shrub or small tree a m
L. indica “Muskogee” Upright, large shrub or small tree b mL. indica “Comanche” Upright, large shrub or small tree b m
L. indica “William Toovey” Upright, large shrub or small tree b mL. indica “Yuma” Upright, large shrub or small tree b m
L. indica “Ebony Flame” Upright, shrub a mL. indica “Ebony Fire” Upright, shrub a m
L. indica “Ebony Embers” Upright, shrub b mL. indica “Chisam Fire” Upright, shrub b m
L. indica “Victor” Upright, spherical a mL. indica “Tonto” Upright, semi-dwarf shrub b m
L. indica “Houston” Dwarf shrubs, weeping branches a mL. indica “Sacramento” Dwarf shrubs, weeping branches a m
L. indica “New Orleans” Dwarf shrubs, creeping branches a nL. indica “Creole” Dwarf shrubs, creeping branches a n
4. Discussion
Crape myrtle is popular and widely used in gardens because of its long flowering time and rich andcolorful flowers. It can be planted alone or in clusters, used for garden flower belts, or cut flowers canbe displayed in vases after pruning and pinning. The lack of varieties with diverse plant architecturetypes, flowers with a pleasant fragrance, and early-flowering features limits the further applicationof crape myrtle. Plant architecture traits (e.g., dwarf, weeping, creeping, columnar, and branchingangle) have attracted much attention; these have potentially important application value for the plantarchitecture improvement of horticultural crops. Dwarf crape myrtles are becoming increasinglypopular for use as potted plants and indoor flowers [47]. However, dwarfing and the arborization oftrees are complex quantitative traits, which have greater non-additive effects on genetic performanceand heritability. The columnar trait is controlled by a single gene (Co); however, other modificationgenes that may also play a role have been confirmed in apple [11]. Incomplete dominant columnartraits (pillar) also exist in peach, with a small branching angle and vertical growth of branches, but noobvious genetic segregation rule was observed for dwarf and compact traits [7].
In this study, the number of upright and creeping individuals for the F1 of L. fauriei and L. indica“Creole” was 140 and 52, respectively, and the ratio of the two plant types was 2.69/1. In the BC1
216

Forests 2019, 10, 429
population of S82 × L. fauriei, the ratio of upright (138) to creeping (36) individuals was 3.83/1. However,in the BC1 population of S82 × L. indica “Creole”, the number of upright and creeping individuals was42 and 150, respectively, with a ratio of 1/3.57 (Table S4). In the F1 and S82 × L. fauriei populations,the number of upright individuals was much larger than that of creeping individuals because allhybrids were derived from crosses between upright and creeping parents. Although both parents(S82 × L. indica “Creole”) were creeping types, upright individuals still appeared in their hybrids(Table S4). The comprehensive analysis of the segregation of two plant architecture types in three geneticpopulations cannot determine the number of genes controlling the creeping trait. However, the analysisshows that the upright type has a dominant effect on the creeping type. The upright/creeping planttype of crape myrtle is speculated to be controlled by a major gene and also regulated by minorgenes. Our recent research results show that the dwarf trait of crape myrtle is also likely controlledby a major gene and modified by minor genes based on the phenotypic data in the F1 population ofL. fauriei (♀) × L. indica “Pocomoke” (♂) [35]. Correlation analysis between phenotypic traits is helpfulto advance the selection of plant architecture in crape myrtle seedlings, which can shorten the breedingtime and enhance breeding efficiency. A significant positive correlation was observed between PHand PW. PCA is verified by individual traits in the BC1 population, which is similar to the correlationobtained for the F1 population generated from L. caudate (♀) and L. indica “Xiang Xueyun” (♂) [36].Eleven quantitative characters for 192 individuals in the F1 population from a cross between L. fauriei(♀) and L. indica “Creole” (♂) were measured and analyzed; the results showed that the diversity indexfor plant architecture was 1.05 times greater than 1, which means that there is great potential for geneticimprovement of the plant architecture [48]. In addition, most quantitative characters were significantlycorrelated with plant architecture and branching pattern. The results of heredity for some traits in theF1 population of L. speciosa and L. indica showed that the coefficient of variation in the F1 generationwas 14.58–40.16%, which indicates significant variation [49].
Traditional breeding methods have the disadvantages of a long cycle, heavy workload,and low effectiveness for improving tree architecture. By using molecular marker-assisted selection,healthy individual plants with target traits can be selected at the seedling stage, which reduces the wasteof resources, reduces the cost of breeding, and speeds up the breeding process [15]. BSA overcomes theconstraints of near-isogenic lines and saves time and effort; it is widely used in marker developmentand gene mapping [16]. Because BSA does not require a large population, it is very popular in the studyof the plant architecture traits of woody plants, such as apple (vertical traits) and peach (columnarand vertical traits) and in the development of genes and markers for peach weeping traits [2,10,50].In ground-cover chrysanthemum, a random amplified polymorphic DNA (RAPD) marker A-10555linked to the creeping trait was 7.96 cM from the loci controlling creeping/standard traits [51]. In crapemyrtle, an SSR marker was identified and linked to the dwarf gene with a distance of 23.33 cM betweenthe loci and dwarf gene [35]. In this study, two SSR markers (S364 and LYS12) closely linked to creepingtraits in crape myrtle were obtained according to the principle of BSA. One marker was linked toPCA, with a genetic distance of 23.49 cM, and the other was linked to BA, with a genetic distanceof 25.86 cM. The two markers were verified in the BC1 population, parents, species, and varietieswith high accuracy, which suggests that it is feasible to use these two markers to perform molecularmarker-assisted breeding of a creeping plant type for crape myrtle. Previous research indicates thatthe polymorphic loci assayed within 15 cm of the target locus can be identified; loci are detectedwith decreasing frequency as genetic distance increases [16]. Therefore, the difference between twonear-isogenic pools cannot be determined with the genetic distance of 23.49 cM and 25.86 cM fromcreeping genes. In addition, BSA has limitations in locating quantitative traits, which can only detectlarge-effect QTLs and require samples with large phenotypic differences when near-isogenic pools areconstructed. In the future, we can use multi-generational hybridization and backcrossing to obtainpopulations with more significant phenotypic segregation to construct pools and screen markers.Additionally, the number of species-specific molecular markers is a critical factor that influenced theresults of this experiment. To achieve an ideal effect in the marker-assisted selection of the creeping
217

Forests 2019, 10, 429
trait, we will develop more species-specific molecular markers to enhance the coverage area of thecrape myrtle genome.
5. Conclusions
Crape myrtle is a widely used horticultural plant with important ornamental value, but it lackscreeping varieties. This study is the first to map creeping genes in Lagerstroemia species. In a BC1
population derived from L. fauriei Koehne (standard) and L. indica “Creole” (creeping), 174 individualswere employed to screen molecular markers linked to the creeping trait of crape myrtle among 322SSR primers with good polymorphism using BSA and SSR technologies. Two SSR markers (S364and LYS12), which were 23.49 cM and 25.86 cM from the loci controlling plant opening angle traitand branching angle trait, were detected and further verified in the population, parents, species,and varieties with more than 74% accuracy, respectively. Our study will lay the foundation for the QTLmapping and marker-assisted selection breeding for creeping architecture of crape myrtle.
Supplementary Materials: The following are available online at http://www.mdpi.com/1999-4907/10/5/429/s1.Figure S1: Electrophoretic results of S364 primers in BC1 individuals; Figure S2: Electrophoretic results of LYS12primers in BC1 individuals; Figure S3: Electrophoresis of S364 and LYS12 amplification products in parents.(a) Electrophoretic results of S364 primers; (b) Electrophoretic results of LYS12 primers; Figure S4: Distribution ofthree traits of BC1 population. P1: L. fauriei, P2: L. indica “Creole”, P3: S82 individual, Table S1: Sequence of 322pairs of primers used in the study; Table S2: Phenotypic characters of parents and BC1 plants; Table S3: Phenotypeand strip type of 174 individuals in BC1 population; Table S4: Classification of phenotype of 174 individuals in F1population of L. fauriei and L. indica “Creole”.
Author Contributions: Conceptualization, T.Z.; data curation, T.Z., B.Q., and H.P.; formal analysis, T.Z., B.Q.,and S.L.; funding acquisition, Q.Z.; investigation, B.Q., M.C., and T.C.; methodology, B.Q., S.L., and M.C.;project administration, T.Z. and Q.Z.; resources, M.C., H.P., J.W., and T.C.; software, B.Q., S.L., H.P., and J.W.;writing—original draft, T.Z. and B.Q.; writing—review and editing, T.Z. and Q.Z.
Funding: This work was supported by the program for Science and Technology of Beijing (No. Z181100002418006)and Special Fund for Beijing Common Construction Project.
Acknowledgments: We are thankful to American Journal Experts (AJE) for suggesting professional native Englishspeaker for our manuscript.
Conflicts of Interest: The authors declare no conflict of interest and this research is carried on the absence of anyfinancial or commercial relationships that could be interpreted to a potential conflict of interest.
Abbreviations
BA Branching angle of the main branchBC1 Backcross1BH Branching heightBSA Bulked segregant analysiscM CentimorganDNA Deoxyribonucleic acidEST-SSR Expressed sequence tagF1 First filial generationLL Leaf lengthLW Leaf widthNMB Number of main branchesPCA Plant canopy anglePCR Polymerase chain reactionPH Plant heightPW Plant widthQTL Quantitative trait locusRAPD Random amplified polymorphic DNASNP Single nucleotide polymorphismSSR Simple sequence repeat
218

Forests 2019, 10, 429
References
1. McSteen, P.; Leyser, O. Shoot branching. Annu. Rev. Plant Biol. 2005, 56, 353–374. [CrossRef]2. Hollender, C.A.; Dardick, C. Molecular basis of angiosperm tree architecture. New Phytol. 2015, 206, 541–556.
[CrossRef]3. Sasaki, A.; Ashikari, M.; Ueguchi-Tanaka, M.; Itoh, H.; Nishimura, A.; Swapan, D.; Ishiyama, K.; Saito, T.;
Kobayashi, M.; Khush, G.S.; et al. Green revolution: A mutant gibberellin-synthesis gene in rice. Nature 2002,416, 701–702. [CrossRef] [PubMed]
4. Peng, J.; Richards, D.E.; Hartley, N.M.; Murphy, G.P.; Devos, K.M.; Flintham, J.E.; Beales, J.; Fish, L.J.;Worland, A.J.; Pelica, F.; et al. Green revolution’ genes encode mutant gibberellin response modulators.Nature 1999, 400, 256–261. [CrossRef] [PubMed]
5. Costes, E.; Gion, J. Genetics and genomics of tree architecture. Adv. Bot. Res. 2015, 74, 157–200.6. Werner, D.J.; Chaparro, J.X. Genetic interactions of pillar and weeping peach genotypes. Hortscience 2005, 40,
18–20.7. Scorza, R.; Bassi, D.; Liverani, A. Genetic interactions of pillar (columnar), compact, and dwarf peach tree
genotypes. J. Am. Soc. Hortic. Sci. 2002, 127, 254–261. [CrossRef]8. Zhang, J.; Zhang, Q.; Cheng, T.; Yang, W.; Pan, H.; Zhong, J.; Huang, L.; Liu, E. High-density genetic
map construction and identification of a locus controlling weeping trait in an ornamental woody plant(Prunus mume Sieb. Et Zucc). Dna. Res. 2015, 22, 183–191. [CrossRef]
9. Roberts, D.J.; Werner, D.J.; Wadl, P.A.; Trigiano, R.N. Inheritance and allelism of morphological traits ineastern redbud (Cercis canadensis L.). Hortic. Res. 2015, 2, 15049. [CrossRef]
10. Dougherty, L.; Singh, R.; Brown, S.; Dardick, C.; Xu, K. Exploring DNA variant segregation types in pooledgenome sequencing enables effective mapping of weeping trait in Malus. J. Exp. Bot. 2018, 69, 1499–1516.[CrossRef] [PubMed]
11. Baldi, P.; Wolters, P.J.; Komjanc, M.; Viola, R.; Velasco, R.; Salvi, S. Genetic and physical characterisationof the locus controlling columnar habit in apple (Malus × domestica Borkh.). Mol. Breed. 2013, 31, 429–440.[CrossRef]
12. Li, T.; Liu, J.; Xie, Y.; Wang, Q.; Meng, F. Analysis of genetic diversity in Prunus mira Koehne ex Sargentpopulations using AFLP markers. Plant Syst. Evol. 2014, 300, 475–482. [CrossRef]
13. Salazar, J.A.; Ruiz, D.; Campoy, J.A.; Sánchez-Pérez, R.; Crisosto, C.H.; Martínez-García, P.J.; Blenda, A.;Jung, S.; Main, D.; Martínez-Gómez, P. Quantitative trait loci (QTL) and Mendelian trait loci (MTL) analysisin Prunus: A breeding perspective and beyond. Plant Mol. Biol. Rep. 2014, 32, 1–18. [CrossRef]
14. Sun, L.; Yang, W.; Zhang, Q.; Cheng, T.; Pan, H.; Xu, Z.; Zhang, J.; Chen, C. Genome-wide characterizationand linkage mapping of simple sequence repeats in mei (Prunus mume Sieb. Et Zucc.). PLoS ONE 2013,8, e59562. [CrossRef]
15. Scorza, R. Theory and practice of genetically manipulating peach tree architecture. NY Fruit Q. 2005, 13,27–31.
16. Michelmore, R.W.; Paran, I.; Kesseli, R.V. Identification of markers linked to disease-resistance genes bybulked segregant analysis: A rapid method to detect markers in specific genomic regions by using segregatingpopulations. Proc. Natl. Acad. Sci. USA 1991, 88, 9828–9832. [CrossRef]
17. Xu, X.; Jiang, C.; Liao, J.; Gu, Q.; Liu, S.; Chen, J. Screening of EST-SSR marker linked to dwarf character inActinidia chinensis Planch. Acta Hortic. Sin. 2010, 37, 553–558.
18. Gonzalez, M.; Salazar, E.; Castillo, J.; Morales, P.; Mura-Jornet, I.; Maldonado, J.; Silva, H.; Carrasco, B.Genetic structure based on EST-SSR: A putative tool for fruit color selection in Japanese plum (Prunussalicina L.) breeding programs. Mol. Breed. 2016, 36, 68. [CrossRef]
19. Foisset, N.; Delourme, R.; Barret, P.; Renard, M. Molecular tagging of the dwarf BREIZH (Bzh) gene in Brassicanapus. Theor. Appl. Genet. 1995, 91, 756–761. [CrossRef]
20. Warburton, M.L.; Becerra-Velasquez, V.L.; Goffreda, J.C.; Bliss, F.A. Utility of RAPD markers in identifyinggenetic linkages to genes of economic interest in peach. Theor. Appl. Genet. 1996, 93, 920–925. [CrossRef]
21. Milach, S.; Rines, H.W.; Phillips, R.L. Molecular genetic mapping of dwarfing genes in oat. Theor. Appl.Genet. 1997, 95, 783–790. [CrossRef]
22. Byers, D. Crapemyrtle: A grower’s thoughts; Owl Bay Publishers: Auburn, AL, USA, 1997.
219

Forests 2019, 10, 429
23. Egulf, D.R.; Andrick, A. The Lagerstroemia Handbook/Checklist: A Guide to Crape Myrtle Cultivars;American Association of Botanical Gardens and Arboreta, Inc.: Las Cruces, NM, USA, 1978.
24. Zhang, Q. Studies on Cultivars of Crape-myrtle (Lagerstroemia indica) and their uses in urban greening.J. Beijing For. Univ. 1991, 4, 57–66.
25. Pooler, M.R. Molecular genetic diversity among 12 clones of Lagerstroemia fauriei revealed by AFLP andRAPD markers. Hortscience 2003, 38, 256–259. [CrossRef]
26. Wang, X.; Wadl, P.A.; Pounders, C.; Trigiano, R.N.; Cabrera, R.I.; Scheffler, B.E.; Pooler, M.; Rinehart, T.A.Evaluation of genetic diversity and pedigree within crape myrtle cultivars using simple sequence repeatmarkers. J. Am. Soc. Hortic. Sci. 2011, 136, 116–128. [CrossRef]
27. Egolf, D.R. ‘Biloxi’, ‘Miami’, and ‘Wichita’ Lagerstroemia. HortScience (USA) 1987, 22, 336–338.28. Pooler, M.R.; Dix, R.L. Chickasaw’, kiowa’, and Pocomoke’ Lagerstroemia. Hortscience 1999, 34, 361–363.
[CrossRef]29. Hagan, A.K.; Keever, G.J.; Gilliam, C.H.; Williams, J.D.; Creech, G. Susceptibility of crapemyrtle cultivars to
powdery mildew and Cercospora leaf spot in Alabama. J. Environ. Hortic. 1998, 16, 143–147.30. Pounders, C.; Rinehart, T.; Sakhanokho, H. Evaluation of interspecific hybrids between Lagerstroemia indica
and L. speciosa. Hortscience 2007, 42, 1317–1322. [CrossRef]31. Katsuo, K. Crape-Myrtle Named Purple Queen. U.S. Patent US PP07: 957, 1992.32. Katsuo, K. Crape-Myrtle Named White Fairy. U.S. Patent US PP07: 968, 1992.33. Pooler, M.R. Arapaho’ and Cheyenne’ Lagerstroemia. Hortscience 2006, 41, 855–856. [CrossRef]34. Ye, Y.J.; Wu, J.; Feng, L.; Ju, Y.; Cai, M.; Cheng, T.; Pan, H.; Zhang, Q. Heritability and gene effects for plant
architecture traits of crape myrtle using major gene plus polygene inheritance analysis. Sci. Hortic.-Amst.2017, 225, 335–342. [CrossRef]
35. Ye, Y.J.; Liu, Y.; Cai, M.; He, D.; Shen, J.S.; Ju, Y.Q.; Bian, X.M.; Pan, H.T.; Zhang, Q.X. Screening of molecularmarkers linked to dwarf trait in crape myrtle by bulked segregant analysis. Genet. Mol. Res. 2015, 14,4369–4380. [CrossRef]
36. He, D.; Liu, Y.; Cai, M.; Pan, H.T.; Zhang, Q.X.; Wang, X.Y.; Wang, X.J. Genetic diversity of Lagerstroemia(Lythraceae) species assessed by simple sequence repeat markers. Genet. Mol. Res. 2012, 11, 3522–3533.[CrossRef] [PubMed]
37. Cai, M.; Pan, H.; Wang, X.; He, D.; Wang, X.; Wang, X.; Zhang, Q. Development of novel microsatellites inLagerstroemia indica and DNA fingerprinting in Chinese Lagerstroemia cultivars. Sci. Hortic.-Amst. 2011, 131,88–94. [CrossRef]
38. Wang, J.; Dai, X.; Chen, Y.; Yang, Y.; Zhang, X.; Li, S.; Yin, T. Genomic sequencing using 454 pyrosequencingand development of an SSR primer database for ‘Lagerstroemia indica’ L. Plant Omics 2015, 8, 17.
39. He, D.; Liu, Y.; Cai, M.; Pan, H.; Zhang, Q. The first genetic linkage map of crape myrtle (Lagerstroemia) basedon amplification fragment length polymorphisms and simple sequence repeats markers. Plant Breed. 2014,133, 138–144. [CrossRef]
40. Liu, Y.; He, D.; Cai, M.; Tang, W.; Li, X.Y.; Pan, H.T.; Zhang, Q.X. Development of microsatellite markers forLagerstroemia indica (Lythraceae) and related species. Appl. Plant Sci. 2013, 1, 1200203. [CrossRef]
41. Ye, Y.; Cai, M.; Ju, Y.; Jiao, Y.; Feng, L.; Pan, H.; Cheng, T.; Zhang, Q. Identification and validation of SNPmarkers linked to dwarf traits using SLAF-Seq technology in Lagerstroemia. PLoS ONE 2016, 11, e158970.[CrossRef]
42. Bassi, D.; Rizzo, M. Peach breeding for growth habit. Acta Hortic. 2000, 1, 411–414. [CrossRef]43. Thakur, A.K.; Uphoff, N.; Antony, E. An assessment of physiological effects of system of rice intensification
(SRI) practices compared with recommended rice cultivation practices in India. Exp. Agr. 2010, 46, 77–98.[CrossRef]
44. Zhu, R.R.; Gao, Y.K.; Xu, L.J.; Zhang, Q.X. Genetic diversity of Aquilegia (Ranunculaceae) species and cultivarsassessed by AFLPs. Genet. Mol. Res. 2011, 10, 817–827. [CrossRef]
45. Ju, Y.; Feng, L.; Wu, J.; Ye, Y.; Zheng, T.; Cai, M.; Cheng, T.; Wang, J.; Zhang, Q.; Pan, H. Transcriptome analysisof the genes regulating phytohormone and cellular patterning in Lagerstroemia plant architecture. Sci. Rep.2018, 8, 15162. [CrossRef]
46. Kosambi, D.D. The estimation of map distances from recombination values. Ann. Hum. Genet. 2016, 12,125–130.
220

Forests 2019, 10, 429
47. Guidry, R.K.; Einert, A.E. Potted dwarf crape myrtles: A promising new floriculture crop. Flor. Rev. 1975,157, 30.
48. Shi, J.; Chen, Z.; Qin, B.; Cai, M.; Pan, H.; Zhang, Q. Phenotypic and genetic analysis of reptant plant type,applanate branch and other related characters in Lagerstroemia indica. Adv. Ornam. Hortic. China 2016, 1,100–109.
49. Jiao, Y.; Feng, L.; Ye, Y.; Ju, Y.; Pan, H.; Zhang, Q.; Wang, G.; Pan, L.; Zhu, Y. Phenotypic and genetic analysisof several traits in F1 Hybrids of Lagerstroemia speciosa and L. India. Adv. Ornam. Hortic. China 2017, 1,292–297.
50. Hollender, C.A.; Pascal, T.; Tabb, A.; Hadiarto, T.; Srinivasan, C.; Wang, W.; Liu, Z.; Scorza, R.; Dardick, C.Loss of a highly conserved sterile alpha motif domain gene (WEEP) results in pendulous branch growth inpeach trees. Proc. Natl. Acad. Sci. USA 2018, 115, E4690–E4699. [CrossRef]
51. Zhao, J.; Chen, F.; Teng, N.; Chen, S. Genetic analysis and RAPD marker of creeping habits in ground-coverChrysanthemum. Sci. Agric. Sin. 2009, 42, 734–741.
© 2019 by the authors. Licensee MDPI, Basel, Switzerland. This article is an open accessarticle distributed under the terms and conditions of the Creative Commons Attribution(CC BY) license (http://creativecommons.org/licenses/by/4.0/).
221


Article
Morphological Characteristics and AllometricRelationships of Shoot in Two Undergrowth Plants:Polygonatum odoratum and Polygonatum multiflorum
Mirela Tulik 1,*, Jerzy Karczewski 2, Natalia Szeliga 3, Joanna Jura-Morawiec 4
and Ingeborga Jarzyna 5
1 Department of Forest Botany, Warsaw University of Life Sciences—SGGW, 02-776 Warsaw, Poland2 Department of Biophysics and Plant Morphogenesis, University of Silesia, 40-032 Katowice, Poland;
[email protected] Lezajsk Forest District, 37-300 Lezajsk, Poland; [email protected] Polish Academy of Sciences Botanical Garden—Centre for Biological Diversity Conservation in Powsin,
02-973 Warsaw, Poland; [email protected] Faculty of Biology, Biological and Chemical Research Centre, University of Warsaw, 02-089 Warsaw, Poland;
[email protected]* Correspondence: [email protected]; Tel.: +48-22-593-8032
Received: 16 November 2018; Accepted: 17 December 2018; Published: 19 December 2018
Abstract: The main purpose of this investigation was to describe the spatial arrangement of shoottissues, as seen in transverse section, and allometric relationships in two contrasting species ofPolygonatum i.e., Polygonatum odoratum which commonly grows in mixed pine-oak forest with shootsrectangular in shape, and Polygonatum multiflorum found in oak-hornbeam forest with cylindricalshoots. The mass and length of the aerial shoots of each individual plant were measured. The shootregions of each plant were then categorized as basal (b), central (c) or apical (a). Transversesections of these shoot regions were subsequently cut, and the following parameters were measured:(1) Diameter of shoots, (2) thickness of the outer and inner zones of parenchyma and (3) thickness ofthe sclerenchyma zone. Additional allometric relationships between the various measurements werecomputed and determined as Pearson’s correlation coefficients (r). Both species of Polygonatumdiffered significantly with respect to the length, diameter and thickness of the outer zone ofparenchyma. Shoots of P. multiflorum were taller but narrower than those of P. odoratum, whichhad a significantly wider zone of outer parenchyma. Allometric relationships were stronger forP. multiflorum, and for both species, they were generally stronger in the basal part of the shoot.We conclude that in P. multiflorum, the strong correlation between the diameter and length of theshoot seems to be important to the growth in shaded environments.
Keywords: allometry; anatomy; Polygonatum odoratum; Polygonatum multiflorum; shape; shoot
1. Introduction
Spatial organization of the plant body is defined as plant architecture subject to genetic andenvironmental control [1]. It is widely believed that the purpose of the mechanical integrity of theshoot is to ensure the reproductive success and survival of the plant [2]. Such mechanical integrity,and the peripheral location (or peripheral concentration in the case of monocots) of vascular bundlesand mechanical supporting tissues such as collenchyma and sclerenchyma also enable the plant toresist and respond to physical forces such as wind and are exacerbated by the weight of the plantitself [3]. Crook et al. [4] demonstrated that plants occupying different habitats are able to modifytheir structural investment so as to maintain a “constant factor of safety” against mechanical failure.
Forests 2018, 9, 783; doi:10.3390/f9120783 www.mdpi.com/journal/forests223

Forests 2018, 9, 783
As a consequence, plants that grow in exposed sites differ from those occupying more shelteredenvironments in terms of their morphology and anatomy [5].
In a forest, light is one of the main factors affecting species diversity and coexistence of plants [6,7].It influences the abundance [8] and composition [9] of species in the understory. The plants growingon the forest floor obtain only 0.5%–5% of incident light [10]; in tropical rainforests less than 1% [11]and less than 2%–5% in moderately humid deciduous forests [12].
We examined two species of Polygonatum, growing on the forest floor namely Polygonatumodoratum (Mill.) Druce and Polygonatum multiflorum (L.) All, both members of the monocotyledonousfamily Asparagaceae (APG III 2009). These differ from each other in several ways, including thenumber of flowers located in leaf axils, the size and shape of the shoot, and the habitats that theyoccupy. One of the most distinct differences between their habitats is the amount of light reaching theforest floor [13]. P. odoratum is native to Europe, Asia, and Northern Africa (http://e-monocot.org).It prefers semi-shade and a moderately exposed habitat, where it grows to a height of ~65 cm. Its white,tubular flowers (one, rarely two per axil) hang singly from the underside of the shoot, which is squareto rectangular in transverse section. By contrast, P. multiflorum can grow to a height of 80 cm indeciduous European or Asian forests (beech, oak and hornbeam). Its tubular flowers are also white(usually 3–5 per leaf axils) and also hang from beneath the shoot which, unlike that of P. odoratum,is cylindrical in shape and round in transverse section.
Since mechanical design, whether it be at the cellular level or at the level of whole-plantarchitecture, appears to be fundamental to survival, the main purpose of this investigation wasto describe the spatial arrangement of shoot tissues, as seen in transverse section, and allometricrelationships in two contrasting species of Polygonatum.
2. Materials and Methods
Shoots of the two species used for our study (P. multiflorum and P. odoratum) were collected inthe late spring of 2015 and 2017. Fifteen flowering individuals of each species were collected foreach of the two years of our study. Individuals of P. odoratum were found in mixed pine-oak forestQuerco roboris-Pinetum (W. Mat.1981) J. Mat. 1988) whereas P. multiflorum grew in sub-continentaloak-hornbeam forest (Tilio-Carpinetum Tracz. 1962). Plants of each species were cut at ground level,protected from desiccation, and brought to the laboratory, where they were subjected to investigations.
Shoot length (L) was subsequently measured and three shoot regions determined for each, namely:Basal (b), located close to the base of the shoot; central (c), located in the middle part of the shoot;and apical (a), located near the apex (Figure 1).
Hand-cut transverse sections were then obtained from each of these shoot regions for both species.The protocol using carrot and cork, as recommended by Gärtner and Schweingruber [14], was adoptedfor preparing sections using a sliding microtome (Microm HM 440, GMI Inc, Ramsey, MN, USA).For the detection of lignified cell walls, sections were stained with Alcian blue and Safranin [15] andsome sections were also observed under UV (ultraviolet) light. Photomicrographs were achievedwith the aid of an Olympus system consisting of a BX61 motorized microscope (Olympus, Tokyo,Japan) and Cell P image analysis software (version 3.4) coupled to a Color View digital camera(Olympus Soft Imaging System GmbH, Munster, Germeny). Based on images taken from each regionof the shoot for every individual, the following parameters were measured: (1) diameter of shoot (D);(2) thickness of mechanical tissue zone (sclerenchyma zone, Ws); (3) thickness of parenchyma tissuelocated externally to the mechanical tissue (hereafter referred to as outer parenchyma zone (Wp)); and(4) thickness of inner parenchyma zone (Wpi, calculated and expressed as the difference between thediameter and the sum of the thicknesses of outer parenchyma and sclerenchyma zones, as follows:Wpi = D − (Wp + Ws)). Measurements were performed at two points on the circumference of eachsection and the average measurements calculated. The accuracy of these measurements was ±0.01 mm.
224

Forests 2018, 9, 783
Figure 1. Location of three regions along the length of Polygonatum shoot categorized as basal (b),central (c) and apical (a). Region (b) was 0.5 cm above ground level.
In addition, we determined the mass (M) of the entire aerial part of individual plants collectedin 2017 and measured shoot length (L). Accuracy of the measurements was ±0.01 g and ±0.1 mm,respectively. The allometric relationships between all measurements were characterized by allometricscaling laws of the form Y = cMb (c—constant, b—allometric scaling coefficient) and determined asPearson’s correlation coefficients (r) on data transformed to a natural logarithm. A similar method wasused by Niklas [5], Weiner and Thomas [16], and Poorter et al. [17].
Significance of difference between means was assessed by Student’s t-test. Analyses werecomputed on Statistica software, version 13.
3. Results
3.1. Morpho-Anatomical Analysis of Polygonatum Shoots
Shoot anatomy of both investigated species demonstrated significant similarity, despite differencesin the cross-sectional shape of the shoots (rectangular in P. odoratum and round in P. multiflorum;Figure 2a, b). The shoots of both species were comprised of epidermis, ground tissue and collateralvascular bundles. The ground tissue was represented by the outer parenchyma, sclerenchyma andinner parenchyma (core). The collateral, closed vascular bundles, were irregularly scattered throughoutthe ground tissue (Figure 2c–e). Towards the outer parenchyma, the bundles were smaller in size,whereas those near the centre of the shoot were larger. The vascular bundles, especially those locatedperipherally, were enclosed within a sclerotic sheath comprised of layers of sclerenchyma fibres.
225

Forests 2018, 9, 783
Figure 2. (a,b) Diagram showing shape of Polygonatum shoots as seen in transverse section; rectangularin P. odoratum (a) and circular in P. multiflorum (b). The sclerenchyma zone is marked black;the outer/inner parenchyma zone white. Vascular tissue is represented by scattered collateral bundles.(c–e) Photomicrographs of transverse sections of P. odoratum (c,d) and P. multiflorum (e) shoots. Scalebar = 200 μm. (c)—section viewed under UV light. Fluorescence of lignified cell walls of sclerenchymacells is marked with arrow. p—outer parenchyma zone; s—sclerenchyma zone; pi—inner parenchymazone; cvb—collateral vascular bundle.
No significant difference were observed in the thickness of the sclerenchyma zone between thespecies at basal level. Nevertheless, plants varied significantly with respect to the thickness of theouter zone of parenchyma, regardless of region (Table 1).
Table 1. Values of Student’s t-test for the mean thickness of the outer parenchyma zone for the threeregions (basal, central, and apical) along the shoots of P. odoratum (P. o) and P. multiflorum (P. m).
Variable atCategorized Region
Meant-Value p-Value
P. o P. m
Basal 0.1876 0.1047 8.6023 0.0000Central 0.1589 0.0930 7.3910 0.0000Apical 0.1555 0.0931 8.8375 0.0000
Means are expressed in mm, n = 15.
In the basal region, the mean thickness of the outer parenchyma zone of P. odoratum reached0.19 mm, as compared with 0.10 mm in P. multiflorum (Figure 3).
226

Forests 2018, 9, 783
Figure 3. Thickness of outer parenchyma zone at basal (b), central (c) and apical (a) regions along shootof both species.
For both species, the width of the outer parenchyma zone diminished along its length, althoughfor P. multiflorum, the mean value at the central region was almost identical to that for the apicalregion. The mean thickness of the sclerenchyma zone in the basal region was similar: 0.055 mm forP. odoratum and 0.053 mm for P. multiflorum. In both species, the diameter of shoot and thickness of thesclerenchyma zone diminished on approaching the apical region, but we observed very significantdifferences between values (Figure 4).
Figure 4. Thickness of sclerenchyma zone at basal (b), central (c) and apical (a) regions along shoot ofboth species. Significant differences are for central (p <0.0001) and apical (p <0.0000001) regions.
227

Forests 2018, 9, 783
Moreover, the species differed significantly with respect to the radius/diameter, thickness of theouter parenchyma zone and sclerenchyma zone relative to the overall length of their shoots (Table 2).
Table 2. Values of Student’s t-test for the mean radius and thickness of the outer parenchyma zone andsclerenchyma zone for the entire length of the shoot of tested plants.
VariableMean
t-Value p-ValueP. o P. m
Radius 1.6416 1.4050 2.0269 0.0456Thickness of outerparenchyma zone 0.1674 0.0969 13.0812 0.0000
Thickness of sclerenchymazone 0.05217 0.0395 5.28161 0.0000
P. o—P. odoratum; P. m—P. multiflorum. Means are expressed in mm, n = 45.
3.2. Allometric Relationships
Correlations between diameter (D) and length (L) of the shoot for each of the two species and forall three regions of the shoot (basal, central and apical) were very significant (Table 3, Figure 5). ForP. multiflorum, values for r were greater than for P. odoratum. For both species, values for r were greaterfor the basal region than for the apical region of the shoot. Individuals of P. multiflorum had longershoots, although these had smaller diameters.
Table 3. Values of Pearson’s correlation coefficients (r) between diameter (D) and length (L) of the shootfor the two species P. odoratum and P. multiflorum based on three regions of the shoot (basal, centraland apical).
r D–L
Basal Central Apical
P. odoratum 0.7305 ** 0.8555 *** 0.6224 *P. multiflorum 0.9626 *** 0.9152 *** 0.8511 ***
Data transformed to natural logarithm. Asterisks denote the statistical significance of Pearson’s correlationcoefficient: *** p <0.001, ** p <0.01, * p <0.05, n = 15.
Figure 5. Cont.
228

Forests 2018, 9, 783
Figure 5. Relationships between diameter and length for all three regions of the shoot for the twospecies P. odoratum and P. multiflorum.
A relationship also existed between mass (M) and length (L) of the shoot (data ln-transformed).For both species, coefficients of correlation were similar: for P. multiflorum r = 0.6473 and for P. odoratumr = 0.6757, p <0.01 (Figure 6). Individuals of P. multiflorum were generally larger, with longer shootsand greater mass.
229

Forests 2018, 9, 783
Figure 6. Relationships between mass and length of the shoot for the two species P. odoratum andP. multiflorum.
We also observed correlations between the thickness of the sclerenchyma zone (Ws) and that ofthe outer parenchyma zone (Wp) vs. shoot diameter (D), as well as shoot length (L), in both species(Table 4). Correlations were generally stronger for the basal part of the shoot than for the apical region,but this relationship was generally not very strong.
Table 4. Values of Pearson’s correlation coefficients (r) between the thickness of the sclerenchyma zone(Ws) and the thickness of the outer parenchyma cylinder (Wp) vs. shoot diameter (D) and shoot length(L) for P. odoratum and P. multiflorum based on three regions of the shoot (basal, central and apical).
P. odoratum
Ws-D Ws-L Wp-D Wp-L
basal 0.529657 * 0.664209 ** NS 0.599483 *central NSapical NS NS NS
P. multiflorum
Ws-D Ws-L Wp-D Wp-L
basal 0.816187 *** 0.799026 *** NScentral NS NS NS NSapical 0.522822 * 0.741862 ** NS NS
Data transformed to natural logarithm. Asterisks denote the statistical significance of Pearson’s correlationcoefficient: *** p <0.001, ** p <0.01, * p <0.05, NS—non significant, n = 15.
4. Discussion
The organization and spatial distribution of tissues in the shoot of two species of Polygonatummay support the thesis that these plants are adapted to be resistant to mechanical failure, since theyare composed of a variety of cells whose walls (made of cellulose and lignin) differ in elasticity [5,18].Comparison of the shoot structure of Polygonatum with the anatomy of grasses reveals a universalsolution to certain structural problems (in particular those relating to mechanical support) common toboth groups of plants. Fundamentally, the most common type of aerial shoot anatomy in monocotsis based on the presence of a peripherally situated cylinder of sclerenchyma fibres. Hypodermalsclerenchyma is also very common in grass. This tissue is dead at maturity, with thick, lignifiedwalls enclosing an empty lumen [5,19]. The distribution of this tissue provides increased support andrigidity and helps the plant withstand forces, such as wind. Centralized arrangement of mechanical
230

Forests 2018, 9, 783
tissues is also observed, especially in roots, as well as the shoots of submerged, aquatic angiosperms,both of which are subject to pulling strains [20]. A sclerotic sheath (a sheath of sclerenchymatous fibressurrounding the vascular bundles) may comprise the main stiffening element in many other monocots,such as palms [21]. It is stiffer by far than the surrounding parenchymatous ground tissue in whichthe vascular bundles are embedded [22–24]. It is also worth noting that the shoot of grasses is usuallyhollow e.g., the internodes of cereals. In other words, air occurs at the ‘core’ of grass shoots and thisis the lightest and least expensive arrangement, both in terms of material and energy expenditure.Moreover, it permits longitudinal gaseous transport and is of particular value in certain marginalplants, where like the aerenchyma of true hydrophytes, it may allow the aeration of submergedorgans. The arrangement of mechanical tissue, both peripherally and around each vascular bundle isconsidered optimal and in the case of grasses, provides excellent protection from mechanical failure(e.g., wilting), since the weight of plant per unit of shoot volume is greatly reduced. In describing themorphological and anatomical adaptation of grass shoots to mechanical stress, Frey [25] compared itwith a fundamental rule of eastern fighting, namely, “flex to win”. In contrast to grasses, the shoot coreof Polygonatum is solid and parenchymatous, consisting of thin-walled parenchyma cells. Thin-walledtissues tend to possess lower elastic moduli than thick-walled tissues [5]. Nevertheless, they becomeincreasingly important when the shoot is thick and the amount of sclerenchyma present small.Parenchyma may provide mechanical support hydrostatically by means of cell turgidity [5].
As previously mentioned, in order to be resistant to mechanical support, the shoot must be ableto bend, but not break, and therefore it is necessary that the most rigid tissue is peripherally located.As a result, some sort of compromise must be reached between the distribution of mechanical andphotosynthetic tissue. The question then arises: How do both species of Polygonatum resolve thisanatomical conflict between the requirement for support and that for photosynthesis? One possibleexplanation in the case of P. multiflorum is that the turgor pressure of the inner parenchyma cellson the inside of the cylinder of sclerenchyma reinforces the shoot. As a result, these plants maygrow taller and become more slender so as to absorb more solar energy for photosynthesis andother light-dependent processes. In the case of P. odoratum, the outer zone of photosynthetic corticalparenchyma is wider and therefore the mechanically resistant sclerenchyma is less peripheral in itsdistribution. As a consequence, the shoots of this species are shorter and have a greater diameter,allowing the plant to grow at greater light intensities and owing to the wider zone of chlorophyllouscortical parenchyma (outer parenchyma), photosynthesis is enhanced. It would also appear that in thecase of Polygonatum the compromise between mechanical support and photosynthesis is subject to theenvironment, especially since light conditions have a particularly strong impact both on plant size andform [26,27].
The behaviour of P. multiflorum may also be compared with the growth strategy of sapling trees.Young and quickly growing trees produce juvenile wood external to the pith [28]. The properties ofjuvenile wood are different from those of mature wood and the former is thought to be mechanicallymore resistant. Cells of juvenile wood tend to be shorter and have thinner walls. Therefore, juvenilewood is less dense than mature wood [29]. Young trees have slender stems that are more flexiblethan those of older trees, may grow rapidly towards the canopy and bend without breaking. It seemsthat the shoots of P. multiflorum, which are taller and have a smaller diameter, are better adapted tocompete for light than those of P. odoratum (despite the fact that their mechanical tissue is representedby sclerenchyma and/or parenchyma cells, and that the pattern of biomass partitioning is intermediateto that typical of herbaceous plants and trees).
Allometric relations have frequently been reported for trees (in order to estimate their totalbiomass or root mass—parameters that are difficult to measure), but are less often reported forherbaceous plants, which are believed to be a result of natural selection processes and adaptiveevolutionary changes [30–32]. Weiner and Thomas [16] suggested that the ability of plants to adapt tothe environment modifies allometric relationships, especially in annual plants, and may depend on theprevailing growing conditions [33,34]. Jarzyna [35] investigated allometric relationships for competing
231

Forests 2018, 9, 783
and non-competing plants, discovering that those for competing plants were stronger. It is likely that inboth P. odoratum and P. multiflorum, amongst others, the availability of light may be a crucial factor forexplaining allometric relationships. These relationships are stronger in P. multiflorum, probably becausethis species grows in poorer light conditions (oak-hornbeam forest). In moderately humid deciduousforests, the percentage of sunlight reaching through the tree foliage to the herb and moss layer on theforest floor is less than 2%–5% [12]. Moreover, light reaches the forest floor mainly in the dormantseason, while in the summer time, leaves of the canopy trees block the passage of light to the ground.Based on differences in tree crown morphology and the stand structure occupied by both investigatedspecies of Polygonatum, it could be assumed that in a dense forest stand occupied by P. mutliflorum, lesslight penetrates through the canopy. Thus, with limited light availability in the understory, the tallerP. multiflorum might invest more energy into its aboveground biomass i.e., its supporting shoot.
5. Conclusions
Our paper contributes towards a better understanding of the relationship that exists betweenplant structure and the environment, based on two contrasting species of Polygonatum (P. odoratumand P. multiflorum) growing on the forest floor that differ from each other in the shape of the shoot,as viewed in transverse section. We conclude that the spatial distribution of tissues in the shoots of theinvestigated species is typical of that found in self-supporting herbaceous plants. In P. multiflorum,the strong correlation between shoot diameter and length seems to be important to growth inshaded habitats.
Author Contributions: Conceptualization, M.T. and N.S.; Investigation and Methodology, M.T., N.S. and J.J.M.;Software, J.K. and I.J.; Writing—Review and Editing, M.T., I.J., J.J.M.
Funding: This research received no external funding.
Conflicts of Interest: The authors declare that there is no conflict of interest.
References
1. Reinhard, D.; Kuhlemeier, C. Plant architecture. EMBO Rep. 2002, 3, 846–851. [CrossRef] [PubMed]2. Crook, M.J.; Ennos, A.R. Mechanical differences between free-standing and supported wheat plants, Triticum
aestivum L. Ann. Bot. 1996, 77, 197–202. [CrossRef]3. Gartner, B.L. Root biomechanics and whole plant allocation patterns: Responses of tomato to stem flexure.
J. Exp. Bot. 1994, 45, 1647–1654. [CrossRef]4. Crook, M.J.; Ennos, A.R.; Sellers, E.K. Structural development of the shoot and root systems of two winter
wheat cultivars. J. Exp. Bot. 1994, 45, 857–863. [CrossRef]5. Niklas, K.J. Plant allometry: The Scaling of Form and Process; University of Chicago Press: Chicago, IL, USA,
1994; ISBN 9780226580814.6. Grime, J.P. Evidence for the existence of three primary strategies in plants and its relevance to ecological and
evolutionary theory. Amer. Nat. 1977, 111, 1169–1194. [CrossRef]7. Schmidt, W.; Weitemeier, M.; Holzapfel, C. Vegetation dynamics in canopy gaps of beech forest on
limestone—The influence of the light gradient on species richness. Verh. Ges. Ökol. 1996, 25, 253–260.8. Elemans, M. Light, nutirents and the growth of herbaceous forest species. Acta Oecol. 2004, 26, 197–202.
[CrossRef]9. Tinya, F.; Márialigeti, S.; Király, B.; Németh, B.; Ódor, P. The effect of light conditions on herbs, bryophytes
and seedlings of temperate mixed forests in Orség, Western Hungary. Plant Ecol. 2009, 204, 69–81. [CrossRef]10. Chazdon, R.L.; Pearcy, R.W. The importance of sunflecks for forest understory plants. BioScience 1991, 41,
760–766. [CrossRef]11. Kitajima, K.; Mulkey, S.S.; Wright, J. Variation in crown light utilization characteristics among tropical canopy
trees. Ann. Bot. 2005, 95, 535–547. [CrossRef]12. Nunements, U. A review of light interception in plant stands from leaf to canopy in different plant functional
types and in species with varying shade tolerance. Ecol. Res. 2010, 25, 693–714. [CrossRef]13. Obminski, Z. Ekologia Lasu; Panstwowe Wydawnictwo Naukowe: Warszawa, Poland, 1977; pp. 260–268.
232

Forests 2018, 9, 783
14. Gärtner, H.; Schweingruber, F.H. Microscopic Preparation Techniques for Plant Stem Analysis; Kessel PublishingHouse: Remagen, Germany, 2013; ISBN 978-3-941300-76-7.
15. Broda, B. Metody Histochemii Roslinnej; Panstwowy Zakład Wydawnictw Lekarskich: Warszawa, Poland, 1971.16. Weiner, J.; Thomas, S.C. Competition and allometry in three species of annual plants. Ecology 1992, 73,
648–656. [CrossRef]17. Poorter, H.; Jagodzinski, A.M.; Ruiz-Peinado, R.P.; Kuyah, S.; Luo, Y.; Oleksyn, J.; Usoltsev, V.A.; Buckley, T.N.;
Reich, T.N.; Reich, P.B.; et al. Howe does biomass distribution change with size and differ among species?An analysis for 1200 plant species from five country. New Phytol. 2015, 208, 736–749. [CrossRef] [PubMed]
18. Vincent, J.F.V. The mechanical design of grass. J. Mater. Sci. 1982, 17, 856–860. [CrossRef]19. Goodman, A.M. Mechanical adaptations of Cleavers (Gallium aparine). Ann. Bot. 2005, 95, 475–480. [CrossRef]
[PubMed]20. Koehl, M.A.R.; Wainwright, S.A. Mechanical adaptation of a giant kelp. Limnol. Oceanogr. 1997, 22, 1067–1071.
[CrossRef]21. Rüggeberg, M.; Bugert, I.; Speck, T. Structural and mechanical design of tissue interfaces in the giant reed
Arundo donax. J. R. Soc. Interface 2010, 7, 499–506. [CrossRef]22. Rich, P.M. Mechanical structure of the stem of arborescent palms. Bot. Gaz. 1987, 148, 42–50. [CrossRef]23. Tomlinson, P.B. The Structural Biology of Palms; Clarendon Press: Oxford, UK, 1990; ISBN 10: 019854572X.24. Spatz, H.C.; Beismann, H.; Brüchert, F.; Emanns, A.; Speck, T. Biomechanics of the giant reed Arundo donax.
Philos. Trans. R. Soc. Lond. 1997, 352, 1–10. [CrossRef]25. Frey, L. Trawy niezwyciezone. Łakarstwo W Pol. 2000, 3, 9–20.26. Winer, J.; Bernston, G.M.; Thomas, S.C. Competition and growth form in a woodland annual. J. Ecol. 1990,
78, 459–469. [CrossRef]27. Watari, R.; Nagashima, H.; Hirose, T. Stem extension and mechanical stability of Xantium canadense grown in
an open or in dense stand. Ann. Bot. 2014, 114, 179–190. [CrossRef] [PubMed]28. Zobel, B.J.; Sprague, J.R. Juvenille Wood in Forest Trees; Springer-Verlag: Berlin, Germany, 1998; ISBN 978-3-642-72126-7.29. Plomion, C.; Leprovost, G.; Stokes, A. Wood formation in trees. Plant Physiol. 2001, 127, 1513–1517. [CrossRef]
[PubMed]30. Niklas, K.J. Plant height and the properties of some herbaceous stems. Ann. Bot. 1995, 75, 133–142. [CrossRef]31. Castelan-Estrada, M.; Vivin, P.; Gaudillére, J.P. Allometric relationships estimate seasonal above-ground
vegetative and reproductive biomass of Vitis vinifera L. Ann. Bot. 2002, 89, 401–408. [CrossRef]32. Enquist, B.J. Universal scaling in tree and vascular plant allometry toward a general quantitative theory
linking plant form and function from cells to ecosystems. Tree Physiol. 2002, 22, 1045–1064. [CrossRef]33. Prior, S.A.; Rogers, H.H. Soybean growth response to water supply. J. Plant Nutr. 1995, 18, 617–636.
[CrossRef]34. Wang, P.; Weiner, J.; Cahill, J.F.; Zhou, D.W.; Bian, H.F.; Song, Y.T.; Sheng, L.X. Shoot competition, root
competition and reproductive allocation in Chenopodium accuminatum. J. Ecol. 2014, 102, 1688–1696.[CrossRef]
35. Jarzyna, I. Plant morphology and allometric relationships in competing and non-competing plants of Tagetespatula L. Acta Soc. Bot. Pol. 2002, 71, 149–154. [CrossRef]
© 2018 by the authors. Licensee MDPI, Basel, Switzerland. This article is an open accessarticle distributed under the terms and conditions of the Creative Commons Attribution(CC BY) license (http://creativecommons.org/licenses/by/4.0/).
233


Article
Drought Impact on Leaf Phenology and Spring FrostSusceptibility in a Quercus robur L. Provenance Trial
Ivica Cehulic 1, Krunoslav Sever 2, Ida Katicic Bogdan 2, Anamarija Jazbec 2, Željko Škvorc 2 and
Saša Bogdan 2,*
1 Croatian Forest Research Institute, 10450 Jastrebarsko, Croatia; [email protected] Faculty of Forestry; University of Zagreb, 10000 Zagreb, Croatia; [email protected] (K.S.);
[email protected] (I.K.B.); [email protected] (A.J.); [email protected] (Ž.Š.)* Correspondence: [email protected]
Received: 20 November 2018; Accepted: 8 January 2019; Published: 11 January 2019
Abstract: Research highlights: The susceptibility of oaks to late spring and early autumn frosts isdirectly related to their leaf phenology. Drought may alter the leaf phenology and therefore frosttolerance of oaks. However, the effects of drought on oak leaf phenology and frost resistance have notbeen thoroughly studied. Background and objectives: One of the consequences of climate change isan increase in the frequency of dry episodes during the vegetation period. Pedunculate oak (Quercusrobur L.) is an economically and ecologically important forest tree species that prefers humid habitats.Therefore, knowledge of the impact of drought on this species is of great importance for the adaptationof forestry strategies and practices to altered environmental conditions. The aim of this study was todetermine the impact of drought on leaf phenology and spring frost susceptibility in nine provenances.Materials and methods: One-year-old saplings originating from nine European provenances wereused in the trial. The saplings were exposed to experimental drought and then re-watered in twosubsequent years. Spring and autumn leaf phenology were scored. The trial was impacted bya late spring frost in the third year, and the resulting leaf frost injury was scored. The effects ofdrought treatment on the phenology and frost susceptibility of plants from the provenances wereanalysed. Results: Leaf phenology of plants from most of the studied provenances was significantlyinfluenced by the drought treatment (p < 0.001). Drought induced a carry-over effect on flushingphenology, which was observed as delayed bud burst (from 0.6 to 2.4 days) in the second year andas advanced bud burst (from 0.1 to 6.3 days) in the third year. Therefore, opposite shifts in flushingphenology may be induced as a result of differences in the time span when plants sense water deficits.In contrast to flushing, autumn leaf phenology was unambiguously delayed following the droughttreatments for all studied provenances (from 2.1 to 25.8 days). Differences in late frost susceptibilitywere predominantly caused by among-provenance differences in flushing phenology. However, thedrought treatment significantly increased frost susceptibility in the plants (the rate of frost-injuredplants per provenance increased from 3% to 78%). This higher susceptibility to spring frost was mostlikely caused by the advanced flushing phenology that resulted from the drought treatment in theprevious year.
Keywords: pedunculate oak; drought; stress; memory; flushing; autumn leaf senescence;phenological shift; carry-over effect
1. Introduction
The hazards associated with climate change, including rising temperatures, decreasingprecipitation, and an increasing frequency of extreme climatic events, are expected to intensify [1–3].In general, the productivity of forest ecosystems is severely impaired by water availability, and drought
Forests 2019, 10, 50; doi:10.3390/f10010050 www.mdpi.com/journal/forests235

Forests 2019, 10, 50
may induce episodes of large-scale tree decline in temperate forests [4]. Most likely, such declineswill substantially increase the necessity for artificial regeneration of temperate forests. However,the increasing severity and frequency of droughts may also impact forest regeneration, causingunacceptably high seedling mortality rates. Late spring frost is an additional abiotic factor that stronglylimits forest regeneration [5]. Therefore, it is necessary to enhance our understanding of the mutualimpacts of drought and frost on forest reproductive material.
Pedunculate oak (Quercus robur L.) is a widespread European temperate forest tree speciesthat generally prefers fertile and moist habitats [6], although it is also tolerant to arid habitats suchas the forest-steppe ecosystems in eastern Europe (e.g., see [7]). Moreover, this species is one ofthe most economically valuable European hardwood tree species and is a climax species in foreststhat harbor high biodiversity. Because the species is mainly adapted to moist habitats, its droughttolerance will become increasingly important for its survival, especially in the presence of additionalstresses such as frost, competition, pests, and diseases. Theoretically, pedunculate oak may adaptto stressful environmental changes at the individual, population, and plant community levels [2]through phenotypic modifications (i.e., plasticity), natural selection, and hybridization with relatedxerophilous species, such as sessile oak and pubescent oak [8,9]. In general, oaks are relativelytolerant to drought [10], as they have a xeromorphic leaf structure and root structure that can copewith variability in soil water availability; additionally, oaks display the ability to rapidly resumeassimilation after periods of water deficiency [11–15]. However, intraspecific variation in responses todrought occurs among oaks from different provenances. Some of this variation has been attributed toadaptability driven by natural selection in the original provenance habitats [16,17], but in othercases, the original site-level climate of provenances has not been correlated with the responsesof oaks to drought (e.g., [18]). Reduced above-ground biomass production, together with a shifttowards root growth, is a drought response often observed in oak species [18–20]. Other droughtresponses by oak include changes in the morphological (e.g., reduced leaf area and chlorophyllcontent) and physiological (e.g., reduced stomatal conductance and water use efficiency) propertiesof leaves [21]. Although pedunculate oak does not appear to possess efficient responses to leaffrost injury [22], oak populations display adaptation to frost events in the form of differences in leafphenology [23]. Additionally, occasional frost events (together with other factors) may have led to highwithin-population genetic variation in pedunculate oak populations, which are often characterized byvarious phenological types [24]. For deciduous tree species such as Q. robur, the timing of bud burst inspring and leaf senescence in autumn is very important in defining the period of carbon fixation andgrowth during the vegetation season as well as determining survival due to the increased frequency ofclimatic extremes such as frosts. Among the most important adaptive traits, phenology is thought tobe one of the most affected by climate change [25]. However, it is necessary to further enhance ourunderstanding of the impacts of interactive stressful climatic events on the phenology of deciduousforest tree species. The effects of drought on oak phenology (especially that of the pedunculate oak)have not been thoroughly studied and have been mainly described as earlier growth cessation underdry conditions [17,26], which is also visible as earlier radial growth cessation [27]. Interestingly,drought may induce an after-effect (i.e., a carry-over effect) in the subsequent spring that is indicatedby advanced bud burst [26,28]. The same effect of water stress on leaf phenology was also recorded inbeech [29]. In one report, sessile oak from different provenances showed a drought-induced carry-overeffect in the subsequent spring, which was observable as a delay in the bud burst date [30]. To thebest of our knowledge, this discrepancy in observed leaf phenological shifts induced by drought inoaks has not been explained, nor reported for other forest tree species. Here, we propose that budburst shifts that occur as a carry-over effect induced by drought have opposite directions dependingon the time span over which the plants sensed the water deficit. That is, if plants sensed the waterdeficit early in the vegetation period (i.e., in spring), then flushing would likely be delayed in thesubsequent year; in contrast, if drought were sensed late (i.e., in summer), then advanced flushingwould likely occur in the subsequent year. The effects of drought on oak frost resistance have been
236

Forests 2019, 10, 50
even less thoroughly studied. In general, few papers address between-provenance genetic variation inoak frost susceptibility (e.g., pedunculate oak [17] and holm oak [31]). One study examined the effectof drought on oak frost hardiness (measured as resistance to winter freezing periods) [32], but it didnot evaluate frosts that occurred in late spring or early autumn. As drought may alter phenology andtherefore the susceptibility of forest tree species to late spring and early autumn frosts, it is necessaryto improve our understanding of these interactive effects.
We established a short-term pedunculate oak provenance trial with seedlings originating fromnine provenances along the eastern European north-south gradient, i.e., from Estonia to Italy. Plantsfrom these provenances were experimentally treated to induce drought conditions during two growingseasons. As the trial was affected by a late spring frost in the third year, we had the opportunity toexamine variation in oak frost susceptibility among provenances as well as the impact of drought onthe frost susceptibility of these plants. The aims of the study were to determine the following: (1) theimpact of drought on the flushing phenology of plants from various provenances; (2) the impact ofdrought on the autumn leaf senescence of plants from these provenances; and (3) among-provenancedifferences in the impact of drought on spring frost susceptibility.
2. Materials and Methods
2.1. Plant Origin and Trial Design
In autumn 2013, acorns were collected below crowns of at least ten randomly chosen maturetrees in each of nine allegedly natural pedunculate oak stands. The provenances are located along alatitudinal gradient from Estonia to Italy (Table 1). Acorns were sent to the Croatian Forest ResearchInstitute and sown in 0.5-litre polyvinyl chloride (PVC) pots filled with nursery substrate. In spring2014, germinated seedlings were individually transplanted into 50-litre PVC pots filled with naturalsoil extracted from a local pedunculate oak forest (soil type: gleysol; pH = 7.6; soil texture: silty loam).The soil was homogenized and cleared of stones, leaves, sprouts, and twigs prior to filling the pots.The pots were kept outdoors during the first vegetation period; thus, they were exposed to naturallocal weather conditions at the nursery of the Croatian Forest Research Institute (45◦40′08.27” N;15◦38′31.96” E; 141 m a.s.l.). In spring 2015, the pots were transferred to a greenhouse and arrangedfollowing a strip-plot experimental design. The first factor (water availability) had two levels: a controlplot and a drought treatment plot (DT plot). The second factor (replication) had three levels. Eachprovenance was represented within each combination of the factors by various numbers of randomlyplaced plants (3–9 per provenance due to differences in acorn germination and seedling survival).
Table 1. Location and climatic characterization of the provenance sites.
CountryProvenance
AbbreviationLatitude N Longitude E T (◦C) PR (mm) bFFP
Estonia ES 58.238520 22.442890 6.1 568.3 April 24thLithuania LI 54.537975 23.811175 6.4 625.3 April 20th
Poland PL 51.190300 16.549010 8.6 554.7 April 11thHungary HU 47.025120 18.263499 10.8 562.0 April 1st
Croatia (Repaš) CR (RE) 46.139763 17.091610 10.8 793.2 April 4thCroatia (Koška) CR (KO) 45.569734 18.235555 10.9 719.0 April 3th
Croatia (Karlovac) CR (KA) 45.494896 15.708384 11.4 994.7 March 29thCroatia (Otok) CR (OT) 45.094245 18.821524 11.3 745.3 April 3th
Italy IT 42.755380 11.918041 14.3 722.8 February 18th
Mean annual temperature (T), mean annual precipitation (PR) and average beginning of the frost-free period inspring (bFFP) were generated with ClimateEU software (version 4.63) (http://www.ualberta.ca/~{}ahamann/data/climateeu.html) for the period of 1901 to 2009. The provenance abbreviations indicate their country of origin.
The trial included a drop-in irrigation system that allowed water availability in the main plots(i.e., control and DT plots) to be controlled. Plants in the control plot were constantly maintained in soilwith a high volumetric soil moisture (VSM) content (i.e., 40%–50% VSM) during the growing period.
237

Forests 2019, 10, 50
The VSM content was monitored by soil moisture sensors, which were set up in six representativepots (one in each combination of the factors) and connected to automatic meteorological stations.
2.2. Treatments
In the first growing period, the trial was established in a greenhouse that was automaticallyventilated, thus preventing excessive heat and air humidity during the summer. Plants in the DT plotwere deprived of water on March 30th, 2015 (Figure 1). The drought treatment was stopped, and theplants were re-watered on July 21st (Figure 1), a date when approximately 20% of the plants in the plothad visible leaf injury symptoms. All plants in the trial continued to regularly receive water until theend of the growing season. During the dormant period of the year (i.e., beginning on November 1st,2015), the pots were transferred outside the greenhouse and exposed to normal local winter conditions.Because the plants had unexpectedly shown vigorous growth in the greenhouse and threatened toreach the ceiling, the trial was performed outside for the remainder of the study. To prevent the soilfrom receiving natural precipitation, each pot was covered with polystyrene panels that were shapedto fit around the plant stem and additionally sealed with polyurethane foam and duct tape.
Figure 1. The beginning and end of growing seasons in the control and drought treatment (DT) plotsin three consecutive years (2015, 2016 and 2017). Open symbols indicate the mean bud burst date in thecontrol (square) and DT (circle) plots, whilst closed symbols indicate the mean date of autumn leafsenescence in the control (square) and drought treatment (circle). The symbol × indicates the late frostevent (on 21st April 2017). Grey polygons indicate the duration of drought treatments in 2015 (from30th March to 21st July) and 2016 (from 20th June to 16th July).
In the subsequent growing period (in 2016), the plants in the DT plot were deprived of waterbeginning on June 20th. The drought treatment was stopped on July 16th (Figure 1), when almost 25%of the plants showed visible leaf injury symptoms. Afterwards, the plants in the DT plot continued toreceive regular watering until the end of the growing season, similar to the way plants in the controlplot were treated.
2.3. Leaf Phenology Scoring
Leaf flushing and autumn leaf senescence were studied from 2015 to 2017 (flushing only in thelast year).
Leaf flushing phenological phases were scored on all plants in the trial on a 1–8 ordinal scale:
1—bud scales completely closed; buds smaller, darker and hard;2—buds swelling, scales slightly spaced;3—bud burst; buds opening, scales considerably more widely spaced, green leaf tips visible;4—folded leaf visible;5—leaf unfolding but not yet flattened, small;6—leaves still relatively small but with flattened blades, blade edges bent downwards, withered,lighter green or reddish;
238

Forests 2019, 10, 50
7—leaves appear developed, larger but still more tenderly structured (thinner) than fully developedleaves and lighter green or reddish;8—leaves fully developed, darker green, thicker.
Autumn leaf phenological phases were scored on a 0–5 ordinal scale:
0—leaves completely green with no visible yellowing;1—up to 25% of plant leaves brown;2—up to 50% of plant leaves brown;3—more than 50% of plant leaves brown;4—more than 75% of plant leaves brown;5—leaves shed.
The day of the year when each plant reached flushing phase 3 was recorded as the bud burst date,and the day of the year when each plant reached autumn leaf phenological phase 3 was recorded asthe autumn senescence date. These individual plant data were used for subsequent statistical analyses.
2.4. Spring Frost Injury Scoring
A late spring frost affected the trial (as well as a much wider geographic area) on April 21st,2017. After a warm period (the mean air temperature from April 1st to April 20th was 12 ◦C, witha maximum temperature of 29.5 ◦C), the air temperature suddenly dropped from the maximum of13.6 ◦C at 3 p.m. on April 20th to −0.1 ◦C at 8 p.m. on the same day, and the temperature continued todecrease until it reached a minimum of −5.8 ◦C at 5 a.m. on April 21st, after which the temperaturerose to −0.3◦C by 7 a.m. and continued to rise.
Several days later, there were visible leaf injuries on the plants in the trial. Leaf injuries appearedas necrotic leaf tissue visible as various shades of brown stretching from the margins of the leaf bladetowards the midrib. On some leaves, these injuries were located closer to the apex, but on others, theinjuries were located closer to the base. In general, there were no cases in which the whole leaf bladesurface was necrotic. Additionally, in all cases, a rather low percentage of plant leaves were injured(on average, 5% of all plant leaves were partly injured). As a result, it was difficult to grade the plantsbased on frost injury; thus, we decided to record frost damage using a binary scale (0—plant has novisible injuries, and 1—plant has visible injuries).
2.5. Statistical Analyses
Individual plant data on bud burst date and autumn leaf senescence date were used for statisticalanalyses. All statistical analyses were performed in SAS/STAT 15.1 software, a free version of SASUniversity Edition by SAS Institute Inc., Cary, NC, USA. Descriptive statistics were performed usingthe MEANS procedure. Analyses of variance (ANOVAs) were performed using the MIXED procedureto determine the statistical significance of the factors (irrigation treatments, blocks, provenances, andthe provenance by treatment interaction) according to the following linear model:
yiklj = μ + Ti + Bj + Pk + TPik + εijk (ANOVA model) (1)
where yijkl—individual value of a trait; μ—overall mean; Ti—fixed effect of treatment i, where i = 1, 2;Bj—random effect of block j, where j = 1, 2, 3; Pk—fixed effect of population k, where k = 1, 2, . . . , 9;TPik—population by treatment interaction; and εijkl—random error.
Assumptions of residual normality and variance homogeneity were tested by using theShapiro–Wilk test and Levine’s test [33] with the GLM and UNIVARIATE procedures in SAS. Residualswere plotted as a function of fitted values to test for variance homogeneity, and the distribution ofresiduals was also tested. The significance of the irrigation treatments was tested by the Wald test andwith the Satterthwaite approximation [34]. Student’s t-test was performed to establish the significanceof differences in the bud burst date between the different groups of frost-injured and uninjured plants.
239

Forests 2019, 10, 50
3. Results
3.1. Flushing Phenology
As expected, in spring 2015 (prior to drought treatment), there were no statistically significantdifferences in the timing of bud burst between the control plot and the DT plot (F = 2.52; p = 0.1131).However, in spring 2016 (the year after the first drought treatment), the mean bud burst date of plantsfrom almost all (except CR (OT)) provenances in the DT plot was delayed (1.5 days on average),ranging from 0.6 to 2.4 days per provenance (Figure 2). The drought treatment effect was statisticallysignificant (F = 12.90; p = 0.0004). In spring 2017, the mean bud burst date of plants in the DT plotwas advanced by 3 days on average (compared with the control), ranging from 0.1 to 6.3 days perprovenance (Figure 2). The only exception was provenance ES, for which plants exhibited a delay inmean bud burst of 1.3 days (Figure 2). The effect of drought on the bud burst date was again highlystatistically significant (F = 31.44; p < 0.0001).
Figure 2. Provenance mean bud burst dates in the treatments (control and drought), expressed asday of year (DOY) in 2016 and 2017. Vertical bars indicate the standard deviation of the mean values.Asterisks above bars indicate significant differences between treatments for the same provenance.Provanance abbreviations: ES—Estonia; LI—Lithuania; PL—Poland; HU—Hungary; CR (RE)—Croatia(Repaš); CR (KO)—Croatia (Koška); CR (KA)—Croatia (Karlovac); CR (OT)—Croatia (Otok); IT—Italy.
3.2. Autumn Leaf Phenology
Autumn leaf phenology was scored in 2015 and 2016 after one and two years of successivedrought treatments were imposed on plants in the DT plot, respectively. In 2015, the plants exhibitedan average delay in senescence of 8 days (ranging from 2 (provenance ES) to 13 (provenance PL) days)(Figure 3). In 2016, leaf senescence was again delayed, in this case by an average of 15 days (rangingfrom 3 (LI) to 26 (CR (RE) days) (Figure 3). Based on ANOVA, the leaf senescence date of plants inthe DT plot was significantly delayed compared to that in the control in both years (F = 179.00 and318.85; p < 0.0001, respectively). Based on Tukey’s test, the mean autumn senescence of plants fromonly the most northern provenances (ES and LI) did not significantly differ between the DT plot andthe control plot.
240

Forests 2019, 10, 50
Figure 3. Provenance means of autumn leaf senescence in the treatments (control and drought)expressed as day of year (DOY) in 2015 and 2016. Vertical bars indicate the standard deviation of themean values. Asterisks above bars indicate significant differences between treatments for the sameprovenance. Provanance abbreviations: ES—Estonia; LI—Lithuania; PL—Poland; HU—Hungary; CR(RE)—Croatia (Repaš); CR (KO)—Croatia (Koška); CR (KA)—Croatia (Karlovac); CR (OT)—Croatia(Otok); IT—Italy.
3.3. Spring Frost Susceptibility
The trial was impacted by a late spring frost occurring on April 21st, 2017. The proportion offrost-injured plants varied among provenances. More than 90% of plants from provenances CR (KO),HU, and CR (RE) were injured in the DT plot, though no plants from provenance LI were injured(Figure 4). Additionally, a larger proportion of damaged plants were observed in the DT plots for mostprovenances, indicating an adverse impact of drought on frost tolerance.
Figure 4. Proportions of frost-injured plants by provenance and treatment. Provanance abbreviations:ES—Estonia; LI—Lithuania; PL—Poland; HU—Hungary; CR (RE)—Croatia (Repaš); CR (KO)—Croatia(Koška); CR (KA)—Croatia (Karlovac); CR (OT)—Croatia (Otok); IT—Italy.
Based on the relationship between the state of flushing on April 21st and the incidence of frostinjuries, plants that had entered flushing phases 5, 6, and 7 were injured (Figure 5). All plants that hadentered flushing phase 7 were injured in both the control and DT plots (only a single plant in the DTplot had no visible symptoms of frost injury). Additionally, all plants in the DT plot that had enteredflushing phase 6 were injured, whereas only 44% of plants in the same flushing phase had visible leaf
241

Forests 2019, 10, 50
injuries in the control plot. There was an obvious difference in the proportion of injured plants thathad reached flushing phase 5 between the control and DT plots (Figure 5).
Figure 5. Total proportion of frost-injured plants from all provenances (in the control and droughttreatments) that were in flushing phase 5 (leaf unfolding but not yet flattened, small), 6 (leaves stillrelatively small but with flattened blades, blade edges bent downwards, withered, lighter greenor reddish), and 7 (leaves appear completely developed, larger but still more tenderly structured(thinner) than fully developed leaves and lighter green or reddish) at the time of the frost event (on21st April 2017).
Because the frost-injured plants were those that had entered flushing phases 5, 6, and 7 onApril 21st, we analysed the proportions of these plants from the studied provenances separatelyfor the control and DT plots. These results are presented in Figure 6. The provenances with thelargest proportion of frost-injured plants in the control plot (see Figure 4) were also those with thelargest proportion of plants that had entered more advanced flushing phases, and vice versa (compareFigures 4 and 6).
Figure 6. Proportions of plants in advanced flushing phases at the time of the frost event on 21stApril 2017 by provenance and treatment: 5 (leaf unfolding but not yet flattened, small), 6 (leavesstill relatively small but with flattened blades, blade edges bent downwards, withered, lighter greenor reddish), and 7 (leaves completely developed, larger but still more tenderly structured (thinner)than fully developed leaves and lighter green or reddish). CO—control; DR—drought treatment.Provanance abbreviations: ES—Estonia; LI—Lithuania; PL—Poland; HU—Hungary; CR (RE)—Croatia(Repaš); CR (KO)—Croatia (Koška); CR (KA)—Croatia (Karlovac); CR (OT)—Croatia (Otok); IT—Italy.
242

Forests 2019, 10, 50
Additionally, the increase in frost susceptibility in the DT plot may be explained by more advanced(i.e., earlier) flushing of plants in that plot. For example, the proportion of frost-injured plants increasedby >50% in the DT plot for provenances PL (from 0% to 78%), HU (from 39% to 96%), and CR (KO)(from 43% to 96%) (Figure 4). The same provenances exhibited the greatest shifts towards moreadvanced flushing on April 21st (Figure 6).
These results led to the question of why all plants that had reached flushing phase 6 (FP6) sufferedfrost injuries in the DT plot while only 44% of the FP6 plants were damaged in the control plot. Thus,we tested for significant differences in the mean bud burst date between control plants not showingfrost injury symptoms and drought-treated plants as well as between frost-injured control plants anddrought-treated plants. These results are shown in Table 2.
Table 2. Student’s t-test comparing the mean bud burst date between the two groups of control plants(injured or uninjured) and DT plants (all frost injured).
Groups of Plants which were inFP 6 * on April 21st regarding the
Plots and Frost InjuriesNumber of Plants
Mean Day of the BudBurst (± Standard
Deviation)
Difference from theGroup Number 2
t-Value (p)
1. Uninjured control plants 30 96.91 ± 1,70 2.898 (0.0026)2. Plants in the DT plot (they were
all injured by the frost) 55 95.77 ± 1.80
3. Injured control plants 24 96.26 ± 1.93 1.067 (0.146)* flushing phase 6. DT = drought treatment.
Therefore, we compared two groups of control plants with drought-treated plants. Student’s t-testshowed that uninjured control plants had started flushing significantly later, but injured control plantshad not. Although all these plants were recorded as being in flushing phase 6 on April 21st, theseresults (Table 2) indicate that plants in the DT plot were at a more advanced flushing state similar tothat of the damaged control plants.
4. Discussion
4.1. Leaf Phenology
In our study, pedunculate oak plants that were experimentally exposed to drought exhibiteddelayed bud burst in the subsequent spring (Figure 2). However, after the second drought treatment,the mean bud burst date of the plants was advanced (Figure 2). This discrepancy (i.e., oppositeshifts in bud burst induced by water stress) was also revealed in other studies. For example,Mijnsbrugge et al. [30] reported delayed bud burst of oak exposed to drought and Kuster et al. [28]and Spieß et al. [26] reported advanced bud burst of oak exposed to drought stress in previous years.Thus, based on our results as well as those from the above-mentioned studies, drought stress has acarry-over effect on oak flushing phenology, which causes it to shift. This effect of water stress onflushing phenology was also recorded in Fagus crenata Blume [29]. Plant environmental responsesare epigenetically regulated. Various environmental signals and stresses can induce epigeneticmodifications, thereby creating a flexible “memory” system for short or prolonged periods of time [35].Changes in epigenetic marks in trees are accompanied by morphological and physiological changesin various processes such as ageing, organ maturation, and bud set or burst [36–38]. Therefore,drought stress may have triggered an epigenetic response (“memory”) resulting in the observedcarry-over effect on bud burst date in the oaks from the studied provenances. Why bud burstshifts may occur in opposite directions (i.e., towards an earlier or a later date) is an open question.There may be more than one molecular mechanism behind this epigenetic “memory” phenomenon.The complexity of signalling events associated with sensing drought stress in plants is well known(e.g., see [39]). Various chemical signals (e.g., reactive oxygen species, calcium, and plant hormones)participate in the induction of stress tolerance via transduction cascades and the activation of genomicre-programming [40]. For example, abscisic acid (ABA) plays an important role in epigenetic processes
243

Forests 2019, 10, 50
such as in ABA-mediated responses to abiotic stress (see [41]). Therefore, the complexity of droughtsensing and signalling pathways likely results in different epigenetic modifications and thereforephenotypic changes such as opposite shifts in bud burst date. The different time spans over whichplants sense water deficits in the vegetation period presumably cause opposite carry-over effectsregarding flushing phenology. Accordingly, in the first year of the experiment, we stopped wateringthe plants in the DT plot on March 30th, allowing them to sense the water deficit early in the vegetationperiod, i.e., during or shortly after flushing. In contrast, in the second year of the experiment,the plants were deprived of water in the second half of June after they had completely developedleaves. Plants from the studied pedunculate oak provenances responded with delayed bud burstfollowing the first drought treatment (Figure 2). Combined with advanced bud burst following thesecond drought treatment (Figure 2), this indicated that the hypothesis in this study was supported.Of course, the molecular mechanisms underlying the epigenetic “memory” phenomenon are stillpoorly understood [35]; thus, it is not clear why bud burst shifts occur in opposite directions. We canonly speculate that drought in different time spans induced different sensing and signalling pathways,which resulted in the observed effects on the flushing phenology of the studied oak plants. Addressingthe mechanisms underlying the observed effects of drought on flushing phenology was beyond thescope of this study.
Leaf senescence was significantly delayed by drought in plants from all provenances in boththe first and second year of the experiment (Figure 3). Delayed autumn leaf senescence is a knownphysiological response to drought and re-watering in oaks [9,30] as well as other tree species [42].This phenomenon has been explained as the photosynthetic and growth compensation of trees duringthe post-drought period of recovery. Notably, leaf senescence in the most northern provenances (i.e.,Estonia and Lithuania) did not significantly differ between the DT and control plots. Plants from thenorthern provenances may be more sensitive to environmental signalling at the end of the growingseason, which may prevent them from overextending their growing season. Vitasse et al. [43] reporteda similar result in a study on clinal variation in the leaf senescence of Quercus petraea (Matt.) Liebl.from provenances along an altitudinal gradient. Additionally, Deans and Harvey [44] reported anegative correlation between leaf yellowing and latitude in sessile oak, although this correlation wasnot as strong as the positive correlation between budburst date and latitude. Nevertheless, naturalselection in harsher (colder) habitats appears to favour genotypes that respond with more rapid growthcessation in autumn. This relationship may be why the delayed leaf senescence of plants from thenorthern provenances was not as significant as that of plants from the more southern provenances.
4.2. Spring Frost Susceptibility
Spring frost affected the trial (as well as a much wider geographic area) on the morning of April21st, 2017. Within a few days, symptoms of necrosis were observable on plant leaves. This incidentenabled us to study variation in frost susceptibility among provenances and between the treatments inthe trial. There were significant differences among the studied oak provenances in terms of spring frostsusceptibility. The mean proportion of injured plants was strongly related to their state of flushingdevelopment on the particular day when frost impacted the trial. Thus, differences among provenancesin the proportion of frost-injured plants were caused by differences in flushing phenology. Additionally,the difference in the proportion of frost-injured plants between the control and DT plots may also beexplained by differences in flushing phenology. Plants that were in more advanced flushing phasessuffered leaf injury, whereas plants that had not started flushing or were in a state of less advancedflushing did not suffer damage (Figure 5). This result confirms the report by Utkina and Rubtsov [24],who found greater resilience to spring frosts of later flushing pedunculate oaks.
The most frost-susceptible plants were clearly those in flushing phase 7 (almost fully developedleaves with completely flattened blades but still tenderly structured, light green or reddish) becauseall but one of these plants suffered frost injuries in both the control and the DT plots. Additionally,all plants in phenological phase 6 in the DT plot were frost injured (Figure 5). Pedunculate oak do
244

Forests 2019, 10, 50
not appear to possess effective active molecular responses to frost; instead, avoidance is their majoranti-frost “strategy”. This lack of active frost responses was true at least for plants from the earlyflushing provenances that were exposed to the frost in 2017 and suffered leaf injury. The use of escapeas an adaptive response to spring frost risks has been reported in sessile oak populations along anelevation gradient [45] as well as in various pedunculate oak populations [24,46,47]. However, thepresence of a few exceptions (such as a single plant in flushing phase 7 that did not show visiblesymptoms of leaf injury) suggests that at least some pedunculate oak genotypes possess an efficientresponse to freezing at the molecular level. Such a molecular response might be due to alterations inenzymatic activity [48] and the accumulation of soluble sugars, as has already been reported for variousQuercus species [49,50]; additionally, such a response might be due to the more efficient mobilizationof non-structural carbohydrates (NSCs), as reviewed by Villar-Salvador et al. [51].
There was a large increase in the proportion of frost-injured plants in the DT plot (for most ofthe provenances), indicating an adverse impact of drought on oak frost susceptibility (Figure 4). Thisresult raises the question of why plants in the DT plot (drought stressed) showed increased springfrost susceptibility. Based on our results, the main reason for the increased frost susceptibility ofthese plants was the earlier flushing caused by the drought treatment in the previous year. Droughtstress in the previous year induced a clear carry-over effect, which resulted in the earlier flushing ofplants from most provenances (Figure 2; year 2017). Therefore, most of the provenances in the DT plotexhibited an increased proportion of plants at more developed flushing phases on the day when thespring frost occurred. Nonetheless, it was not as obvious why all plants at flushing phase 6 (100%)in the DT plot were harmed by the frost, while only 44% of plants in the same flushing phase in thecontrol plot showed visible injuries. Drought stress may have impacted plants in the DT plot, resultingin an even more reduced efficiency of molecular responses to freezing temperatures. For example,the accumulation and re-mobilization of NSCs and nitrogen (N) reserves play a very important rolein frost resistance (see [51] and references therein). Drought stress in the current growing seasonmay hinder re-mobilization capacity in the next growing season by decreasing seedling N and NSCcontent. [51]. Oaks use NSC and N reserves from storage tissues for their early spring growth beforebud burst [52], and significant reductions in these reserves in spring have been reported for oaks [48].Therefore, the higher proportion of frost-injured saplings in the DT plot may be explained in thefollowing way: summer drought impaired the capacity to accumulate, store, and re-mobilize NSC andN reserves (responsible for frost resistance and vessel formation in early spring), which elevated thefrost susceptibility of the saplings in the DT plot.
Another possibility was that not all plants in flushing phase 6 were in the exact same state offlushing on a particular day. Specifically, injured plants may have started flushing slightly earlier(i.e., were at a slightly more advanced flushing state) than the uninjured plants, despite all of the plantsbeing scored as in the same flushing phase on that particular day. This explanation for the differencein the proportions of damaged phase-6 plants between the DT and control plots is supported by thetest results (Table 2). Uninjured phase-6 plants in the control plot started flushing significantly later(had an earlier bud burst date, on average), while injured phase-6 plants did not (Table 2). Therefore,injured phase-6 plants in the control plot and phase-6 plants in the DT plot were at a slightly moreadvanced state of flushing on the day of the frost, which may have rendered them more susceptible tofrost injuries. Furthermore, the flushing phenology scoring method, in which a plant was graded basedon the most frequent phase, may have resulted in two plants in somewhat different states of flushingbeing assigned the same score. For example, if most buds indicated flushing phase 6, a plant wasgraded as being in phase 6; however, some newly emerging leaves may have already been in phase 7.Such plants may have sustained frost injuries on those few phase-7 leaves. Although plausible, thishypothesis should be further tested.
245

Forests 2019, 10, 50
5. Conclusions
The results of this study confirmed the previously reported effects of drought stress onpedunculate oak leaf phenology, i.e., delayed autumn leaf senescence and a carry-over effect on budburst date. Although the effect of drought on autumn leaf senescence was unambiguous (i.e., delayedsenescence), the mean bud burst dates were shifted in opposite directions in the two analyzed years.Our study supports the hypothesis that opposite shifts in bud burst dates occur due to the differenttimes in the growing season at which plants sense water deficit signals. Accordingly, if oaks sensewater deficits early in the growing season (i.e., during or shortly after flushing), then their bud burstdate will be delayed in the subsequent spring. In contrast, if the oaks sense water deficit signals late inthe growing season (i.e., summer drought), then their bud burst will shift towards an earlier date inthe subsequent spring.
The results strongly indicated an adverse effect of drought stress on pedunculate oak spring frostsusceptibility. The adverse effect was most likely caused by a shift in spring leaf phenology. In otherwords, summer drought stress induced a carry-over effect, resulting in earlier mean bud burst inthe subsequent spring, which made plants from the majority of the studied oak provenances moresusceptible to late-frost leaf injuries. Importantly, the impacts of drought on autumn leaf senescence,i.e., delayed leaf senescence, most likely increase the susceptibility of oaks to early autumn frosts.
However, plants from the latest-flushing provenances were the least sensitive to theabove-mentioned adverse effects of drought on frost resistance. Therefore, these provenances may beconsidered valuable sources of forest reproductive material for the regeneration of oak forests madenecessary by an increase in the frequency of drought and frost events.
Author Contributions: Conceptualization, K.S. and S.B.; Data curation, I.C., A.J. and S.B.; Formal analysis, I.C.,A.J. and S.B.; Funding acquisition, S.B.; Investigation, I.C., I.K.B. and S.B.; Methodology, K.S. and S.B.; Projectadministration, S.B.; Resources, I.C. and A.J.; Supervision, S.B.; Validation, I.C., I.K.B. and A.J.; Visualization, I.K.B.and Ž.Š.; Writing—original draft, I.C. and S.B.; Writing—review & editing, K.S., A.J. and Ž.Š.
Funding: This study was fully supported by the Croatian Science Foundation under grant number IP-2014-09-4686(Phenotypic and Epigenetic Response to Drought Stress and Adaptability of Quercus robur L. Populations along aLatitudinal Gradient).
Acknowledgments: Thank you to all those who kindly supplied acorns from their local provenances for the trial,including Dr. Moica Piazzai (Monte Rufeno Nature Reserve, Italy); Dr. Krista Takkis (Estonia); Dr. VirgilijusBaliuckas (Forest Tree Genetics and Breeding Department of the Lithuanian Research Centre for Agriculture andForestry); Czesław Kozioł (Lesny Bank Genów Kostrzyca); Tomasz Miedzyrzecki and Bartlomiej Laski (MiekiniaForest District, Poland); Goran Peric (Forest Office Koška); staff of the Forest Office Repaš; staff of the Forest OfficeKarlovac and Mladen Šimunic (Forest Office Otok). The trial was maintained by employees of Nursery Productionand the Division for Genetics, Forest Tree Breeding and Seed Husbandry of the Croatian Forest Research Institute.Many thanks to all of them. Thank you to the three anonymous reviewers for helpful comments and suggestions.
Conflicts of Interest: The authors declare no conflicts of interest.
References
1. Parry, M.L. Climate Change: Impacts, Adaptation and Vulnerability. Working Group II Contribution to theFourth Assessment Report of the IPCC Intergovernmental Panel on Climate Change; Cambridge UniversityPress: Cambridge, UK, 2007.
2. Lindner, M.; Maroschek, M.; Netherer, S.; Kremer, A.; Barbati, A.; Garcia-Gonzalo, J.; Seidl, R.; Delzon, S.;Corona, P.; Kolström, M.; et al. Climate change impacts, adaptive capacity, and vulnerability of Europeanforest ecosystems. For. Ecol. Manag. 2010, 259, 698–709. [CrossRef]
3. Intergovernmental Panel on Climate Change (IPCC). Contribution of Working Groups I, II and III to the FifthAssessment Report of the Intergovernmental Panel on Climate Change; Climate Change 2014: Synthesis Report;IPCC: Geneva, Switzerland, 2014.
4. Bréda, N.; Huc, R.; Granier, A.; Dreyer, E. Temperate forest trees and stands under severe drought: A reviewof ecophysiological responses, adaptation processes and long-term consequences. Ann. For. Sci. 2006, 63,625–644. [CrossRef]
246

Forests 2019, 10, 50
5. Kreyling, J.; Stahlmann, R.; Beierkuhnlein, C. Spatial variation in leaf damage of forest trees after the extremespring frost event in May 2011. Allgemeine Forst und Jagdzeitung 2012, 183, 15–22.
6. Ducousso, A.; Bordacs, S. EUFORGEN Technical Guidelines for genetic conservation and use for pedunculateand sessile oaks (Quercus robur and Q petraea). Available online: http://www.euforgen.org/publications/publication/iquercus-roburi-and-iquercus-petraeai-technical-guidelines-for-genetic-conservation-and/(accessed on 15 November 2018).
7. Árvai, M.; Morgós, A.; Kern, Z. Growth-climate relations and the enhancement of drought signals inpedunculate oak (Quercus robur L.) tree-ring chronology in Eastern Hungary. iForest 2018, 11, 267–274.[CrossRef]
8. Kremer, A. Evolutionary responses of European oaks to climate change. Irish For. 2010, 67, 53–66.9. Van der Mijnsbrugge, K.; Turcsán, A.; Maes, J.; Duchêne, N.; Meeus, S.; Van der Aa, B.; Steppe, K.;
Steenackers, M. Taxon-Independent and Taxon-Dependent Responses to Drought in Seedlings from Quercusrobur L., Q. petraea (Matt.) Liebl. and Their Morphological Intermediates. Forests 2017, 8, 407. [CrossRef]
10. Leuschner, C.; Backes, K.; Hertel, D.; Schipka, F.; Schmitt, U.; Terborg, O.; Runge, M. Drought responses atleaf, stem and fine root levels of competitive Fagus sylvatica L. and Quercus petraea (Matt.) Liebl. trees in dryand wet years. For. Ecol. Manag. 2001, 149, 33–46. [CrossRef]
11. Kubiske, M.E.; Abrams, M.D. Stomatal and nonstomatal limitations of photosynthesis in 19 temperate treespecies on contrasting sites during wet and dry years. Plant Cell Environ. 1993, 16, 1123–1129. [CrossRef]
12. Galle, A.; Haldimann, P.; Feller, U. Photosynthetic performance and water relations in young pubescent oak(Quercus pubescens) trees during drought stress and recovery. New Phytol. 2007, 174, 799–810. [CrossRef]
13. Kuster, T.M.; Arend, M.; Bleuler, P.; Gunthardt-Goerg, M.S.; Schulin, R. Water regime and growth ofyoung oak stands subjected to air-warming and drought on two different forest soils in a model ecosystemexperiment. Plant Biol. 2013, 15, 138–147. [CrossRef]
14. Kuster, T.M.; Arend, M.; Gunthardt-Goerg, M.S.; Schulin, R. Root growth of different oak provenances intwo soils under drought stress and air warming conditions. Plant Soil 2013, 369, 61–71. [CrossRef]
15. Turcsán, A.; Steppe, K.; Sárközi, E.; Erdélyi, É.; Missoorten, M.; Mees, G.; Mijnsbrugge, K.V. Early SummerDrought Stress during the First Growing Year Stimulates Extra Shoot Growth in Oak Seedlings (Quercuspetraea). Front. Plant Sci. 2016, 7, 193. [CrossRef] [PubMed]
16. Bruschi, P. Geographical variation in morphology of Quercus petraea (Matt.) Liebl. as related to droughtstress. Plant Biosyst. 2010, 144, 298–307. [CrossRef]
17. Jensen, J.; Hansen, J. Genetic variation in responses to different soil water treatments in Quercus robur L.Scand. J. For. Res. 2010, 25, 400–411. [CrossRef]
18. Arend, M.; Kuster, T.; Günthardt-Goerg, M.S.; Dobbertin, M. Provenance-specific growth responses todrought and air warming in three European oak species (Quercus robur, Q. petraea and Q. pubescens).Tree Physiol. 2011, 31, 287–297. [CrossRef] [PubMed]
19. Broadmeadow, M.S.J.; Jackson, S.B. Growth responses of Quercus petraea, Fraxinus excelsior and Pinus sylvestristo elevated carbon dioxide, ozone and water supply. New Phytol. 2000, 146, 437–451. [CrossRef]
20. Thomas, F.M.; Gausling, T. Morphological and physiological responses of oak seedlings (Quercus petraea andQ. robur) to moderate drought. Ann. For. Sci. 2000, 57, 325–333. [CrossRef]
21. Quero, J.L.; Villar, R.; Marañón, T.; Zamora, R. Interactions of drought and shade effects on seedlings of fourQuercus species: Physiological and structural leaf responses. New Phytol. 2006, 170, 819–834. [CrossRef]
22. Selig, M.; Bohne, H. Late frost reactions of different populations of Quercus robur L. and Tilia cordata Mill. inGermany. Eur. J. Hortic. Sci. 2016, 81, 157–164. [CrossRef]
23. Alberto, F.; Bouffier, L.; Louvet, J.-M.; Lamy, J.-B.; Delzon, S.; Kremer, A. Adaptive responses for seed andleaf phenology in natural populations of sessile oak along an altitudinal gradient. J. Evolut. Biol. 2011, 24,1442–1454. [CrossRef]
24. Utkina, I.A.; Rubtsov, V.V. Studies of Phenological forms of Pedunculate Oak. Contemp. Probl. Ecol. 2017, 10,804–811. [CrossRef]
25. Bertin, R.I. Plant phenology and distribution in relation to recent climate change. J. Torrey Bot. Soc. 2008, 135,126–146. [CrossRef]
26. Spieß, N.; Oufir, M.; Matušíková, I.; Stierschneider, M.; Kopecky, D.; Homolka, A.; Burg, K.; Fluch, S.;Hausman, J.F.; Wilhelm, E. Ecophysiological and transcriptomic responses of oak (Quercus robur) to long-termdrought exposure and rewatering. Environ. Exp. Bot. 2012, 77, 117–126. [CrossRef]
247

Forests 2019, 10, 50
27. Pflug, E.E.; Siegwolf, R.; Buchmann, N.; Dobbertin, M.; Kuster, T.M.; Gunthardt-Goerg, M.S.; Arend, M.Growth cessation uncouples isotopic signals in leaves and tree rings of drought-exposed oak trees.Tree Physiol. 2015, 35, 1095–1105. [CrossRef] [PubMed]
28. Kuster, T.; Dobbertin, M.; Günthardt-Goerg, M.; Schaub, M.; Arend, M. A Phenological Timetable of OakGrowth under Experimental Drought and Air Warming. PLoS ONE 2014, 9, e89724. [CrossRef]
29. Yonekura, T.; Yoshidome, M.; Watanabe, M.; Honda, Y.; Ogiwara, I.; Izuta, T. Carry-over effects of ozoneand water stress on leaf phenological characteristics and bud frost hardiness of Fagus crenata seedlings. Trees2004, 18, 581–588. [CrossRef]
30. Mijnsbrugge, K.; Turcsán, A.; Maes, J.; Duchêne, N.; Meeus, S.; Steppe, K.; Steenackers, M. Repeated SummerDrought and Re-watering during the First Growing Year of Oak (Quercus petraea) Delay Autumn Senescenceand Bud Burst in the Following Spring. Front. Plant Sci. 2016, 7, 419. [CrossRef]
31. Andivia, E.; Fernández, M.; Vázquez-Piqué, J.; Alejano, R. Two provenances of Quercus ilex ssp. ballota (Desf)Samp. nursery seedlings have different response to frost tolerance and autumn fertilization. Eur. J. For. Res.2012, 131, 1091–1101. [CrossRef]
32. Thomas, F.; Ahlers, U. Effects of excess nitrogen on frost hardiness and freezing injury of above-groundtissue in young oaks (Quercus petraea and Q. robur). New Phytol. 1999, 144, 73–83. [CrossRef]
33. Sabin, T.E.; Stafford, S.G. Assessing the Need for Transformation of Response Variables; Forest Research Laboratory,Oregon State University: Corvallis, OR, USA, 1990; p. 31.
34. Littell, R.C.; Milliken, G.A.; Stroup, W.W.; Wolfinger, R.D. SAS System for Mixed Models, 6th ed.; SAS Institute:Cary, NC, USA, 2006.
35. Bräutigam, K.; Vining, K.; Lafon-Placette, C.; Fossdal, C.; Mirouze, M.; Marcos, J.; Fluch, S.; Fraga, M.F.;Guevara, M.Á.; Abarca, D.; et al. Epigenetic regulation of adaptive responses of forest tree species to theenvironment. Ecol. Evol. 2013, 3, 399–415. [CrossRef]
36. Fraga, M.F.; Rodriguez, R.; Canal, M.J. Genomic DNA methylation-demethylation during aging andreinvigoration of Pinus radiata. Tree Physiol. 2002, 22, 813–816. [CrossRef] [PubMed]
37. Santamaria, M.E.; Hasbun, R.; Valera, M.J. Acetylated H4 histone and genomic DNA methylation patternsduring bud set and bud burst in Castanea sativa. J. Plant Physiol. 2009, 166, 1360–1369. [CrossRef]
38. Valledor, L.; Hasbún, R.; Meijón, M. Involvement of DNA methylation in tree development andmicropropagation. Plant Cell Tissue Organ Culture 2007, 91, 75–86. [CrossRef]
39. Chaves, M.; Maroco, J.; Pereira, J. Understanding plant responses to drought—From genes to the wholeplant. Funct. Plant Biol. 2003, 30, 239–264. [CrossRef]
40. Farooq, M.; Wahid, A.; Kobayashi, N.; Fujita, D. Plant drought stress: Effects, mechanisms and management.Agron. Sustain. Dev. 2009, 29, 185–212. [CrossRef]
41. Chinnusamy, V.; Gong, Z.; Zhu, J. Abscisic Acid-mediated Epigenetic Processes in Plant Development andStress Responses. J. Integr. Plant Biol. 2008, 50, 1187–1195. [CrossRef] [PubMed]
42. Arend, M.; Sever, K.; Pflug, E.; Gessler, A.; Schaub, M. Seasonal photosynthetic response of European beechto severe summer drought: Limitation, recovery and post-drought stimulation. Agric. For. Meteorol. 2016,220, 83–89. [CrossRef]
43. Vitasse, Y.; Delzon, S.; Bresson, C.C.; Michalet, R.; Kremer, A. Altitudinal differentiation in growth andphenology among populations of temperate-zone tree species growing in a common garden. Can. J. For. Res.2009, 39, 1259–1269. [CrossRef]
44. Deans, J.D.; Harvey, F.J. Phenologies of sixteen European provenances of sessile oak growing in Scotland.Forestry 1995, 68, 265–274. [CrossRef]
45. Dantec, C.; Ducasse, H.; Capdevielle, X.; Fabreguettes, O.; Delzon, S.; Desprez-Loustau, M. Escape of springfrost and disease through phenological variations in oak populations along elevation gradients. J. Ecol. 2015,103, 1044–1056. [CrossRef]
46. Puchałka, R.; Koprowski, M.; Przybylak, J.; Przybylak, R.; Dabrowski, H.P. Did the late spring frost in 2007and 2011 affect tree-ring width and earlywood vessel size in Pedunculate oak (Quercus robur) in northernPoland? Int. J. Biometeorol. 2016, 60, 1143–1150. [CrossRef] [PubMed]
47. Puchałka, R.; Koprowski, M.; Gricar, J.; Przybylak, R. Does tree-ring formation follow leaf phenology inPedunculate oak (Quercus robur L.)? Eur. J. For. Res. 2017, 136, 259–268. [CrossRef]
48. Ebermann, R.; Korori, S.A.A.; Lickl, E. Temperature Dependent Alterations of Peroxidase and AmylaseIsoenzymes in Quercus robur. Phyton 1991, 31, 121–128.
248

Forests 2019, 10, 50
49. Morin, X.; Améglio, T.; Ahas, R.; Kurz-Besson, C.; Lanta, V.; Lebourgeois, F.; Miglietta, F.; Chuine, I. Variationin cold hardiness and carbohydrate concentration from dormancy induction to bud burst among provenancesof three European oak species. Tree Physiol. 2007, 27, 817–825. [CrossRef] [PubMed]
50. Holland, V.; Koller, S.; Lukas, S.; Brüggemann, W. Drought- and frost-induced accumulation of solublecarbohydrates during accelerated senescence in Quercus pubescens. Trees 2016, 30, 215–226. [CrossRef]
51. Villar-Salvador, P.; Uscola, M.; Jacobs, D. The role of stored carbohydrates and nitrogen in the growth andstress tolerance of planted forest trees. New For. 2015, 46, 813–839. [CrossRef]
52. Michelot, A.; Simard, S.; Rathgeber, C.; Dufrêne, E.; Damesin, C. Comparing the intra-annual wood formationof three European species (Fagus sylvatica, Quercus petraea and Pinus sylvestris) as related to leaf phenologyand non-structural carbohydrate dynamics. Tree Physiol. 2012, 32, 1033–1045. [CrossRef] [PubMed]
© 2019 by the authors. Licensee MDPI, Basel, Switzerland. This article is an open accessarticle distributed under the terms and conditions of the Creative Commons Attribution(CC BY) license (http://creativecommons.org/licenses/by/4.0/).
249


Article
Differentiation and Non-Linear Responses inTemporal Phenotypic Plasticity of SeasonalPhenophases in a Common Garden ofCrataegus monogyna Jacq.
Kristine Vander Mijnsbrugge 1,* and Astrid Janssens 2
1 Department of Forest Ecology and Management, Research Institute for Nature and Forest, Gaverstraat 4,B-9500 Geraardsbergen, Belgium
2 Department of Bioengineering Technology TC, University of Leuven, Kleinhoefstraat 4, B-2440 Geel,Belgium; [email protected]
* Correspondence: [email protected]; Tel.: +32-478-282-137
Received: 16 February 2019; Accepted: 19 March 2019; Published: 27 March 2019
Abstract: Phenology in perennial plants implies the temporal occurrence of biological eventsthroughout the year. Heritable phenotypic plasticity in the timing of the phenophases can be ofimportance in the adaptation of woody species to a quickly changing environment. We observedthe timing of bud burst, flower opening, leaf senescence and leaf fall in two successive years in acommon garden of Crataegus monogyna Jacq. in Belgium, consisting of six local and five non-localprovenances. Data were processed with cumulative logistic mixed models. Strong auto-correlationwas present among the spring phenophases as well as among the autumnal phenophases, with springphenophases being negatively correlated with fall phenophases. The strongest between-provenancedifferentiation was found for the timing of bud burst in spring, followed by flower opening and finallyby leaf senescence and leaf fall. Warmer spring temperatures in March 2017 advanced the timing ofbud burst, and to a lesser extent of flower opening, in all provenances compared to 2016. However,the advancement was non-linear among the provenances, with the lower latitude provenances beingrelatively less early and the higher elevation provenances being more late than the local provenancesin this year. It can be hypothesized that non-local provenances display larger temporal phenotypicplastic responses in the timing of their spring phenophases compared to local provenances whentemperatures in the common garden deviate more from their home-sites.
Keywords: phenology; leafing out; flowering; senescence; cumulative logistic regression; hawthorn;provenance trial; non-local populations; variance analysis
1. Introduction
Woody plants are sessile and perennial organisms that are characterized by long generation timesand slow migration rates [1]. Therefore, it is expected that woody species can adapt relatively quicklyto changing local environmental conditions [2]. The capacity for evolutionary change depends onthe standing genetic variation in tree populations [3] and climate is a major driver of evolutionarychange over longer time scales [4]. Understanding the genetic basis of complex polygenic traits inwoody plants that are clearly influenced by climate is therefore a current challenge in forest geneticresearch. Because all individuals in a common garden share the same environment, any averagedifference in a trait between provenances of the same species has a genetic origin. The genetic variationin fitness-related traits is typically estimated in open pollinated progeny tests in common gardenexperiments, including the estimation of differentiation between provenances [5,6], and the study ofthis variation has its place in the field of quantitative genetics [7].
Forests 2019, 10, 293; doi:10.3390/f10040293 www.mdpi.com/journal/forests251

Forests 2019, 10, 293
The seasonal cycle in deciduous woody plant species of temperate regions is characterized bythe timing of bud burst and flowering in spring and by the timing of bud formation, leaf senescenceand leaf shedding in autumn. These phenophases can deviate between genetically differentiatedpopulations and are believed to be adaptive, responding to selection induced by environmentalchange [5,8,9]. The timing of the phenophases marking the beginning and the end of the yearlygrowing season maximizes the annual growth while minimizing the risk of frost damage in spring andautumn. Frost can damage woody plants at high fitness costs [10]. Late frosts in spring can damage thesoft tissues of young leaves, whereas early frosts in autumn may cause early leaf abscission, hinderingthe resorption of nutrients. In addition, early frosts are also known to damage the cambial zone intrees [11].
The timing of bud burst and leaf unfolding vary considerably among tree species, responding todivergent climatic conditions [3,5]. Bud burst can be the main trait that is affected by climate mediatedselection [3]. Selection on timing of bud burst can be sufficiently strong to counteract the homogenizingeffect of gene flow [12,13]. Rising spring temperatures advance the onset of the growing season inmany woody species of the temperate zone, prolonging the growing season and thus affecting plantproductivity and the global carbon balance [14–16]. On the other hand, late frosts in spring mayhamper early flushing species in a global warming scenario [17]. Because of its adaptive nature andthe easy assessment from an early age onward, spring flushing is frequently evaluated in commongardens [5,18]. Within the same woody species, population differentiation for bud burst, as observedin common garden experiments, typically follows clines along gradients of elevation and/or latitudeof the home-sites of the populations [5,19,20] possibly due to different temperature requirementsthat are genetically determined [21]. The genetic variation in timing of bud burst, together withdivergent selection, is believed to have allowed tree species in temperate regions to occupy largedistribution ranges [22]. Within populations, individual trees display variable timing of bud burst,which is suggested to have a genetic cause [23]. Individual trees in a population can therefore becategorized as early, intermediate and late phenological forms [24]. Neutral genetic marker analysisshowed that late bud burst forms of Fagus sylvatica L. in natural populations in Poland displayedhigher within-population genetic variation in comparison to the early forms, suggesting that latespring frosts shape the neutral genetic structure of the populations [24]. Finally, no relationship wasfound between the timing of cambial activity and the timing of bud burst in Quercus robur L. [23].
Flowering and the subsequent fruit formation are part of the sexual reproductive cycle in plants.Reproductive phenology is sensitive to environmental cues such as temperature, moisture andherbivory [25]. Divergent timing of flowering can stimulate assortative mating in populations ofwoody plants, reducing gene flow and promoting population differentiation [25]. The timing offlowering varies strongly among woody angiosperm species and can occur before, during or afterbud burst. For instance, pollen emission concurs with leaf unfolding in oaks. Assortative matingthrough long-distance pollen flow is therefore suggested to interact with local adaptation of budburst [3,26]. In general, timing of bud burst and flowering are most likely auto-correlated in temperatetree species [26,27].
The emergence and growth of new spring foliage in temperate deciduous trees relies stronglyon the nutrients that were resorbed during the preceding leaf senescence [28]. The timing of leafsenescence is affected by both photoperiod and temperature [29–32] while the timing of bud burstis primarily influenced by temperature [33,34]. It shows less year-to-year variability in comparisonwith timing of bud burst and is concomitant with less favorable conditions for photosynthesis [29].In 59 tree species, the timing of autumnal leaf senescence displayed a pattern according to the climaticclines of the home-sites of the studied populations, which was clearer than the pattern observed inbud burst timing [5]. But, in a common garden experiment of Quercus petraea (Matt.) Liebl. composedof populations derived from the same geographic region but from deviating elevations, the populationdifferentiation for autumnal leaf senescence did not correlate with the elevation of the origin [3]. Thereis no consensus concerning the factors controlling the leaf senescence process [29,35]. Leaves that
252

Forests 2019, 10, 293
emerged after a late spring frost in beech and oak displayed higher photosynthesis rates and a delayedleaf senescence in autumn, compensating for spring frost damage and demonstrating that long-livedtrees can adapt their autumnal phenology depending on preceding productivity [36]. The springphenophases of bud burst and flowering, and the timing of leaf senescence and leaf abscission aremost probably strongly auto-correlated. Therefore, it is suggested that leaf fall can be used as a proxyfor leaf senescence, assuming a certain time delay [30].
The range of phenotypes that a plant can express as a function of the environment is calledphenotypic plasticity. Genetically controlled, heritable phenotypic plasticity has the potential toinfluence plant evolution [37]. Species that are able to adjust their phenological responses to warmingspring temperatures by earlier bud burst or earlier flowering show better performance when comparedwith less responsive species [38]. Because of their longevity, phenotypic plasticity may play animportant role in the adaptation of woody perennials to the predicted climate change [39]. Studyingresponses of provenances of woody species in a common garden not only allows assessment ofthe differentiation among the provenances that is shaped by divergent selection, e.g. [40]. Also,repeated observations in successive years allow the estimation of phenotypic plastic reactions tovariable meteorological conditions in the garden over time. We planted a common garden in Belgiumconsisting of Crataegus monogyna Jacq., a common shrub species in western Europe, including localand non-local provenances, and studied the seasonal phenophases that mark the growth cycle ofwoody plants. Using neutral (non-adaptive) molecular markers, high levels of genetic diversitywithin populations, but low levels of population differentiation, were found in this species [41]. Wehypothesized that: (i) the timing of bud burst, flower opening, leaf senescence and leaf fall differbetween local and non-local provenances; (ii) the timing of the four phenophases display varyingdegrees of within-provenance and between-provenance variation; (iii) spring phenophases are stronglyauto-correlated, as well as autumnal phenophases; and (iv) the non-local provenances respond in anon-linear way, in comparison with the local provenances, to the variable meteorological conditionsin the common garden environment in two successive years (variable temporal phenotypic plasticityamong the provenances) which can be related to the home-site conditions of the non-local provenances.
2. Materials and Methods
2.1. Common Garden
A description of the provenances, the seed collection, the growth of the plants and the planting ofthe common garden have already been reported in [42]. In short, the common garden consisted of sixlocal Flemish provenances (northern part of Belgium), two Walloon provenances (southern part ofBelgium), one provenance from the UK, one from Italy and one from Hungary (Table 1). The Belgian(Flemish and Walloon) provenances were collected by the authors and grown in the nursery of theresearch institute in Geraardsbergen, Belgium, whereas the UK, Italian and Hungarian provenanceswere grown in adjacent nursery beds in a Flemish forest nursery, under a sales contract. For thecollection of the seeds in the Belgian populations, care was taken to collect from C. monogyna, excludingCrataegus laevigata (Poir.) DC. individuals and individuals with a putative hybridogenic background,by visually assessing the morphology of the leaves and the berries. Seeds were collected from atleast 30 individuals from each population. Information on the seed collection in the commercialprovenances was not available as it concerned commercial plant material without a certificate ofprovenance. Certificates of provenance are not compulsory for C. monogyna according to the CouncilDirective 1999/105/EC [43]. Therefore, the exact location of these commercial seed sources was alsonot available. In the beginning of 2008, planting stock of the 11 provenances were planted in a commongarden in Londerzeel, Flanders, Belgium. The provenances were randomly mixed in a single tree plotdesign and planted with a spacing of 1.5 × 1.5 m. Mean monthly temperatures for 2016 and 2017 wereacquired from the weather station in Groenendaal which is located at a distance of 30 km from thecommon garden site (Figure 1).
253

Forests 2019, 10, 293
Table 1. Descriptive data of the provenances of C. monogyna in the common garden. No precise data onseed-stock populations were available for the commercial provenances. -: no data available.
Region Village Provenance abb. Latitude Longitude Altitude (m) n
Flanders Landegem FL1 51.0546 3.5888 10 53Flanders Riemst FL2 50.8116 5.5978 112 52Flanders Hansbeke FL3 51.0747 3.5345 10 31Flanders Zomergem FL4 51.1195 3.5642 7.5 46Flanders Melle FL5 51.0030 3.7988 10 55Flanders Muizen FL6 51.0109 4.5143 12.5 52Wallonia Smuid WA1 50.0188 5.2662 370 53Wallonia Viroin WA2 50.0727 4.6072 305 49Hungary - HU - - - 46
Italy - IT - - - 52United
Kingdom - UK - - - 48
Figure 1. Mean monthly temperatures in 2016 and 2017 in Groenendaal, Belgium.
2.2. Scoring of the Four Phenophases
Observations of the phenophases were performed on the shrubs in the common garden in 2016and 2017. Bud burst, flower opening, leaf senescence and leaf fall were scored following two 6-leveland two 5-level protocols, respectively (Table 2). For all phenophases, the whole shrub was evaluatedvisually and a mean score level was given. Bud burst was scored in 2016 on 8, 23, 31 March and 16April, and in 2017 on 12, 21, 26 March and 2 April. Flower opening was scored in 2016 on 28 April,4 and 11 May, and in 2017 on 26 April, 1 and 11 May. Leaf senescence and leaf fall were scored in 2016on 21 October and 4 November, and in 2017 on 8 and 29 October.
Table 2. Description of the different score levels of the four observed phenophases.
Phenophase Score Level Description
bud burst 1 winter buds2 buds swelling3 buds opening and first green tips of the leaves visible4 leaves emerging from the bud but not yet unfolding5 leaves emerged and unfolding6 leaves fully unfolded and expanding
flower opening 1 flower buds closed and green2 flower buds closed and white3 less than half of the flowers in an inflorescence opened4 half to more than half of the flowers in an inflorescence opened5 most but not all flowers in an inflorescence opened6 all flowers opened
254

Forests 2019, 10, 293
Table 2. Cont.
Phenophase Score Level Description
leaf senescence 1 (mainly) green leaves2 mainly light green to yellow leaves3 mainly yellow leaves4 yellow and brown leaves5 (mainly) brown leaves
leaf fall 1 (nearly) no leaves fallen2 About 1/4of the leaves are fallen3 About 1/2 of the leaves are fallen4 About 3/4 of the leaves are fallen5 (nearly) all leaves fallen
2.3. Statistical Analysis of Phenological Data
All statistical analyses were performed in the open source software R 3.5.1. [44]. Models werefitted to examine the timing of the four phenophases in the two successive years. Each phenologicaltrait (Tph) was a response variable and was modeled using cumulative logistic regression in the“ordinal” package [45], as the recorded observations were in an ordinal scale. The command “clmm”in the “ordinal” package models the probability (p) of having reached maximally a given level of theordinal response variable. The score levels for leaf senescence and fall were defined in increasingorder, and the probability was modeled for having reached maximally a given score level; e.g., havingreached maximally a leaf senescence score of 3 was to be interpreted as the probability of havingreached scores of 1, 2 or 3. The score levels of bud burst and flower opening were defined in decreasingorder, so that the probability of having reached maximally a bud burst score of 3, for example, includedthe probability of having reached scores of 6, 5, 4or 3. In this way, this could be interpreted as havingreached a score of at least 3. Mixed models were fitted as the phenological data concerned repeatedobservations on the same plants. The year of observation (Y, categorical variable) and the provenance(P, categorical variable) were present in the fixed part of each model, including an interaction termbetween these two variables. In the four phenological models, the local Flemish provenance FL1(Table 1) was taken as the standard provenance to which the timing of the other provenances in thecommon garden was compared. Day (D, numerical variable) was added in the fixed part to accountfor the different observation days. The random part (random intercept) consisted of a unique shrubidentity code (ID). The latter accounted for the repeated observations on the same plants.
log (pTph/(1 − pTph)) = αi − βY.Y (fixed) − βP.P (fixed) − βYP.Y.P (fixed) − βD.D (fixed) − rID (random)
where αi was an intercept value indicating the passing from one level of the ordinal phenologicalresponse variable to the next. βY, βP and βD were the estimated coefficients for the fixed covariates Y,P and D, and rID was the random effect coefficient for all levels of the variable ID.
To be able to compare the timing of the four phenophases for all provenances, the days werecalculated for which the different provenances in each phenophase had reached the same stage ofphenological development. The DOY (day of the year) was calculated for which the probability forhaving reached a bud burst or flower opening score of at least 4 and having reached a maximal leafsenescence and leaf fall score of 3, attained 50% (D50%PY) in the observation years 2016 and 2017 andfor every provenance. A D50%PY for a given provenance and a given year therefore indicated the daythat half of the plants of this provenance had reached minimally (bud burst and flower opening) ormaximally (leaf senescence and fall) a given score level of the respective phenophase in the respectiveyear. This calculation was based on log(pTph/(1 − pTph)) being 0 for p = 50%. With 2016 as the standardlevel for the variable Y, to which 2017 is compared, the following formulas were used:
D50%P2016 = (αi − βP)/(βD)
255

Forests 2019, 10, 293
D50%P2017 = (αi − β2017 − βP − β2017P)/(βD)
When the timing of a given phenophase for a given provenance differed significantly from thestandard provenance FL1, the time lag was calculated between this provenance and the standardprovenance. For 2016, this was inferred from the model with 2016 as the standard level of the categoricalvariable Y, whereas for 2017 this was inferred from the model with 2017 as the standard level for thevariable Y. The time span between a provenance and the standard provenance from which it differedsignificantly, was calculated by subtracting the calculated D50%FL1Y from D50%PY. Pearson correlationcoefficients were calculated between the timing of the phenophases in the two observation years usingthe D50%P2016 and D50%P2017 values.
A significant interaction term between provenance P and year Y in the model statistics indicatedthat the time span between the timing of a phenophase for a given provenance and the standardprovenance in 2016 differed significantly from the respective time span between these two provenancesin 2017. The significant interaction terms were visualized in reaction norm figures, in which thetiming of a phenophase for a provenance was compared between 2016 and 2017. The slope of the lineconnecting the timing of a phenophase between 2016 and 2017 for a provenance with a significantinteraction term in the model statistics, differed significantly from the slope connecting the timings forthe standard provenance FL1.
To examine the relative variance in the timing of bud burst, flower opening, leaf senescence andleaf fall among the different provenances in the common garden, in comparison with the relativevariance among the shrubs within a provenance, the four phenological models were adapted bymoving the provenance variable (P) from the fixed to the random part.
log(pTph/(1 − pTph)) = αi − βY.Y − βD.D (fixed) − rP (random) − rID (random)
The relative variance between the provenances (σ2P) and the relative variance between the shrubs
within a provenance (σ2ID) were obtained from these models.
3. Results
3.1. Timing of Bud Burst
All provenances in the common garden burst buds earlier in 2017 compared with 2016 (thecovariate year was significant in the model statistics, Table 3, Figure S1). Significant differences in thetiming of bud burst were observed between several provenances and the standard Flemish provenanceFL1 in 2016 (Table 3) and in 2017 (Table S1). The time spans between the timing of these provenancesand FL1 were calculated for both observation years (Table 4). The Italian and Hungarian provenancesflushed earlier in comparison to the Flemish provenances, whereas the Walloon provenances with ahigher elevation in the home-sites, flushed later (Figure 2a, Table 3).
Table 3. Model statistics for the timing of bud burst and flower opening. The provenance FL1 and theyear 2016 are the standard levels for the categorical variables provenance and year, to which the otheryear, 2017, and the other provenances are compared. DOY: day of the year. Provenance abbreviationsare given in Table 1.
Variable Bud Burst Flower Opening
Estimate Std. Error z-Value p-Value Estimate Std. Error z-Value p-Value
DOY −0.64 0.01 −44.79 <0.001 *** −0.46 0.01 −38.90 <0.001 ***2017 −8.29 0.30 −27.26 <0.001 *** −2.84 0.24 −12.07 <0.001 ***FL2 −0.28 0.48 −0.59 0.558 −0.28 0.31 −0.90 0.367FL3 −0.08 0.55 −0.15 0.878 −0.47 0.35 −1.32 0.188FL4 1.30 0.49 2.63 0.009 ** 0.42 0.32 1.32 0.188FL5 0.31 0.47 0.66 0.513 −0.04 0.30 −0.12 0.905
256

Forests 2019, 10, 293
Table 3. Cont.
Variable Bud Burst Flower Opening
Estimate Std. Error z-Value p-Value Estimate Std. Error z-Value p-Value
FL6 0.50 0.48 1.06 0.290 −0.10 0.31 −0.31 0.753HO −6.19 0.51 −12.06 <0.001 *** −3.02 0.35 −8.65 <0.001 ***IT −7.14 0.51 −14.14 <0.001 *** −3.19 0.32 −10.04 <0.001 ***
WA1 3.01 0.48 6.26 <0.001 *** 1.46 0.32 4.55 <0.001 ***WA2 3.62 0.49 7.33 <0.001 *** 0.69 0.34 2.04 0.041*UK 0.43 0.49 0.89 0.375 −0.65 0.36 −1.82 0.069
2017:FL2 0.56 0.34 1.64 0.101 0.39 0.33 1.19 0.2332017:FL3 1.14 0.39 2.94 0.003 ** 0.77 0.39 1.97 0.049 *2017:FL4 −0.07 0.35 −0.21 0.837 0.44 0.34 1.32 0.1882017:FL5 0.10 0.34 0.31 0.760 0.50 0.32 1.56 0.1192017:FL6 0.51 0.34 1.51 0.130 0.40 0.33 1.19 0.2362017:HO 2.44 0.37 6.54 <0.001 *** 1.91 0.36 5.30 <0.001 ***2017:IT 3.15 0.36 8.73 <0.001 *** 0.99 0.33 3.05 0.002 **
2017:WA1 1.01 0.35 2.91 0.004 ** 0.90 0.38 2.40 0.016 *2017:WA2 0.62 0.36 1.75 0.080 1.59 0.39 4.04 <0.001 ***2017:UK 0.94 0.35 2.73 0.006 ** 1.21 0.39 3.11 0.002 *
Significant results: *** p < 0.001; ** p < 0.01; * p < 0.05.
Table 4. Differences in timing between the standard local provenance FL1 and the other provenancesin the common garden in 2016 and 2017 for the four phenophases. Time spans are shown only forthe provenances that differed significantly from the standard provenance FL1 in the models (Table 3,Table S1). Negative values indicate earlier timing of the phenophase, positive values indicate latertiming. Provenance abbreviations are given in Table 1.
Phenophase Provenance Difference in Timing with FL1 (days)
2016 2017
bud burst FL3 1.7FL4 2 1.9FL6 1.6HO −9.7 −5.9IT −11.2 −6.3
WA1 4.7 6.3WA2 5.7 6.7UK 2.2
flower opening FL4 1.9HO −6.6 −2.4IT −7 −4.8
WA1 3.2 5.2WA2 1.5 5UK 1.2
leaf senescence HO 15.7 11.9IT 9 12.3
UK −7.5leaf fall FL5 4.4
HO 6.8 8IT 8.7 6.3
257

Forests 2019, 10, 293
(a) (b)
Figure 2. Modeled timing of bud burst for the different provenances in 2016 and 2017: (a) Modeledprobability of having reached at least bud burst score 4; (b) D50%PY values for the provenances (P) witha significant interaction term in the model statistics, for the years (Y) 2016 and 2017. D50%PY valuesindicate the modeled day of the year (DOY) when half of the plants of a provenance attain a bud burstscore of at least four.
A significant interaction term between provenance and year in the model indicated a significantrelative change in time span (between the timing of bud burst for the respective provenance and thetiming for the standard provenance FL1) between the two observation years (Table 3). A significantinteraction term for a provenance was visualized as the slope of a line connecting the timings (expressedas D50%PY values) for this provenance in the two observation years differing from the slope of thestandard provenance FL1 (Figure 2b). In 2016, the southern European provenances burst their budsabout 10 days earlier than the Flemish provenance FL1, whereas this time lag between the southernEuropean provenances and FL1 was reduced to about 6 days difference in 2017, resulting in less steepslopes for the provenances HO and IT compared to FL1 in Figure 2b (provenance abbreviations inTable 1). Whereas in 2017 the difference between the timing of bud burst in the southern Europeanprovenances and FL1 was reduced in comparison with 2016, the time lag between the Walloonprovenance WA1 and FL1 increased in 2017 in comparison with 2016, resulting in a less steep slope forWA1 compared with FL1 in Figure 2b (provenance abbreviations in Table 1). The UK provenance andthe Flemish provenance FL3 also displayed significant interaction terms (Tables 1 and 3, Figure 2b).
3.2. Timing of Flower Opening
In general, all provenances in the common garden opened their flowers earlier in 2017 comparedwith 2016 (the covariate year was significant in the model statistics, Table 3, Figure S2). The southernEuropean provenances and the Walloon provenances differed significantly in the timing of thisphenophase when compared with the standard local provenance FL1 in 2016 and in 2017 (Table 3,Table S1 and Figure 3a). In addition, the Flemish FL4 and the UK provenance differed significantlyfrom FL1 in 2017 (provenance abbreviations in Table 1). The time spans between these provenancesand FL1 were calculated for both observation years (Table 4). Similar to bud burst, the Italian andHungarian provenances opened their flowers earlier in comparison with the Flemish provenances,whereas the Walloon provenances tended to flower later (Figure 3a, Table 3). All time spans for floweropening between FL1 and the provenances that differed significantly from FL1, were smaller than forbud burst in both observation years.
258

Forests 2019, 10, 293
(a) (b)
Figure 3. Modeled timing of flower opening for the different provenances in 2016 and 2017: (a)Modeled probability of having reached at least a flower opening score of four; (b) D50%PY values forthe provenances (P) with a significant interaction term in the model statistics, for the years (Y) 2016and 2017. D50%PY values indicate the modeled DOY when half of the plants of a provenance attain aflower opening score of at least four.
Significant interaction terms between provenance and year in the model (Table 3) are visualizedin Figure 3b. The pattern was comparable to bud burst. In 2016 the southern European provenancesopened their flowers about 6 to 7 days earlier than the Flemish provenance FL1. In 2017, this timelag between the southern European provenances and FL1 was reduced to about 2 to 5 days, resultingin less steep slopes than FL1 in Figure 3b. Similar to bud burst, the time lag between the Walloonprovenances and FL1 increased in 2017 compared with 2016 (from 2 to 3 days in 2016 to about 5 daysin 2017), also resulting in less steep slopes than FL1 in Figure 3b. One extra local provenance, FL4,and the UK provenance differed significantly in timing of flower opening from FL1 in 2017 (Table S1).The UK provenance displayed a significant interaction term (Table 3, Figure 3b), whereas among theFlemish provenances only FL3 had a significant interaction term, visualized as a less steep slope thanFL1 in Figure 3b.
3.3. Timing of Leaf Senescence and Leaf Fall
For the timing of leaf senescence and leaf fall, fewer provenances differed significantly from thestandard provenance FL1 in comparison with the timing of bud burst and flower opening (Table 5,Table S2, Figure 4, Figure 5a, Figure S3 and Figure S4). For the southern European provenances, leafsenescence in 2016 occurred 9 to 16 days later than the local provenance FL1, and around 12 days laterin 2017 (Table 4). Timing of leaf fall was modeled for these provenances 6 to 9 days later than the localprovenance FL1 in both years (Table 4). In 2017, the timing of leaf senescence in the UK provenancewas 7.5 days earlier than FL1, whereas in 2016, the timing of leaf fall in the Flemish provenance FL5was 4 days later (Table 4).
Table 5. Model statistics for the timing of leaf senescence and leaf fall. The provenance FL1 and theyear 2016 are the standard levels for the categorical variables provenance and year, to which the otheryear, 2017, and the other provenances are compared. Provenance abbreviations are given in Table 1.
Variable Leaf Senescence Leaf Fall
Estimate Std. Error z-Value p-Value Estimate Std. Error z-Value p-Value
DOY 0.10 0.01 14.97 <0.001 *** 0.27 0.01 31.11 <0.001 ***2017 −1.32 0.33 −4.06 <0.001 *** 1.89 0.29 6.45 <0.001 ***FL2 −0.07 0.35 −0.19 0.851 −0.13 0.46 −0.28 0.782FL3 0.13 0.41 0.32 0.747 0.49 0.54 0.91 0.366FL4 −0.10 0.35 −0.29 0.771 −0.81 0.48 −1.70 0.090
259

Forests 2019, 10, 293
Table 5. Cont.
Variable Leaf Senescence Leaf Fall
Estimate Std. Error z-Value p-Value Estimate Std. Error z-Value p-Value
FL5 −0.16 0.34 −0.48 0.635 −1.17 0.46 −2.56 0.010*FL6 −0.06 0.35 −0.16 0.874 0.17 0.47 0.36 0.721HO −1.60 0.35 −4.61 <0.001 *** −1.82 0.47 −3.83 <0.001 ***IT −0.92 0.33 −2.76 0.006 ** −2.34 0.47 −5.03 <0.001 ***
WA1 0.00 0.34 −0.01 0.996 −0.84 0.46 −1.83 0.068WA2 0.10 0.35 0.29 0.768 −0.23 0.47 −0.49 0.624UK −0.05 0.35 −0.15 0.884 −0.47 0.47 −1.00 0.317
2017:FL2 0.73 0.45 1.62 0.106 0.79 0.41 1.94 0.0522017:FL3 0.16 0.53 0.31 0.757 0.01 0.47 0.02 0.9842017:FL4 0.20 0.45 0.44 0.658 0.43 0.41 1.04 0.2992017:FL5 0.09 0.44 0.21 0.834 0.40 0.39 1.02 0.3082017:FL6 −0.06 0.46 −0.13 0.898 0.22 0.41 0.53 0.5982017:HO 0.39 0.46 0.86 0.391 −0.34 0.41 −0.84 0.4022017:IT −0.33 0.44 −0.76 0.450 0.66 0.40 1.65 0.100
2017:WA1 0.47 0.45 1.05 0.294 0.72 0.40 1.80 0.0722017:WA2 0.19 0.46 0.41 0.683 0.99 0.41 2.42 0.016 *2017:UK 0.82 0.45 1.81 0.070 1.13 0.41 2.76 0.006 **
Significant results: *** p < 0.001; ** p < 0.01; * p < 0.05.
Figure 4. Modeled timing of leaf senescence for the different provenances in 2016 and 2017. Modeledprobability of having reached a maximal leaf senescence score of three.
(a) (b)
Figure 5. Modeled timing of leaf fall for the different provenances in 2016 and 2017: (a) Modeledprobability of having reached a maximal leaf fall score of three; (b) D50%PY values for the provenances(P) with a significant interaction term in de model statistics, for the years (Y) 2016 and 2017. D50%PY
values indicate the modelled DOY when half of the plants of a provenance attain a maximal leaf fallscore of three.
260

Forests 2019, 10, 293
3.4. Correlation and Variance Analysis
Pearson correlation coefficients between the timing of the different phenophases in the twoobservation years revealed, in general, high and significant correlations. The spring phenophases budburst and flower opening displayed the highest correlation coefficients (0.98 *** and 0.97 *** in 2016and 2017, respectively, Table 6). In comparison, the autumnal phenophases, leaf senescence and leaffall, displayed lower correlation coefficients (0.79 ** in 2016 and 0.9 *** in 2017, Table 6). Both springphenophases were correlated with leaf senescence (−0.87 *** and −0.86 *** for bud burst and floweropening in 2016, and −0.82 ** and −0.75 ** in 2017, respectively, Table 6), with later spring flushingand flowering occurring with earlier leaf senescence. In comparison, the spring phenophases were lesscorrelated with leaf fall (−0.7 * and −0.65 * for bud burst and flower opening in 2016, and −0.78 **and −0.65 * in 2017, respectively, Table 6). Intra-phenophase correlation coefficients, between 2016and 2017, were obviously high, with bud burst displaying the highest correlation coefficient (0.97 ***),followed by flower opening (0.92 ***), leaf fall (0.89 ***) and finally leaf senescence (0.86 ***).
Table 6. Correlations between the timing of the four phenophases bud burst (Bb), flower opening(Fo), leaf senescence (Se) and leaf fall (Fa) in 2016 and 2017. Pearson correlation coefficients andcorresponding p-values are indicated above and below the diagonal respectively. A correlationcoefficient with a corresponding p-value below 0.001 is indicated in bold and is underlined, between0.001 and 0.01 is in bold and between 0.01 and 0.05 is underlined.
Bb2016 Fo2016 Se2016 Fa216 Bb2017 Fo2017 Se2017 Fa2017
Bb2016 0.98 −0.87 −0.7 0.97 0.95 −0.85 −0.8Fo2016 < 0.001 −0.86 −0.65 0.94 0.92 −0.81 −0.73Se2016 < 0.001 < 0.001 0.79 −0.83 −0.7 0.86 0.9Fa2016 0.017 0.030 0.003 −0.64 −0.53 0.75 0.89Bb2017 < 0.001 < 0.001 0.002 0.036 0.97 −0.82 −0.78Fo2017 < 0.001 < 0.001 0.019 0.097 < 0.001 −0.75 −0.65Se2017 < 0.001 0.002 < 0.001 0.008 0.002 0.008 0.9Fa2017 0.003 0.010 < 0.001 < 0.001 0.004 0.030 < 0.001
The relative variability in timing of the phenophases between the provenances was comparedwith the relative variability between the different shrubs within a provenance (Figure 6). In 2016,the between-provenance variance was relatively highest in the phenophase bud burst, and lower indecreasing order in flower opening, leaf senescence and leaf fall. The relative within-provenancevariance increased accordingly. In 2017, the between-provenance variance for bud burst was lowercompared with 2016 but was still higher than the relative within-provenance variance in this year.For flower opening, the between-provenance variance in 2017 was lower compared with 2016 and wasas high as the relative within-provenance variance in this year. For leaf senescence and leaf fall in 2017,the relative variances attributable to the differentiation between the provenances were lower than in2016, and thus displayed correspondingly higher relative within-provenance variances. In general, thespring phenophases displayed the largest relative between-provenance variances, in comparison withthe autumnal phenophases.
261

Forests 2019, 10, 293
Figure 6. Relative between-provenance (between prov) and within-provenance (between geno)variance for the timing of bud burst, flower opening, leaf senescence and leaf fall in 2016 and 2017.
4. Discussion
4.1. Timing of the Phenophases
Our results showed that differentiation between local and non-local provenances of C. monogynais present in the phenological traits marking the seasonality in woody plants, as observed in a commongarden. Differentiation in phenological traits in common gardens has been found in many treespecies [46,47]. As shown before [42], the southern European provenances burst their buds earlier(lower latitude), the Walloon provenances are later (higher elevation), and the UK provenance is similarto the local Flemish provenances (lower longitude). We also detected, although in a lower order ofmagnitude, differentiation for bud burst between certain local provenances in both observation years.This finding may be related to results from Danish common gardens consisting of local populations ofinsect-pollinated shrub species (Cornus sanguinea L. Malus sylvestris (L.) Mill. and Rosa dumalis Bechst.),where differentiation in bud burst on a local scale, with very little spring temperature deviationbetween the home-sites of the populations, was suggested to be driven not only by natural selectionbut also by neutral processes [48]. Despite the fact that timing of bud burst and flower opening arestrongly correlated, the time spans between the timing of bud burst from, on the one hand the standardlocal Flemish provenance and on the other hand the non-local provenances from the Walloon region(higher elevation), southern Europe (lower latitude) and the UK (lower longitude), were larger incomparison to the respective time spans between the timing of flower opening. This phenomenonhas already been detected in the studied common garden [42] and proved to be consistent for twoadditional observation years. As hypothesized before [42], the timing of flower opening may be lesssensitive to natural selection and local adaptation due to two reasons. Shrubs start flowering only afterseveral crucial years of establishment and seedling development, and a year of reduced reproductiondue to an improper timing of flowering may be less detrimental to a woody plant than reduced growth(accompanied by unfavorable competition with neighboring plants) because of an improper timing ofbud burst. Therefore, the timing of flowering may be more responsive to the local micro-climate.
Leaf senescence and leaf fall in the southern European provenances were delayed compared withthe local provenances. Together with an earlier bud burst, this implies a longer growing season forthese provenances (spring phenophases were negatively correlated with autumnal phenophases). It isquestionable whether the longer growing season is advantageous or disadvantageous. In a reciprocalcommon garden experiment of Populus fremontii S. Watson, southern populations planted in colderclimates set buds relatively later in comparison with the same genotypes planted in a common garden attheir home-site [39]. This later bud set is described as an inability to avoid early autumnal frosts and is
262

Forests 2019, 10, 293
interpreted as non-adaptive phenotypic plasticity, possibly caused by a lesser sensitivity to photoperiodas a cue to initiate bud set in more southern populations [39]. Bud flush in the southern population wasfound to be later in the colder common garden compared to the home-site common garden (but stillearlier than the local populations from the cold environment) and was therefore interpreted as adaptiveplasticity [39]. In our experiment, the higher elevation provenances of the Walloon region displayed alater bud burst in comparison to the local provenances, but no earlier nor later leaf senescence andleaf fall. This finding is likely in line with [34] who found no correlation between temperatures of thesource sites along an altitudinal gradient and timing of leaf senescence in a common garden for Acerpseudoplatanus L. and Fraxinus excelsior L.. This may be due to a higher sensitivity of leaf senescenceto photoperiod, compared to that of bud burst [29,30]. Higher elevations in the Walloon part ofBelgium imply a generally colder climate compared to the local climate of the common garden site,but a negligible difference in photoperiod. When compared with the timing of bud burst and floweropening, a relatively smaller contribution of the between-provenance variation in the variance analysisindicates a weaker population differentiation for the autumnal phenophases. These results are in linewith findings of [39] and [40] who both found a stronger influence of genotypic effects for bud set inpoplar compared with bud burst, whereas bud burst showed stronger population-level effects relativeto bud set. Although occurring in the same vegetative organ of the plant, the correlation between thetiming of leaf senescence and leaf fall was smaller compared with the correlation between the timing ofbud burst and flower opening, the latter implying a correlation between a vegetative (leaf bud) and agenerative (flower) organ, which may suggest less tight genetic control for the autumnal phenophases.
4.2. Non-Linear Temporal Responses in Timing of the Phenophases
Inter-annual variation over long time periods in the timing of bud burst in temperate tree specieshas been widely modeled and discussed, e.g., [49]. Still, it remains difficult to accurately predictbud burst on smaller time scales. We studied the temporal phenotypic plasticity in the phenologicalresponses on a small time scale, i.e., the responses to local meteorological conditions in the commongarden, by observing the variability of the phenological responses on the same shrubs in two successiveyears. The non-linear inter-annual response of timing of bud burst was expressed in five significantinteraction terms between the variables provenance and year in the modeling analysis, including fournon-local provenances. For flower opening we found a comparable number of significant interactionterms (one extra Walloon provenance) with the same provenances involved as for bud burst, mostprobably giving expression to the auto-correlation of both phenophases. For leaf fall, only twoprovenances displayed significant interaction terms in the models, both being non-local, and forleaf senescence there were none. The lesser sensitivity of the autumnal phenophases to plasticitycompared with the spring phenophases can be due to a higher sensitivity to photoperiod as a stablecue to initiate these processes [40]. The relatively high presence of non-local provenances among thesignificant interaction terms in the phenological models may be indicative of their non-local origin.The non-linear temporal responses in non-local provenances can be interpreted as a reaction to theprevailing growth conditions that deviate from the home-site conditions that they are adapted to.Considering the timing of bud burst, the time span between the southern European provenancesand the local standard provenance in 2016 was larger than in 2017. For the Walloon provenances weobserved an opposite response. As temperature is a well-known determinant for the timing of budburst, the warmer temperatures in March 2017 have likely advanced the timing of bud burst in allprovenances compared to 2016. It is by now well-known that woody plants shift to earlier bud burstdates upon increased warming [50]. However, the advancement that we observed in the non-localprovenances was not linear in comparison with the local Flemish provenances, with the southernEuropean provenances being relatively less early and the Walloon provenances being relatively laterthan the local provenances in 2017. In transplant experiments of Populus fremontii, the magnitudeof phenotypic plasticity in bud flush and bud set was found to be correlated with the home-siteclimates [39]. Planting the southern European provenances of C. monogyna in the common garden
263

Forests 2019, 10, 293
in Belgium implied a transfer to a cooler environment, with the cooler spring of 2016 inducing alonger time span in the timing of bud burst with the local provenances than the warmer spring of 2017.The warmer spring in 2017 drove the higher elevation provenances to a longer time span in the timingof bud burst with the local provenances, compared with the cooler spring in 2016. Together, theseresults suggest a larger plastic reaction in the timing of bud burst in the common garden environmentmay imply that prevailing meteorological conditions deviate more from the home-site conditions.
5. Conclusions
In Europe, populations of woody species at the southern limits of their natural range havemaintained relatively large levels of genetic diversity and are therefore considered as appropriate genepools for assisted migration towards the north as a climate adaptation strategy [51]. On the other hand,results from Danish (high latitude in Europe) common garden trials with local populations for severalshrub species indicate substantial genetic variation and evolutionary potential, questioning the need forassisted migration specifically for widespread and generally occurring woody species [48]. In addition,C. monogyna, as a key component of old hedgerows, displayed large levels of genetic diversity innuclear and chloroplast markers in the UK (medium latitude in Europe) [41]. Although limited in time,our two-year study showed that all provenances of the common shrub species C. monogyna adjust theirphenological responses to the prevailing temperatures and that non-local provenances tend to reactnon-linearly relative to the local provenances, with larger temporal spring plasticity coinciding witha larger difference in climatic conditions between home-sites and the common garden environment.Our results can be interpreted as an extra argument in the debate over assisted migration, suggestingthat for widespread species planted stock of non-local origin may tend to “over-react” to variableenvironmental conditions at the site to which they are transplanted. This over-reaction in plasticresponse may be caused by the environmental conditions that deviate more from the optima theseprovenances are adapted to at their home sites. Our results therefore stress the importance of carefullyreflecting on assisted migration projects, and considering at least the addition of local planting stockwhen deciding to transport populations of trees and shrubs over longer distances in anticipation of thepredicted climate change.
Supplementary Materials: The following are available online at http://www.mdpi.com/1999-4907/10/4/293/s1,Figure S1: Scores of bud burst in the common garden on four observation days in the years 2016 (a) and 2017(b). Provenance abbreviations are in Table 1. Descriptions of score levels are in Table 2; Figure S2: Scores offlower opening in the common garden on three observation days in the years 2016 (a) and 2017 (b). Provenanceabbreviations are in Table 1. Descriptions of score levels are in Table 2; Figure S3: Scores of leaf senescence inthe common garden on two observation days in the years 2016 (a) and 2017 (b). Provenance abbreviations arein Table 1. Descriptions of score levels are in Table 2; Figure S4: Scores of leaf fall in the common garden ontwo observation days in the years 2016 (a) and 2017 (b). Provenance abbreviations are in Table 1. Descriptionsof score levels are in Table 2; Table S1: Model statistics for bud burst and flower opening. The provenance FL1and the year 2017 are the standard levels for the categorical variables provenance and year, to which the otheryear, 2016, and the other provenances are compared. Provenance abbreviations are in Table 1; Table S2: Modelstatistics for leaf senescence and leaf fall. The provenance FL1 and the year 2017 are the standard levels for thecategorical variables provenance and year, to which the other year, 2016, and the other provenances are compared.Provenance abbreviations are in Table 1.
Author Contributions: K.V.M. conceptualized the study; K.V.M. and A.J. performed the field work and thestatistical analysis and wrote the manuscript.
Funding: This research received no external funding.
Acknowledgments: We specifically express our gratitude to Stefaan Moreels for general technical assistancethroughout the whole project, Wim Stevens for maintenance of the common garden and Joris Vernaillen for helpwith the scoring.
Conflicts of Interest: The authors declare no conflict of interest.
264

Forests 2019, 10, 293
References
1. Aitken, S.N.; Yeaman, S.; Holliday, J.A.; Wang, T.L.; Curtis-McLane, S. Adaptation, migration or extirpation:Climate change outcomes for tree populations. Evol. Appl. 2008, 1, 95–111. [CrossRef]
2. Kremer, A.; Potts, B.M.; Delzon, S. Genetic divergence in forest trees: Understanding the consequences ofclimate change. Funct. Ecol. 2014, 28, 22–36. [CrossRef]
3. Firmat, C.; Delzon, S.; Louvet, J.M.; Parmentier, J.; Kremer, A. Evolutionary dynamics of the leaf phenologicalcycle in an oak metapopulation along an elevation gradient. J. Evol. Biol. 2017, 30, 2116–2131. [CrossRef]
4. Erwin, D.H. Climate as a driver of evolutionary change. Curr. Biol. 2009, 19, R575–R583. [CrossRef]5. Alberto, F.J.; Aitken, S.N.; Alia, R.; Gonzalez-Martinez, S.C.; Hanninen, H.; Kremer, A.; Lefevre, F.;
Lenormand, T.; Yeaman, S.; Whetten, R.; et al. Potential for evolutionary responses to climate changeevidence from tree populations. Glob. Chang. Biol. 2013, 19, 1645–1661. [CrossRef]
6. Klisz, M.; Ukalski, K.; Ukalska, J.; Jastrzebowski, S.; Puchalka, R.; Przybylski, P.; Mionskowski, M.; Matras, J.What can we learn from an early test on the adaptation of silver fir populations to marginal environments?Forests 2018, 9, 441. [CrossRef]
7. De Villemereuil, P.; Gaggiotti, O.E.; Mouterde, M.; Till-Bottraud, I. Common garden experiments in thegenomic era: New perspectives and opportunities. Heredity 2016, 116, 249–254. [CrossRef]
8. Gienapp, P.; Reed, T.E.; Visser, M.E. Why climate change will invariably alter selection pressures onphenology. Proc. R. Soc. B-Biol. Sci. 2014, 281, 20141611. [CrossRef]
9. De Kort, H.; Vandepitte, K.; Honnay, O. A meta-analysis of the effects of plant traits and geographical scaleon the magnitude of adaptive differentiation as measured by the difference between Qst and Fst. Evol. Ecol.2013, 27, 1081–1097. [CrossRef]
10. Vitasse, Y.; Lenz, A.; Korner, C. The interaction between freezing tolerance and phenology in temperatedeciduous trees. Front. Plant Sci. 2014, 5, 541. [CrossRef]
11. Begum, S.; Nakaba, S.; Yamagishi, Y.; Oribe, Y.; Funada, R. Regulation of cambial activity in relation toenvironmental conditions: Understanding the role of temperature in wood formation of trees. Physiol. Plant.2013, 147, 46–54. [CrossRef]
12. Savolainen, O.; Pyhäjärvi, T.; Knürr, T. Gene flow and local adaptation in trees. Annu. Rev. Ecol. Evol. Syst.2007, 38, 595–619. [CrossRef]
13. Whittet, R.; Cavers, S.; Cottrell, J.; Rosique-Esplugas, C.; Ennos, R. Substantial variation in the timingof pollen production reduces reproductive synchrony between distant populations of Pinus sylvestris L.In scotland. Ecol. Evol. 2017, 7, 5754–5765. [CrossRef]
14. Dragoni, D.; Schmid, H.P.; Wayson, C.A.; Potter, H.; Grimmond, C.S.B.; Randolph, J.C. Evidence of increasednet ecosystem productivity associated with a longer vegetated season in a deciduous forest in south-centralIndiana, USA. Glob. Chang. Biol. 2011, 17, 886–897. [CrossRef]
15. Menzel, A.; Sparks, T.H.; Estrella, N.; Koch, E.; Aasa, A.; Ahas, R.; Alm-Kubler, K.; Bissolli, P.; Braslavska, O.;Briede, A.; et al. European phenological response to climate change matches the warming pattern.Glob. Chang. Biol. 2006, 12, 1969–1976. [CrossRef]
16. Zohner, C.M.; Renner, S.S. Common garden comparison of the leaf-out phenology of woody species fromdifferent native climates, combined with herbarium records, forecasts long-term change. Ecol. Lett. 2014, 17,1016–1025. [CrossRef] [PubMed]
17. Duputie, A.; Rutschmann, A.; Ronce, O.; Chuine, I. Phenological plasticity will not help all species adapt toclimate change. Glob. Chang. Biol. 2015, 21, 3062–3073. [CrossRef] [PubMed]
18. Aitken, S.N.; Bemmels, J.B. Time to get moving: Assisted gene flow of forest trees. Evol. Appl. 2016, 9,271–290. [CrossRef]
19. Le Corre, V.; Kremer, A. The genetic differentiation at quantitative trait loci under local adaptation. Mol. Ecol.2012, 21, 1548–1566. [CrossRef] [PubMed]
20. Gomory, D.; Ditmarova, L.; Hrivnak, M.; Jamnicka, G.; Kmet’, J.; Krajmerova, D.; Kurjak, D. Differentiationin phenological and physiological traits in European beech (Fagus sylvatica L.). Eur. J. For. Res. 2015, 134,1075–1085. [CrossRef]
21. Vitasse, Y.; Bresson, C.C.; Kremer, A.; Michalet, R.; Delzon, S. Quantifying phenological plasticity totemperature in two temperate tree species. Funct. Ecol. 2010, 24, 1211–1218. [CrossRef]
265

Forests 2019, 10, 293
22. Pluess, A.R.; Frank, A.; Heiri, C.; Lalaguee, H.; Vendramin, G.G.; Oddou-Muratorio, S. Genome-environmentassociation study suggests local adaptation to climate at the regional scale in Fagus sylvatica. New Phytol.2016, 210, 589–601. [CrossRef]
23. Puchalka, R.; Koprowski, M.; Gricar, J.; Przybylak, R. Does tree-ring formation follow leaf phenology inpedunculate oak (Quercus robur L.)? Eur. J. For. Res. 2017, 136, 259–268. [CrossRef]
24. Kraj, W.; Sztorc, A. Genetic structure and variability of phenological forms in the european beech (Fagussylvatica L.). Ann. For. Sci. 2009, 66, 1–7. [CrossRef]
25. Jordan, C.Y.; Ally, D.; Hodgins, K.A. When can stress facilitate divergence by altering time to flowering?Ecol. Evol. 2015, 5, S962–S973. [CrossRef]
26. Soularue, J.P.; Kremer, A. Assortative mating and gene flow generate clinal phenological variation in trees.BMC Evol. Biol. 2012, 12, 79. [CrossRef] [PubMed]
27. Soularue, J.P.; Kremer, A. Evolutionary responses of tree phenology to the combined effects of assortativemating, gene flow and divergent selection. Heredity 2014, 113, 485–494. [CrossRef] [PubMed]
28. Fu, Y.S.; Campioli, M.; Vitasse, Y.; De Boeck, H.J.; Van den Berge, J.; AbdElgawad, H.; Asard, H.; Piao, S.;Deckmyn, G.; Janssens, I.A. Variation in leaf flushing date influences autumnal senescence and next year’sflushing date in two temperate tree species. Proc. Natl. Acad. Sci. USA 2014, 111, 7355–7360. [CrossRef][PubMed]
29. Delpierre, N.; Dufrene, E.; Soudani, K.; Ulrich, E.; Cecchini, S.; Boe, J.; Francois, C. Modelling interannualand spatial variability of leaf senescence for three deciduous tree species in France. Agric. For. Meteorol. 2009,149, 938–948. [CrossRef]
30. Estiarte, M.; Penuelas, J. Alteration of the phenology of leaf senescence and fall in winter deciduous speciesby climate change: Effects on nutrient proficiency. Glob. Chang. Biol. 2015, 21, 1005–1017. [CrossRef]
31. Rohde, A.; Bastien, C.; Boerjan, W. Temperature signals contribute to the timing of photoperiodic growthcessation and bud set in poplar. Tree Physiol. 2011, 31, 472–482. [CrossRef]
32. Rohde, A.; Storme, V.; Jorge, V.; Gaudet, M.; Vitacolonna, N.; Fabbrini, F.; Ruttink, T.; Zaina, G.; Marron, N.;Dillen, S.; et al. Bud set in poplar—Genetic dissection of a complex trait in natural and hybrid populations.New Phytol. 2011, 189, 106–121. [CrossRef] [PubMed]
33. Polgar, C.A.; Primack, R.B. Leaf-out phenology of temperate woody plants: From trees to ecosystems.New Phytol. 2011, 191, 926–941. [CrossRef] [PubMed]
34. Vitasse, Y.; Delzon, S.; Bresson, C.C.; Michalet, R.; Kremer, A. Altitudinal differentiation in growth andphenology among populations of temperate-zone tree species growing in a common garden. Can. J. For. Res.2009, 39, 1259–1269. [CrossRef]
35. Panchen, Z.A.; Primack, R.B.; Gallinat, A.S.; Nordt, B.; Stevens, A.D.; Du, Y.J.; Fahey, R. Substantial variationin leaf senescence times among 1360 temperate woody plant species: Implications for phenology andecosystem processes. Ann. Bot.-Lond. 2015, 116, 865–873. [CrossRef] [PubMed]
36. Zohner, C.M.; Rockinger, A.; Renner, S.S. Increased autumn productivity permits temperate trees tocompensate for spring frost damage. New Phytol. 2019, 221, 789–795. [CrossRef]
37. Nicotra, a.B.; Atkin, O.K.; Bonser, S.P.; Davidson, A.M.; Finnegan, E.J.; Mathesius, U.; Poot, P.;Purugganan, M.D.; Richards, C.L.; Valladares, F.; et al. Plant phenotypic plasticity in a changing climate.Trends Plant Sci. 2010, 15, 684–692. [CrossRef] [PubMed]
38. Cleland, E.E.; Allen, J.M.; Crimmins, T.M.; Dunne, J.A.; Pau, S.; Travers, S.E.; Zavaleta, E.S.; Wolkovich, E.M.Phenological tracking enables positive species responses to climate change. Ecology 2012, 93, 1765–1771.[CrossRef] [PubMed]
39. Cooper, H.F.; Grady, K.C.; Cowan, J.A.; Best, R.J.; Allan, G.J.; Whitham, T.G. Genotypic variation inphenological plasticity: Reciprocal common gardens reveal adaptive responses to warmer springs butnot to fall frost. Glob. Chang. Biol. 2019, 25, 187–200. [CrossRef] [PubMed]
40. Evans, L.M.; Kaluthota, S.; Pearce, D.W.; Allan, G.J.; Floate, K.; Rood, S.B.; Whitham, T.G. Bud phenologyand growth are subject to divergent selection across a latitudinal gradient in Populus angustifolia and impactadaptation across the distributional range and associated arthropods. Ecol. Evol. 2016, 6, 4565–4581.[CrossRef] [PubMed]
41. Brown, J.A.; Beatty, G.E.; Finlay, C.M.V.; Montgomery, W.I.; Tosh, D.G.; Provan, J. Genetic analyses revealhigh levels of seed and pollen flow in hawthorn (Crataegus monogyna Jacq.), a key component of hedgerows.Tree Genet. Genomes 2016, 12, 58. [CrossRef]
266

Forests 2019, 10, 293
42. Vander Mijnsbrugge, K.; Onkelinx, T.; De Cuyper, B. Variation in bud burst and flower opening responsesof local versus non-local provenances of hawthorn (Crataegus monogyna Jacq.) in Belgium. Plant Syst. Evol.2015, 301, 1171–1179. [CrossRef]
43. Council of the European Union. Council directive 1999/105/ec of 22 december 1999 on the marketing offorest reproductive material. Off. J. Eur. Communion 2000, L11, 17–40.
44. R Core Team. R: A Language and Environment for Statistical Computing; R Foundation for Statistical Computing:Vienna, Austria, 2018; Available online: http://www.R-project.org/ (accessed on 5 January 2018).
45. Christensen, R.H.B. Ordinal: Regression Models for Ordinal Data. R Package Version 2015.6-28. 2015.Available online: http://www.Cran.R-project.Org/package=ordinal/ (accessed on 5 January 2015).
46. Alberto, F.J.; Derory, J.; Boury, C.; Frigerio, J.M.; Zimmermann, N.E.; Kremer, A. Imprints of natural selectionalong environmental gradients in phenology-related genes of Quercus petraea. Genetics 2013, 195, 495–512.[CrossRef] [PubMed]
47. Salmela, M.J.; Cavers, S.; Cottrell, J.E.; Iason, G.R.; Ennos, R.A. Spring phenology shows genetic variationamong and within populations in seedlings of scots pine (Pinus sylvestris L.) in the Scottish highlands.Plant Ecol. Divers 2013, 6, 523–536. [CrossRef]
48. Lobo, A.; Hansen, J.K.; Hansen, L.N.; Kjaer, E.D. Differences among six woody perennials native to northernEurope in their level of genetic differentiation and adaptive potential at fine local scale. Ecol. Evol. 2018, 8,2231–2239. [CrossRef]
49. Chmielewski, F.M.; Rotzer, T. Response of tree phenology to climate change across Europe. Agric. For. Meteorol.2001, 108, 101–112. [CrossRef]
50. Franks, S.J.; Weber, J.J.; Aitken, S.N. Evolutionary and plastic responses to climate change in terrestrial plantpopulations. Evol. Appl. 2014, 7, 123–139. [CrossRef] [PubMed]
51. Hampe, A.; Petit, R.J. Conserving biodiversity under climate change: The rear edge matters. Ecol. Lett. 2005,8, 461–467. [CrossRef] [PubMed]
© 2019 by the authors. Licensee MDPI, Basel, Switzerland. This article is an open accessarticle distributed under the terms and conditions of the Creative Commons Attribution(CC BY) license (http://creativecommons.org/licenses/by/4.0/).
267


Article
Effects of Lime Application and Understory Removalon Soil Microbial Communities in SubtropicalEucalyptus L’Hér. Plantations
Songze Wan 1, Zhanfeng Liu 2, Yuanqi Chen 3, Jie Zhao 4, Qin Ying 1 and Juan Liu 1,*
1 Collaborative Innovation Center of Jiangxi Typical Trees Cultivation and Utilization, College of forestry,Jiangxi Agriculture University, Nanchang 330045, China; [email protected] (S.W.);[email protected] (Q.Y.)
2 Key Laboratory of vegetation Restoration and Management of Degradation Ecosystems, South ChinaBotanical Garden, Chinese Academy of Sciences, Guangzhou 510650, China; [email protected]
3 Hunan Province Key Laboratory of Coal Resources Clean-utilization and Mine Environment Protection,Hunan University of Science and Technology, Xiangtan 411201, China; [email protected]
4 Key Laboratory of Agro-ecological Processes in Subtropical Region, Institute of Subtropical Agriculture,Chinese Academy of Sciences, Changsha 410125, China; [email protected]
* Correspondence: [email protected]
Received: 7 March 2019; Accepted: 13 April 2019; Published: 16 April 2019
Abstract: Soil microorganisms play key roles in ecosystems and respond quickly to environmentalchanges. Liming and/or understory removal are important forest management practices and havebeen widely applied to planted forests in humid subtropical and tropical regions of the world.However, few studies have explored the impacts of lime application, understory removal, and theirinteractive effects on soil microbial communities. We conducted a lime application experimentcombined with understory removal in a subtropical Eucalyptus L’Hér. plantation. Responses ofsoil microbial communities (indicated by phospholipid fatty acids, PLFAs), soil physico-chemicalproperties, and litter decomposition rate to lime and/or understory removal were measured. Limeapplication significantly decreased both fungal and bacterial PLFAs, causing declines in total PLFAs.Understory removal reduced the fungal PLFAs but had no effect on the bacterial PLFAs, leading todecreases in the total PLFAs and in the ratio of fungal to bacterial PLFAs. No interaction betweenlime application and understory removal on soil microbial community compositions was observed.Changes in soil microbial communities caused by lime application were mainly attributed to increasesin soil pH and NO3
–-N contents, while changes caused by understory removal were mainly due to theindirect effects on soil microclimate and the decreased soil dissolved carbon contents. Furthermore,both lime application and understory removal significantly reduced the litter decomposition rates,which indicates the lime application and understory removal may impact the microbe-mediated soilecological process. Our results suggest that lime application may not be suitable for the managementof subtropical Eucalyptus plantations. Likewise, understory vegetation helps to maintain soil microbialcommunities and litter decomposition rate; it should not be removed from Eucalyptus plantations.
Keywords: lime application; understory removal; microbial community; forest management;Eucalyptus
1. Introduction
Soil microorganisms play essential roles in regulating ecosystem processes and maintainingecosystem functions and services, such as litter decomposition [1], nutrient cycling [2], primaryproduction, and climate regulation [3]. Both biotic and environmental factors drive the activity,structure, and diversity of soil microbial communities, which are controlled by many factors including
Forests 2019, 10, 338; doi:10.3390/f10040338 www.mdpi.com/journal/forests269

Forests 2019, 10, 338
edaphic conditions [4]. Soil microbes generally respond quickly to environmental changes. Althoughnumerous previous studies have explored the soil microbial responses to environmental changesin various forest types, more quantitative research estimating the effects of forest managementpractices on soil microbial community compositions is needed [5,6]. Information from such studiesis valuable in both theoretical and practical aspects, which will improve our understanding of themechanisms underlying soil carbon and nutrient cycling in forest ecosystems and may supportsustainable forest management.
Acrisol is a common type of soil, distributed mainly in humid tropical/subtropical and even warmtemperate regions, such as Southern Asia, South China, and Southeast US [7]. Lime application is oneof the most widely applied management practices for amending Acrisol [8]. In addition to lowering soilacidity, lime application could improve soil structure, and thus typically promote agriculture and forestproductivities [4,9]. Lime application also affects soil biological and biochemical properties, includingmicrobial activities and carbon and nitrogen mineralization [7]. Previous studies investigating theeffects of liming on soil microbial community composition reported mixed results. For example, bothPennanen et al. (1998) and Pawlett et al. (2009) found that lime application significantly reducedbacterial phospholipid fatty acids (PLFAs) and did not affect fungal PLFAs [10,11]. While Bruneau et al.(2010) reported that the density of bacteria was increased by liming [12]. Kamal et al. (2010) found thatlime application led to increases in the relative abundance of prokaryotes, bacilli, and actinomycetesbut decreases in micromycetes [13]. On the contrary, Wang et al. (2007) reported an inhibitory effect oflime on actinomycetes that could facilitate soil carbon mineralization [14]. Although the acid toleranceof individual microbial species varies widely, it is well recognized that low pH inhibits the growth ofsoil bacteria but favors fungi that are more resistant to acidity. Therefore, the soil microbial communitygenerally shifts from fungi to bacteria as the pH increases after lime application [15]. However, mostof these studies focused on the soil microbial communities in agricultural soil [8,16]. We still have apoor understanding of how fungal and bacterial communities respond to lime application in forests,especially for Eucalyptus plantations in South China where soils are strongly acidic.
Eucalyptus urophylla S.T.Blake is a fast-growing species and is widely planted in South China.Due to the high demand for wood and fiber, the planting area of E. urophylla is expanding [17].Within an E. urophylla plantation, the understory vegetation is typically dominated by a native fernDicranopteris dichotoma (Thunb.) Bernh., which usually forms a mat-like dense layer beneath theopen-canopy areas [6,17]. Several studies have revealed that understory vegetation plays importantroles in maintaining both the aboveground and belowground biodiversity, the microclimate, and thenutrient cycling [1,6,18]. Furthermore, understory fern biomass can occupy up to 20% of the totalbiomass in Eucalyptus plantations [19], indicating that understory plants could make a substantialcontribution to the regulation of soil processes. Although the number of such studies is growingrecently, the importance of understory vegetation in driving ecosystem structure and functions remainsunfocused in most ecological studies [20,21]. In practice, understory vegetation is usually removedto reduce competition for nutrients against plantation trees, which could facilitate the growth of treeseedlings [22] and cause significant changes in soil microclimates [20] or nutrient availabilities [23].To date, however, only a few studies quantitatively determined the effects of understory removal on soilmicrobial community composition, especially in combination with other forest management practices,and the effects tend to be conflicting. Some studies reported significant alterations in the compositionof soil microbial communities [6,24], while others did not [25]. Therefore, the effects of understoryremoval on soil microbial communities are highly context dependent and need to be further studied.
In the present study, a lime application experiment combined with understory removal wasconducted in a subtropical E. urophylla plantation to examine the main and interactive effects of limeapplication and understory removal on soil microbial community composition. We hypothesizedthat: (1) Lime application would increase soil pH, leading to negative effects on fungal biomass butpositive effects on bacterial biomass, hence, changing the microbial composition, because most fungiare moderately acidophilic but bacterial species could grow within wider pH ranges; and (2) understory
270

Forests 2019, 10, 338
removal would result in negative effects on soil microbial biomass and composition, due to reductionsof belowground resource inputs and changes in soil microclimates.
2. Materials and Methods
2.1. Site Description
This study was conducted in three six-year old E. urophylla monoculture plantations at HeshanNational Field Research Station of Forest Ecosystem (112◦50′ E, 22◦34′ N), Chinese Academy of Science(CAS), Guangdong Province, China. Each of the three plantations occupied about 1 ha. The distancebetween any two plantations exceeded 1 km. The climate in this region is typically subtropicalmonsoon, with a humid hot season from April to September and a dry cold season from October toMarch. The mean annual temperature and rainfall are 21.7 °C and 1700 mm, respectively. The soil isclassified as an Ultisol developed from sandstone [26]. Eucalyptus plantations were reestablished in2005 after all previous trees (Pinus elliottii Engelm.) had been cut, with saplings planted at a spacingof 3 m × 2 m (1650 trees per ha). The understory vegetation within the plantation was dominated(almost 100%) by D. dichotoma, accompanied by some rarely occurring species such as Rhodomyrtustomentosa (Aiton) Hassk. and Miscanthus sinensis Andersson.
2.2. Experiment Design
A split-plot design was used and four treatments were replicated three times, with the limeapplication as the main-plot factor and understory removal as the sub-plot factor. In December 2011,two paired main-plots were established in each plantation, and within each main plot, a sub-plot wasdistinguished. The main-plot size was 10 m × 10 m, while the sub-plot size was 5 m × 5 m. Limeapplication and understory removal were arranged for the main plot and the sub-plot, respectively.Therefore, the four treatments were: Control without lime application and with intact understory(CK), understory removal (UR), lime application (LA), and lime application combined with understoryremoval (LUR). Around each plot, polyvinyl chloride (PVC) boards were embedded at a depth of80 cm to exclude disturbance from roots outside the plots and to eliminate the movement of water andnutrients. For plots receiving lime application, lime was added to the soil surface on 15 December2011 and 15 August 2012 in the form of pulverized lime (60 kg per 100 m2 as CaO in total per year).Understory vegetation (including the above- and belowground components) was physically removedfrom plots for the understory removal treatments (i.e., UR and LUR) prior to the start of the experiment.Any understory plant germinated during the experimental period was removed on a monthly basis.
2.3. Soil Sampling and Analysis
Soils were sampled on 0, 10, 60, 147, 275, and 377 days after the treatments were applied, with theday 0 sample as the baseline. The surface litter was carefully removed before sampling. In each plot,five soil cores (2.5 cm in diameter) at 0–10 cm depth from random sampling points were combinedas one composite sample. After carefully removing the surface organic materials and visible roots,each composite sample was passed through a 2 mm sieve and divided into two subsamples; onesubsample was stored at 4 °C for soil physical–chemical analysis, and the other was stored at −20 °Cfor PLFA analysis.
Soil pH was measured every month during the experimental period. Three soil cores at 0–10 cmdepth were sampled in each plot and combined as a composite sample. Soil pH was determined in a1:2.5 soil-water slurry using a combination glass electrode. Soil temperature was measured with theDS1922l temperature logger iButton® (Dallas Semiconductor Corp., Dallas, TX, USA) every 2 h at5 cm soil depth in situ from December 2011 to December 2012. Soil moisture contents (SMC% g ofwater per 100 g of dry soil) was determined gravimetrically after the soil was dried for 48 h at 105 °C.
The soil microbial community was characterized by the phospholipid fatty acid (PLFA)analysis [27,28]. Briefly, field-moist, sieved soil samples equivalent to 8 g dry mass were extracted in
271

Forests 2019, 10, 338
a chloroform–methanol–phosphate buffer (1:2:0.8 v/v/v), and the extracted lipids were fractionatedinto neutral lipids, glycolipids, and polar lipids on silica acid columns by successive elution withchloroform, acetone, and methanol. The methanol fraction (containing phospholipids) was subjectedto mild alkaline methanolysis to transform the fatty acids into free methyl esters and was analyzed on agas chromatograph (Hewlett-Packard 6890, Agilent, Santa Clara, CA, USA). Peaks were identified usingbacterial fatty acid standards and MIDI peak identification software (MIDI, Inc., Newark, DE, USA).Concentrations of each PLFA were standardized relative to 19:0 internal reference concentrations.Fungal biomass was considered to be indicated by 18:2ω6,9 [28]; bacterial biomass was considered tobe indicated by the following 10 PLFAs: i15:0, a15:0, 15:0, i16:0, 16:1w7, i17:0, a17:0, 17:0, cy17:0, andcy19:0; total PLFAs and the ratio of fungal to bacterial PLFAs were also calculated. All PLFAs werecalculated as ng g–1 dry soil.
2.4. Litter Decomposition Experiment
Litter bags (26 cm × 15 cm with a mesh size of 1 mm × 1 mm) were used to measure Eucalyptuslitter decomposition rates. Fresh Eucalyptus litter was collected from litter traps (1 m × 1 m nylon net)in the experimental plantation. Each litter bag contained 10 g oven-dried litter, and six litter bags wereplaced on the soil surface in each subplot of the four treatments in December 2011. Afterward, onelitter bag in each subplot was harvested bimonthly until all the six bags were harvested. The retrievedlitter decomposition residuals were collected and oven-dried at 65 °C to a constant mass, and thenweighed for the mass. The litter decomposition rate was calculated as the bimonthly mass loss rate:Litter decomposition rate (%) = (mass loss bimonthly/initial weight of litter) × 100%, where the initialweight of litter in each litter bag was 10 g.
2.5. Statistical Analysis
Repeated-measure ANOVAs by the general linear model were employed to examine the effectsof time and treatments throughout the experimental period. Soil physico-chemical properties andmicrobial biomass measured during the experiment were analyzed using linear mixed-effect models,with lime application and understory removal as categorical fixed effects, and replicated (n = 3) as arandom effect. Redundancy analysis (RDA) was performed to determine the relationships betweenmicrobial communities (PLFA profile) and soil physico-chemical properties. The most discriminatingsoil property variables were selected by the “forward selection” procedure. Data were transformed(natural log, square root, or rank) when necessary to meet assumptions of normality and homogeneityof variance. Statistical significance was determined at P ≤ 0.05. All univariate analyses were performedin SPSS 18.0 (SPSS Inc., Chicago, IL, USA). RDA was performed with the CANOCO 4.5 software (Ithaca,NY, USA). The forward selection was implemented based on the Monte Carlo permutation (n = 499).
3. Results
3.1. Soil Physico-Chemical Properties
Contents of soil organic carbon (SOC), total nitrogen (TN), dissolved organic carbon (DOC), aswell as soil pH, did not differ among plots before the treatments were applied (Table 1), indicating nospatial heterogeneity between the experimental plots. Soil NH4
+-N contents varied with time but didnot differ among the four treatments during the experimental period (Table 2). Soil pH, however, wassignificantly higher in the LA treatment (4.19–4.56 units) than in the control (3.78–3.83 units) or the URtreatment (3.57–3.87 units) across the sampling events (Figure 1). Soil NO3
–-N contents were increasedby LA, but decreased by UR. Soil moisture contents (SMC) were significantly lower in both LA and URtreatments than in the control. For DOC, there was a slight decline in the UR treatment, but the trendwas minimal (P = 0.06). In addition, no interaction between LA and UR on any soil physico-chemicalproperty measured in this study was observed (Table 2).
272

Forests 2019, 10, 338
Table 1. Soil characteristics before treatments were applied.
Treatments SOC (g kg−1) TN (g kg−1) DOC (μg C g−1) pH
Control 14.43 (0.66) 1.86 (0.32) 288.64 (74.26) 3.97 (0.04)UR 15.78 (1.82) 1.72 (0.53) 268.11 (88.39) 4.05 (0.04)LA 17.06 (1.95) 1.68 (0.37) 249.22 (62.16) 4.14 (0.02)
LUR 15.64 (1.21) 1.71 (0.47) 246.54 (46.55) 4.16 (0.01)ANOVA ns ns ns ns
SOC, soil organic carbon; TN, total nitrogen; DOC, dissolved organic carbon; Control, no lime application andno understory removal; UR, understory removal; LA, lime application; LUR, lime application with understoryremoval. Values are means (with SE in parentheses; n = 3). Statistical significance was determined at P < 0.05. ns, nosignificant difference between treatments using ANOVA.
PP
P
Figure 1. Soil pH under different treatments during the experimental period. CK, control withoutlime application and with intact understory; UR, understory removal; LA, lime application; LUR, limeapplication with understory removal. Values are means ± SE, n = 3.
Table 2. Effects of time, lime application, understory removal, and the interaction of lime applicationand understory removal on soil moisture content, soil temperature at 0–5cm depth, dissolved organiccarbon, and inorganic nitrogen content, n = 3.
FactorsTime LA UR LA × UR
F P F P F P F P
SMC 15.14 <0.01 20.45 <0.01 9.4 <0.01 2.56 0.112ST 12.15 <0.01 3.57 0.09 36.4 <0.01 1.05 0.34
DOC 1.45 0.2 0.95 0.33 0.18 0.06 0.23 0.63NH4
+–N 7.15 <0.01 0.27 0.6 2.31 0.14 2.2 0.99NO3
––N 26.01 <0.01 27.13 <0.01 13.31 <0.01 0.99 0.32
Time, sampling time; LA, lime application; UR, understory removal; LA ×UR, interactions between lime applicationand understory removal; SMC, soil moisture content; ST, soil temperature; DOC, dissolved organic carbon. Resultsare from a three-way factorial ANOVA, with factors of time (levels: Dec 2011, Feb 2012, May 2012, Sep 2012, and Dec2012), lime application (levels: limed, not limed), and understory removal (levels: understory removed, understorynot removed).
3.2. Soil Microbial Community
Soil microbial biomass (as indicated by the total PLFAs, i.e., the sum of fungal and bacterial PLFAs)ranged from 453 to 2701 ng g–1 under different treatment during the experimental period. Samplingtime had a significant effect on total PLFAs, bacterial PLFAs, fungal PLFAs, and the F:B ratio (ratio offungal to bacterial PLFAs) (Figure 2, Table 3). Across sampling time, the LA treatment significantlydecreased both fungal and bacterial PLFAs and hence the total PLFAs, but had no significant effect onthe F:B ratio (Figure 2, Table 3). The UR treatment, however, significantly decreased the fungal and
273

Forests 2019, 10, 338
total PLFAs without affecting bacterial PLFAs, and thus reduced the F:B ratio (Figure 2, Table 3). Therewere no significant interaction effects of LA and UR on the composition of soil microbial communitiesduring the entire experimental period. In addition, no interaction effect between sampling time and LAwas observed, while the interaction between sampling time and UR on the total PLFAs was remarkable(Table 3).
Figure 2. Soil microbial phospholipid fatty acids (PLFAs) under different treatments. (a) Soil TotalPLFAs; (b) Soil Fungal PLFAs; (c) Soil Bacterial PLFAs; (d) the Ratio of Fungal PLFAs to Bacterial PLFAs.UR, understory removal; LA, lime application; LUR, lime application with understory removal. F:Bindicates the ratio of fungal to bacterial PLFAs. Values are means ± SE, n = 3.
Table 3. Effects of time, lime application, understory removal, and interactions between time, limeapplication and understory removal on soil microbial PLFAs, n = 3.
VariableTime LA UR LA × UR Time × LA Time × UR Time × LA × UR
P P P P P P P
Total PLFAs <0.01 <0.01 0.02 0.65 0.64 0.02 0.81Bacteria PLFAs <0.01 <0.01 0.14 0.79 0.24 0.07 0.94Fungal PLFAs <0.01 <0.01 <0.01 0.46 0.06 0.08 0.21
F:B <0.01 0.76 0.02 0.74 0.65 0.26 0.38
Time, sampling time; LA, lime application; UR, understory removal; LA ×UR, interactions between lime applicationand understory removal; F:B indicates the ratio of fungal to bacterial PLFAs. Results are from a three-way factorialANOVA, with factors of time (levels: Dec 2011, Feb 2012, May 2012, Sep 2012, and Dec 2012), lime application(levels: limed, not limed), and understory removal (levels: understory removed, understory not removed).
3.3. Relationships between Soil Physico-Chemical Properties and Microbial Community
Redundancy analysis showed that soil microclimate (P < 0.01), soil DOC (P < 0.01), soil pH(P = 0.02), and soil NO3
–-N content (P = 0.02) were significantly correlated with whole soil microbialcommunities (Figure 3). Specifically, soil pH and SMC were correlated negatively to 18:2ω6,9, i16:0,15:0, and a17:0 (Figure 3). Soil temperature was correlated positively to i17:0 and negatively to a15:0,i15:0, and 16:1ω7 (Figure 3). Soil NO3
–-N content and soil DOC, however, were correlated negatively
274

Forests 2019, 10, 338
to i17:0, but correlated positively to a15:0, i15:0, and 16:1ω7 (Figure 3). All the environmental dataexplained 92.4% of the total variance, with the first axis (Axis 1) explaining 66.3% of the variance andthe second axis (Axis 2) explaining another 26.1% (Figure 3).
Figure 3. Redundancy analysis of soil microbial PLFA biomarkers. Ordination diagrams presentingspecies scores and environmental factor scores (vectors). ST, soil temperature at 0–5 cm depth; DOC,dissolved organic carbon; SMC, soil moisture content.
3.4. Litter Decomposition
One year after the treatments were applied, both LA and UR treatments significantly reducedlitter mass loss (both P < 0.01). There was no significant interaction of LA and UR on the litter massloss during the experimental period (Figure 4).
PP P
Figure 4. Mass of Eucalyptus litter remaining per litter bag under different treatments. Vertical barsrepresent SEs. LA, lime application; UR, understory removal. The inserted P values were fromrepeated-measure ANOVA.
275

Forests 2019, 10, 338
4. Discussion
4.1. The Impacts of Lime Application on Soil Microbial Community
Liming is commonly used to improve environmental conditions for the development ofacid-intolerant microbes, resulting in increased microbial biomass and activities [4,29]. In thisstudy, however, we observed a reduction of soil fungal and bacterial PLFAs after lime application.Consistent with our results, some other studies have also found that lime application inhibited the soilmicrobial biomass in both field- and lab-based conditions. For instance, Pawlett et al. (2009) reportedthat liming decreased soil microbial PLFAs and bacterial PLFAs [11]. Lin et al. (2018) also foundthat some soil bacterial groups were consistently decreased by a 27-year lime application in SouthChina, and lime application may potentially affect the N-fixation ability by altering the soil communitystructure of soil diazotrophs [30]. Lime application did not affect soil the F:B ratio in this study, dueto the decreases in both fungal and bacterial PLFAs (Figure 2, Table 3). Likewise, Xue et al. (2010)observed that liming had minimal effects on the F:B ratio, though soil microbial community structurehad been significantly affected [31].
The most likely reason for lime application inducing alterations in soil microbial biomass may beassociated directly with the increased soil pH, as shown by the fungal biomarker 18:2ω6,9, and thebacterial biomarkers a17:0, i16:0, and 15:0 were correlating negatively with soil pH (Figure 3). It is wellrecognized that most fungi are moderately acidophilic [7], and therefore, the fungal activities wouldbe inhibited and the microbial communities would typically shift from fungal to bacterial as soil pHincreased after lime application. Furthermore, the signature of a17:0, i16:0, and 15:0 had dominatedthe decreased bacterial biomass with higher pH in liming soils in the present study. In addition, ourresults showed that lime application reduced the soil water content, which might in turn suppress theNO3
–-N leaching from soil. The increased inorganic N might have “toxicity effects or salt effects” onsoil microbes and consequently suppress the microbial biomass [32]. In line with our results, studiesfrom Wu et al. (2011) and Cox et al. (2010) also demonstrated that the microbial diversity and biomasswere reduced by the increased N availability [19,33].
4.2. The Impacts of Understory Removal on Soil Microbial Community
Soil microorganisms are greatly affected by both the quantity and quality of resources, as well asthe soil habitat. Soil sampling time had significant effects on soil microbial biomass and compositionin this study (Figure 2, Table 3), probably due to the seasonal variations in soil temperature and/ormoisture. The present study region is within a typical subtropical monsoon climate, with distinctwet–hot and dry–cold seasons. Over 83% and 66% of annual precipitation and radiation inputs tothis region occur during the wet–hot season (from April to September). The temporal changes in soilmicrobial biomass and composition could be ascribed to the changes in moisture, soil temperature,and the substrate availability, as indicated by other studies [24].
In addition, soil sampling time had a significant interactive effect with UR on soil total PLFAs,which should be considered when conducting “before-after-control-impact” (BACI) experiments in themonsoon climate regime region. Our findings showed that understory removal significantly reducedtotal PLFAs, fungal PLFA, and the F: B ratio. The effects of understory plant removal on soil microbialcommunities have also been observed in other forest ecosystems. For instance, Winsome et al. (2017)reported that understory removal significantly reduced soil microbial biomass in a ponderosa pineplantation [34]. Tong et al. (2015) found that understory removal apparently decreased soil fungalPLFAs and the F:B ratio in a Chinese fir plantation [35]. Yin et al. (2016) found that the biomass of allmicrobial community groups (i.e., fungi, bacteria, arbuscular mycorrhizal fungi, and actinomycetes)decreased with decreasing understory herbs biomass in subtropical plantations, which suggested thatunderstory vegetation would exert strong controls on soil microbial communities [36]. Zhao et al.(2012) and Giuggiola et al. (2018) also suggested that the indirect effects of understory removal on soilmicroclimate wound be the most likely factor affecting soil microbial community composition [20,37].
276

Forests 2019, 10, 338
Furthermore, RDA showed that the increased soil temperature and decreased soil moisture derivedfrom the understory removal treatment resulted in changes in soil microbial composition. This maybe attributed to the fact that the soil microbial community was significantly correlated with soiltemperature and moisture, and all of the environmental variables explained up to 92.4% of the totalvariance in soil microbial communities in this study (Figure 3).
It is generally accepted that soil microbial community is controlled by the bottom-up force [38,39].Normally, understory vegetation is considered as a minor portion of biomass in a forest ecosystemand contributes less to the bottom-up force on soil decomposers than overstory plants. Wu et al.(2011) reported that the DOC remained unaffected by understory removal in both two-year and24-year Eucalyptus plantations [19], which indicated that the bottom-up control induced by understoryvegetation was minor. However, there was an apparent trend that understory removal decreasedDOC (P = 0.06) (Table 2), and thus resulted in the decrease in fungal PLFAs in the six-year Eucalyptusplantation in this study, which was proven by the positive correlation between the fungal PLFAbiomarker (i.e., 18:2ω6,9) and the DOC (Figure 3). Additionally, understory removal decreased soilmoisture (P < 0.01), and subsequently increased the fungal PLFAs, as indicated by the negativerelationship between the fungal PLFA biomarker 18:2ω6,9 and soil moisture (Figure 3). Consequently,the suppressing effect of understory removal on soil fungal PLFAs could be ascribed to the decrease inDOC. Furthermore, our previous study in the same experiment site found that understory removalsignificantly reduced the soil CO2 flux, and the biomass of understory fern occupied up to 20%of the Eucalyptus plantation [17], which indicated that the understory dominated by D. dichotomamight have a bottom-up control on soil microbial communities. Since the ecological functions ofunderstory vegetation in a forest ecosystem largely depend on their species [21] and biomass [6,40],the differentiated results from different ecosystems indicate that the effects of understory vegetation onsoil microbial communities are context dependent and require further studies.
5. Conclusions
In conclusion, soil microbial communities in this study were affected by both lime application andunderstory removal, but without any interaction. Lime application increased soil pH and soil NO3
–-Ncontent, which decreased the soil fungal and bacterial PLFAs. Understory presence is favorable forsustaining soil microclimates and providing resources for soil microorganisms. Understory removalinhibited soil total PLFAs and fungal PLFAs, and hence altered the soil microbial communities. Inaddition, both lime application and understory removal significantly reduced the litter decompositionrates (Figure 4), which indicates the lime application and understory removal may impact themicrobe-mediated soil ecological process (i.e., soil nutrient cycling). We propose that lime applicationmay not be suitable for the management of subtropical Eucalyptus plantations, while the understory fernD. dichotoma functions as a facilitator in Eucalyptus plantations and should not be removed. In general,our findings in this study would be helpful for the development of management practices that optimizethe yield and sustainability of subtropical plantations.
Author Contributions: S.W. and Z.L. designed the experiment. S.W., Y.C., and J.Z. performed the study datacollection. J.L., S.W, and Q.Y. analyzed the results. J.L. and Z.L. reviewed the article. S.W. wrote the final article.All authors approved the final version of the manuscript.
Funding: This study was funded by the National Science Foundation of China (41867007 and 31500341),Guangdong Provincial Key Laboratory of Applied Botany, South China Botanical Garden, Chinese Academy ofScience (AB2016003), the Open Foundation of the State Key Laboratory of Urban and Regional Ecology of China(SKLURE2016-2-5), and the Youth Innovation Promotion Association CAS.
Acknowledgments: We thank Shenglei Fu and Weixing Zhang from Henan University for their comments anddiscussions on the early version of the manuscript. We also thank Xiaoli Wang and Xiaolin Zhu for their assistancein samples analysis and data collection.
Conflicts of Interest: The authors declare no conflict of interest.
277

Forests 2019, 10, 338
References
1. Wan, S.; Zhang, C.; Chen, Y.; Zhao, J.; Wang, X.; Wu, J.; Zhou, L.; Lin, Y.; Liu, Z.; Fu, S. The understory fernDicranopteris dichotoma facilitates the overstory Eucalyptus trees in subtropical plantations. Ecosphere 2014, 5,1–12. [CrossRef]
2. Leff, J.W.; Jones, S.E.; Prober, S.M.; Barberán, A.; Borer, E.T.; Firn, J.L.; Harpole, W.S.; Hobbie, S.E.;Hofmockel, K.S.; Knops, J.M.H.; et al. Consistent responses of soil microbial communities to elevatednutrient inputs in grasslands across the globe. Proc. Natl. Acad. Sci. USA 2015, 112, 10967–10972. [CrossRef]
3. Delgado-Baquerizo, M.; Maestre, F.T.; Reich, P.B.; Jeffries, T.C.; Gaitan, J.J.; Encinar, D.; Berdugo, M.;Campbell, C.D.; Singh, B.K. Microbial diversity drives multifunctionality in terrestrial ecosystems.Nat. Commun. 2016, 7, 10541. [CrossRef]
4. Narendrula-Kotha, R.; Nkongolo, K.K. Microbial response to soil liming of damaged ecosystems revealed bypyrosequencing and phospholipid fatty acid analyses. PLoS ONE 2017, 12, e0168497. [CrossRef]
5. Li, J.; Li, Z.; Wang, F.; Zou, B.; Chen, Y.; Zhao, J.; Mo, Q.; Li, Y.; Li, X.; Xia, H. Effects of nitrogen andphosphorus addition on soil microbial community in a secondary tropical forest of China. Biol. Fertil. Soils2015, 51, 207–215. [CrossRef]
6. Zhao, J.; Wan, S.; Fu, S.; Wang, X.; Wang, M.; Liang, C.; Chen, Y.; Zhu, X. Effects of understory removal andnitrogen fertilization on soil microbial communities in Eucalyptus plantations. For. Ecol. Manag. 2013, 310,80–86. [CrossRef]
7. Zhao, J.; Zhao, C.; Wan, S.; Wang, X.; Zhou, L.; Fu, S. Soil nematode assemblages in an acid soil as affected bylime application. Nematology 2015, 17, 179. [CrossRef]
8. Bramble, D.S.E.; Gouveia, G.A.; Ramnarine, R. Organic residues and ammonium effects on CO2 emissionsand soil quality indicators in limed acid tropical soils. Soil Syst. 2019, 3, 16. [CrossRef]
9. Bakina, L.G.; Chugunova, M.V.; Zaitseva, T.B.; Nebol’sina, Z.P. The effect of liming on the complex of soilmicroorganisms and the humus status of a soddy-podzolic soil in a long-term experiment. Eurasian Soil Sci.2014, 47, 110–118. [CrossRef]
10. Pennanen, T.H.; Vanhala, P.; Kiikkila, O.; Neuvonen, S.; Baath, E. Structure of a microbial community in soilafter prolonged addition of low levels of simulated acid rain. Appl. Environ. Microb. 1998, 64, 2173–2180.
11. Pawlett, M.; Hopkins, D.W.; Moffett, B.F.; Harris, J.A. The effect of earthworms and liming on soil microbialcommunities. Biol. Fertil. Soils 2009, 45, 361–369. [CrossRef]
12. Bruneau, P.M.C.; Davidson, D.A.; Grieve, I.C.; Young, I.M.; Naoise, N. The effects of soil horizons andfaunal excrement on bacterial distribution in an upland grassland soil. Fems Microb. Ecol. 2010, 52, 139–144.[CrossRef]
13. Kamal, S.; Prasad, R.; Varma, A. Soil microbial diversity in relation to heavy metals. In Soil Heavy Metals;Springer: Berlin, Heidelberg, 2010; volume 19, pp. 31–63.
14. Wang, Y.; Shi, J.; Wang, H.; Lin, Q.; Chen, X.; Chen, Y. The influence of soil heavy metals pollution on soil microbialbiomass, enzyme activity, and community composition near a copper smelter. Ecotoxicol. Environ. Saf. 2007, 67,75–81. [CrossRef]
15. Haynes, R.J.; Naidu, R. Influence of lime, fertilizer and manure applications on soil organic matter contentand soil physical conditions: A review. Nutr. Cycl. Agroecosyst. 1998, 51, 123–137. [CrossRef]
16. Shi, L.; Guo, Z.; Liang, F.; Xiao, X.; Peng, C.; Zeng, P.; Feng, W.; Ran, H. Effect of liming with various waterregimes on both immobilization of Cadmium and improvement of bacterial communities in ContaminatedPaddy: A field experiment. Int. J. Environ. Res. Public Health 2019, 16, 498. [CrossRef]
17. Wan, S.; Zhang, C.; Chen, Y.; Zhao, J.; Zhu, X.; Wu, J.; Zhou, L.; Lin, Y.; Liu, Z.; Fu, S. Interactive effects ofunderstory removal and fertilization on soil respiration in subtropical Eucalyptus plantations. J. Plant Ecol.2015, 3, 284–290. [CrossRef]
18. Wang, F.; Chen, F.; Wang, G.G.; Mao, R.; Fang, X.; Wang, H.; Bu, W. Effects of experimental nitrogen additionon nutrients and nonstructural carbohydrates of dominant understory plants in a Chinese fir plantation.Forests 2019, 10, 155. [CrossRef]
278

Forests 2019, 10, 338
19. Wu, J.; Liu, Z.; Chen, D.; Huang, G.; Zhou, L.; Fu, S. Understory plants can make substantial contributionsto soil respiration: Evidence from two subtropical plantations. Soil Biol. Biochem. 2011, 43, 2355–2357.[CrossRef]
20. Giuggiola, A.; Zweifel, R.; Feichtinger, L.M.; Vollenweider, P.; Bugmann, H.; Haeni, M.; Rigling, A.Competition for water in a xeric forest ecosystem—Effects of understory removal on soil micro-climate,growth and physiology of dominant Scots pine trees. For. Ecol. Manag. 2018, 409, 241–249. [CrossRef]
21. Nilsson, M.-C.; Wardle, D.A. Understory vegetation as a forest ecosystem driver: Evidence from the northernSwedish boreal forest. Front. Ecol. Environ. 2005, 3, 421–428. [CrossRef]
22. Wang, J.; Hai, R.; Long, Y.; Duan, W. Establishment and early growth of introduced indigenous tree speciesin typical plantations and shrubland in South China. For. Ecol. Manag. 2009, 7, 1293–1300. [CrossRef]
23. Li, Y.L.; Wang, S.L.; Yan, S.K. Short-term effects of understory vegetation removal on nutrient cycling in litterlayer of Chinese fir plantation. Chin. J. Appl. Ecol. 2011, 22, 2560.
24. Wu, J.; Liu, Z.; Wang, X.; Sun, Y.; Zhou, L.; Lin, Y.; Fu, S. Effects of understory removal and tree girdling onsoil microbial community composition and litter decomposition in two Eucalyptus plantations in SouthChina. Funct. Ecol. 2011, 25, 921–931. [CrossRef]
25. Urcelay, C.; Díaz, S.; Gurvich, D.E.; Chapin, F.S., III; Cuevas, E.; Domínguez, L.S. Mycorrhizal communityresilience in response to experimental plant functional type removals in a woody ecosystem. J. Ecol. 2010, 97,1291–1301. [CrossRef]
26. FAO. World Referernce Base for Soil Resources 2006; World Soil Resources Report 103; FAO: Rome, Italy, 2006.27. Bossio, D.; Scow, K. Impacts of carbon and flooding on soil microbial communities: Phospholipid fatty acid
profiles and substrate utilization patterns. Microb. Ecol. 1998, 35, 265–278. [CrossRef]28. Frostegård, Å.; Tunlid, A.; Bååth, E. Use and misuse of PLFA measurements in soils. Soil Biol. Biochem. 2011,
43, 1621–1625. [CrossRef]29. Frostegård, Å.; Bååth, E.; Tunlio, A. Shifts in the structure of soil microbial communities in limed forests as
revealed by phospholipid fatty acid analysis. Soil Biol. Biochem. 1993, 25, 723–730. [CrossRef]30. Lin, Y.; Ye, G.; Liu, D.; Ledgard, S.; Luo, J.; Fan, J.; Yuan, J.; Chen, Z.; Ding, W. Long-term application of
lime or pig manure rather than plant residues suppressed diazotroph abundance and diversity and alteredcommunity structure in an acidic Ultisol. Soil Biol. Biochem. 2018, 123, 218–228. [CrossRef]
31. Xue, D.; Huang, X.; Yao, H.; Huang, C. Effect of lime application on microbial community in acidic teaorchard soils in comparison with those in wasteland and forest soils. J. Environ. Sci. 2010, 22, 1253–1260.[CrossRef]
32. Thirukkumaran, C.M.; Parkinson, D. Microbial respiration, biomass, metabolic quotient and litter decompositionin a lodgepole pine forest floor amended with nitrogen and phosphorous fertilizers. Soil Biol. Biochem. 2000, 32,59–66. [CrossRef]
33. Cox, F.; Barsoum, N.; Lilleskov, E.A.; Bidartondo, M.I. Nitrogen availability is a primary determinant ofconifer mycorrhizas across complex environmental gradients. Ecol. Lett. 2010, 13, 1103–1113. [CrossRef]
34. Winsome, T.; Silva, L.C.R.; Scow, K.M.; Doane, T.A.; Powers, R.F.; Horwath, W.R. Plant-microbe interactionsregulate carbon and nitrogen accumulation in forest soils. For. Ecol. Manag. 2017, 384, 415–423. [CrossRef]
35. He, T.X.; Li, Y.P.; Zhang, F.Y.; Wang, Q.K. Effects of understory removal on soil respiration and microbialcommunity composition structure in a Chinese fir plantation. Chin. J. Plant Ecol. 2015, 39, 797–806.
36. Yin, K.; Zhang, L.; Chen, D.; Tian, Y.; Zhang, F.; Wen, M.; Yuan, C. Understory herb layer exerts strongcontrols on soil microbial communities in subtropical plantations. Sci. Rep. 2016, 6, 27066. [CrossRef]
37. Zhao, J.; Wan, S.; Li, Z.A.; Shao, Y.; Xu, G.; Liu, Z.; Zhou, L.; Fu, S. Dicranopteris-dominated understory asmajor driver of intensive forest ecosystem in humid subtropical and tropical region. Soil Biol. Biochem. 2012,49, 78–87. [CrossRef]
38. Schuldt, A.; Bruelheide, H.; Buscot, F.; Assmann, T.; Erfmeier, A.; Klein, A.-M.; Ma, K.; Scholten, T.;Staab, M.; Wirth, C.; et al. Belowground top-down and aboveground bottom-up effects structure multitrophiccommunity relationships in a biodiverse forest. Sci. Rep. 2017, 7, 4222. [CrossRef]
279

Forests 2019, 10, 338
39. Benítez, E.; Paredes, D.; Rodríguez, E.; Aldana, D.; González, M.; Nogales, R.; Campos, M.; Moreno, B.Bottom-up effects on herbivore-induced plant defences: A case study based on compositional patterns ofrhizosphere microbial communities. Sci. Rep. 2017, 7, 6251. [CrossRef]
40. Brown, S.; Lenart, M.; Mo, J.; Kong, G. Structure and Organic Matter Dynamics of a Human-Impacted PineForest in a MAB Reserve of Subtropical China. Biotropica 1995, 27, 276–289. [CrossRef]
© 2019 by the authors. Licensee MDPI, Basel, Switzerland. This article is an open accessarticle distributed under the terms and conditions of the Creative Commons Attribution(CC BY) license (http://creativecommons.org/licenses/by/4.0/).
280

Article
Effects of Phosphate Solubilizing Bacteria on theGrowth, Photosynthesis, and Nutrient Uptake ofCamellia oleifera Abel.
Fei Wu 1,2, Jianrong Li 3, Yanliu Chen 1, Linping Zhang 1,2,*, Yang Zhang 1, Shu Wang 1, Xin Shi 4,
Lei Li 5 and Junsheng Liang 5
1 Key Laboratory of State Forestry Administration on Forest Ecosystem Protection and Restoration of PoyangLake Watershed, Jiangxi Agricultural University, Nanchang 330045, China; [email protected] (F.W.);[email protected] (Y.C.); [email protected] (Y.Z.); [email protected] (S.W.)
2 2011 Collaborative Innovation Center of Jiangxi Typical Trees Cultivation and Utilization,Jiangxi Agricultural University, Nanchang 330045, China
3 South China Botanical Garden, Chinese Academy of Sciences, Guangzhou 510650, China;[email protected]
4 Research Institute of Tropical Forestry, Chinese Academy of Forestry, Guangzhou 510520, China;[email protected]
5 Hunan Academy of Forestry, Changsha 410004, China; [email protected] (L.L.); [email protected] (J.L.)* Correspondence: [email protected]; Tel.: +86-0791-8381-3243
Received: 14 March 2019; Accepted: 15 April 2019; Published: 20 April 2019
Abstract: Phosphorus (P) is a necessary nutrient for plant growth and plays an important role inplant metabolisms; however, the majority of P in soil is in insoluble forms. Phosphate solubilizingbacteria (PSB) can convert the insoluble phosphates into plant-available forms and may have thepotential for use in sustainable agricultural practices. This study examined the effects of two nativePSB, namely Bacillus aryabhattai (JX285) and Pseudomonas auricularis (HN038), and a mixture of bothstrains (1:1) on the growth of Camellia oleifera Abel. seedlings. The results showed a significantpromotion of the growth of C. oleifera plants by three inoculation treatments. All the PSB inoculationtreatments could improve the leaf nitrogen (N) and P content and had positive effects on the availableN, P, and potassium (K) content of rhizosphere soil. A co-inoculation of the two native PSB strainscaused a synergistic effect and achieved the best benefit. In conclusion, B. aryabhattai and P. auriculariscould be used as biological agents instead of chemical fertilizers for agricultural production to reduceenvironmental pollution and increase the yield of tea oil.
Keywords: phosphate solubilizing bacteria; nutrition; oil tea
1. Introduction
Phosphorus (P) is an essential nutrient for plant growth and development. Although a largeamount of P is present in soil, the majority of it is unavailable to plants [1]. In agro-forestry practices,it is a fact that many problems arise in the application of phosphate fertilizer [2]. On one hand,phosphate rock is a nonrenewable resource and may run out in 50–100 years due to anthropogenicexploitation [3]. On the other hand, about 70% of the phosphate fertilizer in soluble forms that isapplied to the soil is rapidly combined with cations such as Ca2+, Mg2+, Al3+, and Fe3+ and convertedto insoluble forms [4]. Therefore, improving the absorption and use of P by crops is of great significancefrom both the ecological and economical perspective [5].
Phosphate-dissolving microorganisms are microbial resources closely associated with plantnutrition and account for 10% of all soil microorganisms [6,7]. Phosphate solubilizing bacteria (PSB)are a group of these microorganisms that can transform insoluble P compounds into available forms
Forests 2019, 10, 348; doi:10.3390/f10040348 www.mdpi.com/journal/forests281

Forests 2019, 10, 348
by secreting organic acids, and they may be used as inoculants to enhance P availability for plants [8].In addition, they can also promote plant growth via producing hormones, such as cytokinin andindole acetic acid [9,10]. Despite some PSB present in plant rhizospheres and in soil, the amount of Preleased by these microorganisms is usually insufficient to meet the demand of growing plants [11].High-efficiency PSB have the potential for making a great contribution to the decrease of environmentalpollution and promoting ecological balance by replacing chemical fertilizers [12]. Consequently, thereis an urgent need to investigate the effects of selected high-efficiency PSB on plant nutrition and growth.
Camellia oleifera Abel. (Theaceae), a unique edible oil tree species to China, is one of the world′sfour famous woody oil plants [13]. Tea oil obtained from seeds has an unsaturated fatty acid contentof up to 90%, much higher than vegetable oil, peanut oil, and soybean oil, and contains specialphysiologically active substances, such as camellia, which have extremely high nutritional values [14].Camellia oleifera generally grows in the mountains and hills of subtropical regions in southern China andis also of great value in soil and water conservation and maintaining ecological balance [15]. However,the acid soil in southern China has a low available P content and limits the growth and productivity ofC. oleifera [16]. In our previous study, we screened two high-efficiency PSB strains (JX285 and HN038)from the rhizosphere soil of C. oleifera [17,18]. The present study’s aim was to determine the impacts ofJX285 and HN038 on the growth, photosynthesis, and nutrient uptake of C. oleifera. The results mayprovide a theoretical basis for the development of microbial fertilizers for use in agroforestry.
2. Materials and Methods
2.1. Strains, Plant Material, and Growth Medium
The two PSB strains, JX285 (Bacillus aryabhattai) and HN38 (Pseudomonas auricularis), were isolatedfrom the rhizosphere of C. oleifera in our previous experiments [17,18]. The PSB inoculum wasprepared as follows: the two PSB strains were individually grown in liquid Luria-Bertani (LB) medium(containing tryptone 10 g/L, yeast extract 5 g/L, and NaCl 10 g/L) with shaking at 180 rpm for 24 h at28 ◦C, and then the broth was centrifuged at 10,000 r/min for 10 min. The supernatant was discarded,and the pellet was re-suspended and washed with sterilized water three times. The final concentrationof PSB inoculum was adjusted to 108 colony-forming units (CFU) mL−1.
The seeds of C. oleifera were provided by the Jiangxi Academy of Forestry Research, China.The seeds were first surface sterilized with 0.3% potassium permanganate solution for 1 h and rinsedwith sterilized water three times. They were then germinated on wet gauze at 30 ◦C. The germinatedseeds were transplanted into 1 kg pots with sterilized sand. Finally, uniform seedlings were selected andtransferred to a new pot containing 3 kg of growth medium. Each pot was planted with one seedling.
The growth medium was a mixture of krasnozem soil, sand, and peat soil (6:3:1, v/v). The soilused in the experiment was collected from the campus of Jiangxi Agricultural University (China)and was sieved after being air dried (1 mm). The growth medium was autoclaved at 0.11 MPa and121 ◦C for 2 h. The basic physicochemical properties of the growth medium were as follows: pH 5.25(soil:water—1:5), 43.71 mg/kg organic matter, 94.68 mg/kg available nitrogen (N), 2.80 mg/kg availableP, and 15.80 mg/kg available potassium (K).
2.2. Experimental Design and Growth Condition
A pot experiment was conducted using a two-factor completely randomized block designcontaining five inoculation treatments and three P treatments [19]. The inoculation treatments were asfollows: inoculated with P. auricularis HN038 (T1), inoculated with B. aryabhattai JX285 (T2), inoculatedwith the mixture of HN038 and JX285 (1:1) (T3), inoculated with LB medium (CK1), and inoculatedwith sterile water (CK2). The P treatments were as follows: no phosphate fertilizer (0 g/kg), (P1),added 3 g calcium superphosphate (1 g/kg) (P2), added 6 g calcium superphosphate (2 g/kg) (P3).Each treatment contained 5 replicates. Furthermore, in order to prevent the plant grow from stoppingdue to a lack of nutrient requirements, urea and potassium nitrate were added to the soil to reach
282

Forests 2019, 10, 348
300 mg/kg N and 200 mg/kg K, respectively. The pot was placed in a greenhouse with 12 h of light perday. After five months of growth, the growth and photosynthetic parameters were measured and theseedlings were harvested.
2.3. Plant Growth Measurement
Three healthy seedlings with consistent growth were selected for each treatment to measuretheir growth parameters. A measuring tape (Swordfish, China) was used to measure the plant height.The leaves, stems, and roots were harvested and dried at 75 ◦C to a constant weight and weighed tocalculate the total biomass of each plant.
2.4. Measurement of Gas Exchange Parameters and Relative Chlorophyll Content
A LI-6400 portable photosynthesis system (Li-Cor, Lincoln, NE, USA) was used to determine thephotosynthetic parameters. When the seedlings were growing vigorously (mid-September) and thetemperature was relatively stable (09:00–11:00 am), healthy leaves in the upper part of the seedlingswere chosen to determine the net photosynthetic rate (Pn) and the transpiration rate (Tr). The wateruse efficiency (WUE) was calculated as WUE = Pn/Tr. A chlorophyll meter (SPAD-502) was used tomeasure the relative chlorophyll content of the plants. A random measurement method was usedbetween each treatment to eliminate the inevitable errors caused by different measurement times.
2.5. Measurement of Plant Nutrient and Soil Nutrient
The dry leaves were finely ground and homogenized to determine the N and P concentrations.The P content was assayed by the dry ash digestion method [20]. The N content was determined bythe Kjeldahl digestion method [21].
Samples of rhizosphere soil were collected to test the soil’s nutrient status. The N contentwas measured using the alkaline hydrolysis method [22]. The P content was determined by themolybdenum ruthenium anti-colorimetric method [23]. The K content was measured by atomicabsorption spectrometry [24].
2.6. Data Analysis
Statistical tests were performed using SPSS 13.0 (SPSS Inc., Chicago, IL, USA). A two-way ANOVAwas performed to analysis the significance of P application, the PSB inoculation treatment and theinteraction of P × PSB treatment. A one-way ANOVA was employed to examine the differences amongthe different inoculation treatments under each P level. Duncan’s multiple range test was performed atp = 0.05 in case of significant impact by factor.
3. Results
3.1. Plant Height and Biomass
The two-way ANOVA results showed that plant height and biomass were significantly (p ≤ 0.01)influenced by the interaction between P application and PSB inoculation (Table 1). The plant heightand biomass were significantly (p ≤ 0.05) improved by the single and mixed inoculation of two PSBstrains compared to the non-inoculation control under each P level (Table 1). Co-inoculated plantsshowed a greater plant height and dry weight than those of plants inoculated with single PSB strainsand non-inoculated plants. There was no significant difference in plant height and biomass betweenthe CK1 and CK2 treatments. Moreover, the degree of the increase by PSB inoculation differed to someextent under different P levels. The maximum positive effects of the PSB inoculation on plant heightand biomass were observed at the P3 level.
283

Forests 2019, 10, 348
Table 1. Effect of PSB on plant height and biomass of C. oleifera seedlings.
P Application PSB Inoculation Plant Height (cm) Biomass (g)
P1
T1 22.5 ± 0.9 b 10.13 ± 0.90 cT2 22.7 ± 1.9 b 12.00 ± 0.60 bT3 26.2 ± 1.2 a 14.27 ± 1.40 a
CK1 15.7 ± 1.2 c 6.67 ± 0.61 dCK2 17.8 ± 0.3 c 7.00 ± 0.72 d
P2
T1 34.5 ± 1.0 c 23.40 ± 1.59 cT2 36.7 ± 1.8 b 24.40 ± 0.72 bT3 37.5 ± 1.0 a 26.97 ± 1.66 a
CK1 16.5 ± 2.1 d 7.67 ± 1.01 dCK2 18.2 ± 0.9 d 7.97 ± 1.53 d
P3
T1 32.3 ± 1.5 a 15.73 ± 0.90 bT2 33.5 ± 0.9 a 16.47 ± 0.99 bT3 34.5 ± 0.8 a 19.13 ± 0.92 a
CK1 16.9 ± 1.3 b 7.24 ± 0.47 cCK2 17.9 ± 2.1 b 7.50 ± 0.95 c
Two-way ANOVA resultsP 0.00 ** 0.00 **
PSB 0.00 ** 0.00 **P × PSB 0.00 ** 0.00 **
Data are means± SD (n= 3). P: phosphorus; PSB: phosphate solubilizing bacteria; P1: no phosphate fertilizer (0 g/kg);P2: added 3 g calcium superphosphate (1 g/kg); P3: added 6 g calcium superphosphate (2 g/kg); T1: inoculated withP. auricularis HN038; T2: inoculated with B. aryabhattai JX285; T3: inoculated with the mixture of HN038 and JX285(1:1); CK1: inoculated with LB medium; CK2: inoculated with sterile water. Different lowercase letters within thesame column indicate significant differences (p ≤ 0.05). **, significant effect at p ≤ 0.01.
3.2. Gas Exchange Parameters
The Pn was significantly (p ≤ 0.05) influenced by P treatment and PSB treatment, while the Trand WUE were significantly (p ≤ 0.05) influenced by the interaction between P application and PSBinoculation (Table 2). At the same P application level, the Pn, Tr, and WUE were significantly (p ≤ 0.05)enhanced by the single and mixed inoculation of PSB strains (Table 2). The Pn, Tr, and WUE ofplants co-inoculated with B. aryabhattai and P. auricularis were higher than that of other treatments.The inoculation of single or mixed PSB strains promoted Pn and Tr more effectively at a high P level(P3 treatment), while the PSB’s best improvement effect on WUE appeared at the intermediate level(P2 treatment).
Table 2. Effect of PSB on the photosynthetic characteristics of C. oleifera leaves.
P ApplicationLevels
PSBInoculation
Pn[μmol/(m2·s)]
Tr[μmol/(m2·s)]
WUE(μmol/mmol)
SPAD
P1
T1 3.41 ± 0.07 c 2.47 ± 0.07 a 1.38 ± 0.03 b 48.40 ± 1.64cT2 3.64 ± 0.05 b 2.59 ± 0.06 a 1.40 ± 0.03 b 51.37 ± 0.64 bT3 4.48 ± 0.20 a 2.69 ± 0.09 a 1.66 ± 0.07 a 64.83 ± 2.70 a
CK1 2.46 ± 0.25 d 1.58 ± 0.09 b 1.74 ± 0.10 a 43.63 ± 2.21 dCK2 2.79 ± 0.43 d 1.73 ± 0.03 b 1.62 ± 0.23 a 44.83 ± 1.72 d
P2
T1 4.14 ± 0.35 c 2.20 ± 0.09 ab 1.88 ± 0.08 a 62.93 ± 2.40 bT2 4.73 ± 0.40 b 2.66 ± 0.07 a 1.78 ± 0.14 a 68.87 ± 1.66 aT3 5.69 ± 0.36 a 2.80 ± 0.04 a 2.03 ± 0.21 a 71.30 ± 1.64 a
CK1 2.93 ± 0.45 d 1.87 ± 0.04 b 1.56 ± 0.21 b 47.83 ± 1.50 cCK2 3.07 ± 0.36 d 1.83 ± 0.04 b 1.68 ± 0.16 b 48.31 ± 1.14 c
P3
T1 3.76 ± 0.10 c 2.37 ± 0.03 ab 1.58 ± 0.02 a 52.73 ± 2.01 cT2 3.93 ± 0.29 b 2.42 ± 0.05 a 1.62 ± 0.10 a 57.87 ± 0.40 bT3 4.82 ± 0.20 a 2.87 ± 0.06 a 1.68 ± 0.04 a 66.17 ± 2.15 a
CK1 2.89 ± 0.23 d 1.79 ± 0.07 b 1.61 ± 0.10 a 46.23 ± 1.00 dCK2 3.12 ± 0.16 d 1.90 ± 0.10 b 1.59 ± 0.02 a 47.36 ± 0.92 d
Two-way ANOVA resultsP 0.00 ** 0.03 * 0.00 ** 0.00 **
PSB 0.01 * 0.00 ** 0.01 ** 0.00 **P × PSB 0.17 NS 0.00 ** 0.17 NS 0.00 **
Data are means ± SD (n = 3). Pn: net photosynthetic rate, Tr: transpiration rate, WUE: water use efficiency, SPAD:relative chlorophyll content. Different lowercase letters within the same column indicate significant differences(p ≤ 0.05). *, significant effect at 0.01 < p ≤ 0.05; **, significant effect at p ≤ 0.01; NS, no significant effect.
284

Forests 2019, 10, 348
3.3. Chlorophyll Content
The chlorophyll content was significantly (p ≤ 0.01) influenced by the interaction between Papplication and PSB inoculation (Table 2). The single and mixed inoculations of PSB strains couldsignificantly (p ≤ 0.05) increase the chlorophyll content of leaves regardless of the amount of P appliedin the medium (Table 2). The co-inoculated plants had a higher chlorophyll content than that of eitherplants inoculated with single PSB strains or non-inoculated plants. The best promoted effect of thePSB strains on chlorophyll content was found at the intermediate P level. No significant difference inchlorophyll content was observed between the CK1 and CK2 treatments.
3.4. Nitrogen and Phosphorus Content in Leaves
The N content of the leaves was significantly (p ≤ 0.05) influenced by P treatment and PSBtreatment, while the P content of the leaves was significantly (p ≤ 0.01) influenced by the interactionbetween P treatment and PSB treatment (Table 3). The trend of the changes in the N content ofleaves was similar to that of the P content of leaves. The N and P content of the leaves increased tovarying degrees by the single and mixed inoculations of PSB strains under different P applicationlevels (Table 3). At the low (P1) and intermediate (P2) P levels, the N and P content of leaves weresignificantly increased by the PSB inoculation. The mixed inoculation of PSB strains increased theleaf N and P content more effectively than the single inoculation. However, there were no significantdifferences in the N and P content with the inoculation of PSB strains at a high P level (P3).
Table 3. Effect of PSB on the nitrogen content of C. oleifera leaves.
P Application Levels PSB Inoculation Nitrogen Content (mg/kg) Phosphorus Content (g/kg)
P1
T1 1771.36 ± 86.22 b 0.50 ± 0.03 bT2 1924.55 ± 128.97 a 0.56 ± 0.02 aT3 1989.24 ± 100.17 a 0.55 ± 0.01 a
CK1 1761.09 ± 102.14 b 0.44 ± 0.02 cCK2 1788.55 ± 85.44 b 0.46 ± 0.02 c
P2
T1 1849.29 ± 73.71 b 0.59 ± 0.03 bT2 2045.05 ± 50.33 a 0.61 ± 0.02 bT3 2122.31 ± 101.49 a 0.66 ± 0.01 a
CK1 1791.32 ± 195.53 c 0.47 ± 0.03 cCK2 1886.69 ± 52.92 b 0.48 ± 0.01 c
P3
T1 1750.58 ± 105.83 b 0.50 ± 0.04 aT2 1766.99 ± 141.89 b 0.51 ± 0.05 aT3 1973.33 ± 95.04 a 0.59 ± 0.04 a
CK1 1752.88 ± 92.92 b 0.49 ± 0.06 aCK2 1831.46 ± 83.27 b 0.51 ± 0.05 a
Two-way ANOVA resultsP 0.01 * 0.00 **
PSB 0.00 ** 0.00 **P × PSB 0.65 NS 0.01 **
Data are means ± SD (n = 3). Different lowercase letters within the same column indicate significant differences(p ≤ 0.05). *, significant effect at 0.01 < p ≤ 0.05; **, significant effect at p ≤ 0.01; NS, no significant effect.
3.5. Nitrogen, Phosphorus, and Potassium Content of Rhizosphere Soil
The soil available N content was significantly (p ≤ 0.01) influenced by P treatment and PSBtreatment (Table 4). A significant increase in the available N content was found in the treatment of theinoculated PSB strains compared to the non-inoculated control (p ≤ 0.05) (Figure 1). The maximumavailable N in the soil was found in the co-inoculated treatment under the intermediate P level.Moreover, no significant difference was observed in the available N content between the CK1 andCK2 treatments.
285

Forests 2019, 10, 348
Table 4. Results of a two-way ANOVA of the effects of phosphate solubilizing bacteria (PSB) inoculation,phosphorus (P) application and their interactions on the soil parameters.
Index P PSB P × PSB
Soil N content 0.00 ** 0.00 ** 0.06 NS
Soil P content 0.00 ** 0.00 ** 0.00 **Soil K content 0.08 NS 0.00 ** 0.00 **
**, significant effect at p ≤ 0.01; NS, no significant effect.
Figure 1. Effects of PSB on the available nitrogen content of C. oleifera. Note: Data are means ± SD(n = 3). P1: no phosphate fertilizer (0 g/kg); P2: added 3 g calcium superphosphate (1 g/kg); P3: added6 g calcium superphosphate (2 g/kg); T1: inoculated with P. auricularis HN038; T2: inoculated withB. aryabhattai JX285; T3: inoculated with the mixture of HN038 and JX285 (1:1); CK1: inoculated withLB medium; CK2: inoculated with sterile water. Different lowercase letters within the same columnindicate significant differences (p ≤ 0.05).
The results showed that the soil available P content was significantly (p ≤ 0.01) influenced by theinteraction between P treatment and PSB treatment (Table 4). Different inoculation treatments causeddifferent degrees of increase in the available P content in the soil (Figure 2). Under the intermediateand high P levels, the inoculation of single and mixed PSB strains significantly increased the content ofavailable P in the soil (p ≤ 0.05). Conversely, there were no significant differences in the available Pcontent among the inoculation treatments under a low P level (p > 0.05).
Figure 2. Effects of PSB on available phosphorus content of C. oleifera. Note: Data are means ± SD(n = 3). Different lowercase letters within the same column indicate significant differences (p ≤ 0.05).
286

Forests 2019, 10, 348
The soil available K content was significantly (p ≤ 0.01) influenced by the interaction between Ptreatment and PSB treatment and (Table 4). An inoculation of PSB strains increased the available Kcontent in the soil (Figure 3). The co-inoculated treatment had a higher available K content than singleand non-inoculation treatments under each P level.
Figure 3. Effects of PSB on the available potassium content of C. oleifera. Note: Data are means ± SD(n = 3). Different lowercase letters within the same column indicate significant differences (p ≤ 0.05).
4. Discussion
Phosphorus deficiency in soil is an important limiting factor in global agro-forestryproduction [25,26]. Some microorganisms can increase the concentration of available P by secretingorganic acids and various degrading enzymes (phytase, nuclease, phosphatase, etc.) to decomposeinsoluble phosphate in the soil [27,28]. However, these microorganisms release little P in theirnatural state [11]. Therefore, it is necessary to artificially inoculate some high-efficiency P solubilizingmicroorganisms to increase the amount of available P. In our previous experiments, we isolated nativePSB strains from the rhizosphere soil of C. oleifera and screened two strains (JX285 and HN38) with ahigh phosphorus solubilizing ability [17,18]. The results of the present study showed that the singleand mixed inoculations of JX285 and HN38 had positive effects on the growth, photosynthetic capacity,N and P content in the leaves of C. oleifera, and available N, P, and K content in the soil.
Plant growth is the most obvious characteristic for evaluating the effects of PSB [29]. In this study,the single and mixed inoculations of two native PSB strains increased the plant height and biomass ofC. oleifera, supporting the findings reported by previous studies [10,30]. This might be due to the PSBstrains of JX285 and HN38 dissolving the insoluble phosphate in the soil and enhancing the available Pcontent by producing organic acid and extracellular phosphatases [27,28]. Another possibility mightbe related to the metabolism of PSB, producing a variety of plant hormones, acids, and vitamins [30].
Plants use the light energy absorbed by chlorophyll molecules to drive photosynthesis [31].This study showed the beneficial effect of PSB inoculation on the chlorophyll content and photosyntheticcapacity of C. oleifera that is consistent with a previous observation in rice [32]. The higher Tr andWUE found in plants inoculated with PSB strains indicated that PSB improved the water statusof C. oleifera [33]. An enhancement of Tr suggested an increased water uptake capacity, providingadditional water for transpiration and improving soluble nutrient uptake [34].
Phosphorus is an essential nutrient, being a component of vital molecules in plants, and isinvolved in many metabolic processes [28]. PSB may convert insoluble P compounds into solubleforms by the processes of chelation, acidification, and exchange reactions [30]. In the current study,the increased available P content in the rhizosphere soil by inoculating PSB strains was only found inthe intermediate and high insoluble P levels, while no significant difference was observed between the
287

Forests 2019, 10, 348
inoculated and non-inoculated plants under a low P level. This may result from the uptake of P byC. oleifera for growth under a low P level, as supported by the improved leaf P content and the growthperformance of PSB under a low P level. Under a high P level, the available P released by PSB wassufficient for the plants’ growth, which led to the PSB with no effect on the leaf P concentration. PSBnot only solubilize and mineralize P from insoluble compounds but also release other nutrients [1,35].In this study, the available N and K content of rhizosphere soil and the leaf N content were promotedby the PSB inoculation, demonstrating that PSB elevated the amounts of available N, P, and K in thesoil and subsequently provided better nutrition for plant growth [36,37].
This study also found that the inoculation effect of mixed PSB strains was better than that ofsingle strains. According to previous studies, there may be a synergistic effect between differentmicroorganisms [38,39]. On one hand, the combination of different PSB strains may have a higher andmore stable cell activity than a single strain [40]. On the other hand, the combination could betterexploit the limited P sources in soil [30]. However, the mechanisms of a synergistic interaction remainto be explored.
5. Conclusions
In this study, we probed the effects of single and mixed inoculations of two native PSB strains, JX285and HN38, on the growth of C. oleifera seedlings. The results showed the positive influence of JX285 andHN38 on plant growth, photosynthetic capacity, the N and P content of the leaves, and the available N,P, and K content of rhizosphere soil. The two PSB strains in the co-inoculation acted synergisticallywith each other and strengthened the beneficial effects on plant growth performance. The use of PSBas inoculants may provide an alternative to chemical fertilizers and promote sustainable agroforestry.
Author Contributions: L.Z. conceived the idea and established the direction; F.W. wrote the first draft of themanuscript; J.L. (Jianrong Li), Y.C., S.W., Y.Z., L.L. and X.S. carried out the experiment. S.W., J.L. (Junsheng Liang),and Y.C. analyzed the data. All authors contributed with suggestions and corrections, and approved thefinal manuscript.
Funding: This research was funded by the National Natural Science Foundation of China (31660189, 31570594),and Hunan Provincial Natural Science Foundation of China (2018JJ2217, 2018JJ3281).
Conflicts of Interest: The authors declare no conflict of interest.
References
1. Oteino, N.; Lally, R.D.; Kiwanuka, S.; Lloyd, A.; Ryan, D.; Germaine, K.J.; Dowling, D.N. Plant growthpromotion induced by phosphate solubilizing endophytic Pseudomonas isolates. Front. Microbiol. 2015,6, 745. [CrossRef]
2. Ågren, G.I. Stoichiometry and nutrition of plant growth in natural communities. Annu. Rev. Ecol. Evol. Syst.2008, 39, 153–170. [CrossRef]
3. Cordell, D.; Drangert, J.O.; White, S. The story of phosphorus: Global food security and food for thought.Glob. Environ. Chang. 2009, 19, 292–305. [CrossRef]
4. Skinner, M.F.; Attiwill, P.M. The productivity of pine plantations in relation to previous land use. Plant Soil1981, 61, 329–339. [CrossRef]
5. Abbas, M.; Shah, J.A.; Irfan, M.; Memon, M.Y. Remobilization phosphorus in wheat cultivars under inducedphosphorus deficiency. J. Plant Nutr. 2018, 41, 1–12. [CrossRef]
6. Fujita, Y.; Venterink, H.O.; Van Bodegom, P.M.; Douma, J.C.; Heil, G.W.; Hölzel, N.; Jabłonska, E.; Kotowski, W.;Okruszko, T.; Pawlikowski, P.; et al. Low investment in sexual reproduction threatens plants adapted tophosphorus limitation. Nature 2013, 505, 82–86. [CrossRef]
7. Gyaneshwar, P.; Kumar, G.N.; Parekh, L.J.; Poole, P.S. Role of soil microorganisms in improving p nutritionof plants. Plant Soil 2002, 245, 83–93. [CrossRef]
8. Khan, M.S.; Zaidi, A.; Wani, P.A. Role of phosphate-solubilizing microorganisms in sustainable agriculture—Areview. Agron. Sustain. Dev. 2007, 27, 29–43. [CrossRef]
9. Coutinho, F.P.; Felix, W.P.; Yano-Melo, A.M. Solubilization of phosphates in vitro by Aspergillus spp. andPenicillium spp. Ecol. Eng. 2012, 42, 85–89. [CrossRef]
288

Forests 2019, 10, 348
10. Wang, T.; Liu, M.Q.; Li, H.X. Inoculation of phosphate-solubilizing bacteria Bacillus thuringiensis b1 increasesavailable phosphorus and growth of peanut in acidic soil. Acta Agric. Scand. 2014, 64, 252–259.
11. Collavino, M.M.; Sansberro, P.A.; Mroginski, L.A.; Aguilar, O.M. Comparison of in vitro solubilization activityof diverse phosphate-solubilizing bacteria native to acid soil and their ability to promote Phaseolus vulgarisgrowth. Biol. Fertil. Soils 2010, 46, 727–738. [CrossRef]
12. Zak, D.; Goldhammer, T.; Cabezas, A.; Gelbrecht, J.; Gurke, R.; Wagner, C.; Reuter, H.; Augustin, J.;Klimkowska, A.; Mclnnes, R. Top soil removal reduces water pollution from phosphorus and dissolvedorganic matter and lowers methane emissions from rewetted peatlands. J. Appl. Ecol. 2018, 55, 311–320.[CrossRef]
13. Ping, L.; Wang, K.; Zhou, C.; Xie, Y.; Yao, X.; Yin, H. Seed transcriptomics analysis in Camellia oleifera uncoversgenes associated with oil content and fatty acid composition. Int. J. Mol. Sci. 2018, 19, 118.
14. Lin, C.Y.; Fan, C.L. Fuel properties of biodiesel produced from Camellia oleifera Abel oil throughsupercritical-methanol transesterification. Fuel 2011, 90, 2240–2244. [CrossRef]
15. Li, J. Soil, water and nutrient Loss in young plantation of the inter-cropped tea oil (Camellia oleifera) withdifferent crops. Scientia Silvae Sinicae 2008, 44, 167–172, (In Chinese with English Abstract).
16. Huang, W.; Liu, J.; Wang, Y.P.; Zhou, G.; Han, T.; Li, Y. Increasing phosphorus limitation along threesuccessional forests in southern China. Plant Soil 2013, 364, 181–191. [CrossRef]
17. Wang, S.; Zhang, L.P.; Zhang, Y.; Hao, F.F.; Hu, D.N. Screening, identification and phosphate solubilizingcapability of phosphate solubilizing bacteria in rhizosphere of Camellia oleifera Abel at red soil region. For. Res.2015, 28, 409–416, (In Chinese with English Abstract).
18. Huang, F.L.; Zhang, Y.; Zhang, L.P.; Wang, S.; Feng, Y.; Rong, N.H. Complete genome sequence of Bacillusmegaterium JX285 isolated from Camellia oleifera rhizosphere. Comput. Biol. Chem. 2019, 79, 1–5. [CrossRef]
19. Kalavrouziotis, I.K.; Koukoulakis, P.H. Soil pollution under the effect of treated municipal wastewater.Environ. Monit. Assess. 2011, 184, 6297–6305. [CrossRef]
20. Bowman, R.A. A sequential extraction procedure with concentrated sulfuric acid and dilute base for soilorganic phosphorus. Soil Sci. Soc. Am. J. 1989, 53, 362–366. [CrossRef]
21. Wu, F.; Zhang, H.; Fang, F.; Liu, H.; Tang, M. Arbuscular mycorrhizal fungi alter nitrogen allocation in theleaves of Populus × canadensis ‘Neva’. Plant Soil 2017, 421, 477–491. [CrossRef]
22. Mcgrath, R. Protein measurement by ninhydrin determination of amino acid released by alkaline hydrolysis.Anal. Biochem. 1972, 49, 95–102. [CrossRef]
23. Pu, P.; Zhang, M.; Zhang, L.N. A study on temperature and time conditions of colorimetric method inmeasuring soil available phosphorus. Adv. Mater. Res. 2014, 838–841, 2047–2051. [CrossRef]
24. Billings, G.K. The determination of potassium in oil field brines by atomic absorption spectrometry: Geologicalnote. Clin. Infect. Dis. 1965, 13, 532–534.
25. Turner, B.L.; Brenes-Arguedas, T.; Condit, R. Pervasive phosphorus limitation of tree species but notcommunities in tropical forests. Nature 2018, 555, 367–370. [CrossRef] [PubMed]
26. Nikolic, N.; Kostic, L.; Djordjevic, A.; Nikolic, M. Phosphorus deficiency is the major limiting factor for wheaton alluvium polluted by the copper mine pyrite tailings: A black box approach. Plant Soil 2011, 339, 485–498.[CrossRef]
27. Parekh, L.J.; Gyaneshwar, P.; Kumar, G.N.; Archana, G.; Poole, P.S.; Collins, M.D.; Hutson, R.A.Involvement of a phosphate starvation inducible glucose dehydrogenase in soil phosphate solubilization byEnterobacter asburiae. FEMS Microbiol. Lett. 1999, 171, 223–229.
28. Bashan, Y.; Kamnev, A.A.; de-Bashan, L.E. A proposal for isolating and testing phosphate-solubilizingbacteria that enhance plant growth. Biol. Fertil. Soils 2013, 49, 1–2. [CrossRef]
29. Ashmore, M.R. Assessing the future global impacts of ozone on vegetation. Plant Cell Environ. 2005, 28,949–964. [CrossRef]
30. Yu, X.; Liu, X.; Zhu, T.H.; Liu, G.H.; Mao, C. Isolation and characterization of phosphate-solubilizing bacteriafrom walnut and their effect on growth and phosphorus mobilization. Biol. Fertil. Soils 2011, 47, 437–446.[CrossRef]
31. Wu, F.; Zhang, H.; Fang, F.; Tang, M. Nutrient allocation and photochemical responses of Populus × canadensis‘Neva’ to nitrogen fertilization and exogenous Rhizophagus irregularis inoculation. Acta Physiol. Plant. 2018,40, 152. [CrossRef]
289

Forests 2019, 10, 348
32. Panhwar, Q.A.; Radziah, O.; Zaharah, A.R.; Sariah, M.; Razi, I.M. Role of phosphate solubilizing bacteria onrock phosphate solubility and growth of aerobic rice. J. Environ. Biol. 2011, 32, 607–612. [PubMed]
33. Wu, F.; Zhang, H.; Fang, F.; Wu, N.; Zhang, Y.; Tang, M. Effects of nitrogen and exogenous Rhizophagusirregularis on the nutrient status, photosynthesis and leaf anatomy of Populus × canadensis ‘Neva’. J. PlantGrowth Regul. 2017, 36, 824–835. [CrossRef]
34. Brodribb, T.J.; Field, T.S.; Jordan, G.J. Leaf maximum photosynthetic rate and venation are linked byhydraulics. Plant Physiol. 2007, 144, 1890–1898. [CrossRef] [PubMed]
35. Prodhan, M.A.; Finnegan, P.M.; Lambers, H. How does evolution in phosphorus-impoverished landscapesimpact plant nitrogen and sulfur assimilation? Trends Plant Sci. 2019, 24, 69–82. [CrossRef] [PubMed]
36. Kerkhoff, A.J.; Fagan, W.F.; Elser, J.J.; Enquist, B.J. Phylogenetic and Growth Form Variation in the Scaling ofNitrogen and Phosphorus in the Seed Plants. Am. Nat. 2006, 168, E103–E122. [CrossRef]
37. Diao, C.P.; Wang, Z.H.; Li, S.S.; Liu, L.; Wang, S.; Huang, N. Differences in grain nitrogen contents ofhigh-yielding wheat cultivars and relation to NPK uptake and utilization in drylands. J. Plant Nutr. Fertil.2018, 24, 285–295.
38. Bayer, A.S.; Chow, A.W.; Morrison, J.O.; Guze, L.B. Bactericidal synergy between Penicillin or Ampicillinand aminoglycosides against antibiotic-tolerant lactobacilli. Antimicrob. Agents Chemother. 1980, 17, 359–363.[CrossRef]
39. Kiratisin, P.; Apisarnthanarak, A.; Kaewdaeng, S. Synergistic activities between carbapenems andother antimicrobial agents against Acinetobacter baumannii including multidrug-resistant and extensivelydrug-resistant isolates. Int. J. Antimicrob. Agents 2010, 36, 243–246. [CrossRef]
40. Rudresh, D.L.; Shivaprakash, M.K.; Prasad, R.D. Effect of combined application of rhizobium, phosphatesolubilizing bacterium and Trichoderma spp. on growth, nutrient uptake and yield of chickpea(Cicer aritenium L.). Appl. Soil Ecol. 2005, 28, 139–146. [CrossRef]
© 2019 by the authors. Licensee MDPI, Basel, Switzerland. This article is an open accessarticle distributed under the terms and conditions of the Creative Commons Attribution(CC BY) license (http://creativecommons.org/licenses/by/4.0/).
290

MDPISt. Alban-Anlage 66
4052 BaselSwitzerland
Tel. +41 61 683 77 34Fax +41 61 302 89 18
www.mdpi.com
Forests Editorial OfficeE-mail: [email protected]
www.mdpi.com/journal/forests


MDPI St. Alban-Anlage 66 4052 Basel Switzerland
Tel: +41 61 683 77 34 Fax: +41 61 302 89 18
www.mdpi.com ISBN 978-3-03936-757-3