
GENERATOR USAGE ANALYSIS AND EVALUATION ON ...
95
BACHELOR THESIS AND COLLOQUIUM ME 141502 GENERATOR USAGE ANALYSIS AND EVALUATION ON SUCESS VICTORY XXXIV HIKARI QURRATA’AIN NURHADI NRP: 4213 101 043 Supervisors: Ir. Sardono Sarwito, M.Sc. Dr. Eddy Setyo Koenhardono, S.T., M.Sc. DOUBLE DEGREE PROGRAM OF MARINE ENGINEERING DEPARTMENT FACULTY OF MARINE TECHNOLOGY INSTITUT TEKNOLOGI SEPULUH NOPEMBER SURABAYA 2017
-
Upload
khangminh22 -
Category
Documents
-
view
0 -
download
0
Transcript of GENERATOR USAGE ANALYSIS AND EVALUATION ON ...

BACHELOR THESIS AND COLLOQUIUM
ME 141502
GENERATOR USAGE ANALYSIS AND EVALUATION ON SUCESS
VICTORY XXXIV
HIKARI QURRATA’AIN NURHADI
NRP: 4213 101 043
Supervisors:
Ir. Sardono Sarwito, M.Sc.
Dr. Eddy Setyo Koenhardono, S.T., M.Sc.
DOUBLE DEGREE PROGRAM OF MARINE ENGINEERING DEPARTMENT
FACULTY OF MARINE TECHNOLOGY
INSTITUT TEKNOLOGI SEPULUH NOPEMBER
SURABAYA 2017


BACHELOR THESIS AND COLLOQUIUM
ME 141502
ANALISA DAN EVALUASI PENGGUNAAN GENERATOR PADA MT
SUCCESS VICTORY XXXIV
HIKARI QURRATA’AIN NURHADI
NRP: 4213 101 043
Dosen Pembimbing:
Ir. Sardono Sarwito, M.Sc.
Dr. Eddy Setyo Koenhardono, S.T., M.Sc.
DEPARTEMEN TEKNIK SISTEM PERKAPALAN PROGRAM GELAR GANDA
FAKULTAS TEKNOLOGI KELAUTAN
INSTITUT TEKNOLOGI SEPULUH NOPEMBER
SURABAYA 2017


i
VALIDATION SHEET
GENERATOR USAGE ANALYSIS AND EVALUATION ON MT SUCCESS
VICTORY XXXIV 6780 DWT
BACHELOR THESIS
Submitted to Complete One of Requirement of Bachelor Engineering Degree
on
Laboratory of Marine Electrical and Automation System (MEAS)
Double Degree (S-1) in Marine Engineering Program
Faculty of Marine Technology
Institut Teknologi Sepuluh Nopember
Prepared by:
HIKARI QURRATA’AIN NURHADI
NRP. 4213 101 043
Approved by Bachelor Thesis Supervisors:
1. Ir. Sardono Sarwito, M.Sc. .............
2. Dr. Eddy Setyo Koenhardono, S.T., M.Sc. .............
SURABAYA
JULY, 2017

ii
“This page intentionally left blank”
iii
VALIDATION SHEET
GENERATOR USAGE ANALYSIS AND EVALUATION ON MT SUCCESS
VICTORY XXXIV 6780 DWT
BACHELOR THESIS
Submitted to Complete One of Requiremet of Bachelor Engineering Degree
on
Laboratory of Marine Electrical and Automatical System (MEAS)
Double Degree (S-1) in Marine Engineering Program
Faculty of Marine Technology
Institut Teknologi Sepuluh Nopember
Prepared by:
HIKARI QURRATA’AIN NURHADI
NRP. 4213 101 043
Approved by Chief Department:
1. Dr. Eng. M. Badrus Zaman, S.T, . .............
SURABAYA
JULI, 2017

iv
“This page intentionally left blank”

v
GENERATOR USAGE ANALYSIS AND EVALUATION ON MT SUCCESS
VICTORY XXXIV 6780 DWT
BACHELOR THESIS
Submitted to Complete One of Requiremet of Bachelor Engineering Degree
on
Laboratory of Marine Electrical and Automatical System (MEAS)
Double Degree (S-1) in Marine Engineering Program
Faculty of Marine Technology
Institut Teknologi Sepuluh Nopember
Prepared by:
HIKARI QURRATA’AIN NURHADI
NRP. 4213 101 043
Approved by Representative Hochscule Wismar in Indonesia:
1. Dr.-Ing Wolfgang Busse .............
SURABAYA
JULI, 2017

vi
“This page intentionally left blank”

vii
DECLARATION OF HONOR
I, who signed below hereby confirm that:
This bachelor thesis report has written without any plagiarism act, and
confirm consciously that all the data, concepts, design, references, and material
in this report own by Marine Electrical and Automatical System (MEAS) in
Department of Marine Engineering ITS which are the product of research study
and reserve the right to use for further research study and its development.
Name : Hikari Qurrata’ain Nurhadi
NRP : 4213 101 043
Bachelor Thesis Title : Generator Usage Analysis and Evaluation on MT
SUCCESS VICTORY XXXIV 6780 DWT
Department : Double Degree Program in Marine Engineering
If there is plagiarism act in the future, I will fully responsible and receive the
penalty given by ITS according to the regulation applied.
Surabaya, July 2017
Hikari Qurrata’ain Nurhadi

viii
“This page intentionally left blank”

ix
GENERATOR USAGE ANALYSIS AND EVALUATION ON MT SUCCESS
VICTORY XXXIV 6780 DWT
Name : Hikari Qurrata’ain Nurhadi
NRP : 4213 101 043
Department : Marine Engineering
Supervisors : Ir. Sardono Sarwito, M.Sc.
Dr. Eddy Setyo Koenhardono, S.T., M.Sc.
ABSTRACT
The generator is the main power supply of electricity in the ship. The generator
can supply each ship’s electricity consumer regarding the generator capacity and
consumer requirement. Generators can provide the electrical needs of equipment
requiring power on board according to their capacity. The generator which
installed on the vessel has a complicated calculation phase in order to get the
best efficiency on the ship MT SUCCESS VICTORY XXXIV. However, after having a
long period of about 15 years and there are different factors between the State of
Indonesia and Japan (the origin of shipbuilding), so the power capacity used is not
the same as the first time when the ship is operated.
This thesis analyzes and evaluates the usage of the generator on the MT SUCCESS
VICTORY XXXIV. In this study, observations were made on the switchboard panel
inside the Engine Control Room to see the power usage in 4 conditions on the
ship: sailing, maneuver, loading and unloading, and anchoring. Besides observing
the usage of power., current, frequency, and voltage also recorded their outputs.
The study includes load factors on each condition and cos φ on calculations which
contains in the switchboard panel, also the observations on the use of continuous
and intermittent loads on the power calculation table.
The results obtained are if it viewed from the load factor and cos φ, there is a
different load factor reduction and power reduction. in each condition when
compared with the first design the highest load factor in each condition are, 43%
for sailing condition become 33,2%, 69% for maneuvering condition become
46,3%, 89,1% for loading/discharging condition become 42,75%, and 18,6% for
anchoring condition became 14,6% . In addition, the highest Power capacity is
712.8 kVA and it compares with the highest power capacity in actual condition is
537.5 kVA. There is a gap in power capacity between design and actual condition

x
that has 175.3 kVA, this is because of many different factors such as weather,
temperature, climate and different sea areas in Indonesia with Japan as a
shipbuilding vessel of MT SUCCESS VICTORY XXXIV. In addition, there are unused
equipment and transmutation of continuous loads and intermittent loads if the
ship is in Indonesia areas because of the factors that have mentioned
above.Keywords: Generator, Load Factor, Cos Φ, Continuous Load,
Intermittent Load
xi
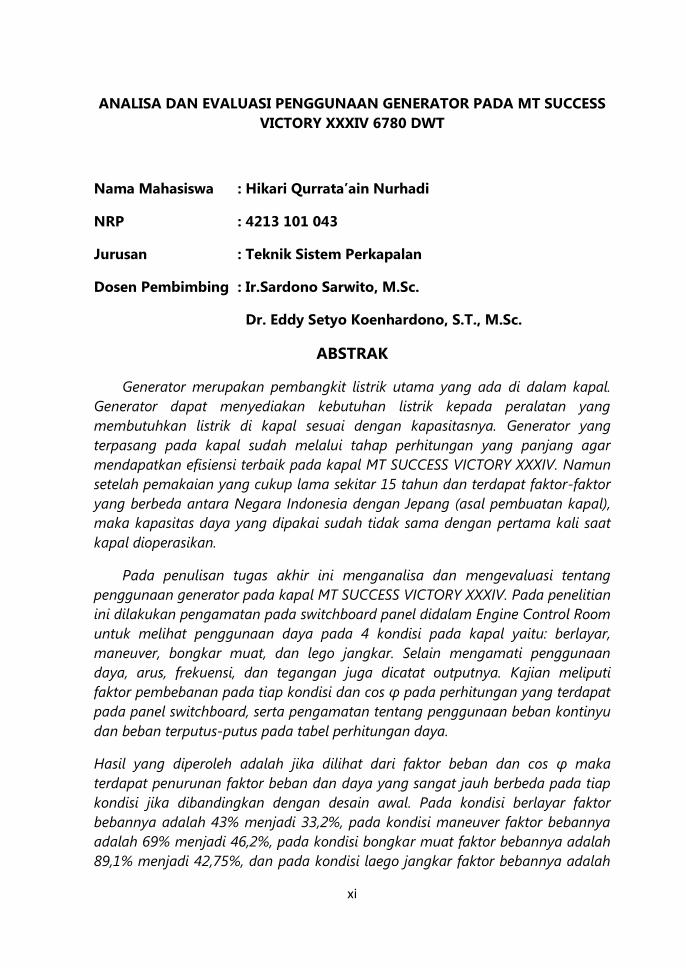
ANALISA DAN EVALUASI PENGGUNAAN GENERATOR PADA MT SUCCESS
VICTORY XXXIV 6780 DWT
Nama Mahasiswa : Hikari Qurrata’ain Nurhadi
NRP : 4213 101 043
Jurusan : Teknik Sistem Perkapalan
Dosen Pembimbing : Ir.Sardono Sarwito, M.Sc.
Dr. Eddy Setyo Koenhardono, S.T., M.Sc.
ABSTRAK
Generator merupakan pembangkit listrik utama yang ada di dalam kapal.
Generator dapat menyediakan kebutuhan listrik kepada peralatan yang
membutuhkan listrik di kapal sesuai dengan kapasitasnya. Generator yang
terpasang pada kapal sudah melalui tahap perhitungan yang panjang agar
mendapatkan efisiensi terbaik pada kapal MT SUCCESS VICTORY XXXIV. Namun
setelah pemakaian yang cukup lama sekitar 15 tahun dan terdapat faktor-faktor
yang berbeda antara Negara Indonesia dengan Jepang (asal pembuatan kapal),
maka kapasitas daya yang dipakai sudah tidak sama dengan pertama kali saat
kapal dioperasikan.
Pada penulisan tugas akhir ini menganalisa dan mengevaluasi tentang
penggunaan generator pada kapal MT SUCCESS VICTORY XXXIV. Pada penelitian
ini dilakukan pengamatan pada switchboard panel didalam Engine Control Room
untuk melihat penggunaan daya pada 4 kondisi pada kapal yaitu: berlayar,
maneuver, bongkar muat, dan lego jangkar. Selain mengamati penggunaan
daya, arus, frekuensi, dan tegangan juga dicatat outputnya. Kajian meliputi
faktor pembebanan pada tiap kondisi dan cos φ pada perhitungan yang terdapat
pada panel switchboard, serta pengamatan tentang penggunaan beban kontinyu
dan beban terputus-putus pada tabel perhitungan daya.
Hasil yang diperoleh adalah jika dilihat dari faktor beban dan cos φ maka
terdapat penurunan faktor beban dan daya yang sangat jauh berbeda pada tiap
kondisi jika dibandingkan dengan desain awal. Pada kondisi berlayar faktor
bebannya adalah 43% menjadi 33,2%, pada kondisi maneuver faktor bebannya
adalah 69% menjadi 46,2%, pada kondisi bongkar muat faktor bebannya adalah
89,1% menjadi 42,75%, dan pada kondisi laego jangkar faktor bebannya adalah

xii
18,6% menjadi 14,6%. Selain itu, kapasitas daya tertinggi adalah 712.8 kVA dan
dibandingkan dengan kapasitas daya sekarang adalah 537.5 kVA. Ada
perbedaan daya antara desain pertama dengan kondisi sekarang sebesar 175.3
kVA. Ini dikarenakan banyak faktor yang berbeda dari segi cuaca, temperature,
iklim dan area laut yang berbeda di Indonesia dengan Jepang sebagai tempat
pembuatan kapal MT SUCCESS VICTORY XXXIV. Selain itu, terdapat peralatan
yang tidak digunakan dan perubahan bebankontinyu dan beban teputus-putus
jika kapal berada di Indonesia karena faktor-faktor yang sudah disebutkan
diatas.
Kata Kunci: Generator, Faktor beban, Cos Φ, Beban Kontinyu, Beban
Terputus-putus

xiii
PREFACE
All praise and gratitude author said to the presence of God Almighty,
Allah SWT, who has given grace, pleasure, and His guidance so that I can finish
the bachelor thesis report completely.
In progress to finish this bachelor thesis report, the author would like to
thank those who have helped to complete this final project report, including :
1. My Lovely Father H. Agus Nurhadi M.Eng and My Lovely Mother Hj. Siti
Kholifah S.E who always never stop give me great supports in physical,
spiritual, and material.
2. My Lovely Older Sister Maryanna Istiqomah Pratiwi, S.Si and My little
Brother Fadhil Fadlurrahman Nurhadi and Aqil Rabbani Nurhadi who
always pray for me and give me supports to finish this Bachelor thesis.
3. Mr. Dr. Eng. M. Badrus Zaman, S.T, as a Chief Department of Marine
Engineering, Faculty of Marine Technology ITS.
4. Mr. Ir. Sardono Sarwito, M.Sc and Mr. Dr. Eddy Setyo Koenhardono, S.T.,
M.Sc. as supervisor of my bachelor thesis at Marine Engineering
Department, Faculty of Marine Technology ITS.
5. Mr. Sutopo Purwono Fitri ST., M.Eng., Ph.D. as a supervisor of my college
life for at least 8 semester / 4 years at Marine Engineering Department,
Faculty of Marine Technology ITS.
6. Mr. Ir. Dwi Priyanta, M.S.E. as a Double Degree supervisor of my college
life for at least 8 semester / 4 years at Marine Engineering Department,
Faculty of Marine Technology ITS.
7. KANS JATIM Squad as a my big family when we struggle together in
Surabaya.
8. All the families of BARAKUDA `13 and P 53 who are pleased to share
information to complete this final project.
9. All the families of Double Degree Marine Engineering Batch 2013, thanks
for being part of my college life for at least 4 years.
10. All the families of the Laboratory of "Marine Electrical and Automation
System (MEAS)", neither Lab technicians nor members who have given
the spirit and knowledge transfer during complete this final project
report.
11. All of the people that can not mention one - one and has helped me to
finish the final project report completely.

xiv
Finally, I hope this final project report can be useful, especially for me and
generally for readers. I as the author apologize if there are errors in the making,
writing sentences, use of language and so on. Because the error was coming
from myself and the truth that belongs only to God Almighty.
Surabaya, July 2017

xv
Contents VALIDATION SHEET ........................................................................................................ i
ABSTRACT ...................................................................................................................... ix
PREFACE ....................................................................................................................... xiii
Contents ......................................................................................................................... xv
List of Tables ................................................................................................................ xvii
List of Figures ............................................................................................................. xviii
CHAPTER I
INTRODUCTION ........................................................................................................... xx
1.1 Background ........................................................................................................... 1
1.2 Problem Formulations ............................................................................................. 1
I.3 Limitation problem: .............................................................................................. 2
I.4 Aims: ....................................................................................................................... 2
I.5 Benefits: .................................................................................................................. 2
CHAPTER II
THEORITICAL FRAMEWORK ......................................................................................... 3
2.1 Ship Electrical System Arrangement.................................................................. 3
2.2 Generator .............................................................................................................. 4
2.2.1 Synchronus AC Generator ............................................................................ 4
2.2.2 Construction .................................................................................................. 5
2.3 Observating Generator ........................................................................................ 6
2.3.1 Kind of Ship Condition ................................................................................. 6
2.3.2 Diversity Factor .............................................................................................. 7
2.3.3 Load Factor .................................................................................................... 7
2.3.4 Formula .................................................................................................... 9
2.3.5 Tolerance Voltage and Frequency in Ship ............................................... 11
CHAPTER III
RESEARCH METHOD .................................................................................................... 13
xvi
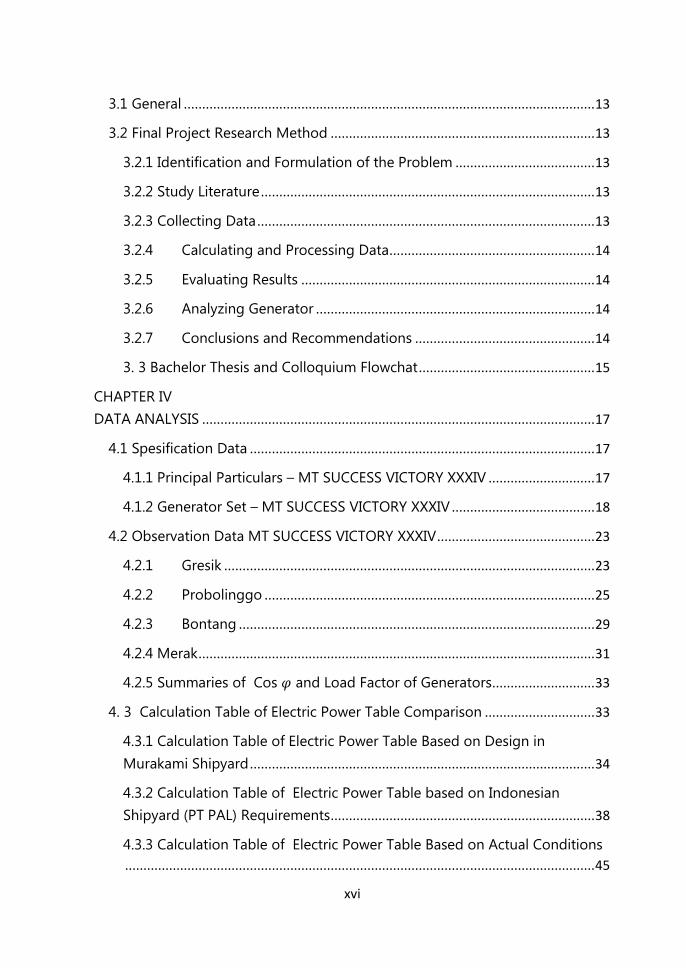
3.1 General ................................................................................................................ 13
3.2 Final Project Research Method ........................................................................ 13
3.2.1 Identification and Formulation of the Problem ...................................... 13
3.2.2 Study Literature ........................................................................................... 13
3.2.3 Collecting Data ............................................................................................ 13
3.2.4 Calculating and Processing Data ........................................................ 14
3.2.5 Evaluating Results ................................................................................ 14
3.2.6 Analyzing Generator ............................................................................ 14
3.2.7 Conclusions and Recommendations ................................................. 14
3. 3 Bachelor Thesis and Colloquium Flowchat ................................................ 15
CHAPTER IV
DATA ANALYSIS ........................................................................................................... 17
4.1 Spesification Data .............................................................................................. 17
4.1.1 Principal Particulars – MT SUCCESS VICTORY XXXIV ............................. 17
4.1.2 Generator Set – MT SUCCESS VICTORY XXXIV ....................................... 18
4.2 Observation Data MT SUCCESS VICTORY XXXIV ........................................... 23
4.2.1 Gresik ..................................................................................................... 23
4.2.2 Probolinggo .......................................................................................... 25
4.2.3 Bontang ................................................................................................. 29
4.2.4 Merak ............................................................................................................ 31
4.2.5 Summaries of Cos and Load Factor of Generators ............................ 33
4. 3 Calculation Table of Electric Power Table Comparison .............................. 33
4.3.1 Calculation Table of Electric Power Table Based on Design in
Murakami Shipyard .............................................................................................. 34
4.3.2 Calculation Table of Electric Power Table based on Indonesian
Shipyard (PT PAL) Requirements ........................................................................ 38
4.3.3 Calculation Table of Electric Power Table Based on Actual Conditions
................................................................................................................................ 45

xvii
4.4 Evaluation of Generator ................................................................................... 49
4.4.1 Comparison Based on Power .............................................................. 49
4.4.2 Comparison Based on Load Factor ........................................................... 50
4.4.3 Final Evaluation ........................................................................................... 52
CHAPTER V
CONCLUSION ............................................................................................................... 53
5.1 Conclusion .......................................................................................................... 53
5.2 recommendation ................................................................................................ 53
Bibliography ................................................................................................................ 55
ATTACHMENT ............................................................................................................... 57
The port of Gresik ................................................................................................ 57
ATTACHMENT B ................................................................................................... 59
The port of Probolinggo ..................................................................................... 59
ATTACMENT C ...................................................................................................... 63
The port of Bontang ............................................................................................ 63
ATTACHMENT D ................................................................................................... 69
The port of Merak ................................................................................................ 69
List of Tables
Table 2. 1 Load Factor Table .......................................................................................... 8
Table 2. 2 Voltage and Frequency for AC Distribution Systems ............................ 12
Table 2. 3 Voltage Variation for DC Distribution Systems ...................................... 12
Table 2. 4 Voltage Variations for Battery Systems ................................................... 12
Table 4. 1 Calculation Power Table from Murakami Shipyard ............................... 19
Table 4. 2 Required Electric Power Table Based on Design in Murakami Shipyard
........................................................................................................................................ 34
Table 4. 3 Required electric power Table based on Indonesian Shipyard (PT PAL)
Requirements ................................................................................................................ 38

xviii
Table 4. 4 Required Electric Power Table based on Indonesian Shipyard (PT PAL)
Requiremets with Actual Condition’s Load Factor ................................................... 41
Table 4. 5 Requiered Power Table based on actual condition ............................... 45
Table 4. 6 Power Capacity Based on Switchboard’s Panel ...................................... 49
Table 4. 7 Comparison Load Factor based on Switchboard’s Panel ...................... 52
List of Figures
Figure 2. 1 Schematic Diagram of Ship Electrical System ......................................... 3
Figure 2. 2 Sycnchronus AC Generator Characteristic ............................................... 4
Figure 2. 3 Construction AC Generator ....................................................................... 6
Figure 3. 1 Bachelor Thesis and Colloquium Flowchart .......................................... 15
Figure 4. 1 MT SUCCESS VICTORY XXXIV ................................................................. 17
Figure 4. 2 Wiring Diagram of MT SUCCESS VICTORY XXXIV ................................ 18
Figure 4. 3 Specs of Generator ................................................................................... 22
Figure 4. 4 Graphic of Cos and Load Factor Generator No.1 and 2 in
Discharging Condition ................................................................................................. 24
Figure 4. 5 Graphic of Cos and Load Factor Generator No.1 in Anchoring
Condition ....................................................................................................................... 24
Figure 4. 6 Graphic of Cos and Load Factor Generator No.1 and 2 in
Maneuvering Condition .............................................................................................. 25
Figure 4. 7 Graphic of Cos and Load Factor Generator No.2 in Sailing
condition ....................................................................................................................... 26
Figure 4. 8 Graphic of Cos and Load Factor Generator No.1 in anchoring
condition ....................................................................................................................... 26
Figure 4. 9 Graphic of Cos and Load Factor Generator No.2 in Anchoring
condition ....................................................................................................................... 27
Figure 4. 10 Graphic of Cos and Load Factor Generator Generator No.1 and 2
in Discharging Condition ............................................................................................ 28
Figure 4. 11 Graphic of Cos and Load Factor Generator No.1 and 2 in
Maneuvering Condition .............................................................................................. 28
Figure 4. 12 Graphic of Cos and Load Factor Generator No.1 and 2 in Sailing
Condition ....................................................................................................................... 29
Figure 4. 13 Graphic of Cos and Load Factor Generator No.1 and 2 in
Anchoring condition (switched when 24 hours running) ....................................... 30

xix
Figure 4. 14 Graphic of Cos and Load Factor Generator No.1 in Loading
Condition ....................................................................................................................... 30
Figure 4. 15 Graphic of Cos and Load Factor Generator No.1 and 2 in
Maneuvering Condition .............................................................................................. 31
Figure 4. 16 Graphic of Cos and Load Factor Generator No.1 and 2 in Sailing
condition (Switched Every 12 hours) ......................................................................... 32
Figure 4. 17 Graphic of Cos and Load Factor Generator No.1 and 2 in
Maneuvering Condition .............................................................................................. 32

xx
“This page intentionally left blank”

1
CHAPTER I
INTRODUCTION
1.1 Background
Two-thirds of the Earth is sea area. The maritime industry is needed to
support the State's economy. The most important thing in the maritime industry
is a ship. The suitable and correctable calculation of ships arrangement can
improve the efficiency of machinery, electrical, construction, and load space.
The way to improve the efficiency of the electricity system is the suitable and
correctable electrical arrangement to reduce the cost of purchasing equipment
when all of plans on ship is ready.
The electrical system is the category of a main system on the ship
because it is a system that serves to operate almost the entire performance on
ships such as sailing, maneuvering, loading and discharging, and anchoring. To
set the system itself (generator) normally, it is controlled by the crews of ship in
the engine control room, but now it is already automated for using automation
systems on ships.
The Generator is a major source of the electrical system of the ship.
Ships need a generator which is paralleled with another generator to give
power a variety of required equipment with the amount of load that will be
used by the ship. Besides the main generator, that there is also an emergency
generator is usually used when the main generator is not working or when the
ship is on blackout condition.
1.2 Problem Formulations
Based on the description of the background on which was submitted,
so there are several issues, among others:
1. How about the values of the power generator in SUCCESS VICTORY
XXXIV?
2. How about the conditions of the generator in SUCCESS VICTORY
XXXIV?
3. Is it has already suitable condition with regulation in the electrical
system in the ship?
4. How to optimize the power of generator after re-constructing the
calculation?

2
I.3 Limitation problem:
1. This analysis takes the data focus on the power of generator, current,
voltage, and frequency.
2. This analysis data will be held on the MT SUCCESS VICTORY XXXIV.
3. This data will be taken based on four condition of ship: Sailing,
Maneuvering, Loading and Discharging, and Anchoring.
4. This data will be taken every single condition when generator
distributes the power.
I.4 Aims:
This thesis aims to:
1. Know the power capacity value in real condition on the ship.
2. Know the power capacity value in design of MT SUCCESS VICTORY
XXXIV.
3. Evaluate the condition of the generator on the ship.
4. Compare the value of power generator on ship with first design, real
condition, and Indonesian Shipyard (PT PAL) requirements.
I.5 Benefits:
Benefits to be gained from this final project are:
1. Giving the knowledge about the generator in the ship.
2. Giving the assessment about condition of generator.
3. Can be a reference to the owner for optimizing generator after being
evaluated.

3
CHAPTER II
THEORITICAL FRAMEWORK
2.1 Ship Electrical System Arrangement
The main function in Ship Electrical System is to distributing all of the
electrical items in ship with safe conditions. Swithcboad is the important
element in distributing power because it contains the panels and main board to
supplies power to motors group. Transformers, Fuse, Circuit Breakers placed in
strategically Ship Electrical System to disconnect circuit if there was fault in the
systems.
Based on regulation, the main switchboard placed in Engine Control
Room to monitor the power distribution for electrical items on ship. The
engineer must know the knowledge about power distribution on ship. To know
about power distribution on ship, engineer have to study the ship's power
diagrams. Almost all oceangoing ships have an A.C. distribution system in
preference to a direct current D.C. system. This system usually adapted with
shore practiceand also allows normal industrial equipment to be used after
being adapted and certified where and if necessary, so it can withstand the
conditions on board of a ship (e.g. vibration, freezing and tropical temperatures,
humidity, the salty atmosphere, etc. encountered in various parts of the ship).
(MAES, 2013)
Figure 2. 1 Schematic Diagram of Ship Electrical System
(Source: Practical Marine Electrical Knowledge, 1999)

4
Synchronous generator always used in marine application to distributing
high voltage in electrical system in ship. Synchronous machines are excited by
direct current. In all but very small generators the rotor is the exiter of the
generator. The direct current can be supplied to the rotor from an external
exciting device via slip rings (brushed excitation) or via a small AC generator
and rectifier on the rotor shaft (brush-less excitation). An automatic voltage
regulator (AVR) controls de exciting current. The AVR keeps the generators
voltage in the set value, regardless of changes in load, temperature and
frequency. (MAES, 2013)
2.2 Generator
2.2.1 Synchronus AC Generator
A rotating field and with the armature windings on the stationary frame
usually exist in Synchronous a.c. generators. Inverted constructions are also
available and in this type the armature is rotating. But it has aimitations in the
size and complexity of the sliprings and brushgear limit the inverted
construction to about 150 kV A, so the generator must be paralleled with
another generator to increase the power. (Watson, 1957)
Figure 2. 2 Sycnchronus AC Generator Characteristic
(Source: Practical Marine Elecrical Knowledge, 1999)
The salient-pole type is familiar on generator usage for marine
application, in which the field poles will be similar to those of a d.c. generator
and projecting towards the air gap. Alternatively, generators of the non-salient

5
or cylindrical construction with distributed field windings embedded in slots
may be used. The cylindrical type is generally used in high-speed
turbogenerators. (Watson, 1957)
2.2.2 Construction
The two main parts of any rotating a.c. machine are its stator and rotor.
The fabricated steel stator frame supports the stator core and its three phase
windings. The stator core is assembled from laminated steel with the windings
housed in slots around the inner periphery of the cylindrical core.
The rotor of a main a.c. generator provides the field excitation from its
electromagnetic poles. The shaft bearings of large generators (and motors) are
usually insulated to prevent stray currents from circulating through.
To prevent the flow of shaft current, one bearing (usually the non-drive
end) is electricallv isolated from earth bv a thin layer of insulating material
beneath the bearing pedestal. The pedestal holding-down bolts must also be
insulated by suitable sleeving The rotor poles are supplied with direct current
(d.c.) from an exciter.
To eliminate the maintenance problems associated with rotating
contacts, a brushless arrangement is usual for marine generators. All brush gear,
commutators and slip rings are eliminated by using an a.c. exciter with its
output being rectified by shaft-mounted silicon diodes.
Power losses, typically 10% of the generator rating, cause internal
heating in the windings and magnetic cores of both rotor and stator. This heat
must be continuously transferred out of the generator io prevent excessive
temperature rise causing breakdown of winding insulation
Cooling air is forced through ventilation ducts in the stator core,
between rotor poles and through the air gap (a few millimetres) between stator
and rotor. Water cooling of the circulating air may also be used for generators
with a large power rating. Temperature detectors (resistance type, thermistors
or thermocouples) are used to monitor the temperature of stator windings,
bearings and the cooling air/water of the generator. Single or grouped
temperature alarms are activated at the main watchkeeping position. While the
generator is stopped during standby or maintenance periods, low power
electric heaters within the machine prevent internal condensation forming on
the winding insulation.
(Hall, 1999)

6
Figure 2. 3 Construction AC Generator
(Source: Practical Marine Electrical Knowledge, 1999)
2.3 Observating Generator
There are some things that must be considered in evaluating the
generator on a ship:
2.3.1 Kind of Ship Condition
1. Sailing: when the ship was sailing many requirements that use on the
ship because this condition is the ship's longest operation and this
condition as a reference to calculate the capacity of the generator.
(Sarwito, 1995)
2. Maneuvering: To know how much the power of generator that used
when the ship making some movements, in this case, balancer and
blower may possible to use. (Sarwito, 1995)
3. Loading and Discharging: This Condition may utilize the highest power
of generator on ship like turning gear, cargo gear, pump, etc. (Sarwito,
1995)
4. Anchoring: To know how much the power of generator that used when
the ship was anchoring. (Sarwito, 1995)

7
2.3.2 Diversity Factor
The electrical equipment on the ship has a specific character for its load.
Several diversity of equipments are rarely used at the same time and
continuously at a certain period. These inequalities need to be considered to
calculate the capacity of the generator. Types of the load in the operation of
electrical equipment on board consist of:
1. Continuous load: equipments to operate continuously at four conditions
of the ship. Which belong to equipment are off the lights, air
conditioning systems, pumps for CPP, and others.
2. Intermittent load: equipment in operation do not continuously operate
at four conditions of the ship but periodically work with the period, for
example fuel transfer pumps, fresh water pumps, and others.
2.3.3 Load Factor
Genset selection can be finished After the load factor was obtained.
Load factor is Obtained from initial ship design data and The load factor is
based Under the operational conditions and Operational equipment that is
carried out at PT.PAL. Then from operational conditions. The equipment is
divided into two conditions Namely continuous load and intermittent load.
(Sitepu, 2010)
1. Load Factor generator: defined as the ratio between the power is using
in one condition with amount of the generator usage (usually one or
two depend with total of generators on ship).
2. Load factor equipment: defined as the ratio between the time to those
on the equipment in a condition with the total time for a condition:

8
Table 2. 1 Load Factor Table
Cooling freshwater pumps 85 85
Cooling sea water pumps 85 85
Lubricating oil pumps 65 65
Fuel valve cooling freshwater pumps 85 85
Fuel valve cooling oil pumps 70 70
Grade-C heavy oil purifiers and pumps 65
Fuel oil clarifiers and pumps 65
Booster pumps 65 65
Feed water pumps 85 85 85
Fuel oil burning pumps 65 65 85
Forced draft fans 85 85 85
Exhaust gas boiler circulating water pump 85
Air compressor 85
Generator cooling water pumps 85
Freshwater pumps 85 85 85
Sanitary pumps 85 85 85
Ventilating fans 85 85 85
Pumps fitted on distilling plant 85
Winches 30 ~ 40
Cargo oil pumps 30
Steering gear 20 20
Fans 80 80 50
Electric heaters 80 80 50
Air conditioning equipment 80 80 50
Electric fans 80 80 50
Pumps room ventilating fans 80
Cargo hold ventilating fans 60 ~ 80 60 ~ 80 Not include fans for cargo hold desiccator
Hot water circulating fans 80 80 80
For provision 60 80 * 60 * mark to be calculated by adding installation number
For cargo 60 80 * 80 * - d i t t o -
Innert gas fans for cargo oil 70 70 85 *
LPG re-liquefying compressor 90 90 90
LPG cargo pump
Innert gas generator for LPG 80
Refrigerated container 45 ~ 65 45 ~ 65 45 ~ 65
Fixed
Portable 80
Projectors 80
Funnel Lights
Accomodation 80 80 70
Engine room Not include hand lamps.
Navigation lights
Motor generator 70 70 70
Gyro-compass 80 80
Radar
Main circulating pump 75 ~ 90 75 ~ 90
Generator circulating pumps 80 ~ 90 80 ~ 90 80 ~ 90
Cargo ship 65 ~ 70 50 ~ 60
Tanker 75 ~ 80 50 ~ 60
Auxiliary feed pumps
Main condensate pumps 65 ~ 75 50 ~ 60
Auxiliary condensate pumps
Lubricating oil pumps 60 ~ 70 60 ~ 70
Fuel oil burning pumps 70 ~ 80 75 ~ 85 75 ~ 85
Main feed
pumpsContinous load only during cargo handling. Load factor
is to be determined according to actual operating
conditions
When the main condesate pumps are not used for
generator condesate transfer. Load factor is to be
determined according to actual operating conditions
Oth
ers
Cargo lamps100 100
100 100
Lighting 100
100
100 100
100
100
Au
xil
lary
Mach
inery
fo
r tu
rbin
sh
ips
Au
xil
lary
Mach
inery
fo
r d
iese
l sh
ips
Aux. Boiler
use
Au
x. M
ach
inery
co
m-
mo
nly
use
d f
or
die
sel
an
d t
urb
ine
ship
s
Deck
Mach
inery
To be considered according to the number installed and
Accomoda-
tion space
Refrigerator
Table. Definition of Continous Load and Load Factor f o
Kind of Auxiliary Machinery
Load Factor f o
RemarksNormally at
sea
Arrival &
Departure
Cargo
Handling

9
(Source: Perencanaan Instalasi Listrik Kapal, 1995)
2.3.4 Ship Electric Power Analysis
The power factor can be defined As an angle whose forming the zero
byway between the current and the voltage at the frequency certain. Active
power is used for Operate the loads on the electricity customer. The power is
Cargo ship 55 ~ 65 50 ~ 60
Tanker 65 ~ 75 50 ~ 60
Cargo ship 65 ~ 75 55 ~ 65 Usage of fans A. B :
Tanker 68 ~ 75 55 ~ 65 No. of fan installed No. of sets in
Cargo ship 75 ~ 85 70 ~ 80 A 2 sets/ 2 boilers 2
Tanker 80 ~ 90 70 ~ 80 B 2 sets/ 2 boilers1 : up to 85%
2 : 85% and over
Cargo ship 70 70 70 B 3 sets/ 2 boilers1 : up to 85%
2 : 85% and over
Tanker 60 ~ 75 55 ~ 70 80 ~ 90
70 70 70 In case of motor driven deck machinery
25 25 75 In case of steam driven deck machinery
Tanker 55 ~ 70 55 ~ 70 75 ~ 90
Automatic combustion control devices 80 ~ 90 80 ~ 90 80 ~ 90
Soot blowing air compressor 80 ~ 90
Ship's service air compressor 80 ~ 90 80 ~ 90 80 ~ 90 In case of automatic starting device is installed
Turning motor 80 ~ 90 80 ~ 90
A grade heavy fuel oil purifier and pumps * 65 * 65
Turning motor * 80
General service pumps * 65 * 65
Bilge pumps 85
Ballast pumps 85 85
Fuel oil transfer pumps 80 * 80
Lubricating oil extraxtion pumps 80 80
Lubricating oil purifiers * 80 80
Windlasses * 40
Boat winches 80
Butterworth pump 85
Stripping pumps 15 ~ 25 55 ~ 65
Accommodation ladder winch 80
Capstans and mooring winches * 40
Electric range 40 ~ 60 40 ~ 60 40 ~ 60
Electric oven 40 ~ 60 40 ~ 60 40 ~ 60
Others 40 40 40
Projectors * 80
Motor generator for battery use 80 80 80
Radar *
Radio equipment * 80
Nautical instruments * 60 * 60
Motor siren and motor horn 80 80
Note : 1. Fire pump, machine tools, electric welder and hoists are not to be considered in the electric power consumption calculation.
2. * LPSG : Low Pressure Steam Generator
* mark show the load which becomes the largest consumable load among the auxiliary machinery used intermittently during sea going.
* mark show intermittent loads which are used simultancouslywith the auxiliary machinery marked with *.
Oth
ers
Galley, pantry and
laundry service
Considerations are to be given according to type and
particular of installation
- d i t t o -
Considerations are to be given when the equipment of
large capacity is to be installed particularity
100
Deck
mach
inery
In case of tanker this pump should be * marked and
the general service pump is to be * marked.
Au
x.
Mach
inery
for
die
sel
ship
s
For the case that ship mainly uses C grade heavy fuel
oil during sea going. However when the ship uses A
grade heavy fuel oil during sea going the purifiers are
to be continous load
Au
x. M
ach
inery
co
m-
mo
nly
use
d i
n d
iese
l an
d
turb
ine s
hip
s
When sea water is used as ballast, ballast pump
should be marked with *.
Lower values for sirocco type and high values for turbo-vane
type fans. Load factor during cargo handling is to be determined
according to actual operating conditions
B
There may be a case to be used as a continous load
When
dumper
control
Dra
in p
um
ps
When
LPSG" in-
scalled
Without
LPSG" in-
scalled
To be calculated as intermittent load depending on the
type of boiler.
Cargo ship
Fo
rced
dra
ft f
an
s When
speed and
vane
control
A
Au
xil
lary
Mach
inery
fo
r tu
rbin
sh
ips
(co
nt.
'd)
* * *
* * *

10
generated by the generator that is transmitted to the electricity customer.
(Antonov & Natalinus, 2013).
Electrical power in the Three phases AC power system consists of
three components, the name are compelx power, active power, and reactive
power. The meaning of complex power is the amount of voltage and Current
are used for converted electrical energy per Unit time. Complex power contains
components Real and imaginary of the given power. (Alimuddin, 2014)
A balanced three phase load is one that is equally shared (balanced)
across all three phases. The total load is determined by adding up the individual
kW balanced loads. In the balanced systems, the average power consumed by
each load branch is the same and given by
cosIVP~
effeffav
where Veff is the effective value of the phase voltage, Ieff is the effective
value of the phase current and is the angle of the impedance. The total
average power consumed by the load is the sum of those consumed by each
branch, hence, we have
cosIV3P~
3P effeffavav
In the balanced Y systems, the phase current has the same
amplitude as the line current Leffeff II , whereas the line voltage has the
effective value LeffV which is 3 times greater than the effective value of the
phase voltage, effLeff V3V . Hence, using (22), we obtain
cosIV3cosI3
V3P
LeffLeffLeffLeff
av
Similarly, we derive:
The conversion formula is as follows:
KW gen = kW load
= kVA x PF
= √3 x volts x current x PF
1000
Note :
PF = power factor of load
11
Volts = rated line to line voltage
Current = rated line current
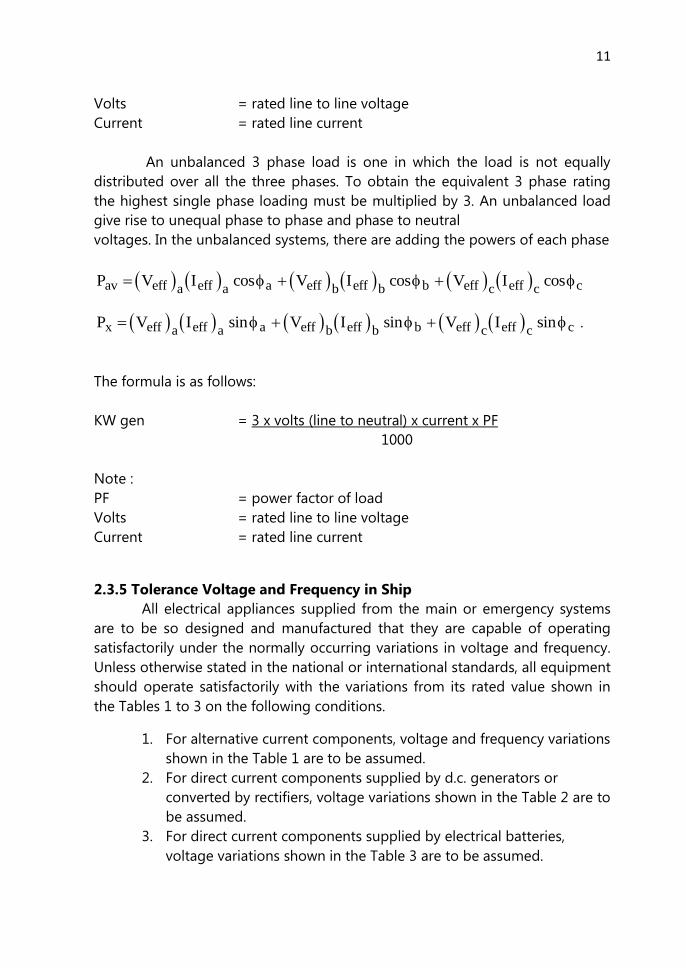
An unbalanced 3 phase load is one in which the load is not equally
distributed over all the three phases. To obtain the equivalent 3 phase rating
the highest single phase loading must be multiplied by 3. An unbalanced load
give rise to unequal phase to phase and phase to neutral
voltages. In the unbalanced systems, there are adding the powers of each phase
P V I V I V Iav eff a eff a a eff b eff b b eff c eff c c cos cos cos
P V I V I V Ix eff a eff a a eff b eff b b eff c eff c c sin sin sin .
The formula is as follows:
KW gen = 3 x volts (line to neutral) x current x PF
1000
Note :
PF = power factor of load
Volts = rated line to line voltage
Current = rated line current
2.3.5 Tolerance Voltage and Frequency in Ship
All electrical appliances supplied from the main or emergency systems
are to be so designed and manufactured that they are capable of operating
satisfactorily under the normally occurring variations in voltage and frequency.
Unless otherwise stated in the national or international standards, all equipment
should operate satisfactorily with the variations from its rated value shown in
the Tables 1 to 3 on the following conditions.
1. For alternative current components, voltage and frequency variations
shown in the Table 1 are to be assumed.
2. For direct current components supplied by d.c. generators or
converted by rectifiers, voltage variations shown in the Table 2 are to
be assumed.
3. For direct current components supplied by electrical batteries,
voltage variations shown in the Table 3 are to be assumed.

12
Any special system, e.g. electronic circuits, whose function cannot
operate satisfactorily within the limits shown in the Table should not be
supplied directly from the system but by alternative means, e.g. through
stabilized supply.
Table 2. 2 Voltage and Frequency for AC Distribution Systems
Quantity in Operation
Variation
nns Permanen
t
Transient
Frequency +5% +10% (5 sec)
Voltage +6%, -10% +20% (1.5 sec)
(Source: IACS Requirement, 2016)
Table 2. 3 Voltage Variation for DC Distribution Systems
Parameters Variations
Voltage tolerance (continuous) +10%
Voltage cyclic variation deviation 5%
Voltage ripple (a.c. r.m.s. over steady
d.c. voltage)
10%
(Source: IACS Requiremet, 2016)
Table 2. 4 Voltage Variations for Battery Systems
Systems Variations
Components connected to the battery during
charging (see Note)
+30%, -25%
Components not connected to the battery
during charging
+20%, -25%
Note: Different voltage variations as determined by the charging/discharging
characteristics, including ripple voltage from the charging device,
may be considered.
(Source: IACS Requirements, 2016)

13
CHAPTER III
RESEARCH METHOD
3.1 General
This chapter describes systematically stages which done in this research.
This research method all activities, rules, and analysis that are implemented to
solve problems defined on this final project.
3.2 Final Project Research Method
This final project is done by an experiment to analyze the performance
of a generator in MT SUCCESS VICTORY XXXIV. The project is done in several
stages. At below, the explanation of each stage are:
3.2.1 Identification and Formulation of the Problem
The final project begins by identifying and formulating the problem that
will be done and also limits of the problems. This stage can make it easier for
completion of this final project. The identification and formulation of the
problem can be seen in the previous chapter.
3.2.2 Study Literature
The study of literature is an early stage is a stage of learning about the
basic theories to be discussed or used in the final project. The basic theory of
the Load factor in Ship that generated by the parallel generator. Literature was
obtained from:
a. Journal
b. Paper
c. Script
d. Book
e. Internet
3.2.3 Collecting Data
Experiments were performed at the MT SUCCESS VICTORY XXXIV
Chemical Tanker, which is owned by Soechi Chemical Tanker. Experiments were
done by performing the testing process of the performance of the generator
used, and load factor that showed in switchboard panel.

14
3.2.4 Calculating and Processing Data
a. Calculating of Load Factor Generator
The Calculation of generator efficiency taken from input power in
complex power (VA) of this parallel generator in MT SUCCESS VICTORY
XXXIV that showed in switchboard panel.
b. Calculating of Cos
The Calculation of Cos uses formula Cos
√
c. Calculating Continuous Load and Intermittent Load
The Calculation of Continuous Load and Intermittent Load earned by the
required power table from Murakami Shipyard.
3.2.5 Evaluating Results
Evaluates the calculation that it is possible to fulfill the rules in
calculation from design or not.
3.2.6 Analyzing Generator
Analyzes the difference value of power generator between in real
condition (ship) and in design to get the factor that must be possible from this
comparison.
3.2.7 Conclusions and Recommendations
The conclusion of this final project is to answer the condition in
generator MT SUCCESS VICTORY XXXIV. There is comparison value between
ship and ship electrical arrangement. The value used for comparison are load
factor and efficiency of the generator. This final project can be used as a
reference for maintaining the ship soon based on regulation.

15
3. 3 Bachelor Thesis and Colloquium Flowchat
No
Figure 3. 1 Bachelor Thesis and Colloquium Flowchart
Start
Identification and
Problem Formulation
Literature Study
1.Journal/
paper
2. The
Script
3. Book
4. Internet Collecting Data by
Survey on Ship
Calculating and
Processing Data
Evaluating
Results
Analyzing
Reccomendation and
Conclusion
Finish

16
“This page intentionally left blank”

17
CHAPTER IV
DATA ANALYSIS
4.1 Spesification Data
This thesis uses data from Chemical Tanker ship (MT SUCCESS VICTORY
XXXIV) as an Object for this observation and takes P, V, I f from its switchboard
panel to analyze and evaluate the condition of its generator. Built on November
1999, this ship has a couple of generators for operating its electrical equipment.
Figure 4.1 until Figure 4.3 explain the data Principal Particulars of Ship, Wiring
Diagram, as the first steps to choose its generator with power capcity about 400
kVA and Table 4.1 explains about calculation power table of MT SUCCESS
VICTORY XXXIV.
4.1.1 Principal Particulars – MT SUCCESS VICTORY XXXIV
This Ship was built in Murakami Shipyard/Japan, launched on 1st
November 1999 and delivered on 15th February. Now from figure 4.1, this ship
has Indonesian flag and get a port of registry in Jakarta but it does not change
its Classification Society, and still use NK as a Classification society of
Ship.Principal Particulars attached:
Figure 4. 1 MT SUCCESS VICTORY XXXIV
LOA : 105 m
LPP : 97 m
Breadth : 16.8 m

18
Depth : 8.4 m
Height : 34 m
Delivered : 15th February 2000
Shipyard : Murakami Ship Building
Main Engine : Akasaka Diesel 6UEC 37 LA
Generator : TAIYO ( Yanmar S156L-UTx 2 set)
4.1.2 Generator Set – MT SUCCESS VICTORY XXXIV
The electrical system on MT SUCCESS VICTORY is supplied by 2
generators with its capacity 400 kVA for one generator. Before getting the
suitable power for this generator, Murakami Shipyard made wiring diagram to
MT SUCCESS VICTORY XXXIV to explain power distribution of MT SUCCES
VICTORY XXXIV. Figure 4.2 represents about the distribution of wiring diagram
on MT SUCCESS VICTORY XXXIV.
Figure 4. 2 Wiring Diagram of MT SUCCESS VICTORY XXXIV
After getting the wiring diagram, this shipyard calculated electric power
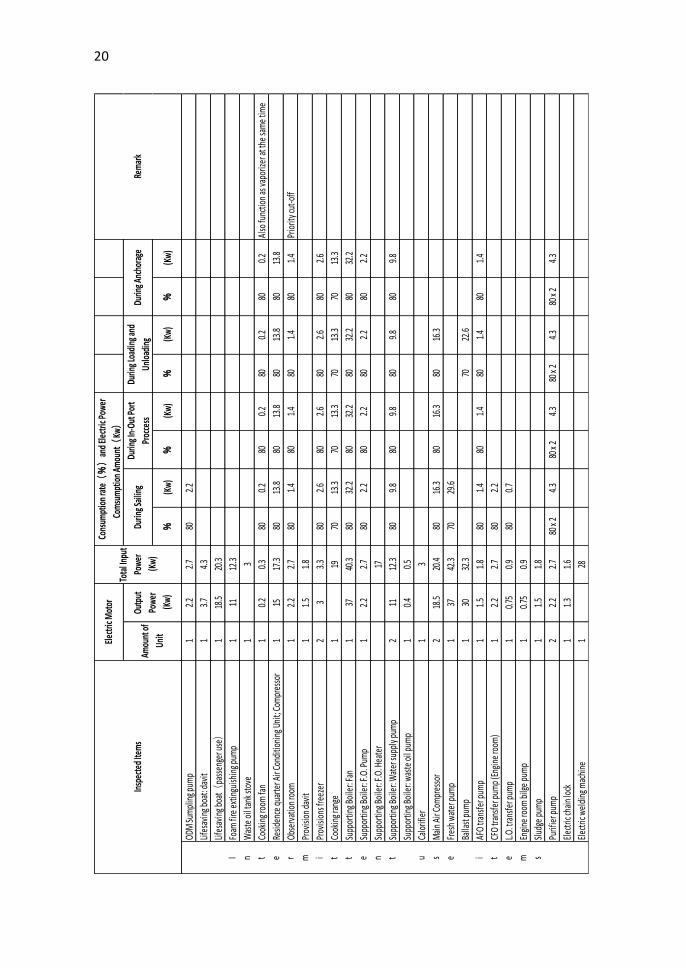
table for each condition to reach the most efficient power in Table 4.1.
According to these calculation items based on design, the generators have
maximum capacity of power 344.1 kVA in sailing condition, 552.3 kVA in

19
% (K
w)%
(Kw)
% (K
w)%
(Kw)
Stee
ring M
achi
ne1
5.56.3
402.5
503.2
Powe
r Pac
k Ele
ctric
Mot
or3
145
152.6
70 x
221
3.680
x 3
412
Engin
e roo
m ex
haus
t fan
12.2
2.780
2.280
2.280
2.280
2.2Pi
ority
cut-o
ff
Butte
rwor
th pu
mp
155
57.3
8045
.8Pi
ority
cut-o
ff
Gas-f
ree F
an1
3739
.380
31.4
Pior
ity cu
t-off
Resid
encia
l Qua
rter A
ir Co
nditi
onin
g Uni
t; Co
mpr
esso
r1
5.56.3
805
805
805
805
Obse
rvat
ion r
oom
10.2
0.380
0.280
0.280
0.280
0.2
Engin
e roo
m ve
ntila
tor
27.5
8.380
x 2
13.2
80 x
213
.280
x 2
13.2
80 x
213
.2
Pum
p roo
m ex
haus
t fan
12.2
2.780
2.2
Main
sea-
wate
r coo
ling p
ump
111
12.3
809.8
809.8
Main
fres
h wat
er co
olin
g pum
p2
5.56.3
805.1
805.1
Main
F.O.
supp
ly pu
mp
21.5
1.980
1.480
1.4
Spar
e L.O
. pum
p1
18.5
20.4
6513
.3
Sea-
wate
r ser
vice p
ump
115
17.3
8013
.880
13.8
8013
.880
13.8
Sea-
wate
r coo
ler g
ener
ator
15.5
6.380
5.180
5.180
5.180
5.1
Auxil
iary b
lowe
r2
1516
.380
x 2
26.1
Fire e
xtin
guish
er - m
isc. p
ump
137
40.3
7530
.2
Exha
ust g
as ci
rculat
ory p
ump
22.2
2.780
2.2
Wat
er su
pply
mac
hine
: Sea
-wat
er co
oler
pum
p1
5.56.3
805.1
Wat
er su
pply
mac
hine
: Vac
uum
pum
p1
5.56.3
805.1
Wat
er su
pply
mac
hine
: Dist
illed
wat
er pu
mp
10.7
50.9
800.7
F.O. P
urrif
ier
25.5
6.380
x 2
10.1
805
805
805
L.O. P
urrif
ier
15.5
6.380
5
Tran
sform
er(
AC10
0 lo
ad)
315
40 x
318
50 x
322
.550
x 3
22.5
35 x
3 15
.8
War
m w
ater
circu
lator
y pum
p1
0.40.5
800.4
800.4
800.4
800.4
Powe
r Pac
k Hyd
raul
ic oi
l pum
p1
2.63.1
802.5
802.5
c o n t i n u o u s u s e i t e m s
Insp
ecte
d Ite
ms
Electr
ic M
otor
Tota
l Inpu
t
Powe
r
(Kw)
Amou
nt of
Unit
Outp
ut
Powe
r
(Kw)
Durin
g Sail
ing
Rem
ark
Durin
g Ent
ry-D
epar
ture
Port
Proc
ess
Durin
g Loa
ding
and
Unlo
adin
gDu
ring A
ncho
rage
Cons
umpt
ion r
ate(%)
and E
lectr
ic Po
wer
Com
sum
ptio
n Am
ount(
Kw)
Maneuvering condition, 712.8 kVA when the ship is in loading and
discharging/discharging condition, and 149.1 kVA in Anchoring condition.
Tab
le 4
. 1
Calc
ula
tio
n P
ow
er
Tab
le f
rom
Mu
rak
am
i S
hip
yard
20
% (K
w)
% (K
w)
% (K
w)
% (K
w)
ODM
Sum
plin
g pum
p1
2.2
2.7
802.
2
Lifes
avin
g boa
t: da
vit
13.
74.
3
Lifes
avin
g boa
t(pa
ssen
ger u
se)
118
.520
.3
Foam
fire
ext
ingu
ishin
g pum
p1
1112
.3
Was
te o
il ta
nk st
ove
13
Cook
ing r
oom
fan
10.
20.
380
0.2
800.
280
0.2
800.
2Al
so fu
nctio
n as
vapo
rizer
at th
e sa
me
time
Resid
ence
qua
rter A
ir Co
nditi
onin
g Uni
t; Co
mpr
esso
r1
1517
.380
13.8
8013
.880
13.8
8013
.8
Obse
rvat
ion
room
12.
22.
780
1.4
801.
480
1.4
801.
4Pr
iorit
y cut
-off
Prov
ision
dav
it1
1.5
1.8
Prov
ision
s fre
ezer
23
3.3
802.
680
2.6
802.
680
2.6
Cook
ing r
ange
119
7013
.370
13.3
7013
.370
13.3
Supp
ortin
g Boi
ler:
Fan
137
40.3
8032
.280
32.2
8032
.280
32.2
Supp
ortin
g Boi
ler:
F.O.
Pum
p1
2.2
2.7
802.
280
2.2
802.
280
2.2
Supp
ortin
g Boi
ler:
F.O.
Hea
ter
17
Supp
ortin
g Boi
ler:
Wat
er su
pply
pum
p2
1112
.380
9.8
809.
880
9.8
809.
8
Supp
ortin
g Boi
ler:
was
te o
il pu
mp
10.
40.
5
Calo
rifie
r1
3
Mai
n Ai
r Com
pres
sor
218
.520
.480
16.3
8016
.380
16.3
Fres
h w
ater
pum
p1
3742
.370
29.6
Balla
st p
ump
130
32.3
7022
.6
AFO
trans
fer p
ump
11.
51.
880
1.4
801.
480
1.4
801.
4
CFO
trans
fer p
ump
(Eng
ine
room
)1
2.2
2.7
802.
2
L.O. t
rans
fer p
ump
10.
750.
980
0.7
Engi
ne ro
om b
ilge
pum
p1
0.75
0.9
Slud
ge p
ump
11.
51.
8
Purif
ier p
ump
22.
22.
780
x 2
4.3
80 x
24.
380
x 2
4.3
80 x
24.
3
Elec
tric c
hain
lock
11.
31.
6
Elec
tric w
eldi
ng m
achi
ne1
28
I n t e r m i t t e n t u s e i t e m s
Insp
ecte
d Ite
ms
Elec
tric M
otor
Tota
l Inp
ut
Pow
er
(Kw
)
Rem
ark
Amou
nt o
f
Unit
Outp
ut
Pow
er
(Kw
)
Durin
g Sai
ling
Durin
g In-
Out P
ort
Proc
cess
Durin
g Loa
ding
and
Unlo
adin
gDu
ring A
ncho
rage
Cons
umpt
ion
rate(%)
and
Elec
tric P
ower
Com
sum
ptio
n Am
ount(
Kw)

21
% (K
w)
% (K
w)
% (K
w)
% (K
w)
CFO
Tra
nsfe
r pum
p(bo
w)
13.
74.
380
3.4
803.
480
3.4
803.
4Al
so fu
nctio
n as
vap
oriz
er a
t the
sam
e tim
e
Pum
p ro
om b
ilge
pum
p1
3.7
4.3
803.
4
Disp
oser
11.
51.
880
1.4
801.
480
1.4
801.
4
Turn
ing
mot
or m
ain
engi
ne1
1.5
1.8
Stuf
fing
box
L.O
. Pum
p1
0.4
0.5
800.
4
Ladd
er w
inch
21.
51.
8
Pist
on h
orn
15.
56.
3
Sew
age
proc
essi
ng u
nit /
trea
tmen
t1
0.4
580
0.4
Soup
ket
tle1
670
4.2
704.
270
4.2
704.
2
Was
te o
il in
cine
rato
r1
1.5
1.8
801.
4
cont
inuo
us u
sed
item
s
(Kw
/KVA
)
8669
89.1
37.3
AC 4
45 V
x 3
Pha
se x
60
Hz x
6 P
x 4
00 k
VA
275.
3/34
4.1
441.
8/55
2.3
570.
2/71
2.8
119.
3/14
9.1
400
x 1
400
x 2
400
x 2
400
x 1
93.2
69.2
86.1
5
182
372.
648
4.1
106.
513
2.5
6565
Rem
ark
Insp
ecte
d Ite
ms
Elec
tric
Mot
or
Tota
l Inp
ut
Pow
er
(Kw
)Am
ount
of
Uni
t
Out
put
Pow
er
(Kw
)
Durin
g Sa
iling
Durin
g In
-Out
Por
t
Proc
cess
Cons
umpt
ion
rate(%)
and
Elec
tric
Pow
er
Com
sum
ptio
n Am
ount(
Kw)
Elec
tric
al e
quip
men
t spe
cific
atio
n
Gene
rato
r Out
put P
ower(
KVA)x
amou
nt(
unit)
Gene
rato
r Loa
ding
Rat
e (%)
Durin
g Lo
adin
g an
d
Unl
oadi
ngDu
ring
Anch
orag
e
c o n t i n u o u s u s e
i t e m s
R e q u i r e d
E l e c t r i c
P o w e r
Inte
rmitt
ent u
sed
Item
s
Tota
l (Kw
)
Inva
lid ra
te (%
)
Requ
ired
elec
tric
pow
er (K
w)
Requ
ired
elec
tric
pow
er (K
w)
Inte
rmitt
ent u
sed
item
s+co
ntin
uous
use
d ite
ms
143.
4
6565

22
After getting a wiring diagram and calculation power table in Murakami
Shipyard, MT SUCCESS VICTORY XXXIV required the power of generator with
capacity 400 kVA for one generator and it needs two generators for operating
its electrical equipment. Figure 4.3 shows Specification of Generator and re-
writes above its original specification to clear the nameplate.
Model : TAIYO - TWY35C.65
Output : 400 kVA
Frequency : 60Hz
Volt : 445 Vlot
Ampere : 519 A
Number of Phase : 3
Power Factor : 0.8
Number of Poles : 6
Amb Temperature : 45 C
Insulation : F Class
Figure 4. 3 Specs of Generator

23
4.2 Observation Data of MT SUCCESS VICTORY XXXIV
From problem limitation of this thesis. This route taken for four ports in
Indonesia, they were Gresik to Discharge Methanol and Probolinggo also to
Discharge Methanol. And for loading Methanol MT SUCCESS VICTORY XXXIV
sailed to Bontang, and back for Discharging in Merak. This observation noted
P,V, I, and f (attached in Chapter of Attachment on the last page) that showed in
panel every single hour in 4 conditions (Sailing, Maneuvering,
Loading/Discharging, Anchoring) of ship to calculate Load Factor and Cos of
generators.
These graphics from Figure 4.4 until Figure 4.17 represent the Data
Observation from Load Factors and Cos in 4 routes every single hours from
the calculation and Formulas of Load Factors and Cos are:
Cos
√
4.2.1 Gresik
In The port of Gresik, this ship discharged 4000 Tons of Methanol for
one day. After discharging, this ship maneuvered out to the port and did
anchoring near the port to bunker, because there is also another ship want to
load or discharge in the port of Gresik. After bunkering, MT SUCCESS VICTORY
XXXIV continued its trip to Probolinggo to discharge its load again. Figure 4.4
until Figure 4.6 show condition activities of MT SUCCESS VICTORY in The port of
Gresik.
1. Based on analysis of Cos Φ and load factor of generators when the ship
discharged its load, cos φ of generators was still good but load factor of
generators was lower than the calculation in Murakami Ship yard and
when the ship was in cargo handling condition, it needed 89.1% load
factor capacity of generators, but in actual condition the highest load
factor of generators was 36%. Figure 4.4 shows Graphic of Load Factor
and Cos in Discharging condition on Gresik.
24
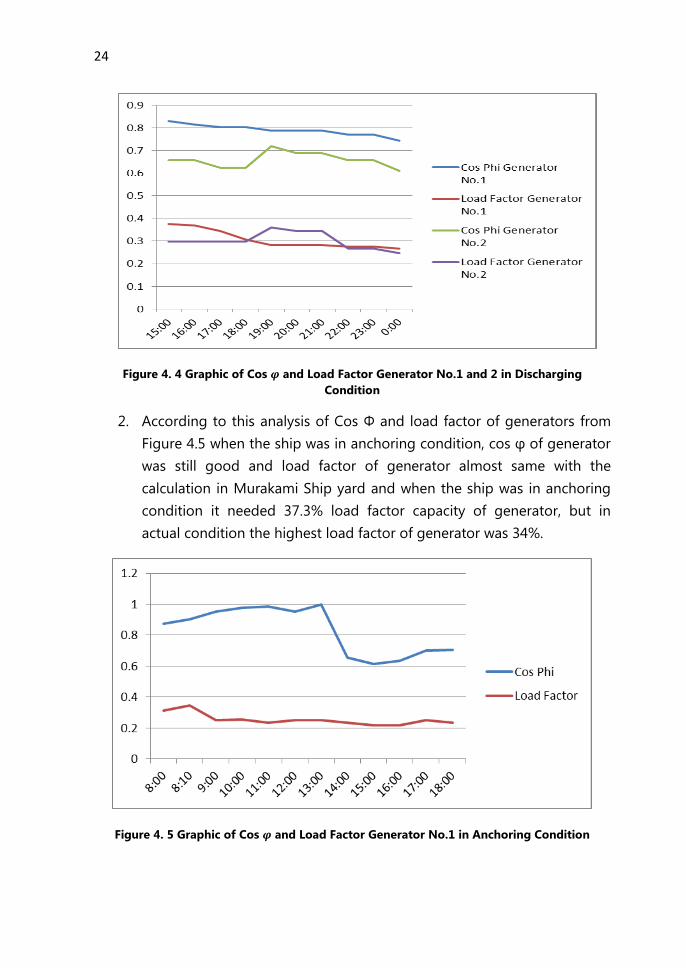
Figure 4. 4 Graphic of Cos and Load Factor Generator No.1 and 2 in Discharging
Condition
2. According to this analysis of Cos Φ and load factor of generators from
Figure 4.5 when the ship was in anchoring condition, cos φ of generator
was still good and load factor of generator almost same with the
calculation in Murakami Ship yard and when the ship was in anchoring
condition it needed 37.3% load factor capacity of generator, but in
actual condition the highest load factor of generator was 34%.
Figure 4. 5 Graphic of Cos and Load Factor Generator No.1 in Anchoring Condition

25
3. Regarding from the analysis of Cos Φ and load factor of generators
shows in Figure 4.6 when the ship was in maneuvering condition, cos φ
of generators was still good but load factor of generators was lower
than the calculation in Murakami Ship yard and when the ship was in
maneuvering condition it needed 86% load factor capacity of
generators, but in actual condition the highest load factor of generators
was 43%.
Figure 4. 6 Graphic of Cos and Load Factor Generator No.1 and 2 in Maneuvering
Condition
4.2.2 Probolinggo
In this port, this ship sailed almost two days and waited for discharging
for two days because there were also two ships discharging in the same port.
After getting its turn to discharge, this ship discharged 2000 Tons of Methanol
for one day and left this port after discharging immediately. Figure 4.7 until
Figure 4.11 show condition activities of MT SUCCESS VICTORY in The port of
Probolinggo.
1. According to the analysis of Cos Φ and load factor of generator when
the ship was in sailing condition, cos φ of generator was still good but
load factor of generator was lower than the calculation in Murakami
Ship yard and when the ship was in sailing condition it needed 69% load
factor capacity of generator, but in actual condition the highest load

26
factor of generator was 35%. Figure 4.7 shows its graphic of Cos and
Load Factor in sailing condition.
Figure 4. 7 Graphic of Cos and Load Factor Generator No.2 in Sailing condition
2. From Figure 4.8 the data analysis of Cos Φ and load factor of generator
when the ship was in anchoring condition, cos φ of generator was still
good and load factor of generator almost same with the calculation in
Murakami Ship yard and when the ship was in anchoring condition it
needed 37.3% load factor capacity of generator, but in actual condition
the highest load factor of generator was 31%.
Figure 4. 8 Graphic of Cos and Load Factor Generator No.1 in anchoring condition
27
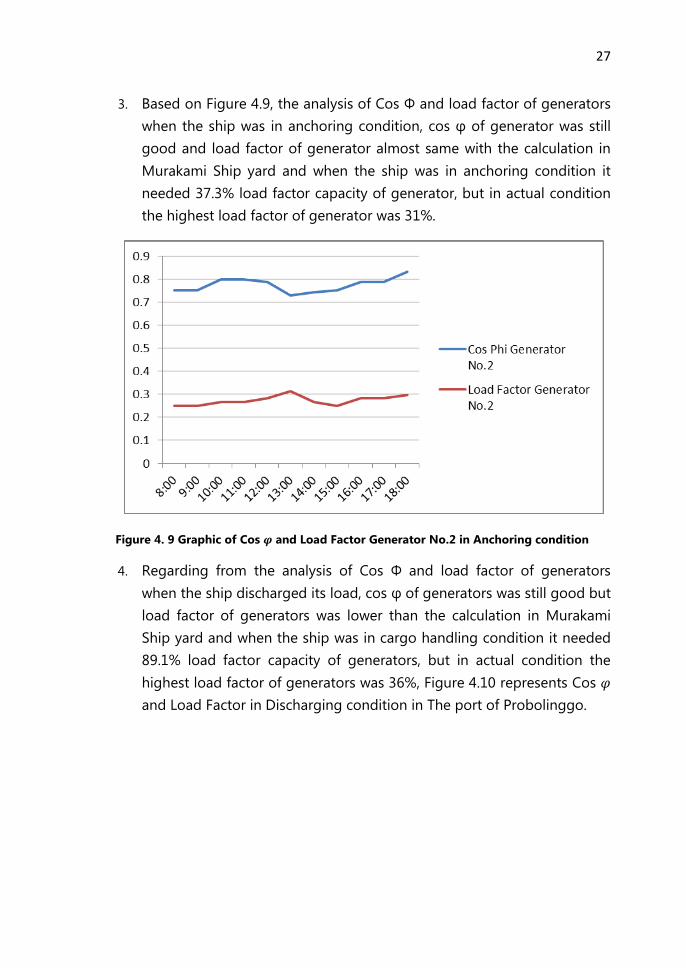
3. Based on Figure 4.9, the analysis of Cos Φ and load factor of generators
when the ship was in anchoring condition, cos φ of generator was still
good and load factor of generator almost same with the calculation in
Murakami Ship yard and when the ship was in anchoring condition it
needed 37.3% load factor capacity of generator, but in actual condition
the highest load factor of generator was 31%.
Figure 4. 9 Graphic of Cos and Load Factor Generator No.2 in Anchoring condition
4. Regarding from the analysis of Cos Φ and load factor of generators
when the ship discharged its load, cos φ of generators was still good but
load factor of generators was lower than the calculation in Murakami
Ship yard and when the ship was in cargo handling condition it needed
89.1% load factor capacity of generators, but in actual condition the
highest load factor of generators was 36%, Figure 4.10 represents Cos
and Load Factor in Discharging condition in The port of Probolinggo.

28
Figure 4. 10 Graphic of Cos and Load Factor Generator Generator No.1 and 2 in
Discharging Condition
5. According to the analysis of Cos Φ and load factor of generators in
Figure 4.11 when the ship was in maneuvering condition, cos φ of
generators was still good but load factor of generators was lower than
the calculation in Murakami Ship yard and when the ship was in
maneuvering condition it needed 86% load factor capacity of
generators, but in actual condition the highest load factor of generators
was 43%.
Figure 4. 11 Graphic of Cos and Load Factor Generator No.1 and 2 in Maneuvering
Condition

29
4.2.3 Bontang
In Bontang, this ship came back to charge its load with full capacity. But
in this case, this ship waited 4 days to charge the load because the port in this
city is very busy. After charging its load with Methanol again, this ship sailed to
Banten for discharging its load in 2 ports in Banten (Merak and Anyer). Figure
4.12 until Figure 4.15 show condition activities of MT SUCCESS VICTORY in The
port of Bontang.
1. From Figure 4.12 the analysis of Cos Φ and load factor of generator
when the ship was in sailing condition, cos φ of generator was still good
but load factor of the generator was higher at the moment than the
calculation in Murakami Ship yard (at the moment 81%). When the ship
was in sailing condition it needed 69% load factor capacity of the
generator, but in actual condition the highest load factor of the
generator was 48%.
Figure 4. 12 Graphic of Cos and Load Factor Generator No.1 and 2 in Sailing Condition
2. Regarding from Figure 4.13, the analysis of Cos Φ and load factor of
generator when the ship was in anchoring condition, cos φ of generator
was still good and load factor of generator almost same with the
calculation in Murakami Ship yard nd when the ship was in anchoring
condition it needed 37.3% load factor capacity of generator, but in
actual condition the highest load factor of generator was 31%.

30
Figure 4. 13 Graphic of Cos and Load Factor Generator No.1 and 2 in Anchoring condition
(switched when 24 hours running)
3. According to the analysis of Cos Φ and load factor of generator when
the ship was in loading condition, cos φ of generator was still good and
load factor of generator almost same with the calculation in Murakami
Ship yard and when the ship was in loading condition it needed 89.1%
load factor capacity of generator, but in actual condition the highest
load factor of generator was 34%. Figure 4.14 shows the graphic Cos
and Load Factor in loading condition.
Figure 4. 14 Graphic of Cos and Load Factor Generator No.1 in Loading Condition

31
4. Based on analysis of Cos Φ and load factor of generators in Figure 4.15
when the ship was in maneuvering condition, cos φ of generators was
still good but load factor of generators was lower than the calculation in
Murakami Ship yard and when the ship was in maneuvering condition it
needed 86% load factor capacity of generators, but in actual condition
the highest load factor of generators was 50%.
Figure 4. 15 Graphic of Cos and Load Factor Generator No.1 and 2 in Maneuvering
Condition
4.2.4 Merak
Merak was the last destination of this observations. This thesis did not
note all of the activity in Merak, because its data has completed. So, in Merak
just only noted about this ship in sailing and maneuvering condition. Figure
4.16 and Figure 4.17 show graphics of Cos and Load Factor in The port of
Merak.
1. According to the analysis of Cos Φ and load factor of the generator in
Figure 4.16 when the ship was in sailing condition, cos φ of the
generator was still good but load factor of the generator was lower than
the calculation in Murakami Ship yard. When the ship was in sailing
condition it needed 69% load factor capacity of the generator, but in
actual condition the highest load factor of generator was 33%.

32
Figure 4. 16 Graphic of Cos and Load Factor Generator No.1 and 2 in Sailing condition
(Switched Every 12 hours)
2. From Figure 4.17, the analysis of Cos Φ and load factor of generators
when the ship was in maneuvering condition, cos φ of generators was
still good but load factor of generators was lower than the calculation in
Murakami Ship yard and when the ship was in maneuvering condition it
needed 86% load factor capacity of generators, but in actual condition
the highest load factor of generators was 50%.
Figure 4. 17 Graphic of Cos and Load Factor Generator No.1 and 2 in Maneuvering
Condition

33
4.2.5 Summaries of Cos and Load Factor of Generators
Cos in every conditions of generator in good condition because from
graphics show the percentage of Cos is in a range from 70% until 80%, but
for Load Factor in every condition is very low if they compare with the first
design because from the graphics show the percentage of Load Factor is only
30% and the highest is 67%.
The generator should be in good condition based on Cos and Load
Factor, so to know more details about the condition of the generator, the
author calculates electric power table and after getting all of the summaries, the
generator can be analyzed and evaluated.
4. 3 Calculation Table of Electric Power Table Comparison
After getting the table of activities and Graphics of activities based on
Load Factor and Power Factor (cos Φ), this thesis needs all of the items that
used in MT SUCCESS VICTORY XXXIV to calculate the capacity for generators in
real condition because there was the different capacity of power between
design and real condition.
Beside calculation by design and real condition, this thesis also
calculates by Indonesian Shipyard (PT PAL) Requirements calculation table of
electric power table. So with these comparisons, this thesis will get the best
conclusion and give comments and advice to the owner of MT SUCCESS
VICTORY XXXIV about his generators.
For the last steps, this thesis also makes a calculation again based on the
highest and the lowest power in every condition in switchboard’s panel on this
ship to ensure and analyze the calculation that may closer with that three
comparisons before (calculation table of electric power table based on: Design,
Indonesian Shipyard (PT PAL) Requirements, and in real condition).

34
% (K
w)%
(Kw)
% (K
w)%
(Kw)
Steer
ing M
achin
e1
5.56.3
402.5
503.2
Powe
r Pac
k Elec
tric M
otor
314
515
2.670
x 2
213.6
80 x
341
2
Engin
e roo
m ex
haus
t fan
12.2
2.780
2.280
2.280
2.280
2.2Pio
rity c
ut-o
ff
Butte
rwor
th pu
mp1
5557
.380
45.8
Piorit
y cut
-off
Gas-f
ree F
an1
3739
.380
31.4
Piorit
y cut
-off
Resid
encia
l Qua
rter A
ir Con
dition
ing Un
it; Co
mpre
ssor
15.5
6.380
580
580
580
5
Obse
rvatio
n roo
m1
0.20.3
800.2
800.2
800.2
800.2
Engin
e roo
m ve
ntila
tor
27.5
8.380
x 2
13.2
80 x
213
.280
x 2
13.2
80 x
213
.2
Pump
room
exha
ust f
an1
2.22.7
802.2
Main
sea-w
ater c
oolin
g pum
p1
1112
.380
9.880
9.8
Main
fresh
wate
r coo
ling p
ump
25.5
6.380
5.180
5.1
Main
F.O. s
upply
pump
21.5
1.980
1.480
1.4
Spare
L.O.
pump
118
.520
.465
13.3
Sea-w
ater s
ervic
e pum
p1
1517
.380
13.8
8013
.880
13.8
8013
.8
Sea-w
ater c
ooler
gene
rator
15.5
6.380
5.180
5.180
5.180
5.1
Auxil
iary b
lower
215
16.3
80 x
226
.1
Fire e
xting
uishe
r - m
isc. p
ump
137
40.3
7530
.2
Exha
ust g
as ci
rculat
ory p
ump
22.2
2.780
2.2
Wate
r sup
ply m
achin
e: Se
a-wate
r coo
ler pu
mp1
5.56.3
805.1
Wate
r sup
ply m
achin
e: Va
cuum
pump
15.5
6.380
5.1
Wate
r sup
ply m
achin
e: Di
stille
d wate
r pum
p1
0.75
0.980
0.7
F.O. P
urrif
ier2
5.56.3
80 x
210
.180
580
580
5
L.O. P
urrif
ier1
5.56.3
805
Trans
form
er(
AC10
0 loa
d)3
1540
x 3
1850
x 3
22.5
50 x
322
.535
x 3
15.8
Warm
wate
r circ
ulato
ry pu
mp1
0.40.5
800.4
800.4
800.4
800.4
Powe
r Pac
k Hyd
raulic
oil p
ump
12.6
3.180
2.580
2.5
c o n t i n u o u s u s e i t e m s
Inspe
cted I
tems
Electr
ic M
otor
Total
Inpu
t
Powe
r
(Kw)
Amou
nt of
Unit
Outp
ut
Powe
r
(Kw)
Durin
g Sail
ingRe
mark
Durin
g Ent
ry-De
partu
re
Port
Proc
ess
Durin
g Loa
ding a
nd
Unloa
ding
Durin
g Anc
horag
e
Cons
umpt
ion ra
te(%)
and E
lectri
c Pow
er
Coms
umpt
ion Am
ount(
Kw)
4.3.1 Calculation Table of Electric Power Table Based on Design in
Murakami Shipyard
This table calculates items based on the design using load factor from
Murakami shipyard to know power capacity of generator MT SUCCESS VICTORY
XXXIV.
Tab
le 4
. 2
Req
uir
ed
Ele
ctr
ic P
ow
er
Tab
le B
ase
d o
n D
esi
gn
in
Mu
rak
am
i S
hip
yard

35
% (K
w)
% (K
w)
% (K
w)
% (K
w)
ODM
Sum
plin
g pum
p1
2.2
2.7
802.
2
Lifes
avin
g boa
t: da
vit
13.
74.
3
Lifes
avin
g boa
t(pa
ssen
ger u
se)
118
.520
.3
Foam
fire
ext
ingu
ishin
g pum
p1
1112
.3
Was
te o
il ta
nk st
ove
13
Cook
ing r
oom
fan
10.
20.
380
0.2
800.
280
0.2
800.
2Al
so fu
nctio
n as
vapo
rizer
at th
e sa
me
time
Resid
ence
qua
rter A
ir Co
nditi
onin
g Uni
t; Co
mpr
esso
r1
1517
.380
13.8
8013
.880
13.8
8013
.8
Obse
rvat
ion
room
12.
22.
780
1.4
801.
480
1.4
801.
4Pr
iorit
y cut
-off
Prov
ision
dav
it1
1.5
1.8
Prov
ision
s fre
ezer
23
3.3
802.
680
2.6
802.
680
2.6
Cook
ing r
ange
119
7013
.370
13.3
7013
.370
13.3
Supp
ortin
g Boi
ler:
Fan
137
40.3
8032
.280
32.2
8032
.280
32.2
Supp
ortin
g Boi
ler:
F.O.
Pum
p1
2.2
2.7
802.
280
2.2
802.
280
2.2
Supp
ortin
g Boi
ler:
F.O.
Hea
ter
17
Supp
ortin
g Boi
ler:
Wat
er su
pply
pum
p2
1112
.380
9.8
809.
880
9.8
809.
8
Supp
ortin
g Boi
ler:
was
te o
il pu
mp
10.
40.
5
Calo
rifie
r1
3
Mai
n Ai
r Com
pres
sor
218
.520
.480
16.3
8016
.380
16.3
Fres
h w
ater
pum
p1
3742
.370
29.6
Balla
st p
ump
130
32.3
7022
.6
AFO
trans
fer p
ump
11.
51.
880
1.4
801.
480
1.4
801.
4
CFO
trans
fer p
ump
(Eng
ine
room
)1
2.2
2.7
802.
2
L.O. t
rans
fer p
ump
10.
750.
980
0.7
Engi
ne ro
om b
ilge
pum
p1
0.75
0.9
Slud
ge p
ump
11.
51.
8
Purif
ier p
ump
22.
22.
780
x 2
4.3
80 x
24.
380
x 2
4.3
80 x
24.
3
Elec
tric c
hain
lock
11.
31.
6
Elec
tric w
eldi
ng m
achi
ne1
28
I n t e r m i t t e n t u s e i t e m s
Insp
ecte
d Ite
ms
Elec
tric M
otor
Tota
l Inp
ut
Pow
er
(Kw
)
Rem
ark
Amou
nt o
f
Unit
Outp
ut
Pow
er
(Kw
)
Durin
g Sai
ling
Durin
g In-
Out P
ort
Proc
cess
Durin
g Loa
ding
and
Unlo
adin
gDu
ring A
ncho
rage
Cons
umpt
ion
rate(%)
and
Elec
tric P
ower
Com
sum
ptio
n Am
ount(
Kw)

36
% (K
w)
% (K
w)
% (K
w)
% (K
w)
CFO
Tra
nsfe
r pum
p(bo
w)
13.
74.
380
3.4
803.
480
3.4
803.
4Al
so fu
nctio
n as
vap
oriz
er a
t the
sam
e tim
e
Pum
p ro
om b
ilge
pum
p1
3.7
4.3
803.
4
Disp
oser
11.
51.
880
1.4
801.
480
1.4
801.
4
Turn
ing
mot
or m
ain
engi
ne1
1.5
1.8
Stuf
fing
box
L.O
. Pum
p1
0.4
0.5
800.
4
Ladd
er w
inch
21.
51.
8
Pist
on h
orn
15.
56.
3
Sew
age
proc
essi
ng u
nit /
trea
tmen
t1
0.4
580
0.4
Soup
ket
tle1
670
4.2
704.
270
4.2
704.
2
Was
te o
il in
cine
rato
r1
1.5
1.8
801.
4
cont
inuo
us u
sed
item
s
(Kw
/KVA
)
8669
89.1
37.3
AC 4
45 V
x 3
Pha
se x
60
Hz x
6 P
x 4
00 k
VA
275.
3/34
4.1
441.
8/55
2.3
570.
2/71
2.8
119.
3/14
9.1
400
x 1
400
x 2
400
x 2
400
x 1
93.2
69.2
86.1
5
182
372.
648
4.1
106.
513
2.5
6565
Rem
ark
Insp
ecte
d Ite
ms
Elec
tric
Mot
or
Tota
l Inp
ut
Pow
er
(Kw
)Am
ount
of
Uni
t
Out
put
Pow
er
(Kw
)
Durin
g Sa
iling
Durin
g In
-Out
Por
t
Proc
cess
Cons
umpt
ion
rate(%)
and
Elec
tric
Pow
er
Com
sum
ptio
n Am
ount(
Kw)
Elec
tric
al e
quip
men
t spe
cific
atio
n
Gene
rato
r Out
put P
ower(
KVA)x
amou
nt(
unit)
Gene
rato
r Loa
ding
Rat
e (%)
Durin
g Lo
adin
g an
d
Unl
oadi
ngDu
ring
Anch
orag
e
c o n t i n u o u s u s e
i t e m s
R e q u i r e d
E l e c t r i c
P o w e r
Inte
rmitt
ent u
sed
Item
s
Tota
l (Kw
)
Inva
lid ra
te (%
)
Requ
ired
elec
tric
pow
er (K
w)
Requ
ired
elec
tric
pow
er (K
w)
Inte
rmitt
ent u
sed
item
s+co
ntin
uous
use
d ite
ms
143.
4
6565

37
According to these calculation items based on design, the generators
have the maximum capacity of power 344.1 kVA in sailing condition, 552.3 kVA
in Maneuvering condition, 712.8 kVA when the ship is in loading and
discharging/discharging condition, and 149.1 kVA in Anchoring condition.
In this case, the maximum capacity of power is 712.8 kVA when the ship
is in loading and discharging condition. Literally, shipyard can give a
recommendation to the owner to install two generators with the total capacity
for 720-750 kVA to reduce the cost of new generators. But based on rules,
generator can handle the maximum power for only 90% and after that, the rest
of the power moved to another generator. And in loading and discharging
condition there is 89.1% generator usage.
So Murakami Shipyard gives a solution for the owner to install two
generators with the capacity of power are 400 kVA and total the capacities are
800 kVA. Because in the final calculation of power table, the maximum capacity
of power is when the ship in loading and discharging condition with the
capacity reach until 712.8 kVA. that the generators use 3 power pack electric
motors to turn on the hydraulic oil pump and other items that need high power
to discharge the load.

38
Shipo
wner
Ship
type
% (K
w)%
(Kw)
% (K
w)%
(Kw)
Steer
ing M
achin
e1
5.56.3
201.3
201.3
Powe
r Pac
k Elec
tric M
otor
314
515
2.670
x 2
213.6
80 x
336
7
Engin
e roo
m ex
haus
t fan
12.2
2.780
2.280
2.280
2.2Pio
rity c
ut-o
ff
Butte
rwor
th pu
mp1
5557
.385
48.7
Piorit
y cut
-off
Gas-f
ree F
an1
3739
.380
31.4
Piorit
y cut
-off
Resid
encia
l Qua
rter A
ir Con
dition
ing Un
it; Co
mpre
ssor
15.5
6.380
580
580
5
Obse
rvatio
n roo
m1
0.20.3
800.2
800.2
800.2
Engin
e roo
m ve
ntila
tor
27.5
8.385
x 2
1485
x 2
1485
x 2
14
Pump
room
exha
ust f
an1
2.22.7
802.2
Main
sea-w
ater c
oolin
g pum
p1
1112
.385
10.5
8510
.5
Main
fresh
wate
r coo
ling p
ump
25.5
6.385
5.385
5.3
Main
F.O. s
upply
pump
21.5
1.980
1.480
1.4
Spare
L.O.
pump
118
.520
.465
13.3
6513
.3
Sea-w
ater s
ervic
e pum
p1
1517
.380
13.8
8013
.880
13.8
Sea-w
ater c
ooler
gene
rator
15.5
6.380
5.1
Auxil
iary b
lower
215
16.3
80 x
226
.1
Fire e
xting
uishe
r - m
isc. p
ump
137
40.3
7530
.2
Exha
ust g
as ci
rculat
ory p
ump
22.2
2.780
2.2
Wate
r sup
ply m
achin
e: Se
a-wate
r coo
ler pu
mp1
5.56.3
805.1
Wate
r sup
ply m
achin
e: Va
cuum
pump
15.5
6.380
5.1
Wate
r sup
ply m
achin
e: Di
stille
d wate
r pum
p1
0.75
0.985
0.75
F.O. P
urrif
ier2
5.56.3
80 x
210
.180
580
5
L.O. P
urrif
ier1
5.56.3
805
Trans
form
er(
AC10
0 loa
d)3
1540
x 3
1850
x 3
22.5
50 x
322
.5
Warm
wate
r circ
ulato
ry pu
mp1
0.40.5
800.4
800.4
800.4
Powe
r Pac
k Hyd
raulic
oil p
ump
12.6
3.180
2.580
2.5
c o n t i n u o u s u s e i t e m s
SNO.
Inspe
cted I
tems
Electr
ic M
otor
Total
Inpu
t
Powe
r
(Kw)
Amou
nt of
Unit
Outp
ut
Powe
r
(Kw)
Durin
g Sail
ingRe
mark
Durin
g Ent
ry-De
partu
re
Port
Proc
ess
Durin
g Loa
ding a
nd
Unloa
ding
Durin
g Anc
horag
e
Cons
umpt
ion ra
te(%)
and E
lectri
c Pow
er
Coms
umpt
ion Am
ount(
Kw)
4.3.2 Calculation Table of Electric Power Table based on Indonesian
Shipyard (PT PAL) Requirements
This table calculates required electric power table based on the usage of
item from Indonesian Shipyard (PT PAL) Requirements and also uses load factor
from Indonesian Shipyard (PT PAL) Requirements too. The blue marks on this
table represent the items belong to Indonesian Shipyard (PT PAL) Requirements
table. From table 4.3 uses items and Load Factors from actual condition.
Tab
le 4
. 3
Req
uir
ed
ele
ctr
ic p
ow
er
Tab
le b
ase
d o
n I
nd
on
esi
an
Sh
ipyard
(P
T P
AL)
Req
uir
em
en
ts

39
% (K
w)
% (K
w)
% (K
w)
% (K
w)
ODM
Sum
plin
g pum
p1
2.2
2.7
802.
2
Lifes
avin
g boa
t: da
vit
13.
74.
3
Lifes
avin
g boa
t(pa
ssen
ger u
se)
118
.520
.3
Foam
fire
ext
ingu
ishin
g pum
p1
1112
.3
Was
te o
il ta
nk st
ove
13
Cook
ing r
oom
fan
10.
20.
360
0.2
600.
260
0.2
Also
func
tion
as va
poriz
er at
the
sam
e tim
e
Resid
ence
qua
rter A
ir Co
nditi
onin
g Uni
t; Co
mpr
esso
r1
1517
.380
13.8
8013
.880
13.8
Obse
rvat
ion
room
12.
22.
780
1.4
801.
480
1.4
Prio
rity c
ut-o
ff
Prov
ision
dav
it1
1.5
1.8
Prov
ision
s fre
ezer
23
3.3
802.
680
2.6
802.
6
Cook
ing r
ange
119
6011
.460
11.4
6011
.4
Supp
ortin
g Boi
ler:
Fan
137
40.3
8534
8534
8534
Supp
ortin
g Boi
ler:
F.O.
Pum
p1
2.2
2.7
651.
765
1.7
852.
2
Supp
ortin
g Boi
ler:
F.O.
Hea
ter
17
Supp
ortin
g Boi
ler:
Wat
er su
pply
pum
p2
1112
.385
10.5
8510
.585
10.5
Supp
ortin
g Boi
ler:
was
te o
il pu
mp
10.
40.
5
Calo
rifie
r1
3
Mai
n Ai
r Com
pres
sor
218
.520
.480
16.3
Fres
h w
ater
pum
p1
3742
.385
3685
3685
36
Balla
st p
ump
130
32.3
8527
.5
AFO
trans
fer p
ump
11.
51.
885
1.5
851.
5
CFO
trans
fer p
ump
(Eng
ine
room
)1
2.2
2.7
852.
3
L.O. t
rans
fer p
ump
10.
750.
980
0.7
Engi
ne ro
om b
ilge
pum
p1
0.75
0.9
850.
75
Slud
ge p
ump
11.
51.
8
Purif
ier p
ump
22.
22.
780
x 2
4.3
80 x
24.
380
x 2
4.3
Elec
tric c
hain
lock
11.
31.
6
Elec
tric w
eldi
ng m
achi
ne1
28
I n t e r m i t t e n t u s e i t e m s
Insp
ecte
d Ite
ms
Elec
tric M
otor
Tota
l Inp
ut
Pow
er
(Kw
)
Rem
ark
Amou
nt o
f
Unit
Outp
ut
Pow
er
(Kw
)
Durin
g Sai
ling
Durin
g In-
Out P
ort
Proc
cess
Durin
g Loa
ding
and
Unlo
adin
gDu
ring A
ncho
rage
Cons
umpt
ion
rate(%)
and
Elec
tric P
ower
Com
sum
ptio
n Am
ount(
Kw)
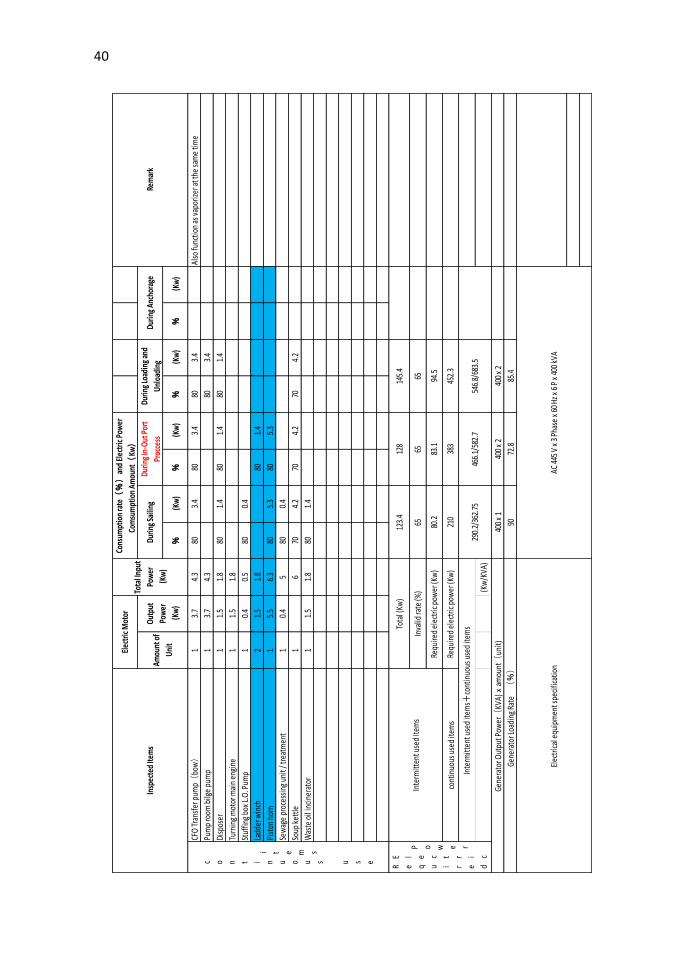
40
% (K
w)
% (K
w)
% (K
w)
% (K
w)
CFO
Tra
nsfe
r pum
p(bo
w)
13.
74.
380
3.4
803.
480
3.4
Also
func
tion
as v
apor
izer
at t
he sa
me
time
Pum
p ro
om b
ilge
pum
p1
3.7
4.3
803.
4
Disp
oser
11.
51.
880
1.4
801.
480
1.4
Turn
ing
mot
or m
ain
engi
ne1
1.5
1.8
Stuf
fing
box
L.O
. Pum
p1
0.4
0.5
800.
4
Ladd
er w
inch
21.
51.
880
1.4
Pist
on h
orn
15.
56.
380
5.3
805.
3
Sew
age
proc
essi
ng u
nit /
trea
tmen
t1
0.4
580
0.4
Soup
ket
tle1
670
4.2
704.
270
4.2
Was
te o
il in
cine
rato
r1
1.5
1.8
801.
4
cont
inuo
us u
sed
item
s
(Kw
/KVA
)
Elec
tric
al e
quip
men
t spe
cific
atio
n
Gene
rato
r Out
put P
ower(
KVA)x
amou
nt(
unit)
Gene
rato
r Loa
ding
Rat
e (%)
Durin
g Lo
adin
g an
d
Unl
oadi
ngDu
ring
Anch
orag
e
c o n t i n u o u s u s e
i t e m s
R e q u i r e d
E l e c t r i c
P o w e r
Inte
rmitt
ent u
sed
Item
s
Tota
l (Kw
)
Inva
lid ra
te (%
)
Requ
ired
elec
tric
pow
er (K
w)
Requ
ired
elec
tric
pow
er (K
w)
Inte
rmitt
ent u
sed
item
s+co
ntin
uous
use
d ite
ms
123.
4
6565
Rem
ark
Insp
ecte
d Ite
ms
Elec
tric
Mot
or
Tota
l Inp
ut
Pow
er
(Kw
)Am
ount
of
Uni
t
Out
put
Pow
er
(Kw
)
Durin
g Sa
iling
Durin
g In
-Out
Por
t
Proc
cess
Cons
umpt
ion
rate(%)
and
Elec
tric
Pow
er
Com
sum
ptio
n Am
ount(
Kw)
128
145.
4
65
80.2
83.1
94.5
210
383
452.
3
290.
2/36
2.75
466.
1/58
2.7
546.
8/68
3.5
400
x 1
400
x 2
400
x 2
9072
.885
.4
AC 4
45 V
x 3
Pha
se x
60
Hz x
6 P
x 4
00 k
VA

41
Ship
owne
rSh
ip ty
pe
% (K
w)
% (K
w)
% (K
w)
% (K
w)
Stee
ring
Mac
hine
15.
56.
320
1.3
201.
3
Pow
er P
ack
Elec
tric
Mot
or3
145
152.
640
x 2
116
40 x
211
6
Engi
ne ro
om e
xhau
st fa
n1
2.2
2.7
802.
280
2.2
802.
280
2.2
Pior
ity
cut-
off
Butt
erw
orth
pum
p1
5557
.385
48.7
Pior
ity
cut-
off
Gas
-fre
e Fa
n1
3739
.380
31.4
Pior
ity
cut-
off
Resi
denc
ial Q
uart
er A
ir C
ondi
tion
ing
Uni
t; C
ompr
esso
r1
5.5
6.3
805
805
805
805
Obs
erva
tion
room
10.
20.
380
0.2
800.
280
0.2
800.
2
Engi
ne ro
om v
enti
lato
r2
7.5
8.3
85 x
214
85 x
214
85 x
214
806.
6
Pum
p ro
om e
xhau
st fa
n1
2.2
2.7
802.
2
Mai
n se
a-w
ater
coo
ling
pum
p1
1112
.385
10.5
8510
.5
Mai
n fr
esh
wat
er c
oolin
g pu
mp
25.
56.
385
5.3
855.
3
Mai
n F.
O. s
uppl
y pu
mp
21.
51.
980
1.4
801.
4
Spar
e L.
O. p
ump
118
.520
.465
13.3
6513
.3
Sea-
wat
er s
ervi
ce p
ump
115
17.3
8013
.880
13.8
8013
.880
13.8
Sea-
wat
er c
oole
r gen
erat
or1
5.5
6.3
805.
180
5.1
Aux
iliar
y bl
ower
215
16.3
80 x
226
.1
Fire
ext
ingu
ishe
r - m
isc.
pum
p1
3740
.375
30.2
Exha
ust g
as c
ircu
lato
ry p
ump
22.
22.
780
2.2
Wat
er s
uppl
y m
achi
ne: S
ea-w
ater
coo
ler p
ump
15.
56.
380
5.1
Wat
er s
uppl
y m
achi
ne: V
acuu
m p
ump
15.
56.
380
5.1
Wat
er s
uppl
y m
achi
ne: D
isti
lled
wat
er p
ump
10.
750.
985
0.75
F.O
. Pur
rifi
er2
5.5
6.3
80 x
210
.180
580
580
5
L.O
. Pur
rifi
er1
5.5
6.3
805
Tran
sfor
mer(
AC1
00
load)
315
40 x
318
50 x
322
.550
x 3
22.5
35 x
3
15.8
War
m w
ater
cir
cula
tory
pum
p1
0.4
0.5
800.
480
0.4
800.
480
0.4
Pow
er P
ack
Hyd
raul
ic o
il pu
mp
12.
63.
180
2.5
802.
5
c o n t i n u o u s u s e i t e m s
SNO
.
Insp
ecte
d It
ems
Elec
tric
Mot
or
Tota
l Inp
ut
Pow
er
(Kw
)A
mou
nt o
f
Uni
t
Out
put
Pow
er
(Kw
)
Dur
ing
Saili
ngRe
mar
kD
urin
g En
try-
Dep
artu
re
Port
Pro
cess
Dur
ing
Load
ing
and
Unl
oadi
ngD
urin
g A
ncho
rage
Cons
umpt
ion
rate(%)
and
Elec
tric
Pow
er
Com
sum
ptio
n A
mou
nt(
Kw)
Tab
le 4
. 4
Req
uir
ed
Ele
ctr
ic P
ow
er
Tab
le b
ase
d o
n I
nd
on
esi
an
Sh
ipyard
(P
T P
AL)
Req
uir
em
ets
wit
h A
ctu
al
Co
nd
itio
n’s
Lo
ad
Facto
r

42
% (K
w)
% (K
w)
% (K
w)
% (K
w)
ODM
Sum
plin
g pum
p1
2.2
2.7
802.
2
Lifes
avin
g boa
t: da
vit
13.
74.
3
Lifes
avin
g boa
t(pa
ssen
ger u
se)
118
.520
.3
Foam
fire
ext
ingu
ishin
g pum
p1
1112
.3
Was
te o
il ta
nk st
ove
13
Cook
ing r
oom
fan
10.
20.
360
0.2
600.
260
0.2
800.
2Al
so fu
nctio
n as
vapo
rizer
at th
e sa
me
time
Resid
ence
qua
rter A
ir Co
nditi
onin
g Uni
t; Co
mpr
esso
r1
1517
.380
13.8
8013
.880
13.8
8013
.8
Obse
rvat
ion
room
12.
22.
780
1.4
801.
480
1.4
801.
4Pr
iorit
y cut
-off
Prov
ision
dav
it1
1.5
1.8
Prov
ision
s fre
ezer
23
3.3
802.
680
2.6
802.
680
2.6
Cook
ing r
ange
119
6011
.460
11.4
6011
.470
13.3
Supp
ortin
g Boi
ler:
Fan
137
40.3
8534
8534
8534
8032
.2
Supp
ortin
g Boi
ler:
F.O.
Pum
p1
2.2
2.7
651.
765
1.7
852.
280
2.2
Supp
ortin
g Boi
ler:
F.O.
Hea
ter
17
Supp
ortin
g Boi
ler:
Wat
er su
pply
pum
p2
1112
.385
10.5
8510
.585
10.5
809.
8
Supp
ortin
g Boi
ler:
was
te o
il pu
mp
10.
40.
5
Calo
rifie
r1
3
Mai
n Ai
r Com
pres
sor
218
.520
.480
16.3
Fres
h w
ater
pum
p1
3742
.385
3685
3685
36
Balla
st p
ump
130
32.3
8527
.5
AFO
trans
fer p
ump
11.
51.
885
1.5
851.
580
1.4
CFO
trans
fer p
ump
(Eng
ine
room
)1
2.2
2.7
852.
3
L.O. t
rans
fer p
ump
10.
750.
980
0.7
Engi
ne ro
om b
ilge
pum
p1
0.75
0.9
850.
75
Slud
ge p
ump
11.
51.
8
Purif
ier p
ump
22.
22.
780
x 2
4.3
80 x
24.
380
x 2
4.3
802.
2
Elec
tric c
hain
lock
11.
31.
6
Elec
tric w
eldi
ng m
achi
ne1
28
I n t e r m i t t e n t u s e i t e m s
Insp
ecte
d Ite
ms
Elec
tric M
otor
Tota
l Inp
ut
Pow
er
(Kw
)
Rem
ark
Amou
nt o
f
Unit
Outp
ut
Pow
er
(Kw
)
Durin
g Sai
ling
Durin
g In-
Out P
ort
Proc
cess
Durin
g Loa
ding
and
Unlo
adin
gDu
ring A
ncho
rage
Cons
umpt
ion
rate(%)
and
Elec
tric P
ower
Com
sum
ptio
n Am
ount(
Kw)
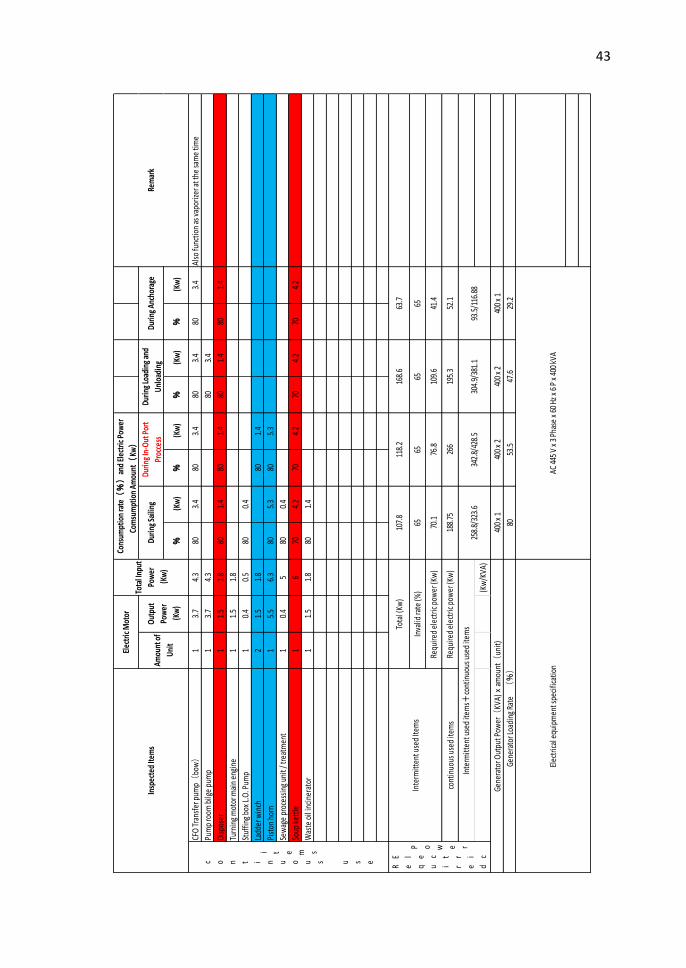
43
% (K
w)
% (K
w)
% (K
w)
% (K
w)
CFO
Tra
nsfe
r pum
p(bo
w)
13.
74.
380
3.4
803.
480
3.4
803.
4Al
so fu
nctio
n as
vap
oriz
er a
t the
sam
e tim
e
Pum
p ro
om b
ilge
pum
p1
3.7
4.3
803.
4
Disp
oser
11.
51.
880
1.4
801.
480
1.4
801.
4
Turn
ing
mot
or m
ain
engi
ne1
1.5
1.8
Stuf
fing
box
L.O
. Pum
p1
0.4
0.5
800.
4
Ladd
er w
inch
21.
51.
880
1.4
Pist
on h
orn
15.
56.
380
5.3
805.
3
Sew
age
proc
essi
ng u
nit /
trea
tmen
t1
0.4
580
0.4
Soup
ket
tle1
670
4.2
704.
270
4.2
704.
2
Was
te o
il in
cine
rato
r1
1.5
1.8
801.
4
cont
inuo
us u
sed
item
s
(Kw
/KVA
)
Elec
tric
al e
quip
men
t spe
cific
atio
n
Gene
rato
r Out
put P
ower(
KVA)x
amou
nt(
unit)
Gene
rato
r Loa
ding
Rat
e (%)
Durin
g Lo
adin
g an
d
Unl
oadi
ngDu
ring
Anch
orag
e
c o n t i n u o u s u s e
i t e m s
R e q u i r e d
E l e c t r i c
P o w e r
Inte
rmitt
ent u
sed
Item
s
Tota
l (Kw
)
Inva
lid ra
te (%
)
Requ
ired
elec
tric
pow
er (K
w)
Requ
ired
elec
tric
pow
er (K
w)
Inte
rmitt
ent u
sed
item
s+co
ntin
uous
use
d ite
ms
107.
8
6565
Rem
ark
Insp
ecte
d Ite
ms
Elec
tric
Mot
or
Tota
l Inp
ut
Pow
er
(Kw
)Am
ount
of
Uni
t
Out
put
Pow
er
(Kw
)
Durin
g Sa
iling
Durin
g In
-Out
Por
t
Proc
cess
Cons
umpt
ion
rate(%)
and
Elec
tric
Pow
er
Com
sum
ptio
n Am
ount(
Kw)
118.
216
8.6
63.7
6565
70.1
76.8
109.
641
.4
188.
7526
619
5.3
52.1
258.
8/32
3.6
342.
8/42
8.5
304.
9/38
1.1
93.5
/116
.88
400
x 1
400
x 2
400
x 2
400
x 1
8053
.547
.629
.2
AC 4
45 V
x 3
Pha
se x
60
Hz x
6 P
x 4
00 k
VA

44
According to these calculation items based on design, the generators
have the maximum capacity of power 362.75 kVA in sailing condition, 582.7 kVA
in Maneuvering condition, 683.5 kVA when the ship is in loading and
discharging condition, and there is no required power in anchoring condition
because of the rules.
In this case, the maximum capacity of power is 683.5 kVA when the ship
is in loading/Discharging condition. The Load factor from Indonesian Shipyard
(PT PAL) requirements is higher than in Design from the shipyard, so in several
condition power capacity of generator is higher regarding Indonesian Shipyard
(PT PAL) Requirements. But there are many different items between table of
items based on Indonesian Shipyard (PT PAL) requirements and items in MT
SUCCESS VICTORY XXXIV, so it uses the similarity items between Indonesian
Shipyard (PT PAL) requirements and items on the ship.
Such as power pack electric motors that are not mentioned in
Indonesian Shipyard (PT PAL) requirement, whereas this item has a big capacity
of power to generate all of the other items to work.
Generator loading rates based on Indonesian Shipyard (PT PAL)
requirements is near with Design either using Load Factor from Indonesian
Shipyard (PT PAL) Requirement or from actual condition. Where based on
design MT SUCCESS VICTORY XXXIV uses two generators, and based on the
calculation table by Indonesian Shipyard (PT PAL) requirements this ship also
uses a couple of generators to operate this ship because it has similarity load
factor capacity of the generator but in Indonesian Shipyard (PT PAL)
Requirements, the load factor is higher.

45
% (K
w)%
(Kw)
% (K
w)%
(Kw)
Stee
ring M
achi
ne1
5.56.3
402.5
503.2
Powe
r Pac
k Ele
ctric
Mot
or3
145
152.6
40 x
211
640
x 2
116
Engin
e roo
m ex
haus
t fan
12.2
2.780
2.280
2.280
2.280
2.2Pi
ority
cut-o
ff
Butte
rwor
th pu
mp *
155
57.3
8045
.8Pi
ority
cut-o
ff
Gas-f
ree F
an *
137
39.3
8031
.4Pi
ority
cut-o
ff
Resid
encia
l Qua
rter A
ir Co
nditi
onin
g Uni
t; Co
mpr
esso
r1
5.56.3
805
805
805
805
Obse
rvat
ion r
oom
10.2
0.380
0.280
0.280
0.280
0.2
Engin
e roo
m ve
ntila
tor
27.5
8.380
6.680
6.680
6.680
6.6
Pum
p roo
m ex
haus
t fan
12.2
2.780
2.2
Main
sea-
wate
r coo
ling p
ump
111
12.3
809.8
809.8
Main
fres
h wat
er co
olin
g pum
p2
5.56.3
805.1
805.1
Main
F.O.
supp
ly pu
mp
21.5
1.980
1.480
1.4
Spar
e L.O
. pum
p1
18.5
20.4
6513
.3
Sea-
wate
r ser
vice p
ump
115
17.3
8013
.880
13.8
8013
.880
13.8
Sea-
wate
r coo
ler g
ener
ator
15.5
6.380
5.180
5.180
5.180
5.1
Auxil
iary b
lowe
r2
1516
.380
12
Fire e
xtin
guish
er - m
isc. p
ump
137
40.3
7530
.2
Exha
ust g
as ci
rculat
ory p
ump
22.2
2.780
2.2
Wat
er su
pply
mac
hine
: Sea
-wat
er co
oler
pum
p1
5.56.3
805.1
Wat
er su
pply
mac
hine
: Vac
uum
pum
p1
5.56.3
805.1
Wat
er su
pply
mac
hine
: Dist
illed
wat
er pu
mp
10.7
50.9
800.7
F.O. P
urrif
ier
25.5
6.380
4.480
580
580
5
L.O. P
urrif
ier
15.5
6.380
5
Tran
sform
er(
AC10
0 lo
ad)
315
40 x
318
50 x
322
.550
x 3
22.5
35 x
3 15
.8
War
m w
ater
circu
lator
y pum
p1
0.40.5
800.4
800.4
800.4
800.4
Powe
r Pac
k Hyd
raul
ic oi
l pum
p1
2.63.1
802.5
802.5
C o n t i n u o u s u s e i t e m s
Insp
ecte
d Ite
ms
Electr
ic M
otor
Tota
l Inpu
t
Powe
r
(Kw)
Amou
nt of
Unit
Outp
ut
Powe
r
(Kw)
Durin
g Sail
ing
Rem
ark
Durin
g Ent
ry-D
epar
ture
Port
Proc
ess
Durin
g Loa
ding
and
Unlo
adin
gDu
ring A
ncho
rage
Cons
umpt
ion r
ate(%)
and E
lectr
ic Po
wer
Com
sum
ptio
n Am
ount(
Kw)
4.3.3 Calculation Table of Electric Power Table Based on Actual Conditions
This table calculates required electric power table based on usage of
item from Actual Condition. The red marks on this table represent the items
which do not use in actual condition.
Tab
le 4
. 5
Req
uie
red
Po
wer
Tab
le b
ase
d o
n a
ctu
al
co
nd
itio
n

46
% (K
w)
% (K
w)
% (K
w)
% (K
w)
ODM
Sum
plin
g pum
p1
2.2
2.7
802.
2
Lifes
avin
g boa
t: da
vit
13.
74.
3
Lifes
avin
g boa
t(pa
ssen
ger u
se)
118
.520
.3
Foam
fire
ext
ingu
ishin
g pum
p1
1112
.3
Was
te o
il ta
nk st
ove
13
Cook
ing r
oom
fan
10.
20.
380
0.2
800.
280
0.2
800.
2Al
so fu
nctio
n as
vapo
rizer
at th
e sa
me
time
Resid
ence
qua
rter A
ir Co
nditi
onin
g Uni
t; Co
mpr
esso
r1
1517
.380
13.8
8013
.880
13.8
8013
.8
Obse
rvat
ion
room
12.
22.
780
1.4
801.
480
1.4
801.
4Pr
iorit
y cut
-off
Prov
ision
dav
it1
1.5
1.8
Prov
ision
s fre
ezer
23
3.3
802.
680
2.6
802.
680
2.6
Cook
ing r
ange
119
7013
.370
13.3
7013
.370
13.3
Supp
ortin
g Boi
ler:
Fan
137
40.3
8032
.280
32.2
8032
.280
32.2
Supp
ortin
g Boi
ler:
F.O.
Pum
p1
2.2
2.7
802.
280
2.2
802.
280
2.2
Supp
ortin
g Boi
ler:
F.O.
Hea
ter
17
Supp
ortin
g Boi
ler:
Wat
er su
pply
pum
p2
1112
.380
9.8
809.
880
9.8
809.
8
Supp
ortin
g Boi
ler:
was
te o
il pu
mp
10.
40.
5
Calo
rifie
r1
3
Mai
n Ai
r Com
pres
sor
218
.520
.480
16.3
8016
.380
16.3
Fres
h w
ater
pum
p1
3742
.370
29.6
Balla
st p
ump
130
32.3
7022
.6
AFO
trans
fer p
ump
11.
51.
880
1.4
801.
480
1.4
801.
4
CFO
trans
fer p
ump
(Eng
ine
room
)1
2.2
2.7
802.
2
L.O. t
rans
fer p
ump
10.
750.
980
0.7
Engi
ne ro
om b
ilge
pum
p1
0.75
0.9
Slud
ge p
ump
11.
51.
8
Purif
ier p
ump
22.
22.
780
2.2
802.
280
2.2
802.
2
Elec
tric c
hain
lock
11.
31.
6
Elec
tric w
eldi
ng m
achi
ne1
28
I n t e r m i t t e n t u s e i t e m s
Insp
ecte
d Ite
ms
Elec
tric M
otor
Tota
l Inp
ut
Pow
er
(Kw
)
Rem
ark
Amou
nt o
f
Unit
Outp
ut
Pow
er
(Kw
)
Durin
g Sai
ling
Durin
g In-
Out P
ort
Proc
cess
Durin
g Loa
ding
and
Unlo
adin
gDu
ring A
ncho
rage
Cons
umpt
ion
rate(%)
and
Elec
tric P
ower
Com
sum
ptio
n Am
ount(
Kw)

47
% (K
w)
% (K
w)
% (K
w)
% (K
w)
CFO
Tran
sfer
pum
p(bo
w)
13.
74.
380
3.4
803.
480
3.4
803.
4Al
so fu
nctio
n as
vapo
rizer
at th
e sa
me
time
Pum
p ro
om b
ilge
pum
p1
3.7
4.3
803.
4
Disp
oser
11.
51.
880
1.4
801.
480
1.4
801.
4
Turn
ing m
otor
mai
n en
gine
11.
51.
8
Stuf
fing b
ox L.
O. P
ump
10.
40.
580
0.4
Ladd
er w
inch
21.
51.
8
Pist
on h
orn
15.
56.
3
Sew
age
proc
essin
g uni
t / tr
eatm
ent
10.
45
800.
4
Soup
kettl
e1
670
4.2
704.
270
4.2
704.
2
Was
te o
il in
ciner
ator
11.
51.
880
1.4
Cont
inuo
us u
sed
item
s
(Kw
/KVA
)
6646
.385
.529
.2
AC 44
5 V x
3 Pha
se x
60 H
z x 6
P x 4
00 kV
A
209.
8/26
2.25
296.
4/37
0.5
274/
342
93.5
/116
.88
400 x
140
0 x 2
400 x
140
0 x 1
124.
852
66.7
41.4
8524
4.4
182.
952
.1
8010
2.72
63.7
6565
Rem
ark
Insp
ecte
d Ite
ms
Elec
tric M
otor
Tota
l Inp
ut
Pow
er
(Kw
)Am
ount
of
Unit
Outp
ut
Pow
er
(Kw
)
Durin
g Sai
ling
Durin
g In-
Out P
ort
Proc
cess
Cons
umpt
ion
rate(%)
and
Elec
tric P
ower
Com
sum
ptio
n Am
ount(
Kw)
Elec
trica
l equ
ipm
ent s
pecif
icatio
n
Gene
rato
r Out
put P
ower(
KVA)x
amou
nt(
unit)
Gene
rato
r Loa
ding
Rat
e (%)
Durin
g Loa
ding
and
Unlo
adin
gDu
ring A
ncho
rage
C o n t i n u o u s u s e
i t e m s
R e q u i r e d
E l e c t r i c
P o w e r
Inte
rmitt
ent u
sed
Item
s
Tota
l (Kw
)
Inva
lid ra
te (%
)
Requ
ired
elec
tric p
ower
(Kw
)
Requ
ired
elec
tric p
ower
(Kw
)
Inte
rmitt
ent u
sed
item
s+Co
ntin
uous
use
d ite
ms
192
6565
48
According to these calculation items based on design, the generators
have the maximum capacity of power 262.25 kVA in sailing condition, 370.5 kVA
in Maneuvering condition, 342 kVA when the ship is in loading and
discharging/discharging condition, and 116.88 in Anchoring condition.
In this case, the maximum capacity of power is 370 kVA when the ship is
in sailing condition. It may possible even though based on design discharging
uses the highest power capacity. So, there are different calculations between
the table of items based on design, Indonesian Shipyard (PT PAL) requirements
and actual condition of MT SUCCESS VICTORY XXXIV.
Based on analyzing in actual condition power pack electric motors did
not use as it should be operated. Because of that, maneuvering has higher
power capacity than loading/discharging condition. In loading/discharging
condition power pack electric motors should use all of those items, but in actual
condition, in loading/discharging and maneuvering condition the crews of ship
turn on power pack electric motors only two items. In addition, because of the
different climates, temperatures, weathers, sea areas and many other factors
between Indonesia and Japan, crews of the ship did not use some items
because that ship is not too need those items such as: Residencial Quarter Air
Conditioning Unit; Compressor, Spare L.O. pump, Exhaust gas circulatory pump,
Warm water circulatory pump, Cooking room fan, and other items that have
mentioned by the red marks in this table. So, all of the conditions have
decreasing power capacity because of items using that are not suitable for the
first design in Murakami shipyard which has different factors (climates,
temperatures, weathers, sea areas) for ship in Indonesia.
Generator loading rates based on actual conditions are 66% in sailing condition,
46.3% in maneuvering condition using two generators, 85.5% in loading and
discharging condition, and 29.2% in anchoring condition . Assumed this ship
uses the generator from Murakami shipyard, were based on design MT
SUCCESS VICTORY XXXIV uses two generators, even though there are high the
rest of the power capacity of the generator.
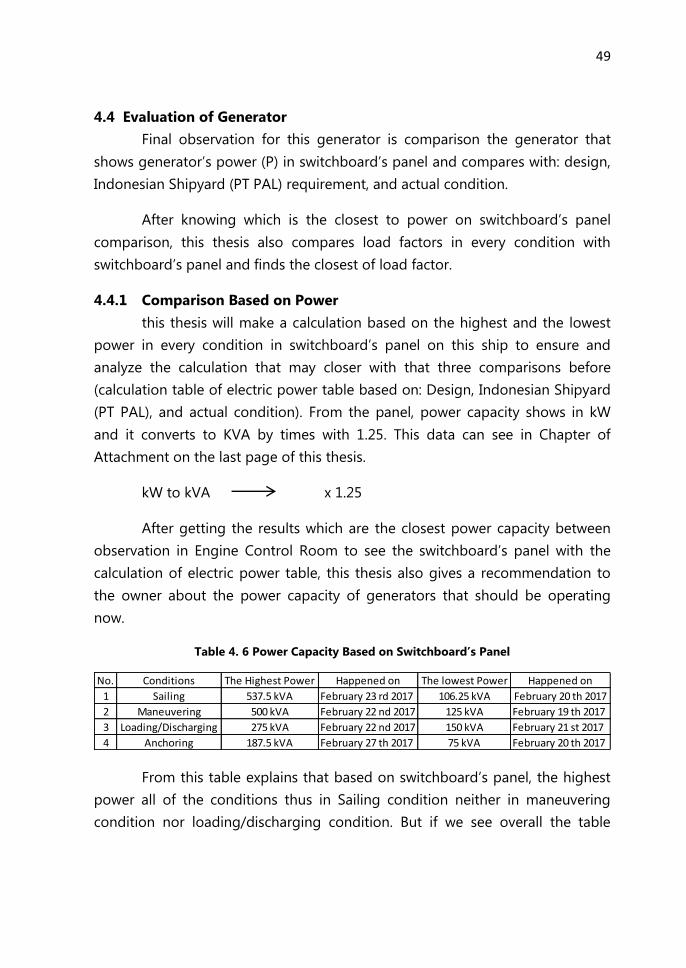
49
4.4 Evaluation of Generator
Final observation for this generator is comparison the generator that
shows generator’s power (P) in switchboard’s panel and compares with: design,
Indonesian Shipyard (PT PAL) requirement, and actual condition.
After knowing which is the closest to power on switchboard’s panel
comparison, this thesis also compares load factors in every condition with
switchboard’s panel and finds the closest of load factor.
4.4.1 Comparison Based on Power
this thesis will make a calculation based on the highest and the lowest
power in every condition in switchboard’s panel on this ship to ensure and
analyze the calculation that may closer with that three comparisons before
(calculation table of electric power table based on: Design, Indonesian Shipyard
(PT PAL), and actual condition). From the panel, power capacity shows in kW
and it converts to KVA by times with 1.25. This data can see in Chapter of
Attachment on the last page of this thesis.
kW to kVA x 1.25
After getting the results which are the closest power capacity between
observation in Engine Control Room to see the switchboard’s panel with the
calculation of electric power table, this thesis also gives a recommendation to
the owner about the power capacity of generators that should be operating
now.
Table 4. 6 Power Capacity Based on Switchboard’s Panel
From this table explains that based on switchboard’s panel, the highest
power all of the conditions thus in Sailing condition neither in maneuvering
condition nor loading/discharging condition. But if we see overall the table
No. Conditions The Highest Power Happened on The lowest Power Happened on
1 Sailing 537.5 kVA February 23 rd 2017 106.25 kVA February 20 th 2017
2 Maneuvering 500 kVA February 22 nd 2017 125 kVA February 19 th 2017
3 Loading/Discharging 275 kVA February 22 nd 2017 150 kVA February 21 st 2017
4 Anchoring 187.5 kVA February 27 th 2017 75 kVA February 20 th 2017

50
before, maneuvering and loading/discharging condition use high power
capacity constantly.
Back to calculation table of electric power table, to match it with
switchboard’s panel, this thesis uses the highest power capacity by the final
result of required electric power from these three comparisons (based on:
Design, Indonesian Shipyard (PT PAL) Requirements, Actual Condition) to
compare with switchboard’s panel.
Based on design: the highest power capacity is 712.8 kVA when the ship
in Loading/Discharging condition and it compares with the highest
power capacity in the panel is 537.5 kVA. There is a gap in power
capacity between design and panel that has 175.3 kVA.
Based on Indonesian Shipyard (PT PAL) Requirements: the highest
power capacity is 683.5 kVA when the ship in sailing condition and it
compares with the highest
power capacity in the panel is 537.5 kVA. There is a gap in power
capacity between design and panel that has 176 kVA.
Based on Actual Condition: the highest power capacity is 370.5 kVA
when the ship in maneuvering condition and it compares with the
highest power capacity in the panel is 537.5 kVA. There is a gap in
power capacity between design and panel that has 167.5 kVA.
After getting this information we know that power capacity showed in
switchboard’s panel is closer with calculation of power table based on actual
condition eventough the gap is still far with existing condition in panel. But it is
better than in design and Indonesian Shipyard (PT PAL) requiremets. Because in
existing condition MT SUCCESS VICTORY XXXIV has couple of generators with
big power capacity, it should be installed new generator with lower capacity.
4.4.2 Comparison Based on Load Factor
This thesis will make a calculation based on the highest load factor in
every condition that will be divided by the maximum capacity of the generator
(800 kVA). in switchboard’s panel on this ship to ensure and analyze the
calculation that may closer with that three comparisons before (calculation table

51
of electric power table based on: Design, Indonesian Shipyard (PT PAL), and
actual condition). The Formula of Load Factor is:
Design from Murakami Shipyard:
Sailing Condition: Anchoring Condition:
Maneuvering Condition Loading/Discharging Condition:
Indonesian Shipyard (PT PAL) Requirement:
Sailing Condition: Anchoring Condition:
Maneuvering Condition Loading/Discharging Condition:
Actual Condition:
Sailing Condition: Anchoring Condition:
Maneuvering Condition Loading/Discharging Condition:
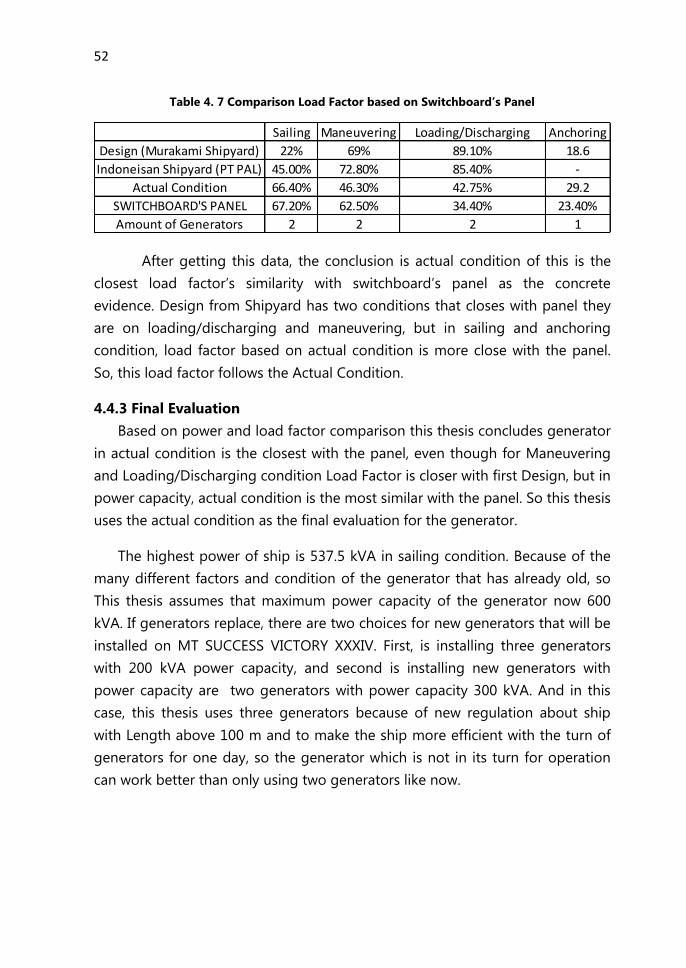
52
Table 4. 7 Comparison Load Factor based on Switchboard’s Panel
After getting this data, the conclusion is actual condition of this is the
closest load factor’s similarity with switchboard’s panel as the concrete
evidence. Design from Shipyard has two conditions that closes with panel they
are on loading/discharging and maneuvering, but in sailing and anchoring
condition, load factor based on actual condition is more close with the panel.
So, this load factor follows the Actual Condition.
4.4.3 Final Evaluation
Based on power and load factor comparison this thesis concludes generator
in actual condition is the closest with the panel, even though for Maneuvering
and Loading/Discharging condition Load Factor is closer with first Design, but in
power capacity, actual condition is the most similar with the panel. So this thesis
uses the actual condition as the final evaluation for the generator.
The highest power of ship is 537.5 kVA in sailing condition. Because of the
many different factors and condition of the generator that has already old, so
This thesis assumes that maximum power capacity of the generator now 600
kVA. If generators replace, there are two choices for new generators that will be
installed on MT SUCCESS VICTORY XXXIV. First, is installing three generators
with 200 kVA power capacity, and second is installing new generators with
power capacity are two generators with power capacity 300 kVA. And in this
case, this thesis uses three generators because of new regulation about ship
with Length above 100 m and to make the ship more efficient with the turn of
generators for one day, so the generator which is not in its turn for operation
can work better than only using two generators like now.
Sailing Maneuvering Loading/Discharging Anchoring
Design (Murakami Shipyard) 22% 69% 89.10% 18.6
Indoneisan Shipyard (PT PAL) 45.00% 72.80% 85.40% -
Actual Condition 66.40% 46.30% 42.75% 29.2
SWITCHBOARD'S PANEL 67.20% 62.50% 34.40% 23.40%
Amount of Generators 2 2 2 1

53
CHAPTER V
CONCLUSION
5.1 Conclusion
Based on observations and data analysis in Engine Control Room’s MT
SUCCESS VICTORY XXXIV, it can be concluded that
1. Generators on SUCCESS VICTOY XXXIV get a decreasing performance
power capacity because it has been using more than 15 years. The
decreasing performance of the generators is 200 kVA. And now it may
possible to this ship changes its generator with lower capacity about 600
kVA.
2. Load Factor has been decreased in each condition when it compared
with the first design the highest load factor in each condition are, 43%
for sailing condition become 33,2%, 69% for maneuvering condition
become 46,3%, 89,1% for loading/discharging condition become
42,75%, and 18,6% for anchoring condition became 14,6%
3. There are some items that do not use again in MT SUCCESS VICTORY
XXXIV because of many factors such as the different climates,
temperatures, weathers, sea areas.
4. This ship should be using three generators with power of capacity 200
kVA for each Generator because of new regulation about ship with
Length above 100 m and to make ship more efficient with the turn of
generators for one day, so the generator which is not in its turn for
operation can work better than only using two generators like now.
5.2 recommendation
The recommendations from this research are:
1. there is further research to analyze fuel efficiency on the ship based on
generator usage.
2. There is further research to analyze the effects of generator usage if it
does not match with power capacity

54
“This page intentionally left blank”

55
Bibliography
Alimuddin. (2014). Analisa Efisiensi Konsumsi Energi Listrik Pada Kapal Motor
Penumpang Nusa Mulia.
Antonov, & Natalinus. (2013). PENGARUH PERUBAHAN TEGANGAN SUMBER
TERHADAP KARAKTERISTIK FAKTOR DAYA.
Hall, D. T. (1999). Practical Marine Electrical Knowledge. London: Witherby.
IACS. (2016). Requirement Concering Electrical And Electronic Installations. IACS.
MAES, W. (2013). Marine Electrical Knowledge. Belgium: Antwerp Maritime Academy.
Sarwito, S. (1995). Perencanaan Instalasi Listrik Kapal. Surabaya: Institut Teknologi
Sepuluh Nopember.
Sitepu, R. (2010). ANALISA KEBUTUHAN DAYA LISTRIK PADA KAPAL OFFSHORE.
Vol.IV, B. (2016). Rules for Electrical Installations. Indonesia: BKI (Persero).
Watson, G. O. (1957). Marine Electrical Practice. England: B.P Shipping.

56
“This page intentionally left blank”

57
ATTACHMENT
ATTACHMENT A
The port of Gresik
In The port of Gresik, this ship discharged 4000 Tons of Methanol for
one day. After discharging, this ship maneuvered out to the port and did
anchoring near the port to bunker, because there is also another ship want to
load or discharge in the port of Gresik. After bunkering, MT SUCCESS VICTORY
XXXIV continued its trip to Probolinggo to discharge its load again.
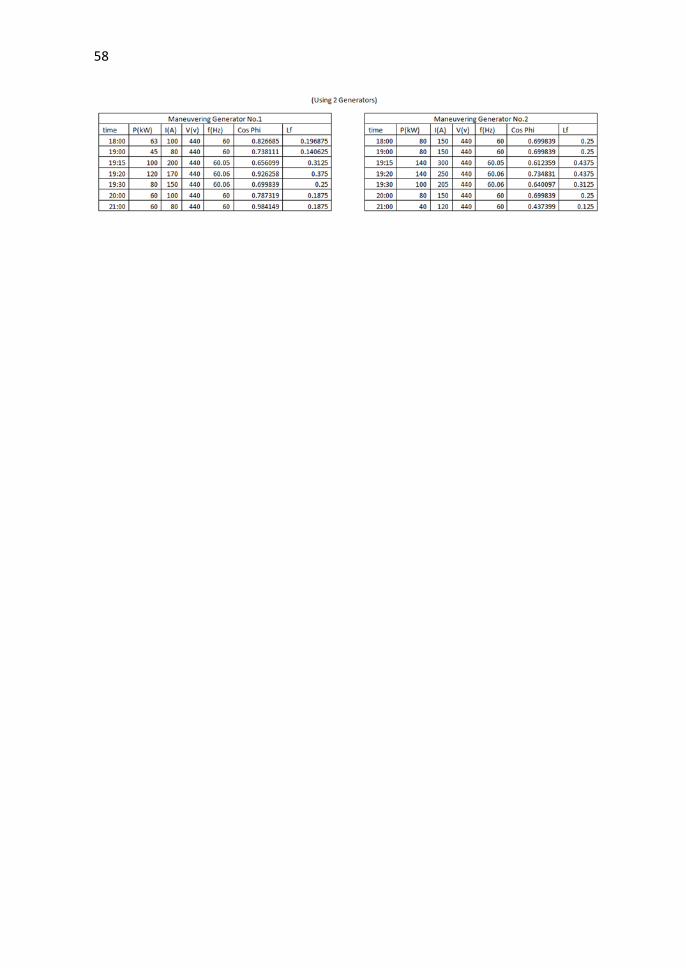
58

59
ATTACHMENT B
The port of Probolinggo
In this port, this ship sailed almost two days and waited for discharging
for two days because there were also two ships discharging in the same port.
After getting its turn to discharge, this ship discharged 2000 Tons of Methanol
for one day and left this port after discharging immediately.
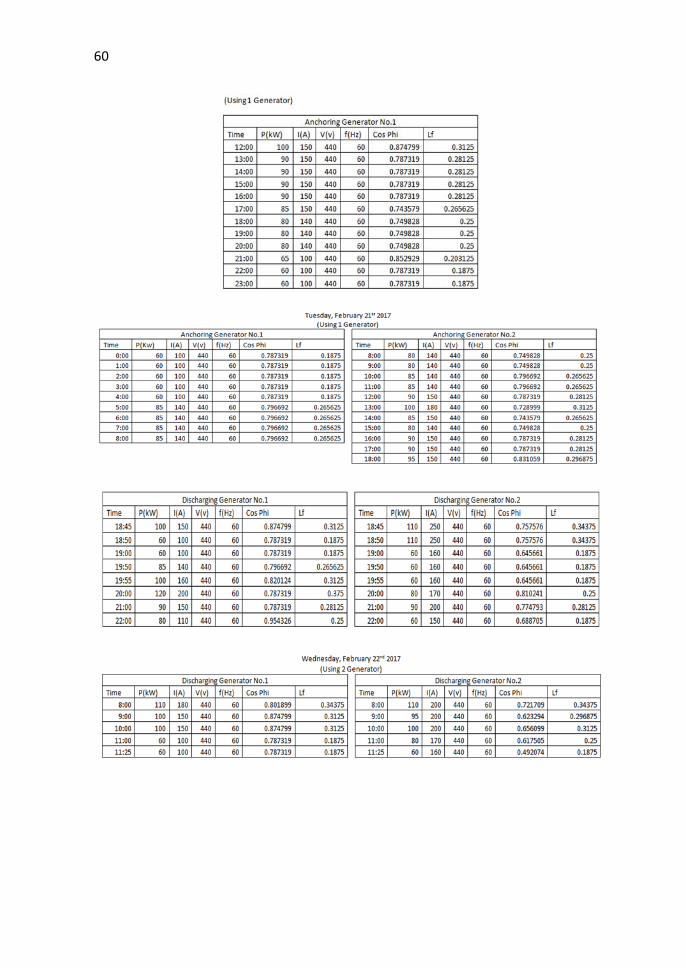
60

61

62
“This page intentionally left blank”

63
ATTACMENT C
The port of Bontang
In Bontang, this ship back to charge its load with full capacity. But in this
case, this ship waited 4 days to charge the load because the port in this city is
very busy. After charging its load with Methanol again, this ship sailed to Banten
for discharging its load in 2 ports in Banten (Merak and Anyer).
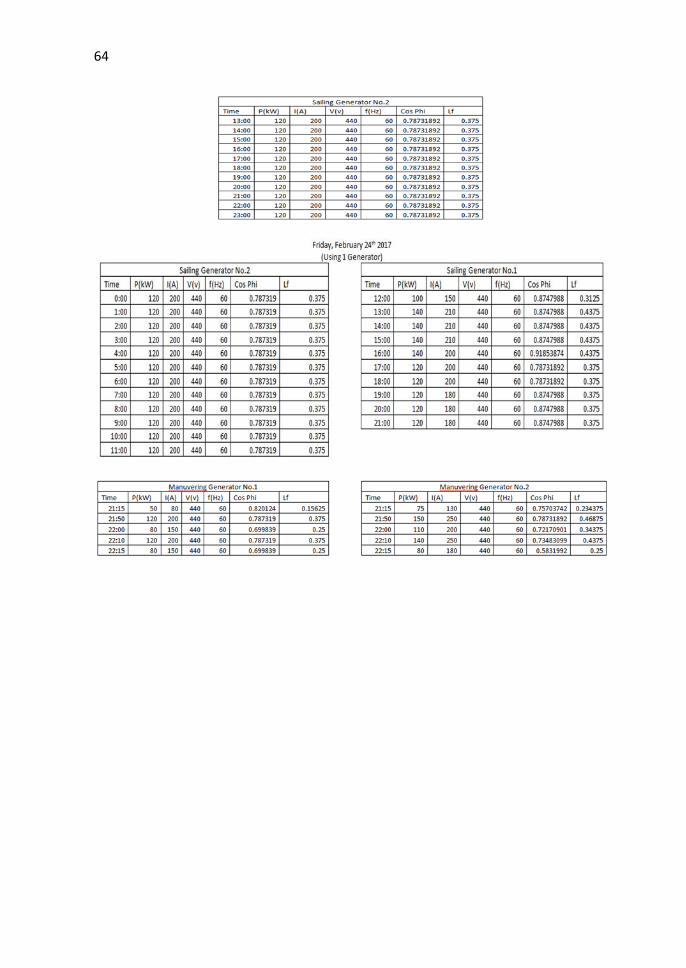
64
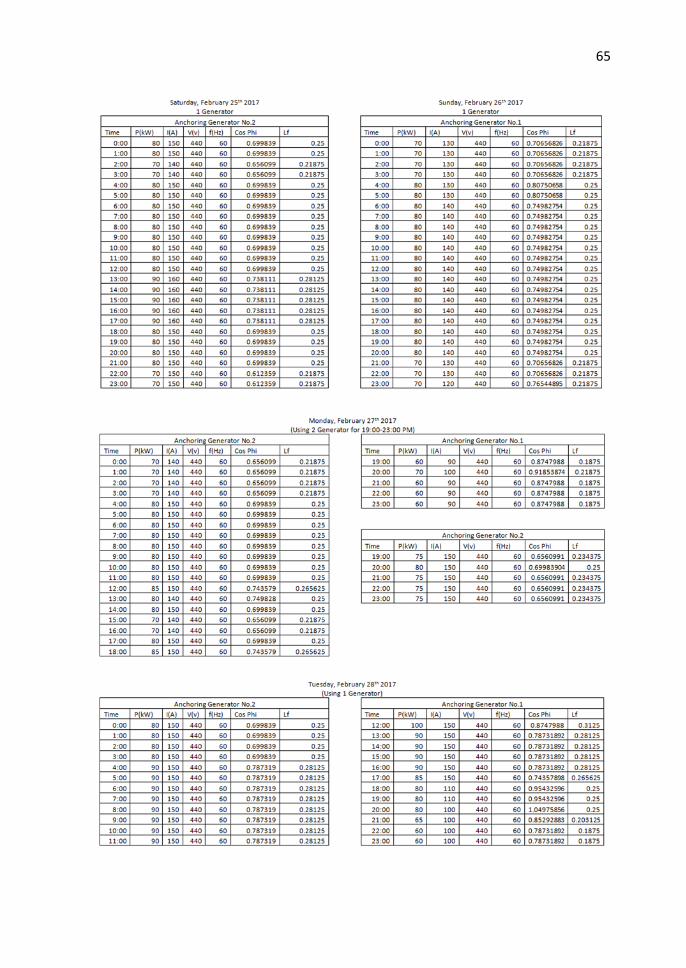
65

66

67

68
“This page intentionally left blank”
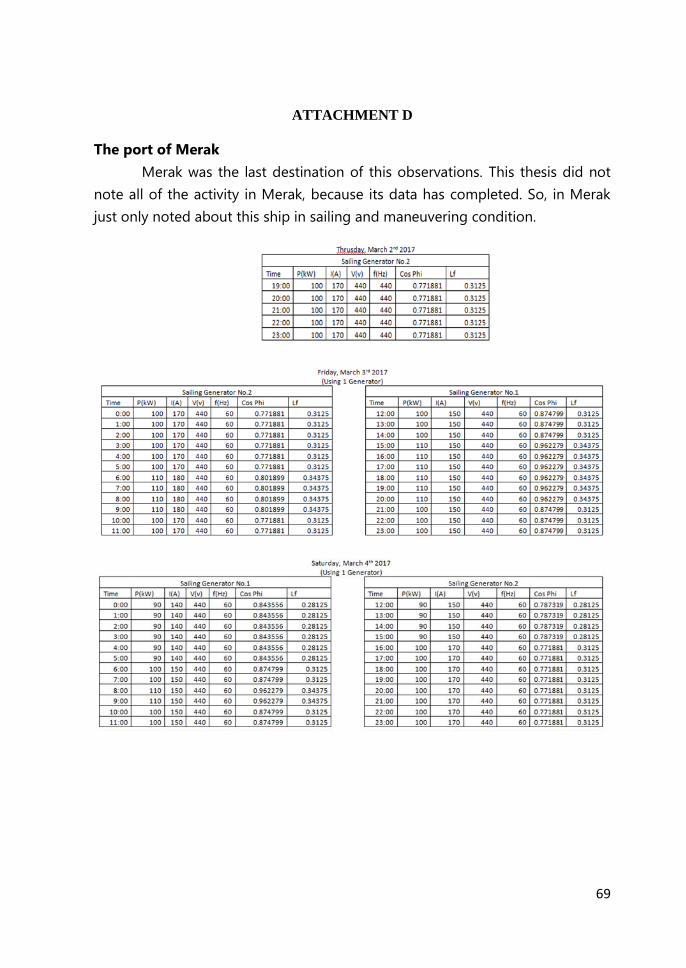
69
ATTACHMENT D
The port of Merak
Merak was the last destination of this observations. This thesis did not
note all of the activity in Merak, because its data has completed. So, in Merak
just only noted about this ship in sailing and maneuvering condition.
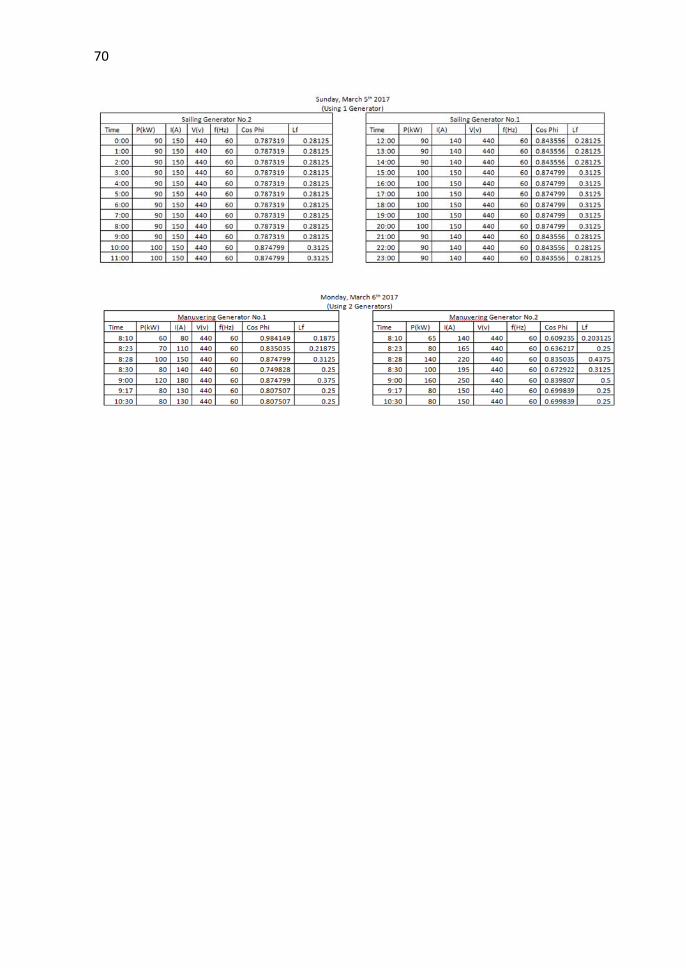
70

71
WRITER PROFILE
The writer named Hikari Qurrata’ain Nurhadi was born in
Tangerang, May 2nd 1995. The writer studied elementary
school at SDIT Asy-Syukriyyah Tangerang, junior high
school at SMPI Nurul Fikri Boarding School Anyer and
senior high school at SMAN 5 Kota Tangerang. Then the
writer continues the education at Department of Marine
Engineering Double Degree, Institut Teknologi Sepuluh
Nopember-Hochschule Wismar in 2013. During college,
the writer gets part of KANS JATIM, Marine Innovation
and Technology Club (METIC), and Lembaga Dakwah
Jurusan (LDJ) at Department of Marine Engineering ITS.
At the 3rd year of study, the writer joined Marine Electrical and Automatical
System (MEAS) Laboratory and finished the study for an 8th semester.