Generation and analysis of a protein-protein interface data set with similar chemical and spatial...
15
Generation and Analysis of a Protein–Protein Interface Data Set With Similar Chemical and Spatial Patterns of Interactions Shira Mintz, 1† Alexandra Shulman-Peleg, 2 Haim J. Wolfson, 2 and Ruth Nussinov 1,3 * 1 Sackler Institute of Molecular Medicine, Department of Human Genetics and Molecular Medicine, Sackler School of Medicine, Tel Aviv University, Tel Aviv, Israel 2 School of Computer Science, Raymond and Beverly Sackler, Faculty of Exact Sciences, Tel Aviv University, Tel Aviv, Israel 3 Basic Research Program, SAIC-Frederick, Inc., Laboratory of Experimental and Computational Biology, Frederick, Maryland ABSTRACT Protein–protein interfaces are re- gions between 2 polypeptide chains that are not covalently connected. Here, we have created a non- redundant interface data set generated from all 2-chain interfaces in the Protein Data Bank. This data set is unique, since it contains clusters of interfaces with similar shapes and spatial organiza- tion of chemical functional groups. The data set allows statistical investigation of similar interfaces, as well as the identification and analysis of the chemical forces that account for the protein–pro- tein associations. Toward this goal, we have devel- oped I2I-SiteEngine (Interface-to-Interface Si- teEngine) [Data set available at http:// bioinfo3d.cs.tau.ac.il/Interfaces; Web server: http:// bioinfo3d.cs.tau.ac.il/I2I-SiteEngine]. The algorithm recognizes similarities between protein–protein binding surfaces. I2I-SiteEngine is independent of the sequence or the fold of the proteins that com- prise the interfaces. In addition to geometry, the method takes into account both the backbone and the side-chain physicochemical properties of the interacting atom groups. Its high efficiency makes it suitable for large-scale database searches and classi- fications. Below, we briefly describe the I2I-Si- teEngine method. We focus on the classification process and the obtained nonredundant protein– protein interface data set. In particular, we analyze the biological significance of the clusters and present examples which illustrate that given constellations of chemical groups in protein–protein binding sites may be preferred, and are observed in proteins with different structures and different functions. We ex- pect that these would yield further information regarding the forces stabilizing protein–protein in- teractions. Proteins 2005;61:6 –20. © 2005 Wiley-Liss, Inc. Key words: protein–protein interactions; protein binding sites; data set of protein–pro- tein interfaces; structural comparison of binding sites; alignment of inter- faces, physicochemical properties INTRODUCTION Most cellular processes involve association and dissocia- tion of protein molecules. Protein–protein interactions are highly diverged: They include homo- and heterocomplexes, and permanent and transient interactions. They may be large or small, hydrophobic or polar. The Protein Data Bank (PDB) 1 contains numerous examples of various types of complexes such as antigen–antibody, hormone– receptor, and enzyme–substrate/inhibitor. Given their cen- tral role in most biological processes, protein interactions have been addressed by many research groups. 2–9 They are crucial in practically all in vivo functions: cellular regulation, biosynthethic and degradation pathways, sig- nal transduction, initiation of DNA replication, transcrip- tion and translation, multimolecular assembly, viral pack- aging, the immune response, and oligomer formation. Protein–protein interactions are involved in allosteric mechanisms, in turning genes on and off, and are impor- tant for drug design. Yet, deciphering the complex nature of protein interactions has proven to be a very difficult task. In vivo, a large portion of the protein surface may be involved in binding to various molecules. Moreover, some sites bind multiple proteins of different sizes, shapes, and composition. We may not know the identity and roles of these proteins, and the pathways that might be involved. Further, some binding reactions are cooperative events, Grant sponsor: Center of Excellence in Geometric Computing and its Applications, funded by the Israel Science Foundation (adminis- tered by the Israel Academy of Sciences). Grant sponsor: Hermann Minkowski-Minerva Center for Geometry at Tel-Aviv University (in support of H. J. Wolfson). Grant sponsor: National Cancer Institute of the National Institutes of Health; Contract number: NO1-CO-12400 (to R. Nussinov). The content of this publication does not necessarily reflect the view or policies of the Department of Health and Human Services, nor does the mention of trade names, commercial products, or organization imply endorsement by the U.S. Government. The publisher or recipient acknowledges the right of the U.S. Government to retain a nonexclusive, royalty-free license in and to any copyright covering the article. † This work was performed in partial fulfillment of the requirements for an M. Sc. degree. *Correspondence to: Ruth Nussinov, Bldg. 469, Rm 151, NCI- Frederick, Frederick, MD 21702. E-mail: [email protected] Received 14 October 2004; Revised 13 February 2005; Accepted 4 March 2005 Published online 3 August 2005 in Wiley InterScience (www.interscience.wiley.com). DOI: 10.1002/prot.20580 PROTEINS: Structure, Function, and Bioinformatics 61:6 –20 (2005) © 2005 WILEY-LISS, INC.
Transcript of Generation and analysis of a protein-protein interface data set with similar chemical and spatial...

Generation and Analysis of a Protein–Protein InterfaceData Set With Similar Chemical and Spatial Patterns ofInteractionsShira Mintz,1† Alexandra Shulman-Peleg,2 Haim J. Wolfson,2 and Ruth Nussinov1,3*1Sackler Institute of Molecular Medicine, Department of Human Genetics and Molecular Medicine, Sackler School of Medicine,Tel Aviv University, Tel Aviv, Israel2School of Computer Science, Raymond and Beverly Sackler, Faculty of Exact Sciences, Tel Aviv University, Tel Aviv, Israel3Basic Research Program, SAIC-Frederick, Inc., Laboratory of Experimental and Computational Biology, Frederick, Maryland
ABSTRACT Protein–protein interfaces are re-gions between 2 polypeptide chains that are notcovalently connected. Here, we have created a non-redundant interface data set generated from all2-chain interfaces in the Protein Data Bank. Thisdata set is unique, since it contains clusters ofinterfaces with similar shapes and spatial organiza-tion of chemical functional groups. The data setallows statistical investigation of similar interfaces,as well as the identification and analysis of thechemical forces that account for the protein–pro-tein associations. Toward this goal, we have devel-oped I2I-SiteEngine (Interface-to-Interface Si-teEngine) [Data set available at http://bioinfo3d.cs.tau.ac.il/Interfaces; Web server: http://bioinfo3d.cs.tau.ac.il/I2I-SiteEngine]. The algorithmrecognizes similarities between protein–proteinbinding surfaces. I2I-SiteEngine is independent ofthe sequence or the fold of the proteins that com-prise the interfaces. In addition to geometry, themethod takes into account both the backbone andthe side-chain physicochemical properties of theinteracting atom groups. Its high efficiency makes itsuitable for large-scale database searches and classi-fications. Below, we briefly describe the I2I-Si-teEngine method. We focus on the classificationprocess and the obtained nonredundant protein–protein interface data set. In particular, we analyzethe biological significance of the clusters and presentexamples which illustrate that given constellationsof chemical groups in protein–protein binding sitesmay be preferred, and are observed in proteins withdifferent structures and different functions. We ex-pect that these would yield further informationregarding the forces stabilizing protein–protein in-teractions. Proteins 2005;61:6–20.© 2005 Wiley-Liss, Inc.
Key words: protein–protein interactions; proteinbinding sites; data set of protein–pro-tein interfaces; structural comparisonof binding sites; alignment of inter-faces, physicochemical properties
INTRODUCTION
Most cellular processes involve association and dissocia-tion of protein molecules. Protein–protein interactions arehighly diverged: They include homo- and heterocomplexes,and permanent and transient interactions. They may belarge or small, hydrophobic or polar. The Protein DataBank (PDB)1 contains numerous examples of varioustypes of complexes such as antigen–antibody, hormone–receptor, and enzyme–substrate/inhibitor. Given their cen-tral role in most biological processes, protein interactionshave been addressed by many research groups.2–9 Theyare crucial in practically all in vivo functions: cellularregulation, biosynthethic and degradation pathways, sig-nal transduction, initiation of DNA replication, transcrip-tion and translation, multimolecular assembly, viral pack-aging, the immune response, and oligomer formation.Protein–protein interactions are involved in allostericmechanisms, in turning genes on and off, and are impor-tant for drug design. Yet, deciphering the complex natureof protein interactions has proven to be a very difficulttask. In vivo, a large portion of the protein surface may beinvolved in binding to various molecules. Moreover, somesites bind multiple proteins of different sizes, shapes, andcomposition. We may not know the identity and roles ofthese proteins, and the pathways that might be involved.Further, some binding reactions are cooperative events,
Grant sponsor: Center of Excellence in Geometric Computing andits Applications, funded by the Israel Science Foundation (adminis-tered by the Israel Academy of Sciences). Grant sponsor: HermannMinkowski-Minerva Center for Geometry at Tel-Aviv University (insupport of H. J. Wolfson). Grant sponsor: National Cancer Institute ofthe National Institutes of Health; Contract number: NO1-CO-12400(to R. Nussinov). The content of this publication does not necessarilyreflect the view or policies of the Department of Health and HumanServices, nor does the mention of trade names, commercial products,or organization imply endorsement by the U.S. Government. Thepublisher or recipient acknowledges the right of the U.S. Governmentto retain a nonexclusive, royalty-free license in and to any copyrightcovering the article.
†This work was performed in partial fulfillment of the requirementsfor an M. Sc. degree.
*Correspondence to: Ruth Nussinov, Bldg. 469, Rm 151, NCI-Frederick, Frederick, MD 21702. E-mail: [email protected]
Received 14 October 2004; Revised 13 February 2005; Accepted 4March 2005
Published online 3 August 2005 in Wiley InterScience(www.interscience.wiley.com). DOI: 10.1002/prot.20580
PROTEINS: Structure, Function, and Bioinformatics 61:6–20 (2005)
© 2005 WILEY-LISS, INC.
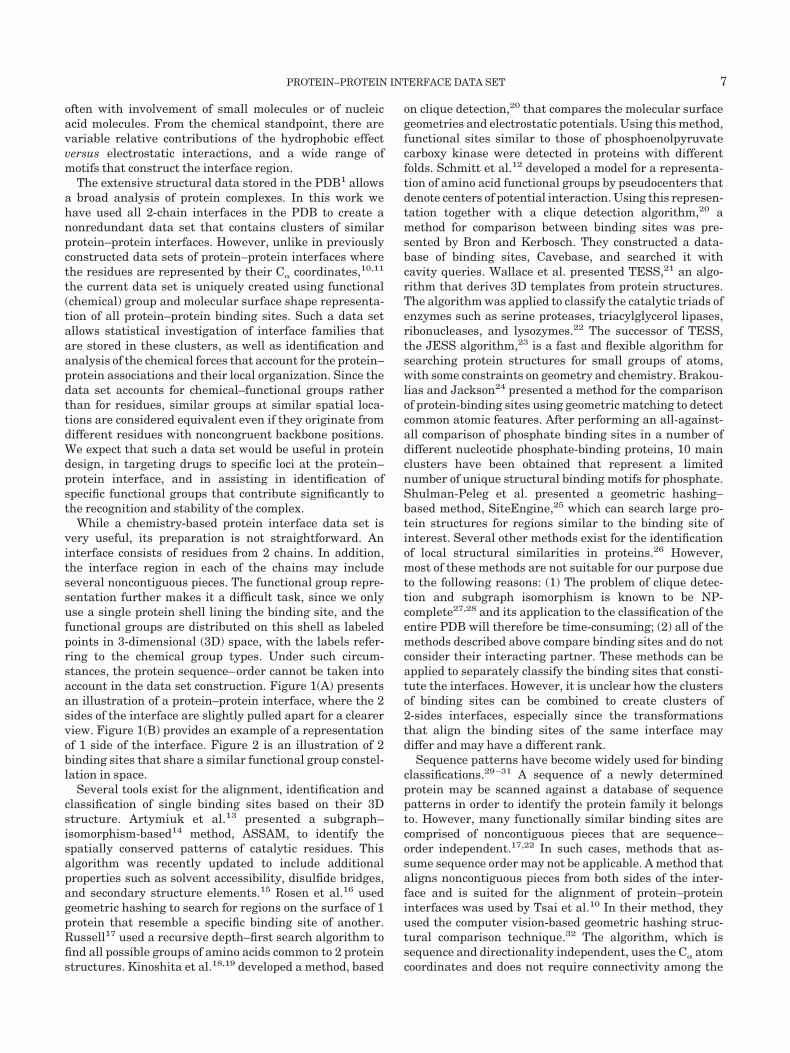
often with involvement of small molecules or of nucleicacid molecules. From the chemical standpoint, there arevariable relative contributions of the hydrophobic effectversus electrostatic interactions, and a wide range ofmotifs that construct the interface region.
The extensive structural data stored in the PDB1 allowsa broad analysis of protein complexes. In this work wehave used all 2-chain interfaces in the PDB to create anonredundant data set that contains clusters of similarprotein–protein interfaces. However, unlike in previouslyconstructed data sets of protein–protein interfaces wherethe residues are represented by their C� coordinates,10,11
the current data set is uniquely created using functional(chemical) group and molecular surface shape representa-tion of all protein–protein binding sites. Such a data setallows statistical investigation of interface families thatare stored in these clusters, as well as identification andanalysis of the chemical forces that account for the protein–protein associations and their local organization. Since thedata set accounts for chemical–functional groups ratherthan for residues, similar groups at similar spatial loca-tions are considered equivalent even if they originate fromdifferent residues with noncongruent backbone positions.We expect that such a data set would be useful in proteindesign, in targeting drugs to specific loci at the protein–protein interface, and in assisting in identification ofspecific functional groups that contribute significantly tothe recognition and stability of the complex.
While a chemistry-based protein interface data set isvery useful, its preparation is not straightforward. Aninterface consists of residues from 2 chains. In addition,the interface region in each of the chains may includeseveral noncontiguous pieces. The functional group repre-sentation further makes it a difficult task, since we onlyuse a single protein shell lining the binding site, and thefunctional groups are distributed on this shell as labeledpoints in 3-dimensional (3D) space, with the labels refer-ring to the chemical group types. Under such circum-stances, the protein sequence–order cannot be taken intoaccount in the data set construction. Figure 1(A) presentsan illustration of a protein–protein interface, where the 2sides of the interface are slightly pulled apart for a clearerview. Figure 1(B) provides an example of a representationof 1 side of the interface. Figure 2 is an illustration of 2binding sites that share a similar functional group constel-lation in space.
Several tools exist for the alignment, identification andclassification of single binding sites based on their 3Dstructure. Artymiuk et al.13 presented a subgraph–isomorphism-based14 method, ASSAM, to identify thespatially conserved patterns of catalytic residues. Thisalgorithm was recently updated to include additionalproperties such as solvent accessibility, disulfide bridges,and secondary structure elements.15 Rosen et al.16 usedgeometric hashing to search for regions on the surface of 1protein that resemble a specific binding site of another.Russell17 used a recursive depth–first search algorithm tofind all possible groups of amino acids common to 2 proteinstructures. Kinoshita et al.18,19 developed a method, based
on clique detection,20 that compares the molecular surfacegeometries and electrostatic potentials. Using this method,functional sites similar to those of phosphoenolpyruvatecarboxy kinase were detected in proteins with differentfolds. Schmitt et al.12 developed a model for a representa-tion of amino acid functional groups by pseudocenters thatdenote centers of potential interaction. Using this represen-tation together with a clique detection algorithm,20 amethod for comparison between binding sites was pre-sented by Bron and Kerbosch. They constructed a data-base of binding sites, Cavebase, and searched it withcavity queries. Wallace et al. presented TESS,21 an algo-rithm that derives 3D templates from protein structures.The algorithm was applied to classify the catalytic triads ofenzymes such as serine proteases, triacylglycerol lipases,ribonucleases, and lysozymes.22 The successor of TESS,the JESS algorithm,23 is a fast and flexible algorithm forsearching protein structures for small groups of atoms,with some constraints on geometry and chemistry. Brakou-lias and Jackson24 presented a method for the comparisonof protein-binding sites using geometric matching to detectcommon atomic features. After performing an all-against-all comparison of phosphate binding sites in a number ofdifferent nucleotide phosphate-binding proteins, 10 mainclusters have been obtained that represent a limitednumber of unique structural binding motifs for phosphate.Shulman-Peleg et al. presented a geometric hashing–based method, SiteEngine,25 which can search large pro-tein structures for regions similar to the binding site ofinterest. Several other methods exist for the identificationof local structural similarities in proteins.26 However,most of these methods are not suitable for our purpose dueto the following reasons: (1) The problem of clique detec-tion and subgraph isomorphism is known to be NP-complete27,28 and its application to the classification of theentire PDB will therefore be time-consuming; (2) all of themethods described above compare binding sites and do notconsider their interacting partner. These methods can beapplied to separately classify the binding sites that consti-tute the interfaces. However, it is unclear how the clustersof binding sites can be combined to create clusters of2-sides interfaces, especially since the transformationsthat align the binding sites of the same interface maydiffer and may have a different rank.
Sequence patterns have become widely used for bindingclassifications.29–31 A sequence of a newly determinedprotein may be scanned against a database of sequencepatterns in order to identify the protein family it belongsto. However, many functionally similar binding sites arecomprised of noncontiguous pieces that are sequence–order independent.17,22 In such cases, methods that as-sume sequence order may not be applicable. A method thataligns noncontiguous pieces from both sides of the inter-face and is suited for the alignment of protein–proteininterfaces was used by Tsai et al.10 In their method, theyused the computer vision-based geometric hashing struc-tural comparison technique.32 The algorithm, which issequence and directionality independent, uses the C� atomcoordinates and does not require connectivity among the
PROTEIN–PROTEIN INTERFACE DATA SET 7

C� points in the matching. The similarity between 2protein–protein interfaces was measured based on theextent of the geometrical superposition between theircorresponding C� atoms, the percent residue identity inthe match, and the differences in their sizes. This methodwas used by Tsai et al. to create a nonredundant data set ofprotein–protein interfaces.10 As the number of the com-plexes in PDB grew, Keskin et al.11 reapplied the methodto build an updated data set. In the construction of thedata set, the residues considered were those that interactacross the 2-chain interface and residues in their spatialvicinity. The C� atom geometrical representation led toclusters that contain similar interface architectures formedby the 2 chains. Only geometrical constraints and back-bone coordinates were used in this procedure, althoughside-chains are well known to play important roles in theinteraction between protein molecules. Another 2-sidesinterface classification was carried out by Mintseris andWeng.33 In their work, they used atomic contact vectors(ACVs) as a way to represent the physicochemical proper-ties of interfaces and used the clique detection algorithm20
to compare them. They applied the ACVs to 2 classificationproblems—distinguishing homodimers from crystal con-tacts and obligate oligomers from transient recognitioncomplexes. Using the ACVs, a nonredundant data set oftransient recognition complexes was created.
Here, our goal is to investigate the organization of thefunctional groups derived from both the backbone andside-chains of amino acids. We expect that clusters ofinterfaces with common chemical groups would be usefulin figuring out the organization of the stabilizing intermo-lecular interactions. Recognition of similar binding organi-zations shared by different protein–protein complexes isperformed by pairwise alignment between the correspond-ing protein–protein interfaces. Alignments that are basedon sequence similarity may not be sufficient for this task,since interacting residues may have similar constellationsin space, but their order on the polypeptide chain may be
Fig. 1. Physicochemical and surface representation of an interface(PDB code: 1aa7). (A) Illustration of a protein–protein interface with itssurface representation. Colors of the surface patches are determined bythe physicochemical properties of the functional groups to which itbelongs. The 2 sides of the interface are pulled apart for a clearerrepresentation. (B) An example of a surface representation of one side ofthe interface. Following Schmitt et al.,12 each pseudocenter (representedas a colored ball) represents an interaction center of one of the followingphysicochemical properties: hydrogen bond donor (blue), hydrogen bondacceptor (red), mixed donor–acceptor (green), hydrophobic aliphatic(orange), and hydrophobic aromatic (white). Each surface point isassigned a physicochemical property according to the functional group towhich it belongs.
Figure 2.
8 S. MINTZ ET AL.
different. Each region may be derived from residues indifferent parts of the sequence, or even from single sequen-tially isolated residues. The problem gets even harderwhen attempting to align regions consisting of functionalchemical groups that may derive from different residues.
To address these requirements, we have developedI2I-SiteEngine (Interface-to-Interface SiteEngine). UnlikeSiteEngine,25 whose goal is recognition of binding sites ofsmall molecules in protein structures, I2I-SiteEngine34
has been designed to recognize similarities between pro-tein–protein interfaces. I2I-SiteEngine is independent ofthe sequence or the fold of the proteins that comprise theinterfaces. In addition to geometry, the method takes intoaccount the physicochemical properties of the interactingatom groups, both backbone and side-chain. The methodperforms a simultaneous alignment of 2 binding sites thatconstitute an interface. Here, we briefly describe themethod and focus on its application to the classification ofall complexes available in the PDB. We present theclassification procedure, as well as the results obtainedfrom analysis of the interface clusters. These illustratethat similar constellations of chemical groups in theprotein–protein binding sites may be preferred, and areobserved in proteins with different structures and differ-ent functions. Recognition of common favored bindingorganizations shared by different protein families maysuggest their contribution to the formation and stability ofthe complex.
The “hot spot” residues occur in a broad range ofinterfaces.35–37 A mutation of a hot spot residue to alanineleads to a significant (��G � 2 kcal/mol) drop in the freeenergy of the protein–protein association. The hot spotshave been defined at the residue level. It has further beenshown that the experimental hot spots are highly corre-lated with the conservation of interface residues in fami-lies of 3D structures.38,39 Our data set will allow theexamination of hot spots at the functional group level,hopefully elucidating the chemical origin of the stabilizinginteractions, assisting in the identification of their typeand organization. Additionally, they may be useful in thegeneration and design of drug targets that prevent theformation of protein–protein complexes. It may also assistin the prediction of side effects caused by similar bindingpartners.
METHODSData Set Generation
The construction of the protein–protein interface dataset includes 5 stages: (1) initial extraction of all 2-chain
interfaces from the PDB; (2) filtering of the interfaces toreduce redundancy and the number of pairwise compari-sons; (3) generation of interfaces; (4) structural compari-sons; (5) ranking; and (6) clustering.
Stage 1: Initial extraction of interfaces from thePDB
Our definition of interface residues is similar to that ofTsai et al.10 and Keskin et al.11 Two residues fromdifferent chains are defined as interacting residues if thedistance between any 2 atoms of the 2 residues is less thanthe sum of their corresponding van der Waals radii plus0.5 Å. We extracted all 2-chain complexes from the PDB(excluding modeled structures, structures with a resolu-tion lower than 3.5 Å, and structures with only C� coordi-nates) that have at least 10 interacting residues in eachchain (the September 2003 release). In this scheme, aninterface will include only 2 chains, and a certain polypep-tide chain might appear in more than 1 interface, accord-ing to the number of polypeptide chains that interact withit. Through this procedure [Fig. 3(A)], 23,912 two-chaininterfaces were collected. These interfaces include differ-ent types of complexes: homodimers, heterodimers, andportions of higher complexes. Following the nomenclatureof Tsai et al.,10 an interface is named according to its PDBcode and the chains it contains (e.g., 1aa7AB is an inter-face between chain A and chain B, derived from PDB code1aa7).
Stage 2: Filtering procedures
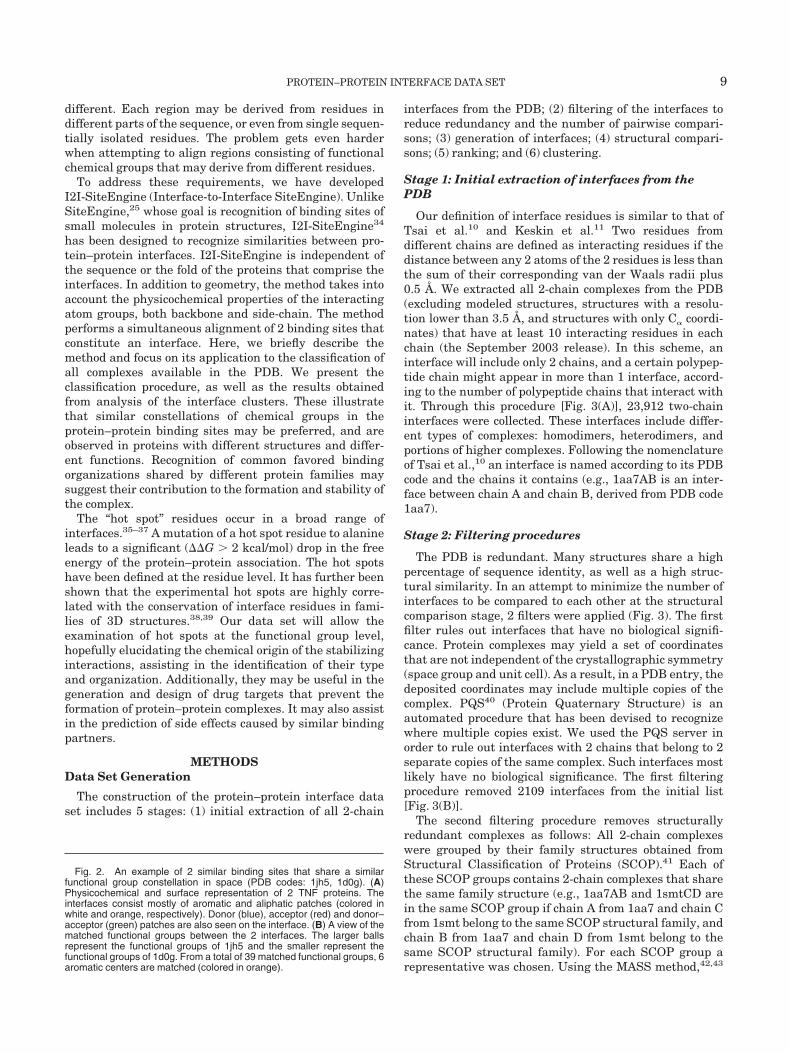
The PDB is redundant. Many structures share a highpercentage of sequence identity, as well as a high struc-tural similarity. In an attempt to minimize the number ofinterfaces to be compared to each other at the structuralcomparison stage, 2 filters were applied (Fig. 3). The firstfilter rules out interfaces that have no biological signifi-cance. Protein complexes may yield a set of coordinatesthat are not independent of the crystallographic symmetry(space group and unit cell). As a result, in a PDB entry, thedeposited coordinates may include multiple copies of thecomplex. PQS40 (Protein Quaternary Structure) is anautomated procedure that has been devised to recognizewhere multiple copies exist. We used the PQS server inorder to rule out interfaces with 2 chains that belong to 2separate copies of the same complex. Such interfaces mostlikely have no biological significance. The first filteringprocedure removed 2109 interfaces from the initial list[Fig. 3(B)].
The second filtering procedure removes structurallyredundant complexes as follows: All 2-chain complexeswere grouped by their family structures obtained fromStructural Classification of Proteins (SCOP).41 Each ofthese SCOP groups contains 2-chain complexes that sharethe same family structure (e.g., 1aa7AB and 1smtCD arein the same SCOP group if chain A from 1aa7 and chain Cfrom 1smt belong to the same SCOP structural family, andchain B from 1aa7 and chain D from 1smt belong to thesame SCOP structural family). For each SCOP group arepresentative was chosen. Using the MASS method,42,43
Fig. 2. An example of 2 similar binding sites that share a similarfunctional group constellation in space (PDB codes: 1jh5, 1d0g). (A)Physicochemical and surface representation of 2 TNF proteins. Theinterfaces consist mostly of aromatic and aliphatic patches (colored inwhite and orange, respectively). Donor (blue), acceptor (red) and donor–acceptor (green) patches are also seen on the interface. (B) A view of thematched functional groups between the 2 interfaces. The larger ballsrepresent the functional groups of 1jh5 and the smaller represent thefunctional groups of 1d0g. From a total of 39 matched functional groups, 6aromatic centers are matched (colored in orange).
PROTEIN–PROTEIN INTERFACE DATA SET 9
which performs structural alignment by secondary struc-tures, all complexes in each SCOP group were structurallyaligned to the representative of the corresponding group. Ifthe pairwise alignment yields a score above a given (highlystrict) threshold,* the complex is retained in the group. Ifthe score is lower than the threshold, the complex is nowthe new representative of a new group. The groups ob-tained by this process contain interfaces that share veryhigh structural and sequential similarity. At the final step,we extract only the representatives of the groups, result-ing in 4602 interfaces [Fig. 3(C)]. The process describedhere is performed in order to eliminate structural redun-dancy. Since a very strict threshold is used in the struc-tural comparison process, interface representatives thatshare a rather high sequence similarity might still exist.The elimination of sequence similarity redundancy isdescribed below.
Stage 3: Generation of interfaces
Prior to the structural alignment procedure, we prepro-cess the interfaces of the retained complexes. An interfaceis defined as an unordered pair of interacting binding sites,which belong to 2 noncovalently linked protein molecules.Each interface is represented by the functional groups ofits 2 interacting binding sites, as well as their correspond-ing physicochemically labeled surfaces. The main stages ofthe interface generation are summarized in Figure 4.Given a protein–protein complex, the first step is the
construction of a smooth molecular surface44,45 for each ofthe interacting protein chains. Since we are interestedonly in the regions of interaction, for each protein chain,we retain only surface points that are within a distance of4 Å from the surface of its binding partner. Given theatomic coordinates of the interacting protein structure, weextract the functional groups that are exposed to theinterface surface. Those are determined by the physico-chemical properties of the residues (backbone and side-chains). We follow Schmitt et al.12 in the definition andrepresentation of each functional group of an amino acidby a 3D point, denoted as pseudocenter. Each pseudo-center represents a center of potential interaction and hasone of the following properties: hydrogen bond donor,hydrogen bond acceptor, mixed donor–acceptor, hydropho-bic aliphatic and aromatic (�) contacts. For example, themodel represents the side-chain of arginine by 3 pseudo-centers of type donor (located on nitrogen atoms) and apseudocenter of type aliphatic (located at the center ofmass of the 3 carbon atoms). The side-chain of proline isrepresented by an aromatic pseudocenter located at thecenter of its aromatic ring.
Finally, we perform a physicochemical labeling of theinterface surfaces according to the properties of the pseudo-centers. The obtained surfaces and the pseudocenters ofthe 2 binding sites are used to represent an interface.
Stage 4: Structural alignment between interfaces
Toward the goal of classification of protein–proteininterfaces, we have developed a method, I2I-SiteEngine,which simultaneously aligns between 2 pairs of bindingsites and is independent of the sequences and the folds of
*The root-mean-square deviation (RMSD) of the alignment is re-quired to be less than 1.5 Å and at least 85% of the protein should beincluded in the alignment.
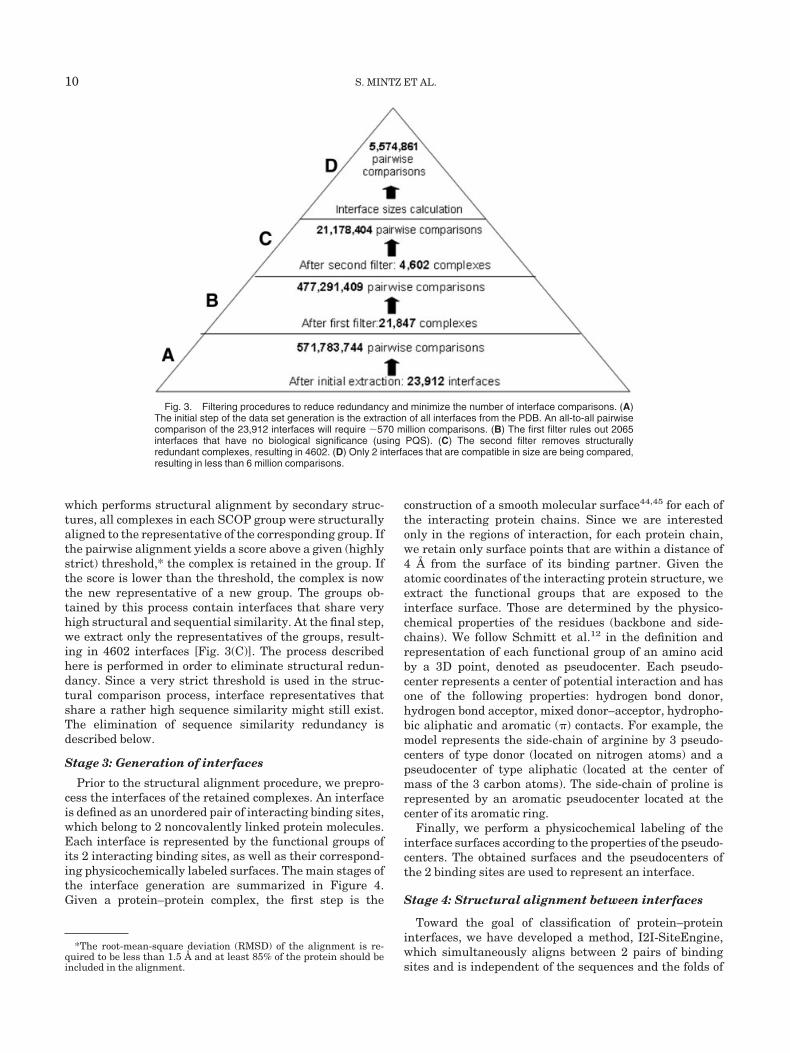
Fig. 3. Filtering procedures to reduce redundancy and minimize the number of interface comparisons. (A)The initial step of the data set generation is the extraction of all interfaces from the PDB. An all-to-all pairwisecomparison of the 23,912 interfaces will require �570 million comparisons. (B) The first filter rules out 2065interfaces that have no biological significance (using PQS). (C) The second filter removes structurallyredundant complexes, resulting in 4602. (D) Only 2 interfaces that are compatible in size are being compared,resulting in less than 6 million comparisons.
10 S. MINTZ ET AL.
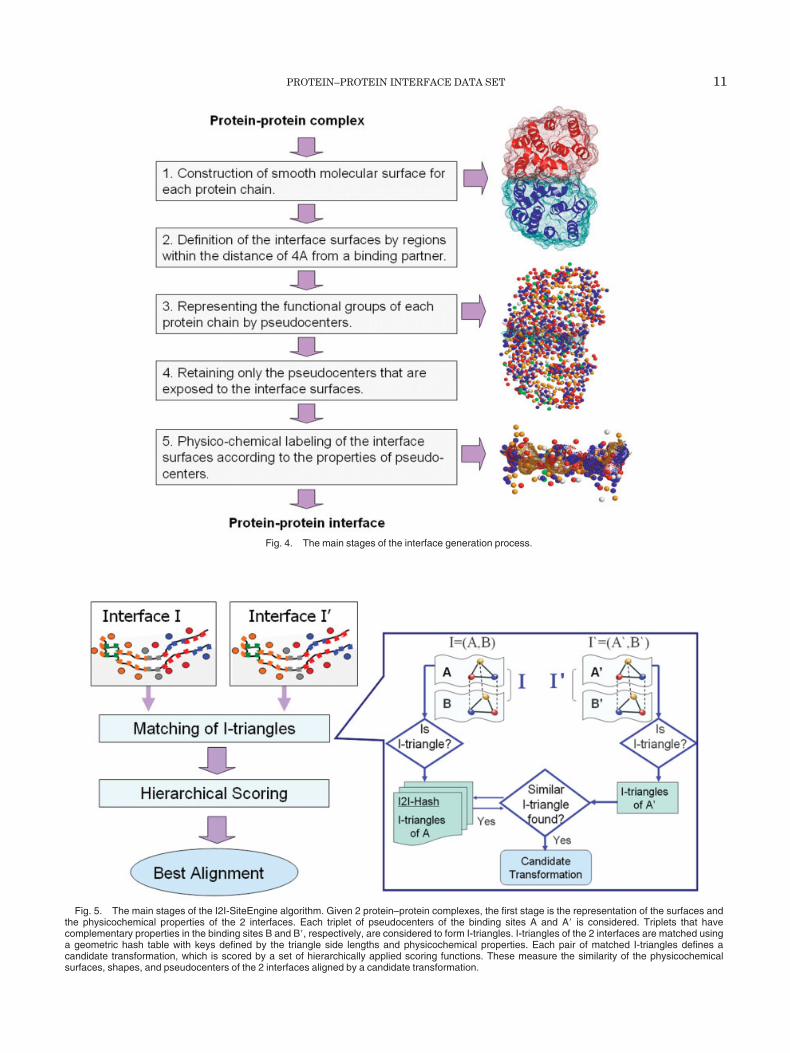
Fig. 4. The main stages of the interface generation process.
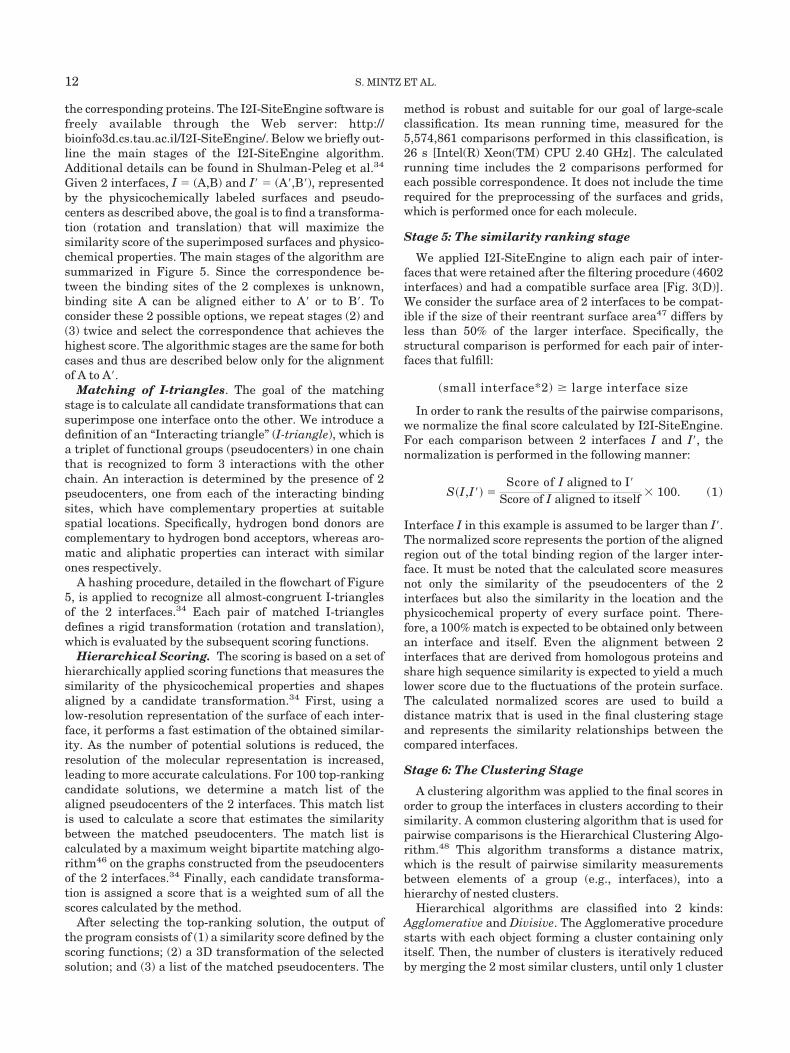
Fig. 5. The main stages of the I2I-SiteEngine algorithm. Given 2 protein–protein complexes, the first stage is the representation of the surfaces andthe physicochemical properties of the 2 interfaces. Each triplet of pseudocenters of the binding sites A and A� is considered. Triplets that havecomplementary properties in the binding sites B and B�, respectively, are considered to form I-triangles. I-triangles of the 2 interfaces are matched usinga geometric hash table with keys defined by the triangle side lengths and physicochemical properties. Each pair of matched I-triangles defines acandidate transformation, which is scored by a set of hierarchically applied scoring functions. These measure the similarity of the physicochemicalsurfaces, shapes, and pseudocenters of the 2 interfaces aligned by a candidate transformation.
PROTEIN–PROTEIN INTERFACE DATA SET 11
the corresponding proteins. The I2I-SiteEngine software isfreely available through the Web server: http://bioinfo3d.cs.tau.ac.il/I2I-SiteEngine/. Below we briefly out-line the main stages of the I2I-SiteEngine algorithm.Additional details can be found in Shulman-Peleg et al.34
Given 2 interfaces, I � (A,B) and I� � (A�,B�), representedby the physicochemically labeled surfaces and pseudo-centers as described above, the goal is to find a transforma-tion (rotation and translation) that will maximize thesimilarity score of the superimposed surfaces and physico-chemical properties. The main stages of the algorithm aresummarized in Figure 5. Since the correspondence be-tween the binding sites of the 2 complexes is unknown,binding site A can be aligned either to A� or to B�. Toconsider these 2 possible options, we repeat stages (2) and(3) twice and select the correspondence that achieves thehighest score. The algorithmic stages are the same for bothcases and thus are described below only for the alignmentof A to A�.
Matching of I-triangles. The goal of the matchingstage is to calculate all candidate transformations that cansuperimpose one interface onto the other. We introduce adefinition of an “Interacting triangle” (I-triangle), which isa triplet of functional groups (pseudocenters) in one chainthat is recognized to form 3 interactions with the otherchain. An interaction is determined by the presence of 2pseudocenters, one from each of the interacting bindingsites, which have complementary properties at suitablespatial locations. Specifically, hydrogen bond donors arecomplementary to hydrogen bond acceptors, whereas aro-matic and aliphatic properties can interact with similarones respectively.
A hashing procedure, detailed in the flowchart of Figure5, is applied to recognize all almost-congruent I-trianglesof the 2 interfaces.34 Each pair of matched I-trianglesdefines a rigid transformation (rotation and translation),which is evaluated by the subsequent scoring functions.
Hierarchical Scoring. The scoring is based on a set ofhierarchically applied scoring functions that measures thesimilarity of the physicochemical properties and shapesaligned by a candidate transformation.34 First, using alow-resolution representation of the surface of each inter-face, it performs a fast estimation of the obtained similar-ity. As the number of potential solutions is reduced, theresolution of the molecular representation is increased,leading to more accurate calculations. For 100 top-rankingcandidate solutions, we determine a match list of thealigned pseudocenters of the 2 interfaces. This match listis used to calculate a score that estimates the similaritybetween the matched pseudocenters. The match list iscalculated by a maximum weight bipartite matching algo-rithm46 on the graphs constructed from the pseudocentersof the 2 interfaces.34 Finally, each candidate transforma-tion is assigned a score that is a weighted sum of all thescores calculated by the method.
After selecting the top-ranking solution, the output ofthe program consists of (1) a similarity score defined by thescoring functions; (2) a 3D transformation of the selectedsolution; and (3) a list of the matched pseudocenters. The
method is robust and suitable for our goal of large-scaleclassification. Its mean running time, measured for the5,574,861 comparisons performed in this classification, is26 s [Intel(R) Xeon(TM) CPU 2.40 GHz]. The calculatedrunning time includes the 2 comparisons performed foreach possible correspondence. It does not include the timerequired for the preprocessing of the surfaces and grids,which is performed once for each molecule.
Stage 5: The similarity ranking stage
We applied I2I-SiteEngine to align each pair of inter-faces that were retained after the filtering procedure (4602interfaces) and had a compatible surface area [Fig. 3(D)].We consider the surface area of 2 interfaces to be compat-ible if the size of their reentrant surface area47 differs byless than 50% of the larger interface. Specifically, thestructural comparison is performed for each pair of inter-faces that fulfill:
(small interface*2) � large interface size
In order to rank the results of the pairwise comparisons,we normalize the final score calculated by I2I-SiteEngine.For each comparison between 2 interfaces I and I�, thenormalization is performed in the following manner:
S�I,I� �Score of I aligned to I�
Score of I aligned to itself 100. (1)
Interface I in this example is assumed to be larger than I�.The normalized score represents the portion of the alignedregion out of the total binding region of the larger inter-face. It must be noted that the calculated score measuresnot only the similarity of the pseudocenters of the 2interfaces but also the similarity in the location and thephysicochemical property of every surface point. There-fore, a 100% match is expected to be obtained only betweenan interface and itself. Even the alignment between 2interfaces that are derived from homologous proteins andshare high sequence similarity is expected to yield a muchlower score due to the fluctuations of the protein surface.The calculated normalized scores are used to build adistance matrix that is used in the final clustering stageand represents the similarity relationships between thecompared interfaces.
Stage 6: The Clustering Stage
A clustering algorithm was applied to the final scores inorder to group the interfaces in clusters according to theirsimilarity. A common clustering algorithm that is used forpairwise comparisons is the Hierarchical Clustering Algo-rithm.48 This algorithm transforms a distance matrix,which is the result of pairwise similarity measurementsbetween elements of a group (e.g., interfaces), into ahierarchy of nested clusters.
Hierarchical algorithms are classified into 2 kinds:Agglomerative and Divisive. The Agglomerative procedurestarts with each object forming a cluster containing onlyitself. Then, the number of clusters is iteratively reducedby merging the 2 most similar clusters, until only 1 cluster
12 S. MINTZ ET AL.
remains. The Divisive procedure starts with 1 cluster anditeratively splits a cluster until all objects are separated.The Agglomerative procedure, used in this work, requiresfewer computations to proceed from one level to another,and therefore is used more frequently. The crucial step inthe Agglomerative procedure is the merging of the 2 mostsimilar clusters. Different distance functions are used tomeasure the similarity between different clusters and canlead to different results. In this work we used the averagelinkage distance method48 to define the distance between 2clusters Ci, Cj:
Dave�Ci,Cj �
�k�Ci
�l�Cj
S�k,l
m*n , (2)
where S(k,l) is the pairwise similarity score betweeninterface k and interface l [defined in Eq. (1)], and m and nare the number of interfaces in clusters Ci and Cj, respec-tively. In this method, the distance between 2 clusters isdefined as the average distance between all possible pairsof interfaces within the 2 clusters. The 2 clusters with thesmallest average distance between their data entries aremerged at each step. In our implementation of the algo-rithm, the merging process stops when the average dis-tance between 2 clusters is larger than a predeterminedthreshold value. The threshold for the similarity score [Eq.(1)] was determined by a preliminary evaluation on a pilotdata set34 and was set to 25. Other distance functionsinclude the single linkage that measures the distancebetween clusters by the distance between the 2 closestpoints within the clusters, and the complete linkage thatmeasures the distance by the distance between the far-thest pair of data points within 2 clusters. However, boththe single linkage and the complete linkage methods arevery sensitive to noise and to outliers. The average linkagemethod is a compromise and is more stable to unknowndistributions of objects. A drawback of the average linkagemethod is that given a threshold value of similarity for the
merging stage, the final results of the clustering algorithmmight include 2 data points in 1 cluster that share a lowersimilarity than the threshold. In order to overcome thisproblem, for each such pair of interfaces, the interface thatis less similar to all the rest of the interfaces in the clusteris removed from the cluster and generates a new cluster.
RESULTS AND DISCUSSIONGeneration of a Nonredundant Data Set
After applying the clustering algorithm to the pairwisealignment scores, the interfaces that were removed by thestructural alignment procedure at the initial filteringstage were added to the clusters according to their repre-sentatives. This procedure resulted in 2582 clusters. Ofthese, 740 contain a single interface. In order to be able tocarry out a statistical analysis on the data set, a nonredun-dant data set was generated from the clusters. To elimi-nate redundancy, the sequences of the chains comprisingthe interfaces in each cluster were compared by Blast-Clust,49 using a threshold identity of 50%. The sequencethreshold that is used in SCOP41 for the classification ofthe families is 30%. Our method for the alignment betweenthe interfaces considers a very high-resolution representa-tion of the physicochemical surfaces and is sensitive tolocal changes. In order not to lose relevant data, we haveselected a slightly more permissive threshold of 50%. If 2interface members in the same cluster share a sequenceidentity of more than 50% in both their chains, onemember was removed from the cluster. Finally, a represen-tative was selected for each cluster. The representative isthe interface that is most similar to the rest of the clustermembers.
Comparison to the “Backbone Data Set”
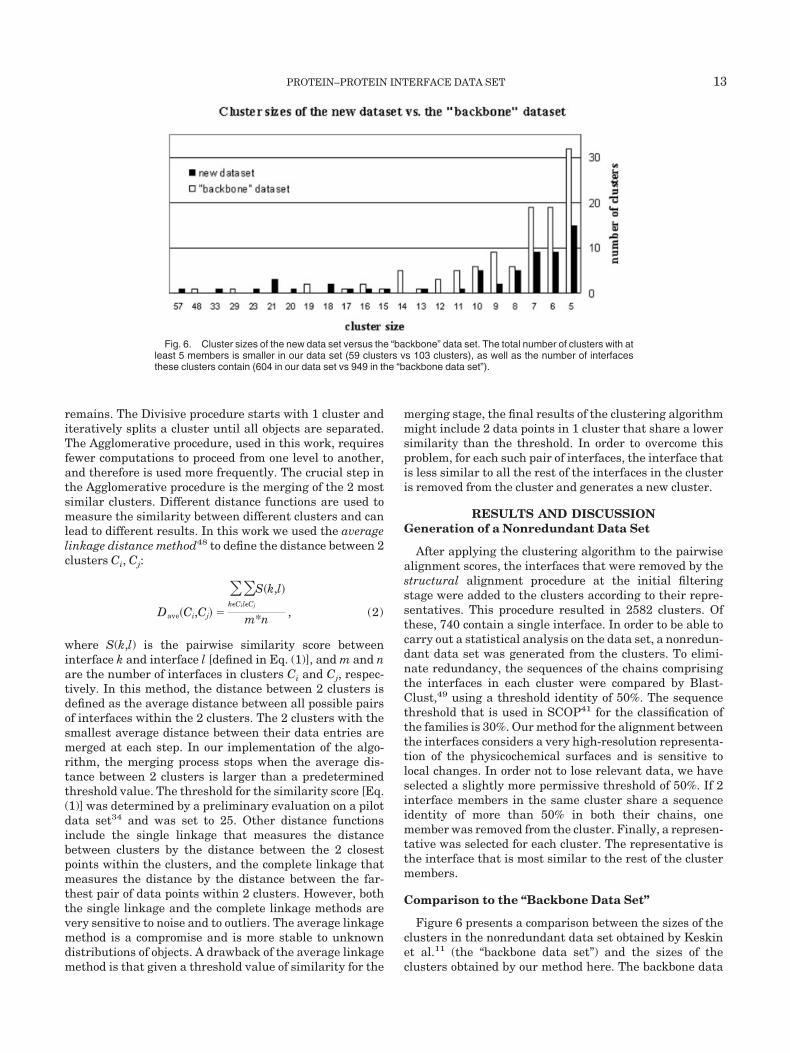
Figure 6 presents a comparison between the sizes of theclusters in the nonredundant data set obtained by Keskinet al.11 (the “backbone data set”) and the sizes of theclusters obtained by our method here. The backbone data
Fig. 6. Cluster sizes of the new data set versus the “backbone” data set. The total number of clusters with atleast 5 members is smaller in our data set (59 clusters vs 103 clusters), as well as the number of interfacesthese clusters contain (604 in our data set vs 949 in the “backbone data set”).
PROTEIN–PROTEIN INTERFACE DATA SET 13

set is generated at the amino acid level, and the structuralcomparisons are carried out using the C� coordinates. Thenonredundant backbone data set includes only clusterswith 5 or more interfaces. In order to make an appropriatecomparison, Figure 6 shows clusters with at least 5members for both data sets. Both data sets were obtainedfrom a comparable number of interfaces (21,663 interfaceshere vs 20,937 in Keskin et al.). However, different repre-sentation of the interfaces, different clustering methods,thresholds and parameters, were used that affect the finalresults. As can be seen in the chart, the total number ofclusters with at least 5 members is smaller in our data set(59 clusters vs 103 clusters), as well as the number ofinterfaces that these clusters contain (604 in our data setvs 949 in the backbone data set). The stronger tendency ofinterfaces to cluster in the backbone data set is expectedand emphasizes the major difference between the 2 meth-ods. While the current I2I-SiteEngine alignment methodfocuses on the level of the chemical groups and demandssimilarity between the physicochemical properties of thealigned surfaces, as well as similarity of the geometricalshape, the alignment method used in the backbone dataset is based on the geometry of the protein backbone alone,thus focusing on the motifs and the residue-based constel-lations that are observed in the interfaces. When aligning2 interfaces solely by their C� atom coordinates, interfaceswith recurring secondary structures motifs will receivehigh alignment scores even though the side-chains atomsof the interacting residues may display dissimilar orienta-tions and chemical properties.
The ClustersSimilar interfaces, similar overall fold
The function of a protein is most often determined by itsability to interact with other proteins (e.g., enzyme–inhibitor, antibody–antigen). Most often, proteins withsimilar function will also share similar overall folds.Therefore, the fact that interfaces with similar functionand fold are observed to be clustered is not surprising. Inour nonredundant data set (that contain only clusters ofinterfaces with no more than 50% sequence identity), 15such clusters with 5 or more interfaces that share the sameoverall superfamily structure (following SCOP) are ob-served. An example for this type of cluster can be seen inFigure 2. Cluster 673 contains 5 members of the TNF(tumor necrosis factor) family proteins that play a role inmammalian cell host defense processes, inflammation,apoptosis, autoimmunity, and organogenesis.50 The TNFligand trimer structure consists entirely of � strands andloops. The interface between 2 monomers of the trimerconsists of aromatic residues (which are conserved for allTNF family members). Hydrophobic interactions appear tobe the main force driving trimer formation.50 In Figure2(A), which gives the surface representation and thefunctional groups of one side of 2 TNF interfaces, thearomatic patches are clearly seen. From a total of 39matched functional groups between the 2 interfaces, 6aromatic centers are matched [Fig. 2(B)].
Similar interfaces, different overall folds
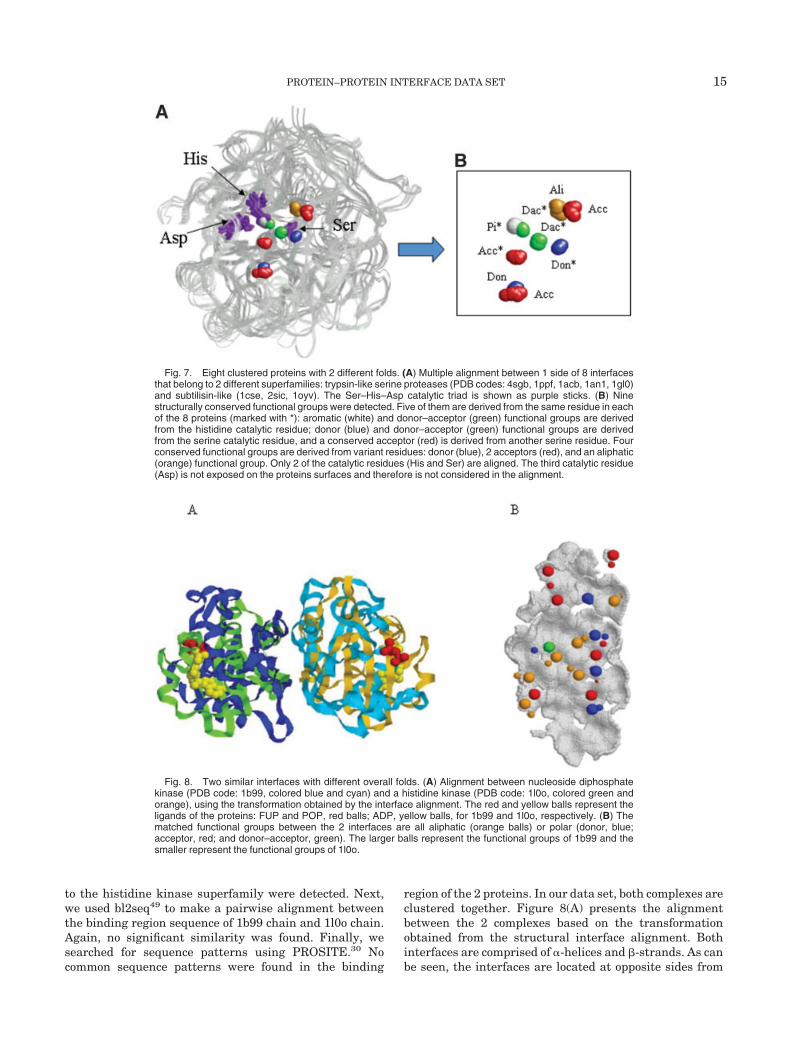
A more surprising type of cluster is when the interfacesare clustered in the same group (i.e., they share similarspatial binding organizations), yet they belong to a differ-ent SCOP superfamily (i.e., the chains that compose themhave different global folds). Forty-six such clusters with 5interfaces or more are observed in our nonredundant dataset. Moreover, although stable and transient complexesmay exhibit different features,4 the discrimination be-tween their physicochemical properties is not straightfor-ward,51 and several clusters of this type contain both typesof complexes. While the previous type of clusters is to beexpected, this type can suggest either preferred bindingorganizations for proteins with different functions, orsimilar functions shared by unrelated proteins (possiblyselected by convergent evolution). The subtilisin-like andtrypsin-like folds are a well studied example of such a case,where the proteins have different overall folds, yet theyshare a similar function.22,52 In our data set, interfacescomprised of these proteins complexed with their inhibi-tors are clustered. Figure 7 shows the multiple alignmentsbetween 1 side of the 8 interfaces from this cluster: Fiveinterfaces (PDB codes: 4sgb, 1ppf, 1acb, 1an1, and 1gl0)belong to the trypsinlike serine proteases superfamily, and3 interfaces (1cse, 2sic, and 1oyv) belong to the subtilisin-like superfamily. The proteins from both superfamilies areknown to have a Ser–His–Asp catalytic triad in theiractive sites (presented as purple sticks). The alignmentshown in Figure 7 was done with the MultiBind algo-rithm.63 The MultiBind program performs multiple align-ments of binding sites in order to detect binding patternsthat are common to a family of proteins. Nine structurallyconserved functional groups were detected when applyingMultiBind to the cluster. Functional groups marked with(*) are derived from the same residue in each of the 9proteins. As can be seen, 2 structurally conserved func-tional groups (aromatic, white; donor–acceptor, green) arederived from the catalytic histidine residue, 2 conservedfunctional groups (donor, blue; donor–acceptor, green) arederived from the catalytic serine residue, and anotherstructurally conserved functional group (acceptor, red) isderived from another serine residue in all 9 proteins. Theother 4 conserved functional groups (aliphatic, orange; 2acceptors, red; and donor, blue) are derived from variousresidues. As can be seen in Figure 7, only 2 of the catalyticresidues (His and Ser) are aligned. The third catalyticresidue (Asp) is not exposed on the protein surfaces andtherefore is not considered in the alignment.
Two similar interfaces with different overall folds canalso be seen in Figure 8. Both proteins are kinases: Thefirst (1b99) belongs to the nucleoside diphosphate kinasesuperfamily, and the second (1l0o) to the histidine kinasesuperfamily. We used this case in order to examinewhether sequence alignment methods can detect the simi-larity between the interfaces. Here, the binding region isconstructed of contiguous sequence residues, which makesit suitable for sequence alignment. When we usedBLASTP49 with the overall chains of the 1b99 complex as aquery against the full PDB data set, no proteins belonging
14 S. MINTZ ET AL.
to the histidine kinase superfamily were detected. Next,we used bl2seq49 to make a pairwise alignment betweenthe binding region sequence of 1b99 chain and 1l0o chain.Again, no significant similarity was found. Finally, wesearched for sequence patterns using PROSITE.30 Nocommon sequence patterns were found in the binding
region of the 2 proteins. In our data set, both complexes areclustered together. Figure 8(A) presents the alignmentbetween the 2 complexes based on the transformationobtained from the structural interface alignment. Bothinterfaces are comprised of �-helices and �-strands. As canbe seen, the interfaces are located at opposite sides from
Fig. 7. Eight clustered proteins with 2 different folds. (A) Multiple alignment between 1 side of 8 interfacesthat belong to 2 different superfamilies: trypsin-like serine proteases (PDB codes: 4sgb, 1ppf, 1acb, 1an1, 1gl0)and subtilisin-like (1cse, 2sic, 1oyv). The Ser–His–Asp catalytic triad is shown as purple sticks. (B) Ninestructurally conserved functional groups were detected. Five of them are derived from the same residue in eachof the 8 proteins (marked with *): aromatic (white) and donor–acceptor (green) functional groups are derivedfrom the histidine catalytic residue; donor (blue) and donor–acceptor (green) functional groups are derivedfrom the serine catalytic residue, and a conserved acceptor (red) is derived from another serine residue. Fourconserved functional groups are derived from variant residues: donor (blue), 2 acceptors (red), and an aliphatic(orange) functional group. Only 2 of the catalytic residues (His and Ser) are aligned. The third catalytic residue(Asp) is not exposed on the proteins surfaces and therefore is not considered in the alignment.
Fig. 8. Two similar interfaces with different overall folds. (A) Alignment between nucleoside diphosphatekinase (PDB code: 1b99, colored blue and cyan) and a histidine kinase (PDB code: 1l0o, colored green andorange), using the transformation obtained by the interface alignment. The red and yellow balls represent theligands of the proteins: FUP and POP, red balls; ADP, yellow balls, for 1b99 and 1l0o, respectively. (B) Thematched functional groups between the 2 interfaces are all aliphatic (orange balls) or polar (donor, blue;acceptor, red; and donor–acceptor, green). The larger balls represent the functional groups of 1b99 and thesmaller represent the functional groups of 1l0o.
PROTEIN–PROTEIN INTERFACE DATA SET 15
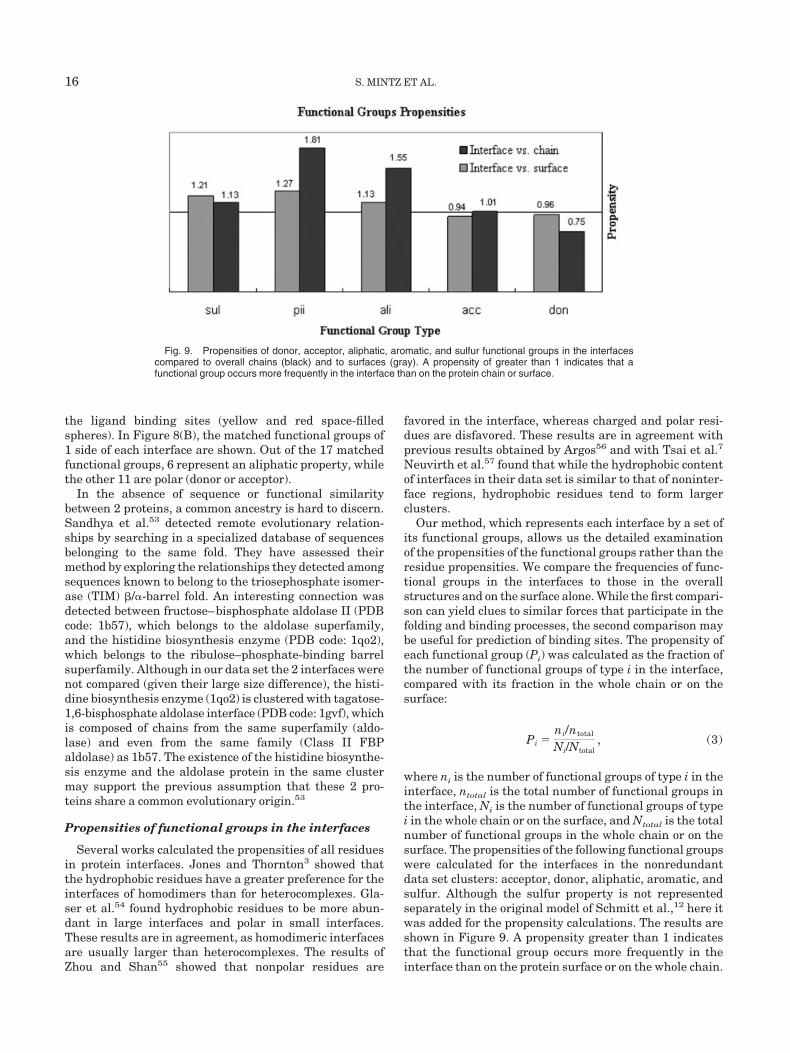
the ligand binding sites (yellow and red space-filledspheres). In Figure 8(B), the matched functional groups of1 side of each interface are shown. Out of the 17 matchedfunctional groups, 6 represent an aliphatic property, whilethe other 11 are polar (donor or acceptor).
In the absence of sequence or functional similaritybetween 2 proteins, a common ancestry is hard to discern.Sandhya et al.53 detected remote evolutionary relation-ships by searching in a specialized database of sequencesbelonging to the same fold. They have assessed theirmethod by exploring the relationships they detected amongsequences known to belong to the triosephosphate isomer-ase (TIM) �/�-barrel fold. An interesting connection wasdetected between fructose–bisphosphate aldolase II (PDBcode: 1b57), which belongs to the aldolase superfamily,and the histidine biosynthesis enzyme (PDB code: 1qo2),which belongs to the ribulose–phosphate-binding barrelsuperfamily. Although in our data set the 2 interfaces werenot compared (given their large size difference), the histi-dine biosynthesis enzyme (1qo2) is clustered with tagatose-1,6-bisphosphate aldolase interface (PDB code: 1gvf), whichis composed of chains from the same superfamily (aldo-lase) and even from the same family (Class II FBPaldolase) as 1b57. The existence of the histidine biosynthe-sis enzyme and the aldolase protein in the same clustermay support the previous assumption that these 2 pro-teins share a common evolutionary origin.53
Propensities of functional groups in the interfaces
Several works calculated the propensities of all residuesin protein interfaces. Jones and Thornton3 showed thatthe hydrophobic residues have a greater preference for theinterfaces of homodimers than for heterocomplexes. Gla-ser et al.54 found hydrophobic residues to be more abun-dant in large interfaces and polar in small interfaces.These results are in agreement, as homodimeric interfacesare usually larger than heterocomplexes. The results ofZhou and Shan55 showed that nonpolar residues are
favored in the interface, whereas charged and polar resi-dues are disfavored. These results are in agreement withprevious results obtained by Argos56 and with Tsai et al.7
Neuvirth et al.57 found that while the hydrophobic contentof interfaces in their data set is similar to that of noninter-face regions, hydrophobic residues tend to form largerclusters.
Our method, which represents each interface by a set ofits functional groups, allows us the detailed examinationof the propensities of the functional groups rather than theresidue propensities. We compare the frequencies of func-tional groups in the interfaces to those in the overallstructures and on the surface alone. While the first compari-son can yield clues to similar forces that participate in thefolding and binding processes, the second comparison maybe useful for prediction of binding sites. The propensity ofeach functional group (Pi) was calculated as the fraction ofthe number of functional groups of type i in the interface,compared with its fraction in the whole chain or on thesurface:
Pi �ni/ntotal
Ni/Ntotal, (3)
where ni is the number of functional groups of type i in theinterface, ntotal is the total number of functional groups inthe interface, Ni is the number of functional groups of typei in the whole chain or on the surface, and Ntotal is the totalnumber of functional groups in the whole chain or on thesurface. The propensities of the following functional groupswere calculated for the interfaces in the nonredundantdata set clusters: acceptor, donor, aliphatic, aromatic, andsulfur. Although the sulfur property is not representedseparately in the original model of Schmitt et al.,12 here itwas added for the propensity calculations. The results areshown in Figure 9. A propensity greater than 1 indicatesthat the functional group occurs more frequently in theinterface than on the protein surface or on the whole chain.
Fig. 9. Propensities of donor, acceptor, aliphatic, aromatic, and sulfur functional groups in the interfacescompared to overall chains (black) and to surfaces (gray). A propensity of greater than 1 indicates that afunctional group occurs more frequently in the interface than on the protein chain or surface.
16 S. MINTZ ET AL.
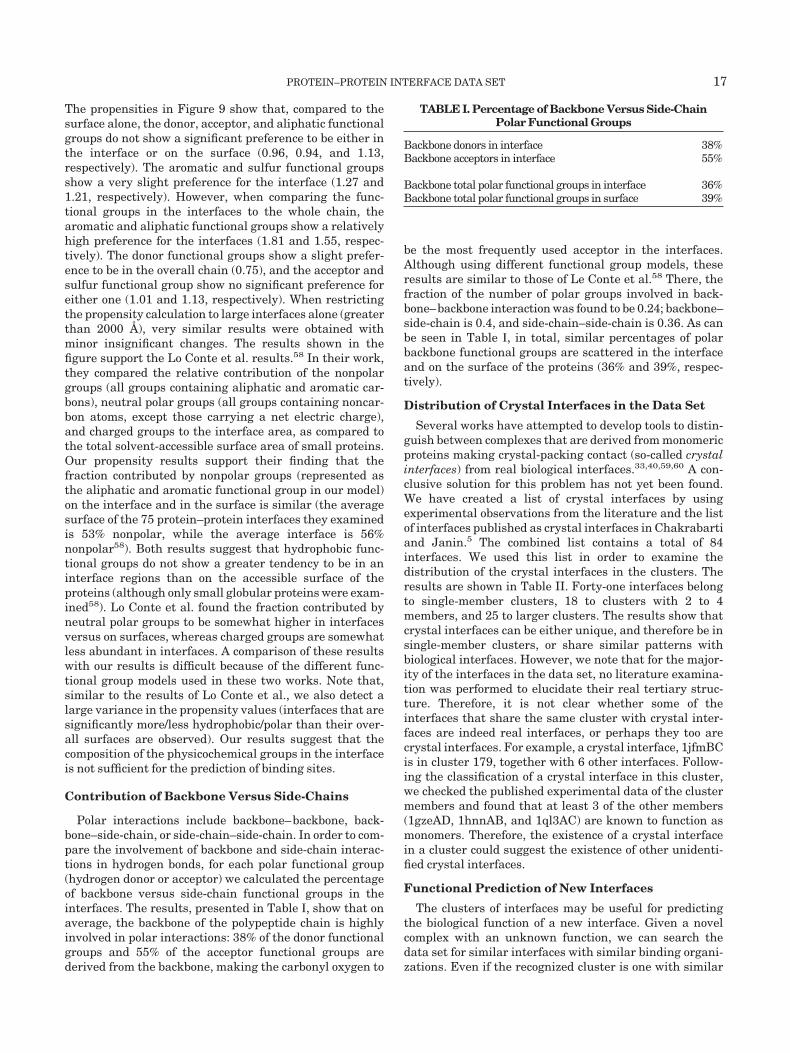
The propensities in Figure 9 show that, compared to thesurface alone, the donor, acceptor, and aliphatic functionalgroups do not show a significant preference to be either inthe interface or on the surface (0.96, 0.94, and 1.13,respectively). The aromatic and sulfur functional groupsshow a very slight preference for the interface (1.27 and1.21, respectively). However, when comparing the func-tional groups in the interfaces to the whole chain, thearomatic and aliphatic functional groups show a relativelyhigh preference for the interfaces (1.81 and 1.55, respec-tively). The donor functional groups show a slight prefer-ence to be in the overall chain (0.75), and the acceptor andsulfur functional group show no significant preference foreither one (1.01 and 1.13, respectively). When restrictingthe propensity calculation to large interfaces alone (greaterthan 2000 Å), very similar results were obtained withminor insignificant changes. The results shown in thefigure support the Lo Conte et al. results.58 In their work,they compared the relative contribution of the nonpolargroups (all groups containing aliphatic and aromatic car-bons), neutral polar groups (all groups containing noncar-bon atoms, except those carrying a net electric charge),and charged groups to the interface area, as compared tothe total solvent-accessible surface area of small proteins.Our propensity results support their finding that thefraction contributed by nonpolar groups (represented asthe aliphatic and aromatic functional group in our model)on the interface and in the surface is similar (the averagesurface of the 75 protein–protein interfaces they examinedis 53% nonpolar, while the average interface is 56%nonpolar58). Both results suggest that hydrophobic func-tional groups do not show a greater tendency to be in aninterface regions than on the accessible surface of theproteins (although only small globular proteins were exam-ined58). Lo Conte et al. found the fraction contributed byneutral polar groups to be somewhat higher in interfacesversus on surfaces, whereas charged groups are somewhatless abundant in interfaces. A comparison of these resultswith our results is difficult because of the different func-tional group models used in these two works. Note that,similar to the results of Lo Conte et al., we also detect alarge variance in the propensity values (interfaces that aresignificantly more/less hydrophobic/polar than their over-all surfaces are observed). Our results suggest that thecomposition of the physicochemical groups in the interfaceis not sufficient for the prediction of binding sites.
Contribution of Backbone Versus Side-Chains
Polar interactions include backbone–backbone, back-bone–side-chain, or side-chain–side-chain. In order to com-pare the involvement of backbone and side-chain interac-tions in hydrogen bonds, for each polar functional group(hydrogen donor or acceptor) we calculated the percentageof backbone versus side-chain functional groups in theinterfaces. The results, presented in Table , show that onaverage, the backbone of the polypeptide chain is highlyinvolved in polar interactions: 38% of the donor functionalgroups and 55% of the acceptor functional groups arederived from the backbone, making the carbonyl oxygen to
be the most frequently used acceptor in the interfaces.Although using different functional group models, theseresults are similar to those of Le Conte et al.58 There, thefraction of the number of polar groups involved in back-bone–backbone interaction was found to be 0.24; backbone–side-chain is 0.4, and side-chain–side-chain is 0.36. As canbe seen in Table , in total, similar percentages of polarbackbone functional groups are scattered in the interfaceand on the surface of the proteins (36% and 39%, respec-tively).
Distribution of Crystal Interfaces in the Data Set
Several works have attempted to develop tools to distin-guish between complexes that are derived from monomericproteins making crystal-packing contact (so-called crystalinterfaces) from real biological interfaces.33,40,59,60 A con-clusive solution for this problem has not yet been found.We have created a list of crystal interfaces by usingexperimental observations from the literature and the listof interfaces published as crystal interfaces in Chakrabartiand Janin.5 The combined list contains a total of 84interfaces. We used this list in order to examine thedistribution of the crystal interfaces in the clusters. Theresults are shown in Table II. Forty-one interfaces belongto single-member clusters, 18 to clusters with 2 to 4members, and 25 to larger clusters. The results show thatcrystal interfaces can be either unique, and therefore be insingle-member clusters, or share similar patterns withbiological interfaces. However, we note that for the major-ity of the interfaces in the data set, no literature examina-tion was performed to elucidate their real tertiary struc-ture. Therefore, it is not clear whether some of theinterfaces that share the same cluster with crystal inter-faces are indeed real interfaces, or perhaps they too arecrystal interfaces. For example, a crystal interface, 1jfmBCis in cluster 179, together with 6 other interfaces. Follow-ing the classification of a crystal interface in this cluster,we checked the published experimental data of the clustermembers and found that at least 3 of the other members(1gzeAD, 1hnnAB, and 1ql3AC) are known to function asmonomers. Therefore, the existence of a crystal interfacein a cluster could suggest the existence of other unidenti-fied crystal interfaces.
Functional Prediction of New Interfaces
The clusters of interfaces may be useful for predictingthe biological function of a new interface. Given a novelcomplex with an unknown function, we can search thedata set for similar interfaces with similar binding organi-zations. Even if the recognized cluster is one with similar
TABLE I. Percentage of Backbone Versus Side-ChainPolar Functional Groups
Backbone donors in interface 38%Backbone acceptors in interface 55%
Backbone total polar functional groups in interface 36%Backbone total polar functional groups in surface 39%
PROTEIN–PROTEIN INTERFACE DATA SET 17
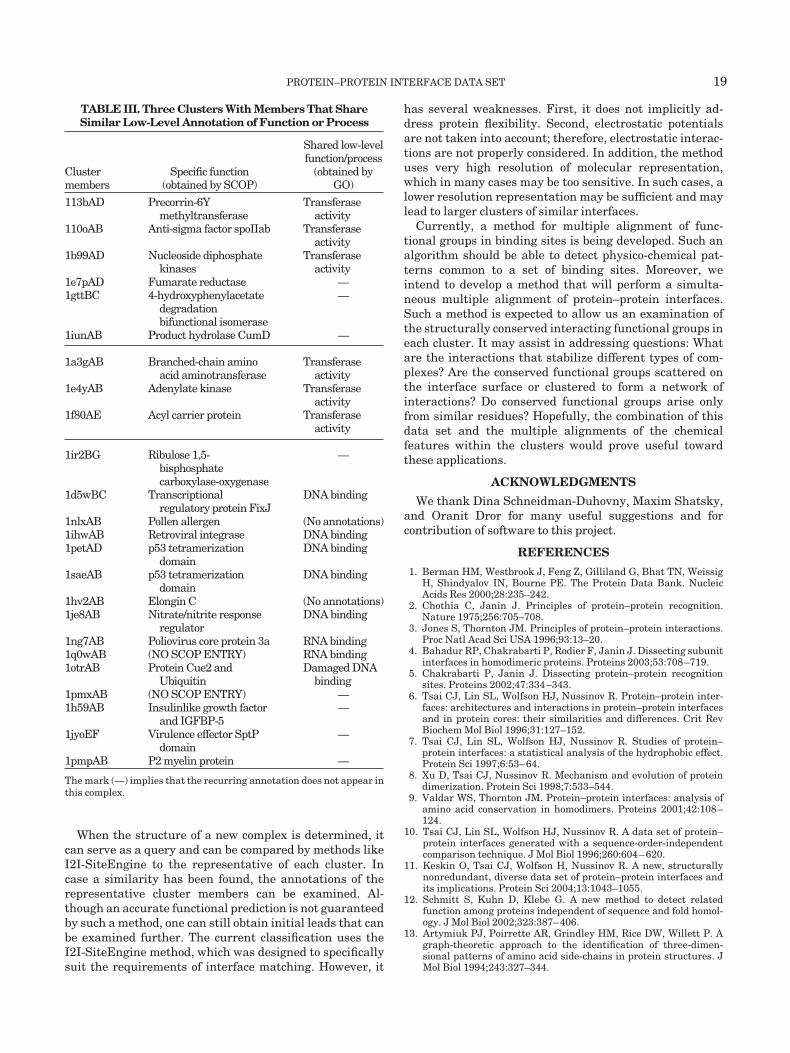
interfaces that are constructed of chains of different folds,it can still be used to obtain hints for the function of thenew interface. We used the Gene Ontology (GO) data-base61 to examine whether such clusters contain recurringbiological features. The GO database contains 3 hierar-chies that represent (1) the molecular function of a protein,(2) the biological process that the protein participates in,and (3) the cellular component it functions in. The differ-ent levels of the hierarchies allow the examination of notonly the specific type of function or process but also a moregeneral view of the role of the protein (e.g., a hierarchalannotation of a nucleic acid binding protein may includeRNA binding annotation, DNA binding annotation ortranslation factor activity, and each of these goes furtherdown in the hierarchy of annotations). Clusters of the firsttype (similar interface–similar global folds) include inter-faces that belong to the same family and thus will havesimilar annotations even at high levels of hierarchy. Onthe other hand, clusters from the second type (similarinterfaces–different global folds) may contain interfaceswith different high-level annotations but similar low-levelannotations. These clusters may be useful in the globalfunctional prediction of newly determined interfaces thatare clustered within them. Several clusters have beenfound where half or more of the members have differentspecific functions but they share similar low-level annota-tion of function or pathway. Three of these clusters arepresented in Table III. For the third cluster in Table III, 2of its members (1nlxAB and 1hv2AB) do not have any GOannotations. However, Batuyan et al.62 published the factthat the 1hv2 protein is a transcription elongation factor,which binds the DNA as the rest of its cluster members.Obviously, functional annotation becomes more complexwhen all members of the cluster exhibit different func-tions. However, the above examples illustrate that even ifthe new interface is assigned to a cluster that containscomplexes with different functions, the assignment to thiscluster may still contribute to the functional prediction.
CONCLUSIONS
Here, we have presented a nonredundant data set ofprotein–protein interfaces. The clustering is based on thesimilarity between both the spatial and the physicochemi-cal properties of the backbone and the side-chain atoms,regardless of the sequence or overall structural similarity
of the chains. As expected, compared to the C� residue–based data set of interfaces, the different representation,thresholds, parameters, and clustering methods affect thefinal results. The total number of clusters with at least 5elements is smaller in the current data set (59 clusters vs103 clusters). The number of interfaces that these clusterscontain is also smaller (604 in our data set vs 949 in theresidue-based data set). This highlights the differences inthe representations of the interfaces and the data setgeneration. The I2I-SiteEngine alignment focuses on thechemical groups and the geometries of the aligned sur-faces, whereas the C�-based data set focuses on backboneinterface motifs. There, the side-chain atoms of the inter-acting residues may display dissimilar orientations andchemical properties.
The choice of which data set to use depends on the goal.Using a functional group representation leads to higheraccuracy. Thus, inevitably, the functional group–baseddata set has fewer clusters with at least 5 members,reflecting its sensitivity to side-chain and backbone func-tional group motions. Given its representation and sensi-tivity, it is not expected to behave well in large-scaleapplications of lower resolution structures and modeledstructures. However, it is expected to be the data set ofchoice when elucidating the stabilizing interactions on themicroscopic scale and the preferred constellation of chemi-cal groups, when searching for protein–protein bindingsites with similar chemistry, when designing mutations ornew binding sites, in functional assignment and in drugdesign.
The SCOP database classifies proteins into structuralfamilies (when there is sequence similarity), structuralsuperfamilies (when the proteins lack sequence similaritybut have functional and structural similarity), and struc-tural folds (when there is only coarse structural similar-ity). When cross-comparing the data set clusters with theSCOP classification of the overall fold, 2 types of clustersare revealed. The first, more trivial, are clusters thatcontain interfaces composed of chains classified in thesame superfamily. The second cluster type contains inter-faces composed of chains from different SCOP superfami-lies. We have shown several examples of such clusteredproteins, most of which perform different functions. Suchclusters probably illustrate favorable chemical organiza-tion of interfaces.
TABLE II. Distribution of “Crystal Interfaces” in the Data Set
“Crystal interfaces” in a single-membercluster
13pkAD, 1i4gAB, 1aw7AB, 1ml1AC, 2g3pAB, 1mblAB, 830cAB, 1a3yAB, 1c02AB, 1aq0AB,2hckAB, 1qciAB, 1xgmAB, 1qdmAB, 1ag9AB, 1hkbAB, 1ckiAB, 1hfvAB, 1g4eAB,1fgkAB, 4atjAB, 1cqxAB, 1qpaAB, 1toaAB, 1dsuAB, 1a12AB, 1ac1AB, 1qs8AB, 1omeAB,1bilAB, 1sw6AB, 1f05AB, 1d8hAC, 1fvfAB, 1b6bAB, 1brwAB, 1fqjBE, 1flzAB, 1hz6BC,1k05BC, 1jnrAD
“Crystal interfaces” in clusters with2–4 members
1bs4BC, 1ehyAC, 1cpjAB, 2ugiAB, 1binAB, 1c47AB, 1xcaAB, 1dxmAB, 1pvaAB, 1a2lAB,1csgAB, 1b5zAB, 1cbiAB, 1dkdAC, 1fguAB, 1gcqBC, 2rslAB, 1ifqAB
“Crystal interfaces” in clusters with atleast 5 members
1rb3AB, 1ilr12, 1thtAB, 1kptAB, 1bc2AB, 1bkzAB, 1vlzAB, 3ng1AB, 1ae9AB, 1aohAB,1k6jAB, 1e69AB, 1a7vAB, 1dxxAD, 1czvAB, 1iepAB, 1dg1GH, 1lvfAB, 1fdqAB, 1gggAB,1fvrAB, 1i0cAB, 1iazAB, 1jfmBC, 1rhgBC
18 S. MINTZ ET AL.
When the structure of a new complex is determined, itcan serve as a query and can be compared by methods likeI2I-SiteEngine to the representative of each cluster. Incase a similarity has been found, the annotations of therepresentative cluster members can be examined. Al-though an accurate functional prediction is not guaranteedby such a method, one can still obtain initial leads that canbe examined further. The current classification uses theI2I-SiteEngine method, which was designed to specificallysuit the requirements of interface matching. However, it
has several weaknesses. First, it does not implicitly ad-dress protein flexibility. Second, electrostatic potentialsare not taken into account; therefore, electrostatic interac-tions are not properly considered. In addition, the methoduses very high resolution of molecular representation,which in many cases may be too sensitive. In such cases, alower resolution representation may be sufficient and maylead to larger clusters of similar interfaces.
Currently, a method for multiple alignment of func-tional groups in binding sites is being developed. Such analgorithm should be able to detect physico-chemical pat-terns common to a set of binding sites. Moreover, weintend to develop a method that will perform a simulta-neous multiple alignment of protein–protein interfaces.Such a method is expected to allow us an examination ofthe structurally conserved interacting functional groups ineach cluster. It may assist in addressing questions: Whatare the interactions that stabilize different types of com-plexes? Are the conserved functional groups scattered onthe interface surface or clustered to form a network ofinteractions? Do conserved functional groups arise onlyfrom similar residues? Hopefully, the combination of thisdata set and the multiple alignments of the chemicalfeatures within the clusters would prove useful towardthese applications.
ACKNOWLEDGMENTS
We thank Dina Schneidman-Duhovny, Maxim Shatsky,and Oranit Dror for many useful suggestions and forcontribution of software to this project.
REFERENCES
1. Berman HM, Westbrook J, Feng Z, Gilliland G, Bhat TN, WeissigH, Shindyalov IN, Bourne PE. The Protein Data Bank. NucleicAcids Res 2000;28:235–242.
2. Chothia C, Janin J. Principles of protein–protein recognition.Nature 1975;256:705–708.
3. Jones S, Thornton JM. Principles of protein–protein interactions.Proc Natl Acad Sci USA 1996;93:13–20.
4. Bahadur RP, Chakrabarti P, Rodier F, Janin J. Dissecting subunitinterfaces in homodimeric proteins. Proteins 2003;53:708–719.
5. Chakrabarti P, Janin J. Dissecting protein–protein recognitionsites. Proteins 2002;47:334–343.
6. Tsai CJ, Lin SL, Wolfson HJ, Nussinov R. Protein–protein inter-faces: architectures and interactions in protein–protein interfacesand in protein cores: their similarities and differences. Crit RevBiochem Mol Biol 1996;31:127–152.
7. Tsai CJ, Lin SL, Wolfson HJ, Nussinov R. Studies of protein–protein interfaces: a statistical analysis of the hydrophobic effect.Protein Sci 1997;6:53–64.
8. Xu D, Tsai CJ, Nussinov R. Mechanism and evolution of proteindimerization. Protein Sci 1998;7:533–544.
9. Valdar WS, Thornton JM. Protein–protein interfaces: analysis ofamino acid conservation in homodimers. Proteins 2001;42:108–124.
10. Tsai CJ, Lin SL, Wolfson HJ, Nussinov R. A data set of protein–protein interfaces generated with a sequence-order-independentcomparison technique. J Mol Biol 1996;260:604–620.
11. Keskin O, Tsai CJ, Wolfson H, Nussinov R. A new, structurallynonredundant, diverse data set of protein–protein interfaces andits implications. Protein Sci 2004;13:1043–1055.
12. Schmitt S, Kuhn D, Klebe G. A new method to detect relatedfunction among proteins independent of sequence and fold homol-ogy. J Mol Biol 2002;323:387–406.
13. Artymiuk PJ, Poirrette AR, Grindley HM, Rice DW, Willett P. Agraph-theoretic approach to the identification of three-dimen-sional patterns of amino acid side-chains in protein structures. JMol Biol 1994;243:327–344.
TABLE III. Three Clusters With Members That ShareSimilar Low-Level Annotation of Function or Process
Clustermembers
Specific function(obtained by SCOP)
Shared low-levelfunction/process
(obtained byGO)
113bAD Precorrin-6Ymethyltransferase
Transferaseactivity
110oAB Anti-sigma factor spoIIab Transferaseactivity
1b99AD Nucleoside diphosphatekinases
Transferaseactivity
1e7pAD Fumarate reductase —1gttBC 4-hydroxyphenylacetate
degradationbifunctional isomerase
—
1iunAB Product hydrolase CumD —
1a3gAB Branched-chain aminoacid aminotransferase
Transferaseactivity
1e4yAB Adenylate kinase Transferaseactivity
1f80AE Acyl carrier protein Transferaseactivity
1ir2BG Ribulose 1,5-bisphosphatecarboxylase-oxygenase
—
1d5wBC Transcriptionalregulatory protein FixJ
DNA binding
1nlxAB Pollen allergen (No annotations)1ihwAB Retroviral integrase DNA binding1petAD p53 tetramerization
domainDNA binding
1saeAB p53 tetramerizationdomain
DNA binding
1hv2AB Elongin C (No annotations)1je8AB Nitrate/nitrite response
regulatorDNA binding
1ng7AB Poliovirus core protein 3a RNA binding1q0wAB (NO SCOP ENTRY) RNA binding1otrAB Protein Cue2 and
UbiquitinDamaged DNA
binding1pmxAB (NO SCOP ENTRY) —1h59AB Insulinlike growth factor
and IGFBP-5—
1jyoEF Virulence effector SptPdomain
—
1pmpAB P2 myelin protein —
The mark (—) implies that the recurring annotation does not appear inthis complex.
PROTEIN–PROTEIN INTERFACE DATA SET 19
14. Ullmann JR. An algorithm for subgraph isomorphism. J AssocComput Mach 1976;23:31–42.
15. Spriggs RV, Artymiuk PJ, Willett P. Searching for patterns ofamino acids in 3D protein structures. J Chem Inf Comput Sci2003;43:412–421.
16. Rosen M, Lin SL, Wolfson H, Nussinov R. Molecular shapecomparisons in searches for active sites and functional similarity.Protein Eng 1998;11:263–277.
17. Russell RB. Detection of protein three-dimensional side-chainpatterns: new examples of convergent evolution. J Mol Biol1998;279:1211–1227.
18. Kinoshita K, Furui J, Nakamura H. Identification of proteinfunctions from a molecular surface database, eF-site. J StructFunct Genomics 2002;2:9–22.
19. Kinoshita K, Nakamura H. Identification of protein biochemicalfunctions by similarity search using the molecular surface data-base eF-site. Protein Sci 2003;12:1589–1595.
20. Bron C, Kerbosch J. Finding all cliques of an undirected graph.Commun ACM 1973;16:575–577.
21. Wallace AC, Borkakoti N, Thornton JM. TESS: a geometrichashing algorithm for deriving 3D coordinate templates for search-ing structural databases: application to enzyme active sites.Protein Sci 1997;6:2308–2323.
22. Wallace AC, Laskowski RA, Thornton JM. Derivation of 3Dcoordinate templates for searching structural databases: applica-tion to Ser-His-Asp catalytic triads in the serine proteinases andlipases. Protein Sci 1996;5:1001–1013.
23. Barker JA, Thornton JM. An algorithm for constraint-basedstructural template matching: application to 3D templates withstatistical analysis. Bioinformatics 2003;19:1644–1649.
24. Brakoulias A, Jackson RM. Towards a structural classification ofphosphate binding sites in protein–nucleotide complexes: anautomated all-against-all structural comparison using geometricmatching. Proteins 2004;56:250–260.
25. Shulman-Peleg A, Nussinov R, Wolfson HJ. Recognition of func-tional sites in protein structures. J Mol Biol 2004;339:607–633.
26. Jones S, Thornton JM. Searching for functional sites in proteinstructures. Curr Opin Chem Biol 2004;8:3–7.
27. Garey MR, Johnson DS. Computers and intractability: a guide tothe theory of NP-Completeness. New York: W. H. Freeman; 1979.
28. Cormen TH, Leiserson CE, Rivest RL. Introduction to algorithms.Cambridge, MA: MIT Press; 1990.
29. Attwood TK, Bradley P, Flower DR, Gaulton A, Maudling N,Mitchell AL, Moulton G, Nordle A, Paine K, Taylor P, Uddin A,Zygouri C. PRINTS and its automatic supplement, prePRINTS.Nucleic Acids Res 2003;31:400–402.
30. Sigrist CJ, Cerutti L, Hulo N, Gattiker A, Falquet L, Pagni M,Bairoch A, Bucher P. PROSITE: a documented database usingpatterns and profiles as motif descriptors. Brief Bioinform 2002;3:265–274.
31. Li H, Li J. Discovery of stable and significant binding motif pairsfrom PDB complexes and protein interaction data sets. Bioinfor-matics 2005;21:314–324.
32. Nussinov R, Wolfson HJ. Efficient detection of three-dimensionalstructural motifs in biological macromolecules by computer visiontechniques. Proc Natl Acad Sci USA 1991;88:10495–10499.
33. Mintseris J, Weng Z. Atomic contact vectors in protein–proteinrecognition. Proteins 2003;53:629–639.
34. Shulman-Peleg A, Mintz S, Nussinov R, Wolfson HJ. Protein–protein interfaces: Recognition of similar spatial and chemical organi-zations. In Jonassen I and Kim J, editors. Workshop on Algorithmsin Bioinformatics 2004, Bergen, Norway. Lecture Notes in ComputerScience, Springer Verlag, Volume 3240. p 194–205.
35. Bogan AA, Thorn KS. Anatomy of hot spots in protein interfaces. JMol Biol 1998;280:1–9.
36. Clackson T, Wells JA. A hot spot of binding energy in a hormone–receptor interface. Science 1995;267:383–386.
37. DeLano WL. Unraveling hot spots in binding interfaces: progressand challenges. Curr Opin Struct Biol 2002;12:14–20.
38. Hu Z, Ma B, Wolfson H, Nussinov R. Conservation of polar residuesas hot spots at protein interfaces. Proteins 2000;39:331–342.
39. Ma B, Elkayam T, Wolfson H, Nussinov R. Protein–proteininteractions: structurally conserved residues distinguish betweenbinding sites and exposed protein surfaces. Proc Natl Acad SciUSA 2003;100:5772–5777.
40. Henrick K, Thornton JM. PQS: a protein quaternary structure fileserver. Trends Biochem Sci 1998;23:358–361.
41. Murzin AG, Brenner SE, Hubbard T, Chothia C. SCOP: a struc-tural classification of proteins database for the investigation ofsequences and structures. J Mol Biol 1995;247:536–540.
42. Dror O, Benyamini H, Nussinov R, Wolfson H. MASS: multiplestructural alignment by secondary structures. Bioinformatics2003;19(Suppl 1):i95–i104.
43. Dror O, Benyamini H, Nussinov R, Wolfson HJ. Multiple struc-tural alignment by secondary structures: algorithm and applica-tions. Protein Sci 2003;12:2492–2507.
44. Connolly ML. Solvent-accessible surfaces of proteins and nucleicacids. Science 1983;221:709–713.
45. Connolly ML. Molecular surface calculation. J Appl Crystallogr1983;16:548–558.
46. Mehlhorn K. The LEDA platform of combinatorial and geometriccomputing. London: Cambridge University Press; 1999.
47. Richards FM. Areas, volumes, packing and protein structure.Annu Rev Biophys Bioeng 1977;6:151–176.
48. Duda RO, Hart PE, Stork DG. Pattern classification. New York:Wiley; 2001.
49. Altschul SF, Gish W, Miller W, Myers EW, Lipman DJ. Basic localalignment search tool. J Mol Biol 1990;215:403–410.
50. Liu Y, Xu L, Opalka N, Kappler J, Shu HB, Zhang G. Crystalstructure of sTALL-1 reveals a virus-like assembly of TNF familyligands. Cell 2002;108:383–394.
51. Bahadur RP, Chakrabarti P, Rodier F, Janin J. A dissection ofspecific and non-specific protein–protein interfaces. J Mol Biol2004;336:943–955.
52. Fischer D, Wolfson H, Lin SL, Nussinov R. Three-dimensional,sequence order-independent structural comparison of a serineprotease against the crystallographic database reveals active sitesimilarities: potential implications to evolution and to proteinfolding. Protein Sci 1994;3:769–778.
53. Sandhya S, Kishore S, Sowdhamini R, Srinivasan N. Effectivedetection of remote homologues by searching in sequence data setof a protein domain fold. FEBS Lett 2003;552:225–230.
54. Glaser F, Steinberg DM, Vakser IA, Ben-Tal N. Residue frequen-cies and pairing preferences at protein–protein interfaces. Pro-teins 2001;43:89–102.
55. Zhou HX, Shan Y. Prediction of protein interaction sites fromsequence profile and residue neighbor list. Proteins 2001;44:336–343.
56. Argos P. An investigation of protein subunit and domain inter-faces. Protein Eng 1988;2:101–113.
57. Neuvirth H, Raz R, Schreiber G. ProMate: a structure basedprediction program to identify the location of protein–proteinbinding sites. J Mol Biol 2004;338:181–199.
58. Lo Conte L, Chothia C, Janin J. The atomic structure of protein–protein recognition sites. J Mol Biol 1999;285:2177–2198.
59. Elcock AH, McCammon JA. Identification of protein oligomeriza-tion states by analysis of interface conservation. Proc Natl AcadSci USA 2001;98:2990–2994.
60. Ponstingl H, Henrick K, Thornton JM. Discriminating betweenhomodimeric and monomeric proteins in the crystalline state.Proteins 2000;41:47–57.
61. Harris MA, Clark J, Ireland A, Lomax J, Ashburner M, Foulger R,Eilbeck K, Lewis S, Marshall B, Mungall C, Richter J, Rubin GM,Blake JA, Bult C, Dolan M, Drabkin H, Eppig JT, Hill DP, Ni L,Ringwald M, Balakrishnan R, Cherry JM, Christie KR, CostanzoMC, Dwight SS, Engel S, Fisk DG, Hirschman JE, Hong EL, NashRS, Sethuraman A, Theesfeld CL, Botstein D, Dolinski K, Feier-bach B, Berardini T, Mundodi S, Rhee SY, Apweiler R, Barrell D,Camon E, Dimmer E, Lee V, Chisholm R, Gaudet P, Kibbe W,Kishore R, Schwarz EM, Sternberg P, Gwinn M, Hannick L,Wortman J, Berriman M, Wood V, de la Cruz N, Tonellato P,Jaiswal P, Seigfried T, White R. The Gene Ontology (GO) databaseand informatics resource. Nucleic Acids Res 2004;32[Databaseissue]:D258–D261.
62. Botuyan MV, Mer G, Yi GS, Koth CM, Case DA, Edwards AM,Chazin WJ, Arrowsmith CH. Solution structure and dynamics ofyeast elongin C in complex with a von Hippel–Lindau peptide. JMol Biol 2001;312:177–186.
63. Shatsky M, Shulman-Peleg A, Nussinov R, Wolfson HJ. Recogni-tion of binding patterns common to a set of protein structures. InMiyano S, editor. RECOMB 2005, Cambridge, MA, May 14–18,2005. Lecture Notes in Computer Science, Springer Verlag, Vol-ume 3500. p 440–455.
20 S. MINTZ ET AL.