Generating .xpt files with SAS, R and Python - PharmaSUG
11
PharmaSUG 2021 - Paper EP-057 Generating .xpt files with SAS, R and Python Todd Case and YuTing Tian Vertex Pharmaceuticals, Boston, USA ABSTRACT The primary purpose of this paper is to first lay out a process of generating a simplified Transport (.xpt) file with RStudio and Python to meet study electronic data submission requirements of the Food & Drug Administration (FDA). The second purpose of this paper is to compare the .xpt files created from three different languages: R, Python and SAS. The paper is the expansion of the original FDA guideline document “CREATING SIMPLIFIED TS.XPT FILES”, published in November, 2019. Transport files can be created by SAS, as well as open source software, including R and Python. According to the FDA guideline document mentioned above, .xpt files can be created by R and Python. This may allow Pharmaceutical companies to expand use of R and Python beyond data visualization and statistical analysis currently being generated by these two languages. Hopefully, readers can use the process shown in the paper as a template to create .xpt files. INTRODUCTION Transport files are in use in the pharmaceutical industry as a result of FDA e-data submission requirements. The “Creating Simplified TS.XPT Files” is the specific guide to help sponsors create TS (ts.xpt) files with R and Python to meet study data submission requirements. The paper is divided into four sections which correspond to the steps outlined in our suggested processes: the first three sections introduce how to produce .xpt files with SAS,R and Python, respectively, and the fourth section compares the results of simplified .xpt files generated from the different software packages using SAS Universal Viewer (the application to view SAS Transport .xpt files). 1) Using SAS to generate final datasets in .xpt format 1.1) Code to generate raw TS domain in SAS 1.2) Export TS.SAS with .xpt format 1.3) Using macro to create .xpt files with SAS 2) Using RStudio to generate final datasets in xpt format 2.1) Code to generate raw TS domain in RStudio 2.2) Export TS.R file with .xpt format 2.3) A fast way to create All .xpt files with RStudio 3) Using Python to generate final datasets in .xpt format 3.1) Code to generate raw TS domain in Python 3.2) Export TS.py file with .xpt format 4) Review and Compare generated ts.xpt file in SAS Universal Viewer 1). Using SAS to generate final datasets in .xpt format 1.1) Code to generate raw TS domain in SAS The Trial Summary domain is used to record basic information about the study such as protocol title, trial phase, etc. The purpose of this paper is to introduce the process of generating xpt files with different languages in terms of the original paper “Creating Simplified TS.XPT Files. We assume the readers have a fundamental knowledge of using SAS, RStudio and Python already, therefore we start our paper with raw data already cleaned with SAS, then the same raw Trial Summary dataset is applied into SAS, RStudio and Python to generate a ts.xpt file separately. The fabricated TS raw dataset is produced as Figure1 shown below:
-
Upload
khangminh22 -
Category
Documents
-
view
2 -
download
0
Transcript of Generating .xpt files with SAS, R and Python - PharmaSUG

PharmaSUG 2021 - Paper EP-057
Generating .xpt files with SAS, R and Python
Todd Case and YuTing Tian
Vertex Pharmaceuticals, Boston, USA
ABSTRACT The primary purpose of this paper is to first lay out a process of generating a simplified Transport (.xpt) file with RStudio and Python to meet study electronic data submission requirements of the Food & Drug Administration (FDA). The second purpose of this paper is to compare the .xpt files created from three different languages: R, Python and SAS. The paper is the expansion of the original FDA guideline document “CREATING SIMPLIFIED TS.XPT FILES”, published in November, 2019. Transport files can be created by SAS, as well as open source software, including R and Python. According to the FDA guideline document mentioned above, .xpt files can be created by R and Python. This may allow Pharmaceutical companies to expand use of R and Python beyond data visualization and statistical analysis currently being generated by these two languages. Hopefully, readers can use the process shown in the paper as a template to create .xpt files.
INTRODUCTION Transport files are in use in the pharmaceutical industry as a result of FDA e-data submission requirements. The “Creating Simplified TS.XPT Files” is the specific guide to help sponsors create TS (ts.xpt) files with R and Python to meet study data submission requirements. The paper is divided into four sections which correspond to the steps outlined in our suggested processes: the first three sections introduce how to produce .xpt files with SAS,R and Python, respectively, and the fourth section compares the results of simplified .xpt files generated from the different software packages using SAS Universal Viewer (the application to view SAS Transport .xpt files).
1) Using SAS to generate final datasets in .xpt format 1.1) Code to generate raw TS domain in SAS 1.2) Export TS.SAS with .xpt format 1.3) Using macro to create .xpt files with SAS
2) Using RStudio to generate final datasets in xpt format
2.1) Code to generate raw TS domain in RStudio 2.2) Export TS.R file with .xpt format 2.3) A fast way to create All .xpt files with RStudio
3) Using Python to generate final datasets in .xpt format
3.1) Code to generate raw TS domain in Python 3.2) Export TS.py file with .xpt format
4) Review and Compare generated ts.xpt file in SAS Universal Viewer
1). Using SAS to generate final datasets in .xpt format
1.1) Code to generate raw TS domain in SAS
The Trial Summary domain is used to record basic information about the study such as protocol title, trial phase, etc. The purpose of this paper is to introduce the process of generating xpt files with different languages in terms of the original paper “Creating Simplified TS.XPT Files. We assume the readers have a fundamental knowledge of using SAS, RStudio and Python already, therefore we start our paper with raw data already cleaned with SAS, then the same raw Trial Summary dataset is applied into SAS, RStudio and Python to generate a ts.xpt file separately. The fabricated TS raw dataset is produced as Figure1 shown below:
Data TS;
infile datalines truncover firstobs=2;
length STUDYID $20 DOMAIN $2 TSSEQ 8. TSGRPID $40. TSPARMCD $8 TSPARM $40
TSVAL TSVALNF TSVALCD $200 TSVCDREF $20 TSVCDVER $10;
attrib
STUDYID label = 'Study Identifier'
DOMAIN label = 'Domain Abbreviation'
TSSEQ label = 'Sequence Number'
TSGRPID label = 'Group ID'
TSPARMCD label = 'Trial Summary Parameter Short Name'
TSPARM label = 'Trial Summary Parameter'
TSVAL label = 'Parameter Value'
TSVALNF label = 'Parameter Null Flavor'
TSVALCD label = 'Parameter Value Code'
TSVCDREF label = 'Name of the Reference Terminology'
TSVCDVER label='Version of the Reference Terminology';
input @1 STUDYID $ 1-3 @5 DOMAIN $ 5-6 @8 TSSEQ 1. @10 TSGRPID $ 10-22
@23 TSPARMCD $ 23-31 @32 TSPARM $ 32-57 @59 TSVAL $59-72 @74 TSVALNF $74-75
@76 TSVALCD $ 76-82 @83 TSVCDREF $ 83-91 @93 TSVCDVER $ 93-103 @
;
datalines;
123456789012345678901234567890123456789012345678901234567890123456789012345678901235678901234567890123456
001 TS 1 ACTSUB Actual Number of Subjects 10
001 TS 1 ADAPT Adaptive Design N C49487 CDISC 2019-12-20
001 TS 1 AGEMAX Maximum Age of Subjects P65Y ISO 8601
001 TS 1 AGEMIN Minimum Age of Subjects P18Y ISO 8601
001 TS 1 DCUTDESC Data Cutoff Description DATABASE LOCK
001 TS 1 DCUTDTC Data Cutoff Date 2020-11-26
001 TS 1 group1,drug1 DOSE Dose per Administration 400
001 TS 2 group2,drug2 DOSE Dose per Administration 15
001 TS 1 drug1 DOSFRM Dose Form TABLET C42998 ISO 8601
001 TS 1 drug2 DOSFRM Dose Form CAPSULES C42998 ISO 8601
;
run; Figure1 Figure1 is a simulated dataset - we have created the eleven standard CDISC (Clinical Data Interchange Standards Consortium) variables that exist in the TS domain. We assume the readers are already familiar with the Trial Summary dataset, so we do not explain each variable and value in detail. This fabricated data shows some parameters that are required or expected in the Trial Summary dataset, the STUDYID is “001”; the DOMAIN is “TS”; there are two drugs: -drug1 and drug2; TSPARMCD is the short name of the parameter, such as “ACTSUB”, “AGEMAX” here; TSPARM is the term for the parameter in corresponding with TSPARMCD, such as “Actual Number of Subjects”, “Maximum Age of Subjects”; TSVAL is the value of TSPARM, such as the number of subjects in this study is “10”, the maximum age of subjects is P65Y, meaning 65 years old, etc.
Figure2 Figure2 shows the result of the code from Figure1 in SAS.
1.2) Export it with xpt format
libname sasfile "E:\users\tiany";
libname xptfile XPORT "E:\users\tiany\ts.xpt";
data xptfile.ts;
set sasfile.ts2;
run;
/*or another way to xport*/
1
11
1
d
2
1
1
1
2
11
1
d
2
1
1
proc copy in=sasfile
out=xptfile memtype=data;
select ts2;
run;
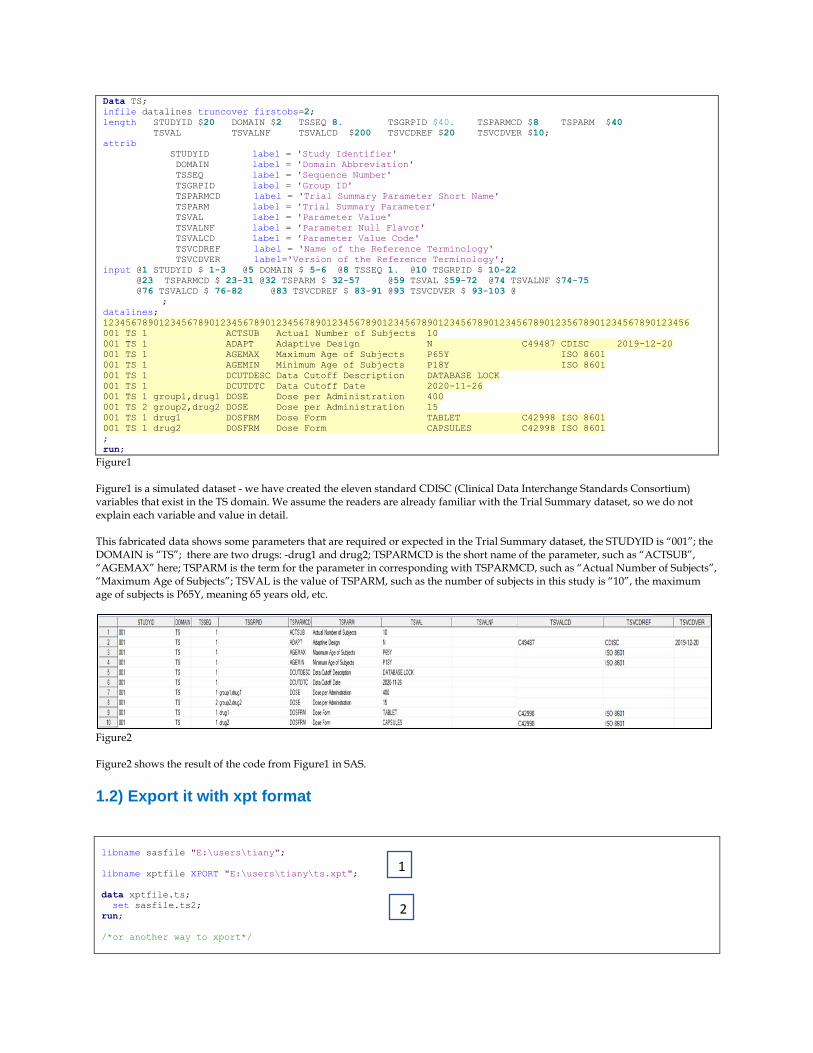
Figure3 Figure3 is the code to generate the ts.xpt file.
1: Define two libnames: “sasfile” for saving sas dataset and “xptile” for saving file with .xpt format. Notice: when we create a path for storing xpt file, we should be specific the name of the .xpt file we are creating into path using XPORT engine, such as: “E:\users\tiany\ts.xpt” here. There are two different ways of creating xpt file as below: 2: create xpt file with “data step” 3: to create xpt file with “proc copy” statement. The process is straightforward as shown in figure2.
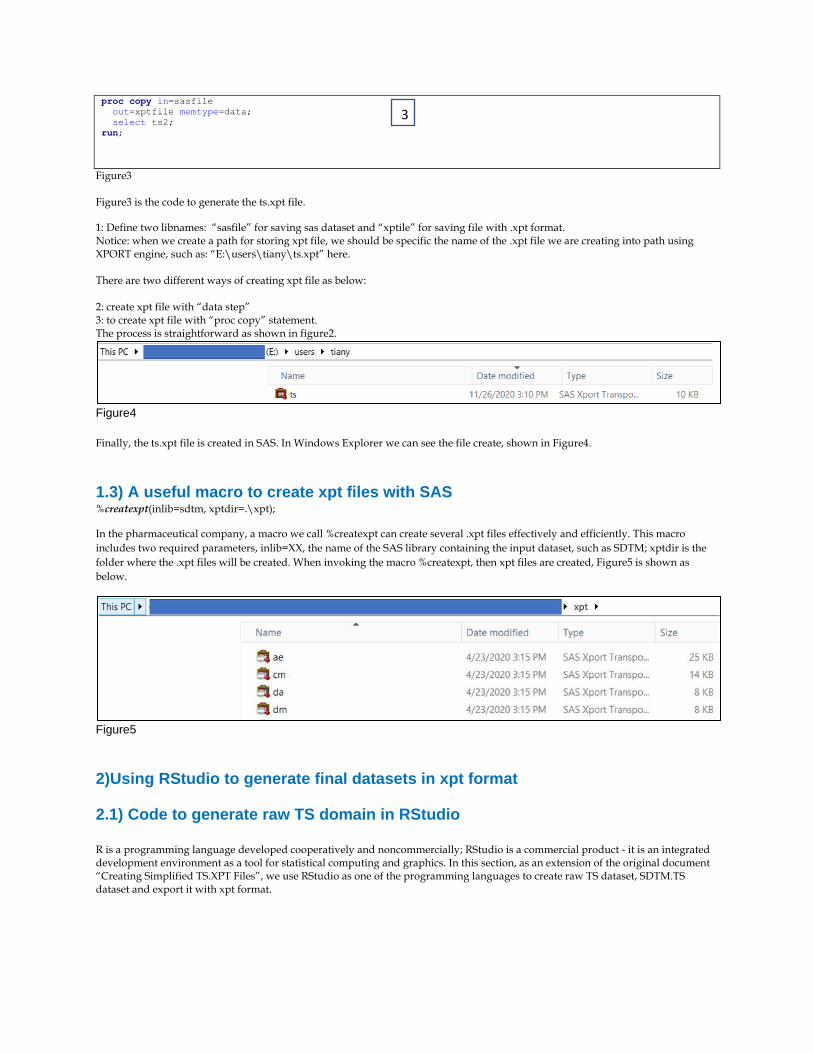
Figure4
Finally, the ts.xpt file is created in SAS. In Windows Explorer we can see the file create, shown in Figure4.
1.3) A useful macro to create xpt files with SAS %createxpt(inlib=sdtm, xptdir=.\xpt);
In the pharmaceutical company, a macro we call %createxpt can create several .xpt files effectively and efficiently. This macro
includes two required parameters, inlib=XX, the name of the SAS library containing the input dataset, such as SDTM; xptdir is the
folder where the .xpt files will be created. When invoking the macro %createxpt, then xpt files are created, Figure5 is shown as
below.
Figure5
2)Using RStudio to generate final datasets in xpt format
2.1) Code to generate raw TS domain in RStudio
R is a programming language developed cooperatively and noncommercially; RStudio is a commercial product - it is an integrated development environment as a tool for statistical computing and graphics. In this section, as an extension of the original document “Creating Simplified TS.XPT Files”, we use RStudio as one of the programming languages to create raw TS dataset, SDTM.TS dataset and export it with xpt format.
3
11
1
d
2
1
1
1

##option 1 package##
Install.packages('SASxport')
library(SASxport)
library(Hmisc)
Library(sas7bdat)
##option 2 package##
Install.packages('haven')
library(Hmisc)
library(haven)
Figure6 After installing R and RStudio, then you can use either option1 “SASXport” package or option2 “Haven” package. For each package, there are three steps separately as shown below: 1: Install the package “SASXport”. This package is to provide functions to read, list contents and write SAS export files. 2: Invoke the library function to load it into the current R session: library(SASxport), library(Hmisc). The Hmisc library contains many functions such as useful data analysis. We need to use data frame function and label function under Hmisc library. 3: then we can use library(sas7bdat) to read SAS datasets into R. 4: the second way is to install the package “Haven”. Then we invoke library(Hmisc) and library(haven) to read SAS datasets into R. As Figure6 is shown above.
ts<-data.frame( STUDYID = c("001","001","001","001","001","001","001","001","001","001"),
DOMAIN = "TS",
TSSEQ = c(1,1,1,1,1,1,1,2,1,1),
TSGRPID = c("","","","","","","group1,drug1","group2,drug2","drug1","drug2"),
TSPARMCD = c("ACTSUB","ADAPT","AGEMAX","AGEMIN",
"DCUTDESC","DCUTDTC", "DOSE","DOSE","DOSFRM", "DOSFRM"),
TSPARM = c("Actual Number of Subjects",
"Adaptive Design",
"Maximum Age of Subjects",
"Minimum Age of Subjects",
"Data Cutoff Description",
"Data Cutoff Date",
"Dose per Administration",
"Dose per Administration",
"Dose Form",
"Dose Form"),
TSVAL = c("10","N","P65Y","P18Y",
"DATABASE LOCK",
strftime(as.Date("2020-11-26",format="%Y-%m-%d")),
"400","15",
"TABLET","CAPSULES"),
TSVALNF = c(""),
TSVALCD = c("","C49487","","","","","","","C42998","C42998"),
TSVCDREF = c("","CDISC","ISO 8601","ISO 8601","","","","","ISO 8601","ISO 8601"),
TSVCDVER = c("",strftime(as.Date("2019-12-20",format="%Y-%m-%d")),"","","",
"","","","",""),stringsAsFactors = FALSE)
View(ts)
Figure7
Figure7 shows how to create Trial Summary dataset using data.frame function in RStudio. We use data.frame function to collect variables which share many of the properties of lists, then we use a series of c vectors to store values. As we mentioned above, we assume readers have a rudimental knowledge of using RStudio, therefore we won’t explain the code in detail.
1
11
1
d
2
1
1
1
2
11
1
d
2
1
1
1
3
11
1
d
2
1
1
1
4
11
1
d
2
1
1
1
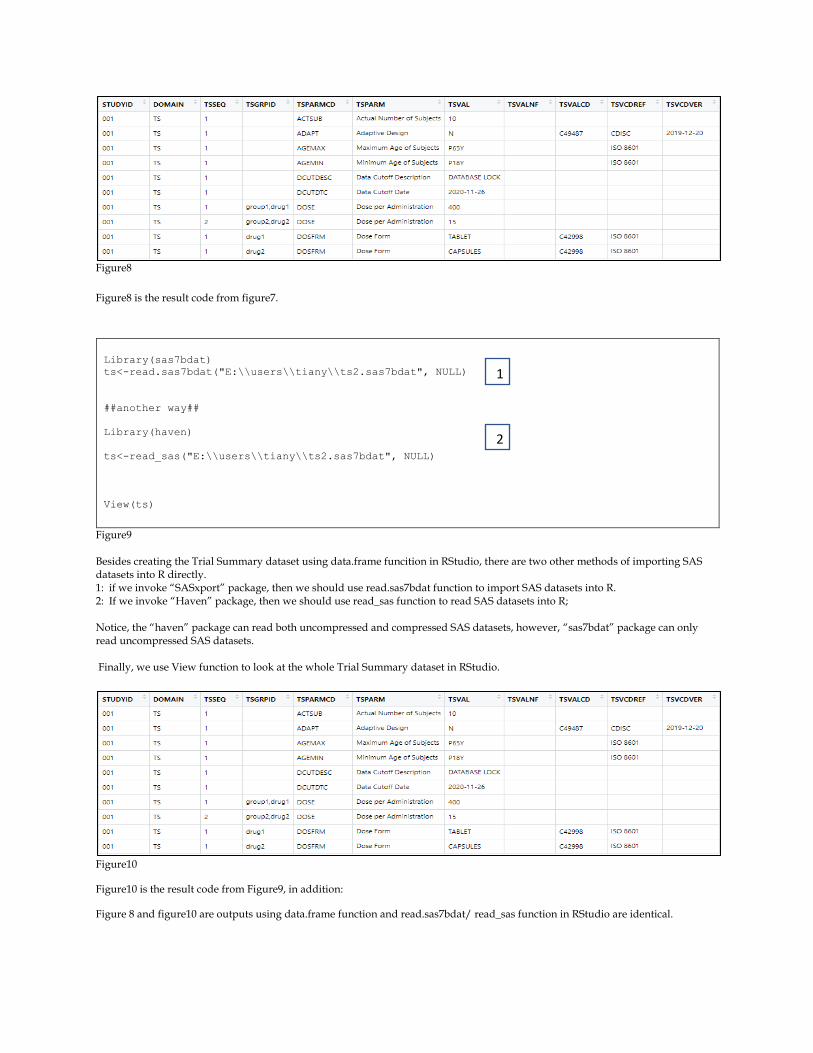
Figure8
Figure8 is the result code from figure7.
Library(sas7bdat)
ts<-read.sas7bdat("E:\\users\\tiany\\ts2.sas7bdat", NULL)
##another way##
Library(haven)
ts<-read_sas("E:\\users\\tiany\\ts2.sas7bdat", NULL)
View(ts)
Figure9 Besides creating the Trial Summary dataset using data.frame funcition in RStudio, there are two other methods of importing SAS datasets into R directly. 1: if we invoke “SASxport” package, then we should use read.sas7bdat function to import SAS datasets into R. 2: If we invoke “Haven” package, then we should use read_sas function to read SAS datasets into R; Notice, the “haven” package can read both uncompressed and compressed SAS datasets, however, “sas7bdat” package can only read uncompressed SAS datasets. Finally, we use View function to look at the whole Trial Summary dataset in RStudio.
Figure10
Figure10 is the result code from Figure9, in addition:
Figure 8 and figure10 are outputs using data.frame function and read.sas7bdat/ read_sas function in RStudio are identical.
1
11
1
d
2
1
1
1
2
11
1
d
2
1
1
1

label(ts) <- 'Trial Summary'
label(ts$STUDYID)<-'Study Identifier'
label(ts$DOMAIN)<-'Domain Abbreviation'
label(ts$TSSEQ)<-'Sequence Number'
label(ts$TSGRPID)<-'Group ID'
label(ts$TSPARMCD)<-'Trial Summary Parameter Short Name'
label(ts$TSPARM)<-'Trial Summary Parameter'
label(ts$TSVAL)<-'Parameter Value'
label(ts$TSVALNF)<-'Parameter Null Flavor'
label(ts$TSVALCD)<-'Parameter Value Code'
label(ts$TSVCDREF)<-'Name of the Reference Terminology'
label(ts$TSVCDVER)<-'Version of the Reference Terminology Figure11
Figure11 shows of using label function to assign labels for each variable.
2.2) Export TS.R file with .xpt format
write.xport(ts,file="E:/users/tiany/ts_R.xpt")
Figure12
Finally, we use write.xport function to export TS file with xpt format. Figure12 is shown as above.
Figure 13
Figure13 is the ts.xpt file created by RStudio.
2.3) A fast way to create ALL xpt files in a directory with RStudio
##import all files##
Library(haven)
setwd("E:\\Users\\Tiany")
ldf <- list()
listsas <- dir(pattern = "*.sas7bdat")
for (k in 1:length(listsas)){
ldf[[k]] <- read_sas(listsas[k])
m<-substr(listsas[[k]],1,2)
path<-paste("E:\\Users\\Tiany\\sas\\",m,"_new.xpt",sep="")
write_xpt(ldf[[k]],path)
}
1
11
1
d
2
1
1
1
2
11
1
d
2
1
1
1
3
11
1
d
2
1
1
1
4
11
1
d
2
1
1
1
5
11
1
d
2
1
1
1

1: create a list
2: create the list of all the sas7bdat files in the directory
3: using for loop function to import all sas7bdat files from the SAS library to RStudio.
Figure15
Figure15 shows the result of #3 in figure14.
4: concatenate the string and create the path where store all .xpt files
Figure16
Figure16 shows the result of #4 in figure14
5: export all xpt files with write_xpt function.
Figure17
Figure17 is the result of code from #5 in figure15.
3) Using Python to generate final datasets in xpt format
3.1) Code to generate raw TS domain in Python Python is an interpreted, object-oriented, high-level programming language. In the pharmaceutical industry, there is a growing
acceptance towards using Python to deal with data and to deliver programming outputs efficiently and effectively.
After installing python, open the CMD.exe command line interface, set the directory where python is installed and type in pip
install xport, as shown on below Figure18.
Figure18
Figure14
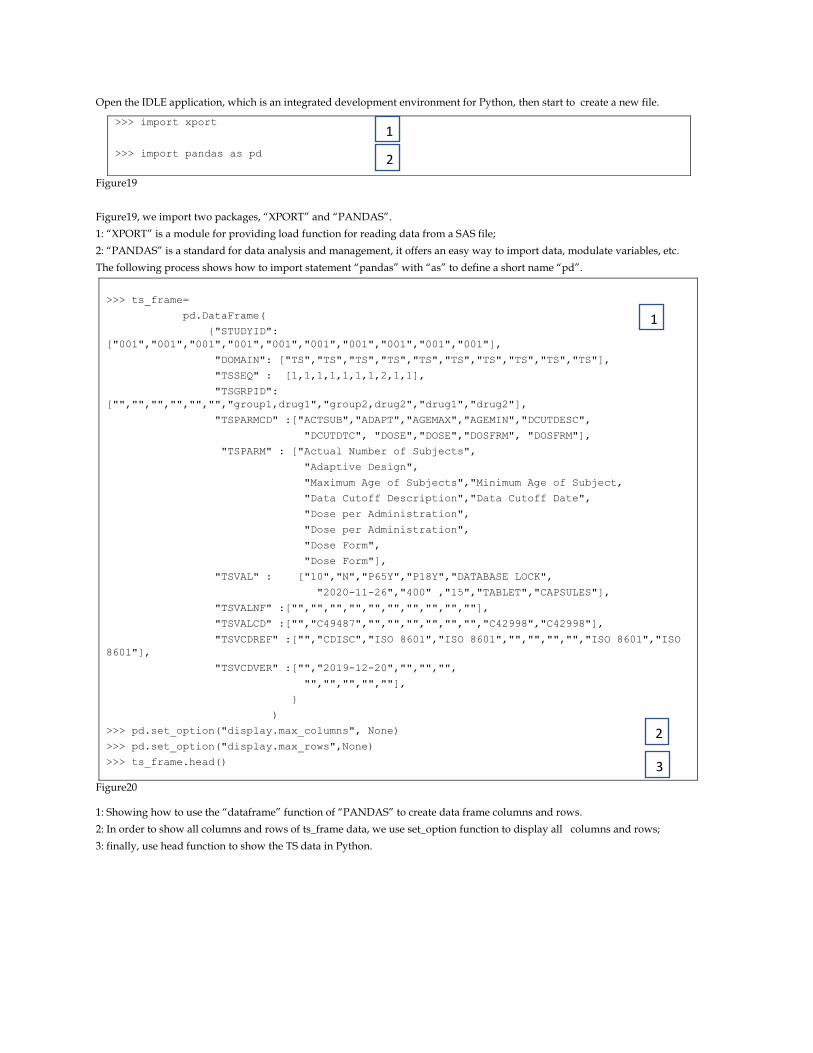
Open the IDLE application, which is an integrated development environment for Python, then start to create a new file.
Figure19
Figure19, we import two packages, “XPORT” and “PANDAS”.
1: “XPORT” is a module for providing load function for reading data from a SAS file;
2: “PANDAS” is a standard for data analysis and management, it offers an easy way to import data, modulate variables, etc.
The following process shows how to import statement “pandas” with “as” to define a short name “pd”.
>>> ts_frame=
pd.DataFrame(
{"STUDYID":
["001","001","001","001","001","001","001","001","001","001"],
"DOMAIN": ["TS","TS","TS","TS","TS","TS","TS","TS","TS","TS"],
"TSSEQ" : [1,1,1,1,1,1,1,2,1,1],
"TSGRPID":
["","","","","","","group1,drug1","group2,drug2","drug1","drug2"],
"TSPARMCD" :["ACTSUB","ADAPT","AGEMAX","AGEMIN","DCUTDESC",
"DCUTDTC", "DOSE","DOSE","DOSFRM", "DOSFRM"],
"TSPARM" : ["Actual Number of Subjects",
"Adaptive Design",
"Maximum Age of Subjects","Minimum Age of Subject,
"Data Cutoff Description","Data Cutoff Date",
"Dose per Administration",
"Dose per Administration",
"Dose Form",
"Dose Form"],
"TSVAL" : ["10","N","P65Y","P18Y","DATABASE LOCK",
"2020-11-26","400" ,"15","TABLET","CAPSULES"],
"TSVALNF" :["","","","","","","","","",""],
"TSVALCD" :["","C49487","","","","","","","C42998","C42998"],
"TSVCDREF" :["","CDISC","ISO 8601","ISO 8601","","","","","ISO 8601","ISO
8601"],
"TSVCDVER" :["","2019-12-20","","","",
"","","","",""],
}
)
>>> pd.set_option("display.max_columns", None)
>>> pd.set_option("display.max_rows",None)
>>> ts_frame.head()
Figure20
1: Showing how to use the “dataframe” function of “PANDAS” to create data frame columns and rows.
2: In order to show all columns and rows of ts_frame data, we use set_option function to display all columns and rows;
3: finally, use head function to show the TS data in Python.
>>> import xport
>>> import pandas as pd
1
11
1
d
2
1
1
1
2
11
1
d
2
1
1
1 1
11
1
d
2
1
1
1
2
11
1
d
2
1
1
1
3
11
1
d
2
1
1
1

Figure21
Figure21 is the output of code from Figure20 in Python. It is the same result with Figure2, the one created by SAS , and Figure10, the
one created by RStudio.
3.2) Export TS.py file with .xpt format
Figure22
In figure22, We use (with open) function to export ts_frame.py with ts_python.xpt format and store it to the location
“E:/users/tiany/python file.
Figure 23
The result shows on figure23.
4)Review and Compare generated simplified ts.xpt file in SAS Universal Viewer
The SAS Universal Viewer is a replacement for the SAS System Viewer, we use SAS Universal Viewer to open the ts.xpt file that we
created.
Figure24
Figure24 is the view of ts.xpt file created by SAS.
>>> with open("E:/users/tiany/python file/ts_python.xpt","wb") as
f:xport.from_columns(ts_frame,f)
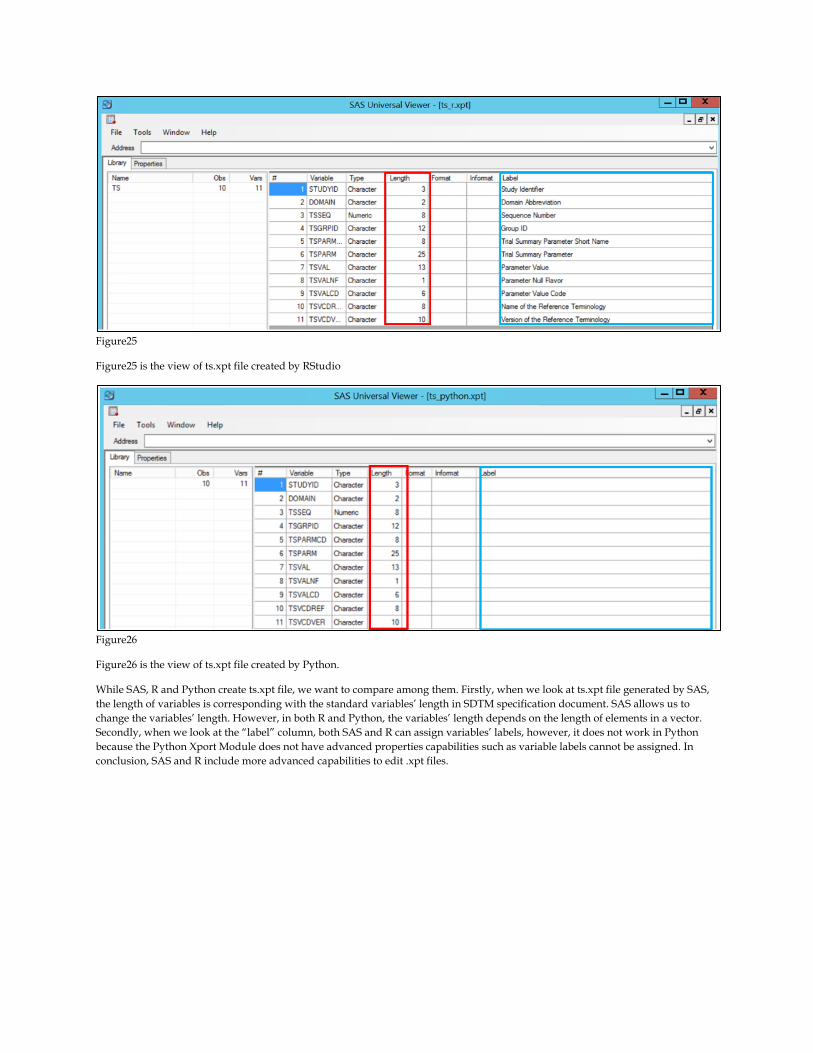
Figure25
Figure25 is the view of ts.xpt file created by RStudio
Figure26
Figure26 is the view of ts.xpt file created by Python.
While SAS, R and Python create ts.xpt file, we want to compare among them. Firstly, when we look at ts.xpt file generated by SAS,
the length of variables is corresponding with the standard variables’ length in SDTM specification document. SAS allows us to
change the variables’ length. However, in both R and Python, the variables’ length depends on the length of elements in a vector.
Secondly, when we look at the “label” column, both SAS and R can assign variables’ labels, however, it does not work in Python
because the Python Xport Module does not have advanced properties capabilities such as variable labels cannot be assigned. In
conclusion, SAS and R include more advanced capabilities to edit .xpt files.

REFRENCE
CREATING SIMPLIFIED TS.XPT FILES
https://www.fda.gov/media/132457/download
Study Data Technical Conformance Guide_v4.5
https://www.fda.gov/media/136460/download
Technical Rejection Criteria for Study Data
https://www.fda.gov/media/100743/download
ACKNOWLEDGMENTS Thanks to the people at SAS Tech Support
CONTACT INFORMATION Your comments and questions are valued and encouraged. Contact the author at:
Todd Case: [email protected]
YuTing Tian: [email protected]