
General physics laboratory(101) Prepared by Physics Lab ...
85
1 KINGDOM OF AUDI ARABIA UMM ALQURA UNIVERSITY COLLEGE OF APPLIED SCIENCE PHYSICS DEPARTMENT General physics laboratory(101) Prepared by Physics Lab Committee PDF created with pdfFactory Pro trial version www.pdffactory.com
-
Upload
khangminh22 -
Category
Documents
-
view
0 -
download
0
Transcript of General physics laboratory(101) Prepared by Physics Lab ...

1
KINGDOM OF AUDI ARABIA
UMM ALQURA UNIVERSITY
COLLEGE OF APPLIED SCIENCE
PHYSICS DEPARTMENT
General physics laboratory(101)
Prepared by
Physics Lab Committee
PDF created with pdfFactory Pro trial version www.pdffactory.com
2
General Physics Laboratory (101) Contents
Subject Experiment No Page
Important notes about the lab
Introduction / concept of measurement, errors in measurement
Graphs and graph analysis 1
Detailed illustrations on the chart
Exercises on the chart
Accurate measurements 2
Vectors 3
Study of the refractive index of the transparent material
4
Set the lens focal length of thin 5
Set the specific heat of metal 6
Set the speed of sound in air using resonance in air columns
7
Set the frequency using the tuning fork Alsolhumicr
8
The use of springs to achieve law and set the wheel Hook gravity.
9
Measure the coefficient of Bing Mad wire
10
Study of the fall of the body through the inner viscous
11
The appointment of the surface tension of a liquid
12
PDF created with pdfFactory Pro trial version www.pdffactory.com
3
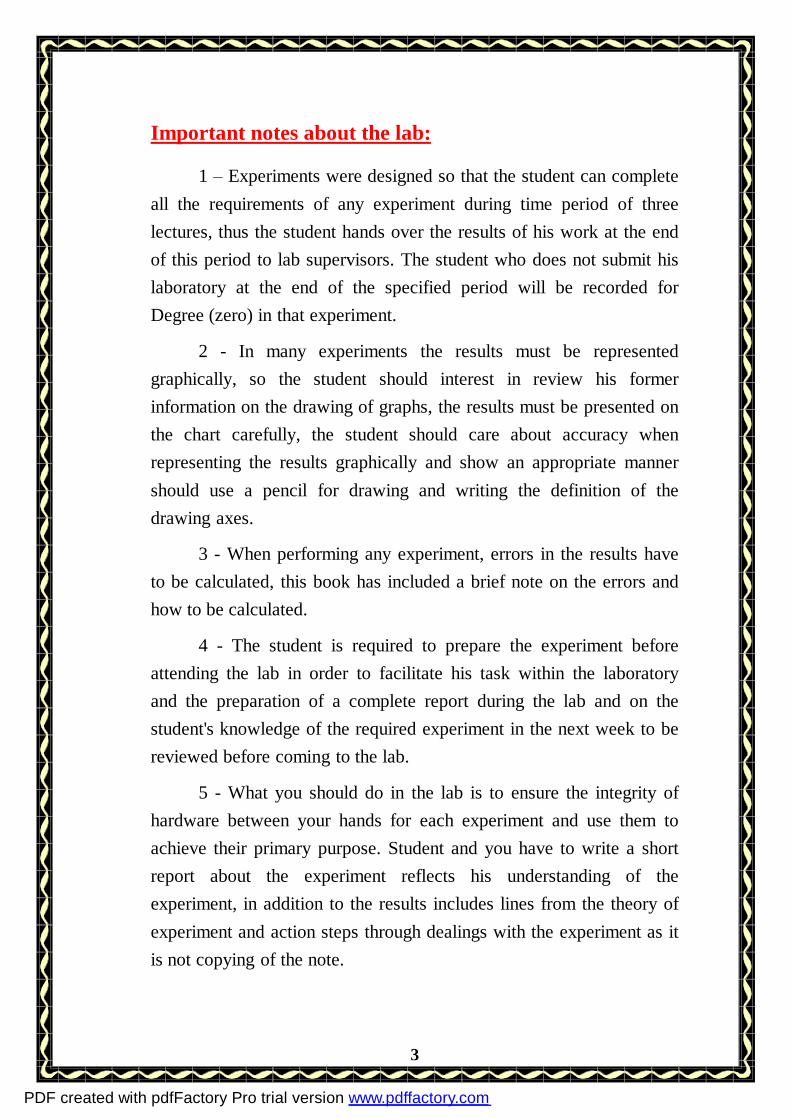
Important notes about the lab:
1 – Experiments were designed so that the student can complete all the requirements of any experiment during time period of three lectures, thus the student hands over the results of his work at the end of this period to lab supervisors. The student who does not submit his laboratory at the end of the specified period will be recorded for Degree (zero) in that experiment.
2 - In many experiments the results must be represented graphically, so the student should interest in review his former information on the drawing of graphs, the results must be presented on the chart carefully, the student should care about accuracy when representing the results graphically and show an appropriate manner should use a pencil for drawing and writing the definition of the drawing axes.
3 - When performing any experiment, errors in the results have to be calculated, this book has included a brief note on the errors and how to be calculated.
4 - The student is required to prepare the experiment before attending the lab in order to facilitate his task within the laboratory and the preparation of a complete report during the lab and on the student's knowledge of the required experiment in the next week to be reviewed before coming to the lab.
5 - What you should do in the lab is to ensure the integrity of hardware between your hands for each experiment and use them to achieve their primary purpose. Student and you have to write a short report about the experiment reflects his understanding of the experiment, in addition to the results includes lines from the theory of experiment and action steps through dealings with the experiment as it is not copying of the note.
PDF created with pdfFactory Pro trial version www.pdffactory.com

4
6 - All students should bring the necessary tools for the lab: a transparent ruler, pencil, sharpener, eraser, calculator ... Etc. any student isn't not allowed to borrow these tools from his colleagues in order not to disable the occupancy of his colleagues.
7 - The mark of the lab 25% of the decision marks, of which 15 is the rate of weekly reports and 10 marks on the final test of the lab, involved within the assessment class to the weekly report: The behavior of the student in the lab and his preoccupation with his own experiment, students prepare for the experiment or not and found that the supervisor when discussing to the student within the lab. As well as his organization of the report required.
8 - Students should take the opportunity to learn and acquire skill in experimentation and not rely on the results of others who preceded him in the implementation of this experiment. When discovery of any case based on the results of a previous class, record of that experiment will be (zero).
9 - Any student who misses more than four experiments will be deprived from the final test of the lab.
PDF created with pdfFactory Pro trial version www.pdffactory.com
5
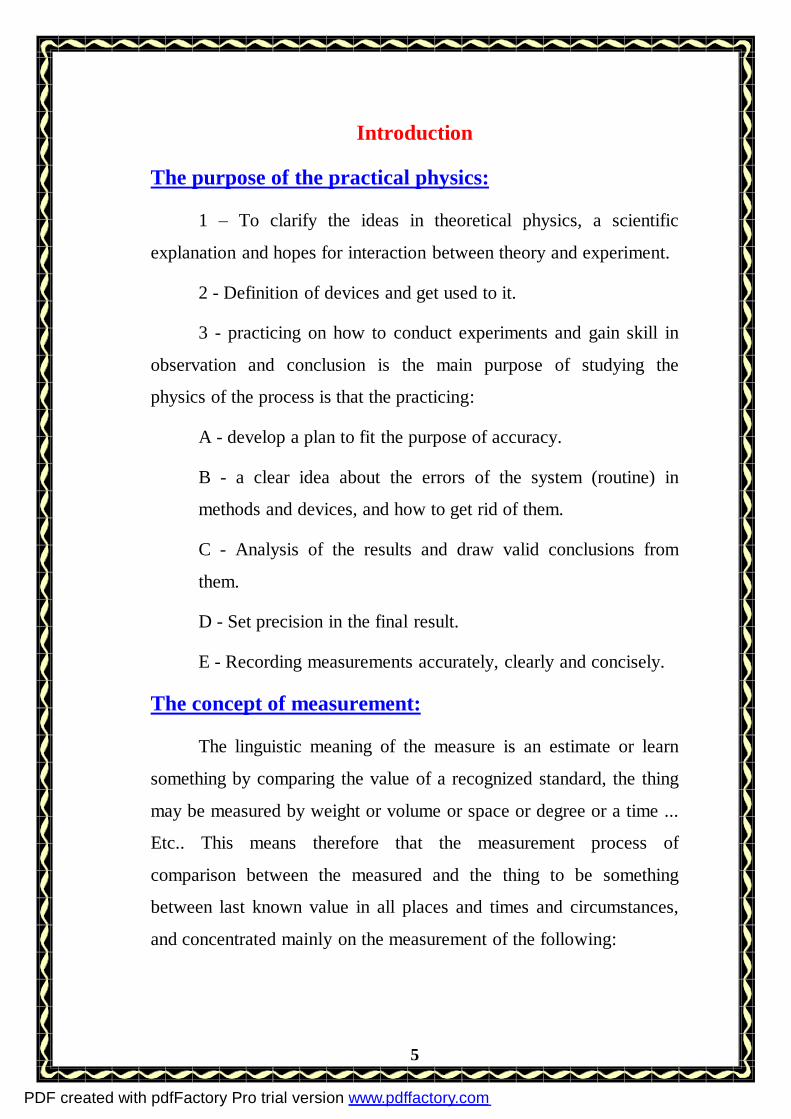
Introduction
The purpose of the practical physics:
1 – To clarify the ideas in theoretical physics, a scientific
explanation and hopes for interaction between theory and experiment.
2 - Definition of devices and get used to it.
3 - practicing on how to conduct experiments and gain skill in
observation and conclusion is the main purpose of studying the
physics of the process is that the practicing:
A - develop a plan to fit the purpose of accuracy.
B - a clear idea about the errors of the system (routine) in
methods and devices, and how to get rid of them.
C - Analysis of the results and draw valid conclusions from
them.
D - Set precision in the final result.
E - Recording measurements accurately, clearly and concisely.
The concept of measurement:
The linguistic meaning of the measure is an estimate or learn
something by comparing the value of a recognized standard, the thing
may be measured by weight or volume or space or degree or a time ...
Etc.. This means therefore that the measurement process of
comparison between the measured and the thing to be something
between last known value in all places and times and circumstances,
and concentrated mainly on the measurement of the following:
PDF created with pdfFactory Pro trial version www.pdffactory.com
6
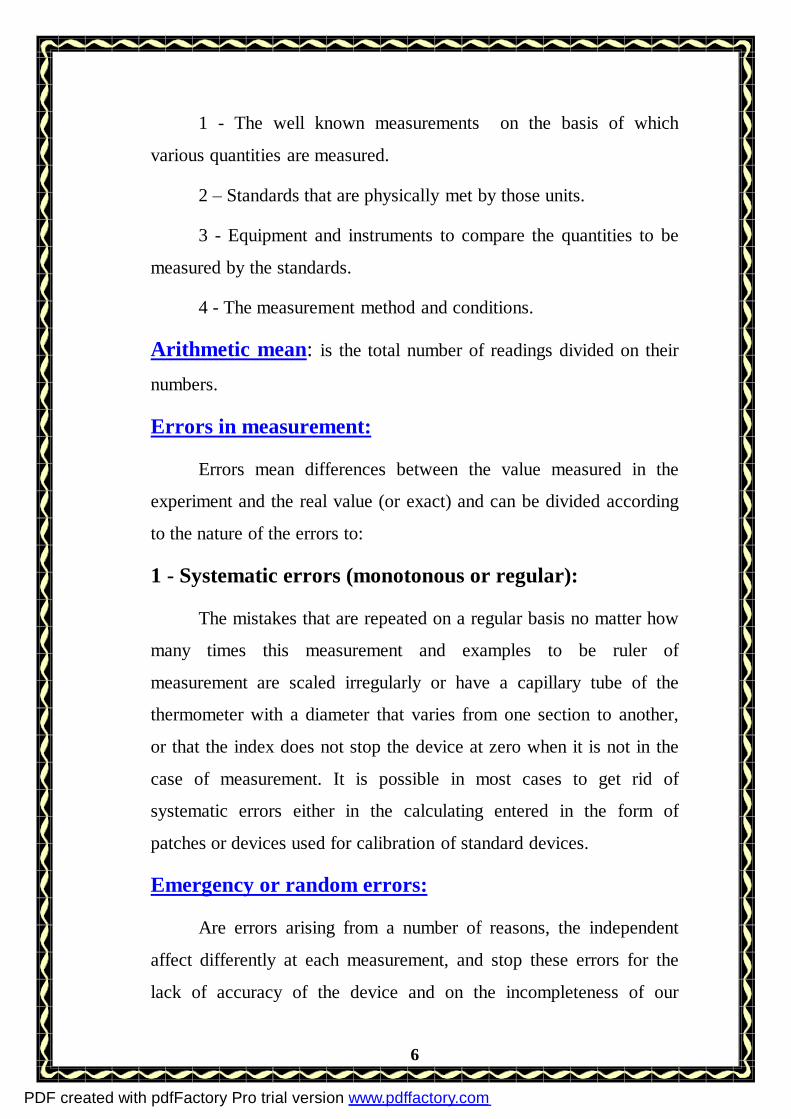
1 - The well known measurements on the basis of which
various quantities are measured.
2 – Standards that are physically met by those units.
3 - Equipment and instruments to compare the quantities to be
measured by the standards.
4 - The measurement method and conditions.
Arithmetic mean: is the total number of readings divided on their
numbers.
Errors in measurement:
Errors mean differences between the value measured in the
experiment and the real value (or exact) and can be divided according
to the nature of the errors to:
1 - Systematic errors (monotonous or regular):
The mistakes that are repeated on a regular basis no matter how
many times this measurement and examples to be ruler of
measurement are scaled irregularly or have a capillary tube of the
thermometer with a diameter that varies from one section to another,
or that the index does not stop the device at zero when it is not in the
case of measurement. It is possible in most cases to get rid of
systematic errors either in the calculating entered in the form of
patches or devices used for calibration of standard devices.
Emergency or random errors:
Are errors arising from a number of reasons, the independent
affect differently at each measurement, and stop these errors for the
lack of accuracy of the device and on the incompleteness of our
PDF created with pdfFactory Pro trial version www.pdffactory.com
7
human senses and on the changing air continued to external
circumstances (such as changing the temperature - pressure - humidity
- etc.).
Errors Calculation:
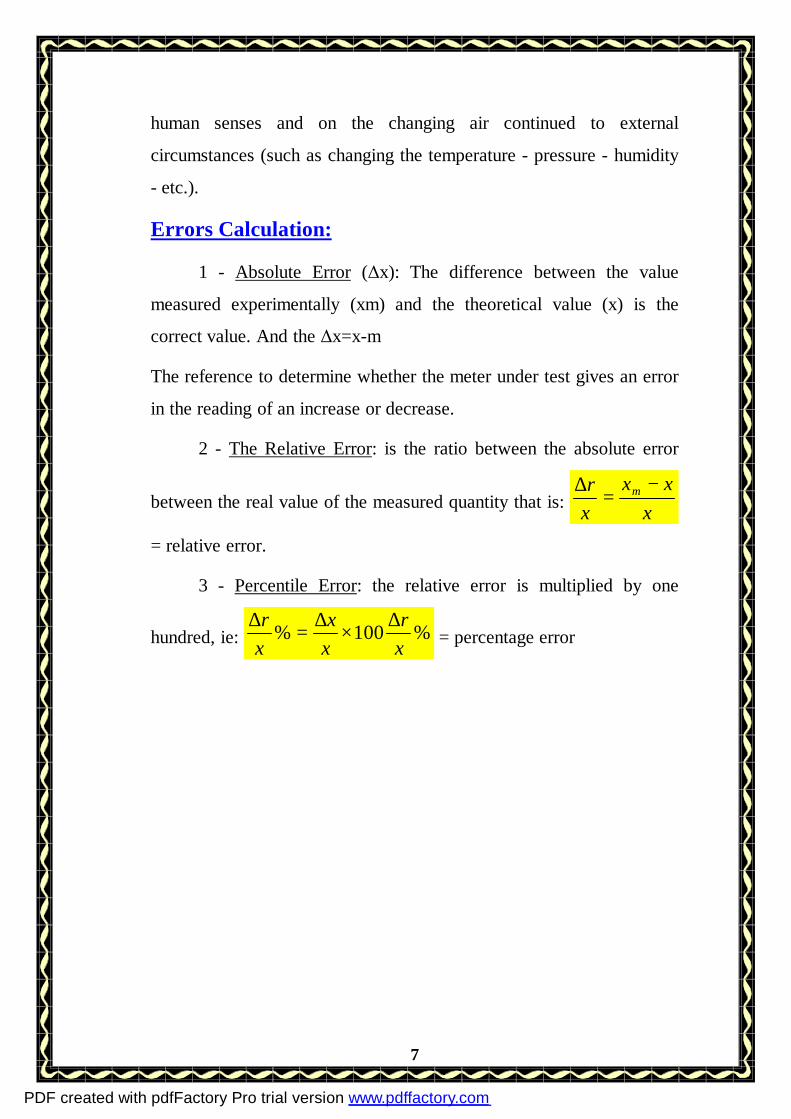
1 - Absolute Error (Δx): The difference between the value
measured experimentally (xm) and the theoretical value (x) is the
correct value. And the Δx=x-m
The reference to determine whether the meter under test gives an error
in the reading of an increase or decrease.
2 - The Relative Error: is the ratio between the absolute error
between the real value of the measured quantity that is: xxx
xr m −
=∆
= relative error.
3 - Percentile Error: the relative error is multiplied by one
hundred, ie: %100%xr
xx
xr ∆
×∆
=∆
= percentage error
PDF created with pdfFactory Pro trial version www.pdffactory.com
8
The first meeting (Lab 1)
Graphs and graph analysis
Training objectives on the charts:
1 - Drawing the given values on the graph paper drawing scale
using the appropriate manner.
2 - Draw non-linear relationship (represented by the curve) and
the possibility of conversion to a linear relationship represented by a
straight line.
3 - Analysis of the results given and find the relationship
between the variables measured, such as the appointment of a mile
straight line or set a particular coup for the curve ... Etc..
Introduction:
The graph is a summary method to represent the experimentally
measured gives a summary of results given a clearer and faster than
the table and is an important means to extract information and to find
the relationship between the physical variables measured. For the graph types of securities depending on the methods or
systems, the division of these papers, depending on the purpose of use,
the student will learn in this session on some of these papers and
metrology systems (Scales) in every type and trains on roads and
drawing upon the common types:
1 - Normal boxes paper: before, and the students used in the
earlier stages of the study, called the division of this type scale linear .
2 - logarithmic Paper: The system of the division in which the
logarithmic scale on the axes horizontal (X) and vertical (y) is called
PDF created with pdfFactory Pro trial version www.pdffactory.com
9
this type of logarithmic - the logarithmic. This type is also different
standards, including a single session or two and write it , there are
papers in three sessions and four, and so on ... Etc..
3 - Semi-logarithmic paper, semi-logarithmic, which was one of the
axes is divided and the division of a linear second axis is divided into
logarithmic.
And limit ourselves in this decision on the use of ordinary paper
squares. The logarithmic paper will learn the student how to use it
later in another decision.
Graphic Analysis of practical results:
Laws, principles, and physical relations can be expressed in several
methods:
A - With the words: As in the case when giving definitions.
B - Mathematical symbols: As in the case when writing equations.
C - Graphic representation: As in the case when using graphics.
Often we find that the three combined methods used to convey
the results of a particular experiment, and in any case, the use of
diagrams is given directly to a quick idea about the relationship
between two quantities under study.
A graph is usually drawn using the values of the independent
variable and the dependent variable experimentally, the independent
variable often means the amount under the control of experimental
researcher, so that it can take a valuable piece of information in
advance. The value of the dependent variable associated with
completely independent variable. We choose certain values of the
PDF created with pdfFactory Pro trial version www.pdffactory.com
10
independent variable and create practical values of the corresponding
dependent variable. Put the values of both variables in the table of a
suitable prelude to represent graphically. The figure is often more
useful than the table because the diagram can be used for:
1 - Getting new values for the independent variable and the
corresponding values of the dependent variable in contrast to the
values obtained experimentally.
2 - Getting rid of some anomalous values, which may be due to
some experimental errors.
3 - To clarify the general trend of the values of the dependent
variable (whether it is progressive, regressive ...) and also to clarify
critical points (variable curve of the ascending to descending .... and
so on)
4 - Getting the values of the variables studied can be accessed
virtually impossible for a lack of equipment and laboratory
capabilities.
General rules of the graphs forms: (important).
First, draw axes and naming to look at the results of the
experiment or information that represent the values of two variables,
the table information was free from negative values we draw the two
axes perpendicular to discuss the point of intersection of the axes in
the bottom left angle of the paper squares, so that most of the space
axes of the page. But, if any, negative values must take this into
calculating and this makes the intersection point of axes relatively far
from both sides of a page, or both, as needed. Such as the independent
variable on the x-axis (horizontal axis) and the dependent variable on
PDF created with pdfFactory Pro trial version www.pdffactory.com
11
the vertical axis (the vertical axis should label each of the axes by
placing the appropriate mark on each axis, the brand include the
changing quantity and unity.
How do you know if the independent or dependant
variable?
It depends on the information required to be represented, the
information was the result of the experiment you have made your own
independent is located under the control of the student and the
dependent variable depends on the value of the independent variable.
For example, in the experiment of spring in the case of
achieving the law Hook variables there are outstanding mass M and
the resulting elongation h we start first identify the cluster and then
assign the amount of elongation resulting from the impact of this mass
be block here is the independent variable and the dependent variable is
the elongation. Sometimes the information given to you reedy but be
accompanied by a mathematical equation, in this case the formula
equation describes the independent variable of the Centre as described
in Example (1) The relationship between M and T illustrated by the
equation M = KT. In this equation M T depends on the independent
variable, M is the dependent variable that can not be know before you
know the value of T.
Second: choosing the appropriate scale:
What is a scale drawing? how to choose a scale drawing?
May be possible to represent the values of one or both variables on the
paper boxes as they are in the table of information if these values are
within the limits of the available space of the drawing page. But
PDF created with pdfFactory Pro trial version www.pdffactory.com
12
sometimes these values are either so large beyond the scope of the
drawing page as if it represented for what they are or may be very
small, takes the output format representation of the values earlier, after
a space in the leaf area and thus difficult to infer from the drawing of
any information on the physical.
In any of the cases highlight the importance of using scale drawing, so
the mean values represent the sum large or small values in a
systematic manner allows the opportunity to exploit most of the space
and paper boxes.
How is the right choice?
Depends on the values given or resulting from experiment and
work as follows:
A - The number of boxes define the axis of the variable and not for
example, 18 squares.
B - Divide the value of the variable declaration on the number of
boxes, so the result is the value represented by one square (or one
centimeter). The result is a value that is appropriate in the sense it is
difficult to determine the partial values (such as half and quarter) and
this may lead to errors in the graph. So what is the solution?
Clear answer to the question the following examples:
(B 1) Suppose that we have the information in the table of
values for the independent variable is limited to between 1.5 × 98 and
to be represented on the horizontal axis.
PDF created with pdfFactory Pro trial version www.pdffactory.com
13
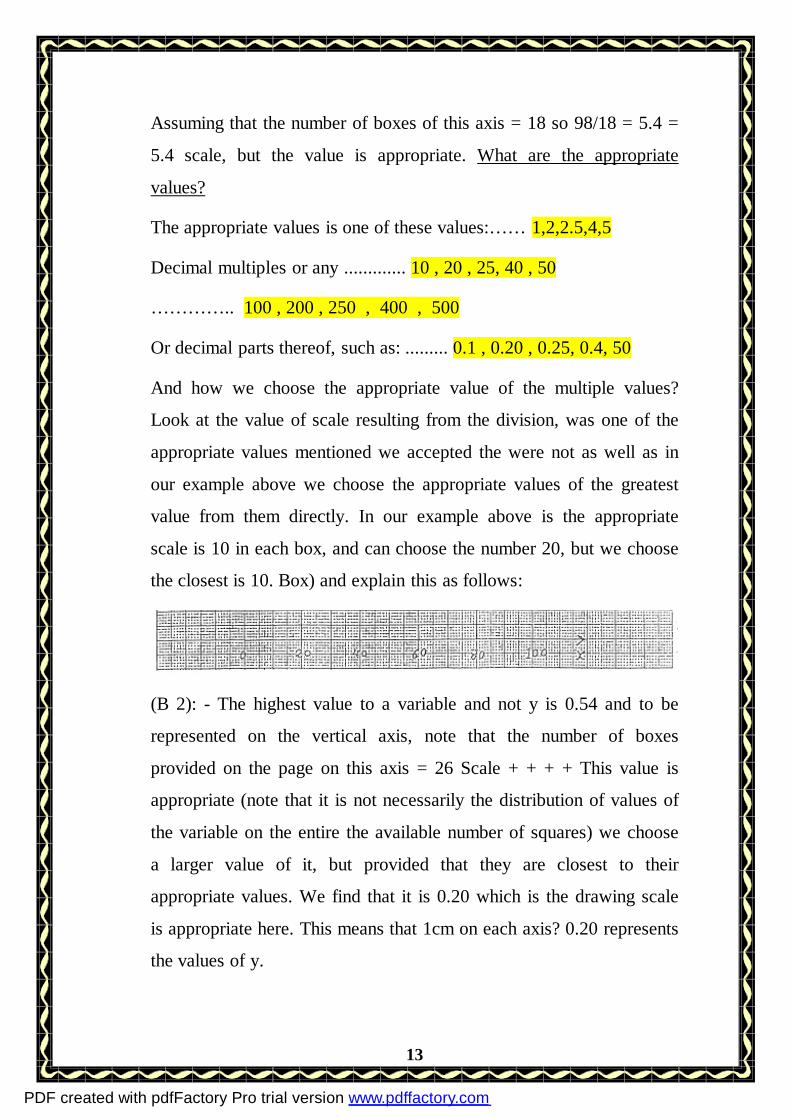
Assuming that the number of boxes of this axis = 18 so 98/18 = 5.4 =
5.4 scale, but the value is appropriate. What are the appropriate
values?
The appropriate values is one of these values:…… 1,2,2.5,4,5
Decimal multiples or any ............. 10 , 20 , 25, 40 , 50
………….. 100 , 200 , 250 , 400 , 500
Or decimal parts thereof, such as: ......... 0.1 , 0.20 , 0.25, 0.4, 50
And how we choose the appropriate value of the multiple values?
Look at the value of scale resulting from the division, was one of the
appropriate values mentioned we accepted the were not as well as in
our example above we choose the appropriate values of the greatest
value from them directly. In our example above is the appropriate
scale is 10 in each box, and can choose the number 20, but we choose
the closest is 10. Box) and explain this as follows:
(B 2): - The highest value to a variable and not y is 0.54 and to be
represented on the vertical axis, note that the number of boxes
provided on the page on this axis = 26 Scale + + + + This value is
appropriate (note that it is not necessarily the distribution of values of
the variable on the entire the available number of squares) we choose
a larger value of it, but provided that they are closest to their
appropriate values. We find that it is 0.20 which is the drawing scale
is appropriate here. This means that 1cm on each axis? 0.20 represents
the values of y.
PDF created with pdfFactory Pro trial version www.pdffactory.com

14
(B 3): - The highest value of a variable is 48000, what is the
appropriate scale if the number of squares is 16.
Scale = 3000 = 48000 / 16 but it is not appropriate. Value we choose
4000 as the closest appropriate value.
Third, putting the points and draw the graph:
Place the experimental points in the correct positions on the
drawing page and draw a small circle around each point (note that the
position of the point is a point of convergence of two values are
represented by the value of the independent variable in the horizontal
direction and the value represented by the variable of in the vertical
direction).
After completion of all points, we draw the best line possible
mediating points since they may not fall all the points on the graph, it
shows deviations simple to some of the points as a result of errors, a
pilot or the failure of a simple device the points that seem clearly
abnormal significantly from the total the other points can be neglected
.
Graph output can be either a curve or a straight line and each
physical significance. Curve has different forms and each form can be
described by a mathematical equation of its own.
The straight line can be described by the general equation: y = mx = c
Where m is a fixed amount of miles this line, c is the length of
the axis of the lump y (axis of antibiotics), and if the straight line
PDF created with pdfFactory Pro trial version www.pdffactory.com

15
going through the original point (0.0), the c = 0 becomes the equation
of the rectum is: y = mx
Fourth, addressing the drawing:
Should be a clear address for drawing shows what the graphic
(such as the relationship between such and such) and is usually placed
under or above the drawing in the middle of the page, and can also
develop any further explanation helps to understand the meaning of
the graph.
PDF created with pdfFactory Pro trial version www.pdffactory.com
16
Detailed illustrations on the chart.
Part (1):
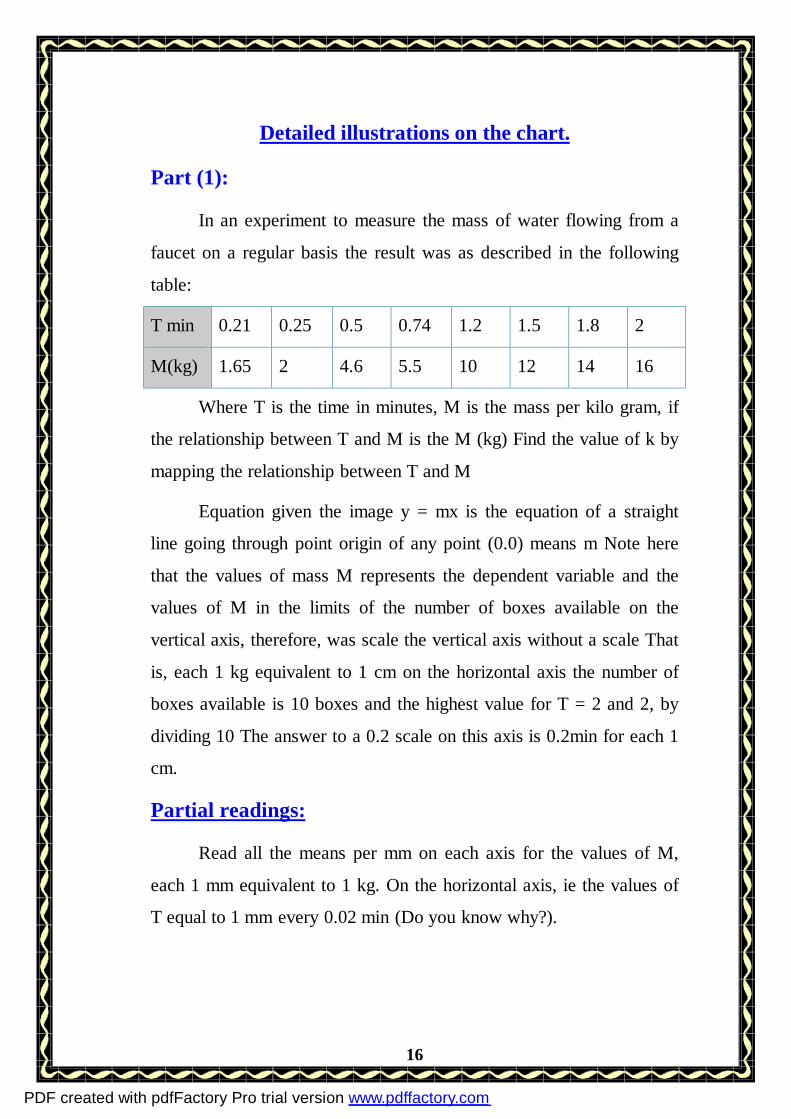
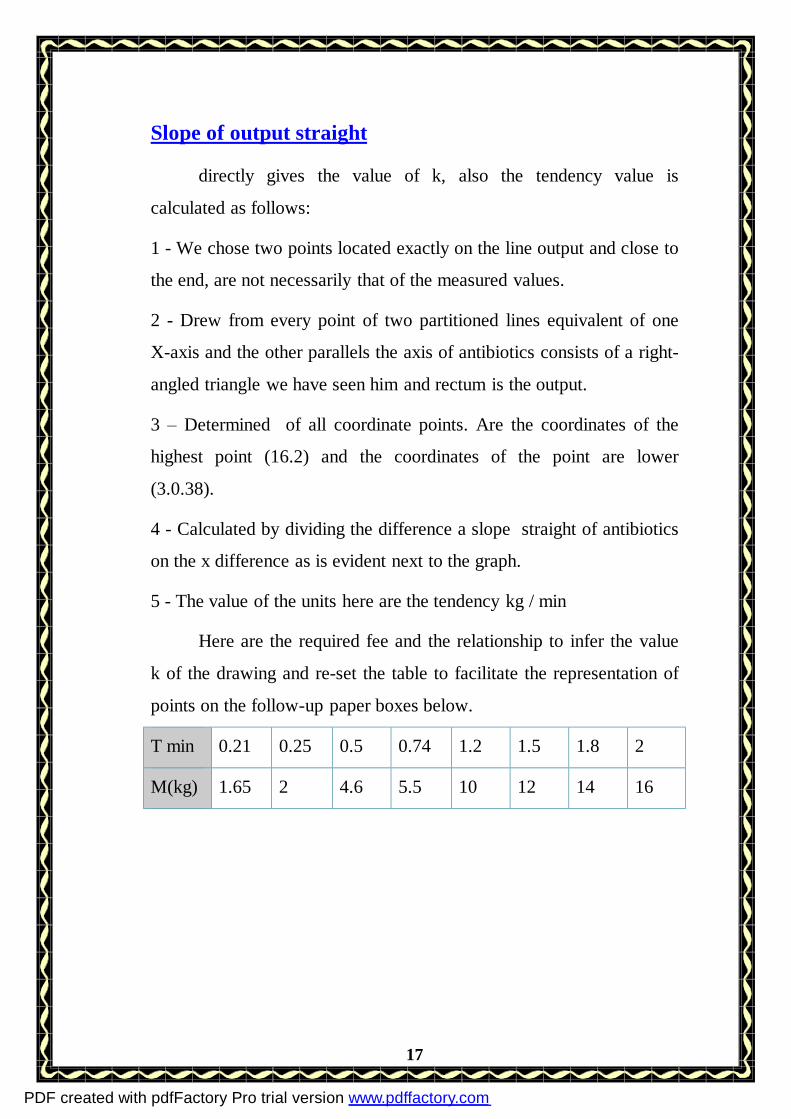
In an experiment to measure the mass of water flowing from a
faucet on a regular basis the result was as described in the following
table:
T min 0.21 0.25 0.5 0.74 1.2 1.5 1.8 2
M(kg) 1.65 2 4.6 5.5 10 12 14 16
Where T is the time in minutes, M is the mass per kilo gram, if
the relationship between T and M is the M (kg) Find the value of k by
mapping the relationship between T and M
Equation given the image y = mx is the equation of a straight
line going through point origin of any point (0.0) means m Note here
that the values of mass M represents the dependent variable and the
values of M in the limits of the number of boxes available on the
vertical axis, therefore, was scale the vertical axis without a scale That
is, each 1 kg equivalent to 1 cm on the horizontal axis the number of
boxes available is 10 boxes and the highest value for T = 2 and 2, by
dividing 10 The answer to a 0.2 scale on this axis is 0.2min for each 1
cm.
Partial readings:
Read all the means per mm on each axis for the values of M,
each 1 mm equivalent to 1 kg. On the horizontal axis, ie the values of
T equal to 1 mm every 0.02 min (Do you know why?).
PDF created with pdfFactory Pro trial version www.pdffactory.com
17
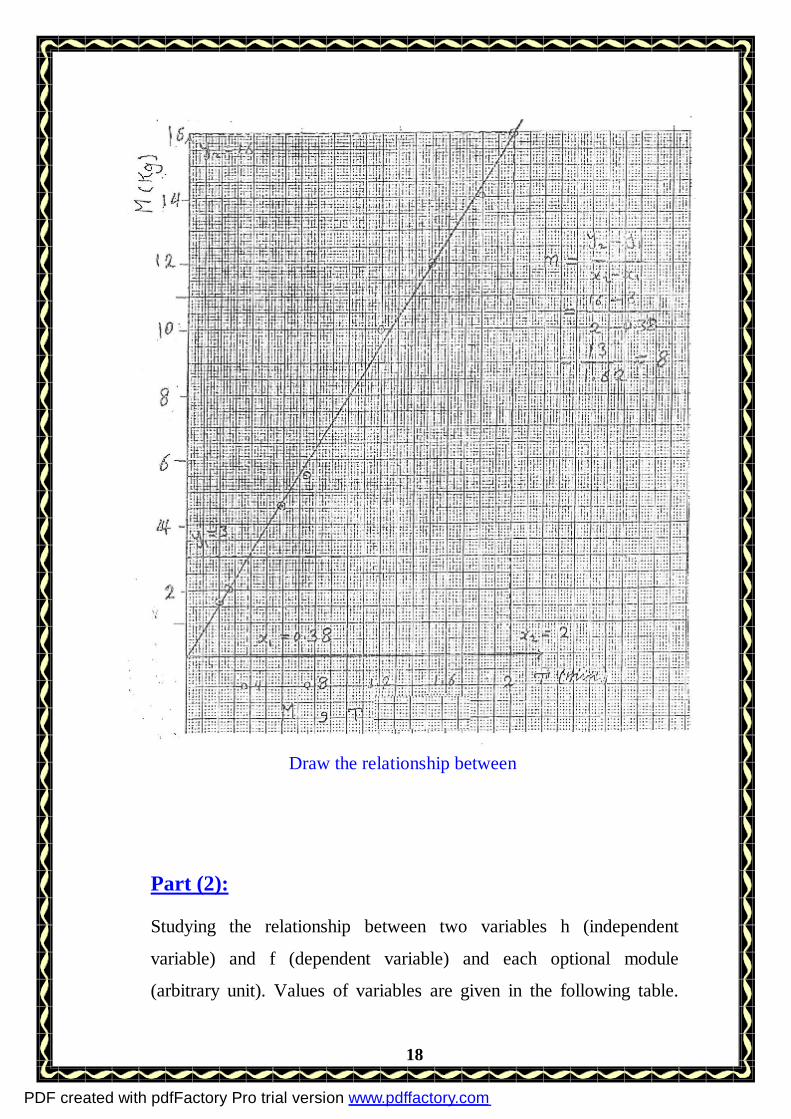
Slope of output straight
directly gives the value of k, also the tendency value is
calculated as follows:
1 - We chose two points located exactly on the line output and close to
the end, are not necessarily that of the measured values.
2 - Drew from every point of two partitioned lines equivalent of one
X-axis and the other parallels the axis of antibiotics consists of a right-
angled triangle we have seen him and rectum is the output.
3 – Determined of all coordinate points. Are the coordinates of the
highest point (16.2) and the coordinates of the point are lower
(3.0.38).
4 - Calculated by dividing the difference a slope straight of antibiotics
on the x difference as is evident next to the graph.
5 - The value of the units here are the tendency kg / min
Here are the required fee and the relationship to infer the value
k of the drawing and re-set the table to facilitate the representation of
points on the follow-up paper boxes below.
T min 0.21 0.25 0.5 0.74 1.2 1.5 1.8 2
M(kg) 1.65 2 4.6 5.5 10 12 14 16
PDF created with pdfFactory Pro trial version www.pdffactory.com
18
Draw the relationship between
Part (2):
Studying the relationship between two variables h (independent
variable) and f (dependent variable) and each optional module
(arbitrary unit). Values of variables are given in the following table.
PDF created with pdfFactory Pro trial version www.pdffactory.com
19
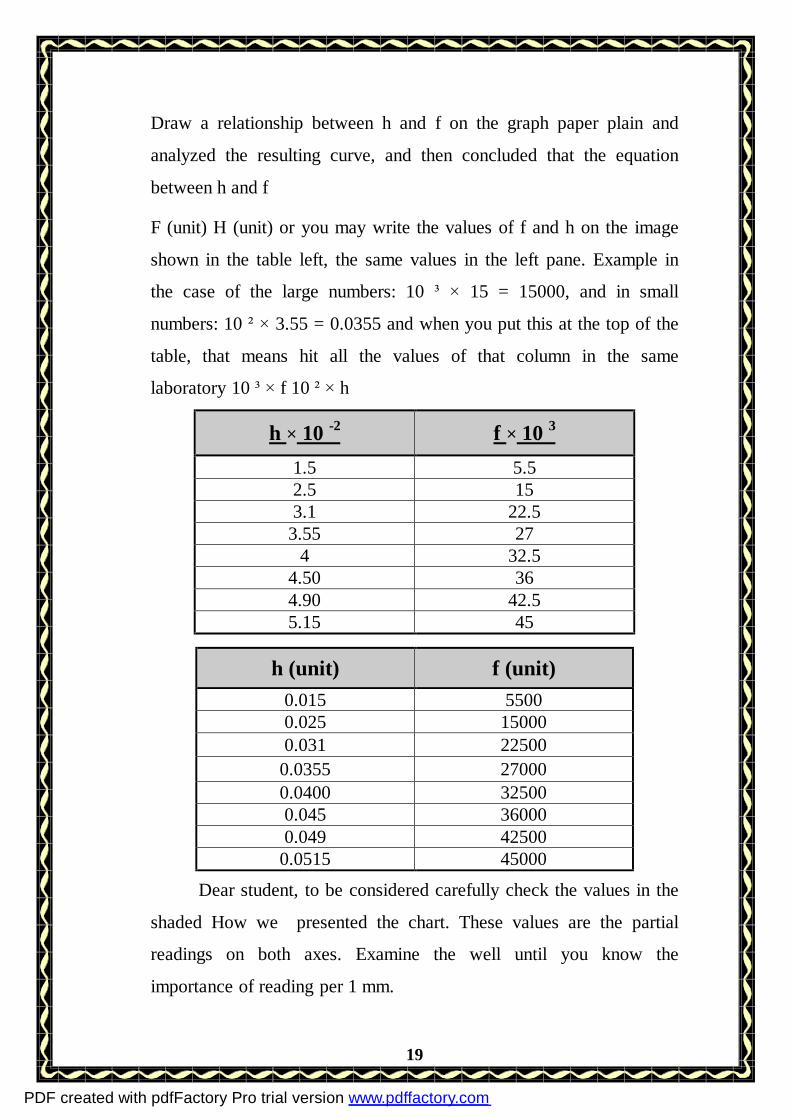
Draw a relationship between h and f on the graph paper plain and
analyzed the resulting curve, and then concluded that the equation
between h and f
F (unit) H (unit) or you may write the values of f and h on the image
shown in the table left, the same values in the left pane. Example in
the case of the large numbers: 10 ³ × 15 = 15000, and in small
numbers: 10 ² × 3.55 = 0.0355 and when you put this at the top of the
table, that means hit all the values of that column in the same
laboratory 10 ³ × f 10 ² × h
h × 10 -2 f × 10 3
1.5 5.5 2.5 15 3.1 22.5
3.55 27 4 32.5
4.50 36 4.90 42.5 5.15 45
h (unit) f (unit) 0.015 5500 0.025 15000 0.031 22500
0.0355 27000 0.0400 32500 0.045 36000 0.049 42500
0.0515 45000
Dear student, to be considered carefully check the values in the
shaded How we presented the chart. These values are the partial
readings on both axes. Examine the well until you know the
importance of reading per 1 mm.
PDF created with pdfFactory Pro trial version www.pdffactory.com
20
How do we set the drawing scale:
The number of squares in the length of the page chart is 26 and
we want to take the square of which 18 only to scale the vertical axis
(the values of f). In this case we divide the highest value for f of 18 so
drawing scale on the vertical axis is the equivalent of 1cm every 250
of the values of f. (This means that any part of the f values of less than
250 can be neglected for a youngster).
On the horizontal axis of the display page is 10 squares and
declaration of the value of h is 0.049 divided to 10 if the answer is
0.0049 per 1 cm, a value that is appropriate, and the appropriate value
is 0.005 for each 1 cm and this is what we have done. Try to learn how
to read a partial equivalent of 1mm in this case?
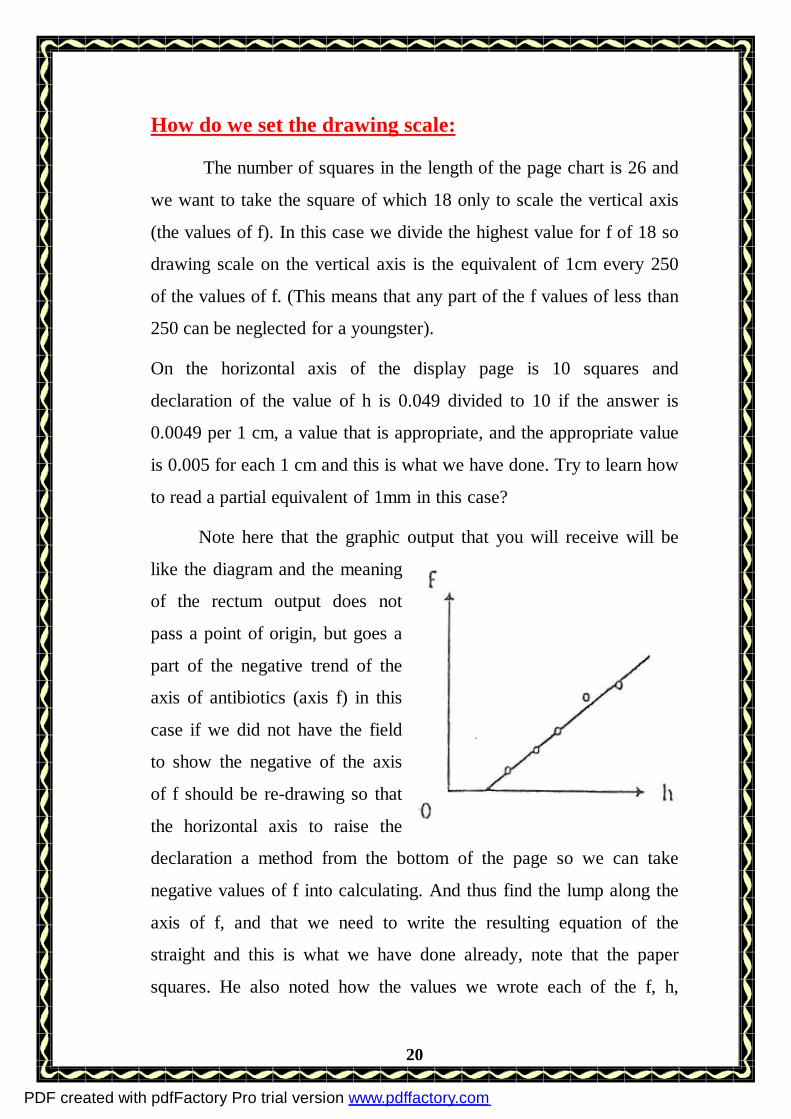
Note here that the graphic output that you will receive will be
like the diagram and the meaning
of the rectum output does not
pass a point of origin, but goes a
part of the negative trend of the
axis of antibiotics (axis f) in this
case if we did not have the field
to show the negative of the axis
of f should be re-drawing so that
the horizontal axis to raise the
declaration a method from the bottom of the page so we can take
negative values of f into calculating. And thus find the lump along the
axis of f, and that we need to write the resulting equation of the
straight and this is what we have done already, note that the paper
squares. He also noted how the values we wrote each of the f, h,
PDF created with pdfFactory Pro trial version www.pdffactory.com
21
where we hit the axis in all plants and one such is the case in the table
left and so avoid writing multiple fields in large numbers or very small
on the axis of the large values (zeros).
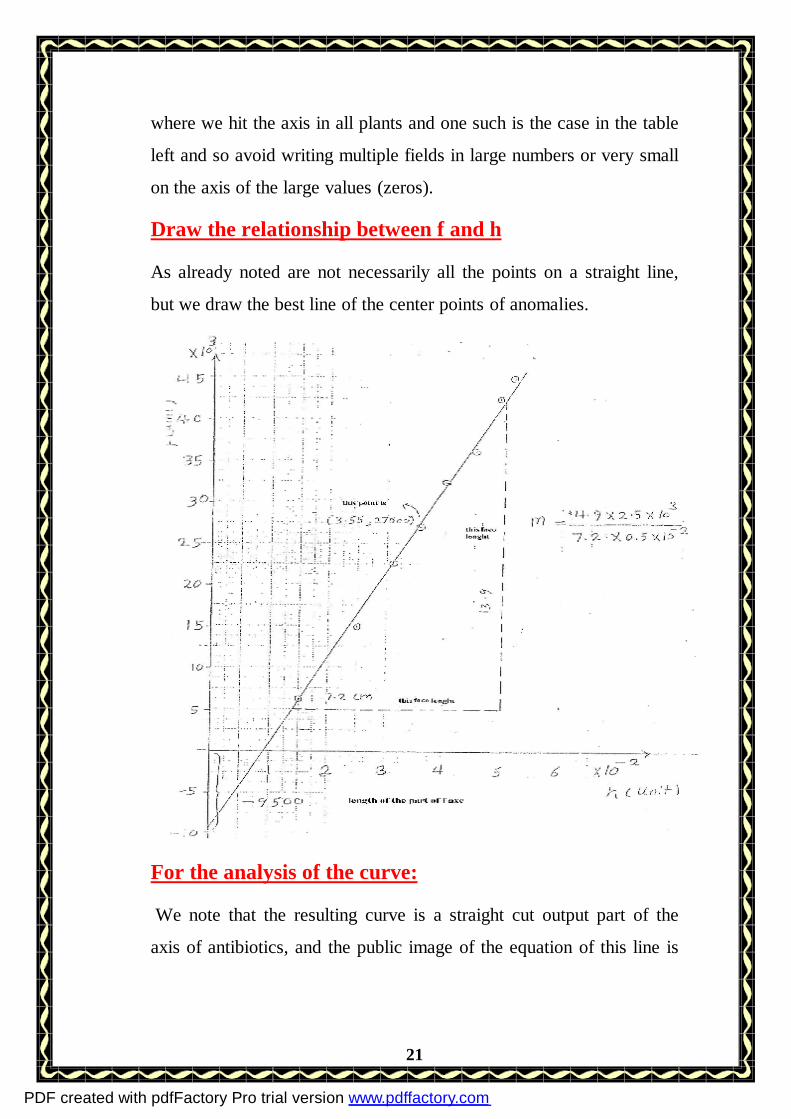
Draw the relationship between f and h
As already noted are not necessarily all the points on a straight line,
but we draw the best line of the center points of anomalies.
For the analysis of the curve:
We note that the resulting curve is a straight cut output part of the
axis of antibiotics, and the public image of the equation of this line is
PDF created with pdfFactory Pro trial version www.pdffactory.com
22
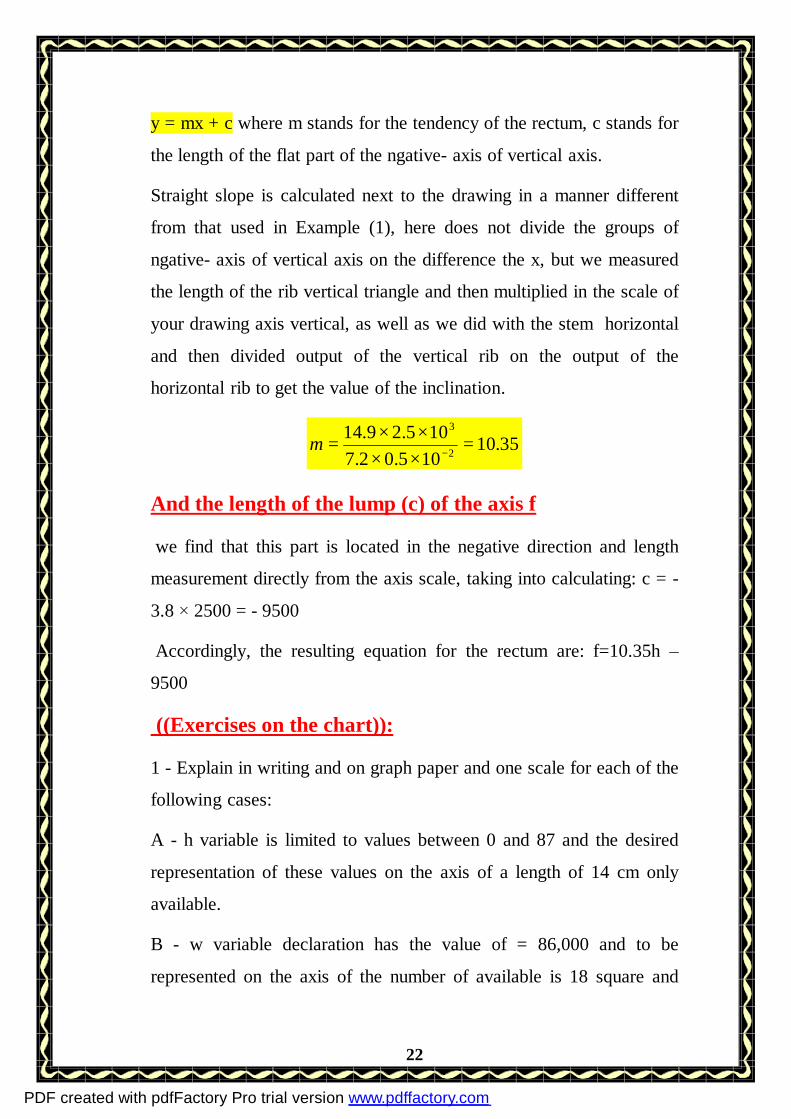
y = mx + c where m stands for the tendency of the rectum, c stands for
the length of the flat part of the ngative- axis of vertical axis.
Straight slope is calculated next to the drawing in a manner different
from that used in Example (1), here does not divide the groups of
ngative- axis of vertical axis on the difference the x, but we measured
the length of the rib vertical triangle and then multiplied in the scale of
your drawing axis vertical, as well as we did with the stem horizontal
and then divided output of the vertical rib on the output of the
horizontal rib to get the value of the inclination.
35.10105.02.7105.29.14
2
3
=××××
=−
m
And the length of the lump (c) of the axis f
we find that this part is located in the negative direction and length
measurement directly from the axis scale, taking into calculating: c = -
3.8 × 2500 = - 9500
Accordingly, the resulting equation for the rectum are: f=10.35h –
9500
((Exercises on the chart)):
1 - Explain in writing and on graph paper and one scale for each of the
following cases:
A - h variable is limited to values between 0 and 87 and the desired
representation of these values on the axis of a length of 14 cm only
available.
B - w variable declaration has the value of = 86,000 and to be
represented on the axis of the number of available is 18 square and
PDF created with pdfFactory Pro trial version www.pdffactory.com

23
then also explained how to write variable values on the axis to avoid
writing multiple fields.
C - The variable is limited to a value of 0.008, such as the axis length
of 12cm on a paper chart.
2 - Draw on graph paper the relationship between the two variables s
(independent variable), p (dependent variable), their values shown in
the following table, provided that represent the values of p on the axis
of a length of 12cm, the values of s on the axis of a length of 16cm.
Explain the appropriate scale for each axis, and the reading is partial
on each axis? I think the output straight slope, then write the equation
of this line.
S (unit) 26 40 60 80 130 150 188
P(unit) 800 1200 1600 2800 3600 4280 5200
3 - Study the relationship between the speed of an object (dependent
variable) v, and time t independent variable. The values of variables
shown in the table below. Draw a relationship between v, t on the
graph paper plain, and analyzed the resulting curve, and then conclude
that the equation between v and t.
V(m/s) 0.6 0.7 0.82 0.96 1.08 1.16 1.26 1.34 1.5
T(sec) 1 2 3 4 5 6 7 8 9
PDF created with pdfFactory Pro trial version www.pdffactory.com
24
Experiment number (2):
The use of accurate measurements
Objective of the experiment:
the identification of some precise measurements and devices used in
practice.
First: {kaddma of measurement with Vernier}
Consists of the following parts:
1 - The original measure included a measure of static. Be read as the
ruler and less read it is 1 mm.
2 - a vernier scale and a secondary movable jaw connects to a mobile.
3 - Jaw is fixed in the beginning of the grading scale hard disk.
Secondary standard is scale so increases the number of sections scale
one section for the number of divisions along the scale of what has the
original scale and this means that the length of the section of the
vernier at least along the section of the measure of distance equal to
the original shape = 1/n. of varnia sections (1) shows a picture of his
and their parts.
Kaddma is divided into three sections:
Category (a): vernier scale is divided in this type section to 50 and it is
less a reading of his is 0.02 mm.
Category (b) is divided Vernier scale for this type section to 20 and it
is less a reading of this type is 0.05 mm.
Category (c): here vernier scale is divided into 10 sections and be read
is less than 0.1 mm
PDF created with pdfFactory Pro trial version www.pdffactory.com
25
And determined the accuracy of measurements or the degree of the
scale less reading, less the length can be measured.
In type (b) available in the lab to find that the vernier is divided to 20
sections when the vernier error-free zero find that when the
applicability of the jaws (vernier )kaddma completely on each other,
the line scale zero Vernier be applicable on the line scale zero measure
of the original line of Staging be a logic on-line No. 39 on the original
scale. And when you move the line of zero staging of distance of 1
mm find that line of Staging Twentieth Vernier fully applies to the
line No. 40 on the scale the original, if the distance of each section of
the scale the original is 1 mm, each section of the vernier at least a
distance of 0.05 mm for each section of the original scale.
The type (c), the vernier which is divided into ten sections and if
kaddma error-free when it is zero-zero staging the applicability of the
jaws has a zero ranking scale of the original and true line of the tenth
staging it on the line ninth of the original scale. For this, every section
of the vernier distance of less than 0.1 mm for each section of the
original scale.
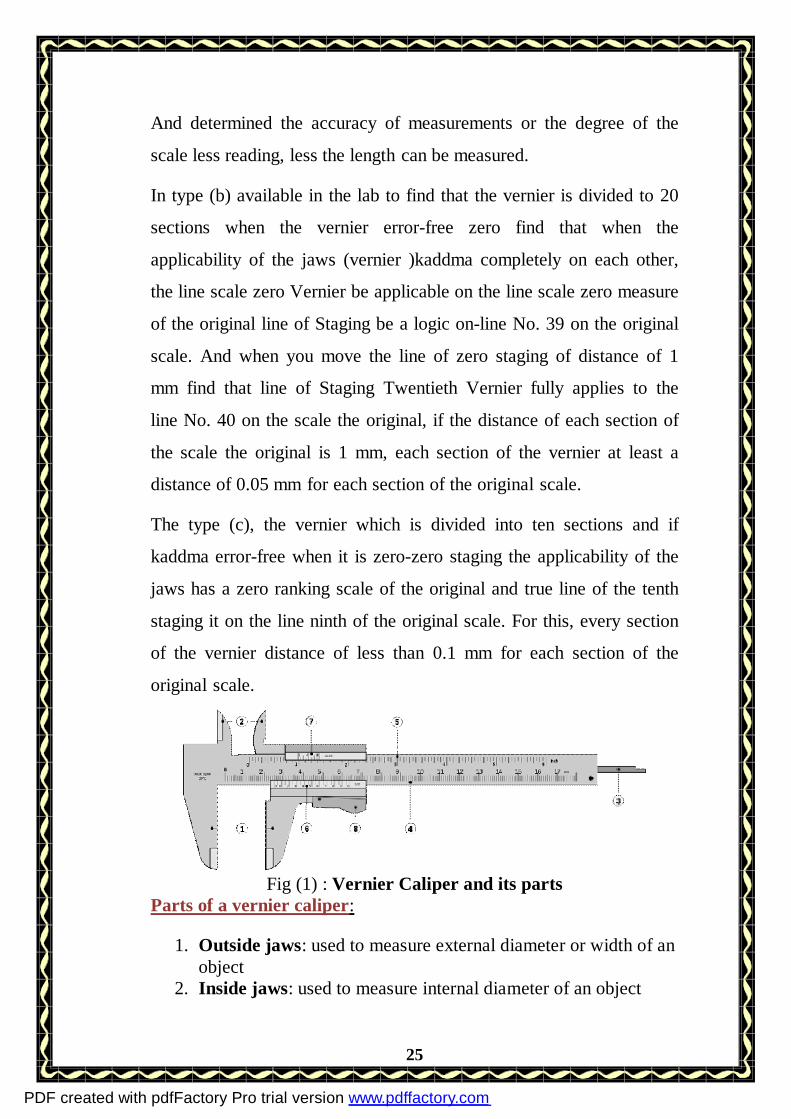
Fig (1) : Vernier Caliper and its parts
Parts of a vernier caliper:
1. Outside jaws: used to measure external diameter or width of an object
2. Inside jaws: used to measure internal diameter of an object
PDF created with pdfFactory Pro trial version www.pdffactory.com
26
3. Depth probe: used to measure depths of an object or a hole 4. Main scale: scale marked every mm 5. Main scale: scale marked in inches and fractions 6. Vernier scale gives interpolated measurements to 0.1 mm or
better 7. Vernier scale gives interpolated measurements in fractions of
an inch 8. Retainer: used to block movable part to allow the easy
transferring of a measurement
How to take reading:
A- Determine the error of zero, if any: Before making any
measurements necessary to know the free kaddma of any error of zero
has been made clear previously in the case of an error of zero in this
case does not apply to a written zero in the scales the original and
secondary on each other when the applicability of the jaws on each
other and then must determine the value of zero error and determine
its direction so that added to or subtracted from any reading of the
measurements were taken if the zero vernier scale to the right of zero,
the value of the original error and put a zero if the zero to the left of
the original measure, they added.
B - Examples of kaddma taking readings of the category (b):
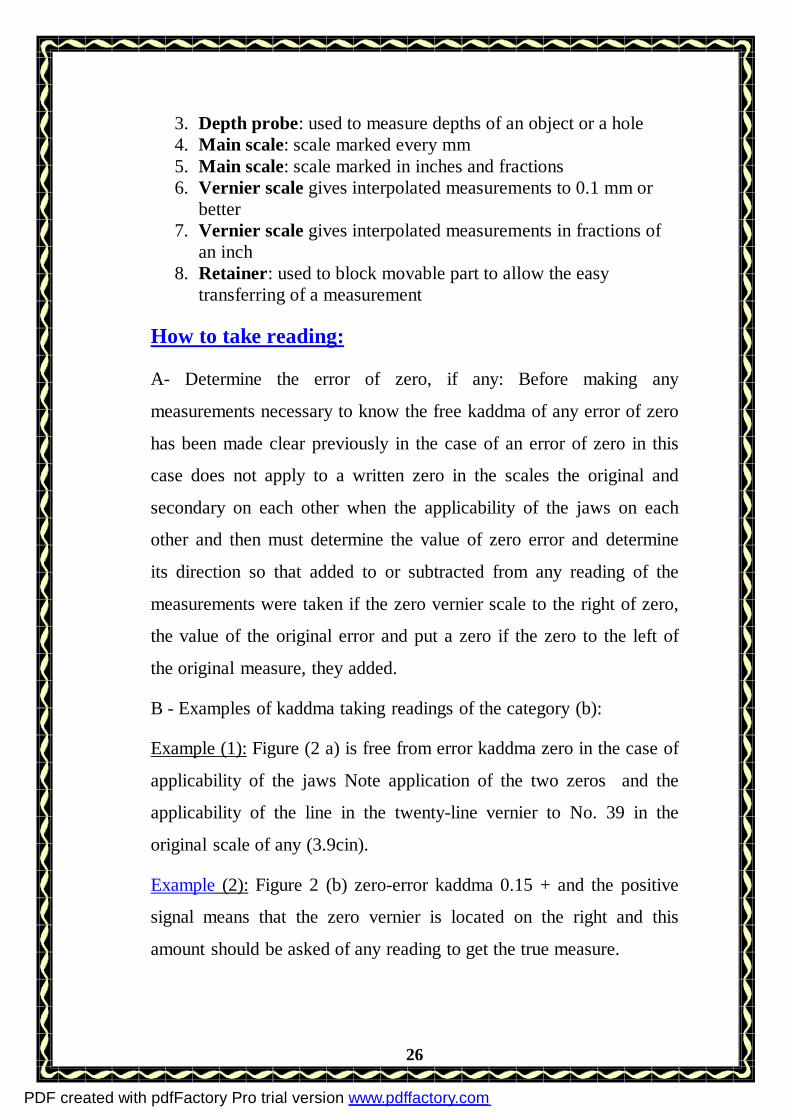
Example (1): Figure (2 a) is free from error kaddma zero in the case of
applicability of the jaws Note application of the two zeros and the
applicability of the line in the twenty-line vernier to No. 39 in the
original scale of any (3.9cin).
Example (2): Figure 2 (b) zero-error kaddma 0.15 + and the positive
signal means that the zero vernier is located on the right and this
amount should be asked of any reading to get the true measure.
PDF created with pdfFactory Pro trial version www.pdffactory.com
27
Example (3): Figure 2 (c) error in the zero kaddma 0.15 - and the
negative sign means that the zero vernier is located on the left and you
must add this amount to any reading to get the true measure.
Fig ( 2A) fig ( 2B) fig (3C)
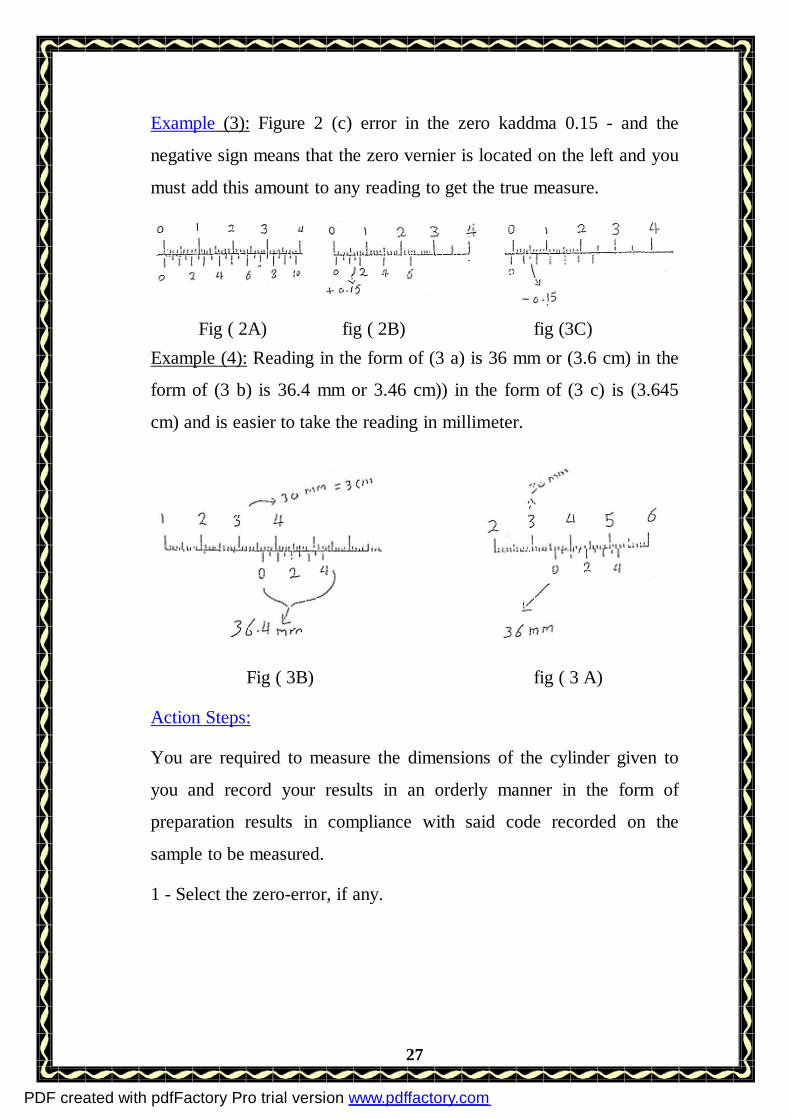
Example (4): Reading in the form of (3 a) is 36 mm or (3.6 cm) in the
form of (3 b) is 36.4 mm or 3.46 cm)) in the form of (3 c) is (3.645
cm) and is easier to take the reading in millimeter.
Fig ( 3B) fig ( 3 A)
Action Steps:
You are required to measure the dimensions of the cylinder given to
you and record your results in an orderly manner in the form of
preparation results in compliance with said code recorded on the
sample to be measured.
1 - Select the zero-error, if any.
PDF created with pdfFactory Pro trial version www.pdffactory.com
28
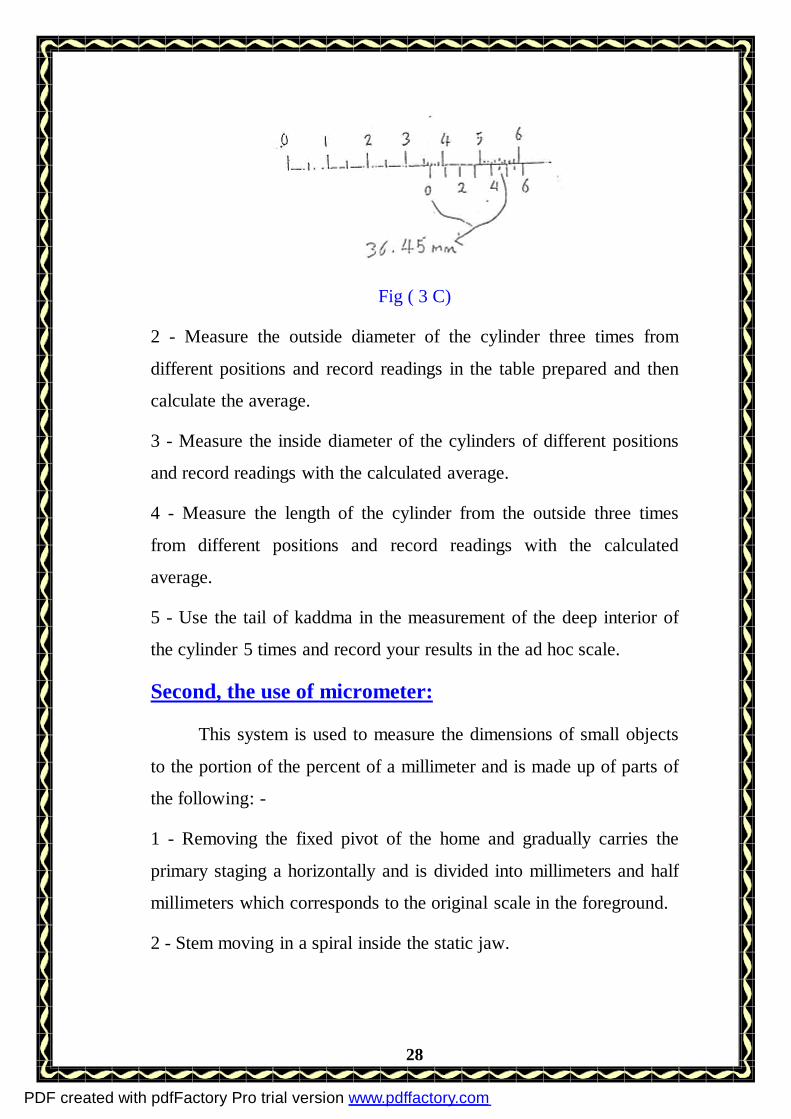
Fig ( 3 C)
2 - Measure the outside diameter of the cylinder three times from
different positions and record readings in the table prepared and then
calculate the average.
3 - Measure the inside diameter of the cylinders of different positions
and record readings with the calculated average.
4 - Measure the length of the cylinder from the outside three times
from different positions and record readings with the calculated
average.
5 - Use the tail of kaddma in the measurement of the deep interior of
the cylinder 5 times and record your results in the ad hoc scale.
Second, the use of micrometer:
This system is used to measure the dimensions of small objects
to the portion of the percent of a millimeter and is made up of parts of
the following: -
1 - Removing the fixed pivot of the home and gradually carries the
primary staging a horizontally and is divided into millimeters and half
millimeters which corresponds to the original scale in the foreground.
2 - Stem moving in a spiral inside the static jaw.
PDF created with pdfFactory Pro trial version www.pdffactory.com
29
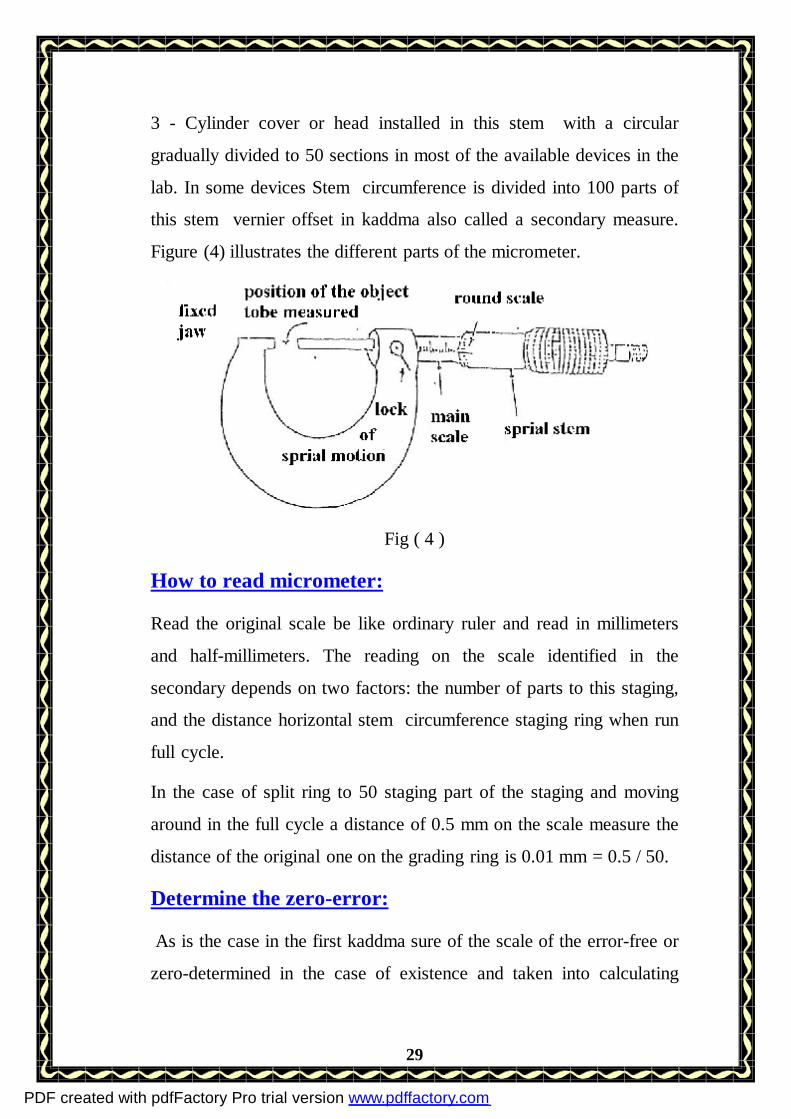
3 - Cylinder cover or head installed in this stem with a circular
gradually divided to 50 sections in most of the available devices in the
lab. In some devices Stem circumference is divided into 100 parts of
this stem vernier offset in kaddma also called a secondary measure.
Figure (4) illustrates the different parts of the micrometer.
Fig ( 4 )
How to read micrometer:
Read the original scale be like ordinary ruler and read in millimeters
and half-millimeters. The reading on the scale identified in the
secondary depends on two factors: the number of parts to this staging,
and the distance horizontal stem circumference staging ring when run
full cycle.
In the case of split ring to 50 staging part of the staging and moving
around in the full cycle a distance of 0.5 mm on the scale measure the
distance of the original one on the grading ring is 0.01 mm = 0.5 / 50.
Determine the zero-error:
As is the case in the first kaddma sure of the scale of the error-free or
zero-determined in the case of existence and taken into calculating
PDF created with pdfFactory Pro trial version www.pdffactory.com
30
when taking measurements. The scale of the error-free zero-
knowledge when you can touch the stem with a prominent part alone
installer with the progressive application of a zero longitudinal and
circular. In the event that their application is said that there is zero
error is determined by the number of parts (lines) on the scale ring
confined between zero grading scale longitudinal line. Combines zero
error if the zero ring staging goes to zero for the linear scale (ie,
located to the left of zero longitudinal staging) and ask if the reverse
occurs. Traditionally, determining the direction of development of
zero-error signal is positive or negative as shown below:
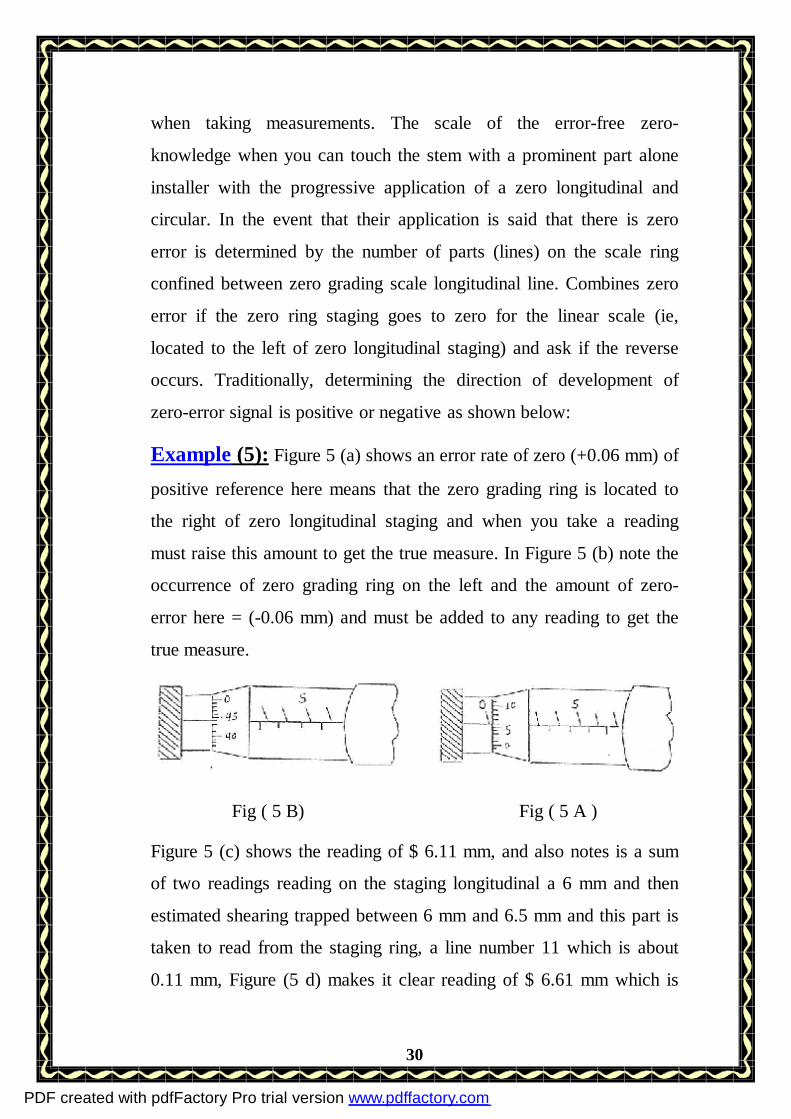
Example (5): Figure 5 (a) shows an error rate of zero (+0.06 mm) of
positive reference here means that the zero grading ring is located to
the right of zero longitudinal staging and when you take a reading
must raise this amount to get the true measure. In Figure 5 (b) note the
occurrence of zero grading ring on the left and the amount of zero-
error here = (-0.06 mm) and must be added to any reading to get the
true measure.
Fig ( 5 B) Fig ( 5 A )
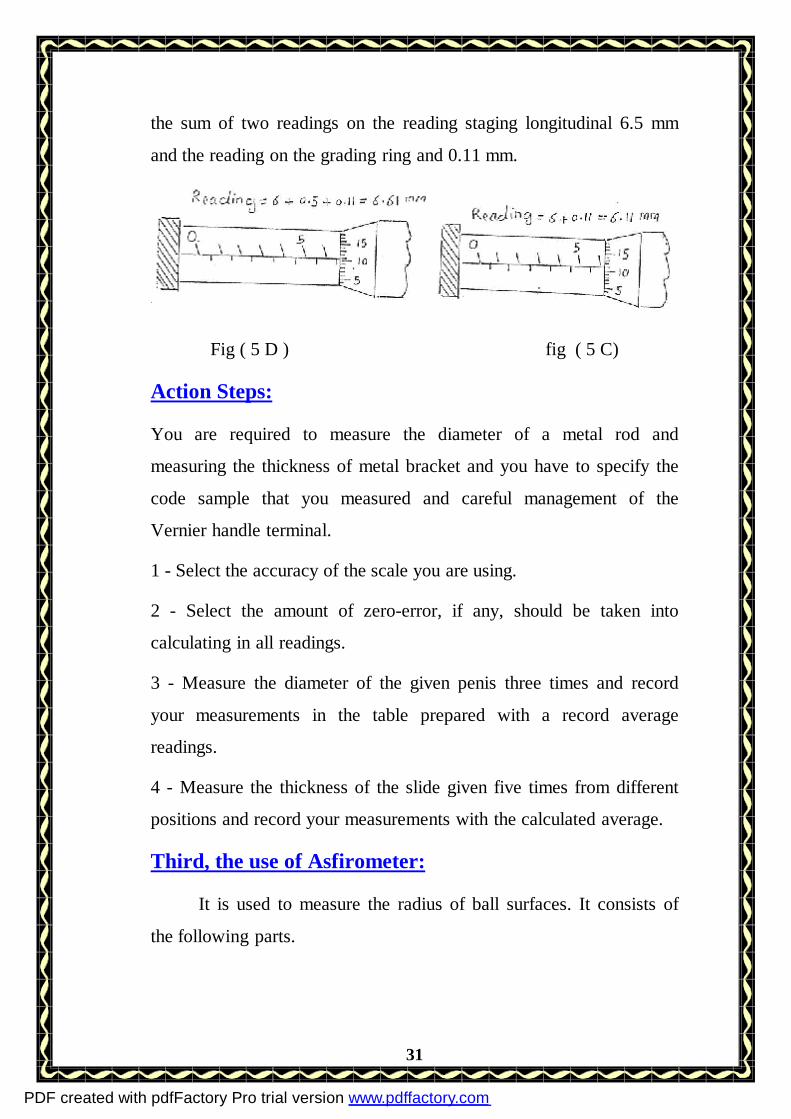
Figure 5 (c) shows the reading of $ 6.11 mm, and also notes is a sum
of two readings reading on the staging longitudinal a 6 mm and then
estimated shearing trapped between 6 mm and 6.5 mm and this part is
taken to read from the staging ring, a line number 11 which is about
0.11 mm, Figure (5 d) makes it clear reading of $ 6.61 mm which is
PDF created with pdfFactory Pro trial version www.pdffactory.com
31
the sum of two readings on the reading staging longitudinal 6.5 mm
and the reading on the grading ring and 0.11 mm.
Fig ( 5 D ) fig ( 5 C)
Action Steps:
You are required to measure the diameter of a metal rod and
measuring the thickness of metal bracket and you have to specify the
code sample that you measured and careful management of the
Vernier handle terminal.
1 - Select the accuracy of the scale you are using.
2 - Select the amount of zero-error, if any, should be taken into
calculating in all readings.
3 - Measure the diameter of the given penis three times and record
your measurements in the table prepared with a record average
readings.
4 - Measure the thickness of the slide given five times from different
positions and record your measurements with the calculated average.
Third, the use of Asfirometer:
It is used to measure the radius of ball surfaces. It consists of
the following parts.
PDF created with pdfFactory Pro trial version www.pdffactory.com
32
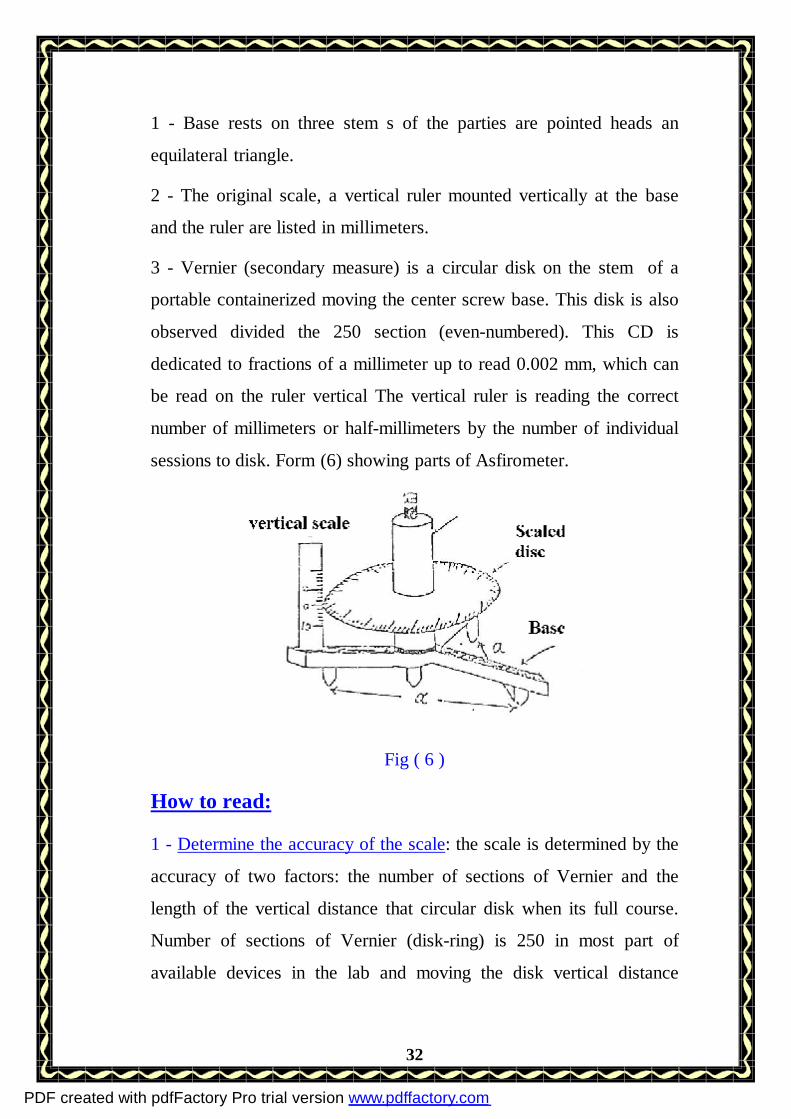
1 - Base rests on three stem s of the parties are pointed heads an
equilateral triangle.
2 - The original scale, a vertical ruler mounted vertically at the base
and the ruler are listed in millimeters.
3 - Vernier (secondary measure) is a circular disk on the stem of a
portable containerized moving the center screw base. This disk is also
observed divided the 250 section (even-numbered). This CD is
dedicated to fractions of a millimeter up to read 0.002 mm, which can
be read on the ruler vertical The vertical ruler is reading the correct
number of millimeters or half-millimeters by the number of individual
sessions to disk. Form (6) showing parts of Asfirometer.
Fig ( 6 )
How to read:
1 - Determine the accuracy of the scale: the scale is determined by the
accuracy of two factors: the number of sections of Vernier and the
length of the vertical distance that circular disk when its full course.
Number of sections of Vernier (disk-ring) is 250 in most part of
available devices in the lab and moving the disk vertical distance
PDF created with pdfFactory Pro trial version www.pdffactory.com
33
figures were half millimeter when departments complete cycle and
this means that the length of the one on the CD ring is 0.002 mm and
the minimum distance measured by Asfirometer.
2 - Determining the zero error: You can know by putting the meter on a flat surface (plate glass) and we stem contained even apply to the four heads pointed exactly on the surface of the glass and can be confirmed by passing a small paper transparent among all age tapered surface of the glass If you do not pass that was evidence the applicability of the four capital well on the surface of the mirror plane then look to the scales circular and vertical if applicable zero staging ring zero staging vertical free from error of zero, but if you do not apply when the applicability of four heads on the surface of the mirror there is an error of zero needs to be established before to take measurements.
when taking any reading courses, it is prefered to calculate the number of the circular disk (instead of reading the vertical scale) of each session a half millimeter scale on the vertical and two sessions of two completely one millimeter. This is safer to avoid being blurred to the eye that makes it difficult for some to position the edge of the disk it is above or below the half-mm when relying on only the vertical scale reading.
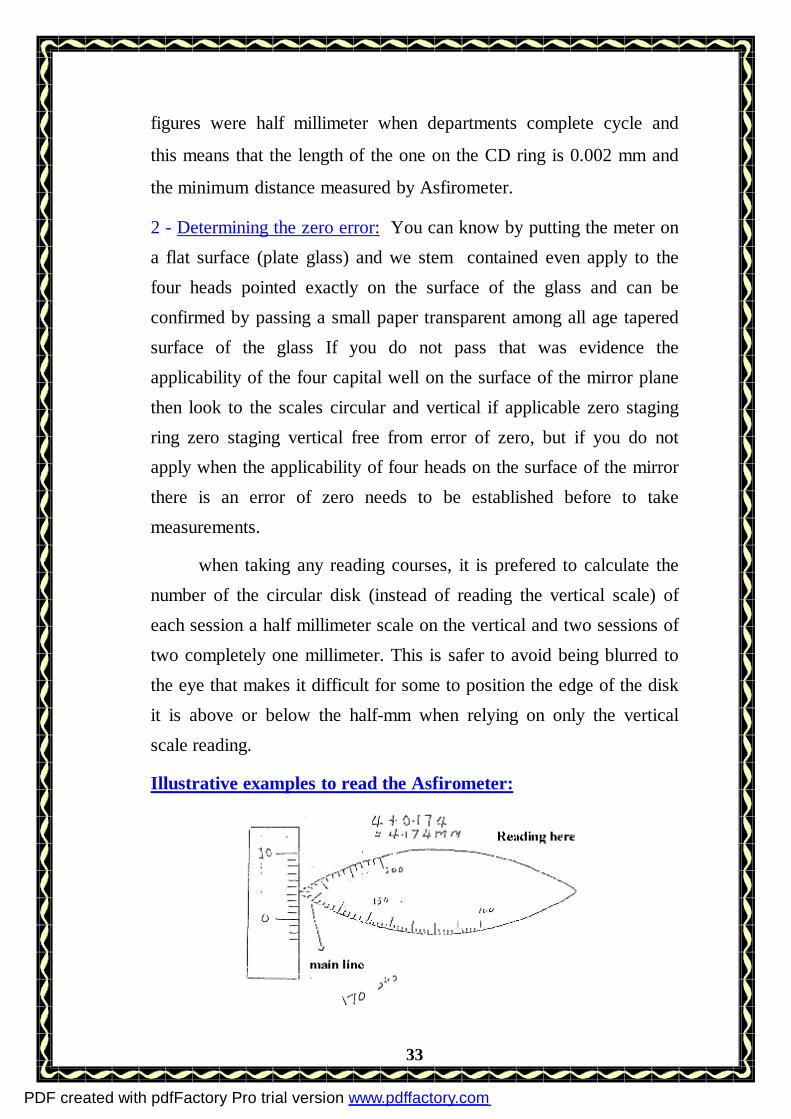
Illustrative examples to read the Asfirometer:
PDF created with pdfFactory Pro trial version www.pdffactory.com
34
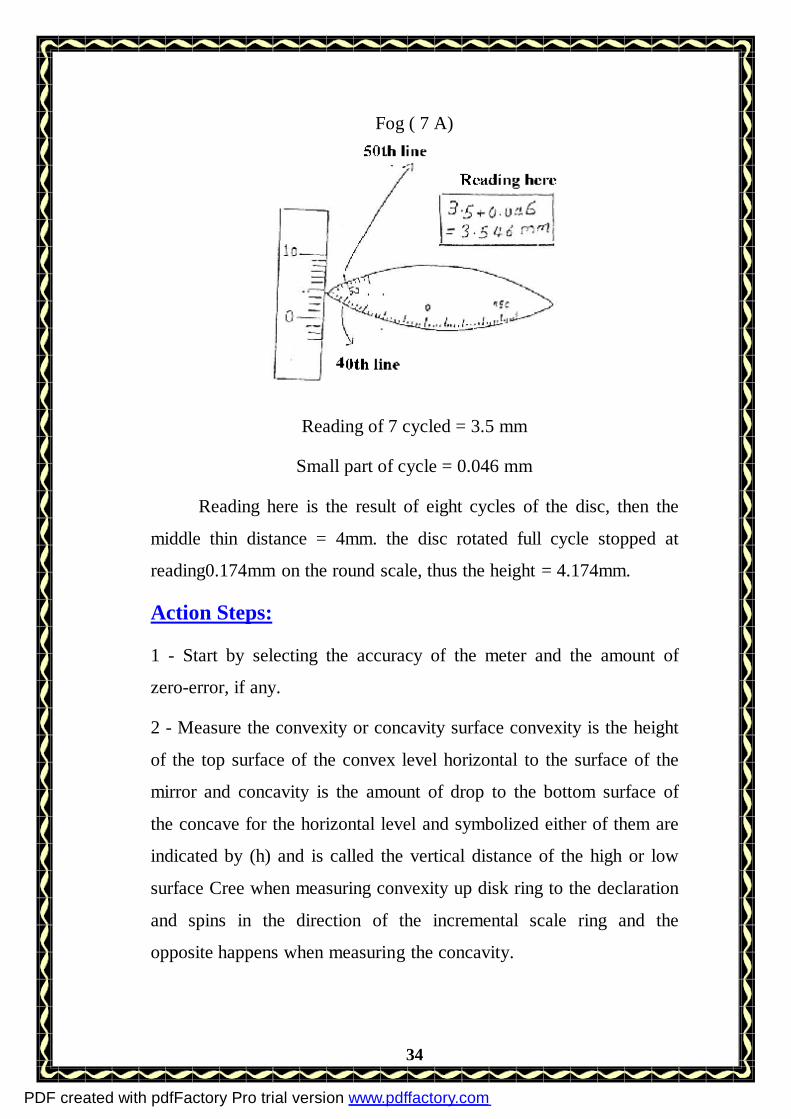
Fog ( 7 A)
Reading of 7 cycled = 3.5 mm
Small part of cycle = 0.046 mm
Reading here is the result of eight cycles of the disc, then the
middle thin distance = 4mm. the disc rotated full cycle stopped at
reading0.174mm on the round scale, thus the height = 4.174mm.
Action Steps:
1 - Start by selecting the accuracy of the meter and the amount of
zero-error, if any.
2 - Measure the convexity or concavity surface convexity is the height
of the top surface of the convex level horizontal to the surface of the
mirror and concavity is the amount of drop to the bottom surface of
the concave for the horizontal level and symbolized either of them are
indicated by (h) and is called the vertical distance of the high or low
surface Cree when measuring convexity up disk ring to the declaration
and spins in the direction of the incremental scale ring and the
opposite happens when measuring the concavity.
PDF created with pdfFactory Pro trial version www.pdffactory.com

35
3 - Measure the distance (a) between two of the three parties to the
scale is done by pressing the scale on a sheet of education and external
pressure points in pencil and then use the ruler to measure the distance
between any two signs.
4 - Calculate the radius of the ball surface Cree using the following
relationship : h
ar6
2
=
PDF created with pdfFactory Pro trial version www.pdffactory.com
36
Experiment number (3)
Vectors
Objective of the experiment: -
practical training on the laws of combination of the Force vectors
- Study the point of balance of force vectors
The device used:
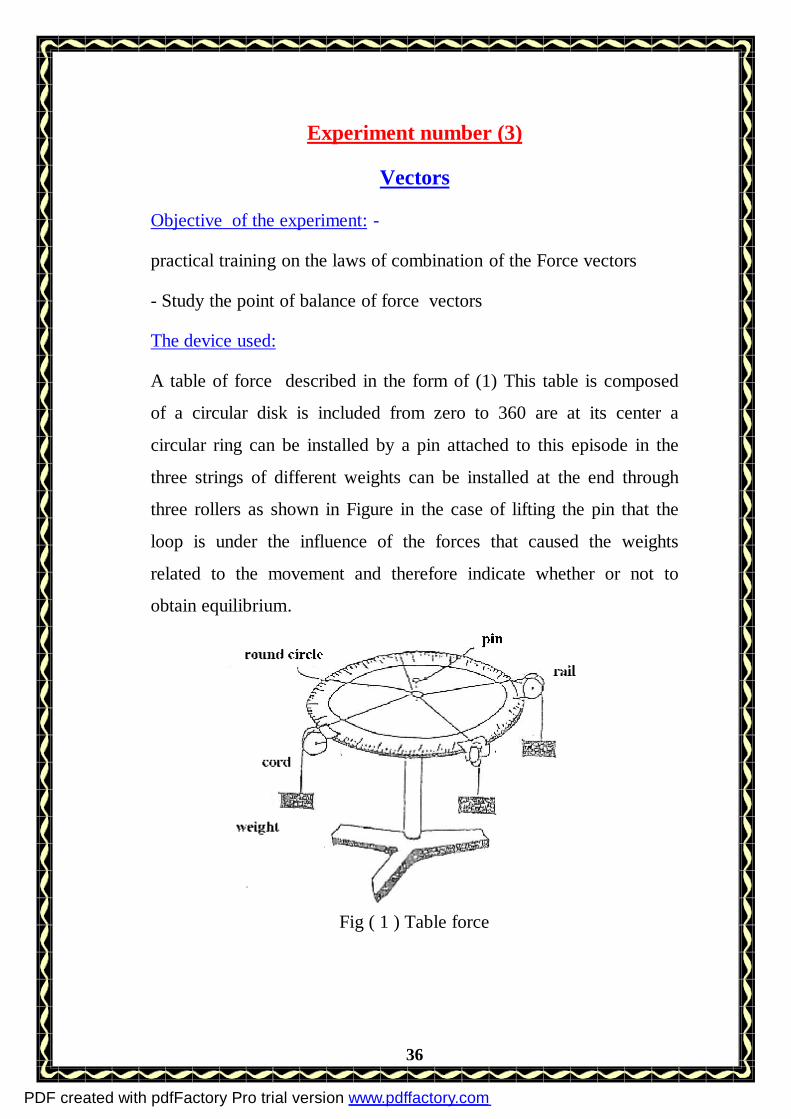
A table of force described in the form of (1) This table is composed
of a circular disk is included from zero to 360 are at its center a
circular ring can be installed by a pin attached to this episode in the
three strings of different weights can be installed at the end through
three rollers as shown in Figure in the case of lifting the pin that the
loop is under the influence of the forces that caused the weights
related to the movement and therefore indicate whether or not to
obtain equilibrium.
Fig ( 1 ) Table force
PDF created with pdfFactory Pro trial version www.pdffactory.com
37
Theory of experiment:
Vector theory can be collected in one of two methods:
Graphic representation (called a closed polygon method) or analytical
method (the method the components or compounds are component
method) combination of two forces or more and the result of this
combination is called outcome in our experiment this get the balance
of three forces, any of which could be the outcome of the two forces
this outcome can be calculated theoretically in one of the two
methods:
The first method: the method the components or compounds :
Is in this method the collection heading or more by placing the
beginnings of all vectors at the center point (the origin of the of x and
y coordinates) and then find a home each vector on each axis This
process is called vector analysis (or force s) to the compounds on the
axes orthogonal (×axis , Y axis).
Thus a net force vector F to F1 , F2 , F3 mathematical equation: F= F1
+ F2 + F3
Amount of these collections gives the following equation: 2
3212
321 )()( yyyxxx FFFFFFF +++++= ……………(1)
Where Fx , Fx , Fx is a watershed vector F1 , F2 , F3 on the X-axis
(compounds x) Fy , Fy , Fy is a watershed vector F1 , F2 , F3 on the axis
of (compounds) direction collected appointed angle θ, which are
manufactured with the direction the positive X-axis (axis x)
According to the equation
PDF created with pdfFactory Pro trial version www.pdffactory.com
38
2321
2321 )()( yyyxxx FFFFFFF +++++= ……………(1)
Part (1):
In the given experiment we have two weights one represented by a
vector of force F1 and makes an angle of θ1 with the direction the
positive axis x and the second is represented by a vector of force F2
and makes an angle of θ2 with the direction the positive axis x. These
two equilibrium with the weight (force) w makes Angle amount θ with
the positive direction of the axis x Now the outcome of the two F2, F1
is a practical weight w and to find an outcome theoretically using the
method of components we are analyzing each of the two F2, F1 to two
compounds and then calculate the amount and direction received as
follows:
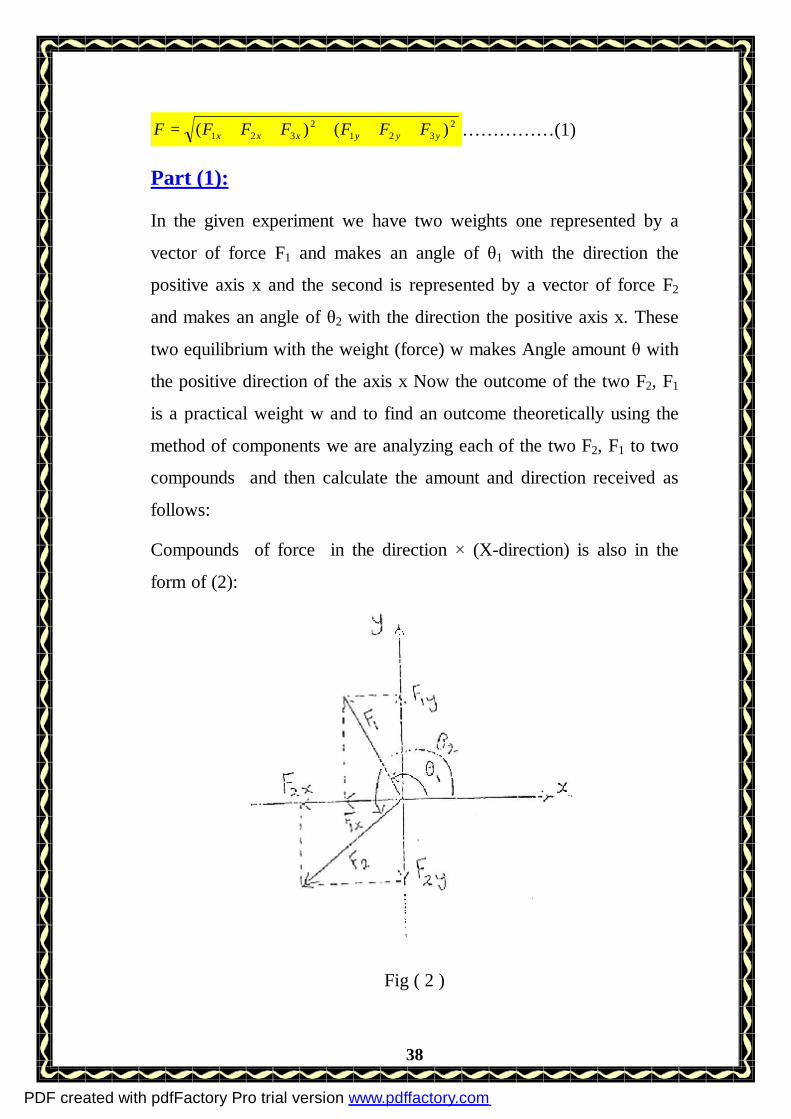
Compounds of force in the direction × (X-direction) is also in the
form of (2):
Fig ( 2 )
PDF created with pdfFactory Pro trial version www.pdffactory.com
39
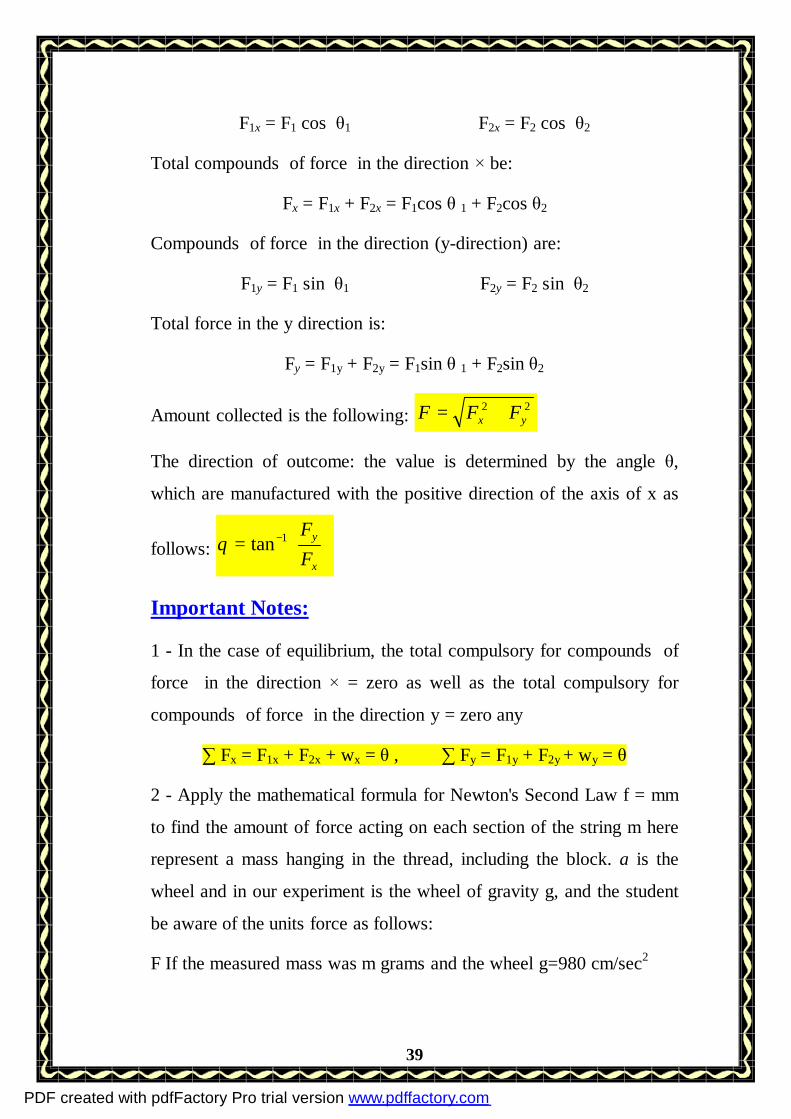
F1x = F1 cos θ1 F2x = F2 cos θ2
Total compounds of force in the direction × be:
Fx = F1x + F2x = F1cos θ 1 + F2cos θ2
Compounds of force in the direction (y-direction) are:
F1y = F1 sin θ1 F2y = F2 sin θ2
Total force in the y direction is:
Fy = F1y + F2y = F1sin θ 1 + F2sin θ2
Amount collected is the following: 22yx FFF +=
The direction of outcome: the value is determined by the angle θ,
which are manufactured with the positive direction of the axis of x as
follows:
= −
x
y
FF1tanθ
Important Notes:
1 - In the case of equilibrium, the total compulsory for compounds of
force in the direction × = zero as well as the total compulsory for
compounds of force in the direction y = zero any
∑ Fx = F1x + F2x + wx = θ , ∑ Fy = F1y + F2y + wy = θ 2 - Apply the mathematical formula for Newton's Second Law f = mm
to find the amount of force acting on each section of the string m here
represent a mass hanging in the thread, including the block. a is the
wheel and in our experiment is the wheel of gravity g, and the student
be aware of the units force as follows:
F If the measured mass was m grams and the wheel g=980 cm/sec2
PDF created with pdfFactory Pro trial version www.pdffactory.com
40
F If the measured mass in m per kilo and the wheel g=9.8 m/sec2
The second method:
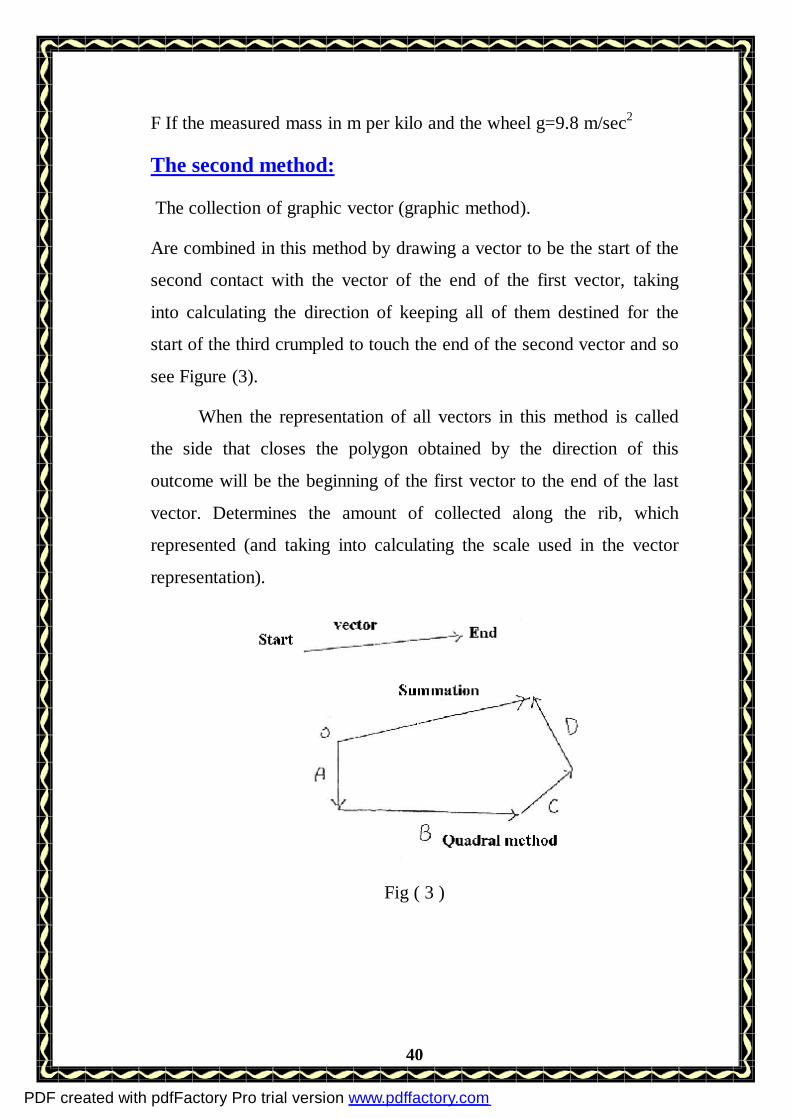
The collection of graphic vector (graphic method).
Are combined in this method by drawing a vector to be the start of the
second contact with the vector of the end of the first vector, taking
into calculating the direction of keeping all of them destined for the
start of the third crumpled to touch the end of the second vector and so
see Figure (3).
When the representation of all vectors in this method is called
the side that closes the polygon obtained by the direction of this
outcome will be the beginning of the first vector to the end of the last
vector. Determines the amount of collected along the rib, which
represented (and taking into calculating the scale used in the vector
representation).
Fig ( 3 )
PDF created with pdfFactory Pro trial version www.pdffactory.com
41
Part (2):
In this example we explain how to collect vector graphics, and content
ourselves with the collection heading:
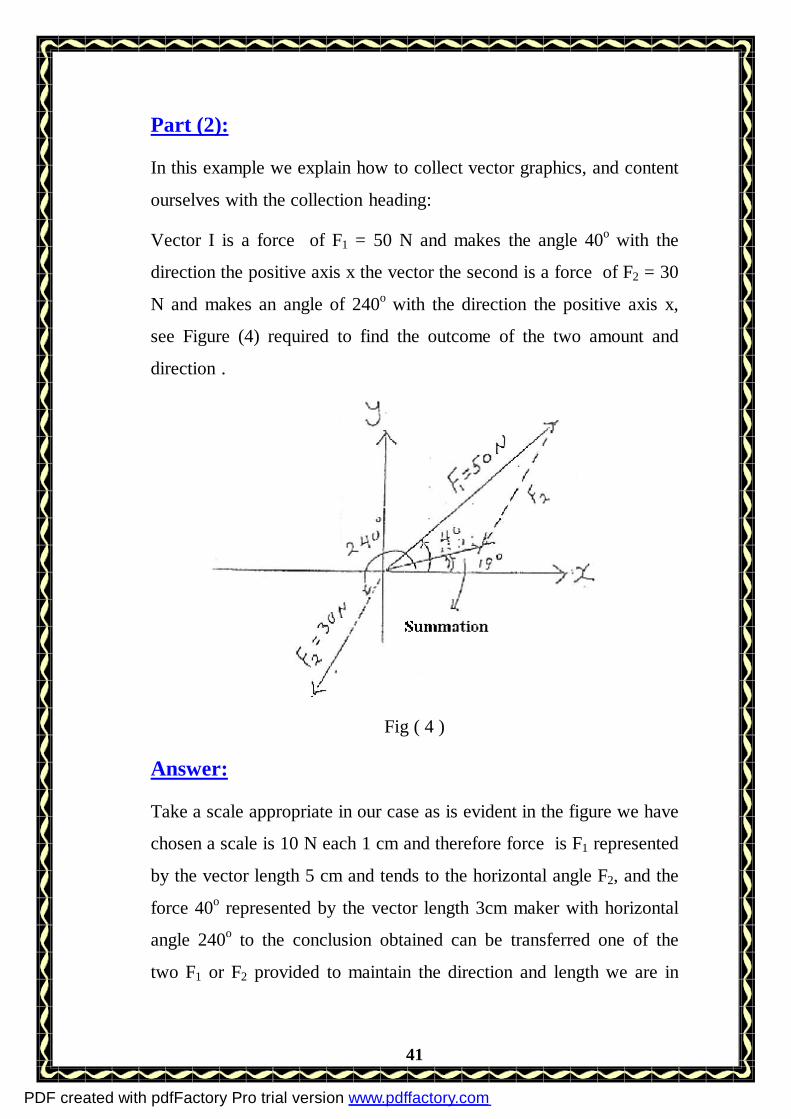
Vector I is a force of F1 = 50 N and makes the angle 40o with the
direction the positive axis x the vector the second is a force of F2 = 30
N and makes an angle of 240o with the direction the positive axis x,
see Figure (4) required to find the outcome of the two amount and
direction .
Fig ( 4 )
Answer:
Take a scale appropriate in our case as is evident in the figure we have
chosen a scale is 10 N each 1 cm and therefore force is F1 represented
by the vector length 5 cm and tends to the horizontal angle F2, and the
force 40o represented by the vector length 3cm maker with horizontal
angle 240o to the conclusion obtained can be transferred one of the
two F1 or F2 provided to maintain the direction and length we are in
PDF created with pdfFactory Pro trial version www.pdffactory.com
42
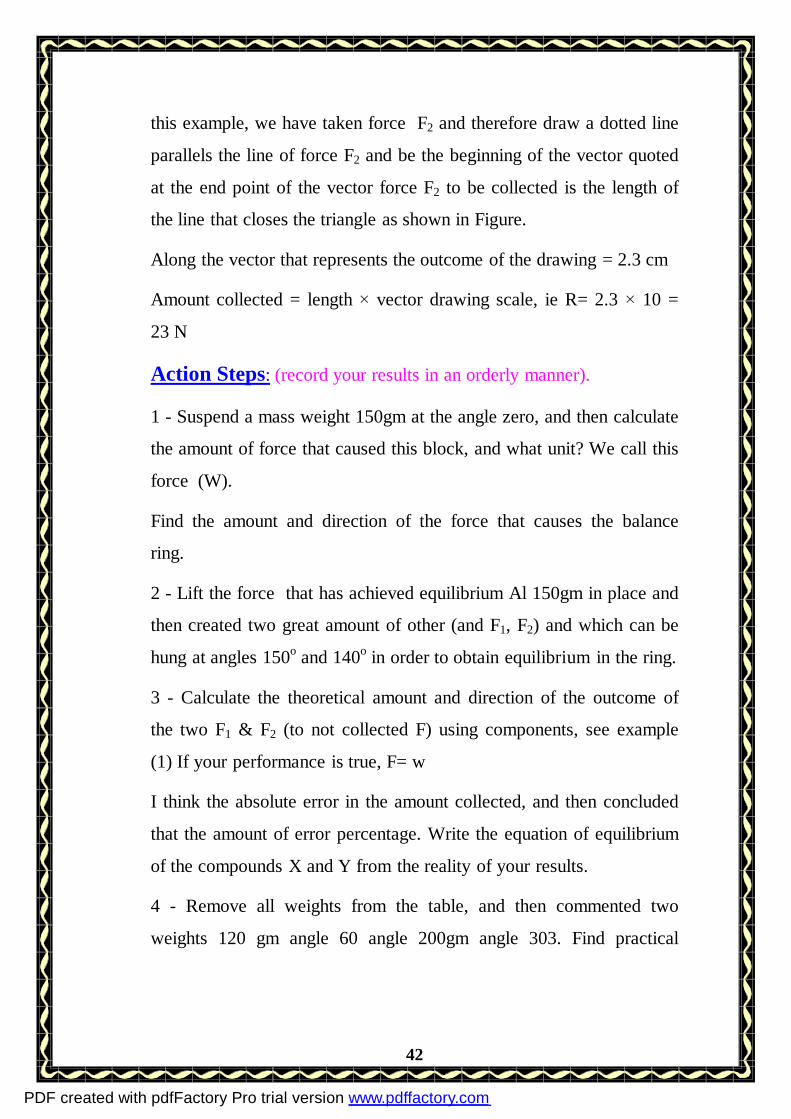
this example, we have taken force F2 and therefore draw a dotted line
parallels the line of force F2 and be the beginning of the vector quoted
at the end point of the vector force F2 to be collected is the length of
the line that closes the triangle as shown in Figure.
Along the vector that represents the outcome of the drawing = 2.3 cm
Amount collected = length × vector drawing scale, ie R= 2.3 × 10 =
23 N
Action Steps: (record your results in an orderly manner).
1 - Suspend a mass weight 150gm at the angle zero, and then calculate
the amount of force that caused this block, and what unit? We call this
force (W).
Find the amount and direction of the force that causes the balance
ring.
2 - Lift the force that has achieved equilibrium Al 150gm in place and
then created two great amount of other (and F1, F2) and which can be
hung at angles 150o and 140o in order to obtain equilibrium in the ring.
3 - Calculate the theoretical amount and direction of the outcome of
the two F1 & F2 (to not collected F) using components, see example
(1) If your performance is true, F= w
I think the absolute error in the amount collected, and then concluded
that the amount of error percentage. Write the equation of equilibrium
of the compounds X and Y from the reality of your results.
4 - Remove all weights from the table, and then commented two
weights 120 gm angle 60 angle 200gm angle 303. Find practical
PDF created with pdfFactory Pro trial version www.pdffactory.com

43
amount and direction of the third force (net R) that cause the
equilibrium of the circular ring.
5 - Check the theory of the result obtained in the previous step by
finding the amount and direction of the net graphical method, see
Example (2).
Calculate the absolute error in the amount collected, and then
concluded that the amount of error percentage in your measurements.
PDF created with pdfFactory Pro trial version www.pdffactory.com

44
Experiment number (4)
The Study of refractive index of a transparent material
Objective of the experiment:
- To study of refraction in the path of winning a beam of light when he
moved from the center of a Central time.
-To calculate the refractive index of the transparent material (glass)
and by measuring the angle of incidence and refraction of winning a
beam of light through Mar of this article.
The device used:
Glass panel in the form of parallel rectangles, published three, cork
board, a set of pins, white paper, a protractor to measure angles.
Theory of experiment:
When passing a beam of light (non-vertical) from the center to
the center of a different density (so that the speed in the second
medium is different from the speed in the first), it is said that this
beam had broken, if there is transmission of light rays from the center
of an antenna to the center of a larger T × density (such as glass), the
refracted beam to near vertical surface on the separation between the
two mediums as shown in the form of (1), and the speed of light in the
center of the largest density of less accelerated in the air.
The ratio between the speed of light in free space (space) and
speed in the middle of a known refractive index of the center (index of
refraction) angle between the incident beam and the vertical angle is
PDF created with pdfFactory Pro trial version www.pdffactory.com
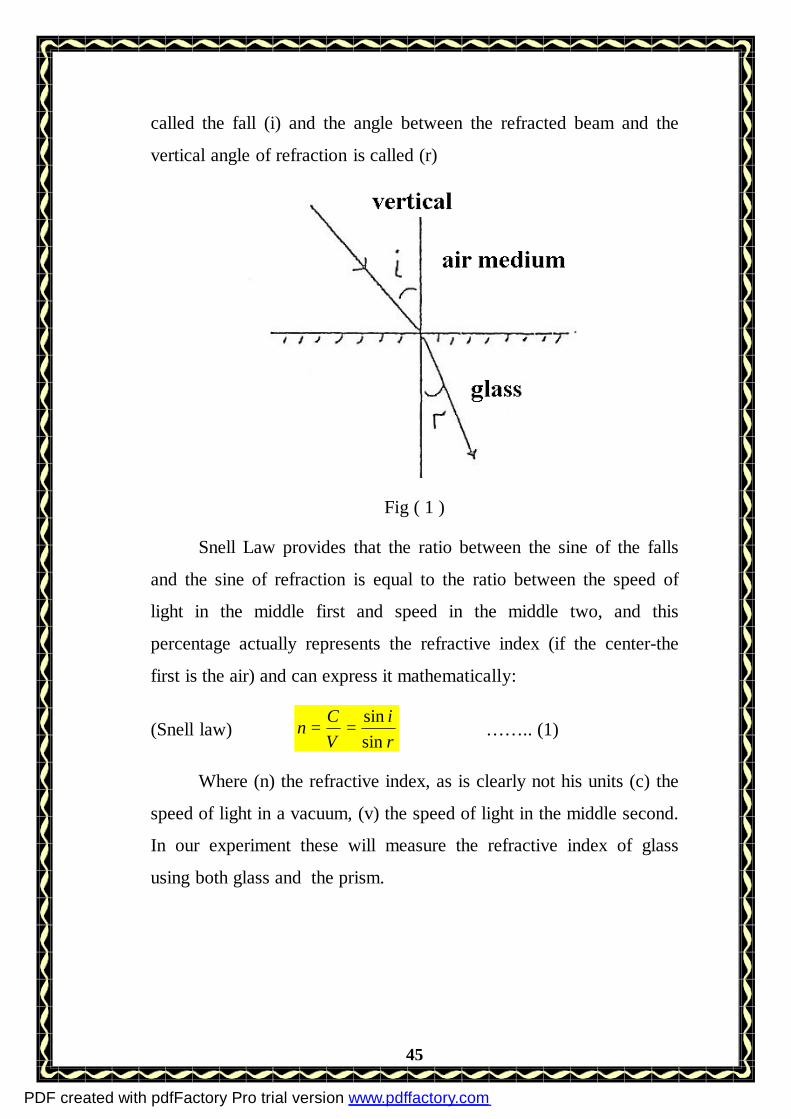
45
called the fall (i) and the angle between the refracted beam and the
vertical angle of refraction is called (r)
Fig ( 1 )
Snell Law provides that the ratio between the sine of the falls
and the sine of refraction is equal to the ratio between the speed of
light in the middle first and speed in the middle two, and this
percentage actually represents the refractive index (if the center-the
first is the air) and can express it mathematically:
(Snell law) ri
VCn
sinsin
== …….. (1)
Where (n) the refractive index, as is clearly not his units (c) the
speed of light in a vacuum, (v) the speed of light in the middle second.
In our experiment these will measure the refractive index of glass
using both glass and the prism.
PDF created with pdfFactory Pro trial version www.pdffactory.com
46
Refraction of light by a glass three-leaflet:
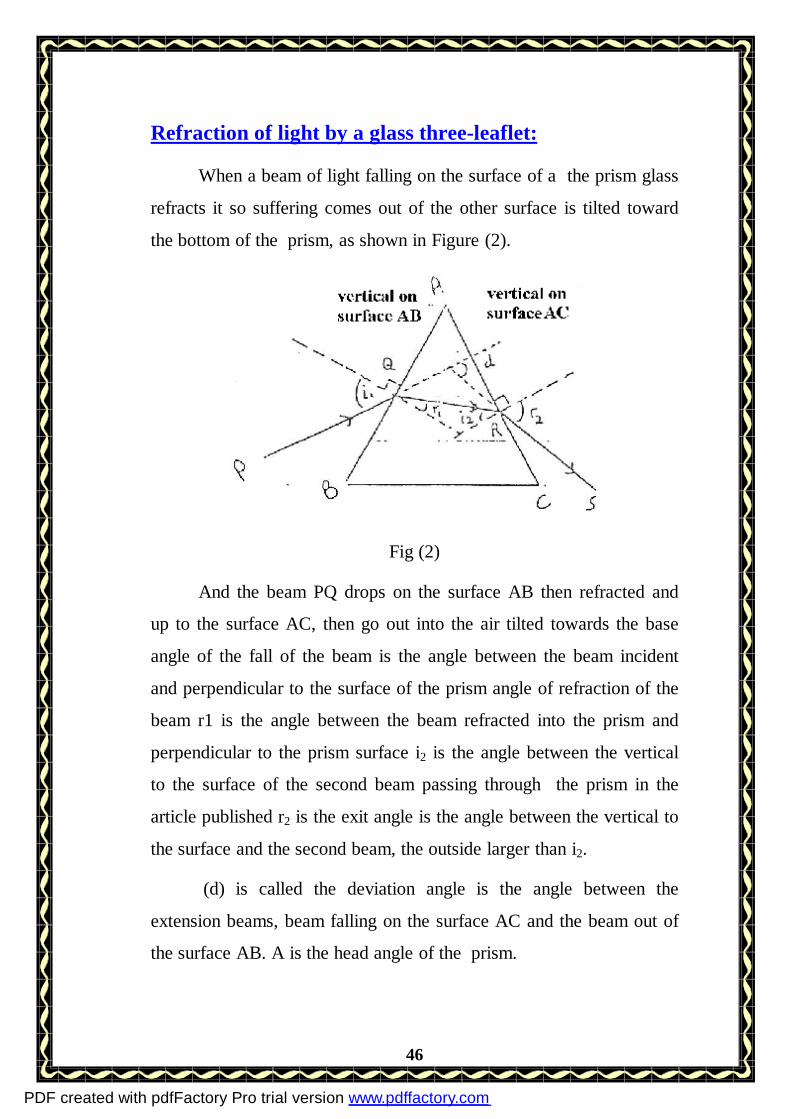
When a beam of light falling on the surface of a the prism glass
refracts it so suffering comes out of the other surface is tilted toward
the bottom of the prism, as shown in Figure (2).
Fig (2)
And the beam PQ drops on the surface AB then refracted and
up to the surface AC, then go out into the air tilted towards the base
angle of the fall of the beam is the angle between the beam incident
and perpendicular to the surface of the prism angle of refraction of the
beam r1 is the angle between the beam refracted into the prism and
perpendicular to the prism surface i2 is the angle between the vertical
to the surface of the second beam passing through the prism in the
article published r2 is the exit angle is the angle between the vertical to
the surface and the second beam, the outside larger than i2.
(d) is called the deviation angle is the angle between the
extension beams, beam falling on the surface AC and the beam out of
the surface AB. A is the head angle of the prism.
PDF created with pdfFactory Pro trial version www.pdffactory.com
47
Calculating the refractive index of prism material:
the refractive index of prism material can be calculate using the signal
equation 1
1
sinsin
rin =
It can also calculate the value of n using other relationship in a
special case for the development of the prism, called the development
of the end of the small deviation we will cite here a brief for this case
(for details see the adopted references for the lectures, as well as the
syllabus of high school physics).
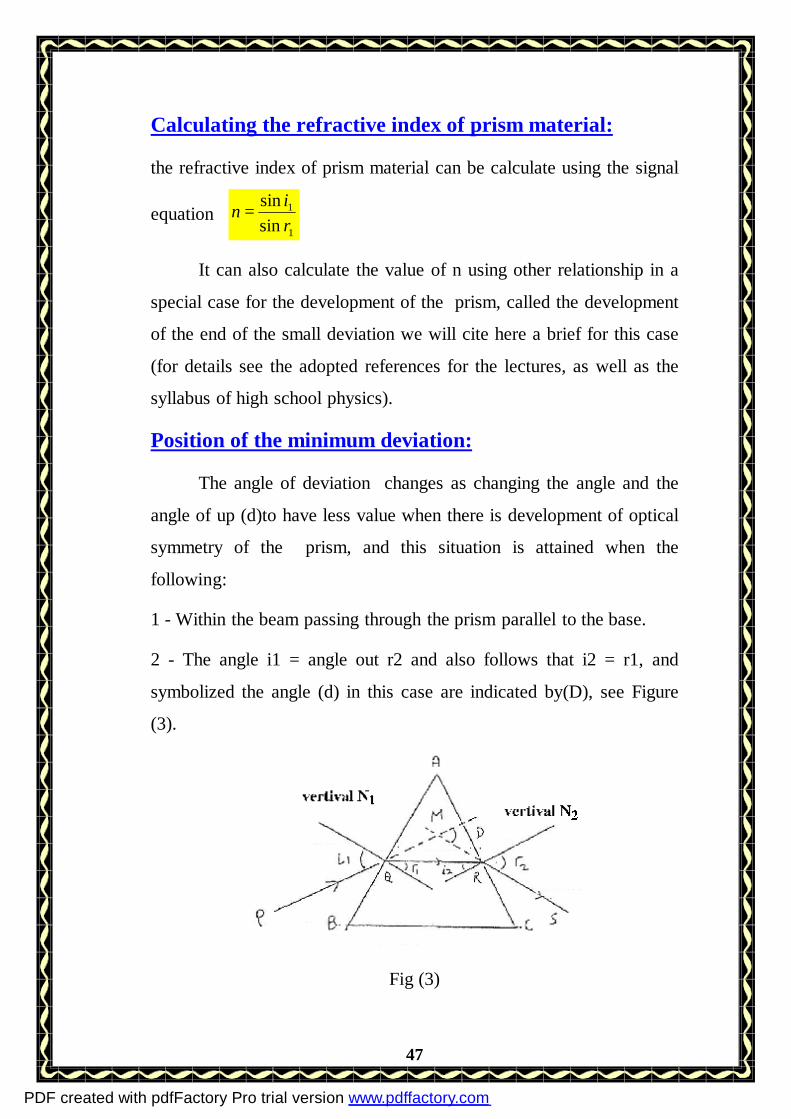
Position of the minimum deviation:
The angle of deviation changes as changing the angle and the
angle of up (d)to have less value when there is development of optical
symmetry of the prism, and this situation is attained when the
following:
1 - Within the beam passing through the prism parallel to the base.
2 - The angle i1 = angle out r2 and also follows that i2 = r1, and
symbolized the angle (d) in this case are indicated by(D), see Figure
(3).
Fig (3)
PDF created with pdfFactory Pro trial version www.pdffactory.com
48
If these conditions are true, the refractive index can be
calculated from the following relationship:
A
ADn
21sin
)(21sin +
= ………………….. (2)
Action Steps:
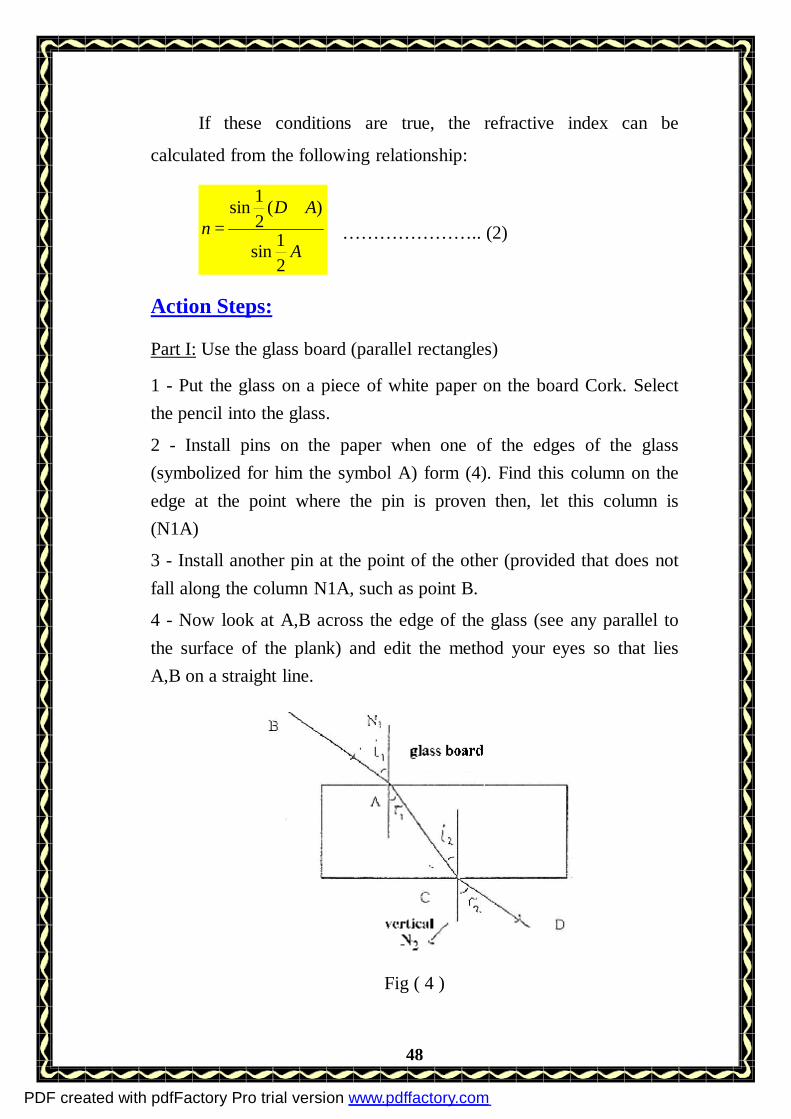
Part I: Use the glass board (parallel rectangles)
1 - Put the glass on a piece of white paper on the board Cork. Select the pencil into the glass. 2 - Install pins on the paper when one of the edges of the glass (symbolized for him the symbol A) form (4). Find this column on the edge at the point where the pin is proven then, let this column is (N1A) 3 - Install another pin at the point of the other (provided that does not fall along the column N1A, such as point B. 4 - Now look at A,B across the edge of the glass (see any parallel to the surface of the plank) and edit the method your eyes so that lies A,B on a straight line.
Fig ( 4 )
PDF created with pdfFactory Pro trial version www.pdffactory.com
49
5 - Place another pin C in the position described so masks both A,B
and place another pin D to obscure both the A, B, C.
6 - Lift the glass and put a method, arrived in a straight line between
the points AB,BC,CD vertical straight path (of at the point A)
Measure the angles r1,i1 and then calculate the refractive index of
glass using the equation (1)
i1 Is the angle of the incident beam and passing in the air.
r1 Is the angle of refraction of the refracted beam and pass-through in
the glass.
i2 Is the angle of the beam passing through the glass into the air.
r2 Is the angle to go out and be confined to regulating the vertical and
parallel to the surface.
Note that i1 = r2 , r1 = i2 , 2
2
sinsin1
ri
n=
Part two: Using the prism
1 - Lift the cuboids glass used in the first part and set it aside.
2 - Place the new white paper on cork board on top of them so that the
triangular prism base applicable to the paper.
3 - Determine the position of the prism in pencil, then place two pins
R,Q so that RQ are parallel to the base of the prism, and this will be
published in the development of optical symmetry.
4 - Mark the level of the eye in the paper put a pin last fall so that the
three pins on the straightening one. Finally, place the forth pin (S) on
the other side of the prism is located so that the four pins on the
integrity of one (as it did in the first part of the experiment).
PDF created with pdfFactory Pro trial version www.pdffactory.com

50
5 - Lift the prism and then match lines PQ,QR,RS, which represent
the true path of a beam of light from the point P to point Q passing
through the point R through the prism and then to the eye at the point
S.
6 - Draw two columns N2, N1 such as what is shown in Figure (3) then
both the PQ , RS on the integrity actually, even in the M angle D
intersection consisting of a small angle of the end for the deviation.
7 - Measure using the protractor both of the following angles: head
angle prism A and the angle D, and both angles r1, i1 record the results
of your measurements on the drawing next to each angle, and then
recorded in a table (2).
8 - Calculate the refractive index n for article published using the
equations (1) , (2) and record the results of your measurements in a
table both methods (2).
9 - Use the white paper, a third of the fee, put the two pins Q , R so
that the line is QR tilted towards the base, such as the situation
described in the form of (2): Measure the exact angle of deviation d,
as well as both angles r1 , i1 and record the results of your
measurements in Table (2) If your measurements right angle you will
find that the value of d is greater than the angle D as long as the beam
QR is not equivalent to the base.
10 - Refer to your drawing that represents the development of micro-
end and measure the angles of deviation r2, i2 If your performance you
will find true i1 = r2 , r1 = i2. Through your results What is the
relationship you observe between the angles D , r1 , i1 record as a
result of your note.
PDF created with pdfFactory Pro trial version www.pdffactory.com
51
Experiment number (5)
Set the focal length of thin lens
Objective of the experiment: the use of the general law of the
thin lens focal length to find later.
Introduction:
When the fall of the bundle of rays parallel and parallel to the
axis of convex lens, they accumulate in the focus of the lens as shown
in Figure (1) is called the distance f dimension length of the lens If the
lens is concave, the rays come out different and looks as if it were
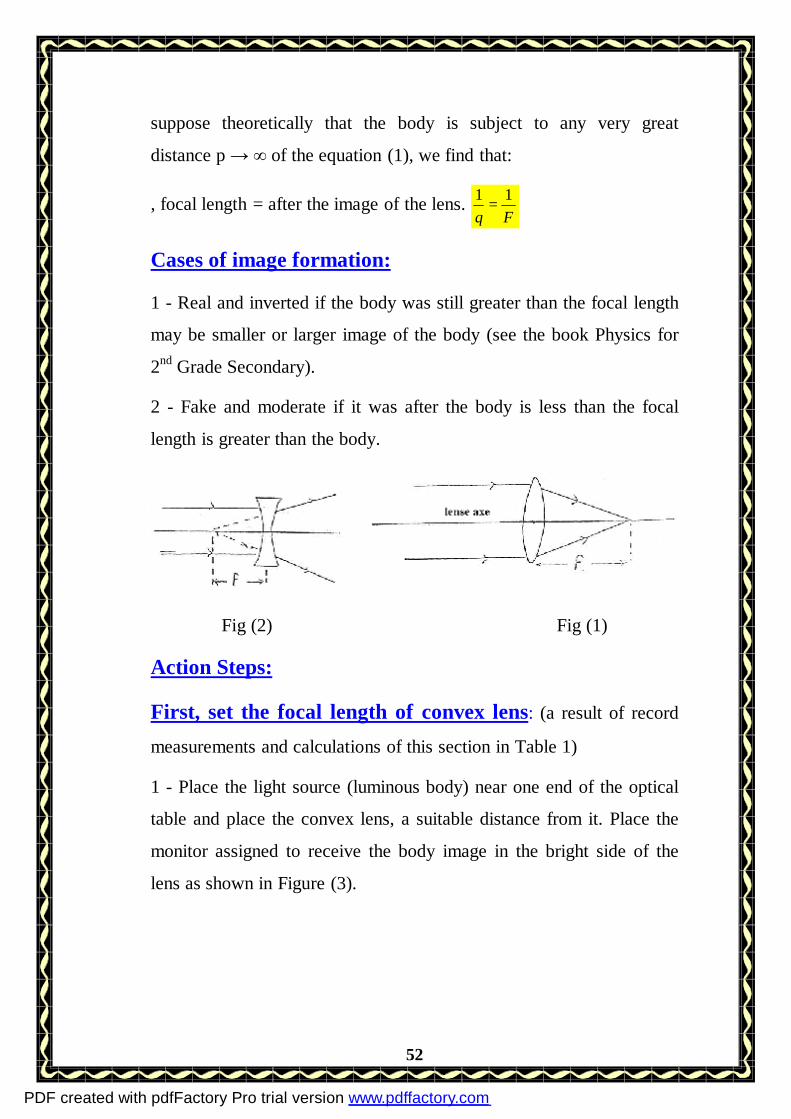
coming from the center of a fake as shown in Figure (2).
In fact, is the parallel rays if the light source far from the lens if
the light source close to the common law can be applied to the thin
lens is:
FqP111
=+ ……… (1)
Where f is the body distance (light source) on the lens p after
the image on the lens and q focal length.
Keep in mind that the f positive in the case of convex lenses and
negative in the case of concave lenses.
P Positive in the case of the real body and the body in the case of a
negative placebo.
q Positive in the case of the real image and in the case of negative
image.
PDF created with pdfFactory Pro trial version www.pdffactory.com
52
suppose theoretically that the body is subject to any very great
distance p → ∞ of the equation (1), we find that:
, focal length = after the image of the lens. Fq11
=
Cases of image formation:
1 - Real and inverted if the body was still greater than the focal length
may be smaller or larger image of the body (see the book Physics for
2nd Grade Secondary).
2 - Fake and moderate if it was after the body is less than the focal
length is greater than the body.
Fig (2) Fig (1)
Action Steps:
First, set the focal length of convex lens: (a result of record
measurements and calculations of this section in Table 1)
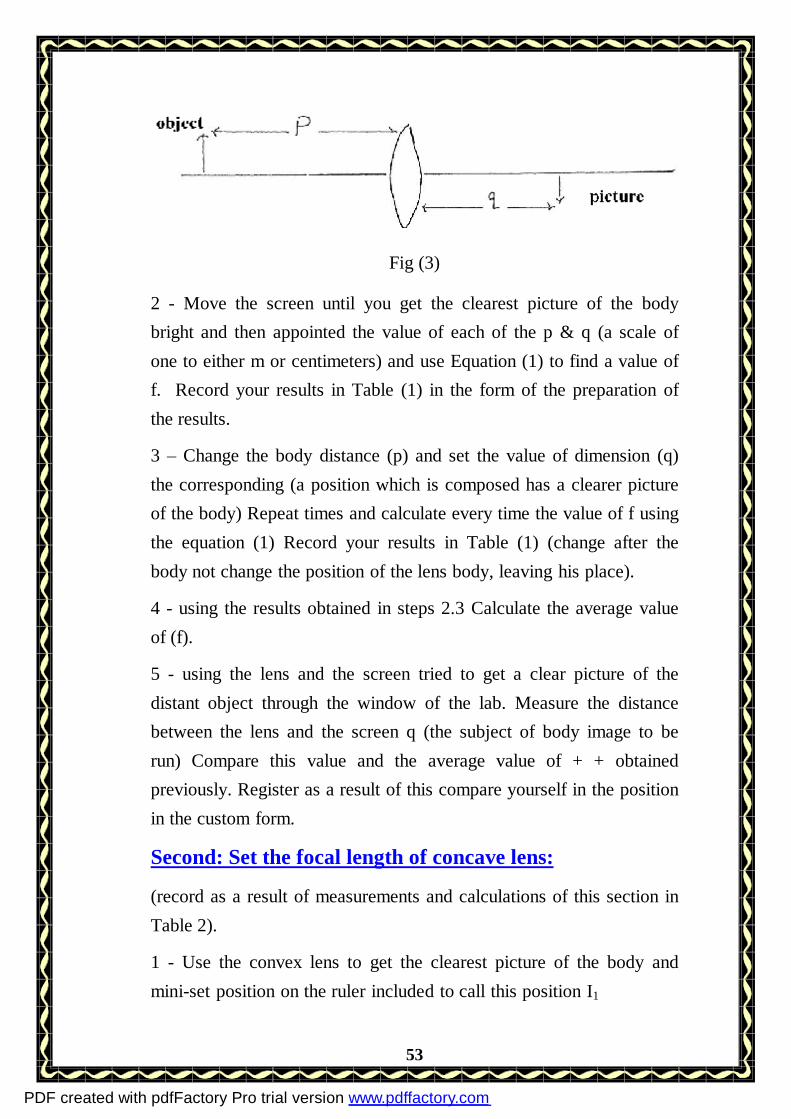
1 - Place the light source (luminous body) near one end of the optical
table and place the convex lens, a suitable distance from it. Place the
monitor assigned to receive the body image in the bright side of the
lens as shown in Figure (3).
PDF created with pdfFactory Pro trial version www.pdffactory.com
53
Fig (3)
2 - Move the screen until you get the clearest picture of the body bright and then appointed the value of each of the p & q (a scale of one to either m or centimeters) and use Equation (1) to find a value of f. Record your results in Table (1) in the form of the preparation of the results.
3 – Change the body distance (p) and set the value of dimension (q) the corresponding (a position which is composed has a clearer picture of the body) Repeat times and calculate every time the value of f using the equation (1) Record your results in Table (1) (change after the body not change the position of the lens body, leaving his place).
4 - using the results obtained in steps 2.3 Calculate the average value of (f).
5 - using the lens and the screen tried to get a clear picture of the distant object through the window of the lab. Measure the distance between the lens and the screen q (the subject of body image to be run) Compare this value and the average value of + + obtained previously. Register as a result of this compare yourself in the position in the custom form.
Second: Set the focal length of concave lens:
(record as a result of measurements and calculations of this section in Table 2).
1 - Use the convex lens to get the clearest picture of the body and mini-set position on the ruler included to call this position I1
PDF created with pdfFactory Pro trial version www.pdffactory.com
54
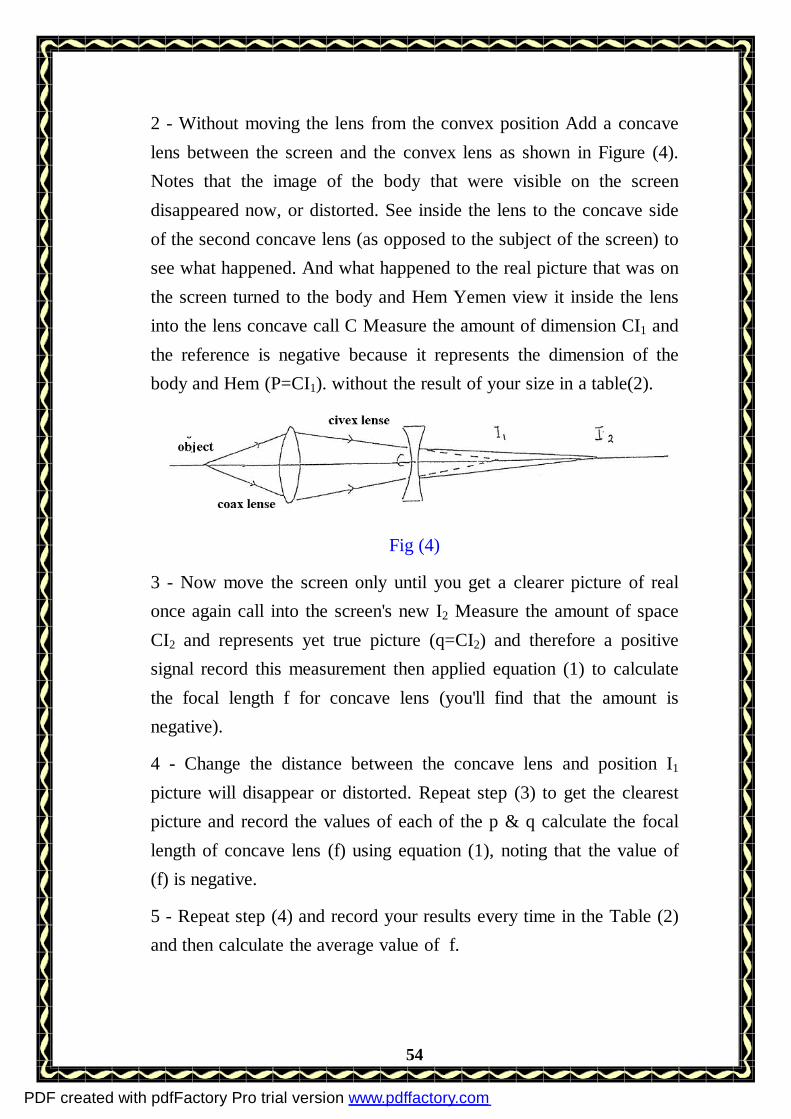
2 - Without moving the lens from the convex position Add a concave lens between the screen and the convex lens as shown in Figure (4). Notes that the image of the body that were visible on the screen disappeared now, or distorted. See inside the lens to the concave side of the second concave lens (as opposed to the subject of the screen) to see what happened. And what happened to the real picture that was on the screen turned to the body and Hem Yemen view it inside the lens into the lens concave call C Measure the amount of dimension CI1 and the reference is negative because it represents the dimension of the body and Hem (P=CI1). without the result of your size in a table(2).
Fig (4)
3 - Now move the screen only until you get a clearer picture of real once again call into the screen's new I2 Measure the amount of space CI2 and represents yet true picture (q=CI2) and therefore a positive signal record this measurement then applied equation (1) to calculate the focal length f for concave lens (you'll find that the amount is negative).
4 - Change the distance between the concave lens and position I1 picture will disappear or distorted. Repeat step (3) to get the clearest picture and record the values of each of the p & q calculate the focal length of concave lens (f) using equation (1), noting that the value of (f) is negative.
5 - Repeat step (4) and record your results every time in the Table (2) and then calculate the average value of f.
PDF created with pdfFactory Pro trial version www.pdffactory.com
55
Experiment number (6)
Set the specific heat of metal
The objective of the experiment:
Set the specific heat of metal, through the study of heat transfer
between the body temperature of a different quality.
The device used:
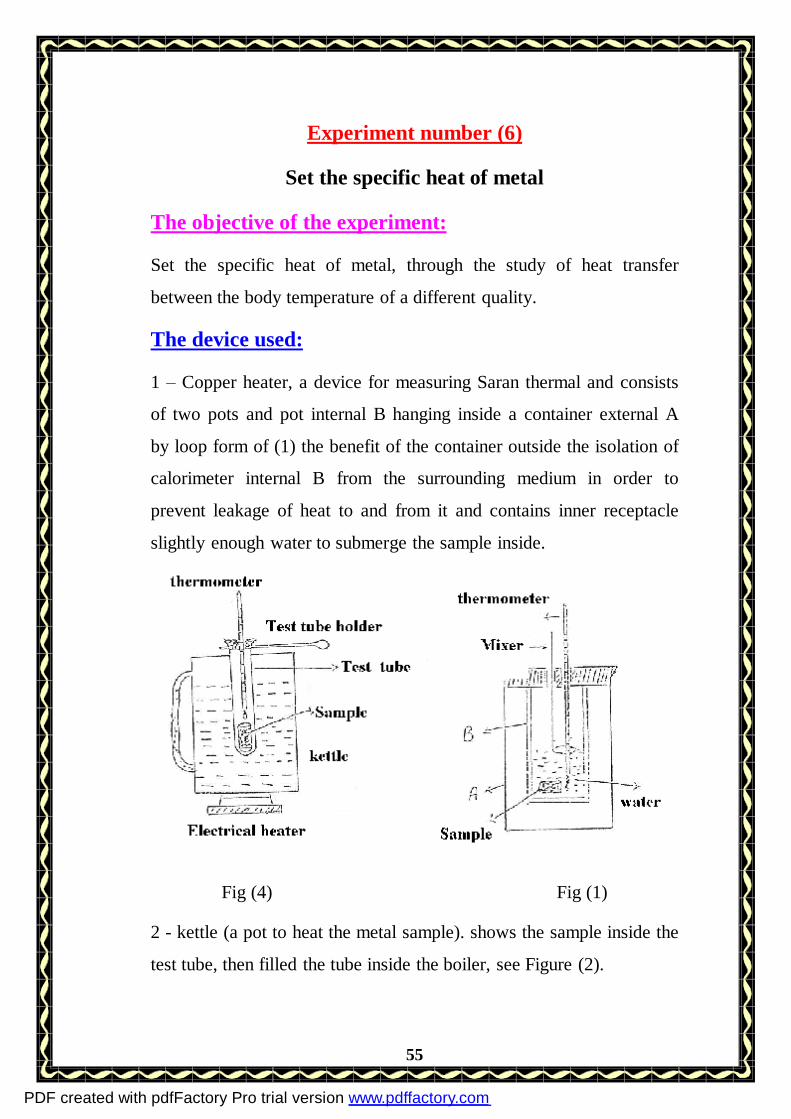
1 – Copper heater, a device for measuring Saran thermal and consists
of two pots and pot internal B hanging inside a container external A
by loop form of (1) the benefit of the container outside the isolation of
calorimeter internal B from the surrounding medium in order to
prevent leakage of heat to and from it and contains inner receptacle
slightly enough water to submerge the sample inside.
Fig (4) Fig (1)
2 - kettle (a pot to heat the metal sample). shows the sample inside the
test tube, then filled the tube inside the boiler, see Figure (2).
PDF created with pdfFactory Pro trial version www.pdffactory.com
56
3 - Thermometer to measure temperature.
Theory of experiment:
Specific heat of a substance is the amount of heat needed to
change the temperature of the unit blocks of material by one degree,
and can express it mathematically as follows:
tmQC∆
= …………………. . (1)
Q Represents the amount of heat, expressed in price, m mass of
material expressed in grams.
Δt The change in temperature expressed in degrees Celsius, which
represents the difference between the two classes primary heat T1 The
final grade Tf ( Δt = Tf – T1 or Δt = T1 – Tf)
The units are in accordance with the specific heat equation (1) are:
Price / gm. Cal / gm e Degrees Celsius (in the system cgs).
As in the system MKS, the mass per kilo gram, and the amount of heat
per kilo price, and therefore the specific heat units are: in the
international system kilo cal/kg c and the intensity is J/Kgc.
In our measurements in the lab we deal with the system (cgs) to set
the specific heat (c).
As is known, if we have two bodies are different in temperature
was connect them with each other (such as a piece of hot metal in cold
water), the hot body will drop the temperature and the cold body will
increase its temperature even up objects to the temperature of the joint
and then say that the objects in the case of equilibrium thermal Our
experiment here is based on this principle, and we will in this
PDF created with pdfFactory Pro trial version www.pdffactory.com
57
experiment to drop the sample metal (which is the desired set
temperature of quality) in the priced copper by water and usually the
sample is heated, and the temperature is common for the calorimeter
and water is the degree of equilibrium gases is equal to room
temperature the pot will lose the amount of heat gained by each of the
water and calorimeter to consider the following:
Primary temperature: the sample is hot tim and the water and
calorimeter is tiw.
Temperature involved in the case of thermal equilibrium after mixing
are: tf (final grade) mass of water mw, and mass of the sample mm and
block calorimeter mc.
In the case of the thermal equilibrium:
The amount of heat lost to the sample = amount of heat gained to the
water + the amount of heat gained any of the calorimeter:
(2) …………………. Qm = Qw + Qc
(3) …….... Qw = mw Cw (tf – ti) the amount of heat gained water
(4) ……… Qc = mc Cc (tf – tiw)
Action Steps:
4 - Note to read the thermometer, which measures the temperature of
the sample during the heated inside the boiler and wait for the surface
reading and record the sample temperature and not hot tim Remove the
thermometer and let it cool to get back to room temperature. Then
convey the sample immediately to the inner receptacle of a
calorimeter.
PDF created with pdfFactory Pro trial version www.pdffactory.com
58
5 - Cover tightly priced and enter a thermometer and use the plot to
move the water from time to time to converge the temperature of the
mixture.
6 – Take reading when the temperature of the mixture take the
thermometer read tr is the final temperature for each of the calorimeter
and water sample and in the case of thermal equilibrium without
reading to the final temperature.
7 - Apply equation (3) to calculate the amount of heat gained to water.
8 – Apply equation (4) to calculate the amount of heat gained to the
calorimeter.
9 - Apply equation (6) to calculate the specific heat of the sample
metal.
10 - Calculate the amount of error in the absolute specific heat of the
sample if they know that the sample is of iron, which is the
temperature of quality 0.11 call/ gm c
11 - Calculate the amount of error percentage for the result obtained
by the pilot in the value of specific heat.
(See p. 3 for error calculating).
PDF created with pdfFactory Pro trial version www.pdffactory.com
59
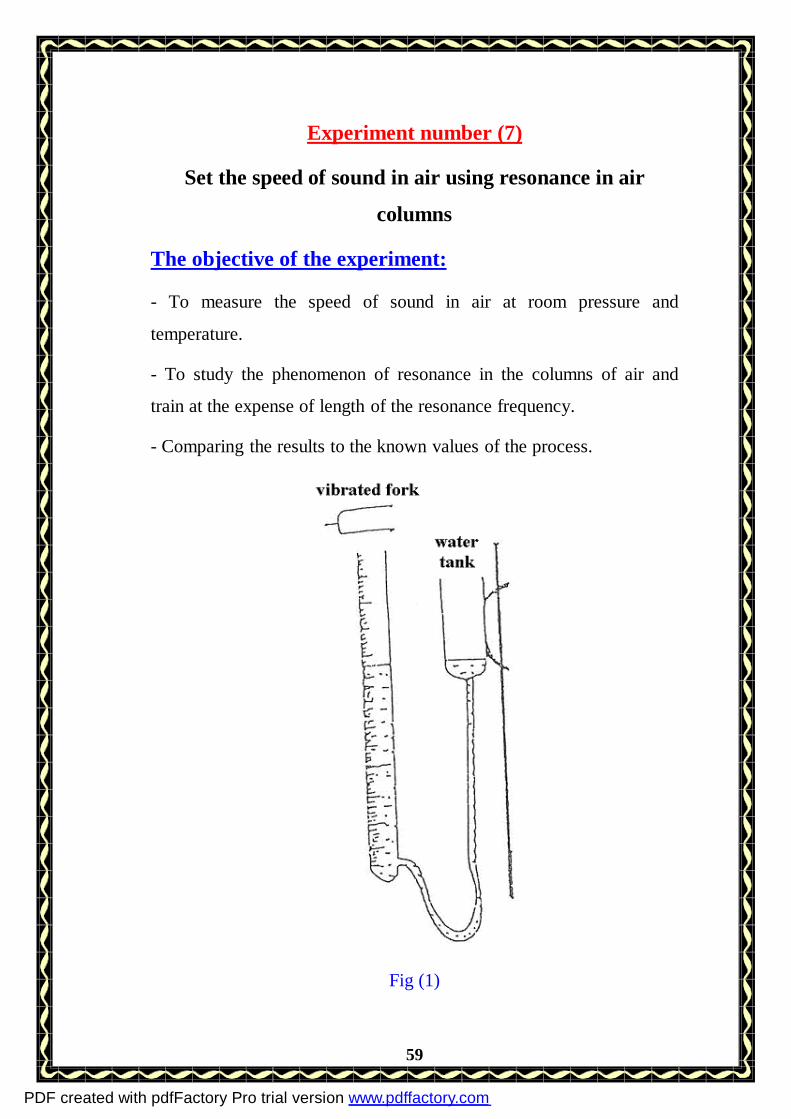
Experiment number (7)
Set the speed of sound in air using resonance in air
columns
The objective of the experiment:
- To measure the speed of sound in air at room pressure and
temperature.
- To study the phenomenon of resonance in the columns of air and
train at the expense of length of the resonance frequency.
- Comparing the results to the known values of the process.
Fig (1)
PDF created with pdfFactory Pro trial version www.pdffactory.com
60
The device used:
Consists of a cylindrical tube mounted with included tape and
related water tank can be moved to the declaration and down and thus
change the water in the glass tube, and in this method can change the
length of the antenna column. See Figure(1).
Tuning forks set of different frequencies.
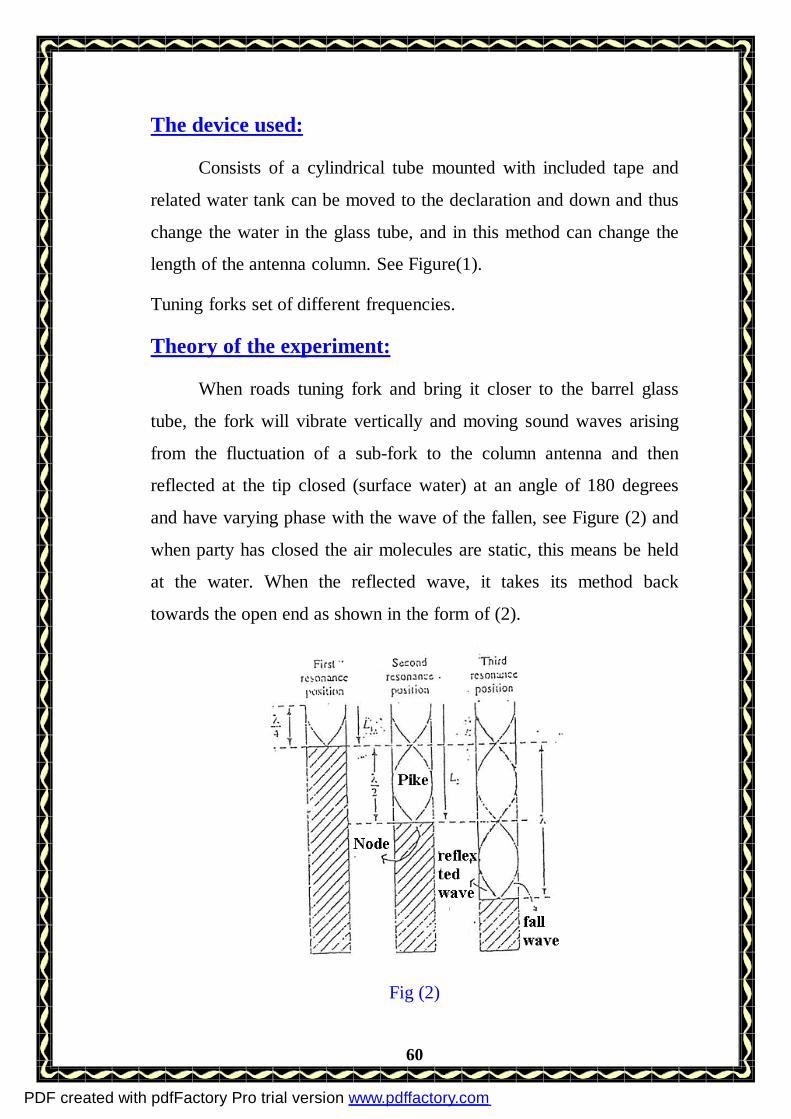
Theory of the experiment:
When roads tuning fork and bring it closer to the barrel glass
tube, the fork will vibrate vertically and moving sound waves arising
from the fluctuation of a sub-fork to the column antenna and then
reflected at the tip closed (surface water) at an angle of 180 degrees
and have varying phase with the wave of the fallen, see Figure (2) and
when party has closed the air molecules are static, this means be held
at the water. When the reflected wave, it takes its method back
towards the open end as shown in the form of (2).
Fig (2)
PDF created with pdfFactory Pro trial version www.pdffactory.com
61
As a result of interference between the waves falling and
reflected waves will occur for damping vibrations unless the antenna
along the column length is appropriate. When the appropriate length
for the column comprised the belly of the antenna when the open end
of the column of the antenna and occurs to strengthen the voice of any
ring. The appropriate length for the column antenna is to be
complications of an individual for a quarter of the wavelength of the
wave of the fallen, and then the reflected wave will work to strengthen
the falling wave and the wave is made up suspended, and this
condition is called resonance.
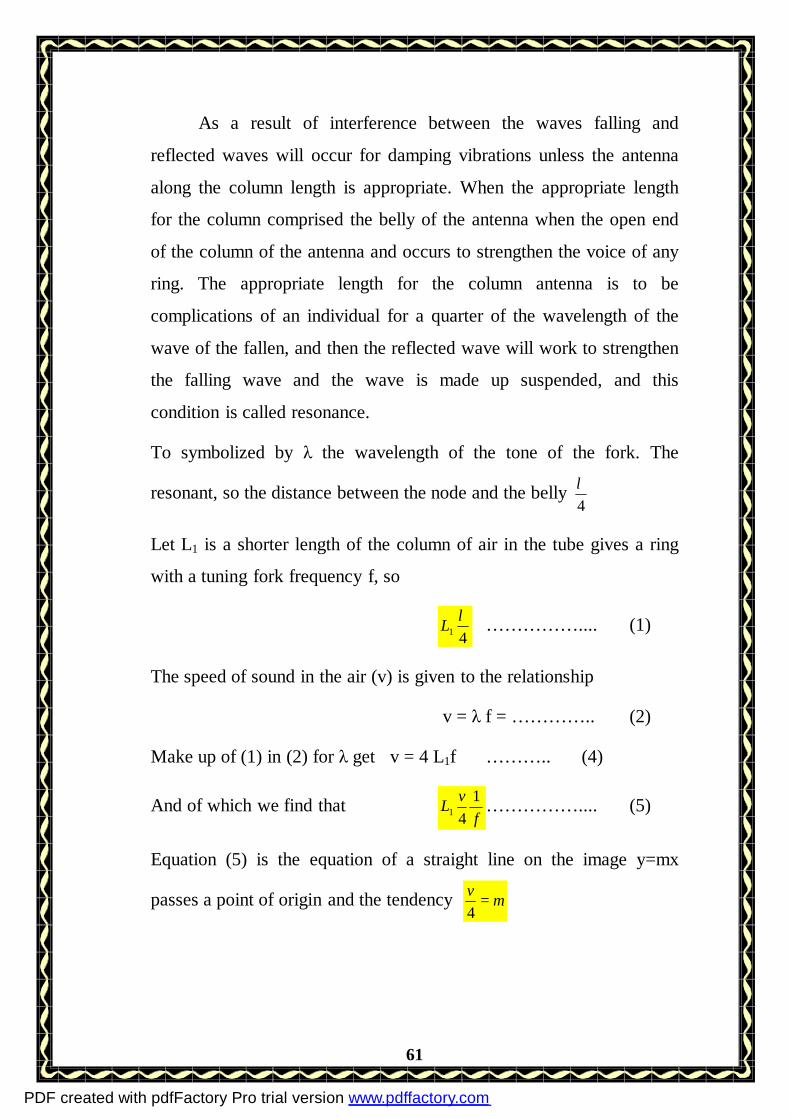
To symbolized by λ the wavelength of the tone of the fork. The
resonant, so the distance between the node and the belly 4λ
Let L1 is a shorter length of the column of air in the tube gives a ring
with a tuning fork frequency f, so
41λL …………….... (1)
The speed of sound in the air (v) is given to the relationship
v = λ f = ………….. (2)
Make up of (1) in (2) for λ get v = 4 L1f ……….. (4)
And of which we find that f
vL 141 …………….... (5)
Equation (5) is the equation of a straight line on the image y=mx
passes a point of origin and the tendency mv=
4
PDF created with pdfFactory Pro trial version www.pdffactory.com
62
Action Steps:
1 - Mark the water's surface near the mouth of the glass tube and by
raising the water tank to the declaration, and then start using a tuning
fork with a frequency top and kick using a hammer, rubber, and its
proximity to the opening of the tube and stir the water gradually so
that it starts the water in the tube to decline slowly Probe hearing well
in this Meanwhile, notes a clear increase in the intensity of sound at
some points. Higher and lower the water level to make sure exactly
determine the point of the first ring.
2 - Measure the distance between the surface of the water and opening
the tube L1 so that she is the shortest length of the column of air
happens ring with the tuning fork frequency (f) which corresponds to
a quarter wavelength acoustic record as a result of your size to the
length of the (L1) and as well as the frequency value f recorded on the
Fork in the results table.
3 - Repeat previous two steps using the tuning forks of different
frequency (preferably taking into calculating the arrangement of the
declaration to less and less frequency). Each time the log values of
each of the L1 , f.
4 - Calculate the inverted )1(f
and record in the table. Then draw a
relationship between the graphs )1(f
on the horizontal axis and L1 on
the vertical axis if your performance is true and accurate you will get a
straight line going through the original point of achieving an equation
(3)
PDF created with pdfFactory Pro trial version www.pdffactory.com
63
5 - Calculate the miles from the rectum of output and concluded that
the value of the speed of sound in the air units m/cec
6 - It is known that the speed of sound in air at zero degrees Celsius
and at sea level and it is 331.4 m/sec increase by 0.61 m/sec 1 c for
each rise in temperature of the air amounting to according to the
following relationship v= 331.4+0.61 t ….. (4)
Based on Measure the temperature of the laboratory (t c) thermometer
through the lab and then applied the equation (4) to set the speed of
sound in air temperature in the lab. As the speed of sound calculated
from the equation (4) Find the correct value is the amount of absolute
error, then the amount of error in the percentage score of any pilot in
the speed of sound deduced in step.
PDF created with pdfFactory Pro trial version www.pdffactory.com
64
Experiment number (8)
Set the fork frequency using the tuning Sonometer
Objective of the experiment:
Identify some basic properties of sound and set the frequency of
tuning fork more than one method.
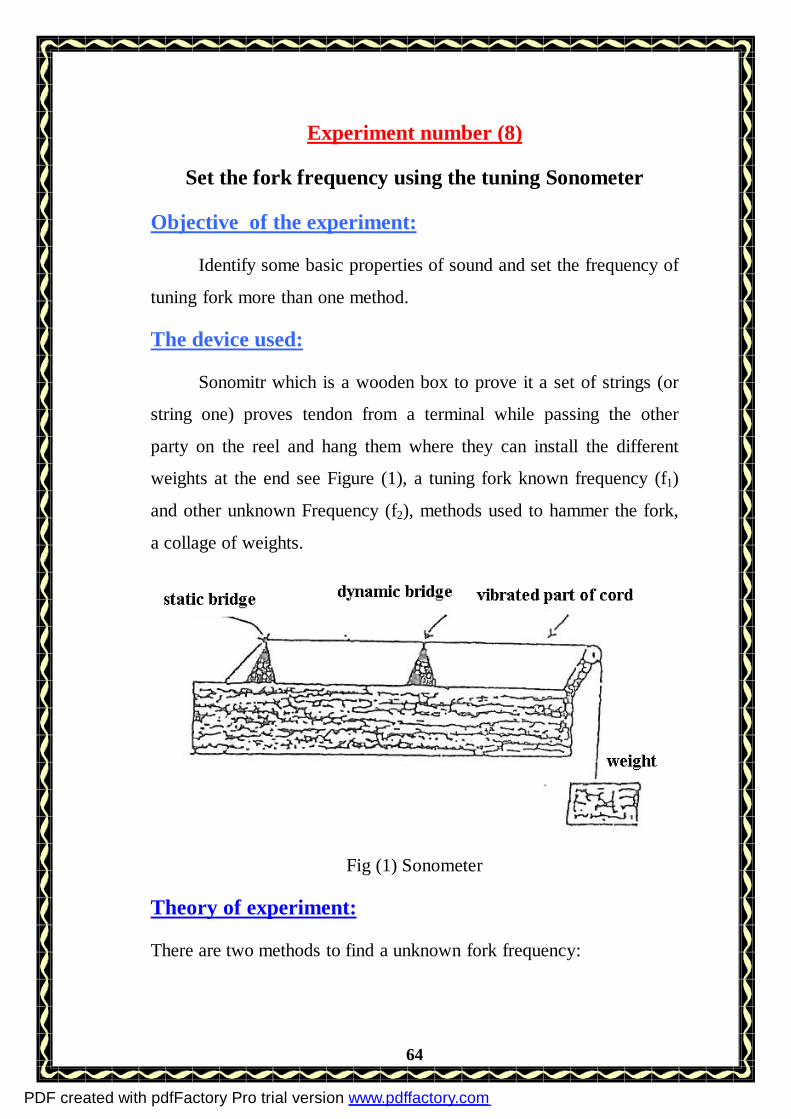
The device used:
Sonomitr which is a wooden box to prove it a set of strings (or
string one) proves tendon from a terminal while passing the other
party on the reel and hang them where they can install the different
weights at the end see Figure (1), a tuning fork known frequency (f1)
and other unknown Frequency (f2), methods used to hammer the fork,
a collage of weights.
Fig (1) Sonometer
Theory of experiment:
There are two methods to find a unknown fork frequency:
PDF created with pdfFactory Pro trial version www.pdffactory.com
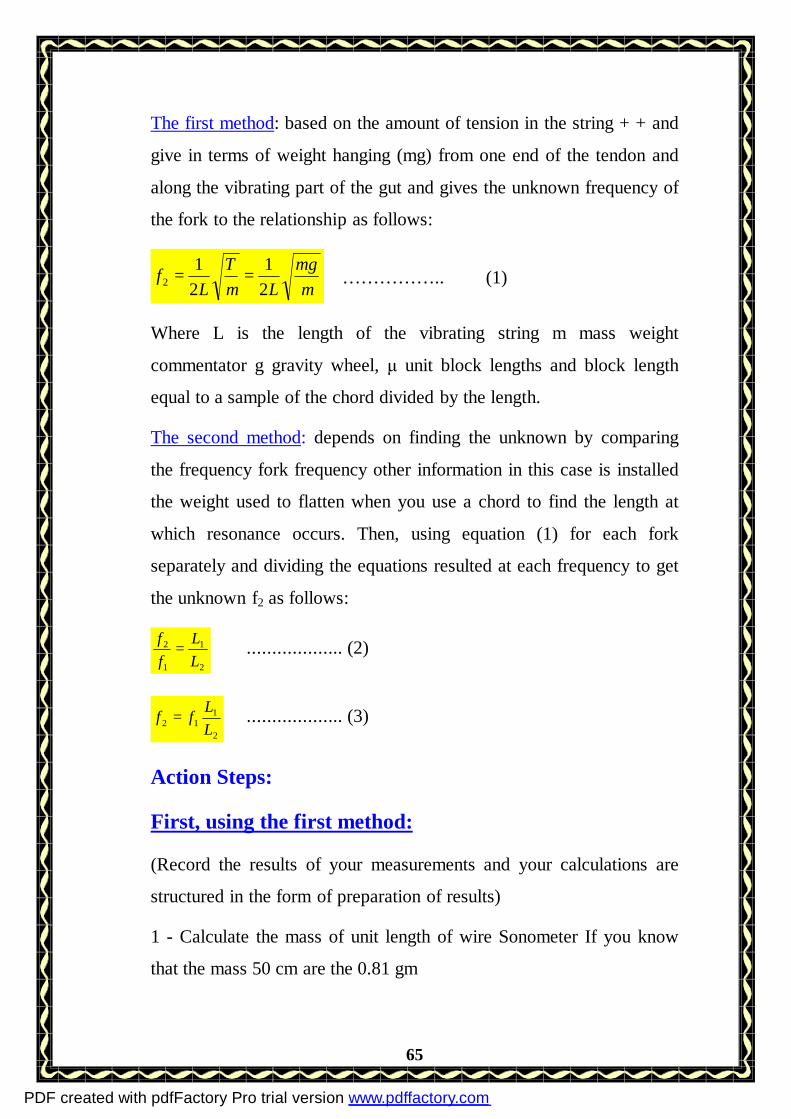
65
The first method: based on the amount of tension in the string + + and
give in terms of weight hanging (mg) from one end of the tendon and
along the vibrating part of the gut and gives the unknown frequency of
the fork to the relationship as follows:
µµmg
LT
Lf
21
21
2 == …………….. (1)
Where L is the length of the vibrating string m mass weight
commentator g gravity wheel, μ unit block lengths and block length
equal to a sample of the chord divided by the length.
The second method: depends on finding the unknown by comparing
the frequency fork frequency other information in this case is installed
the weight used to flatten when you use a chord to find the length at
which resonance occurs. Then, using equation (1) for each fork
separately and dividing the equations resulted at each frequency to get
the unknown f2 as follows:
2
1
1
2
LL
ff
= ................... (2)
2
112 L
Lff = ................... (3)
Action Steps:
First, using the first method:
(Record the results of your measurements and your calculations are
structured in the form of preparation of results)
1 - Calculate the mass of unit length of wire Sonometer If you know
that the mass 50 cm are the 0.81 gm
PDF created with pdfFactory Pro trial version www.pdffactory.com
66
2 - Place the heavier mass 2.5 kg at the end of the cuff tendon hanging
passengers put paper over the small gut (passenger and a small sheet
of tin or paper).
3 - Knocking fork attached and placed on Sonomitr near the gut,
without affecting them. Move the drawbridge to change the length of
the vibrating part of the gut so that the tone emitted by a similar tone
of the tuning fork in this case the string vibrates strongly and drops
passengers (This condition is called resonance).
4 - Measure the length of the vibrating part of the gut and repeat step
(3) three times by changing the position of the drawbridge and take
the best vibration (so make sure of the length + + has a resonance that
occurs).
5 - Record the value of string L in the mass and the amount of
outstanding m (which is about: the mass of gravity + mass balance) in
Table (1) in the form of the preparation of the results.
6 - Start weight loss by half a kilogram at a time. Repeat the steps
(3.4, 5) with all the weight and record the results in Table(1).
7 - I think every time the value of the unknown frequency f2 and using
the equation (1) and record the results of your calculating, then find
the average value of f2.
Second, using the second method:
1 - Choose a tuning fork with a low frequency f1 (a fork information.)
2 - Place the drawbridge over a considerable distance.
3 - Knocking tuning fork placed on the Sonomitr and is pending in the
block until you get the same tone fork (resonance case), where the
PDF created with pdfFactory Pro trial version www.pdffactory.com
67
paper and shaking down passengers. Record the value of mass m1 as
well as length L1.
4- Repeat the previous step twice and record your results in Table (2)
and the average length of the eye L1.
5- Install the previous block and take the second tuning fork
frequency unknown (f2) and Sonomiter placed on the drawbridge and
move until you get a case of ringing. Record length L2 to this case.
6 - applied equation (3) to calculate the frequency of fork unknown.
Then compare this result is the outcome of the previous method.
PDF created with pdfFactory Pro trial version www.pdffactory.com
68
Experiment number (9):
Use the spring to the achievement of Hooke's law and set
of the gravity.
The objective of the experiment:
- Achievement of Hooke's law
- To study of simple harmonic motion of the spring and set the wheel
of gravity.
The device used:
Sticky spiral spring wire ends vertically in a holder and the
other end hanging down the party and installed to read the scale index
of the vertical ruler mounted on the stand beside the spring, the
balance of the weight-bearing and are posted at the end of the hanging
party. Group weights. Stopwatch.
Theory of experiment:
Part One: Achieving the law Hook
When you suspend the weight of mass M at the end of spring we are
seeing in the elongation along the spring as a result of force caused by
the mass M This force gives the Newton's second law is: F = Mg
Where g is the gravity wheel. The units are force to either Newton or
Dane, depending on both the mass and the wheel (see this point in the
experiment 3).
Based on the law of Hook, the elongation of the spring incident (h)
original length Lo (see Figure 1) is directly proportional to the cluster
used M, we express this mathematically as:
PDF created with pdfFactory Pro trial version www.pdffactory.com
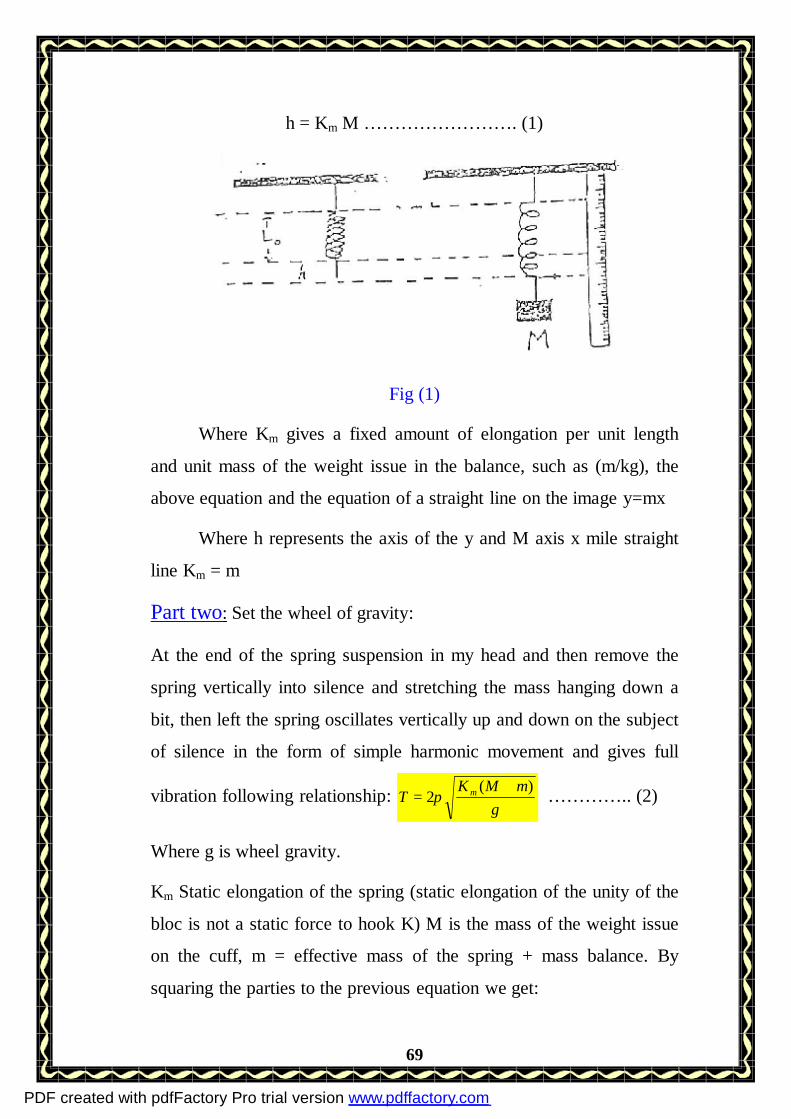
69
h = Km M ……………………. (1)
Fig (1)
Where Km gives a fixed amount of elongation per unit length
and unit mass of the weight issue in the balance, such as (m/kg), the
above equation and the equation of a straight line on the image y=mx
Where h represents the axis of the y and M axis x mile straight
line Km = m
Part two: Set the wheel of gravity:
At the end of the spring suspension in my head and then remove the
spring vertically into silence and stretching the mass hanging down a
bit, then left the spring oscillates vertically up and down on the subject
of silence in the form of simple harmonic movement and gives full
vibration following relationship: g
mMKT m )(
2+
= π ………….. (2)
Where g is wheel gravity.
Km Static elongation of the spring (static elongation of the unity of the
bloc is not a static force to hook K) M is the mass of the weight issue
on the cuff, m = effective mass of the spring + mass balance. By
squaring the parties to the previous equation we get:
PDF created with pdfFactory Pro trial version www.pdffactory.com

70
mg
KM
gK
T mm 222 44 ππ += ………….. (3)
Equation (3) is the equation of a straight line on the image y=mx+c
Inclination g
Km24π and the length of the lump from the axis of
antibiotics (axis T) mg
Km24π draw the relationship between mass M
(on the axis x) and the square of time league T2 (on the axis y) we get
a straight line (Figure 2) from which to infer the value of g.
Fig ( 2 )
Action Steps:
Part One: Achieving the law Hook
1 - I start reading the staging to take the vertical cursor to a party
when the balance of free weights.
2 - Place the weight in the balance mass 100gm staging a reading and
then calculate the amount of vertical elongation (h) resulting from the
PDF created with pdfFactory Pro trial version www.pdffactory.com
71
weight which is about the difference between my reading of staging
when the cuff-free, and after putting the weight. Scored both of the
mass M and elongation h resulting in a table (1).
3 - Add balance weights to the other with a gradual increase in weight
until you reach the weight of the mass 400 gm and each time record
both the mass and then read the staging elongation h generated each
time for the whole weight issue in the balance.
4 - such as the relationship between M and h on graph paper,
including plain and concluded that the value of fixed Km.
Part two: Set the wheel of gravity:
1 - Put on the balance weight mass 200gm, and then Pull the spring
down a little and let him and adjust a certain point pass by the Party,
conveyors (such as the cursor), then use the stopwatch to record time
of 20 frequencies is complete (total time) (Note that the frequency of
full is to pass the cursor that point twice in a row). This step requires
high accuracy in the follow-up.
2 - Calculate the time of one oscillation T (Periodic time) by dividing
the total time of the vibration frequencies on any number of 20.
Record the results of your measurements: the amount of mass M and
then the total time per time-frequency T in Table (2).
3 - Add gradually to the masses cuff five times (50gm or 20gm each
time) and repeat steps 1.2 time (enough to access the 350gm and
increased it until the spring does not lose its elasticity).
4 - Calculate the square of time T2 (ie T2) for each block and the
corresponding record in the results table.
PDF created with pdfFactory Pro trial version www.pdffactory.com

72
5 - Draw graphs the relationship between the T2, and M then created a
mile straight-line output, and it figured the amount of wheel gravity g
units MKS using the value of Km appointed in the first part.
6 - Calculate the amount of each of the absolute error and percentage
error in the value of g if you know that the correct value is: g= 9.8m/
sec2 or g = 980 cm / sec2.
7 - Concluded the value of effective mass of the spring from the
graph, explaining how it worked.
PDF created with pdfFactory Pro trial version www.pdffactory.com
73
Experiment number (10)
Measure the Young coefficient of the wire
The objective of the experiment:
Study of Longitudinal stress and strain to the longitudinal metal wire
and set the plants survived the substance of the wire.
The device used:
Consists of the device used in this method as in the form of (1) of the
two wires are long C , B of the same material held to vertically in the
level of a single one of them C so-called wire comparison and end
frame carries weight w stable enough to make it tight, and the other B
is a wire which will be the experiment and set the coefficient to be
spared him this wire end frame hanging by the balance weights can be
downloaded and installed them in different contexts the balance
between water B screw nail based on the micrometer screw is installed
in the wire (Spirit level) This is used to deduce the balance of
elongation in the wire as a result put weights on it. The micrometer is
used to measure the amount of the elongation (ΔL).
PDF created with pdfFactory Pro trial version www.pdffactory.com
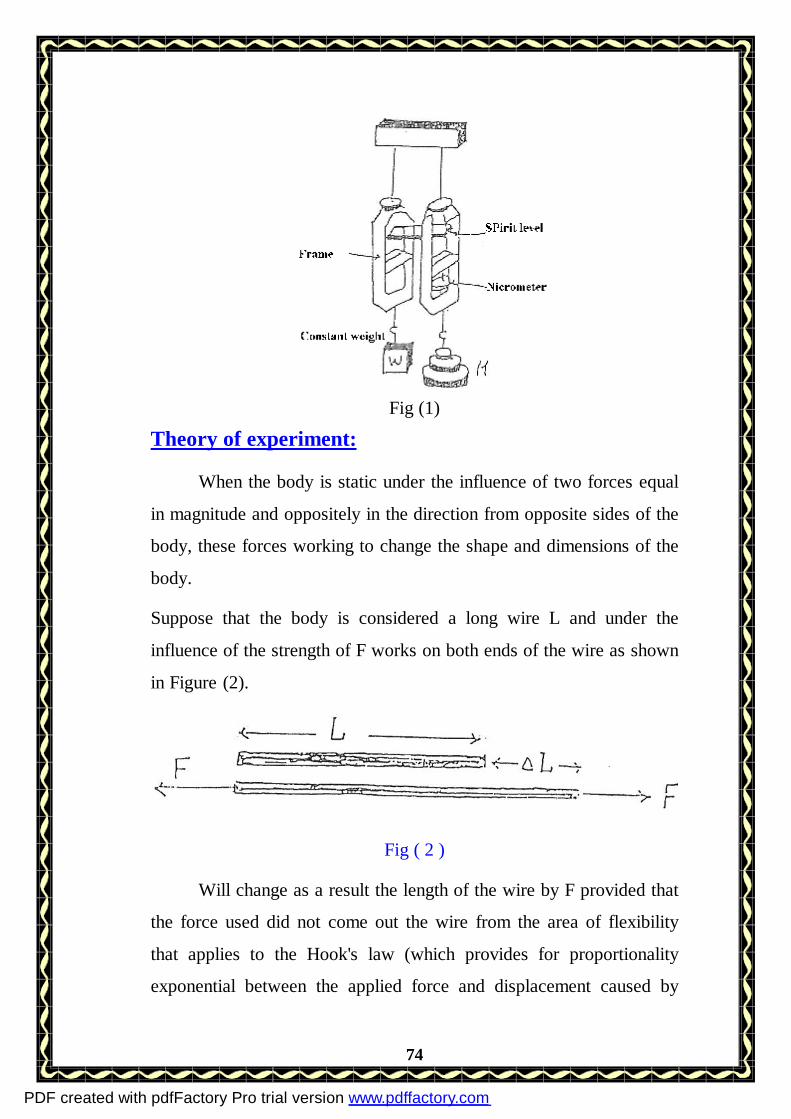
74
Fig (1)
Theory of experiment:
When the body is static under the influence of two forces equal
in magnitude and oppositely in the direction from opposite sides of the
body, these forces working to change the shape and dimensions of the
body.
Suppose that the body is considered a long wire L and under the
influence of the strength of F works on both ends of the wire as shown
in Figure (2).
Fig ( 2 )
Will change as a result the length of the wire by F provided that
the force used did not come out the wire from the area of flexibility
that applies to the Hook's law (which provides for proportionality
exponential between the applied force and displacement caused by
PDF created with pdfFactory Pro trial version www.pdffactory.com
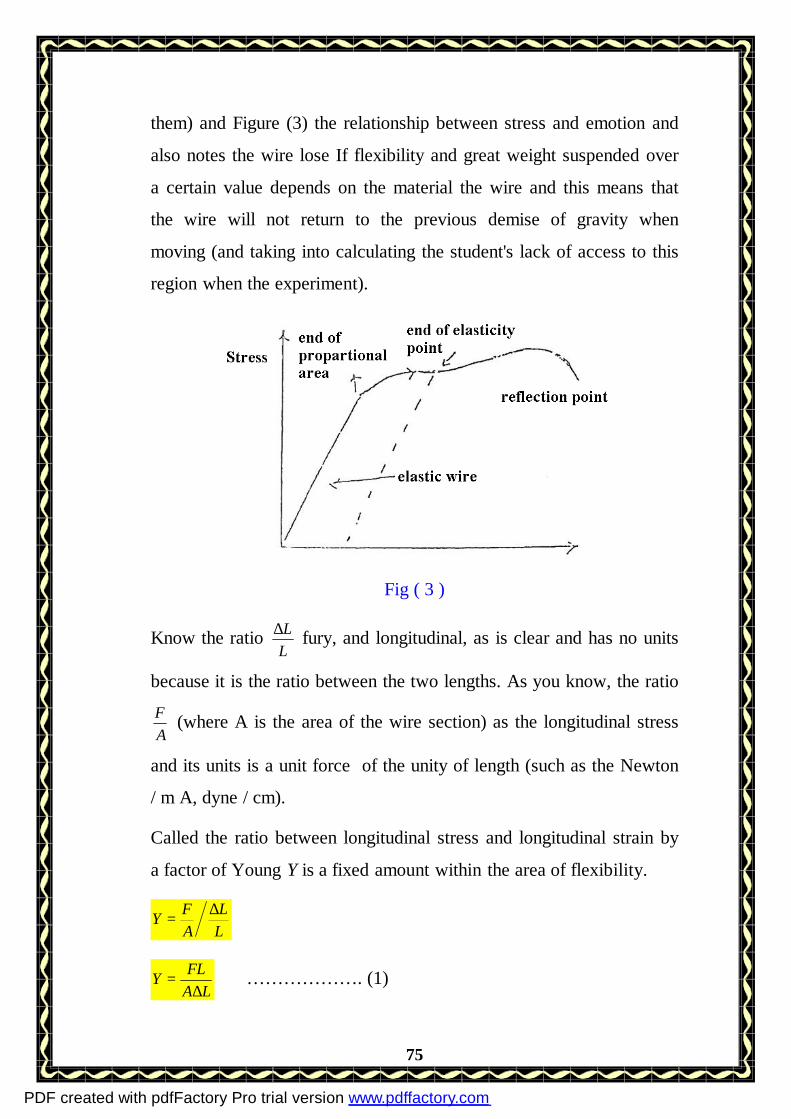
75
them) and Figure (3) the relationship between stress and emotion and
also notes the wire lose If flexibility and great weight suspended over
a certain value depends on the material the wire and this means that
the wire will not return to the previous demise of gravity when
moving (and taking into calculating the student's lack of access to this
region when the experiment).
Fig ( 3 )
Know the ratio LL∆ fury, and longitudinal, as is clear and has no units
because it is the ratio between the two lengths. As you know, the ratio
AF (where A is the area of the wire section) as the longitudinal stress
and its units is a unit force of the unity of length (such as the Newton
/ m A, dyne / cm).
Called the ratio between longitudinal stress and longitudinal strain by
a factor of Young Y is a fixed amount within the area of flexibility.
LL
AFY ∆
=
LAFLY∆
= ………………. (1)
PDF created with pdfFactory Pro trial version www.pdffactory.com
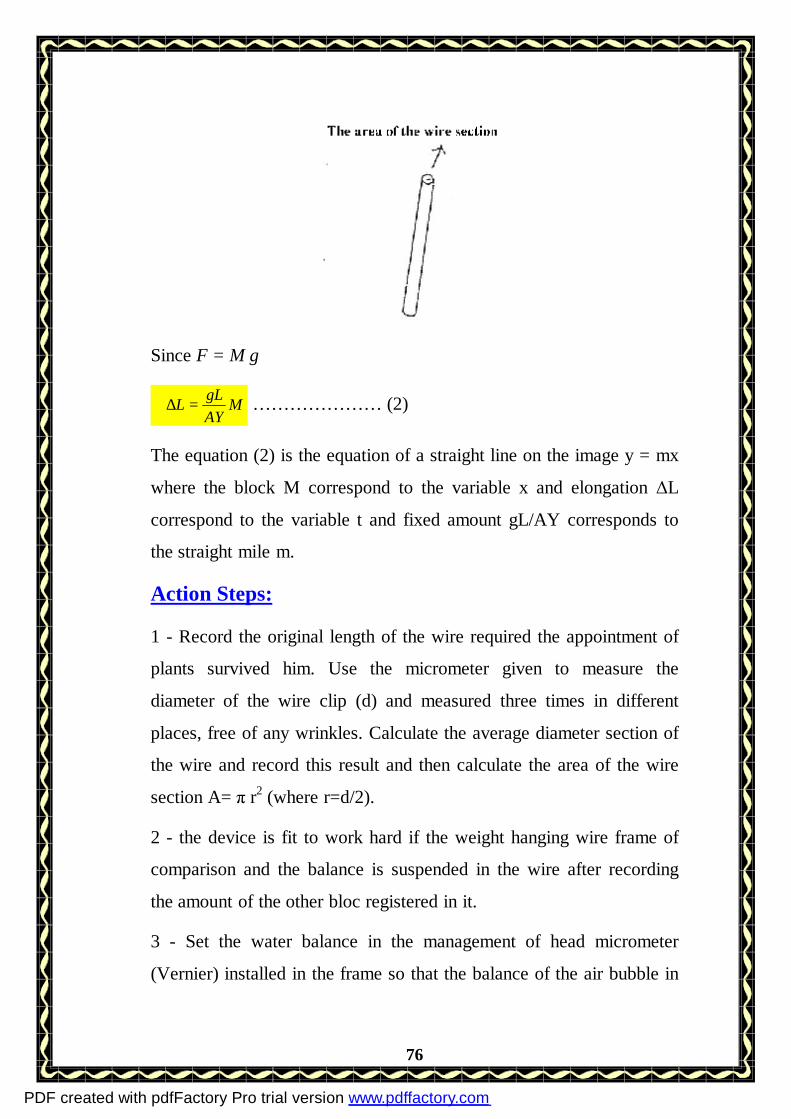
76
Since F = M g
MAYgLL =∆∴ ………………… (2)
The equation (2) is the equation of a straight line on the image y = mx
where the block M correspond to the variable x and elongation ΔL
correspond to the variable t and fixed amount gL/AY corresponds to
the straight mile m.
Action Steps:
1 - Record the original length of the wire required the appointment of
plants survived him. Use the micrometer given to measure the
diameter of the wire clip (d) and measured three times in different
places, free of any wrinkles. Calculate the average diameter section of
the wire and record this result and then calculate the area of the wire
section A= π r2 (where r=d/2).
2 - the device is fit to work hard if the weight hanging wire frame of
comparison and the balance is suspended in the wire after recording
the amount of the other bloc registered in it.
3 - Set the water balance in the management of head micrometer
(Vernier) installed in the frame so that the balance of the air bubble in
PDF created with pdfFactory Pro trial version www.pdffactory.com
77
the center and thus the balance in a horizontal position. Micrometer
reading log at this situation and this is the primary reading.
4 - begin by placing a block figures were 05 kg in the balance. Note
the disruption of the balance for balance and vertical position and the
side methods air bubble was prepared to put the balance of horizontal
management and vernier micrometer until you return to the center the
bubble once again record the micrometer reading as well as the value
of the mass M used in the results table. (Noted in some micrometers
attached to the device that the vernier scale is moving in the opposite
direction and the student pay attention to this point so he can take the
correct reading).
5 - Take the difference between this reading and the previous reading
of this before you put the weight The result is the elongation due to
gravity resulting from the development of mass 0.5 kg.
6 - Add to the cuff block again a 0.5 kg last, and then the water
balance to the vertical position and a reading micrometer at this
situation, then find the difference between this reading and reading the
immediately preceding (call this difference elongation progress δL),
combining this result with the previous result in the step (o) we get the
elongation resulting from the mass of 1 kg (call this the cumulative
elongation ΔL, note that the ΔL=δL in the previous step only when
you put the first of any weight.
7 - Add gradually to cuff 1/2 kg several times (no more than kg 3) and
each time repeat the previous step which created a first elongation
progress (the difference between the two readings of the two weights
consecutive) and elongation cumulative (a collection of elongation
PDF created with pdfFactory Pro trial version www.pdffactory.com
78
Interim) Record this value each time before mass corresponding
record your results in a table organized.
8 - Now, gradually decrease the weights 1/2 kg and every time the
balance was prepared to put it horizontal and a reading and then
figured Micrometer δL when you lose weight at a time and scored
against the corresponding cluster.
9 - After you lose all the weight, I think ΔL in the case of weight loss,
and scored every time the corresponding block.
10 - Calculate the average elongation incident ΔL (in the cases of
increase and decrease) for each corresponding block. Record the
results of your calculations in the table.
11 - Draw graphs the relationship between the ΔL & M If your
performance you will get a sound on a straight line a mile I think this
line and it concluded that the value of coefficient of Young Y.
Brother, a student do these additional steps and answer the
following questions (without the use of any of the supervisors within
the lab) that we welcome you to answer any question, but the day
before the experiment the performance of additional steps and answer
the questions you add three degrees stronger.
12 - avail the graph to find the incident elongation in the case of a
mass of comment 2.8 kg What is the value of emotion and stress in
this case?
13 - It is known that the elongation occurring in the wire the influence
of gravity caused by the job W on the wire is equal to the force acting
× distance this job represents the energy stored in the wire and you are
required to use the graph output with you in calculating the energy
PDF created with pdfFactory Pro trial version www.pdffactory.com

79
stored in the wire in the case of suspension of the cluster 2.8 kg,
explaining how it worked.
14 - Write a comment scientifically on your results and record your
own notes through your interaction with the experiment.
We suggest you to make a table like this to record your results in this
experiment.
Average
ΔL
In case of decrease in the case of increase
M(kgm) Cumulative
ΔL
Interim
δL Reading
Cumulative
ΔL
Interim
δL Reading
0
0.5
1
1.5
---
PDF created with pdfFactory Pro trial version www.pdffactory.com
80
Experiment number (11)
Study of the body fall through the viscous medium.
Objective of the experiment:
Set the viscosity coefficient of a liquid using a drop balls (Stokes
method).
Devices used:
Of the glass tube of length ( 100 to 150 m) closed from one end,
micrometers, an hour off a set of balls of different diameters, a ruler.
Theory of experiment:
According to Stokes law, when the fall of a small ball of radius
η through the inner viscous coefficient .. His wife V they gain
terminal velocity F, resulting in a force for wife F provides as follows:
F = 6 π η r v ………………… (1)
Viscosity and the strength of this work to impede the fall of the
ball any direction to be up and directly proportional to the radius of
each ball r and the final speed v.
There are other forces affecting the ball landing in the liquid:
A - push the liquid to the top of the ball (the buoyant force Buoyant
force B) is the weight of the volume of liquid mood.
grB σπ 3
34
= ………………… (2)
Where the density of the liquid (σ = 1.262 gm / cm 3) g wheel gravity.
B - the weight of the ball to the bottom:
PDF created with pdfFactory Pro trial version www.pdffactory.com
81
pgrmg 3
34 π= ………………… (3)
(Where is the density of material p = 7.87 gm / cm3 ball)
At the beginning of the fall of the ball in the liquid, the speed of the
impact of increasing weight and the greater the speed increase of
liquid's resistance to movement of the ball to equalize the weight of
the ball to the bottom of my strength to the total viscosity and
buoyancy to the top to prove the speed and start the ball falling at a
constant speed is called as soon as the final (Terminal velocity) .
FBmg +=
rvgrpgr πησππ 634
34 33 +=
2
9)( rpgv
ησ−=
2
18)( dpgv
ησ−= ………………… (3)
Where d is the diameter of the ball (d= 2r)
Equation (4) is the equation of a straight line on the image y=mx
where the variable x offset d2 and variable y offset v and inclination.
ησ
18)( −= pgm
Action Steps:
1 - Place two marks on the glass tube and measure the distance
between them (and to ensure that the final speed, the higher the mark
should be a method from the surface of the liquid by at least 'n 10 cm).
PDF created with pdfFactory Pro trial version www.pdffactory.com

82
2 - Measure the diameter d+ one of the balls by micrometer and then
drop in the tube and by stopwatch record the time required to cut the
distance between the brands and knowledge of distance and time I
think the speed of the ball v.
3 - Repeat step (2) using balls of different countries and each time
created by d & v.
4 - Calculate the values of d2, and then draw a relationship between
the v & d2 graphic chart and calculate the resulting tendency rectum
and from the concluded value of coefficient of viscosity η.
5 - Calculate the percentage error in the amount of your score if you
know that glycerin is a liquid and given the correct value for the
coefficient of viscosity is a 0.629 N/m2.
==============================================
Dear student, system was used units MKS (m kg s) in your
measurements and your calculating, you are a personal and expensive
units correct in every step necessary and the neglect of writing units
lead to the resolution of degrees.
PDF created with pdfFactory Pro trial version www.pdffactory.com
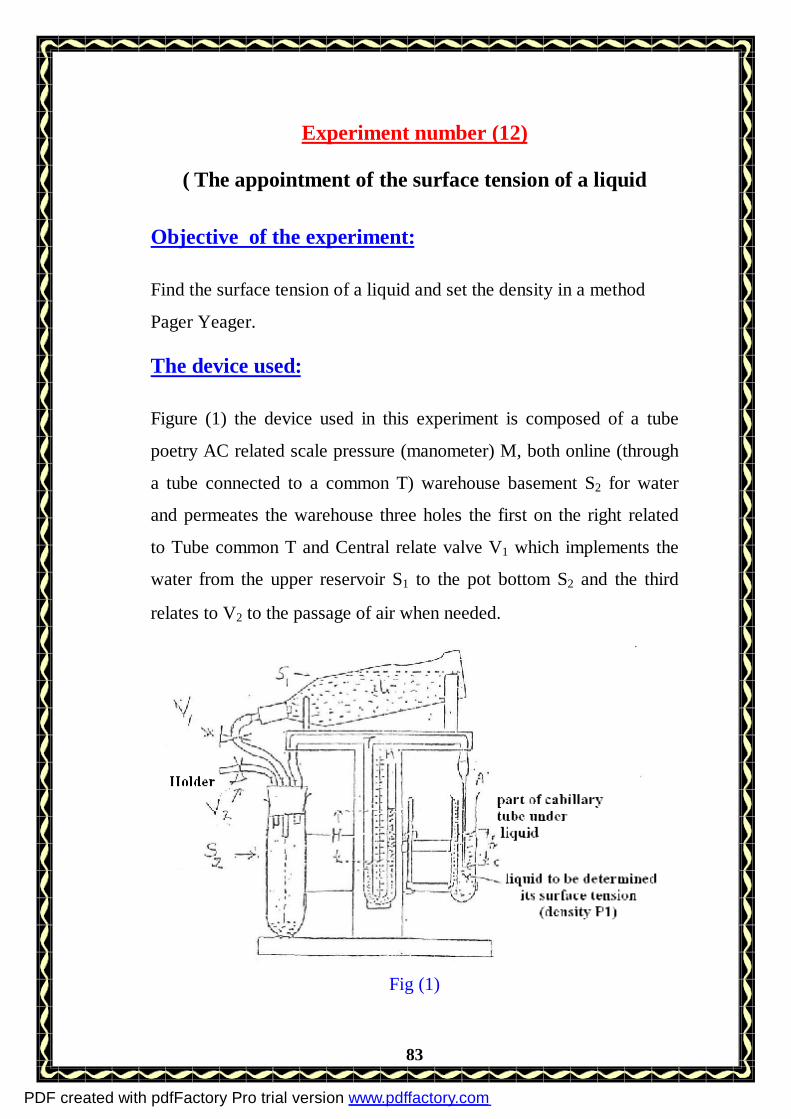
83
Experiment number (12)
( The appointment of the surface tension of a liquid
Objective of the experiment:
Find the surface tension of a liquid and set the density in a method
Pager Yeager.
The device used:
Figure (1) the device used in this experiment is composed of a tube
poetry AC related scale pressure (manometer) M, both online (through
a tube connected to a common T) warehouse basement S2 for water
and permeates the warehouse three holes the first on the right related
to Tube common T and Central relate valve V1 which implements the
water from the upper reservoir S1 to the pot bottom S2 and the third
relates to V2 to the passage of air when needed.
Fig (1)
PDF created with pdfFactory Pro trial version www.pdffactory.com

84
Theory of experiment:
Surface tension is known as an influential force in the direction
perpendicular to the unit length of the liquid surface and gives the
relationship 1F
=γ …………. (1)
Where γ is the surface tension F vertical force on the surface of the
liquid L along the surface of the liquid.
If a bubble formed within the means of increasing the pressure inside
the bubble equals the pressure outside the )2(rγ , where r the radius of
the bubble.
And use the Pager (Yeager) this relationship in the appointment of the
surface tension of a liquid when opening the valve V1 gradually
implemented water from the reservoir top S1 to the repository S2 to
increase the air pressure in the pot S2 slowly and formed a bubble of
air at the tip of the tube poetry AC submerged in the liquid and the
greater the pressure increased the size of the bubble until it reaches the
radius to the radius of the capillary tube, the bubble by Tube, and be
reading manometer M in a maximum before the moment of the
separation bubble at that moment is:
=Pressure inside the bubble, the pressure outside.
Pressure inside the bubble = P+P1g h + rγ2 …….. (2)
PDF created with pdfFactory Pro trial version www.pdffactory.com
85
Where P is the atmospheric pressure, P1 density of the liquid surface
tension to be set h along the submerged part of the capillary tube into
the liquid.
Pressure outside the bubble = P + P2 gH ………….. (3)
Where P2 density of liquid manometer H & M maximum height
between the surface of this liquid in the manometer.
Of equal pressure within and outside the bubble, we get:
22
1 2ργ
ρρ
rghH += …………….. (4)
This equation is the equation of a straight line on the image y=mx+c
And the length of the axis of the lump y is 2
2ργ
rgc =
And the design of the relationship between h and H get a straight line
and the slope and part of the axis of the lump P1 can be inferred
density of the liquid P1 and the value of surface tension y.
Important Note:
The student is responsible for writing the correct units .. The student
of accuracy in the investigation and the integrity of what is written in
all seriousness it requires, including the axes of the graph, his book
code variable on each axis is accompanied by mentioning the unit
right next to him in parentheses and student to forget it or neglect.
PDF created with pdfFactory Pro trial version www.pdffactory.com

![[5365]-11 MBA 101](https://static.fdokumen.com/doc/165x107/6322631aae0f5e819105deed/5365-11-mba-101.jpg)