Movement trajectory classification using supervised machine ...
Upload
khangminh22Category
view
4download
0
i
Gene Ontology Semi-supervised Clustering for Prediction of
Genes Functions
By
Animesh Kumar Paul
Roll No: 1607507
A thesis submitted in partial fulfillment of the requirements for the degree of
Master of Science in Computer Science and Engineering
Department of Computer Science and Engineering
Khulna University of Engineering & Technology
Khulna 9203, Bangladesh
February, 2018

ii
Declaration
This is to certify that the thesis work entitled “Gene Ontology Semi-supervised
Clustering for Prediction of Genes Functions” has been carried out by Animesh
Kumar Paul in the Department of Computer Science and Engineering (CSE),
Khulna University of Engineering & Technology (KUET), Khulna, Bangladesh.
The above thesis work or any part of this work has not been submitted anywhere
for the award of any degree or diploma.
Signature of Supervisor Signature of Candidate

iii
Approval
This is to certify that the thesis work submitted by Animesh Kumar Paul entitled
“Gene Ontology Semi-supervised Clustering for Prediction of Genes Functions”
has been approved by the board of examiners for the partial fulfillment of the
requirements for the degree of Master of Science in Computer Science &
Engineering in the Department of Computer Science and Engineering, Khulna
University of Engineering & Technology, Khulna, Bangladesh in February, 2018.
BOARD OF EXAMINERS
1.
_______________________
Dr. Pintu Chandra Shill
Professor, Department of Computer Science and Engineering
Khulna University of Engineering & Technology, Khulna
Chairman
(Supervisor)
2.
_______________________
Head of the Department
Department of Computer Science and Engineering
Khulna University of Engineering & Technology, Khulna
Member
3.
_______________________
Dr. M. M. A. Hashem
Professor, Department of Computer Science and Engineering
Khulna University of Engineering & Technology, Khulna
Member
4.
_______________________
Dr. Muhammad Aminul Haque Akhand
Professor, Department of Computer Science and Engineering
Khulna University of Engineering & Technology, Khulna
Member
5.
_______________________
Dr. Rameswar Debnath
Professor, Department of Computer Science and Engineering
Khulna University
Member
(External)
iv
Acknowledgment
All the praise to the almighty God, whose blessing helped me to complete this thesis
work successfully. I show significant and indescribable gratefulness to my
supervisor Dr. Pintu Chandra Shill, Professor, Department of Computer Science
and Engineering, Khulna University of Engineering & Technology for his
outstanding, helpful contribution in giving suggestion and encouragement. I
acknowledge his constant co-operation and proper guidance throughout the
development process. He has been an excellent source of practical and feasible
ideas, profound knowledge and all-time feedback for me.
I thank all the teachers of the Department of Computer Science and Engineering
who helped me providing guidelines to perform the work. I would also like to thank
my friends and family for their cordial support.
Author
v
Abstract
Different products of gene expression work together in a cell for each living
organism to achieve different biological processes. Many proteins play different
roles depending on the environment of the organism for the functioning of a cell.
Usually, most conventional methods are not able to analyze the functions of the
genes biologically. In this thesis, we propose a gene ontology (GO) annotation
based semi-supervised clustering algorithm called GO Fuzzy relational clustering
(GO-FRC). In GO-FRC, one gene is allowed to be assigned to multiple clusters,
and that is biologically relevant to the behavior of gene. In the clustering process,
GO-FRC utilizes the useful biological knowledge, which is available in the form of
a Gene Ontology, as a prior knowledge along with the gene expression data. The
prior knowledge helps to improve the coherence of the groups concerning the
knowledge field. The proposed GO-FRC has been tested on the two yeast
(Saccharomyces cerevisiae) expression profiles datasets (Eisen and Dream 5 yeast
datasets) and has compared with other state-of-the-art clustering algorithms.
Experimental results imply that GO-FRC can produce more biologically relevant
clusters with the use of the small amount of GO annotations.
vi
Contents
PAGE
Title Page
Declaration
Approval
Acknowledgment
Abstract
Contents
List of Tables
List of Figures
List of Algorithms
i
ii
iii
iv
v
vi
viii
ix
x
CHAPTER I Introduction 1
1.1 Background
1.2 Problem Statement
1.3 Objectives
1.4 Methodology
1.5 Scope of the Thesis
1.6 Contribution of the Thesis
1.7 Organization of the Thesis
1
1
2
2
3
3
3
CHAPTER II Literature Review 5
2.1 Introduction
2.2 Related Work
5
13
CHAPTER III Go Annotations Based Fuzzy Relational Clustering 8
3.1 Introduction
3.2 Collect GO Slim Biological Process Term
3.3 GO Annotations based Fuzzy Relational Clustering Algorithm
3.3.1 Incorporating Gene Annotations to Fuzzy Relational Clustering
3.4 Conclusions
8
9
10
11
18
CHAPTER IV Simulation Results and Discussions 19
4.1 Introduction
4.2 Quality Assurance of Clusters
4.3 Comparative Analysis
4.4 Prediction of Function
19
20
22
23
vii
4.5 Result Analysis and Discussion
4.6 Conclusions
25
28
CHAPTER V Conclusions and Discussions 29
5.1 Conclusions 29
REFERENCES 30
APPENDICES
Appendix A Gene Ontology Consortium 37
Appendix B GO Annotations 38
Appendix C Evidence Codes 39
Appendix D ClusterJudge 40
Appendix E BioGRID 41

viii
LIST OF TABLES
Table No. Description Page
3.1
3.2
4.1
4.2
4.3
4.4
4.5
4.6
Supporting Degree of each evidence code
GOSlim Biological Process Terms prescribed by Saccharomyces
Genome Database
Validity of the clusters for different values of α and β for Eisen yeast
dataset
Validity of the clusters for different values of α and β for Dream 5
yeast dataset
Comparative Analysis of GO-FRC with other existing methods
using Eisen and Dream 5 yeast datasets
Number of genes with unknown function for Eisen yeast dataset (β =
0.5, α = 0.3)
Number of genes with unknown functions for Dream 5 Yeast dataset
(β = 0.1, α = 0.1)
Correct gene functions prediction using GO-FRC that are validated
by the annotation information from latest GO
11
11
19
20
21
25
25
26
ix
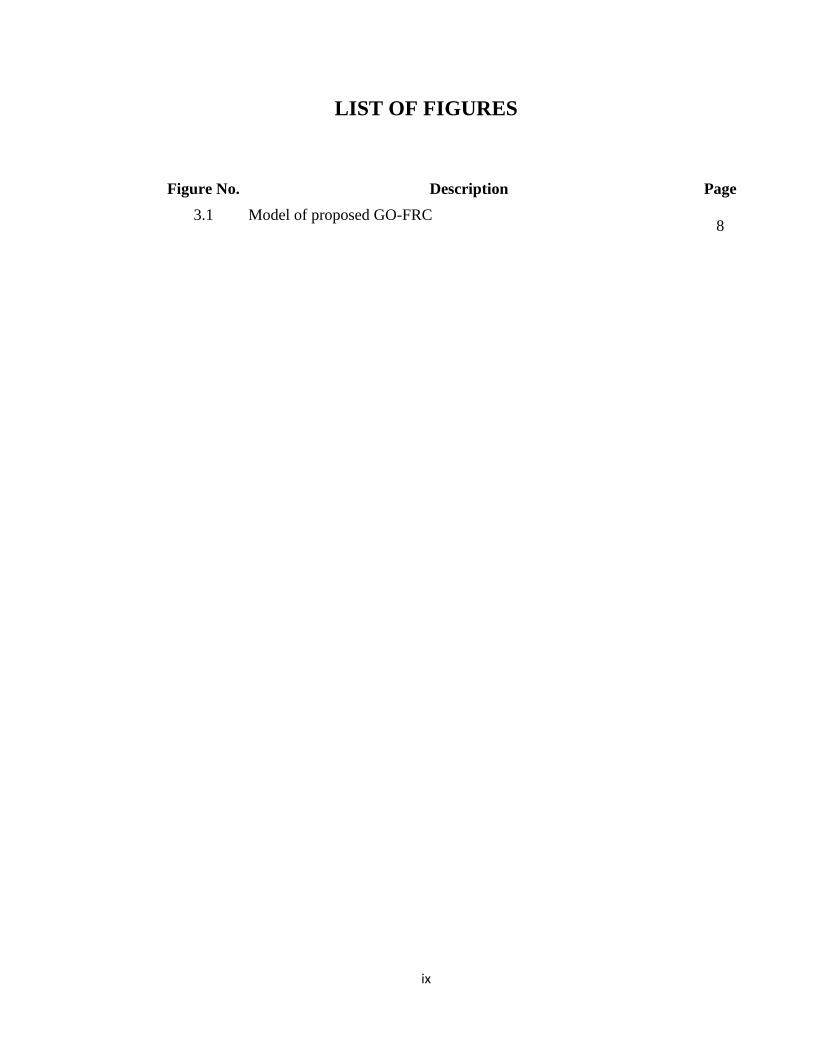
LIST OF FIGURES
Figure No. Description Page
3.1
Model of proposed GO-FRC
8
x
LIST OF ALGORITHMS
Algorithm
No.
Description Page
1 Standard Fuzzy Relational Clustering (FRC) 15
2 GO annotations based Fuzzy Relational Clustering (Go-FRC) 16
1
CHAPTER I
Introduction
1.1 Background
High-throughput microarray technology [1] generates vast amounts of gene
expression data under a variety of conditions [2, 3, 4] for numerous living
organisms. This technology provides an effective platform for systematically
analyzing the biological systems to obtain the underlying information about the
functionality and organization of the cell. In a view to understanding the functions
of cells, we need to investigate the behavior of the genes in a holistic manner [5, 6,
7, 8] rather than in an individual manner. Clustering is the most common approach
to analyzing the gene expression data by considering a large number of genes and
the high complexity of biological networks [9, 10, 11, 12]. In the recent works, the
authors have used different clustering methods like k-means, FCM and moreover,
some of them incorporated the biological information to these types of clustering
methods. The recent works depict that the methods without the previous biological
knowledge are unable to give biological relevant clustering process.
1.2 Problem Statement
Conventional clustering methods such as k-means [13, 14] and hierarchical [1, 15,
16, 17] are commonly used for the analysis of microarray data. These types of
conventional clustering algorithms assign each gene to one cluster only [18] and
these methods not capable of assigning a gene to multiple clusters. Because these
conventional methods work based on the Boolean logic. We would like to point out
that, in the biological system, gene products are associated with various biological
functions, and these genes are coregulated in various forms under various
environmental states. So the processes of assigning each gene into one cluster by
these conventional methods are not biologically relevant. Therefore, a relational
2
clustering algorithm is required and time demanding to assign each gene/gene
products into different cluster referred to as biological functions.
1.3 Objectives
The key objective of this work is to find the functions of the genes and their
involvement into the organism. This general objective can be divided into the
following specific ones:
To enhance the fuzzy relational clustering by introducing the prior
knowledge into it and investigate the incorporation of the gene annotation
to modified fuzzy relational clustering for finding the roles of the genes
which are involved depending on the environment of the organism.
To predict functions of the genes.
To compare the performance with other prominent methods on the
Saccharomyces cerevisiae dataset to identify the effectiveness of a method
for analyzing the gene expression profiles.
1.4 Methodology
Fuzzy relational clustering algorithm (FRC) based on Gene Ontology called GO-
FRC is proposed to generate the biological relevant clustering from the different
datasets. The GO-FRC method integrates the Gene Ontology information and fuzzy
relational clustering to find the number of clusters through Go slim terms and then
partitions the whole given dataset to produce the most biologically relevant clusters.
Here, two well-known cluster validity indices, cohesion, and separation are used in
the process of the clustering where cohesion is for evaluating the cluster
homogeneity and separation means quantifying the separation between different
clusters. Finally, the proposed method is compared with other existing method
using Z-score value which is calculated through the Clusterjudge.

3
1.5 Scope of the Thesis
This study focuses on clustering the microarray gene expression data. The proposed
method uses the GO annotations as prior knowledge for assigning initial clusters to
generate consistent clusters. This clustering can help to disclose the unknown
functions of the genes. The researcher limited this research to use only those data
for which the Gene annotation and GO slim terms are available. Here, we have used
yeast GOSlim terms, but the model can work on any kind of extended version of
GOSlim terms as prior knowledge. Along with the budding yeast, the proposed
system can be used to organisms. The constraint of this proposed technique is that
we need to determine a parameter of the clustering process experimentally.
1.6 Contributions
The major contributions of this research topic are –
Incorporate the GO annotation information into Fuzzy relational clustering
method.
Decrease the dependency on the prior knowledge of the number of clusters.
Produce more biological relevant clustering results compare to others who
don’t use domain knowledge
Produce the consistent clustering results for the multiple runs.
Predict the functions of the genes.
1.7 Organization of the thesis
The rest of this thesis is organized as follows:
Chapter II presents some of the existing prominent data clustering schemes
while focusing on their limitations. It also includes alluring benefits of data
clustering by the proposed method.
Chapter III presents the proposed system named GO-FRC and describes
its working procedure in detail. It then describes the fuzzy relational
clustering algorithm in detail. It also describes the objective functions used
in our proposed method. This chapter also includes a description of Gene

4
Ontology. It also describes the evaluation function used for evaluating the
clusters.
Chapter IV shows the experimental results of the proposed method on
microarray gene expression datasets. Here it demonstrates the improved
performance of GO-FRC in comparison with clustering approaches.
Chapter V lists the concluding remarks gathered from experiments.
The appendices are presented afterward.

5
CHAPTER II
Literature Review
2.1 Introduction
This chapter describes some related works based on clustering to analysis the
microarray data. The limitations of these methods are also mentioned here.
Additionally, this chapter also presents how the limitations of the existing methods
are overcame by the proposed method.
2.2 Related work
High-throughput microarray technology [1] generates vast amounts of gene
expression data under a variety of conditions [2, 3, 4] for numerous living
organisms. This technology provides an effective platform for systematically
analyzing the biological systems to obtain the underlying information about the
functionality and organization of the cell. In a view to understanding the functions
of cells, we need to investigate the behavior of the genes in a holistic manner [5, 6,
7, 8] rather than in an individual manner. Clustering is the most common approach
to analyzing the gene expression data by considering a large number of genes and
the high complexity of biological networks [9, 10, 11, 12].
Conventional clustering methods such as k-means [13, 14] and hierarchical [1, 15,
16, 17] are commonly used for the analysis of microarray data. These types of
conventional clustering algorithms assign each gene to one cluster only [18] and
these methods not capable of assigning a gene to multiple clusters. Because these
conventional methods work by Boolean logic. We would like to point out that, in
the biological system, gene products are associated with various biological
functions, and these genes are coregulated in various forms under various
environmental states. So the processes of assigning each gene into one cluster by

6
these conventional methods are not biologically relevant. For this reason, a multi-
valued clustering algorithm is necessary and time demanding that can be capable
of assigning the genes into different clusters.
Some noteworthy research works have been conducted for the clustering process.
Ayad et al. [19] introduced cluster ensemble approach based on relabeling and
voting technique. In their method, general voting-based consensus clustering refers
to a distinct class of consensus methods in which the cluster label mismatch
problem is explicitly addressed. Their method illustrates that the performance of
data clustering is improved by combining the results of several clustering
algorithms. Cui et al. [20] then applied the Low-Rank Representation (LRR) model
to identify the functional interaction between genes. Besides this methods can
generate gene clusters in which one gene can be assigned to multiple clusters, from
microarray data. Jamous et al. introduce a clustering method called binarization of
consensus partition matrix (Bi-CoPaM) [21] based on the tunable binarization that
can identify functionally active sequences from microarray datasets. Bi-CoPaM
allows one gene to be assigned to different clusters which help to identify the gene
clusters from the microarray gene expression data. But Bi-CoPaM limits the gene
to be assigned to any of the clusters, so it is unable to make any prediction of their
properties for the further analysis of these unassigned genes. These consensus
clustering methods selected the number of clusters randomly initially for generating
the different clustering results and do not incorporate any previous biological
knowledge like Gene Ontology for the ensemble clustering process.
Fuzzy c-means (FCM) [22, 23, 24, 25, 26] is used to represent the relationships
between the genes. FCM allows each gene to be a member of each cluster using a
membership value that denotes the degree of strength of membership to clusters by
the similarity between the gene expression data and each cluster’s properties. In
FCM, genes can be assigned to multiple clusters which genes are involved in
different type of coregulation process. To add more advantages to FCM, authors
incorporated other ideas to FCM and proposed a hybrid system such as FuzzySOM
[27] and Fuzzy J-means [28]. Fuzzy J-means considers the local minima problem

7
for cluster solutions and for solving this problem, it used variable neighborhood
searching. FuzzySOM [27] adds the idea of self-organizing maps(SOM) [29, 30] to
FCM for arraying the cluster centroids into the low-dimensional grid. Although all
of these variations of FCM clustering method help to get a more accurate
representation of the clusters, these methods suffer from the same basic limitations,
i.e., using random memberships assignment for each gene as an initial stage. In
multiple runs of the clustering process for the same dataset, the clustering process
generates inconsistent results due to the use of different initial membership values,
so finally, we don’t get identical clusters set. For extenuating this limitation, Eisen
and Gasch [26] incorporating principle component analysis (PCA) to FCM for
identifying the seeding prototype centroids.
The generated clusters are needed to be assigned to relevant biological processes
based on the biological knowledge. For this purpose, GO annotations [31] are the
best choice. These GO annotations are incorporated with different methods for the
analysis of gene microarray data. Cheng et al. [32] used a graph based GO structure
for calculating the gene similarity to find the gene cluster. GO hierarchical is also
merged into the hierarchical subspace clustering process [33]. Fang et al. [34] allow
genes to be assigned to already known biological processes by utilizing the
knowledge of GO annotations. Huang et al. [35] used GO annotations with the K-
medoids algorithm, and here it allows unknown genes to be assigned to clusters
which contain the genes with known functions but it doesn’t allow known
functional genes to other functional clusters. In the work of Brameier et al. [36],
the co-clustering algorithm used to cluster yeast genes based on the microarray
expression profiles and GO annotations, and it used random assignment of the
membership values for genes, so we don’t get the same final clustering result for
the multiple runs of the clustering algorithm. The model-based clustering method
is proposed by Pan et al. [37] using the GO annotations as prior probabilities.
Nepomuceno et al. [38] integrate GO annotation information into biclustering
process to evaluate the quality of the clusters. It takes GO annotation, microarray
expression matrix, the number of clusters as the input values.

8
CHAPTER III
Go Annotations Based Fuzzy Relational Clustering
3.1 Introduction
This chapter described the concept, working principle of the proposed gene
ontology-based clustering algorithm (GO-FRC) as depicted in Fig. 4.1, which can
disclose the functions of the genes. The rest of the chapter gives the details of the
GO-FRC method step by step.
Generate Initial
Membership Values for
each gene based on the
GO annotations
Use GO Slim
Biological terms to
determine the cluster
numbers
Generate the Pairwise
Similarity Matrix using
Euclidean Distance
Compute the
likelihoods in the
Expectation Step using
previously generated
initial membership
values
7. Complete the
Maximization Step
based on the new
membership values
Calculate new
membership values
using likelihoods
Final clustering result
in form of membership
values
Measure the
performance using
ClusterJudge tool
Generate resultant
cluster file using
defined threshold
Pass Pairwise
Similarity matrix, the
initial membership
values and the number
of clusters
1
3
2
4
5
6
7
8
9
Fig. 3.1 Model of proposed GO-FRC

9
3.2 Collect GO Slim Biological Process Term
With the advent of the high-throughput technologies [40] such as DNA microarray,
a sharp increase in functional data is found as a result of it. Experimental biologists
found difficulty in extracting the important biological knowledge amidst the
enthusiastic investigations into the tortuous gene expression data. It elicits the need
for pertinent tools that help to accumulate reliable biological knowledge about
genes and gene products. Gene ontology is such relevant tool which helps to
maintain the well-organized biological knowledge and also fosters the
advancement of several biomedical and biological applications [41, 42].
The Gene Ontology (GO) [31, 42] provides a set of expert-curated with
hierarchically structured [43], precisely defined, controlled, and organism-
independent vocabularies of terms of the functional annotation [44] of different
model organisms to depict biomolecules or gene products in three aspects
(biological process, molecular function, and cellular component). The biological
process ontology represents collections of processes such as chemical reactions or
other events performed by the different order of molecular functions. The molecular
function ontology represents molecular level activities such as catalytic or binding.
The cellular component ontology represents the locations in the levels of sub-
cellular structures and macromolecular complexes from large structures such as the
nucleus to smaller structures such as a protein complex [45]. Each ontology is
engineered as a Directed Acyclic Graph (DAG) [42] hierarchy of terms. There
contains parents-child relationships [46] between the terms and a term can have
more than one parent.
The biological roles of gene products are annotated as GO annotation by the expert-
curators based on their specialized ideas on the different organism. An evidence
code is placed with each annotation for providing the general idea of what the type
of confidence/support level [41] is used for each annotation. Each ontology
contains an overwhelmingly large amount of controlled vocabularies, but
sometimes such amount of details about the gene products can complicate the
process of getting concise knowledge of the genes such as discovering the genes’

10
general functions. Recognizing such needs, a set of general GO terms is provided
the GO Consortium, which is referred to as GO slims [47] for various organisms.
Domain experts are manually picked these terms for mapping all the major
relationships of specific domains.
Here, we collected the GO slim biological process terms which are defined by
Saccharomyces Genome Database [48]. These terms are used to get the broad
overview of the functions of genes. Within an ontology, parent-child relationships
exist between the terms where each node can give rise to various numbers of GO
terms, and these terms, in turn, give rise to other terms or annotated genes as their
leaves, respectively. So, we can say that almost similar genes contain same parents
mean if two genes are annotated to two distinct GO terms but if both of them are
descendants of a GOSlim term, then two genes are similar to each other. So, a
GOSlim term and its descendants can form a cluster. Using this concept, the initial
cluster is formed by assigning similar genes annotated to the corresponding
GOSlim term.
3.3 GO Annotations based Fuzzy Relational Clustering Algorithm
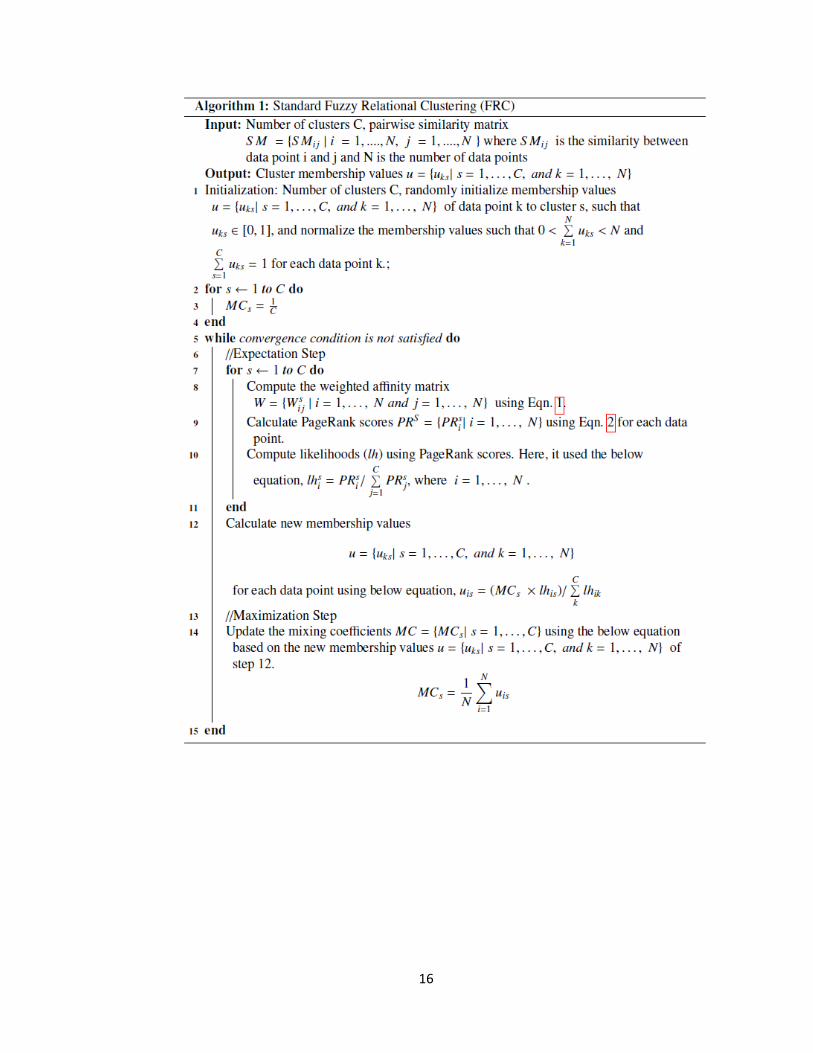
In our proposed method, we have modified the Fuzzy Relational Clustering (FRC)
algorithm [39]. The original FRC calculates the PageRank score for each object in
each cluster to measure the centrality of each cluster. This algorithm works in two
steps: firstly, Expectation Step and then Maximization step, aiming to optimize the
cluster membership values and mixing coefficients. For performing these two steps,
it requires a pairwise similarity matrix SM = {S Mij | i = 1,..., N, j = 1,..., N } where
SMij is the similarity between data point i and j and N is the number of data points.
It takes the similarity matrix(often referred to as affinity matrix) as an input for its
clustering process. Here, we calculated the pairwise similarities between genes.
Finally, it returns cluster membership values as a result.
In Expectation Step (E-step), the affinity matrix weights wij are calculated using the
cluster membership values and scaling the similarities. i.e.
11
𝑤𝑖𝑗𝑠 = 𝑆𝑀𝑖𝑗 × 𝑢𝑖𝑠 × 𝑢𝑗𝑠 (1)
Where wijs is the weight between objects i and j in cluster s, 𝑆𝑀𝑖𝑗is the similarity
between objects i and j, and uis and us
j are the membership values of objects i and j
to cluster s.
In the initial stage of the PageRank calculation, PageRank scores are initialized
randomly.Then, for each cluster, it calculates the PageRank scores (PR)
according to Eqn. 2.
PRis = (1-d) + d* ∑ 𝑊𝐽𝐼
𝑆𝑁𝐽=1 (2)
Where PRis denotes the PageRank Score of ith object for cluster s, d is the damping
factor (generally, 0.8 ≤ d ≤ 0.9), N is the number of nodes/data points. In this case,
the PageRank score of a data point within each cluster is interpreted as the
likelihood, and cluster membership values are updated using PageRank score.
In Maximization Step (M-step), updating of mixing coefficients is performed based
on the expectation level’s assessed membership values of the cluster.
In FRC process, it also used random initialization of membership values of
instances, and as a result, we will get inconsistent or undesirable [25] clustering
results. For avoiding these problems, we replace the random initialization process
with the fixed and desired process. So, we got a repeatable clustering algorithm that
is generated same clustering result for the given same parameter. In the traditional
Fuzzy Relational Clustering algorithm, it needs prior knowledge about the number
of clusters. For avoiding this situation, we utilized the information of GOSlims.
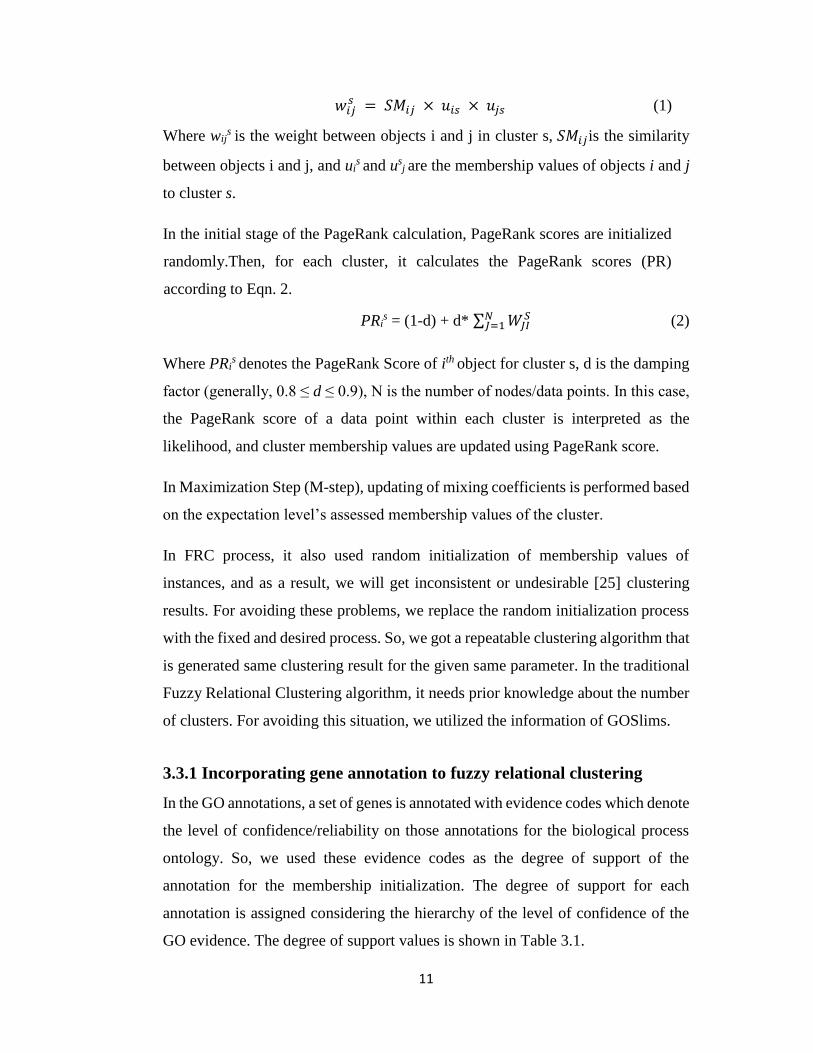
3.3.1 Incorporating gene annotation to fuzzy relational clustering
In the GO annotations, a set of genes is annotated with evidence codes which denote
the level of confidence/reliability on those annotations for the biological process
ontology. So, we used these evidence codes as the degree of support of the
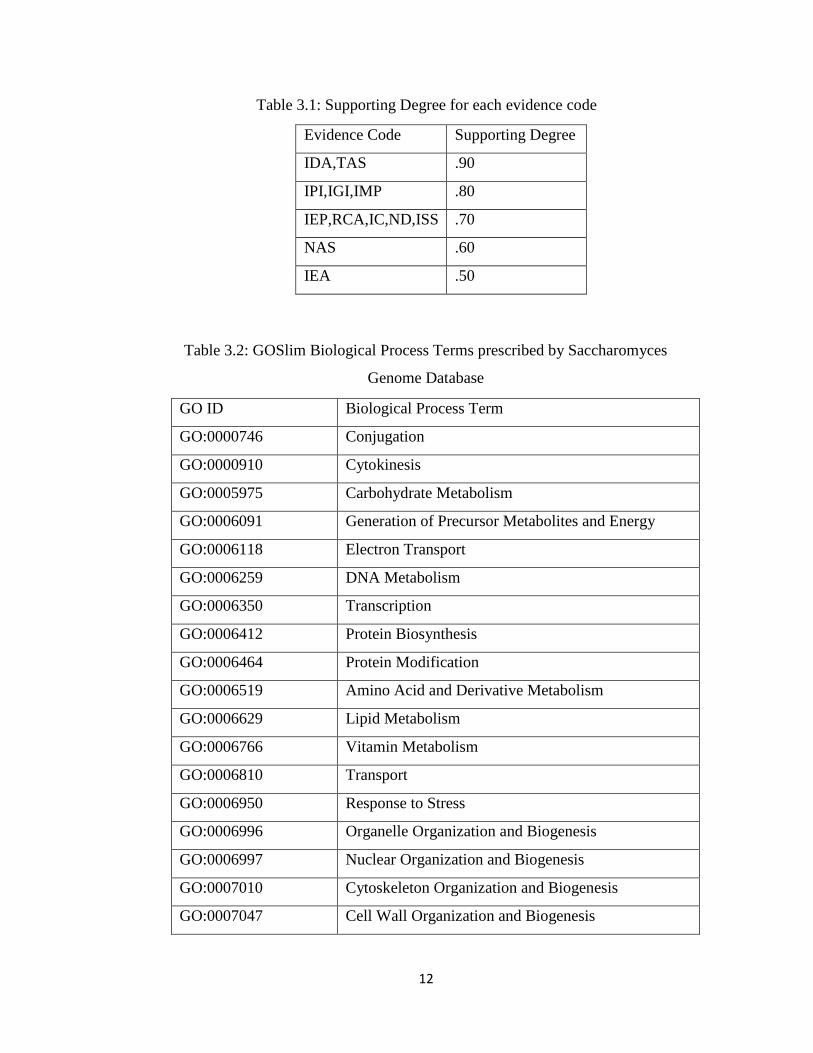
annotation for the membership initialization. The degree of support for each
annotation is assigned considering the hierarchy of the level of confidence of the
GO evidence. The degree of support values is shown in Table 3.1.
12
Table 3.1: Supporting Degree for each evidence code
Evidence Code Supporting Degree
IDA,TAS .90
IPI,IGI,IMP .80
IEP,RCA,IC,ND,ISS .70
NAS .60
IEA .50
Table 3.2: GOSlim Biological Process Terms prescribed by Saccharomyces
Genome Database
GO ID Biological Process Term
GO:0000746 Conjugation
GO:0000910 Cytokinesis
GO:0005975 Carbohydrate Metabolism
GO:0006091 Generation of Precursor Metabolites and Energy
GO:0006118 Electron Transport
GO:0006259 DNA Metabolism
GO:0006350 Transcription
GO:0006412 Protein Biosynthesis
GO:0006464 Protein Modification
GO:0006519 Amino Acid and Derivative Metabolism
GO:0006629 Lipid Metabolism
GO:0006766 Vitamin Metabolism
GO:0006810 Transport
GO:0006950 Response to Stress
GO:0006996 Organelle Organization and Biogenesis
GO:0006997 Nuclear Organization and Biogenesis
GO:0007010 Cytoskeleton Organization and Biogenesis
GO:0007047 Cell Wall Organization and Biogenesis

13
GO:0007049 Cell Cycle
GO:0007114 Cell Budding
GO:0007124 Pseudohyphal Growth
GO:0007126 Meiosis
GO:0007165 Signal Transduction
GO:0009653 Morphogenesis
GO:0016044 Membrane Organization and Biogenesis
GO:0016070 RNA Metabolism
GO:0016192 Vesicle-mediated Transport
GO:0019725 Cell Homeostasis
GO:0030163 Protein Catabolism
GO:0030435 Sporulation
GO:0042254 Ribosome Biogenesis and Assembly
GO:0045333 Cellular Respiration
We need to assign the genes under the 32 terms of the biological process (refers to
Table 3.2), which is defined as GOSlim for yeast by SGD [50], in the process of
clustering. We consider that each term of GOSlim biological process (𝑏𝑝) is the
different cluster point (𝐶𝑠) where 𝐶𝑠 is the sth bp process term. Assignment of the
set of genes under the biological process terms are as follows: Suppose, we have a
set of genes G. A gene 𝑔𝑖 is assigned to GOSlim biological process 𝐶𝑠 if the gene
𝑔𝑖 is linked with bp based on the information of the GO annotation and in the GO
hierarchy, bp is a offspring of 𝐶𝑠. The gene 𝑔𝑖 is assigned to 𝐶𝑠 with the degree of
support for gene based on the GO annotation. The equations for the initialization of
membership for gene 𝑔𝑖 are as follow:
𝑢𝑖𝑠(0)
= 𝛼. 𝛽 (3)
𝑢𝑖𝑠(0)
= 𝑑𝑏𝑖𝑠(1 − 𝛼) + 𝛼. 𝛽 (4)
14
Where 𝑢𝑖𝑠(0)
is the membership of gene 𝑔𝑖 in cluster 𝐶𝑠 (sth biological process) in the
0th iteration as an initial membership value and dbis is the degree of support based
on the evidence code for the annotated gene 𝑔𝑖 which is linked with biological
process 𝐶𝑠, α is used to make the variation in the value of membership 𝑢𝑖𝑠(0) which
depends on the gene expression and annotation where the values of the α are
between 0 to 1. The dependency of 𝑢𝑖𝑠(0)
on gene annotation is decreased while
increasing the value of α. The computation of the membership values fully depends
on the annotation information of the each gene when α is equal to 0. The purpose
of β is used as the supporting degree where gene 𝑔𝑖 is not associated with cluster
𝐶𝑠 . If the value of β is small, it helps to assign the gene 𝑔𝑖 to 𝐶𝑠 based on its
transcriptional pattern when the 𝑔𝑖 is not associated with Cs. Here, the values of β
are between 0 to 1.
In our proposed algorithm, initialize the membership values using Eqn. 3. If the 𝑔𝑖
is associated with the biological process term 𝐶𝑠, then we use Eqn. 4. If there are
multiple degree of support values for multiple evidence code for supporting the
gene 𝑔𝑖 annotation for 𝐶𝑠, the highest degree of supporting value for that gene 𝑔𝑖 is
used. Membership values of each gene to clusters are updated using the GO
annotations and the given data after initializing membership values for each gene.
The idea behind integrating the Gene Ontology information to Fuzzy Relational
Clustering is illustrated as follows:
1. Initialization: Pairwise similarities between genes are calculated using the
Eqn. 5, and then these pairwise similarities named affinity matrix is passed
to clustering process as an input. Initial membership values of the cluster
are assigned using Eqn. 3 and Eqn. 4 and above procedure. Then, the
membership values are normalized, and mixing coefficients are also
initialized. Step 1 to 3 of Algorithm 2 shows the initialization process.
Pairwise Similarity, SM = 𝑒− 𝐸𝑢𝑐𝑙𝑖𝑑𝑒𝑎𝑛 𝑑𝑖𝑠𝑡𝑎𝑛𝑐𝑒 (5)
15
2. Expectation step: The value of PageRank for each object in each cluster
is calculated using affinity matrix weights. The membership values are
updated using the initial membership values which are generated on the
basis of GO annotations. The process of updating the membership values
is different from the original FRC algorithm. The steps are shown in
Algorithm 2. Steps 10 and 12 of Algorithm 2 utilize the initial membership
value of each gene.
3. Maximization step: Update the mixing coefficient based on membership
values generated from the Expectation step.
The standard FRC algorithm can be outlined by Algorithm 1, where S Mij, uis, ujs,
Wijs , PRi
s have defined above, lhis is the likelihood of object i in cluster s, MCs is
the mixing coefficient of cluster s. Here, the convergence condition of the algorithm
is when the iteration number is equal to the maximum number of iterations. And
also we depict our proposed method through the GO-FRC algorithm which is
outlined by Algorithm 2.
16

17
For evaluating the cluster, we consider the ratio of clusters compactness to
separation [51] stated in Eqn. 6, where N is the total number of genes, C is the
number of clusters, xi is the expression vector data for gene 𝑔𝑖 . The cluster’s
optimality is increasing while decreasing the ratio. The lowest ratio gives the
highest separation between clusters, but with the most compact cluster.

18
In the clustering results, the biological process 𝐶𝑠 contains a gene 𝑔𝑖 if 𝑢𝑖𝑠 > 0.035
where 0.035 is the membership cutoff value in this experiment.
Conventional clustering algorithms used arbitrary membership cutoff values. In this
study, we consider 0.035 as the membership cutoff value because it is always higher
than the membership value which is (1
𝐶𝑙𝑢𝑠𝑡𝑒𝑟 𝑁𝑢𝑚𝑏𝑒𝑟𝑠=32= 0.03125) uniformly
distributed.
3.5. Conclusions
Clustering process is completed by using Fuzzy Relational Clustering with GO
annotations. GO annotations help to generate biological relevant clusters from the
microarray gene expression data.
19
CHAPTER IV
Simulation Results and Discussions
4.1 Introduction
Gene products are habitually associated with various tasks in the cell’s functioning.
Therefore each gene can be assigned to multiple clusters in the clustering process.
But the conventional clustering algorithms such as k-means, hierarchical are not
capable of assigning a gene to multiple clusters. Fuzzy relational clustering
algorithm supports multifunctional behavior which is more suitable for
representing the relationships between the genes of cell in living organisms.
In this experiment, we used two yeast Saccharomyces cerevisiae datasets which are
collected from Eisen Lab [26] and DREAM5 challenges [49]. The Eisen yeast
dataset contains the expression levels of 6153 with 93 samples, and Dream5 yeast
dataset contains about 5950 genes with 536 samples. For evaluating the
performance on predicting the new functions of genes, we used some older version
of other data files : used association file of yeast GO annotation is generated on 9th
September 2005(Revision: 1.1190), used Gene Ontology is generated on 1st
September, 2005 and the used yeast GOSlim terms are created on 29th September,
2005(CVS version: Revision: 1.48).
From the experimental results of our proposed algorithm, we have found that about
5606 genes of Eisen yeast dataset are assigned more than one cluster for β = 0.5
and α = 0.3, and also 4701 genes of dream5 yeast dataset are assigned more than
one cluster for β = 0.1 and α = 0.1 using the GO-FRC algorithm.
As our proposed method used biological process terms, the generated clusters are
related to these GOSlim biological processes. These clusters help to find some
interesting biological interpretation which is usually so much time-consuming
20
analysis process. Our proposed algorithm initializes the membership values based
on the GO annotation. If any gene does not associate with any cluster (biological
process term), the gene is assigned based on expression data only.
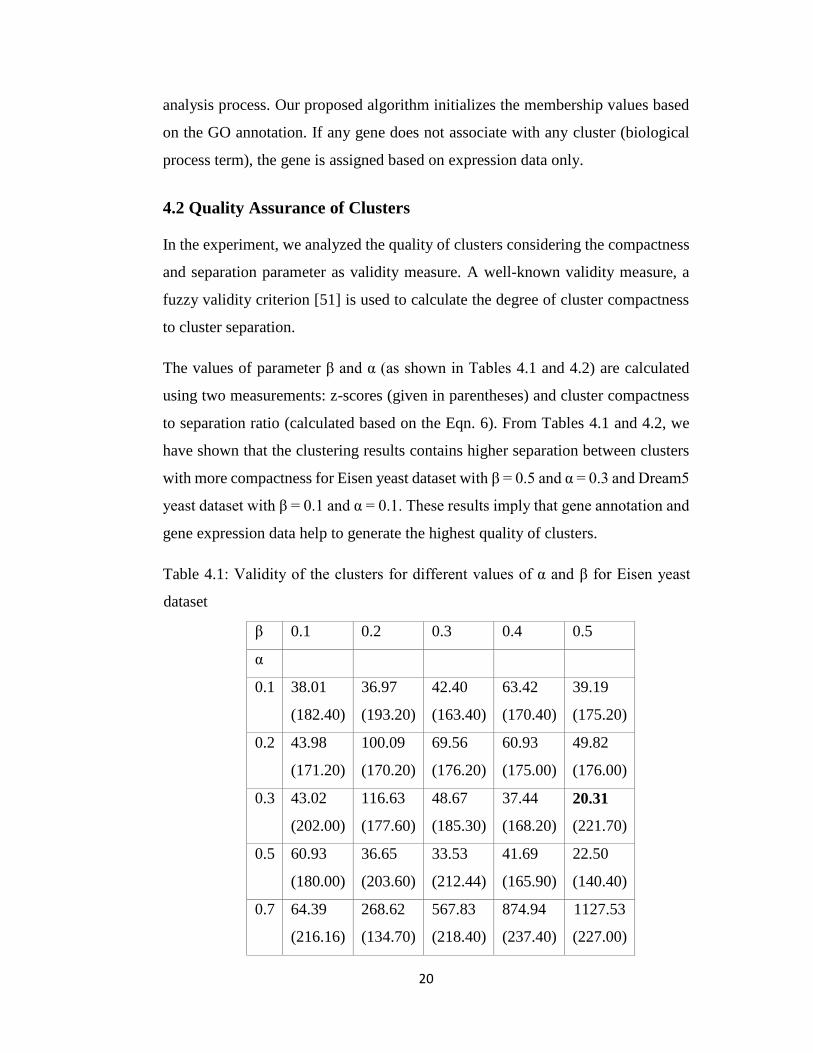
4.2 Quality Assurance of Clusters
In the experiment, we analyzed the quality of clusters considering the compactness
and separation parameter as validity measure. A well-known validity measure, a
fuzzy validity criterion [51] is used to calculate the degree of cluster compactness
to cluster separation.
The values of parameter β and α (as shown in Tables 4.1 and 4.2) are calculated
using two measurements: z-scores (given in parentheses) and cluster compactness
to separation ratio (calculated based on the Eqn. 6). From Tables 4.1 and 4.2, we
have shown that the clustering results contains higher separation between clusters
with more compactness for Eisen yeast dataset with β = 0.5 and α = 0.3 and Dream5
yeast dataset with β = 0.1 and α = 0.1. These results imply that gene annotation and
gene expression data help to generate the highest quality of clusters.
Table 4.1: Validity of the clusters for different values of α and β for Eisen yeast
dataset
β 0.1 0.2 0.3 0.4 0.5
α
0.1 38.01 36.97 42.40 63.42 39.19
(182.40) (193.20) (163.40) (170.40) (175.20)
0.2 43.98 100.09 69.56 60.93 49.82
(171.20) (170.20) (176.20) (175.00) (176.00)
0.3 43.02 116.63 48.67 37.44 20.31
(202.00) (177.60) (185.30) (168.20) (221.70)
0.5 60.93 36.65 33.53 41.69 22.50
(180.00) (203.60) (212.44) (165.90) (140.40)
0.7 64.39 268.62 567.83 874.94 1127.53
(216.16) (134.70) (218.40) (237.40) (227.00)

21
Table 4.2: Validity of the clusters for different values of α and β for Dream 5 yeast
dataset
β 0.1 0.2 0.3 0.4 0.5
α
0.1 214.02 364.42 436.38 574.02 693.89
(252.40) (167.60) (288.00) (277.40) (308.80)
0.2 474.25 636.39 854.99 989.54 1072.94
(286.20) (280.80) (251.60) (269.00) (284.60)
0.3 555.80 920.90 1080.62 1156.68 1198.03
(269.20) (287.80) (210.20) (281.40) (260.40)
0.5 990.90 1186.98 1239.53 1262.73 1275.37
(275.60) (282.40) (281.60) (300.80) (285.60)
0.7 1210.22 1272.14 1289.69 1299.04 1306.00
(276.00) (286.60) (312.80) (311.20) (292.80)
Along with the cluster validity measuring criteria, separation and compactness, we
need to calculate the biological significance of the cluster using Cluster Judge [15]
for the biological microarray data. This biological significance is defined by z-
score. The high value of z-score denotes that the clusters have less chance to
produce randomly and the clusters contain higher biological significance. From the
Tables 4.1 and 4.2, we have shown that the biological significance (z-score) of the
clusters is not significantly different for the different α and β values except when α
≥ 0.50. Regarding z-score values, the quality of the resultant clusters is robust
despite the values of α and β. Here, the z-scores are the average of the ten repetitions
for each value of α and β.
22
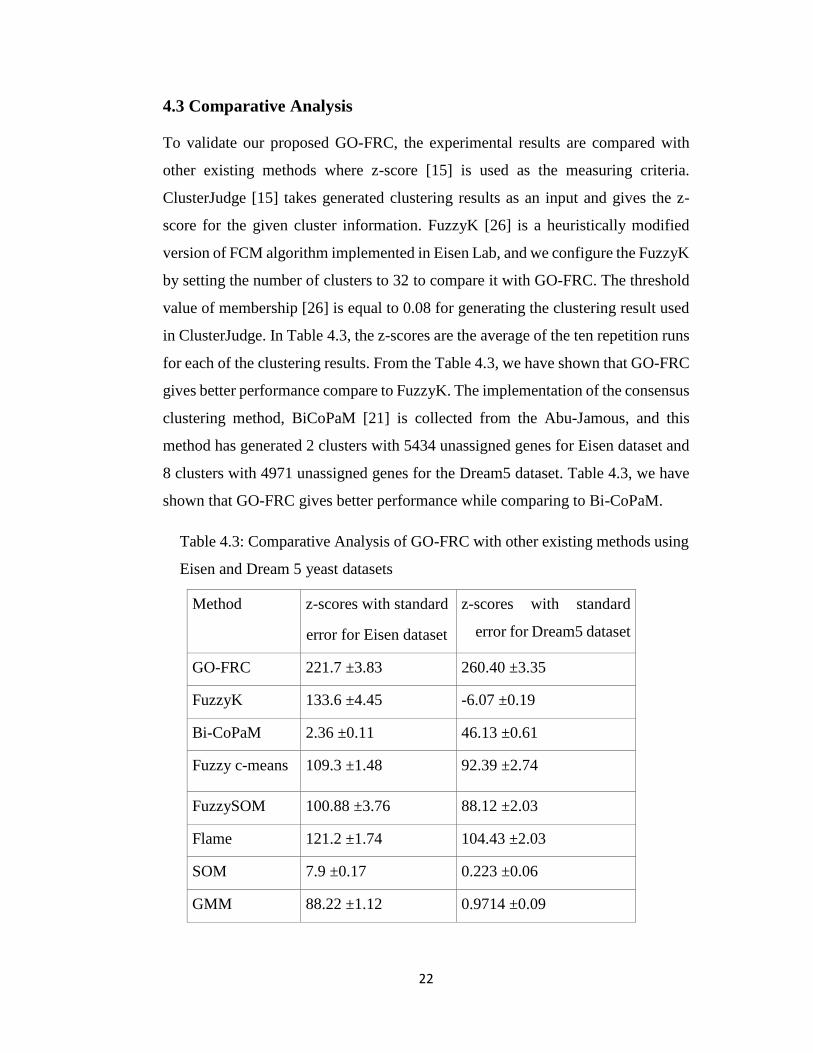
4.3 Comparative Analysis
To validate our proposed GO-FRC, the experimental results are compared with
other existing methods where z-score [15] is used as the measuring criteria.
ClusterJudge [15] takes generated clustering results as an input and gives the z-
score for the given cluster information. FuzzyK [26] is a heuristically modified
version of FCM algorithm implemented in Eisen Lab, and we configure the FuzzyK
by setting the number of clusters to 32 to compare it with GO-FRC. The threshold
value of membership [26] is equal to 0.08 for generating the clustering result used
in ClusterJudge. In Table 4.3, the z-scores are the average of the ten repetition runs
for each of the clustering results. From the Table 4.3, we have shown that GO-FRC
gives better performance compare to FuzzyK. The implementation of the consensus
clustering method, BiCoPaM [21] is collected from the Abu-Jamous, and this
method has generated 2 clusters with 5434 unassigned genes for Eisen dataset and
8 clusters with 4971 unassigned genes for the Dream5 dataset. Table 4.3, we have
shown that GO-FRC gives better performance while comparing to Bi-CoPaM.
Table 4.3: Comparative Analysis of GO-FRC with other existing methods using
Eisen and Dream 5 yeast datasets
Method z-scores with standard
error for Eisen dataset
z-scores with standard
error for Dream5 dataset
GO-FRC 221.7 ±3.83 260.40 ±3.35
FuzzyK 133.6 ±4.45 -6.07 ±0.19
Bi-CoPaM 2.36 ±0.11 46.13 ±0.61
Fuzzy c-means 109.3 ±1.48 92.39 ±2.74
FuzzySOM 100.88 ±3.76 88.12 ±2.03
Flame 121.2 ±1.74 104.43 ±2.03
SOM 7.9 ±0.17 0.223 ±0.06
GMM 88.22 ±1.12 0.9714 ±0.09

23
Other fuzzy clustering methods like FCM (fuzzy c-means), FuzzySOM (fuzzy self-
organizing maps) are also used to validate the performance of GO-FRC. We also
configure the GEDAS [52] by setting 32 as the number of clusters, maximum
iterations equal to 500, fuzziness parameter equal to 1.2, the similarity type as
Euclidean distance. GO-FRC gives a significantly better performance than FCM
and FuzzySOM regarding z-scores, as shown in Table 4.3. Fuzzy clustering by
Local Approximation of Membership (FLAME) [53] helps to identify non-linear
relationships and cluster outliers. FLAME captures the number of clusters
automatically. Here, for the comparison, we used the default setting like the number
of k-nearest neighbors as 10, maximum approximation steps as 500 and Euclidean
distance are used as similarity type. From the Table 4.3, we have shown that
FLAME gives better performance than FCM, FuzzySOM, but GO-FRC gives
significantly better performance over FLAME.
Other clustering algorithms such as Gaussian mixture model (GMM) and self-
organizing maps (SOM) [29] are used for performing the comparison with GO-
FRC. We conduct the clustering analysis of SOM and GMM on Weka [54] data
mining tool while setting the number of iterations of 100000 for SOM and 100 for
GMM. From the Table 4.3, we have shown that GO-FRC outperforms SOM and
GMM.
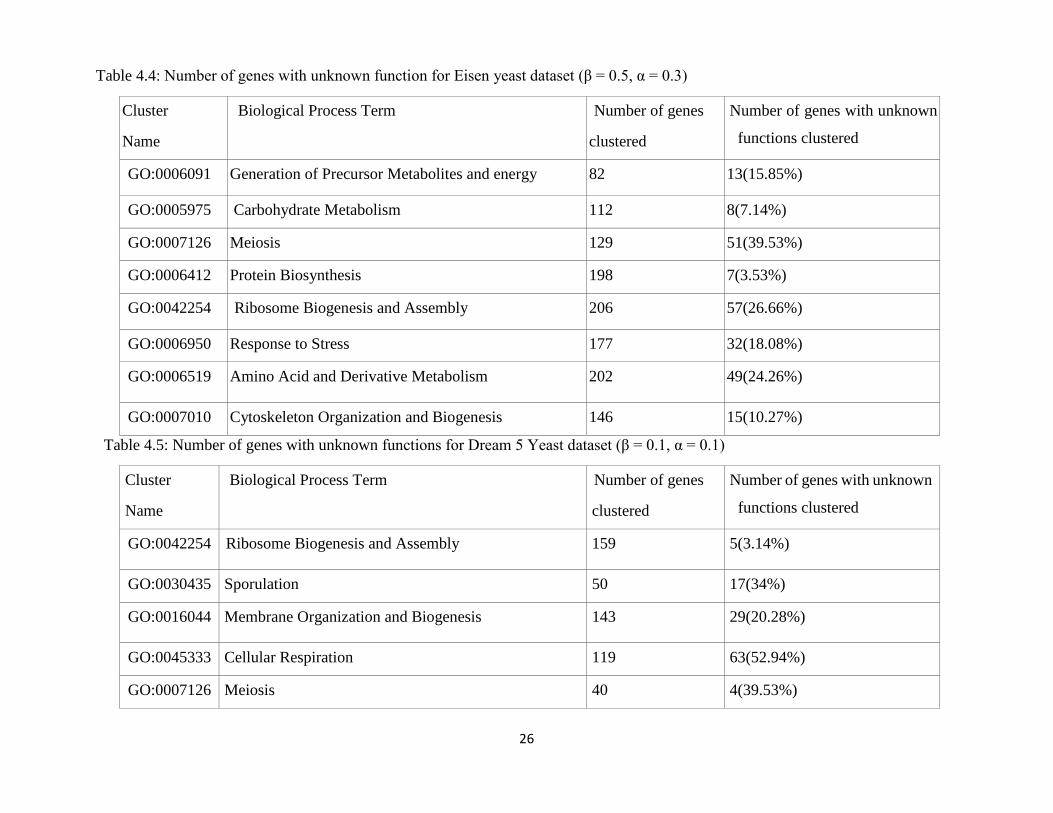
4.4 Prediction of Function
Clustering can help to disclose the unknown functions of the genes. The proposed
clustering method generates a set of clusters where each group contains more
similar genes (genes with known functions, genes with unknown functions) based
on their gene expression profiles. Inference of the unknown functions of the genes
is done by considering the assignment of the genes with undiscovered functions to
genes with known functions which are previously assigned to those genes.
Generated clusters by the proposed method are more consistent with the GO
annotation. For both datasets, genes with newly assigned functions by the proposed
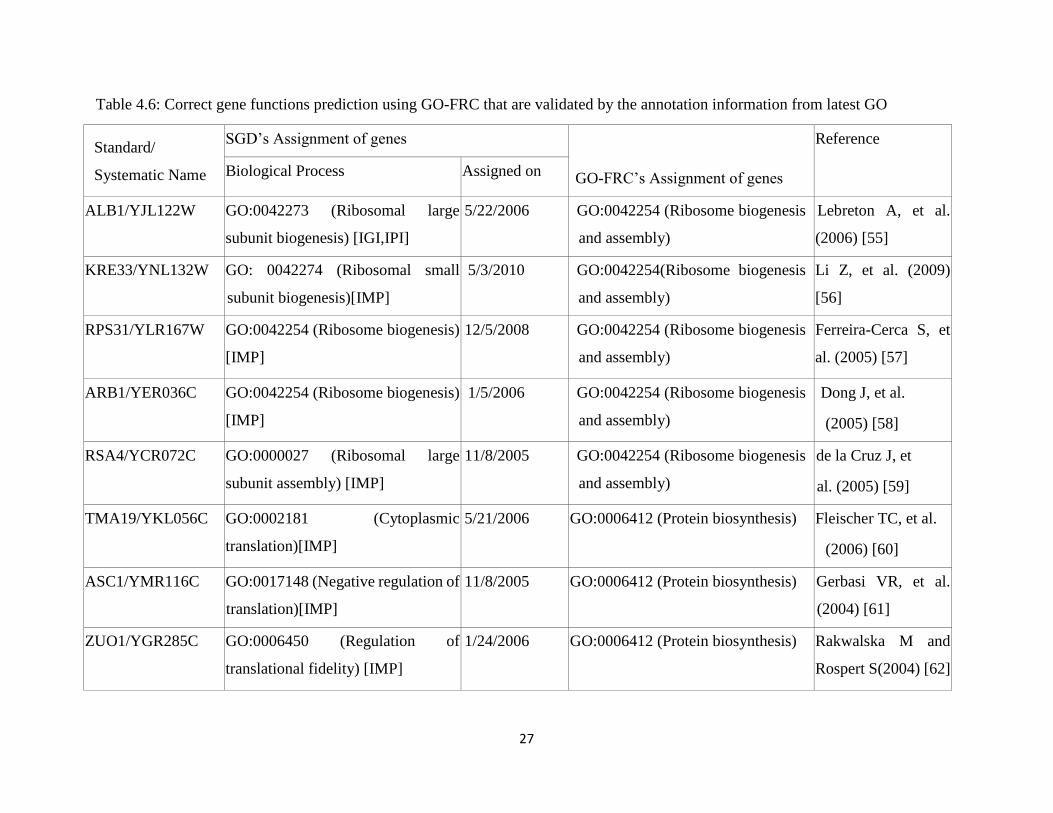
method are shown in Table 4.4 and Table 4.5. The genes with newly proposed
functions have been further analyzed. From the analysis, as shown in Table 4.6, we
24
found that genes YJL122W and YNL132W are clustered in the biological process
term cluster GO: 0042254 for Eisen and Dream 5 yeast datasets. Amalgamating
these pieces of information, these apprise that genes YJL122W and YNL132W are
associated with Ribosome biogenesis and assembly (GO:0042254). Our used yeast
annotation was created on 9th September, 2005 by SGD. Genes YJL122W and
YNL132W were assigned to biological process unknown (GO:0000004). Genes
YJL122W and YNL132W were assigned new standard name ALB1(involved in
the biogenesis of ribosomal large subunit) and KRE33(Protein required for
biogenesis of the small ribosomal subunit), respectively according to the current
SGD. Genes YJL122W was assigned under the biological process term ”ribosomal
large subunit biogenesis” on May 22, 2006 based on the experimental result [55]
and Genes YNL132W was assigned under the biological process term ”ribosomal
small subunit biogenesis” on May 03, 2010 based on the experimental result [56].
Ribosomal large subunit biogenesis (GO:0042273) and ribosomal small subunit
biogenesis (GO:0042274) are the children of ribosome biogenesis(GO:0042254).
As ALB1/YJL122W and KRE33/YNL132W are involved in ribosomal large
subunit biogenesis and ribosomal small subunit biogenesis, respectively,
ALB1/YJL122W and KRE33/YNL132W are also involved in ribosome biogenesis
(GO:0042254). Genes ALB1/YJL122W and KRE33/YNL132W are assigned
under the correct gene functions based on the similar properties of gene expression
profiles with the expression profiles of other genes which are previously assigned
to the biological process term ”ribosome biogenesis and assembly” (GO:0042254).
Genes RSA4/YCR072C, ARB1/YER036C and RPS31/YLR167W are assigned
under the Ribosome biogenesis and assembly (GO:0042254) by the proposed GO-
FRC clustering method where the genes are assigned under the ribosomal large
subunit assembly(GO:0000027), ribosome biogenesis (GO:0042254), ribosome
biogenesis (GO:0042254), respectively according to the lasted go annotation by
SGD. Using Eisen dataset, the genes ZUO1/YGR285C, ASC1/YMR116C and
TMA19/YKL056C are assigned to protein biosynthesis (GO:0006412). Brief
information about these genes is given in Table 4.6.
25
According to the Yeast GRID [63], CNS1/ YBR155W physically interacts with
FRK1/YPL141C [64] while HSC82/ YMR186W has genetic and physical
interaction with CNS1 [65, 66, 67, 68]. For Eisen yeast dataset, we have analyzed
the cluster GO:0006259 and found that these three genes are clustered into the same
cluster. So, genes with already identified interactions assign to the same cluster.
4.5 Result Analysis and Discussions
Some of the advantages of the proposed method concerning other methods are
described here. In [38], GO annotation based clustering algorithm needs the cluster
numbers as prior knowledge and the generated clusters from this method are not
biologically annotated which restricts the path of analyzing the interesting
biological interpretation from the resultant clusters. In GO-FRC, the number of
clusters is selected based on the number of GO slim terms and is equal to the
number of GO slim terms. Moreover, as our proposed method used biological
process terms, the generated clusters are related to these GOSlim biological
processes. These help to find some interesting biological interpretation which is
usually so much time-consuming analysis process. In [35], GO annotations based
K-medoids algorithm does not allow to capture new function of previously
annotated genes with identified functions by restricting genes with identified
functions to be doled out to different clusters. But GO-FRC permits genes with
known functions to be appointed to other biological processes. GO-FRC helps to
predict the functions of the genes as described in section 4.4.
26
Table 4.4: Number of genes with unknown function for Eisen yeast dataset (β = 0.5, α = 0.3)
Cluster
Name
Biological Process Term Number of genes
clustered
Number of genes with unknown
functions clustered
GO:0006091 Generation of Precursor Metabolites and energy 82 13(15.85%)
GO:0005975 Carbohydrate Metabolism 112 8(7.14%)
GO:0007126 Meiosis 129 51(39.53%)
GO:0006412 Protein Biosynthesis 198 7(3.53%)
GO:0042254 Ribosome Biogenesis and Assembly 206 57(26.66%)
GO:0006950 Response to Stress 177 32(18.08%)
GO:0006519 Amino Acid and Derivative Metabolism 202 49(24.26%)
GO:0007010 Cytoskeleton Organization and Biogenesis 146 15(10.27%)
Table 4.5: Number of genes with unknown functions for Dream 5 Yeast dataset (β = 0.1, α = 0.1)
Cluster
Name
Biological Process Term Number of genes
clustered
Number of genes with unknown
functions clustered
GO:0042254 Ribosome Biogenesis and Assembly 159 5(3.14%)
GO:0030435 Sporulation 50 17(34%)
GO:0016044 Membrane Organization and Biogenesis 143 29(20.28%)
GO:0045333 Cellular Respiration 119 63(52.94%)
GO:0007126 Meiosis 40 4(39.53%)
27
Table 4.6: Correct gene functions prediction using GO-FRC that are validated by the annotation information from latest GO
Standard/
Systematic Name
SGD’s Assignment of genes
GO-FRC’s Assignment of genes
Reference
Biological Process Assigned on
ALB1/YJL122W GO:0042273 (Ribosomal large
subunit biogenesis) [IGI,IPI]
5/22/2006 GO:0042254 (Ribosome biogenesis
and assembly)
Lebreton A, et al.
(2006) [55]
KRE33/YNL132W GO: 0042274 (Ribosomal small
subunit biogenesis)[IMP]
5/3/2010 GO:0042254(Ribosome biogenesis
and assembly)
Li Z, et al. (2009)
[56]
RPS31/YLR167W GO:0042254 (Ribosome biogenesis)
[IMP]
12/5/2008 GO:0042254 (Ribosome biogenesis
and assembly)
Ferreira-Cerca S, et
al. (2005) [57]
ARB1/YER036C GO:0042254 (Ribosome biogenesis)
[IMP]
1/5/2006 GO:0042254 (Ribosome biogenesis
and assembly)
Dong J, et al.
(2005) [58]
RSA4/YCR072C GO:0000027 (Ribosomal large
subunit assembly) [IMP]
11/8/2005 GO:0042254 (Ribosome biogenesis
and assembly)
de la Cruz J, et
al. (2005) [59]
TMA19/YKL056C GO:0002181 (Cytoplasmic
translation)[IMP]
5/21/2006 GO:0006412 (Protein biosynthesis) Fleischer TC, et al.
(2006) [60]
ASC1/YMR116C GO:0017148 (Negative regulation of
translation)[IMP]
11/8/2005 GO:0006412 (Protein biosynthesis) Gerbasi VR, et al.
(2004) [61]
ZUO1/YGR285C GO:0006450 (Regulation of
translational fidelity) [IMP]
1/24/2006 GO:0006412 (Protein biosynthesis) Rakwalska M and
Rospert S(2004) [62]

28
GO-FRC uses the GO annotations as prior knowledge for assigning initial clusters to generate
consistent clusters. Here, we have used yeast GOSlim terms, but the model can work on any kind
of extended version of GOSlim terms as prior knowledge. Along with the budding yeast, the
proposed system can be used to organisms. The constraint of this proposed technique is that we
need to determine the value of α experimentally. While GO-FRC has a limitation, from the above
observations, we can conclude that the proposed semi-supervised clustering algorithm, GO-FRC
is the better option to analyze the gene expression data more biologically.
4.6 Conclusions
This chapter focuses on the performance analysis of the proposed method through evaluating the
quality of the resultant clusters firstly. The results of this work show that it performs better than
other existing methods. Finally, it shows its capability to predict the unknown functions of the
genes correctly.

29
CHAPTER V
Concluding Remarks
5.1 Conclusions
In this thesis, we propose fuzzy relational clustering technique called GO-FRC and this model
helps to generate biologically relevant clusters. In GO-FRC, the generated clusters are consistent
with multiple runs of the clustering algorithm, and these generated clusters are automatically
assigned to yeast biological process, and it alleviates the time-consuming analyzation of clusters
of genes. The experimental result implies that GO-FRC performs well with the small amount of
GO annotations as in yeast and gives better clustering results compare to FuzzyK [26], Bi-CoPaM
[21], FCM [52], FuzzySOM [52], FLAME [53] , SOM [54], GMM [54] using a lower percentage
of yeast’s GO annotations.
As the proposed model helps to generate the biological relevant clusters for yeast datasets, the
proposed method may also be adapted to another type of organism’s microarray datasets. We will
try to determine the value of α more effectively in our future research work.
30
REFERENCES
[1] M. B. Eisen, P. T. Spellman, P. O. Brown, D. Botstein, Cluster analysis and display of genome-
wide expression patterns., Proceedings of the National Academy of Sciences of the United
States of America 95 (25) (1998) 14863 –8. doi:10.1073/pnas.95.25.14863.
[2] L. M. Steinmetz, R. W. Davis, Maximizing the potential of functional genomics., Nature
reviews. Genetics 5 (3) (2004) 190–201. doi:10.1038/nrg1293.
[3] J. Quackenbush, Computational analysis of microarray data., Nature Reviews Genetics 2 (6)
(2001) 418–427. doi:10.1038/35076576.
[4] R. a. Young, Biomedical discovery with DNA arrays. (2000). doi:10.1016/S0092-
8674(00)00005-2.
[5] I. Shmulevich, E. R. Dougherty, S. Kim, W. Zhang, Probabilistic Boolean Networks: a rule-
based uncertainty model for gene regulatory networks., Bioinformatics (Oxford, England) 18
(2) (2002) 261–274. doi:10.1093/ bioinformatics/18.2.261.
[6] T. Akutsu, S. Miyano, S. Kuhara, Inferring qualitative relations in genetic networks and
metabolic pathways., Bioinformatics (Oxford, England) 16 (8) (2000) 727–734.
doi:10.1093/bioinformatics/16.8.727.
[7] C. Debouck, P. N. Goodfellow, DNA microarrays in drug discovery and development., Nature
genetics 21 (1 Suppl) (1999) 48–50. doi:10.1038/4475.
[8] S. Huang, Gene expression profiling, genetic networks, and cellular states: An integrating
concept for tumorigenesis and drug discovery (1999). doi:10.1007/s001099900023.
[9] S. M. Razavi Zadegan, M. Mirzaie, F. Sadoughi, Ranked k-medoids: A fast and accurate rank-
based partitioning algorithm for clustering large datasets, Knowledge-Based Systems 39
(2013) 133–143. doi:10.1016/j.knosys.2012.10.012.
[10] S. Navlakha, M. C. Schatz, C. Kingsford, Revealing biological modules via graph
summarization, Journal of computational biology: a journal of computational molecular cell
biology 16 (2) (2009) 253–264. doi: 10.1089/cmb.2008.11TT.
[11] Y. Loewenstein, E. Portugaly, M. Fromer, M. Linial, Efficient algorithms for accurate
hierarchical clustering of huge datasets: Tackling the entire protein space, Bioinformatics 24
(13). doi:10.1093/bioinformatics/btn174.
31
[12] R. Colak, F. Hormozdiari, F. Moser, A. Schonhuth,¨ J. Holman, M. Ester, S. C. Sahinalp,
Dense graphlet statistics of protein interaction and random networks., Pacific Symposium on
Biocomputing. Pacific Symposium on Biocomputing (2009) 178–189.
[13] J. B. MacQueen, Some Methods for classification and Analysis of Multivariate
Observations, in: Proceedings of 5-th Berkeley Symposium on Mathematical Statistics and
Probability, Vol. 1, 1967, pp. 281–297.
[14] S. Tavazoie, J. D. Hughes, M. J. Campbell, R. J. Cho, G. M. Church, Systematic
determination of genetic network architecture., Nature genetics 22 (3) (1999) 281–5.
doi:10.1038/10343. URL http://dx.doi.org/10.1038/10343.
[15] F. D. Gibbons, F. P. Roth, Judging the quality of gene expression-based clustering methods
using gene annotation, Genome Research 12 (10) (2002) 1574–1581. doi:10.1101/gr.397002.
[16] I. G. Costa, F. d. A. T. de Carvalho, M. C. P. de Souto, Comparative analysis of clustering
methods for gene expression time course data, Genetics and Molecular Biology 27 (4) (2004)
623–631. doi:10.1590/S1415-47572004000400025.
[17] S. Datta, S. Datta, Comparisons and validation of statistical clustering techniques for
microarray gene expression data, Bioinformatics 19 (4) (2003) 459–466.
doi:10.1093/bioinformatics/btg025.
[18] A. K. Jain, M. N. Murty, P. J. Flynn, Data clustering: a review, ACM Computing Surveys
31 (3) (1999) 264–323. arXiv:arXiv:1101.1881v2, doi:10.1145/331499.331504.
[19] H. G. Ayad, M. S. Kamel, On voting-based consensus of cluster ensembles, Pattern
Recognition 43 (5) (2010) 1943–1953. doi:10.1016/j.patcog.2009.11.012.
[20] Y. Cui, C. H. Zheng, J. Yang, Identifying Subspace Gene Clusters from Microarray Data
Using Low-Rank Representation, PLoS ONE 8 (3). doi:10.1371/journal.pone.0059377.
[21] B. Abu-Jamous, R. Fa, D. J. Roberts, A. K. Nandi, Paradigm of Tunable Clustering Using
Binarization of Consensus Partition Matrices (Bi-CoPaM) for Gene Discovery, PLoS ONE 8
(2). doi:10.1371/journal.pone.0056432.
[22] A. T. Azar, S. A. El-Said, A. E. Hassanien, Fuzzy and hard clustering analysis for thyroid
disease, Computer Methods and Programs in Biomedicine 111 (1) (2013) 1–16.
doi:10.1016/j.cmpb.2013.01.002.
32
[23] J. C. Bezdek, Pattern Recognition with Fuzzy Objective Function Algorithms, SIAM
Review 25 (3) (1983) 442 –442. arXiv:arXiv:1011.1669v3, doi:10.1137/1025116.
[24] D. Dembele, P. Kastner, Fuzzy C-means method for clustering microarray data,
Bioinformatics 19 (8) (2003) 973 – 980. doi:10.1093/bioinformatics/btg119.
[25] E. R. Dougherty, J. Barrera, M. Brun, S. Kim, R. M. Cesar, Y. Chen, M. Bittner, J. M.
Trent, Inference from clustering with application to gene-expression microarrays., Journal of
computational biology : a journal of computational molecular cell biology 9 (1) (2002) 105–
126. doi:10.1089/10665270252833217.
[26] A. P. Gasch, M. B. Eisen, Exploring the conditional coregulation of yeast gene expression
through fuzzy k-means clustering., Genome Biol 3 (11) (2002) RESEARCH0059.
doi:10.1186/gb-2002-3-11-research0059.
[27] R. D. Pascual-Marqui, A. D. Pascual-Montano, K. Kochi, J. M. Carazo, Smoothly
distributed fuzzy c-means: A new self-organizing map, Pattern Recognition 34 (12) (2001)
2305–2402. doi:10.1016/S0031-3203(00)00159-X.
[28] N. Belacel, M. ??uperlovi?? Culf, M. Laflamme, R. Ouellette, Fuzzy J-Means and VNS
methods for clustering genes from microarray data, Bioinformatics 20 (11) (2004) 1690–1701.
doi:10.1093/bioinformatics/ bth142.
[29] H. Ritter, T. Kohonen, Self-organizing semantic maps, Biological Cybernetics 61 (4)
(1989) 241–254. doi:10.1007/BF00203171.
[30] P. Tamayo, D. Slonim, J. Mesirov, Q. Zhu, S. Kitareewan, E. Dmitrovsky, E. S. Lander,
T. R. Golub, Interpreting patterns of gene expression with self-organizing maps: methods and
application to hematopoietic differentiation., Proceedings of the National Academy of
Sciences of the United States of America 96 (6) (1999) 2907–2912.
doi:10.1073/pnas.96.6.2907.
[31] M. Ashburner, C. A. Ball, J. A. Blake, D. Botstein, H. Butler, J. M. Cherry, A. P. Davis,
K. Dolinski, S. S. Dwight, T. Eppig, M. A. Harris, D. P. Hill, L. Issel-Tarver, A. Kasarskis, S.
Lewis, J. C. Matese, J. E. Richardson, M. Ringwald, G. M. Rubin, G. Sherlock, Gene
Ontology: tool for the unification of biology, Nature Genetics 25 (1) (2000) 25–29.
arXiv:10614036, doi:10.1038/75556.

33
[32] J. Cheng, M. Cline, J. Martin, D. Finkelstein, T. Awad, D. Kulp, M. a. Siani-Rose, A
knowledge-based clustering algorithm driven by Gene Ontology., Journal of
biopharmaceutical statistics 14 (March) (2004) 687–700. doi:10.1081/BIP-200025659.
[33] J. Liu, W. Wang, J. Yang, A framework for ontology-driven subspace clustering,
Proceedings of the 2004 ACM SIGKDD international conference on Knowledge discovery
and data mining - KDD ’04 (2004) 623doi:10.1145/1014052.1014130.
[34] Z. Fang, J. Yang, Y. Li, Q. Luo, L. Liu, Knowledge guided analysis of microarray data,
Journal of Biomedical Informatics 39 (4) (2006) 401–411. doi:10.1016/j.jbi.2005.08.004.
[35] D. Huang, W. Pan, Incorporating biological knowledge into distance-based clustering
analysis of microarray gene expression data, Bioinformatics 22 (10) (2006) 1259–1268.
doi:10.1093/bioinformatics/btl065.
[36] M. Brameier, C. Wiuf, Co-clustering and visualization of gene expression data and gene
ontology terms for Saccharomyces cerevisiae using self-organizing maps, Journal of
Biomedical Informatics 40 (2) (2007) 160–173. doi:10.1016/j.jbi.2006.05.001.
[37] W. Pan, Incorporating gene functions as priors in model-based clustering of microarray
gene expression data., Bioinformatics (Oxford, England) 22 (7) (2006) 795–801.
doi:10.1093/bioinformatics/btl011.
[38] J. A. Nepomuceno, A. Troncoso, I. A. Nepomuceno-Chamorro, J. S. Aguilar-Ruiz,
Integrating biological knowledge based on functional annotations for biclustering of gene
expression data, Computer Methods and Programs in Biomedicine 119 (3) (2015) 163–180.
doi:10.1016/j.cmpb.2015.02.010.
[39] A. Skabar, K. Abdalgader, Clustering Sentence-Level Text Using a Novel Fuzzy
Relational Clustering Algorithm, IEEE Transactions on Knowledge and Data Engineering 25
(1) (2013) 62–75. doi:10.1109/TKDE.2011.205.
[40] K. R. Christie, E. L. Hong, J. M. Cherry, Functional annotations for the Saccharomyces
cerevisiae genome: the knowns and the known unknowns (2009).
doi:10.1016/j.tim.2009.04.005.
[41] G. K. Mazandu, N. J. Mulder, Using the underlying biological organization of the
Mycobacterium tuberculosis functional network for protein function prediction, Infection,
Genetics and Evolution 12 (5) (2012) 922–932. doi:10.1016/j.meegid.2011.10.027.
34
[42] G. K. Mazandu, N. Mulder, DaGO-Fun: tool for Gene Ontology-based functional analysis
using term information content measures., BMC bioinformatics 14 (2013) 284.
doi:10.1186/1471-2105-14-284.
[43] G. K. Mazandu, N. J. Mulder, A topology-based metric for measuring term similarity in
the gene ontology, Advances in Bioinformatics 2012. doi:10.1155/2012/975783.
[44] T. Z. Berardini, The Gene Ontology in 2010: Extensions and refinements, Nucleic Acids
Research 38 ( SUPPL. 1). doi:10.1093/nar/gkp1018.
[45] J. Gou, Y. Wu, W. Luo, An ontology based knowledge clustering method in knowledge
space, in: 2007 IEEE International Workshop on Anti-counterfeiting, Security, Identification,
ASID, 2007, pp. 406–409. doi:10.1109/IWASID.2007.373666.
[46] H. Al-Mubaid, A. Nagar, Comparison of four similarity measures based on GO annotations
for gene clustering, in:Proceedings - IEEE Symposium on Computers and Communications,
2008, pp. 531–536. doi:10.1109/ISCC. 2008.4625763.
[47] GO Slim, 2016. URL http://geneontology.org/page/go-slim-and-subset-guide
[48] [link].URL http://www.geneontology.org/ontology/subsets/goslim_yeast.obo
[49] D. Marbach, J. C. Costello, R. Ku¨ffner, N. M. Vega, R. J. Prill, D. M. Camacho, K. R.
Allison, t. D. DREAM5 Consortium, M. Kellis, J. J. Collins, G. Stolovitzky, Wisdom of
crowds for robust gene network inference., Nature methods 9 (8) (2012) 796–804.
doi:10.1038/nmeth.2016.
[50] Saccharomyces Genome Database, 2016. URL http://www.yeastgenome.org/
[51] X. L. Xie, G. Beni, A validity measure for fuzzy clustering, IEEE Transactions on Pattern
Analysis and Machine Intelligence 13 (8) (1991) 841–847. doi:10.1109/34.85677.
[52] T. V. Prasad, R. P. Babu, S. I. Ahson, GEDAS - Gene Expression Data Analysis Suite.,
Bioinformation 1 (3) (2006) 83–85.
[53] L. Fu, E. Medico, FLAME, a novel fuzzy clustering method for the analysis of DNA
microarray data., BMC bioinformatics 8 (1) (2007) 3. doi:10.1186/1471-2105-8-3.
[54] I. H. Witten, E. Frank, M. a. Hall, Data Mining: Practical Machine Learning Tools and
Techniques (Google eBook), 2011. doi:0120884070,9780120884070.
35
[55] A. Lebreton, C. Saveanu, L. Decourty, J. C. Rain, A. Jacquier, M. Fromont-Racine, A
functional network involved in the recycling of nucleocytoplasmic pre-60S factors, Journal of
Cell Biology 173 (3) (2006) 349–360. doi:10.1083/jcb.200510080.
[56] Z. Li, I. Lee, E. Moradi, N. J. Hung, A. W. Johnson, E. M. Marcotte, Rational extension of
the ribosome biogenesis pathway using network-guided genetics, PLoS Biology 7 (10).
doi:10.1371/journal.pbio.1000213.
[57] S. Ferreira-Cerca, G. Poll,¨ P. E. Gleizes, H. Tschochner, P. Milkereit, Roles of eukaryotic
ribosomal proteins in maturation and transport of pre-18S rRNA and ribosome function,
Molecular Cell 20 (2) (2005) 263–275. doi:10.1016/j.molcel.2005.09.005.
[58] J. Dong, R. Lai, J. L. Jennings, A. J. Link, A. G. Hinnebusch, The Novel ATP-Binding
Cassette Protein ARB1 Is a Shuttling Factor That Stimulates 40S and 60S Ribosome
Biogenesis, Molecular and Cellular Biology 25 (22) (2005) 9859–9873.
doi:10.1128/MCB.25.22.9859-9873.2005.
[59] J. de la Cruz, E. Sanz-Mart´ınez, M. Remacha, The essential WD-repeat protein Rsa4p is
required for rRNA processing and intra-nuclear transport of 60S ribosomal subunits, Nucleic
Acids Research 33 (18) (2005) 5728–5739. doi:10.1093/nar/gki887.
[60] T. C. Fleischer, C. M. Weaver, K. J. McAfee, J. L. Jennings, A. J. Link, Systematic
identification and functional screens of uncharacterized proteins associated with eukaryotic
ribosomal complexes, Genes and Development 20 (10) (2006) 1294–1307.
doi:10.1101/gad.1422006.
[61] V. R. Gerbasi, C. M. Weaver, S. Hill, D. B. Friedman, A. J. Link, Yeast Asc1p and
Mammalian RACK1 Are Functionally Orthologous Core 40S Ribosomal Proteins That
Repress Gene Expression, Molecular and Cellular Biology 24 (18) (2004) 8276–8287.
doi:10.1128/MCB.24.18.8276-8287.2004.
[62] M. Rakwalska, S. Rospert, The Ribosome-Bound Chaperones RAC and Ssb1/2p Are
Required for Accurate Translation in Saccharomyces cerevisiae, Molecular and Cellular
Biology 24 (20) (2004) 9186–9197. doi:10.1128/MCB.24.20.9186-9197.2004.
[63] BioGRID — Database of Protein, Chemical, and Genetic Interactions. URL
https://thebiogrid.org/
36
[64] J. Ptacek, G. Devgan, G. Michaud, H. Zhu, X. Zhu, J. Fasolo, H. Guo, G. Jona, A.
Breitkreutz, R. Sopko, R. R. McCartney, M. C. Schmidt, N. Rachidi, S.-J. Lee, A. S. Mah, L.
Meng, M. J. R. Stark, D. F. Stern, C. De Virgilio, M. Tyers, B. Andrews, M. Gerstein, B.
Schweitzer, P. F. Predki, M. Snyder, Global analysis of protein phosphorylation in yeast.,
Nature 438 (7068) (2005) 679–84. doi:10.1038/nature04187.
[65] N. J. Krogan, G. Cagney, H. Yu, G. Zhong, X. Guo, A. Ignatchenko, J. Li, S. Pu, N. Datta,
A. P. Tikuisis, T. Punna, M. Peregr´ın-Alvarez, M. Shales, X. Zhang, M. Davey, M. D.
Robinson, A. Paccanaro, J. E. Bray, A. Sheung, B. Beattie, D. P. Richards, V. Canadien, A.
Lalev, F. Mena, P. Wong, A. Starostine, M. M. Canete, J. Vlasblom, S. Wu, C. Orsi, S. R.
Collins, S. Chandran, R. Haw, J. J. Rilstone, K. Gandi, N. J. Thompson, G. Musso, P. St Onge,
S. Ghanny, M. H. Y. Lam, G. Butland, A. M. Altaf-Ul, S. Kanaya, A. Shilatifard, E. O’Shea,
J. S. Weissman, C. J. Ingles, T. R. Hughes, J. Parkinson, M. Gerstein, S. J. Wodak, A. Emili,
J. F. Greenblatt, Global landscape of protein complexes in the yeast Saccharomyces
cerevisiae., Nature 440 (7084) (2006) 637–643. doi:10.1038/ nature04670.
[66] K. J. Dolinski, M. E. Cardenas, J. Heitman, CNS1 encodes an essential p60/Sti1 homolog
in Saccharomyces cerevisiae that suppresses cyclophilin 40 mutations and interacts with
Hsp90., Molecular and cellular biology 18 (12) (1998) 7344–52.
[67] J. A. Marsh, H. M. Kalton, R. F. Gaber, Cns1 is an essential protein associated with the
hsp90 chaperone complex in Saccharomyces cerevisiae that can restore cyclophilin 40-
dependent functions in cpr7Delta cells., Molecular and cellular biology 18 (12) (1998) 7353–
9.
[68] A. J. McClellan, Y. Xia, A. M. Deutschbauer, R. W. Davis, M. Gerstein, J. Frydman,
Diverse Cellular Functions of the Hsp90 Molecular Chaperone Uncovered Using Systems
Approaches, Cell 131 (1) (2007) 121–135. doi: 10.1016/j.cell.2007.07.036.

37
Appendix A: Gene Ontology Consortium
The Gene Ontology Consortium (GOC; http://www.geneontology.org) is a bioinformatics asset
that fills in as a far-reaching store of functional information about gene products gathered through
the use of domain-specific ontologies. The project is a collaborative exertion attempting to depict
how and where gene products act by creating evidence-supported gene-product annotations to
structured comprehensive controlled vocabularies. The Gene Ontology (GO) is a controlled
vocabulary composed of >38 000 precise defined phrases called GO terms that describe the gene
products’ molecular actions, the biological processes in which those actions occur and the cellular
locations where they are present. There are >126 million annotations to >19 million gene products
from species throughout the tree of life. Of these, there are 1.1 million manually curated
annotations, from published experimental results to 234 000 gene products. As the GOC develops
the standard language to describe the function, it also defines standards for using these ontologies
in the creation of annotations.
38
Appendix B: GO Annotations
The GO annotations are the main product of the GOC. There are two parts to a GO annotation:
first, the association between a gene product and a descriptive GO definition; and second, the
source and evidence used to make the link. The descriptive definitions, which represent an activity
or process or location in the cell of a gene product, are given a name called the GO term, and a
numerical identifier, the GO ID. Although these associations are viewed as being made to GO
terms, they are made to the descriptive definitions because sometimes names of biological
concepts or terminology used in the literature can be ambiguous.
The source of the data is a specific reference (e.g., PMID: 20952387) that describes the experiment
or analysis upon which the association was based and an evidence code such as Inferred from
Mutant Phenotype (IMP), Inferred from Direct Assay (IDA). The evidence code reflects the type
of study/analysis that supports the association.
There are two methods for making annotations: manually by curators and computationally by
automated methods. Manual annotations are made by trained curators from a range of database
groups such as Saccharomyces Genome Database (SGD), Mouse Genome Informatics (MGI) and
UniProtKB (http://www.geneontology.org/GO.annotation.species_db.shtml).
This method involves reading relevant publications, identifying the gene product(s) of interest and
translating the results from the study to a GO definition using an appropriate evidence code or by
inferring a gene products role by manual examination of its sequence features. In contrast,
automated methods predict functions of genes using a variety of criteria, but mostly by comparing
their sequence to genes with similar sequence without any manual review.
As reports of biological data can be subject to interpretation, and the state of biological knowledge
is constantly changing, to maintain consistency in curation, the GOC has come up with guidelines
to help curators interpret experimental results and map them to the closest GO term definition
possible (http://www.geneontology.org/GO.annotation.conventions.shtml). GOC uses evidence
codes to further improvement of the understanding of the gene annotation. Moreover, to point
users to the original source of the data, during recent years, the GOC has made efforts to update

39
literature-based annotations to use experimental evidence codes such as IMP or IDA as opposed
to non-experimental codes such as Traceable Author Statement (TAS), typically made from
Review articles. The GOC is also working closely with the developers of the Evidence Code
Ontology (ECO) to formalize the representation of evidence used in making annotations, a result
of which is that the evidence codes currently used by the GOC have been mapped to ECO
identifiers.

40
Appendix C: Evidence Codes
A GO annotation consists of a GO term associated with a specific reference that describes the work
or analysis upon which the association between a specific GO term and the gene product is based.
Each annotation must also include an evidence code to indicate how the annotation to a particular
term is supported. Although evidence codes do reflect the type of work or analysis described in
the cited reference which supports the GO term to gene product association, they are not
necessarily a classification of types of experiments/analyses. Note that these evidence codes are
intended for use in conjunction with GO terms, and should not be considered in isolation from the
terms. If a reference describes multiple methods that each provide evidence to make a GO
annotation to a particular term, then multiple annotations with identical GO identifiers and
reference identifiers but different evidence codes may be made.
Out of all the evidence codes available, only Inferred from Electronic Annotation (IEA) is not
assigned by a curator. Manually-assigned evidence codes fall into four general categories:
experimental, computational analysis, author statements, and curatorial statements.
a) Experimental Evidence codes
Use of an experimental evidence code in a GO annotation indicates that the cited paper
displayed results from a physical characterization of a gene or gene product that has
supported the association of a GO term. The Experimental Evidence codes are:
I. Inferred from Experiment (EXP)
II. Inferred from Direct Assay (IDA)
III. Inferred from Physical Interaction (IPI)
IV. Inferred from Mutant Phenotype (IMP)
V. Inferred from Genetic Interaction (IGI)
VI. Inferred from Expression Pattern (IEP)
b) Computational Analysis evidence codes
Use of the computational analysis evidence codes indicates that the annotation is based on
an in silico analysis of the gene sequence and/or other data as described in the cited
reference. The evidence codes in this category also indicate a varying degree of curatorial
input. The Computational Analysis evidence codes are:
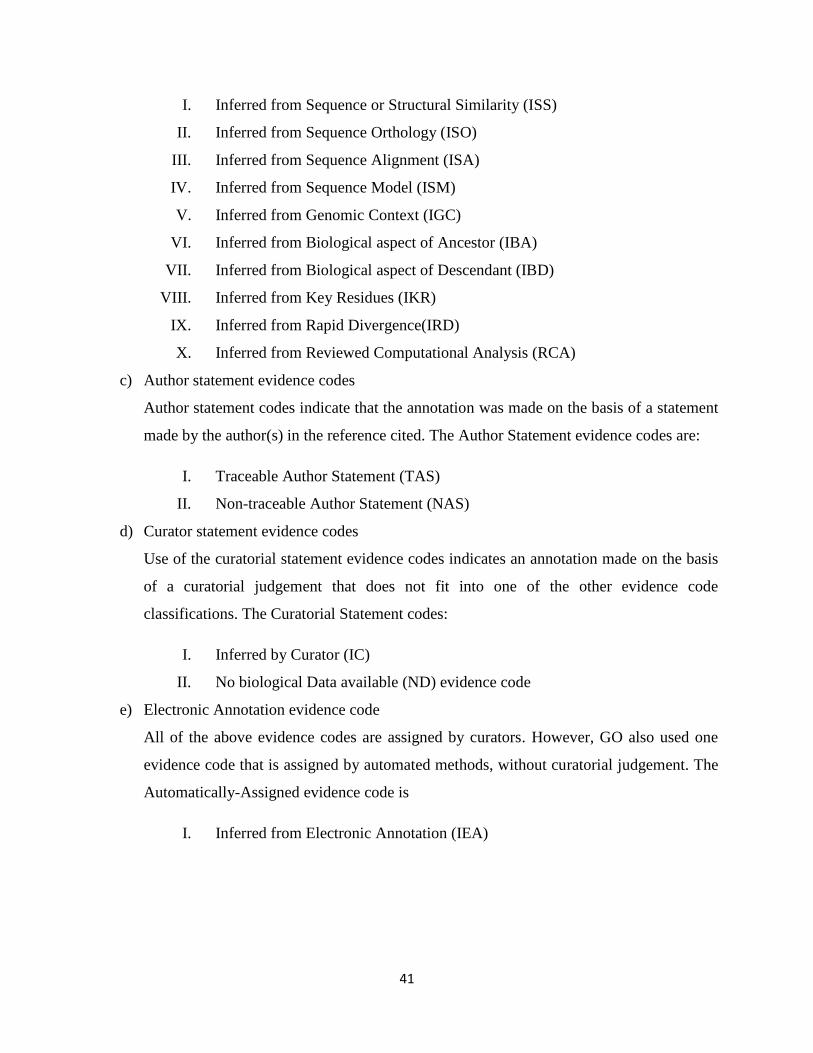
41
I. Inferred from Sequence or Structural Similarity (ISS)
II. Inferred from Sequence Orthology (ISO)
III. Inferred from Sequence Alignment (ISA)
IV. Inferred from Sequence Model (ISM)
V. Inferred from Genomic Context (IGC)
VI. Inferred from Biological aspect of Ancestor (IBA)
VII. Inferred from Biological aspect of Descendant (IBD)
VIII. Inferred from Key Residues (IKR)
IX. Inferred from Rapid Divergence(IRD)
X. Inferred from Reviewed Computational Analysis (RCA)
c) Author statement evidence codes
Author statement codes indicate that the annotation was made on the basis of a statement
made by the author(s) in the reference cited. The Author Statement evidence codes are:
I. Traceable Author Statement (TAS)
II. Non-traceable Author Statement (NAS)
d) Curator statement evidence codes
Use of the curatorial statement evidence codes indicates an annotation made on the basis
of a curatorial judgement that does not fit into one of the other evidence code
classifications. The Curatorial Statement codes:
I. Inferred by Curator (IC)
II. No biological Data available (ND) evidence code
e) Electronic Annotation evidence code
All of the above evidence codes are assigned by curators. However, GO also used one
evidence code that is assigned by automated methods, without curatorial judgement. The
Automatically-Assigned evidence code is
I. Inferred from Electronic Annotation (IEA)
42
Appendix D: ClusterJudge
ClusterJudge is not a new clustering algorithm. Rather, it is an approach to judge the quality of
data that have been clustered somewhere else. It does this by assessing the mutual information
between a gene's membership in a cluster, and the attributes it possesses, as annotated by the
Saccharomyces Genome Database (SGD).
We can upload several files of clustered data at once and compare them. ClusterJudge expects to
get your clustering result in the ".kgg" format produced by Eisen's Cluster program running k-
means clustering. Clustering results produced by other programs will have to modify, but this is a
simple task since the format is so straightforward. The uploaded files should consist of a single
line per gene. Each line should contain three words, separated by tab characters: the ORF name,
some kind of identifying name (typically just the ORF name again), and an integer indicating
which cluster it belongs to. Clusters should be numbered starting at 0. Since ClusterJudge works
by scoring the degree to which genes in the same cluster share annotation, cluster membership is
the only information it requires. We do not need to upload the original expression data.
43
Appendix E: BioGRID
BioGRID is an interaction repository with data compiled through comprehensive curation efforts.
Its current index is version 3.4.155 and searches 63,959 publications for 1,507,991 protein and
genetic interactions, 27,785 chemical associations and 38,559 post-translational modifications
from major model organism species. All data are freely provided via the search index and available
for download in standardized formats.
Copyright © 2022 FDOKUMEN