Gene Expression Profile Changes Are Commonly Modulated across Models and Species after Traumatic...
21
JOURNAL OF NEUROTRAUMA Volume 20, Number 10, 2003 © Mary Ann Liebert, Inc. Gene Expression Profile Changes Are Commonly Modulated across Models and Species after Traumatic Brain Injury JOANNE E. NATALE, 1,2 FARID AHMED, 1,2 IBOLJA CERNAK, 2 BOGDAN STOICA, 2 and ALAN I. FADEN 2 ABSTRACT Brain trauma is a major cause of morbidity and mortality, both in adult and pediatric populations. Much of the functional deficit derives from delayed cell death resulting from induction of neuro- toxic factors that overwhelm endogenous neuroprotective responses. To identify the potential mol- ecular mechanisms underlying such delayed responses, we compared gene expression patterns us- ing high-density oligonucleotide arrays at 4, 8, 24, and 72 h after moderate levels of lateral fluid percussion–induced brain injury in rats and lateral controlled cortical impact injury in mice (a to- tal of 47 profiles). Expression of 82 genes in 12 functional categories was significantly changed in both species after trauma. The largest number of gene expression changes were found in the func- tional groups related to inflammation (17%), transcription regulation (16%), and cell adhesion/ex- tracellular matrix (15%). Fifty percent of genes similarly altered across models had not been pre- viously implicated in traumatic brain injury. Of particular interest were expression changes in genes linked to neurodegeneration, such as ATF3 and lysosomal membrane glycoprotein 2, and to neu- roprotection including lipocortin 1, calponin 3, gelsolin, Id-1, and p45 NF-E2. Gene expression pro- filing across species and models may help identify candidate molecular pathways induced by brain injury, some of which may provide novel targets for therapeutic intervention. Key words: controlled cortical impact; fluid percussion; gene expression; mRNA 907 1 Research Centers for Genetic Medicine and Neuroscience, Children’s National Medical Center, Washington, D.C. 2 Department of Neuroscience, Georgetown University School of Medicine, Washington, D.C. INTRODUCTION T RAUMATIC BRAIN INJURY (TBI) induces a cascade of biochemical responses, both neurotoxic and neuro- protective that substantially determine subsequent tissue loss and associated functional deficits. However, molec- ular mechanisms underlying such delayed responses are not fully understood. Moreover, although it has long been recognized that TBI causes changes in gene expression patterns, until recently such studies have examined rela- tively small numbers of genes and/or their protein prod- ucts (for review, see Marciano et al., 2002). Microarray-based technologies can evaluate gene ex- pression changes in a highly parallel manner, allowing the measurement of changes of thousands of genes and/or expressed sequence tags as a function of time after in- jury. Several groups have recently utilized microarray technology to examine gene expression changes follow- ing controlled cortical impact injury in rodents (Kobori et al., 2002; Matzilevich et al., 2002; Long et al., 2003; Raghavendra Rao et al., 2003). The two studies using rats examined alterations during the first 24 h following in- jury in either hippocampus (Matzilevich et al., 2002) or cerebral cortex (Raghavendra Rao et al., 2003). Both
Transcript of Gene Expression Profile Changes Are Commonly Modulated across Models and Species after Traumatic...

JOURNAL OF NEUROTRAUMAVolume 20, Number 10, 2003© Mary Ann Liebert, Inc.
Gene Expression Profile Changes Are Commonly Modulatedacross Models and Species after Traumatic Brain Injury
JOANNE E. NATALE,1,2 FARID AHMED,1,2 IBOLJA CERNAK,2
BOGDAN STOICA,2 and ALAN I. FADEN2
ABSTRACT
Brain trauma is a major cause of morbidity and mortality, both in adult and pediatric populations.Much of the functional deficit derives from delayed cell death resulting from induction of neuro-toxic factors that overwhelm endogenous neuroprotective responses. To identify the potential mol-ecular mechanisms underlying such delayed responses, we compared gene expression patterns us-ing high-density oligonucleotide arrays at 4, 8, 24, and 72 h after moderate levels of lateral fluidpercussion–induced brain injury in rats and lateral controlled cortical impact injury in mice (a to-tal of 47 profiles). Expression of 82 genes in 12 functional categories was significantly changed inboth species after trauma. The largest number of gene expression changes were found in the func-tional groups related to inflammation (17%), transcription regulation (16%), and cell adhesion/ex-tracellular matrix (15%). Fifty percent of genes similarly altered across models had not been pre-viously implicated in traumatic brain injury. Of particular interest were expression changes in geneslinked to neurodegeneration, such as ATF3 and lysosomal membrane glycoprotein 2, and to neu-roprotection including lipocortin 1, calponin 3, gelsolin, Id-1, and p45 NF-E2. Gene expression pro-filing across species and models may help identify candidate molecular pathways induced by braininjury, some of which may provide novel targets for therapeutic intervention.
Key words: controlled cortical impact; fluid percussion; gene expression; mRNA
907
1Research Centers for Genetic Medicine and Neuroscience, Children’s National Medical Center, Washington, D.C.2Department of Neuroscience, Georgetown University School of Medicine, Washington, D.C.
INTRODUCTION
TRAUMATIC BRAIN INJURY (TBI) induces a cascade ofbiochemical responses, both neurotoxic and neuro-
protective that substantially determine subsequent tissueloss and associated functional deficits. However, molec-ular mechanisms underlying such delayed responses arenot fully understood. Moreover, although it has long beenrecognized that TBI causes changes in gene expressionpatterns, until recently such studies have examined rela-tively small numbers of genes and/or their protein prod-ucts (for review, see Marciano et al., 2002).
Microarray-based technologies can evaluate gene ex-pression changes in a highly parallel manner, allowingthe measurement of changes of thousands of genes and/orexpressed sequence tags as a function of time after in-jury. Several groups have recently utilized microarraytechnology to examine gene expression changes follow-ing controlled cortical impact injury in rodents (Koboriet al., 2002; Matzilevich et al., 2002; Long et al., 2003;Raghavendra Rao et al., 2003). The two studies using ratsexamined alterations during the first 24 h following in-jury in either hippocampus (Matzilevich et al., 2002) orcerebral cortex (Raghavendra Rao et al., 2003). Both

found up-regulation of genes associated with inflamma-tory responses (e.g., interleukin-1beta, monocyte in-hibitory protein-2, P-selectin, monocyte inhibitory protein-1a [MIP-1a]), oxidative stress (e.g., heme oxy-genase-1, [HO-1]), and transcription regulation (e.g., in-terferon regulator factor–1, ICER, c-fos, neuronal activity-regulated pentraxin). In addition, both studies ob-served down-regulation of glutamate receptor subtypes(e.g., GLURK3, GLUR3). Examining a more extendedpost-injury period, cortical responses were also analyzedin a mouse model (Kobori et al., 2002). Comparison ofthese studies showed a subset of genes commonly regu-lated across both species, specifically genes associatedwith inflammatory processes (e.g., MIP-1a, monocyte in-hibitory protein–1b, Fc receptor gamma), cell growth(e.g., brain derived growth factor), cell cycle regulation,and oxidative stress (e.g., GADD45, HO-1, metallo-thionein 1).
These common gene expression changes suggest thatit is possible to identify consistent transcriptional re-sponses to traumatic brain injury. However, comparingacross experimental platforms and experimental systemsmay introduce considerable variability, due to the use ofdifferent controls (sham-injured vs. normal portions ofthe brain), platforms (oligonucleotide or cDNA microar-rays), time-points, or analytical methods employed.Therefore, observed changes may in part reflect suchmethodological differences.
The purpose of the present study was to identify com-mon gene expression changes across different injurymodels (fluid percussion vs. controlled cortical impact)and species (rat vs. mouse) in order to addresses the hy-pothesis that common changes across pathobiologicallydifferent models and species may help to identify themore important secondary injury responses. Importantly,we examined the same brain regions (parietal cortex di-rectly underlying cortical impact site) in both models andcompared injured to sham-injured tissue at all time points.We also studied multiple time points (4, 8, 24, 72 h), usedreplicate samples in order to conduct statistical analyseswhile holding constant the ratio of sham to experimentalchips (2:3), conducted all expression profiling on theAffymetrix platform, and consistently applied normal-ization and filtering criteria prior to stringent statisticalanalyses.
MATERIALS AND METHODS
Experimental Injury Models
All protocols involving animals were approved by theGeorgetown University Institutional Animal Use andCare Committee and were in compliance with the stan-
dards stated in the Committee on Care and Use of Lab-oratory Animals of the Institute of Laboratory Resources,National Research Council (DHEW pub. no. [NIH] 85-23, 2985). We employed pathobiologically differentmodels in the rat and mouse. However, both reflect fre-quently used models of TBI and show many commonmechanisms of secondary injury and cell death(Yakovlev et al., 1997; Fox et al., 1998).
Rat lateral fluid percussion trauma model. During thepast 15 years we have developed and evaluated a lat-eral fluid percussion-induced traumatic brain injurymodel in rats. This model has been extensively charac-terized with regard to physiologic, biochemical, meta-bolic, behavioral and histological changes (Faden, 1989,1993; McIntosh et al., 1989; Faden et al., 1993;Yakovlev et al., 1997). Briefly, male Sprague-Dawleyrats (400 6 25 g) housed in a 12-h light, 12-h dark cy-cle with free access to standard rodent chow and water,were anesthetized with sodium pentobarbital (60 mg/kgi.p.), intubated, and implanted with tail vein and arterycatheters. Brain temperature was assessed indirectlythrough a thermister in the temporalis muscle and main-tained at 36–37°C through a feedback-controlled heat-ing system. A small craniotomy (5 mm) located mid-way between the lambda and bregma sutures over theleft parietal cortex allowed insertion of a female Leur-Loc that was cemented in place. The fluid-percussionhead injury device consisted of a Plexiglas cylindricalreservoir filled with isotonic saline; one end included atransducer that was mounted and connected to a 5 mmtube attached through a male Leur-Loc fitting. A pen-dulum struck a piston at the opposite end of the device,producing a brief 2.5 atmosphere pressure pulse lead-ing to the deformation of underlying brain and causingmoderate brain injury as defined by behavioral changesand histopathology (McIntosh et al., 1989). Three ratswere injured for each time point (4, 8, 24, and 72 h).Sham rats (four rats at the 4-h time point and tworats/time point at 8, 24, and 72 h) were subjected to thesurgery but were not injured. Three strain- and age-matched rats, not subjected to any surgery/injury, servedas the naive group. At predetermined times after surgery(4, 8, 24, and 72 h), sham and injured rats were anes-thetized with pentobarbital (100 mg/kg i.p.) and decap-itated with a sharp, small animal guillotine. The brainwas rapidly removed and placed on an iced dissectionplate. A 7-mm disk of parieto-occipital cortex, centeredon the point of impact of the injury and containing thecontusion area, was removed and immediately frozen inchilled 2-methylbutane and then stored at 280°C. Fornaive and sham rats, the same size cortical region wassampled and stored.
NATALE ET AL.
908

Mouse controlled cortical impact (CCI) model. Wehave also extensively characterized a mouse CCI modelwith regard to biochemical, behavioral and histologicalchanges (Fox and Faden, 1998; Fox et al., 1999;Yakovlev et al., 2001; Faden et al., 2003). Male C57BL/6mice (20–25 g) were housed in a 12-h light, 12-h darkcycle with free access to standard rodent chow and wa-ter. Surgical anesthesia was induced and maintained infreely breathing mice with 4% and 1.5% isoflurane re-spectively, using a flow rate of 1–1.5 L/minute oxygen.The depth of anesthesia was assessed by response of thepalpebral and pedal-withdrawal reflexes, and by moni-toring the respiration rate of the mouse. The mouse wasplaced on a heated pad and rectal temperature was main-tained at 38 6 0.2°C. The head was mounted in thestereotaxic frame of the device and a 4-mm craniotomy,between lambda and bregma on the central aspect of theleft parietal bone, was made using a tissue puncher.
The mouse controlled cortical impact injury deviceconsisted of a microprocessor-controlled pneumatic im-pactor with an interchangeable tip. The core rod of a lin-ear variable differential transducer (LVDT) was attachedto the lower end of the impactor. An oscilloscoperecorded the time/displacement curve produced by thedownward force on the LVDT, allowing precise mea-surement of the impactor velocity. The impounder tip ofthe pneumatic injury device was positioned on the sur-face of the exposed dura, and then withdrawn to create a44-mm stroke distance. A 6 m/sec impact velocity and1.5-mm deformation depth produced a moderate level ofinjury as defined by behavioral and histological outcomes(Fox et al., 1998). After the injury, anesthesia was dis-continued and each mouse placed in a heated cage for 45min during recovery from anesthesia. Sham mice (6/time-point) were subjected to the same surgery, but not in-jured. Naive mice (n 5 6) were not subjected to anysurgery/injury. At predetermined times after surgery 6
injury (4, 8, 24, and 72 h), mice were anesthetized withpentobarbital (100 mg/kg i.p.) and decapitated with asharp, small animal guillotine. The brain was rapidly re-moved and placed on an iced dissection plate. A 4-mm-diameter disk of parieto-occipital cortex, centered on thepoint of impact of the injury and containing the contu-sion area, was removed and immediately frozen in chilled2-methylbutane then stored at 280°C. For naive andsham mice, the same size cortical region was sampledand stored.
RNA Extraction, Amplification, and Hybridizationto Microarrays
To ensure adequate tissue for RNA extraction (,100mg), three mouse cortex disks were pooled prior to RNAextraction. Pooling produced two naive (from six mice)
samples, and for each experimental time point two sham(from six mice) and three injured samples (from ninemice) were obtained (n 5 22 profiles). However, corti-cal tissue from one rat provided sufficient RNA withoutthe need for pooling (n 5 25 profiles). Frozen brain tissue was rapidly homogenized using a Polytron(Brinkmann Instruments, Westbury, NY) in TRIzolreagent (Invitrogen Corp., Carlsbad, CA), then RNA ex-tracted with chloroform, and precipitated in isopropyl al-cohol. Total RNA was purified using an RNeasy kit (Qi-agen Inc., Valencia, CA) prior to quantification. To detectextensive degradation, purified RNA was run on anagarose gel prior to cDNA synthesis. Degraded RNA wasnot used for hybridization. Procedures for cRNA prepa-ration and GeneChip processing were performed as pre-viously described. Briefly, seven micrograms of totalRNA from each tissue sample were converted into dou-ble-stranded cDNA with an oligo-dT primer containingT7 RNA polymerase promoter. Purified double-strandedcDNA was converted to biotin-labeled cRNA. Each fragmented cRNA sample was hybridized to rat U34A or mouse Mu74Av2 oligonucleotide microarrays(Affymetrix Inc., Santa Clara, CA) for 16 h at 60 rpm at45°C. The mouse Mu74Av2 microarray contains,12,500 full-length sequences and expressed sequencetags (referred to as probe sets or genes throughout thistext), while the rat U34A microarray contains ,8800probe sets. After hybridization, each microarray was thenwashed and stained on the Affymetrix Fluidics Station400 using instructions and reagents provided byAffymetrix. Raw intensity data were captured, and theAffymetrix GeneChip® software MAS 5.0 was used tocalculate signal intensity values for each oligonucleotideprobe set in each genome (mouse or rat). A scaling fac-tor, with a target intensity of microarray sector fluo-rescence to 800, was automatically applied to each microarray by the MAS 5.0 algorithm, permitting repro-ducible interarray comparisons. Probe sets hybridizationperformance (pairs of 20 perfect match and mismatch25mer oligonucleotides per probe sets) identified signalintensities that were reliably detected as present, andeliminated most non-specific cross-hybridization signals,as previously described (Chen et al., 2000; Bakay et al.,2002).
Microarray Quality Control, Correction forSaturated Probe Sets, and Normalization
Within both species, each microarray underwent astringent quality control evaluation as previously de-scribed (Chen et al., 2000; Di Giovanni et al., 2003). Thefollowing parameters were considered: cRNA foldchanges (amount of cRNA obtained from starting totalRNA); scaling factor; percentage of probe sets reliably
GENE PROFILES MODULATED AFTER BRAIN TRAUMA
909

detected (present); mean signal value indicating the rel-ative abundance of a probe set; and correlation coeffi-cient of mean signal values for each transcript betweenmicroarrays at the same experimental time point. In ad-dition, control charts were generated using scaling factorand percentage present probe sets to identify systematicerrors in the expression profiling process. Identificationof microarrays with scaling factor or percent present $2standard deviations above or below the mean, as shownin Figure 1, alerted us to the possibility of significant er-rors in laboratory methods.
We used a high setting for the microarray scanner pho-tomultiplier tube to maximize sensitivity of low abundanttranscripts at the expense of intensity saturation of highabundant transcripts. Therefore, for the chips in themouse genome, we used an algorithm to detect probe setsthat became saturated by the biotin/streptavidin/phyco-erythrin amplification (T. Teslovich, unpublished data).For each of these probe sets, the saturated intensity valuewas replaced with non-saturated intensity signal gener-ated by the initial streptavidin/phycoerythrin scan acrossall microarrays in the mouse experiment. This saturatedprobe set procedure was repeated for the microarrays inthe rat experiment.
Data Filtering and Statistical Analysis
We based all further analysis only on those probe setsthat were detected in 40% or more of the microarrays
comprising the complete microarray series for each ex-perimental model. This data scrubbing retained the probesets with the most reliable and consistent performancebetween multiple measurements among arrays of thesame experimental group (Di Giovanni et al., 2003).
Experiment normalization and statistical analysis wereperformed using GeneSpring software, version 5.0 (Sili-con Genetics, Redwood, CA). For each probe set, signalintensity from injured and sham controls were normal-ized to the mean signal intensity generated from the samecortical region from three naive rats or mice. We identi-fied significantly regulated genes using two methods. Formethod 1, normalized signal intensities for each probeset were compared between sham (n 5 8 or 10) and in-jured (n 5 12) microarrays within each experimentalmodel. Two criteria were then applied in order for a re-sponse to be significant: (1) at least a two-fold change insignal intensity and (2) meeting a criterion p-value ,0.05using a Welch t-test, without correction for multiple com-parisons. Method 1 pooled chips from all time points andwas therefore more stringent because it was less likely todetect mRNA levels that were variably expressed whencompared to sham at only one time point. To improveidentification of probe sets that may have been signifi-cantly regulated at only one point post-injury, we alsoidentified genes as “significant” if they met these sametwo criteria when samples (sham versus injured) werecompared within each time point (method 2). The com-bination of fold change threshold and p values serves toeliminate most false positives, producing a more strin-
NATALE ET AL.
910
TABLE 1. OLIGONUCLEOTIDE SEQUENCES FOR REVERSE TRANSCRIPTASE-PCR
Gene name Sequence Product size
RPL-19 59-ggtactgccaacgctcggat-39 325RPL-19 59-ccttggacagagtcttgatgat-39Peripheral-type benzodiazepine receptor 59-ctctacactggtcagctggctc-39 309Peripheral-type benzodiazepine receptor 59-acccatgatgcctggctggcag-39
C-C chemokine receptor 5 59-cacattgtcaaacgcttctgcca-39 308C-C chemokine receptor 5 59-ttactgtctcatcaatacattctc-39
Metallothionein-1 59-cctgcacctgctccagctcc-39 287Metallothionein-1 59-tggaggtgtacggcaagactc-39Myelin-associated glycoprotein 59-gattgccattgtctgctacatca-39 326Myelin-associated glycoprotein 59-actcagccagctcctctgtca-39
Neurokinin 59-catggtcagatctctcacaaaag-39 300Neurokinin 59-tagaattacaatgcttattggcac-39
Cathepsin D 59-atgaactacacccagagaagtaca-39 313Cathepsin D 59-agcaacactaggcgagtgtgaat-39Hemoglobin beta 59-ctgctgattgtctacccttgga-39 320Hemoglobin beta 59-tggaaggcagcctgtgcact-39
TMP21-I 59-gagatcgcaaaagttgagaaact-39 296TMP21-I 59-agcgatgttctgctggctcca-39
PRL-19, ribosomal protein (housekeeping gene).

gent list. To accurately identify significantly regulatedgenes shared by both species, cross species probe setmatches were identified using UniGene and the Programin Genomic Applications web site http://pga.tigr.org/tigr-scripts/xref/list.pl. Furthermore, each match was verifiedby direct sequence matching of significantly regulated ratand mouse genes.
Microarray Validation: Semi-Quantitative ReverseTranscriptase–Polymerase Chain Reaction
One mg of total RNA was used for cDNA synthesisusing SuperScript reverse transcriptase and oligo (dT)-primer (Invitrogen Corp., Carlsbad, CA). The amount ofsynthesized cDNA was evaluated by PCR using primers
GENE PROFILES MODULATED AFTER BRAIN TRAUMA
911
FIG. 1. Control charts showing variability in microarray processing across each experiment. (A) Rat fluid percussion injury ex-periment. Percentage present call (upper panel) and scaling factor (lower panel) are plotted for each chip in the order that chipswere hybridized. Mean and standard deviation for percentage present call or scaling factor were calculated for all chips in the ex-periment. Horizontal lines indicated the mean (solid line), one standard deviation (dotted lines), and two standard deviations(dashed lines) above and below the mean. Chips with control values falling outside 2 standard deviations from the mean areflagged (chips 20, 22, 23). All chips processed under the same conditions as flagged chips are excluded (gray region) from fur-ther analysis. (B) Mouse controlled cortical impact. Same as A. One chip, 3, failed to meet control standards and was excluded.

specific for ribosomal protein RPL19. Polymerase chainreactions (PCR) were performed in a PTC-225 ThermalCycler (MJ Research, Waltham, MA) using AmpliTaqpolymerase (Applied Biosystems, Foster City, CA). EachPCR reaction was repeated at least twice. The thermal cy-cling parameters were as follows: 1 min 30 sec at 94°Cfollowed by 30 cycles of 30 sec at 94°C, 1 min 30 sec at59°C, 1 min at 72°C and final incubation for 5 min at72°C. PCR reaction products were analyzed by agarosegel-electrophoresis. Intensity of sham (n 5 2) and injured(two samples randomly selected from three samples ateach time point) cDNA was adjusted with 2 randomly se-lected naive samples using the housekeeping gene RPL-19. Normalized cDNA was then used to estimate the rel-ative abundance of C-C chemokine receptor 5 (CCR5),cathepsin D, hemoglobin beta, metallothionein 1 (Mt 1),myelin-associated glycoprotein (MAG), neurokinin, pe-ripheral benzodiazepine receptor (PBR), tissue inhibitorof metalloproteinase 1 (TIMP-1), and transmembrane pro-tein Tmp21-I. Primers (Invitrogen Corp., Carlsbad, CA)for each gene were located in different exons (Table 1).Different dilutions of cDNA samples were used for dif-ferent genes to provide a linear range for PCR. The in-tensity of DNA bands was measured using UN-SCAN-ITgel digitizing software (Silk Scientific Inc., Orem, UT).
Functional Classification of Genes
The 82 differentially expressed genes were assignedfunctional annotations based on information in publiclyavailable sources including Gene Ontology and PubMed.It is recognized that a given gene may have multiple func-tions and that a variety of assignment systems can be con-structed. For these analyses, each gene was assigned toonly one functional class.
RESULTSStringent Quality Assurance Improves Reliability of Microarray Results
We applied stringent quality control standards and datafiltering using methods previously reported by our labo-
ratory (Di Giovanni et al., 2003). As shown in Table 2,these included an evaluation of the scaling factor, pro-portion of present probe sets, mean signal value, and ob-served correlation between signal values for each genebetween microarrays obtained at the same experimentaltime point and from the same experimental model. Weobtained highly reliable gene expression profile data inboth the rat and mouse model. Furthermore, since the mi-croarrays used in this study were processed over a five-month period, we used control charts to demonstrate thatour process remained in statistical control over the courseof the experiment (Brassard, 1996). Figure 1 displayscontrol charts of present calls and scaling factor versuschip number assigned sequentially by the order in whichthey were hybridized. Data for both the rat and the mouseare displayed. Quality control standards (values withintwo standard deviations above or below the mean valuefor all chips in the experiment) were not achieved forthree rat microarrays (chips 20, 22, 23). We subsequentlyidentified reagent contamination during the fragmenta-tion step as the cause, and then successfully repeated theexpression profiling for these and five additional chips(18–19, 21, 24–25) that were processed under the sameconditions. Quality control standards (values within twostandard deviations above or below the mean value forall chips in the experiment) were not achieved for onemouse microarrays (chip 3). The nine chips that failed tomeet quality control criteria (gray regions) were not usedin subsequent analyses. Thus, these quality control meth-ods permit identification of aberrant individual chips thatmight not have been detected in statistical analyses.
Temporal Profiling Demonstrates Serial Gene Regulation after TBI
Approximately half of the probe sets fulfilled the re-quirement of .40% of the microarrays showing a “pre-sent” call for each gene (3751 probe sets from the 8800represented on the rat U34A chip [43%]; 6216 probe setsfrom the 12,488 represented on the mouse Mu74Av2 chip[50%]). Of the 3751 rat probe sets analyzed, we foundthat 266 (7%) showed a significant change in expression
NATALE ET AL.
912
TABLE 2. QUALITY CONTROL VALUES (MEAN AND RANGE) FOR 33 U34A AND 24 MU74AV2 GENE CHIPS
U34A (rat) Mu74Av2 (mouse)
Mean 6 SD Range Mean 6 SD Range
Scaling factor 0.83 6 0.3 0.42–1.33 0.66 6 0.3 0.40–1.01% Present 39.5 6 4.9 30.4–48.6 48.1 6 2.2 43.8–51.3Signal value 2327 6 217 1824–2752 1865 6 112 1703–2013Signal correlationa 0.89 6 0.1 0.73–0.96 0.95 6 0.03 0.88–0.98
aMean between chip pair-wise correlation of signal intensities.

level after injury using Method 1 (pooling across timepoints for identifying genes significantly changed by.two-fold after injury). Of these changes, 181 had in-creased expression while 85 had decreased. Similarly, inour mouse model a total of 506 (8%) genes showed sig-nificant changes in expression, of which 350 were up-regulated and 156 downregulated using the same criteriadescribed for rat.
Next we determined the time points when these geneswere at least two-fold up or down regulated (Fig. 2A forrat; Fig. 2B for mouse). The number of upregulated genesgenerally increased over the 72-h time period from 44 at4 h to 130 at 72 h in the rat and from 64 to 260 in themouse. While the absolute numbers are without biologi-cal significance, these data demonstrate serial upregula-
tion of relevant genes during the first 72 h after brain in-jury. We also note the large proportion of genes at 72 hthat are only induced at that one time point (53% of allrat genes induced at 72 h are not present at any of theearlier time points; 37% of all mouse genes induced at72 h are similarly not present at 4–24 h after injury). Thiscontrasts sharply with each of the other time points atwhich 10–24% of the expressed genes are confined to asingle time point.
Comparison across the Two Models IdentifiesCommonly Expressed Genes
Our analyses focused on identification across speciesand models of “essential” genes consistently responding
GENE PROFILES MODULATED AFTER BRAIN TRAUMA
913
FIG. 2. Venn diagrams showing numbers of genes significantly upregulated or downregulated in each species. Numbers ofgenes regulated at more than one time point are found in the cells encircled by intersection of those time points. (A) Numbers ofgenes that were upregulated (left panel) or downregulated (right panel) in parietal cortex at 4 h (solid line), 8 h (dotted line), 24h (gray line), and 72 h (dashed line) after fluid percussion injury in rats. Number of genes in cells: a, 6; b, 1; c, 0; d, 14; e–g, 0;h, 2. (B) Numbers of genes that were upregulated (left panel) or downregulated (right panel) in parietal cortex at 4 h (solid line),8 h (dotted line), 24 h (gray line), and 72 h (dashed line) after controlled cortical impact injury in mice. Number of genes in cells:i, 8; j, 2; k, 1; l, 61; m–o, 0; p, 12.

to the stress of traumatic injury. Sequence matching iden-tified 67 genes significantly regulated across both speciesusing method 1. Method 2, which compared gene ex-pression levels between experimental and sham tissuewithin each time point, identified 192 (5%) and 416 (7%)significantly regulated genes in the rat and mouse ex-periments, respectively. Of these, we found 15 genes notidentified by Method 1 to be significantly regulated bymethod 2.
Overall, 82 genes identified using method 1 and/ormethod 2 were significantly regulated across both mod-els and all subsequent analyses focus on this subset ofgenes. The 82 genes regulated in common across the twomodels were categorized with respect to known func-tions, as displayed in Figure 3. The highest proportion ofgenes commonly altered between the two models re-flected inflammation (17%) or transcription regulation(16%). However, we identified numerous genes relatedto cell adhesion/extracellular matrix, cytoskeleton, andRBC-related, which have previously received little at-tention in TBI molecular pathobiology.
Gene functions were broadly grouped into those in-volved in biological processes or cellular functions. Asshown in Figure 4, we examined the proportion of genesin each biological process class that was regulated at eachtime point and within each model. For example, of thegenes regulated at 4 h after fluid percussion injury in therat, 8% were in the apoptosis/cell cycle class. These datademonstrate expression of genes regulating cell adhesion,inflammation, and oxidative stress in both models by 4–8h. By 8 h, genes associated with apoptosis/cell cycle areupregulated in the mouse injured cortex. Similarly, Fig-ure 5 shows the relative contribution of the seven cellu-lar functional classes that were regulated at each timepoint and within each model. Expression of RBC-relatedgenes occurred rapidly, suggesting mRNA release fromdamaged RBC quickly after injury. Genes associated withthe actin cytoskeleton and cellular motility were upreg-ulated 8–72 h after cortical injury. Genes related to pro-teolysis were markedly upregulated at 72 h. Taken to-gether, these results indicate that inflammation andoxidative stress, as well as changes in transcriptional reg-ulation and calcium binding, participate in the brain’s re-sponse to injury. Furthermore, the induction of genes re-lated to cell adhesion/ECM, cytoskeleton, and proteolysisappear to reflect more delayed components of the sec-ondary injury response.
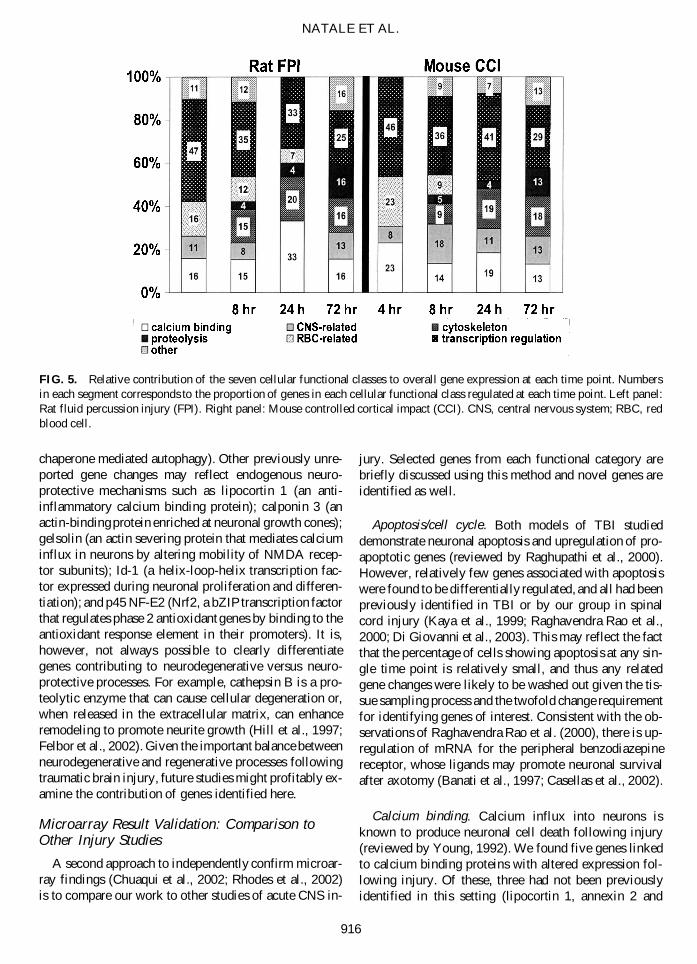
The 82 genes regulated in common in both of the ro-dent models are shown in Table 3, grouped by functioninto the 12 categories provided above. Within these cat-egories, genes are displayed by the temporal onset of theirexpression following injury in the rat model, permittinga direct comparison of results between the rat and mouse
models. In addition, as shown in Table 3, we identified42 genes not previously reported as regulated followingtraumatic brain injury (indicated by Ï). These are dis-tributed across the 11 categories of previously identifiedgenes but also contribute a new category of genes (redblood cell-related) not previously identified in models ofTBI. In addition, to identify additional genes or processesthat may contribute to TBI pathobiology, we selected twoof the genes not previously implicated in TBI as anchorgenes for coordinate clustering. With the transcriptionfactor p45 NF-E2 (Nrf2) as an anchor gene, we imposedPearson coordinate clustering across the 3751 genes thatfulfilled the requirement of .40% of the microarraysshowing a “present” call for each gene in the rat exper-iment (Fig. 6A). A branch of eight genes among the 59genes highly coordinately regulated to Nrf2 (R 5 0.99)contained the oxidative stress response genes glutathioneperoxidase, ferritin, and ceruloplasmin. Similarly, lyso-somal membrane glycoprotein 2 (Lamp2) served as theanchor for clustering across the 6216 genes in the mouseexperiment (Fig. 6B). A branch of nine genes highly co-ordinately regulated to Lamp2 (R 5 0.99) containedgenes with function related to cell adhesion/ECM in-cluding junctional adhesion molecule, lumican, and se-creted acidic cysteine rich glycoprotein (SPARC).
Microarray Result Validation: RT-PCR
To validate our microarray results, we used semi quan-titative RT-PCR with nine genes representing most func-tional categories. RT-PCR confirmed the direction andrelative magnitude of change in gene expression betweensham and injured samples (Fig. 7). Between comparisonof the magnitude of the microarray and the RT-PCR ex-pression results, these two independent methods show thesame general pattern of expression for all genes studied.
DISCUSSION
Patterns of gene expression changes that are conservedacross species and TBI models may help to identify fac-tors involved in secondary injury response, both neuro-toxic and neuroprotective. The 82 genes showing con-sistent expression changes across these models are likelyto contain critical modulators of cell death and/or regen-eration following trauma. Among these are numerousgenes that have not been previously implicated in thepathobiology of traumatic brain injury, including genesimplicated in neuronal regeneration and neurite out-growth.
NATALE ET AL.
914

Secondary Brain Injury: Novel Gene Expression Patterns Suggestive of Degeneration or Regeneration
TBI expression profiling revealed altered regulation ofprocesses linked both to neural degeneration and regen-eration. In the injured cortex we observed altered regu-lation of numerous genes that have been associated with
neurodegenerative or restorative processes in a variety ofmodels of CNS disease or injury. Several genes identi-fied in this study but not previously implicated in TBIthat have been associated with tissue degeneration: thetranscription factor ATF3 (member of ATF/CREB fam-ily of transcription factors induced by stress in neurons),myelin associated glycoprotein, and lysosomal mem-brane glycoprotein 2 (receptor for substrate proteins of
GENE PROFILES MODULATED AFTER BRAIN TRAUMA
915
FIG. 3. Functional classes of the 82 genes regulated in both models and across both species. Genes were assigned to a func-tional class based on their reported function. Pie chart showing percentage of genes assigned to each functional category. Bothup and downregulated genes are shown. Five functional classes (box surrounding name) are involved in biological processes whilethe remaining seven relate to cellular functions. CNS, central nervous system; ECM, extracellular matrix; RBC, red blood cell.
FIG. 4. Relative contribution of the five biological processes to overall gene expression at each time point. Numbers in eachsegment corresponds to the proportion of genes in each biological process class regulated at each time point. Left panel: Rat fluidpercussion injury (FPI). Right panel: Mouse controlled cortical impact (CCI). ECM, extracellular matrix.
chaperone mediated autophagy). Other previously unre-ported gene changes may reflect endogenous neuro-protective mechanisms such as lipocortin 1 (an anti-inflammatory calcium binding protein); calponin 3 (anactin-binding protein enriched at neuronal growth cones);gelsolin (an actin severing protein that mediates calciuminflux in neurons by altering mobility of NMDA recep-tor subunits); Id-1 (a helix-loop-helix transcription fac-tor expressed during neuronal proliferation and differen-tiation); and p45 NF-E2 (Nrf2, a bZIP transcription factorthat regulates phase 2 antioxidant genes by binding to theantioxidant response element in their promoters). It is,however, not always possible to clearly differentiategenes contributing to neurodegenerative versus neuro-protective processes. For example, cathepsin B is a pro-teolytic enzyme that can cause cellular degeneration or,when released in the extracellular matrix, can enhanceremodeling to promote neurite growth (Hill et al., 1997;Felbor et al., 2002). Given the important balance betweenneurodegenerative and regenerative processes followingtraumatic brain injury, future studies might profitably ex-amine the contribution of genes identified here.
Microarray Result Validation: Comparison toOther Injury Studies
A second approach to independently confirm microar-ray findings (Chuaqui et al., 2002; Rhodes et al., 2002)is to compare our work to other studies of acute CNS in-
jury. Selected genes from each functional category arebriefly discussed using this method and novel genes areidentified as well.
Apoptosis/cell cycle. Both models of TBI studieddemonstrate neuronal apoptosis and upregulation of pro-apoptotic genes (reviewed by Raghupathi et al., 2000).However, relatively few genes associated with apoptosiswere found to be differentially regulated, and all had beenpreviously identified in TBI or by our group in spinalcord injury (Kaya et al., 1999; Raghavendra Rao et al.,2000; Di Giovanni et al., 2003). This may reflect the factthat the percentage of cells showing apoptosis at any sin-gle time point is relatively small, and thus any relatedgene changes were likely to be washed out given the tis-sue sampling process and the twofold change requirementfor identifying genes of interest. Consistent with the ob-servations of Raghavendra Rao et al. (2000), there is up-regulation of mRNA for the peripheral benzodiazepinereceptor, whose ligands may promote neuronal survivalafter axotomy (Banati et al., 1997; Casellas et al., 2002).
Calcium binding. Calcium influx into neurons isknown to produce neuronal cell death following injury(reviewed by Young, 1992). We found five genes linkedto calcium binding proteins with altered expression fol-lowing injury. Of these, three had not been previouslyidentified in this setting (lipocortin 1, annexin 2 and
NATALE ET AL.
916
FIG. 5. Relative contribution of the seven cellular functional classes to overall gene expression at each time point. Numbersin each segment corresponds to the proportion of genes in each cellular functional class regulated at each time point. Left panel:Rat fluid percussion injury (FPI). Right panel: Mouse controlled cortical impact (CCI). CNS, central nervous system; RBC, redblood cell.

917
TA
BL
E3.
GE
NE
SR
EG
UL
AT
ED
AF
TE
RT
RA
UM
AT
ICB
RA
ININ
JUR
YIN
BO
TH
SPE
CIE
SG
RO
UP
ED
BY
GE
NE
FU
NC
TIO
N
Rat
FP
IM
ouse
CC
I
Fol
d ch
ange
aF
old
chan
gea
Gen
e sy
mbo
lG
enB
ank
4 h
8 h
24 h
72 h
Gen
Ban
k4
h8
h24
h72
h
Bio
logi
cal
proc
ess
Apo
ptos
is/c
ell
cycl
eM
ycY
0039
63.
522.
332.
731.
95c-
myc
L00
039
1.95
3.72
2.08
4.24
!B
zrp
J051
221.
272.
062.
673.
37pe
riph
eral
ben
zodi
azep
ine
rece
ptor
D21
207
1.01
1.09
1.28
2.04
Gad
d45a
AI0
7029
51.
511.
853.
354.
74G
AD
D45
alp
haU
0093
71.
292.
592.
711.
12C
ell
adhe
sion
/EC
MP
lat
M23
697
2.09
1.73
1.68
21.
10ti
ssue
pla
smin
ogen
act
ivat
orb
J035
201.
461.
691.
842.
68S
pp1
M14
656
8.56
34.7
252
.53
133.
35os
teop
onti
nX
1398
62
1.00
3.10
13.5
636
.79
!Ic
am1
D00
913
4.04
3.64
1.28
2.23
inte
rcel
lula
r ad
hesi
on m
olec
ule-
1M
9055
13.
455.
321.
552.
23T
imp
Al1
6932
73.
575.
895.
863.
44ti
ssue
inh
ibit
or o
f m
etal
lopr
otei
nase
IV
0075
51.
897.
575.
314.
25D
ab2
U95
178
1.04
2.53
1.93
2.89
disa
bled
hom
olog
2U
1886
91.
652.
494.
255.
75!
Fn1
X05
834
1.06
1.40
2.98
3.40
fibr
onec
tin
M18
194
1.14
1.16
1.56
2.20
Col
1a1
Al2
3147
22
1.87
21.
101.
302.
14co
llag
en,
type
1,
alph
a 1b
U03
419
22.
222
1.21
1.46
6.56
!It
gb1
Al1
7736
61.
041.
241.
462.
76in
tegr
in b
eta
1X
1520
21.
441.
322.
191.
98!
Lum
X84
039
21.
061.
181.
233.
57ke
rati
n su
lfat
e pr
oteo
glyc
an l
umic
anA
F01
3262
1.03
1.10
1.99
3.30
Ptp
rzU
0499
81.
082
1.73
21.
152.
40ph
osph
acan
bA
J133
130
1.01
22.
002
1.66
1.14
Mgl
apA
l012
030
1.07
1.37
1.95
3.37
mat
rix
Gla
-pro
tein
D00
613
21.
132.
312.
082.
45!
Alc
amA
B00
8538
21.
072
2.04
21.
692
1.73
CD
166
L25
274
21.
092
2.89
22.
902
1.94
Hea
t sh
ock
Hsp
70-2
Z75
029
6.71
10.8
821
.38
3.11
HS
P70
.2M
2056
72
1.20
21.
422
2.32
22.
00H
spt7
0X
1570
52
1.02
1.11
3.47
1.49
HS
P70
AF
1099
051.
522.
314.
315.
95In
flam
mat
ion
C3a
r1U
8637
92.
241.
561.
342.
88C
3a a
naph
ylat
oxin
che
mot
acti
c re
cept
orU
7746
11.
792.
033.
195.
02!
Cm
kbr5
Y12
009
2.45
3.19
2.22
1.54
C-C
che
mok
ine
rece
ptor
5A
V37
0035
1.31
2.96
3.25
3.36
!If
i1X
6138
12.
052.
343.
702.
38In
terf
eron
-ind
ucib
le p
rote
inU
1911
91.
411.
961.
652.
15!
Scy
a2X
1705
316
.96
23.2
17.
0713
.20
mon
ocyt
e ch
emoa
ttra
ctan
t pr
otei
n-1
M19
681
5.13
61.7
389
.24
44.1
7L
cn2
AA
9465
032.
8017
.73
19.4
68.
22ne
utro
phil
gel
atin
ase-
asso
ciat
ed l
ipoc
alin
X81
627
5.02
15.2
038
.25
7.38
!Il
1r2
Z22
812
1.51
3.20
1.68
1.57
inte
rleu
kin-
1 re
cept
orX
5976
91.
212.
342.
162.
10C
d53
M57
276
1.50
2.99
1.91
7.77
CD
53 (
Leu
kocy
te a
ntig
en M
RC
OX
-44)
X97
227
2.16
3.15
5.00
7.68
Cd9
X76
489
21.
182.
441.
382.
32C
D9
L08
115
21.
111.
172.
074.
63!
Lga
ls3
J029
621.
994.
275.
8633
.78
gale
ctin
-3/M
ac-2
ant
igen
X16
834
7.89
34.5
950
.69
121.
32C
d63
X61
654
1.73
1.87
2.58
3.06
CD
63 a
ntig
en m
ast
cell
D16
432
1.24
1.42
3.00
3.70
C1q
bX
7112
71.
052
1.08
1.31
5.17
com
plem
ent
C1q
B c
hain
M22
531
1.00
1.61
2.56
5.60
!Ii
X13
044
1.56
1.79
1.77
4.95
MH
C c
lass
II/
CD
74X
0049
61.
431.
431.
743.
47
(con
tinue
d )
918
Oxi
dati
ve s
tres
sM
t1M
1179
42.
464.
287.
461.
88m
etal
loth
ione
in I
V00
835
1.52
2.52
1.86
1.37
Hm
ox1
J027
222.
716.
723.
7619
.92
hem
e ox
ygen
ase
1X
5682
41.
293.
224.
976.
91C
pL
3386
91.
312.
282.
384.
58ce
rulo
plas
min
U49
430
1.52
3.37
4.63
2.90
!M
t2A
l176
456
1.76
2.39
15.2
14.
33m
etal
loth
ione
in I
IK
0223
61.
773.
123.
161.
87F
tl1
Al2
3180
71.
081.
271.
722.
48fe
rrit
in l
ight
cha
inL
3987
91.
271.
551.
643.
00!
Cel
lula
r fu
nctio
nC
alci
um b
indi
ngS
100a
8A
A95
7003
8.16
34.1
466
.42
4.50
calg
ranu
lin
A/M
RP
-8M
8321
84.
2414
.65
8.52
2.45
Anx
a2L
1303
92.
013.
142.
904.
85ca
lpac
tin 1
hea
vy c
hain
/ann
exin
A2
M14
044
1.67
4.17
4.31
4.94
!A
nxa1
Al1
7196
23.
412.
032.
974.
45ca
lpac
tin I
I/lip
ocor
tin
1/an
nexi
n A
1M
6926
03.
442.
244.
174.
12!
S10
0a10
J036
271.
472.
132.
384.
41ca
lpac
tin 1
lig
ht c
hain
/S10
0A11
M16
465
1.05
1.55
3.46
3.11
!S
100a
4X
0691
61.
211.
753.
129.
95pl
acen
tal
calc
ium
-bin
ding
pro
tein
M36
579
1.55
1.96
2.23
5.62
CN
S-re
late
dF
abp7
U02
096
1.15
21.
442
1.02
4.27
fatt
y ac
id b
indi
ng p
rote
inb
U04
827
21.
152
2.85
21.
923.
59!
Mag
M22
357
22.
861.
022
1.33
6.87
mye
lin-
asso
ciat
ed g
lyco
prot
einb
M31
811
21.
091.
982.
152.
14!
Pen
k1S
4949
12
2.20
21.
822
1.14
22.
00pr
oenk
epha
lin
AM
5518
11.
552.
672.
682.
19G
ria2
M38
061
21.
062
2.30
21.
572
1.63
glut
amat
e re
cept
or i
onot
ropi
c, A
MP
A 2
L32
372
21.
112
2.40
22.
382
2.61
Tac
1M
1519
12
1.79
22.
262
1.06
21.
64ne
urok
inin
1/s
ubst
ance
PD
1758
42.
042.
921.
351.
20!
Stx
1aD
1039
21.
142
1.51
21.
312
2.22
HP
C-1
/syn
taxi
nD
4520
82
1.09
1.14
21.
972
2.05
!C
ytos
kele
ton
Myh
9U
3146
31.
002.
501.
271.
99m
yosi
n he
avy
chai
n IX
AI5
0545
31.
861.
812.
652.
77A
rpc1
bA
F08
3269
1.06
2.08
2.07
4.57
acti
n-re
late
d pr
otei
n co
mpl
exA
W21
2775
1.17
2.03
2.35
2.61
Gfa
pA
F02
8784
21.
623.
222.
8915
.98
GF
AP
X02
801
21.
411.
723.
707.
41C
nn2
AA
8940
041.
462.
401.
866.
11ge
lsol
inb
Z19
543
1.15
1.35
1.33
2.41
!C
nn3
AA
9444
221.
421.
402.
391.
97ca
lpon
in 3
AW
1256
261.
351.
903.
182.
40!
Tpm
4J0
2780
1.33
1.93
1.29
2.43
trop
omyc
in 4
Al8
3585
81.
452.
233.
103.
52!
Map
tA
l227
608
21.
152
1.23
21.
492
2.14
mic
rotu
bule
-ass
ocia
ted
prot
ein
tau
M18
775
21.
012
1.64
21.
342
2.05
Pro
teol
ysis
Lyz
sA
A89
2775
1.48
3.49
2.14
12.8
9ly
sozy
me
Cb
M21
050
1.64
4.13
5.84
42.6
1C
tsb
X82
396
1.29
21.
451.
532.
77ca
thep
sin
Bb
M65
270
21.
131.
381.
492.
17!
Cts
dX
5446
72
1.28
21.
081.
123.
76ca
thep
sin
D-b
X68
378
21.
081.
371.
383.
50C
tsl
Al1
7659
51.
301.
341.
853.
05ca
thep
sin
LX
0608
61.
061.
341.
963.
39L
amp2
AA
8007
871.
272
1.12
1.55
2.76
lyso
som
al m
embr
ane
glyc
opro
tein
2A
l747
194
1.29
1.30
1.81
2.95
!
TA
BL
E3.
GE
NE
SR
EG
UL
AT
ED
AF
TE
RT
RA
UM
AT
ICB
RA
ININ
JUR
YIN
BO
TH
SPE
CIE
SG
RO
UP
ED
BY
GE
NE
FU
NC
TIO
N(C
ON
T’D
)
Rat
FP
IM
ouse
CC
I
Fol
d ch
ange
aF
old
chan
gea
Gen
e sy
mbo
lG
enB
ank
4 h
8 h
24 h
72 h
Gen
Ban
k4
h8
h24
h72
h

919
RB
C-r
elat
edH
ba-a
1A
l178
971
6.24
3.19
1.91
1.27
hem
oglo
bin
alph
a-1
V00
714
3.22
2.21
1.28
21.
30!
Hbb
-b1
M94
919
3.39
3.74
1.81
1.49
hem
oglo
bin
beta
-1J0
0413
2.67
1.89
1.26
21.
06!
Ala
s2D
8629
73.
272.
372.
191.
27de
lta
AL
A s
ynth
etas
ebM
1526
82.
472.
131.
042
1.36
!T
rans
crip
tion
reg
ulat
ion
Fos
X06
769
3.11
1.74
1.72
1.37
c-fo
sV
0072
72.
806.
385.
182.
54Ir
f1M
3425
32.
581.
271.
591.
62in
terf
eron
reg
ulat
ory
fact
or 1
M21
065
1.56
2.06
2.13
1.43
Atf
3M
6328
24.
002.
571.
521.
44A
TF-
3U
1911
82.
884.
874.
723.
52!
Junb
X54
686
2.46
2.43
3.17
1.11
jun-
BU
2073
52.
954.
533.
231.
33Z
fp36
AA
8006
132.
813.
192.
273.
03bu
tyra
te r
espo
nse
fact
or 2
AA
9606
031.
061.
151.
382.
06!
Ceb
pbX
6076
92.
653.
643.
692.
46C
/EB
P b
eta
M61
007
2.50
3.42
2.64
2.26
Ceb
pdM
6514
93.
714.
986.
392.
74C
/EB
P d
elta
X61
800
3.87
9.13
8.60
6.60
!Ju
nA
l175
959
2.22
2.08
3.04
3.26
v-Ju
nX
1276
12.
301.
463.
651.
49H
mgb
2A
l008
836
1.47
2.04
1.65
3.64
HM
G b
ox 2
X67
668
1.06
1.74
3.04
5.16
!L
itaf
Al2
3753
51.
423.
051.
902.
77L
PS
-ind
uced
TN
F-a
lpha
fac
tor
Al8
5263
21.
472.
022.
742.
28!
Id3
AF
0009
422
1.78
21.
281.
342.
50D
NA
bin
ding
pro
tein
inh
ibit
or (
Id-3
)bM
6052
32
1.28
1.48
1.47
2.23
Nfe
2l2
Al1
7716
11.
201.
231.
583.
46p4
5 N
F-E
2U
7047
51.
321.
361.
982.
42!
Id1
L23
148
22.
081.
481.
971.
83D
NA
bin
ding
pro
tein
inh
ibit
or (
Id-1
)bM
3188
51.
071.
512.
022.
04!
Nr2
f1U
1099
51.
052
2.49
21.
782
1.03
CO
UP
-TF
IX
7413
41.
312
2.68
22.
192
2.16
!O
ther F3
U07
619
2.20
1.40
1.34
1.39
thro
mbo
plas
tin
M26
071
1.36
1.23
1.16
2.06
est
Al1
6975
62.
242.
411.
231.
02ex
pres
sed
sequ
ence
tag
bA
l853
531
1.96
2.39
1.54
1.37
!O
dcX
0794
41.
202.
051.
841.
65or
nith
ine
deca
rbox
ylas
eM
1233
01.
691.
772.
661.
81G
rnX
6232
22
1.06
1.07
1.44
3.59
gran
ulin
bD
1619
51.
202
1.20
1.06
3.50
Arh
cA
A89
1940
1.16
1.89
1.50
3.85
Rho
CX
8063
81.
652.
551.
662.
48T
mp2
1X
9744
32
1.06
1.57
1.55
2.25
tran
smem
bran
e pr
otei
n T
mp2
1-I
AW
1215
392
1.18
1.54
1.95
3.30
!S
cn1a
M22
253
21.
292
2.63
1.05
22.
50so
dium
cha
nnel
Ib
AV
3367
812
1.03
21.
512
1.50
2.21
!P
rkcc
X07
287
21.
542
1.23
21.
332
3.45
prot
ein
kina
se C
, ga
mm
aL
2803
52
1.18
21.
322
2.48
21.
82!
a Fol
d ch
ange
, fol
d ch
ange
vs.
tim
e po
int m
atch
ed s
ham
.b S
igni
fica
nt e
xpre
ssio
n id
enti
fied
by
met
hod
2. A
TF
, act
ivat
ing
tran
scri
ptio
n fa
ctor
; C/E
BP
, CC
AA
T/e
nhan
cer
bind
ing
prot
ein;
CO
UP
-TF
I, c
hick
en o
valb
umin
ups
trea
m p
rom
oter
-tr
ansc
ript
ion
fact
or I
; G
FA
P, g
lial
fib
rill
ary
acid
ic p
rote
in;
HM
G, h
igh
mob
ilit
y gr
oup;
HS
P, h
eat
shoc
k pr
otei
n; L
PS
, lip
opol
ysac
char
ide;
MH
C, m
ajor
his
toco
mpa
tibi
lity
com
plex
;T
NF
, tum
or n
ecro
sis
fact
or.
FP
I, f
luid
per
cuss
ion
inju
ry; C
CI,
con
trol
led
cort
ical
impa
ct; h
, hou
rs; !
, gen
es n
ot p
revi
ousl
y re
port
ed a
s al
tere
d by
trau
mat
ic b
rain
inju
ry. G
enes
wit
hin
each
cat
egor
y ar
e pl
aced
inor
der
base
d on
whe
n th
ey f
irst
ach
ieve
d at
leas
t tw
ofol
d re
gula
tion
aft
er F
PI.
Bol
d pr
inti
ndic
ates
$tw
ofol
d in
crea
se o
r de
crea
se in
exp
ress
ion
vs. s
ham
.
S100A11). Calgranulin A is member of the superfamilyof S-100 proteins characterized by two calcium bindingsites and is known to have an intracellular role duringcalcium-dependent signaling (Rammes et al., 1997), be-ing preferentially expressed by activated microglia as re-viewed by Schafer and Heizmann (1996). Calgranulin AmRNA expression is increased in humans following bothcerebral ischemia (Postler et al., 1997) and traumaticbrain injury (Engel et al., 2000). Lipocortin 1, a gluco-corticoid-inducible protein with anti-inflammatory prop-erties expressed by microglia (McKanna, 1993), is in-duced by interleukin-1 after CNS injury and may providetrophic support to neurons (Miyachi et al., 2001).
Cell adhesion/extracellular matrix. After CNS injury,extracellular matrix (ECM) molecules secreted by cellsin the glial scar participate in both the inhibition and promotion of neuronal regeneration (Fawcett and Asher,1999; Jones and Tuszynski, 2002; Morgenstern et al.,2002). In spinal cord injury, modulating the ECM mayenhance axonal growth and regeneration (Bradbury et al.,2002), but the ECM has received less attention in TBI.Consistent with findings in spinal cord injury, we foundinduction of the inhibitory ECM molecule keratin sulfateproteoglycan lumican 72 h after TBI. Similarly, the chon-droitin sulphate proteoglycan phosphacan, an inhibitor ofaxon outgrowth after spinal cord injury (Bradbury et al.,2002), was upregulated at 72 h after FPI. Tissue plas-minogen activator (tPA) also has both neuroprotectiveand neurotoxic activity after CNS injury. Although tPAis a serine protease that is used for thrombolysis in stroketreatment (NINDS 1995), in cerebral ischemia and trau-matic brain injury tPA may directly mediate neuronaldeath by potentiating NMDA-receptor-mediated excito-toxicity (Wang et al., 1998; Mori et al., 2001; Nicole etal., 2001). Furthermore, degradation of ECM moleculesby tPA-generated plasmin can prevent axonal outgrowthand limit regeneration. In contrast, regeneration may beenhanced by modulation of metalloproteinases, includingTIMP-1 (Jaworski, 2000). Moreover, two important com-ponents of the extracellular matrix, fibronectin and col-lagen, are upregulated 72 h after injury; they have beenproposed to have a role in neurite outgrowth and regen-eration after injury (Carri et al., 1992; Sakai et al., 2001).Taken together, the commonly altered regulation of thisclass of genes implicates cell adhesion/ECM as an im-portant secondary injury response.
CNS-related genes. We also observed altered regula-tion of CNS-related genes, a broad category generallyconsisting of synaptic or myelin genes and neuropeptides.As might be expected in the face of neuronal loss, thereis down-regulation of the glutamate receptor, AMPA,
and the synaptic protein, HPC-1/syntaxin (Fujino et al.,1997). The 2–6-fold upregulation of myelin-associatedglycoprotein (MAG) noted in both our injury models mayinhibit axonal regeneration (Mukhopadhyay et al., 1994)and limit recovery.
Cytoskeleton. An intact cytoskeleton is required for in-flammatory cell migration to the region of injury (Meyerand Feldman, 2002) and is important for neurite exten-sion during regeneration. However, brain injury leads tothe secondary loss of cytoskeletal integrity and changesin tissue structure. We found the induction of six cy-toskeleton-related genes after brain injury. Actin-relatedprotein complex, implicated in the control of actin poly-merization in cells (Meyer and Feldman, 2002) andcalponin 3, an actin binding protein enriched in neuronalgrowth cones and mature astroglia (Plantier et al., 1999),may each be involved in neuronal plasticity after TBI.Gelsolin, a protein that prevents actin polymerization,was upregulated at 72 h after injury; it may have a neu-roprotective role because it reduces calcium conductancethrough NMDA channels by altering their subunit con-formation through its effects on actin polymerization (En-dres et al., 1999).
Heat shock proteins. Heat shock proteins (HSP), ahighly conserved family of stress-response proteins, helprestore function to damaged proteins within the cell(Beckmann et al., 1990; Hightower, 1991; Sharp et al.,1999). The HSP70 gene is induced in the brain byprocesses such as ischemia that denature proteins. Over-production of HSP70 in transgenic mice or by viral genetransfer protects neurons from degeneration in severalmodels of injury (as reviewed by Yenari et al., 1999).We found increased expression of HSP70 after TBI, con-sistent with earlier reports in human cerebral cortex(Dutcher et al., 1998; Truettner et al., 1999).
RBC-related genes. Three red blood cell-related genes(hemoglobin alpha-1, hemoglobin beta-1, and delta ALAsynthetase) showed increased expression at 4 h after in-jury. Changes in the expression for these genes have notbeen previously reported in TBI. However, their biolog-ical significance in this context is unknown and it is pos-sible that these mRNAs arise from release of injured ery-throcytes rather than active induction.
Oxidative stress. Oxidative stress is a component ofsecondary injury after TBI and we identified five an-tioxidant genes that were commonly upregulated. Metal-lothionein I and II (Mt-1, Mt-2) and heme oxygenase 1(HO-1) had been identified by other investigators(Raghavendra Rao et al., 2003), whereas changes in ceru-
NATALE ET AL.
920

loplasmin and ferritin expression had not been previouslyreported in these models. Metallothioneins are a familyof small, cysteine-rich proteins that donate metals to tar-get metalloproteins (particularly zinc finger protein andenzymes), act as metal chelators (specifically of cadmiumand zinc), and scavenge superoxide (Hussain et al., 1996).Interleukin-1, interleukin-6, antioxidant response ele-ment, and glucocorticoids regulate Mt transcription (An-drews, 2000). Mice over expressing Mt-1 are partiallyprotected from focal cerebral ischemia (van LookerenCampagne et al., 1999). Similarly, Mt-1 and Mt-2 defi-cient mice demonstrate decreased astrogliosis and in-creased neuronal apoptosis after traumatic brain injury(Penkowa et al., 2001). Thus, Mt-1 and Mt-2 may playan important role in protecting the CNS from oxidativestress.
Proteolysis. Another family showing gene changes isrelated to proteolysis, including these three previously
identified genes (lysozyme C, cathepsin D, and cathep-sin L) and two genes (cathepsin B and lysosomal mem-brane glycoprotein 2) whose expression changes were notpreviously noted. All are maximally regulated 72 h fol-lowing injury, consistent with their documented role incellular degradation and removal of debris (Leist andJaattela, 2001). Cathepsin B and L provide examples ofgenes that may be required for neuronal survival (Felboret al., 2002), yet contribute to neuronal degradation whenreleased from lysosomes (Hill et al., 1997).
Transcriptional regulation. Genes participating intranscription regulation composed the largest group ofcommonly altered genes after TBI. This broad categoryof genes includes five subgroups: (1) the immediate earlygenes (c-fos, jun-B, v-jun, ATF3); (2) genes involved inantioxidant response (p45 NF-E2); (3) genes implicatedin inflammatory responses (IRF1, C/EBP beta, C/EBPdelta, LPS-induced TNF-alpha factor); (4) growth-related
GENE PROFILES MODULATED AFTER BRAIN TRAUMA
921
FIG. 6. Hierarchical cluster of genes coordinately regulated to two genes not previously implicated in traumatic brain injurypathophysiology. Upregulated genes (red) and downregulated genes (blue) in injured parietal cortex at 4, 8, 24, and 72 h afterfluid percussion injury (FPI) in rat (A) or controlled cortical impact (CCI) in mouse (B). Expression level after injury normal-ized to expression level in parietal cortex at same time point after sham injury. Panel A: Genetree containing 59 genes with ex-pression pattern highly correlated (Pearson correlation, R 5 0.99) with NF-E2–related factor 2 (Nfr2) after FPI. White box en-closes a tree sub-branch containing 3 oxidative stress response genes (names underlined) that share a similar expression pattern.Panel B: Gene tree containing 35 genes with expression pattern highly correlated (Pearson correlation, R 5 0.99) with lysosomalmembrane glycoprotein 2 (Lamp2). White box encloses a tree sub-branch containing three cell adhesion/extracellular matrix genes(names underlined) that share a similar expression pattern. EST, expressed sequence tag; Junct. Adhesion mol., junctional adhe-sion molecule; SPARC, secreted acidic cysteine rich glycoprotein; SPRP 1, small proline-rich protein 1.

genes (c-myc, butyrate response factor 2, HMG box 2);(5) CNS development-related genes (Id-1, Id-3, COUP-TF). Of these, c-fos, jun-B, v-jun, IRF1, Id-3, and C/EBPbeta have been shown by others to be altered followingbrain injury (Kobori et al., 2002; Marciano et al., 2002;Matzilevich et al., 2002; Raghavendra Rao et al., 2003).Several of these genes (jun-B, c-myc) have been impli-cated in the induction of programmed cell death (Di Gio-vanni et al., 2003).
Molecular Evidence for Microglial Activation after TBI
Injury to the brain or spinal cord is accompanied bycellular responses dominated by the activation and pro-
liferation of microglia (Prewitt et al., 1997; Koshinaga etal., 2000). Once activated, microglia play a major role inthe general neuroinflammatory response of the CNS, in-cluding phagocytosis of bacterial pathogens and cellulardebris, and release of cytotoxic (nitric oxide, superoxide,tumor necrosis factor a) and neuroprotective (brain derived neurotrophic factor) factors (for review, seeKreutzberg, 1996). Although microglial activation hasbeen linked to neurotoxicity, there is evolving evidencesuggesting that microglia may also provide protective andrestorative functions that promote recovery from injury(Bruce-Keller, 1999).
Consistent with known characteristic microglial re-sponse to brain injury, we found that genes related to im-mune response and specifically to activated microglia
NATALE ET AL.
922
FIG. 7. Validation of expression changes observed by microarray with RT-PCR in nine genes across four time points after ex-perimental TBI. Magnitude and pattern of gene expression of eight genes shows significant induction. (A) Peripheral benzodi-azepine receptor (PBR), (B) C-C chemokine receptor 5 (CCR5), (C) metallothionein I (Mt-1), (D) myelin-associated glycopro-tein (MAG), (E) neurokinin, (F) cathepsin D, (G) hemoglobin b1, (H) transmembrane protein (TMP21-I).

dominated expression in the cortical impact region. Forexample, Fukuda et al. (1995) showed sustained expres-sion of HO-1 as long as 5 days after fluid percussion in-jury in the injured cortex of rats. In addition, HO-1 ex-pression co-localized with microglia at 72 h after injury,suggesting that transcription in microglia may have con-tributed to the upregulation of HO-1 we found in bothmodels at 72 h. Our gene expression profiling results sug-gest a predominant role for microglia/brain macrophagesin the transcriptional response to experimental TBI.
Analysis of Sequential Gene Expression
IRF1 was the first nuclear transacting factor demon-strated to contribute directly to cerebral ischemic dam-age (Iadecola et al., 1999) and its binding to the inter-feron response factor element is known to be essentialfor interferon gamma-induced MHC class II expression(O’Keefe et al., 2001). Furthermore, Matzilevich alsofound IRF1 to be upregulated following traumatic braininjury. It is, therefore, not surprising that in our experi-ments MHC class II expression consistently followed theexpression of IRF1 (Matzilevich et al., 2002). This wastrue even though the exact timing of these events was notthe same in the mouse and rat models.
Over half of genes upregulated at 72 hours were notexpressed at earlier time points, suggesting that a new setof molecular and cellular responses are initiated relativelylate after injury. These include factors related to inflam-mation, oxidative stress, cytoskeleton and proteolysis,among others (Table 3). For example, the bZip tran-scription factor Nrf2, an essential activator of genes encoding antioxidant enzymes and phase II detoxifyingenzymes through the antioxidant response element(Venugopal and Jaiswal, 1998; Gong et al., 2002), wasamong genes showing initial upregulation at 72 h. TheNrf2-regulated genes HO-1 and ferritin were also upreg-ulated at 72 h. Furthermore, the expression patterns of anadditional two oxidative stress response genes, glu-tathione peroxidase and ceruloplasmin, were highly cor-related (R 5 0.99) with the pattern of Nrf2. The coordi-nated regulation of Nrf2 with oxidative stress sensitivegenes suggests a delayed oxidative stress to which a transcriptional response is mounted. Increased F2-iso-prostane-containing lipids in cerebrospinal fluid 5–7 daysafter TBI in children support the presence of such a lateoxidative stress (Bayir et al., 2002).
Limitations and Strengths
It is important to recognize both the methodologicallimitations and strengths of this work. We performedRNA extraction from brain tissue at four-time points fol-lowing traumatic brain injury. Therefore, we describe
a heterogeneous cell population that is tissue-specificrather than cell-specific. Furthermore, the distribution ofparticular cell types is likely to differ at the four timepoints. Because the methods that we employ provide sen-sitivity that is affected by the relative distributions of var-ious transcripts, rare transcripts were less likely to be de-tected. Subsequent work using cell-specific profilingwould address some of these limitations.
Our experimental approach does, however, also con-tribute significant strengths. First, we examined expres-sion of almost 9000 genes/ESTs at four time points over72 h, thus improving our ability to understand the alter-ations induced by injury. Second, our sampling in boththe experimental and sham animals was regionally spe-cific and included extraction of the same tissue samplevolume. This provided a consistent and directly compa-rable source of RNA for analysis. Third, we have reducedthe rate of false positive results, a prevailing concern inmicroarray experiments, by eliminating microarray re-sults that fail to meet high quality control standards andby imposing stringent statistical criteria for identificationof differentially regulated genes. Moreover, we identifieda group of consistently regulated genes from two speciesand two injury models that are dissimilar in a number ofways, suggesting that the molecular pathways reportedhere may be characteristic of the genomic response toCNS injury.
Previously Described mRNA Changes followingCNS Injury Are Corroborated
Many of the genes we identified as regulated using ourtwo experimental models were also identified in othermodels of brain injury (Tang et al., 2002, 2003). Tangalso used a comparative strategy to characterize the ge-nomic response of the brain to ischemic stroke, intrac-erebral hemorrhage, induced seizures, hypoglycemia, andhypoxia in adult rats (Tang et al., 2002). They identified45 genes regulated in common across these diverse mod-els. Of these, many were also identified (matched by Gen-Bank accession number) in our two experimental mod-els. These included genes related to apoptosis (PBR),calcium binding (annexin 2, S100A11, and S100A4), cel-lular adhesion/ECM (TIMP-1, osteopontin, and matrixgla-protein), cytoskeleton (actin-related protein complex,GFAP, and calponin 3), heat shock protein (HSP70.2),inflammation (monocyte chemoattractant protein, MHCclass II, galectin-3, lipocalin 2), oxidative stress (hemeoxygenase, ceruloplasmin, Mt-1 and -2), proteolysis(lysozyme C), and transcription regulation (C/EBP delta).These data, reflecting non-traumatic brain injury, bothsupport our current findings as well as the concept thatmicroarray approaches can successfully identify commonmolecular processes associated with brain injury.
GENE PROFILES MODULATED AFTER BRAIN TRAUMA
923

Furthermore, using the same data filtering, normaliza-tion, and statistical analyses to select significantly-regu-lated genes (probes present on 40% of microarrays in theexperiment and both statistically significant and twofoldchange in signal intensity vs. time-matched sham), wecompared the 82 commonly regulated after brain injuryto significantly-regulated genes 4 h, 24 h, or 7 days af-ter mild spinal cord injury in rats (Di Giovanni et al.,2003). When gene expression was compared betweenthese different tissues (thoracic spinal cord and parietalcortex) and using different post-injury time periods, 34of 82 genes appeared to be commonly regulated. Theseincluded all genes classified as apoptosis/cell cycle andcalcium binding. Additionally, genes altered across thespinal cord and cortical injury models included those re-lated to cell adhesion/ECM (tPA, osteopontin, ICAM-1,disabled homolog 2, and fibronectin), cytoskeleton(actin-related protein complex, gelsolin, and tropomycin4), immune response (C3a anaphylatoxin chemotactic re-ceptor, monocyte chemoattractant protein-1, CD53,galectin-3, and complement C1q B chain), oxidativestress (ceruloplasmin), proteolysis (lysozyme C andcathepsin L), transcription regulation (c-fos, IRF-1, ATF-3, butyrate response factor 2, C/EBP beta, C/EBP delta,and v-jun), and others (thromboplastin, granulin). In ad-dition to providing methodological validation, theseshared results can further refine identification of candi-date molecular pathways involved in CNS injury, andsuggest that the CNS generates a partially stereotypicmolecular response to a wide variety of insults. Most im-portantly, these highly consistent pathways may serve asa starting point for development of therapies that maymore successfully limit neurotoxicity and enhance re-covery.
ACKNOWLEDGMENTS
We acknowledge Maria Idalia Cruz, Xiao Di, JillMacLeod, and Fiona Patricio for their outstanding tech-nical assistance, along with Simone Di Giovanni and EricHoffman for their thoughtful comments and suggestions.This work was supported by NINDS 1K08 NS41273(J.E.N.), DAMD17-2-99-9007 (A.I.F.), Mental Retar-dation and Developmental Disabilities Research Cen-ter at Children’s National Medical Center, NICHD1P30HD40677-01 (A.I.F. and J.E.N.), and NIH NS36537(A.I.F.).
REFERENCES
ANDREWS, G.K. (2000). Regulation of metallothionein geneexpression by oxidative stress and metal ions. Biochem. Phar-macol. 59, 95–104.
BAKAY, M., ZHAO, P., CHEN, J., et al. (2002). A web-ac-cessible complete transcriptome of normal human and DMDmuscle. Neuromuscul. Disord. 12, Suppl 1, S125–S141.
BANATI, R.B., MYERS, R., and KREUTZBERG, G.W.(1997). PK (‘peripheral benzodiazepine’)—binding sites inthe CNS indicate early and discrete brain lesions: microau-toradiographic detection of [3H]PK11195 binding to acti-vated microglia. J. Neurocytol. 26, 77–82.
BAYIR, H., KAGAN, V.E., TYURINA, Y.Y., et al. (2002).Assessment of antioxidant reserves and oxidative stress incerebrospinal fluid after severe traumatic brain injury in in-fants and children. Pediatr. Res. 51, 571–578.
BECKMANN, R.P., MIZZEN, L.E., and WELCH, W.J. (1990).Interaction of Hsp 70 with newly synthesized proteins: im-plications for protein folding and assembly. Science 248,850–854.
BRADBURY, E.J., MOON, L.D., POPAT, R.J., et al. (2002).Chondroitinase ABC promotes functional recovery afterspinal cord injury. Nature 416, 636–640.
BRASSARD, M. (1996). Control chart. The Memory JoggerPlus1. GOAL/QPC 288–297.
BRUCE-KELLER, A.J. (1999). Microglial–neuronal interac-tions in synaptic damage and recovery. J. Neurosci. Res. 58,191–201.
CARRI, N.G., RUBIN, K., GULLBERG, D., et al. (1992). Neu-ritogenesis on collagen substrates. Involvement of integrin-like matrix receptors in retinal fibre outgrowth on collagen.Int. J. Dev. Neurosci. 10, 393–405.
CASELLAS, P., GALIEGUE, S., and BASILE, A.S. (2002).Peripheral benzodiazepine receptors and mitochondrial func-tion. Neurochem. Int. 40, 475–486.
CHEN, Y.W., ZHAO, P., BORUP, R., et al. (2000). Expres-sion profiling in the muscular dystrophies: identification ofnovel aspects of molecular pathophysiology. J. Cell Biol.151, 1321–1336.
CHUAQUI, R.F., BONNER, R.F., BEST, C.J., et al. (2002).Post-analysis follow-up and validation of microarray exper-iments. Nat. Genet. 32, Suppl, 509–514.
DI GIOVANNI, S., KNOBLACH, S.M., BRANDOLI, C., etal. (2003). Gene profiling in spinal cord injury shows rolefor cell cycle in neuronal death. Ann. Neurol. 53, 454–468
DUTCHER, S.A., UNDERWOOD, B.D., WALKER, P.D., etal. (1998). Patterns of heat-shock protein 70 biosynthesis fol-lowing human traumatic brain injury. J. Neurotrauma 15,411–420.
ENDRES, M., FINK, K., ZHU, J., et al. (1999). Neuroprotec-tive effects of gelsolin during murine stroke. J. Clin. Invest.103, 347–354.
ENGEL, S., SCHLUESENER, H., MITTELBRONN, M., et al.(2000). Dynamics of microglial activation after human trau-matic brain injury are revealed by delayed expression of
NATALE ET AL.
924

macrophage-related proteins MRP8 and MRP14. Acta Neu-ropathol. (Berl.) 100, 313–322.
FADEN, A.I. (1989). TRH analog YM-14673 improves out-come following traumatic brain and spinal cord injury in rats:dose-response studies. Brain Res. 486, 228–235.
FADEN, A.I. (1993). Comparison of single and combinationdrug treatment strategies in experimental brain trauma. J.Neurotrauma 10, 91–100.
FADEN, A.I., LABROO, V.M., and COHEN, L.A. (1993). Im-idazole-substituted analogues of TRH limit behavioraldeficits after experimental brain trauma. J. Neurotrauma 10,101–108.
FADEN, A.I., X, D., SM, K., et al. (2003). Neuroprotective andnootropic actions of a novel cyclized dipeptide followingcontrolled cortical impact in mice. J. Cereb. Blood FlowMetab. 23, 355–363.
FAWCETT, J.W., and ASHER, R.A. (1999). The glial scar andcentral nervous system repair. Brain Res. Bull. 49, 377–391.
FELBOR, U., KESSLER, B., MOTHES, W., et al. (2002). Neu-ronal loss and brain atrophy in mice lacking cathepsins B andL. Proc. Natl. Acad. Sci. USA 99, 7883–7888.
FOX, G.B., and FADEN, A.I. (1998). Traumatic brain injurycauses delayed motor and cognitive impairment in a mutantmouse strain known to exhibit delayed Wallerian degenera-tion. J. Neurosci Res. 53, 718–727.
FOX, G.B., FAN, L., LEVASSEUR, R.A., et al. (1998). Sus-tained sensory/motor and cognitive deficits with neuronalapoptosis following controlled cortical impact brain injury inthe mouse. J. Neurotrauma 15, 599–614.
FOX, G.B., LEVASSEUR, R.A., and FADEN, A.I. (1999). Be-havioral responses of C57BL/6, FVB/N, and 129/SvEMS mousestrains to traumatic brain injury: implications for gene targetingapproaches to neurotrauma. J. Neurotrauma 16, 377–389.
FUJINO, I., FUJIWARA, T., and AKAGAWA, K. (1997).Transient decrease of HPC-1/syntaxin-1A mRNA in the rathippocampus by kainic acid. Neurosci. Res. 28, 243–247.
FUKUDA, K., PANTER, S.S., SHARP, F.R., et al. (1995). In-duction of heme oxygenase–1 (HO-1) after traumatic braininjury in the rat. Neurosci. Lett. 199, 127–130.
GONG, P., STEWART, D., HU, B., et al. (2002). Activationof the mouse heme oxygenase–1 gene by 15-deoxy-Delta(12,14)–prostaglandin J(2) is mediated by the stress re-sponse elements and transcription factor Nrf2. Antioxid. Re-dox Signal 4, 249–257.
HIGHTOWER, L.E. (1991). Heat shock, stress proteins, chap-erones, and proteotoxicity. Cell 66, 191–197.
HILL, I.E., PRESTON, E., MONETTE, R., et al. (1997). Acomparison of cathepsin B processing and distribution dur-ing neuronal death in rats following global ischemia or de-capitation necrosis. Brain Res. 751, 206–216.
HUSSAIN, S., SLIKKER, W., JR., and ALI, S.F. (1996). Role
of metallothionein and other antioxidants in scavenging su-peroxide radicals and their possible role in neuroprotection.Neurochem. Int. 29, 145–152.
IADECOLA, C., SALKOWSKI, C.A., ZHANG, F., et al.(1999). The transcription factor interferon regulatory factor1 is expressed after cerebral ischemia and contributes to is-chemic brain injury. J. Exp. Med. 189, 719–727.
JAWORSKI, D.M. (2000). Differential regulation of tissue in-hibitor of metalloproteinase mRNA expression in responseto intracranial injury. Glia 30, 199–208.
JONES, L.L., and TUSZYNSKI, M.H. (2002). Spinal cord in-jury elicits expression of keratan sulfate proteoglycans bymacrophages, reactive microglia, and oligodendrocyte prog-enitors. J. Neurosci. 22, 4611–4624.
KAYA, S.S., MAHMOOD, A., LI, Y., et al. (1999). Apopto-sis and expression of p53 response proteins and cyclin D1after cortical impact in rat brain. Brain Res. 818, 23–33.
KOBORI, N., CLIFTON, G.L., and DASH, P. (2002). Alteredexpression of novel genes in the cerebral cortex followingexperimental brain injury. Brain Res. Mol. Brain Res. 104,148–158.
KOSHINAGA, M., KATAYAMA, Y., FUKUSHIMA, M., etal. (2000). Rapid and widespread microglial activation in-duced by traumatic brain injury in rat brain slices. J. Neuro-trauma 17, 185–192.
KREUTZBERG, G.W. (1996). Microglia: a sensor for patho-logical events in the CNS. Trends Neurosci. 19, 312–318.
LEIST, M., and JAATTELA, M. (2001). Triggering of apop-tosis by cathepsins. Cell Death Differ. 8, 324–326.
LONG, Y., ZOU, L., LIU, H., et al. (2003). Altered expressionof randomly selected genes in mouse hippocampus aftertraumatic brain injury. J. Neurosci. Res. 71, 710–720.
MARCIANO, P.G., EBERWINE, J.H., RAGUPATHI, R., etal. (2002). Expression profiling following traumatic brain in-jury: a review. Neurochem. Res. 27, 1147–1155.
MATZILEVICH, D.A., RALL, J.M., MOORE, A.N., et al.(2002). High-density microarray analysis of hippocampalgene expression following experimental brain injury. J. Neu-rosci. Res. 67, 646–663.
MCINTOSH, T.K., VINK, R., NOBLE, L., et al. (1989). Trau-matic brain injury in the rat: characterization of a lateral fluid-percussion model. Neuroscience 28, 233–244.
MCKANNA, J.A. (1993). Lipocortin 1 immunoreactivity iden-tifies microglia in adult rat brain. J. Neurosci. Res. 36,491–500.
MEYER, G., and FELDMAN, E.L. (2002). Signaling mecha-nisms that regulate actin-based motility processes in the ner-vous system. J. Neurochem. 83, 490–503.
MIYACHI, T., ASAI, K., TSUIKI, H., et al. (2001). Interleukin-1beta induces the expression of lipocortin 1 mRNA in cul-tured rat cortical astrocytes. Neurosci. Res. 40, 53–60.
GENE PROFILES MODULATED AFTER BRAIN TRAUMA
925

MORGENSTERN, D.A., ASHER, R.A., and FAWCETT, J.W.(2002). Chondroitin sulphate proteoglycans in the CNS in-jury response. Prog. Brain Res. 137, 313–332.
MORI, T., WANG, X., KLINE, A.E., et al. (2001). Reducedcortical injury and edema in tissue plasminogen activatorknockout mice after brain trauma. Neuroreport 12, 4117–4120.
MUKHOPADHYAY, G., DOHERTY, P., WALSH, F.S., et al.(1994). A novel role for myelin-associated glycoprotein asan inhibitor of axonal regeneration. Neuron 13, 757–767.
NATIONAL INSTITUTE OF NEUROLOGICAL DISOR-DERS AND STROKE rt-PA STROKE STUDY GROUP.(1995). Tissue plasminogen activator for acute ischemicstroke. N. Engl. J. Med. 333, 1581–1587.
NICOLE, O., DOCAGNE, F., ALI, C., et al. (2001). The proteolytic activity of tissue-plasminogen activator en-hances NMDA receptor-mediated signaling. Nat. Med. 7,59–64.
O’KEEFE, G.M., NGUYEN, V.T., PING TANG, L.L., et al.(2001). IFN-gamma regulation of class II transactivator pro-moter IV in macrophages and microglia: involvement of thesuppressors of cytokine signaling-1 protein. J. Immunol. 166,2260–2269.
PENKOWA, M., GIRALT, M., THOMSEN, P.S., et al.(2001). Zinc or copper deficiency–induced impaired in-flammatory response to brain trauma may be caused by theconcomitant metallothionein changes. J. Neurotrauma 18,447–463.
PLANTIER, M., FATTOUM, A., MENN, B., et al. (1999).Acidic calponin immunoreactivity in postnatal rat brain andcultures: subcellular localization in growth cones, under theplasma membrane and along actin and glial filaments. Eur.J. Neurosci. 11, 2801–2812.
POSTLER, E., LEHR, A., SCHLUESENER, H., et al. (1997).Expression of the S-100 proteins MRP-8 and -14 in ischemicbrain lesions. Glia 19, 27–34.
PREWITT, C.M., NIESMAN, I.R., KANE, C.J., et al. (1997).Activated macrophage/microglial cells can promote the re-generation of sensory axons into the injured spinal cord. Exp.Neurol. 148, 433–443.
RAGHAVENDRA RAO, V.L., DHODDA, V.K., SONG, G.,et al. (2003). Traumatic brain injury–induced acute gene ex-pression changes in rat cerebral cortex identified byGeneChip analysis. J. Neurosci. Res. 71, 208–219.
RAGHAVENDRA RAO, V.L., DOGAN, A., BOWEN, K.K.,et al. (2000). Traumatic brain injury leads to increased ex-pression of peripheral-type benzodiazepine receptors, neu-ronal death, and activation of astrocytes and microglia in ratthalamus. Exp. Neurol. 161, 102–114.
RAGHUPATHI, R., GRAHAM, D.I., and MCINTOSH, T.K.
(2000). Apoptosis after traumatic brain injury. J. Neuro-trauma 17, 927–938.
RAMMES, A., ROTH, J., GOEBELER, M., et al. (1997).Myeloid-related protein (MRP) 8 and MRP14, calcium-bind-ing proteins of the S100 family, are secreted by activatedmonocytes via a novel, tubulin-dependent pathway. J. Biol.Chem. 272, 9496–9502.
RHODES, D.R., BARRETTE, T.R., RUBIN, M.A., et al.(2002). Meta-analysis of microarrays: interstudy validationof gene expression profiles reveals pathway dysregulation inprostate cancer. Cancer Res. 62, 4427–4433.
SAKAI, T., JOHNSON, K.J., MUROZONO, M., et al. (2001).Plasma fibronectin supports neuronal survival and reducesbrain injury following transient focal cerebral ischemia butis not essential for skin-wound healing and hemostasis. Nat.Med. 7, 324–330.
SCHAFER, B.W., and HEIZMANN, C.W. (1996). The S100family of EF-hand calcium-binding proteins: functions andpathology. Trends Biochem. Sci. 21, 134–140.
SHARP, F.R., MASSA, S.M., and SWANSON, R.A. (1999).Heat-shock protein protection. Trends Neurosci. 22, 97–99.
TANG, Y., LU, A., ARONOW, B.J., et al. (2002). Genomicresponses of the brain to ischemic stroke, intracerebral haem-orrhage, kainate seizures, hypoglycemia, and hypoxia. Eur.J. Neurosci. 15, 1937–1952.
TANG, Y., NEE, A.C., LU, A., et al. (2003). Blood genomicexpression profile for neuronal injury. J. Cereb. Blood FlowMetab. 23, 310–319.
TRUETTNER, J., SCHMIDT-KASTNER, R., BUSTO, R., etal. (1999). Expression of brain-derived neurotrophic factor,nerve growth factor, and heat shock protein HSP70 follow-ing fluid percussion brain injury in rats. J. Neurotrauma 16,471–486.
VAN LOOKEREN CAMPAGNE, M., THIBODEAUX, H.,VAN BRUGGEN, N., et al. (1999). Evidence for a protective role of metallothionein-1 in focal cerebral ischemia. Proc. Natl. Acad. Sci. USA 96, 12870–12875.
VENUGOPAL, R., and JAISWAL, A.K. (1998). Nrf2 and Nrf1in association with Jun proteins regulate antioxidant responseelement–mediated expression and coordinated induction ofgenes encoding detoxifying enzymes. Oncogene 17,3145–3156.
WANG, Y.F., TSIRKA, S.E., STRICKLAND, S., et al. (1998).Tissue plasminogen activator (tPA) increases neuronal dam-age after focal cerebral ischemia in wild-type and tPA-defi-cient mice. Nat. Med. 4, 228–231.
YAKOVLEV, A.G., DI, X., MOVSESYAN, V., et al. (2001).Presence of DNA fragmentation and lack of neuroprotectiveeffect in DFF45 knockout mice subjected to traumatic braininjury. Mol. Med. 7, 205–216.
NATALE ET AL.
926

YAKOVLEV, A.G., KNOBLACH, S.M., FAN, L., et al.(1997). Activation of CPP32-like caspases contributes to neu-ronal apoptosis and neurological dysfunction after traumaticbrain injury. J. Neurosci. 17, 7415–7424.
YENARI, M.A., GIFFARD, R.G., SAPOLSKY, R.M., et al.(1999). The neuroprotective potential of heat shock protein70 (HSP70). Mol. Med. Today. 5, 525–531.
YOUNG, W. (1992). Role of calcium in central nervous sys-tem injuries. J. Neurotrauma 9, Suppl 1, S9–S25.
Address reprint requests to:JoAnne E. Natale, M.D., Ph.D.
Research Centers for Genetic Medicine andNeuroscience
Children’s National Medical Center111 Michigan Ave., NWWashington, DC 20010
E-mail: [email protected]
GENE PROFILES MODULATED AFTER BRAIN TRAUMA
927


![[- 200 [ PROVIDING MODULATED COMMUNICATION SIGNALS ]](https://static.fdokumen.com/doc/165x107/6328adc85c2c3bbfa804c60f/-200-providing-modulated-communication-signals-.jpg)