Towards a Closing of the Gender Pay Gap. National Report Austria (2002)
Upload
khangminh22Category
view
0download
0
Gender Pay Gap in the Formal Sector: 2006 - 2013
Date: September 2013 WageIndicator Data Report
Preliminary Evidences from
Paycheck India Data
Biju Varkkey – Faculty, Personnel and Industrial Relations Area,
Indian Institute of Management, Ahmedabad
Rupa Korde – Faculty, Economics Area,
Foundation for Liberal And Management Education, Pune
Report Series 003

About Paycheck India
Paycheck India a research initiative at Indian Institute of Management
Ahmedabad is part of WageIndicator, an organization that collects and shares
data about wages, labour law and career in more than 70 countries. Paycheck
India aims to bring transparency in the labour market by providing salary
predictions for 1600 occupations in India through its Salary Checker, regular
updates on state wise minimum wages, living wage calculation, public sector
wages, labour laws and career advice.
About WageIndicator Foundation
The WageIndicator concept is owned by the WageIndicator Foundation, a non-
profit organization. Its Supervisory Board is chaired by the University of
Amsterdam/Amsterdam Institute of Advanced labour Studies, the Dutch
Confederation of Trade Unions (FNV) and LinkedIn. Started in 2000, the
WageIndicator operates globally through a network of associated, yet
independent, regional and national partner organisations. These include
universities (Harvard Law School, Renmin University, Beijing, Macquarie
University, Sydney),media houses (Monster, UOL, Yellow pages, Zhaopin.com),
trade unions (Confederation of Dutch Trade Unions - FNV, International trade
Union Confederation (ITUC), Hind Mazdoor Sabha (HMS), Trade Union Congress
(TUC)), employers‟ organisations and individual (legal, internet, media)
specialists, with whom the WageIndicator engages in long-lasting relationships.
The WageIndicator Foundation has offices in Amsterdam (where it is
headquartered), Ahmedabad, Bratislava, Buenos Aires, Cape Town, Maputo, and
Minsk. There are WageIndicator websites for 78 countries which gives country
specific information on Minimum Wages, Living Wages, wages by
occupation, Collective Bargaining Agreements (CBA), and Labour Laws. This
report has been prepared by the Indian Regional Office of the WageIndicator
Foundation and the Indian Institute of Management, Ahmedabad.
WageIndicator Foundation
Plantage Muidergracht 12
1018TV Amsterdam
The Netherlands
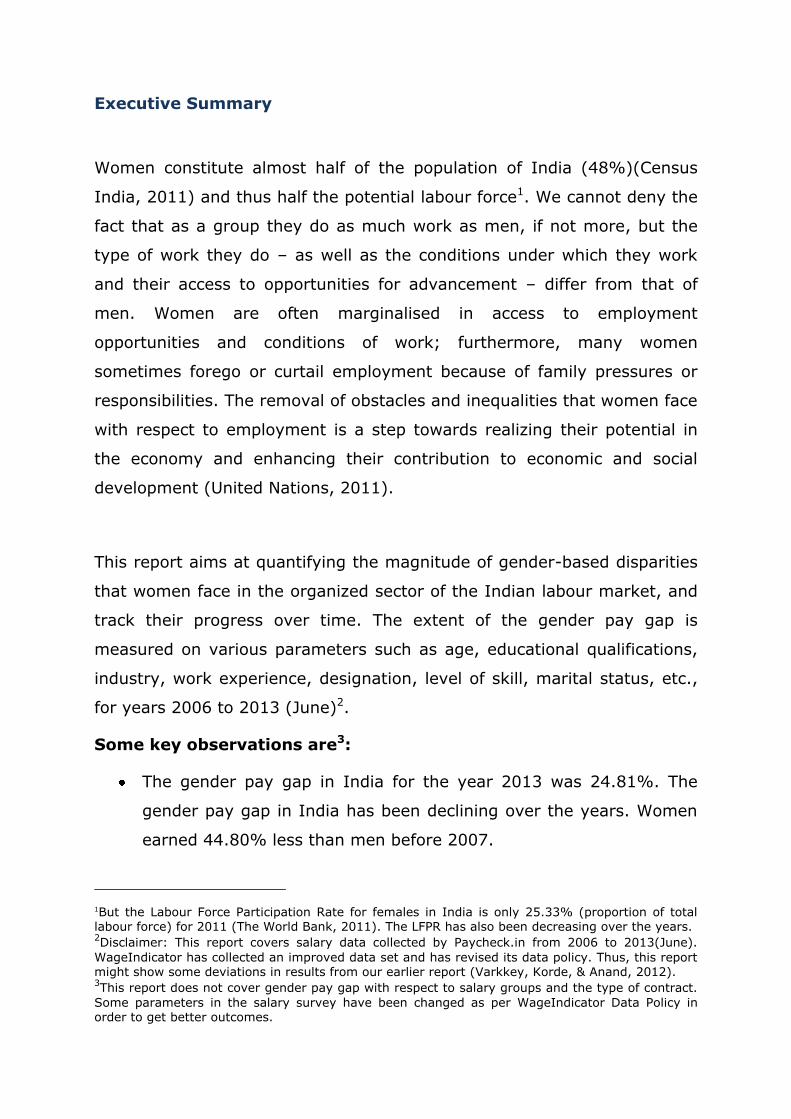
Disclaimer
The data for this report has been generated between 2006 and 2013
(June), through the online voluntary Salary Survey of Paycheck.in. An
earlier version of the report “Gender Pay Gap in the Formal Sector:
Preliminary Evidence from Paycheck India Data” was published in 2012.
Our earlier report covered time period 2006 – 2011. The total number of
respondents was 16,500, out of which 13,729 were males and 2,771 were
females.
Since, then there has been a change in the WageIndicator Data Policy.
This was done in order to get better outcomes. Thus, the current report
„Gender Pay Gap in the Formal Sector: 2006 – 2013, Preliminary
Evidences form Paycheck India Data‟ might show some deviations from
our earlier report. This report is based on 21,552 respondents over a
period of 7.5 years (from 2006 -2013 (June)), out of which 18,043 were
males and 3,509 were females.-
This report has some minor changes as compared to the previous report:
1. The report has more extensive coverage of Indian States with
respect to gender pay gap.
2. The report does not cover gender pay gap with respect to salary
groups and the type of contract.
3. Due to insufficient data, the report does not cover gender pay gap
for the widowed.
The “Survey Design and Data Collection” section of this report is similar
for all the papers that use Paycheck.in Salary Data. This section describes
the methodology of survey, data collection, description of research sample
and methodology for data analysis. During the data analysis of this report
only those variables were considered where there were sufficient female
observations.
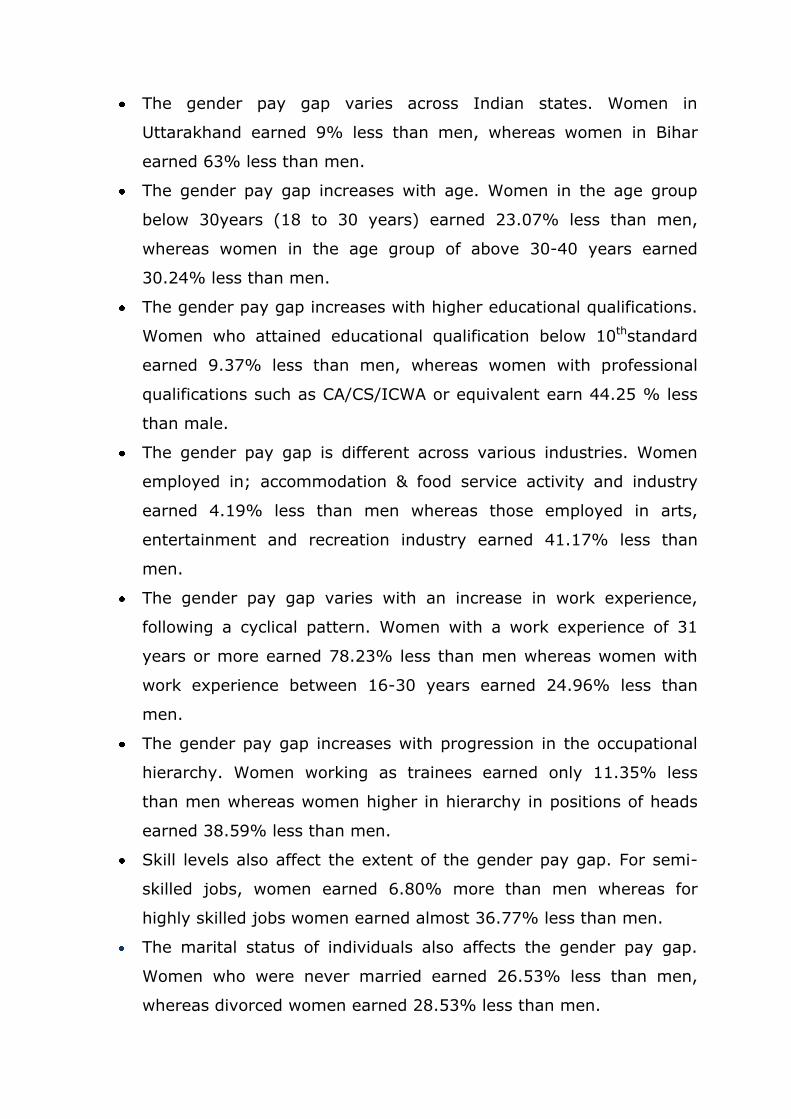
Executive Summary
Women constitute almost half of the population of India (48%)(Census
India, 2011) and thus half the potential labour force1. We cannot deny the
fact that as a group they do as much work as men, if not more, but the
type of work they do – as well as the conditions under which they work
and their access to opportunities for advancement – differ from that of
men. Women are often marginalised in access to employment
opportunities and conditions of work; furthermore, many women
sometimes forego or curtail employment because of family pressures or
responsibilities. The removal of obstacles and inequalities that women face
with respect to employment is a step towards realizing their potential in
the economy and enhancing their contribution to economic and social
development (United Nations, 2011).
This report aims at quantifying the magnitude of gender-based disparities
that women face in the organized sector of the Indian labour market, and
track their progress over time. The extent of the gender pay gap is
measured on various parameters such as age, educational qualifications,
industry, work experience, designation, level of skill, marital status, etc.,
for years 2006 to 2013 (June)2.
Some key observations are3:
The gender pay gap in India for the year 2013 was 24.81%. The
gender pay gap in India has been declining over the years. Women
earned 44.80% less than men before 2007.
1But the Labour Force Participation Rate for females in India is only 25.33% (proportion of total labour force) for 2011 (The World Bank, 2011). The LFPR has also been decreasing over the years. 2Disclaimer: This report covers salary data collected by Paycheck.in from 2006 to 2013(June).
WageIndicator has collected an improved data set and has revised its data policy. Thus, this report might show some deviations in results from our earlier report (Varkkey, Korde, & Anand, 2012). 3This report does not cover gender pay gap with respect to salary groups and the type of contract.
Some parameters in the salary survey have been changed as per WageIndicator Data Policy in order to get better outcomes.
The gender pay gap varies across Indian states. Women in
Uttarakhand earned 9% less than men, whereas women in Bihar
earned 63% less than men.
The gender pay gap increases with age. Women in the age group
below 30years (18 to 30 years) earned 23.07% less than men,
whereas women in the age group of above 30-40 years earned
30.24% less than men.
The gender pay gap increases with higher educational qualifications.
Women who attained educational qualification below 10thstandard
earned 9.37% less than men, whereas women with professional
qualifications such as CA/CS/ICWA or equivalent earn 44.25 % less
than male.
The gender pay gap is different across various industries. Women
employed in; accommodation & food service activity and industry
earned 4.19% less than men whereas those employed in arts,
entertainment and recreation industry earned 41.17% less than
men.
The gender pay gap varies with an increase in work experience,
following a cyclical pattern. Women with a work experience of 31
years or more earned 78.23% less than men whereas women with
work experience between 16-30 years earned 24.96% less than
men.
The gender pay gap increases with progression in the occupational
hierarchy. Women working as trainees earned only 11.35% less
than men whereas women higher in hierarchy in positions of heads
earned 38.59% less than men.
Skill levels also affect the extent of the gender pay gap. For semi-
skilled jobs, women earned 6.80% more than men whereas for
highly skilled jobs women earned almost 36.77% less than men.
The marital status of individuals also affects the gender pay gap.
Women who were never married earned 26.53% less than men,
whereas divorced women earned 28.53% less than men.
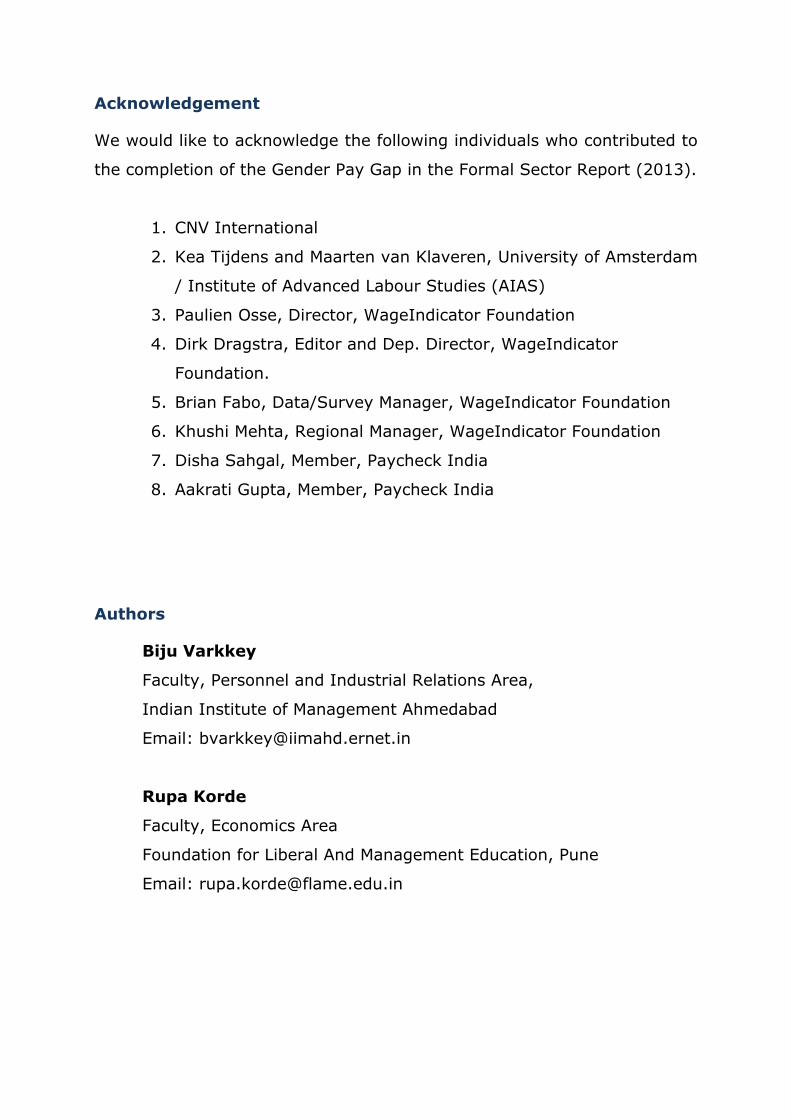
Acknowledgement
We would like to acknowledge the following individuals who contributed to
the completion of the Gender Pay Gap in the Formal Sector Report (2013).
1. CNV International
2. Kea Tijdens and Maarten van Klaveren, University of Amsterdam
/ Institute of Advanced Labour Studies (AIAS)
3. Paulien Osse, Director, WageIndicator Foundation
4. Dirk Dragstra, Editor and Dep. Director, WageIndicator
Foundation.
5. Brian Fabo, Data/Survey Manager, WageIndicator Foundation
6. Khushi Mehta, Regional Manager, WageIndicator Foundation
7. Disha Sahgal, Member, Paycheck India
8. Aakrati Gupta, Member, Paycheck India
Authors
Biju Varkkey
Faculty, Personnel and Industrial Relations Area,
Indian Institute of Management Ahmedabad
Email: [email protected]
Rupa Korde
Faculty, Economics Area
Foundation for Liberal And Management Education, Pune
Email: [email protected]
Table of contents
1 The Gender Pay Gap in India 1-7
1.1 Background ........................................................................................................................... 1-7
1.2 Steps taken by the Indian government to narrow the gender pay gap in India ... 1-9
1.3 Reasons for the gender pay gap in India ..................................................................... 1-11
2 Survey Design and Data Collection 2-14
2.1 Survey design ..................................................................................................................... 2-14
2.2 Data collection .................................................................................................................... 2-14
2.3 Research sample ................................................................................................................ 2-15
2.4 Data analysis ...................................................................................................................... 2-15
3 Analysis of the Gender Pay Gap in India 3-17
3.1 The Gender Pay Gap in India .......................................................................................... 3-17
3.2 The Gender Pay Gap across Indian States ................................................................... 3-18
3.3 The Gender Pay Gap with Respect to Age .................................................................... 3-21
3.4 The Gender Pay Gap with Respect to Educational Qualifications ............................ 3-23
3.5 The Gender Pay Gap with Respect to Industry Type ................................................. 3-26
3.6 The Gender Pay Gap with Respect to Work Experience ............................................ 3-30
3.7 The Gender Pay Gap with Respect to Position/Designation/Level in Occupational Hierarchy ....................................................................................................................................... 3-31
3.8 The Gender Pay Gap with Respect to Level of Skill.................................................... 3-34
3.9 The Gender Pay Gap with Respect to Marital Status .................................................... 3-35
4 Conclusion 4-38
Bibliography 4-42
Annexure 4-45

Page | 1-7
1 The Gender Pay Gap in India
1.1 Background
The world has become a complex place to survive over time with changes
in the economic, demographic, environmental and political environment.
To survive in this environment, we require a new mind-set that can
discard old prejudices and inertia, and accept new ideas and solutions
(Hausmann, Tyson, & Zahidi, 2011).
In today‟s world, where women work alongside men, the issue of fair and
equal treatment arises often. In fact, gender inequality related to work is
one of the issues that has been raised and debated often. Women
constitute almost half the population of India (48%)(Census India, 2011)
and thus half of its potential labour force. But the Labour Force
Participation Rate of womenin India is only 29% for 2011 (The World
Bank, 2011). Though the government4 has introduced several laws to
prohibit inequalities or discrimination against women workers, there still
exists a wide gender pay gap in India. In majority of Indian work places,
the so-called „glass ceiling‟ is not completely broken yet. There are many
facets of gender inequality, and in the current scenario, it is „professional
inequality‟ that incessantly acts as a barrier for women‟s advancement at
the workplace. Professional inequality, as explained by Amartya Sen in
one of his lectures, refers to discrimination in terms of employment,
remuneration, promotion at work and even occupation (Sen, 2001).
When a woman decides to enter the workforce, she has to deal with
gender-biased hiring practices. Even if she somehow manages to enter the
labour market, there exists discrimination at every step of her professional
life.
4 Refer Annexure I – Acts passed by Government of India in the Labour Market
P a g e | 1-8
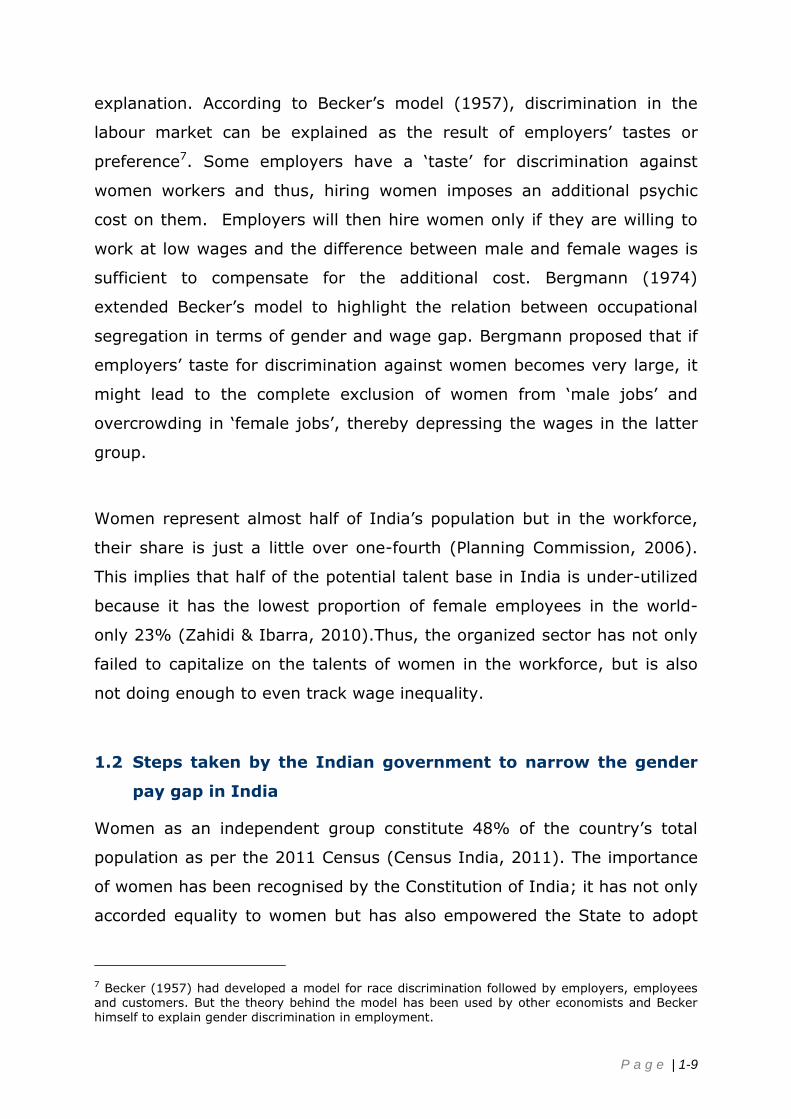
The gender pay gap measures the earning differences between women
and men in paid employment in the labour market. “It is one of the many
indicators of gender inequality in a country that emerge on examining the
labour market participation in terms of gender” (Education International,
2011). The gender pay gap has become a universal issue. Various theories
have been advanced to explain this gap from an economic perspective.
Most of them discuss either the human capital model (supply-side factor)
that focuses on gender differences in skills, particularly education and
experience, or labour market discrimination (demand-side factor) i.e.
inequitable treatment of equally qualified male and female workers. The
human capital approach (Mincer, Polachek 1974) explains that the gender
pay gap arises due to differences in productivity or human capital
accumulation by male and female workers. Women accumulate less
human capital than men because of the traditional division of labour within
the family5 and voluntary choices exercised by women to invest less in
human capital6. They either decide not to enter those jobs which require
more on-the-job training or exit the job early in life for various reasons
which lower their earnings. Simply put, the human capital theory suggests
that since women accumulate less experience/skills than men, they are
paid less. The gender pay gap not only reflects the fact that women are
getting paid less than men but also that women are given less incentives
to stand out in the workplace.
But not all of the gender pay gap can be accounted by differences in
human capital. Just like the explanation given in the analysis section
presented later, the labour market discrimination approach also offers an
5Family assigns different roles to women and men. Women are generally expected to allocate more
time to home-related activities than work. If women spend more time at work they can enhance
their skill sets and thus, productivity and wages. 6Human Capital: “A measure of the economic value of an employee's skill set. The education, experience and abilities of an employee have an economic value for employers and for the
economy as a whole”. Retrieved from Investopedia
(http://www.investopedia.com/terms/h/humancapital.asp#axzz20wnH1zlo) on 25th September, 2013.
P a g e | 1-9
explanation. According to Becker‟s model (1957), discrimination in the
labour market can be explained as the result of employers‟ tastes or
preference7. Some employers have a „taste‟ for discrimination against
women workers and thus, hiring women imposes an additional psychic
cost on them. Employers will then hire women only if they are willing to
work at low wages and the difference between male and female wages is
sufficient to compensate for the additional cost. Bergmann (1974)
extended Becker‟s model to highlight the relation between occupational
segregation in terms of gender and wage gap. Bergmann proposed that if
employers‟ taste for discrimination against women becomes very large, it
might lead to the complete exclusion of women from „male jobs‟ and
overcrowding in „female jobs‟, thereby depressing the wages in the latter
group.
Women represent almost half of India‟s population but in the workforce,
their share is just a little over one-fourth (Planning Commission, 2006).
This implies that half of the potential talent base in India is under-utilized
because it has the lowest proportion of female employees in the world-
only 23% (Zahidi & Ibarra, 2010).Thus, the organized sector has not only
failed to capitalize on the talents of women in the workforce, but is also
not doing enough to even track wage inequality.
1.2 Steps taken by the Indian government to narrow the gender
pay gap in India
Women as an independent group constitute 48% of the country‟s total
population as per the 2011 Census (Census India, 2011). The importance
of women has been recognised by the Constitution of India; it has not only
accorded equality to women but has also empowered the State to adopt
7 Becker (1957) had developed a model for race discrimination followed by employers, employees and customers. But the theory behind the model has been used by other economists and Becker himself to explain gender discrimination in employment.
P a g e | 1-10
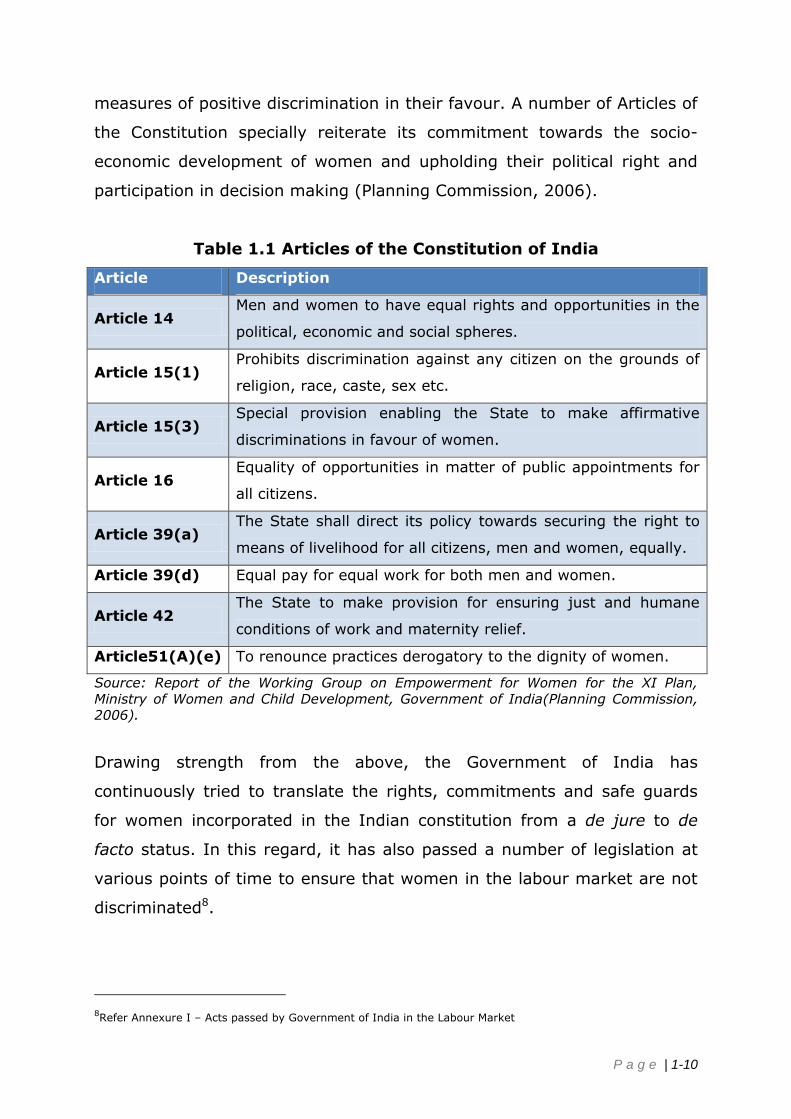
measures of positive discrimination in their favour. A number of Articles of
the Constitution specially reiterate its commitment towards the socio-
economic development of women and upholding their political right and
participation in decision making (Planning Commission, 2006).
Table 1.1 Articles of the Constitution of India
Article Description
Article 14 Men and women to have equal rights and opportunities in the
political, economic and social spheres.
Article 15(1) Prohibits discrimination against any citizen on the grounds of
religion, race, caste, sex etc.
Article 15(3) Special provision enabling the State to make affirmative
discriminations in favour of women.
Article 16 Equality of opportunities in matter of public appointments for
all citizens.
Article 39(a) The State shall direct its policy towards securing the right to
means of livelihood for all citizens, men and women, equally.
Article 39(d) Equal pay for equal work for both men and women.
Article 42 The State to make provision for ensuring just and humane
conditions of work and maternity relief.
Article51(A)(e) To renounce practices derogatory to the dignity of women.
Source: Report of the Working Group on Empowerment for Women for the XI Plan,
Ministry of Women and Child Development, Government of India(Planning Commission, 2006).
Drawing strength from the above, the Government of India has
continuously tried to translate the rights, commitments and safe guards
for women incorporated in the Indian constitution from a de jure to de
facto status. In this regard, it has also passed a number of legislation at
various points of time to ensure that women in the labour market are not
discriminated8.
8Refer Annexure I – Acts passed by Government of India in the Labour Market
P a g e | 1-11
Though a large number of women-related legislations are in place, the
efficacies of these laws are not satisfactory, primarily owing to poor
implementation. A major reason for this is the lack of adequate knowledge
regarding these special legislations and also the absence of gender
sensitivity on the part of functionaries in law enforcement, police,
prosecution, medical profession, judiciary etc. Women themselves too
need to be made aware of the special legislations that are available for
their protection and rights. Before determining the extent of the gender
pay gap in India, it is essential to understand the reasons that could have
led to this scenario.
1.3 Reasons for the gender pay gap in India
Empirical studies on the gender pay gap in India also provide evidence of
both human capital differences and labour market discrimination
(Madheswaran & Khasnobis, 2007). The typical model used by economists
to analyze the gender pay gap and its sources involves statistical
decomposition of the total wage gap into two categories generally called
explained or endowment, and unexplained or treatment components. The
endowment effect explains that the wage gap is owing to differences in
skills while the unexplained or treatment effect postulates that wage
differences arise owing to unequal gender treatment with otherwise
equally productive workers. The results of all such studies indicate that a
significant gender pay gap does exist in India and discrimination reflected
by the treatment effect is more pronounced than the endowment effect
(Jann, 2008). Almost two-thirds (63.5%) of the gender pay gap can be
accounted for by discrimination, which is least at the beginning of the
career but widens with experience. More experienced women face higher
inequality in pay (Duraisamy & Duraisamy, 1998). The human capital
theory argues that women deliberately choose lower paying jobs, but an
empirical study suggests that the greater part of the female earnings
disadvantage lies in their poor wage position owing to wage discrimination
P a g e | 1-12
and not in their occupational distribution (Madheswaran &
Lakshmanasamy, 1996).
The main reasons for the gender pay gap are:
Direct gender discrimination in labour markets: when people who
have the same level of educational qualifications and work
experience are treated differently because of their gender. This
occurs when:
o There are different pay levels for the same work
o There are different job requirements for the same pay level
Occupational segregation is more subtle as well as more delicate to
address with specific actions.
The jobs in which women are mostly employed are secretaries, teachers
and nurses. And even within these jobs, they are paid less than their male
counterparts (IWPR 2009). This basic undervaluation of a women‟s work is
because:
Since women‟s primary responsibility is assumed to be of unpaid
care work such as looking after children and family, it seems to
channel them into similar work areas in the labour market (UNIFEM,
2005). Sometimes, these differences are because of the selection
effect (Pertersen & Snartland, 2004). The selection effect suggests
that it is not women who choose certain kinds of occupations, but
most of the time it is employers who favor men over women.
In some cases, it is the specific way in which work is attained that
plays an important role in financial evaluation: “The physical
strength of the labourer may not be particularly well remunerated
unless supplemented with time-served and learned building skills.
But by the same token, the 'talents' of women, such as the capacity
for and the skills involved in caring, are not rewarded either (Rees,
1992).”

P a g e | 1-13
It is because of this gendered division of work, women may not have
sufficient bargaining power and are forced to take up lower paying jobs in
the labour market. Besides, women also face general barriers when they
enter the labour market which in turn affects their income growth and
prospects for promotion.
Yet another reason for the gender bias and the gender pay gap is the
duties and requirements of parenthood. Women often take up part-time
jobs or a career break when they are required to take care of their
children. Those women, who return to the labour market for a full-time
job after a break or part-time work, are often offered lower wages than
their male counterparts. Even those women who do not have children are
not given any preference because they are categorized as potential
mothers (Goldberg & Hill, 2007). Women who are not married are denied
employment opportunities on the grounds that they might quit jobs in
case they are married and have to move with their spouse or take time off
when getting married. These factors tend to increase the gender pay gap
(Education International, 2011). This report aims to measure the extent of
the gender pay gap in India using various parameters.

P a g e | 2-14
2 Survey Design and Data Collection9
2.1 Survey design
This paper uses survey data of individuals from India. The data has been
collected from the continuous and voluntary Paycheck India web survey
(www.paycheck.in) that is posted in English and Hindi. The survey
contains questions about wages, education, occupation, industry, socio-
demographics, and the like (Tijdens et al, 2010).
In 2000, the WageIndicator project (www.WageIndicator.org) started as a
paper-and-pencil survey for establishing a website with salary information
for women‟s occupations in the Netherlands. By mid-2011, it had
developed into an online data collection tool hosted in over 70 national
websites with job-related content, labour law and minimum wage
information, collective bargaining agreements, public sector wages, and a
free and crowd-pulling Salary Checker presenting average wages for 1600
occupations. WageIndicator project is assisted by world-renowned
universities, trade unions and employers‟ organization. Its international
staff consists of some 100 specialists worldwide.
Being an online volunteer survey, the data is biased towards those who
have access to the internet and are inclined to complete the
questionnaire. Because of this limitation, the data captures only the
organized sector in India.
2.2 Data collection
The data for this survey was collected through an online survey
questionnaire by the WageIndicator‟s Indian website, PaycheckIndia
9This section “Survey Design and Data Collection” is same for all the papers that used Paycheck.in
Salary data. This section describes the methodology of survey and data collection.
P a g e | 2-15
(www.paycheck.in)10. A total of 21,55211 people across India responded
by completing the online questionnaire over a period of 7.5 years from
2006-1312. These included both male and female respondents from
different age groups, varied industries, and various hierarchical positions
in their respective occupations. The primary parameters of this study are
Gender and Salary, each of which has been tested on various parameters
to draw conclusions for the survey.
2.3 Research sample
The primary data for this report is based on a voluntary online salary
survey conducted by Paycheck India13. Out of the 21,552 online responses
obtained through the survey, 18,043 were males and 3,509 were females.
Online data was collected over a period of 7.5 years (from 2006 to 2013)
from employed individuals, mostly in the organized sector spread across
India. The year-wise gender distribution of the overall respondents during
the period of survey shows that the ratio of male to female respondents
has been 5:1 on an average.
2.4 Data analysis
The objective of this report is to analyze wage differentials between
genders. The difference has been analyzed in multiple dimensions: across
industries, occupations, educational qualifications, age, etc. Average
salaries (median) across various dimensions for males and females have
been used to analyze the data in order to find out the percentage
difference in earnings.
The gender pay gap is computed according to the formula:
10 Available at http://www.paycheck.in/main/salary/Paysurveyit 11
Our earlier report covered time period 2006-2011. Total number of respondents was 16,500, out
of which 13,729 were males and 2,771 were females (Varkkey, Korde, & Anand, 2012). 12Paycheck India dataset is updated half-yearly. Dataset for this report is from 2006 to June, 2013. 13For more information about Paycheck India please visit http://www.paycheck.in/main/about-us

P a g e | 2-16
Pay Gap = Median wage female - Median wage male
Median wage male * 100%
It can be interpreted as the percentage difference between female and
male median wages (CELSI, 2012)14.
During the data analysis only those variables were considered where there
were sufficient numbers of female observations.
14 The formula used here for computation of gender pay gap is used in various reports published by WageIndicator Foundation.
P a g e | 3-17
3 Analysis of the Gender Pay Gap in India
3.1 The Gender Pay Gap in India
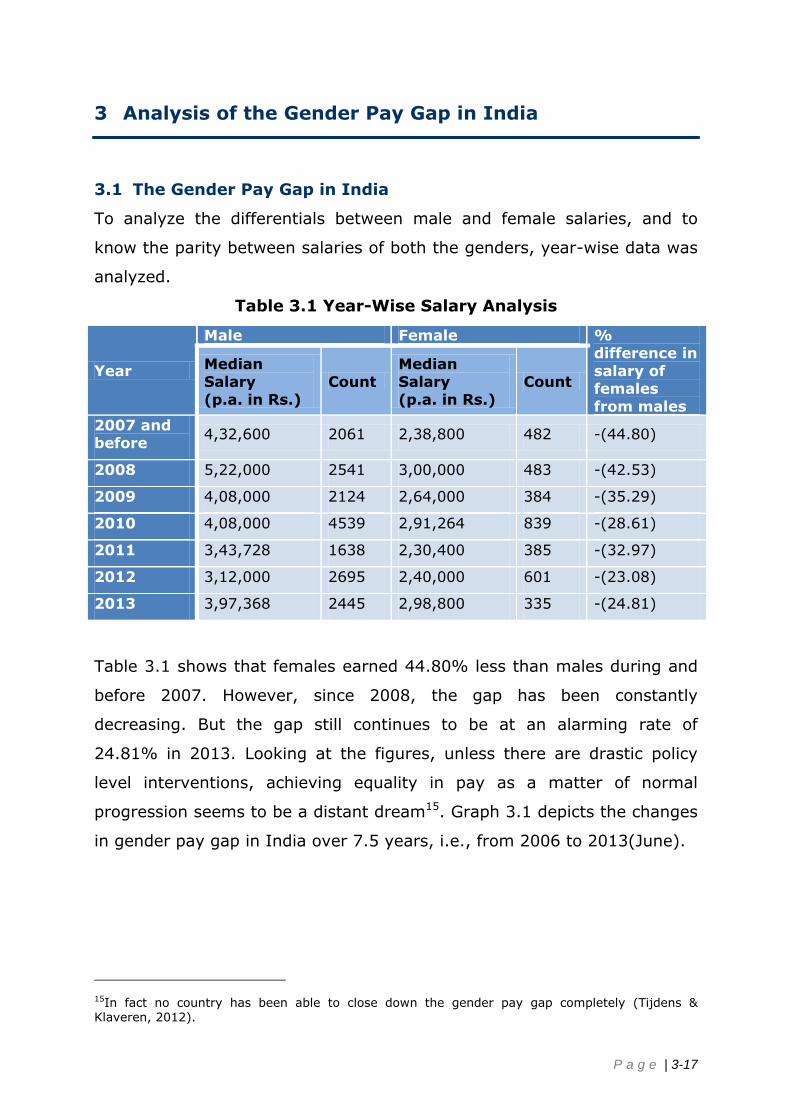
To analyze the differentials between male and female salaries, and to
know the parity between salaries of both the genders, year-wise data was
analyzed.
Table 3.1 Year-Wise Salary Analysis
Year
Male Female %
difference in
salary of females
from males
Median
Salary
(p.a. in Rs.)
Count
Median
Salary
(p.a. in Rs.)
Count
2007 and before
4,32,600 2061 2,38,800 482 -(44.80)
2008 5,22,000 2541 3,00,000 483 -(42.53)
2009 4,08,000 2124 2,64,000 384 -(35.29)
2010 4,08,000 4539 2,91,264 839 -(28.61)
2011 3,43,728 1638 2,30,400 385 -(32.97)
2012 3,12,000 2695 2,40,000 601 -(23.08)
2013 3,97,368 2445 2,98,800 335 -(24.81)
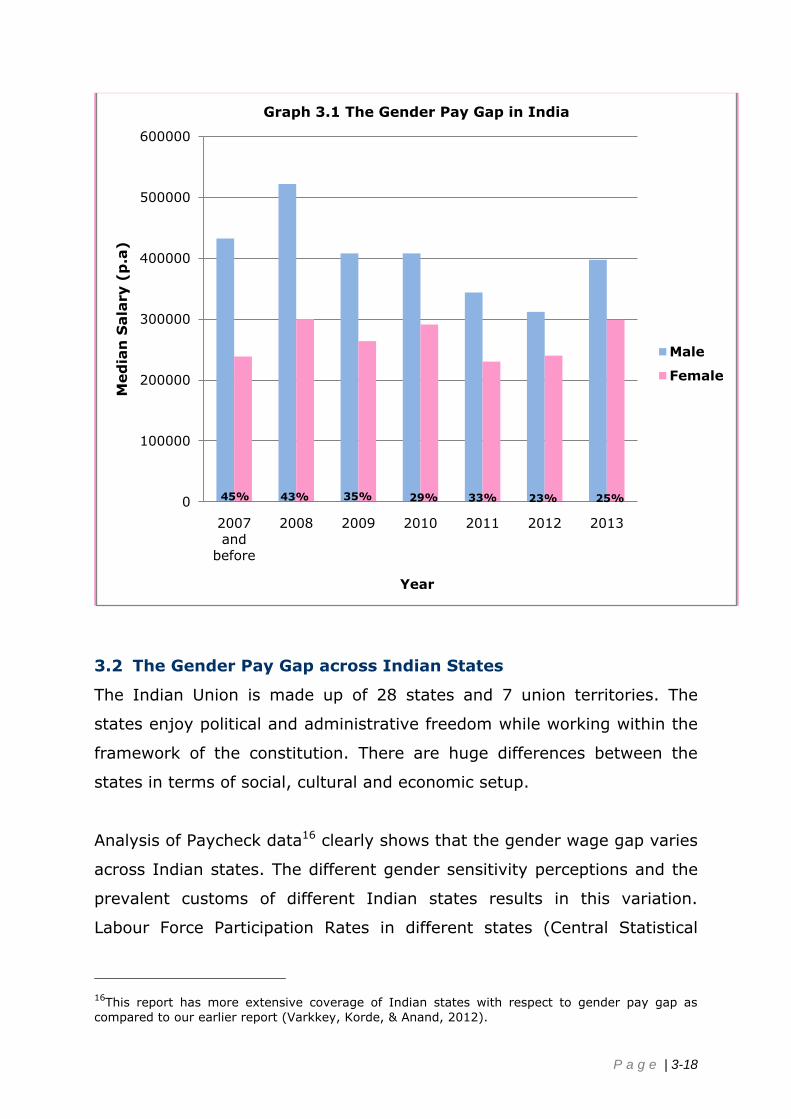
Table 3.1 shows that females earned 44.80% less than males during and
before 2007. However, since 2008, the gap has been constantly
decreasing. But the gap still continues to be at an alarming rate of
24.81% in 2013. Looking at the figures, unless there are drastic policy
level interventions, achieving equality in pay as a matter of normal
progression seems to be a distant dream15. Graph 3.1 depicts the changes
in gender pay gap in India over 7.5 years, i.e., from 2006 to 2013(June).
15In fact no country has been able to close down the gender pay gap completely (Tijdens & Klaveren, 2012).
P a g e | 3-18
3.2 The Gender Pay Gap across Indian States
The Indian Union is made up of 28 states and 7 union territories. The
states enjoy political and administrative freedom while working within the
framework of the constitution. There are huge differences between the
states in terms of social, cultural and economic setup.
Analysis of Paycheck data16 clearly shows that the gender wage gap varies
across Indian states. The different gender sensitivity perceptions and the
prevalent customs of different Indian states results in this variation.
Labour Force Participation Rates in different states (Central Statistical
16This report has more extensive coverage of Indian states with respect to gender pay gap as
compared to our earlier report (Varkkey, Korde, & Anand, 2012).
0
100000
200000
300000
400000
500000
600000
2007 and
before
2008 2009 2010 2011 2012 2013
Med
ian
Sala
ry (
p.a
)
Year
Graph 3.1 The Gender Pay Gap in India
Male
Female
45% 43% 35% 29% 33% 23% 25%
P a g e | 3-19
Organisation, 2006) may also affect the degree of the gender pay gap.
Although, the cultural restrictions that women face are changing, women
are still not as free as men to participate in the formal economy (Dreze &
Sen, 1995), (Dunlop & Velkoff, 1999), (Nihila, 1999).
For purpose of analysis, the Indian Union has been divided into six zones -
North, East, West, South, Central and North-East17. The zonal distribution
of Indian states with their respective gender pay gap figures is as depicted
in Table 3.218.
Table 3.2 The Gender Pay Gap across Indian States
Zone State Abbreviation % difference in
salary of females
from males
North Jammu & Kashmir JK -
Himachal Pradesh HP -(45)
Punjab PU -(11)
Uttarakhand UT -(9)
Uttar Pradesh UP -(15)
Haryana HA -(40)
New Delhi DE -(22)
Average -(23.66)
East Bihar BI -(63)
Orissa OR -
Jharkhand JH -(23)
West Bengal WB -(34)
Average -(40)
West Rajasthan RA -(44)
Gujarat GU -(37)
Goa GO -(39)
Maharashtra MA -(36)
Average -(39)
South Andhra Pradesh AP -(24)
17 In the light of the vision of Jawaharlal Nehru (first Prime Minister of India), five Zonal Councils were set up vide Part-III of the States Re-organisation Act, 1956 (Ministry of Home Affaris, 2010). 18Only those states are considered for this analysis which has sufficient number of female
observations.

P a g e | 3-20
Karnataka KA -(41)
Kerala KE -(44)
Tamil Nadu TN -(30)
Average -(34.75)
Central Madhya Pradesh MP -(29)
Chhattisgarh CA -(48)
Average -(38.5)
North-East Assam AS -(48)
Sikkim SI -
Nagaland NA -
Meghalaya ME -
Manipur MN -
Mizoram MI -
Tripura TR -
Arunachal Pradesh AR -
Average -(48)
The gender pay gap is highest for the states of Bihar, Chhattisgarh,
Assam, Himachal Pradesh and Rajasthan and Kerela, with females earning
63%, 48%, 48%, 45% and 44% less respectively. Uttarakand has the
lowest gender pay gap with females earning only 9% less than males,
followed by Punjab and Uttar Pradesh where women earned 10% and 15%
respectively less than males. For all other states, the pay gap ranges
between 22% to 43%. Zone-wise analysis of data shows that, the North
zone has the least gender pay gap of 24%, whereas the North-east and
East zone has the highest gender pay gap of 48% and 40% respectively.
Figure 3.2 givesa pictoral depiction of the gender pay gap across Indian
States.

P a g e | 3-21
Figure 3.2 Map of Indian States19
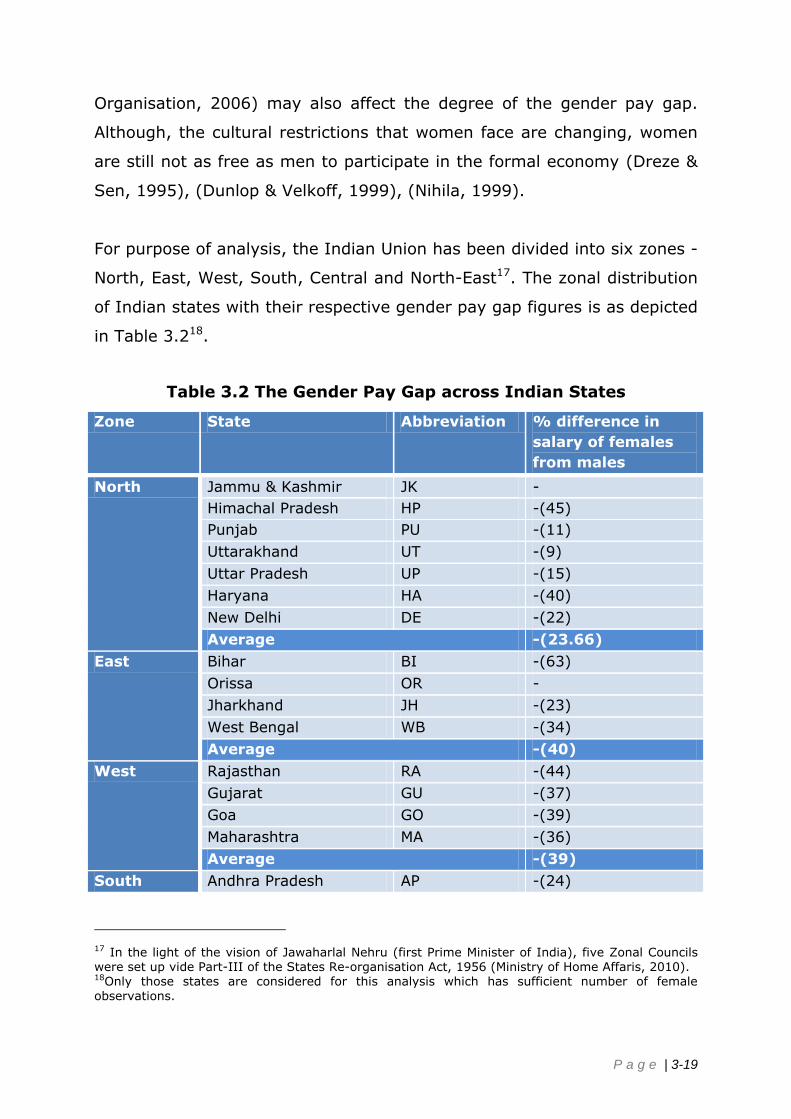
3.3 The Gender Pay Gap with Respect to Age
With increase in age, we would expect an increase in pay, and pay
differentials between men and women to reduce. But the socio-economic
framework in India does not guarantee that both sexes will receive the
same pay if they fall in the same age groups. This is attribute able to
19Map of India retrieved on 10th May, 2012 from
http://www.fileshome.com/India_Flash_Map_Flash_Map_Fla_Map_129689.html. This is a dead link
as on 25th September, 2013.
30%
24%
44%
41%
39%
36%
37%
44%
34%
48% 63%
23%
15%
29%
48%
22%
9%
45%
40%
11%

P a g e | 3-22
different reasons. Table 3.4 analyses the gender pay gap with respect to
age and the latter part of this section also offers a possible explanation for
the occurrence of the gap.
Table 3.3 The Gender Pay Gap with Respect To Age
Age
groups
Male Female %
difference
in salary of
females
from males
Median Salary
(p.a. in Rs.) Count
Median
Salary (p.a. in Rs.)
Count
18-30
years 3,12,000 9506 2,40,000 2299 -(23.07)
30-40
years 5,16,096 6638 3,60,000 936 -(30.24)
40-50 years
5,30,148 1458 3,89,604 197 -(26.51)
Above 50
Years 4,92,000 369 4,21,620 64 -(14.30)
We observe that the wage gap for the age group of below 30 years is
relatively low - females earned 23.07% less than males. A possible
explanation for this can also be found in section 3.11, where the gender
pay gap is the least for unmarried women20. But as the age increases, the
gender pay gap widens. For the age group of 30-40 years, the gender pay
gap is noticeably high, where females earned 30.24% less than males.
This is the age group where women are balancing multiple roles and also
usually tend to take frequent career breaks21. With more number of career
breaks in their job history, the bargaining capacity of women in terms of
wages declines. Men in the same bracket earn a higher salary compared
to women since they might not take such career breaks or generally have
higher bargaining power. But the gender wage gap reduces slightly for the
age group of 40-50 years where females earned 26.51% less than their
male peers. But for the age group of above 50 years females earn only
14.30% less than males. Again, at an older age, only those women, who
have a need to work, engage themselves in the labour market. A graphical
20In most cases, unmarried women are in age group of below 30years. 21Career breaks because of child bearing and child rearing.
P a g e | 3-23
representation of the gender pay gap with respect to age is shown in
graph 3.3.
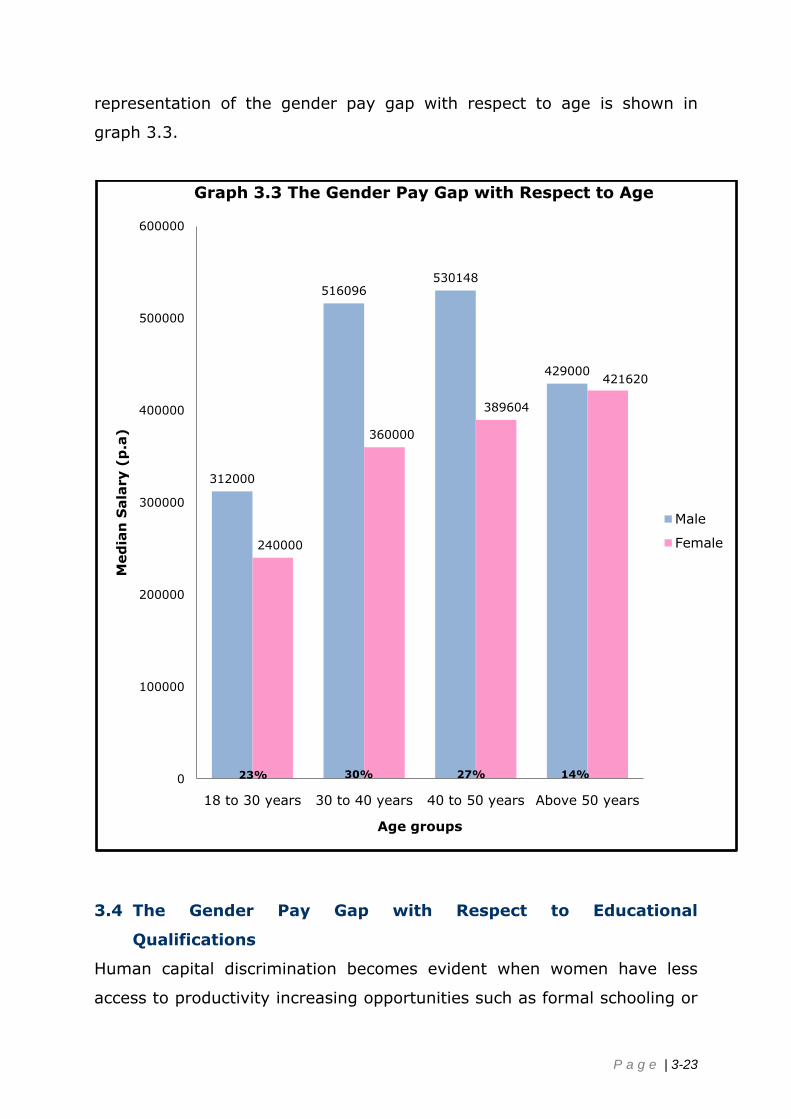
3.4 The Gender Pay Gap with Respect to Educational
Qualifications
Human capital discrimination becomes evident when women have less
access to productivity increasing opportunities such as formal schooling or
312000
516096530148
429000
240000
360000
389604
421620
0
100000
200000
300000
400000
500000
600000
18 to 30 years 30 to 40 years 40 to 50 years Above 50 years
Med
ian
Sala
ry (
p.a
)
Age groups
Graph 3.3 The Gender Pay Gap with Respect to Age
Male
Female
23% 30% 27% 14%

P a g e | 3-24
on-the-job training (World Bank, 2012), when compared to men.
Sometimes, women especially in India (UNICEF, 2003) are able to obtain
just basic education (that too with lot of difficulty, given that the female
literacy rate in India is only 65.46%)(National Comission on Population,
2013) or have access only to education of inferior quality as compared to
men22. This type of discrimination is also called pre-market (past or
indirect) discrimination, because it occurs before the individual seeks
employment. An analysis of the gender pay gap with respect to
educational qualifications is shown in Table 3.4.
Table 3.4 The Gender Pay Gap with Respect to Educational Qualifications
Education
Attainment
Male Female %
difference in salary of
females
from
males
Median
salary
(p.a. in Rs.)
Count
Median
salary
(p.a. in Rs.)
Count
No Formal Education 1,26,000 145 1,41,114 76 11.99
Below 10th Std 64,500 281 70,584 40 9.37
Advanced
certificate/diploma 3,36,000 709 3,01,260 1636 -(10.33)
Plus 2 or equivalent 1,16,640 810 99,900 108 -(14.35)
Three-year degree
(B.Sc., B.A., B.Com,
BBA, etc.)
2,40,000 3648 1,99,854 733 -(16.72)
Four/five year
degree (BE, MBBS,
LLB, etc)
5,40,000 4671 3,90,000 505 -(27.77)
Masters (Arts,
science, commerce,
etc.)
4,56,000 5928 2,70,120 1636 -(40.76)
CA/CS/ICWA or
equivalent 7,20,000 5928 4,01,400 81 -(44.25)
PhD. or equivalent 5,82,000 123 4,14,000 30 -(28.86)
Others 2,71,716 163 2,40,000 25 -(11.67)
22In India, due to social factors there is a preference for a male child and hence, more care is taken of the male child.

P a g e | 3-25
The analysis of the Paycheck data with respect to educational attainment
reveals some interesting outcomes. For no formal education and education
attainment below 10th standard, gender pay gap does exist but, it is men
who earn 12% and 9.37% respectively less than women. But with an
increase in education attainment, gender pay constantly increases. For
women with some basic education like Advanced certificate or Diploma,
Plus 2 or equivalent, and a three-year degree (B.Sc, B.A., B.Com, BBA,
etc.) earn 10.33%, 14.35% and 16.72% less than men respectively.23
However, the data shows that as educational qualifications of women
increase, the gender pay gap also increases. Women with four/five-year
degree courses and PhD. or equivalent earned 27.77% and 28.86% less
respectively than men. For higher educational qualifications like Masters
(any stream), CA/CS/ICWA or equivalent, the gender pay gap is the
highest - in the range of 40-44%24. So, with women attaining higher
educational qualifications, they stand a higher chance of facing
discrimination. A graphical representation is shown in Graph 3.4.
23Some women face pre-market discrimination and are not able to continue their education further.
In India, it is usually a custom for parents decide the future for their daughters. The average age of marriage in India is 18.3 (UNICEF, 2001) (though it has been increasing over the years with social and cultural reforms). Parents even decide about the groom and time of marriage in India. This results in an abrupt end to further education for most women in India. In other cases, people
anticipate post-market discrimination and choose not to invest further in education especially for women. 24In India, education equivalent to Plus 2 is considered as very basic education whereas post-
graduate programmes are considered as higher education. Higher education attainment means advanced knowledge and skills which enables individuals to earn higher wages in the labour market.
P a g e | 3-26
3.5 The Gender Pay Gap with Respect to Industry Type
The jobs of men and women differ to a great extent, whether across
sectors, industries, occupations, types of jobs, or types of firms. Though
“these differences evolve with economic development, the resulting
changes in the structure of employment are not enough to eliminate
employment segregation by gender. So, women all over the world appear
to be concentrated in low-productivity jobs” (World Bank, 2012). This is
126000
64500
336000
116640
240000
540000
456000
720000
582000
271716
141114
70584
301260
99900
199854
390000
270120
401400
414000
240000
0 200000 400000 600000 800000
No Formal Education
Below 10th Std
Advanced certificate/diploma
Plus 2 or equivalent
Three-year degree (B.Sc., B.A., B.Com, BBA, etc.)
Four/five year degree (BE, MBBS, LLB, etc)
Masters (Arts, science, commerce, etc.)
CA/CS/ICWA or equivalent
PhD or equivalent
Others
Median Salary (p.a)
Ed
ucati
on
al Q
ualifi
cati
on
sGraph 3.4 The Gender Pay Gap with Respect to
Educational Qualifications
Female Male
12%
9%
10%
14%
28%
16%
41%
44%
29%
12%
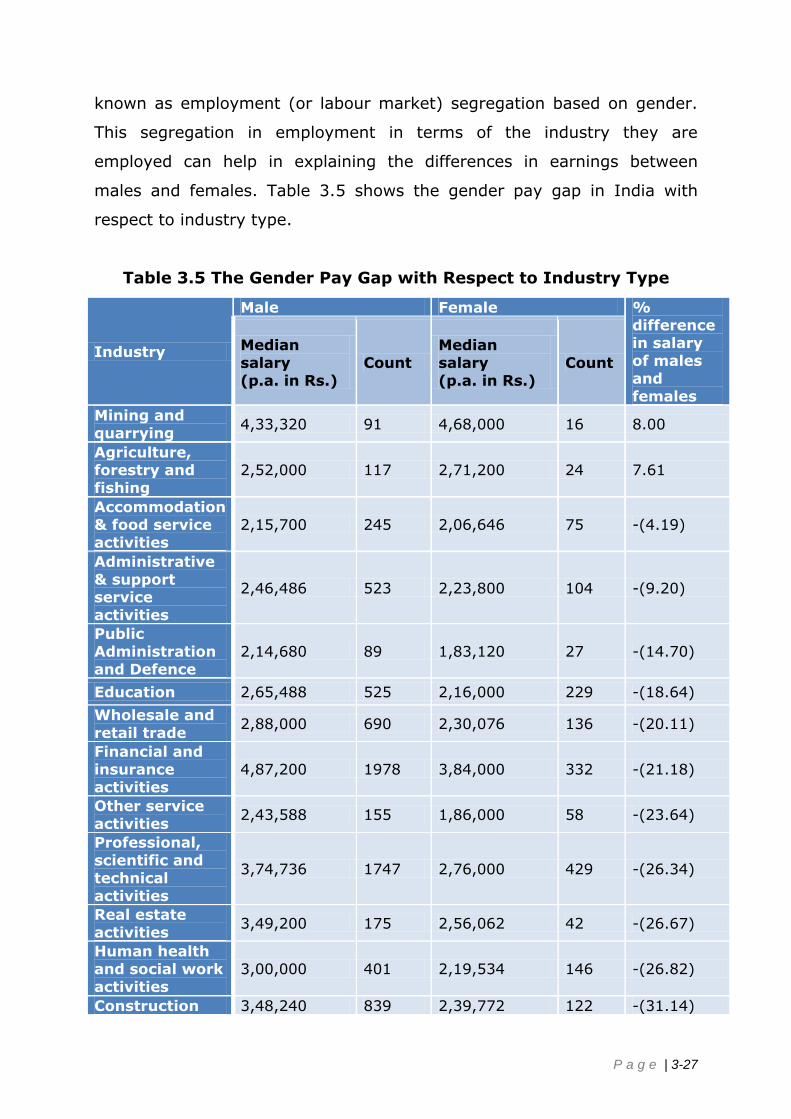
P a g e | 3-27
known as employment (or labour market) segregation based on gender.
This segregation in employment in terms of the industry they are
employed can help in explaining the differences in earnings between
males and females. Table 3.5 shows the gender pay gap in India with
respect to industry type.
Table 3.5 The Gender Pay Gap with Respect to Industry Type
Industry
Male Female %
difference in salary
of males
and
females
Median
salary
(p.a. in Rs.)
Count
Median
salary
(p.a. in Rs.)
Count
Mining and
quarrying 4,33,320 91 4,68,000 16 8.00
Agriculture, forestry and
fishing
2,52,000 117 2,71,200 24 7.61
Accommodation & food service
activities
2,15,700 245 2,06,646 75 -(4.19)
Administrative
& support service
activities
2,46,486 523 2,23,800 104 -(9.20)
Public
Administration
and Defence
2,14,680 89 1,83,120 27 -(14.70)
Education 2,65,488 525 2,16,000 229 -(18.64)
Wholesale and
retail trade 2,88,000 690 2,30,076 136 -(20.11)
Financial and
insurance
activities
4,87,200 1978 3,84,000 332 -(21.18)
Other service
activities 2,43,588 155 1,86,000 58 -(23.64)
Professional,
scientific and
technical
activities
3,74,736 1747 2,76,000 429 -(26.34)
Real estate
activities 3,49,200 175 2,56,062 42 -(26.67)
Human health
and social work
activities
3,00,000 401 2,19,534 146 -(26.82)
Construction 3,48,240 839 2,39,772 122 -(31.14)

P a g e | 3-28
Information and
Communication
5,52,000 3992 3,56,982 626 -(35.32)
Manufacturing 3,56,520 3372 2,17,200 484 -(39.07)
Arts,
entertainment and recreation
4,08,000 112 2,40,000 35 -(41.17)
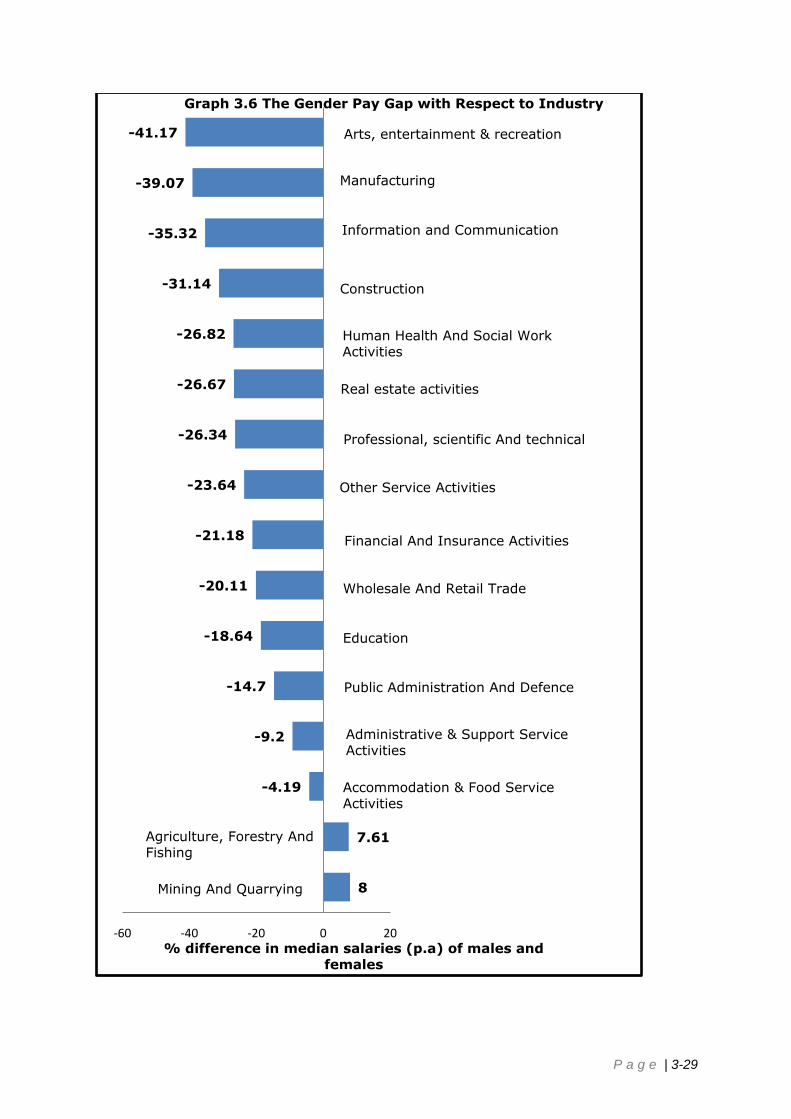
All industries face a gender pay gap crisis. Mining and quarrying industry
and agriculture, forestry and fishing industry are two sectors where
women are paid more than men, 8% and 7.61% respectively. All other
industries face a reverse gender pay gap problem. The gap can be small
or big, with women being paid less than men. It ranges from a small gap
of 4.19% (accommodation and food service) to a substantial gap of
41.17% (arts, entertainment and recreation). A graphical representation
is shown in graph 3.5.
P a g e | 3-29
8
7.61
-4.19
-9.2
-14.7
-18.64
-20.11
-21.18
-23.64
-26.34
-26.67
-26.82
-31.14
-35.32
-39.07
-41.17
-60 -40 -20 0 20% difference in median salaries (p.a) of males and
females
Graph 3.6 The Gender Pay Gap with Respect to Industry
Administrative & Support Service Activities
Public Administration And Defence
Education
Wholesale And Retail Trade
Financial And Insurance Activities
Other Service Activities
Professional, scientific And technical
Real estate activities
Construction
Information and Communication
Manufacturing
Arts, entertainment & recreation
Accommodation & Food Service Activities
Human Health And Social Work Activities
Agriculture, Forestry And Fishing
Mining And Quarrying

P a g e | 3-30
3.6 The Gender Pay Gap with Respect to Work Experience
Human capital can be gained not only by investing in education but also
through work experience. It is expected that over a period of time, people
with the same amount of work experience should be paid similar salaries.
This also assumes that education/skill levels are congruent. The Paycheck
data analysis shows a rather unexpected trend, as depicted in Table 3.6
below.
Table 3.6 The Gender Pay Gap with Respect to Work Experience
Work
Experience
Male Female % difference
in salary of
females
from males
Median salary
(p.a. in Rs.) Count
Median
salary
(p.a. in Rs.)
Count
0-15 years 3,67,921 13121 2,65,771 2756 -(27.76)
16-30 years 5,40,168 3100 4,05,334 417 -(24.96)
Above 31
years 11,21,111 274 2,44,011 29 -(78.23)
The gender pay gap, when analysed based on work experience, has shown
a mixed trend. The pay gap has been fluctuating (in terms of an increase
and decrease) on alternate work experience groups. We see that the
highest pay discrimination is faced by women in the experience group of
above 31 years. The women in this experience group earned 78.23% less
than men. Women in the experience group of 0-15 years also faced a
substantial gender pay gap where they earned 27.76% less than men. For
the experience group of 16-30 years, women earned 24.96% less than
men and are the ones to come across the lowest pay discrimination. A
graphical representation is shown in Graph 3.6.

P a g e | 3-31
3.7 The Gender Pay Gap with Respect to
Position/Designation/Level in Occupational Hierarchy
While assessing the productivity of an employee, the impact of group or
team effort cannot be ignored. Unfavourable social interactions on the job
can lead to decreased productivity. For example, especially in Indian
society, some male workers may become disgruntled when obligated to
work with or take orders from women. And therefore, in the interest of
productivity and profits, employers may decide to segregate men and
women employees on the job. Moreover, many employers have
preconceived notions about the job capabilities of women. Thus, it is often
seen that women are not preferred for promotion to higher designations in
the occupational hierarchy. This may result in most women crowding at
367921
540168
1121111
265771
405334
244011
0
200000
400000
600000
800000
1000000
1200000
0-15 years 16-30 years Above 31 years
Med
ian
Sala
ry (
p.a
)
Work Experience
Graph 3.6 The Gender Pay Gap with Respect to
Work Experience
Male
Female
28% 25% 78%
P a g e | 3-32
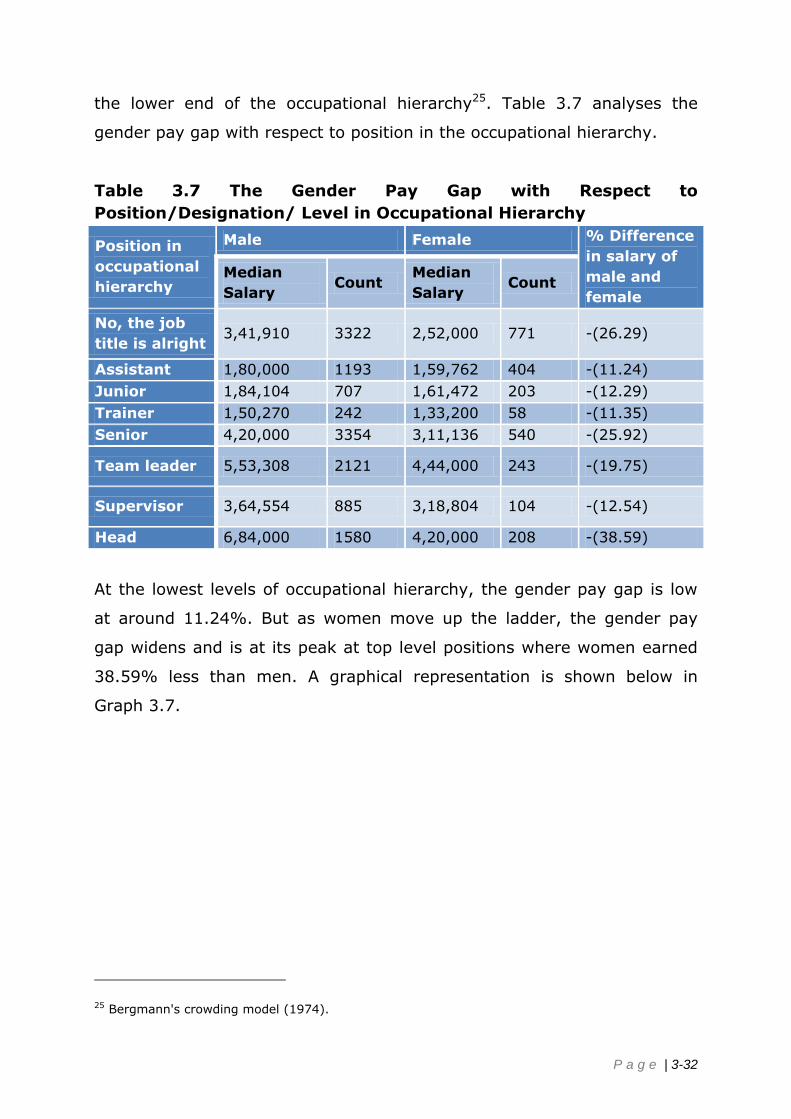
the lower end of the occupational hierarchy25. Table 3.7 analyses the
gender pay gap with respect to position in the occupational hierarchy.
Table 3.7 The Gender Pay Gap with Respect to
Position/Designation/ Level in Occupational Hierarchy
Position in
occupational
hierarchy
Male Female % Difference
in salary of
male and
female
Median
Salary Count
Median
Salary Count
No, the job
title is alright 3,41,910 3322 2,52,000 771 -(26.29)
Assistant 1,80,000 1193 1,59,762 404 -(11.24)
Junior 1,84,104 707 1,61,472 203 -(12.29)
Trainer 1,50,270 242 1,33,200 58 -(11.35)
Senior 4,20,000 3354 3,11,136 540 -(25.92)
Team leader 5,53,308 2121 4,44,000 243 -(19.75)
Supervisor 3,64,554 885 3,18,804 104 -(12.54)
Head 6,84,000 1580 4,20,000 208 -(38.59)
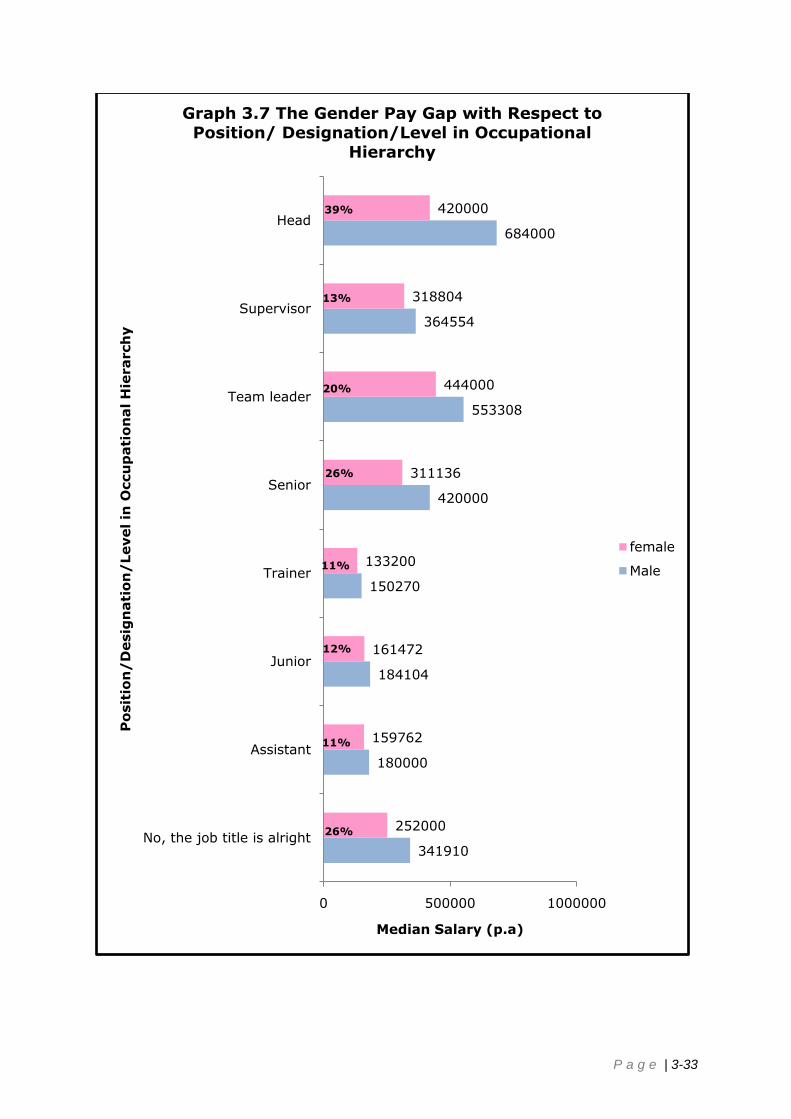
At the lowest levels of occupational hierarchy, the gender pay gap is low
at around 11.24%. But as women move up the ladder, the gender pay
gap widens and is at its peak at top level positions where women earned
38.59% less than men. A graphical representation is shown below in
Graph 3.7.
25 Bergmann's crowding model (1974).
P a g e | 3-33
341910
180000
184104
150270
420000
553308
364554
684000
252000
159762
161472
133200
311136
444000
318804
420000
0 500000 1000000
No, the job title is alright
Assistant
Junior
Trainer
Senior
Team leader
Supervisor
Head
Median Salary (p.a)
Po
sit
ion
/D
esig
nati
on
/Level in
Occu
pati
on
al H
ierarch
yGraph 3.7 The Gender Pay Gap with Respect to
Position/ Designation/Level in Occupational
Hierarchy
female
Male
39%
13%
20%
26%
11%
12%
11%
26%

P a g e | 3-34
3.8 The Gender Pay Gap with Respect to Level of Skill
Skill is the ability that an individual acquires from one‟s knowledge,
practice, aptitude, etc. The labour market awards higher wages to
individuals with higher skill sets and it is expected that individuals with
same skill set should be paid similar wages. Milgrom and Oster illustrated
this idea by considering two classes of workers – “a „regular‟ group and a
„disadvantaged‟ group. If it is easier to hide the disadvantaged group than
the regular group, then firms will not promote or pay the skilled members
of the disadvantaged group as much as they pay other skilled workers.
This leads to persistent discrimination (that is, lower wages and under-
representation in senior positions) against the disadvantaged workers and
less investment in human capital by members of this group (Milgrom &
Oster, 1987)”. The Paycheck data analysis of the gender pay gap with
respect to the level of skills required is shown in Table 3.8.
Table 3.8 The Gender Pay Gap with Respect to Level of Skill
Level of
Skill
Male Female %
difference
in salary
of males and
females
Median salary
(p.a. in Rs.) Count
Median salary
(p.a. in Rs.) Count
Unskilled 1,48,284 297 1,41,450 97 -(4.60)
Semi-
skilled 1,44,000 1972 1,53,804 375 6.80
Skilled 4,14,000 5502 3,00,000 956 -(27.53)
Highly
skilled 4,55,670 8889 2,88,108 1816 -(36.77)
It is evident from the table above that the gender pay gap is low for
unskilled jobs where women earned 4.60% less men. However, the
gender pay gap widens for skilled and highly skilled jobs where women
earned 27.53% and 36.77% less respectively than men. This gap
suggests that not many women are preferred for skilled jobs. Even if they
are able to make it, they tend to be paid less than their male
counterparts. The only section where women earned 6.80% more than
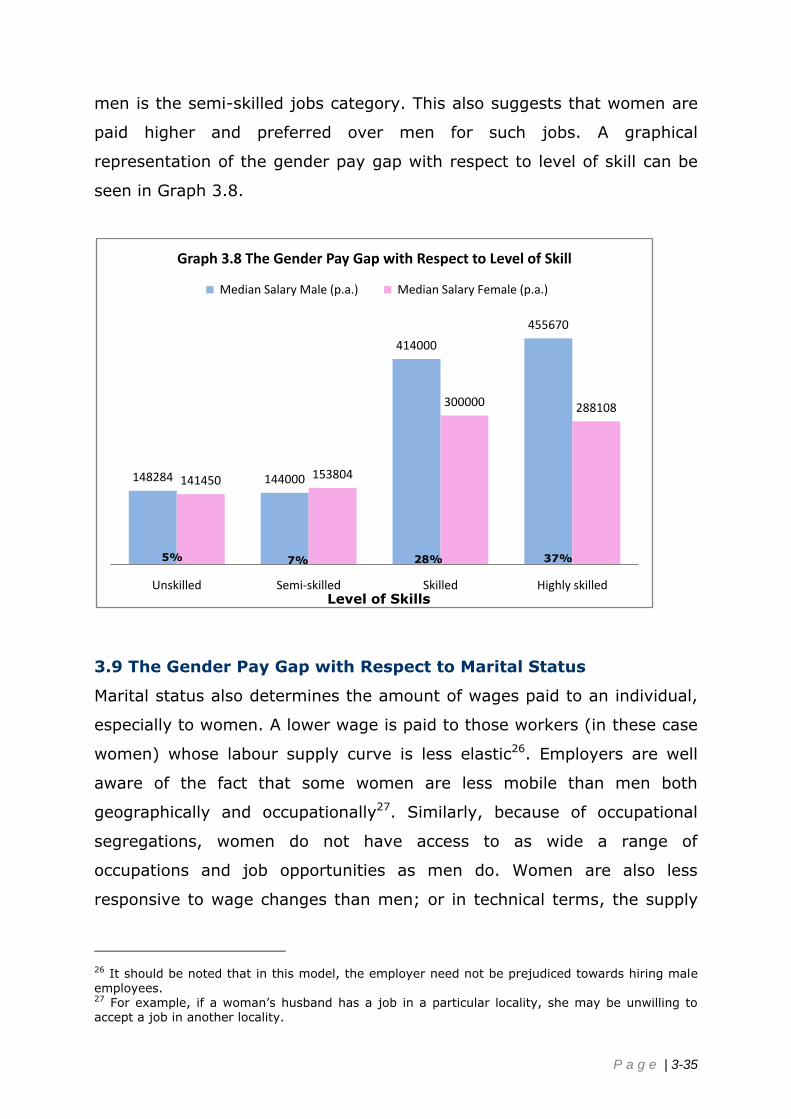
P a g e | 3-35
men is the semi-skilled jobs category. This also suggests that women are
paid higher and preferred over men for such jobs. A graphical
representation of the gender pay gap with respect to level of skill can be
seen in Graph 3.8.
3.9 The Gender Pay Gap with Respect to Marital Status
Marital status also determines the amount of wages paid to an individual,
especially to women. A lower wage is paid to those workers (in these case
women) whose labour supply curve is less elastic26. Employers are well
aware of the fact that some women are less mobile than men both
geographically and occupationally27. Similarly, because of occupational
segregations, women do not have access to as wide a range of
occupations and job opportunities as men do. Women are also less
responsive to wage changes than men; or in technical terms, the supply
26 It should be noted that in this model, the employer need not be prejudiced towards hiring male
employees. 27 For example, if a woman‟s husband has a job in a particular locality, she may be unwilling to accept a job in another locality.
148284 144000
414000
455670
141450 153804
300000 288108
Unskilled Semi-skilled Skilled Highly skilled
Graph 3.8 The Gender Pay Gap with Respect to Level of Skill
Median Salary Male (p.a.) Median Salary Female (p.a.)
28%5% 7% 37%
Level of Skills
P a g e | 3-36
curve of women is less elastic. One more reason attributed to the less
elastic supply curve of women is that they are less likely to be unionized
than men. Industrial unions establish a uniform wage which makes the
labour supply curve perfectly elastic at that wage28. Thus, in firms where
men are unionized and women are not, the labour supply of women will be
less elastic than for men, resulting in wage differentials that are
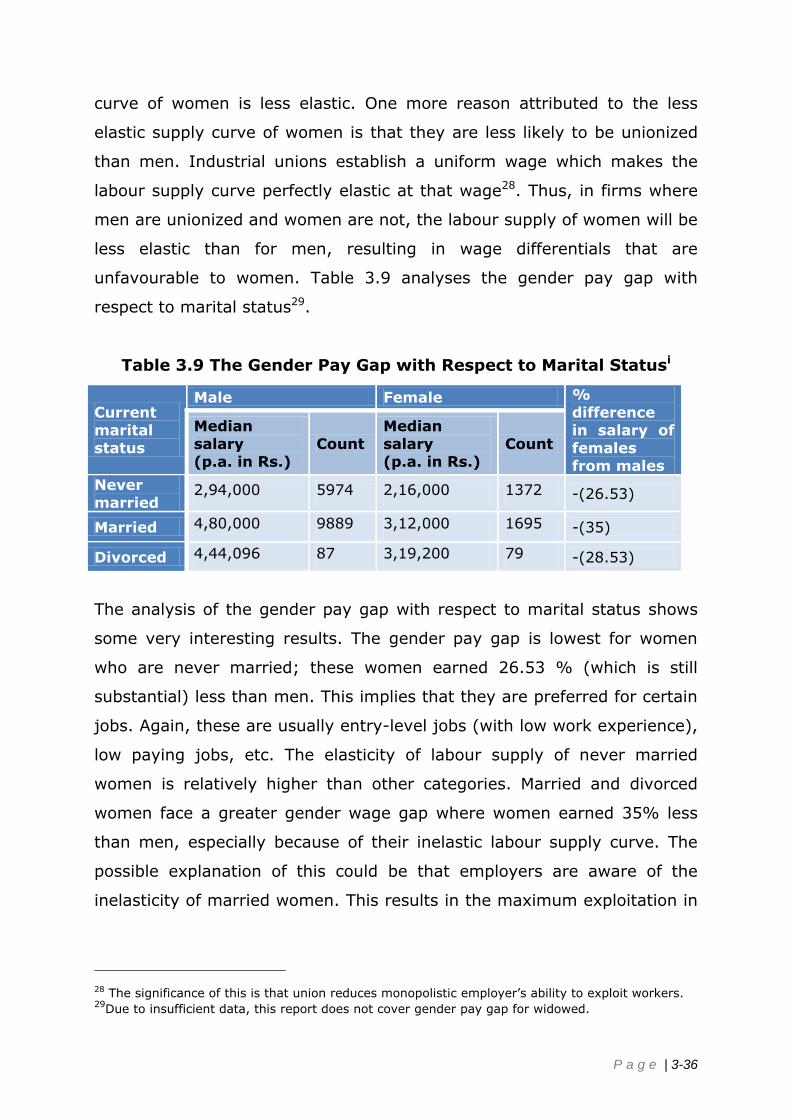
unfavourable to women. Table 3.9 analyses the gender pay gap with
respect to marital status29.
Table 3.9 The Gender Pay Gap with Respect to Marital Statusi
Current
marital
status
Male Female %
difference
in salary of
females
from males
Median
salary
(p.a. in Rs.)
Count
Median
salary
(p.a. in Rs.)
Count
Never
married 2,94,000 5974 2,16,000 1372 -(26.53)
Married 4,80,000 9889 3,12,000 1695 -(35)
Divorced 4,44,096 87 3,19,200 79 -(28.53)
The analysis of the gender pay gap with respect to marital status shows
some very interesting results. The gender pay gap is lowest for women
who are never married; these women earned 26.53 % (which is still
substantial) less than men. This implies that they are preferred for certain
jobs. Again, these are usually entry-level jobs (with low work experience),
low paying jobs, etc. The elasticity of labour supply of never married
women is relatively higher than other categories. Married and divorced
women face a greater gender wage gap where women earned 35% less
than men, especially because of their inelastic labour supply curve. The
possible explanation of this could be that employers are aware of the
inelasticity of married women. This results in the maximum exploitation in
28 The significance of this is that union reduces monopolistic employer‟s ability to exploit workers. 29
Due to insufficient data, this report does not cover gender pay gap for widowed.

P a g e | 3-37
terms of wages. A graphical representation of the gender pay gap with
respect to marital status can be seen in Graph 3.9.
294000
480000444096
216000
312000 319200
Never married Married Divorced
Graph 3.9 The Gender Pay Gap with Respect to
Marital Status
Median salary Male (p.a) Median salary Female (p.a)
35%27% 29%
P a g e | 4-38
4 Conclusion
The issue of gender pay gap is important because it affects a significant
portion of the working population. Many reasons contribute to the gap. If
the extent of the gender pay gap can be accounted for, then an inquiry
can be made into the determinants of the gap. The existence of such a
gap is unconstitutional; bridging the gap is also the subject of public policy
interventions.
Women constitute for almost half the population of India (48%)(Census
India, 2011) and thus, half its potential labour force. But the Labour Force
Participation Rate for females in India is only 29% (The World Bank,
2011). Various studies have shown that women are often disadvantaged
in relation to access to employment opportunities and conditions of work;
furthermore, many women sometimes forego or curtail employment
because of family pressures or responsibilities (United Nations, 2011).
Hence, only if the degree of the gender pay gap and its various features
are determined, appropriate government interventions can be designed to
help in reducing these income disparities (Haas, 2006). This study of the
gender pay gap is designed to provide directions in this regard.
The primary data for this report is based on a voluntary online salary
survey conducted by PaycheckIndia (www.paycheck.in) collected over a
period of 7.5 years (2006-2013). One limitation of this data, being
collected through an online voluntary survey, is the bias towards those
who have access to the internet and are inclined to complete the web
survey. Because of this limitation, the data captures only those working in
the organized sector30 in India31.
30The employment in the unorganized sector in India cannot be ignored, since it accounts for 95.5% of total employment in 2004-05, with 1.5% each in public and private corporate sectors,

P a g e | 4-39
The report analyses the gender pay gap in India on various parameters
and also enquires into the reasons for the same. While the gender pay gap
computed in terms of a national average (annual gross salary) has been
narrowing over the years, it is still very high. Women before 2007 earned
45% less than men, whereas in 2013 they earned 24.81% less than
men32.
The gender pay gap figures also vary across Indian states. The gender pay
gap is highest for the states of Bihar, Chhattisgarh, Assam and Himachal
Pradesh. Uttarakhand registered the lowest gender pay gap followed by
Punjab, Uttar Pradesh, and New Delhi33.
Further, the Paycheck data divulges that the gender wage gap is
substantially high for women between 30 to 40 years (30.24)34.All
industries35 are faced with a gender pay gap crisis. Ranging from a small
pay gap of 4.19% (accommodation & food service activities) to a
substantial gap of 41.17% (arts, entertainment and recreation), every
industry, small or big, is facing that situation36.
When compared for years of work experience, the highest pay
discrimination is faced by women in the experience group of above 31
years 78.23% Women in the experience group of 16-30 years come
across as facing the lowest pay discrimination 24.96%37. The gender wage
gap is less than 12.29% at the lowest levels of occupational hierarchy. But
7.9% in household excluding informal sector and the balance 84.6% in the informal sector
(National Statistical Commission, 2012). 31To counterbalance the bias in the web-survey Paycheck India aims to conduct face-to-face surveys in future. 32
Refer Section 3.1 33Refer Section 3.2 34 Refer Section 3.3 35The informal sector is not captured in this survey. 36Refer Section 3.5 37Refer Section 3.7

P a g e | 4-40
as women move up the occupational hierarchy, the gender pay gap
widens and is at its peak at the top level positions at 38.59% (Head)38.
The gender pay gap is negligible for semi-skilled jobs with a difference of
6.80%, which also implies that women are marginally preferred over men
for such jobs. The gender pay gap is low for unskilled jobs at 4.60%.
However, the gender pay gap widens to 27.53% for skilled and almost
36.77% for highly skilled jobs39. Moreover, the gender pay gap is the
lowest for women who are never married at 26.53%. But it is divorced
women who face the highest gender pay gap at 28.53%.
No country has been able to close down the gender pay gap completely
(Tijdens & Klaveren, 2012). But looking at the gender pay gap figures in
India, unless there are focused policy-level interventions, achieving
equality in pay as a matter of normal progression seems to be a distant
dream. The Constitution of India does promise equality in all aspects to its
citizens, irrespective of any characteristic. But there still exist vast
differences in socio-economic aspects, which imply a direct violation of
basic rights, especially when it comes to not giving equal opportunity and
equal pay to women who choose to work in the organized sector. By
denying equality to women, the nation is not harnessing the potential of
its labour forced to the fullest. At the same time, it should be also noted
that policy interventions should focus on programs that encourage and
support women to make their mark in the world of work.
Apart from constitutional provisions, there have been administrative
actions initiated in that direction. For example, the government has tried
to set norms that would limit discrimination of employees through the
Sixth Pay Commission (Ministry of Finance, 2008). With a continuously
growing private sector (Economic Survey, 2013) in India, firms will have
38Refer Section 3.8 39Refer Section 3.9
P a g e | 4-41
to formulate their policies such that the gap-induced limitations do not
contaminate the labour market.
In spite of the efforts, overtime, the gender pay gap has got
institutionalized. This is a matter of concern. But time has come now that,
we should focus to try and reduce its impact on society. If these issues are
not contained right now, then the problem of the gender pay gap can
further aggravate. Thus, policy-level interventions will have to be
complemented with changes in socio-cultural factors as well.

P a g e | 4-42
Bibliography
CELSI. (2012). Loonwijzer-Monsterboard Wage Index. Sector Analysis of
the Netherlands. Amsterdam: Wage Indicator Foundation and
Bratislava, Central European Labour Studies Institue (CELSI).
Census India. (2011). Chapter 5: Gender Composition of the Population.
Retrieved September 24, 2013, from Census India:
http://www.censusindia.gov.in/2011-prov-
results/data_files/india/Final_PPT_2011_chapter5.pdf
Central Statistical Organisation. (2006). Selected Socio-Economic
Statistics - India. Ministry of Statis and Programme Implemtation,
Government of India.
Dreze, J., & Sen, A. (1995). India: Economic Development and Social
Opportunity. Oxford: Oxford University Press.
Dunlop, J. E., & Velkoff, V. A. (1999, December 3). Women and the
Economy in India. U.S. Census Bureau, Offical Statistics.
Duraisamy, P., & Duraisamy, M. (1998). Accounting for Wage differentials
in an Organized Labour Market in India. The Indian Journal of
Labour Economics, 41(4), 934-944.
Economic Survey. (2013). Economic Survey 2012-13. Ministry of Finance,
Government of India.
Education International. (2011, March 3). The Gender Pay Gap - Reasons
and Implications. Pay Equity Now. Brussels, Belgium:
http://download.ei-ie.org/Docs/WebDepot/feature2 - 100303 -
reasons and implications - final EN.pdf.
Goldberg, J. D., & Hill, C. A. (2007). Behind the Pay Gap. Washington, DC:
AAUW Educational Foundation.
Haas, S. (2006). Economic Development and the Gender Wage Gap. The
Park Place Economist, 14, 49-55.
Hausmann, R., Tyson, L. D., & Zahidi, S. (2011). The Global Gender Gap
Report. Geneva: World Economic Forum.
Jann, B. (2008). The Blinder-Oaxaca Decomposition for Liner Regression
Models. The Stata Journal, 8(4), 453-479.
Madheswaran, S., & Khasnobis, B. G. (2007, January 5 - 7).
Decomposition of Gender Wage Gap in India: An Econometric
Analysis. Retrieved September 25, 2013, from 43rd Annual
Conference of The Indian Econometric Society, IIT Bombay,
Mumbai:

P a g e | 4-43
http://www.google.co.in/url?sa=t&rct=j&q=&esrc=s&frm=1&source
=web&cd=7&ved=0CG4QFjAG&url=http%3A%2F%2Fwww.hss.iitb.a
c.in%2Fties07%2Fpaper%2Fts5%2FpsB%2F1.doc&ei=4fgEULiGC4n
5rQfu6_CxBg&usg=AFQjCNEHTQzJYQLkIpOoJqjErF5pslBs6w
Madheswaran, S., & Lakshmanasamy, T. (1996). Occupational
Segregation and Earnings Differentials by Sex: Evidence from India.
Artha Vijnana, 38(4), 372-386.
Milgrom, P., & Oster, S. (1987). Job Discrimination, Market Forces, and
the Invisibility Hypothesis. The Quaterly Journal of Economics,
80(3), 453-476.
Ministry of Finance. (2008). Report of the Sixth Central Pay Commission.
Government of India.
Ministry of Home Affaris. (2010, July 14). Zoncil Council. Retrieved
September 25, 2013, from Ministry of Home Affaris, Government of
India: http://mha.nic.in/uniquepage.asp?ID_PK=470
National Comission on Population. (2013, June 7). Literacy Rate. Retrieved
September 25, 2013, from National Comission on Population:
http://populationcommission.nic.in/content/933_1_LiteracyRate.asp
x
National Statistical Commission. (2012). Report of the Committee on
Unorganised Sector Statistics. Government of India.
Nihila, M. (1999, April 17-24). Marginalisation of Women Workers: Leather
Tanning Industry in Tamil Nadu. Economic and Political Weekly.
Pertersen, T., & Snartland, V. (2004). Firms, Wages, and Incentives:
Incentive Systems and Their Impacts on Wages, Productivity, and
Risks. Research in Social Stratification and Mobility, 21, 255-288.
Planning Commission. (2006). Report of the Working Group on
Empowerment of Women for The XI Plan (2007 - 2012. Ministry of
Women and Child Development, Government of India.
Rees, T. L. (1992). Women and the Labour Market. London: Routledge.
Sen, A. (2001, Oct. 27 - Nov. 09). Many Faces of Gender Inequality.
Frontline, 18(22).
The World Bank. (2011). Gender Equality Data and Statistics. Retrieved
September 24, 2013, from www.worldbank.org:
http://datatopics.worldbank.org/gender/topic/economic-structure
Tijdens, K. G., & Klaveren, M. V. (2012). Frozen in Time: Gender Pay Gap
Unchanged for 10 Years. Brussels: ITUC.

P a g e | 4-44
UNICEF. (2001). Age at Marriage - India. Retrieved September 25, 2013,
from UNICEF:
http://www.unicef.org/india/Media_AGE_AT_MARRIAGE_in.pdf
UNICEF. (2003, February 26). India Statistics. Retrieved September 25,
2013, from UNICEF:
http://www.unicef.org/infobycountry/india_statistics.html#103
UNIFEM. (2005). Progress of The World's Women: Women, Work and
Poverty. New york: United Nations Development Fund for Women.
United Nations. (2011). World's Women - Chapter 4: Work. Retrieved
September 24, 2013, from www.unstats.un.org:
http://unstats.un.org/unsd/demographic/products/Worldswomen/W
W2010%20Report_by%20chapter(pdf)/Work.pdf
Varkkey, B., Korde, R., & Anand, L. (2012, October 27). Retrieved
December 7, 2012, from WageIndicator.org:
http://www.WageIndicator.org/documents/publicationslist/publicatio
ns-2012/Gender%20Pay%20Gap%20FINAL%20REPORT.pdf
World Bank. (2012). World Development Report. World Bank.
Zahidi, S., & Ibarra, H. (2010). The Corporate Gender Gap Report.
Geneva: World Economic Forum.

P a g e | 4-45
Annexure
Annexure I:Acts passed by the Government of India in the Labour
Market (Planning Commission, 2006)
Workmen’s Compensation Act, 1923
•This Act was aimed at providing financial protection to the workman &his/her dependents in case of accidental injury by means of payment ofcompensation by a certain class of employers. Due to the difference inbargaining power, there are chances that the woman may be subject toexploitation.
Minimum Wages Act , 1948
•In accordance with Article 39 of the Constitution, this Act was passed toprovide for a statutory fixation of minimum wages, since workers arepoorly organized and have less bargaining power. It provides for fixationof minimum wages by the government for employment and provides formachinery for fixing and revision of minimum wages
Factories Act, 1948
•This Act was introduced to regulate the condition of labourers employedin factories. However a number of provisions relating to safety, health &welfare of the workers are generally found to be inadequate in view ofthe large and growing industrial activities.
Contract Labour (Regulation and Abolition ) Act , 1970
•This Act provides for the separate provision for utilities and fixed workinghours for women
Equal Remuneration Act, 1976
•This Act provides for equal pay to men and women for equal work. Article42 of the Constitution states that the State shall make provisions forsecuring just and humane conditions of work and provide for maternityrelief. This act was enacted keeping in mind the unequal physical &sociological burden a woman faces at the time of child bearing andrearing.

P a g e | 4-46

P a g e | 4-47
Copyright © 2022 FDOKUMEN