Gender Equality Index 2020 - Digitalisation and the future of ...
182
Gender Equality Index 2020 Digitalisation and the future of work
-
Upload
khangminh22 -
Category
Documents
-
view
1 -
download
0
Transcript of Gender Equality Index 2020 - Digitalisation and the future of ...
Gender Equality Index 2020 Digitalisation and the future of work

AcknowledgementsThe authors of Gender Equality Index 2020 are Davide Barbieri, Jakub Caisl, Dr Marre Karu, Giulia Lanfredi, Blandine Mollard, Vytautas Peciukonis, Maria Belen Pilares La Hoz, Dr Jolanta Reingardė and Dr Lina Salanauskaitė of the European Institute for Gender Equality (EIGE).
A special thank you goes to Bernadette Gemmell, Cristina Fabre and Jurgita Pečiūrienė of EIGE for their highly relevant contributions to the report and to Gráinne Murphy (Milieu Consulting) for her editorial support.
Many thanks to other colleagues at EIGE for their intellectual insights, administrative support and encouragement.
Important contributions to the analysis of digitalisa-tion and the future of work were made by Professor Ursula Huws, Eleni Kampouri, Neil H. Spencer and Matt Coates of the University of Hertfordshire in the United Kingdom.
The thematic focus of Gender Equality Index 2020 has benefited greatly from expert advice received from the European Commission, in particular the Gender Equality Unit at the Directorate-General for Justice and Consumers, the Directorate-General for Employment, Social Affairs and Inclusion, the Directorate-General for Research and Innovation and the Directorate-General for Internal Market, Industry, Entrepreneurship and SMEs; the European Founda-tion for the Improvement of Living and Working Con-ditions; the International Labour Organization; the European Women’s Lobby; MenEngage; BusinessEurope; and Professor Dr Aysel YolluTok, Professor Dr Timm Teubner, Professor Dr Miriam Beblo and Dr Irem Güney-Frahm.
EIGE is very grateful to the many other individuals and institutions who provided valuable contributions and support to this update on the Gender Equality Index.
Luxembourg: Publications Office of the European Union, 2020
Print ISBN 978-92-9482-568-1 ISSN 2599-8927 doi:10.2839/076536 MH-AF-20-001-EN-CPDF ISBN 978-92-9482-569-8 ISSN 2599-8935 doi:10.2839/79077 MH-AF-20-001-EN-N
© European Institute for Gender Equality, 2020 Cover image: © Myvisuals/Shutterstock.com Reproduction is authorised provided the source is acknowledged.
Reuse is authorised provided the source is acknowledged, the original meaning is not distorted and EIGE is not liable for any damage caused by that use. The reuse policy of EIGE is implemented by the Commission Decision of 12 December 2011 on the reuse of Commission documents (2011/833/EU).
Tel. +370 52157444
Email: [email protected]
http://www.eige.europa.eu
http://twitter.com/eurogender
http://www.facebook.com/eige.europa.eu
http://www.youtube.com/eurogender
http://eurogender.eige.europa.eu
https://www.linkedin.com/company/eige/
The European Institute for Gender Equality (EIGE) is an autonomous body of the European Union established to strengthen gender equality across the EU. Equality between women and men is a fundamental value of the EU and EIGE’s task is to make this a reality in Europe and beyond. This includes becoming a European knowledge centre on gender equality issues, supporting gender mainstreaming in all EU and Member State policies, and fighting discrimination based on sex.
European Institute for Gender Equality, EIGE Gedimino pr. 16 LT-01103 VilniusLITHUANIA
European Institute for Gender Equality
Gender Equality Index 2020 Digitalisation and the future of work

Foreword
3Gender Equality Index 2020 — Digitalisation and the future of work
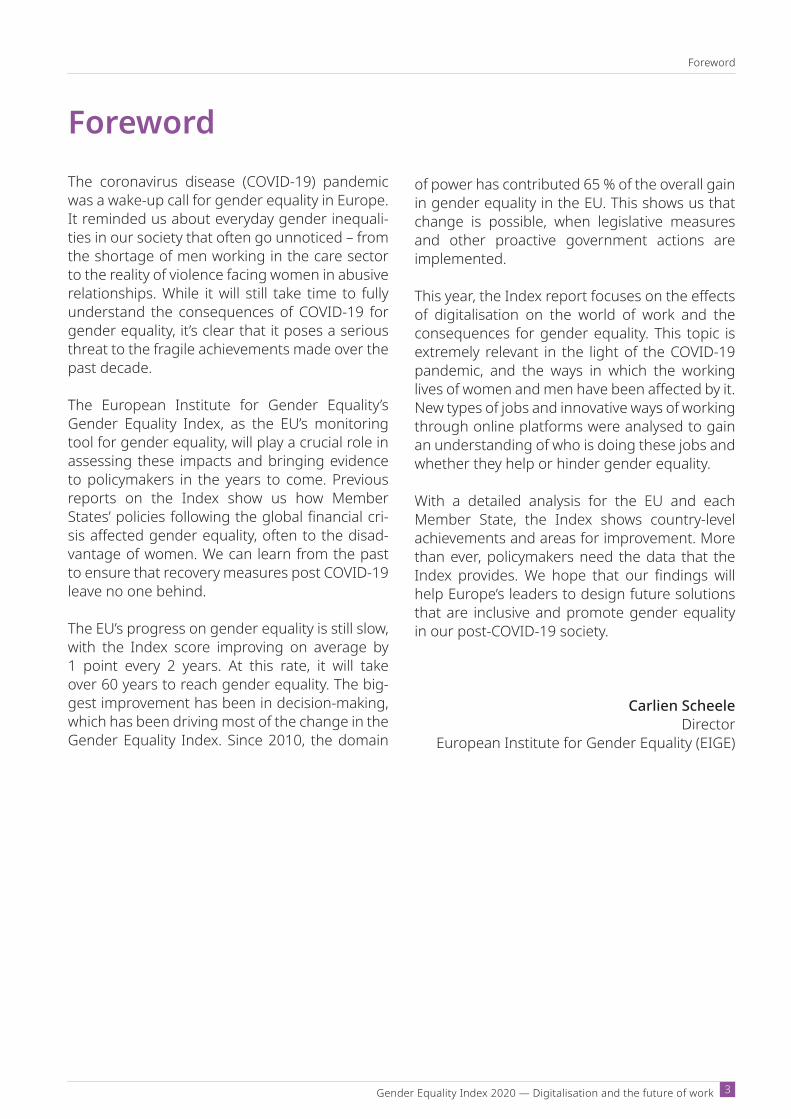
ForewordThe coronavirus disease (COVID19) pandemic was a wake-up call for gender equality in Europe. It reminded us about everyday gender inequali-ties in our society that often go unnoticed – from the shortage of men working in the care sector to the reality of violence facing women in abusive relationships. While it will still take time to fully understand the consequences of COVID19 for gender equality, it’s clear that it poses a serious threat to the fragile achievements made over the past decade.
The European Institute for Gender Equality’s Gender Equality Index, as the EU’s monitoring tool for gender equality, will play a crucial role in assessing these impacts and bringing evidence to policymakers in the years to come. Previous reports on the Index show us how Member States’ policies following the global financial cri-sis affected gender equality, often to the disad-vantage of women. We can learn from the past to ensure that recovery measures post COVID19 leave no one behind.
The EU’s progress on gender equality is still slow, with the Index score improving on average by 1 point every 2 years. At this rate, it will take over 60 years to reach gender equality. The big-gest improvement has been in decision-making, which has been driving most of the change in the Gender Equality Index. Since 2010, the domain
of power has contributed 65 % of the overall gain in gender equality in the EU. This shows us that change is possible, when legislative measures and other proactive government actions are implemented.
This year, the Index report focuses on the effects of digitalisation on the world of work and the consequences for gender equality. This topic is extremely relevant in the light of the COVID19 pandemic, and the ways in which the working lives of women and men have been affected by it. New types of jobs and innovative ways of working through online platforms were analysed to gain an understanding of who is doing these jobs and whether they help or hinder gender equality.
With a detailed analysis for the EU and each Member State, the Index shows countrylevel achievements and areas for improvement. More than ever, policymakers need the data that the Index provides. We hope that our findings will help Europe’s leaders to design future solutions that are inclusive and promote gender equality in our postCOVID19 society.
Carlien ScheeleDirector
European Institute for Gender Equality (EIGE)
Abbreviations
European Institute for Gender Equality 4
Abbreviations
Member State abbreviationsBE BelgiumBG BulgariaCZ CzechiaDK DenmarkDE GermanyEE EstoniaIE IrelandEL GreeceES SpainFR FranceHR CroatiaIT ItalyCY CyprusLV LatviaLT LithuaniaLU LuxembourgHU HungaryMT MaltaNL NetherlandsAT AustriaPL PolandPT PortugalRO RomaniaSI SloveniaSK SlovakiaFI FinlandSE SwedenUK United KingdomEU 28 EU Member States (2013–2020)
Frequently used abbreviationsAI artificial intelligenceAsT assistive technologyCEO chief executive officerCOVID-19 coronavirus diseaseEHIS European Health Interview SurveyEQLS European Quality of Life SurveyEU European UnionEU2020 Europe 2020 strategyEU-LFS European Union Labour Force SurveyEurofound European Foundation for the
Improvement of Living and Working Conditions
EU-SILC European Union Statistics on Income and Living Conditions
EWCS European Working Conditions SurveyFRA European Union Agency for
Fundamental RightsFTE full-time equivalentGDP gross domestic productICT information and communications
technologyILO International Labour OrganizationISOC Digital Economy and SocietyJRC Joint Research CentreLGBTQI*(1) lesbian, gay, bisexual, transgender,
queer, intersex and other nondominant sexual orientations and gender identities in society
MS Member StateOECD Organisation for Economic
Co-operation and Developmentp.p. percentage point(s)PPS purchasing power standardR & D research and developmentSDGs Sustainable Development GoalsSES Structure of Earnings SurveySTEM science, technology, engineering and
mathematicsWAVE Women Against Violence Europe WHO World Health OrganizationWiD Women in DigitalWMID Women and Men in Decision-Making
(EIGE Gender Statistics Database)
(1) This report uses the abbreviation LGBTQI* as it is the most inclusive umbrella term for people whose sexual orientation differs from heteronormativity and whose gender identity falls outside binary categories. The language used to refer to this very heterogeneous group continuously evolves towards greater inclusion. For this reason, different researchers and organisations have adopted other versions of the abbreviation, such as LGBT and LGBTI. Accordingly, the report will use those researchers’ and organisations’ chosen abbreviations when describing the results of their work.
Gender Equality Index 2020 — Digi talisation and the future of work
Contents
5
Contents
Foreword 3
Highlights of the Gender Equality Index 2020 11
Introduction 17
1. Gender equality in the EU at a glance 19
1.1. Gender equality will be reached in over 60 years, at the current pace 19
1.2. Gender equality needs faster progress in all domains 21
1.3. Without gains in power, gender equality would barely be progressing 21
2. Domain of work 25
2.1. Increases in women’s employment have not challenged gender segregation 26
2.2. Slow progress leaves women from vulnerable groups behind 29
2.3. Europe 2020 employment target unlikely to be achieved without increased employment of women 30
3. Domain of money 32
3.1. The pursuit of women’s economic independence: nothing less thanan uphill battle 33
3.2. Ending gender inequalities in earnings and pensions – the EU is decades away without targeted action 34
3.3. Grave risk of poverty is the harsh reality for older women and every second lone mother 36
4. Domain of knowledge 38
4.1. Stalled progress in the domain of knowledge 38
4.2. Women continue to gradually outpace men in educational attainment 39
4.3. Low engagement in adult learning and gender divide in educational choiceremain major barriers 41
5. Domain of time 44
5.1. Gender equality in time use: some gains but not sufficient to offsetoverall stalling 45
5.2. Insufficient care infrastructure pushes women to fill the gaps 46
5.3. Gender, age and education affect workers’ access to social activities 47
6. Domain of power 49
6.1. Halfway to gender equality in decision-making 49
6.2. Legislative action advances gender equality in politics 51
6.3. Progress on gender equality is most notable on company boards 52
Contents
European Institute for Gender Equality 6
7. Domain of health 54
7.1. Lack of data obstructs monitoring of gender progress on health behaviour 54
7.2. Disability and education significantly affect health and access to healthcare 56
7.3. Unprecedented impact of COVID-19 calls for gender-sensitive policies and research 58
8. Domain of violence 60
8.1. Collecting data on violence presents long-standing challenges 61
8.2. Gender-based violence intersects with multiple axes of oppression 62
8.3. When gender-based violence goes digital 63
9. Digitalisation and the future of work: a thematic focus 65
9.1. Who uses and develops digital technologies? 66
9.2. Digital transformation of the world of work 83
9.3. Broader consequences of digitalisation 111
10. Conclusions 118
References 127
Annexes 147
Annex 1. List of indicators of the Gender Equality Index 147
Annex 2. Gender Equality Index scores 153
Annex 3. Indicators included in the Gender Equality Index 162
Annex 4. List of main indicators of digitalisation and world of work 168
Annex 5. Indicators on digitalisation and the world of work 169
Gender Equality Index 2020 — Digi talisation and the future of work
Contents
7
Figure 1. Ranges of Gender Equality Index scores for Member States, and changes over time 20Figure 2. Gender Equality Index (changes compared with 2010 and 2017) 21Figure 3. Annual change, long term (2010–2018) and short term (2017–2018), by domain, EU 22Figure 4. Scores for the domain of work and its subdomains (2018), and changes over time 27Figure 5. Scores for the domain of work, and changes since 2010 and 2017, in the EU Member States 28Figure 6. FTE employment rate by sex, family composition, age, education level, country of birth and disability, EU, 2018 29Figure 7. Europe 2020 target – employment rate (% of people aged 20–64), EU, 2018 30Figure 8. Scores for the domain of money and its subdomains (2018), and changes over time 33Figure 9. Scores for the domain of money, and changes since 2010 and 2017, in the EU Member States 34Figure 10. At risk of poverty rate by sex, family composition, age, education level, country of birth and disability, EU, 2018 36Figure 11. Scores for the domain of knowledge and its subdomains (2018), and changes over time 39Figure 12. Scores for the domain of knowledge, and changes since 2010 and 2017, in the EU Member States 40Figure 13. Graduates of tertiary education by sex, family composition, age, education level, country of birth and disability, EU, 2018 41Figure 14. Europe 2020 target – tertiary educational attainment (% of people aged 30–34), EU, 2018 42Figure 15. Scores for the domain of time and its subdomains (2017), and changes over time 45Figure 16. Scores for the domain of time, and changes since 2010, in the EU Member States 46Figure 17. Shares of workers engaging in social activities by sex, family composition, age, education level, country of birth and disability, EU, 2015 48Figure 18. Scores for the domain of power and its subdomains (2018), and changes over time 50Figure 19. Scores for the domain of power, and changes since 2010 and 2017, in the EU Member States 51Figure 20. Percentages of women on the boards of the largest quoted companies (supervisory boards or board of directors) and binding quotas, by EU Member State, 2020 53Figure 21. Scores for the domain of health and its subdomains (2018), and changes over time 55Figure 22. Scores for the domain of health, and changes since 2010 and 2017, in the EU Member States 56Figure 23. Self-perceived health by sex, family composition, age, education level, country of birth and disability, EU, 2018 57Figure 24. Women victims of intentional homicide by an intimate partner or family member (per 100 000 female population), 2017 61Figure 25. Percentages of women aged 18 or older who experienced online harassment in the 12 months prior to the survey, by country, 2016 63
List of figures

Contents
European Institute for Gender Equality 8
Figure 26. Percentages of respondents who experienced cyber-harassment as a result of being LGBTI in the past 12 months, by age and orientation, EU, 2020 64Figure 27. Relationship between the Gender Equality Index and the Digital Economy and Society Index 68Figure 28. Percentages of people (aged 16–74) who use the internet daily in the EU, by sex, age and education level, 2019 70Figure 29. Percentages of people (aged 16–74) who engaged in certain online activities in the past 3 months for private purposes in the EU, by sex 71Figure 30. Percentages of people (aged 16–74) using mobile internet for professional purposes in the EU, by sex, age and education level, 2012 72Figure 31. Internet user skill scores by sex, 2017 73Figure 32. Levels of digital skills of individuals in the EU, by sex and age group (%), 2019 75Figure 33. Percentages of people (aged 16–74) with above basic digital skills in the EU, by type of skill, gender and age group, 2019 76Figure 34. Percentages of people (aged 16–74) in the EU who carried out at least one training activity to improve computer, software or application skills, by sex, age, and education level, 2018 77Figure 35. Percentages of 15 year olds expecting to work as ICT professionals at age 30, by country and gender, 2018 78Figure 36. Percentages of ICT students and graduates in the total student population, by sex, 2018 79Figure 37. Percentages of women and men among ICT students and graduates, 2018 79Figure 38. Percentages of women among ICT specialists (aged 15 or older), 2010 and 2019 80Figure 39. Percentages of women among scientists and engineers (aged 25–64) in high-technology sectors, 2010 and 2019 81Figure 40. Percentages of women among Grade A staff in engineering and technology R & D, 2016 82Figure 41. Use of ICT at work and activities performed by women and men (aged 16–74) in the EU (%), 2018 85Figure 42. Percentages of workers undertaking repetitive tasks of less than 10 minutes’ duration, by sex and occupation, EU, 2015 87Figure 43. Percentages of workers undertaking complex tasks, by sex and occupation, EU, 2015 87Figure 44. Percentages of the adult population participating in platform work, by country 2017 92Figure 45. Percentages of women and men in platform work by intensity, EU, 2018 93Figure 46. Percentages of women and men (aged 20–64) in ICT and non-ICT sectors, by working time arrangements, EU, 2015 95Figure 47. Percentages of people (aged 20–64) working part-time in ICT and other occupations, by gender and country, 2018 96Figure 48. Gender composition of the workplaces of ICT specialists (aged 20–64) in the EU (%), 2015 97Figure 49. Percentages of employees (aged 20–64) frequently perceiving spillover from work to home and family in the EU, by occupational group and gender, 2015 106Figure 50. Income distribution of women and men (aged 20–64) working in ICT and non-ICT sectors (%), EU, 2015 109

Gender Equality Index 2020 — Digi talisation and the future of work
Contents
9
Table 1. Changes in the Gender Equality Index and domain scores by Member State, long term (2010–2018) and short term (2017–2018), in points 23
Table 2. Percentage contributions of the different domains to Gender Equality Index progress in the short term (2017–2018) and in the long term (2010–2018) 24
Table 3. Gender Equality Index scores, ranks and changes in score by EU Member State, 2010, 2012, 2015, 2017, 2018 153
Table 4. Gender Equality Index scores and ranks, by domain and EU Member State, 2010 154
Table 5. Gender Equality Index scores and ranks, by domain and EU Member State, 2018 155
Table 6. Gender Equality Index scores in the domain of work and its subdomains, by EU Member State, 2010, 2012, 2015, 2017, 2018 156
Table 7. Gender Equality Index scores in the domain of money and its subdomains, by EU Member State, 2010, 2012, 2015, 2017, 2018 157
Table 8. Gender Equality Index scores in the domain of knowledge and its subdomains, by EU Member State, 2010, 2012, 2015, 2017, 2018 158
Table 9. Gender Equality Index scores in the domain of time and its subdomains, by EU Member State, 2010, 2012, 2015, 2017, 2018 159
Table 10. Gender Equality Index scores in the domain of power and its subdomains, by EU Member State, 2010, 2012, 2015, 2017, 2018 160
Table 11. Gender Equality Index scores in the domain of health and its subdomains, by EU Member State, 2010, 2012, 2015, 2017, 2018 161
Table 12. Indicators included in the domain of work, by EU Member State, 2018 162
Table 13. Indicators included in the domain of money, by EU Member State, 2018 163
Table 14. Indicators included in the domain of knowledge, by EU Member State, 2018 164
Table 15. Indicators included in the domain of time, by EU Member State, 2018 165
Table 16. Indicators included in the domain of power, by EU Member State, 2018 166
Table 17. Indicators included in the domain of health, by EU Member State, 2018 167
Table 18. Percentages of people (aged 16–74) using the internet daily, by gender, age and educational level, 2019 169
Table 19. Percentages of people (aged 16–74) with above basic digital skills, by gender, age and educational level, 2019 170
Table 20. Percentages of people (aged 16–74) with above basic information skills, by gender, age and educational level, 2019 171
Table 21. Percentages of people (aged 16–74) with above basic communication skills, by gender, age and educational level, 2019 172
Table 22. Percentages of people (aged 16–74) with above basic problem-solving skills, by gender, age and educational level, 2019 173
Table 23. Percentages of people (aged 16–74) with above basic software skills, by gender, age and educational level, 2019 174
List of tables

Contents
European Institute for Gender Equality 10
Table 24. Percentages of people (aged 16–74) who carried out at least one training activity to improve skills relating to the use of computers, software or applications, by gender, age and educational level, 2018 175
Table 25. Indicator on segregation in education and the labour market in ICT 176
Table 26. Percentages of employed people (aged 16–74) who performed ICT activities at work, by gender and type of activity 177
Table 27. Percentages of people (aged 20–64) working part-time in ICT, by gender, and gender pay gap in ICT 178
Gender Equality Index 2020 — Digi talisation and the future of work
Highlights of the Gender Equality Index 2020
11
Highlights of the Gender Equality Index 2020
Main findings
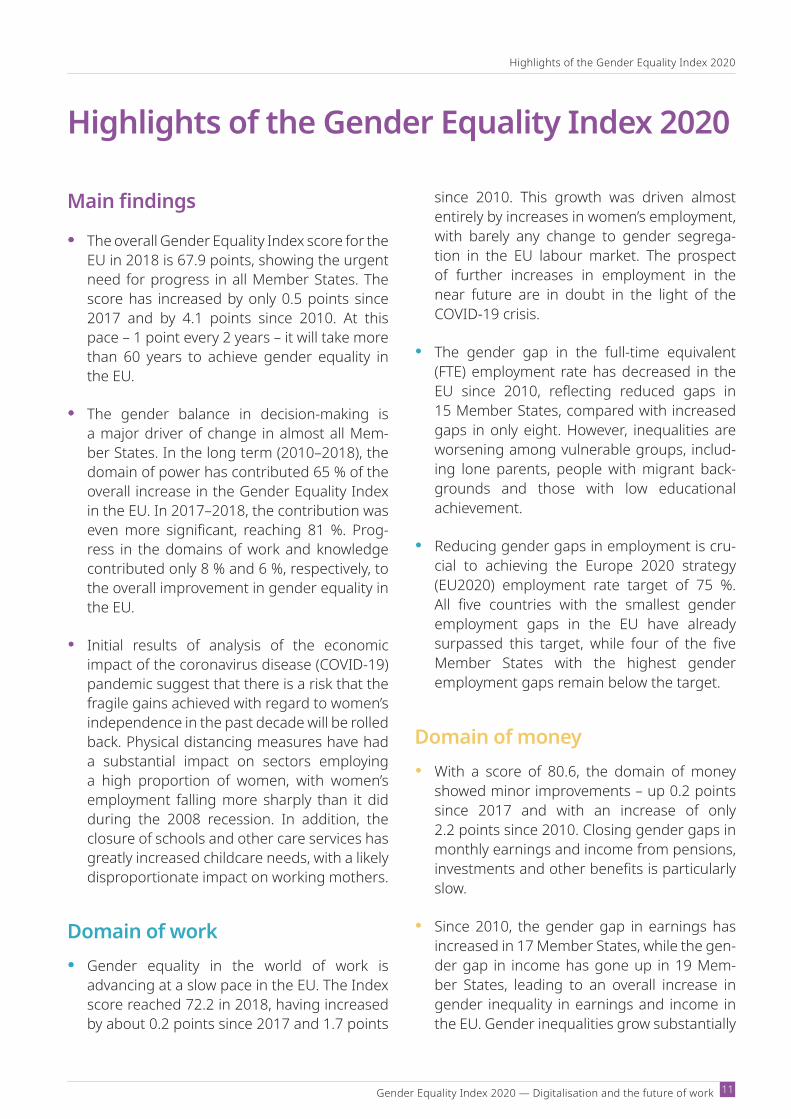
The overall Gender Equality Index score for the EU in 2018 is 67.9 points, showing the urgent need for progress in all Member States. The score has increased by only 0.5 points since 2017 and by 4.1 points since 2010. At this pace – 1 point every 2 years – it will take more than 60 years to achieve gender equality in the EU.
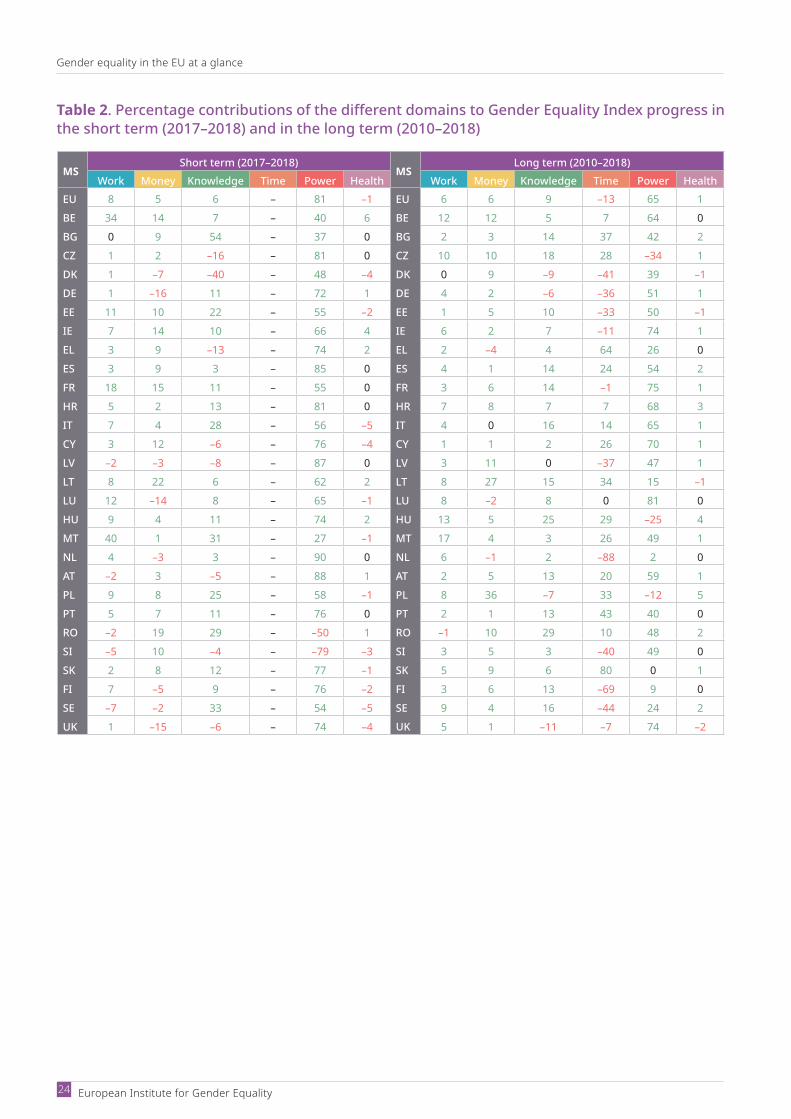
The gender balance in decision-making is a major driver of change in almost all Mem-ber States. In the long term (2010–2018), the domain of power has contributed 65 % of the overall increase in the Gender Equality Index in the EU. In 2017–2018, the contribution was even more significant, reaching 81 %. Prog-ress in the domains of work and knowledge contributed only 8 % and 6 %, respectively, to the overall improvement in gender equality in the EU.
Initial results of analysis of the economic impact of the coronavirus disease (COVID19) pandemic suggest that there is a risk that the fragile gains achieved with regard to women’s independence in the past decade will be rolled back. Physical distancing measures have had a substantial impact on sectors employing a high proportion of women, with women’s employment falling more sharply than it did during the 2008 recession. In addition, the closure of schools and other care services has greatly increased childcare needs, with a likely disproportionate impact on working mothers.
Domain of work Gender equality in the world of work is
advancing at a slow pace in the EU. The Index score reached 72.2 in 2018, having increased by about 0.2 points since 2017 and 1.7 points
since 2010. This growth was driven almost entirely by increases in women’s employment, with barely any change to gender segrega-tion in the EU labour market. The prospect of further increases in employment in the near future are in doubt in the light of the COVID19 crisis.
The gender gap in the full-time equivalent (FTE) employment rate has decreased in the EU since 2010, reflecting reduced gaps in 15 Member States, compared with increased gaps in only eight. However, inequalities are worsening among vulnerable groups, includ-ing lone parents, people with migrant back-grounds and those with low educational achievement.
Reducing gender gaps in employment is cru-cial to achieving the Europe 2020 strategy (EU2020) employment rate target of 75 %. All five countries with the smallest gender employment gaps in the EU have already surpassed this target, while four of the five Member States with the highest gender employment gaps remain below the target.
Domain of money With a score of 80.6, the domain of money
showed minor improvements – up 0.2 points since 2017 and with an increase of only 2.2 points since 2010. Closing gender gaps in monthly earnings and income from pensions, investments and other benefits is particularly slow.
Since 2010, the gender gap in earnings has increased in 17 Member States, while the gen-der gap in income has gone up in 19 Mem-ber States, leading to an overall increase in gender inequality in earnings and income in the EU. Gender inequalities grow substantially
Highlights of the Gender Equality Index 2020
European Institute for Gender Equality 12
with age and level of education, peaking for women living in couples with children, and lone mothers.
The poverty gender gap has increased in 14 Member States since 2010 and in 21 Member State since 2017. Poverty or social exclusion are concentrated among certain particularly vulnerable groups of women and men: lone mothers, women above 65 years of age, women and men with disabilities, women and men with a low level of education, and migrant populations.
Domain of knowledge The score for the domain of knowl-
edge (63.6 points) has remained virtually unchanged since 2017 and improved only fractionally (1.8 points) since 2010. Gender segregation in higher education and low par-ticipation in adult learning remain the key challenges blocking more significant progress in this domain.
Since 2010, gender segregation in education has increased slightly, with the situation wors-ening in 13 Member States and in other cases remaining almost unchanged (with very few exceptions). Gender segregation in education remains a major barrier to gender equality in the EU.
The engagement of women and men (aged 15 or older) in formal or non-formal educa-tion and training remained low and stood at 17 % in the EU in 2018. Adult learning gradu-ally stalls with age, increasing the risk of skills mismatches and a premature end to women’s and men’s careers.
Domain of time With an EU score of 61.6 points, the domain of
time points to persistent gender inequalities not only in relation to informal care for family members but also in terms of access to leisure
time and activities. Increasing time pressures from both paid and unpaid work, combined with gender norms and financial constraints, limit access to leisure for many groups of women, which can have ramifications for their overall well-being and even their health.
A lack of availability of formal care services is linked to long-standing gender inequalities. Rising long-term care needs and lack of care services intensify gender inequalities within families and in employment. Care responsi-bilities are keeping 7.7 million women (aged 20–64) out of the labour market, compared with 450 000 men. Far more women than men also work parttime (8.9 million versus 560 000) owing to their care responsibilities.
The COVID19 pandemic in Europe and the associated closure of schools and lack of availability of social support systems (carers, childminders, grandparents) has considerably aggravated the pressure on families – espe-cially women and lone mothers – to combine care work for children and older family mem-bers with paid work. Early data show that women have experienced an even greater burden of childcare and children’s education while teleworking.
Domain of power Even though the score for the domain of power
has increased by almost 12 points since 2010, and by 1.6 points since 2017, it remains the lowest of all domains, at 53.5 points. The EU has come just halfway towards gender equal-ity in key decision-making positions in major political, economic and social institutions.
The gender gap is narrowing in political deci-sionmaking. Many Member States have insti-tuted legislative candidate quotas to increase gender balance in national parliaments, with strong results.
The subdomain of economic power has made significant progress, with a 17.9 point increase

Gender Equality Index 2020 — Digi talisation and the future of work
Highlights of the Gender Equality Index 2020
13
since 2010. The presence of women on the boards of the largest publicly quoted compa-nies has increased strikingly with the applica-tion of quotas by Member States or other soft measures to address the gender imbalance.
Domain of health Only marginal progress (1.8 points) has been
made since 2010, with the domain of health backsliding by 0.1. points since 2017. The score for access to health services decreased by 0.2 points and there were no changes in health status. The latest comparable data for health behaviour are from 2014, so the change cannot be monitored at this time.
Health inequalities are accumulating for women with low education and women and men with disabilities, who have both the poorest health and the most limited access to health services. Health status, as well as access to services, is connected to labour market status and level of income.
The COVID19 pandemic will have repercus-sions for the mental and physical health of women and men well beyond the immediate effects of the virus, reversing progress already achieved in health equality. The mental health of women and men, as well as that of girls and boys, will require particular attention.
Domain of violence The lockdowns imposed in all Member States
as a result of COVID19 have proved a sub-stantial threat to women victims of violence, who are forced to remain at home for a pro-longed period of time and thus are constantly exposed to their abusers. The increased use of the internet and social networks that has resulted from lockdowns and social distanc-ing measures, especially among young peo-ple, has been associated with a spike in cases of cyber-violence against women, such as sharing of intimate pictures without consent.
Analysing data on femicide presents long-standing challenges, owing to the lack of a uniform EU legal definition of femicide and significant differences in data collection between the Member States. Nevertheless, in 2017, Eurostat recorded 854 women victims of homicide by a family member or intimate partner.
Gender-based violence intersects with multi-ple axes of oppression. For this reason, Mus-lim women, women with disabilities and older women face more severe forms of discrimina-tion and are exposed to a higher risk of vio-lence. Within the lesbian, gay, bisexual, trans, queer and intersex (LGBTQI*) community, the gender component exacerbates the risk of falling victim to violence, with the most vulner-able individuals being those whose gender expression does not match their assigned sex at birth and intersex people.
Digitalisation and the future of work
Gendered patterns in use of new technologies Women and men are online to a more or less
equal extent: 78 % of women and 80 % of men use the internet daily. However, older women and women with lower education lag behind. In addition, 25 % of women aged 55–74 (com-pared with 21 % of men) and 27 % of women with low education (21 % of men) have never had the chance to use the internet. Men are more likely to participate in professional net-works, download software and look for online learning materials. Women outpace men in social networking and searches for informa-tion about education and training.
In the EU, young women and men are the most digitally skilled generation and bene-fit equally from basic and above basic digi-tal skills. However, at a later age, the gender divide is widening. Men are more advantaged
Highlights of the Gender Equality Index 2020
European Institute for Gender Equality 14
in terms of the digital skills necessary to thrive in a digitalised world of work than women, particularly among older people (aged 55 or older). Women also experience bigger obsta-cles than men in acquiring and upgrading digital skills.
Despite the overall growth of the information and communications technology (ICT) sector in recent decades and the high demand for ICT skills in the labour market, only 20 % of graduates in ICTrelated fields are women and the share of women in ICT jobs is 18 % (a decrease of 4 percentage points (p.p.) since 2010). Beyond ICT, a striking gender gap exists among scientists and engineers in the high-technology sectors likely to be mobil-ised in the design and development of new digital technologies. The untapped potential of talented female scientists, alongside gen-der-blind research, prevents the realisation of the full potential of technological and scien-tific advances.
Digital transformation of the world of work The digital transformation of the labour mar-
ket brings with it several important challenges for gender equality. Notably, women are at a slightly higher risk than men of being replaced in their jobs (e.g. in clerical support work) by digitally enabled machines; and newly emerg-ing jobs (e.g. ICT professionals) are often concentrated in the in male-dominated ICT and science, technology, engineering and mathematics (STEM) sectors. There is poten-tial to promote gender equality as well – for example by breaking down the old patterns of labour market segregation or by upskilling certain jobs held mostly by women.
Women are underrepresented among plat-form workers, accounting for about one third of this workforce. So far, it seems that plat-form work mostly reproduces, rather than challenges, key gender inequalities from the
broader labour market, such as gender seg-regation and the gender pay gap.
Platform work poses challenges for the application of the EU’s gender equality and non-discrimination legislation in the area of employment, partly because of the frag-mented and irregular nature of this work and partly because of new workforce man-agement practices. For example, online cus-tomer ratings play a big role in evaluating workers’ performance in some forms of plat-form work, often with consequences for job access and pay. Yet such ratings can mirror gender and racial stereotyping on the part of customers, rather than providing an objective assessment.
Most platform workers are classified as self-employed or independent contractors, which results in limited access to social and work protection measures, including those essential for achieving gender equality. For example, around half of all selfemployed mothers may not be entitled to maternity ben-efits in the EU, and access to parental leave is also limited for the self-employed in a number of Member States. The lack of social protec-tion became especially problematic during the COVID19 crisis, which highlighted the importance of access to, for example, unem-ployment benefits and sick pay.
Some forms of platform work are highly flex-ible and provide important opportunities to combine paid work with unpaid care respon-sibilities. This is likely to support women’s work participation in particular, since women usually undertake the lion’s share of unpaid care. However, such opportunities do not seem to challenge the unequal distribution of unpaid work per se, and in some cases may even reinforce it. For example, women are more likely to perform online tasks via plat-forms because they need to work from home owing to caring responsibilities, while men are more likely to do so to top-up income from their other work. Thus, platform work
Gender Equality Index 2020 — Digi talisation and the future of work
Highlights of the Gender Equality Index 2020
15
is unlikely to change the unequal division of unpaid care between women and men; this requires specific measures to support work–life balance, such as affordable, high quality care provision and well-paid care-re-lated leave available to all.
Broader consequences of digitalisation Artificial intelligence (AI) systems have the
power to create an array of opportunities for European society and the economy, but they also pose new challenges. The increasing use of AI in every aspect of people’s lives requires reflection on its ethical implications and the assessment of potential risks, such as algo-rithmic gender bias and discrimination. The lack of gender diversity in the development of AI technologies and the quality of the data used in algorithms are the key risk factors for potential biases and unfair treatment.
Sexual harassment in the workplace is sadly a common experience for women in the EU. This form of gender-based violence is now increasingly mediated by digital technologies and affecting women’s working lives in dra-matic ways. Women public figures are par-ticularly targeted, especially on social media,
as a strategy to silence them and undermine their authority. Women platform workers are exposed to abuse and violence from users of platform services. Such abuse often stems from a situation of ‘information asymmetry’ between workers and users resulting from the platform’s design and terms of service. On the one hand, these platforms give users access to a high volume of private informa-tion on the worker (e.g. including age, gender, location and photograph); on the other hand, they restrict the information accessible to the worker, which can limit their ability to assess the safety of a ‘gig’ before accepting it.
The number of women and men needing long-term care is bound to increase, given the ageing population and increasing life expec-tancy across the EU. To contain costs and sustain the pressure of the growing number of patients, countries aim to promote inde-pendent living in any care setting (residential, home or community-based) together with greater use of ad hoc technological solutions (i.e. assistive technology, gerontechnology). Such technologies enable personalised inter-ventions based on data collected from the environment or directly from the care recipi-ent, and to some extent alleviate the caregiver burden.

Gender Equality Index 2020 — Digi talisation and the future of work
Introduction
17
IntroductionIn March 2020, the European Commission pre-sented the new EU gender equality strategy 2020–2025. The strategy builds on the promise of the newly appointed Commission President to strive for a Union of equality, where women and men, girls and boys, in all their diversity, are free to pursue their chosen path in life, with equal opportunities to thrive and to participate in and lead European society (European Commission, 2020c). The EU has made some improvements in gender equality in recent decades. However, given that the EU is considered a global leader in gender equality, this progress is taking place at a snail’s pace. Gender equality is not yet a reality for millions of Europeans.
The COVID19 pandemic in 2020 has infected mil-lions, ended thousands of lives, and affected the lives of all women and men, girls and boys. Sta-tistics on the COVID19 outbreak show import-ant sex differences in mortality and vulnerability to the disease (Novel Coronavirus Pneumonia Emergency Response Epidemiology Team, 2020). However, the impact of COVID19 and the result-ing policy responses go far beyond the disease itself, reaching into all domains of society and life, including the economy and employment, educa-tion, time use and work–life balance. There is also worrying evidence of growing gender-based vio-lence. Persistent and prevailing gender inequal-ities mean that women and men experience the COVID19 crisis – and its repercussions – differently. Crucially, the pandemic poses a seri-ous threat to the fragile achievements in gender equality made over the past decade.
This report presents the fifth edition of the Gen-der Equality Index. In view of the postEurope 2020 discussions about the future of Europe and the commitments presented in the EU gender equality strategy 2020–2025, it is important to
sustain effective monitoring of gender equal-ity in the EU and thus ensure evidence-based policymaking.
The Gender Equality Index has been widely rec-ognised for its contribution to monitoring prog-ress on gender equality in the EU. The new EU gender equality strategy 2020–2025 acknowl-edges the European Institute for Gender Equal-ity’s (EIGE) Index as a key benchmark for gender equality and sets out its intention to introduce annual monitoring of gender equality building on the Gender Equality Index (European Com-mission, 2020c).
The Index covers a range of indicators in the domains of work, money, knowledge, time, power and health. It also integrates two additional domains: violence and intersecting inequalities. The indicators are closely linked to EU targets and international commitments such as the Beijing Platform for Action and the 2030 Agenda for Sus-tainable Development and its Sustainable Devel-opment Goals (SDGs). This edition tracks gender equality progress in the EU since 2010 (2). More detailed statistical analyses of Index results for every EU Member State and the United Kingdom will be provided separately.
This year’s thematic focus of the Index explores how digitalisation is shaping the future of work for women and men. Recent decades have seen digital technologies radically transform the world of work, with profound consequences for workers, businesses, regulators and society. Dig-italisation has led to automation and reorganisa-tion of vast numbers of jobs, the emergence of new flexible working practices and forms of work (e.g. platform work), and the creation of new ICT occupations and strands of research. This has sparked debates on how to harness the potential
(2) The 2020 edition of the Index covers data available up to and including January 2020. The newest data available by this point covers developments until 2018. As this is a reference period during which the United Kingdom still was a Member State, the EU aggregate used here refers to the 28 EU Member States (EU28), including the United Kingdom.

Introduction
European Institute for Gender Equality 18
of this transformation to increase the productiv-ity, competitiveness and growth of the EU econ-omy. However, such debates often neglect the broader transformative potential of digitalisa-tion, notably its central role in transforming gen-der relations in both positive and negative ways.
The thematic focus takes stock of recent research to assess the opportunities, risks and challenges for gender equality in the world of work brought about by digitalisation. It shows the profound implications of new technologies for future prog-ress towards gender equality across all Index domains, most notably for work, money and knowledge. While it highlights some well-known challenges – such as the gender segregation of ICT education, employment and research – it chiefly aims to shed light on less wellknown aspects of digitalisation. These include, for exam-ple, the different effects of precarious working conditions on women and men in certain forms of platform work, and the ways in which digital
technologies can enable new forms of harass-ment at work. The thematic focus therefore pro-vides some fresh insights on monitoring gender equality not only in the broader context of the European Pillar of Social Rights but also in the context of specific strategies linked to digital-isation, such as the EU digital strategy ‘Shaping Europe’s digital future’.
Chapter 1 presents the main findings of the Gen-der Equality Index 2020 and provides a broad overview of the main trends in gender equality since 2010 and since the previous edition, which was based on 2017 data. Chapters 2–7 sum-marise the policy context, main findings and developments in relation to the core domains of the Index. Using the measurement framework for the domain of violence, Chapter 8 presents the most up-to-date (albeit scarce) data on vio-lence against women. The thematic focus on dig-italisation and its impact on the future of work is presented in Chapter 9.
Gender Equality Index 2020 — Digi talisation and the future of work
Gender equality in the EU at a glance
19
1.1. Gender equality will be reached in over 60 years, at the current pace
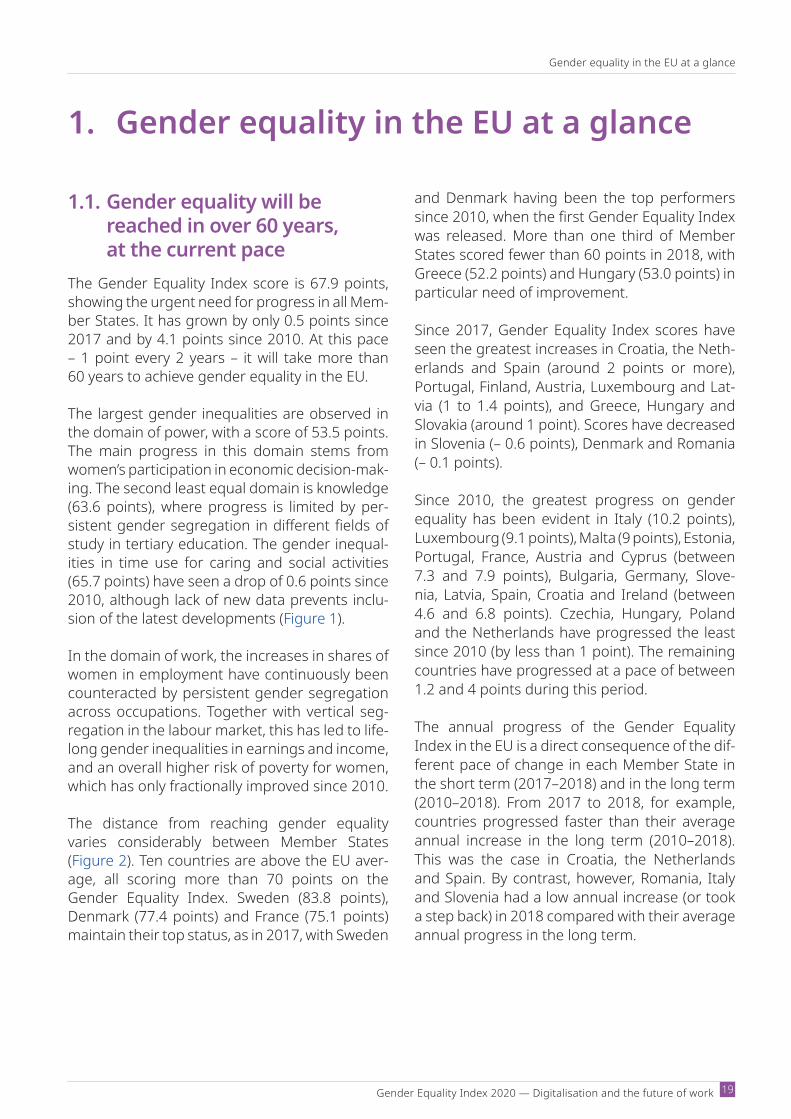
The Gender Equality Index score is 67.9 points, showing the urgent need for progress in all Mem-ber States. It has grown by only 0.5 points since 2017 and by 4.1 points since 2010. At this pace – 1 point every 2 years – it will take more than60 years to achieve gender equality in the EU.
The largest gender inequalities are observed in the domain of power, with a score of 53.5 points. The main progress in this domain stems from women’s participation in economic decision-mak-ing. The second least equal domain is knowledge (63.6 points), where progress is limited by per-sistent gender segregation in different fields of study in tertiary education. The gender inequal-ities in time use for caring and social activities (65.7 points) have seen a drop of 0.6 points since 2010, although lack of new data prevents inclu-sion of the latest developments (Figure 1).
In the domain of work, the increases in shares of women in employment have continuously been counteracted by persistent gender segregation across occupations. Together with vertical seg-regation in the labour market, this has led to life-long gender inequalities in earnings and income, and an overall higher risk of poverty for women, which has only fractionally improved since 2010.
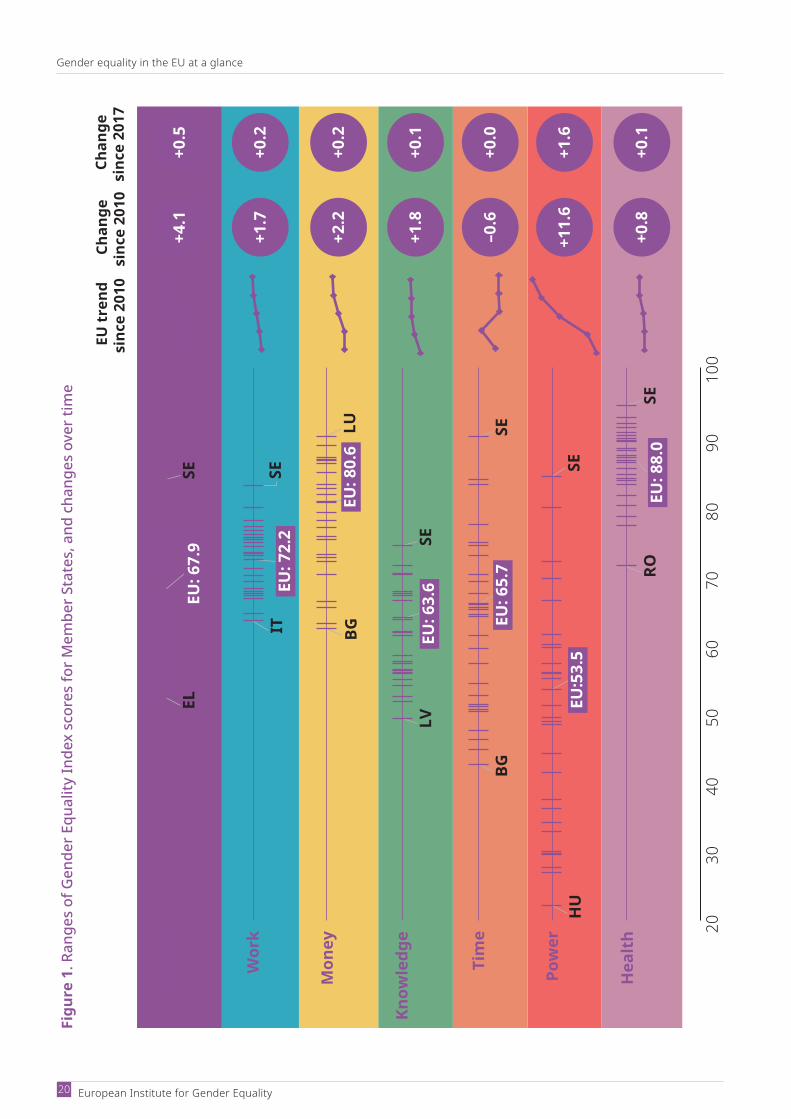
The distance from reaching gender equality varies considerably between Member States (Figure 2). Ten countries are above the EU aver-age, all scoring more than 70 points on the Gender Equality Index. Sweden (83.8 points), Denmark (77.4 points) and France (75.1 points) maintain their top status, as in 2017, with Sweden
and Denmark having been the top performers since 2010, when the first Gender Equality Index was released. More than one third of Member States scored fewer than 60 points in 2018, with Greece (52.2 points) and Hungary (53.0 points) in particular need of improvement.
Since 2017, Gender Equality Index scores have seen the greatest increases in Croatia, the Neth-erlands and Spain (around 2 points or more), Portugal, Finland, Austria, Luxembourg and Lat-via (1 to 1.4 points), and Greece, Hungary and Slovakia (around 1 point). Scores have decreased in Slovenia (– 0.6 points), Denmark and Romania (– 0.1 points).
Since 2010, the greatest progress on gender equality has been evident in Italy (10.2 points), Luxembourg (9.1 points), Malta (9 points), Estonia, Portugal, France, Austria and Cyprus (between 7.3 and 7.9 points), Bulgaria, Germany, Slove-nia, Latvia, Spain, Croatia and Ireland (between 4.6 and 6.8 points). Czechia, Hungary, Poland and the Netherlands have progressed the least since 2010 (by less than 1 point). The remaining countries have progressed at a pace of between 1.2 and 4 points during this period.
The annual progress of the Gender Equality Index in the EU is a direct consequence of the dif-ferent pace of change in each Member State in the short term (2017–2018) and in the long term (2010–2018). From 2017 to 2018, for example, countries progressed faster than their average annual increase in the long term (2010–2018). This was the case in Croatia, the Netherlands and Spain. By contrast, however, Romania, Italy and Slovenia had a low annual increase (or took a step back) in 2018 compared with their average annual progress in the long term.
1. Gender equality in the EU at a glance
Gender equality in the EU at a glance
European Institute for Gender Equality 20
Figu
re 1
. Ran
ges
of G
ende
r Equ
ality
Inde
x sc
ores
for M
embe
r Sta
tes,
and
cha
nges
ove
r tim
e
Chan
gesi
nce
2010
Ch
ange
sinc
e 20
17
EU t
rend
sinc
e 20
10
Wor
k+1
.7
+2.2
+1.8
–0.6
+0.8
+0.2
+0.2
+0.1
+0.0
+11.
6+1
.6
+0.1
Mon
ey
Tim
e
Pow
er
Hea
lth
Know
ledg
e
ITSE
EU: 6
3.6
LVSE
EU: 7
2.2
EU: 8
0.6
BGLU
EU: 6
5.7
BGSE
EU:5
3.5
HU
SE
EU: 8
8.0
ROSE
2030
4050
6070
8090
100
+4.1
+0.5
IND
EX
EU: 6
7.9
ELSE
Gender Equality Index 2020 — Digi talisation and the future of work
Gender equality in the EU at a glance
21
Figure 2. Gender Equality Index (changes compared with 2010 and 2017)Change since 2010 Change since 2017Score for 2018
SE 3.7 0.2DK 2.2 -0.1FR 7.6 0.5FI 1.6 1.3NL 0.1 2.0UK 4.0 0.5IE 6.8 0.9ES 5.6 1.9BE 2.1 0.3LU 9.1 1.1EU 4.1 0.5SI 5.0 -0.6DE 4.9 0.6AT 7.8 1.2IT 10.2 0.5MT 9.0 0.9PT 7.6 1.4LV 5.6 1.1EE 7.3 0.9BG 4.6 0.8HR 5.6 2.3CY 7.9 0.6LT 1.4 0.8CZ 0.6 0.5PL 0.3 0.6SK 2.5 1.4RO 3.6 -0.1HU 0.6 1.1EL
83.877.475.174.774.172.772.272.071.470.367.967.767.566.563.563.461.360.860.759.657.956.956.356.255.855.554.453.052.2 3.6 1.0
1.2. Gender equality needs faster progress in all domains
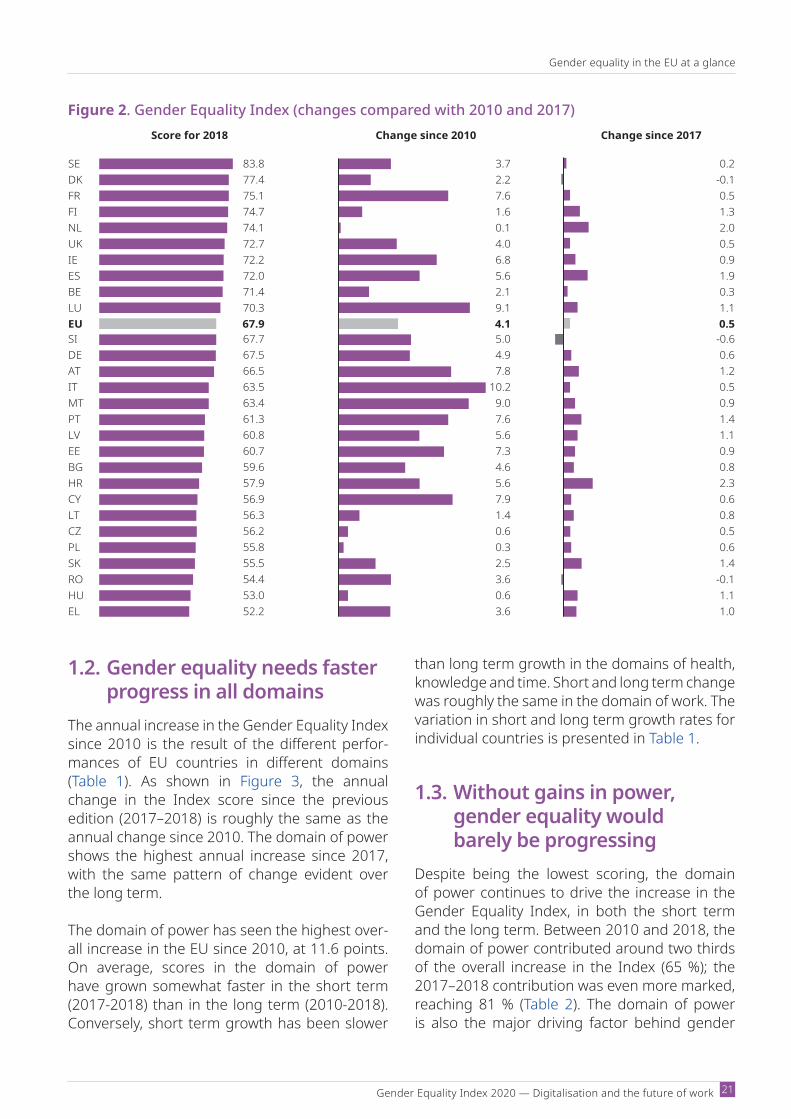
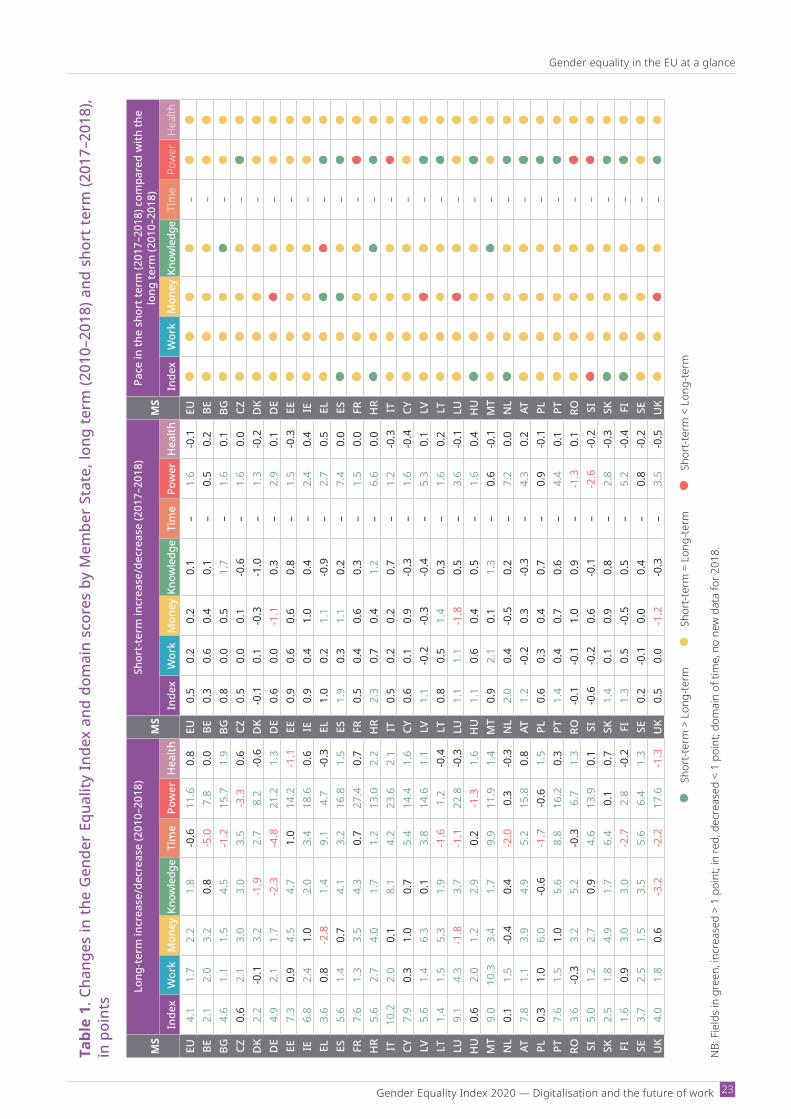
The annual increase in the Gender Equality Index since 2010 is the result of the different perfor-mances of EU countries in different domains (Table 1). As shown in Figure 3, the annual change in the Index score since the previous edition (2017–2018) is roughly the same as the annual change since 2010. The domain of power shows the highest annual increase since 2017, with the same pattern of change evident over the long term.
The domain of power has seen the highest over-all increase in the EU since 2010, at 11.6 points. On average, scores in the domain of power have grown somewhat faster in the short term (2017-2018) than in the long term (2010-2018). Conversely, short term growth has been slower
than long term growth in the domains of health, knowledge and time. Short and long term change was roughly the same in the domain of work. The variation in short and long term growth rates for individual countries is presented in Table 1.
1.3. Without gains in power, gender equality would barely be progressing
Despite being the lowest scoring, the domain of power continues to drive the increase in the Gender Equality Index, in both the short term and the long term. Between 2010 and 2018, the domain of power contributed around two thirds of the overall increase in the Index (65 %); the 2017–2018 contribution was even more marked, reaching 81 % (Table 2). The domain of power is also the major driving factor behind gender

Gender equality in the EU at a glance
European Institute for Gender Equality 22
Figure 3. Annual change, long term (2010–2018) and short term (2017–2018), by domain, EU
0.1
1.5
-0.1
0.20.3
0.2
0.5
-0.1
1.6
00.1
0.2 0.2
0.5
-0.2
0
0.2
0.4
0.6
0.8
1
1.2
1.4
1.6
1.8
Health Power Time Knowledge Money Work Index
Annual change 2010–2018 Annual change 2017–2018
equality progress in almost all of the Member States in the long term, particularly in Belgium, Ireland, France, Croatia, Italy, Cyprus, Luxem-bourg and the United Kingdom. In the short term, the domain of power has contributed more than 80 % of overall gender equality progress in Czechia, Croatia, Spain, Latvia, Austria and the Netherlands, and 70–80 % in Germany, Greece, Cyprus, Portugal, Finland and the United King-dom. In Slovenia, by contrast, the decrease in the Gender Equality Index by – 0.6 points during 2017–2018 was determined by a decrease in the domain of power (– 79 %).
In 2017–2018, progress in the domain of work contributed to an overall increase in the EU’s Gender Equality Index score by 8 %, the domain of knowledge by 6 % and the domain of money by 5 % (Table 2). However, these lower contribu-tions to gender equality progress at EU level hide
important country differences. Closing gender gaps in the domain of work made a relatively high contribution to gender equality progress in Malta (+ 40 %), Belgium (+ 34 %) and France (+ 18 %) between 2017 and 2018. Changes in the domain of money had a substantial pos-itive impact on gender equality in Lithuania (+ 22 %), Romania (+ 19 %) and France (+ 15 %) but reduced the Gender Equality Index scores for Germany, Luxembourg and the United King-dom (by around – 14 % to – 16 %). The domain of knowledge contributed positively to progress in Bulgaria (+ 54 %), Sweden (+ 33 %) and Malta (+ 33 %) and made a negative contribution in Denmark (– 40 %), Czechia (– 16 %) and Greece (– 13 %). Finally, the domain of time reduced the EU’s Gender Equality Index scores between 2010 and 2018 by 13 %, owing to diminishing gender equality in several Member States (the Netherlands, Finland, Sweden and Denmark).
Gender Equality Index 2020 — Digi talisation and the future of work
Gender equality in the EU at a glance
23
Tabl
e 1.
Cha
nges
in th
e G
ende
r Eq
ualit
y In
dex
and
dom
ain
scor
es b
y M
embe
r St
ate,
long
term
(201
0–20
18) a
nd s
hort
term
(201
7–20
18),
in p
oint
s
MS
Long
-term
incr
ease
/dec
reas
e (2
010–
2018
) M
SSh
ort-t
erm
incr
ease
/dec
reas
e (2
017–
2018
)M
S Pa
ce in
the
shor
t ter
m (2
017–
2018
) com
pare
d w
ith th
e lo
ng te
rm (2
010–
2018
)
Inde
xW
ork
Mon
eyKn
owle
dge
Tim
ePo
wer
Hea
lthIn
dex
Wor
kM
oney
Know
ledg
eTi
me
Pow
erH
ealth
Inde
xW
ork
Mon
eyKn
owle
dge
TIm
ePo
wer
Hea
lthEU
4.1
1.7
2.2
1.8
-0.6
11.6
0.8
EU0.
50.
20.
20.
1–
1.6
-0.1
EU–
BE2.
12.
03.
20.
8-5
.07.
80.
0BE
0.3
0.6
0.4
0.1
–0.
50.
2BE
–BG
4.6
1.1
1.5
4.5
-1.2
15.7
1.9
BG0.
80.
00.
51.
7–
1.6
0.1
BG–
CZ0.
62.
13.
03.
03.
5-3
.30.
6CZ
0.5
0.0
0.1
-0.6
–1.
60.
0CZ
–D
K2.
2-0
.13.
2-1
.92.
78.
2-0
.6D
K-0
.10.
1-0
.3-1
.0–
1.3
-0.2
DK
–D
E4.
92.
11.
7-2
.3-4
.821
.21.
3D
E0.
60.
0-1
.10.
3–
2.9
0.1
DE
–EE
7.3
0.9
4.5
4.7
1.0
14.2
-1.1
EE0.
90.
60.
60.
8–
1.5
-0.3
EE–
IE6.
82.
41.
02.
03.
418
.60.
6IE
0.9
0.4
1.0
0.4
–2.
40.
4IE
–EL
3.6
0.8
-2.8
1.4
9.1
4.7
-0.3
EL1.
00.
21.
1-0
.9–
2.7
0.5
EL–
ES5.
61.
40.
74.
13.
216
.81.
5ES
1.9
0.3
1.1
0.2
–7.
40.
0ES
–FR
7.6
1.3
3.5
4.3
0.7
27.4
0.7
FR0.
50.
40.
60.
3–
1.5
0.0
FR–
HR
5.6
2.7
4.0
1.7
1.2
13.0
2.2
HR
2.3
0.7
0.4
1.2
–6.
60.
0H
R–
IT10
.22.
00.
18.
14.
223
.62.
1IT
0.5
0.2
0.2
0.7
–1.
2-0
.3IT
–CY
7.9
0.3
1.0
0.7
5.4
14.4
1.6
CY0.
60.
10.
9-0
.3–
1.6
-0.4
CY–
LV5.
61.
46.
30.
13.
814
.61.
1LV
1.1
-0.2
-0.3
-0.4
–5.
30.
1LV
–LT
1.4
1.5
5.3
1.9
-1.6
1.2
-0.4
LT0.
80.
51.
40.
3–
1.6
0.2
LT–
LU9.
14.
3-1
.83.
7-1
.122
.8-0
.3LU
1.1
1.1
-1.8
0.5
–3.
6-0
.1LU
–H
U0.
62.
01.
22.
90.
2-1
.31.
6H
U1.
10.
60.
40.
5–
1.6
0.4
HU
–M
T9.
010
.33.
41.
79.
911
.91.
4M
T0.
92.
10.
11.
3–
0.6
-0.1
MT
–N
L0.
11.
5-0
.40.
4-2
.00.
3-0
.3N
L2.
00.
4-0
.50.
2–
7.2
0.0
NL
–AT
7.8
1.1
3.9
4.9
5.2
15.8
0.8
AT1.
2-0
.20.
3-0
.3–
4.3
0.2
AT–
PL0.
31.
06.
0-0
.6-1
.7-0
.61.
5PL
0.6
0.3
0.4
0.7
–0.
9-0
.1PL
–PT
7.6
1.5
1.0
5.6
8.8
16.2
0.3
PT1.
40.
40.
70.
6–
4.4
0.1
PT–
RO3.
6-0
.33.
25.
2-0
.36.
71.
3RO
-0.1
-0.1
1.0
0.9
–-1
.30.
1RO
–SI
5.0
1.2
2.7
0.9
4.6
13.9
0.1
SI-0
.6-0
.20.
6-0
.1–
-2.6
-0.2
SI–
SK2.
51.
84.
91.
76.
40.
10.
7SK
1.4
0.1
0.9
0.8
–2.
8-0
.3SK
–FI
1.6
0.9
3.0
3.0
-2.7
2.8
-0.2
FI1.
30.
5-0
.50.
5–
5.2
-0.4
FI–
SE3.
72.
51.
53.
55.
66.
41.
3SE
0.2
-0.1
0.0
0.4
–0.
8-0
.2SE
–U
K4.
01.
80.
6-3
.2-2
.217
.6-1
.3U
K0.
50.
0-1
.2-0
.3–
3.5
-0.5
UK
–
Sh
ortt
erm
> L
ong
term
Sh
ortt
erm
= L
ong
term
Sh
ortt
erm
< L
ong
term
NB:
Fie
lds
in g
reen
, inc
reas
ed >
1 p
oint
; in
red,
dec
reas
ed <
1 p
oint
; dom
ain
of ti
me,
no
new
dat
a fo
r 201
8.
Gender equality in the EU at a glance
European Institute for Gender Equality 24
Table 2. Percentage contributions of the different domains to Gender Equality Index progress in the short term (2017–2018) and in the long term (2010–2018)
MSShort term (2017–2018)
MSLong term (2010–2018)
Work Money Knowledge Time Power Health Work Money Knowledge Time Power HealthEU 8 5 6 – 81 –1 EU 6 6 9 –13 65 1BE 34 14 7 – 40 6 BE 12 12 5 7 64 0BG 0 9 54 – 37 0 BG 2 3 14 37 42 2CZ 1 2 –16 – 81 0 CZ 10 10 18 28 –34 1DK 1 –7 –40 – 48 –4 DK 0 9 –9 –41 39 –1DE 1 –16 11 – 72 1 DE 4 2 –6 –36 51 1EE 11 10 22 – 55 –2 EE 1 5 10 –33 50 –1IE 7 14 10 – 66 4 IE 6 2 7 –11 74 1EL 3 9 –13 – 74 2 EL 2 –4 4 64 26 0ES 3 9 3 – 85 0 ES 4 1 14 24 54 2FR 18 15 11 – 55 0 FR 3 6 14 –1 75 1HR 5 2 13 – 81 0 HR 7 8 7 7 68 3IT 7 4 28 – 56 –5 IT 4 0 16 14 65 1CY 3 12 –6 – 76 –4 CY 1 1 2 26 70 1LV –2 –3 –8 – 87 0 LV 3 11 0 –37 47 1LT 8 22 6 – 62 2 LT 8 27 15 34 15 –1LU 12 –14 8 – 65 –1 LU 8 –2 8 0 81 0HU 9 4 11 – 74 2 HU 13 5 25 29 –25 4MT 40 1 31 – 27 –1 MT 17 4 3 26 49 1NL 4 –3 3 – 90 0 NL 6 –1 2 –88 2 0AT –2 3 –5 – 88 1 AT 2 5 13 20 59 1PL 9 8 25 – 58 –1 PL 8 36 –7 33 –12 5PT 5 7 11 – 76 0 PT 2 1 13 43 40 0RO –2 19 29 – –50 1 RO –1 10 29 10 48 2SI –5 10 –4 – –79 –3 SI 3 5 3 –40 49 0SK 2 8 12 – 77 –1 SK 5 9 6 80 0 1FI 7 –5 9 – 76 –2 FI 3 6 13 –69 9 0SE –7 –2 33 – 54 –5 SE 9 4 16 –44 24 2UK 1 –15 –6 – 74 –4 UK 5 1 –11 –7 74 –2

Gender Equality Index 2020 — Digi talisation and the future of work
Domain of work
25
EIGE’s 2020 research assessing progress towards gender equality 25 years after the adoption of the Beijing Platform for Action suggests that the world of work in the EU remains characterised by a number of important gender inequalities (EIGE, 2020a). The employment rate of women is still significantly below that of men (3). The labour market remains heavily gender segregated, and women tend to be found more often in temporary, part-time or precarious employment. This contributes to significant gender gaps in pay and pensions (see Chapter 3, ‘Domain of money’). Such inequalities have particularly dire consequences for vulnerable groups of women, including younger and older cohorts, lone mothers with dependent children, and those from migrant communities or other minority groups. Closing these gender gaps could generate considerable long-term gains for the EU economy, amounting to as much as 10 % of its gross domestic product (GDP) by 2050 (EIGE, 2017c).
Inequalities are often rooted in the unequal distribution of care and other responsibilities within the household (EIGE, 2020a). A disproportionate amount of caring activities falls on women, which limits their participation in paid employment (see Chapter 5, ‘Domain of time’). The design of tax and benefit systems may also undermine the incentives for second earners (4) to participate in the labour market. This report highlights the potential impacts of two other important factors on the prospects for women’s participation in the world of work. Firstly, as digitalisation continues to transform the EU labour market, it presents both challenges and opportunities for gender equality (see Chapter 9). Secondly, the COVID19 crisis is likely to have huge employment impacts for both women and men (see below).
The Europe 2020 strategy has provided a broad plan for the EU economy since 2010, with the
European Semester being a key process for coordinating the economic and social policies of Member States. While the strategy has a headline target of 75 % of people aged 20–64 in work by 2020, there are no separate targets for women and men. The gender perspective is more prominent in the European Pillar of Social Rights, introduced in 2017, the key prin-ciples of which include equal opportunities for women and men in all areas, including labour market participation, terms and conditions of employment, and career progression. The Pil-lar is accompanied by the Social Scoreboard, which includes indicators dedicated to mon-itoring gender equality in the labour market (the gender gap in employment, the gender gap in part-time employment and the gender pay gap). The EU is also strongly committed to the United Nations’ 2030 Agenda for Sustain-able Development and its SDGs, including to monitoring three indicators related to gender equality (SDG 5) within the area of employment: the gender employment gap, the gender pay gap and the inactive population due to caring responsibilities.
Key EU policy priorities and actions relating to gender equality in the labour market are out-lined in the EU gender equality strategy 2020–2025. The most relevant measures from the perspective of employment include a focus on appropriate transposition and implementation of the Work–Life Balance Directive (5); support-ing provision of quality childcare and long-term care using EU funding; a proposal to revise the targets set by the European Council in Barce-lona in 2002 to ensure further upwards con-vergence on childcare across Member States; addressing the priorities set out in the Euro-pean Pillar of Social Rights and monitoring their progress through the European Semes-ter, notably through indicators from the Social Scoreboard; developing guidance for Member States on how national tax and benefits systems
(3) Based on Eurostat table t2020_10 (available at https://ec.europa.eu/eurostat/web/productsdatasets//t2020_10&lang=en).(4) Second earners are employed individuals who earn less than their partners.(5) European Parliament and Council of the European Union (2019).
2. Domain of work
Domain of work
European Institute for Gender Equality 26
affect incentives for second earners to work; introducing targeted measures to promote the participation of women in innovation, including a pilot project to promote womenled startups; and tackling gender segregation in the con-text of the digital transformation of the labour market (see Chapter 9).
2.1. Increases in women’s employment have not challenged gender segregation
Gender equality in the world of work is advancing at a slow pace in the EU in both the short term and the long term (Figure 4). On average, the Index score for the domain of work (6) has grown by
about 0.2 points per year, reaching 72.2 points in 2018. It may be optimistic to expect this growth to continue, as it is based on a period (2010–2018) characterised by recovery from the 2008 crisis and subsequent (relative) stability, and the latest figures do not take into account the potential implications of the COVID19 crisis.
Changes in the work domain scores were almost entirely driven by increases in the labour mar-ket participation of women. Since 2010, the Index participation score has increased by about 0.4 points per year, owing to a combination of the following changes.
The gender gaps in FTE employment rates and duration of working life have reduced slightly. For example, in 2010 women’s FTE
(6) The domain of work measures the extent to which women and men can benefit from equal access to employment and good working conditions. The subdomain of participation combines two indicators: the rate of FTE employment and the duration of working life. Gender segregation and quality of work are included in the second subdomain. Sectoral segregation is measured through women’s and men’s participation in the education, human health and social work sectors. Quality of work is measured by flexible working time arrangements and Eurofound’s Career Prospects Index.
(7) Eurofound, ‘Work, teleworking and COVID19’ (https://www.eurofound.europa.eu/data/covid19/workingteleworking), data downloaded on 15.6.20.
Preliminary data collected by the European Foundation for the Improvement of Living and Work-ing Conditions (Eurofound) (7) show that the COVID19 crisis is likely to lead to a sharp decline in employment in the EU. As of May 2020, around 5 % of workers had permanently lost their job owing to the pandemic, 23 % had temporarily lost their job and 15 % believed themselves likely to lose their job in the near future. The International Labour Organization (ILO) estimates that, in Europe and Central Asia, during the first quarter of 2020 working hours declined by 1.9 %, and during the second quarter they were projected to decline by almost 12 % (ILO, 2020b).
The Eurofound data indicates that initial employment losses are likely to affect similar propor-tions of women and men, although this needs to be considered in the light of limited data reli-ability and lack of evidence on impacts among specific groups. The proportion of women affected is more striking than in previous crises, such as the 2008 financial crisis, where the immediate impact disproportionately affected men (Alon et al., 2020; ILO, 2020a). This is partly because the sectors most severely affected by the COVID19 pandemic (accommodation and food services, real estate, business and administrative activities, manufacturing and wholesale/retail, according to the ILO) account for a sizeable share of women’s employment in the EU, around 40 %. Women may also be at increased risk of losing jobs because of additional unpaid care responsibilities resulting from closures of schools and childcare facilities, which may be difficult to combine with employment; this is particularly the case for lone parents, the large majority of whom are women (EWL, 2020). Women are more likely than men to be involved in precarious or informal work, with limited access to various work and social protections, which puts them at a particular disadvan-tage (EIGE, 2020a; ILO, 2020a).

Gender Equality Index 2020 — Digi talisation and the future of work
Domain of work
27
women worked in education, health and social work activities, compared with 8 % of men. Other sectors and occupations remain dominated by men: for example, only 17 % of ICT specialists are women (see Chapter 9) (8). Women work more often in certain non-standard forms of employ-ment, such as part-time work (31 % of women compared with 8 % of men) or temporary work (12 % versus 10 %), which contributes to higher incidence of precarious employment (26 % versus 15 %) (EIGE, 2020a).
The pattern of slow progress in the domain of work has been fairly consistent across coun-tries since 2010 (Figure 5). Only Malta and Luxembourg have progressed at a substan-tially faster pace than average. Three countries recorded virtually no improvement in gender equality during this period: Denmark, Romania and Cyprus.
employment rate was 17.6 p.p. lower than men’s, and this difference had reduced to 15.9 p.p. by 2018. The gender gap in FTE employment has decreased in 15 Member States, increased in eight and stayed roughly the same in the remaining countries.
There have been overall increases in the FTE employment rate and the duration of working life for both women and men. For example, between 2010 and 2018 the FTE employment rate increased from 47.2 % to 49 % overall and from 38.9 % to 41.5 % for women.
The progress on women’s participation has not led to substantial changes to gendered pat-terns of employment in the labour market. The Index score for work quality and segregation has scarcely changed since 2010, standing at 64 points in 2018. Around 30 % of all employed
(8) European Commission, ‘Women in digital’ (https://ec.europa.eu/digital-single-market/en/women-ict).
Figure 4. Scores for the domain of work and its subdomains (2018), and changes over time
Changesince 2010
EU trendsince 2010
50 60 70 80 90 100
Range of work domain scores by country, 2018
Segregation andquality
EU: 64.0CZ AT
+0.3
Participation
IT SE
+3.4
EU: 81.5
+1.7
Changesince 2017
+0.0
+0.6
+0.2WORK
EU: 72.2IT SE

Domain of work
European Institute for Gender Equality 28
The gender segregation of some occupations came into particular focus during the COVID19 crisis. Some strands of work were classified as essential during the pandemic, which often exposed these workers to unprecedented workloads, health risks and work–life balance chal-lenges. Around 7 % of workers reported a large increase in their working hours during the pan-demic (9). These included health professionals, of whom 72.5 % are women in the EU (10). Women dominate some occupations, especially those often characterised by lower salaries. For example, women account for more than 85 % of nursing and midwifery professionals and personal care workers in health services. Another example of a lowpaid, femaledominated occupation that became essential during the crisis is food store cashier; these workers faced similar challenges to their health and work–life balance.
Figure 5. Scores for the domain of work, and changes since 2010 and 2017, in the EU Member States
(9) Eurofound, ‘Work, teleworking and COVID19’ (https://www.eurofound.europa.eu/data/covid19/workingteleworking), data downloaded on 15/06/20.
(10) EIGE, ‘Covid19 and gender equality’ (https://eige.europa.eu/topics/health/covid19andgenderequality).
SEDKNLUKATIEMTFILUBELTLVESSIPTFREUEEDECYHRBGHUROPLCZSKELIT
82.979.777.876.976.475.975.475.475.274.774.174.073.273.172.972.872.272.172.170.869.969.068.067.667.367.066.664.463.3
-0.10.10.40.0
-0.20.42.10.51.10.60.5
-0.20.3
-0.20.40.40.20.60.00.10.70.00.6
-0.10.30.00.10.20.2
2.5-0.11.51.81.12.4
10.30.94.32.01.51.41.41.21.51.31.70.92.10.32.71.12.0
-0.31.02.11.80.82.0
Score for 2018 Change since 2010 Change since 2017
Gender Equality Index 2020 — Digi talisation and the future of work
Domain of work
29
2.2. Slow progress leaves women from vulnerable groups behind
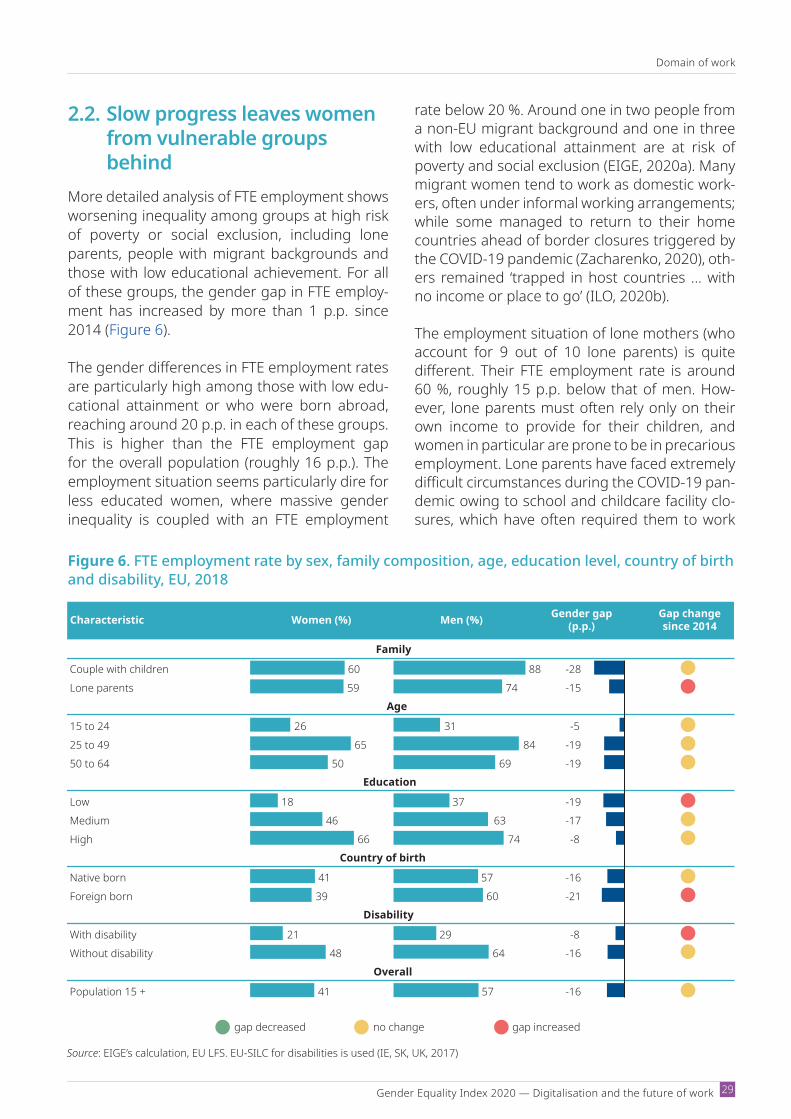
More detailed analysis of FTE employment shows worsening inequality among groups at high risk of poverty or social exclusion, including lone parents, people with migrant backgrounds and those with low educational achievement. For all of these groups, the gender gap in FTE employ-ment has increased by more than 1 p.p. since 2014 (Figure 6).
The gender differences in FTE employment rates are particularly high among those with low edu-cational attainment or who were born abroad, reaching around 20 p.p. in each of these groups. This is higher than the FTE employment gap for the overall population (roughly 16 p.p.). The employment situation seems particularly dire for less educated women, where massive gender inequality is coupled with an FTE employment
rate below 20 %. Around one in two people from a non-EU migrant background and one in three with low educational attainment are at risk of poverty and social exclusion (EIGE, 2020a). Many migrant women tend to work as domestic work-ers, often under informal working arrangements; while some managed to return to their home countries ahead of border closures triggered by the COVID19 pandemic (Zacharenko, 2020), oth-ers remained ‘trapped in host countries … with no income or place to go’ (ILO, 2020b).
The employment situation of lone mothers (who account for 9 out of 10 lone parents) is quite different. Their FTE employment rate is around 60 %, roughly 15 p.p. below that of men. How-ever, lone parents must often rely only on their own income to provide for their children, and women in particular are prone to be in precarious employment. Lone parents have faced extremely difficult circumstances during the COVID19 pan-demic owing to school and childcare facility clo-sures, which have often required them to work
Figure 6. FTE employment rate by sex, family composition, age, education level, country of birth and disability, EU, 2018
Characteristic Women (%) Men (%) Gender gap(p.p.)
Gap changesince 2014
Couple with children 60 88 -28Lone parents 59 74 -15
15 to 24 26 31 -525 to 49 65 84 -1950 to 64 50 69 -19
Low 18 37 -19Medium 46 63 -17High 66 74 -8
Native born 41 57 -16Foreign born 39 60 -21
With disability 21 29 -8Without disability 48 64 -16
Population 15 + 41 57 -16
Overall
Family
Age
Education
Country of birth
Disability
gap decreased no change gap increased
Source: EIGE’s calculation, EU LFS. EUSILC for disabilities is used (IE, SK, UK, 2017)
Domain of work
European Institute for Gender Equality 30
from home or stop working altogether (Alon et al., 2020). Every second lone parent is at risk of poverty or social exclusion (EIGE, 2020a).
People with disabilities are the only vulnerable group analysed for whom the data show a decline in the FTE employment gender gap. However, the overall FTE employment rate remains very low in this group, reaching around 21 % for women and 29 % for men, with almost no improvement since 2014. Around one third of women in this group are at risk of poverty and social exclusion (EIGE, 2020a).
Finally, data collected by the European Union Agency for Fundamental Rights (FRA) indicates very low employment among women from cer-tain minority backgrounds. Fewer than one in five women from Roma communities work, and around 80 % of Roma people are estimated to live below the monetary poverty threshold in their country (FRA, 2016b).
Other data collected by FRA highlight that peo-ple from the LGTBI community continue to be discriminated against in the world of work, with around 1 in 10 feeling discriminated against
when looking for work, and 1 in 5 when working (FRA, 2020).
2.3. Europe 2020 employment target unlikely to be achieved without increased employment of women
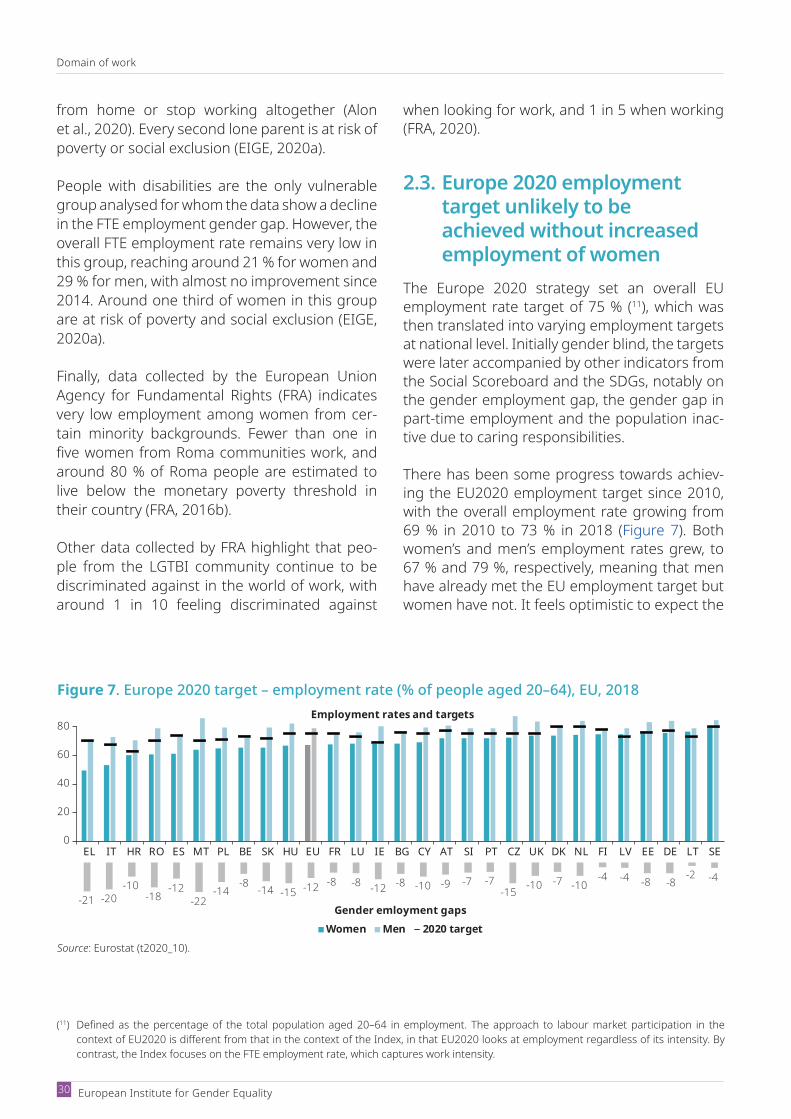
The Europe 2020 strategy set an overall EU employment rate target of 75 % (11), which was then translated into varying employment targets at national level. Initially gender blind, the targets were later accompanied by other indicators from the Social Scoreboard and the SDGs, notably on the gender employment gap, the gender gap in part-time employment and the population inac-tive due to caring responsibilities.
There has been some progress towards achiev-ing the EU2020 employment target since 2010, with the overall employment rate growing from 69 % in 2010 to 73 % in 2018 (Figure 7). Both women’s and men’s employment rates grew, to 67 % and 79 %, respectively, meaning that men have already met the EU employment target but women have not. It feels optimistic to expect the
(11) Defined as the percentage of the total population aged 20–64 in employment. The approach to labour market participation in the context of EU2020 is different from that in the context of the Index, in that EU2020 looks at employment regardless of its intensity. By contrast, the Index focuses on the FTE employment rate, which captures work intensity.
Figure 7. Europe 2020 target – employment rate (% of people aged 20–64), EU, 2018
0
20
40
60
80
EL IT HR RO ES MT PL BE SK HU EU FR LU IE BG CY AT SI PT CZ UK DK NL FI LV EE DE LT SE
Employment rates and targets
Women Men 2020 target
-21 -20-10
-18-12
-22-14
-8 -14 -15 -12 -8 -8 -12 -8 -10 -9 -7 -7-15 -10 -7 -10
-4 -4 -8 -8-2 -4
Gender emloyment gaps
Source: Eurostat (t2020_10).
Gender Equality Index 2020 — Digi talisation and the future of work
Domain of work
31
(12) Where a national target has not been set, but the employment rate exceeds the EU target of 75 %.(13) Only Malta achieved an employment rate higher than 75 %, but most of its recent employment gains have come from the greater
involvement of women in the labour market.
employment target to be met in 2020, as the cur-rent data does not account for the impact of the COVID19 crisis.
The overall progress has reduced the gender employment gap only slightly. This gap stood at 12 p.p. in 2018, compared with 13 p.p. in 2010. The share of women working part-time continues to be much higher than the equivalent Figure for men (by 23 p.p.), with a marginal improvement in the past decade. The slow progress on clos-ing gender gaps is linked to the disproportionate share of caring responsibilities borne by women: in 2018, 32 % of inactive women were inactive because of their care responsibilities, a propor-tion that had grown by more than 4 p.p. since 2010. Less than 5 % of inactive men were inactive for that same reason.
The EU employment target of 75 % was met in 23 EU Member States for men and only four for women (Germany, Estonia, Lithuania and Sweden). National targets were met for men in all EU Member States apart from Spain and the United Kingdom (12) but met for women only in Sweden, Lithuania and Latvia. Reducing gender employment gaps seems to be an important precondition for achieving such targets: all five countries with the lowest gender employment gaps (Sweden, Lithuania, Latvia, Finland and Portugal) had already surpassed the EU2020 employment target in 2018. By contrast, four of the five countries with the highest gender employment gaps (Malta, Greece, Italy, Romania and Hungary) remain below the EU2020 employment target, three by more than 5 p.p. (13).
Domain of money
European Institute for Gender Equality 32
Women’s economic empowerment is central to realising women’s rights and gender equality. Investing in women’s economic independence enables more inclusive economic growth and the eradication of poverty and social exclusion. The 2030 Agenda for Sustainable Development is based on the premise that women’s eco-nomic empowerment is crucial to sustainable development.
Throughout the economic crisis and subsequent recovery, many women continued to experi-ence precarious working and living conditions across the EU, with the economic impact of the COVID19 pandemic likely to have further det-rimental effects on women. The ILO estimates that almost 25 million jobs could be lost world-wide as a result of COVID19, with up to 35 mil-lion additional people facing working poverty (14). Women are more likely to be in temporary, part-time and precarious jobs, and to be employed in the informal sector, all of which are particu-larly vulnerable to economic shock. Women are lower paid, save less and have limited access to social protection.
Recent decades have seen the world of work radically transformed by advances in digital tech-nologies. These pose some new challenges for and risks to gender equality. Digitalisation may hold out the promise of flexibility, achievement and creativity for well-educated and highly skilled women, but it simultaneously tends to increase non-standard and precarious employment, such as short-term, part-time, low-paid and socially unprotected forms of labour, for the less privi-leged segments of the female workforce (see Section 9.2).
Together, these inequalities tend to lead to par-ticularly acute economic disadvantage, particu-larly for vulnerable groups of women, including younger and older women, lone mothers, and
3. Domain of money
women from migrant communities or other minority groups (EIGE, 2020a). They therefore require a broader approach to analysing eco-nomic policies and their impact on the overall well-being of individuals, particularly women. This is reflected in the wider trend in EU pol-icy towards a more social Europe. For example, gender equality is one of the key principles of the European Pillar of Social Rights and fea-tures in several of its other principles as well. The Pillar reinforces equal opportunities to access to financial resources, for instance, by reiterating the principle of equal pay for jobs of equal value. It establishes the rights to ade-quate minimum income benefits and to equal opportunities for women and men to acquire pension rights (European Commission, 2018e). However, the EU has limited competence to intervene directly in Member States’ social policy initiatives, which means that the imple-mentation of the main principles of the Pillar remains uncertain.
Since 2013, the EU has strengthened initiatives to tackle the gender pay gap. The 2014 pay trans-parency recommendation (Commission Recom-mendation 2014/124/EU) provided guidance to Member States on how to apply the principle of equal pay and achieve greater transparency in pay structure and levels. It was followed in 2017 by the EU action plan (2017–2019) on tackling the gender pay gap (COM(2017) 678 final), which called on Member States to apply effective equal pay legislation. The EU gender equality strategy 2020–2025 goes a step further and proposes binding measures on pay transparency. In the 2021 Pension adequacy report, the Commission, together with the Council’s Social Protection Com-mittee, will undertake an assessment of gender inequality in sharing risks and resources in pen-sion systems. The provision of pension credits for care-related career breaks in occupational pen-sion schemes has been proposed in the strategy
(14) ILO, ‘Almost 25 million jobs could be lost worldwide as a result of COVID19, says ILO’ (https://www.ilo.org/global/about-the-ilo/newsroom/news/WCMS_738742/lang–en/index.htm).

Gender Equality Index 2020 — Digi talisation and the future of work
Domain of money
33
as a means of strengthening gender equality in pension rights. The Commission also proposes to address the higher proportion of women liv-ing in poverty, particularly in older age, through the structural reform support programme.
3.1. The pursuit of women’s economic independence: nothing less than an uphill battle
Women’s economic independence has long been a focus of EU gender equality policy. However, women remain in a more precarious economic situation, including when it comes to accessing financial resources. With a score of 80.6 points, the domain of money (15) shows very minor improvement (0.2 points) since 2017 and an increase of only 2.2 points since 2010 (Figure 8). This domain has the second highest score, after the domain of health.
The subdomain of financial resources scores 74.3 points, which is a slight improvement (up 4.9 points) since 2010. Closing gender gaps in
monthly earnings and income from pensions, investments and other benefits is painfully slow. The score for the subdomain of economic situa-tion is higher, albeit without substantial progress on closing gender gaps in poverty and income distribution.
The majority of EU countries slightly narrowed their gender gaps and improved overall per-formance on financial resources and economic situation (Figure 9). The fastest progress since 2010 was in Latvia (+ 6.3), Poland (+ 6) and Lithu-ania (+ 5.3). Latvia and Lithuania slightly reduced income inequalities among women and men, while Poland fractionally narrowed the gen-der gap in poverty. Greece (– 2.8), Luxembourg (– 1.8) and the Netherlands (– 0.4) show a neg-ative trend over the 8-year period. Although the country reduced the gender gap in earnings, income and poverty, data for Greece show that inequality in income distribution increased. In the Netherlands, gender inequalities in earnings – and particularly in income – have increased since 2010. Luxembourg ranks first in the subdomain of financial resources and managed to reduce the gender gaps in earning and income. Nev-ertheless, it fell considerably in the ranking of
(15) The domain of money measures gender inequalities in access to financial resources and economic situation. The subdomain of financial resources includes women’s and men’s mean monthly earnings from work and mean equivalised net income (from pensions, investments, benefits and any other source in addition to earnings from paid work). The subdomain of economic resources captures women’s and men’s risk of poverty and the income distribution among women and men.
Figure 8. Scores for the domain of money and its subdomains (2018), and changes over timeChange
since 2010Change
since 2017EU trend
since 2010Range of money domain scores by country, 2018
+2.2 +0.2MONEY
EU: 80.6BG LU
+4.9 +0.5Financial resources
EU: 74.3 LURO
35 45 55 65 75 85 95 100
–1.1 –0.2Economic situation
EU: 87.5LV SK
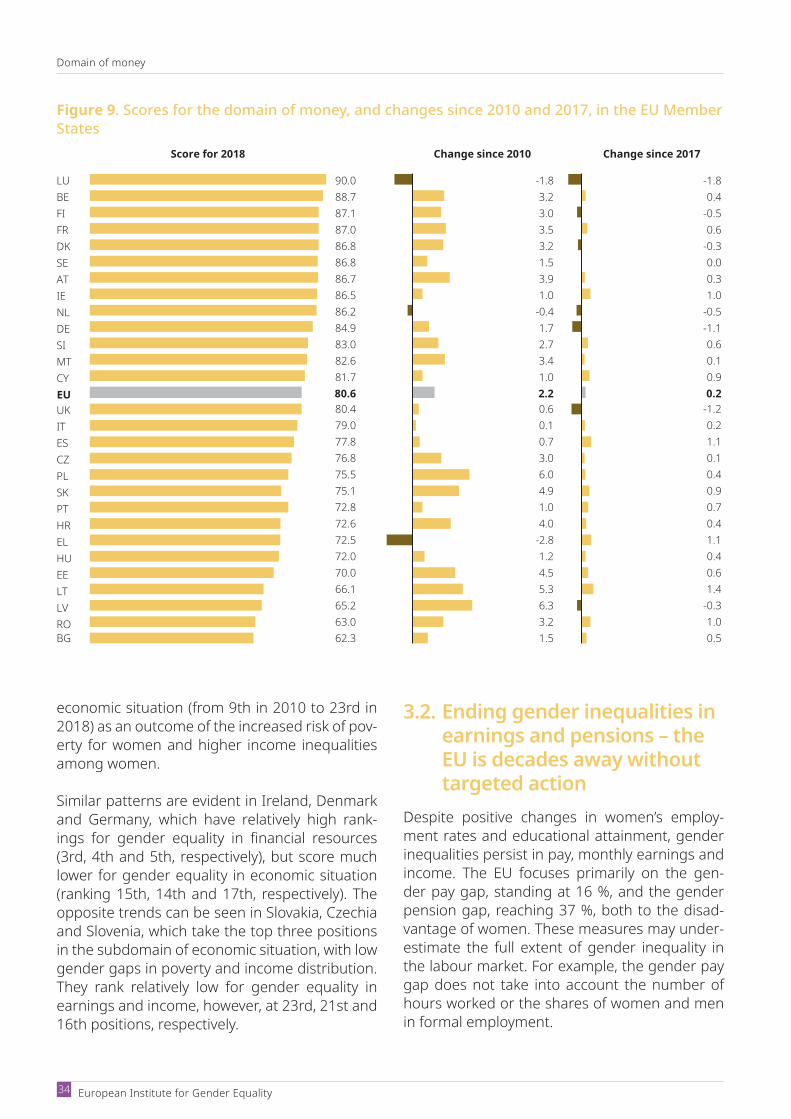
Domain of money
European Institute for Gender Equality 34
economic situation (from 9th in 2010 to 23rd in 2018) as an outcome of the increased risk of pov-erty for women and higher income inequalities among women.
Similar patterns are evident in Ireland, Denmark and Germany, which have relatively high rank-ings for gender equality in financial resources (3rd, 4th and 5th, respectively), but score much lower for gender equality in economic situation (ranking 15th, 14th and 17th, respectively). The opposite trends can be seen in Slovakia, Czechia and Slovenia, which take the top three positions in the subdomain of economic situation, with low gender gaps in poverty and income distribution. They rank relatively low for gender equality in earnings and income, however, at 23rd, 21st and 16th positions, respectively.
Figure 9. Scores for the domain of money, and changes since 2010 and 2017, in the EU Member States
Change since 2017
LUBEFIFRDKSEATIENLDESIMTCYEUUKITESCZPLSKPTHRELHUEELTLVRO
Score for 2018
90.088.787.187.086.886.886.786.586.284.983.082.681.780.680.479.077.876.875.575.172.872.672.572.070.066.165.263.0
Change since 2010
-1.83.23.03.53.21.53.91.0
-0.41.72.73.41.02.20.60.10.73.06.04.91.04.0
-2.81.24.55.36.33.2
-1.80.4
-0.50.6
-0.30.00.31.0
-0.5-1.10.60.10.90.2
-1.20.21.10.10.40.90.70.41.10.40.61.4
-0.31.0
BG 62.3 1.5 0.5
3.2. Ending gender inequalities in earnings and pensions – the EU is decades away without targeted action
Despite positive changes in women’s employ-ment rates and educational attainment, gender inequalities persist in pay, monthly earnings and income. The EU focuses primarily on the gen-der pay gap, standing at 16 %, and the gender pension gap, reaching 37 %, both to the disad-vantage of women. These measures may under-estimate the full extent of gender inequality in the labour market. For example, the gender pay gap does not take into account the number of hours worked or the shares of women and men in formal employment.
Gender Equality Index 2020 — Digi talisation and the future of work
Domain of money
35
The domain of money looks at gender difference in mean monthly earnings, which considers the wider context of women’s and men’s employ-ment opportunities. In addition to income from pensions, it looks at investments and other ben-efits. Since 2010, the gender gap in earnings has increased in 17 Member States, while the gender gap in income has gone up in 19 countries, lead-ing to an overall increase in gender inequality in earnings and income in the EU.
Between 2010 and 2018, the gender gap in monthly earnings increased most in Italy, Poland and Latvia. The biggest progress on closing the gender gap was observed in Cyprus, the United Kingdom and Greece. In addition to gender inequalities in earnings, fewer women than men in the EU receive any type of main salary supple-mentary earnings (e.g. performance bonuses). In its 2019 research on gender segregation in edu-cation and the labour market, EIGE noted that, across remuneration sources, the gender gap is greatest in bonuses. Women are less likely to work in companies that offer higher premiums to their employees and they receive lower premiums than men working in the same companies (EIGE, 2019c).
Between 2010 and 2018, the gender gap in total disposable income (including income from pen-sions, investments and other benefits) increased most in Lithuania, Latvia and Denmark. A com-parison with the 2017 data shows that gender
inequality in income is on the rise in Denmark and Latvia. Czechia, Latvia, Lithuania and Roma-nia show no progress, as the gender gap in income has grown steadily since 2010. France, Cyprus and Luxembourg show most progress on closing gender income gaps.
Gender inequalities in earnings and income grow substantially with age, level of educa-tion and increasing family demands. Women over 50 are the most disadvantaged com-pared with men. In addition, women with the highest levels of qualifications are the most underpaid compared with men with higher education, showing accumulating disadvan-tages for women as their careers progress. In terms of the different stages of life, gender inequalities in earnings and income peak for women living in couples with children and for lone mothers.
While EIGE’s research on the gender pay gap shows considerable variation across different jobs, women earn less than men in all sectors (EIGE, 2019c). The gender pay gaps are largest in financial and insurance activities (35 %) and manufacturing (31 %), which particularly under-pay older women. The gender pay gap is also substantial among health professionals (33 %), showing a dearth of women in high-level posts and a culture of underpayment in jobs domi-nated by women.
(16) Eurofound, ‘Work, teleworking and COVID19’ (https://www.eurofound.europa.eu/data/covid19/workingteleworking).
The first results of a Eurofound survey on living, working and COVID19 (16) show widespread economic insecurity among respondents, with around 4 in 10 saying their financial situation is now worse than before the pandemic. On households’ total monthly income, slightly more women than men (11 % and 9 %, respectively) indicated that their households would face diffi-culty or great difficulty in making ends meet. Nearly every third woman (31 %) and every fourth man (23 %) had no savings with which to maintain their pre-crisis standard of living.
Recent literature (Alon et al., 2020; EIGE, 2019c) has documented that gender inequalities in earnings and income are closely related to (expected and actual) care duties for children, which fall disproportionately on women, without appropriate income replacement. The COVID19linked shift of care duties back into private households will have more severe negative effects on women’s income, as they take on this duty at the cost of their labour market participation, thus losing current and future income.

Domain of money
European Institute for Gender Equality 36
3.3. Grave risk of poverty is the harsh reality for older women and every second lone mother
In 2010, the Europe 2020 strategy established a 10-year EU target to lift at least 20 million peo-ple out of the risk of poverty or social exclusion. Since then, the total number of women and men at risk of poverty or social exclusion has reduced by 8 million, welcome progress that nevertheless falls short of the target. In 2018, of the 21 Member States with national antipoverty targets for the whole population, only eight countries had achieved them (17).
Across the EU, the difference between women and men at risk of poverty is 1.9 p.p., to the
detriment of women, and has not improved since 2010. Given that incomes are typically measured at household level, assuming equal sharing of resources within households, this gender gap is likely to underestimate women’s true exposure to poverty. Gender gaps in poverty have increased in 14 Member States since 2010 and have been on the rise in 21 Member States since 2017. The biggest increases since 2010 have been observed in Lithuania, Latvia and Estonia. Cyprus, Slovenia and France have shown most progress on closing their gender gaps (see Table 13 in Annex 3).
Poverty and social exclusion are often con-centrated in certain particularly vulnerable groups of women and men (Figure 10). For instance, having children exacerbates the risk of poverty, with almost 4 in 10 lone parents –
(17) Eurostat, People at risk of poverty or social exclusion (T2020_50).
Figure 10. At risk of poverty rate by sex, family composition, age, education level, country of birth and disability, EU, 2018
Characteristic Women (%) Gender gap(p.p.)
Gap changesince 2014
Couple with children 0Lone parents -6
15 to 24 -225 to 49 -150 to 64 065 + -5
Low -2Medium -2High 0
Native born -2Foreign born -2
With disability -1Without disability -2
Population 15 +
1436
2316
1618
2716
8
1627
2216
17 -2
Men (%)
1430
211516
13
2514
8
1425
2114
15
Family
Age
Education
Country of birth
Disability
Overall
no change gap increasedgap decreased
Source: EIGE’s calculation, EUSILC (IE, SK, UK, 2017)
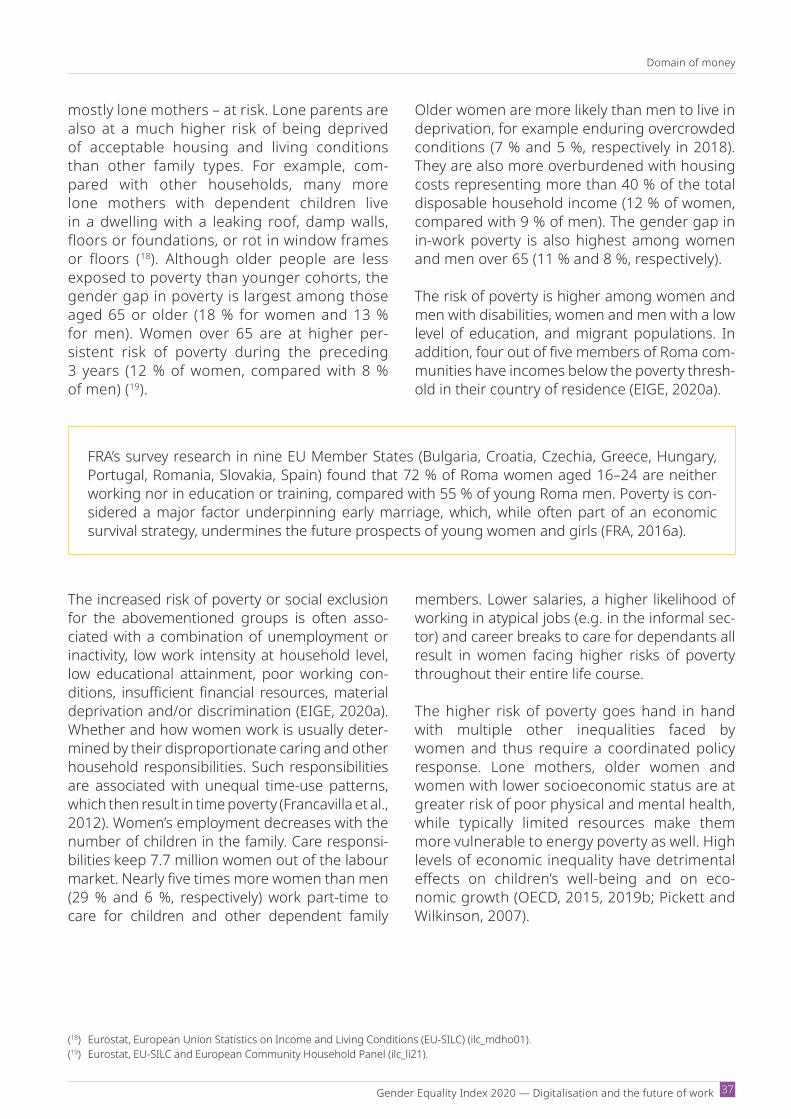
Gender Equality Index 2020 — Digi talisation and the future of work
Domain of money
37
mostly lone mothers – at risk. Lone parents are also at a much higher risk of being deprived of acceptable housing and living conditions than other family types. For example, com-pared with other households, many more lone mothers with dependent children live in a dwelling with a leaking roof, damp walls, floors or foundations, or rot in window frames or floors (18). Although older people are less exposed to poverty than younger cohorts, the gender gap in poverty is largest among those aged 65 or older (18 % for women and 13 % for men). Women over 65 are at higher per-sistent risk of poverty during the preceding 3 years (12 % of women, compared with 8 % of men) (19).
Older women are more likely than men to live in deprivation, for example enduring overcrowded conditions (7 % and 5 %, respectively in 2018). They are also more overburdened with housing costs representing more than 40 % of the total disposable household income (12 % of women, compared with 9 % of men). The gender gap in in-work poverty is also highest among women and men over 65 (11 % and 8 %, respectively).
The risk of poverty is higher among women and men with disabilities, women and men with a low level of education, and migrant populations. In addition, four out of five members of Roma com-munities have incomes below the poverty thresh-old in their country of residence (EIGE, 2020a).
The increased risk of poverty or social exclusion for the abovementioned groups is often asso-ciated with a combination of unemployment or inactivity, low work intensity at household level, low educational attainment, poor working con-ditions, insufficient financial resources, material deprivation and/or discrimination (EIGE, 2020a). Whether and how women work is usually deter-mined by their disproportionate caring and other household responsibilities. Such responsibilities are associated with unequal time-use patterns, which then result in time poverty (Francavilla et al., 2012). Women’s employment decreases with the number of children in the family. Care responsi-bilities keep 7.7 million women out of the labour market. Nearly five times more women than men (29 % and 6 %, respectively) work part-time to care for children and other dependent family
members. Lower salaries, a higher likelihood of working in atypical jobs (e.g. in the informal sec-tor) and career breaks to care for dependants all result in women facing higher risks of poverty throughout their entire life course.
The higher risk of poverty goes hand in hand with multiple other inequalities faced by women and thus require a coordinated policy response. Lone mothers, older women and women with lower socioeconomic status are at greater risk of poor physical and mental health, while typically limited resources make them more vulnerable to energy poverty as well. High levels of economic inequality have detrimental effects on children’s wellbeing and on eco-nomic growth (OECD, 2015, 2019b; Pickett and Wilkinson, 2007).
FRA’s survey research in nine EU Member States (Bulgaria, Croatia, Czechia, Greece, Hungary, Portugal, Romania, Slovakia, Spain) found that 72 % of Roma women aged 16–24 are neither working nor in education or training, compared with 55 % of young Roma men. Poverty is con-sidered a major factor underpinning early marriage, which, while often part of an economic survival strategy, undermines the future prospects of young women and girls (FRA, 2016a).
(18) Eurostat, European Union Statistics on Income and Living Conditions (EUSILC) (ilc_mdho01).(19) Eurostat, EUSILC and European Community Household Panel (ilc_li21).
Domain of knowledge
38 European Institute for Gender Equality
Equal access to education, as well as fair and high-quality educational processes, are essen-tial for gender equality and for Europe’s future economic prosperity. The Index looks at gender segregation in higher education, graduates of tertiary education and participation in adult learn-ing – the issues high on the EU policy agenda. Targets for tertiary education attainment levels and adult lifelong learning are included in the EU framework for education and training 2020 and are among the SDG targets. The European Pillar of Social Rights also emphasises the importance of education and training and lifelong learning to ensure that women and men acquire and maintain the skills they need to participate fully in society and successfully manage transitions in the labour market. The Council recommendation on key competencies for lifelong learning specifi-cally encourages Member States to foster efforts to involve more women and men in lifelong learn-ing activities, while the Commission’s recommen-dation ‘Upskilling pathways: new opportunities for adults’ calls for improvements to adult learn-ing provision, with a specific focus on the needs of low-skilled adults. Horizontal segregation in education is emphasised in the new EU gender equality strategy 2020–2025, which highlights the need to address gendered choices in study subjects and subsequent careers. Promoting ‘equity, social cohesion, and active citizenship’ is also reflected among the priorities set out in the EU framework for education and training 2020, although gender equality is not one of its pri-mary objective.
The COVID19 pandemic has had a considerable impact on learning activities at all levels of edu-cation. Universities and schools in many Mem-ber States shifted their learning processes to the digital environment, highlighting challenges
in accessing personal computers and broad-band connection, especially for families in diffi-cult socioeconomic conditions. At the same time, the temporary closure of childcare services and schools in nearly all Member States saw lone par-ents and couples with children facing increased difficulties in combining their work and care responsibilities. With many women and men out of work because of the pandemic, adult educa-tion will play a major role in reintegrating them into the labour market.
Digitalisation has had a significantly impact on the world of education and training, bringing new opportunities and challenges for gender equality (see Chapter 9 for a detailed discussion). Digital skills and competencies are increasingly neces-sary for the full participation of women and men in social and working life, yet significant gender differences exist in the levels and types of digital skills that women and men acquire. The lack of gender diversity among researchers inventing, designing and developing digital services and goods remains strikingly high, limiting the overall potential of research and development activities.
4.1. Stalled progress in the domain of knowledge
With an overall EU score of 63.6 points, the domain of knowledge (20) has remained stagnant since the previous edition of the Gender Equality Index, improving by only 1.8 points since 2010 (Figure 11 and Figure 12). Most Member States experienced little or no improvement – nor even any setbacks – in the knowledge domain between 2017 and 2018. Increases of at least 1 point were registered in Bulgaria (+ 1.8), Malta (+ 1.3) and Croatia (+ 1.2), while the score fell in
(20) The domain of knowledge measures gender inequalities in educational attainment, lifelong learning and gender segregation in education. The subdomain of educational attainment is measured by two indicators: the percentages of women and men tertiary graduates, and the participation of women and men in formal and non-formal education and training over the life course. The second subdomain targets gender segregation in tertiary education by looking at the percentages of women and men students in the education, health and welfare, humanities and arts fields.
4. Domain of knowledge
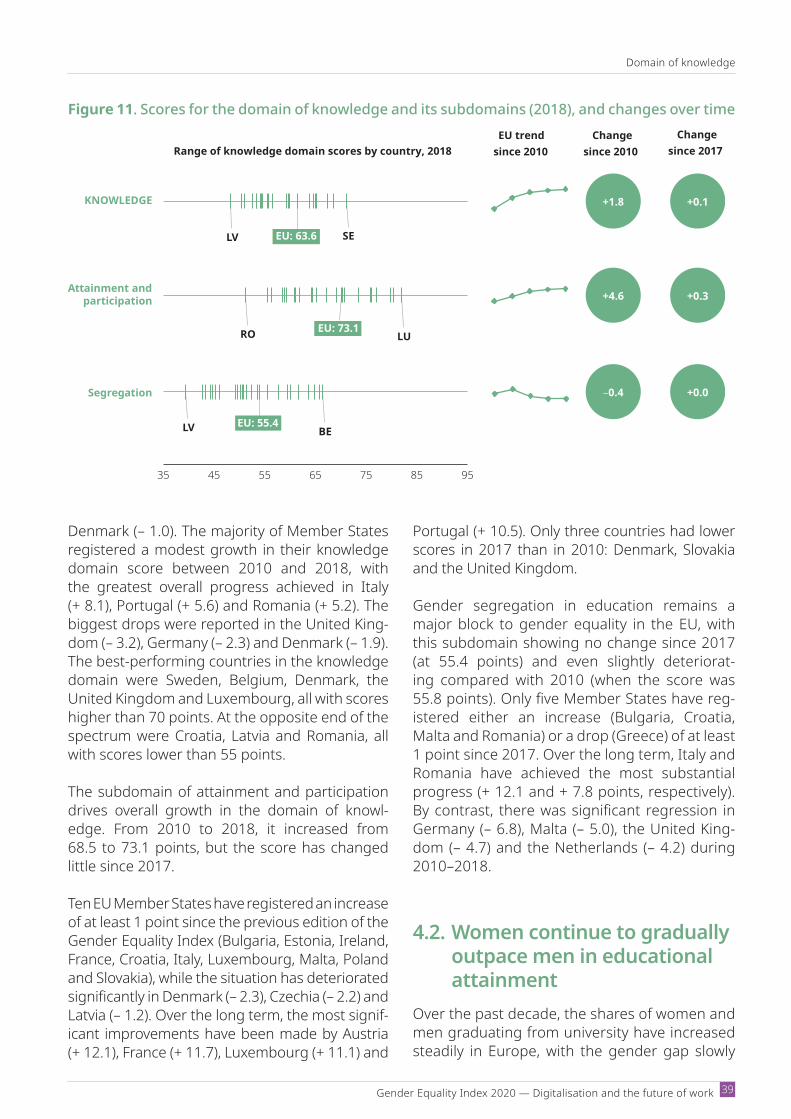
Gender Equality Index 2020 — Digi talisation and the future of work
Domain of knowledge
39
Portugal (+ 10.5). Only three countries had lower scores in 2017 than in 2010: Denmark, Slovakia and the United Kingdom.
Gender segregation in education remains a major block to gender equality in the EU, with this subdomain showing no change since 2017 (at 55.4 points) and even slightly deteriorat-ing compared with 2010 (when the score was 55.8 points). Only five Member States have reg-istered either an increase (Bulgaria, Croatia, Malta and Romania) or a drop (Greece) of at least 1 point since 2017. Over the long term, Italy and Romania have achieved the most substantial progress (+ 12.1 and + 7.8 points, respectively). By contrast, there was significant regression in Germany (– 6.8), Malta (– 5.0), the United King-dom (– 4.7) and the Netherlands (– 4.2) during 2010–2018.
4.2. Women continue to gradually outpace men in educational attainment
Over the past decade, the shares of women and men graduating from university have increased steadily in Europe, with the gender gap slowly
Figure 11. Scores for the domain of knowledge and its subdomains (2018), and changes over timeChange
since 2010Change
since 2017EU trend
since 2010Range of knowledge domain scores by country, 2018
35 45 55 65 75 85 95
KNOWLEDGE
EU: 63.6LV SE
+1.8 +0.1
Segregation
BELV
–0.4 +0.0
EU: 55.4
+4.6 +0.3Attainment and
participation
LURO EU: 73.1
Denmark (– 1.0). The majority of Member States registered a modest growth in their knowledge domain score between 2010 and 2018, with the greatest overall progress achieved in Italy (+ 8.1), Portugal (+ 5.6) and Romania (+ 5.2). The biggest drops were reported in the United King-dom (– 3.2), Germany (– 2.3) and Denmark (– 1.9). The best-performing countries in the knowledge domain were Sweden, Belgium, Denmark, the United Kingdom and Luxembourg, all with scores higher than 70 points. At the opposite end of the spectrum were Croatia, Latvia and Romania, all with scores lower than 55 points.
The subdomain of attainment and participation drives overall growth in the domain of knowl-edge. From 2010 to 2018, it increased from 68.5 to 73.1 points, but the score has changed little since 2017.
Ten EU Member States have registered an increase of at least 1 point since the previous edition of the Gender Equality Index (Bulgaria, Estonia, Ireland, France, Croatia, Italy, Luxembourg, Malta, Poland and Slovakia), while the situation has deteriorated significantly in Denmark (– 2.3), Czechia (– 2.2) and Latvia (– 1.2). Over the long term, the most signif-icant improvements have been made by Austria (+ 12.1), France (+ 11.7), Luxembourg (+ 11.1) and

Domain of knowledge
European Institute for Gender Equality 40
reversing to favour women. In 2010, 20 % of women and 21 % of men had gained tertiary education, while in 2018 more women than men had graduated from university in the 15 or older age group (26 % and 25 %, respectively). The largest gender gaps in favour of women tertiary graduates were registered in Estonia (17 p.p.), Latvia (14 p.p.) and Sweden (11 p.p.), while an additional nine Member States had gaps higher than 5 p.p. (Bulgaria, Denmark, Ireland, Cyprus, Lithuania, Poland, Portugal, Slovenia and Fin-land). Men were more likely than women to graduate from university in four countries: Ger-many (with the largest gender gap of 8 p.p.), Luxembourg, the Netherlands and Austria (all with gaps below 4.5 p.p.).
An intersectional analysis reveals that ter-tiary educational attainment differs substan-tially between women and men in terms of age, family composition and disability (Figure 13). More women than men aged 15–49 have gained tertiary education, but the reverse is evident in the 50 + age group. Furthermore, more women than men have gained tertiary education in the couples living with children cohort (+ 6 p.p.). Meanwhile, an analysis of the intersection of gender and disability found a gender gap in favour of men (3 p.p.). Among people without disabilities, this gap was reversed and stood at 2 p.p. Long-term tendencies sug-gest that these gender gaps have increased since 2014.
Figure 12. Scores for the domain of knowledge, and changes since 2010 and 2017, in the EU Mem-ber States
Change since 2010 Change since 2017
SEBEDKUKLUESNLIEMTFRATEUITFISKCZHUPLEECYLTSIPTBGELDEROHRLV
Score for 2018
74.271.471.370.170.067.667.367.367.166.363.863.661.961.661.258.457.457.256.356.256.255.955.754.954.854.052.451.649.3
3.50.7
-1.9-3.23.84.10.42.01.74.34.91.88.13.01.72.93.0
-0.64.80.71.80.95.64.61.4
-2.35.21.70.1
0.40.1
-1.0-0.30.50.30.30.41.30.2
-0.30.10.70.50.9
-0.60.60.70.8
-0.20.2
-0.10.61.8
-0.90.30.81.2
-0.4
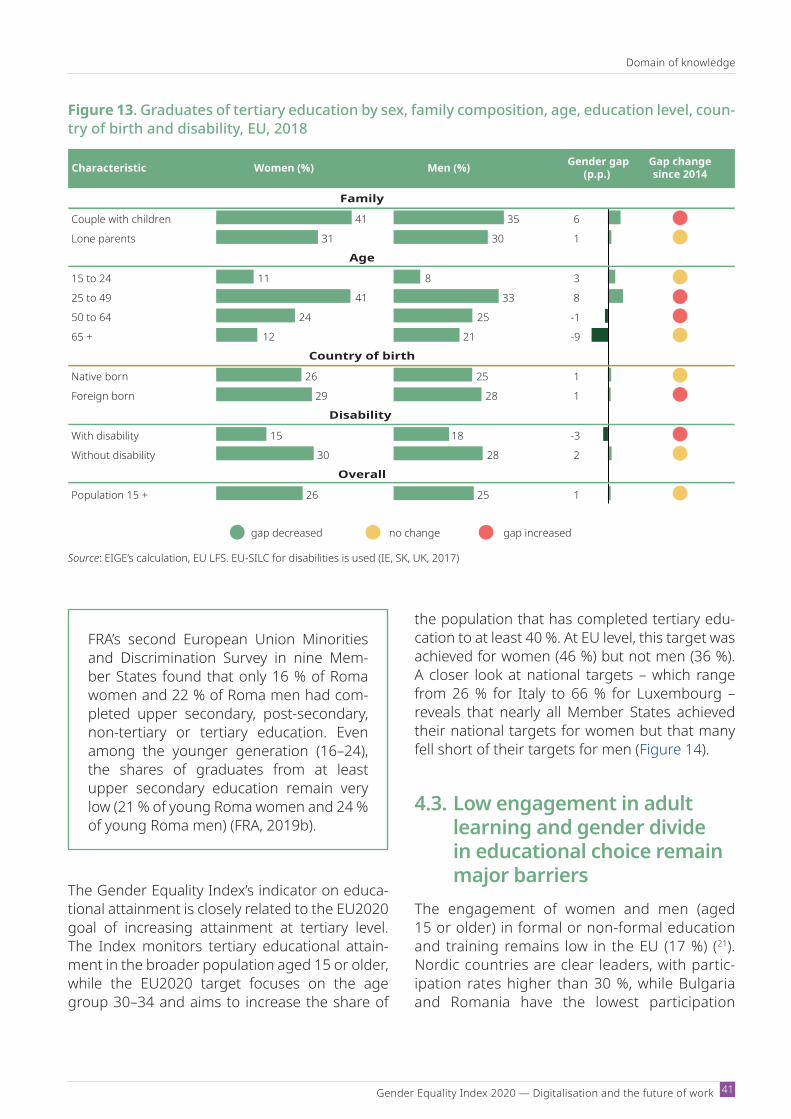
Gender Equality Index 2020 — Digi talisation and the future of work
Domain of knowledge
41
The Gender Equality Index’s indicator on educa-tional attainment is closely related to the EU2020 goal of increasing attainment at tertiary level. The Index monitors tertiary educational attain-ment in the broader population aged 15 or older, while the EU2020 target focuses on the age group 30–34 and aims to increase the share of
Figure 13. Graduates of tertiary education by sex, family composition, age, education level, coun-try of birth and disability, EU, 2018
Characteristic Gender gap(p.p.)
Gap changesince 2014
Couple with children 35
Lone parents 30
15 to 24 8 3
25 to 49 33 8
50 to 64 25 -1
65 + 21 -9
Native born 25 1
Foreign born 28 1
With disability 18 -3
Without disability 28 2
Population 15 +
Men (%)Women (%)
41
31
11
41
24
12
26
29
15
30
26 25 1
Overall
Family
Age
Country of birth
Disability
6
1
no change gap increasedgap decreased
Source: EIGE’s calculation, EU LFS. EUSILC for disabilities is used (IE, SK, UK, 2017)
FRA’s second European Union Minorities and Discrimination Survey in nine Mem-ber States found that only 16 % of Roma women and 22 % of Roma men had com-pleted upper secondary, post-secondary, non-tertiary or tertiary education. Even among the younger generation (16–24), the shares of graduates from at least upper secondary education remain very low (21 % of young Roma women and 24 % of young Roma men) (FRA, 2019b).
the population that has completed tertiary edu-cation to at least 40 %. At EU level, this target was achieved for women (46 %) but not men (36 %). A closer look at national targets – which range from 26 % for Italy to 66 % for Luxembourg – reveals that nearly all Member States achieved their national targets for women but that many fell short of their targets for men (Figure 14).
4.3. Low engagement in adult learning and gender divide in educational choice remain major barriers
The engagement of women and men (aged 15 or older) in formal or non-formal education and training remains low in the EU (17 %) (21). Nordic countries are clear leaders, with partic-ipation rates higher than 30 %, while Bulgaria and Romania have the lowest participation
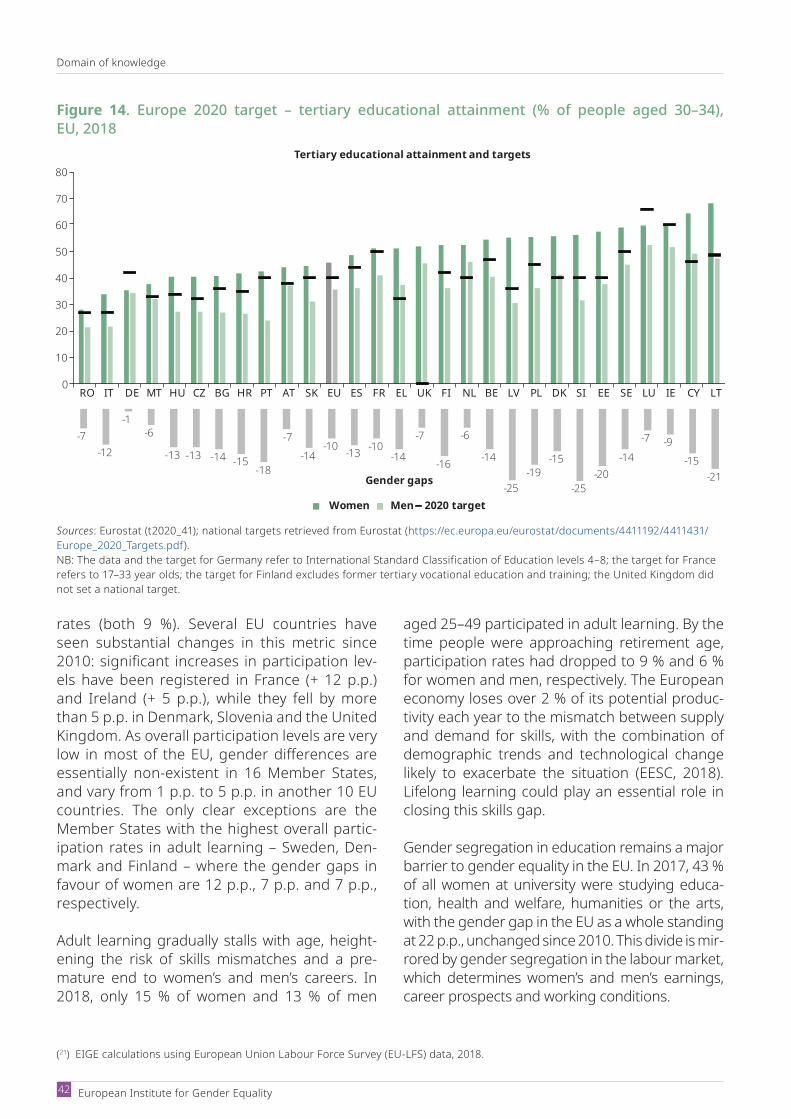
Domain of knowledge
European Institute for Gender Equality 42
rates (both 9 %). Several EU countries have seen substantial changes in this metric since 2010: significant increases in participation lev-els have been registered in France (+ 12 p.p.) and Ireland (+ 5 p.p.), while they fell by more than 5 p.p. in Denmark, Slovenia and the United Kingdom. As overall participation levels are very low in most of the EU, gender differences are essentially nonexistent in 16 Member States, and vary from 1 p.p. to 5 p.p. in another 10 EU countries. The only clear exceptions are the Member States with the highest overall partic-ipation rates in adult learning – Sweden, Den-mark and Finland – where the gender gaps in favour of women are 12 p.p., 7 p.p. and 7 p.p., respectively.
Adult learning gradually stalls with age, height-ening the risk of skills mismatches and a pre-mature end to women’s and men’s careers. In 2018, only 15 % of women and 13 % of men
aged 25–49 participated in adult learning. By the time people were approaching retirement age, participation rates had dropped to 9 % and 6 % for women and men, respectively. The European economy loses over 2 % of its potential produc-tivity each year to the mismatch between supply and demand for skills, with the combination of demographic trends and technological change likely to exacerbate the situation (EESC, 2018). Lifelong learning could play an essential role in closing this skills gap.
Gender segregation in education remains a major barrier to gender equality in the EU. In 2017, 43 % of all women at university were studying educa-tion, health and welfare, humanities or the arts, with the gender gap in the EU as a whole standing at 22 p.p., unchanged since 2010. This divide is mir-rored by gender segregation in the labour market, which determines women’s and men’s earnings, career prospects and working conditions.
(21) EIGE calculations using European Union Labour Force Survey (EULFS) data, 2018.
Figure 14. Europe 2020 target – tertiary educational attainment (% of people aged 30–34), EU, 2018
0
10
20
30
40
50
60
70
80
RO IT DE MT HU CZ BG HR PT AT SK EU ES FR EL UK FI NL BE LV PL DK SI EE SE LU IE CY LT
Tertiary educational attainment and targets
Women Men 2020 target
-7-12
-1-6
-13 -13 -14 -15-18
-7-14
-10 -13 -10-14
-7
-16
-6
-14
-25-19
-15
-25-20
-14
-7 -9-15
-21Gender gaps
Sources: Eurostat (t2020_41); national targets retrieved from Eurostat (https://ec.europa.eu/eurostat/documents/4411192/4411431/Europe_2020_Targets.pdf).NB: The data and the target for Germany refer to International Standard Classification of Education levels 4–8; the target for France refers to 17–33 year olds; the target for Finland excludes former tertiary vocational education and training; the United Kingdom did not set a national target.

Gender Equality Index 2020 — Digi talisation and the future of work
Domain of knowledge
43
The highest gender gaps in enrolment in educa-tion, health and welfare, humanities and the arts were registered in Finland and Cyprus (33 p.p. and 27 p.p., respectively), while in 20 countries the gap was greater than 20 p.p. Romania and Bulgaria recorded the lowest gender gaps in the EU, yet these were still very high, at 15 p.p. and 16 p.p., respectively. However, several EU countries have made significant progress since 2010: the Neth-erlands, for example, has closed the gap by 9 p.p., while Germany has reduced it by nearly 8 p.p. At the same time, five countries (Latvia, Lithuania, Hungary, Romania and Slovenia) all witnessed an increase in the gap of more than 5 p.p.
Although the gap is not directly measured by the Gender Equality Index, there is a significant gender difference among graduates in ICT and
STEM subjects. In 2018, women constituted about 28 % of graduates in engineering, man-ufacturing and construction, and only around 20 % of ICT graduates (22). However, near gen-der parity was recorded among graduates in natural sciences, mathematics and statistics (54 % women and 46 % men). Gender differ-ences in STEM subjects in higher education are not explained by academic performance, as girls and boys show similar levels of achieve-ment in science and maths in secondary level education (European Commission, 2019g). Social norms and gendered expectations regarding career choices (often reinforced through educational content and curricula) are the key drivers of gender segregation in higher education (EIGE, 2020a).
(22) Source: Eurostat (educ_uoe_grad02).
Domain of time
44 European Institute for Gender Equality
The unequal distribution of paid and unpaid work along gender lines is considered one of the root causes of gender inequality in society as a whole and in the labour market specifically, as it raises questions about women’s exposure to the risk of poverty, access to decision-making and polit-ical representation. In 2019, the adoption of the Work–Life Balance Directive for parents and car-ers showed strong political will to facilitate better distribution of care and household work between women and men. Among the provisions are new or harmonised labour market rights, such as the right to flexible working arrangements for workers with care responsibilities, carer’s leave, parental leave and increased job protection. The directive also includes non-legislative aspects, such as investment in infrastructure for care, particularly long-term care.
The newly released EU gender equality strat-egy 2020–2025 includes closing gender gaps in caring roles as one of its priorities. It proposes a series of measures, such as the transposition and implementation of the Work–Life Balance Directive, greater investment in quality care infra-structure for children, older people and people with disabilities, and the implementation of the European Pillar of Social Rights (European Com-mission, 2020c).
The COVID19 pandemic in Europe brought with it the closure of schools and early education facil-ities and a lack of availability of social support sys-tems (carers, childminders, grandparents); thus, it has exacerbated the pressure on families – especially women and lone mothers – to combine work caring for children and older family mem-bers with paid work (Fodor et al., 2020). Eurostat data show that, in 2019, about 13.4 million adults lived in households with young children where all the adults were working full-time (23). The shift to telework in response to the pandemic has
affected women and men differently, with pre-liminary data showing that, among 18–34 year olds, more women than men started teleworking during the pandemic (50 % and 37 %, respec-tively) (24), which could reflect women taking on a disproportionate share of childcare and educa-tion while maintaining their paid work. Research from the United Kingdom carried out during the lockdown has shown that, while women were still spending more time on childcare than men, the gender gap in childcare was smaller than before the pandemic. It highlighted that the division of childcare had grown more equal in households where men either were teleworking or had lost their jobs (Sevilla and Smith, 2020).
In several Member States (Belgium, Germany, Ireland, Spain, France, Italy, Sweden and the United Kingdom), people living in residential care facilities have suffered a very high death toll as result of the COVID19 outbreak. Data from May 2020 show that mortality in long-term care facilities has accounted for a signif-icant share of all COVID19 deaths, from 21 % in England to 66 % in Spain (ComasHerrera et al., 2020; ECDC, 2020). This tragic loss of life has highlighted the systematic under-staffing and underfunding of most residential long-term care institutions. This could create an upswing towards autonomous living and prompt families to move away from residen-tial care and intensify their efforts to provide home-based long-term care (EIGE, 2020e), potentially further aggravating the dispropor-tionate burden of informal care shouldered by women (EIGE, 2019b).
More generally, lockdown situations have high-lighted that, despite being invisible, devalued and unaccounted for in GDP measures, daily unpaid care shouldered disproportionately by women is essential to the functioning of society.
5. Domain of time
(23) Of the nearly 42 million adults living in households with at least one child aged less than 6 years, 32 % were in a situation where all the adults were working fulltime. Data from Eurostat for the EU27, 2019, lfst_hhwhacc.
(24) Eurofound, ‘Living, working and COVID19 data’ (http://eurofound.link/covid19data).

Gender Equality Index 2020 — Digi talisation and the future of work
Domain of time
45
5.1. Gender equality in time use: some gains but not sufficient to offset overall stalling
The domain of time (25) is the third lowest scoring of the six domains comprising the Gender Equal-ity Index and is characterised by a persistent lack of progress and growing inequality (EIGE, 2017e, 2019b). Since 2010, the EU score has stagnated, with a slight decrease of 0.6 points (Figure 15) (26) to 65.7.
Owing to the absence of uptodate data on time use, the score for the domain of time has not been updated since 2017. Since 2010, 10 Member States have seen their score decrease (the Netherlands, Finland, the United Kingdom, Luxembourg, Belgium, Germany, Poland, Lith-uania, Romania and Bulgaria). The most pro-nounced regressions have been seen in Belgium
(– 5 points), Germany (– 4.8 points) and Finland (– 2.7 points). The majority of EU countries have observed improvements in their scores since 2010, ranging from increases of 9.9 points in Malta, 9.1 points in Greece and 8.8 points in Por-tugal to increases of 1.2 points in Croatia and 1 point in Estonia. France and Hungary have not seen their scores change substantially since 2010 (+ 0.7 and + 0.2 points, respectively).
As shown in Figure 16, the EU score for the domain of time (65.7 points) masks a variety of national circumstances, with scores ranging from 42.7 in Bulgaria to 90.1 in Sweden. Time has the second broadest dispersion of countries’ scores in the Gender Equality Index (after the domain of power). The social activities subdomain, with a score of 61.6 points in 2018, reveals higher lev-els of gender inequality than the care subdomain (70 points).
Figure 15. Scores for the domain of time and its subdomains (2017), and changes over time
Range of time domain scores by country, 2017 Change
since 2010
EU: 65.7BG SE
50 60 70 80 90 100
–0.6TIME
EU: 61.6BG SE
–3.8Social activities
EU: 70.0EL SE
+2.7Care activities
(25) The domain of time measures gender inequality in the allocation of time to care and domestic work and social activities. The first subdomain of care activities measures gender gaps in women’s and men’s involvement in the care and/or education of their children and grandchildren and older people or people with disabilities. It also measures their involvement in cooking and housework. The second subdomain explores how many women and men engage in social activities, i.e. participate in sporting, cultural or leisure activities outside the home, combined with their engagement in voluntary and charitable activities.
(26) Note that Figure 15 presents only current scores and changes since 2010, owing to limited availability of data on the time domain data over the relevant period, which prevents other trends being presented.
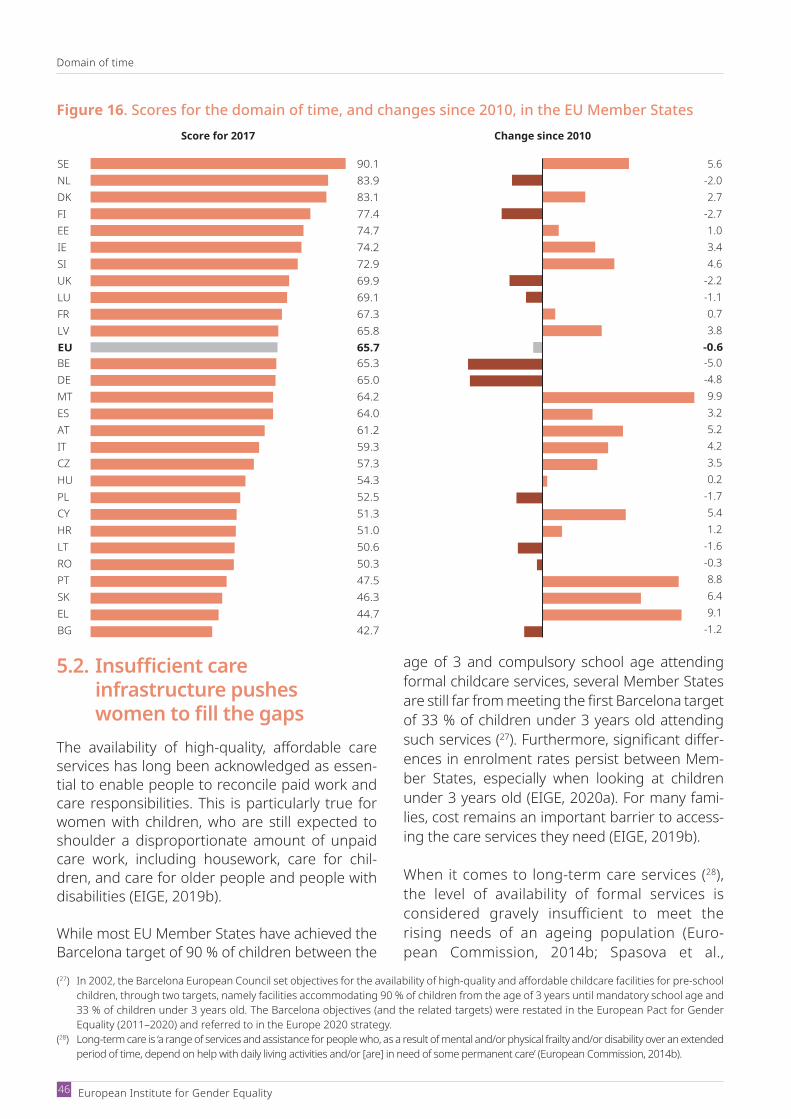
Domain of time
European Institute for Gender Equality 46
5.2. Insufficient care infrastructure pushes women to fill the gaps
The availability of highquality, affordable care services has long been acknowledged as essen-tial to enable people to reconcile paid work and care responsibilities. This is particularly true for women with children, who are still expected to shoulder a disproportionate amount of unpaid care work, including housework, care for chil-dren, and care for older people and people with disabilities (EIGE, 2019b).
While most EU Member States have achieved the Barcelona target of 90 % of children between the
age of 3 and compulsory school age attending formal childcare services, several Member States are still far from meeting the first Barcelona target of 33 % of children under 3 years old attending such services (27). Furthermore, significant differ-ences in enrolment rates persist between Mem-ber States, especially when looking at children under 3 years old (EIGE, 2020a). For many fami-lies, cost remains an important barrier to access-ing the care services they need (EIGE, 2019b).
When it comes to long-term care services (28), the level of availability of formal services is considered gravely insufficient to meet the rising needs of an ageing population (Euro-pean Commission, 2014b; Spasova et al.,
Figure 16. Scores for the domain of time, and changes since 2010, in the EU Member StatesScore for 2017 Change since 2010
SE 5.6NL -2.0DK 2.7FI -2.7EE 1.0IE 3.4SI 4.6UK -2.2LU -1.1FR 0.7LV 3.8EU -0.6BE -5.0DE -4.8MT 9.9ES 3.2AT 5.2IT 4.2CZ 3.5HU 0.2PL -1.7CY 5.4HR 1.2LT -1.6RO -0.3PT 8.8SK 6.4EL 9.1BG
90.183.983.177.474.774.272.969.969.167.365.865.765.365.064.264.061.259.357.354.352.551.351.050.650.347.546.344.742.7 -1.2
(27) In 2002, the Barcelona European Council set objectives for the availability of highquality and affordable childcare facilities for preschool children, through two targets, namely facilities accommodating 90 % of children from the age of 3 years until mandatory school age and 33 % of children under 3 years old. The Barcelona objectives (and the related targets) were restated in the European Pact for Gender Equality (2011–2020) and referred to in the Europe 2020 strategy.
(28) Longterm care is ‘a range of services and assistance for people who, as a result of mental and/or physical frailty and/or disability over an extended period of time, depend on help with daily living activities and/or [are] in need of some permanent care’ (European Commission, 2014b).
Gender Equality Index 2020 — Digi talisation and the future of work
Domain of time
47
2018). In 2017, one in four people in the EU had a long-term disability (29), and about 5 % of families with children had a child with dis-abilities (EIGE, 2020e). As a result, long-term care in the EU is characterised by informal-ity, with informal carers outnumbering formal caregivers by an estimated two-to-one ratio (European Commission, 2014b). As a conse-quence, families often forgo adequate care entirely, relying instead on domestic workers in precarious working conditions or provid-ing care themselves (EIGE, 2020e). Gaps in care services disproportionately affect women as care recipients, as more women than men are dependent on long-term care, and also as caregivers, with the vast majority of formal and informal carers being women (30). Across the Member States, women from migrant back-grounds employed as domestic workers are often employed in irregular jobs with no access to social protection or labour rights (ILO, 2018b; Spasova et al., 2018). The COVID19 crisis, which has seen thousands of migrant care workers (mostly women) return to their home countries ahead of border closures, has highlighted the older EU countries’ reliance on the work of women, usually from eastern Euro-pean countries and deprived of proper work status (Zacharenko, 2020).
The effects of insufficient care coverage are sig-nificant and profoundly gendered. Eurostat data show that, in the EU, care responsibilities keep some 7.7 million women out of the labour mar-ket, compared with just 450 000 men (31). In addi-tion, far more women than men work part-time (8.9 million versus 560 000) owing to their care responsibilities (32). Women are therefore more likely than men to report difficulties in combining paid work and care responsibilities (33), which has clear consequences for their participation in the labour market.
At the societal level, the employment lost as a result of women’s caring responsibilities leads to a loss of an estimated EUR 370 billion per year for Europe (European Commission, 2018a).
5.3. Gender, age and education affect workers’ access to social activities
With an EU score of 61.6 points, social activ-ities is the subdomain with the lower score in the time domain, pointing to persistent gender inequalities. This is important from both a gen-der equality and a well-being perspective (Bra-jša-Žganec et al., 2011). Access to leisure time and activities, while an essential aspect of quality of life, is largely determined by time pressures from both paid and unpaid work (European Parliament, 2016).
Research shows that for workers, overall time dedicated to paid work has increased, reducing the time and energy available for other activi-ties (Haworth and Lewis, 2005). In addition, the diminishing boundaries between professional and personal time brought about by digitalisa-tion sees paid work increasingly encroaching on leisure time (European Parliament, 2016; Wajc-man, 2015). This is particularly true for people in precarious employment, such as platform work-ers (see Chapter 9).
Looking at the specific indicator for sporting, cul-tural and leisure activities carried out outside the home, the participation of working women and men is extremely low in some countries and var-ies significantly between countries. In nine coun-tries (34), fewer than one in five workers engaged in any sporting, cultural or leisure activities out-side the home at least every other day. The rates in another 11 countries (35) ranged from 19 % in Poland to 36 % in Belgium and Estonia.
(29) Women (27 %) more than men (22 %). Eurostat, health variables, EUSILC, 2017 (hlth_silc_06).(30) More women (19.7 %) than men (14.9 %) provide care for older people and people with disabilities, particularly among the population
aged 50–64(31) Eurostat, EULFS (lfsa_igar), data for women aged 20–64.(32) A further 15.1 % of women, compared with 8.0 % of men, work part-time because of other family or personal responsibilities, widening
this gap further.(33) Based on data from the 2016 European Quality of Life Survey (EQLS).(34) Bulgaria, Greece, Croatia, Cyprus, Lithuania, Hungary, Portugal, Romania and Slovakia.

Domain of time
European Institute for Gender Equality 48
As seen in Figure 17, workers’ involvement in social activities (36) reveals important inequali-ties in how women and men in the EU combine work with other aspects of their lives. While the overall gender gap in participation in sporting, cultural and leisure activities is rather modest (4 p.p.) it reaches 13 p.p. among lone parents and 17 p.p. among young workers (aged 15–24). This significant gender gap in social activities among young workers mirrors the gap in physical activity between young women and men (19 p.p.), cov-ered by the domain of health (37).
Physical activity habits among adults are often established in youth. Analysis of data from the international Health Behaviour in Schoolaged Children survey highlights that the overall activ-ity levels of children in Europe tend to decline between the ages of 11 and 15, especially among
Figure 17. Shares of workers engaging in social activities by sex, family composition, age, educa-tion level, country of birth and disability, EU, 2015
Characteristic Women (%) Men (%) Gender gap(p.p.)
Couple with children 26 29 -3
Lone parents 26 39 -13
15 to 24 39 56 -17
25 to 49 28 33 -5
50 to 64 25 25 0
Low 20 21 -1
Medium 23 28 -5
High 37 43 -6
Native born 28 32 -4
Foreign born 26 31 -5
With disability 27 27 0
Without disability 28 32 -4
Employed population 15 + 28 32 -4Overall
Family
Age
Education
Country of birth
Disability
Source: EIGE’s calculation, EWCS
(35) Belgium, Czechia, Germany, Estonia, France, Italy, Latvia, Malta, Austria, Poland and the United Kingdom.(36) The indicator focuses on workers and is thus limited to certain age groups, including 15–24 and 50–64. Nor does it reflect the situations
of those excluded from the labour market, for example owing to care responsibilities.(37) EIGE, ‘Health in European Union for 2019’ (https://eige.europa.eu/genderequalityindex/2019/domain/health/age).
girls (WHO, 2016, 2017), with parental income lev-els a key determinant of access to sports for chil-dren (Richter et al., 2009).
When it comes to leisure activities outside the home in general, the gendered division of labour (which sees most childcare responsibili-ties assigned to women), women’s lower income and gender norms surrounding motherhood all contribute to women with children, espe-cially lone mothers, engaging less in leisure activities (Brajša-Žganec et al., 2011; Dlugonski and Motl, 2013; European Parliament, 2016; McIntyre and Rhodes, 2009). For all workers, involvement in social activities declines with age and increases with education, pointing to the ways in which gender and class differ-ences shape access to cultural and recreational resources.
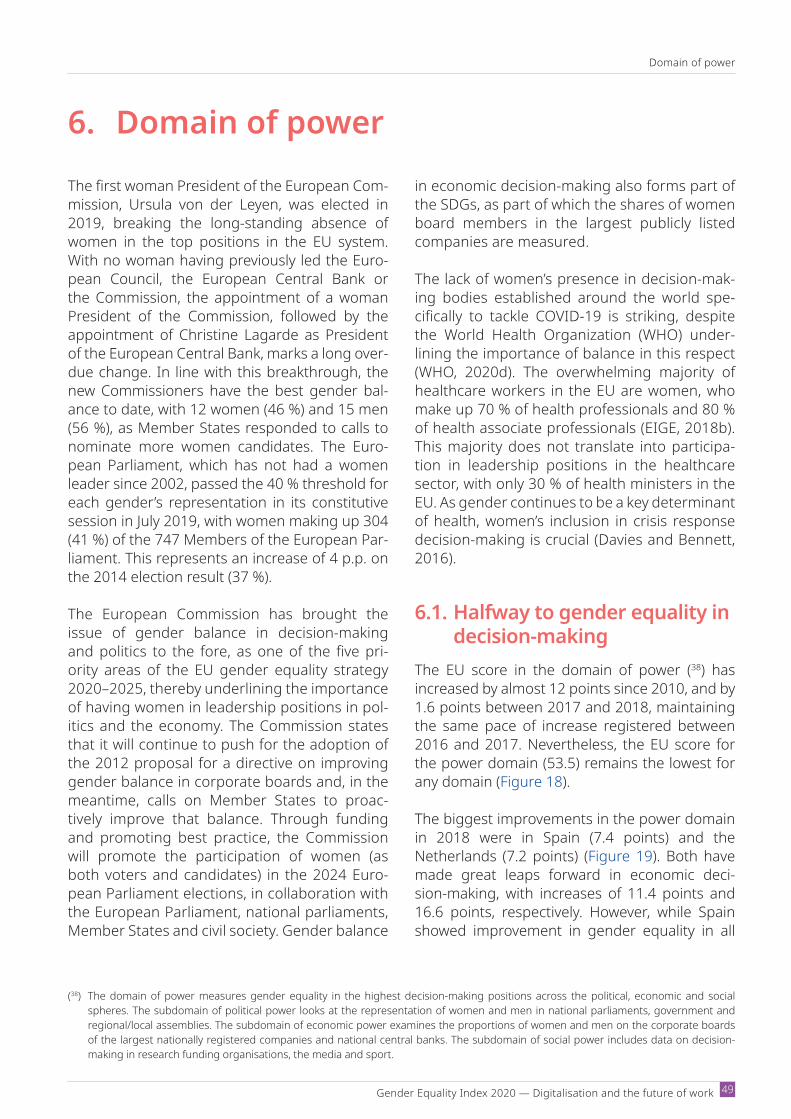
Domain of power
49Gender Equality Index 2020 — Digitalisation and the future of work
The first woman President of the European Com-mission, Ursula von der Leyen, was elected in 2019, breaking the longstanding absence of women in the top positions in the EU system. With no woman having previously led the Euro-pean Council, the European Central Bank or the Commission, the appointment of a woman President of the Commission, followed by the appointment of Christine Lagarde as President of the European Central Bank, marks a long over-due change. In line with this breakthrough, the new Commissioners have the best gender bal-ance to date, with 12 women (46 %) and 15 men (56 %), as Member States responded to calls to nominate more women candidates. The Euro-pean Parliament, which has not had a women leader since 2002, passed the 40 % threshold for each gender’s representation in its constitutive session in July 2019, with women making up 304 (41 %) of the 747 Members of the European Par-liament. This represents an increase of 4 p.p. on the 2014 election result (37 %).
The European Commission has brought the issue of gender balance in decision-making and politics to the fore, as one of the five pri-ority areas of the EU gender equality strategy 2020–2025, thereby underlining the importance of having women in leadership positions in pol-itics and the economy. The Commission states that it will continue to push for the adoption of the 2012 proposal for a directive on improving gender balance in corporate boards and, in the meantime, calls on Member States to proac-tively improve that balance. Through funding and promoting best practice, the Commission will promote the participation of women (as both voters and candidates) in the 2024 Euro-pean Parliament elections, in collaboration with the European Parliament, national parliaments, Member States and civil society. Gender balance
in economic decision-making also forms part of the SDGs, as part of which the shares of women board members in the largest publicly listed companies are measured.
The lack of women’s presence in decision-mak-ing bodies established around the world spe-cifically to tackle COVID19 is striking, despite the World Health Organization (WHO) under-lining the importance of balance in this respect (WHO, 2020d). The overwhelming majority of healthcare workers in the EU are women, who make up 70 % of health professionals and 80 % of health associate professionals (EIGE, 2018b). This majority does not translate into participa-tion in leadership positions in the healthcare sector, with only 30 % of health ministers in the EU. As gender continues to be a key determinant of health, women’s inclusion in crisis response decision-making is crucial (Davies and Bennett, 2016).
6.1. Halfway to gender equality in decision-making
The EU score in the domain of power (38) has increased by almost 12 points since 2010, and by 1.6 points between 2017 and 2018, maintaining the same pace of increase registered between 2016 and 2017. Nevertheless, the EU score for the power domain (53.5) remains the lowest for any domain (Figure 18).
The biggest improvements in the power domain in 2018 were in Spain (7.4 points) and the Netherlands (7.2 points) (Figure 19). Both have made great leaps forward in economic deci-sion-making, with increases of 11.4 points and 16.6 points, respectively. However, while Spain showed improvement in gender equality in all
6. Domain of power
(38) The domain of power measures gender equality in the highest decision-making positions across the political, economic and social spheres. The subdomain of political power looks at the representation of women and men in national parliaments, government and regional/local assemblies. The subdomain of economic power examines the proportions of women and men on the corporate boards of the largest nationally registered companies and national central banks. The subdomain of social power includes data on decision-making in research funding organisations, the media and sport.
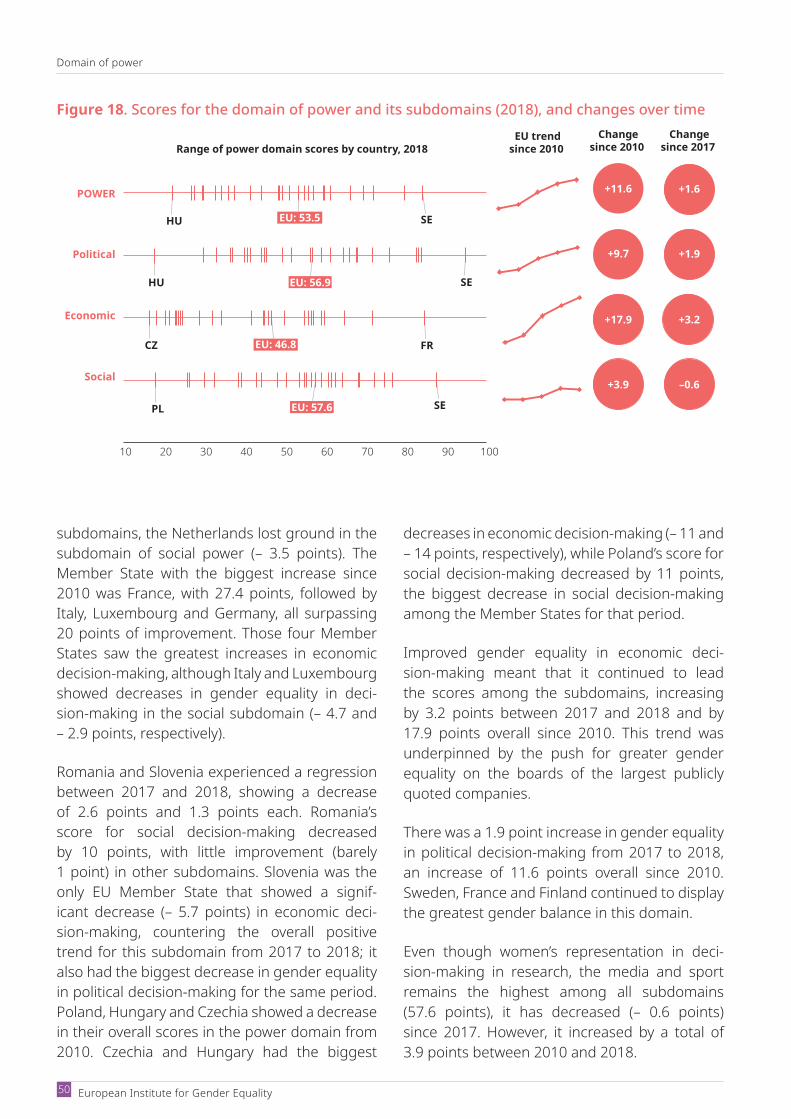
Domain of power
European Institute for Gender Equality 50
subdomains, the Netherlands lost ground in the subdomain of social power (– 3.5 points). The Member State with the biggest increase since 2010 was France, with 27.4 points, followed by Italy, Luxembourg and Germany, all surpassing 20 points of improvement. Those four Member States saw the greatest increases in economic decisionmaking, although Italy and Luxembourg showed decreases in gender equality in deci-sion-making in the social subdomain (– 4.7 and – 2.9 points, respectively).
Romania and Slovenia experienced a regression between 2017 and 2018, showing a decrease of 2.6 points and 1.3 points each. Romania’s score for social decision-making decreased by 10 points, with little improvement (barely 1 point) in other subdomains. Slovenia was the only EU Member State that showed a signif-icant decrease (– 5.7 points) in economic deci-sion-making, countering the overall positive trend for this subdomain from 2017 to 2018; it also had the biggest decrease in gender equality in political decision-making for the same period. Poland, Hungary and Czechia showed a decrease in their overall scores in the power domain from 2010. Czechia and Hungary had the biggest
decreases in economic decision-making (– 11 and – 14 points, respectively), while Poland’s score for social decision-making decreased by 11 points, the biggest decrease in social decision-making among the Member States for that period.
Improved gender equality in economic deci-sion-making meant that it continued to lead the scores among the subdomains, increasing by 3.2 points between 2017 and 2018 and by 17.9 points overall since 2010. This trend was underpinned by the push for greater gender equality on the boards of the largest publicly quoted companies.
There was a 1.9 point increase in gender equality in political decision-making from 2017 to 2018, an increase of 11.6 points overall since 2010. Sweden, France and Finland continued to display the greatest gender balance in this domain.
Even though women’s representation in deci-sion-making in research, the media and sport remains the highest among all subdomains (57.6 points), it has decreased (– 0.6 points) since 2017. However, it increased by a total of 3.9 points between 2010 and 2018.
Figure 18. Scores for the domain of power and its subdomains (2018), and changes over timeChange
since 2010 Change
since 2017
+ 11.6
EU trendsince 2010
POWER
Range of power domain scores by country, 2018
Political
Economic
Social
+17.9
+3.9
+1.6
+1.9
–0.6
EU: 53.5HU SE
EU: 56.9HU SE
EU: 46.8CZ FR
EU: 57.6PL SE
10 20 30 40 50 60 70 80 90 100
+11.6
+9.7
+3.2

Gender Equality Index 2020 — Digi talisation and the future of work
Domain of power
51
6.2. Legislative action advances gender equality in politics
The presence of women in EU national parlia-ments (both houses) has increased by 10 p.p., from 24 % in 2010 to 32 % in 2020 (39). Parlia-ments in Sweden, Finland, Belgium, Spain, Por-tugal and Austria have reached gender balance; that is, they comprise at least 40 % of each gen-der. The parliaments of Croatia, Malta and Hun-gary have less than 20 % women members.
Several parliamentary elections took place in 2019, with two big improvements in gender balance: in Finland, from 40 % in 2010 to 46 % in 2020, and in Portugal, from 30 % in 2010 to
40 % in 2020. Luxembourg improved dramati-cally recently, gaining almost 7 p.p., while prog-ress has also been made in Belgium, Greece and Spain (+ 3 p.p. each) since the beginning of 2019. There has been little change in Poland (28 %), while in Spain, the share of women dropped by 4 p.p., but the parliament nevertheless remains well balanced (42 % women). No progress has been made in Estonia.
A number of countries have undertaken ini-tiatives to improve the gender balance in their parliaments and speed up the rate of change. Legislative candidate quotas are currently in place in 10 Member States: Belgium, Ireland, Greece, Spain, France, Croatia, Italy, Poland,
Figure 19. Scores for the domain of power, and changes since 2010 and 2017, in the EU Member States
Change since 2010 Change since 2017Score for 2018
SEFRFIESDKBGUKDENLIEBESIEUPTLVITLUATHRROEELTMTPLCYSKCZELHU
84.279.871.969.466.261.560.059.557.255.855.755.053.551.149.448.848.444.241.437.536.134.132.830.029.829.627.727.022.2
0.81.55.27.41.31.63.52.97.22.40.5
-2.61.64.45.31.23.64.36.6
-1.31.51.60.60.91.62.81.62.71.6
6.427.4
2.816.8
8.215.717.621.2
0.318.6
7.813.911.616.214.623.622.815.813.0
6.714.2
1.211.9-0.614.4
0.1-3.34.7
-1.3
(39) In the domain of power, the most recent data for Women and men in decision-making is used (WMID). 2020 data refers to 1st quarter of 2020. For comparability, 2010 data also refers to 1st quarter (https://eige.europa.eu/gender-statistics/dgs)
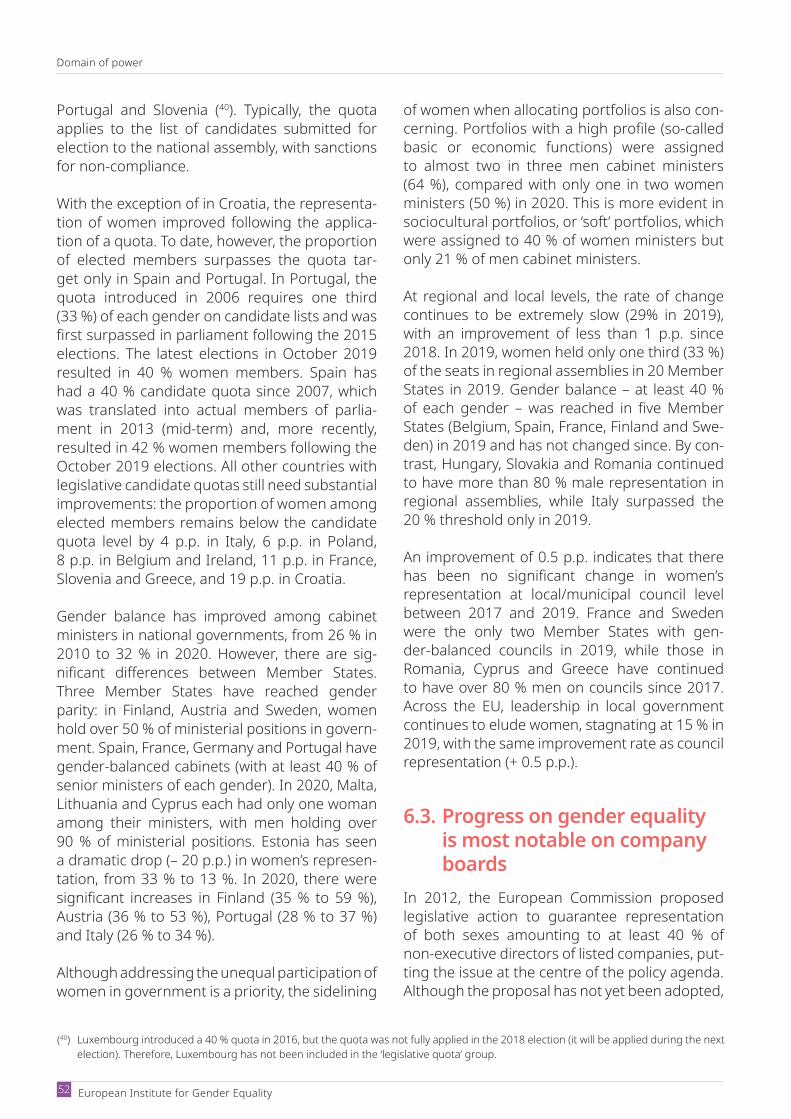
Domain of power
European Institute for Gender Equality 52
Portugal and Slovenia (40). Typically, the quota applies to the list of candidates submitted for election to the national assembly, with sanctions for non-compliance.
With the exception of in Croatia, the representa-tion of women improved following the applica-tion of a quota. To date, however, the proportion of elected members surpasses the quota tar-get only in Spain and Portugal. In Portugal, the quota introduced in 2006 requires one third (33 %) of each gender on candidate lists and was first surpassed in parliament following the 2015 elections. The latest elections in October 2019 resulted in 40 % women members. Spain has had a 40 % candidate quota since 2007, which was translated into actual members of parlia-ment in 2013 (mid-term) and, more recently, resulted in 42 % women members following the October 2019 elections. All other countries with legislative candidate quotas still need substantial improvements: the proportion of women among elected members remains below the candidate quota level by 4 p.p. in Italy, 6 p.p. in Poland, 8 p.p. in Belgium and Ireland, 11 p.p. in France, Slovenia and Greece, and 19 p.p. in Croatia.
Gender balance has improved among cabinet ministers in national governments, from 26 % in 2010 to 32 % in 2020. However, there are sig-nificant differences between Member States. Three Member States have reached gender parity: in Finland, Austria and Sweden, women hold over 50 % of ministerial positions in govern-ment. Spain, France, Germany and Portugal have gender-balanced cabinets (with at least 40 % of senior ministers of each gender). In 2020, Malta, Lithuania and Cyprus each had only one woman among their ministers, with men holding over 90 % of ministerial positions. Estonia has seen a dramatic drop (– 20 p.p.) in women’s represen-tation, from 33 % to 13 %. In 2020, there were significant increases in Finland (35 % to 59 %), Austria (36 % to 53 %), Portugal (28 % to 37 %) and Italy (26 % to 34 %).
Although addressing the unequal participation of women in government is a priority, the sidelining
of women when allocating portfolios is also con-cerning. Portfolios with a high profile (socalled basic or economic functions) were assigned to almost two in three men cabinet ministers (64 %), compared with only one in two women ministers (50 %) in 2020. This is more evident in sociocultural portfolios, or ‘soft’ portfolios, which were assigned to 40 % of women ministers but only 21 % of men cabinet ministers.
At regional and local levels, the rate of change continues to be extremely slow (29% in 2019), with an improvement of less than 1 p.p. since 2018. In 2019, women held only one third (33 %) of the seats in regional assemblies in 20 Member States in 2019. Gender balance – at least 40 % of each gender – was reached in five Member States (Belgium, Spain, France, Finland and Swe-den) in 2019 and has not changed since. By con-trast, Hungary, Slovakia and Romania continued to have more than 80 % male representation in regional assemblies, while Italy surpassed the 20 % threshold only in 2019.
An improvement of 0.5 p.p. indicates that there has been no significant change in women’s representation at local/municipal council level between 2017 and 2019. France and Sweden were the only two Member States with gen-derbalanced councils in 2019, while those in Romania, Cyprus and Greece have continued to have over 80 % men on councils since 2017. Across the EU, leadership in local government continues to elude women, stagnating at 15 % in 2019, with the same improvement rate as council representation (+ 0.5 p.p.).
6.3. Progress on gender equality is most notable on company boards
In 2012, the European Commission proposed legislative action to guarantee representation of both sexes amounting to at least 40 % of nonexecutive directors of listed companies, put-ting the issue at the centre of the policy agenda. Although the proposal has not yet been adopted,
(40) Luxembourg introduced a 40 % quota in 2016, but the quota was not fully applied in the 2018 election (it will be applied during the next election). Therefore, Luxembourg has not been included in the ‘legislative quota’ group.
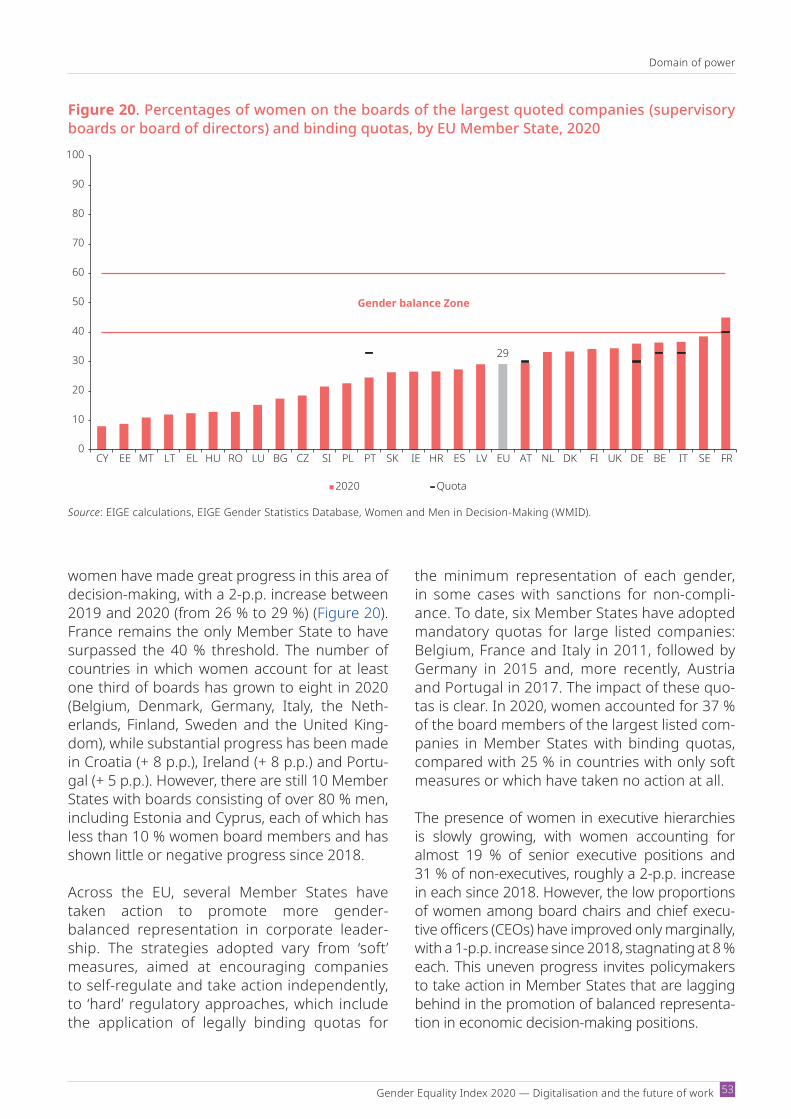
Gender Equality Index 2020 — Digi talisation and the future of work
Domain of power
53
women have made great progress in this area of decision-making, with a 2-p.p. increase between 2019 and 2020 (from 26 % to 29 %) (Figure 20). France remains the only Member State to have surpassed the 40 % threshold. The number of countries in which women account for at least one third of boards has grown to eight in 2020 (Belgium, Denmark, Germany, Italy, the Neth-erlands, Finland, Sweden and the United King-dom), while substantial progress has been made in Croatia (+ 8 p.p.), Ireland (+ 8 p.p.) and Portu-gal (+ 5 p.p.). However, there are still 10 Member States with boards consisting of over 80 % men, including Estonia and Cyprus, each of which has less than 10 % women board members and has shown little or negative progress since 2018.
Across the EU, several Member States have taken action to promote more gender- balanced representation in corporate leader-ship. The strategies adopted vary from ‘soft’ measures, aimed at encouraging companies to self-regulate and take action independently, to ‘hard’ regulatory approaches, which include the application of legally binding quotas for
the minimum representation of each gender, in some cases with sanctions for non-compli-ance. To date, six Member States have adopted mandatory quotas for large listed companies: Belgium, France and Italy in 2011, followed by Germany in 2015 and, more recently, Austria and Portugal in 2017. The impact of these quo-tas is clear. In 2020, women accounted for 37 % of the board members of the largest listed com-panies in Member States with binding quotas, compared with 25 % in countries with only soft measures or which have taken no action at all.
The presence of women in executive hierarchies is slowly growing, with women accounting for almost 19 % of senior executive positions and 31 % of nonexecutives, roughly a 2p.p. increase in each since 2018. However, the low proportions of women among board chairs and chief execu-tive officers (CEOs) have improved only marginally, with a 1-p.p. increase since 2018, stagnating at 8 % each. This uneven progress invites policymakers to take action in Member States that are lagging behind in the promotion of balanced representa-tion in economic decision-making positions.
Figure 20. Percentages of women on the boards of the largest quoted companies (supervisory boards or board of directors) and binding quotas, by EU Member State, 2020
0
10
20
30
40
50
60
70
80
90
100
CY EE MT LT EL HU RO LU BG CZ SI PL PT SK IE HR ES LV EU AT NL DK FI UK DE BE IT SE FR
2020 Quota
Gender balance Zone
29
Source: EIGE calculations, EIGE Gender Statistics Database, Women and Men in DecisionMaking (WMID).
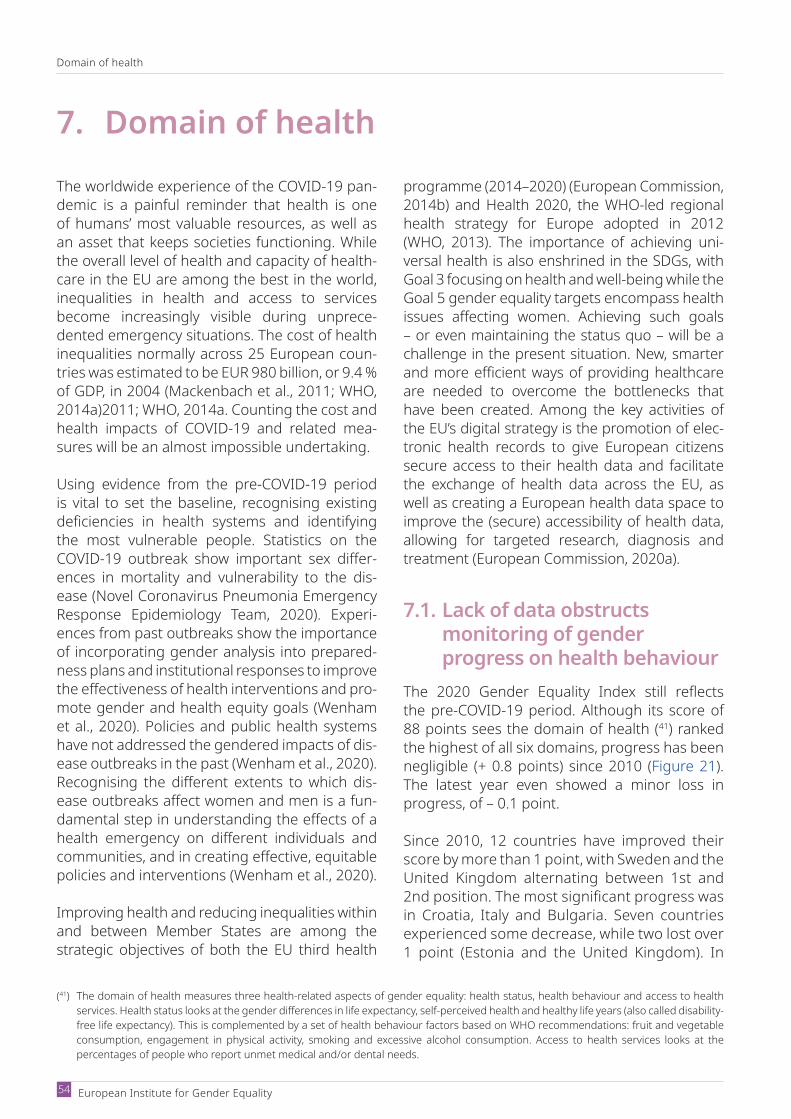
Domain of health
54 European Institute for Gender Equality
The worldwide experience of the COVID19 pan-demic is a painful reminder that health is one of humans’ most valuable resources, as well as an asset that keeps societies functioning. While the overall level of health and capacity of health-care in the EU are among the best in the world, inequalities in health and access to services become increasingly visible during unprece-dented emergency situations. The cost of health inequalities normally across 25 European coun-tries was estimated to be EUR 980 billion, or 9.4 % of GDP, in 2004 (Mackenbach et al., 2011; WHO, 2014a)2011; WHO, 2014a. Counting the cost and health impacts of COVID19 and related mea-sures will be an almost impossible undertaking.
Using evidence from the preCOVID19 period is vital to set the baseline, recognising existing deficiencies in health systems and identifying the most vulnerable people. Statistics on the COVID19 outbreak show important sex differ-ences in mortality and vulnerability to the dis-ease (Novel Coronavirus Pneumonia Emergency Response Epidemiology Team, 2020). Experi-ences from past outbreaks show the importance of incorporating gender analysis into prepared-ness plans and institutional responses to improve the effectiveness of health interventions and pro-mote gender and health equity goals (Wenham et al., 2020). Policies and public health systems have not addressed the gendered impacts of dis-ease outbreaks in the past (Wenham et al., 2020). Recognising the different extents to which dis-ease outbreaks affect women and men is a fun-damental step in understanding the effects of a health emergency on different individuals and communities, and in creating effective, equitable policies and interventions (Wenham et al., 2020).
Improving health and reducing inequalities within and between Member States are among the strategic objectives of both the EU third health
programme (2014–2020) (European Commission, 2014b) and Health 2020, the WHOled regional health strategy for Europe adopted in 2012 (WHO, 2013). The importance of achieving uni-versal health is also enshrined in the SDGs, with Goal 3 focusing on health and well-being while the Goal 5 gender equality targets encompass health issues affecting women. Achieving such goals – or even maintaining the status quo – will be a challenge in the present situation. New, smarter and more efficient ways of providing healthcare are needed to overcome the bottlenecks that have been created. Among the key activities of the EU’s digital strategy is the promotion of elec-tronic health records to give European citizens secure access to their health data and facilitate the exchange of health data across the EU, as well as creating a European health data space to improve the (secure) accessibility of health data, allowing for targeted research, diagnosis and treatment (European Commission, 2020a).
7.1. Lack of data obstructs monitoring of gender progress on health behaviour
The 2020 Gender Equality Index still reflects the preCOVID19 period. Although its score of 88 points sees the domain of health (41) ranked the highest of all six domains, progress has been negligible (+ 0.8 points) since 2010 (Figure 21). The latest year even showed a minor loss in progress, of – 0.1 point.
Since 2010, 12 countries have improved their score by more than 1 point, with Sweden and the United Kingdom alternating between 1st and 2nd position. The most significant progress was in Croatia, Italy and Bulgaria. Seven countries experienced some decrease, while two lost over 1 point (Estonia and the United Kingdom). In
7. Domain of health
(41) The domain of health measures three health-related aspects of gender equality: health status, health behaviour and access to health services. Health status looks at the gender differences in life expectancy, selfperceived health and healthy life years (also called disabilityfree life expectancy). This is complemented by a set of health behaviour factors based on WHO recommendations: fruit and vegetable consumption, engagement in physical activity, smoking and excessive alcohol consumption. Access to health services looks at the percentages of people who report unmet medical and/or dental needs.
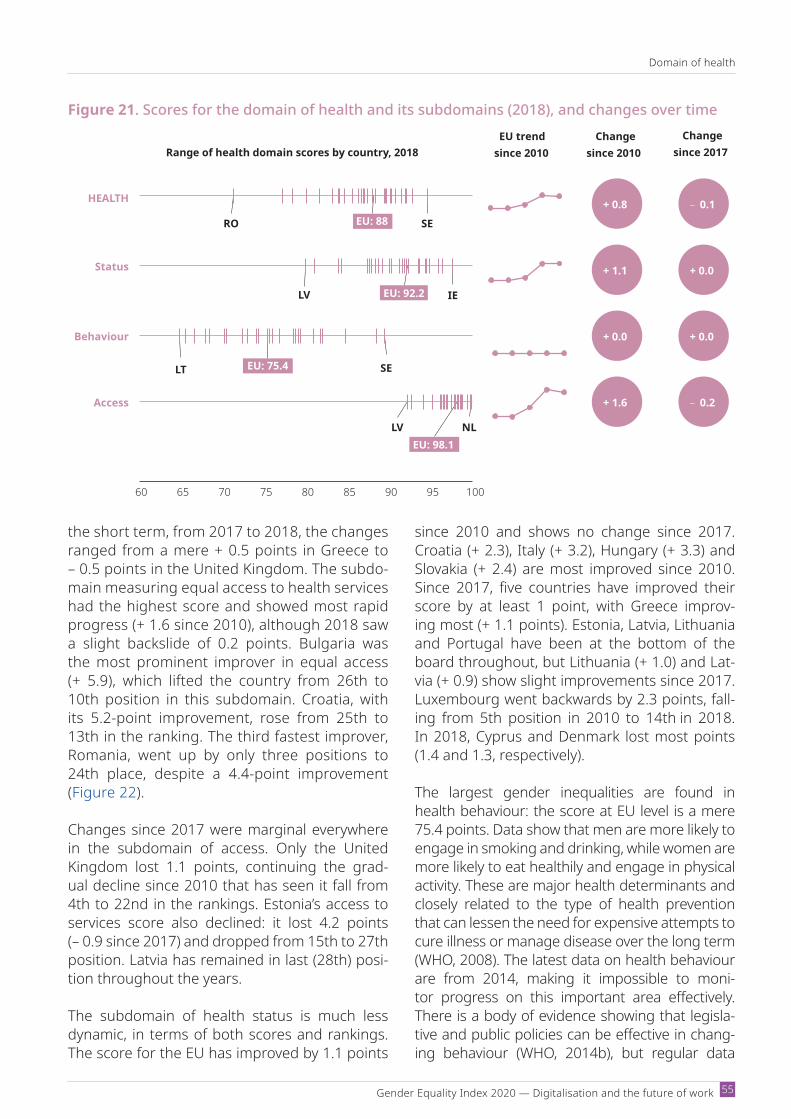
Gender Equality Index 2020 — Digi talisation and the future of work
Domain of health
55
the short term, from 2017 to 2018, the changes ranged from a mere + 0.5 points in Greece to – 0.5 points in the United Kingdom. The subdo-main measuring equal access to health services had the highest score and showed most rapid progress (+ 1.6 since 2010), although 2018 saw a slight backslide of 0.2 points. Bulgaria was the most prominent improver in equal access (+ 5.9), which lifted the country from 26th to 10th position in this subdomain. Croatia, with its 5.2-point improvement, rose from 25th to 13th in the ranking. The third fastest improver, Romania, went up by only three positions to 24th place, despite a 4.4-point improvement (Figure 22).
Changes since 2017 were marginal everywhere in the subdomain of access. Only the United Kingdom lost 1.1 points, continuing the grad-ual decline since 2010 that has seen it fall from 4th to 22nd in the rankings. Estonia’s access to services score also declined: it lost 4.2 points (– 0.9 since 2017) and dropped from 15th to 27th position. Latvia has remained in last (28th) posi-tion throughout the years.
The subdomain of health status is much less dynamic, in terms of both scores and rankings. The score for the EU has improved by 1.1 points
since 2010 and shows no change since 2017. Croatia (+ 2.3), Italy (+ 3.2), Hungary (+ 3.3) and Slovakia (+ 2.4) are most improved since 2010. Since 2017, five countries have improved their score by at least 1 point, with Greece improv-ing most (+ 1.1 points). Estonia, Latvia, Lithuania and Portugal have been at the bottom of the board throughout, but Lithuania (+ 1.0) and Lat-via (+ 0.9) show slight improvements since 2017. Luxembourg went backwards by 2.3 points, fall-ing from 5th position in 2010 to 14th in 2018. In 2018, Cyprus and Denmark lost most points (1.4 and 1.3, respectively).
The largest gender inequalities are found in health behaviour: the score at EU level is a mere 75.4 points. Data show that men are more likely to engage in smoking and drinking, while women are more likely to eat healthily and engage in physical activity. These are major health determinants and closely related to the type of health prevention that can lessen the need for expensive attempts to cure illness or manage disease over the long term (WHO, 2008). The latest data on health behaviour are from 2014, making it impossible to moni-tor progress on this important area effectively. There is a body of evidence showing that legisla-tive and public policies can be effective in chang-ing behaviour (WHO, 2014b), but regular data
Figure 21. Scores for the domain of health and its subdomains (2018), and changes over timeChange
since 2010Change
since 2017
+ 0.8 – 0.1
EU trend since 2010
HEALTH
EU: 88RO SE
60 65 70 75 80 85 90 95 100
Range of health domain scores by country, 2018
+ 0.0 + 0.0Behaviour
EU: 75.4LT SE
+ 1.6 – 0.2
EU: 98.1LV NL
Access
Status
EU: 92.2 IELV
+ 1.1 + 0.0
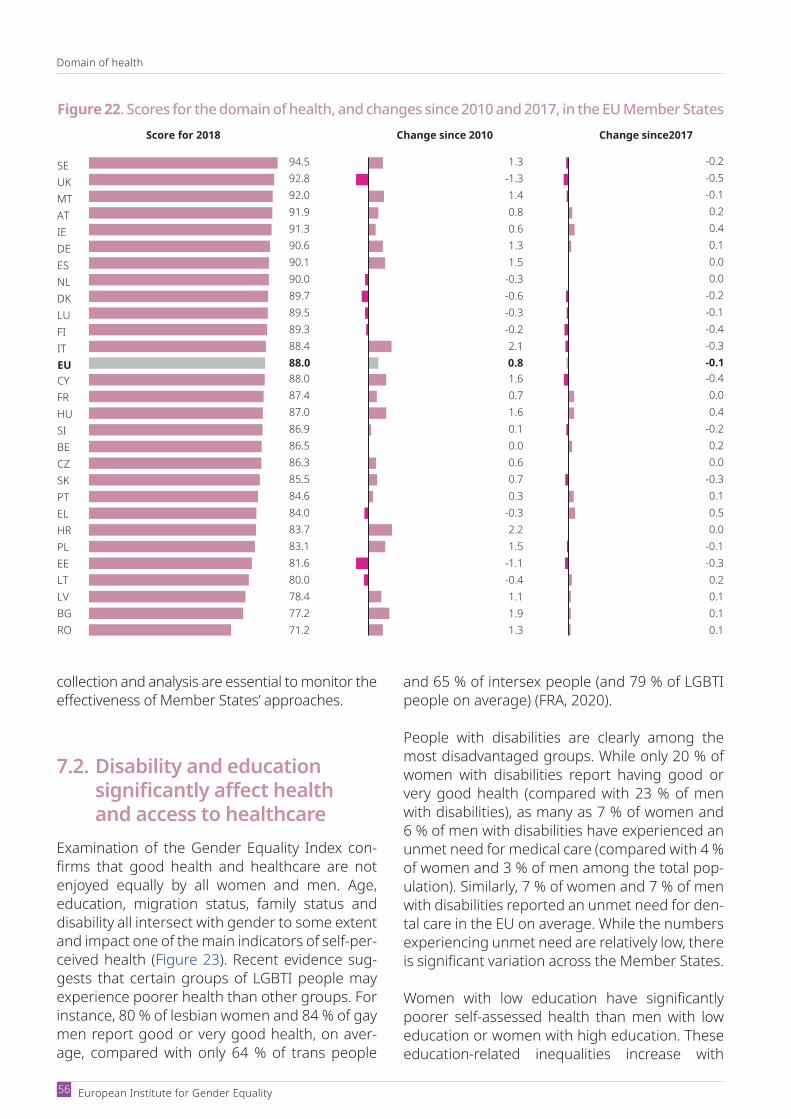
Domain of health
European Institute for Gender Equality 56
collection and analysis are essential to monitor the effectiveness of Member States’ approaches.
7.2. Disability and education significantly affect health and access to healthcare
Examination of the Gender Equality Index con-firms that good health and healthcare are not enjoyed equally by all women and men. Age, education, migration status, family status and disability all intersect with gender to some extent and impact one of the main indicators of self-per-ceived health (Figure 23). Recent evidence sug-gests that certain groups of LGBTI people may experience poorer health than other groups. For instance, 80 % of lesbian women and 84 % of gay men report good or very good health, on aver-age, compared with only 64 % of trans people
and 65 % of intersex people (and 79 % of LGBTI people on average) (FRA, 2020).
People with disabilities are clearly among the most disadvantaged groups. While only 20 % of women with disabilities report having good or very good health (compared with 23 % of men with disabilities), as many as 7 % of women and 6 % of men with disabilities have experienced an unmet need for medical care (compared with 4 % of women and 3 % of men among the total pop-ulation). Similarly, 7 % of women and 7 % of men with disabilities reported an unmet need for den-tal care in the EU on average. While the numbers experiencing unmet need are relatively low, there is significant variation across the Member States.
Women with low education have significantly poorer self-assessed health than men with low education or women with high education. These education-related inequalities increase with
Figure 22. Scores for the domain of health, and changes since 2010 and 2017, in the EU Member States
SE 94.5
UK 92.8
MT 92.0
AT 91.9
IE 91.3
DE 90.6
ES 90.1
NL 90.0
DK 89.7
LU 89.5
FI 89.3
IT 88.4
EU 88.0CY 88.0FR 87.4HU 87.0SI 86.9BE 86.5CZ 86.3SK 85.5PT 84.6EL 84.0HR 83.7PL 83.1EE 81.6LT 80.0LV 78.4BG 77.2RO 71.2
-0.2-0.5-0.10.20.40.10.00.0
-0.2-0.1-0.4-0.3-0.1-0.40.00.4
-0.20.20.0
-0.30.10.50.0
-0.1-0.30.20.10.10.1
1.3-1.31.40.80.61.31.5
-0.3-0.6-0.3-0.22.10.81.60.71.60.10.00.60.70.3
-0.32.21.5
-1.1-0.41.11.91.3
Score for 2018 Change since 2010 Change since2017
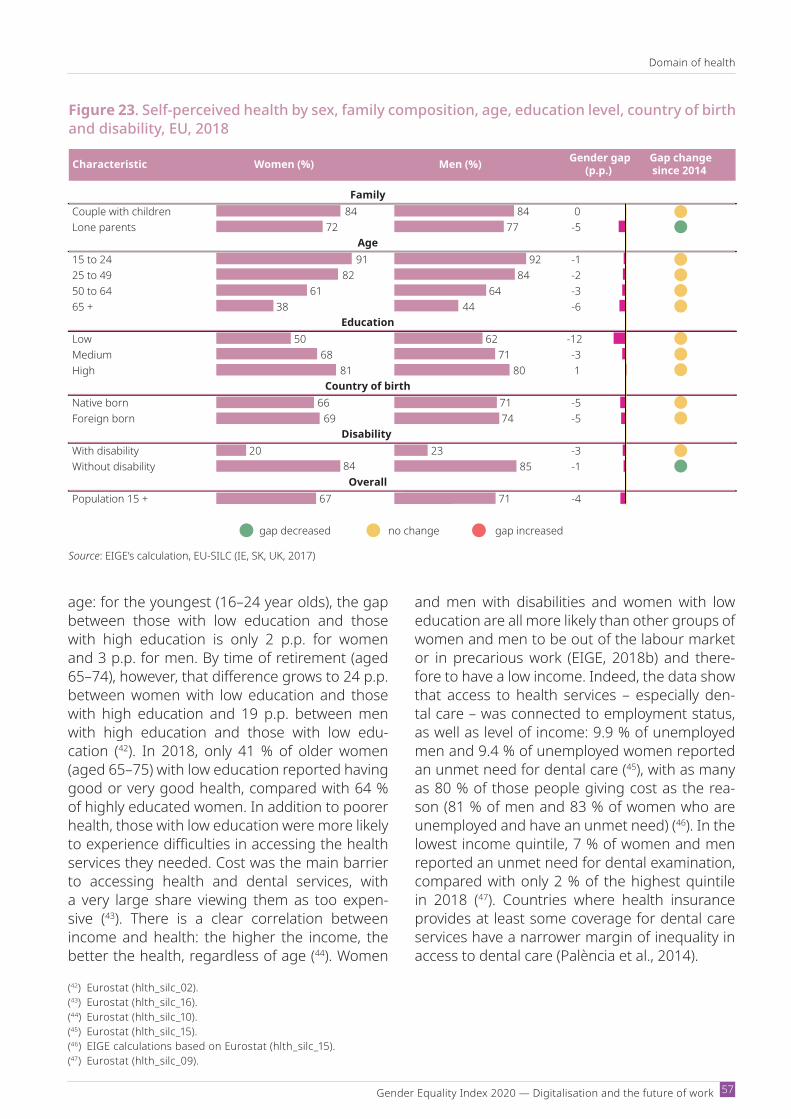
Gender Equality Index 2020 — Digi talisation and the future of work
Domain of health
57
age: for the youngest (16–24 year olds), the gap between those with low education and those with high education is only 2 p.p. for women and 3 p.p. for men. By time of retirement (aged 65–74), however, that difference grows to 24 p.p. between women with low education and those with high education and 19 p.p. between men with high education and those with low edu-cation (42). In 2018, only 41 % of older women (aged 65–75) with low education reported having good or very good health, compared with 64 % of highly educated women. In addition to poorer health, those with low education were more likely to experience difficulties in accessing the health services they needed. Cost was the main barrier to accessing health and dental services, with a very large share viewing them as too expen-sive (43). There is a clear correlation between income and health: the higher the income, the better the health, regardless of age (44). Women
and men with disabilities and women with low education are all more likely than other groups of women and men to be out of the labour market or in precarious work (EIGE, 2018b) and there-fore to have a low income. Indeed, the data show that access to health services – especially den-tal care – was connected to employment status, as well as level of income: 9.9 % of unemployed men and 9.4 % of unemployed women reported an unmet need for dental care (45), with as many as 80 % of those people giving cost as the rea-son (81 % of men and 83 % of women who are unemployed and have an unmet need) (46). In the lowest income quintile, 7 % of women and men reported an unmet need for dental examination, compared with only 2 % of the highest quintile in 2018 (47). Countries where health insurance provides at least some coverage for dental care services have a narrower margin of inequality in access to dental care (Palència et al., 2014).
Figure 23. Self-perceived health by sex, family composition, age, education level, country of birth and disability, EU, 2018
Characteristic Women (%) Men (%) Gender gap(p.p.)
Gap changesince 2014
Couple with childrenLone parents -5
15 to 24 -125 to 49 -250 to 64 -365 + -6
Low -12Medium -3High 1
Native born -5Foreign born -5
With disability -3Without disability -1
Population 15 +
84 8472 77
91 9282 84
61 6438 44
50 6268 71
81 80
66 7169 74
20 2384 85
67 71 -4Overall
Family
Age
Education
Country of birth
Disability
no change gap increasedgap decreased
0
Source: EIGE’s calculation, EUSILC (IE, SK, UK, 2017)
(42) Eurostat (hlth_silc_02).(43) Eurostat (hlth_silc_16).(44) Eurostat (hlth_silc_10).(45) Eurostat (hlth_silc_15).(46) EIGE calculations based on Eurostat (hlth_silc_15).(47) Eurostat (hlth_silc_09).
Domain of health
European Institute for Gender Equality 58
The data highlight how different inequali-ties accumulate: poor health, low educational achievement, inactivity or unemployment, and low income go hand in hand, resulting in a situa-tion where healthcare services are least accessi-ble to those who are most in need. This, in turn, can have further detrimental consequences for health. Gender differences in ill health are often due to differences in employment status, as employment is one of the main predictors of bet-ter health (Lahelma et al., 2001). Poor work and employment conditions – which are often con-centrated among populations in vulnerable situ-ations – can widen inequalities in health (Forster et al., 2018). Overall, health and access to health services are connected to ‘social status’, which can be measured by level of education, occupa-tion or income level (Forster et al., 2018).
The economic crisis and the strain on the health services created by the COVID19 pandemic highlight the need to strengthen social and health protections for unemployed people and those with low incomes. Women with low edu-cation and women with disabilities fall into these categories particularly often and are thus at greater risk of remaining without proper health-care, even while being among those most likely to suffer from poor health. The 2008 recession made access to medical care more difficult, as a result of unemployment and financial hardship (Madureira-Lima et al., 2018).
7.3. Unprecedented impact of COVID-19 calls for gender-sensitive policies and research
The COVID19 pandemic has challenged health systems and affected the health and lives of innumerable people, both directly and indi-rectly. Although gender-disaggregated data are not provided by all countries, data suggest that infected men are more likely to die from COVID19 than infected women (BMJ Global Health, 2020). A similar trend was seen in the SARS outbreak in 2003 ( Jin et al., 2020). Gender disparities may be rooted in biological differences (e.g. genetic and immunological differences, gender differences in preexisting health problems), behavioural risk
factors (e.g. a history of smoking), working con-ditions and other social factors (Gebhard et al., 2020). For example, women participate less in the labour market, but they work as front-line providers of healthcare and social care. A study of eight countries found that women are more likely to see COVID19 as a very serious health problem, to agree with restrictive public policy measures adopted in response to it and to com-ply with them (Galasso et al., 2020).
The number of victims extends beyond the count of those who have died from COVID19, with the unprecedented increase in deaths exceeding the recorded numbers of directly COVIDlinked deaths. This may be because health systems have become overwhelmed and people have not received the help they need (Wu et al., 2020) and because people have not sought help because of a fear of leaving home (Roxby, 2020). The sit-uation is most grave for those with preexisting physical or mental health conditions.
The impact of the COVID19 pandemic and the policy responses of closing infrastructure (includ-ing health facilities) and social distancing may have a more far-reaching impact. The grief of losing people to COVID19, the fear of infection, unpredictability, work–life balance struggles due to closures of schools and kindergartens, the stress of job and income loss, and the loneliness and isolation caused by social distancing, stigma and discrimination are likely to generate sig-nificant stress, anxiety and thus related mental health issues. For instance, a study found that the number of calls to a German helpline increased significantly during the pandemic owing to increased loneliness, anxiety and suicidal ide-ation (Armbruster and Klotzbücher, 2020).
The gender differences in mental shealth are well established and it is likely that the pandemic and resulting economic crisis will only exacer-bate these differences. For instance, job loss is a major stressor for men. Studies have shown that during periods of high unemployment during the financial crisis suicide rates in men significantly increased – particularly among those of working age and the unemployed – while suicide rates among women were largely unaffected (Parmar et al., 2016). However, women’s struggle with work–life balance may have been aggravated by
Gender Equality Index 2020 — Digi talisation and the future of work
Domain of health
59
the unbalanced division of care responsibilities within the family. Living in lockdown may fos-ter unhealthy lifestyles, substance abuse, lack of physical exercise and unhealthy eating hab-its. The subdomain of health behaviour shows that these behaviours are more common in men than women, although lockdown and the result-ing economic crisis may increase unhealthy behaviour among both women and men.
Social isolation over long periods of time can increase the risk of a variety of negative health outcomes, including heart disease, depression, dementia and even death (Miller, 2020). It has been shown to be comparable to well-estab-lished risk factors for mortality, such as smoking and alcohol consumption, and worse than phys-ical inactivity and obesity (Holt-Lunstad et al., 2010). There is added stress for older adults and people with certain health conditions, who are at particular risk and who may also be cut off from care by physical distancing. Women, particularly older women, are more likely to live alone than men (EIGE, 2020e). Women may be at risk of exposure as a result of occupational gender seg-regation: globally, women make up 70 % of the health workforce and are more likely to be front-line health workers, especially nurses, midwives and community health workers (WHO, 2018).
In its mental health guidance, WHO specifically targets healthcare workers, health facility man-agers, childcare providers, older adults, care pro-viders, people with underlying health conditions, and those living in isolation to try and contain the spread of the pandemic (WHO, 2020c). Children’s mental health also needs special attention, with children affected by the changing situation, isola-tion and general anxiety levels in the home, par-ticularly in tense/violent households. Of young people with a history of mental illness in the United Kingdom, 83 % said that the COVID19 pandemic had made their condition worse and 26 % said that they were unable to access mental health support. Peer support groups and face-to-face services have been cancelled, and sup-port by phone or online can be challenging for some young people (YoungMinds, 2020).
The total costs of mental ill health are estimated to amount to more than 4 % of GDP across EU Member States (over EUR 600 billion per year) (48) (OECDEU, 2018). A considerable number of chil-dren experience mental health problems, with many such issues beginning in adolescence or even younger (OECDEU, 2018). Mental health issues are among the health conditions with the highest burden of disease for young children and young people, particularly adolescent girls (Baranne and Falissard, 2018). Children who have been isolated or quarantined during pandemic outbreaks have been found to be more likely to develop acute stress disorders, adjustment disorders and grief disorders (Sprang and Silman, 2013).
Only 1 % of all academic research on previous outbreaks of Zika and Ebola explored the gen-dered impact of those outbreaks (Criado Perez, 2019) (49). The COVID19 outbreak has seen quite numerous publications on gender impli-cations, but WHO points out that there is lim-ited availability of sex and agedisaggregated data, which hampers analysis of the gendered implications of COVID19 and the development of appropriate responses (WHO, 2020b). The biological differences between women and men need to be considered in clinical testing of vaccines and drug treatments for COVID19, including the special situation of pregnancy. Sufficient and timely research on mechanisms of spreading the virus is needed to advise preg-nant and breastfeeding women. Health pan-demics can make it more difficult for women and girls to access sexual and reproductive health services, as a result of the reallocation of resources and priorities (UN Women, 2020; WHO, 2020b). Those with specific conditions (e.g. autism) may be particularly at risk, as they may not be able to tolerate disruption to their daily routines (Lee, 2020).
A more in-depth analysis of gender inequalities in health will be reported on in 2021, when health will be the thematic focus of the Gender Equality Index. That Index will also focus on important top-ics such as mental health, reproductive and sexual health, and the gendered impacts of pandemics.
(48) A large part of these costs arises from lower employment rates and productivity of people with mental health issues but also from spending on social security programmes and direct spending on healthcare.
(49) In her book Invisible Women: Exposing data bias in a world designed for men, Criado Perez (2019) notes that 29 million papers were published in more than 15 000 peerreviewed titles around the time of the Zika and Ebola epidemics, but less than 1 % explored the gendered impact of the outbreaks.
Domain of violence
60 European Institute for Gender Equality
The domain of violence provides a set of indica-tors that can help the EU and its Member States to monitor the extent of the most common and documented forms of violence against women. Unlike the other domains, the domain of vio-lence does not measure differences between women and men; rather, it examines women’s experiences of violence. The main objective is to eliminate violence against women, not to reduce gaps.
EIGE developed a three-tier structure of mea-surement to provide the most complete and reli-able picture of violence against women in the EU.
1. A composite measure combines indicators on the extent of violence against women. The composite measure does not affect the final score of the Gender Equality Index. However, violence against women must be considered alongside the other domains, as it mirrors the rest of the enduring inequalities captured by the Index. In 2017, the EU composite measure score was 27.5 (EIGE, 2017d). This measure
is calculated on a scale from 1 to 100, where the highest score indicates the highest prev-alence of violence against women. The lat-est calculation of the composite measure score relied on data from a 2014 FRA survey (FRA, 2014b). Until the completion of the next EU-wide survey on violence against women, led by Eurostat (50), scores for this domain can-not be updated.
2. Additional indicators cover the broader range of forms of violence against women described in the Istanbul Convention (Coun-cil of Europe, 2011). These indicators may be included in the calculation of the single score if more reliable and comparable data becomes available. They includes EIGE’s indicators on administrative data (EIGE, 2018a).
3. Contextual factors include some of the root causes of violence against women. Designed to monitor Member State compliance with the obligations set out in the Istanbul Con-vention, they cover six dimensions: policies,
Violence against women surged during the COVID-19 pandemic
The COVID19 pandemic that hit the EU in early 2020 has had substantial health and economic implications, including for gender-based violence. The lockdowns imposed across all Member States heightened the threat to women victims of violence. According to WHO, violence against women increases during every type of emergency, including pandemics (WHO, 2020a). In France, for example, during the first 3 weeks of lockdown, the number of registered cases of domestic violence increased by over 30 % (Euronews, 2020). Lockdown exacerbated the risk of domestic abuse by forcing women to remain at home for a prolonged period of time, while constant expo-sure to their abuser made it very difficult to contact helplines or other sources of help. It has also weakened women’s ability to leave abusive partners after the crisis, owing to the ensuing finan-cial insecurity (EIGE, 2020d). Several countries adopted ad hoc measures to facilitate reporting of cases of violence in pharmacies, establishing a code system for women to signal that they were in danger, and arranged hotel accommodation to enable at-risk women to self-isolate in safety (Talmazan et al., 2020). Italy developed a smartphone app that allowed situations of abuse to be reported directly to the police without making a phone call (Ferrari, 2020).
(50) The data collection is planned to take place between 2020 and 2022.
8. Domain of violence

Gender Equality Index 2020 — Digi talisation and the future of work
Domain of violence
61
prevention, protection and support, substan-tive legislation, involvement of law enforce-ment agencies, and societal framework.
8.1. Collecting data on violence presents long-standing challenges
Across the three levels that comprise the domain of violence’s measurement framework, recent data is available only for femicide. This form of violence is commonly understood as ‘the kill-ing of a woman in the context of intimate part-ner violence’ (EIGE, 2017a, p. 4), but there is no legal definition of femicide as a criminal offence, either at EU or Member State level (Schröttle and Meshkova, 2018). This implies that capturing the current situation requires a proxy (albeit one that is unable to account for the motive of the killing): the number of female victims of inten-tional homicide killed by an intimate partner or family member (EIGE, 2018c). In 2017, Eurostat recorded 854 women victims of homicide by a family member or intimate partner (51). The
country with the highest rate of femicide (calcu-lated per 100 000 women) was Latvia, while the lowest rate was recorded in Greece (Figure 24). These figures should be read in the light of the fact that Eurostat data is based on harmonised national police statistics, which can differ in their methods of collection and aggregation (Corradi et al., 2018). Another caveat to consider is the fact that violence against women is universally underreported; therefore, the data is unable to capture the ‘grey zone’ resulting from the differ-ence between actual prevalence and disclosed violence (EIGE, 2016; Walklate et al., 2019).
For the other forms of violence, no new data has become available since the publication of the Gender Equality Index 2019, except for some new insights into trafficking in human beings. Data presented by the Council of Europe in its latest general report on the activity of the Group of Experts on Action against Trafficking in Human Beings revealed that in the EU the number of identified victims of trafficking rose from 9 510 in 2015 to 14 363 in 2018: an increase of 51 %. The numbers are not directly comparable between
Figure 24. Women victims of intentional homicide by an intimate partner or family member (per 100 000 female population), 2017
0.0
0.2
0.4
0.6
0.8
1.0
1.2
1.4
LV HU HR FI LT SI DE RO FR CZ UK NL ES IT SK EL
Family member Intimate partner
Source: Eurostat, 2019 (crim_hom_vrel).NB: Data related to the number of women victims of intentional homicide by family or relatives in 2017 is not available for Northern Ireland, Romania, Italy and Greece. Slovakia recorded zero women killed by family members in 2017.
(51) Data is available for 16 Member States, as well as England and Wales, Scotland, and Northern Ireland.
Domain of violence
European Institute for Gender Equality 62
countries, because of different collection and registration methods and difficulties in the pro-cess of identifying victims, and nor are they disag-gregated by gender. The Council of Europe also highlighted that these data presents an under-estimation of the problem (the hidden nature of which makes it extremely hard to measure).
8.2. Gender-based violence intersects with multiple axes of oppression
Minority groups face different kinds of discrim-inations in Europe. The intersection between belonging to a minority group and identifying as a woman creates a particularly vulnerable con-dition that poses several threats to physical and psychological integrity. For example, extensive research shows that Muslim women are dispro-portionately affected by Islamophobic attacks across Europe, as wearing a headscarf makes their religious affiliation easily recognisable (Abdelkader, 2017; Mahr and Nadeem, 2019; Seta, 2016). Attacks on these women – usually perpetrated by unknown white men – are moti-vated by a combination of Islamophobia and sex-ism (Seta, 2016).
Older women are disproportionately exposed to the risk of abuse, compared with older men (Saripapa, 2019). Gender is a risk factor for vic-tims of elderly abuse not only because women have a longer life expectancy and are overrep-resented among people in need of long-term care (EIGE, 2020e) but also because gendered power dynamics are exacerbated by oldage physical and economic fragility (Van Bavel et al., 2010). In December 2019, Women Against Vio-lence Europe (WAVE) launched its Multi-Agency Responses to Violence against Older Women project to develop provision of support to elderly survivors of violence. Later life stages reflect the accumulation of a lifetime of inequality, economic
dependence, violence and abuse, which makes older women particularly vulnerable, including to femicide (Brennan et al., 2017). This is especially true for those in need of long-term care and medical assistance (WAVE, 2019).
Disability, too, substantially increases women’s vulnerability to violence (EIGE, 2020a). Like older women, women with disabilities are more likely to be in some way dependent on their abuser, which prevents them from accessing help (Tatara et al., 1998). In its EUwide survey on violence against women, FRA found that women with dis-abilities were more likely to be victims of all forms of violence (physical, sexual and psychological violence and stalking) than women who did not identify as having disabilities (FRA, 2014b). Of women with disabilities, 34 % have suffered inti-mate partner violence, compared with 19 % of women without disabilities (EIGE, 2020a).
Within the LGBTQI* community, the gender com-ponent exacerbates the risk of violence and dis-crimination. According to FRA’s 2012 EU LGBT survey, individuals whose gender expression did not match the sex they were assigned at birth were twice as likely to experience hatemoti-vated violence than those who fitted with societal expectations. This included not only transgender individuals (52), but also gay men presenting in a ‘feminine’ way, and bisexual and lesbian women presenting in a ‘masculine’ way (FRA, 2014a). Indeed, the latest version of FRA’s LGBTI survey revealed that 46 % of bisexual women and 29 % of lesbian women experienced harassment due to their assigned sex, in addition to their sex-ual orientation, compared with only 2 % of gay men (FRA, 2020). Another form of violence affect-ing the LGBTQI* community is intersex genital mutilation, the practice of subjecting intersex (53) infants to ‘corrective’ genital surgeries to modify their sex characteristics (Jones, 2017). According to FRA (2020), in Europe 62 % of these interven-tions are non-consensual, as they are performed
(52) Individuals who are openly transgender or intersex are the most likely to be sexually or physically assaulted (24 % and 26 % prevalence of attacks, compared with 11 % among LGBTI respondents overall) (FRA, 2020).
(53) The term refers to ‘a range of physical traits or variations that lie between stereotypical ideals of male and female. Intersex people are born with physical, hormonal or genetic features that are neither wholly female nor wholly male; or a combination of female and male; or neither female nor male. Many forms of intersex exist; it is a spectrum or umbrella term, rather than a single category’ (ILGAEUROPE, 2015, p. 5).

Gender Equality Index 2020 — Digi talisation and the future of work
Domain of violence
63
on infants who are unable to express their informed consent to the treatment. The gen-dered aspect of intersex genital mutilation is particularly relevant, since the medicalisation of intersex bodies consists in the nonconsensual mutilation of gender-non-conforming bodies, in order to ‘normalise’ them and align them with the assigned gender roles and sex of rearing (Car-penter, 2016). In February 2019, the European Parliament adopted a resolution on the rights of intersex people (2018/2878 (RSP)), recognising that such surgeries are medically unnecessary (serving only a cosmetic purpose) and cause life-long damage to the physical and psychological integrity of intersex people. The Parliament thus ‘strongly condemns sexnormalising treatments and surgery; welcomes laws that prohibit such surgery, as in Malta and Portugal, and encour-ages other Member States to adopt similar legis-lation as soon as possible’ (European Parliament, 2019b).
8.3. When gender-based violence goes digital
The emergence of digital technologies has had far-reaching impacts on women’s and girls’ exposure to genderbased violence. Firstly, in
providing abusers with access to more varied and powerful tools of control and coercion over the women in their lives, digital technologies can aggravate traditional forms of intimate partner violence (EIGE, 2017b). Secondly, digital tech-nologies have enabled the emergence of new forms of gender-based violence, which are likely to affect women differently depending on their personal characteristics. Online abuse towards women and girls is now understood as an itera-tion or extension of genderbased violence expe-rienced offline (Lewis et al., 2017). This section focuses on some of the forms of violence that have emerged from digital technological devel-opment and their impact on women’s online and offline lives.
As shown in Figure 25, 5 % of adult women in the EU have experienced some form of online harassment in the 12 months preceding the survey. This percentage reaches 12 % in Austria, 11 % in Germany and 9 % in France.
As discussed in EIGE (2019a), adolescent girls and young women are very active internet users, especially on social networking sites, and commonly face unwanted and inappropriate advances online in that context. This is reflected in the higher prevalence of cyber-harassment
Figure 25. Percentages of women aged 18 or older who experienced online harassment in the 12 months prior to the survey, by country, 2016
0
2
4
6
8
10
12
14
ES PL PT HR BG IT CY EL SI HU RO SE LT CZ BE EE NL IE MT LV UK EU LU DK SK FI FR DE AT
5
Source: EIGE calculations using microdata from Eurofound’s 2016 European Quality of Life Survey (EQLS).
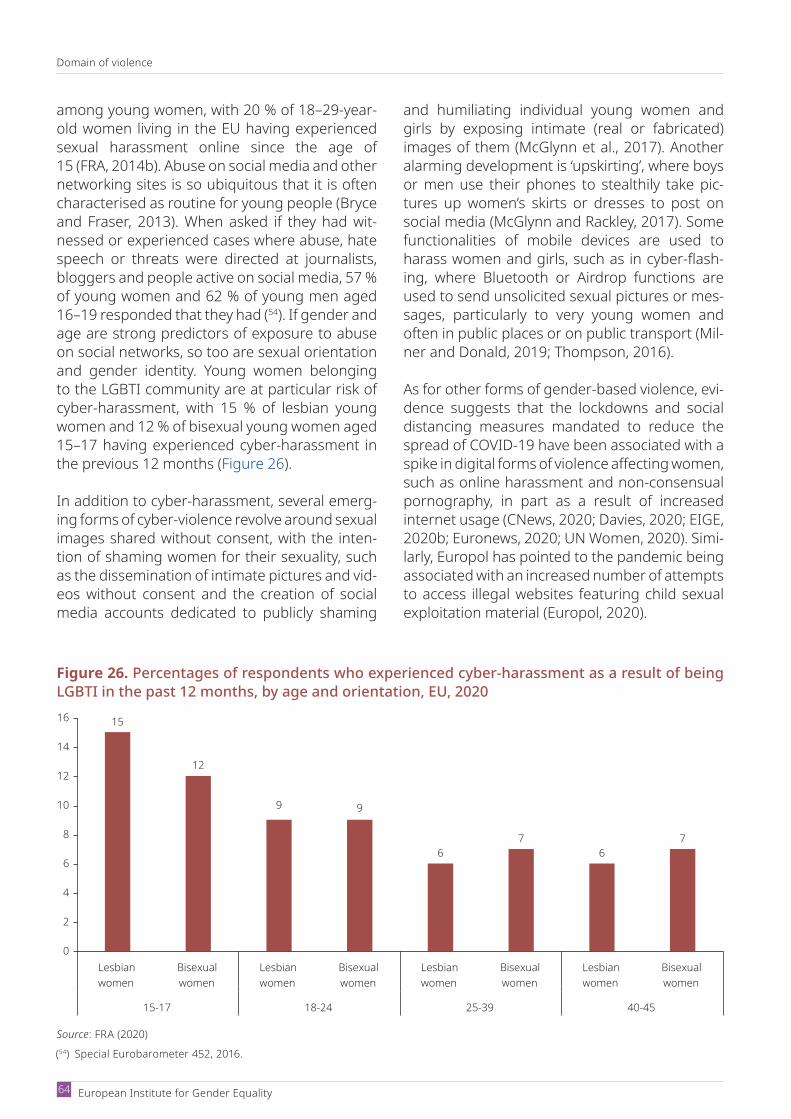
Domain of violence
European Institute for Gender Equality 64
among young women, with 20 % of 18–29yearold women living in the EU having experienced sexual harassment online since the age of 15 (FRA, 2014b). Abuse on social media and other networking sites is so ubiquitous that it is often characterised as routine for young people (Bryce and Fraser, 2013). When asked if they had wit-nessed or experienced cases where abuse, hate speech or threats were directed at journalists, bloggers and people active on social media, 57 % of young women and 62 % of young men aged 16–19 responded that they had (54). If gender and age are strong predictors of exposure to abuse on social networks, so too are sexual orientation and gender identity. Young women belonging to the LGBTI community are at particular risk of cyber-harassment, with 15 % of lesbian young women and 12 % of bisexual young women aged 15–17 having experienced cyberharassment in the previous 12 months (Figure 26).
In addition to cyber-harassment, several emerg-ing forms of cyberviolence revolve around sexual images shared without consent, with the inten-tion of shaming women for their sexuality, such as the dissemination of intimate pictures and vid-eos without consent and the creation of social media accounts dedicated to publicly shaming
and humiliating individual young women and girls by exposing intimate (real or fabricated) images of them (McGlynn et al., 2017). Another alarming development is ‘upskirting’, where boys or men use their phones to stealthily take pic-tures up women’s skirts or dresses to post on social media (McGlynn and Rackley, 2017). Some functionalities of mobile devices are used to harass women and girls, such as in cyberflash-ing, where Bluetooth or Airdrop functions are used to send unsolicited sexual pictures or mes-sages, particularly to very young women and often in public places or on public transport (Mil-ner and Donald, 2019; Thompson, 2016).
As for other forms of gender-based violence, evi-dence suggests that the lockdowns and social distancing measures mandated to reduce the spread of COVID19 have been associated with a spike in digital forms of violence affecting women, such as online harassment and non-consensual pornography, in part as a result of increased internet usage (CNews, 2020; Davies, 2020; EIGE, 2020b; Euronews, 2020; UN Women, 2020). Simi-larly, Europol has pointed to the pandemic being associated with an increased number of attempts to access illegal websites featuring child sexual exploitation material (Europol, 2020).
Figure 26. Percentages of respondents who experienced cyber-harassment as a result of being LGBTI in the past 12 months, by age and orientation, EU, 2020
0
2
4
6
8
10
12
14
16 15
12
9 9
67
67
Lesbianwomen
Bisexualwomen
Lesbianwomen
Bisexualwomen
Lesbianwomen
Bisexualwomen
Lesbianwomen
Bisexualwomen
15-17 18-24 25-39 40-45
Source: FRA (2020)
(54) Special Eurobarometer 452, 2016.
Digitalisation and the future of work: a thematic focus
65Gender Equality Index 2020 — Digi talisation and the future of work
Recent decades have seen digitalisation trans-form socioeconomic and political realities. With the integration of digital technologies, the world of work has changed – creating both opportu-nities for and risks to gender equality. However, academic, public and policy debates on the digital future of work have often adopted gen-der-neutral perspectives that fail to address the central role of digitalisation in transforming gender relations in positive and negative ways (Scheele, 2005).
The EU digital strategy ‘Shaping Europe’s digi-tal future’ presents a vision of digital transition that works for all, ‘putting people first and open-ing new opportunities for business’ (European Commission, 2020a). The EU gender equality strategy 2020–2025 observes that integration of a gender perspective in this area is essential to reach the goal of gender equality. While a number of positive policy developments can be noted, major challenges remain if gender equal-ity in the digital world of work is to be achieved.
In 2019, EU countries committed to boosting the participation of women in digital and technology sectors through the Ministerial Declaration of Commitment on Women in Digital (WiD), with a strong focus on improving the representation of women in certain high-skilled, well-paid activities (notably STEM). While systematic monitoring of progress achieved under the WiD declaration is envisaged, its coverage of gender equality issues linked to digitalisation is limited, often owing to lack of availability or poor quality of gender-dis-aggregated data (for additional suggestions for indicators to be monitored, see Annex 5). Main-streaming of gender equality into other aspects of digitalisation is not well developed. For exam-ple, policy literature has little to say about the implications of new platform work opportunities for gender equality (for an exception, see Euro-pean Commission (2018f)).
The limited treatment of equality issues in digital policy contrasts with feminist scholars’ longstanding interest in this topic. Since the 1970s, feminist research has criticised the gen-der biases of scientific thought as dominated by the perspectives and interests of Western middleclass white men (Harding, 1986, 1991; Keller and Longino, 1996). The gendered, racial and class-based division of labour was associ-ated with the prevailing gender-blind techno-logical practices (Cockburn and Ormrod, 1993). The scope and understanding of the debate on gender and technology later expanded, with influential thinkers identifying the potential to transform bodies beyond biological bounda-ries and transcend gender inequalities through the use of digital technologies (Haraway, 1984, 1991; Wajcman, 2004, 2015). At the same time, however, a number of studies of digital dis-course on race and gender showed the per-sistence of – and even the emergence of new forms of – racist and sexist stereotyping online (Nakamura, 2013).
Feminist research has also highlighted links between gender, technology and the labour market, focusing on the different ways in which technology has substituted or trans-formed the work of women and men. Vari-ous forms of gender segregation have been identified, including vertical, horizontal and contractual segregation (e.g. in part-time or temporary work) (Rubery and Fagan, 1993). Further research has built on this evidence and analysed how new kinds of technology-en-abled work, such as telework and platform work, have reproduced or changed dominant patterns of gender segregation and inequality (Freeman, 2010; Mirchandani, 2010; Overseas Development Institute, 2019).
This thematic focus takes stock (briefly) of the research on the positive and negative
9. Digitalisation and the future of work: a thematic focus

Digitalisation and the future of work: a thematic focus
European Institute for Gender Equality 66
consequences of digitalisation for gender equal-ity in the world of work, particularly those con-sequences that are not (fully) addressed in the EU policy framework. It shows that digitalisation of work is likely to have profound implications for future progress towards gender equality across all Index domains, especially work, money and knowledge. It concludes with several broad policy and research recommendations on pro-moting gender equality in the context of future digitalisation.
In addition, the chapter explores the gendered consequences of digitalisation for groups facing additional disadvantages, such as women with disabilities or women from migrant and ethnic backgrounds. It also reflects on variations in the impact of digitalisation across Member States. Finally, it explores how the COVID19 crisis (ongo-ing at the time of writing) may affect the trends analysed here. The scope of this analysis is lim-ited by (1) data gaps – even basic gender-dis-aggregated data on some issues (e.g. platform work and the COVID19 crisis) are often missing; and (2) the brief, exploratory nature of the chap-ter, which allows only limited attention to detail.
The thematic focus is structured in three sec-tions. The first provides a gender perspective on the use and development of digital technologies, exploring how women and men use technolo-gies, gendered patterns in the development of digital skills, and the composition of the work-force driving technological change. The second section looks at the implications of the digital transformation of the labour market for gender equality. It analyses the prospects for women and men as new technologies replace or comple-ment labour, increase work flexibility and enable new forms of work, such as platform work. The final section discusses three broad technological developments to illustrate how they might affect gender equality: the increasing use of AI algo-rithms, the emerging phenomenon of cyber-vi-olence and the ways in which new technologies are transforming the world of care.
9.1. Who uses and develops digital technologies?
The spread of technology is having a colos-sal impact on the labour market and the types of skills needed in the economy and society (European Commission, 2019c). The creation of a digital single market has been a key EU policy since 2015. It aims to support an inclu-sive digital society, which requires the inte-gration of ICT learning and skills acquisition across different sectors in order to provide women and men of all ages with opportuni-ties to advance. The European Commission’s Digital Skills and Jobs Coalition promotes this objective by bringing together local and national authorities, educational and ICT com-panies, consumers and social partners, who collaborate to reduce digital skill gaps in civic participation, the labour market and educa-tion (European Commission, 2016a).
A study undertaken on behalf of the Commis-sion, however, found that gender mainstream-ing is not well developed in digital single market policies and that substantial discrepancies persist between different EU Member States, depending (primarily) on national policies and legislation (European Commission, 2016a). The WiD Scoreboard (55) is one of the mechanisms put in place by the Commission to assess wom-en’s inclusion in digital jobs, careers and entre-preneurship. According to the Scoreboard, even in those Member States where gender main-streaming is more advanced, ‘stereotypes and preconceptions’ continue to create obstacles for women and girls (European Commission, 2019j). These findings confirm that gender inequali-ties continue to prevent women from reach-ing their full potential and hinder EU societies from taking full advantage of women’s digital potential and current contributions (European Commission, 2018i).
(55) The WiD Scoreboard is a composite indicator combining 13 indicators under three dimensions: (1) internet use, (2) internet user skills and (3) specialist skills and employment (https://ec.europa.eu/digital-single-market/en/women-digital-scoreboard).

Gender Equality Index 2020 — Digi talisation and the future of work
Digitalisation and the future of work: a thematic focus
67
The new College of Commissioners made a strong commitment to invest in digital skills and address the widening skills gap in its forthcoming digital education action plan and new European skills agenda. A communication on the future of research and innovation and the European research area will look at how the EU can better pool resources, as well as deepen research, inno-vation and knowledge capacity in the digital age.
This section highlights numerous gender ine-qualities in the use and creation of technologies and digital skills. It is structured in three sub-sections: the first focuses on gender patterns in the use of new technologies and reveals gender differences in confidence and concerns about technologies; the second looks at gender dif-ferences in digital skill levels and types; and the third presents some insights into control of the invention, design, evaluation, development, com-mercialisation and dissemination of digital services and goods.
9.1.1. Gendered patterns in use of new technologies
Technology can be perceived as gendered in many ways, for example if the relationship between gender and technology is viewed as mutually constitutive: technological change is shaped and structured according to societal norms and relations, which are in turn influenced by technological transformations. On the one hand, this means that the types of technologies used in different historical, political and cultural contexts, their design and meaning are created within gender relations and thus reflect preex-isting gender inequalities. On the other hand, by offering different tools and methodologies for work, entertainment and care, technologies themselves shape those gender relations.
Digital transformation and technological innova-tion represent opportunities and challenges across Member States in relation to economic growth, productivity and employment (see Section 9.2). The digital performance of the EU is measured
by the Digital Economy and Society Index, which brings together a set of relevant indicators on Europe’s current digital policies (56).. The correla-tion between the Gender Equality Index and the Digital Economy and Society Index shows that societies with greater equality between women and men also perform better in the area of the digital economy (Figure 27), which is vital for sus-tainable economic growth.
The best performing Member States in the Digi-tal Economy and Society Index are Finland, Swe-den, the Netherlands and Denmark, which are also among the Member States with the high-est scores on the Gender Equality Index. The strong relationship between the Digital Econ-omy and Society Index and the Gender Equality Index suggests that digital performance can be improved while tackling the digital gender divide (e.g. gender gaps in access to and use of digi-tal technologies, in digital-related education, in entrepreneurship, in ICT). Thus, advancements in digital transformation can go hand in hand with advancements in gender equality.
Is confidence in technology gendered?
Gender analysis of the use of technology reveals a historically unequal power relationship between women and men. Differences in access to economic resources and knowledge, together with gender norms and perceptions of tech-nology, can sideline women from technological developments.
Historically, women have provided a substantial contribution to technological innovation as pro-grammers and computer scientists. Yet the role of those women in influencing computer history is often invisible and unrecognised. Presenting the field as overwhelmingly dominated by men creates a false and unfounded impression of ICT inferiority among women (Hicks, 2017). A litera-ture review of gender differences in technology use shows women to be more anxious than men about IT use, reducing their selfeffectiveness and increasing perceptions of IT requiring greater
(56) It captures five dimensions: connectivity; human capital and digital skills; use of internet services by citizens; integration of digital technology by businesses; and digital public services. More information is available from the European Commission’s website (https://ec.europa.eu/digital-single-market/en/desi).

Digitalisation and the future of work: a thematic focus
European Institute for Gender Equality 68
effort (Goswami and Dutta, 2015). ‘Impostor syn-drome’ – or a fear of failure – has a real impact on women, and men’s reactions to women’s dis-comfort with technology is often mocking or dis-missive, making many women more reluctant to engage (Tedesco, 2019).
Selfefficacy in the use of digital technologies is considered a key motivational construct under-pinning their use (Rohatgi et al., 2016). Women and men tend to differ in their levels of confi-dence in their capacity to acquire and use digital skills. EIGE research into the opportunities and risks of digitalisation for young people (EIGE, 2019a) shows that while digital skills and access to digital technologies is becoming less of an issue for young Europeans, boys consistently express higher selfconfidence across a range of skills in relation to the use of digital technologies. In fact, boys tend to overestimate their perfor-mance and abilities, while girls underestimate both. This reflects the influence of wider gender norms on perceptions of technological selfeffi-cacy (Huffman et al., 2013).
The Eurobarometer 460 survey presenting European citizens’ opinions on the impact of digitalisation and automation on daily life reveals that women are somewhat more con-cerned about, and have more negative per-ceptions of, digital technologies (European Commission, 2018i). For example, men are more likely to think newer digital technologies have had a positive impact on the economy (78 % versus 72 % of women) or their qual-ity of life (70 % versus 63 %). Only one in two women (54 %) has positive views about robots and AI, compared with 67 % of men. Women also tend to be less informed than men about new technologies, which may contribute to their greater mistrust of them. In the case of AI, 41 % of women had heard, read or seen something about it in the past year, compared with 53 % of men. A gender gap also exists in relation to other technological topics (Euro-pean Commission, 2018i).
Explicit and implicit gender biases embed-ded in digital services and products have been
Figure 27. Relationship between the Gender Equality Index and the Digital Economy and Society Index
BE
BG
CZ
DK
DE
EE
IE
EL
ES
FR
HR
IT
CY
LV
LT
LU
HU
MT
NL
AT
PL
PT
RO
SI
SK
FI
SE
UK
40
50
60
70
80
90
30 40 50 60 70
Gen
der
Equa
lity
Inde
x 20
20
Digital Economy and Society Index
Source: European Commission, Digital Economy and Society Index.
Gender Equality Index 2020 — Digi talisation and the future of work
Digitalisation and the future of work: a thematic focus
69
researched in recent years, particularly in the area of software development (Wang and Red-miles, 2019). Research has shown that the needs of users whose characteristics match those of the designers (in terms of gender, age, (dis)abil-ity) tend to be best served by the software (Bur-nett et al., 2018). Three main types of biases were identified: bias in understanding who the user is and how they might use the software; bias in the data used to enable the software, which may then deliver incorrect or biased suggestions to the user; and bias in the design of the product, making it unappealing or impractical for certain categories of users (Vorvoreanu et al., 2019). Gender biases have received attention in rela-tion to, for example, ‘tracking and datafication of the body and daily activities, such as running, sleeping, walking and eating’ (Søndergaard and Hansen, 2017) and the internet of things (57).
Multiple research findings suggest that exclu-sivity in the design of digital technologies and lack of testing on women contribute to women’s reduced confidence with regard to technologies. For example, extensive studies have examined genderbased differences in the motion sick-ness experienced with virtual reality exposure. A recent study demonstrated that inter-pupillary distance contributed to motion sickness among women, as virtual reality headsets were simply not designed for female physiology (Stanney et al., 2020).
Growing connectivity does not reach everyone
The ownership and use of digital technolo-gies have substantial potential for economic empowerment of women and increasing gender equality. Access to the internet and ownership of and access to digital devices can offer addi-tional employment opportunities, income and knowledge. They can alleviate caring burdens and help with basic tasks, such as shopping for goods or services and banking online. How-ever, the unprecedented growth in connectivity
and use of the internet are not enjoyed equally. Certain groups of women, in particular, have unequal access to connectivity and digital tech-nologies, contributing to the digital gender divide (OECD, 2018b).
EU-wide data shows that women fare more or less equally with men online: 78 % of women and 80 % of men use the internet daily (an increase from 49 % of women and 57 % of men in 2010). However, older women and women with low education lag behind (Figure 28). In addition, 25 % of women aged 55–74 and 27 % of women with low education have never had the chance to use the internet, compared with 21 % of men aged 55–74 and 21 % of men with low educa-tion (58). Although these numbers have declined since 2010, equal connectivity continues to need attention.
In a number of EU Member States, the groups of women who most need opportunities for economic empowerment are most cut off from those opportunities. The biggest gender gaps among daily internet users (to the detriment of women) are found in Austria (8 p.p.), Croatia (7 p.p.) and Luxembourg (6 p.p.). Older women (aged 55–74) are particularly disadvantaged in Austria (a 20p.p. gender gap), Luxembourg (13 p.p.) and Germany (12 p.p.). Women with low education are clearly lagging behind in Austria (28 p.p.), Czechia (26 p.p.) and Croatia (20 p.p.).
Similar gender differences are observed in mobile connectivity, which is spreading quickly but not always equally (Yang et al., 2018). In 2019, 74 % of women and 76 % of men had mobile internet access (59). This is a substantial increase since 2012, when only 31 % of women and 40 % of men accessed the internet away from home or work.
The gender difference among older peo-ple (aged 55–74) with mobile internet access is slightly higher (50 % of women and 54 % of men), although there are significant differences between countries. Older women in Denmark,
(57) Referring to everyday objects that are digitally enhanced, connected to the internet and collect/use user data.(58) Eurostat, ISOC, ‘Individuals – internet use’ (isoc_ci_ifp_iu).(59) Individuals who used a portable computer or handheld device to access the internet away from home or work. Eurostat, ISOC, ‘Individuals –
places of internet use’ (isoc_ci_ifp_pu).
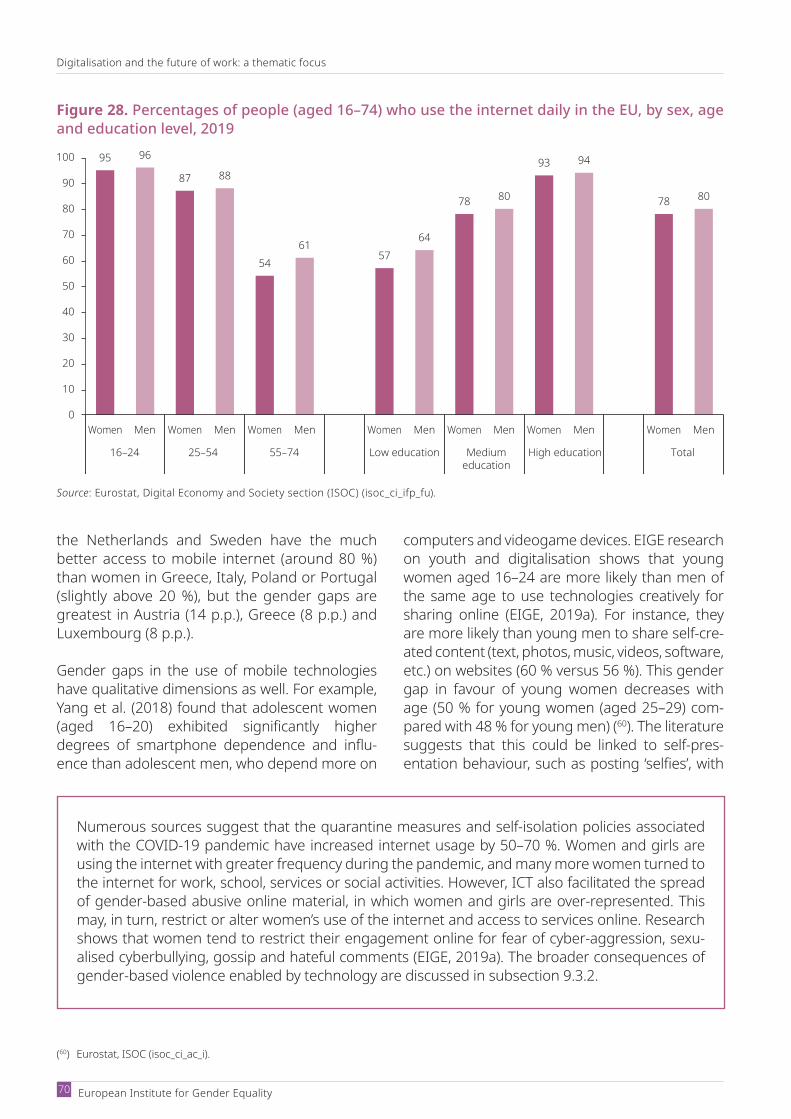
Digitalisation and the future of work: a thematic focus
European Institute for Gender Equality 70
the Netherlands and Sweden have the much better access to mobile internet (around 80 %) than women in Greece, Italy, Poland or Portugal (slightly above 20 %), but the gender gaps are greatest in Austria (14 p.p.), Greece (8 p.p.) and Luxembourg (8 p.p.).
Gender gaps in the use of mobile technologies have qualitative dimensions as well. For example, Yang et al. (2018) found that adolescent women (aged 16–20) exhibited significantly higher degrees of smartphone dependence and influ-ence than adolescent men, who depend more on
computers and videogame devices. EIGE research on youth and digitalisation shows that young women aged 16–24 are more likely than men of the same age to use technologies creatively for sharing online (EIGE, 2019a). For instance, they are more likely than young men to share self-cre-ated content (text, photos, music, videos, software, etc.) on websites (60 % versus 56 %). This gender gap in favour of young women decreases with age (50 % for young women (aged 25–29) com-pared with 48 % for young men) (60). The literature suggests that this could be linked to self-pres-entation behaviour, such as posting ‘selfies’, with
Numerous sources suggest that the quarantine measures and self-isolation policies associated with the COVID19 pandemic have increased internet usage by 50–70 %. Women and girls are using the internet with greater frequency during the pandemic, and many more women turned to the internet for work, school, services or social activities. However, ICT also facilitated the spread of gender-based abusive online material, in which women and girls are over-represented. This may, in turn, restrict or alter women’s use of the internet and access to services online. Research shows that women tend to restrict their engagement online for fear of cyberaggression, sexu-alised cyberbullying, gossip and hateful comments (EIGE, 2019a). The broader consequences of genderbased violence enabled by technology are discussed in subsection 9.3.2.
(60) Eurostat, ISOC (isoc_ci_ac_i).
Figure 28. Percentages of people (aged 16–74) who use the internet daily in the EU, by sex, age and education level, 2019
95 96
87 88
5461
5764
78 80
93 94
78 80
0
10
20
30
40
50
60
70
80
90
100
Women Men Women Men Women Men Women Men Women Men Women Men Women Men
16–24 25–54 55–74 Low education Mediumeducation
High education Total
Source: Eurostat, Digital Economy and Society section (ISOC) (isoc_ci_ifp_fu).
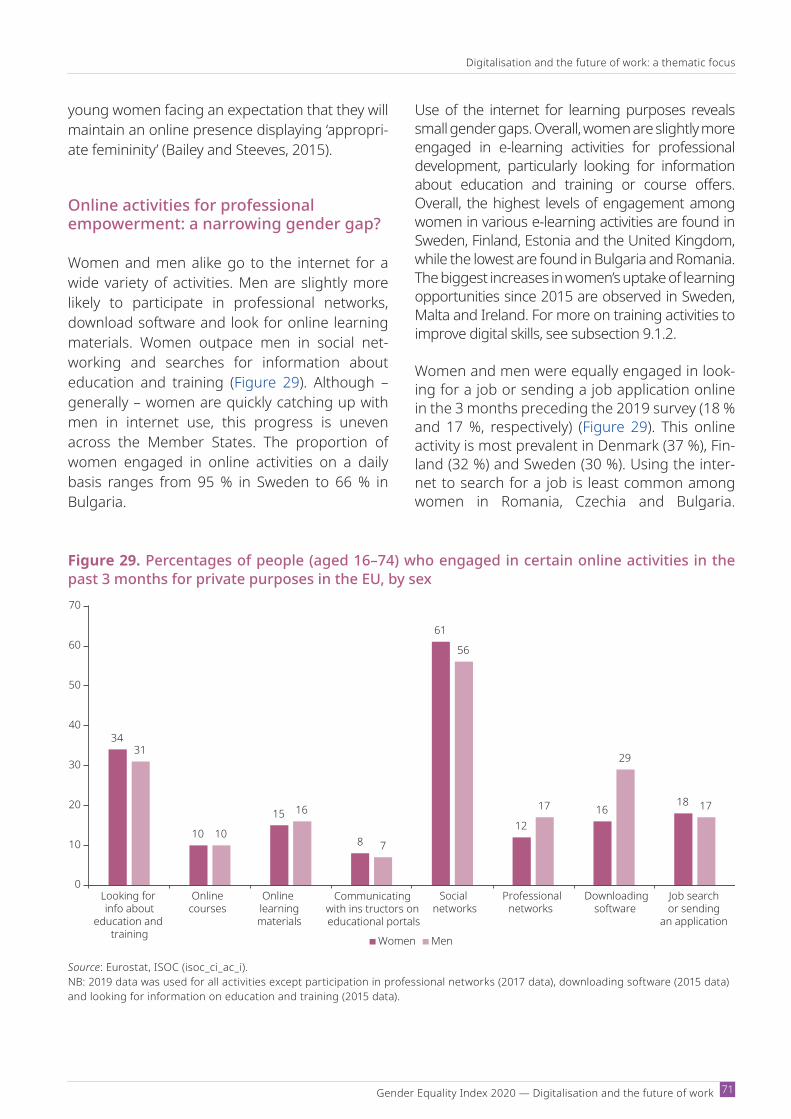
Gender Equality Index 2020 — Digi talisation and the future of work
Digitalisation and the future of work: a thematic focus
71
young women facing an expectation that they will maintain an online presence displaying ‘appropri-ate femininity’ (Bailey and Steeves, 2015).
Online activities for professional empowerment: a narrowing gender gap?
Women and men alike go to the internet for a wide variety of activities. Men are slightly more likely to participate in professional networks, download software and look for online learning materials. Women outpace men in social net-working and searches for information about education and training (Figure 29). Although – generally – women are quickly catching up with men in internet use, this progress is uneven across the Member States. The proportion of women engaged in online activities on a daily basis ranges from 95 % in Sweden to 66 % in Bulgaria.
Use of the internet for learning purposes reveals small gender gaps. Overall, women are slightly more engaged in e-learning activities for professional development, particularly looking for information about education and training or course offers. Overall, the highest levels of engagement among women in various e-learning activities are found in Sweden, Finland, Estonia and the United Kingdom, while the lowest are found in Bulgaria and Romania. The biggest increases in women’s uptake of learning opportunities since 2015 are observed in Sweden, Malta and Ireland. For more on training activities to improve digital skills, see subsection 9.1.2.
Women and men were equally engaged in look-ing for a job or sending a job application online in the 3 months preceding the 2019 survey (18 % and 17 %, respectively) (Figure 29). This online activity is most prevalent in Denmark (37 %), Fin-land (32 %) and Sweden (30 %). Using the inter-net to search for a job is least common among women in Romania, Czechia and Bulgaria.
Figure 29. Percentages of people (aged 16–74) who engaged in certain online activities in the past 3 months for private purposes in the EU, by sex
34
10
15
8
61
1216
18
31
10
16
7
56
17
29
17
0
10
20
30
40
50
60
70
Looking for info about
education and training
Online learningmaterials
Communicating with ins tructors on educational portals
Onlinecourses
Social networks
Professionalnetworks
Downloadingsoftware
Job search or sending
an application
Women Men
Source: Eurostat, ISOC (isoc_ci_ac_i).NB: 2019 data was used for all activities except participation in professional networks (2017 data), downloading software (2015 data) and looking for information on education and training (2015 data).

Digitalisation and the future of work: a thematic focus
European Institute for Gender Equality 72
Women outnumber men in using the internet to search for a job in Sweden, Malta, Slovakia, Croa-tia and France.
Participation in online professional networks (LinkedIn, Xing, etc.) reveals a larger gender gap (12 % of women compared with 17 % of men) and an overall increase in engagement since 2011 (from 6 % of women and 9 % of men). Women’s participation ranges from 29 % in the Nether-lands and 27 % in Denmark to as low as 2 % in Bulgaria and 3 % in Czechia, Romania and Slo-vakia. The biggest gender gaps are found in the Netherlands (9 p.p.), Sweden (8 p.p.), Denmark and Luxembourg (6 p.p. each). Since 2017, the biggest increases in participation in professional networks among women have been observed in the United Kingdom, Poland, Austria and the Netherlands. In April 2020, 43 % of LinkedIn users were women and 57 % were men (61).
Data on users of mobile internet for professional purposes (via portable computer or handheld device) show substantial gender differences. In 2012, twice as many men as women aged 25–54 (22 % and 11 %, respectively) used mobile
internet for professional purposes. The gender gap increased with level of education (Figure 30). Highly educated men were nearly twice as likely to use mobile internet for professional purposes than highly educated women (33 % and 19 %, respectively).
Using digital technologies for professional pur-poses is an important prerequisite for success-ful integration into the digitalised economy and more advanced forms of IT work. Overall in the EU, women are behind men in the use of various ICT technologies at work (see subsection 9.1.1). The COVID19 crisis may well have brought sub-stantial changes in relation to online activity and the use of mobile internet for professional pur-poses by both women and men, especially par-ents with children under 12, and those changes remain to be assessed.
9.1.2. Digital skills and training
Digital skills have increasingly become a basis for global competitiveness, boosting jobs and growth. Digital societies require digital
Figure 30. Percentages of people (aged 16–74) using mobile internet for professional purposes in the EU, by sex, age and education level, 2012
68
11
22
2
5
1
4 5
13
19
33
7
15
0
5
10
15
20
25
30
35
40
Women Men Women Men Women Men Women Men Women Men Women Men Women Men
16–24 25–54 55–74 Low education Mediumeducation
High education Total
Source: Eurostat, ISOC (isoc_cimobi_purp).
(61) https://www.statista.com/statistics/933964/distributionofusersonlinkedinworldwidegender/

Gender Equality Index 2020 — Digi talisation and the future of work
Digitalisation and the future of work: a thematic focus
73
competencies if they are to ensure full partici-pation of people in social and working life. The internet has been of paramount importance in working towards high-quality education at all levels, while the COVID19 crisis has shown that most jobs can be done remotely using technology. The crisis has caused education and training to be moved online or digitalised, placing the digital skills and competence of learners and teachers/trainers front and cen-tre when it comes to engaging in learning at all levels.
Building on the various concepts used to define digital skills (Kaarakainen et al., 2017) and the EU Digital Scoreboard (Digital Economy and Soci-ety Index, Women in Digital (WiD)), the following analysis looks at gender differences in informa-tion, communication, problem-solving and soft-ware skills (62) and in training opportunities to advance those skills.
Advanced digital skills of women and gender equality go hand in hand
The WiD Scoreboard monitors women’s partici-pation in the digital economy. Its second dimen-sion looks at women’s internet use skills, as measured by three indicators: at least basic dig-ital skills, above basic digital skills and software skills (Figure 31). Luxembourg, Finland, the Neth-erlands and Sweden have the highest scores in internet user skills, while Romania, Bulgaria, Italy and Poland score lowest. Only six Member States (Finland, Slovenia, Lithuania, Latvia, Cyprus and Bulgaria) show women scoring higher than men on internet user skills. The biggest gender gaps (to women’s disadvantage) are in Luxembourg, Austria and Croatia.
The correlation between the Gender Equal-ity Index and internet user skills suggests that these two areas reinforce one another. Women’s
Figure 31. Internet user skill scores by sex, 2017
0
10
20
30
40
50
60
70
80
90
100
LU FI NL SE UK DK DE AT EE MT SI LT BE SK FR EU ES HR CZ LV PT IE CY HU EL PL IT BG ROWomen Men
Source: European Commission, WiD Scoreboard, dimension 2 (European Commission, 2019i); scores for men based on EIGE calculations.NB: WiD Scoreboard, dimension 2, internet user skills, is calculated as the weighted average of the three indicators 2.1, at least basic digital skills (33.3 %); 2.2, above basic digital skills (33.3 %); and 2.3, at least basic software skills (33.3 %).
(62) Digital skills indicators are based on selected activities related to internet or software use performed by people in four specific dimensions (information, communication, problem-solving, software skills). It is assumed that individuals having performed certain activities have the corresponding skills. Therefore, the indicators can be considered a proxy for the digital competencies and skills of individuals. According to the variety or complexity of activities performed, two levels of skills are computed for each of the four dimensions: basic and above basic.
Individuals with above basic skills displayed them across all four dimensions; individuals with a basic level of skills had at least one basic skill level and no ‘no skills’ across the four dimensions.

Digitalisation and the future of work: a thematic focus
European Institute for Gender Equality 74
internet skills are highest in Luxembourg, which ranks 10th on the Gender Equality Index, while Finland, the Netherlands, Sweden, the United Kingdom and Denmark are in the top rankings on both indices.
Gender divide in digital skills widens with age
Given the likely future of jobs, it is important to distinguish between basic and advanced digital skills. While basic digital skills, such as the use of search engines or digital bank services, are nec-essary, advanced digital skills open opportuni-ties for access to well-paid jobs for which there is significant demand in the European digital economy. Both types of skills are increasingly essential in the labour market. As noted by the Organisation for Economic Cooperation and Development, workers who are successful in penetrating competitive labour markets typically have a mix of basic and advanced digital skills (OECD, 2018a).
In the EU, men often have more advantages than women when it comes to the digital skills (information, communication, problem-solving and software skills) necessary to thrive in the dig-italised world of work. This is particularly evident among older people (aged 55 or older). Finland, the Netherlands, Denmark, the United Kingdom and Sweden have the highest shares of women with above basic digital skills, while Greece, Poland, Italy, Bulgaria and Romania have the lowest shares. The correlation between Gender Equality Index scores (domain of work, subdo-main of participation, domain of money) and the shares of women with above basic skills confirms that countries with high shares of digitally skilled women also have higher gender equality in the labour market.
Young women and men are the most digitally skilled generation and benefit equally from basic and above basic digital skills – 59 % of women and 60 % of men aged 16–24 have above basic digital skills (Figure 32). Finland, Malta and Croatia have the highest shares of young women with above
basic digital skills, while Italy, Bulgaria and Roma-nia have the lowest shares. However, at a later age, the gender divide widens, with most older people having low to basic digital skills. Finland, Denmark and Sweden have the highest shares of digitally skilled women aged 55–74, while Greece, Bulgaria and Romania have the lowest shares. Aside from generational and country differences, women generally experience bigger obstacles in trying to improve their digital skills, owing to fac-tors such as gender stereotypes, family status, and the broader societal, economic and techno-logical environment (OECD, 2018a).
The digital skills of young people are improving quickly, with a somewhat faster pace observed for men than for women. Between 2015 and 2019, the share of women aged 16–24 with above basic digital skills increased by 7 p.p., com-pared with 9 p.p. for men, with no substantial gender gap observed during this period. Greece, Cyprus and Ireland made the greatest progress in 4 years, while the shares of young women with above basic digital skills declined in Luxembourg, Denmark and Bulgaria. Across the EU, the gen-der gap decreased among those aged 25–54 (– 4 p.p. in 2015, – 3 p.p. in 2019). Cyprus, Austria and Ireland progressed most, while Luxembourg, Latvia and Denmark showed least progress dur-ing this period. Among older people (aged 55 or older), progress was slower, and older people still remain the least digitally skilled age group, with a gender gap of around – 7 p.p. in 2019 (compared with – 6 p.p. in 2015) (63).
In addition to gender differences in levels of digi-tal skill in some age groups, women and men also acquire different types of digital skills (see sub-section 9.1.1.). The gender gap in overall digital skills is primarily associated with problem-solv-ing digital skills (64), to the detriment of women. More men than women have above basic digi-tal skills in problem-solving and software skills, with a smaller gap evident in information and communications skills. The Council recommen-dation ‘Upskilling pathways: new opportunities for adults’ seeks to improve lowqualified adults’
(63) Eurostat, ISOC (isoc_sk_dskl_i).(64) For example, making informed decisions on the most appropriate digital tools, solving conceptual and technical problems,
updating own and others’ competencies.
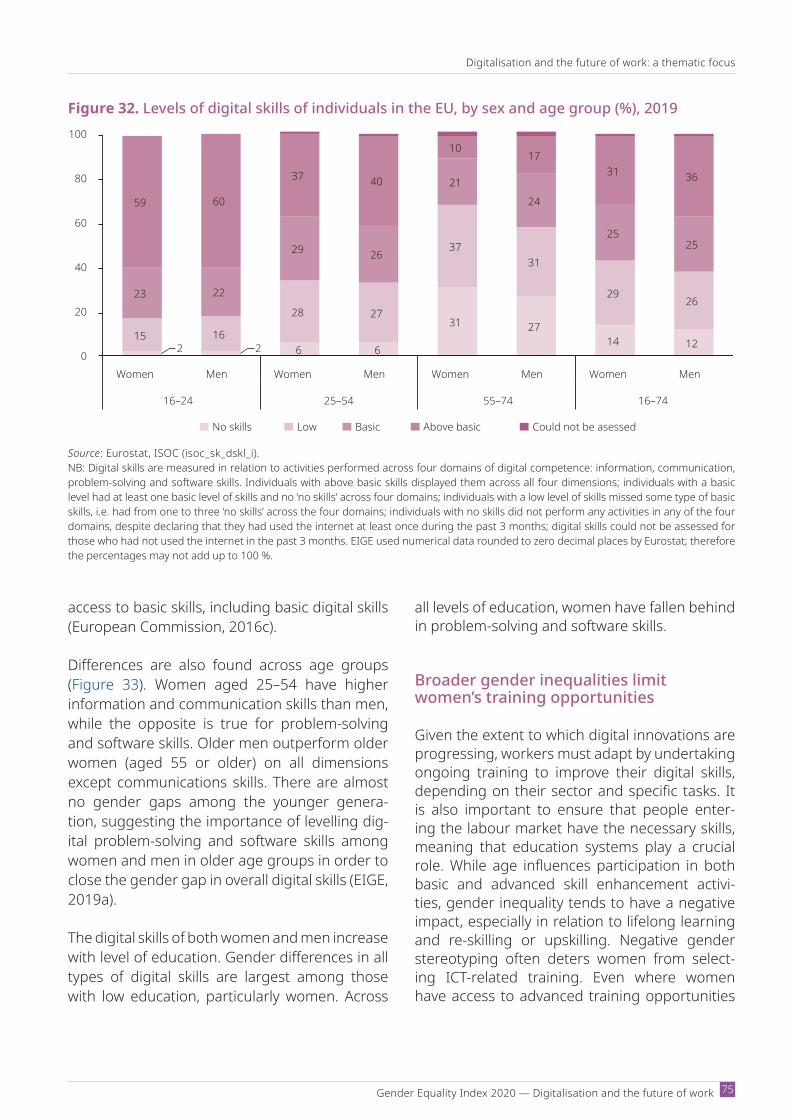
Gender Equality Index 2020 — Digi talisation and the future of work
Digitalisation and the future of work: a thematic focus
75
access to basic skills, including basic digital skills (European Commission, 2016c).
Differences are also found across age groups (Figure 33). Women aged 25–54 have higher information and communication skills than men, while the opposite is true for problem-solving and software skills. Older men outperform older women (aged 55 or older) on all dimensions except communications skills. There are almost no gender gaps among the younger genera-tion, suggesting the importance of levelling dig-ital problem-solving and software skills among women and men in older age groups in order to close the gender gap in overall digital skills (EIGE, 2019a).
The digital skills of both women and men increase with level of education. Gender differences in all types of digital skills are largest among those with low education, particularly women. Across
all levels of education, women have fallen behind in problem-solving and software skills.
Broader gender inequalities limit women’s training opportunities
Given the extent to which digital innovations are progressing, workers must adapt by undertaking ongoing training to improve their digital skills, depending on their sector and specific tasks. It is also important to ensure that people enter-ing the labour market have the necessary skills, meaning that education systems play a crucial role. While age influences participation in both basic and advanced skill enhancement activi-ties, gender inequality tends to have a negative impact, especially in relation to lifelong learning and re-skilling or upskilling. Negative gender stereotyping often deters women from select-ing ICT-related training. Even where women have access to advanced training opportunities
Figure 32. Levels of digital skills of individuals in the EU, by sex and age group (%), 2019
2 6 6
31 2714 12
15 16
28 27
3731
2926
23 22
29 26
2124
2525
59 60
37 40
1017
31 36
0
20
40
60
80
100
Women Men Women Men Women Men Women Men
16–24 25–54 55–74 16–74
No skills Low Basic Above basic Could not be asessed
2
Source: Eurostat, ISOC (isoc_sk_dskl_i).NB: Digital skills are measured in relation to activities performed across four domains of digital competence: information, communication, problemsolving and software skills. Individuals with above basic skills displayed them across all four dimensions; individuals with a basic level had at least one basic level of skills and no ‘no skills’ across four domains; individuals with a low level of skills missed some type of basic skills, i.e. had from one to three ‘no skills’ across the four domains; individuals with no skills did not perform any activities in any of the four domains, despite declaring that they had used the internet at least once during the past 3 months; digital skills could not be assessed for those who had not used the internet in the past 3 months. EIGE used numerical data rounded to zero decimal places by Eurostat; therefore the percentages may not add up to 100 %.
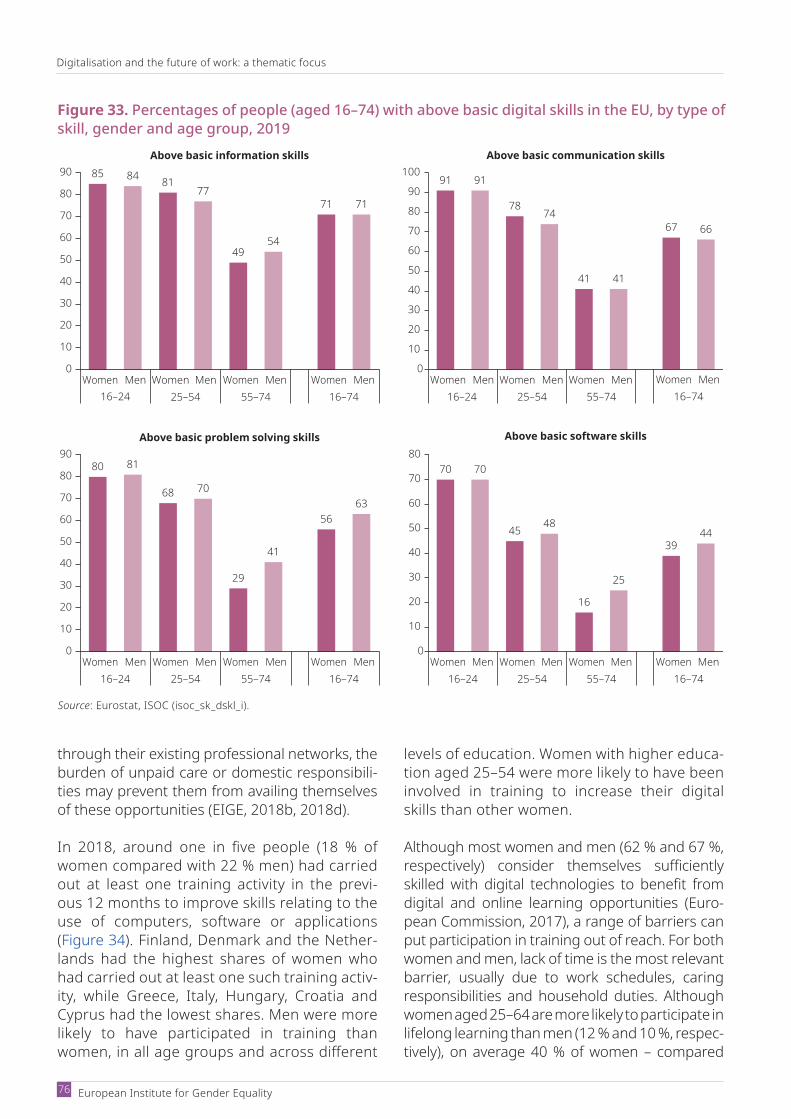
Digitalisation and the future of work: a thematic focus
European Institute for Gender Equality 76
through their existing professional networks, the burden of unpaid care or domestic responsibili-ties may prevent them from availing themselves of these opportunities (EIGE, 2018b, 2018d).
In 2018, around one in five people (18 % of women compared with 22 % men) had carried out at least one training activity in the previ-ous 12 months to improve skills relating to the use of computers, software or applications (Figure 34). Finland, Denmark and the Nether-lands had the highest shares of women who had carried out at least one such training activ-ity, while Greece, Italy, Hungary, Croatia and Cyprus had the lowest shares. Men were more likely to have participated in training than women, in all age groups and across different
levels of education. Women with higher educa-tion aged 25–54 were more likely to have been involved in training to increase their digital skills than other women.
Although most women and men (62 % and 67 %, respectively) consider themselves sufficiently skilled with digital technologies to benefit from digital and online learning opportunities (Euro-pean Commission, 2017), a range of barriers can put participation in training out of reach. For both women and men, lack of time is the most relevant barrier, usually due to work schedules, caring responsibilities and household duties. Although women aged 25–64 are more likely to participate in lifelong learning than men (12 % and 10 %, respec-tively), on average 40 % of women – compared
91 91
7874
41 41
67 66
0
10
20
30
40
50
60
70
80
90
100
Women Men Women Men Women Men Women Men16–24 25–54 55–74 16–74
Above basic communication skills
80 81
68 70
29
41
5663
Women Men Women Men Women Men Women Men16–24 25–54 55–74 16–74
Above basic problem solving skills
85 84 8177
4954
71 71
0
10
20
30
40
50
60
70
80
90
Women Men Women Men Women Men Women Men16–24 25–54 55–74 16–74
Above basic information skills
90
80
70
60
50
40
30
20
10
0
Above basic software skills
70 70
45 48
16
25
3944
0
10
20
30
40
50
60
70
80
Women Men Women Men Women Men Women Men16–24 25–54 55–74 16–74
Source: Eurostat, ISOC (isoc_sk_dskl_i).
Figure 33. Percentages of people (aged 16–74) with above basic digital skills in the EU, by type of skill, gender and age group, 2019
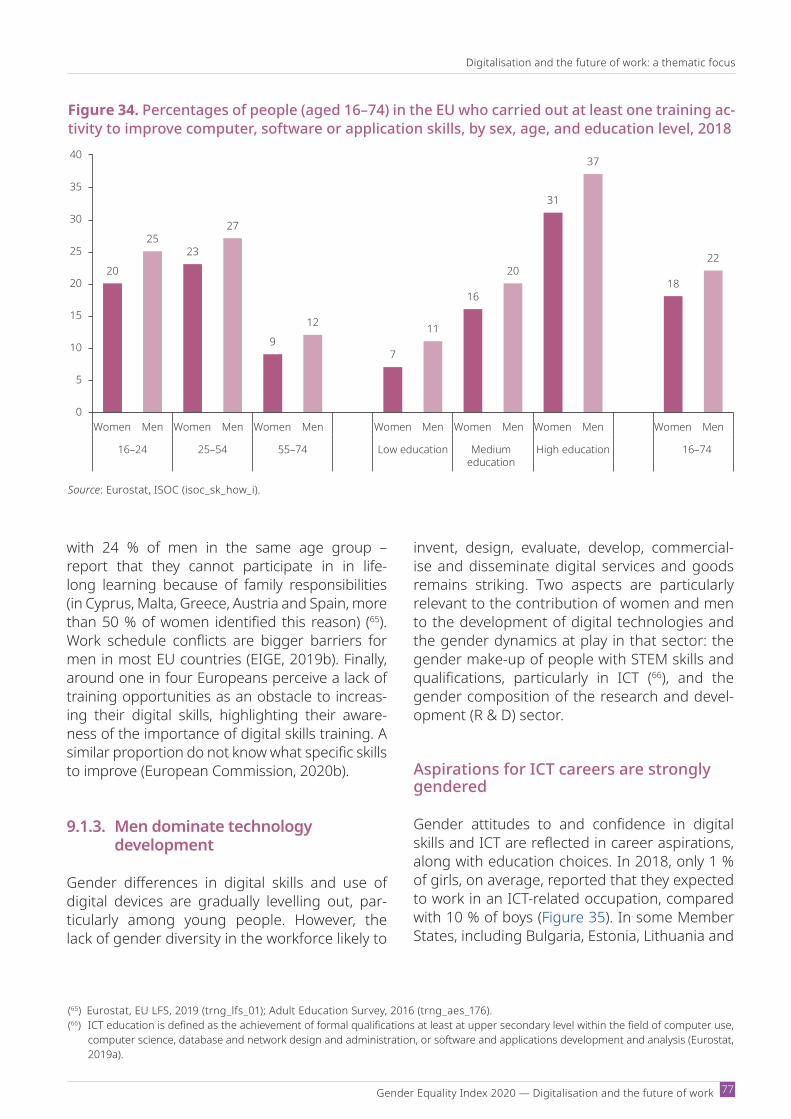
Gender Equality Index 2020 — Digi talisation and the future of work
Digitalisation and the future of work: a thematic focus
77
with 24 % of men in the same age group – report that they cannot participate in in life-long learning because of family responsibilities (in Cyprus, Malta, Greece, Austria and Spain, more than 50 % of women identified this reason) (65). Work schedule conflicts are bigger barriers for men in most EU countries (EIGE, 2019b). Finally, around one in four Europeans perceive a lack of training opportunities as an obstacle to increas-ing their digital skills, highlighting their aware-ness of the importance of digital skills training. A similar proportion do not know what specific skills to improve (European Commission, 2020b).
9.1.3. Men dominate technology development
Gender differences in digital skills and use of digital devices are gradually levelling out, par-ticularly among young people. However, the lack of gender diversity in the workforce likely to
invent, design, evaluate, develop, commercial-ise and disseminate digital services and goods remains striking. Two aspects are particularly relevant to the contribution of women and men to the development of digital technologies and the gender dynamics at play in that sector: the gender makeup of people with STEM skills and qualifications, particularly in ICT (66), and the gender composition of the research and devel-opment (R & D) sector.
Aspirations for ICT careers are strongly gendered
Gender attitudes to and confidence in digital skills and ICT are reflected in career aspirations, along with education choices. In 2018, only 1 % of girls, on average, reported that they expected to work in an ICT-related occupation, compared with 10 % of boys (Figure 35). In some Member States, including Bulgaria, Estonia, Lithuania and
Figure 34. Percentages of people (aged 16–74) in the EU who carried out at least one training ac-tivity to improve computer, software or application skills, by sex, age, and education level, 2018
20
2523
27
9
12
7
11
16
20
31
37
18
22
0
5
10
15
20
25
30
35
40
Women Men Women Men Women Men Women Men Women Men Women Men Women Men
16–24 25–54 55–74 Low education Mediumeducation
High education 16–74
Source: Eurostat, ISOC (isoc_sk_how_i).
(65) Eurostat, EU LFS, 2019 (trng_lfs_01); Adult Education Survey, 2016 (trng_aes_176).(66) ICT education is defined as the achievement of formal qualifications at least at upper secondary level within the field of computer use,
computer science, database and network design and administration, or software and applications development and analysis (Eurostat, 2019a).
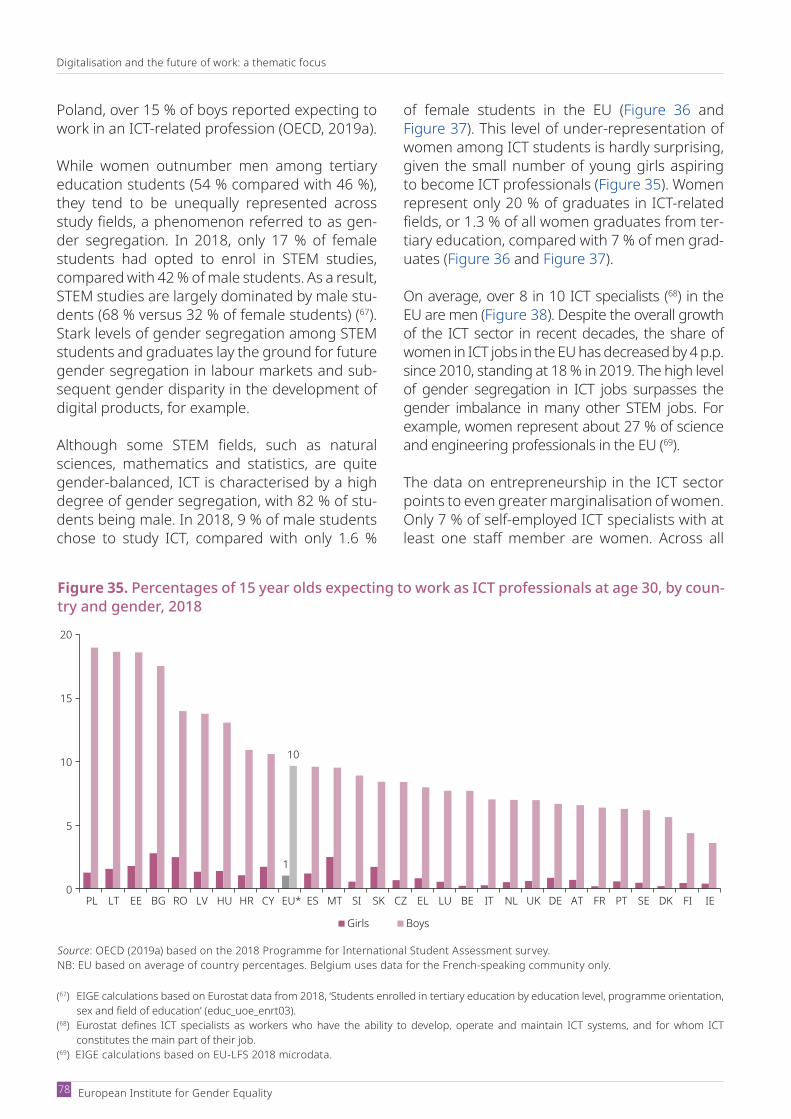
Digitalisation and the future of work: a thematic focus
European Institute for Gender Equality 78
Poland, over 15 % of boys reported expecting to work in an ICTrelated profession (OECD, 2019a).
While women outnumber men among tertiary education students (54 % compared with 46 %), they tend to be unequally represented across study fields, a phenomenon referred to as gen-der segregation. In 2018, only 17 % of female students had opted to enrol in STEM studies, compared with 42 % of male students. As a result, STEM studies are largely dominated by male stu-dents (68 % versus 32 % of female students) (67). Stark levels of gender segregation among STEM students and graduates lay the ground for future gender segregation in labour markets and sub-sequent gender disparity in the development of digital products, for example.
Although some STEM fields, such as natural sciences, mathematics and statistics, are quite gender-balanced, ICT is characterised by a high degree of gender segregation, with 82 % of stu-dents being male. In 2018, 9 % of male students chose to study ICT, compared with only 1.6 %
of female students in the EU (Figure 36 and Figure 37). This level of under-representation of women among ICT students is hardly surprising, given the small number of young girls aspiring to become ICT professionals (Figure 35). Women represent only 20 % of graduates in ICT-related fields, or 1.3 % of all women graduates from ter-tiary education, compared with 7 % of men grad-uates (Figure 36 and Figure 37).
On average, over 8 in 10 ICT specialists (68) in the EU are men (Figure 38). Despite the overall growth of the ICT sector in recent decades, the share of women in ICT jobs in the EU has decreased by 4 p.p. since 2010, standing at 18 % in 2019. The high level of gender segregation in ICT jobs surpasses the gender imbalance in many other STEM jobs. For example, women represent about 27 % of science and engineering professionals in the EU (69).
The data on entrepreneurship in the ICT sector points to even greater marginalisation of women. Only 7 % of selfemployed ICT specialists with at least one staff member are women. Across all
(67) EIGE calculations based on Eurostat data from 2018, ‘Students enrolled in tertiary education by education level, programme orientation, sex and field of education’ (educ_uoe_enrt03).
(68) Eurostat defines ICT specialists as workers who have the ability to develop, operate and maintain ICT systems, and for whom ICT constitutes the main part of their job.
(69) EIGE calculations based on EULFS 2018 microdata.
Figure 35. Percentages of 15 year olds expecting to work as ICT professionals at age 30, by coun-try and gender, 2018
1
10
0
5
10
15
20
PL LT EE BG RO LV HU HR CY EU* ES MT SI SK CZ EL LU BE IT NL UK DE AT FR PT SE DK FI IE
Girls Boys
Source: OECD (2019a) based on the 2018 Programme for International Student Assessment survey.NB: EU based on average of country percentages. Belgium uses data for the French-speaking community only.

Gender Equality Index 2020 — Digi talisation and the future of work
Digitalisation and the future of work: a thematic focus
79
sectors, women entrepreneurs represent about 27 % of all self-employed people with at least one employee (70).
The gender gap in start-ups and venture capital investment is similarly striking. According to the EU Startup Monitor 2018, only 17 % of startup founders are women. OECD analysis shows that women-owned start-ups receive on average 23 % less funding than men-led businesses (European Commission, 2018d). On a positive note, the OECD observes that venture capital firms with at least one woman partner are more than twice as likely to invest in a company with a woman on the management team, and three times as likely to invest in women CEOs (OECD, 2018a). The evidence also shows that, despite the scarcity of
women entrepreneurs, women-led digital start-ups are more likely to be successful than those owned by men (Roland Berger et al., 2017), while investments in female-founded start-ups perform 63 % better than investments with all-male found-ing teams (Marion, 2016).
Even though ICT skills are in high demand in the labour market (see subsection 9.2.2), women ICT professionals do not fare as well as their male counterparts. For women, the probability of being employed in the ICT sector following ICT-related studies is between 1 p.p. and 2 p.p. smaller than the probability of employment in a relevant field of women following other programmes of study (European Commission, 2016b). EIGE’s research shows that only one third of recent STEM
Figure 36. Percentages of ICT students and graduates in the total student population, by sex, 2018
1.6 1.3
9
7
0
5
10
15
20
Students Graduates
Women Men
Source: Eurostat (educ_uoe_enrt03, educ_uoe_grad02).
Figure 37. Percentages of women and men among ICT students and graduates, 2018
18 20
82 80
0
10
20
30
40
50
60
70
80
90
100
Students Graduates
Women Men
(70) EIGE calculations based on EULFS 2018 microdata.
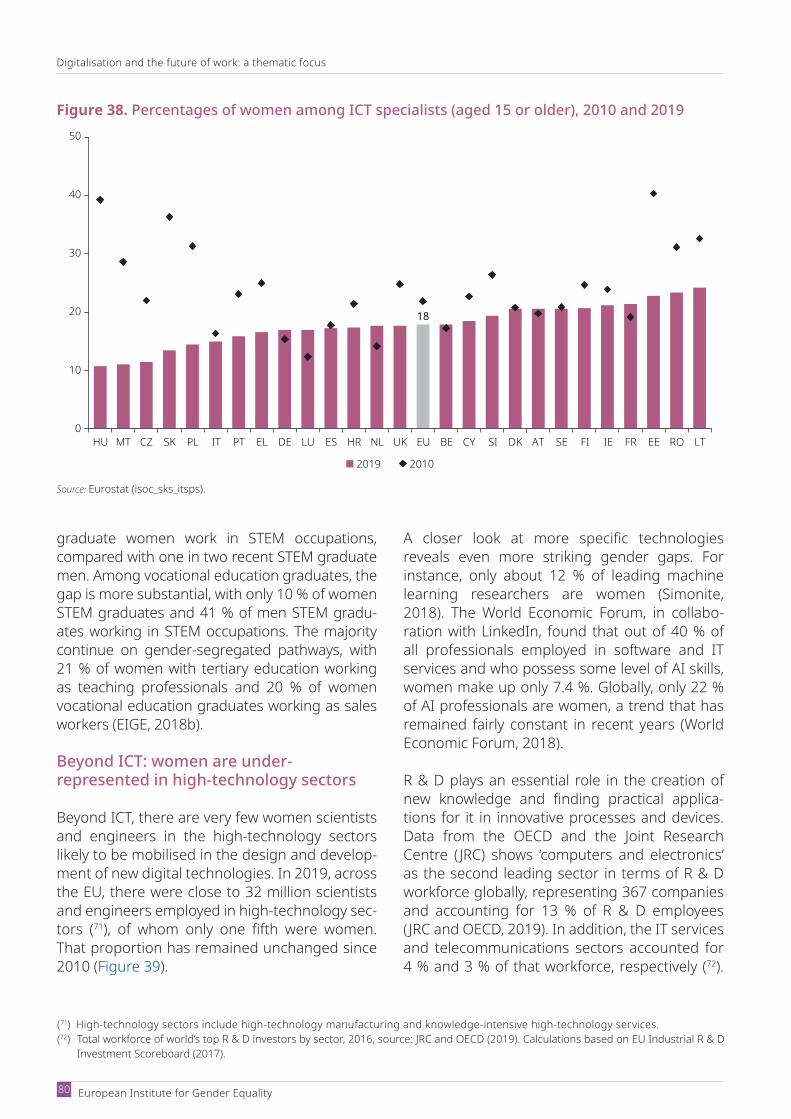
Digitalisation and the future of work: a thematic focus
European Institute for Gender Equality 80
graduate women work in STEM occupations, compared with one in two recent STEM graduate men. Among vocational education graduates, the gap is more substantial, with only 10 % of women STEM graduates and 41 % of men STEM gradu-ates working in STEM occupations. The majority continue on gender-segregated pathways, with 21 % of women with tertiary education working as teaching professionals and 20 % of women vocational education graduates working as sales workers (EIGE, 2018b).
Beyond ICT: women are under- represented in high-technology sectors
Beyond ICT, there are very few women scientists and engineers in the high-technology sectors likely to be mobilised in the design and develop-ment of new digital technologies. In 2019, across the EU, there were close to 32 million scientists and engineers employed in high-technology sec-tors (71), of whom only one fifth were women. That proportion has remained unchanged since 2010 (Figure 39).
A closer look at more specific technologies reveals even more striking gender gaps. For instance, only about 12 % of leading machine learning researchers are women (Simonite, 2018). The World Economic Forum, in collabo-ration with LinkedIn, found that out of 40 % of all professionals employed in software and IT services and who possess some level of AI skills, women make up only 7.4 %. Globally, only 22 % of AI professionals are women, a trend that has remained fairly constant in recent years (World Economic Forum, 2018).
R & D plays an essential role in the creation of new knowledge and finding practical applica-tions for it in innovative processes and devices. Data from the OECD and the Joint Research Centre ( JRC) shows ‘computers and electronics’ as the second leading sector in terms of R & D workforce globally, representing 367 companies and accounting for 13 % of R & D employees ( JRC and OECD, 2019). In addition, the IT services and telecommunications sectors accounted for 4 % and 3 % of that workforce, respectively (72).
(71) High-technology sectors include high-technology manufacturing and knowledge-intensive high-technology services.(72) Total workforce of world’s top R & D investors by sector, 2016, source: JRC and OECD (2019). Calculations based on EU Industrial R & D
Investment Scoreboard (2017).
Figure 38. Percentages of women among ICT specialists (aged 15 or older), 2010 and 2019
18
0
10
20
30
40
50
HU MT CZ SK PL IT PT EL DE LU ES HR NL UK EU BE CY SI DK AT SE FI IE FR EE RO LT
2019 2010
Source: Eurostat (isoc_sks_itsps).
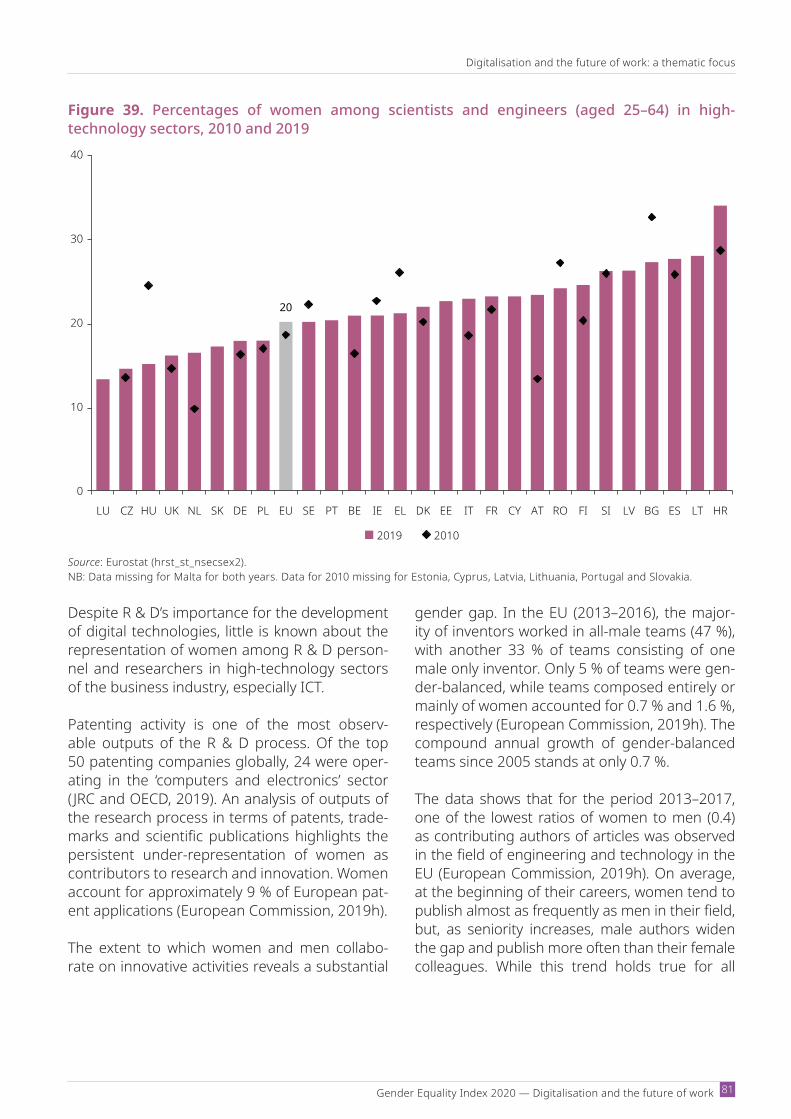
Gender Equality Index 2020 — Digi talisation and the future of work
Digitalisation and the future of work: a thematic focus
81
Despite R & D’s importance for the development of digital technologies, little is known about the representation of women among R & D person-nel and researchers in high-technology sectors of the business industry, especially ICT.
Patenting activity is one of the most observ-able outputs of the R & D process. Of the top 50 patenting companies globally, 24 were oper-ating in the ‘computers and electronics’ sector ( JRC and OECD, 2019). An analysis of outputs of the research process in terms of patents, trade-marks and scientific publications highlights the persistent under-representation of women as contributors to research and innovation. Women account for approximately 9 % of European pat-ent applications (European Commission, 2019h).
The extent to which women and men collabo-rate on innovative activities reveals a substantial
gender gap. In the EU (2013–2016), the major-ity of inventors worked in all-male teams (47 %), with another 33 % of teams consisting of one male only inventor. Only 5 % of teams were gen-der-balanced, while teams composed entirely or mainly of women accounted for 0.7 % and 1.6 %, respectively (European Commission, 2019h). The compound annual growth of gender-balanced teams since 2005 stands at only 0.7 %.
The data shows that for the period 2013–2017, one of the lowest ratios of women to men (0.4) as contributing authors of articles was observed in the field of engineering and technology in the EU (European Commission, 2019h). On average, at the beginning of their careers, women tend to publish almost as frequently as men in their field, but, as seniority increases, male authors widen the gap and publish more often than their female colleagues. While this trend holds true for all
Figure 39. Percentages of women among scientists and engineers (aged 25–64) in high- technology sectors, 2010 and 2019
20
0
10
20
30
40
LU CZ HU UK NL SK DE PL EU SE PT BE IE EL DK EE IT FR CY AT RO FI SI LV BG ES HRLT
2019 2010
Source: Eurostat (hrst_st_nsecsex2).NB: Data missing for Malta for both years. Data for 2010 missing for Estonia, Cyprus, Latvia, Lithuania, Portugal and Slovakia.
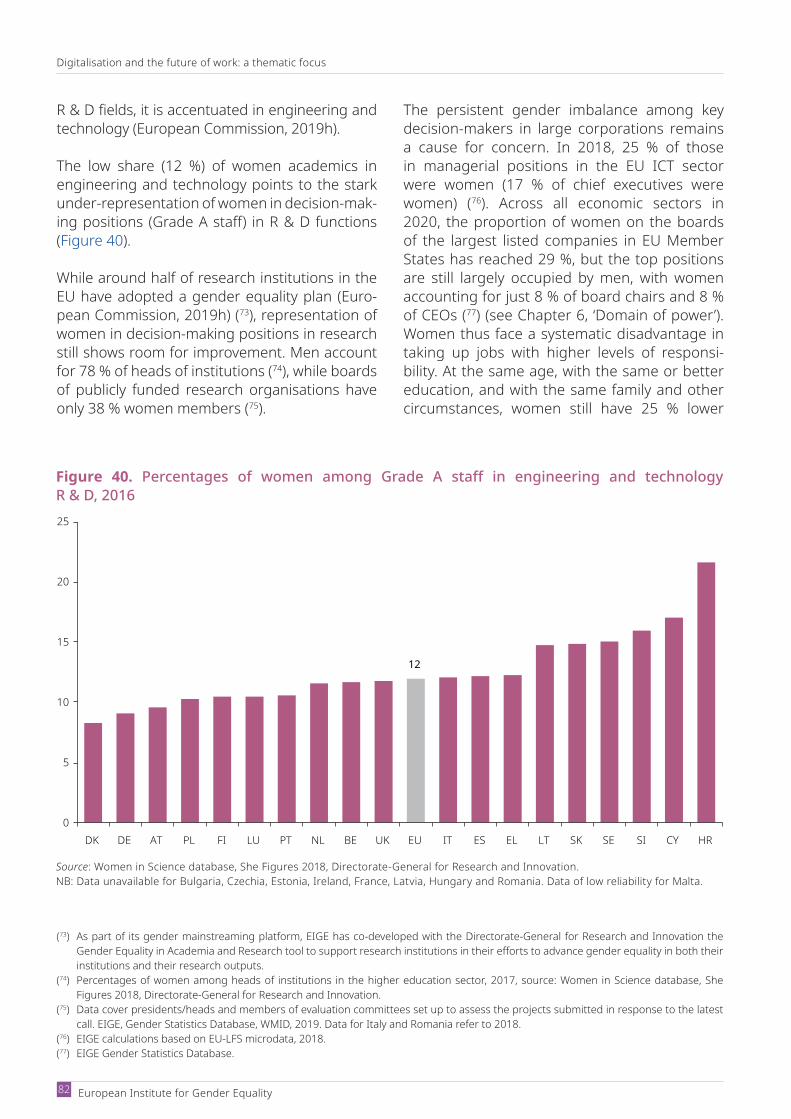
Digitalisation and the future of work: a thematic focus
European Institute for Gender Equality 82
R & D fields, it is accentuated in engineering and technology (European Commission, 2019h).
The low share (12 %) of women academics in engineering and technology points to the stark under-representation of women in decision-mak-ing positions (Grade A staff) in R & D functions (Figure 40).
While around half of research institutions in the EU have adopted a gender equality plan (Euro-pean Commission, 2019h) (73), representation of women in decision-making positions in research still shows room for improvement. Men account for 78 % of heads of institutions (74), while boards of publicly funded research organisations have only 38 % women members (75).
The persistent gender imbalance among key decision-makers in large corporations remains a cause for concern. In 2018, 25 % of those in managerial positions in the EU ICT sector were women (17 % of chief executives were women) (76). Across all economic sectors in 2020, the proportion of women on the boards of the largest listed companies in EU Member States has reached 29 %, but the top positions are still largely occupied by men, with women accounting for just 8 % of board chairs and 8 % of CEOs (77) (see Chapter 6, ‘Domain of power’). Women thus face a systematic disadvantage in taking up jobs with higher levels of responsi-bility. At the same age, with the same or better education, and with the same family and other circumstances, women still have 25 % lower
(73) As part of its gender mainstreaming platform, EIGE has co-developed with the Directorate-General for Research and Innovation the Gender Equality in Academia and Research tool to support research institutions in their efforts to advance gender equality in both their institutions and their research outputs.
(74) Percentages of women among heads of institutions in the higher education sector, 2017, source: Women in Science database, She Figures 2018, Directorate-General for Research and Innovation.
(75) Data cover presidents/heads and members of evaluation committees set up to assess the projects submitted in response to the latest call. EIGE, Gender Statistics Database, WMID, 2019. Data for Italy and Romania refer to 2018.
(76) EIGE calculations based on EULFS microdata, 2018.(77) EIGE Gender Statistics Database.
Figure 40. Percentages of women among Grade A staff in engineering and technology R & D, 2016
12
0
5
10
15
20
25
DK DE AT PL FI LU PT NL BE UK EU IT ES EL LT SK SE SI CY HR
Source: Women in Science database, She Figures 2018, Directorate-General for Research and Innovation.NB: Data unavailable for Bulgaria, Czechia, Estonia, Ireland, France, Latvia, Hungary and Romania. Data of low reliability for Malta.

Gender Equality Index 2020 — Digi talisation and the future of work
Digitalisation and the future of work: a thematic focus
83
odds of progressing to higher profile jobs (Euro-pean Commission, 2018c).
Many factors influence the persistent gender seg-regation in STEM and R & D jobs. These include gender stereotypes and the gender divide in digital skills and educational background, but also masculine organisational culture and a lack of work–life balance options and role models (Valenduc, 2011; Valenduc et al., 2004), (see sub-section 9.2.4). While data are scarce for the EU on the prevalence of sexual harassment in the science and technology sector, evidence from other parts of the world highlights systemic sex-ual harassment, which may discourage women from entering the sector or encourage their exit from it (National Academies of Sciences Engi-neering and Medicine, 2018; Seiner, 2019).
9.2. Digital transformation of the world of work
Advances in digitalisation have had profound impacts on the labour market, chiefly resulting from the adoption of new ICT, increased use and storage of digitally codified information, and new developments in AI and robotics (Autor, 2015; Valenduc and Vendramin, 2017). Public debate on this transformation usually focuses either on its potential to boost economic productivity and growth or on the challenges it presents for work-ers, businesses and labour market regulation, paying only limited attention to gender equality prospects.
This section focuses on the gendered implica-tions of several key advances in the digitalisation of the world of work. While these can be under-stood as a continuation of long-term trends in labour market transformation (Valenduc and Vendramin, 2017), the analysis here is mostly limited to developments within the past decade and their implications for the future. More specif-ically, it covers the following.
Job automation – that is, a process in which human labour input is replaced by (digitally
enabled) machine input (Eurofound, 2018a). In the past decade, the ‘exponential growth in the collection, storage, and processing of digi-tised information’ (Valenduc and Vendramin, 2017, p. 124) has enabled the development of powerful algorithms that exploit these data to ‘learn’ how to perform an increasing range of tasks. This has enhanced the capacity of machines to perform tasks previously done by workers (Autor, 2015; Frey and Osborne, 2017), encouraging further transformation of employment structures and content as new technologies increasingly replace or comple-ment workers.
Use of new technologies at work. With work-ers increasingly working alongside digitally enabled machines, there is higher demand for both basic and advanced digital skills in the labour market. This contributes to the growth of employment in certain well-paid sectors that require advanced digital skills, such as ICT. It also supports the use of new technologies in other sectors, often resulting in transformation of work practices, condi-tions and quality.
Greater flexibility of work. The spread of por-table devices (e.g. computers, tablets and smartphones) and improvements in internet connectivity and infrastructure have enabled increasing amounts of work to be carried out at various places and times. This allows (and sometimes obliges) people to work ‘anytime, anywhere’ (Eurofound and ILO, 2017).
New forms of work. The remote working enabled by ICT has contributed to an increas-ing amount of work being contracted out (Howcroft and Rubery, 2018; Piasna and Dra-hokoupil, 2017), with new contracting prac-tices emerging in the context of platform work.
Within the EU policy framework, the digital trans-formation of work is addressed under the Euro-pean Pillar of Social Rights, which endorses the

Digitalisation and the future of work: a thematic focus
European Institute for Gender Equality 84
principles of fair working conditions, access to social protection and gender equality. Although the Pillar underlines the importance of sup-porting emerging business models, innovative forms of work, entrepreneurship and self-em-ployment, support for such new business mod-els should entail quality working conditions and equal treatment of workers irrespective of the type of employment relationship. In 2018, the European Commission set up a high-level expert group to look at the process of the digi-tal transformation of the EU labour market, pro-vide analysis and explore policy options. To date, much of the gender equality focus has been on the gender segregation of some key sectors linked to digitalisation, such as ICT and STEM, notably in the context of the recent WiD decla-ration. When it comes to platform work, this is part of the EU’s single market strategy and also part of the digital strategy. In its communication on the European agenda for the collaborative economy ( June 2016), the Commission provided guidance for Member States on the application of existing EU rules to the platform economy, including fair working conditions, and adequate and sustainable consumer and social protec-tion. More recently, the President of the Euro-pean Commission stated that she ‘will look at ways of improving the labour conditions of plat-form workers’ (von der Leyen, 2019). Platform work will be covered by the preparations for the Digital Services Act (78), which should upgrade the liability and safety rules for digital platforms, services and products, and complete the digital single market.
The analysis of the gendered implications of dig-ital transformation of work is structured in five subsections. The first looks at the broad labour market transformation resulting from automa-tion of work and increased use of new technolo-gies, and gives a broad overview of the gendered implications of these changes. The remaining subsections then provide a more detailed anal-ysis of the challenges and opportunities for gender equality in the context of two economic activities closely linked to digitalisation, one usu-ally offering wellpaid, highquality jobs (the ICT sector) and the other often providing low-paid,
less secure but highly flexible opportunities (cer-tain types of platform work). The second sub-section analyses the employment prospects for women and men within these economic activi-ties, while the third discusses new forms of work and flexible working practices from a gender equality perspective. The fourth and fifth subsec-tions look at the implications of digitalisation for work–life balance and gender differences in pay, respectively.
As the analysis focuses chiefly on recent tech-nological developments, it is often severely constrained by the availability of (gender-disag-gregated) data. Quantitative data on platform work, for example, is limited to several recent surveys covering a number of EU Member States. There is no EUwide survey and existing surveys suffer from a range of methodological weak-nesses inherent in monitoring a newly emerging phenomenon. As gender-disaggregated data on platform work is extremely limited, the gen-der analysis relies on qualitative, and sometimes rather speculative, research. This is, to a consid-erable degree, true for the analysis of job auto-mation as well.
9.2.1. Job automation, use of new technologies and transformation of the labour market
Much of the current policy debate about the future of work centres on the increased use of digital technologies and their capacity to replace or complement workers in an ever-broadening range of tasks. The spread of new technologies is often seen as a way to increase the produc-tivity and competitiveness of the EU economy. Notably, a range of time-consuming or physi-cally demanding routine tasks have proven fea-sible to automate ( JRC, 2020b), enabling some workers to focus on more creative aspects of their work, increasing added value and – in some cases – leading to improvements in work-ing conditions (Eurofound, 2018c; JRC, 2019a). However, technological progress also has the potential to be highly disruptive, as many jobs need to be reorganised and technology will
(78) https://ec.europa.eu/digital-single-market/en/digital-services-act-package

Gender Equality Index 2020 — Digi talisation and the future of work
Digitalisation and the future of work: a thematic focus
85
completely replace workers in some instances (Eurofound, 2020a).
While digital technologies have transformed the majority of workplaces in the EU labour market, gender differences in the use of ICT at work per-sist. Eurostat data show that 71 % of those in employment (79) use computers, laptops, smart-phones, tablets or other portable devices at work, with the proportion reaching 95 % in some sectors (80). The past 5 years have seen the use of digital technologies increase in almost 9 out of 10 workplaces in the EU (European Commis-sion, 2016b). Yet women continue to use some digital technologies less frequently than men (Figure 41), which is likely to limit their employ-ment prospects in jobs that depend on the use of such technologies.
Earlier estimates predicted that digitalisation could lead to alarmingly high rates of job loss due to automation in the next decade or so (Frey and Osborne, 2017; World Economic Forum, 2016), but these have since been tempered by more modest estimates for OECD economies of 10–20 % of jobs at risk (International Monetary Fund, 2018; OECD, 2016; PwC, 2019). Increas-ingly, it looks like many jobs will be transformed rather than fully automated, with workers switch-ing to tasks that complement new technologies from tasks that are being replaced by them (Autor, 2015; European Commission, 2019e). Some entirely new jobs (or jobs transformed so profoundly as to effectively constitute new jobs) are also likely to appear (Eurofound, 2020a), for example in the STEM sector.
Figure 41. Use of ICT at work and activities performed by women and men (aged 16–74) in the EU (%), 2018
11
39
24
18
47
60
22
70
5
37
20
18
47
62
15
72
0 10 20 30 40 50 60 70 80
Developed or maintained IT sys tems or software
Used occupation-specific software
Used applications to receive tasks or instructions
Used social media for their work
Created or edited electronic documents
Exchanged emails or entered data into databases
Used other computerised equipment or machinery such asthose used in production lines or transport
Used computers, laptops, smartphones, tablets or otherportable devices
Women Men
Source: Eurostat, ISOC (isoc_iw_ap).NB: The Figure presents the percentages of individuals who use ICT at work as a proportion of all employees and self-employed people who used the internet in the past year.
(79) Percentage of employees and self-employed people who used the internet within the past year.(80) Eurostat (isoc_iw_ap).
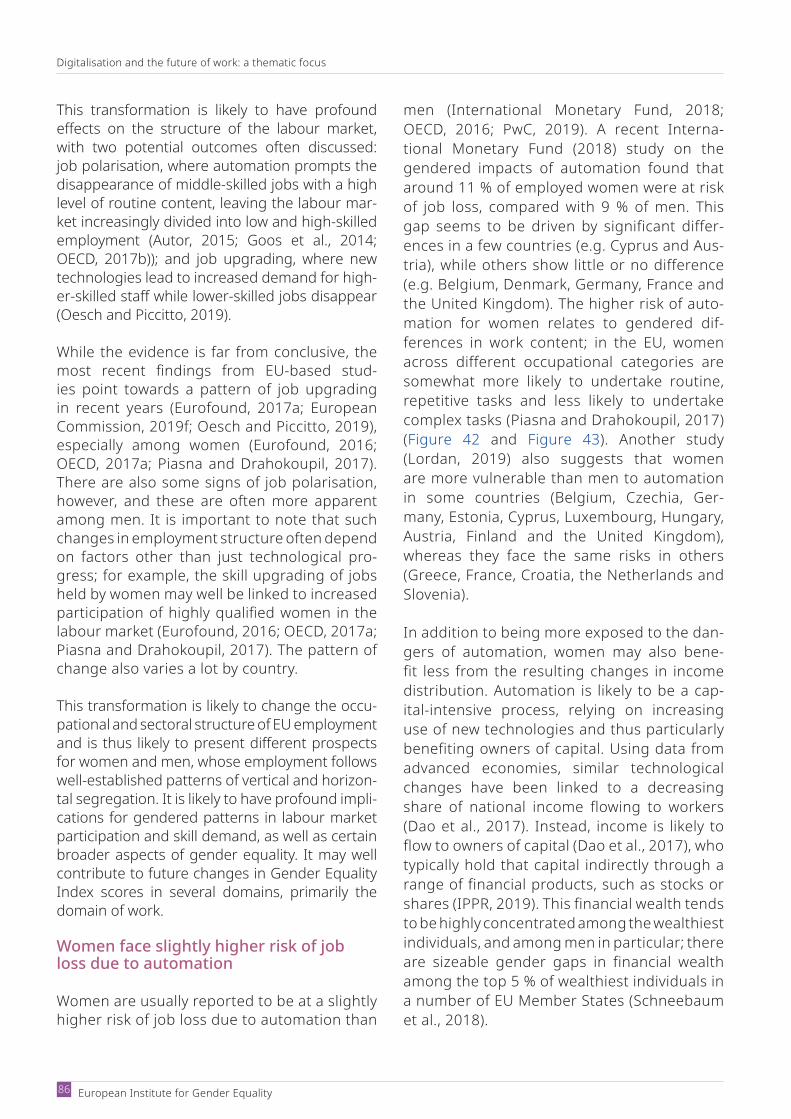
Digitalisation and the future of work: a thematic focus
European Institute for Gender Equality 86
This transformation is likely to have profound effects on the structure of the labour market, with two potential outcomes often discussed: job polarisation, where automation prompts the disappearance of middle-skilled jobs with a high level of routine content, leaving the labour mar-ket increasingly divided into low and high-skilled employment (Autor, 2015; Goos et al., 2014; OECD, 2017b)); and job upgrading, where new technologies lead to increased demand for high-erskilled staff while lowerskilled jobs disappear (Oesch and Piccitto, 2019).
While the evidence is far from conclusive, the most recent findings from EUbased stud-ies point towards a pattern of job upgrading in recent years (Eurofound, 2017a; European Commission, 2019f; Oesch and Piccitto, 2019), especially among women (Eurofound, 2016; OECD, 2017a; Piasna and Drahokoupil, 2017). There are also some signs of job polarisation, however, and these are often more apparent among men. It is important to note that such changes in employment structure often depend on factors other than just technological pro-gress; for example, the skill upgrading of jobs held by women may well be linked to increased participation of highly qualified women in the labour market (Eurofound, 2016; OECD, 2017a; Piasna and Drahokoupil, 2017). The pattern of change also varies a lot by country.
This transformation is likely to change the occu-pational and sectoral structure of EU employment and is thus likely to present different prospects for women and men, whose employment follows well-established patterns of vertical and horizon-tal segregation. It is likely to have profound impli-cations for gendered patterns in labour market participation and skill demand, as well as certain broader aspects of gender equality. It may well contribute to future changes in Gender Equality Index scores in several domains, primarily the domain of work.
Women face slightly higher risk of job loss due to automation
Women are usually reported to be at a slightly higher risk of job loss due to automation than
men (International Monetary Fund, 2018; OECD, 2016; PwC, 2019). A recent Interna-tional Monetary Fund (2018) study on the gendered impacts of automation found that around 11 % of employed women were at risk of job loss, compared with 9 % of men. This gap seems to be driven by significant differ-ences in a few countries (e.g. Cyprus and Aus-tria), while others show little or no difference (e.g. Belgium, Denmark, Germany, France and the United Kingdom). The higher risk of auto-mation for women relates to gendered dif-ferences in work content; in the EU, women across different occupational categories are somewhat more likely to undertake routine, repetitive tasks and less likely to undertake complex tasks (Piasna and Drahokoupil, 2017) (Figure 42 and Figure 43). Another study (Lordan, 2019) also suggests that women are more vulnerable than men to automation in some countries (Belgium, Czechia, Ger-many, Estonia, Cyprus, Luxembourg, Hungary, Austria, Finland and the United Kingdom), whereas they face the same risks in others (Greece, France, Croatia, the Netherlands and Slovenia).
In addition to being more exposed to the dan-gers of automation, women may also bene-fit less from the resulting changes in income distribution. Automation is likely to be a cap-ital-intensive process, relying on increasing use of new technologies and thus particularly benefiting owners of capital. Using data from advanced economies, similar technological changes have been linked to a decreasing share of national income flowing to workers (Dao et al., 2017). Instead, income is likely to flow to owners of capital (Dao et al., 2017), who typically hold that capital indirectly through a range of financial products, such as stocks or shares (IPPR, 2019). This financial wealth tends to be highly concentrated among the wealthiest individuals, and among men in particular; there are sizeable gender gaps in financial wealth among the top 5 % of wealthiest individuals in a number of EU Member States (Schneebaum et al., 2018).
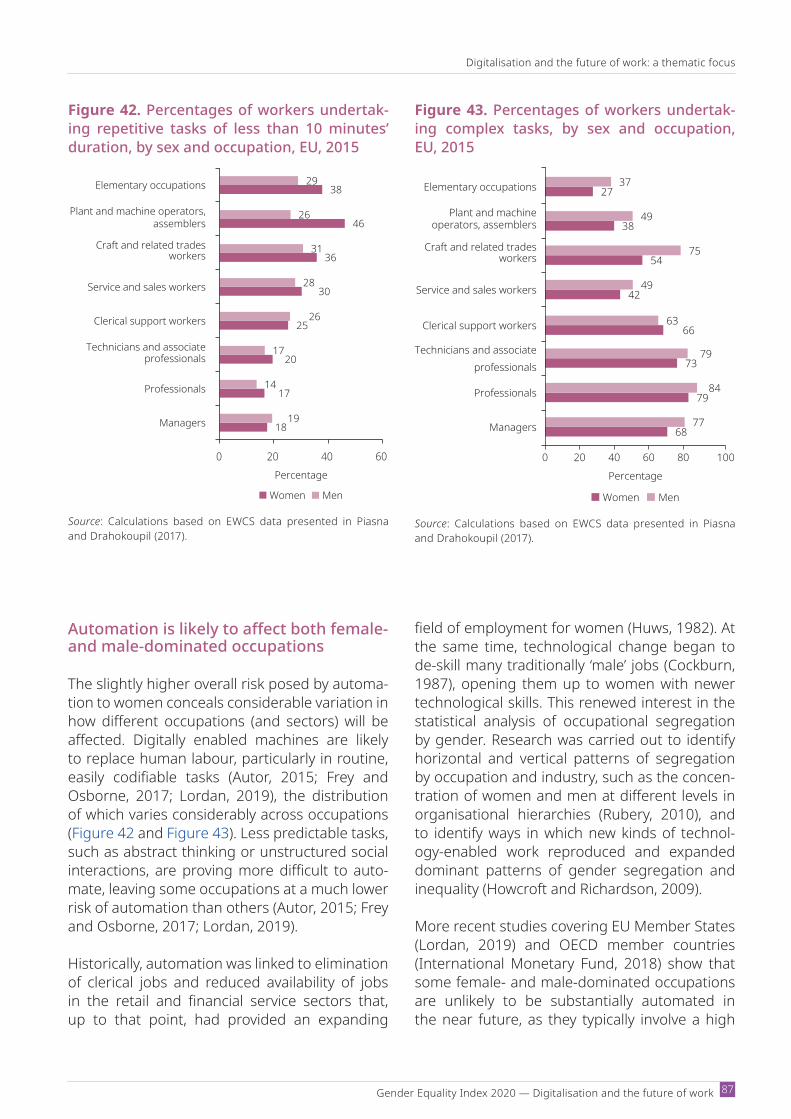
Gender Equality Index 2020 — Digi talisation and the future of work
Digitalisation and the future of work: a thematic focus
87
Automation is likely to affect both female- and male-dominated occupations
The slightly higher overall risk posed by automa-tion to women conceals considerable variation in how different occupations (and sectors) will be affected. Digitally enabled machines are likely to replace human labour, particularly in routine, easily codifiable tasks (Autor, 2015; Frey and Osborne, 2017; Lordan, 2019), the distribution of which varies considerably across occupations (Figure 42 and Figure 43). Less predictable tasks, such as abstract thinking or unstructured social interactions, are proving more difficult to auto-mate, leaving some occupations at a much lower risk of automation than others (Autor, 2015; Frey and Osborne, 2017; Lordan, 2019).
Historically, automation was linked to elimination of clerical jobs and reduced availability of jobs in the retail and financial service sectors that, up to that point, had provided an expanding
field of employment for women (Huws, 1982). At the same time, technological change began to de-skill many traditionally ‘male’ jobs (Cockburn, 1987), opening them up to women with newer technological skills. This renewed interest in the statistical analysis of occupational segregation by gender. Research was carried out to identify horizontal and vertical patterns of segregation by occupation and industry, such as the concen-tration of women and men at different levels in organisational hierarchies (Rubery, 2010), and to identify ways in which new kinds of technol-ogyenabled work reproduced and expanded dominant patterns of gender segregation and inequality (Howcroft and Richardson, 2009).
More recent studies covering EU Member States (Lordan, 2019) and OECD member countries (International Monetary Fund, 2018) show that some female- and male-dominated occupations are unlikely to be substantially automated in the near future, as they typically involve a high
Figure 42. Percentages of workers undertak-ing repetitive tasks of less than 10 minutes’ duration, by sex and occupation, EU, 2015
18
17
20
25
30
36
46
38
19
14
17
26
28
31
26
29
0 20 40 60
Managers
Professionals
Technicians and associateprofessionals
Clerical support workers
Service and sales workers
Craft and related tradesworkers
Plant and machine operators,assemblers
Elementary occupations
Percentage
Women Men
Source: Calculations based on EWCS data presented in Piasna and Drahokoupil (2017).
Figure 43. Percentages of workers undertak-ing complex tasks, by sex and occupation, EU, 2015
68
79
73
66
42
54
38
27
77
84
79
63
49
75
49
37
0 20 40 60 80 100
Managers
Professionals
Technicians and associateprofessionals
Clerical support workers
Service and sales workers
Craft and related tradesworkers
Plant and machineoperators, assemblers
Elementary occupations
Percentage
Women Men
Source: Calculations based on EWCS data presented in Piasna and Drahokoupil (2017).
Digitalisation and the future of work: a thematic focus
European Institute for Gender Equality 88
degree of intellectual tasks or a mix of intellectual and social tasks. For example, some health, edu-cation and social service occupations dominated by women, such as schoolteacher or personal care worker in a residential service, are consid-ered difficult to automate. In fact, the number of personal care workers has risen substantially in recent years (Eurofound, 2017a), mostly as a result of demographic shifts in the EU population that have increased demand for such services. Some maledominated occupations, such as ICT/engineering professional or high-ranking man-ager, are also unlikely to face large job losses due to automation (Eurofound, 2017a; Lordan, 2019). For ICT/engineering professionals, technological progress instead drives job creation, as demon-strated by strong sustained growth in employ-ment in these activities (see subsection 9.2.2). This makes the lack of women in these sectors particularly concerning.
Conversely, some female- and male-dominated occupations are characterised by high levels of routine content and are thus at increased risk of automation. For example, certain key tasks carried out (mostly by men) in transport, stor-age and manufacturing activities (e.g. physical manipulation of heavy goods) may become auto-mated (Eurofound, 2018c; Lordan, 2019). Clerical support work, carried out primarily by women, may also be increasingly performed by machines (Lordan, 2019). This may lead to job loss in some cases, while, in others, it will prompt a profound job transformation that will require workers to perform new, often higher-skilled tasks (Euro-found, 2018c).
Highly educated women often enter new jobs that are difficult to automate
While women face a somewhat higher risk of automation based on current employment pat-terns, there are signs that the structure of wom-en’s employment is changing, with high-skilled work increasingly prevalent. Women’s educa-tional attainment has grown rapidly and many
education gender gaps that existed in the past have already been eliminated, as can be seen from the Gender Equality Index scores in the domain of knowledge. Women have begun to take most of the new high-skilled jobs (81) that are unlikely to be automated in the near future: around 8 million of the 12 million high-skilled jobs created between 2003 and 2015 in the EU went to women (OECD, 2017a). This led to an ‘upgrading in the female occupational structure, with the share of women in high skilled occu-pations … increasing’ (Piasna and Drahokoupil, 2017, p. 7). This does not, however, mean that women are paid equally to men in these jobs.
The fact that women have, on average, lower wages than men may affect the patterns of automation (Rubery, 2018). Firstly, the low-paid nature of certain female-dominated occupations (e.g. domestic work) may slow down the pace of digital innovation, since such innovation can be, at least initially, quite costly and may not always pay off when labour costs are low (Rubery, 2018). This may protect some women from job loss at least in the short term, although it brings little prospect of better pay or working conditions. Secondly, since women tend to earn less than men in the same occupations, this may provide them with new opportunities when male-dom-inated occupations become reorganised or restructured as a result of automation. In such cases, employers may favour hiring women into new positions because of their lower salary demands. Based on previous experience, this often results in ‘first a period of desegregation of male-dominated jobs, followed by either the fem-inisation of the whole occupation or the emer-gence of new feminised subdivisions within the occupation’ (Rubery, 2018). In the service sector, for example, programming tasks that were wellpaid and highly skilled in the recent past may become ‘feminised’ – although more women are recruited, they continue to be treated as ‘second-ary earners’ and their wages drop (Howcroft and Richardson, 2009). Thus, efforts to ensure equal pay for equal work will be needed if women are to fully benefit from such new opportunities.
(81) These include jobs classified under major groups 1, 2, and 3 in the third version of the International Standard Classification of Occupations (ISCO88), namely legislators, senior officials and managers (group 1); professionals (group 2); and technicians and associate professionals (group 3).

Gender Equality Index 2020 — Digi talisation and the future of work
Digitalisation and the future of work: a thematic focus
89
The potential of automation to challenge existing gender inequalities remains unclear
Given the uncertain nature of changes in tech-nology and gender relations, it is difficult to go beyond stylised lists of factors likely to influence the gender equality outcomes of automation in the future. The current literature mostly lim-its itself to speculating about the ways in which this process could affect gender equality, namely gender segregation, division of unpaid work, pay gaps and working conditions. All of these specu-lative scenarios have something in common: the changes have the potential to improve gender equality but their outcomes are highly uncertain and there is no guarantee that their promise will be fulfilled. Indeed, the research reviewed (Howcroft and Rubery, 2018; IPPR, 2019; Rubery, 2018) suggests that this is unlikely to happen without (1) gender-sensitive regulation, institu-tions and policies; (2) challenges to established gender stereotypes, such as those relating to ICT and STEM participation and caring activities; and (3) greater representation of women in key deci-sion-making positions.
9.2.2. Employment prospects in the ICT sector and platform work
Apart from its potential to replace human work, digitalisation offers a range of new opportunities, either by transforming existing jobs or creating entirely new ones. Access to such opportunities is likely to be highly gendered, given the segre-gated nature of the EU labour market, the vari-ety of gender stereotypes around employment in certain jobs and related gender differences in career expectations. This section analyses the differences in participation of women and men in two quite different types of job opportunities linked to digitalisation.
Firstly, the increasing digitalisation of work has created a growing demand for high-skilled work-ers with advanced digital skills, apparent across all economic sectors. This section looks in par-ticular at the job prospects of women and men in the ICT sector, in view of the high demand for ICT specialists during the past decade or so (Eurostat, 2019b) and the fact that the workforce remains male dominated.
Potential of job automation to improve gender equality
Scenario 1 – Index domain of work. Transformation of the labour market structure offers an opportunity to change established gendered patterns of employment, especially in the con-text of the rapid growth of women’s skills (IPPR, 2019; Rubery, 2018). However, evidence from the past decade shows little – if any – progress on the desegregation of the EU labour market (Piasna and Drahokoupil, 2017). Jobs within the STEM and ICT sectors are a stark example of this lack of progress (see subsection 9.1.3).
Scenario 2 – Index domain of time. Potential job loss due to automation has sparked debates about more balanced distribution of paid and unpaid work among women and men (Howcroft and Rubery, 2018; IPPR, 2019; Rubery, 2018). If machines replace a significant share of human work input, this may reduce the overall amount of jobs available. To better distribute the remaining work, proposals to reduce the duration of the working week are frequently discussed, with potential pos-itive outcomes for gendered division of unpaid work. In this context, the recognition of women and men as equal earners and equal carers across the life cycle will be important.
Scenario 3 – Index domain of money. Automating some routine tasks can free up more time for tasks requiring interpersonal, creative or advanced ICT skills (Howcroft and Rubery, 2018; IPPR, 2019). This is an opportunity to upskill certain low-paid jobs held by women and perhaps even achieve higher wages and reduced pay gaps.

Digitalisation and the future of work: a thematic focus
European Institute for Gender Equality 90
Perhaps less obvious is the fact that digitali-sation enables the creation of a broad range of lowskilled opportunities, for example in the context of certain forms of platform work. While platform work includes some well-paid, high-skilled opportunities (Eurofound, 2018b), there are many poorly paid jobs that
serve only to supplement income from other sources (Huws et al., 2019; ILO, 2018c; JRC, 2018). Women are currently under-repre-sented in platform work, with the employment structure following the well-established pat-terns of gender segregation in the broader economy.
Definition of platform work
There are many definitions of platform work, resulting in a lack of consistency in the use of the term. This report adopts Eurofound’s understanding of platform work as a ‘form of employ-ment that uses an online platform to enable organisations or individuals to access other organisations or individuals to solve problems or to provide services in exchange for pay-ment’ (Eurofound, 2018b, p. 9). According to this definition, platform work has several key features:
paid work is organised through an online platform;
three parties are involved: the online platform, the client and the worker;
the aim is to carry out specific tasks or solve specific problems;
the work is outsourced or contracted out;
jobs are broken down into tasks;
services are provided on demand.
Generally, platforms can be divided into those where work is delivered purely online (e.g. Ama-zon Mechanical Turk) and those where work is delivered on-site (e.g. Uber). The most com-mon tasks performed include (1) professional tasks (e.g. software development or translation); (2) transport (e.g. personal transport or food delivery); (3) household tasks (e.g. cleaning or plumbing); and (4) micro tasks (e.g. tagging images online).
Full potential of the ICT sector cannot be realised without gender equality
Recent decades have seen EU Member States gradually transform their labour markets, reflect-ing the trends towards digitalised and knowl-edgebased economies. The STEM sector and in particular the ICT sector have increased in importance in the overall economy and secured their status as providing well-paid, secure and high-quality jobs. From 2008 to 2018, the growth
in employment of ICT specialists was more than 12 times the average employment growth in the EU, with the share of ICT specialists in total employment increasing by 1.1 p.p. (from 2.8 % to 3.9 %) (Eurostat, 2019b). The ICT sector was one of the few that withstood the effects of the financial crisis and continued to experience growth. However, of the 9 million ICT specialists, only around 18 % are women, and the share of women in ICT jobs in the EU has decreased by 4 % since 2010 (see subsection 9.1.3).
Gender Equality Index 2020 — Digi talisation and the future of work
Digitalisation and the future of work: a thematic focus
91
Even larger growth of the ICT sector has been limited by the substantial mismatch between high demand and relatively low supply of ICT specialists in the EU labour market. The majority of EU Member States report difficulties in find-ing a sufficient number of science, engineering and ICT professionals (European Commission, 2014a). A recent estimate suggested that the EU faced a shortage of some 600 000 ICT spe-cialists in 2018 (European Commission, 2018h). This mismatch between the supply of ICT special-ists and employer demand is likely to remain for some time, as STEM specialists and in particular ICT specialists continue to be in high demand (Cedefop, 2018).
With the ICT sector heavily gender segregated and facing a huge demand for new specialists, the greater involvement of women seems to be a policy strategy with obvious economic and social benefits. EIGE has estimated that attract-ing more women into the STEM and ICT sectors would lead to economic growth in the EU, with more jobs (an increase of up to 1.2 million by 2050) and an increase in GDP over the long term (by up to EUR 820 billion by 2050) (EIGE, 2017c).
Growth in personal and household services provided via platforms could support women’s employment
The platform economy (82) in the EU is, as yet, a relatively small phenomenon. In 2015, revenue in the five key sectors of the platform econ-omy (83) were estimated at roughly EUR 4 bil-lion (European Commission, 2019b), with the highest revenues recorded for peer-to-peer transport (EUR 1.7 billion) and accommodation (EUR 1.2 billion). These revenues were predicted to grow rapidly in the coming years (PwC, 2016), but this may turn out to be overly optimistic in the light of the COVID19 pandemic.
Despite the uncertainty about future growth of the platform economy, it is interesting to note that on-demand personal and household ser-vices (cooking, cleaning, plumbing, etc.) were estimated to have the highest growth potential (PwC, 2016). This suggests that there is consid-erable demand for outsourcing unpaid domestic work via platforms. This could support the labour market participation of women (Overseas Devel-opment Institute, 2019). Highly qualified women
(82) Denoting forprofit companies using platforms, apps and other digital technologies to organise exchanges. Note that this is a broader definition than that of platform work, which refers to online platforms matching the supply of and demand for paid labour.
(83) Peer-to-peer accommodation, peer-to-peer transport, on-demand household services, on-demand professional services and collaborative finance.
(84) https://www.weforum.org/agenda/2020/04/gig-workers-hardest-hit-coronavirus-pandemic/(85) See, for example, https://www.businessinsider.com/uberannounceslayoffs3700jobcuts14percentemployeescoronavirus20205,
https://www.forbes.com/sites/jonathankeane/2020/05/22/from-the-us-to-india-the-gig-economy-job-cuts-went-even-deeper-this-week/#4b165abc6999 and https://news.airbnb.com/a-message-from-co-founder-and-ceo-brian-chesky/
(86) See, for example, https://time.com/5836868/gig-economy-coronavirus/ and https://www.eurofound.europa.eu/publications/article/ 2020/coronavirus-highlights-sick-pay-void-for-platform-workers
(87) https://time.com/5836868/gig-economy-coronavirus/
The scant early information on the impacts of the COVID19 pandemic on the platform econ-omy available at the time of writing indicates that there will be negative consequences. Early survey statistics published by the World Economic Forum (84) show that, globally, as much as half of platform workers may have lost their jobs, and a further 26 % have seen their working hours decrease. The impacts on certain on-site services, such as ride-hailing or accommodation rental, seem to have been particularly damaging (85). Other services, such as delivery or online work, appear to be less affected (86). However, there are some concerns about the influx of newly unemployed people into the platform economy, resulting in lower wages and reduced work available per worker (87).
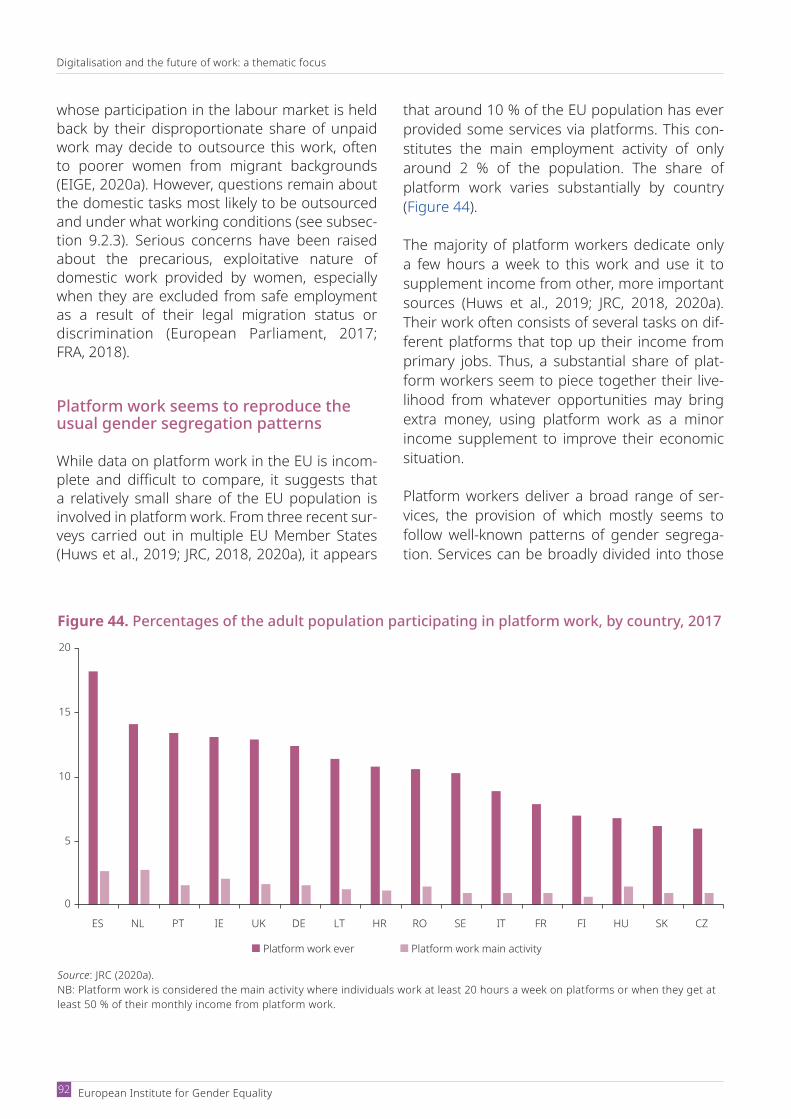
Digitalisation and the future of work: a thematic focus
European Institute for Gender Equality 92
Figure 44. Percentages of the adult population participating in platform work, by country, 2017
0
5
10
15
20
ES NL PT IE UK DE LT HR RO SE IT FR FI HU SK CZ
Platform work ever Platform work main activity
Source: JRC (2020a).NB: Platform work is considered the main activity where individuals work at least 20 hours a week on platforms or when they get at least 50 % of their monthly income from platform work.
whose participation in the labour market is held back by their disproportionate share of unpaid work may decide to outsource this work, often to poorer women from migrant backgrounds (EIGE, 2020a). However, questions remain about the domestic tasks most likely to be outsourced and under what working conditions (see subsec-tion 9.2.3). Serious concerns have been raised about the precarious, exploitative nature of domestic work provided by women, especially when they are excluded from safe employment as a result of their legal migration status or discrimination (European Parliament, 2017; FRA, 2018).
Platform work seems to reproduce the usual gender segregation patterns
While data on platform work in the EU is incom-plete and difficult to compare, it suggests that a relatively small share of the EU population is involved in platform work. From three recent sur-veys carried out in multiple EU Member States (Huws et al., 2019; JRC, 2018, 2020a), it appears
that around 10 % of the EU population has ever provided some services via platforms. This con-stitutes the main employment activity of only around 2 % of the population. The share of platform work varies substantially by country (Figure 44).
The majority of platform workers dedicate only a few hours a week to this work and use it to supplement income from other, more important sources (Huws et al., 2019; JRC, 2018, 2020a). Their work often consists of several tasks on dif-ferent platforms that top up their income from primary jobs. Thus, a substantial share of plat-form workers seem to piece together their live-lihood from whatever opportunities may bring extra money, using platform work as a minor income supplement to improve their economic situation.
Platform workers deliver a broad range of ser-vices, the provision of which mostly seems to follow well-known patterns of gender segrega-tion. Services can be broadly divided into those
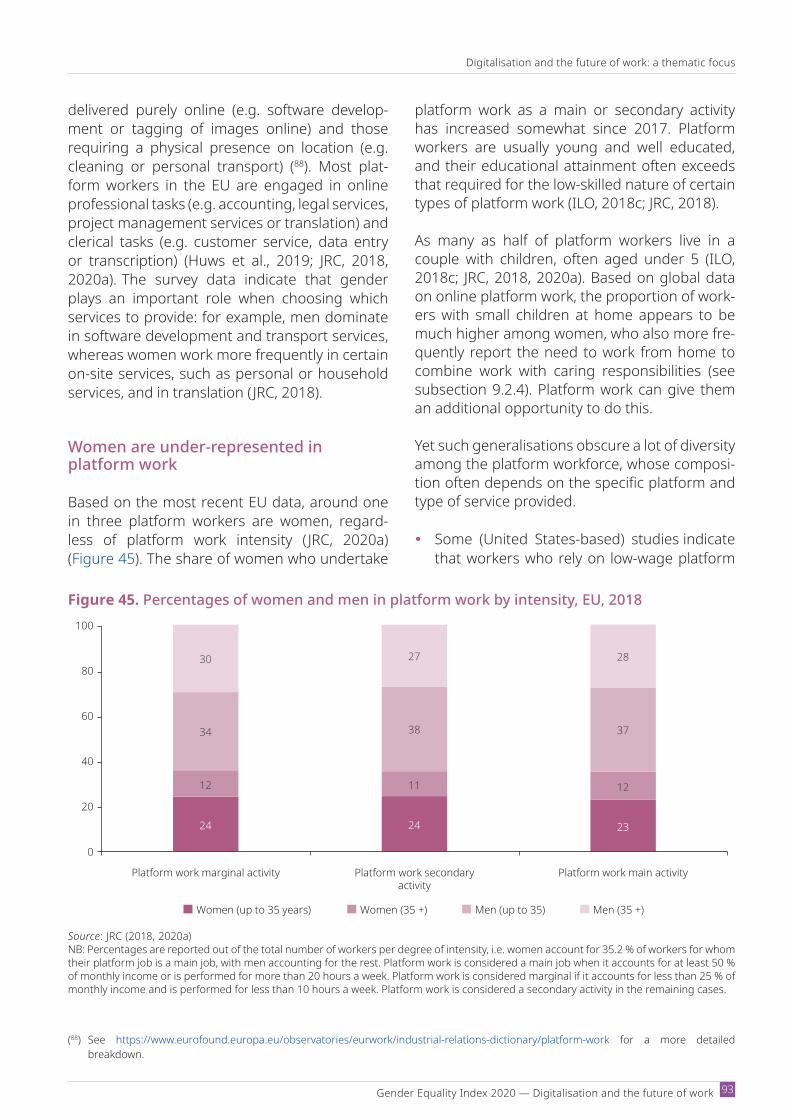
Gender Equality Index 2020 — Digi talisation and the future of work
Digitalisation and the future of work: a thematic focus
93
delivered purely online (e.g. software develop-ment or tagging of images online) and those requiring a physical presence on location (e.g. cleaning or personal transport) (88). Most plat-form workers in the EU are engaged in online professional tasks (e.g. accounting, legal services, project management services or translation) and clerical tasks (e.g. customer service, data entry or transcription) (Huws et al., 2019; JRC, 2018, 2020a). The survey data indicate that gender plays an important role when choosing which services to provide: for example, men dominate in software development and transport services, whereas women work more frequently in certain on-site services, such as personal or household services, and in translation ( JRC, 2018).
Women are under-represented in platform work
Based on the most recent EU data, around one in three platform workers are women, regard-less of platform work intensity ( JRC, 2020a) (Figure 45). The share of women who undertake
platform work as a main or secondary activity has increased somewhat since 2017. Platform workers are usually young and well educated, and their educational attainment often exceeds that required for the low-skilled nature of certain types of platform work (ILO, 2018c; JRC, 2018).
As many as half of platform workers live in a couple with children, often aged under 5 (ILO, 2018c; JRC, 2018, 2020a). Based on global data on online platform work, the proportion of work-ers with small children at home appears to be much higher among women, who also more fre-quently report the need to work from home to combine work with caring responsibilities (see subsection 9.2.4). Platform work can give them an additional opportunity to do this.
Yet such generalisations obscure a lot of diversity among the platform workforce, whose composi-tion often depends on the specific platform and type of service provided.
Some (United Statesbased) studies indicate that workers who rely on low-wage platform
Figure 45. Percentages of women and men in platform work by intensity, EU, 2018
24 24 23
12 11 12
34 38 37
30 27 28
0
20
40
60
80
100
Platform work marginal activity Platform work secondaryactivity
Platform work main activity
Women (up to 35 years) Women (35 +) Men (up to 35) Men (35 +)
Source: JRC (2018, 2020a)NB: Percentages are reported out of the total number of workers per degree of intensity, i.e. women account for 35.2 % of workers for whom their platform job is a main job, with men accounting for the rest. Platform work is considered a main job when it accounts for at least 50 % of monthly income or is performed for more than 20 hours a week. Platform work is considered marginal if it accounts for less than 25 % of monthly income and is performed for less than 10 hours a week. Platform work is considered a secondary activity in the remaining cases.
(88) See https://www.eurofound.europa.eu/observatories/eurwork/industrial-relations-dictionary/platform-work for a more detailed breakdown.
Digitalisation and the future of work: a thematic focus
European Institute for Gender Equality 94
work as a main source of income often come from low-income, less educated households and are more likely to have minority ethnic backgrounds (Smith, 2016; Van Doorn, 2017). Most recent EU data indicates that around 15 % of platform workers are foreign born, a higher proportion than in overall employment ( JRC, 2020a).
Online platform work performed from home also offers opportunities for people with health limitations that prevent them from working outside the home. A global survey found that almost one in five online plat-form workers reported health limitations (ILO, 2018c).
9.2.3. New forms of work and flexible working practices in the context of the ICT sector and platform work
For several decades, advances in digitalisation have been associated with two closely related processes: increased flexibility of work and the emergence of new forms of work. Increases in work flexibility date back to the 1980s, when the introduction of ICT transformed the world of work by enabling home-based and other forms of remote labour, such as teleworking (Huws et al., 1996). In 2002, the European framework agreement on telework was negotiated by the social partners, establishing teleworking as a way for companies to modernise their work organisation and for workers to reconcile work with other aspects of their lives. As the use of portable computers, tablets and smartphones spread throughout the labour market, and inter-net infrastructure and connectivity improved, a growing proportion of the workforce adopted flexible working patterns, working ‘anytime, anywhere’ (Eurofound, 2020b; Eurofound and ILO, 2017).
At the same time, the adoption of various remote working practices contributed to the emergence of new forms of work. The possibil-ity to manage work remotely allowed employ-ers to outsource and offshore an increasing amount (Rubery, 2015). This signalled a move
away from the standard full-time open-ended contract with fixed working time towards less secure forms of employment situated within a ‘complex and multifaceted network of relations between “independent contractors”, clients and intermediaries’ (Bergvall‐Kåreborn and Howcroft, 2014; Piasna and Drahokoupil, 2017; Rubery, 2015). It led to increasingly fragmented nature of work, which was often broken down into ‘highly specified services and tasks’ to be delivered via ‘oneoff contracts’ (Howcroft and Rubery, 2018). The past decade saw this pro-cess culminate in the emergence of platform work, which usually involves self-employed people working on multiple small-scale tasks mediated via online platforms, often alongside other, more stable jobs.
These changes can affect gender equality both positively and negatively. On the one hand, the increased flexibility of work is hailed as a prom-ising way to support further participation of women and certain disadvantaged groups in the labour market (De Stefano, 2016; Overseas Development Institute, 2019), potentially leading to improvements in the Gender Equality Index domain of work. This is because flexible working is often the only option for people to combine substantial unpaid care responsibilities (primar-ily taken on by women) with paid employment, and because it can encompass those who can-not work outside the home, such as people with certain disabilities. More broadly, the increasing flexibility of work is seen as a way to improve work–life balance (see subsection 9.2.4) and potentially reduce gender inequalities in the dis-tribution of unpaid work (and thus contribute to gender equality in the Index domain of time). On the other hand, some new forms of employment deprive workers of much of the traditional labour and social protections crucial for achieving gen-der equality (Howcroft and Rubery, 2018; ILO, 2018c; Overseas Development Institute, 2019; Piasna and Drahokoupil, 2017).
The remainder of this subsection examines the gendered consequences of changes in the form and flexibility of work enabled by digitalisation in two dynamic and growing segments of the econ-omy: the ICT sector and platform work.
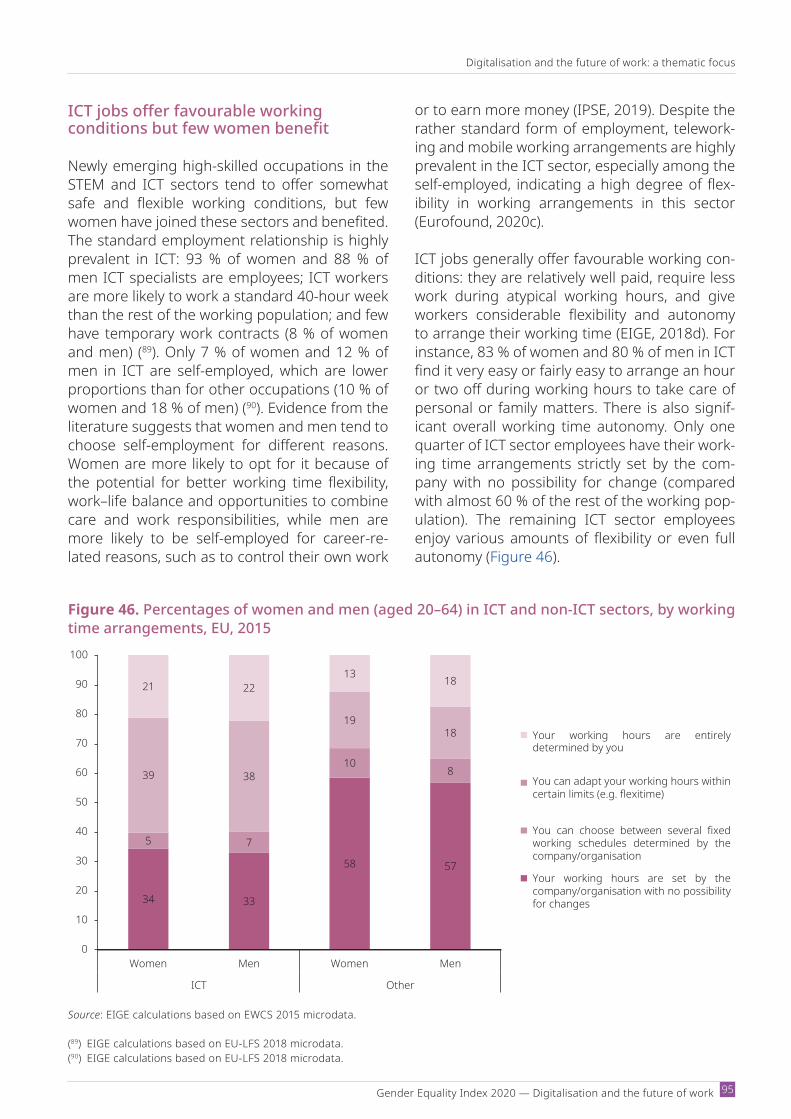
Gender Equality Index 2020 — Digi talisation and the future of work
Digitalisation and the future of work: a thematic focus
95
ICT jobs offer favourable working conditions but few women benefit
Newly emerging high-skilled occupations in the STEM and ICT sectors tend to offer somewhat safe and flexible working conditions, but few women have joined these sectors and benefited. The standard employment relationship is highly prevalent in ICT: 93 % of women and 88 % of men ICT specialists are employees; ICT workers are more likely to work a standard 40-hour week than the rest of the working population; and few have temporary work contracts (8 % of women and men) (89). Only 7 % of women and 12 % of men in ICT are self-employed, which are lower proportions than for other occupations (10 % of women and 18 % of men) (90). Evidence from the literature suggests that women and men tend to choose selfemployment for different reasons. Women are more likely to opt for it because of the potential for better working time flexibility, work–life balance and opportunities to combine care and work responsibilities, while men are more likely to be self-employed for career-re-lated reasons, such as to control their own work
or to earn more money (IPSE, 2019). Despite the rather standard form of employment, telework-ing and mobile working arrangements are highly prevalent in the ICT sector, especially among the selfemployed, indicating a high degree of flex-ibility in working arrangements in this sector (Eurofound, 2020c).
ICT jobs generally offer favourable working con-ditions: they are relatively well paid, require less work during atypical working hours, and give workers considerable flexibility and autonomy to arrange their working time (EIGE, 2018d). For instance, 83 % of women and 80 % of men in ICT find it very easy or fairly easy to arrange an hour or two off during working hours to take care of personal or family matters. There is also signif-icant overall working time autonomy. Only one quarter of ICT sector employees have their work-ing time arrangements strictly set by the com-pany with no possibility for change (compared with almost 60 % of the rest of the working pop-ulation). The remaining ICT sector employees enjoy various amounts of flexibility or even full autonomy (Figure 46).
(89) EIGE calculations based on EULFS 2018 microdata.(90) EIGE calculations based on EULFS 2018 microdata.
Figure 46. Percentages of women and men (aged 20–64) in ICT and non-ICT sectors, by working time arrangements, EU, 2015
34 33
58 57
5 7
10839 38
1918
21 2213 18
0
10
20
30
40
50
60
70
80
90
100
Women Men Women Men
ICT Other
Your working hours are entirely determined by you
You can adapt your working hours withincertain limits (e.g. flexitime)
You can choose between several fixedworking schedules determined by thecompany/organisation
Your working hours are set by thecompany/organisation with no possibilityfor changes
Source: EIGE calculations based on EWCS 2015 microdata.
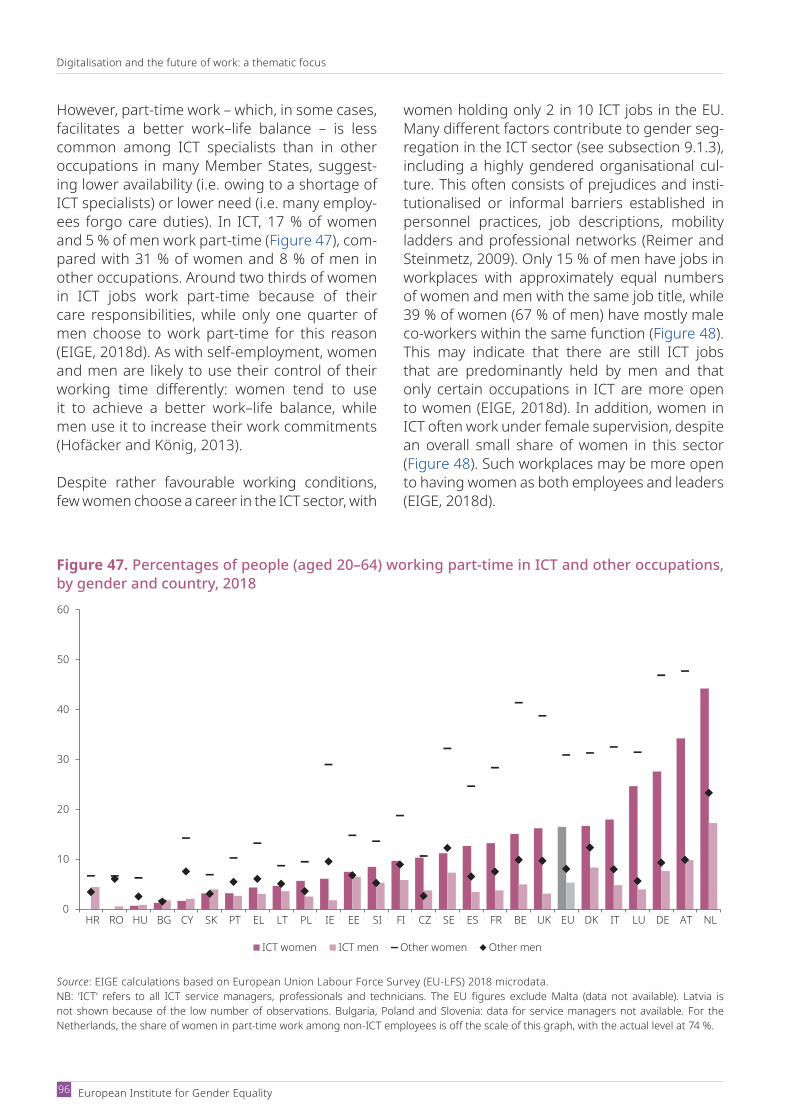
Digitalisation and the future of work: a thematic focus
European Institute for Gender Equality 96
Figure 47. Percentages of people (aged 20–64) working part-time in ICT and other occupations, by gender and country, 2018
0
10
20
30
40
50
60
HR RO HU BG CY SK PT EL LT PL IE EE SI FI CZ SE ES FR BE UK EU DK IT LU DE AT NL
ICT women ICT men Other women Other men
Source: EIGE calculations based on European Union Labour Force Survey (EULFS) 2018 microdata.NB: ‘ICT’ refers to all ICT service managers, professionals and technicians. The EU figures exclude Malta (data not available). Latvia is not shown because of the low number of observations. Bulgaria, Poland and Slovenia: data for service managers not available. For the Netherlands, the share of women in part-time work among non-ICT employees is off the scale of this graph, with the actual level at 74 %.
However, part-time work – which, in some cases, facilitates a better work–life balance – is less common among ICT specialists than in other occupations in many Member States, suggest-ing lower availability (i.e. owing to a shortage of ICT specialists) or lower need (i.e. many employ-ees forgo care duties). In ICT, 17 % of women and 5 % of men work part-time (Figure 47), com-pared with 31 % of women and 8 % of men in other occupations. Around two thirds of women in ICT jobs work part-time because of their care responsibilities, while only one quarter of men choose to work part-time for this reason (EIGE, 2018d). As with self-employment, women and men are likely to use their control of their working time differently: women tend to use it to achieve a better work–life balance, while men use it to increase their work commitments (Hofäcker and König, 2013).
Despite rather favourable working conditions, few women choose a career in the ICT sector, with
women holding only 2 in 10 ICT jobs in the EU. Many different factors contribute to gender seg-regation in the ICT sector (see subsection 9.1.3), including a highly gendered organisational cul-ture. This often consists of prejudices and insti-tutionalised or informal barriers established in personnel practices, job descriptions, mobility ladders and professional networks (Reimer and Steinmetz, 2009). Only 15 % of men have jobs in workplaces with approximately equal numbers of women and men with the same job title, while 39 % of women (67 % of men) have mostly male co-workers within the same function (Figure 48). This may indicate that there are still ICT jobs that are predominantly held by men and that only certain occupations in ICT are more open to women (EIGE, 2018d). In addition, women in ICT often work under female supervision, despite an overall small share of women in this sector (Figure 48). Such workplaces may be more open to having women as both employees and leaders (EIGE, 2018d).
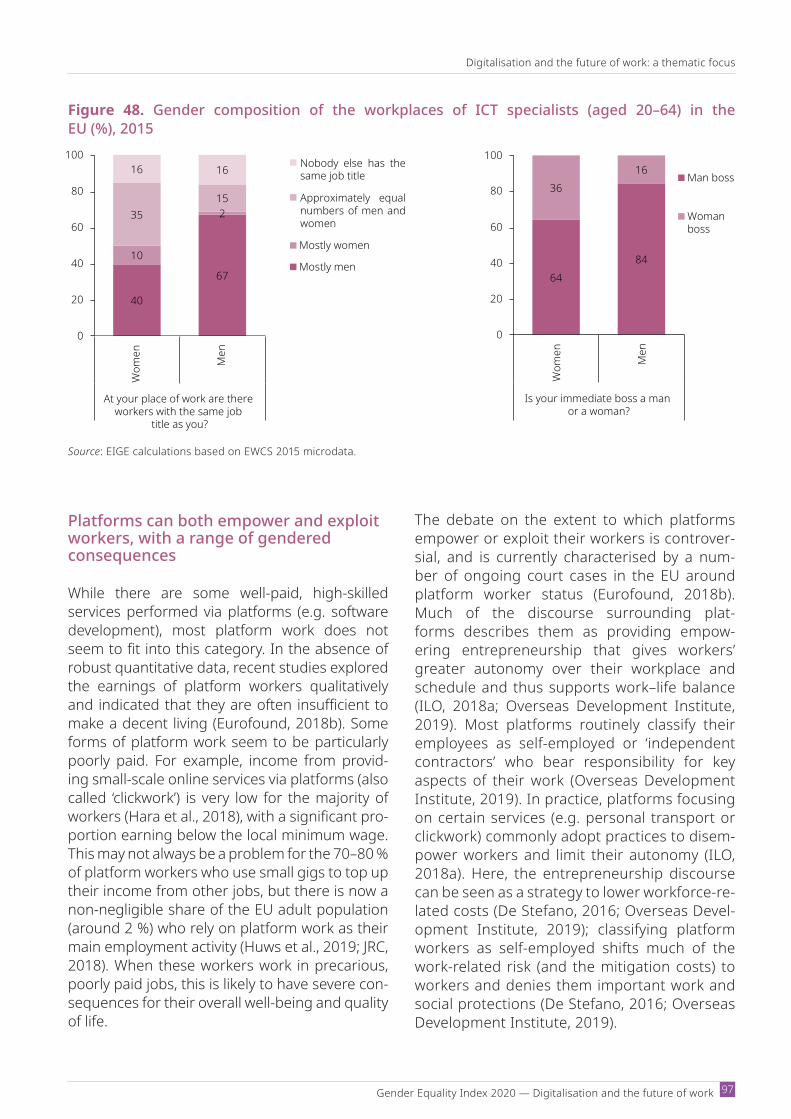
Gender Equality Index 2020 — Digi talisation and the future of work
Digitalisation and the future of work: a thematic focus
97
Platforms can both empower and exploit workers, with a range of gendered consequences
While there are some well-paid, high-skilled services performed via platforms (e.g. software development), most platform work does not seem to fit into this category. In the absence of robust quantitative data, recent studies explored the earnings of platform workers qualitatively and indicated that they are often insufficient to make a decent living (Eurofound, 2018b). Some forms of platform work seem to be particularly poorly paid. For example, income from provid-ing small-scale online services via platforms (also called ‘clickwork’) is very low for the majority of workers (Hara et al., 2018), with a significant pro-portion earning below the local minimum wage. This may not always be a problem for the 70–80 % of platform workers who use small gigs to top up their income from other jobs, but there is now a non-negligible share of the EU adult population (around 2 %) who rely on platform work as their main employment activity (Huws et al., 2019; JRC, 2018). When these workers work in precarious, poorly paid jobs, this is likely to have severe con-sequences for their overall well-being and quality of life.
The debate on the extent to which platforms empower or exploit their workers is controver-sial, and is currently characterised by a num-ber of ongoing court cases in the EU around platform worker status (Eurofound, 2018b). Much of the discourse surrounding plat-forms describes them as providing empow-ering entrepreneurship that gives workers’ greater autonomy over their workplace and schedule and thus supports work–life balance (ILO, 2018a; Overseas Development Institute, 2019). Most platforms routinely classify their employees as self-employed or ‘independent contractors’ who bear responsibility for key aspects of their work (Overseas Development Institute, 2019). In practice, platforms focusing on certain services (e.g. personal transport or clickwork) commonly adopt practices to disem-power workers and limit their autonomy (ILO, 2018a). Here, the entrepreneurship discourse can be seen as a strategy to lower workforce-re-lated costs (De Stefano, 2016; Overseas Devel-opment Institute, 2019); classifying platform workers as self-employed shifts much of the work-related risk (and the mitigation costs) to workers and denies them important work and social protections (De Stefano, 2016; Overseas Development Institute, 2019).
Figure 48. Gender composition of the workplaces of ICT specialists (aged 20–64) in the EU (%), 2015
40
10
35
16
67
215
16
0
20
40
60
80
100
Wom
en
Men
At your place of work are there workers with the same job
title as you?
Mostly women
Mos tly men64
84
3616
0
20
40
60
80
100
Wom
en
Men
Is your immediate boss a man or a woman?
Man boss
Womanboss
Nobody else has thesame job title
Approximately equalnumbers of men andwomen
Source: EIGE calculations based on EWCS 2015 microdata.
Digitalisation and the future of work: a thematic focus
European Institute for Gender Equality 98
Much of the debate overlooks the fact that platform practices are likely to affect women and men in different ways because of gen-dered employment patterns in platform work and the implications of some work and social protections (e.g. parental leave) for gender equality. The rest of this section briefly reviews the gendered consequences of platform prac-tices related to:
work security and autonomy of platform workers;
discrimination, harassment and violence at work;
access of platform workers to social protection;
collective representation of workers.
Platform practices that restrict worker autonomy can reduce women’s participation
Platform work can be an opportunity to increase the participation of women in the labour force (De Stefano, 2016; Overseas Development Institute, 2019). It can offer workers consid-erable autonomy in terms of their workplace and schedule, including the freedom to choose which tasks they do, their working time, and how to organise and perform their work (Euro-found, 2018b). This can benefit women in par-ticular, supporting them to combine work with their disproportionate share of care and family responsibilities.
However, the autonomy and flexibility of plat-form work varies significantly depending on the type of service provided and the work management practices of individual platforms (Eurofound, 2018b; ILO, 2018a). Representa-tion of women and men varies across the dif-ferent types of services and platforms (see subsection 9.2.2), and their degree of auton-omy is likely to do so as well. For example, men currently dominate the provision of certain
platform services associated with higher work autonomy, such as software development. Other workers are likely to face platform prac-tices that impose a combination of low work/lack of pay security and limited work autonomy. This may well put people with significant caring and family responsibilities at a disadvantage and is likely to have negative consequences, particularly for women’s participation.
Some examples are provided below to better illustrate the variation in work autonomy for dif-ferent types of platform work and its gendered implications.
The control that platforms assume over work schedules and work practices varies signifi-cantly, depending on the features of a given platform design. For example, the algorithms used to manage workforces determine whether workers have to search for tasks or customers search for workers; the degree to which customers and workers can set a schedule for performing a task; and the abil-ity of customers to reject work of poor quality (Eurofound, 2018b).
There is an important distinction between services carried out online and on-site. Most platform work performed online (91), such as translation or software development, allows a higher degree of flexibility and control over working hours and place (Eurofound, 2018b). Onsite work, such as ridehailing or personal and household services, usu-ally offers some flexibility in work schedules, but the place of work is determined by the customer.
More autonomy is often found in high-skilled services involving complex tasks (e.g. soft-ware development, dominated by men). Work autonomy may well be a mirage for workers providing low-skilled, highly standardised services (Eurofound, 2019; ILO, 2018a; Over-seas Development Institute, 2019), especially
(91) Except, for example, work on platforms focusing on micro tasks.
Gender Equality Index 2020 — Digi talisation and the future of work
Digitalisation and the future of work: a thematic focus
99
those depending on platform work as a major source of income. Here, platforms often encourage working patterns that do not combine well with caring and family respon-sibilities (ILO, 2018a; Smorto, 2018), such as long or unsocial working hours, intense work at times and places of high demand, and immediate availability to perform irregular work (De Stefano, 2016; Overseas Develop-ment Institute, 2019).
The limited autonomy of platform work for lowskilled services is exacerbated by low job and pay security, reducing workers’ capacity
to resist the control that platforms exert over their work (ILO, 2018a, 2018c). Platforms usu-ally retain control over workers’ job access, in some cases even price setting, with at least some not hesitating to use this as effective leverage to influence worker behaviour (ILO, 2018a; Smorto, 2018). For example, pay and job access can depend on achieving desir-able outcomes measured by tools used to monitor workers, such as customer ratings or key performance criteria (De Stefano, 2016; ILO, 2018a; Overseas Development Institute, 2019).
Gendered consequences of platform practices that limit worker autonomy
Example 1. Ridehailing platforms, such as Uber, often exert considerable control over their workers to ensure the immediate availability of their services to customers. They commonly retain the power to set prices for rides and can use this to influence workers’ driving pat-terns by applying price surges to periods and places of high demand (ILO, 2018a). In some cases, they use worker-monitoring systems to promote immediate availability among driv-ers: drivers who decline or cancel ride requests face the risk of deactivation (i.e. employ-ment loss). In other cases, they encourage longer availability of drivers on the platform (e.g. rewards for a certain number of trips in a day), even though this leads to longer periods of (unpaid) waiting for rides.
Gendered consequences. Such practices do not favour combining (wellpaid) ridehailing work with caring responsibilities and may help to explain the gender pay gaps (Cook et al., 2018) and employment gaps (Huws et al., 2019; JRC, 2018) in ridehailing services.
Example 2. Platforms focusing on small online tasks (clickwork, such as in Amazon Mechanical Turk), tend to grant workers more autonomy in terms of their work schedule and place. How-ever, they still adopt practices that favour workers who work longer, without interruption and on demand (Adams and Berg, 2017). They usually gather online tasks from clients and invite workers to bid for these. The tasks often need to be completed quickly and are posted at ad hoc times that suit clients. This requires workers to spend unpaid time searching for tasks and to then bid for them quickly once they are available (ILO, 2018c). Platforms sometimes moni-tor whether workers work without interruptions, for example by taking screenshots of workers’ screens or recording keystrokes and mouse clicks (ILO, 2018a).
Gendered consequences. Such working patterns are not suitable for women who wish to com-bine platform work with care responsibilities, and are likely to contribute to the gender pay gap (Adams and Berg, 2017).
Digitalisation and the future of work: a thematic focus
European Institute for Gender Equality 100
Platform workers may face discrimination and harassment in some settings
Work-related discrimination in the highly diverse platform economy is a complex, multifaceted topic, with outcomes often heavily dependent on the type of service provided and the work-force practices of a given platform. Nevertheless, several broad points emerge from the literature and are reviewed here. This is not intended as a comprehensive review but, rather, an illustration of ways in which platform work can foster or con-strain discrimination based on gender or other grounds.
Firstly, platform work poses challenges for the application of the EU’s gender equality and nondiscrimination legislation, making it difficult for platform workers to prove discrimination on gender or other grounds. This is primarily due to the fragmentation of work into small tasks per-formed for different clients on an irregular basis (Countouris and Ratti, 2018). Such fragmentation makes it difficult to identify comparable workers or the sources of discrimination when dealing with discrimination claims (92).
Secondly, to the extent that platform work ena-bles anonymous interactions between workers and clients in virtual settings, this can help to reduce discrimination based on individual worker characteristics such as gender or ethnicity (De Stefano, 2016; Eurofound, 2019). However, many platforms regularly publish workers’ personal information online, including name, age, gender and photo. Where such information is available, it allows people to make decisions reflecting their own personal biases based on gender, eth-nicity or other grounds (Rosenblat et al., 2017; Schoenbaum, 2016). One United Statesbased study found, for example, that Airbnb hosts from Asian backgrounds were found to earn 20 % less than their white counterparts. In some cases,
platforms may even promote or enforce cer-tain discriminatory choices by design and use sexist advertising. For example, Lyft began as a ride-sharing service for women only, and in 2014 Uber ‘offered a promotion in France for rides with “Avions de Chasse” (“hot chick” drivers) with the tagline “Who said women don’t know how to drive?” ’ (Schoenbaum, 2016).
Thirdly, platforms often use reputation systems (e.g. customer ratings) to encourage worker account-ability and inform customer choices (Rosenblat et al., 2017), but these may actually become a vehicle of customer bias. Research has found gen-der and ethnicity biases in the context of online market places (Ayres et al., 2015; Doleac and Stein, 2013), in performance evaluations by managers (Castilla, 2008; Elvira and Town, 2001), in online evaluation of teachers (Mitchell and Martin, 2018) and in online hiring decisions (Uhlmann and Silber-zahn, 2014). It is highly likely that such biases also creep into customer ratings of platform workers (Rosenblat et al., 2017), which may penalise work-ers for their gender, ethnicity and/or other charac-teristics. This is particularly concerning for those platforms where workers lack the ability to contest customer ratings, where reputation systems apply only to workers, with no possibility to flag prob-lematic customer behaviour, and where customer ratings directly affect workers’ ability to continue using the platform (e.g. Uber) and/or their remu-neration (e.g. Handy (93)). For example, the system used by Uber to rate drivers enables customers to ‘directly assert their preferences and biases in ways that companies would be prohibited from doing directly. In effect, [platforms] may perpetu-ate bias without being liable for it, as the grounds for firing or “deactivating” a particular driver may be derived from a large corpus of individual rat-ings, whose discriminatory character is currently impossible to verify or oversee by research-ers external to the company’ (Rosenblat et al., 2017, p. 8).
(92) The scope of the new ILO Violence and Harassment Convention No 190 is considerably broader than the workplace, covering, for example, individual exchanges with customers. Those are also covered by the antiharassment provisions of the Goods and Services Directive (Council Directive 2004/113/EC). The process of authorising Member States to ratify the Convention is pending at the Council.
(93) For example, see the remuneration system on Handy (https://prohelp.handy.com/hc/enus/articles/217290407Paymenttiers).

Gender Equality Index 2020 — Digi talisation and the future of work
Digitalisation and the future of work: a thematic focus
101
Finally, serious concerns have been raised about the prevalence of sexual harassment and gender-based violence in certain types of platform work, such as ride-sharing and home rental (see subsection 9.3.2). Beyond the imme-diate impacts on victims’ mental and phys-ical health, this is also likely to have broader labour market consequences. For example, a recent large-scale study of Uber drivers in the United States shows that women drivers are less willing to drive in areas with higher crime and more drinking establishments, which con-tributes to the gender pay gap in ride-hailing (Cook et al., 2018).
Platform workers often lack access to key social and work protections, including parental leave
Owing to the fragmented nature of their work and their self-employed/independent contrac-tor status, many platform workers lack access to key social and work protections. While eli-gibility varies considerably by Member State, a substantial share of platform workers have little or no access to sickness and healthcare benefits, unemployment benefit, paid holiday entitlements, insurance against work-related accidents and illnesses, old-age and disability benefits, and maternity and paternity benefits (Eurofound, 2018d; European Commission, 2019a; ILO, 2018c; Overseas Development Institute, 2019).
This is an issue especially for those platform workers who do not combine platform work
with other employment that provides them with access to social and work protections. While there are no comprehensive, gender-disaggre-gated data on platform work as a sole source of employment, it may well be that this is a more common situation for women than men. For example, men providing online services via platforms are more likely to do so to top up income from other work than women (Adams and Berg, 2017). For a notable share of platform workers, social protection coverage is ensured through their main jobs in the traditional econ-omy, but here women are observed to have less social insurance coverage than men (Behrendt et al., 2019).
The lack of access to social protection linked to childbirth and childcare has a particularly strong gender dimension, as it limits women’s ability to stay in employment and prevents more equal sharing of unpaid care responsibilities. According to a study by the European Commis-sion (2015), only around half of self-employed women aged 15–49 were entitled to maternity benefits. EIGE’s study on eligibility for paren-tal leave (EIGE, 2020c) similarly found that in a number of Member States access was lacking among people who were self-employed or with-out a stable employment relationship. Access to some other benefits is also likely to have a gendered dimension. For example, women’s lack of access to oldage and disability benefits may be particularly problematic, as they tend to live longer and to spend more years living with disabilities (EIGE, 2020a).
(94) https://www.eurofound.europa.eu/publications/article/2020/coronavirus-highlights-sick-pay-void-for-platform-workers(95) https://www.weforum.org/agenda/2020/04/gig-workers-hardest-hit-coronavirus-pandemic/
Platform workers’ poor access to certain types of social protection, such as sick pay or unemploy-ment benefits, has come to the fore during the COVID19 pandemic (94). At the time of writing, data on the impacts of the pandemic on platform workers (95) were not disaggregated by gen-der, so it was not possible to compare how lack of social protection affected women and men in this sector.

Digitalisation and the future of work: a thematic focus
European Institute for Gender Equality 102
Weak collective representation of platform workers can increase gender-based pay inequalities
Representation of platform workers by trade unions is generally weak, although there are now some examples (99) of trade unions represent-ing or supporting platform workers at Member State level (Eurofound, 2018d) (100). Less formal worker-organised initiatives seem much more common (Eurofound, 2018d; ILO, 2018a) (101). One of the key obstacles to platform workers joining or organising unions is the fact that they are selfemployed and are, therefore, excluded from the right to collective bargaining in some jurisdictions (Eurofound, 2018d). Another com-plication is the piecemeal structure of platform work, which often relies on isolated workers with very limited communication with one another (Eurofound, 2018d; ILO, 2018a). Finally, the lack
of job security is likely to inhibit workers’ efforts to organise, as platforms often reserve the right to terminate workers’ access to the platform without giving a reason (Eurofound, 2018d; ILO, 2018a).
Poor union coverage of platform workers is likely to have gendered consequences, for example in terms of pay. This is because women generally fare poorer in settings that rely on individual negotiations when it comes to pay (see subsection 9.2.5) (Barzilay, 2018; Barzilay and BenDavid, 2016; Piasna and Drahokoupil, 2017). Lack of worker rep-resentation can make it more difficult to resist exploitative practices by platforms that limit worker autonomy and flexibility (ILO, 2018a), in turn making platform work less attractive for people (mostly women) with significant caring responsibilities.
The situation was likely to be difficult, especially for workers who relied on platform work as their sole source of employment (women may well be over-represented in this group, as discussed above), and those affected by work stoppages caused by various isolation and lockdown require-ments (e.g. male-dominated ride-hailing but also some female-dominated domestic services). Media reports showed that, in the absence of statutory sick pay, these workers were often faced with an extremely difficult choice between losing vital income or exposing themselves and oth-ers to health risks (96). Initial evidence suggests that platforms took only limited steps to protect their workers. For example, only 5 in 120 platforms surveyed by Fairwork introduced some form of financial compensation for earnings lost as a result of COVID19 (97). Early evidence also indi-cates that platform workers often could not access government income support schemes (98). This highlights the importance of certain recent EU policy actions, such as the adoption of the proposal for a Council recommendation on access to social protection for workers and the self-employed.
(96) See, for example, https://www.theguardian.com/technology/2020/mar/25/uber-lyft-gig-economy-coronavirus, https://www.theguardian.com/world/2020/mar/16/coronavirus-unions-attack-paltry-sick-pay-for-self-isolating-couriers and https://www.wired.com/story/covid19 -pandemic-aggravates-disputes-gig-work/
(97) https://www.transformationalupskilling.org/post/thegigeconomyandcovid19fairworkreportonplatformpolicies(98) https://voxeu.org/article/covid19inequalityandgigeconomyworkers(99) For a more detailed list of initiatives, see https://www.eurofound.europa.eu/data/platform-economy/initiatives#organisingworkers(100) For a sample list of crowdworkers’ unions, see http://faircrowd.work/unions-for-crowdworkers/(101) For example, online forums and social network groups available to workers on certain platforms (e.g. Amazon Mechanical Turk and
Uber) to talk, support each other and share information; setting up workerled organisations to promote workers’ rights; and online protests against platform policies and strikes (often by workers providing ride-hailing and food delivery services).
Gender Equality Index 2020 — Digi talisation and the future of work
Digitalisation and the future of work: a thematic focus
103
Platform work in the care sector: opportunities and challenges
Platform work in the care sector has the potential to provide new solutions to some of care work’s long-standing problems. In fact, platforms act as intermediaries, matching demand and supply more efficiently, minimising geographical distance and allowing both parties to select flexible working arrangements (Trojansky, 2020). Platform work offers new opportunities for the provision of home-based care, which has become a priority in the process of ‘deinstitutionalisa-tion’ in the EU (EIGE, 2020e). At the same time, however, platforms alone cannot solve the vul-nerability of care professionals, or adequately address their disadvantaged working conditions (Ticona and Mateescu, 2018b).
Care services mediated through platforms are usually performed by medium-skilled workers, who are often selected manually by users, rather than being matched with users entirely through algorithms (Eurofound, 2018b). Platforms therefore offer intermediation services between care demand and supply, replacing offline agencies (e.g. nanny agencies) and reducing transaction costs (Nurvala, 2015). This allows a closer personal relationship between the caregiver and careseeker over time, compared with the rapid oneoff interaction typical of, for example, food delivery services (Trojansky, 2020). The composition of the workforce providing care via plat-forms reflects the overall care industry, being female dominated (Eurofound, 2018b; Schwellnus et al., 2019).
The most striking difference between the provision of care services and most other types of services via platforms is the care industry itself, which is known for a high prevalence of irreg-ular employment, informal and precarious working arrangements, heavy workloads and low wages. The workforce is predominantly female, mostly composed of women from a migrant background and often undocumented (Trojansky, 2020). The deprivation of social and employ-ment protections observed in other types of platform work does not apply as strongly to care services mediated through platforms. In fact, platforms could introduce job formalisation and standard payment procedures, as well as increased market visibility for care workers (Ticona and Mateescu, 2018b)102. This new work paradigm thus has the potential to improve care providers’ working conditions and remuneration, in sharp contrast with some other sectors (e.g. transport and food delivery), where digital employment undermined previously fair working arrangements and higher worker protection standards (Trojansky, 2020).
There are important limits to the potential for such positive transformation. The opportunities for improvement that platform work offers in terms of higher salaries and employment formal-isation do not offset the risks. Extreme job flexibility can easily turn into uncertainty, given the lack of a stable employer and the absence of social security (owing to workers’ self-employed status) (Eurofound, 2018b). These risks are exacerbated by the fact that care workers are a vul-nerable group, chiefly migrant women, who receive low wages and little to no social recognition and who bear heavy workloads. While platforms may bring about some improvements for these workers, they are unlikely to change the overall dynamic of exploiting cheap labour prevalent in the sector (Ticona and Mateescu, 2018b).
(102) The topic will also be explored in a forthcoming publication by EIGE. See https://eige.europa.eu/about/projects/gender-inequalities-unpaid-care-work-and-labour-market-eu
Digitalisation and the future of work: a thematic focus
European Institute for Gender Equality 104
9.2.4. Digitalisation and work–life balance
The use of mobile devices, digitalisation of work-ing processes and online communication allow more flexibility in where and when people work. Flexible working arrangements typically relate to how much, when and where employees can work (Eurofound, 2017b; Laundon and Williams, 2018).
This flexibility in time and place is typically assumed to allow work to fit better around home and family responsibilities (Eurofound, 2020c). There is indeed evidence that the use of ICT (smartphones, tablets, laptops, desktop comput-ers) to work outside the employer’s premises can help to facilitate better work–life balance. Work-ers report shorter commuting times, greater working time autonomy, more flexibility in work-ing time, better productivity and improved over-all work–life balance (Eurofound and ILO, 2017). There is evidence that mothers using flexitime and teleworking are less likely to reduce their working hours after childbirth (Chung and Van der Horst, 2018).
The European Commission’s Work–Life Balance Directive (adopted in 2019) sees flexible working arrangements as one of the key tools to reconcile work and life for parents and carers and to con-tribute to the achievement of equality between women and men in the labour market. The Gen-der Equality Index 2019 showed that work–life balance challenges are closely linked to gender inequalities, and that flexible working arrange-ments can increase gender-equal opportuni-ties (EIGE, 2019b). A strong link was established
between the score for the domain of time (which measures gender equality in engagement in care and social activities) and the availability of some flexible working arrangements, such as women’s ability to set their own working hours.
The relationship between flexible working and work–life balance is not self-evident, however (Chung and Van der Lippe, 2018). The impact of using ICT and teleworking depends on how it is implemented: while regular home-based tele-workers have a better work–life balance than those who always work at their employer’s prem-ises, highly mobile workers (i.e. with very exten-sive use of technology and no fixed workplace) have a poorer work–life balance. For parents or others with family responsibilities, the occasional opportunity to telework is particularly beneficial (Eurofound, 2020c)
The use of technology promotes work–life bal-ance only under certain conditions (e.g. when childcare is available) and it carries major draw-backs and risks. Flexible and nonstandard work-ing arrangements may have negative impacts, depending on the kind of flexibility and employ-ees’ control over their working arrangements (EIGE, 2018d). Some studies show that working from home leads to more work–family conflict (Chung and Van der Lippe, 2018) and often goes hand in hand with working overtime (Eurofound, 2018e). Some evidence shows that working from home and flexible work schedules are more effective for single people, less so for families with children (Ten Brummelhuis and Van Der Lippe, 2010). The overall impact of flexible work-ing arrangements on work–life balance is highly
The COVID19 pandemic, and particularly the resulting quarantine, created a natural experi-ment, in which the limits of extensive teleworking have been explored. By April 2020, 35 % of men and 39 % of women had begun to work from home as a result of the pandemic, while only 11 % of men and 10 % of women had done so previously. Among younger women (aged 18–34), as many as 50 % started working from home (compared with 37 % of men of that age)
(Eurofound, 2020b). The situation has shown the unused potential of technology, as well as the limitations of such arrangements for work–life balance. For instance, taken together with teleschooling and closure of childcare facilities, home working has intensified work–life conflicts for many families with children (Eurofound, 2020b)(Eurofound, 2020b). Telework is evidently not a sustainable solution to solve childcare shortages and does not remove the need for other work–life balance policies.
Gender Equality Index 2020 — Digi talisation and the future of work
Digitalisation and the future of work: a thematic focus
105
gendered (Chung and Van der Lippe, 2018), as is the actual use of flexible working arrangements. For instance, more women do regular home-based telework than their male partners in order to combine work and domestic demands (Euro-found, 2020c). This is presumably to accommo-date their disproportionate burden of household work, despite also being in paid work (see Chap-ter 5, ‘Domain of time’).
The rest of this section investigates how tech-nologybased flexibility supports or undermines workers’ work–life balance. Again, the focus is on the ICT sector and platform work, where technol-ogy plays a particularly important role.
High flexibility and autonomy in ICT, but also more work–life spillover effects
The first condition for technologydriven flex-ibility to support work–life balance is workers’ autonomy and control over their working time and place. The Work–Life Balance Directive envisages giving workers the right ‘to request flexible working arrangements for the purpose of adjusting their working patterns, including, where possible, through the use of remote work-ing arrangements, flexible working schedules, or a reduction in working hours, for the purposes of providing care.’ In other words, the directive calls for flexibility controlled by the employee, rather than the employer.
In the ICT sector, digitalisation provides the greatest opportunities for work that is flexible in both time and location (see subsection 9.2.3). In spite of above average flexibility and control over their working time, women and men in ICT are only slightly more satisfied with the fit between their working hours and other responsibilities than others: 87 % of women and 84 % of men in ICT view their working hours as fitting well or very well with their family or social commitments outside work, which is only somewhat higher than among other employed women and men (84 % and 79 %, respectively) (103).
One reason may be that the use of technology can blur the boundaries between work and private life. In the past, temporal and physical boundaries existed between work and home (McCloskey, 2016), but digital technology has now created both the possibility and the expecta-tion of being constantly online and available. The use of smartphones can create high after-hours availability pressure (Ninaus et al., 2015), give rise to difficulties with psychologically detaching from work during free time (Mellner, 2016), and have a negative impact on work–life balance and stress levels (Harris, 2014). Family members can make personal demands on workers while they are teleworking at home (McCloskey, 2016), which increases the need to multitask and blurs bound-aries (Glavin and Schieman, 2012; Schieman and Young, 2010).
Data suggests that this spillover effect is more often felt by women working in ICT than their male ICT peers or women in other sectors, although the differences are not dramatic (Figure 49). There may be several reasons for such gaps. One may be that women in ICT – as in in the rest of the economy – have primary responsibility for home and family affairs. This double burden may be particularly challeng-ing while teleworking from home or with the requirement to be constantly available for work. For men, however, the spillover effects are smaller when they work in ICT, compared with men in other sectors. Some studies indi-cate that women’s motivation to work from home (or to take up self-employment) is to obtain a higher degree of flexibility and auton-omy that will better accommodate work and family responsibilities, while men report labour market and job-related motivations (Hilbrecht et al., 2017). Women’s time tends to be frag-mented and characterised by blurred bounda-ries between leisure time and unpaid care, with phenomena such as contamination (leisure time spent in the presence of children) and fragmentation (interruption of leisure time to care for children) (European Parliament, 2016).
(103) EIGE calculations, EWCS 2015.
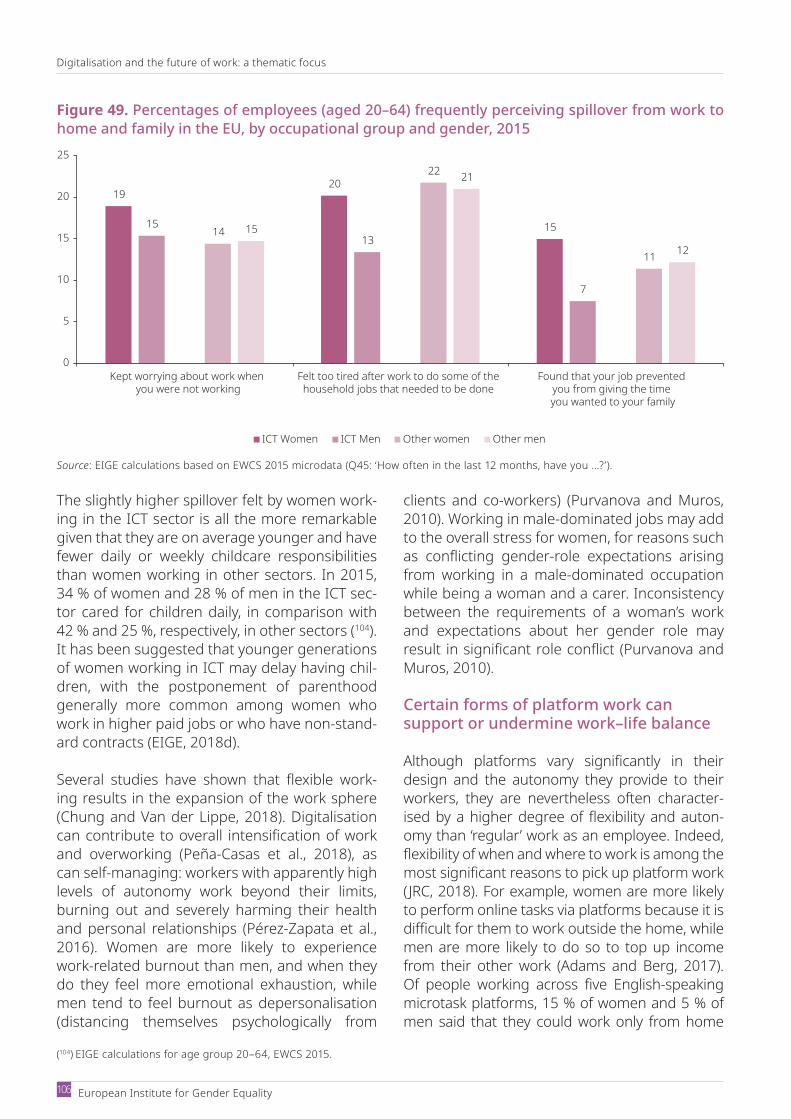
Digitalisation and the future of work: a thematic focus
European Institute for Gender Equality 106
The slightly higher spillover felt by women work-ing in the ICT sector is all the more remarkable given that they are on average younger and have fewer daily or weekly childcare responsibilities than women working in other sectors. In 2015, 34 % of women and 28 % of men in the ICT sec-tor cared for children daily, in comparison with 42 % and 25 %, respectively, in other sectors (104). It has been suggested that younger generations of women working in ICT may delay having chil-dren, with the postponement of parenthood generally more common among women who work in higher paid jobs or who have non-stand-ard contracts (EIGE, 2018d).
Several studies have shown that flexible work-ing results in the expansion of the work sphere (Chung and Van der Lippe, 2018). Digitalisation can contribute to overall intensification of work and overworking (Peña-Casas et al., 2018), as can self-managing: workers with apparently high levels of autonomy work beyond their limits, burning out and severely harming their health and personal relationships (PérezZapata et al., 2016). Women are more likely to experience work-related burnout than men, and when they do they feel more emotional exhaustion, while men tend to feel burnout as depersonalisation (distancing themselves psychologically from
clients and co-workers) (Purvanova and Muros, 2010). Working in male-dominated jobs may add to the overall stress for women, for reasons such as conflicting genderrole expectations arising from working in a male-dominated occupation while being a woman and a carer. Inconsistency between the requirements of a woman’s work and expectations about her gender role may result in significant role conflict (Purvanova and Muros, 2010).
Certain forms of platform work can support or undermine work–life balance
Although platforms vary significantly in their design and the autonomy they provide to their workers, they are nevertheless often character-ised by a higher degree of flexibility and auton-omy than ‘regular’ work as an employee. Indeed, flexibility of when and where to work is among the most significant reasons to pick up platform work (JRC, 2018). For example, women are more likely to perform online tasks via platforms because it is difficult for them to work outside the home, while men are more likely to do so to top up income from their other work (Adams and Berg, 2017). Of people working across five Englishspeaking microtask platforms, 15 % of women and 5 % of men said that they could work only from home
Figure 49. Percentages of employees (aged 20–64) frequently perceiving spillover from work to home and family in the EU, by occupational group and gender, 2015
1920
151513
7
14
22
11
15
21
12
0
5
10
15
20
25
Kept worrying about work when you were not working
Felt too tired after work to do some of thehousehold jobs that needed to be done
Found that your job prevented you from giving the time you wanted to your family
ICT Women ICT Men Other women Other men
Source: EIGE calculations based on EWCS 2015 microdata (Q45: ‘How often in the last 12 months, have you …?’).
(104) EIGE calculations for age group 20–64, EWCS 2015.
Gender Equality Index 2020 — Digi talisation and the future of work
Digitalisation and the future of work: a thematic focus
107
because of care responsibilities (ILO, 2018c). One in five women had a child under 5 years old, while 30 % of women and 10 % of men platform work-ers had been engaged in caring activities prior to taking up platform work. The flexibility of platform work provides opportunities to take up some work and to combine it with childcare and other care responsibilities.
I can only work from home because my hus-band is away the whole day at work and I have to take care of my children and home. (Respondent on CrowdFlower, Italy)Source: ILO (2018c)
As discussed in subsection 9.2.3, platforms vary significantly in the autonomy they afford their workers. The degree of control that workers have over their own working time, workplace and working arrangements is the key to their work–life balance. For example, platforms providing certain services (e.g. ride-hailing or clickwork) often adopt practices that limit worker auton-omy and flexibility, especially for workers who rely on platform work as their main source of income (Eurofound, 2018b; ILO, 2018a). Employ-eroriented flexibility – where either the platform or the client is in charge – creates unpredicta-ble and unreliable schedules, often involving a considerable amount of unpaid time spent searching for work and the need to be availa-ble on demand (Eurofound, 2018b; ILO, 2018a). This undermines work–life balance (Ropponen et al., 2019). Women have been shown to suf-fer particularly from the increased work–life spillover effects created by employeroriented schedules (Lott, 2018), with negative effects on working time quality and increased stress lev-els (Eurofound, 2019). Directive (EU) 2019/1152 (European Parliament, 2019a) on transparent and predictable working conditions is a direct follow-up to the proclamation of the European Pillar of Social Rights and states (among other things) that workers with very unpredictable working schedules (e.g. on-demand work) need reasonable notice of when work will take place.
I feel in control of the work but have no con-trol over when work will be available.Source: ILO (2018c)
Women often take up platform work alongside unpaid care work, and such arrangements may support work–life balance but may also present challenges. While platform work provides oppor-tunities to take up jobs in between care and other responsibilities, highly flexible schedules may require complex logistics that involve commuting, pre-agreed appointments or arranging childcare for a specific time, often at short notice. Arrang-ing, scheduling and providing childcare for on-call workers makes coordination of work and family responsibilities more difficult to sustain (Cherry, 2010; Harris, 2009). At the same time, fragmented and occasional work may perpetuate the gen-dered division of unpaid and paid work, instead of giving rise to questions about or challenges to such arrangements.
Platform work is not a systemic solution to gender inequalities in paid and unpaid work
While full autonomy with no time constraints or rules on working time and arrangements makes platform work sound appealing, the downside to such freedom creates an ‘autonomy par-adox’ (Huws et al., 1996; PérezZapata et al., 2016; Shevchuk et al., 2019). A high degree of autonomy and flexibility often leads to unsocial working hours (Ropponen et al., 2019). Platform workers often work unsocial hours (at evenings, nights or weekends) to optimise their income, match the time preferences of clients in different time zones or meet work–life balance challenges. (ILO, 2018c).
The same paradox applies to freelancers and independent contractors in general, and was pointed out long before platform work emerged (Huws et al., 1996). Selfemployed translators who seemed to be fully autonomous found that they actually had little or no control over their workflow and that their working times were
Digitalisation and the future of work: a thematic focus
European Institute for Gender Equality 108
externally driven by deadlines set by their clients (Huws et al., 1996). In 2017, translation was one of the most female-dominated areas of platform work ( JRC, 2018).
There is evidence that full autonomy of working arrangements leads to the highest degree of work-to-home spillover, higher even than for fixed and fully inflexible schedules. This is par-ticularly true for men, mainly due to the increased overtime hours that men work when they have working time autonomy (Chung and Van der Lippe, 2018). People may set themselves unreal-istic work schedules that lead to increased work-load and eventually have negative consequences for work–life balance, health and well-being (Ropponen et al., 2019). There is a connection between working time and leisure time for recov-ery and sleeping. Keeping work and leisure time separate enables detachment from work during leisure time, which is important for recovery, par-ticularly when the worker is highly stressed (Rop-ponen et al., 2019).
An ILO survey of workers performing online tasks via platforms found that women with young children (0–5 years) spend on average about 19.7 hours working on platforms in a week, while men with small children work over 30 hours. Of these women, 36 % work at night (10 p.m. to 5 a.m.) and 65 % work during the evening (6 p.m. to 10 p.m.); 14 % of women with young children reported working for more than 2 hours at night on more than 15 days in a month (ILO, 2018c). The proportion of mothers working evenings/nights is lower than for platform workers in general.
While platform work can improve work–life bal-ance – especially for parents, other carers or those who face other obstacles to their full partic-ipation in the traditional labour market – it is nec-essary to ensure that it does not further polarise the labour market and marginalise these groups of people, pushing them into more precarious jobs. It cannot be seen as a substitute for proper support for carers or as a solution to the unbal-anced division of care between women and men. It is important to point out that such arrange-ments – while being preferred and beneficial for some – may reinforce gender imbalances and inequalities in the labour market. Women who have heavy loads of care and other unpaid work take up ‘job bites’ around their care and home responsibilities, when in fact they would benefit more from proper care services and more bal-anced division of unpaid work at home. Work–life balance policies need to take this into account and provide comprehensive services and meas-ures that support women’s participation in work, rather than relying on women to take odd jobs in order to earn some income alongside their unpaid work.
9.2.5. Gender pay gap in ICT and platform work
Despite recent policy actions at EU and Mem-ber State levels, the gender pay gap persists. In 2018, on average, women’s gross hourly pay was 14.8 % lower than men’s (Eurostat, 2020). The pay gap stems from a combination of factors, includ-ing occupational and sectoral segregation, part-time or temporary work, gender stereotypes and norms, difficulties in reconciling work and private life, discrimination, opaque wage structures, and undervaluing of women’s work and skills (Euro-pean Commission, 2009, 2018a, 2018g). Major biases, such as horizontal and vertical segre-gation in education and the labour market, are crucial factors underpinning the pay gap (EIGE, 2019c; Eurostat, 2018). A large share of the pay differences (around one third) results from the fact that women and men work in different eco-nomic activities and occupations (Eurostat, 2018), with those that are female dominated often being underpaid and undervalued.
I haven’t really had a time when I rest. I don’t know what holiday means. ... I also work when I am travelling. It is just that if you have regular clients, you need to do everything in order to keep them. And if you don’t respond immediately to their emails then you can easily lose them. It is relatively harsh to be honest.Source: Huws et al. (2019).

Gender Equality Index 2020 — Digi talisation and the future of work
Digitalisation and the future of work: a thematic focus
109
Both women and men are well paid in ICT but the gender pay gap persists
Attracting women to wellpaid ICT and STEM jobs is seen as an important policy tool to reduce the gender pay gap (EIGE, 2019c). In these gener-ally male-dominated jobs, the pay tends to be higher than in much of the EU labour market, including the jobs requiring equally high quali-fications in which women tend to work, such as in the health sector (EIGE, 2018d). In 2015, the average monthly income of both women and men working in ICT was higher than the average income of women and men working elsewhere (Figure 50). Of men working in ICT, 70 % had a monthly income falling into the top two income quintiles (52 % of men working elsewhere), com-pared with 54 % of women working in ICT (28 % of women working elsewhere) (105).
Despite earning more than other female work-ers, women in ICT have lower monthly earnings than men. This reflects gender differences in the average working hours of women and men, their different positions within the ICT sector and dif-ferences in their hourly pay. In 2014 in the EU, the gender pay gap among ICT professionals and technicians was 11 %. This is among the lowest occupational gender pay gaps across all sectors
in the EU (EIGE, 2019c). In all Member States, the gender pay gap in the STEM sector is lower than the general pay gap, except in Ireland and Czechia (EIGE, 2019c). Overall, smaller gender pay gaps in occupations with very few women employ-ees may not necessarily point to gender-equal opportunities but, rather, to large differences in educational qualifications (and thus pay) among the average employed women and men.
Gender pay gaps are often reproduced in the context of platform work
The general assumption has been that plat-form work will help to eliminate the gen-der pay gap and gender inequalities by improving women’s access to the labour market (Barzilay and Ben-David, 2016). For instance, using gender-blind algorithms has the potential to promote equal access to jobs and more flexible work schemes that would allow women to assume dual roles as employees and caregivers (Barzilay and Ben- David, 2016; Liang et al., 2018). Of female plat-form workers in the United States, 86 % believe that gig work offers the opportunity to earn equal pay to their male counterparts (41 % of female gig workers believe that traditional work offers this opportunity) (Hyperwallet, 2017).
Recent studies suggest that the platform econ-omy is not an easy remedy for the gender pay gap (Silbermann, 2020). Estimates vary, with studies finding pay gaps ranging from 4 % in the EU online labour market (PeoplePerHour) (JRC, 2019b) to 7 % in Uber (Cook et al., 2018) and 20 % in Amazon Mechanical Turk (Adams, 2020). A mixed picture emerged from an ILO study of five platforms in 2017, with women having a higher hourly pay rate than men on one platform (Microworkers) and an almost equal pay rate on another (Clickworker), while there was a pay gap of between 5 % and 18 % on other platforms (AMT, Crowdflower, Prolific) (ILO, 2018c). Just as in the traditional economy, a small gender pay gap may hide a number of imbalances, such as lower pay for women despite their higher educational qualifications or skills. There is evidence that the pay gap affects women with young children in
Figure 50. Income distribution of women and men (aged 20–64) working in ICT and non-ICT sectors (%), EU, 2015
13 725
11
169
26
14
17
14
21
23
16
24
15
25
3846
1227
0
20
40
60
80
100
Women Men Women Men
ICT Non-ICT
1s t quintile 2nd quintile 3rd quintile4th quintile 5th quintile
Source: EIGE calculations, EWCS (EIGE, 2018d).
(105) EIGE calculations, EWCS 2015.
Digitalisation and the future of work: a thematic focus
European Institute for Gender Equality 110
particular, especially when their domestic respon-sibilities affect their ability to plan and complete work online (Adams, 2020).
The ILO (2018c) study accounts for both the paid and unpaid work that underpins platform work: searching for tasks, taking unpaid qual-ification tests, researching clients to mitigate fraud and writing reviews, as well as unpaid or rejected tasks and tasks ultimately not submit-ted. In a typical week, both women and men spend about 6 hours doing unpaid tasks, while women (on average) do fewer hours of paid work (around 16 hours) than men (close to 20 hours) (ILO, 2018c).
Gender segregation and other gendered practices are common on platforms
Depending on the platform, pay inequalities can be due to several factors, including biased algo-rithms and behaviours – on the part of both work-ers and clients – that reflect broader biases in the traditional labour market. The segregation of the labour market is reflected in platform work, with the imbalanced division of care between women and men restricting women’s choices more than those of men. Gender segregation within and between platforms (see subsection 9.2.2) per-sists, as a result of very strong gender stereotyp-ing in platforms, with women more likely to be selected for ‘female-type’ jobs (writing, transla-tion) and less likely to be selected for ‘male-type’ jobs (software development) than equally quali-fied male candidates (Galperin, 2019).
There are some signs that customer ratings – which often affect pay levels (ILO, 2018c) – can discriminate on racial and gender grounds (Rosenblat et al., 2017), favouring men over women (Kim, 2018). Hannák et al. (2017) report that workers’ race and gender affect the social feedback that they receive, although the impact is different on each platform. A survey carried out in the United States showed that one third of female platform workers adopted a gender-neu-tral username in order to maintain anonym-ity (Hyperwallet, 2017). However, data from an online crowdworking platform in which workers’
gender is not revealed to the employer showed that women earned on average 82 % of men’s earnings (Adams and Berg, 2017). This shows that while direct gender discrimination may have a role in pay inequality, other factors are also at play.
Studies often conclude that women’s behaviour and personal choices in doing platform work are the reason for their unequal pay (Liang et al., 2018). A study on Uber concluded that the pay difference experienced by women and men was explained by the fact that men drove faster, allow-ing them to complete more rides per hour. Men were also more likely to drive in less safe areas and during times that yielded a higher fee (Cook et al., 2018). Similar reasons were given to explain older drivers (aged 60 or older) earning almost 10 % less than drivers who are 30 years old (Cook et al., 2018). Where platform workers themselves set the pay, women tend to set their rates at lower levels (Barzilay and BenDavid, 2016; Liang et al., 2018) and, in general, take up lower paid jobs (Foong et al., 2018). While the cause is not entirely clear from the available research, it is a result of wom-en’s lower propensity to negotiate salary, along-side gendered expectations about remuneration (among both workers and employers) (Piasna and Drahokoupil, 2017).
The explanation for lower pay cannot be reduced to individual behaviour. There is a structural bias in the gender division of unpaid work and care responsibilities, restricting women’s choices in the labour market in general, including in relation to platform work. For instance, women appear to be less able to select longer, more complex tasks – some of which require a quiet working environ-ment – because of interruptions from young chil-dren or adult family members (Adams and Berg, 2017). The platform may prefer to allocate work to those with higher ratings, restricting the abil-ity of those with lower ratings to make a decent living (Ropponen et al., 2019). This disadvan-tages those who are working fewer hours, par-ticularly women with care responsibilities, and those with poor health. A study of the Amazon Mechanical Turk platform showed that women earned 20 % less per hour on average, with half of the gap explained by the fact that women had
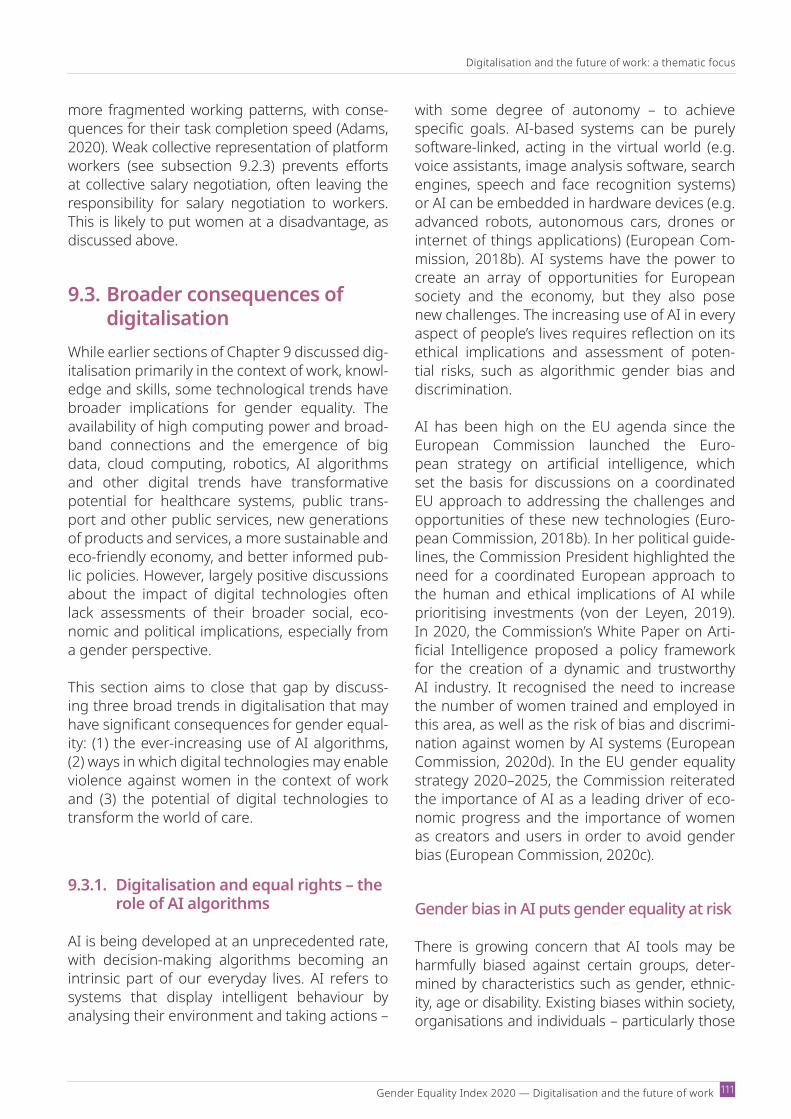
Gender Equality Index 2020 — Digi talisation and the future of work
Digitalisation and the future of work: a thematic focus
111
more fragmented working patterns, with conse-quences for their task completion speed (Adams, 2020). Weak collective representation of platform workers (see subsection 9.2.3) prevents efforts at collective salary negotiation, often leaving the responsibility for salary negotiation to workers. This is likely to put women at a disadvantage, as discussed above.
9.3. Broader consequences of digitalisation
While earlier sections of Chapter 9 discussed dig-italisation primarily in the context of work, knowl-edge and skills, some technological trends have broader implications for gender equality. The availability of high computing power and broad-band connections and the emergence of big data, cloud computing, robotics, AI algorithms and other digital trends have transformative potential for healthcare systems, public trans-port and other public services, new generations of products and services, a more sustainable and eco-friendly economy, and better informed pub-lic policies. However, largely positive discussions about the impact of digital technologies often lack assessments of their broader social, eco-nomic and political implications, especially from a gender perspective.
This section aims to close that gap by discuss-ing three broad trends in digitalisation that may have significant consequences for gender equal-ity: (1) the ever-increasing use of AI algorithms, (2) ways in which digital technologies may enable violence against women in the context of work and (3) the potential of digital technologies to transform the world of care.
9.3.1. Digitalisation and equal rights – the role of AI algorithms
AI is being developed at an unprecedented rate, with decision-making algorithms becoming an intrinsic part of our everyday lives. AI refers to systems that display intelligent behaviour by analysing their environment and taking actions –
with some degree of autonomy – to achieve specific goals. AIbased systems can be purely software-linked, acting in the virtual world (e.g. voice assistants, image analysis software, search engines, speech and face recognition systems) or AI can be embedded in hardware devices (e.g. advanced robots, autonomous cars, drones or internet of things applications) (European Com-mission, 2018b). AI systems have the power to create an array of opportunities for European society and the economy, but they also pose new challenges. The increasing use of AI in every aspect of people’s lives requires reflection on its ethical implications and assessment of poten-tial risks, such as algorithmic gender bias and discrimination.
AI has been high on the EU agenda since the European Commission launched the Euro-pean strategy on artificial intelligence, which set the basis for discussions on a coordinated EU approach to addressing the challenges and opportunities of these new technologies (Euro-pean Commission, 2018b). In her political guide-lines, the Commission President highlighted the need for a coordinated European approach to the human and ethical implications of AI while prioritising investments (von der Leyen, 2019). In 2020, the Commission’s White Paper on Arti-ficial Intelligence proposed a policy framework for the creation of a dynamic and trustworthy AI industry. It recognised the need to increase the number of women trained and employed in this area, as well as the risk of bias and discrimi-nation against women by AI systems (European Commission, 2020d). In the EU gender equality strategy 2020–2025, the Commission reiterated the importance of AI as a leading driver of eco-nomic progress and the importance of women as creators and users in order to avoid gender bias (European Commission, 2020c).
Gender bias in AI puts gender equality at risk
There is growing concern that AI tools may be harmfully biased against certain groups, deter-mined by characteristics such as gender, ethnic-ity, age or disability. Existing biases within society, organisations and individuals – particularly those

Digitalisation and the future of work: a thematic focus
European Institute for Gender Equality 112
engaged in the development of AI – can be built into the systems and algorithms, with or without intent. The lack of gender diversity in the science and technology workforce (see subsection 9.1.3), especially in sectors developing digital tech-nologies, has been credited with enabling and aggravating explicit and implicit gender biases embedded in digital services and products (Wang and Redmiles, 2019). Recent research into gen-der biases in software development points to the fact that the needs of users whose characteristics (gender/age/disability) match those of the design team tend to be best served by the software (Bur-nett et al., 2018).
Algorithms, an automated data processing tech-nique, are the basis of AI and require the right governance mechanisms. Automated deci-sion-making is certainly helpful, but when it produces a gender-biased (or otherwise wrong) decision, detection can come too late or its deci-sion could be impossible to change. The term ‘black box’ is used to describe how algorithms work, neatly encapsulating the fact that, while inputs and outputs can be seen and understood, everything in between – what happens inside the ‘black box’ – is unfathomable. The complex-ity of an algorithm is such that even full access would not bring any clarity as to how the output was created, not even for the developers of the algorithm themselves (Bathaee, 2017). This lack of transparency poses considerable challenges for the evaluation and regulation of algorithms, which are important, particularly for the commu-nity that will be ultimately affected by an algo-rithm’s decisions (AlAmoudi and Latsis, 2019; Goodman and Flaxman, 2017).
The quality of data is an important risk factor for bias in AI. Unprecedented data availability, espe-cially through online collection, has seen much attention paid to the quantity of data available rather than their quality. Problems may arise, such as accurate representation – when data does not represent the population intended – or in measurement – when data does not meas-ure what it aims to (FRA, 2019). When it comes to algorithms, the correct input is a prerequisite for a correct output (known in data science as the ‘garbage in, garbage out’ principle). The use
of data that reflects existing biases can lead to unfair treatment of certain individuals, resulting in discrimination based on gender, age, dis/abil-ity, ethnic origin, religion, education and sexual orientation (LIBE Committee, 2018).
Use of AI may have gendered consequences in a wide range of settings
Word embedding (a type of algorithm) is used to power translations and autocomplete fea-tures in everyday technology. This technology is trained on a body of data of ordinary human language, usually from online sources such as news articles (Bolukbasi et al., 2016; Caliskan et al., 2017). The real novelty of word embedding is that it tries to understand and calculate the relationship between words, instead of taking a word-by-word approach (Nissim et al., 2020). Leaving aside its innovative nature, word embed-ding is an example of how the blind application of machine learning risks amplifying gender bias. For instance, one study testing a system’s abil-ity to complete analogies resulted in ‘man is to computer science as woman is to homemaker’ (Bolukbasi et al., 2016). Another study found that use of this tool can result in gender bias in rela-tion to occupations that should be considered gender neutral, with different results given when the system was fed ‘he’ (doctor) and ‘she’ (nurse) (Lu et al., 2018). It is not gender bias alone that surfaces, but other problematic cultural associa-tions, too. Fortunately, there is a push to develop tools to detect and eliminate such bias (Boluk-basi et al., 2016; Chakraborty et al., 2016; Lu et al., 2018; Prates et al., 2019).
AI is increasingly used in hiring or pre-employment assessments, which constitute a clear determinant of economic opportunity for any individual (Bogen and Rieke, 2018; Metz, 2020). AI hiring tools not only offer employers reduced costs but may also help to address or mitigate bias, giving (more) equal opportunities to future and current employ-ees. One of the selling points of such technol-ogy is the ability to assess candidates objectively, without human bias. However, if the algorithm is built without taking into account sensitive char-acteristics or learns from data on previous biased
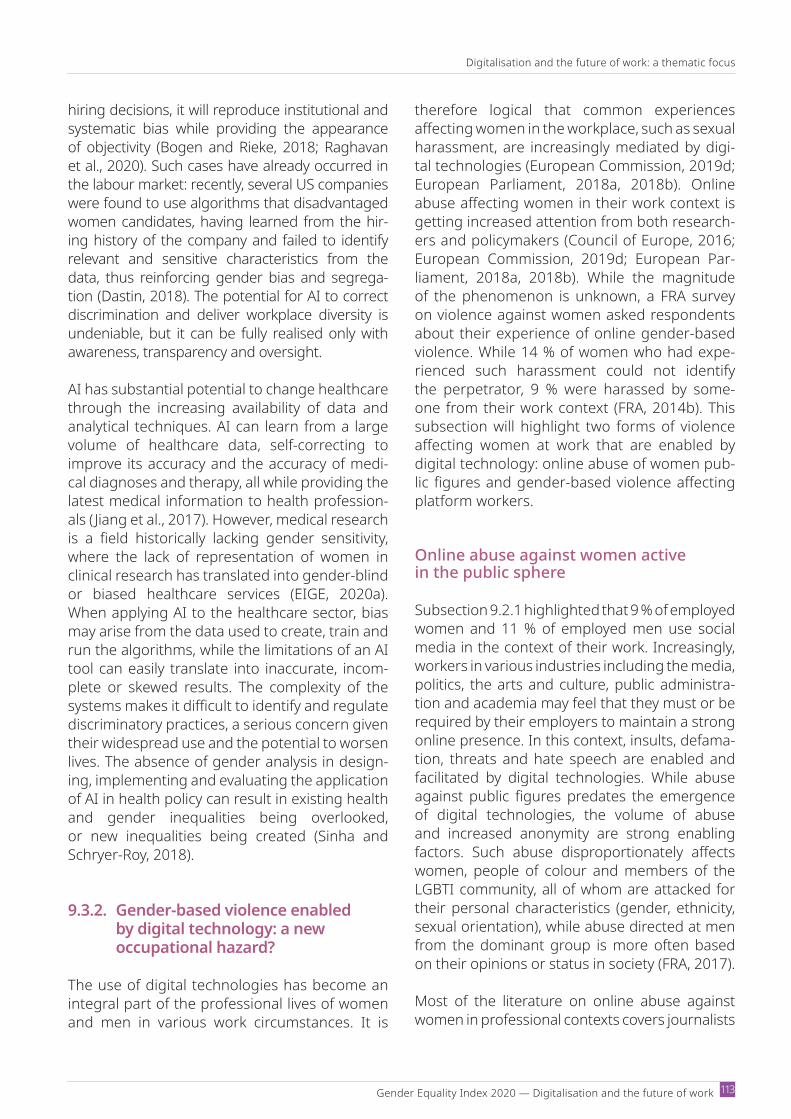
Gender Equality Index 2020 — Digi talisation and the future of work
Digitalisation and the future of work: a thematic focus
113
hiring decisions, it will reproduce institutional and systematic bias while providing the appearance of objectivity (Bogen and Rieke, 2018; Raghavan et al., 2020). Such cases have already occurred in the labour market: recently, several US companies were found to use algorithms that disadvantaged women candidates, having learned from the hir-ing history of the company and failed to identify relevant and sensitive characteristics from the data, thus reinforcing gender bias and segrega-tion (Dastin, 2018). The potential for AI to correct discrimination and deliver workplace diversity is undeniable, but it can be fully realised only with awareness, transparency and oversight.
AI has substantial potential to change healthcare through the increasing availability of data and analytical techniques. AI can learn from a large volume of healthcare data, self-correcting to improve its accuracy and the accuracy of medi-cal diagnoses and therapy, all while providing the latest medical information to health profession-als ( Jiang et al., 2017). However, medical research is a field historically lacking gender sensitivity, where the lack of representation of women in clinical research has translated into gender-blind or biased healthcare services (EIGE, 2020a). When applying AI to the healthcare sector, bias may arise from the data used to create, train and run the algorithms, while the limitations of an AI tool can easily translate into inaccurate, incom-plete or skewed results. The complexity of the systems makes it difficult to identify and regulate discriminatory practices, a serious concern given their widespread use and the potential to worsen lives. The absence of gender analysis in design-ing, implementing and evaluating the application of AI in health policy can result in existing health and gender inequalities being overlooked, or new inequalities being created (Sinha and SchryerRoy, 2018).
9.3.2. Gender-based violence enabled by digital technology: a new occupational hazard?
The use of digital technologies has become an integral part of the professional lives of women and men in various work circumstances. It is
therefore logical that common experiences affecting women in the workplace, such as sexual harassment, are increasingly mediated by digi-tal technologies (European Commission, 2019d; European Parliament, 2018a, 2018b). Online abuse affecting women in their work context is getting increased attention from both research-ers and policymakers (Council of Europe, 2016; European Commission, 2019d; European Par-liament, 2018a, 2018b). While the magnitude of the phenomenon is unknown, a FRA survey on violence against women asked respondents about their experience of online genderbased violence. While 14 % of women who had expe-rienced such harassment could not identify the perpetrator, 9 % were harassed by some-one from their work context (FRA, 2014b). This subsection will highlight two forms of violence affecting women at work that are enabled by digital technology: online abuse of women pub-lic figures and genderbased violence affecting platform workers.
Online abuse against women active in the public sphere
Subsection 9.2.1 highlighted that 9 % of employed women and 11 % of employed men use social media in the context of their work. Increasingly, workers in various industries including the media, politics, the arts and culture, public administra-tion and academia may feel that they must or be required by their employers to maintain a strong online presence. In this context, insults, defama-tion, threats and hate speech are enabled and facilitated by digital technologies. While abuse against public figures predates the emergence of digital technologies, the volume of abuse and increased anonymity are strong enabling factors. Such abuse disproportionately affects women, people of colour and members of the LGBTI community, all of whom are attacked for their personal characteristics (gender, ethnicity, sexual orientation), while abuse directed at men from the dominant group is more often based on their opinions or status in society (FRA, 2017).
Most of the literature on online abuse against women in professional contexts covers journalists

Digitalisation and the future of work: a thematic focus
European Institute for Gender Equality 114
(Edstrom, 2016; European Parliament, 2018b; Ferrier and GarudPatkar, 2018; Henrichsen et al., 2015; Posetti, 2017; Rego, 2018), political figures and human rights defenders, including femi-nist activists (InterParliamentary Union, 2018; Lewis et al., 2017), and academics (Kavanagh and Brown, 2019). A 2018 study by the InterParlia-mentary Union in 45 European countries found that over half of the women parliamentarians and parliamentary staff interviewed (58 %) had expe-rienced sexist attacks on social media, including repeated misogynistic insults and incitement to hatred, nude photomontages and pornographic videos. This was the leading form of gender-based violence experienced by study respondents but fewer than 10 % of them had reported the inci-dents. Half of the respondents (47 %) had expe-rienced death or rape threats. In the majority of cases (76 %), the perpetrators were anonymous males (Inter-Parliamentary Union, 2018).
In other instances, attacks are orchestrated by peers to humiliate and degrade the professional reputation of women in their fields (106). Cases include cybermob harassment of female journal-ists, where users of online forums – mostly young men – are called on to collectively attack a spe-cific individual through digital means (Edstrom, 2016; European Parliament, 2018b; Ferrier and GarudPatkar, 2018). Such forms of abuse exem-plify the potential scale of online harassment, with thousands of insults and threats received in a few hours (FRA, 2016c).
Cyber-violence is used against women in posi-tions of power, especially where they are young or belong to an ethnic or sexual minority, in a bid to delegitimise their power and influence (Lehr and Bechrakis, 2018; Zeid, 2018) and to reaffirm the notion that they do not belong in public spaces (FRA, 2017). The literature reveals the far-reach-ing impact of abuse on women’s professional and personal lives, with many affected women choosing to opt out of certain social networks despite their usefulness in their profession, to write only anonymously, to avoid disseminating their work and to withdraw from an exposed pro-fession altogether.
Abuse of women online is so rampant that wit-nessing abuse can affect young women’s online behaviour and reduce their likelihood of consid-ering a career in public affairs. After witnessing or experiencing online hate speech or abuse, 51 % of young women and 42 % of young men in the EU hesitated to engage in social media debates, out of fear of experiencing abuse, hate speech or threats. Cyber-harassment from peers and strangers often makes young people, especially girls, less willing to be politically active online (EIGE, 2019a).
Women platform workers placed at risk
Subsection 9.2.3 examined how the emergence of platform work and the gig economy has to some extent shifted the traditional power dynamic between employers and employees (De Stefano, 2016; Johnston and LandKazlauskas, 2018). With the employment status of workers in the platform economy shifting towards that of ‘independent con-tractor’, for many workers power relations are now between ‘service provider’ and ‘service purchaser’ – that is, between platform workers and users/clients – and are mediated by technology (Drahokoupil and Fabo, 2016; Overseas Development Institute, 2019). The sense of impunity and anonymity given to clients of on-demand platforms has been seen as placing vulnerable workers in a precarious situa-tion, including putting them at risk of gender-based biases, discrimination and abuse (Van Doorn, 2017).
Although there is a lack of quantitative data on the abuse and violence experienced by women platform workers, research has highlighted ways in which women engaged in the platform economy are exposed to a risk of violence from users. This is particularly the case in roles where platform workers interact with users and clients in enclosed spaces with no third party present, such as ride-hailing, home-sharing or personal and household services (Overseas Development Institute, 2016, 2019; Schoenbaum, 2016; Ticona and Mateescu, 2018a).
Women working in these sectors are routinely exposed to the risk of sexual harassment and
(106) Recent examples include secret online groups of French male journalists using social networks such as Twitter to harass fellow journalists, especially women, gay men and men from ethnic minorities, in a bid to compromise their career opportunities (Breeden, 2019).
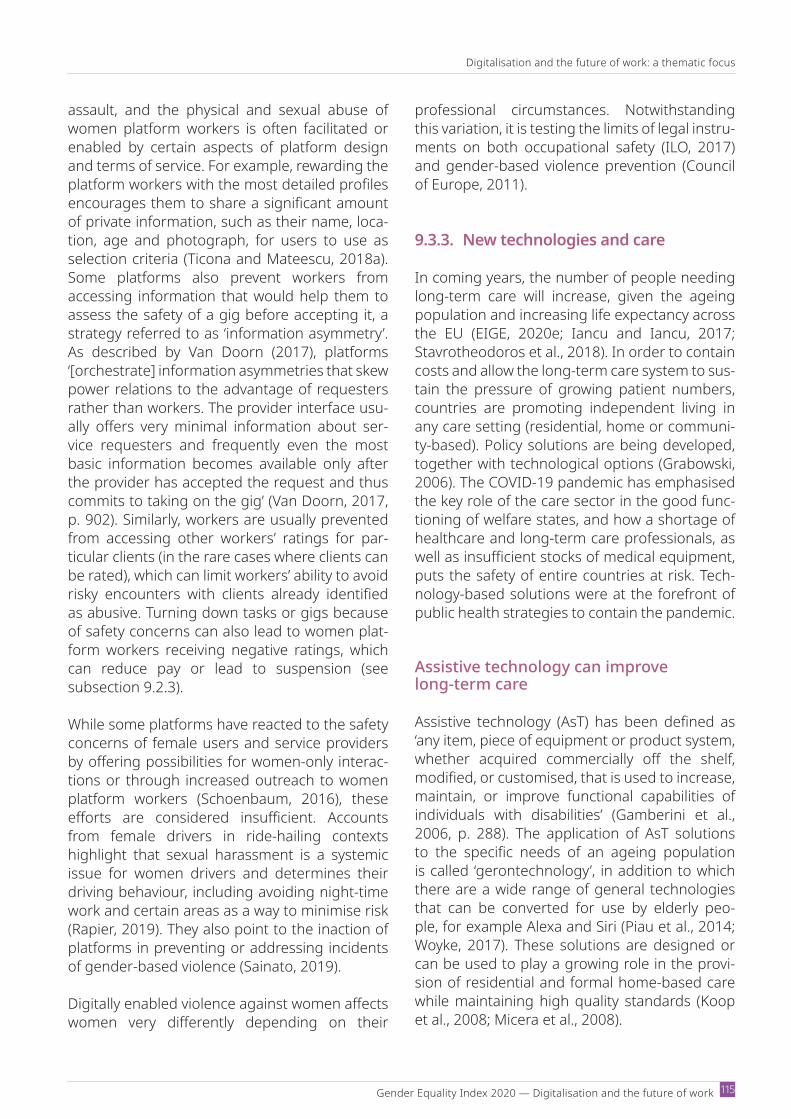
Gender Equality Index 2020 — Digi talisation and the future of work
Digitalisation and the future of work: a thematic focus
115
assault, and the physical and sexual abuse of women platform workers is often facilitated or enabled by certain aspects of platform design and terms of service. For example, rewarding the platform workers with the most detailed profiles encourages them to share a significant amount of private information, such as their name, loca-tion, age and photograph, for users to use as selection criteria (Ticona and Mateescu, 2018a). Some platforms also prevent workers from accessing information that would help them to assess the safety of a gig before accepting it, a strategy referred to as ‘information asymmetry’. As described by Van Doorn (2017), platforms ‘[orchestrate] information asymmetries that skew power relations to the advantage of requesters rather than workers. The provider interface usu-ally offers very minimal information about ser-vice requesters and frequently even the most basic information becomes available only after the provider has accepted the request and thus commits to taking on the gig’ (Van Doorn, 2017, p. 902). Similarly, workers are usually prevented from accessing other workers’ ratings for par-ticular clients (in the rare cases where clients can be rated), which can limit workers’ ability to avoid risky encounters with clients already identified as abusive. Turning down tasks or gigs because of safety concerns can also lead to women plat-form workers receiving negative ratings, which can reduce pay or lead to suspension (see subsection 9.2.3).
While some platforms have reacted to the safety concerns of female users and service providers by offering possibilities for womenonly interac-tions or through increased outreach to women platform workers (Schoenbaum, 2016), these efforts are considered insufficient. Accounts from female drivers in ridehailing contexts highlight that sexual harassment is a systemic issue for women drivers and determines their driving behaviour, including avoiding night-time work and certain areas as a way to minimise risk (Rapier, 2019). They also point to the inaction of platforms in preventing or addressing incidents of genderbased violence (Sainato, 2019).
Digitally enabled violence against women affects women very differently depending on their
professional circumstances. Notwithstanding this variation, it is testing the limits of legal instru-ments on both occupational safety (ILO, 2017) and gender-based violence prevention (Council of Europe, 2011).
9.3.3. New technologies and care
In coming years, the number of people needing long-term care will increase, given the ageing population and increasing life expectancy across the EU (EIGE, 2020e; Iancu and Iancu, 2017; Stavrotheodoros et al., 2018). In order to contain costs and allow the long-term care system to sus-tain the pressure of growing patient numbers, countries are promoting independent living in any care setting (residential, home or communi-ty-based). Policy solutions are being developed, together with technological options (Grabowski, 2006). The COVID19 pandemic has emphasised the key role of the care sector in the good func-tioning of welfare states, and how a shortage of healthcare and long-term care professionals, as well as insufficient stocks of medical equipment, puts the safety of entire countries at risk. Tech-nology-based solutions were at the forefront of public health strategies to contain the pandemic.
Assistive technology can improve long-term care
Assistive technology (AsT) has been defined as ‘any item, piece of equipment or product system, whether acquired commercially off the shelf, modified, or customised, that is used to increase, maintain, or improve functional capabilities of individuals with disabilities’ (Gamberini et al., 2006, p. 288). The application of AsT solutions to the specific needs of an ageing population is called ‘gerontechnology’, in addition to which there are a wide range of general technologies that can be converted for use by elderly peo-ple, for example Alexa and Siri (Piau et al., 2014; Woyke, 2017). These solutions are designed or can be used to play a growing role in the provi-sion of residential and formal home-based care while maintaining high quality standards (Koop et al., 2008; Micera et al., 2008).
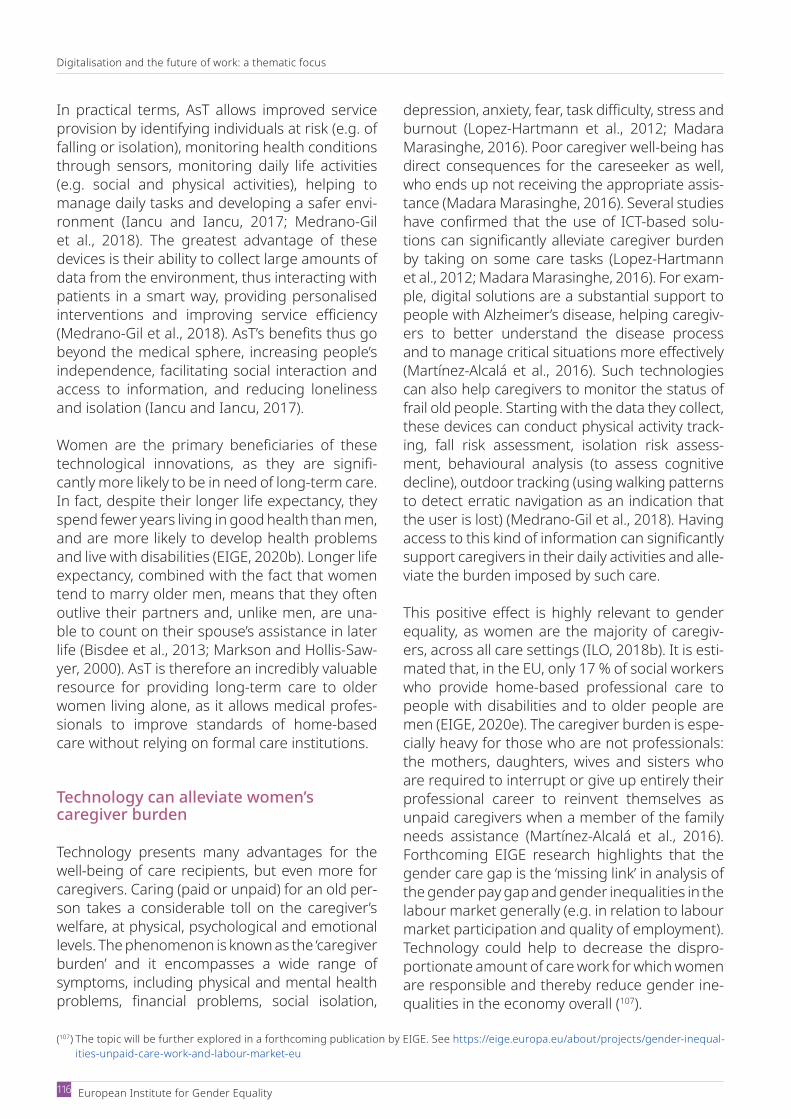
Digitalisation and the future of work: a thematic focus
European Institute for Gender Equality 116
In practical terms, AsT allows improved service provision by identifying individuals at risk (e.g. of falling or isolation), monitoring health conditions through sensors, monitoring daily life activities (e.g. social and physical activities), helping to manage daily tasks and developing a safer envi-ronment (Iancu and Iancu, 2017; MedranoGil et al., 2018). The greatest advantage of these devices is their ability to collect large amounts of data from the environment, thus interacting with patients in a smart way, providing personalised interventions and improving service efficiency (MedranoGil et al., 2018). AsT’s benefits thus go beyond the medical sphere, increasing people’s independence, facilitating social interaction and access to information, and reducing loneliness and isolation (Iancu and Iancu, 2017).
Women are the primary beneficiaries of these technological innovations, as they are signifi-cantly more likely to be in need of long-term care. In fact, despite their longer life expectancy, they spend fewer years living in good health than men, and are more likely to develop health problems and live with disabilities (EIGE, 2020b). Longer life expectancy, combined with the fact that women tend to marry older men, means that they often outlive their partners and, unlike men, are una-ble to count on their spouse’s assistance in later life (Bisdee et al., 2013; Markson and HollisSaw-yer, 2000). AsT is therefore an incredibly valuable resource for providing long-term care to older women living alone, as it allows medical profes-sionals to improve standards of home-based care without relying on formal care institutions.
Technology can alleviate women’s caregiver burden
Technology presents many advantages for the well-being of care recipients, but even more for caregivers. Caring (paid or unpaid) for an old per-son takes a considerable toll on the caregiver’s welfare, at physical, psychological and emotional levels. The phenomenon is known as the ‘caregiver burden’ and it encompasses a wide range of symptoms, including physical and mental health problems, financial problems, social isolation,
(107) The topic will be further explored in a forthcoming publication by EIGE. See https://eige.europa.eu/about/projects/gender-inequal-ities-unpaid-care-work-and-labour-market-eu
depression, anxiety, fear, task difficulty, stress and burnout (LopezHartmann et al., 2012; Madara Marasinghe, 2016). Poor caregiver well-being has direct consequences for the careseeker as well, who ends up not receiving the appropriate assis-tance (Madara Marasinghe, 2016). Several studies have confirmed that the use of ICTbased solu-tions can significantly alleviate caregiver burden by taking on some care tasks (Lopez-Hartmann et al., 2012; Madara Marasinghe, 2016). For exam-ple, digital solutions are a substantial support to people with Alzheimer’s disease, helping caregiv-ers to better understand the disease process and to manage critical situations more effectively (MartínezAlcalá et al., 2016). Such technologies can also help caregivers to monitor the status of frail old people. Starting with the data they collect, these devices can conduct physical activity track-ing, fall risk assessment, isolation risk assess-ment, behavioural analysis (to assess cognitive decline), outdoor tracking (using walking patterns to detect erratic navigation as an indication that the user is lost) (Medrano-Gil et al., 2018). Having access to this kind of information can significantly support caregivers in their daily activities and alle-viate the burden imposed by such care.
This positive effect is highly relevant to gender equality, as women are the majority of caregiv-ers, across all care settings (ILO, 2018b). It is esti-mated that, in the EU, only 17 % of social workers who provide home-based professional care to people with disabilities and to older people are men (EIGE, 2020e). The caregiver burden is espe-cially heavy for those who are not professionals: the mothers, daughters, wives and sisters who are required to interrupt or give up entirely their professional career to reinvent themselves as unpaid caregivers when a member of the family needs assistance (Martínez-Alcalá et al., 2016). Forthcoming EIGE research highlights that the gender care gap is the ‘missing link’ in analysis of the gender pay gap and gender inequalities in the labour market generally (e.g. in relation to labour market participation and quality of employment). Technology could help to decrease the dispro-portionate amount of care work for which women are responsible and thereby reduce gender ine-qualities in the economy overall (107).
Digitalisation and the future of work: a thematic focus
117Gender Equality Index 2020 — Digitalisation and the future of work
Technology and the healthcare sector during COVID-19
During the COVID19 pandemic, technology was effectively deployed to track and trace the spread of the virus among the population in order to plan the most suitable medical response. In France, for example, some online platforms were developed for remote monitoring of infected patients isolated at home (e.g. Covidom and COVID APHM). These services were designed by local health precincts to aggregate and analyse data submitted twice a day by patients, and they helped in providing adequate interventions tailored to the needs of the community (Mouterde, 2020). Data collection through devices such as smart thermometers proved to be one of the greatest advantages of technology, as the optimal allocation of scarce resources was a key determinant of success in containing the emergency (Statucki, 2020).
Another crucial application of digital technology was the possibility to monitor and treat patients with mild symptoms remotely, without exposing healthcare professionals directly to the risk of contagion. One of the biggest challenges of COVID19 was the high infection rate among doc-tors and nurses, causing a medical staff shortage in several countries (Nugent, 2020). Given the disease’s highly contagious nature, some healthcare facilities placed sensors under patients’ pillows to monitor their status, reducing human contact to a minimum.
COVID19 played a crucial role in shedding light on the dire working conditions faced by health-care workers across the EU, most of whom (76 %) are women. They bear heavy workloads, work long shifts (including nights and weekends) and undertake physically demanding tasks, for very low wages. The low economic value assigned to care is a result of cultural norms (care is stere-otypically considered women’s natural role within the household, not valued as ‘work’), as well as cutbacks in public spending, which translate into low wages across the whole care indus-try (ILO, 2018b). In addition, during the pandemic healthcare workers were disproportionately exposed to the risk of infection and were asked to reduce their time off in order that hospitals might cope with the increased workload. Here, technological solutions were essential in helping them to face these challenging circumstances and secure safe working arrangements insofar as possible.
Conclusions
118 European Institute for Gender Equality
10. ConclusionsProgress towards gender equality in the EU remains slow. The Gender Equality Index score in 2018 was 67.9 points, just 0.5 points higher than in 2017 and 4.1 points higher than in 2010. Sweden, Denmark, France and Finland took the top rankings in gender quality. Italy, Luxembourg and Malta experienced the largest improvements since 2010, and the situation remained almost the same in Czechia, Hungary and Poland. Roma-nia, Hungary and Greece remained at the bottom of the rankings, although Romania and Greece had experienced a significant improvement in gender equality since 2010, particularly Greece since 2017.
Although there has been noticeable progress in the EU towards increased women’s employment rates, lower risks of poverty for both women and men, improved gender balance in political and economic decision-making, and policy devel-opments to support work–life balance, there remains a need for more structural change in all domains and Member States.
Gender equality in the EU is facing new, emerg-ing challenges, including those brought about by digitalisation (the thematic focus of this report), recent migration flows and a mounting backlash against gender equality. Some Member States have seen a backlash against women’s human rights that has undermined the discourse on gender equality or developed into measures to prevent progress on women’s rights. The back-lash against gender equality has also contrib-uted to the shrinking space for civil society and women’s rights non-governmental organisa-tions, a problem that has deepened and accel-erated in several Member States in recent years (EIGE, 2020a).
Although further investigation is needed, emerg-ing evidence suggests that the COVID19 pan-demic of 2020 poses new risks to and challenges for gender equality, in particular to women’s economic independence and in relation to vio-lence against women. Several aspects of the
lockdown measures taken by Member States to curb the pandemic have had a considerable impact on economic sectors with a high pres-ence of women and on professions dominated by women. Women have also experienced addi-tional childcare burdens owing to the closure of schools and crèche services, with a particularly marked impact on working mothers. The lock-down and social distancing measures have been associated with an increase in requests for sup-port from women victims of intimate partner vio-lence in many Member States.
Domain of workToday’s world of work is characterised by several important gender inequalities. The employment rate of women is significantly below that of men. The labour market is heavily gender segregated, and women tend to be found more often in tem-porary, part-time or precarious employment. This contributes to significant gender gaps in pay and pensions. Such inequalities have particularly dire consequences for vulnerable groups of women, including younger and older cohorts, lone moth-ers with dependent children, and those from migrant communities or other minority groups. These inequalities are often rooted in the unequal distribution of care and other responsi-bilities within the household.
Progress on eliminating these inequalities is slow and, looking to the near future, uncertain. According to the Index, gender equality in the domain of work has grown only slightly (by about 1.7 points) since 2010. That growth has been almost entirely driven by increases in women’s employment, which makes its sustainability ques-tionable in the light of the COVID19 pandemic. This crisis is likely to lead to a sharp downturn in employment in the EU, at least in the short term: initial ILO estimates for Europe and Central Asia indicate that the first quarter of 2020 saw work-ing hours decline by 2 %, with a projected decline of almost 12 % during the second quarter. The
Gender Equality Index 2020 — Digi talisation and the future of work
Conclusions
119
immediate job loss impacts of the crisis are likely to be borne equally by women and men, unlike the situation during previous crises, where the immediate impacts tended to affect men dispro-portionately. This reflects the fact that the most severely affected sectors (accommodation and food service, real estate, business and adminis-trative activities, manufacturing and wholesale/retail) account for a considerable share of wom-en’s employment. Women’s employment may also be disproportionately affected by the unpaid care responsibilities resulting from childcare and school closures, for example in the case of lone mothers, or from additional care for older and other dependent family members. In addition, more women than men are involved in precari-ous or informal work, with limited access to vari-ous work and social protections, placing them in especially dire circumstances.
In recent years, some promising steps have been taken towards achieving greater equality in the EU labour market. Most notably, the European Pillar of Social Rights was introduced in 2017 to ensure equal opportunities for women and men in areas such as working conditions and career progression. Following the principles of the Pillar, the 2019 directive on work–life bal-ance for parents and carers seeks to address the unequal distribution of unpaid care and encour-age men to take up more caregiving responsi-bilities. Much remains to be done, however. The EU gender equality strategy 2020–2025 outlines several policy priorities, including the transposi-tion and implementation of the Work–Life Bal-ance Directive, increasing the gender sensitivity of national tax and benefits systems, ensuring sufficient availability and quality of childcare, and tackling gender segregation. Following the COVID19 crisis, it will be important to ensure that nonstandard, flexible or informal forms of employment are better paid, formalised and cov-ered by social protection. It will also be crucial to provide gender-sensitive support to those worst affected by the crisis, for example by making sure that targeted support measures reach beyond male-dominated sectors or by recognising the value of some female-dominated activities that proved critical during the crisis (e.g. healthcare) and investing in them appropriately.
Domain of moneyEqual economic independence is a prerequi-site for women taking full control of their lives, personal freedom and self-realisation. However, progress for women looks like nothing less than an uphill battle. Women persistently experience greater disadvantages in the labour market than men and earn less than men; with progress on closing the gender pay gap painfully slow, the feminisation of poverty continues. The EU has only slightly narrowed gender gaps and improved overall performance on financial resources and economic situation since 2010, as shown by an increase of only 2.2 points in this domain. The current COVID19 health crisis has brought new challenges for everybody, including undermining of women’s economic opportunities. It has wid-ened social and economic divisions and deep-ened the consequences of inequality, pushing many of the burdens resulting from it onto the most deprived among the labour force, primarily women.
In 2014, in response to long-standing pay inequality, the European Commission recom-mended that Member States adopt pay trans-parency measures. However, the 2017 report on the implementation of the recommenda-tion revealed that such measures were entirely absent in one third of Member States and insuf-ficient in others. The EU gender equality strategy 2020–2025 goes a step further, promising to introduce binding pay transparency measures. Such measures are necessary to tackle the asymmetry of information between employees and employers on pay, the lack of information on wage structure, the lack of understanding of some existing legal concepts (the concepts of ‘pay’, ‘same work’ and ‘work of equal value’), and the lack of gender neutrality in job classification and evaluation systems. This legislation is even more relevant now that the economic impact of the COVID19 pandemic risks undermining the fragile gains in women’s independence since the 2008 financial crisis.
A range of economic gender inequalities increase women’s risk of exposure to poverty and social exclusion. These are often concentrated among
Conclusions
European Institute for Gender Equality 120
certain particularly vulnerable groups, such as lone mothers, migrant and Roma women, and women with disabilities. The gender gap in pov-erty is highest among people aged 65 or older (18 % for women compared with 13 % for men). This underlines the cumulative effects of wom-en’s lifelong economic disadvantage in the labour market on pension income in old age. Women’s lower level of labour market activity stems pri-marily from their disproportionate caring and other household responsibilities, which are asso-ciated with unequal time-use patterns that result in time poverty (EIGE, 2020a). The COVID19 pan-demic will exacerbate the gender aspect of time poverty, as the increase in unpaid work will hit women hardest.
While income constraints have always been rec-ognised as an element of poverty by policymak-ers, time constraints have not. Consideration of time poverty is key for gender-sensitive poverty reduction strategies (Goldin, 2014, 2015). The EU gender equality strategy 2020–2025 provides a promising basis for putting care work more sol-idly at the centre of EU economic activity and for addressing structural discrimination and gender inequalities built into the current economic, fiscal and social systems. It is crucial that the measures proposed by the strategy are given political pri-ority in the context of the current economic dis-ruption. They need to be placed at the core of the post-pandemic recovery strategies that are likely to reshape our societies.
Domain of knowledgeThe domain of knowledge has remained unchanged since the previous edition of the Gender Equality Index, with progress slow over-all over the past 10 years. Although educational attainment is increasing among young women and men, more significant progress is hampered by persistent gender segregation in higher education and by low participation in lifelong learning.
Young women continue to outpace young men in educational attainment, with the gender gap gradually widening to the detriment of men. This
trend has already had an effect on the achieve-ment of the EU2020 target, with the goal met only for young women in the EU (46 % have graduated from tertiary education). Access to high-quality inclusive education – in accordance with the European Pillar of Social Rights – could be further improved for women and men with disabilities and those from deprived socioeco-nomic backgrounds.
Lifelong learning activities are essential pol-icy tools to promote employability, adaptability, and the professional and personal fulfilment of women and men. Yet participation in adult edu-cation remains below the EU framework for edu-cation and training 2020 benchmark of 15 % for both women and men. Participation in lifelong learning is especially low among women and men with low levels of qualifications, who could bene-fit most from it. As highlighted in the Council rec-ommendation ‘Upskilling pathways’, well-tailored and flexible learning opportunities could benefit those in need by upgrading their skills. Similarly, work–life balance policies could facilitate partici-pation in adult learning by allowing women and men to better manage their training, work and family responsibilities.
Persistent gender segregation remains the most pronounced challenge for gender equality in the domain of knowledge. The share of men study-ing in education, health and welfare, humanities and the arts (and vice versa, that is, the share of women studying in STEM fields) is not increasing. The EU gender equality strategy 2020–2025 aims to address this long-standing gender equality challenge by reducing gendered choices in rela-tion to study subjects and subsequent careers. This could be done by developing gender-sen-sitive and stereotype-free education and career counselling and by carrying out media cam-paigns encouraging and enabling women and men to choose non-traditional educational paths and occupations.
Domain of timeThe domain of time is characterised by a per-sistent lack of progress and growing inequality;
Gender Equality Index 2020 — Digi talisation and the future of work
Conclusions
121
since 2010, the EU score has stagnated, with a slight decrease of 0.6 points to 65.7. Owing to the absence of up-to-date data on time use, the score for the domain of time has not been updated since the last edition of the Index.
The European Pillar of Social Rights endorses everyone’s right to accessible, good-quality and affordable longterm care services, in particular at-home care and community-based services. The Work–Life Balance Directive has bolstered entitlements to familyrelated leave and flexible working arrangements; for example, it intro-duced the new right for workers to take at least 5 working days of carer’s leave per year in case of a relative’s serious illness or dependency. These provisions seek to remove some of the barriers faced by informal carers, especially women, in entering and staying in employment.
A strong commitment to the implementation of both instruments is essential in the context of the COVID19 pandemic, particularly with regard to long-term care needs. In addition, Europe’s rap-idly ageing population will increase the need for longterm care – already insufficiently met across the EU – and potentially add to women’s dispro-portionate burden of unpaid care responsibili-ties. Although long-term care challenges have been on the EU policy agenda for some time, the policies seldom take a gender equality approach.
Domain of powerThe domain of power has shown the biggest and most sustained improvement against the Gender Equality Index (an increase of 1.6 points since 2017 and almost 12 points since 2010), despite being the lowest scoring domain (53.5). The improvement in gender balance in political and economic decision-making can be attributed to the implementation of gender quotas, both binding and voluntary.
Gender parity is essential for a democratic soci-ety. The presence of women in parliaments has increased in 2020, with more Member States
reaching gender balance (i.e. at least 40 % of each gender). Several countries have under-taken initiatives to improve the gender balance in their parliaments and speed up the rate of change. In fact, legislative candidate quotas are currently in place in 10 Member States and the representation of women generally improved fol-lowing their application. Gender balance among cabinet ministers in national governments has also improved, although there are significant differences between Member States. While the unequal participation of women in government is a priority, the sidelining of women in allocating portfolios is also an issue. Highprofile portfolios (the so-called basic or economic functions) are assigned primarily to men, while sociocultural (‘soft’) portfolios, are predominantly assigned to women ministers.
In 2012, the European Commission proposed leg-islative action to guarantee that the under-rep-resented sex would constitute at least 40 % of nonexecutive directors of listed companies. The gender equality strategy 2020–2025 commits to pushing for the adoption of this regulation. Sub-stantial progress has been made in this area of decision-making, with a 2-p.p. increase since last year, but only France surpasses the 40 % repre-sentation threshold. Several Member States have taken action to promote gender-balanced repre-sentation in corporate leadership, varying from soft measures, aimed at encouraging companies to self-regulate and take action independently, to hard regulatory approaches, including the application of legally binding quotas for the min-imum representation of each gender and (in some cases) sanctions for non-compliance. The impact of binding regulation is clear, with women accounting for 37 % of the boards of the largest listed companies in Member States with binding quotas, compared with 25 % in countries that have taken only soft measures or no action at all. It has had a similarly positive impact on other areas of decision-making as well.
In the context of the COVID19 pandemic, the lack of women’s presence in the decision-making bodies managing the crisis unveils deeply rooted
Conclusions
European Institute for Gender Equality 122
issues. This stark contrast is evident in the fact that the overwhelming majority of healthcare workers are women, yet they are absent from key decision-making positions. Gender continues to be a crucial determinant of health and it is nec-essary to include women in decision-making on recovery strategies.
Domain of healthThe EU has shown few notable signs of progress towards gender equality in the domain of health in recent years. Progress since 2010 has been neg-ligible (+ 0.8 points), with a minor loss recorded between 2017 and 2018 (– 0.1 points). Inequali-ties are most marked in the subdomain of health behaviour – smoking, alcohol consumption, eating fruit and vegetables and taking physical exercise – but progress in this area is impossible to monitor, owing to a lack of up-to-date data.
In the wake of the COVID19 pandemic, health inequalities will continue to accumulate and be felt most by those more likely to be out of the labour market and in low-income situations, namely women with low education and women and men with disabilities. Despite healthcare in the EU being generally very accessible, these groups tend to have poor access to healthcare services while being most likely to suffer poor health. In 2018, the most common reason given for unmet health and dental care needs was inability to afford the services. It can therefore be expected that the postCOVID19 economic cri-sis and associated unemployment will continue to significantly restrict access to health services for even larger shares of people.
Gender inequalities in society have determined how COVID19 has impacted the health and lives of all women and men. Apart from the direct health consequences of the virus itself, there are secondary impacts on health and mental health, which are often longlasting and gender specific.
In this context, the strategic objectives of the EU health programme and the WHO strategy to
improve health and reduce health inequalities within and between Member States will not be achievable unless a clearly gendered approach is applied to mitigate the impact of the COVID19 pandemic on health.
Domain of violenceGender-based violence remains a pervasive issue in the EU, with serious ramifications for women’s lives. Women from minority groups find themselves in particularly vulnerable situations that pose several threats to their physical and psychological integrity.
Europe has developed one of the most pro-gressive legal instruments to combat this phe-nomenon: the Istanbul Convention. However, persistent challenges related to its ratification in some Member States, together with gaps in the implementation of national legislation on violence against women, are causes for concern. Further progress requires that all Member States ratify the Istanbul Convention and provide train-ing for law enforcement personnel and judges to ensure adequate implementation of legal instru-ments. It is also important to invest in support services for victims of violence against women and in the collection of high-quality, comparable data on all forms of such violence.
The emergence of cyber-violence (including online hate speech, cyberstalking, cyberbullying and cyber-harassment, and non-consensual por-nography) is a growing concern. Such violence can silence women and discourage them from taking a prominent role in public life. Certain aspects of the digital world have a particularly negative impact on girls, including pornography, child sexual abuse material and cyberbullying. There is no specific EUlevel instrument to tackle these forms of cyber-violence.
Research on gender-based violence points to the shrinking divide between the reality of offline and online spaces. In this era of digitalisation, these spaces should no longer be understood

Gender Equality Index 2020 — Digi talisation and the future of work
Conclusions
123
as separate. Rather, legal instruments, policies and programmes should approach and deal with them in a comprehensive way.
Digitalisation and the future of work
Using and developing digital technologies
Digitalisation is having profound effects on the lives of women and men. Together with new opportunities and high social transformational potential, digitalisation carries the promise of change for gender relations. Yet rapidly evolv-ing technological innovations remain strongly embedded in preexisting gender stereotypes and biases. Too few women are engaged in high-technology industries, research and inno-vation. Here, even when women are recruited, they face gender prejudices and work–life bal-ance strains that contribute to the gender pay gap and to horizontal and vertical segregation. It is imperative to take measures to actively shape digital change and use the potential of digitalisa-tion in a way that promotes gender equality and women’s rights across all aspects of social, eco-nomic and political life.
The impacts of digitalisation on gender equality have rarely been explicitly recognised in EU digi-tal policy, although, as shown in this report, soci-eties with greater equality between women and men also perform better in the digital economy. The new EU gender equality strategy 2020–2025 reaffirms the EU’s commitment to integrating a gender perspective into all major European Commission initiatives, including the digital tran-sition (European Commission, 2020c). The EU has recognised that fighting gender bias and opening up new jobs for women in high-technol-ogy industries is a question of innovation, social equality and justice that requires targeted inter-ventions across all levels of education, up to and including the highest levels of research careers. Crucially, integration of the gender dimension into the digital transition is a way to increase the responsibility and trustworthiness of new technologies and digital innovation. Current
initiatives to bring more women into the ICT sec-tor and address specific labour market needs can be considered an initial step towards addressing the digital gender divide.
Gender differences in digital skills and use of digi-tal devices, particularly among young people, are gradually levelling out. Young women and men are the most digitally skilled generation and ben-efit equally from digital skills. The gender divide widens with age, however. Women generally experience bigger obstacles than men in devel-oping or updating their digital skills. Although women are more likely to participate in learning than men, they consistently report that they can-not participate in lifelong learning because of their family responsibilities.
Women tend to indicate somewhat lower con-fidence in their digital skills and use of tech-nologies. Despite representing 58 % of tertiary graduates in the EU across all study fields, women make up only 19 % of graduates in ICTrelated fields. Gender stereotypes affect young people’s career aspirations and occupational choices, leading to gender segregation in education and subsequently in the labour market.
The digital education action plan and the updated European skills agenda provide a promising basis for addressing gender stereotypes in relation to the use of digital technologies and taking concrete measures to address the gender gap in digital skills and competencies, including in selfconfi-dence. It is necessary to take steps to prevent and combat gender stereotypes and gender segrega-tion in education, as well as to raise awareness of the empowering potential of digitalisation.
Further analysis of intersectional inequalities in the acquisition of certain digital skills (prob-lem-solving and software skills) is needed, espe-cially given the fast pace of digitalisation and risk of exclusion. This is particularly relevant to clos-ing the gender gaps for older people and people with low education. Lack of training opportuni-ties is another obstacle to increasing and updat-ing digital skills for women and men, highlighting the importance of increased attention to and resources for digital skills training.
Conclusions
European Institute for Gender Equality 124
The European Commission and the Member States have made some progress on implement-ing gender targets and quotas in research and innovation. However, the gender differences at higher levels of scientific careers remain striking. The EU and national government bodies should maintain and reinforce the structural change approach as a sustainable policy framework for integrating gender equality into research and innovation. Research and innovation organisa-tions, together with funding organisations and the business sector, need to take specific action to overcome persistent gender gaps in scien-tific careers and ensure gender balance in deci-sion-making. Equally crucial is the integration of gender analysis into all phases of research, from deciding which technologies to develop to gathering and analysing data and transfer-ring ideas to market. The EU has recognised the concept of ‘gendered innovations’, which refers precisely to the potential to radically alter scien-tific knowledge and technological production by introducing gender perspectives, approaches and methodologies (108) (European Commission, 2013). The untapped potential of talented female scientists, as well as the effects of genderblind research, hold back the realisation of technolog-ical and scientific advances.
Digital transformation of the world of work
While gender segregation in research and inno-vation receives some attention in EU policy, the impacts of digitalisation on gender equality in the labour market are frequently overlooked. This is striking, as digitalisation is resulting in a profound labour market transformation, with many jobs automated or reorganised, often along highly gendered sectoral or occupational lines. Notably, women are at a slightly higher risk of job loss due to automation, many new jobs emerging in the context of this transformation are concentrated in male-dominated sectors (ICT, STEM) and much of the benefit may end up in the hands of the wealthiest capital owners (primarily men).
Yet digitalisation of work holds out some pros-pects for increased gender equality. It offers opportunities to break down old patterns of seg-regation, to upskill certain low-skilled jobs usu-ally held by women (with associated rises in pay), and to contribute to a more balanced distribu-tion of paid and unpaid work among women and men. For such benefits to be realised, a number of policy interventions are needed. Firstly, it will be necessary to ensure gender equality in rela-tion to policies that support workers displaced by digitalisation; historically, such policies have often been inadvertently biased against women, focusing on industrial sectors dominated by men rather than the service sector. Secondly, it will be necessary to involve women in the management of this transformation, for example by adopting the proposed directive on gender balance on corporate boards to ensure women’s represen-tation in business leadership. Thirdly, the ben-efits of the transformation need to be broadly distributed among working women and men (e.g. through pay rises, especially for women; expansion of employee ownership of businesses; and better collective representation), rather than disproportionately benefiting wealthy cap-ital owners (mostly men). Finally, efforts will be needed to make new job opportunities avail-able to all, for example by breaking occupational gender stereotypes and promoting sustainable employment that allows a good work–life bal-ance. Ensuring full transposition of the Work–Life Balance Directive at Member State level will be a good starting point in this context.
Women may face challenges other than being replaced by machines, stemming primarily from some of the flexible modes of working that dig-italisation enables, such as certain types of plat-form work. While flexibility can enable women with unpaid care responsibilities to undertake paid employment, it is often coupled with unsta-ble working arrangements, including short-term, part-time and precarious forms of labour for the less privileged segments of the female work-force. These are associated with a lack of social protection, limited access to welfare entitlements
(108) https://www.jst.go.jp/pdf/event_diversity160316.pdf
Gender Equality Index 2020 — Digi talisation and the future of work
Conclusions
125
(including benefits and paid leave) and worker exploitation. Such precarious employment is common in certain forms of platform work, with a range of consequences for gender equality. For example, exploited workers cannot fully enjoy the work–life balance benefits associated with increased work flexibility; lack of access to social benefits prevents workers from using maternity, paternity or parental leave; and certain workforce management practices expose workers to dis-crimination based on gender and other grounds. To date, platform work seems to replicate rather than challenge the inequalities in the traditional labour market, such as the gender pay gap and segregation.
Alongside measures to promote the participation of girls and women in STEM and ICT education, policies should urgently address the lack of sta-ble working arrangements, as well as work and social protections, in the context of new forms of digitised work, such as platform work. More generally, it will be necessary to implement the ILO Conventions on Decent Work and associated instruments to create a robust policy framework around the platform economy. This framework should be supported by high-quality, gender-dis-aggregated data on platform work, comparable across Member States. As yet, only piecemeal data from surveys with limited coverage is avail-able, which severely limits the understanding of challenges faced by platform workers. Com-prehensive, gender-disaggregated data would support more robust gender analysis of these challenges.
For the policy framework around platform econ-omy to be gender sensitive, it will need to ensure that:
1. traditional labour market policies to tackle pay gaps and gender segregation apply in the context of the platform economy;
2. EU gender equality and non-discrimination legislation applies to the platform economy to prevent discriminatory practices based on gender and other grounds;
3. platform workers have access to the social and work protections that are crucial for gen-der equality, such as parental leave and con-tributory pension schemes;
4. flexible working arrangements meet workers’ work–life balance needs (and prevent exploit-ative practices that limit worker autonomy);
5. even the most vulnerable workers – such as the migrant women who are the group meet-ing the sharp growth in demand for domestic services provided via platforms – have decent working conditions.
Some steps have been taken in this direction, including highlighting the importance of main-streaming gender into digitalisation policies in the EU gender equality strategy 2020–2025, the provision of policy guidance and recommenda-tions through the Commission’s communication ‘A European agenda for the collaborative econ-omy’, the adoption of a Council recommendation on access to social protection for workers and the self-employed, and the adoption of the directive on transparent and predictable working condi-tions in the European Union. However, these doc-uments pay little attention to the different ways in which women and men are affected by the new forms of work. Much remains to be done if the principles of fair working conditions, access to social protection and gender equality, as out-lined in the European Pillar of Social Rights, are to become a reality within platform work.
Broader consequences of digitalisation
The effects of digitalisation on women’s and men’s lives extend far beyond the worlds of work and education. The increased presence of high-pow-ered AI technologies creates huge opportunities to transform our economy and society but also recreates old risks and poses new challenges for fundamental rights and gender equality. A recent Commission communication on Europe’s digital future addressed both the challenges and the opportunities of digitalisation, highlighting that only trustworthy development of technologies
Conclusions
European Institute for Gender Equality 126
can ensure sustainable growth and foster an open and democratic society. Further steps have been taken in this direction with the release of the White Paper on Artificial Intelligence, the Eth-ics guidelines for trustworthy AI and the European data strategy. However, scope for broader action remains, for example, in promoting the participa-tion of diverse groups of women and men in the development of AI, or supporting and building the capacity of national equality bodies to detect and address discrimination in the context of digi-talisation, especially AI.
More effort is required to combat cyberviolence, which has become a common and often trau-matising dimension of women’s work and lives. The EU’s accession to the Istanbul Convention would be a positive step forward. As the Conven-tion does not cover the most pervasive forms of cyber-violence, synergies with other Council of Europe conventions (the Budapest Convention and the Lanzarote Convention) and their respec-tive committees could be explored with respect to protection from, and prevention and prosecution of, cyber-violence against women and girls (EIGE, 2020a; European Parliament, 2018b). In line with data collection commitments enshrined in both the Istanbul Convention and the Victims’ Rights Directive, more emphasis should be placed on data collection to gain a better understanding of women’s exposure to this form of violence and to
design adequate responses. The inclusion of this form of violence in the upcoming EU-wide sur-vey on gender-based violence will provide much needed information on women’s experiences of cyberviolence in different contexts.
Assistive technologies (AsT) are likely to play a growing role in the provision of formal and informal home-based care. AsT facilitates home-based medical and social care by monitoring the health and daily life activities of care recipients and by creating better conditions for indepen-dent living. Broader use of AsT is highly relevant from a gender equality perspective, as women account for 83 % of the social workers who pro-vide home-based professional care to people with disabilities and older people. Women are also in greater need of long-term care, as they live longer than men and are more likely to develop serious health problems. AsT has potential to decrease the disproportionate amount of formal and informal care work that falls to women, but this alone is not sufficient. Work in the care sec-tor is hugely devalued, underpaid and character-ised by a high rate of precarious and irregular work. Improving working conditions and attract-ing more men into the care sector (to overcome horizontal segregation) are essential steps towards guaranteeing more equity not within the care industry alone but in the economy and society overall.
References
127Gender Equality Index 2020 — Digitalisation and the future of work
Abdelkader, E. (2017). A Comparative Analysis of European Islamophobia: France, UK, Germany, Netherlands and Sweden. UCLA J. Islamic & Near EL, 16, 29.
Adams, A. (2020). The Gender Wage Gap on an Online Labour Market: The Cost of Interruptions. Centre for Economic Policy Research. Retrieved from https://cepr.org/active/publications/discussion_ papers/dp.php?dpno=14294
Adams, A., and Berg, J. (2017). When home affects pay: An analysis of the gender pay gap among crowdworkers. Social Science Research Network. Retrieved from https://papers.ssrn.com/sol3/papers.cfm?abstract_id=3048711
AlAmoudi, I., and Latsis, J. (2019). Anormative black boxes: Artificial intelligence and health policy. In I. Al-Amoudi and E. Lazega (Eds.), Post- human institutions and organizations: Confronting the matrix. London: Routledge.
Alon, T. M., Doepke, M., OlmsteadRumsey, J., and Tertilt, M. (2020). The impact of COVID19 on gender equality. National Bureau of Economic Research. Retrieved from https://www.nber.org/papers/w26947#:~:text=The%20economic%20downturn%20caused%20by,downturn%20and%20the%20subsequent%20recovery. &text=Beyond%20the%20immediate%20cri-sis%2C%20there,equality%20in%20the%20labor%20market.
Armbruster, S., and Klotzbücher, V. (2020). Lost in lockdown? COVID-19, social distancing, and mental health in Germany. Retrieved from https://www.researchgate.net/publication/341453550_Lost_in_Lockdown_Covid19_Social_Distancing_and_Mental_Health_in_Germany
Autor, D. (2015). Why are there still so many jobs? The history and future of workplace automation. Journal of economic perspectives, 29(3), 3-30.
Ayres, I., Banaji, M., and Jolls, C. (2015). Race effects on eBay. The RAND Journal of Economics, 46(4), 891917.
Bailey, J., and Steeves, V. (2015). eGirls, eCiti-zens: Putting Technology, Theory and Policy into Dialogue with Girls’ and Young Women’s Voices: University of Ottawa Press/Les Presses de l’Uni-versité d’Ottawa.
Baranne, M. L., and Falissard, B. (2018). Global burden of mental disorders among children aged 5–14 years. Child and adolescent psychiatry and mental health, 12(1), 19.
Barzilay, A. R. (2018). Discrimination without Dis-criminating: Learned Gender Inequality in the Labor Market and Gig Economy. Cornell Journal of Law and Public Policy, 28, 545.
Barzilay, A. R., and Ben-David, A. (2016). Platform inequality: gender in the gig-economy. Seton Hall Law Review, 47, 393.
Bathaee, Y. (2017). The artificial intelligence black box and the failure of intent and causation. Har-vard Journal of Law and Technology, 31, 889.
Behrendt, C., Nguyen, Q. A., and Rani, U. (2019). Social protection systems and the future of work: Ensuring social security for digital platform workers. International Social Security Review, 72(3), 17-41.
Bergvall‐Kåreborn, B., and Howcroft, D. (2014). Amazon Mechanical Turk and the commodifica-tion of labour. New technology, work and employ-ment, 29(3), 213-223.
Bisdee, D., Daly, T., and Price, D. (2013). Behind closed doors: Older couples and the gendered management of household money. Social Policy and Society, 12(1), 163-174.
BMJ Global Health. (2020). Sex, gender and COVID19: Disaggregated data and health dis-parities. Retrieved from https://blogs.bmj.com/bmjgh/2020/03/24/sexgenderandcovid19disaggregated-data-and-health-disparities/
Bogen, M., and Rieke, A. (2018). Help Wanted: An Examination of Hiring Algorithms, Equity, and Bias.
References
References
European Institute for Gender Equality 128
Retrieved from https://pdfs.semanticscholar. org/8775/1e071235c53fdb4411545b449537cb8 ab96d.pdf?_ga=2.77241493.1435391397.15984 277091591646695.1598259436
Bolukbasi, T., Chang, K.W., Zou, J. Y., Saligrama, V., and Kalai, A. T. (2016). Man is to computer program-mer as woman is to homemaker? debiasing word embeddings. Paper presented at the Advances in neural information processing systems. http://papers.nips.cc/paper/6228-man-is-to-computer-programmer-as-woman-is-to-homemaker-debia sing-word-embeddings.pdf
BrajšaŽganec, A., Merkaš, M., and Šverko, I. (2011). Quality of life and leisure activities: How do leisure activities contribute to subjective well-being? Social Indicators Research, 102(1), 8191.
Breeden, A. (2019). Facebook Group of French Journalists Harassed Women for Years. New York Times. Retrieved from https://www.nytimes. com/2019/02/12/world/europe/ la l igue dulolsexualharassment.html
Brennan, D., Fisher, H., and Smith, K. I. (2017). Femicides of elderly women in England and Wales. In Femicide Volume VIII. Abuse and femini-cide of the older woman: ACUNS.
Bryce, J., and Fraser, J. (2013). “It’s Common Sense That It’s Wrong”: Young People’s Perceptions and Experiences of Cyberbullying. Cyberpsy-chology, Behavior, and Social Networking, 16(11), 783-787.
Burnett, M., Sarma, A., Mendez, C., Oleson, A., Hilderbrand, C., SteineHanson, Z., and Ko, A. J. (2018). Gender biases in software for prob-lem-solving. Paper presented at the Designing Technologies to Support Human Problem Solv-ing Workshop. At VL/HCC 2018, Lisbon. ftp://ftp.cs.orst.edu/pub/burnett/vlhcc18-workshop PaperproblemSolving.pdf
Caliskan, A., Bryson, J. J., and Narayanan, A. (2017). Semantics derived automatically from language corpora contain human-like biases. Science, 356(6334), 183-186.
Carpenter, M. (2016). The human rights of inter-sex people: addressing harmful practices and rhetoric of change. Reproductive Health Matters, 24(47), 74-84.
Castilla, E. J. (2008). Gender, race, and meritoc-racy in organizational careers. American Journal of Sociology, 113(6), 14791526.
Cedefop. (2018). Skills forecast: trends and chal-lenges to 2030. Retrieved from https://www.cede fop.europa.eu/en/publications-and-resources/publications/3077
Chakraborty, T., Badie, G., and Rudder, B. (2016). Reducing gender bias in word embeddings. Retrieved from http://cs229.stanford.edu/proj 2016/report/BadieChakrabortyRudder-Reduc ingGenderBiasInWordEmbeddings-report.pdf
Cherry, M. A. (2010). A taxonomy of virtual work. Georgia Law Review, 45, 951.
Chung, H., and Van der Horst, M. (2018). Wom-en’s employment patterns after childbirth and the perceived access to and use of flexitime and teleworking. human relations, 71(1), 47-72.
Chung, H., and Van der Lippe, T. (2018). Flexible working, work–life balance, and gender equality: Introduction. Social Indicators Research, 1-17.
CNews. (2020). Avec le confinement, le «revenge porn» a explosé. Retrieved from https://www.cnews.fr/vie-numerique/2020-04-21/avec-le-confinementlerevengepornexplose949211
Cockburn, C. (1987). Machinery of dominance. Capital & Class, 11(2), 170-181.
Cockburn, C., and Ormrod, S. (1993). Gender and Technology in the Making. London: SAGE Publica-tions Ltd.
ComasHerrera, A., Zalakain, J., Litwin, C., Hsu, A. T., Lane, N., and Fernández, J.-L. (2020). Mor-tality associated with COVID19 outbreaks in care homes: early international evidence. International Long Term Care Policy Network. Retrieved from https://ltccovid.org/2020/04/12/

Gender Equality Index 2020 — Digi talisation and the future of work
References
129
morta l i ty assoc iatedwithcov id19out -breaks-in-care-homes-early-international- evidence/
Cook, C., Diamond, R., Hall, J., List, J. A., and Oyer, P. (2018). The gender earnings gap in the gig economy: Evidence from over a million rideshare drivers. Retrieved from https://www.nber.org/papers/w24732.pdf
Corradi, Baldry, Buran, Kouta, Schröttle, and Stevkovic. (2018). Exploring the data on femicide across Europe. In S. Weil, Corradi, C., & Naudi, M. (Ed.), Femicide across Europe (pp. 93166): Policy Press.
Council of Europe. (2011). Convention on Pre-venting and Combating Violence against Women and Domestic Violence (Istanbul Convention) and explanatory report. Retrieved from https://www.coe.int/en/web/conventions/full-list/-/conventions/rms/090000168008482e
Council of Europe. (2016). Combating Sexist Hate Speech. Retrieved from https://rm.coe.int/1680651592
Countouris, N., and Ratti, L. (2018). The Sharing Economy and EU Anti-discrimination Law. In N. M. Davidson, M. l. Finck, and J. J. Infranca (Eds.), The Cambridge Handbook of the Law of the Shar-ing Economy (pp. 486498). Cambridge: Cam-bridge University Press.
Criado Perez, C. (2019). Invisible Women: Exposing data bias in a world designed for men. London: Penguin Random House.
Dao, M., Das, M., Koczan, Z., and Lian, W. (2017). Drivers of Declining Labor Share of Income. International Monetary Fund Blog. Retrieved from https://blogs.imf.org/2017/04/12/drivers-of- declining-labor-share-of-income/
Dastin, J. (2018, October 10, 2018). Amazon scraps secret AI recruiting tool that showed bias against women. Reuters. Retrieved from https://www.reuters.com/article/us-amazon-com-jobs- automation-insight/amazon-scraps-secret-ai- recruiting-tool-that-showed-bias-against-women-idUSKCN1MK08G
Davies. (2020). Revenge porn soars in Europe’s coronavirus lockdown as student fights back. Thomson Reuters Foundation. Retrieved from http://cms.trust.org/tem/20200505165904e8umi
Davies, and Bennett. (2016). A gendered human rights analysis of Ebola and Zika: locating gen-der in global health emergencies. International Affairs, 92(5), 1041-1060.
De Stefano, V. (2016). The rise of the justintime workforce: Ondemand work, crowdwork, and labor protection in the gig-economy. Compara-tive labor law and policy journal, 37(3), 461-471.
Dlugonski, D., and Motl, R. W. (2013). Marital sta-tus and motherhood: Implications for physical activity. Women & health, 53(2), 203-215.
Doleac, J. L., and Stein, L. C. (2013). The visible hand: Race and online market outcomes. The Economic Journal, 123(572), F469F492.
Drahokoupil, J., and Fabo, B. (2016). The plat-form economy and the disruption of the employ-ment relationship. ETUI Research Paper-Policy Brief, 5. Retrieved from https://www.etui.org/publications/policy-briefs/european-econom-ic-employment-and-social-policy/the-plat form-economy-and-the-disruption-of-the- employment-relationship
ECDC. (2020). Surveillance of COVID-19 at long-term care facilities in the EU/EEA. Retrieved from https://www.ecdc.europa.eu/sites/default/files/documents/covid19longtermcarefacilitiessurveillance-guidance.pdf
Edstrom, M. (2016). The trolls disappear in the light: Swedish experiences of mediated sexu-alised hate speech in the aftermath of Behring Breivik. International Journal for Crime, Justice and Social Democracy, 5(2), 96.
EESC. (2018). Skills mismatches: EU businesses are losing millions, and will be losing even more! Retrieved from https://www.eesc.europa.eu/en/news-media/press-releases/skills-mismatches-eu-businesses-are-losing-millions-and-will-be-losing-even-more
References
European Institute for Gender Equality 130
EIGE. (2016). Data Collection on Violence Against Women. Retrieved from https://eige.europa.eu/gender-based-violence/data-collection#2016
EIGE. (2017a). Administrative data collection on rape, femicide and intimate partner violence in EU Member States. Retrieved from https://eige.europa.eu/publications/administrative-data- collection-rape-femicide-and-intimate-part ner-violence-eu-member-states
EIGE. (2017b). Cyber violence against women and girls. Retrieved from http://eige.europa.eu/ rdc/eige-publications/cyber-violence-against- women-and-girls
EIGE. (2017c). Economic benefits of gen-der equality in the European Union, Literature review: existing evidence and methodological approaches. Retrieved from http://eige.europa.eu/sites/default/files/documents/ti_pubpdf_mh0116176ennpdfweb_20170516164243.pdf
EIGE. (2017d). Gender Equality Index 2017: Mea-surement framework of violence against women. Retrieved from https://eige.europa.eu/publi cations/genderequalityindex2017measure ment-framework-of-violence-against-women
EIGE. (2017e). Gender Equality Index 2017: Mea-suring gender equality in the European Union 2005-2015. Retrieved from https://eige.europa.eu/rdc/eigepublications/genderequalityindex 2017-measuring-gender-equality-european- union-2005-2015-report
EIGE. (2018a). Indicators on intimate part-ner violence and rape for the police and justice sectors. Retrieved from https://eige.europa.eu/publications/indicators-intimate-partner- violence-and-rape-police-and-justice-sectors
EIGE. (2018b). Study and work in the EU: set apart by gender - Review of the implementation of the Beijing Platform for Action in the EU Member States. ISBN 9789294938947. Retrieved from https://eige.europa.eu/rdc/eige-publications/study-and-work-eu-set-apart-gender-report
EIGE. (2018c). Towards a Uniform Approach to Data Collection: EIGE’s Femicide Definition and
Indicator. In ACUNS (Ed.), Femicide Volume IX: Femicide, State Accountability and Punishment (pp. 7882). Vienna: ACUNS.
EIGE. (2018d). Women and men in ICT: a chance for better work-life balance. Research note. Retrieved from https://eige.europa.eu/publications/women- and-men-ict-chance-better-work-life-balance- research-note
EIGE. (2019a). Gender equality and youth: oppor-tunities and risks of digitalisation. Beijing Platform for Action. Retrieved from https://eige.europa.eu/publications/gender-equality-and-youth- opportunities-and-risks-digitalisation
EIGE. (2019b). Gender Equality Index 2019. Work-life balance. Retrieved from https://eige.europa.eu/publications/genderequalityindex 2019worklifebalance
EIGE. (2019c). Tackling the gender pay gap: not without a better work-life balance. Retrieved from https://eige.europa.eu/publications/tackling-gender-pay-gap-not-without-better-work-life-balance
EIGE. (2020a). Beijing + 25: the fifth review of the implementation of the Beijing Platform for Action in the EU Member States. Retrieved from https://eige.europa.eu/publications/beijing-25-fifth- review-implementation-bei j ing-platform- action-eu-member-states
EIGE. (2020b). Covid19 and gender equality. Retrieved from https://eige.europa.eu/topics/health/covid19andgenderequality
EIGE. (2020c). Eligibility for parental leave in EU Member States. Retrieved from https://eige. europa.eu/publications/eligibility-parental- leave-eu-member-states
EIGE. (2020d). Gender-based violence. Covid-19 and gender equality. Retrieved from https://eige.europa.eu/covid19andgenderequality/gender-based-violence
EIGE. (2020e). Gender Equality and Lon-Term Care at home: Research note to the Croatian Presidency. Retrieved from https://eige.europa.
https://eige.europa.eu/publications/gender-equality-and-youth-opportunities-and-risks-digitalisation
https://eige.europa.eu/publications/gender-equality-and-youth-opportunities-and-risks-digitalisation

Gender Equality Index 2020 — Digi talisation and the future of work
References
131
eu/publications/gender-equality-and-long- term-care-home
Elvira, M., and Town, R. (2001). The effects of race and worker productivity on performance evalu-ations. Industrial Relations: A Journal of Economy and Society, 40(4), 571590.
Eurofound. (2016). What do Europeans do at work? A task-based analysis: European Jobs Moni-tor 2016. Retrieved from https://www.eurofound.europa.eu/sites/default/files/ef_publication/field_ef_document/ef1617en.pdf
Eurofound. (2017a). Occupational change and wage inequality: European Jobs Monitor 2017. Retrieved from https://www.eurofound.europa.eu/sites/default/files/ef_publication/field_ef_ document/ef1710en.pdf
Eurofound. (2017b). Work-life balance and flexi-ble working arrangements in the European Union. Retrieved from https://www.eurofound.europa.eu/publications/customised-report/2017/work-lifebalanceandflexibleworkingarrangementsin-the-european-union
Eurofound. (2018a). Automation, digitisation and platforms: Implications for work and employment. Retrieved from https://www.eurofound.europa.eu/sites/default/files/ef_publication/field_ef_doc ument/ef18002en.pdf
Eurofound. (2018b). Employment and working conditions of selected types of platform work. Retrieved from https://www.eurofound.europa.eu/publications/report/2018/employment-and-working-conditions-of-selected-types-of-plat-form-work
Eurofound. (2018c). New tasks in old jobs: Driv-ers of change and implications for job quality. Retrieved from https://www.eurofound.europa.eu/sites/default/files/ef_publication/field_ef_ document/fomeef18004en.pdf
Eurofound. (2018d). Platform work: Types and implications for work and employment - Literature Review. Retrieved from https://www.eurofound. europa.eu/data/platform-economy/records/ platform-work-types-and-implications-for- work-and-employment-literature-review
Eurofound. (2018e). Striking a balance: Recon-ciling work and life in the EU. Retrieved from https://www.eurofound.europa.eu/publications/report/2018/striking-a-balance-reconciling-work-and-life-in-the-eu
Eurofound. (2019). Platform work: Maximising the potential while safeguarding standards?. Retrieved from https://www.eurofound.europa.eu/sites/default/files/ef_publication/field_ef_document/ef19045en.pdf
Eurofound. (2020a). Game-changing technolo-gies: Transforming production and employment in Europe. Retrieved from https://www.eurofound.europa.eu/sites/default/files/ef_publication/field_ef_document/ef19047en.pdf
Eurofound. (2020b). Living, working and COVID19 dataset Retrieved from https://www.eurofound.europa.eu/data/covid19
Eurofound. (2020c). Telework and ICT-based mobile work: Flexible working in the digital age. Retrieved from https://www.eurofound.europa.eu/publications/report/2020/telework-and-ict-basedmobileworkflexibleworkinginthedigi tal-age
Eurofound, and ILO. (2017). Working anytime, any-where: The effects on the world of work. Retrieved from https://www.eurofound.europa.eu/publica tions/report/2017/working-anytime-anywhere-theeffectsontheworldofwork
Euronews. (2020). Domestic violence cases jump 30% during lockdown in France. Retrieved from https://www.euronews.com/2020/03/28/domestic-violence-cases-jump-30-during-lock downinfrance?fbclid=IwAR0zKgyaALr9vN UoNghbVTkV08xvhEWwoLPgJzrYM13ICW2Dx NGZ1hhmC78
European Commission. (2009). Opinion on the effectiveness of the current legal frame-work on Equal pay for equal work or work of equal value in tackling the gender pay gap. Retrieved from https://ec.europa.eu/social/Blob Servlet?docId=3176
European Commission. (2013). Gendered Inno-vations: How Gender Analysis Contributes to
References
European Institute for Gender Equality 132
Research. Report of the Expert Group “Innovation through Gender” Retrieved from http://ec.europa.eu/research/science-society/document_library/pdf_06/gendered_innovations.pdf.
European Commission. (2014a). Mapping and analysing bottleneck vacancies in EU labour mar-kets. Retrieved from https://ec.europa.eu/eures/downloadSectionFile.do?fileId=8010
European Commission. (2014b). The Third Health Programme 2014-2020 Funding Health Initia-tives. Regulation (EU) 282/2014. . Retrieved from https://ec.europa.eu/health/sites/health/files/ p ro g ra m m e / d o c s / f a c t s h e e t _ h e a l t h p ro gramme2014_2020_en.pdf
European Commission. (2015). Non-standard employment and access to social security bene-fits. Research note 8/2015. Retrieved from https://ec.europa.eu/social/BlobServlet?docId=15687& langId=en
European Commission. (2016a). The Digital Skills and Jobs Coalition. Members Charter. Retrieved from https://ec.europa.eu/digital-single-market/sites/digitalagenda/files/digital_skills_and_jobs_coalition_members_charter_0.pdf
European Commission. (2016b). ICT for work: Digital skills in the workplace. Retrieved from https://ec.europa.eu/newsroom/dae/document.cfm?doc_id=44434
European Commission. (2016c). Resolutions, rec-ommendations and opinions. Official Journal of the European Unione, 59(C 484), 1. Retrieved from https://eurlex.europa.eu/legalcontent/EN/TXT/ PDF/?uri=OJ:C:2016:484:FULL&from=LT
European Commission. (2017). Special Euro-barometer 460: Attitudes towards the impact of digitisation and automation on daily life. Retrieved from https://data.europa.eu/euodp/en/data/dataset/S2160_87_1_460_ENG
European Commission. (2018a). 2018 Report on Equality between Women and Men in the EU. Retrieved from https://op.europa.eu/en/publica tiondetail//publication/950dce57622211e8ab9c01aa75ed71a1
European Commission. (2018b). Artificial Intelli-gence for Europe. Brussels Retrieved from https://ec.europa.eu/digital-single-market/en/news/communicationartificialintelligenceeurope
European Commission. (2018c). Employment and social developments in Europe: annual review 2018. Retrieved from https://ec.europa.eu/social/main.jsp?langId=en&catId=89&newsId=9150
European Commission. (2018d). EUStartup Monitor. Retrieved from http://startupmonitor.eu/EUStartupMonitor2018ReportWEB.pdf
European Commission. (2018e). The European Pil-lar of Social Rights in 20 principles. Retrieved from https://ec.europa.eu/commission/priorities/ deeper -and- fa i rer -economic -and-mone tary-union/european-pi l lar-social-r ights/european-pillar-social-rights-20-principles_en
European Commission. (2018f). Gender equality and the collaborative economy. Retrieved from https://www.equalitylaw.eu/downloads/4573- gender-equality-and-the-collaborative-econo-my-pdf-721-kb
European Commission. (2018g). Gender pay gap in EU countries based on SES (2014). Retrieved from https://ec.europa.eu/info/sites/info/files/aid_development_cooperation_fundamental_rights/report-gender-pay-gap-eu-countries_october2018_en_0.pdf
European Commission. (2018h). Pilot project monitors online vacancies for ICT specialists in real-time. Retrieved from https://ec.europa.eu/digital-single-market/en/news/pilot-project- monitors-online-vacancies-ict-specialists- real-time
European Commission. (2018i). Women in the Digital Age. Retrieved from https://op.europa.eu/en/publication-detail/-/publication/84bd6dea-2351-11e8-ac73-01aa75ed71a1
European Commission. (2019a). Access to social protection for workers and self-employed. Retrieved from https://ec.europa.eu/social/Blob Servlet?docId=20982&langId=en
Gender Equality Index 2020 — Digi talisation and the future of work
References
133
European Commission. (2019b). Assessing the size and presence of the collaborative economy in Europe. Retrieved from https://op.europa.eu/en/publicationdetail//publication/2acb7619b54411e7-837e-01aa75ed71a1
European Commission. (2019c). Digital Skills & Jobs. Shaping Europe’s digital future. Retrieved from https://ec.europa.eu/digital-single-market/en/policies/digital-skills
European Commission. (2019d). #DigitalRespect 4Her. Retrieved from https://ec.europa.eu/digital- single-market/en/digitalrespect4her
European Commission. (2019e). Final report of the HighLevel Expert Group on the Impact of the Digital Transformation on EU Labour Markets. Retrieved from https://ec.europa.eu/digital-single-market/en/news/final-report- highlevelexpertgroupimpactdigitaltransfor mation-eu-labour-markets
European Commission. (2019f). Labour market and wage developments in Europe: annual review 2019. Retrieved from https://ec.europa.eu/social/ BlobServlet?docId=21904&langId=en
European Commission. (2019g). PISA 2018 and the EU. Striving for social fairness through edu-cation. Retrieved from https://ec.europa.eu/ education/resources-and-tools/document- library/pisa-2018-and-the-eu-striving-for-social-fairness-through-education_en
European Commission. (2019h). She Figures 2018. Gender in Research and Innovation. Retrieved from https://ec.europa.eu/info/publica tions/she-figures-2018_en
European Commission. (2019i). Women in Digi-tal. Shaping Europe’s digital future. Retrieved from https://ec.europa.eu/digital-single-market/en/women-ict
European Commission. (2019j). Women in Dig-ital Scoreboard 2019 Country Reports. Shap-ing Europe’s digital future. Retrieved from https://ec.europa.eu/digital-single-market/en/news/womendigitalscoreboard2019countryreports
European Commission. (2020a). Shaping Europe’s Digital Future. Retrieved from https://ec.europa.eu/info/sites/info/files/communication-shap ing-europes-digital-future-feb2020_en_4.pdf
European Commission. (2020b). Special Euro-barometer 503: Attitudes towards the impact of digitalisation on daily lives. Retrieved from https://data.europa.eu/euodp/en/data/dataset/S2228_92_4_503_ENG
European Commission. (2020c). A Union of Equal-ity: Gender Equality Strategy 2020-2025. (COM/ 2020/152 final). Retrieved from https://eurlex. europa.eu/legalcontent/EN/TXT/?uri=COM% 3A2020%3A152%3AFIN
European Commission. (2020d). White Paper on Artificial Intelligence - A European approach to excellence and trust. Brussels Retrieved from https://ec.europa.eu/info/sites/info/fi les/ commission-white-paper-art i f ic ia l - intel l i gence-feb2020_en.pdf
European Parliament. (2016). Differences in men’s and women’s work, care and leisure time. Retrieved from https://op.europa.eu/en/publication-detail/- /publication/97c41fae944011e7b92d01aa75ed71a1
European Parliament. (2017). Report on working conditions and precarious employment Retrieved from https://www.europarl.europa.eu/doceo/document/A-8-2017-0224_EN.html
European Parliament. (2018a). Bullying and sexual harassment at the workplace, in pub-lic spaces, and in political life in the EU. A study requested by the FEMM committee. Retrieved from http://www.europarl.europa.eu/RegData/ e t u d e s / S T U D / 2 0 1 8 / 6 0 4 9 4 9 / I P O L _ S T U (2018)604949_EN.pdf
European Parliament. (2018b). Cyber violence and hate speech online against women. Women’s Rights & Gender Equality. A study for the FEMM commit-tee. Retrieved from http://www.europarl.europa.eu/RegData/etudes/STUD/2018/604979/IPOL_STU(2018)604979_EN.pdf
References
European Institute for Gender Equality 134
European Parliament. (2019a). Directive (EU) 2019/1152 of the European Parliament and of the Council of 20 June 2019 on transparent and predictable working conditions in the European Union. Retrieved from https://eurlex.europa.eu/legalcontent/EN/TXT/?uri=CELEX:32019L1152
European Parliament. (2019b). European Par-liament resolution of 14 February 2019 on the rights of intersex people (2018/2878(RSP)). Retrieved from http://www.europarl.europa.eu/ s i d e s / g e t D o c . d o ? p u b R e f = / / E P / / T E X T+TA+P8TA20190128+0+DOC+XML+V0//EN
European Parliament, and Council of the Euro-pean Union. (2019). Directive (EU) 2019/1158 Work-life balance for parents and carers and repealing Council Directive 2010/18/EU. Retrieved from https://eurlex.europa.eu/legalcontent/EN/ T X T / ? q i d = 1 5 6 6 2 0 6 9 8 7 7 1 6 & u r i = C E L E X : 32019L1158
Europol. (2020). Catching the virus: cybercrime, disinformation and the COVID-19 pandemic. Retrieved from https://www.europol.europa.eu/publications-documents/catching-virus-cyber crimedisinformationandcovid19pandemic
Eurostat. (2018). A decomposition of the unad-justed gender pay gap using Structure of Earn-ings Survey data. 2018 edition. Retrieved from https://ec.europa.eu/eurostat/documents/ 3888793/8979317/KSTC18003ENN.pdf/ 3a6c92955e664b79b009ea1604770676
Eurostat. (2019a). ICT education a statisti-cal overview. Retrieved from https://ec.europa.eu/eurostat/statisticsexplained/index.php?ti tle=ICT_education__a_statistical_overview&ol did=454538
Eurostat. (2019b). ICT specialists in employ-ment. Retrieved from https://ec.europa.eu/eurostat/stat ist icsexplained/index.php/ICT_specialists_in_employment
Eurostat. (2020). Gender pay gap statistics. . Retrieved from https://ec.europa.eu/eurostat/ statisticsexplained/index.php?title=Gender_ pay_gap_statistics
EWL. (2020). Women must not pay the price for COVID-19! Retrieved from https://www.women lobby.org/ IMG/pdf/ewl_pol icy_br ief_on_ covid19_impact_on_women_and_girls2.pdf
Ferrari, E. (2020). Polizia, con l’app YouPol è pos-sibile segnalare da casa reati di violenza domes-tica. Retrieved from https://www.lastampa.it/imperia-sanremo/2020/03/31/news/polizia-con-l-app-youpol-e-possibile-segnalare-da-casa-reatidiviolenzadomestica1.38661932
Ferrier, M., and Garud-Patkar, N. (2018). Troll-Busters: Fighting online harassment of women journalists. In Mediating Misogyny (pp. 311-332): Springer.
Fodor, E., Gregor, A., Koltai, J., and Kováts, E. (2020). Revolution unstalled? The impact of the Covid19 crisis on the domestic division of labour in Hungary. Gender & Society blog. Retrieved from https://gendersociety.word-press.com/2020/05/28/revolution-unstalled-the- impactofthecovid19crisisonthedomestic divisionoflaborinhungary/?fbclid=IwAR 3QzwuritRdHP3ta3KZ2olLp9H7CqUuDMVmu InBYUxBLWP273bIIRDw
Foong, E., Vincent, N., Hecht, B., and Gerber, E. M. (2018). Women (still) ask for less: Gender differ-ences in hourly rate in an online labor market-place. Proceedings of the ACM on Human-Computer Interaction, 2(CSCW), 121.
Forster, T., Kentikelenis, A., and Bambra, C. (2018). Health inequalities in Europe: setting the stage for progressive policy action. Retrieved from https://www.feps-europe.eu/attachments/pub-lications/1845-6%20health%20inequalities%20inner-hr.pdf
FRA. (2014a). EU LGBT survey: European Union lesbian, gay, bisexual and transgender survey. Retrieved from https://fra.europa.eu/sites/default/files/fra-eu-lgbt-survey-main-results_tk3113640enc_1.pdf
FRA. (2014b). Violence against women: An EU-wide survey. Retrieved from https://fra.
http://www.europarl.europa.eu/sides/getDoc.do?pubRef=-//EP//TEXT+TA+P8-TA-2019-0128+0+DOC+XML+V0//EN
http://www.europarl.europa.eu/sides/getDoc.do?pubRef=-//EP//TEXT+TA+P8-TA-2019-0128+0+DOC+XML+V0//EN

Gender Equality Index 2020 — Digi talisation and the future of work
References
135
europa.eu/sites/default/fi les/fra_uploads/fra-2014-vaw-survey-main-results-apr14_en.pdf
FRA. (2016a). Second European Union Minorities and Discrimination Survey. Roma women in nine EU Member States. Retrieved from https://fra.europa.eu/sites/default/files/fra_uploads/fra-2019euminoritiessurveyromawomen_en.pdf
FRA. (2016b). Second European Union Minorities and Discrimination Survey: Roma — Selected find-ings. Retrieved from https://fra.europa.eu/sites/default/files/fra_uploads/fra-2016-eu-minori-tiessurveyromaselectedfindings_en.pdf
FRA. (2016c). Violence, threats and pressures against journalists and other media actors in the EU. Contribution to the second Annual Collo-quium on Fundamental Rights - November 2016. Retrieved from https://fra.europa.eu/sites/default/files/fra_uploads/fra2016threatsandpressures-journalists_en.pdf
FRA. (2017). Challenges to women’s human rights in the EU. Gender discrimination, sexist hate speech and gender-based violence against women and girls. Retrieved from https://fra.europa.eu/sites/default/files/fra_uploads/fra2017challengestowomen-human-rights_en.pdf
FRA. (2018). Out of sight: migrant women exploited in domestic work. Retrieved from https://fra.europa.eu/sites/default/fi les/fra_uploads/fra2018migrantwomenlabourexploita tion-domestic-work_en.pdf
FRA. (2019). Data quality and artificial intelligence – mitigating bias and error to protect fundamental rights. Retrieved from https://fra.europa.eu/en/publication/2019/dataqualityandartificialintel ligence-mitigating-bias-and-error-protect
FRA. (2020). EU-LGBTI II. A long way to go for LGBTI equality. Retrieved from https://fra.europa. eu/sites/default/files/fra_uploads/fra-2020- lgbti-equality_en.pdf
Francavilla, Giannelli, Mancgiavacchi, and Pic-coli. (2012). Unpaid work in Europe: gender and country differences. In F. Bettio, Plantenga, J. and
Smith, M. (Ed.), Gender and the European labour market (pp. 6988): Routledge.
Freeman, C. (2010). Respectability and flexibility in the neoliberal service economy. In Work and Life in the Global Economy (pp. 3351): Springer.
Frey, C. B., and Osborne, M. A. (2017). The future of employment: How susceptible are jobs to computerisation? Technological forecasting and social change, 114, 254-280.
Galasso, V., Pons, V., Profeta, P., Becher, M., Brouard, S., and Foucault, M. (2020). Gender Differences in COVID-19 Related Attitudes and Behavior: Evidence from a Panel Survey in Eight OECD Countries (08982937). Retrieved from
Galperin, H. (2019). “This Gig Is Not for Women”: Gender Stereotyping in Online Hiring. Social Sci-ence Computer Review.
Gamberini, L., Raya, M. A., Barresi, G., Fabregat, M., Ibanez, F., and Prontu, L. (2006). Cognition, technology and games for the elderly: An intro-duction to ELDERGAMES Project. PsychNology Journal, 4(3), 285-308.
Gebhard, C., RegitzZagrosek, V., Neuhauser, H. K., Morgan, R., and Klein, S. L. (2020). Impact of sex and gender on COVID19 outcomes in Europe. Biology of Sex Differences, 11(1), 1-13.
Glavin, P., and Schieman, S. (2012). Work– family role blurring and work–family conflict: The moderating influence of job resources and job demands. Work and Occupations, 39(1), 7198.
Goldin, C. (2014). A grand gender convergence: Its last chapter. American economic review, 104(4), 10911119.
Goldin, C. (2015). Hours flexibility and the gen-der gap in pay. Retrieved from https://scholar.harvard.edu/files/goldin/files/goldin_equalpay cap.pdf
Goodman, B., and Flaxman, S. (2017). European Union regulations on algorithmic decision-
References
European Institute for Gender Equality 136
making and a “right to explanation”. AI magazine, 38(3), 50-57.
Goos, M., Manning, A., and Salomons, A. (2014). Explaining job polarization: Routinebiased tech-nological change and offshoring. American eco-nomic review, 104(8), 25092526.
Goswami, A., and Dutta, S. (2015). Gender differ-ences in technology usage — A literature review. Open Journal of Business and Management, 4(1), 5159.
Grabowski, D. C. (2006). The costeffectiveness of noninstitutional long-term care services: Review and synthesis of the most recent evidence. Medi-cal care research and review, 63(1), 3-28.
Hannák, A., Wagner, C., Garcia, D., Mislove, A., Strohmaier, M., and Wilson, C. (2017). Bias in online freelance marketplaces: Evidence from taskrabbit and fiverr. Paper presented at the Proceedings of the 2017 ACM Conference on Computer Sup-ported Cooperative Work and Social Computing.
Hara, K., Adams, A., Milland, K., Savage, S., Cal-lison-Burch, C., and Bigham, J. P. (2018). A data-driven analysis of workers’ earnings on Amazon Mechanical Turk. Paper presented at the Pro-ceedings of the 2018 CHI Conference on Human Factors in Computing Systems.
Haraway, D. (1984). A cyborg manifesto: Sci-ence, technology, and socialist-feminism in the late 20th century. In The international handbook of virtual learning environments (pp. 117-158): Springer.
Haraway, D. (1991). Simians, Cyborgs, and Women: the reinvention of nature. New York: Routledge.
Harding, S. (1986). The science question in femi-nism: Cornell University Press.
Harding, S. (1991). Whose science? Whose knowl-edge? Thinking from women’s lives. Ithaca, NY: Cornell University Press.
Harris. (2009). Theorizing class, gender, and the law: Three approaches. Law and Contemporary Problems, 72, 37.
Harris. (2014). The impact of smartphones on work-life balance. Middle Tennessee State University, Retrieved from http://citeseerx. ist.psu.edu/viewdoc/download?doi=10.1.1. 880.4222&rep=rep1&type=pdf
Haworth, J., and Lewis, S. (2005). Work, leisure and well-being. British Journal of Guidance & Counselling, 33(1), 6779.
Henrichsen, J. R., Betz, M., and Lisosky, J. M. (2015). Building digital safety for journalism: A survey of selected issues. Retrieved from https://unesdoc.unesco.org/ark:/48223/pf0000232358
Hicks, M. (2017). Programmed inequality: How Britain discarded women technologists and lost its edge in competition. London: The MIT Press.
Hilbrecht, M., Lero, D. S., Schryer, E., Mock, S. E., and Smale, B. (2017). Understanding the associ-ation between time spent caregiving and well- being among employed adults: testing a model of work–life fit and sense of community. Commu-nity, Work & Family, 20(2), 162-180.
Hofäcker, D., and König, S. (2013). Flexibility and worklife conflict in times of crisis: a gender per-spective. International Journal of Sociology and Social Policy, 33(9/10), 613635.
HoltLunstad, J., Smith, T. B., and Layton, J. B. (2010). Social relationships and mortality risk: a meta-analytic review. PLOS Medicine, 7(7).
Howcroft, D., and Richardson, H. (2009). Work and life in the global economy: A gendered analysis of service work: Palgrave Macmillan UK.
Howcroft, D., and Rubery, J. (2018). Gender equal-ity prospects and the fourth industrial revolution. In M. Neufeind, O’Reilly, J., Ranft, F (Ed.), Work in the Digital Age. Challenges of the fourth industrial revolution (pp. 63): Rowman & Littlefield.

Gender Equality Index 2020 — Digi talisation and the future of work
References
137
Huffman, A. H., Whetten, J., and Huffman, W. H. (2013). Using technology in higher education: The influence of gender roles on technology selfefficacy. Computers in Human Behavior, 29(4), 17791786.
Huws, U. (1982). New Technology and Women’s Employment. Case Studies from West Yorkshire: ERIC.
Huws, U., Podro, S., Gunnarsson, E., Weijers, T., Arvanitaki, K., and Trova, V. (1996). Teleworking and Gender. Retrieved from https://www.employ-ment-studies.co.uk/system/files/resources/files/317.pdf
Huws, U., Spencer, N., Coates, M., Sverre Syrdal, D., and Holts, K. (2019). The Platformisation Of Work In Europe: Results from research in 13 Euro-pean countries. Retrieved from https://www.feps-europe.eu/attachments/publications/plat formisation%20of%20work%20report%20-%20highlights.pdf
Hyperwallet. (2017). The Future of Gig Work is Female: A study on the behaviors and career aspi-rations of women in the gig economy. Retrieved from https://www.hyperwallet.com/app/uploads/HW_The_Future_of_Gig_Work_ is_Female.pdf?mkt_tok=eyJpIjoiTVRjMU9UQmlOakk1 TW1WaSIsInQiOiJYaVQrNEtTTzUzNWliUzZOS TQ3R2wxTnlwY00xZG9MZmErTnVXUkJVdGhM Rm9EUW9GWTFcL1huaXZPbnBmdGN1RnBa WjAwa2tjTW5PXC82NnR5Z0o1VFcrOFhWbEZM bVd3UGcramZvdTg0Y1Y0Q3orMjlcL1wvVUpJaF BROVhMeXRyU1QifQ%3D%3D
Iancu, I., and Iancu, B. (2017). Elderly in the digi-tal era. theoretical perspectives on assistive tech-nologies. Technologies, 5(3), 60.
ILGAEUROPE. (2015). Glossary. Retrieved from https://www.ilgaeurope.org/sites/default/files/glossary_october_2015_edition.pdf
ILO. (2017). Ending Violence and Harassment Against Women and Men in the World of Work.
Paper presented at the Report V (1), Interna-tional Labour Conference, 107th Session, 2018.
ILO. (2018a). The architecture of digital labour platforms: Policy recommendations on platform design for worker well-being. Retrieved from https://www.ilo.org/wcmsp5/groups/public/---dgreports/---cabinet/documents/publication/wcms_630603.pdf
ILO. (2018b). Care work and care jobs for the future of decent work. Retrieved from https://www.ilo.org/global/publications/books/WCMS_633135/langen/index.htm
ILO. (2018c). Digital labour platforms and the future of work. Towards decent work in the online world. Retrieved from http://wtf.tw/text/digital_labour_platforms_and_the_future_of_work.pdf
ILO. (2020a). The COVID-19 response: Getting gen-der equality right for a better future for women at work. Retrieved from https://www.ilo.org/wcmsp5/groups/public/---dgreports/---gender/documents/publication/wcms_744685.pdf
ILO. (2020b). ILO Monitor: COVID-19 and the world of work. Third edition. Retrieved from https://www.ilo.org/wcmsp5/groups/public/---dgre ports/dcomm/documents/briefingnote/wcms_ 743146.pdf
Inter-Parliamentary Union. (2018). Sexism, harass-ment and violence Against Women in Parliaments in Europe. Retrieved from https://www.ipu.org/resources/publications/issue-briefs/2018-10/sexismharassmentandviolenceagainst women-in-parliaments-in-europe
International Monetary Fund. (2018). Gender, technology, and the future of work. Retrieved from https://www.imf.org/en/Publications/StaffDis cussionNotes/Issues/2018/10/09/GenderTech nology-and-the-Future-of-Work-46236
IPPR. (2019). The future is ours. Women, automa-tion and equality in the digital age. Retrieved from

References
European Institute for Gender Equality 138
https://www.ippr.org/files/201907/thefuture isourswomenautomationequalityjuly19.pdf
IPSE. (2019). Women in self-employment: Under-standing the female self-employed community. Retrieved from https://www.ipse.co.uk/resource/women-in-self-employment.html
Jiang, F., Jiang, Y., Zhi, H., Dong, Y., Li, H., Ma, S., . . . Wang, Y. (2017). Artificial intelligence in health-care: past, present and future. Stroke and vascu-lar neurology, 2(4), 230-243.
Jin, J.-M., Bai, P., He, W., Wu, F., Liu, X.-F., Han, D.M., . . . Yang, J.K. (2020). Gender differences in patients with COVID19: Focus on severity and mortality. Frontiers in Public Health, 8, 152.
Johnston, H., and Land-Kazlauskas, C. (2018). Organizing ondemand: Representation, voice, and collective bargaining in the gig economy. Conditions of work and employment series, 94.
Jones, M. (2017). Intersex genital mutilation – A Western version of FGM. The International Jour-nal of Children’s Rights, 25(2), 396411.
JRC. (2018). Platform Workers in Europe. Evi-dence from the COLLEEM Survey. Retrieved from https://ec.europa.eu/jrc/en/publication/eur- scientific-and-technical-research-reports/plat form-workers-europe-evidence-colleem-survey
JRC. (2019a). How computerisation is transform-ing jobs. Retrieved from https://ec.europa.eu/jrc/sites/jrcsh/files/jrc117167.pdf
JRC. (2019b). Is There a Gender Wage Gap in Online Labor Markets? Evidence from Over 250,000 Projects and 2.5 Million Wage Bill Proposals. Retrieved from https://ec.europa.eu/jrc/sites/jrcsh/files/jrc11 5771.pdf
JRC. (2020a). New evidence on platform work-ers in Europe. Results from the second COLLEEM survey. Retrieved from https://publications.jrc.ec.europa.eu/repository/bitstream/JRC118570/jrc118570_jrc118570_final.pdf
JRC. (2020b). A Taxonomy of Tasks for Assessing the Impact of New Technologies on Work. Retrieved from https://www.eurofound.europa.eu/sites/default/files/wpef20007.pdf
JRC, and OECD. (2019). World Corporate Top R&D investors: Shaping the Future of Technologies and of AI. Retrieved from https://ec.europa.eu/jrc/en/publication/world-corporate-top-rd-inves tors-shaping-future-technologies-and-ai
Kaarakainen, M.-T., Kivinen, A., and Kaarakainen, S.S. (2017). Differences between the genders in ICT skills for Finnish upper comprehensive school students: Does gender matter? Paper presented at the Seminar.net.
Kavanagh, E., and Brown, L. (2019). Towards a research agenda for examining online gen-der-based violence against women academics. Journal of Further and Higher Education, 19.
Keller, E. F., and Longino, H. E. (1996). Feminism and science. Oxford: Oxford University Press.
Kim, L. (2018). Gender Bias in Online Market-ing: Data Shows Women Are Undervalued by 21%. WordStream. Retrieved from https://www. w o rd s t re a m . c o m / b l o g / w s / 2 0 1 4 / 0 5 / 1 3 /gender-bias
Koop, C. E., Mosher, R., Kun, L., Geiling, J., Grigg, E., Long, S., . . . Rosen, J. M. (2008). Future deliv-ery of health care: Cybercare. IEEE Engineering in Medicine and Biology Magazine, 27(6), 2938.
Lahelma, E., Arber, S., Martikainen, P., Rahkonen, O., and Silventoinen, K. (2001). The myth of gen-der differences in health: social structural deter-minants across adult ages in Britain and Finland. Current Sociology, 49(3), 31-54.
Laundon, M., and Williams, P. (2018). Flexible work: barrier to benefits? Financial Planning Research Journal, 4(2), 51-68.
Lee, J. (2020). Mental health effects of school clo-sures during COVID19. The Lancet. Child & Ado-lescent Health, 4(6), 421.
Gender Equality Index 2020 — Digi talisation and the future of work
References
139
Lehr, A., and Bechrakis, M. (2018). Against The Odds: Overcoming Online Harassment of Women in Politics. Center for Strategic & Inter-national Studies. Retrieved from https://www.csis.org/analysis/against-odds-overcoming-on-line-harassment-women-politics
Lewis, R., Rowe, M., and Wiper, C. (2017). Online abuse of feminists as an emerging form of vio-lence against women and girls. British journal of criminology, 57(6), 1462-1481.
Liang, C., Hong, Y., Gu, B., and Peng, J. (2018). Gender wage gap in online gig economy and gender differences in job preferences. Retrieved from http://www.netinst.org/Chen_18-03.pdf
LIBE Committee. (2018). Opinion of the Commit-tee on Civil Liberties, Justice and Home Affairs for the Committee on Industry, Research and Energy on a comprehensive European industrial policy on artificial intelligence and robotics. Retrieved from https://www.europarl.europa.eu/doceo/docu ment/A820190019_EN.html
Lopez-Hartmann, M., Wens, J., Verhoeven, V., and Remmen, R. (2012). The effect of caregiver support interventions for informal caregivers of community-dwelling frail elderly: a systematic review. International journal of integrated care, 12, e133.
Lordan, G. (2019). What work disappears? Automa-tion and the changing nature of work. Retrieved from https://op.europa.eu/en/publication-detail/- /publication/1246be88329a11eaba6e01a a75ed71a1/
Lott, Y. (2018). Does flexibility help employees switch off from work? Flexible workingtime arrangements and cognitive work-to-home spill-over for women and men in Germany. Social Indi-cators Research, 1-24.
Lu, K., Mardziel, P., Wu, F., Amancharla, P., and Datta, A. (2018). Gender bias in neural natural language processing. Retrieved from https://arxiv.org/abs/1807.11714
Mackenbach, J. P., Meerding, W. J., and Kunst, A. E. (2011). Economic costs of health inequalities in the European Union. Journal of Epidemiology & Community Health, 65(5), 412419.
Madara Marasinghe, K. (2016). Assistive tech-nologies in reducing caregiver burden among informal caregivers of older adults: a systematic review. Disability and Rehabilitation: Assistive Tech-nology, 11(5), 353-360.
Madureira-Lima, J., Reeves, A., Clair, A., and Stuckler, D. (2018). The Great Recession and inequalities in access to health care: a study of unemployment and unmet medical need in Europe in the economic crisis. International jour-nal of epidemiology, 47(1), 58-68.
Mahr, F., and Nadeem, T. (2019). Muslim women and Islamophobia. In H. S. Moffic, J. R. Peteet, A. Hankir, and R. Awaad (Eds.), Islamophobia and Psychiatry (pp. 295305): Springer.
Marion, T. J. (2016). 4 Factors That Predict Startup Success, and One That Doesn’t. Harvard Business Review, May, 3.
Markson, E. W., and HollisSawyer, L. A. (2000). Intersections of aging: readings in social gerontol-ogy: Roxbury Publishing Company.
Martínez-Alcalá, C. I., Pliego-Pastrana, P., Rosales- Lagarde, A., Lopez-Noguerola, J., and Moli-na-Trinidad, E. M. (2016). Information and com-munication technologies in the care of the elderly: systematic review of applications aimed at patients with dementia and caregivers. JMIR rehabilitation and assistive technologies, 3(1), e6.
McCloskey, D. W. (2016). Finding work-life balance in a digital age: An exploratory study of boundary flexibility and permeability. Information Resources Management Journal 29(3), 53-70.
McGlynn, C., and Rackley, E. (2017). Why ‘upskirt-ing’needs to be made a sex crime. The conver-sation. Retrieved from https://theconversation.com/whyupskirtingneedstobemadeasexcrime-82357
References
European Institute for Gender Equality 140
McGlynn, C., Rackley, E., and Houghton, R. (2017). Beyond ‘revenge porn’: The continuum of image-based sexual abuse. Feminist Legal Studies, 25(1), 25-46.
McIntyre, C. A., and Rhodes, R. E. (2009). Cor-relates of leisure-time physical activity during transitions to motherhood. Women & health, 49(1), 66-83.
MedranoGil, A. M., de los Ríos Pérez, S., Fico, G., Montalvá Colomer, J. B., Cea Sáncez, G., Cabrera-Umpierrez, M. F., and Arredondo Wald-meyer, M. T. (2018). Definition of technological solutions based on the internet of things and smart cities paradigms for active and healthy ageing through Cocreation. Wireless Commu-nications and Mobile Computing. Retrieved from https://www.hindawi.com/journals/wcmc/ 2018/1949835/
Mellner, C. (2016). Afterhours availability expec-tations, work-related smartphone use during leisure, and psychological detachment. Interna-tional Journal of Workplace Health Management, 9(2), 146-164.
Metz, R. (2020, 15 January, 2020). There’s a new obstacle to landing a job after college: Get-ting approved by AI. CNN Business. Retrieved from https://edition.cnn.com/2020/01/15/tech/aijobinterview/index.html
Micera, S., Bonato, P., and Tamura, T. (2008). Gerontechnology. IEEE Engineering in Medicine and Biology Magazine, 27(4), 10-14.
Miller, G. (2020). Social distancing prevents infec-tions, but it can have unintended consequences. Science. Retrieved from https://www.sciencemag.org/news/2020/03/we-are-social-species-how-willsocialdistancingaffectus#
Milner, R. J., and Donald, E. (2019). Technology Facilitated Sexual Violence: Cyberflashing on the Digital Playground. Retrieved from https://dc.etsu.edu/etsuworks/2976/
Mirchandani, K. (2010). Gendered hierarchies in transnational call centres in India. In Work and Life in the Global Economy (pp. 7898): Springer.
Mitchell, K. M., and Martin, J. (2018). Gender bias in student evaluations. PS: Political Science & Poli-tics, 51(3), 648-652.
Mouterde, P. (2020). Des plates-formes assurent le suivi des malades infectés par le coronavirus à domicile. Le Monde. Retrieved from https://www.lemonde.fr/planete/article/2020/04/01/des-plates-formes-assurent-le-suivi-des-malades-du-covid19adomicile_6035153_3244.html
Nakamura, L. (2013). Cybertypes: Race, ethnicity, and identity on the Internet: Routledge.
National Academies of Sciences Engineering and Medicine. (2018). Sexual harassment of women: climate, culture, and consequences in academic sciences, engineering, and medicine: National Academies Press.
Ninaus, K., Diehl, S., Terlutter, R., Chan, K., and Huang, A. (2015). Benefits and stressors – Per-ceived effects of ICT use on employee health and work stress: An exploratory study from Austria and Hong Kong. International journal of qualitative studies on health and well-being, 10(1), 28838.
Nissim, M., van Noord, R., and van der Goot, R. (2020). Fair is better than sensational: Man is to doctor as woman is to doctor. Computational Lin-guistics, 46(2), 487497.
Novel Coronavirus Pneumonia Emergency Response Epidemiology Team. (2020). The epide-miological characteristics of an outbreak of 2019 novel coronavirus diseases (COVID19)—China, 2020. China CDC Weekly, 2(8), 113-122.
Nugent, C. (2020). ‘It’s Like Being a War Medic.’ A Madrid Doctor Speaks Out About Grave Short-ages in Protective Gear. Time. Retrieved from https://time.com/5813848/spain-coronavirus- outbreak-doctor/
Gender Equality Index 2020 — Digi talisation and the future of work
References
141
Nurvala, J.-P. (2015). ‘Uberisation’ is the future of the digitalised labour market. European View, 14(2), 231239.
OECDEU. (2018). Health at a Glance: Europe 2018. Retrieved from https://www.oecd.org/health/health-at-a-glance-europe-23056088.htm
OECD. (2015). In It Together: Why less inequality benefits all. Retrieved from https://www.oecd.org/social/in-it-together-why-less-inequality-bene-fitsall9789264235120en.htm
OECD. (2016). The risk of automation for jobs in OECD countries: a comparative analysis. OECD Social, Employment and Migration Working Papers, No. 189. Retrieved from https://www.oecdilibrary.org/docserver/5jlz9h56dvq7en.pdf?expires=1590486914&id=id&accname=guest&checksum=588D590D27725ED07AF4F67F 1DE36AB5
OECD. (2017a). Going Digital: The Future of Work for Women Retrieved from https://www.oecd.org/employment/Going-Digital-the-Future-of-Work-for-Women.pdf
OECD. (2017b). How technology and globalisation are transforming the labour market. Retrieved from https://www.oecd-ilibrary.org/employment/oecd-employment-outlook-2017_empl_out-look-2017-en
OECD. (2018a). Bridging the digital gender divide: include, upskill, innovate. Retrieved from http://www.oecd.org/internet/bridging-the-digital- gender-divide.pdf
OECD. (2018b). Empowering women in the dig-ital age. Where do we stand? Retrieved from https://www.oecd.org/social/empowering- women-in-the-digital-age-brochure.pdf
OECD. (2019a). PISA 2018 Results (Volume II). Where All Students Can Succeed. Retrieved from http://www.oecd.org/publications/pisa-2018- results-volume-ii-b5fd1b8f-en.htm
OECD. (2019b). Under Pressure: The Squeezed Middle Class. Retrieved from https://www.oecd.
org/social/under-pressure-the-squeezed-mid dleclass689afed1en.htm
Oesch, D., and Piccitto, G. (2019). The Polariza-tion Myth: Occupational Upgrading in Germany, Spain, Sweden, and the UK, 1992–2015. Work and Occupations, 46(4), 441469.
Overseas Development Institute. (2016). A good gig? The rise of on-demand domestic work. Retrieved from https://www.odi.org/publications/ 10658-good-gig-rise-demand-domestic-work
Overseas Development Institute. (2019). Gen-der and the gig economy. Critical steps for evi-dence-based policy. Retrieved from https://www.odi.org/publications/11272-gender- and-gig-economy-critical-steps-evidence- based-policy
Palència, L., Espelt, A., Cornejo‐Ovalle, M., and Borrell, C. (2014). Socioeconomic inequalities in the use of dental care services in Europe: what is the role of public coverage? Community dentistry and oral epidemiology, 42(2), 97105.
Parmar, D., Stavropoulou, C., and Ioannidis, J. P. A. (2016). Health outcomes during the 2008 finan-cial crisis in Europe: systematic literature review. Bmj, 354, i4588. Retrieved from https://www.bmj.com/content/bmj/354/bmj.i4588.full.pdf
PeñaCasas, R., Ghaliani, D., and Coster, S. (2018). The impact of digitalization on job quality in Euro-pean public services. The case of homecare and employment service workers. Retrieved from https://www.epsu.org/sites/default/files/article/files/FINAL%20REPORT%20EPSU%20DIGITAL ISATION%20%20OSE%20June%202018.pdf
PérezZapata, O., Pascual, A. S., ÁlvarezHernán-dez, G., and Collado, C. C. (2016). Knowledge work intensification and selfmanagement: the autonomy paradox. Work Organisation, Labour and Globalisation, 10(2), 2749.
Piasna, A., and Drahokoupil, J. (2017). Gender inequalities in the new world of work. Transfer: European Review of Labour and Research, 23(3), 313-332.

References
European Institute for Gender Equality 142
Piau, A., Campo, E., Rumeau, P., Vellas, B., and Nourhashemi, F. (2014). Aging society and geron-technology: A solution for an independent living? The journal of nutrition, health & aging, 18(1), 97112.
Pickett, K. E., and Wilkinson, R. G. (2007). Child wellbeing and income inequality in rich societies: ecological cross sectional study. Bmj, 335(7629), 1080.
Posetti, J. (2017). Fighting Back Against Prolific Online Harassment: Maria Ressa. In L. Kilman (Ed.), An Attack on One is an Attack on All (pp. 3740): UNESCO.
Prates, M. O., Avelar, P. H., and Lamb, L. C. (2019). Assessing gender bias in machine translation: a case study with Google Translate. Neural Com-puting and Applications, 119.
Purvanova, R. K., and Muros, J. P. (2010). Gender differences in burnout: A metaanalysis. Journal of vocational behavior, 77(2), 168-185.
PwC. (2016). The sharing economy presents Europe with a €570 billion opportunity. Retrieved from https://www.pwc.com/hu/en/pressroom/2016/ sharing_economy_europe.html
PwC. (2019). Will robots really steal our jobs? An international analysis of the potential long term impact of automation Retrieved from https://www.pwc.com/hu/hu/kiadvanyok/assets/pdf/impact_of_automation_on_jobs.pdf
Raghavan, M., Barocas, S., Kleinberg, J., and Levy, K. (2020). Mitigating bias in algorithmic hiring: evaluating claims and practices. Paper presented at the Proceedings of the 2020 Conference on Fairness, Accountability, and Transparency.
Rapier, G. (2019). Female drivers for Uber and Lyft say sexual harassment is the norm — and get-ting help from the companies isn’t easy. Business Insider. Retrieved from https://www.businessin sider.com/femaleuberlyftdriverssaysexualharassmentisrampant20196
Rego, R. (2018). Changing Forms and Platforms of Misogyny: Sexual Harassment of Women Jour-nalists on Twitter. Media Watch, 9(3), 472-485.
Reimer, D., and Steinmetz, S. (2009). Highly edu-cated but in the wrong field? Educational spe-cialisation and labour market risks of men and women in Spain and Germany. European Societ-ies, 11(5), 723-746.
Richter, M., Vereecken, C. A., Boyce, W., Maes, L., Gabhainn, S. N., and Currie, C. E. (2009). Paren-tal occupation, family affluence and adolescent health behaviour in 28 countries. International journal of public health, 54(4), 203-212.
Rohatgi, A., Scherer, R., and Hatlevik, O. E. (2016). The role of ICT selfefficacy for students’ ICT use and their achievement in a computer and infor-mation literacy test. Computers & Education, 102, 103-116.
Roland Berger, La Journée de La Femme Digi-tale, and NUMA. (2017). Digital equality? Women in the digital revolution. Retrieved from https://www.rolandberger.com/en/Publications/Digi talequalityforwomen.html#:~:text=63%25%20bel ieve%20digital%20wil l%20help,of%20professional%20opportunity%20for%20women.
Ropponen, A., Hakanen, J. J., Hasu, M., and Sep-pänen, L. (2019). Workers’ Health, Wellbeing, and Safety in the Digitalizing Platform Economy. In S. Poutanen, A. Kovalainen, and P. Rouvinen (Eds.), Digital Work and the Platform Economy: Under-standing Tasks, Skills and Capabilities in the New Era.: Routledge.
Rosenblat, A., Levy, K. E., Barocas, S., and Hwang, T. (2017). Discriminating tastes: Uber’s customer ratings as vehicles for workplace discrimination. Policy & Internet, 9(3), 256279.
Roxby, P. (2020). Coronavirus: Plea for pub-lic to get medical care when they need it. BBC. Retrieved from https://www.bbc.com/news/health52417599
Rubery, J. (2010). Women and Recession. London: Routledge.
Gender Equality Index 2020 — Digi talisation and the future of work
References
143
Rubery, J. (2015). Change at work: feminisation, flexibilisation, fragmentation and financialisa-tion. Employee Relations, 37(6), 633.
Rubery, J. (2018). A gender lens on the future of work. Journal of International Affairs, 72(1), 91106.
Rubery, J., and Fagan, C. (1993). Occupational segregation of women and men in the European Community: Publications Office of the European Union.
Sainato, M. (2019). Female drivers feel aban-doned by Uber and Lyft after reporting a sexual assault. The Guardian. Retrieved from https://www.theguardian.com/technology/2019/jun/19/uberlyftfemaledriverssexualassault
Saripapa, N. (2019). Analytical report on abuse of older women in selected European countries. Retrieved from http://www.voiva.fi/wpcontent/uploads/2019/03/TISOVA_O1report1.pdf
Scheele, A. (2005). The future of work – What kind of work? Impacts of gender on the defini-tion of work and research methodology. Transfer: European Review of Labour and Research, 11(1), 014-025.
Schieman, S., and Young, M. (2010). Is there a downside to schedule control for the work-fam-ily interface? Journal of Family Issues, 31(10), 13911414.
Schneebaum, A., Rehm, M., Mader, K., and Hollan, K. (2018). The gender wealth gap across Euro-pean countries. Review of Income and Wealth, 64(2), 295331.
Schoenbaum, N. (2016). Gender and the shar-ing economy. Fordham Urban Law Journal 43(4), 1023-1070.
Schröttle, and Meshkova. (2018). Data collection: challenges and opportunities. In S. Weil, Cor-radi, C., & Naudi, M. (Ed.), Femicide Across Europe (pp. 33-52): Policy Press.
Schwellnus, C., Geva, A., Pak, M., and Veiel, R. (2019). Gig economy platforms: Boon or Bane? Retrieved from https://www.oecd-ilibrary.org/economics/gig-economy-platforms-boon- or-bane_fdb0570b-en
Seiner, J. A. (2019). Harassment, Technology, and the Modern Worker. Employee Rights and Employ-ment Policy Journal, 23, 85.
Seta, Ð. (2016). Forgotten Women: The Impact of Islamophobia on Muslim Women. Retrieved from https://www.enareu.org/IMG/pdf/20095_for-gottenwomenpublication_v5_1_.pdf
Sevilla, A., and Smith, S. (2020). Baby steps: The gender division of childcare during the COVID19 pandemic. Retrieved from https://www.iza.org/publications/dp/13302/baby-steps-the-gen-derdivisionofchildcareduringthecovid19 pandemic
Shevchuk, A., Strebkov, D., and Davis, S. N. (2019). The autonomy paradox: how night work under-mines subjective well-being of internet-based freelancers. ILR Review, 72(1), 75-100.
Silbermann, J. (2020). Genderbased pay gaps in the gig economy. Harward Journal of Law and Gender. Retrieved from https://harvard jlg.com/2020/02/gender-based-pay-gaps-in- the-gig-economy/
Simonite, T. (2018). AI is the future – But where are the women. Wired. Retrieved from https://www.wired.com/story/artificial-intelligence-re searchers-gender-imbalance/
Sinha, C., and SchryerRoy, A.M. (2018). Digital health, gender and health equity: invisible imper-atives. Journal of Public Health, 40(suppl_2), ii1-ii5.
Smith, A. (2016). Gig work, online selling and home sharing. Retrieved from https://www.pewresearch .org/ in ternet /2016/11/17/gig-work-online-selling-and-home-sharing/
Smorto, G. (2018). Protecting the weaker par-ties in the platform economy. In N. Davidson, M. Finck, and J. Infranca (Eds.), Cambridge Handbook
References
European Institute for Gender Equality 144
on Law and Regulation of the Sharing Economy: Cambridge University Press.
Søndergaard, M. L. J., and Hansen, L. K. (2017). Designing with Bias and Privilege. Nordes 2017, 7.
Spasova, S., Baeten, R., Coster, S., Ghailani, D., Peña-Casas, R., and Vanhercke, B. (2018). Chal-lenges in long-term care in Europe. A study of national policies. Retrieved from https://ec.europa. eu/social/main.jsp?catId=738&langId=en&pu bId=8128&furtherPubs=yes
Sprang, G., and Silman, M. (2013). Posttrau-matic stress disorder in parents and youth after health-related disasters. Disaster medicine and public health preparedness, 7(1), 105-110.
Stanney, K., Fidopiastis, C., and Foster, L. (2020). Virtual Reality is Sexist: But It Does Not Have to Be. Frontiers in Robotics and AI, 7, 4.
Statucki, T., Howard, N., Ackerman, W. & Kuhn, C. (2020, 09/04/2020). The Potential Benefits of Dig-ital Health Technology in Managing COVID19. Covington Digital Health. Retrieved from https://www.covingtondigitalhealth.com/2020/03/the- potentialbenefitsofdigitalhealthtechnology inmanagingcovid19/
Stavrotheodoros, S., Kaklanis, N., Votis, K., and Tzovaras, D. (2018). A smart-home IoT infrastruc-ture for the support of independent living of older adults. Paper presented at the IFIP international conference on artificial intelligence applications and innovations.
Talmazan, Y., Sirna, L., Ratto, H. M., and Ing, N. (2020). European countries develop new ways to tackle domestic violence during coronavirus lockdowns. NBC News. Retrieved from https://www.nbcnews.com/news/world/european-coun tries-develop-new-ways-tackle-domestic-vio lence-during-coronavirus-n1174301
Tatara, T., Kuzmeskus, L., and Duckhorn, E. (1998). The National Elder Abuse Incidence Study – Final Report. Retrieved from https://acl.gov/sites/default/files/programs/201609/ABuseReport_Full.pdf
Tedesco, C. (2019). Confidence Not Competence: What Holds Women Back from Embracing Tech in Development. DAI. Retrieved from https://dai-global-digital.com/confidence-not-compe tence-what-holds-women-back-from-embrac ing-tech-in-development.html
Ten Brummelhuis, L. L., and Van Der Lippe, T. (2010). Effective work‐life balance support for various household structures. Human Resource Management, 49(2), 173193.
Thompson, L. (2016). #DickPics are no joke: cyberflashing, misogyny and online dating. The Conversation. Retrieved from https://theconver sation.com/dickpicsarenojokecyberflashingmisogyny-and-online-dating-53843
Ticona, J., and Mateescu, A. (2018a). How Domestic Workers Wager Safety In The Plat-form Economy. Fast Company. Retrieved from https://www.fastcompany.com/40541050/how-domestic-workers-wager-safety-in-the-plat form-economy
Ticona, J., and Mateescu, A. (2018b). Trusted strangers: Carework platforms’ cultural entrepre-neurship in the on-demand economy. New Media & Society, 20(11), 4384-4404.
Trojansky, A. (2020). Towards the “Uber-isation” of care? Platform work in the sector of long-term care and its implications for workers’ rights. Retrieved from https://op.europa.eu/en/publication-de-tail//publication/95798e0e59dc11ea8b8101aa75ed71a1:
Uhlmann, E. L., and Silberzahn, R. (2014). Con-formity under uncertainty: Reliance on gender stereotypes in online hiring decisions. Behavioral and Brain Sciences, 37(1), 103-104.
UN Women. (2020). Policy Brief: The Impact of COVID19 on Women. Retrieved from https://www2.unwomen.org/-/media/headquarters/attachments/sections/library/publications/2020/policybrieftheimpactofcovid19onwom-enen.pdf?la=en&vs=1406

Gender Equality Index 2020 — Digi talisation and the future of work
References
145
Valenduc, G. (2011). Not a job for life? Women’s progression, conversion and dropout in ICT pro-fessions. International Journal of Gender, Science and Technology, 3(2), 483-500.
Valenduc, G., and Vendramin, P. (2017). Digitalisa-tion, between disruption and evolution. Transfer: European Review of Labour and Research, 23(2), 121-134.
Valenduc, G., Vendramin, P., Guffens, C., Ponzel-lini, A. M., Lebano, A., d’Ouville, L., . . . Tolar, M. (2004). Widening women’s work in information and communication technology. Retrieved from http://www.ftunamur.org/fichiers/D12print.pdf
Van Bavel, M., Janssens, K., Schakenraad, W., and Thurlings, N. (2010). Elder abuse in Europe: Background and position paper. Retrieved from https://www.aanpak-ouderenmishandeling.nl/doc/Elder-Abuse-in-Europe.pdf
Van Doorn, N. (2017). Platform labor: on the gen-dered and racialized exploitation of lowincome service work in the ‘on-demand’ economy. Infor-mation, Communication & Society, 20(6), 898914.
von der Leyen, U. (2019). Political Guide-lines for the next European Commission 2019-2024. Retrieved from https://ec.europa.eu/commission/sites/beta-political/files/political- guidelinesnextcommission_en.pdf
Vorvoreanu, M., Zhang, L., Huang, Y.H., Hilder-brand, C., SteineHanson, Z., and Burnett, M. (2019). From gender biases to gender-inclusive design: An empirical investigation. Paper presented at the Proceedings of the 2019 CHI Conference on Human Factors in Computing Systems.
Wajcman, J. (2004). Technofeminism. Cambridge: Polity.
Wajcman, J. (2015). Pressed for time: The acceler-ation of life in digital capitalism: University of Chi-cago Press.
Walklate, S., FitzGibbon, K., McCulloch, J., and Maher, J. (2019). Towards a Global Femicide Index: Counting the Costs. London: Routledge.
Wang, Y., and Redmiles, D. (2019). Implicit gen-der biases in professional software development: An empirical study. Paper presented at the 2019 IEEE/ACM 41st International Conference on Soft-ware Engineering: Software Engineering in Soci-ety (ICSESEIS).
WAVE. (2019). Launch of a new EUProject: MAR-VOW MultiAgency Responses to Violence against Older Women – in Austria, Estonia, Greece and Germany Retrieved from https://www.wave-network.org/wp-content/uploads/Pressrelease_MARVOW_.pdf
Wenham, C., Smith, J., and Morgan, R. (2020). COVID19: the gendered impacts of the out-break. The Lancet, 395(10227), 846-848.
WHO. (2008). Behaviour change strategies and health: the role of health systems. Retrieved from http://www.euro.who.int/__data/assets/pdf_file/0003/70185/RC58_edoc10.pdf
WHO. (2013). Health 2020: a European policy framework supporting action across government and society for health and well-being. Retrieved from http://www.euro.who.int/en/publications/abstracts/health-2020-a-european-policy-frame work-supporting-action-across-government-and-society-for-health-and-well-being
WHO. (2014a). The case for investing in public health. A public health summary report for EPHO 8. Retrieved from http://www.euro.who.int/__data/assets/pdf_file/0009/278073/CaseInvest ing-Public-Health.pdf
WHO. (2014b). Policy summary 15. What do we know about the strengths and weakness of different policy mechanisms to influence health behaviour in the population? Retrieved from http://www.euro.who.int/__data/assets/pdf_file/0003/270138/PS15web.pdf
WHO. (2016). Growing Up Unequal: Gender and Socioeconomic Differences in Young People’s Health and Well-being (9289051361). Retrieved from https://www.euro.who.int/__data/assets/pdf_file/0003/303438/HSBCNo.7Growingupunequal-Full-Report.pdf
References
European Institute for Gender Equality 146
WHO. (2017). Adolescent obesity and related behaviours: trends and inequalities in the WHO European Region, 2002–2014. Retrieved from https://www.euro.who. int/__data/assets/ pdf_file/0019/339211/WHO_ObesityReport_ 2017_v3.pdf
WHO. (2018). Working paper on Gender & Equity in the Health and Social Care Workforce. Retrieved from https://www.who.int/hrh/news/2018/GEH-workingpaperZeroDraft.pdf
WHO. (2020a). COVID19 and violence against women. What the health sector/system can do. Retrieved from https://www.who.int/reproductive health/publications/vawcovid19/en/
WHO. (2020b). Gender and COVID-19. Retrieved from https://apps.who.int/iris/bitstream/handle/ 10665/332080/WHO2019nCoVAdvocacy_ briefGender2020.1eng.pdf?sequence= 1&isAllowed=y
WHO. (2020c). Mental health and psychosocial considerations during the COVID-19 outbreak Retrieved from https://www.who.int/docs/default- source/coronaviruse/mental-health-consider ations.pdf
WHO. (2020d). Strengthening Preparedness for Health Emergencies; Implementation of Inter-national Health Regulations. Draft resolution proposed by Argentina, Chile, Finland, France, Indonesia, Netherlands, Rwanda, Singapore and Zambia. Paper presented at the Executive Board: 146th session. https://apps.who.int/gb/ebwha/pdf_files/EB146/B146_CONF17en.pdf
World Economic Forum. (2016). The Future of Jobs. Employment, Skills and Workforce Strategy for the Fourth Industrial Revolution. Retrieved from https://www.weforum.org/reports/the- future-of-jobs
World Economic Forum. (2018). The Global Gen-der Gap Report. Retrieved from http://www3.weforum.org/docs/WEF_GGGR_2018.pdf
Woyke, E. (2017). The Octogenarians Who Love Amazon’s Alexa. MIT Technology Review. Retrieved from https://www.technologyreview.com/ 2017/06/09/151317/theoctogenarianswho loveamazonsalexa/
Wu, J., McCann, A., Katz, J., and Peltier, E. (2020). 74,000 Missing Deaths: Tracking the True Toll of the Coronavirus Outbreak. New York Times. Retrieved from https://www.nytimes.com/inter active/2020/04/21/world/coronavirus-miss ing-deaths.html
Yang, S.Y., Lin, C.Y., Huang, Y.C., and Chang, J.H. (2018). Gender differences in the association of smartphone use with the vitality and mental health of adolescent students. Journal of Ameri-can college health, 66(7), 693701.
YoungMinds. (2020). Coronavirus: Impact on young people with mental health needs. Retrieved from https://youngminds.org.uk/media/3708/coronavirus-report_march2020.pdf
Zacharenko, E. (2020). The coronavirus crisis exposes the systemic exploitation between the EU’s West and East. The Progressive Post. Retrieved from https://progressivepost.eu/no-category/the- coronaviruscrisisexposesthesystemic exploitationbetweentheeuswestandeast
Zeid, A. (2018). The impact of online violence on women human rights defenders and women’s organisations. Statement by UN High Commis-sioner for Human Rights. 38th session of the Human Rights Council. Retrieved from https://www.ohchr.org/EN/HRBodies/HRC/Pages/News-Detail.aspx?NewsID=23238&LangID=E
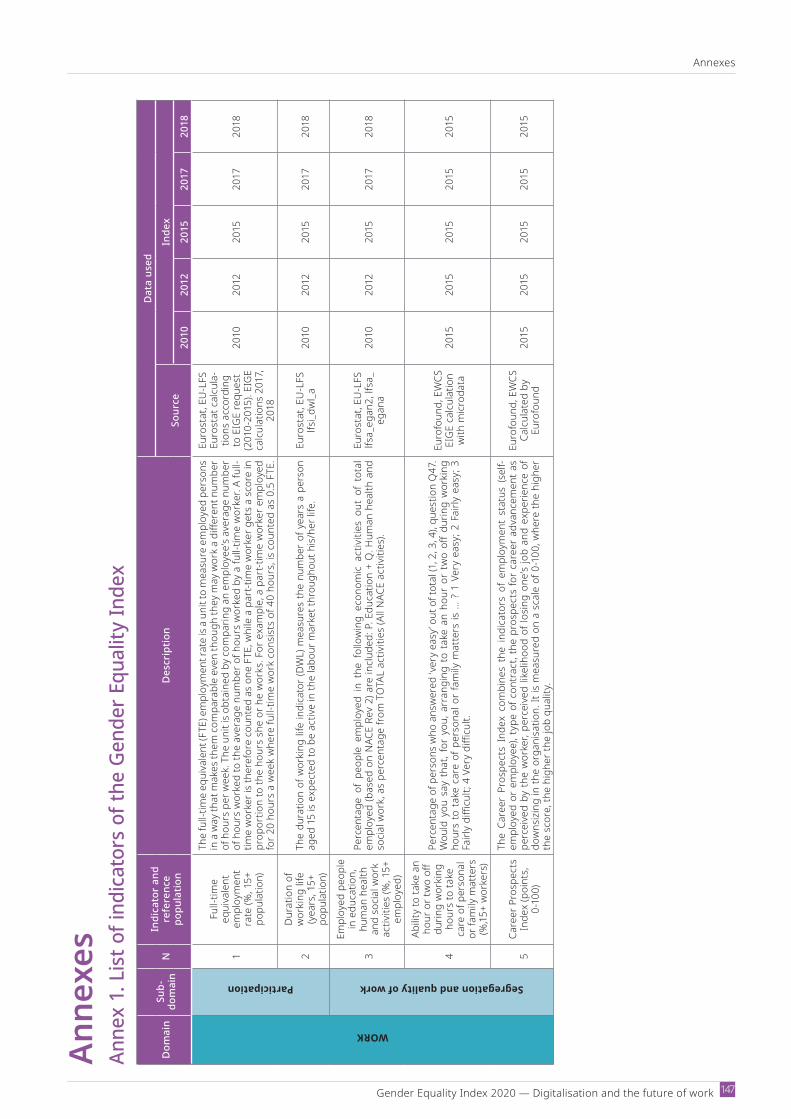
Annexes
147Gender Equality Index 2020 — Digitalisation and the future of work
Anne
xes
Anne
x 1.
Lis
t of i
ndica
tors
of t
he G
ende
r Equ
ality
Inde
x
Dom
ain
Sub-
dom
ain
NIn
dica
tor
and
refe
renc
e po
pula
tion
Des
crip
tion
Dat
a us
ed
Sour
ceIn
dex
2010
2012
2015
2017
2018
WORK
Participation
1
Full-
time
equi
vale
nt
empl
oym
ent
rate
(%, 1
5+
popu
latio
n)
The
full-
time
equi
vale
nt (F
TE) e
mpl
oym
ent r
ate
is a
unit
to m
easu
re e
mpl
oyed
per
sons
in
a w
ay th
at m
akes
them
com
para
ble
even
thou
gh th
ey m
ay w
ork
a di
ffere
nt n
umbe
r of
hou
rs p
er w
eek.
The
uni
t is o
btai
ned
by c
ompa
ring
an e
mpl
oyee
’s av
erag
e nu
mbe
r of
hou
rs w
orke
d to
the
aver
age
num
ber o
f hou
rs w
orke
d by
a fu
ll-tim
e w
orke
r. A
full-
time
wor
ker i
s th
eref
ore
coun
ted
as o
ne F
TE, w
hile
a p
art-t
ime
wor
ker g
ets
a sc
ore
in
prop
ortio
n to
the
hour
s sh
e or
he
wor
ks. F
or e
xam
ple,
a p
artt
ime
wor
ker e
mpl
oyed
fo
r 20
hour
s a
wee
k w
here
full-
time
wor
k co
nsis
ts o
f 40
hour
s, is
coun
ted
as 0
.5 F
TE.
Euro
stat
, EU
LFS
Eu
rost
at c
alcu
la-
tions
acc
ordi
ng
to E
IGE
requ
est
(201
0-20
15).
EIG
E ca
lcul
atio
ns 2
017,
20
18
2010
2012
2015
2017
2018
2D
urat
ion
of
wor
king
life
(y
ears
, 15+
po
pula
tion)
The
dura
tion
of w
orki
ng li
fe in
dica
tor
(DW
L) m
easu
res
the
num
ber
of y
ears
a p
erso
n ag
ed 1
5 is
expe
cted
to b
e ac
tive
in th
e la
bour
mar
ket t
hrou
ghou
t his
/her
life
. Eu
rost
at, E
UL
FS
lfsi_d
wl_
a20
1020
1220
1520
1720
18
Segregation and quality of work
3
Empl
oyed
peo
ple
in e
duca
tion,
hu
man
hea
lth
and
soci
al w
ork
activ
ities
(%, 1
5+
empl
oyed
)
Perc
enta
ge o
f pe
ople
em
ploy
ed i
n th
e fo
llow
ing
econ
omic
activ
ities
out
of
tota
l em
ploy
ed (b
ased
on
NAC
E Re
v 2)
are
incl
uded
: P. E
duca
tion
+ Q
. Hum
an h
ealth
and
so
cial
wor
k, a
s pe
rcen
tage
from
TO
TAL
activ
ities
(All
NAC
E ac
tiviti
es).
Euro
stat
, EU
LFS
lfs
a_eg
an2,
lfsa
_eg
ana
2010
2012
2015
2017
2018
4
Abili
ty to
take
an
hour
or t
wo
off
durin
g w
orki
ng
hour
s to
take
ca
re o
f per
sona
l or
fam
ily m
atte
rs
(%,15
+ w
orke
rs)
Perc
enta
ge o
f per
sons
who
ans
wer
ed 'v
ery
easy
’ out
of t
otal
(1, 2
, 3, 4
), qu
estio
n Q
47.
Wou
ld y
ou s
ay t
hat,
for
you,
arr
angi
ng t
o ta
ke a
n ho
ur o
r tw
o off
dur
ing
wor
king
ho
urs
to t
ake
care
of p
erso
nal o
r fa
mily
mat
ters
is ..
. ? 1
Ver
y ea
sy; 2
Fai
rly e
asy;
3
Fairl
y di
fficu
lt; 4
Ver
y di
fficu
lt.
Euro
foun
d, E
WCS
EI
GE
calc
ulat
ion
with
mic
roda
ta20
1520
1520
1520
1520
15
5Ca
reer
Pro
spec
ts
Inde
x (p
oint
s,
0-10
0)
The
Care
er P
rosp
ects
Ind
ex c
ombi
nes
the
indi
cato
rs o
f em
ploy
men
t st
atus
(se
lfem
ploy
ed o
r em
ploy
ee),
type
of c
ontr
act,
the
pros
pect
s fo
r ca
reer
adv
ance
men
t as
perc
eive
d by
the
wor
ker,
perc
eive
d lik
elih
ood
of lo
sing
one’
s jo
b an
d ex
perie
nce
of
dow
nsizi
ng in
the
orga
nisa
tion.
It is
mea
sure
d on
a s
cale
of 0
-100
, whe
re th
e hi
gher
th
e sc
ore,
the
high
er th
e jo
b qu
ality
.
Euro
foun
d, E
WCS
Ca
lcul
ated
by
Euro
foun
d20
1520
1520
1520
1520
15
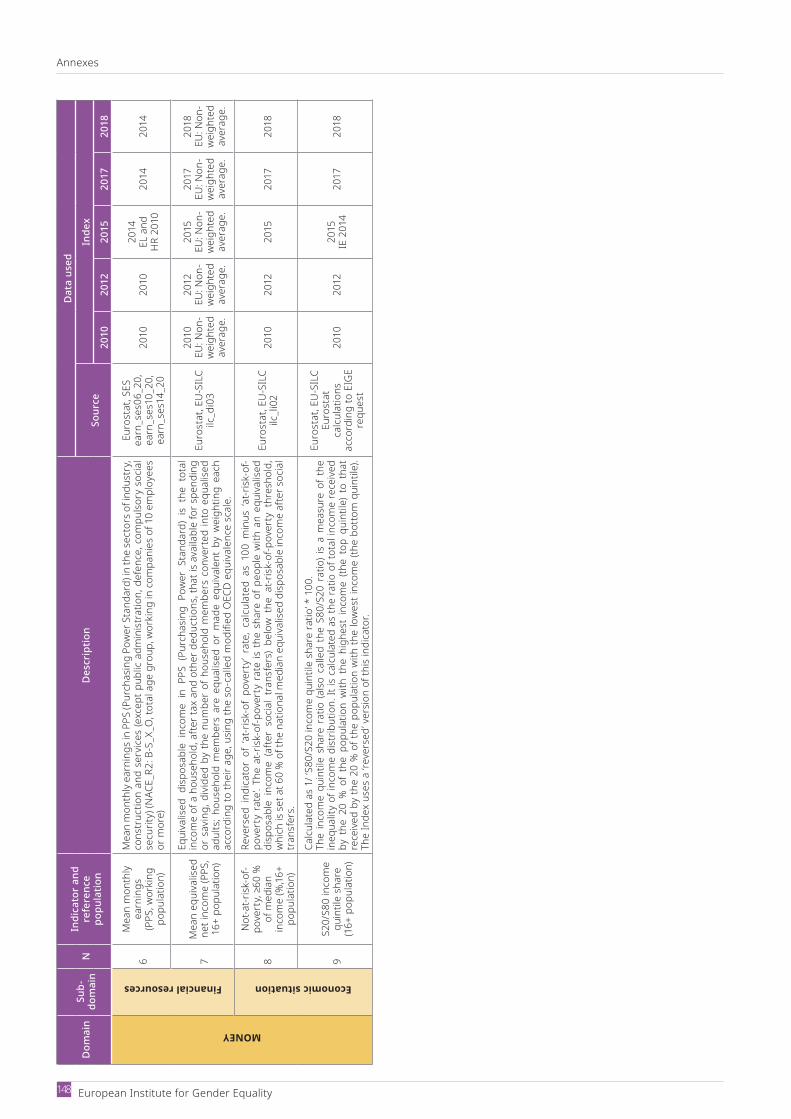
Annexes
European Institute for Gender Equality 148
Dom
ain
Sub-
dom
ain
NIn
dica
tor
and
refe
renc
e po
pula
tion
Des
crip
tion
Dat
a us
ed
Sour
ceIn
dex
2010
2012
2015
2017
2018
MONEY
Financial resources6
Mea
n m
onth
ly
earn
ings
(P
PS, w
orki
ng
popu
latio
n)
Mea
n m
onth
ly e
arni
ngs i
n PP
S (P
urch
asin
g Po
wer
Sta
ndar
d) in
the
sect
ors o
f ind
ustr
y, co
nstr
uctio
n an
d se
rvic
es (e
xcep
t pub
lic a
dmin
istr
atio
n, d
efen
ce, c
ompu
lsor
y so
cial
se
curit
y) (N
ACE_
R2: B
S_X
_O, t
otal
age
gro
up, w
orki
ng in
com
pani
es o
f 10
empl
oyee
s or
mor
e)
Euro
stat
, SES
earn
_ses
06_2
0,
earn
_ses
10_2
0,
earn
_ses
14_2
020
1020
1020
14EL
and
H
R 20
1020
1420
14
7M
ean
equi
valis
ed
net i
ncom
e (P
PS,
16+
popu
latio
n)
Equi
valis
ed d
ispos
able
inc
ome
in P
PS (
Purc
hasin
g Po
wer
Sta
ndar
d) i
s th
e to
tal
inco
me
of a
hou
seho
ld, a
fter t
ax a
nd o
ther
ded
uctio
ns, t
hat i
s av
aila
ble
for s
pend
ing
or s
avin
g, d
ivid
ed b
y th
e nu
mbe
r of
hou
seho
ld m
embe
rs c
onve
rted
into
equ
alis
ed
adul
ts; h
ouse
hold
mem
bers
are
equ
alis
ed o
r m
ade
equi
vale
nt b
y w
eigh
ting
each
ac
cord
ing
to th
eir a
ge, u
sing
the
soc
alle
d m
odifi
ed O
ECD
equi
vale
nce
scal
e.
Euro
stat
, EU
SIL
Cilc
_di0
3
2010
EU: N
on-
wei
ghte
d av
erag
e.
2012
EU: N
on-
wei
ghte
d av
erag
e.
2015
EU: N
on-
wei
ghte
d av
erag
e.
2017
EU: N
on-
wei
ghte
d av
erag
e.
2018
EU: N
on-
wei
ghte
d av
erag
e.
Economic situation
8
Not
-at-r
isk-o
f-po
vert
y, ≥6
0 %
of
med
ian
inco
me
(%,16
+ po
pula
tion)
Reve
rsed
ind
icat
or o
f ‘at
-risk
-of
pove
rty’
rate
, ca
lcul
ated
as
100
min
us ‘a
t-risk
-of-
pove
rty
rate
’. Th
e at
-risk
-of-p
over
ty r
ate
is th
e sh
are
of p
eopl
e w
ith a
n eq
uiva
lised
di
spos
able
inc
ome
(afte
r so
cial
tra
nsfe
rs)
belo
w t
he a
t-risk
-of-p
over
ty t
hres
hold
, w
hich
is s
et a
t 60
% o
f the
nat
iona
l med
ian
equi
valis
ed d
ispos
able
inco
me
afte
r soc
ial
tran
sfer
s.
Euro
stat
, EU
SIL
Cilc
_li02
2010
2012
2015
2017
2018
9S2
0/S8
0 in
com
e qu
intil
e sh
are
(16+
pop
ulat
ion)
Calc
ulat
ed a
s 1/
‘S80
/S20
inco
me
quin
tile
shar
e ra
tio’ *
100
.Th
e in
com
e qu
intil
e sh
are
ratio
(also
cal
led
the
S80/
S20
ratio
) is
a m
easu
re o
f th
e in
equa
lity
of in
com
e di
strib
utio
n. It
is c
alcu
late
d as
the
ratio
of t
otal
inco
me
rece
ived
by
the
20
% o
f th
e po
pula
tion
with
the
hig
hest
inc
ome
(the
top
quin
tile)
to
that
re
ceiv
ed b
y th
e 20
% o
f the
pop
ulat
ion
with
the
low
est i
ncom
e (th
e bo
ttom
qui
ntile
). Th
e In
dex
uses
a ‘r
ever
sed’
ver
sion
of th
is in
dica
tor.
Euro
stat
, EU
SIL
CEu
rost
at
calc
ulat
ions
ac
cord
ing
to E
IGE
requ
est
2010
2012
2015
IE 2
014
2017
2018
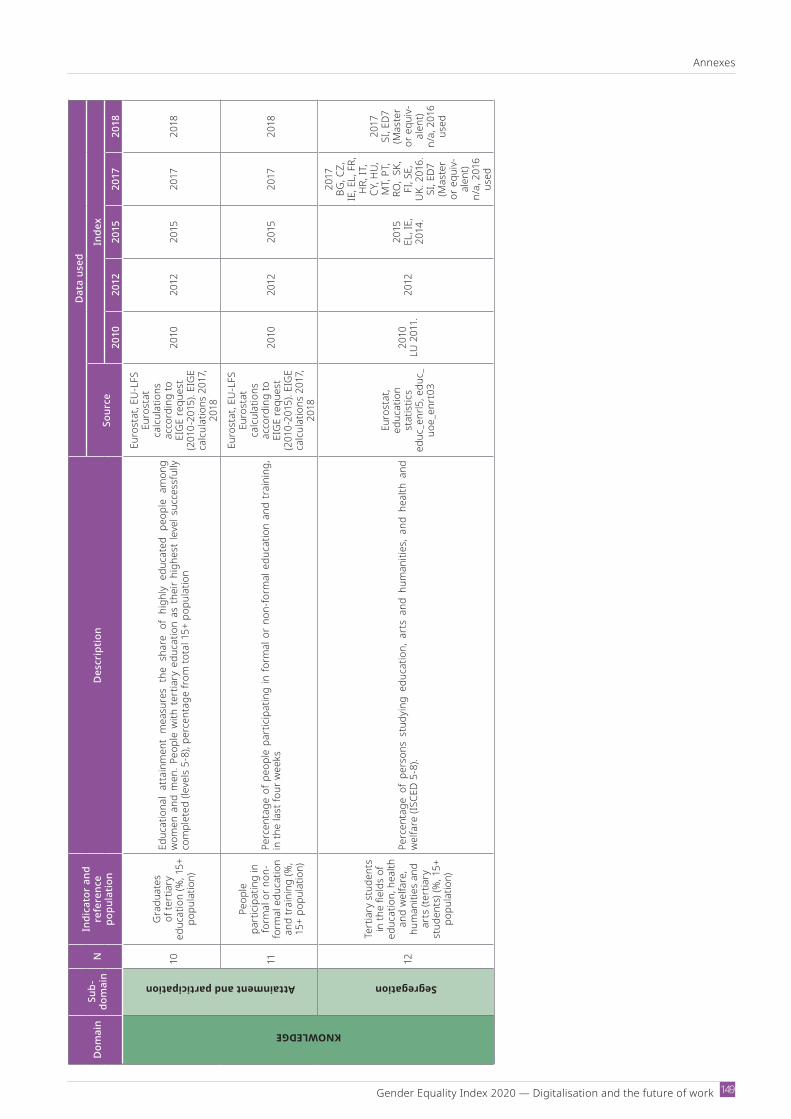
Gender Equality Index 2020 — Digi talisation and the future of work
Annexes
149
Dom
ain
Sub-
dom
ain
NIn
dica
tor
and
refe
renc
e po
pula
tion
Des
crip
tion
Dat
a us
ed
Sour
ceIn
dex
2010
2012
2015
2017
2018
KNOWLEDGE
Attainment and participation
10G
radu
ates
of
tert
iary
ed
ucat
ion
(%, 1
5+
popu
latio
n)
Educ
atio
nal
atta
inm
ent
mea
sure
s th
e sh
are
of h
ighl
y ed
ucat
ed p
eopl
e am
ong
wom
en a
nd m
en. P
eopl
e w
ith t
ertia
ry e
duca
tion
as t
heir
high
est
leve
l suc
cess
fully
co
mpl
eted
(lev
els
5-8)
, per
cent
age
from
tota
l 15+
pop
ulat
ion
Euro
stat
, EU
LFS
Eu
rost
at
calc
ulat
ions
ac
cord
ing
to
EIG
E re
ques
t (2
010-
2015
). EI
GE
calc
ulat
ions
201
7,
2018
2010
2012
2015
2017
2018
11
Peop
le
part
icip
atin
g in
fo
rmal
or n
on-
form
al e
duca
tion
and
trai
ning
(%,
15+
popu
latio
n)
Perc
enta
ge o
f peo
ple
part
icip
atin
g in
form
al o
r no
n-fo
rmal
edu
catio
n an
d tr
aini
ng,
in th
e la
st fo
ur w
eeks
Euro
stat
, EU
LFS
Euro
stat
ca
lcul
atio
ns
acco
rdin
g to
EI
GE
requ
est
(201
0-20
15).
EIG
E ca
lcul
atio
ns 2
017,
20
18
2010
2012
2015
2017
2018
Segregation
12
Tert
iary
stu
dent
s in
the
field
s of
ed
ucat
ion,
hea
lth
and
wel
fare
, hu
man
ities
and
ar
ts (t
ertia
ry
stud
ents
) (%
, 15+
po
pula
tion)
Perc
enta
ge o
f pe
rson
s st
udyi
ng e
duca
tion,
art
s an
d hu
man
ities
, an
d he
alth
and
w
elfa
re (I
SCED
58
).
Euro
stat
, ed
ucat
ion
stat
istic
sed
uc_e
nrl5
, edu
c_uo
e_en
rt03
2010
LU 2
011.
2012
2015
EL, I
E,
2014
.
2017
BG, C
Z,
IE, E
L, F
R,
HR,
IT,
CY, H
U,
MT,
PT,
RO,
SK,
FI, S
E,
UK.
201
6.
SI, E
D7
(Mas
ter
or e
quiv
-al
ent)
n/a,
201
6 us
ed
2017
SI, E
D7
(Mas
ter
or e
quiv
-al
ent)
n/a,
201
6 us
ed
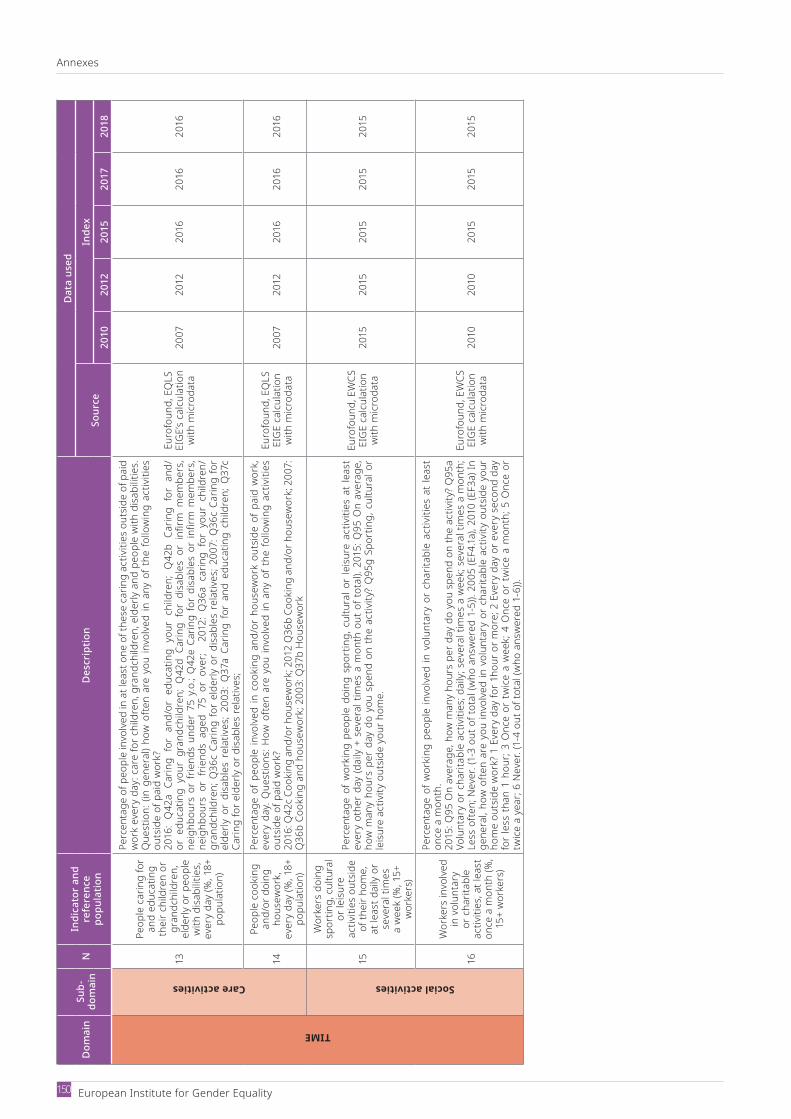
Annexes
European Institute for Gender Equality 150
Dom
ain
Sub-
dom
ain
NIn
dica
tor
and
refe
renc
e po
pula
tion
Des
crip
tion
Dat
a us
ed
Sour
ceIn
dex
2010
2012
2015
2017
2018
TIME
Care activities
13
Peop
le c
arin
g fo
r an
d ed
ucat
ing
thei
r chi
ldre
n or
gr
andc
hild
ren,
el
derly
or p
eopl
e w
ith d
isab
ilitie
s,
ever
y da
y (%
, 18+
po
pula
tion)
Perc
enta
ge o
f peo
ple
invo
lved
in a
t lea
st o
ne o
f the
se c
arin
g ac
tiviti
es o
utsid
e of
pai
d w
ork
ever
y da
y: c
are
for c
hild
ren,
gra
ndch
ildre
n, e
lder
ly a
nd p
eopl
e w
ith d
isab
ilitie
s.
Que
stio
n: (i
n ge
nera
l) ho
w o
ften
are
you
invo
lved
in a
ny o
f the
fol
low
ing
activ
ities
ou
tsid
e of
pai
d w
ork?
2016
: Q
42a
Carin
g fo
r an
d/or
edu
catin
g yo
ur c
hild
ren;
Q42
b Ca
ring
for
and/
or e
duca
ting
your
gra
ndch
ildre
n; Q
42d
Carin
g fo
r di
sabl
es o
r in
firm
mem
bers
, ne
ighb
ours
or
frie
nds
unde
r 75
y.o
.; Q
42e
Carin
g fo
r di
sabl
es o
r in
firm
mem
bers
, ne
ighb
ours
or
frie
nds
aged
75
or o
ver;
201
2: Q
36a
carin
g fo
r yo
ur c
hild
ren/
gran
dchi
ldre
n; Q
36c
Carin
g fo
r el
derly
or
disa
bles
rel
ativ
es; 2
007:
Q36
c Ca
ring
for
elde
rly o
r di
sabl
es r
elat
ives
; 200
3: Q
37a
Carin
g fo
r an
d ed
ucat
ing
child
ren;
Q37
c Ca
ring
for e
lder
ly o
r dis
able
s re
lativ
es;
Euro
foun
d, E
QLS
EIG
E’s
calc
ulat
ion
with
mic
roda
ta20
0720
1220
1620
1620
16
14
Peop
le c
ooki
ng
and/
or d
oing
ho
usew
ork,
ev
ery
day
(%, 1
8+
popu
latio
n)
Perc
enta
ge o
f peo
ple
invo
lved
in c
ooki
ng a
nd/o
r ho
usew
ork
outs
ide
of p
aid
wor
k,
ever
y da
y. Q
uest
ions
: How
ofte
n ar
e yo
u in
volv
ed in
any
of t
he f
ollo
win
g ac
tiviti
es
outs
ide
of p
aid
wor
k?20
16: Q
42c
Cook
ing
and/
or h
ouse
wor
k; 2
012
Q36
b Co
okin
g an
d/or
hou
sew
ork;
200
7:
Q36
b Co
okin
g an
d ho
usew
ork;
200
3: Q
37b
Hou
sew
ork
Euro
foun
d, E
QLS
EIG
E ca
lcul
atio
n w
ith m
icro
data
2007
2012
2016
2016
2016
Social activities
15
Wor
kers
doi
ng
spor
ting,
cul
tura
l or
leisu
re
activ
ities
out
side
of th
eir h
ome,
at
leas
t dai
ly o
r se
vera
l tim
es
a w
eek
(%, 1
5+
wor
kers
)
Perc
enta
ge o
f w
orki
ng p
eopl
e do
ing
spor
ting,
cul
tura
l or
leisu
re a
ctiv
ities
at
leas
t ev
ery
othe
r da
y (d
aily
+ s
ever
al t
imes
a m
onth
out
of t
otal
). 20
15: Q
95 O
n av
erag
e,
how
man
y ho
urs
per
day
do y
ou s
pend
on
the
activ
ity?
Q95
g Sp
ortin
g, c
ultu
ral o
r le
isure
act
ivity
out
side
your
hom
e.
Euro
foun
d, E
WCS
EIG
E ca
lcul
atio
n w
ith m
icro
data
2015
2015
2015
2015
2015
16
Wor
kers
invo
lved
in
vol
unta
ry
or c
harit
able
ac
tiviti
es, a
t lea
st
once
a m
onth
(%,
15+
wor
kers
)
Perc
enta
ge o
f wor
king
peo
ple
invo
lved
in v
olun
tary
or
char
itabl
e ac
tiviti
es a
t le
ast
once
a m
onth
.20
15: Q
95 O
n av
erag
e, h
ow m
any
hour
s pe
r day
do
you
spen
d on
the
activ
ity?
Q95
a Vo
lunt
ary
or c
harit
able
act
iviti
es; d
aily
; sev
eral
tim
es a
wee
k; s
ever
al ti
mes
a m
onth
; Le
ss o
ften;
Nev
er. (
13
out o
f tot
al (w
ho a
nsw
ered
15
)). 2
005
(EF4
.1a),
2010
(EF3
a) In
ge
nera
l, ho
w o
ften
are
you
invo
lved
in v
olun
tary
or
char
itabl
e ac
tivity
out
side
your
ho
me
outs
ide
wor
k? 1
Eve
ry d
ay fo
r 1ho
ur o
r mor
e; 2
Eve
ry d
ay o
r eve
ry s
econ
d da
y fo
r le
ss t
han
1 ho
ur; 3
Onc
e or
tw
ice
a w
eek;
4 O
nce
or t
wic
e a
mon
th; 5
Onc
e or
tw
ice
a ye
ar; 6
Nev
er. (
14
out o
f tot
al (w
ho a
nsw
ered
16
)).
Euro
foun
d, E
WCS
EIG
E ca
lcul
atio
n w
ith m
icro
data
2010
2010
2015
2015
2015
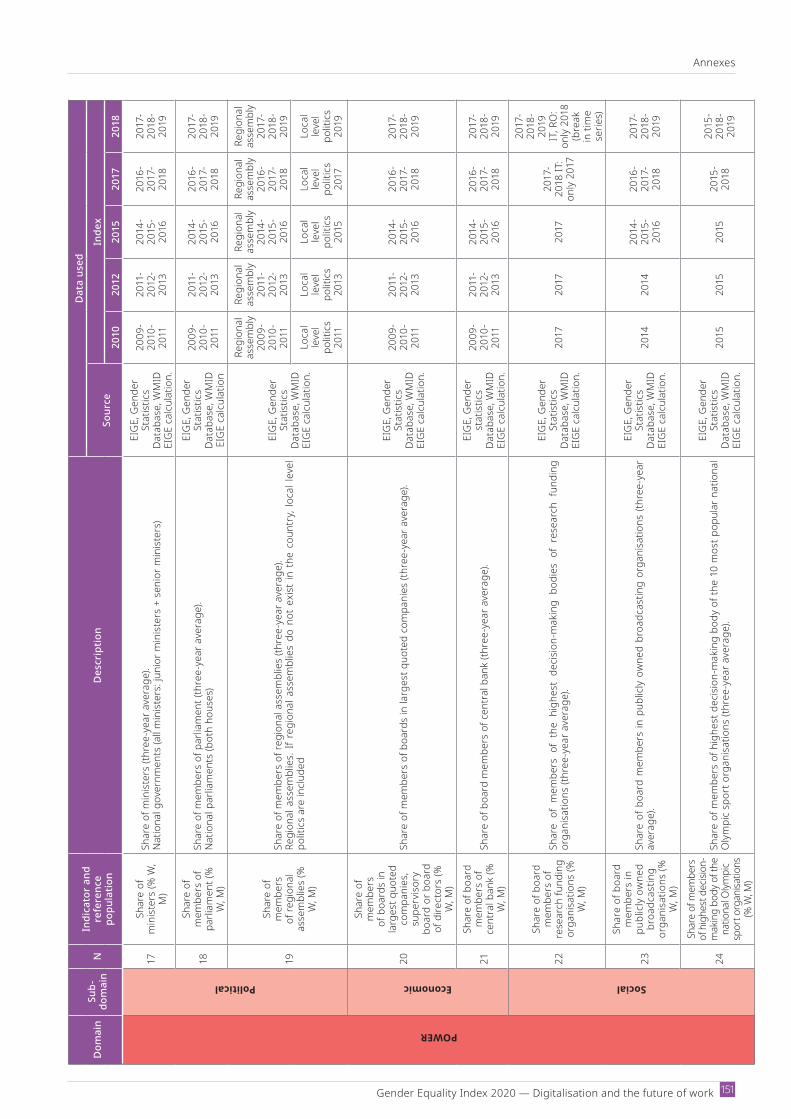
Gender Equality Index 2020 — Digi talisation and the future of work
Annexes
151
Dom
ain
Sub-
dom
ain
NIn
dica
tor
and
refe
renc
e po
pula
tion
Des
crip
tion
Dat
a us
ed
Sour
ceIn
dex
2010
2012
2015
2017
2018
POWER
Political
17Sh
are
of
min
iste
rs (%
W,
M)
Shar
e of
min
iste
rs (t
hree
yea
r ave
rage
).N
atio
nal g
over
nmen
ts (a
ll m
inis
ters
: jun
ior m
inis
ters
+ s
enio
r min
iste
rs)
EIG
E, G
ende
r St
atis
tics
Data
base
, WM
IDEI
GE
calc
ulat
ion.
2009
20
10-
2011
2011
-20
12-
2013
2014
-20
15-
2016
2016
-20
17-
2018
2017
-20
18-
2019
18Sh
are
of
mem
bers
of
parli
amen
t (%
W
, M)
Shar
e of
mem
bers
of p
arlia
men
t (th
ree
year
ave
rage
).N
atio
nal p
arlia
men
ts (b
oth
hous
es)
EIG
E, G
ende
r St
atis
tics
Data
base
, WM
IDEI
GE
calc
ulat
ion
2009
20
10-
2011
2011
-20
12-
2013
2014
-20
15-
2016
2016
-20
17-
2018
2017
-20
18-
2019
19
Shar
e of
m
embe
rs
of re
gion
al
asse
mbl
ies
(%
W, M
)
Shar
e of
mem
bers
of r
egio
nal a
ssem
blie
s (th
ree
year
ave
rage
).Re
gion
al a
ssem
blie
s. I
f re
gion
al a
ssem
blie
s do
not
exi
st in
the
cou
ntry
, loc
al le
vel
polit
ics
are
incl
uded
EIG
E, G
ende
r St
atis
tics
Data
base
, WM
IDEI
GE
calc
ulat
ion.
Regi
onal
as
sem
bly
2009
20
10-
2011
Regi
onal
as
sem
bly
2011
-20
12-
2013
Regi
onal
as
sem
bly
2014
-20
15-
2016
Regi
onal
as
sem
bly
2016
-20
17-
2018
Regi
onal
as
sem
bly
2017
-20
18-
2019
Loca
l le
vel
polit
ics
2011
Loca
l le
vel
polit
ics
2013
Loca
l le
vel
polit
ics
2015
Loca
l le
vel
polit
ics
2017
Loca
l le
vel
polit
ics
2019
Economic
20
Shar
e of
m
embe
rs
of b
oard
s in
la
rges
t quo
ted
com
pani
es,
supe
rvis
ory
boar
d or
boa
rd
of d
irect
ors
(%
W, M
)
Shar
e of
mem
bers
of b
oard
s in
larg
est q
uote
d co
mpa
nies
(thr
eey
ear a
vera
ge).
EIG
E, G
ende
r St
atis
tics
Data
base
, WM
IDEI
GE
calc
ulat
ion.
2009
20
10-
2011
2011
-20
12-
2013
2014
-20
15-
2016
2016
-20
17-
2018
2017
-20
18-
2019
21Sh
are
of b
oard
m
embe
rs o
f ce
ntra
l ban
k (%
W
, M)
Shar
e of
boa
rd m
embe
rs o
f cen
tral
ban
k (th
ree
year
ave
rage
).EI
GE,
Gen
der
stat
istic
s Da
taba
se, W
MID
EIG
E ca
lcul
atio
n.
2009
20
10-
2011
2011
-20
12-
2013
2014
-20
15-
2016
2016
-20
17-
2018
2017
-20
18-
2019
Social
22
Shar
e of
boa
rd
mem
bers
of
rese
arch
fund
ing
orga
nisa
tions
(%
W, M
)
Shar
e of
mem
bers
of
the
high
est
deci
sion
mak
ing
bodi
es o
f re
sear
ch f
undi
ng
orga
nisa
tions
(thr
ee-y
ear a
vera
ge).
EIG
E, G
ende
r St
atis
tics
Data
base
, WM
IDEI
GE
calc
ulat
ion.
2017
2017
2017
2017
-20
18 IT
: on
ly 2
017
2017
-20
18-
2019
IT
, RO
: on
ly 2
018
(bre
ak
in ti
me
serie
s)
23
Shar
e of
boa
rd
mem
bers
in
publ
icly
ow
ned
broa
dcas
ting
orga
nisa
tions
(%
W, M
)
Shar
e of
boa
rd m
embe
rs in
pub
licly
ow
ned
broa
dcas
ting
orga
nisa
tions
(thr
eey
ear
aver
age)
.
EIG
E, G
ende
r St
atis
tics
Data
base
, WM
IDEI
GE
calc
ulat
ion.
2014
2014
2014
-20
15-
2016
2016
-20
17-
2018
2017
-20
18-
2019
24
Shar
e of
mem
bers
of
hig
hest
dec
ision
-m
akin
g bo
dy o
f the
na
tiona
l Olym
pic
spor
t org
anisa
tions
(%
W, M
)
Shar
e of
mem
bers
of h
ighe
st d
ecisi
onm
akin
g bo
dy o
f the
10
mos
t pop
ular
nat
iona
l O
lym
pic
spor
t org
anis
atio
ns (t
hree
yea
r ave
rage
).
EIG
E, G
ende
r St
atis
tics
Data
base
, WM
IDEI
GE
calc
ulat
ion.
2015
2015
2015
2015
-20
1820
15-
2018
-20
19
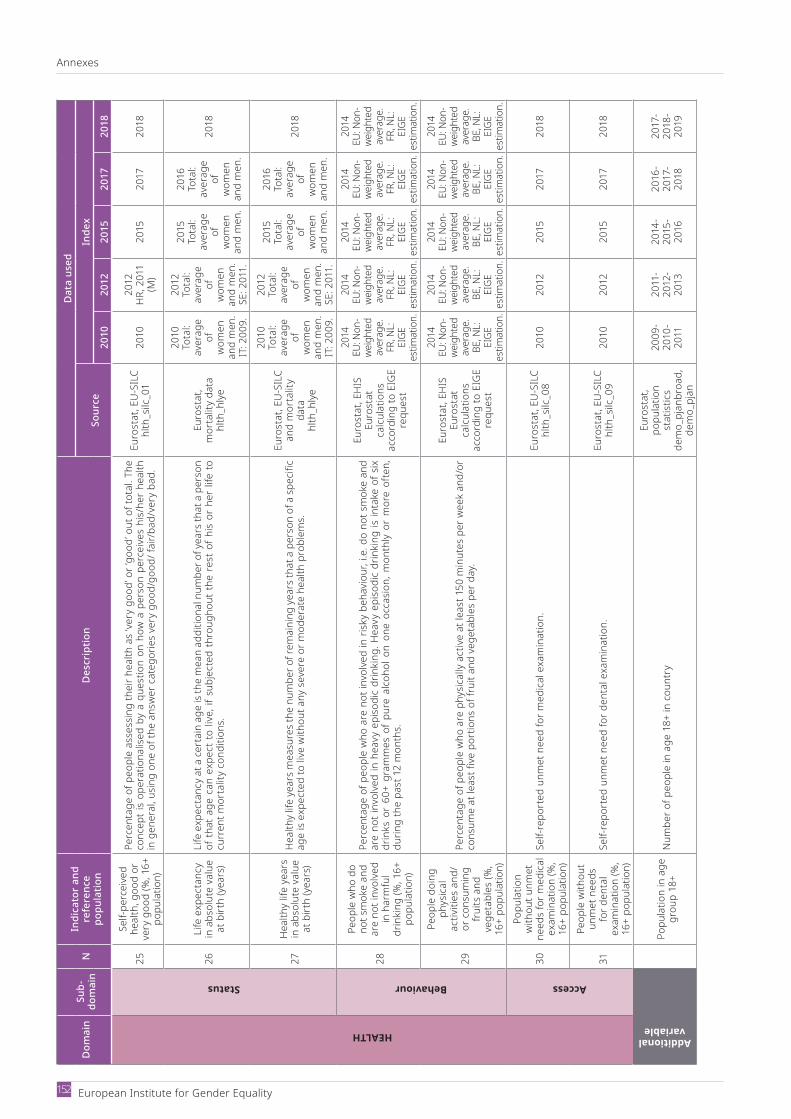
Annexes
European Institute for Gender Equality 152
Dom
ain
Sub-
dom
ain
NIn
dica
tor
and
refe
renc
e po
pula
tion
Des
crip
tion
Dat
a us
ed
Sour
ceIn
dex
2010
2012
2015
2017
2018
HEALTH
Status25
Self
perc
eive
d he
alth
, goo
d or
ve
ry g
ood
(%, 1
6+
popu
latio
n)
Perc
enta
ge o
f peo
ple
asse
ssin
g th
eir h
ealth
as
‘very
goo
d’ o
r ‘go
od’ o
ut o
f tot
al. T
he
conc
ept i
s op
erat
iona
lised
by
a qu
estio
n on
how
a p
erso
n pe
rcei
ves
his/
her
heal
th
in g
ener
al, u
sing
one
of th
e an
swer
cat
egor
ies
very
goo
d/go
od/ f
air/
bad/
very
bad
.Eu
rost
at, E
US
ILC
hlth
_silc
_01
2010
2012
HR,
201
1 (M
)20
1520
1720
18
26Li
fe e
xpec
tanc
y in
abs
olut
e va
lue
at b
irth
(yea
rs)
Life
exp
ecta
ncy
at a
cer
tain
age
is th
e m
ean
addi
tiona
l num
ber o
f yea
rs th
at a
per
son
of t
hat
age
can
expe
ct t
o liv
e, if
sub
ject
ed t
hrou
ghou
t th
e re
st o
f his
or h
er li
fe t
o cu
rren
t mor
talit
y co
nditi
ons.
Euro
stat
, m
orta
lity
data
hlth
_hly
e
2010
Tota
l: av
erag
e of
w
omen
an
d m
en.
IT: 2
009.
2012
Tota
l: av
erag
e of
w
omen
an
d m
en.
SE: 2
011.
2015
Tota
l: av
erag
e of
w
omen
an
d m
en.
2016
Tota
l: av
erag
e of
w
omen
an
d m
en.
2018
27H
ealth
y lif
e ye
ars
in a
bsol
ute
valu
e at
birt
h (y
ears
)H
ealth
y lif
e ye
ars
mea
sure
s th
e nu
mbe
r of r
emai
ning
yea
rs th
at a
per
son
of a
spe
cific
ag
e is
expe
cted
to li
ve w
ithou
t any
sev
ere
or m
oder
ate
heal
th p
robl
ems.
Euro
stat
, EU
SIL
C an
d m
orta
lity
data
hlth
_hly
e
2010
Tota
l: av
erag
e of
w
omen
an
d m
en.
IT: 2
009.
2012
Tota
l: av
erag
e of
w
omen
an
d m
en.
SE: 2
011.
2015
Tota
l: av
erag
e of
w
omen
an
d m
en.
2016
Tota
l: av
erag
e of
w
omen
an
d m
en.
2018
Behaviour
28
Peop
le w
ho d
o no
t sm
oke
and
are
not i
nvol
ved
in h
arm
ful
drin
king
(%, 1
6+
popu
latio
n)
Perc
enta
ge o
f peo
ple
who
are
not
invo
lved
in r
isky
beha
viou
r, i.e
. do
not s
mok
e an
d ar
e no
t inv
olve
d in
hea
vy e
piso
dic
drin
king
. Hea
vy e
piso
dic
drin
king
is in
take
of s
ix
drin
ks o
r 60
+ gr
amm
es o
f pu
re a
lcoh
ol o
n on
e oc
casio
n, m
onth
ly o
r m
ore
ofte
n,
durin
g th
e pa
st 1
2 m
onth
s.
Euro
stat
, EH
ISEu
rost
at
calc
ulat
ions
ac
cord
ing
to E
IGE
requ
est
2014
EU: N
on-
weig
hted
av
erag
e.FR
, NL:
EI
GE
estim
atio
n.
2014
EU: N
on-
weig
hted
av
erag
e.FR
, NL:
EI
GE
estim
atio
n.
2014
EU: N
on-
weig
hted
av
erag
e.FR
, NL:
EI
GE
estim
atio
n.
2014
EU: N
on-
weig
hted
av
erag
e.FR
, NL:
EI
GE
estim
atio
n.
2014
EU: N
on-
weig
hted
av
erag
e.FR
, NL:
EI
GE
estim
atio
n.
29
Peop
le d
oing
ph
ysic
al
activ
ities
and
/or
con
sum
ing
frui
ts a
nd
vege
tabl
es (%
, 16
+ po
pula
tion)
Perc
enta
ge o
f peo
ple
who
are
phy
sical
ly a
ctiv
e at
leas
t 150
min
utes
per
wee
k an
d/or
co
nsum
e at
leas
t five
por
tions
of f
ruit
and
vege
tabl
es p
er d
ay.
Euro
stat
, EH
ISEu
rost
at
calc
ulat
ions
ac
cord
ing
to E
IGE
requ
est
2014
EU: N
on-
weig
hted
av
erag
e.BE
, NL:
EI
GE
estim
atio
n.
2014
EU: N
on-
weig
hted
av
erag
e.BE
, NL:
EI
GE
estim
atio
n.
2014
EU: N
on-
weig
hted
av
erag
e.BE
, NL:
EI
GE
estim
atio
n.
2014
EU: N
on-
weig
hted
av
erag
e.BE
, NL:
EI
GE
estim
atio
n.
2014
EU: N
on-
weig
hted
av
erag
e.BE
, NL:
EI
GE
estim
atio
n.
Access
30
Popu
latio
n w
ithou
t unm
et
need
s fo
r med
ical
ex
amin
atio
n (%
, 16
+ po
pula
tion)
Self
repo
rted
unm
et n
eed
for m
edic
al e
xam
inat
ion.
Euro
stat
, EU
SIL
Chl
th_s
ilc_0
820
1020
1220
1520
1720
18
31
Peop
le w
ithou
t un
met
nee
ds
for d
enta
l ex
amin
atio
n (%
, 16
+ po
pula
tion)
Self
repo
rted
unm
et n
eed
for d
enta
l exa
min
atio
n.
Euro
stat
, EU
SIL
Chl
th_s
ilc_0
920
1020
1220
1520
1720
18
Additional variable
Popu
latio
n in
age
gr
oup
18+
Num
ber o
f peo
ple
in a
ge 1
8+ in
cou
ntry
Euro
stat
, po
pula
tion
stat
istic
sde
mo_
pjan
broa
d,
dem
o_pj
an
2009
20
10-
2011
2011
-20
12-
2013
2014
-20
15-
2016
2016
-20
17-
2018
2017
-20
18-
2019

Gender Equality Index 2020 — Digi talisation and the future of work
Annexes
153
Annex 2. Gender Equality Index scoresTable 3. Gender Equality Index scores, ranks and changes in score by EU Member State, 2010, 2012, 2015, 2017, 2018
MSScores (points) Ranks Changes in score
2010 2012 2015 2017 2018 2010 2012 2015 2017 2018 2010 to 2018 2017 to 2018
EU 63.8 65.0 66.2 67.4 67.9 – – – – – 4.1 0.5
BE 69.3 70.2 70.5 71.1 71.4 5 5 7 8 9 2.1 0.3
BG 55.0 56.9 58.0 58.8 59.6 17 15 16 19 19 4.6 0.8
CZ 55.6 56.7 53.6 55.7 56.2 14 17 23 21 23 0.6 0.5
DK 75.2 75.6 76.8 77.5 77.4 2 2 2 2 2 2.2 –0.1
DE 62.6 64.9 65.5 66.9 67.5 11 12 12 12 12 4.9 0.6
EE 53.4 53.5 56.7 59.8 60.7 21 22 20 17 18 7.3 0.9
IE 65.4 67.7 69.5 71.3 72.2 9 8 8 7 7 6.8 0.9
EL 48.6 50.1 50.0 51.2 52.2 28 28 28 28 28 3.6 1.0
ES 66.4 67.4 68.3 70.1 72.0 8 9 11 9 8 5.6 1.9
FR 67.5 68.9 72.6 74.6 75.1 7 6 5 3 3 7.6 0.5
HR 52.3 52.6 53.1 55.6 57.9 25 23 24 22 20 5.6 2.3
IT 53.3 56.5 62.1 63.0 63.5 22 18 14 14 14 10.2 0.5
CY 49.0 50.6 55.1 56.3 56.9 27 27 22 20 21 7.9 0.6
LV 55.2 56.2 57.9 59.7 60.8 16 19 17 18 17 5.6 1.1
LT 54.9 54.2 56.8 55.5 56.3 18 21 19 23 22 1.4 0.8
LU 61.2 65.9 69.0 69.2 70.3 12 11 9 10 10 9.1 1.1
HU 52.4 51.8 50.8 51.9 53.0 24 25 27 27 27 0.6 1.1
MT 54.4 57.8 60.1 62.5 63.4 19 14 15 15 15 9.0 0.9
NL 74.0 74.0 72.9 72.1 74.1 3 4 4 6 5 0.1 2.0
AT 58.7 61.3 63.3 65.3 66.5 13 13 13 13 13 7.8 1.2
PL 55.5 56.9 56.8 55.2 55.8 15 16 18 24 24 0.3 0.6
PT 53.7 54.4 56.0 59.9 61.3 20 20 21 16 16 7.6 1.4
RO 50.8 51.2 52.4 54.5 54.4 26 26 25 25 26 3.6 –0.1
SI 62.7 66.1 68.4 68.3 67.7 10 10 10 11 11 5.0 –0.6
SK 53.0 52.4 52.4 54.1 55.5 23 24 26 26 25 2.5 1.4
FI 73.1 74.4 73.0 73.4 74.7 4 3 3 4 4 1.6 1.3
SE 80.1 79.7 82.6 83.6 83.8 1 1 1 1 1 3.7 0.2
UK 68.7 68.9 71.5 72.2 72.7 6 7 6 5 6 4.0 0.5
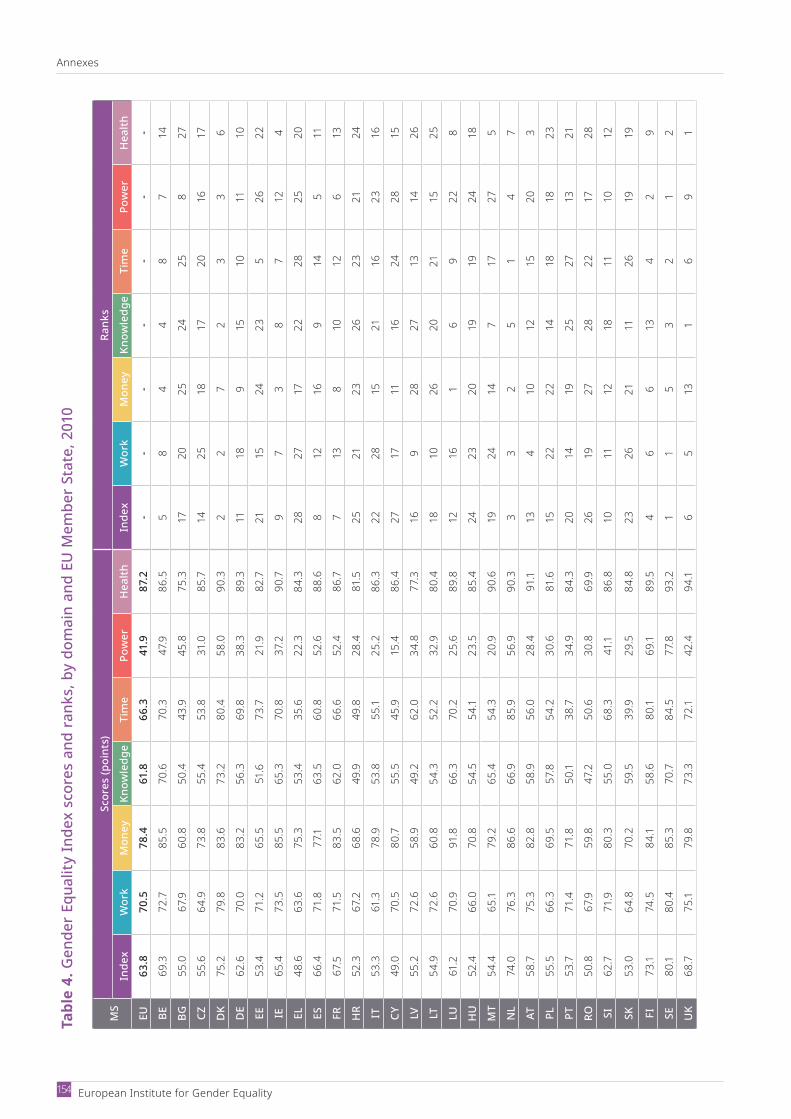
Annexes
European Institute for Gender Equality 154
Tabl
e 4.
Gen
der
Equa
lity
Inde
x sc
ores
and
ran
ks, b
y do
mai
n an
d EU
Mem
ber
Stat
e, 2
010
MS
Scor
es (p
oint
s)Ra
nks
Inde
xW
ork
Mon
eyKn
owle
dge
Tim
ePo
wer
Hea
lthIn
dex
Wor
kM
oney
Know
ledg
eTi
me
Pow
erH
ealth
EU63
.870
.578
.461
.866
.341
.987
.2-
--
--
--
BE69
.372
.785
.570
.670
.347
.986
.55
84
48
714
BG55
.067
.960
.850
.443
.945
.875
.317
2025
2425
827
CZ55
.664
.973
.855
.453
.831
.085
.714
2518
1720
1617
DK
75.2
79.8
83.6
73.2
80.4
58.0
90.3
22
72
33
6
DE
62.6
70.0
83.2
56.3
69.8
38.3
89.3
1118
915
1011
10
EE53
.471
.265
.551
.673
.721
.982
.721
1524
235
2622
IE65
.473
.585
.565
.370
.837
.290
.79
73
87
124
EL48
.663
.675
.353
.435
.622
.384
.328
2717
2228
2520
ES66
.471
.877
.163
.560
.852
.688
.68
1216
914
511
FR67
.571
.583
.562
.066
.652
.486
.77
138
1012
613
HR
52.3
67.2
68.6
49.9
49.8
28.4
81.5
2521
2326
2321
24
IT53
.361
.378
.953
.855
.125
.286
.322
2815
2116
2316
CY49
.070
.580
.755
.545
.915
.486
.427
1711
1624
2815
LV55
.272
.658
.949
.262
.034
.877
.316
928
2713
1426
LT54
.972
.660
.854
.352
.232
.980
.418
1026
2021
1525
LU61
.270
.991
.866
.370
.225
.689
.812
161
69
228
HU
52.4
66.0
70.8
54.5
54.1
23.5
85.4
2423
2019
1924
18
MT
54.4
65.1
79.2
65.4
54.3
20.9
90.6
1924
147
1727
5
NL
74.0
76.3
86.6
66.9
85.9
56.9
90.3
33
25
14
7
AT58
.775
.382
.858
.956
.028
.491
.113
410
1215
203
PL55
.566
.369
.557
.854
.230
.681
.615
2222
1418
1823
PT53
.771
.471
.850
.138
.734
.984
.320
1419
2527
1321
RO50
.867
.959
.847
.250
.630
.869
.926
1927
2822
1728
SI62
.771
.980
.355
.068
.341
.186
.810
1112
1811
1012
SK53
.064
.870
.259
.539
.929
.584
.823
2621
1126
1919
FI73
.174
.584
.158
.680
.169
.189
.54
66
134
29
SE80
.180
.485
.370
.784
.577
.893
.21
15
32
12
UK
68.7
75.1
79.8
73.3
72.1
42.4
94.1
65
131
69
1
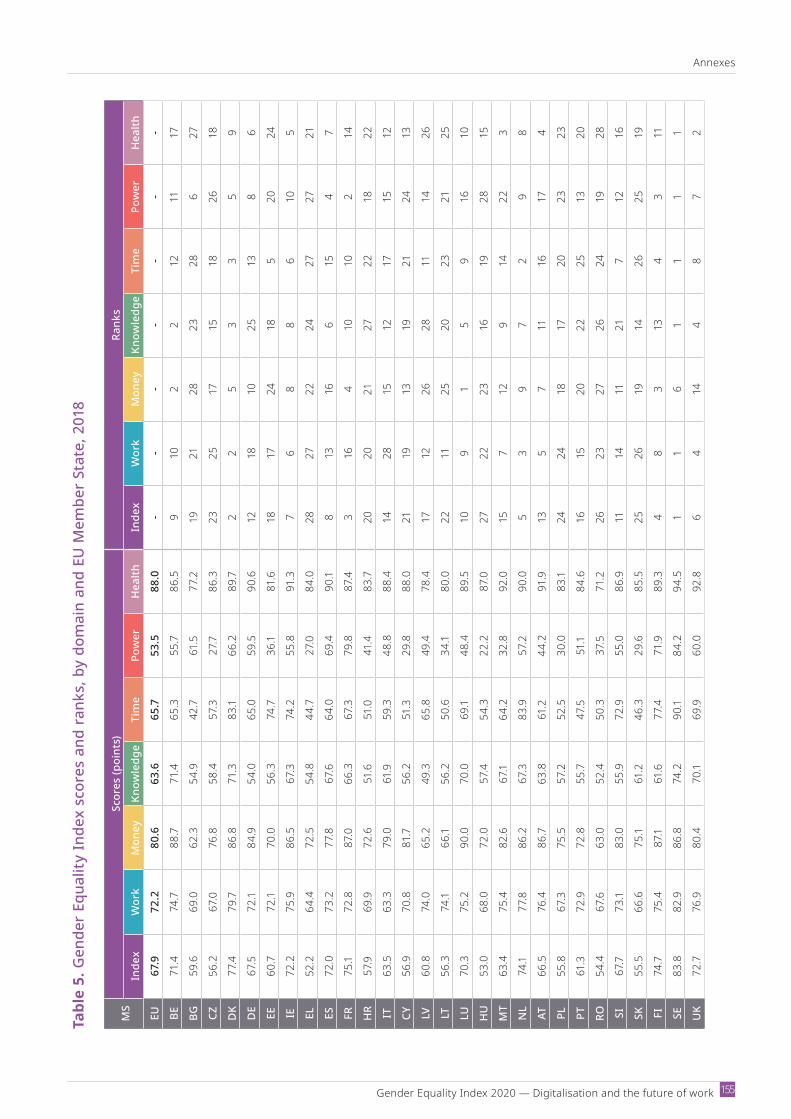
Gender Equality Index 2020 — Digi talisation and the future of work
Annexes
155
Tabl
e 5.
Gen
der
Equa
lity
Inde
x sc
ores
and
ran
ks, b
y do
mai
n an
d EU
Mem
ber
Stat
e, 2
018
MS
Scor
es (p
oint
s)Ra
nks
Inde
xW
ork
Mon
eyKn
owle
dge
Tim
ePo
wer
Hea
lthIn
dex
Wor
kM
oney
Know
ledg
eTi
me
Pow
erH
ealth
EU67
.972
.280
.663
.665
.753
.588
.0-
--
--
--
BE71
.474
.788
.771
.465
.355
.786
.59
102
212
1117
BG59
.669
.062
.354
.942
.761
.577
.219
2128
2328
627
CZ56
.267
.076
.858
.457
.327
.786
.323
2517
1518
2618
DK
77.4
79.7
86.8
71.3
83.1
66.2
89.7
22
53
35
9
DE
67.5
72.1
84.9
54.0
65.0
59.5
90.6
1218
1025
138
6
EE60
.772
.170
.056
.374
.736
.181
.618
1724
185
2024
IE72
.275
.986
.567
.374
.255
.891
.37
68
86
105
EL52
.264
.472
.554
.844
.727
.084
.028
2722
2427
2721
ES72
.073
.277
.867
.664
.069
.490
.18
1316
615
47
FR75
.172
.887
.066
.367
.379
.887
.43
164
1010
214
HR
57.9
69.9
72.6
51.6
51.0
41.4
83.7
2020
2127
2218
22
IT63
.563
.379
.061
.959
.348
.888
.414
2815
1217
1512
CY56
.970
.881
.756
.251
.329
.888
.021
1913
1921
2413
LV60
.874
.065
.249
.365
.849
.478
.417
1226
2811
1426
LT56
.374
.166
.156
.250
.634
.180
.022
1125
2023
2125
LU70
.375
.290
.070
.069
.148
.489
.510
91
59
1610
HU
53.0
68.0
72.0
57.4
54.3
22.2
87.0
2722
2316
1928
15
MT
63.4
75.4
82.6
67.1
64.2
32.8
92.0
157
129
1422
3
NL
74.1
77.8
86.2
67.3
83.9
57.2
90.0
53
97
29
8
AT66
.576
.486
.763
.861
.244
.291
.913
57
1116
174
PL55
.867
.375
.557
.252
.530
.083
.124
2418
1720
2323
PT61
.372
.972
.855
.747
.551
.184
.616
1520
2225
1320
RO54
.467
.663
.052
.450
.337
.571
.226
2327
2624
1928
SI67
.773
.183
.055
.972
.955
.086
.911
1411
217
1216
SK55
.566
.675
.161
.246
.329
.685
.525
2619
1426
2519
FI74
.775
.487
.161
.677
.471
.989
.34
83
134
311
SE83
.882
.986
.874
.290
.184
.294
.51
16
11
11
UK
72.7
76.9
80.4
70.1
69.9
60.0
92.8
64
144
87
2
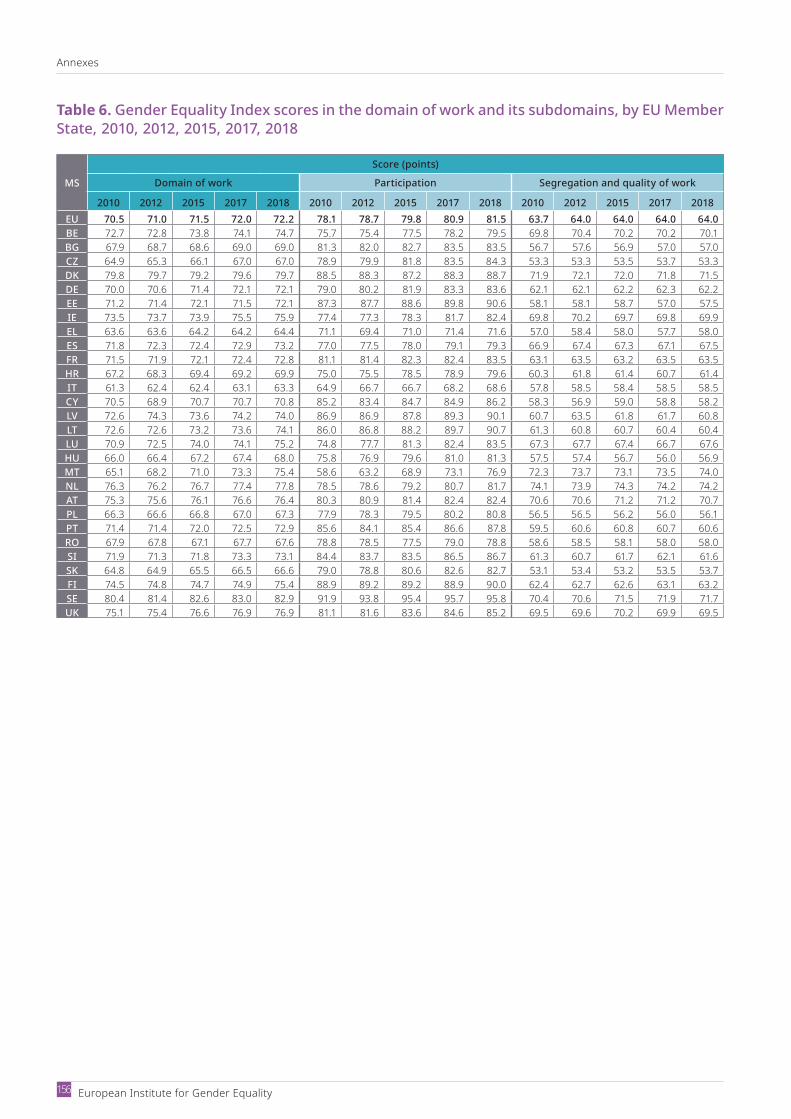
Annexes
European Institute for Gender Equality 156
Table 6. Gender Equality Index scores in the domain of work and its subdomains, by EU Member State, 2010, 2012, 2015, 2017, 2018
MS
Score (points)
Domain of work Participation Segregation and quality of work
2010 2012 2015 2017 2018 2010 2012 2015 2017 2018 2010 2012 2015 2017 2018EU 70.5 71.0 71.5 72.0 72.2 78.1 78.7 79.8 80.9 81.5 63.7 64.0 64.0 64.0 64.0BE 72.7 72.8 73.8 74.1 74.7 75.7 75.4 77.5 78.2 79.5 69.8 70.4 70.2 70.2 70.1BG 67.9 68.7 68.6 69.0 69.0 81.3 82.0 82.7 83.5 83.5 56.7 57.6 56.9 57.0 57.0CZ 64.9 65.3 66.1 67.0 67.0 78.9 79.9 81.8 83.5 84.3 53.3 53.3 53.5 53.7 53.3DK 79.8 79.7 79.2 79.6 79.7 88.5 88.3 87.2 88.3 88.7 71.9 72.1 72.0 71.8 71.5DE 70.0 70.6 71.4 72.1 72.1 79.0 80.2 81.9 83.3 83.6 62.1 62.1 62.2 62.3 62.2EE 71.2 71.4 72.1 71.5 72.1 87.3 87.7 88.6 89.8 90.6 58.1 58.1 58.7 57.0 57.5IE 73.5 73.7 73.9 75.5 75.9 77.4 77.3 78.3 81.7 82.4 69.8 70.2 69.7 69.8 69.9EL 63.6 63.6 64.2 64.2 64.4 71.1 69.4 71.0 71.4 71.6 57.0 58.4 58.0 57.7 58.0ES 71.8 72.3 72.4 72.9 73.2 77.0 77.5 78.0 79.1 79.3 66.9 67.4 67.3 67.1 67.5FR 71.5 71.9 72.1 72.4 72.8 81.1 81.4 82.3 82.4 83.5 63.1 63.5 63.2 63.5 63.5HR 67.2 68.3 69.4 69.2 69.9 75.0 75.5 78.5 78.9 79.6 60.3 61.8 61.4 60.7 61.4IT 61.3 62.4 62.4 63.1 63.3 64.9 66.7 66.7 68.2 68.6 57.8 58.5 58.4 58.5 58.5CY 70.5 68.9 70.7 70.7 70.8 85.2 83.4 84.7 84.9 86.2 58.3 56.9 59.0 58.8 58.2LV 72.6 74.3 73.6 74.2 74.0 86.9 86.9 87.8 89.3 90.1 60.7 63.5 61.8 61.7 60.8LT 72.6 72.6 73.2 73.6 74.1 86.0 86.8 88.2 89.7 90.7 61.3 60.8 60.7 60.4 60.4LU 70.9 72.5 74.0 74.1 75.2 74.8 77.7 81.3 82.4 83.5 67.3 67.7 67.4 66.7 67.6HU 66.0 66.4 67.2 67.4 68.0 75.8 76.9 79.6 81.0 81.3 57.5 57.4 56.7 56.0 56.9MT 65.1 68.2 71.0 73.3 75.4 58.6 63.2 68.9 73.1 76.9 72.3 73.7 73.1 73.5 74.0NL 76.3 76.2 76.7 77.4 77.8 78.5 78.6 79.2 80.7 81.7 74.1 73.9 74.3 74.2 74.2AT 75.3 75.6 76.1 76.6 76.4 80.3 80.9 81.4 82.4 82.4 70.6 70.6 71.2 71.2 70.7PL 66.3 66.6 66.8 67.0 67.3 77.9 78.3 79.5 80.2 80.8 56.5 56.5 56.2 56.0 56.1PT 71.4 71.4 72.0 72.5 72.9 85.6 84.1 85.4 86.6 87.8 59.5 60.6 60.8 60.7 60.6RO 67.9 67.8 67.1 67.7 67.6 78.8 78.5 77.5 79.0 78.8 58.6 58.5 58.1 58.0 58.0SI 71.9 71.3 71.8 73.3 73.1 84.4 83.7 83.5 86.5 86.7 61.3 60.7 61.7 62.1 61.6SK 64.8 64.9 65.5 66.5 66.6 79.0 78.8 80.6 82.6 82.7 53.1 53.4 53.2 53.5 53.7FI 74.5 74.8 74.7 74.9 75.4 88.9 89.2 89.2 88.9 90.0 62.4 62.7 62.6 63.1 63.2SE 80.4 81.4 82.6 83.0 82.9 91.9 93.8 95.4 95.7 95.8 70.4 70.6 71.5 71.9 71.7UK 75.1 75.4 76.6 76.9 76.9 81.1 81.6 83.6 84.6 85.2 69.5 69.6 70.2 69.9 69.5

Gender Equality Index 2020 — Digi talisation and the future of work
Annexes
157
Table 7. Gender Equality Index scores in the domain of money and its subdomains, by EU Member State, 2010, 2012, 2015, 2017, 2018
MS
Score (points)
Domain of money Financial resources Economic situation
2010 2012 2015 2017 2018 2010 2012 2015 2017 2018 2010 2012 2015 2017 2018EU 78.4 78.4 79.6 80.4 80.6 69.4 70.0 73.0 73.8 74.3 88.6 87.9 86.7 87.7 87.5BE 85.5 85.6 87.5 88.3 88.7 77.9 78.6 82.7 83.3 83.8 94.0 93.3 92.6 93.6 93.8BG 60.8 60.5 61.9 61.8 62.3 44.7 44.2 48.2 50.2 49.6 82.8 82.7 79.5 76.1 78.2CZ 73.8 74.0 75.9 76.7 76.8 55.1 55.8 58.8 59.8 60.4 98.7 98.1 98.1 98.2 97.6DK 83.6 85.7 86.6 87.1 86.8 78.3 80.4 82.4 83.2 83.3 89.3 91.4 91.1 91.2 90.5DE 83.2 84.0 84.2 86.0 84.9 77.1 78.1 81.2 82.1 82.9 89.8 90.2 87.4 90.1 86.9EE 65.5 64.9 66.7 69.4 70.0 49.5 50.2 56.4 58.3 59.3 86.7 84.0 79.0 82.5 82.7IE 85.5 84.4 84.7 85.5 86.5 81.1 80.7 81.0 81.7 83.3 90.2 88.2 88.6 89.5 89.8EL 75.3 71.1 70.7 71.4 72.5 66.7 62.7 61.4 61.3 61.4 84.9 80.7 81.4 83.2 85.6ES 77.1 76.0 75.9 76.7 77.8 70.4 69.6 71.0 72.2 72.3 84.4 82.9 81.2 81.4 83.6FR 83.5 83.7 86.1 86.4 87.0 75.9 77.2 80.4 81.0 80.9 91.8 90.6 92.3 92.1 93.5HR 68.6 68.9 69.9 72.2 72.6 56.2 55.7 57.1 60.1 60.6 83.8 85.2 85.6 86.9 86.9IT 78.9 78.7 78.6 78.8 79.0 72.5 72.8 73.0 74.4 74.8 86.0 85.1 84.6 83.5 83.4CY 80.7 81.7 79.2 80.8 81.7 74.8 76.4 72.1 72.8 72.8 87.1 87.4 87.1 89.7 91.6LV 58.9 59.6 64.3 65.5 65.2 43.5 43.5 51.9 53.7 54.6 79.8 81.5 79.5 80.0 78.0LT 60.8 64.3 65.6 64.7 66.1 47.8 48.4 53.5 55.0 56.0 77.3 85.5 80.4 76.1 78.0LU 91.8 92.1 94.4 91.8 90.0 91.2 91.6 97.0 96.8 97.3 92.5 92.7 92.0 87.2 83.2HU 70.8 69.8 70.7 71.6 72.0 51.0 52.5 55.2 55.5 56.2 98.3 92.9 90.5 92.5 92.2MT 79.2 80.6 82.4 82.5 82.6 68.6 69.5 73.3 74.4 74.8 91.3 93.3 92.8 91.4 91.1NL 86.6 87.0 86.8 86.7 86.2 77.7 77.6 79.1 80.4 80.4 96.5 97.5 95.4 93.5 92.4AT 82.8 83.6 85.9 86.4 86.7 74.7 75.8 79.8 81.4 80.9 91.8 92.2 92.5 91.7 93.1PL 69.5 70.3 73.3 75.1 75.5 54.6 56.2 61.4 62.8 63.0 88.5 88.0 87.5 89.9 90.5PT 71.8 71.7 70.9 72.1 72.8 60.4 60.7 60.3 61.2 61.2 85.3 84.8 83.5 84.8 86.8RO 59.8 59.2 59.4 62.0 63.0 42.5 42.7 45.7 47.2 49.3 84.2 82.1 77.3 81.6 80.4SI 80.3 81.3 81.6 82.4 83.0 67.3 68.3 69.8 70.0 70.7 95.8 96.7 95.5 97.1 97.4SK 70.2 72.1 74.0 74.2 75.1 51.9 53.9 56.4 56.8 57.1 95.1 96.4 97.2 96.9 98.8FI 84.1 84.8 86.4 87.6 87.1 74.6 76.2 78.5 79.2 79.4 94.9 94.4 95.2 96.9 95.5SE 85.3 85.3 87.5 86.8 86.8 75.9 77.4 82.3 82.1 82.0 95.8 93.9 93.1 91.9 91.9UK 79.8 80.5 81.2 81.6 80.4 74.4 75.1 77.0 77.1 76.9 85.7 86.3 85.6 86.4 84.0
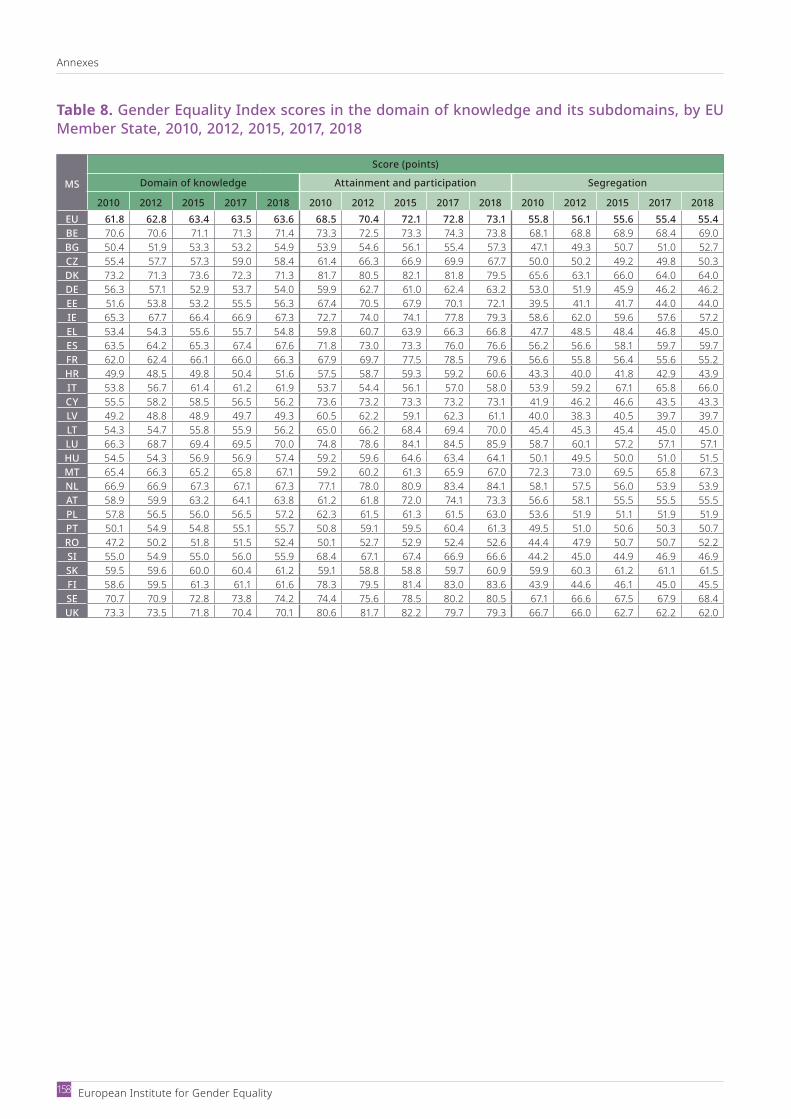
Annexes
European Institute for Gender Equality 158
Table 8. Gender Equality Index scores in the domain of knowledge and its subdomains, by EU Member State, 2010, 2012, 2015, 2017, 2018
MS
Score (points)
Domain of knowledge Attainment and participation Segregation
2010 2012 2015 2017 2018 2010 2012 2015 2017 2018 2010 2012 2015 2017 2018EU 61.8 62.8 63.4 63.5 63.6 68.5 70.4 72.1 72.8 73.1 55.8 56.1 55.6 55.4 55.4BE 70.6 70.6 71.1 71.3 71.4 73.3 72.5 73.3 74.3 73.8 68.1 68.8 68.9 68.4 69.0BG 50.4 51.9 53.3 53.2 54.9 53.9 54.6 56.1 55.4 57.3 47.1 49.3 50.7 51.0 52.7CZ 55.4 57.7 57.3 59.0 58.4 61.4 66.3 66.9 69.9 67.7 50.0 50.2 49.2 49.8 50.3DK 73.2 71.3 73.6 72.3 71.3 81.7 80.5 82.1 81.8 79.5 65.6 63.1 66.0 64.0 64.0DE 56.3 57.1 52.9 53.7 54.0 59.9 62.7 61.0 62.4 63.2 53.0 51.9 45.9 46.2 46.2EE 51.6 53.8 53.2 55.5 56.3 67.4 70.5 67.9 70.1 72.1 39.5 41.1 41.7 44.0 44.0IE 65.3 67.7 66.4 66.9 67.3 72.7 74.0 74.1 77.8 79.3 58.6 62.0 59.6 57.6 57.2EL 53.4 54.3 55.6 55.7 54.8 59.8 60.7 63.9 66.3 66.8 47.7 48.5 48.4 46.8 45.0ES 63.5 64.2 65.3 67.4 67.6 71.8 73.0 73.3 76.0 76.6 56.2 56.6 58.1 59.7 59.7FR 62.0 62.4 66.1 66.0 66.3 67.9 69.7 77.5 78.5 79.6 56.6 55.8 56.4 55.6 55.2HR 49.9 48.5 49.8 50.4 51.6 57.5 58.7 59.3 59.2 60.6 43.3 40.0 41.8 42.9 43.9IT 53.8 56.7 61.4 61.2 61.9 53.7 54.4 56.1 57.0 58.0 53.9 59.2 67.1 65.8 66.0CY 55.5 58.2 58.5 56.5 56.2 73.6 73.2 73.3 73.2 73.1 41.9 46.2 46.6 43.5 43.3LV 49.2 48.8 48.9 49.7 49.3 60.5 62.2 59.1 62.3 61.1 40.0 38.3 40.5 39.7 39.7LT 54.3 54.7 55.8 55.9 56.2 65.0 66.2 68.4 69.4 70.0 45.4 45.3 45.4 45.0 45.0LU 66.3 68.7 69.4 69.5 70.0 74.8 78.6 84.1 84.5 85.9 58.7 60.1 57.2 57.1 57.1HU 54.5 54.3 56.9 56.9 57.4 59.2 59.6 64.6 63.4 64.1 50.1 49.5 50.0 51.0 51.5MT 65.4 66.3 65.2 65.8 67.1 59.2 60.2 61.3 65.9 67.0 72.3 73.0 69.5 65.8 67.3NL 66.9 66.9 67.3 67.1 67.3 77.1 78.0 80.9 83.4 84.1 58.1 57.5 56.0 53.9 53.9AT 58.9 59.9 63.2 64.1 63.8 61.2 61.8 72.0 74.1 73.3 56.6 58.1 55.5 55.5 55.5PL 57.8 56.5 56.0 56.5 57.2 62.3 61.5 61.3 61.5 63.0 53.6 51.9 51.1 51.9 51.9PT 50.1 54.9 54.8 55.1 55.7 50.8 59.1 59.5 60.4 61.3 49.5 51.0 50.6 50.3 50.7RO 47.2 50.2 51.8 51.5 52.4 50.1 52.7 52.9 52.4 52.6 44.4 47.9 50.7 50.7 52.2SI 55.0 54.9 55.0 56.0 55.9 68.4 67.1 67.4 66.9 66.6 44.2 45.0 44.9 46.9 46.9SK 59.5 59.6 60.0 60.4 61.2 59.1 58.8 58.8 59.7 60.9 59.9 60.3 61.2 61.1 61.5FI 58.6 59.5 61.3 61.1 61.6 78.3 79.5 81.4 83.0 83.6 43.9 44.6 46.1 45.0 45.5SE 70.7 70.9 72.8 73.8 74.2 74.4 75.6 78.5 80.2 80.5 67.1 66.6 67.5 67.9 68.4UK 73.3 73.5 71.8 70.4 70.1 80.6 81.7 82.2 79.7 79.3 66.7 66.0 62.7 62.2 62.0

Gender Equality Index 2020 — Digi talisation and the future of work
Annexes
159
Table 9. Gender Equality Index scores in the domain of time and its subdomains, by EU Member State, 2010, 2012, 2015, 2017, 2018
MS
Score (points)
Domain of time Care activities Social activities
2010 2012 2015 2017 2018 2010 2012 2015 2017 2018 2010 2012 2015 2017 2018EU 66.3 68.9 65.7 65.7 65.7 67.3 72.6 70.0 70.0 70.0 65.4 65.4 61.6 61.6 61.6BE 70.3 71.8 65.3 65.3 65.3 72.6 75.7 68.9 68.9 68.9 68.1 68.1 61.9 61.9 61.9BG 43.9 47.4 42.7 42.7 42.7 48.6 56.6 55.7 55.7 55.7 39.7 39.7 32.6 32.6 32.6CZ 53.8 55.5 57.3 57.3 57.3 55.8 59.4 56.8 56.8 56.8 51.9 51.9 57.7 57.7 57.7DK 80.4 85.4 83.1 83.1 83.1 75.8 85.5 86.1 86.1 86.1 85.3 85.3 80.2 80.2 80.2DE 69.8 67.8 65.0 65.0 65.0 70.1 66.1 71.3 71.3 71.3 69.6 69.6 59.3 59.3 59.3EE 73.7 70.1 74.7 74.7 74.7 80.7 73.0 85.9 85.9 85.9 67.2 67.2 65.0 65.0 65.0IE 70.8 76.5 74.2 74.2 74.2 69.9 81.6 76.2 76.2 76.2 71.8 71.8 72.1 72.1 72.1EL 35.6 45.2 44.7 44.7 44.7 34.2 55.1 50.9 50.9 50.9 37.1 37.1 39.3 39.3 39.3ES 60.8 65.8 64.0 64.0 64.0 60.9 71.4 74.5 74.5 74.5 60.6 60.6 55.0 55.0 55.0FR 66.6 70.3 67.3 67.3 67.3 70.3 78.5 70.4 70.4 70.4 63.0 63.0 64.4 64.4 64.4HR 49.8 54.7 51.0 51.0 51.0 53.0 63.9 54.4 54.4 54.4 46.7 46.7 47.9 47.9 47.9IT 55.1 61.4 59.3 59.3 59.3 54.5 67.6 61.2 61.2 61.2 55.7 55.7 57.4 57.4 57.4CY 45.9 45.9 51.3 51.3 51.3 52.6 52.7 65.7 65.7 65.7 40.0 40.0 40.0 40.0 40.0LV 62.0 60.8 65.8 65.8 65.8 78.2 75.1 89.8 89.8 89.8 49.2 49.2 48.2 48.2 48.2LT 52.2 55.7 50.6 50.6 50.6 65.4 74.5 64.0 64.0 64.0 41.7 41.7 40.0 40.0 40.0LU 70.2 71.5 69.1 69.1 69.1 72.1 74.8 79.4 79.4 79.4 68.3 68.3 60.2 60.2 60.2HU 54.1 55.2 54.3 54.3 54.3 68.7 71.6 65.0 65.0 65.0 42.6 42.6 45.4 45.4 45.4MT 54.3 58.7 64.2 64.2 64.2 49.7 57.9 69.0 69.0 69.0 59.4 59.4 59.8 59.8 59.8NL 85.9 86.7 83.9 83.9 83.9 76.5 78.0 79.3 79.3 79.3 96.4 96.4 88.7 88.7 88.7AT 56.0 65.3 61.2 61.2 61.2 44.9 61.0 62.7 62.7 62.7 69.8 69.8 59.7 59.7 59.7PL 54.2 55.3 52.5 52.5 52.5 63.0 65.6 64.1 64.1 64.1 46.5 46.5 43.0 43.0 43.0PT 38.7 46.0 47.5 47.5 47.5 49.3 69.5 63.3 63.3 63.3 30.4 30.4 35.7 35.7 35.7RO 50.6 53.2 50.3 50.3 50.3 70.9 78.1 70.7 70.7 70.7 36.2 36.2 35.8 35.8 35.8SI 68.3 72.4 72.9 72.9 72.9 64.5 72.3 69.5 69.5 69.5 72.4 72.4 76.4 76.4 76.4SK 39.9 43.4 46.3 46.3 46.3 52.7 62.5 56.5 56.5 56.5 30.2 30.2 37.9 37.9 37.9FI 80.1 81.0 77.4 77.4 77.4 84.2 86.0 82.2 82.2 82.2 76.3 76.3 72.9 72.9 72.9SE 84.5 83.5 90.1 90.1 90.1 84.6 82.6 90.9 90.9 90.9 84.3 84.3 89.3 89.3 89.3UK 72.1 73.2 69.9 69.9 69.9 78.4 80.8 75.1 75.1 75.1 66.3 66.3 65.1 65.1 65.1
NB: Scores for the domain of time have not changed since the previous edition of the Index because of a lack of new data.

Annexes
European Institute for Gender Equality 160
Table 10. Gender Equality Index scores in the domain of power and its subdomains, by EU Member State, 2010, 2012, 2015, 2017, 2018
MS
Score (points)
Domain of power Political Economic Social
2010 2012 2015 2017 2018 2010 2012 2015 2017 2018 2010 2012 2015 2017 2018 2010 2012 2015 2017 2018EU 41.9 43.5 48.5 51.9 53.5 47.2 48.3 52.7 55.0 56.9 28.9 31.8 39.5 43.6 46.8 53.7 53.7 55.0 58.2 57.6BE 47.9 50.5 53.4 55.2 55.7 65.8 70.0 70.2 67.8 68.1 32.8 36.0 38.0 40.2 41.8 50.9 51.0 57.1 61.7 60.8BG 45.8 49.4 56.0 59.9 61.5 50.3 53.4 49.2 53.8 56.5 27.6 32.7 53.2 59.9 60.0 69.3 69.3 67.0 66.8 68.5CZ 31.0 32.0 22.6 26.1 27.7 30.7 31.7 36.6 37.8 40.0 27.4 29.0 9.2 13.6 16.4 35.6 35.6 34.2 34.3 32.5DK 58.0 57.5 61.5 64.9 66.2 75.1 76.1 71.2 74.2 76.0 47.5 45.6 55.7 56.5 56.0 54.8 54.8 58.7 65.3 68.3DE 38.3 46.0 53.0 56.6 59.5 60.2 59.9 71.5 69.6 67.8 19.0 33.0 42.1 49.7 56.5 49.2 49.1 49.5 52.4 55.0EE 21.9 22.0 28.2 34.6 36.1 34.9 33.7 44.9 48.5 49.3 21.6 22.7 23.2 23.4 24.2 13.9 13.9 21.4 36.5 39.4IE 37.2 40.7 48.6 53.4 55.8 32.9 37.0 39.8 44.1 45.3 21.7 25.4 39.9 46.4 50.0 72.1 71.7 72.4 74.5 76.8EL 22.3 22.3 21.7 24.3 27.0 34.3 30.7 34.7 35.8 36.5 13.6 15.3 12.1 14.9 20.4 23.8 23.6 24.2 27.0 26.4ES 52.6 52.9 57.0 62.0 69.4 73.7 69.7 72.3 76.8 82.5 33.3 35.8 43.5 53.4 64.8 59.4 59.2 58.9 58.1 62.7FR 52.4 55.1 68.2 78.3 79.8 64.1 70.8 77.1 80.8 83.1 41.2 43.2 70.2 82.9 84.6 54.6 54.6 58.4 71.7 72.3HR 28.4 27.3 28.5 34.8 41.4 40.2 40.0 38.7 42.2 45.1 24.8 22.2 19.0 19.8 28.6 22.9 22.9 31.6 50.2 55.1IT 25.2 29.4 45.3 47.6 48.8 31.7 35.8 47.4 47.9 49.3 10.6 14.8 44.7 53.1 54.9 47.8 47.8 43.7 42.5 43.1CY 15.4 17.4 24.7 28.2 29.8 30.1 30.2 25.8 27.5 29.9 4.7 6.8 22.6 23.0 23.0 25.9 25.7 25.8 35.6 38.6LV 34.8 37.9 39.0 44.1 49.4 38.1 43.7 40.5 36.7 40.6 37.5 42.1 44.2 45.6 46.1 29.5 29.5 33.2 51.4 64.3LT 32.9 27.7 36.6 32.5 34.1 34.0 34.8 40.0 40.9 45.5 23.7 13.9 30.1 18.5 18.1 44.3 44.2 40.9 45.3 48.2LU 25.6 34.9 43.5 44.8 48.4 45.3 47.6 51.1 48.9 51.5 5.2 12.5 23.5 28.2 32.1 71.5 71.2 68.2 65.2 68.6HU 23.5 21.9 18.7 20.6 22.2 16.1 15.9 14.3 15.0 17.8 37.8 31.0 22.1 23.1 23.7 21.4 21.5 20.9 25.1 25.8MT 20.9 25.0 27.4 32.2 32.8 30.0 29.1 30.5 32.9 33.1 12.4 21.9 24.4 24.0 24.2 24.5 24.6 27.5 42.2 44.2NL 56.9 56.6 52.9 50.0 57.2 69.5 66.0 70.6 70.6 71.9 40.4 41.8 33.1 29.3 45.9 65.8 65.8 63.4 60.2 56.7AT 28.4 30.8 34.9 39.9 44.2 60.3 60.3 59.1 61.1 65.9 9.3 11.8 17.4 21.1 24.4 40.7 40.8 41.1 49.3 53.7PL 30.6 34.8 35.1 29.1 30.0 36.6 43.5 46.1 43.6 44.3 27.5 33.8 38.2 33.1 34.1 28.6 28.6 24.4 17.0 17.8PT 34.9 29.7 33.9 46.7 51.1 41.9 42.4 48.7 56.7 59.0 20.4 12.6 16.4 36.3 44.9 49.6 49.3 48.9 49.4 50.4RO 30.8 28.8 33.2 38.8 37.5 23.5 26.5 32.9 40.8 41.6 28.0 20.4 21.4 20.5 21.5 44.4 44.4 51.8 69.7 59.3SI 41.1 51.5 60.6 57.6 55.0 44.5 46.3 65.4 67.3 64.4 29.9 56.4 61.5 50.4 44.7 52.3 52.3 55.3 56.2 57.7SK 29.5 25.4 23.1 26.8 29.6 31.0 28.4 29.0 35.3 36.9 34.1 23.7 14.6 17.9 23.3 24.3 24.4 29.1 30.4 30.0FI 69.1 73.2 65.3 66.7 71.9 86.1 86.3 84.8 78.8 83.9 52.5 62.0 47.6 52.5 59.2 73.1 73.2 68.9 71.5 74.8SE 77.8 75.2 79.5 83.4 84.2 92.1 93.0 93.9 95.1 94.9 58.7 52.6 60.8 69.4 71.7 87.1 87.1 87.8 87.9 87.8UK 42.4 42.0 53.0 56.5 60.0 47.5 45.7 53.0 58.7 61.3 22.9 23.0 40.8 50.2 57.1 70.2 70.2 68.8 61.2 61.7
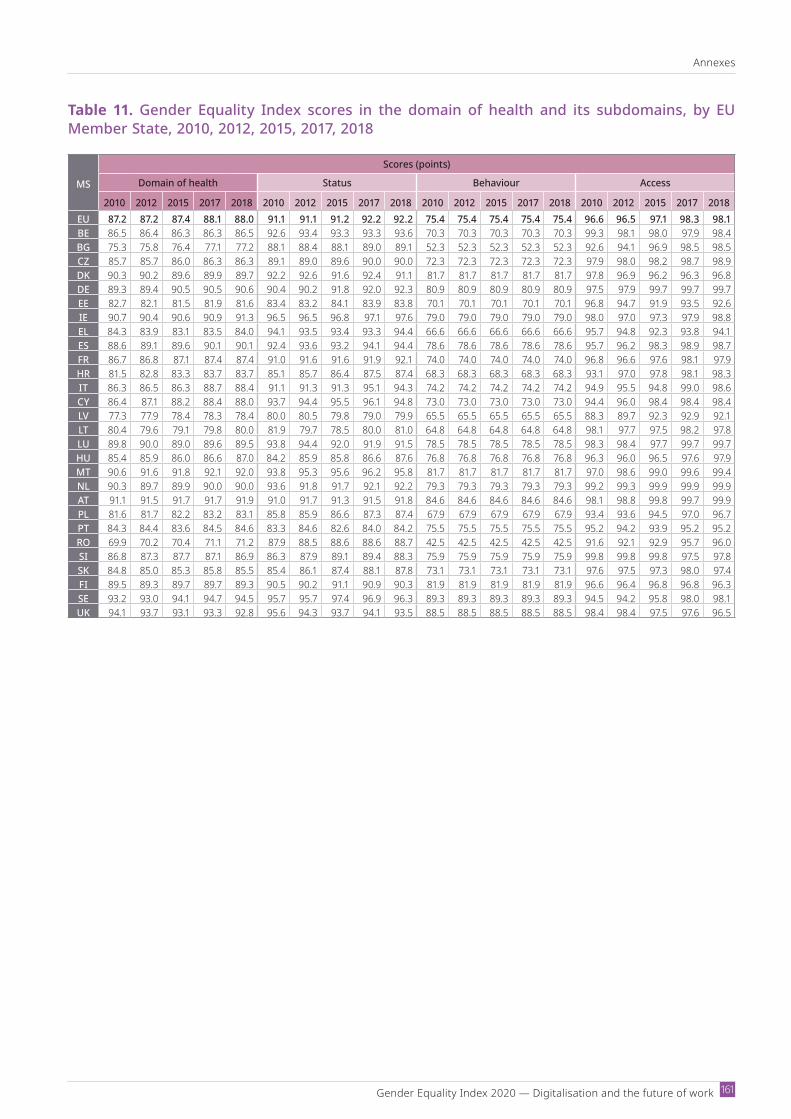
Gender Equality Index 2020 — Digi talisation and the future of work
Annexes
161
Table 11. Gender Equality Index scores in the domain of health and its subdomains, by EU Member State, 2010, 2012, 2015, 2017, 2018
MS
Scores (points)
Domain of health Status Behaviour Access
2010 2012 2015 2017 2018 2010 2012 2015 2017 2018 2010 2012 2015 2017 2018 2010 2012 2015 2017 2018EU 87.2 87.2 87.4 88.1 88.0 91.1 91.1 91.2 92.2 92.2 75.4 75.4 75.4 75.4 75.4 96.6 96.5 97.1 98.3 98.1BE 86.5 86.4 86.3 86.3 86.5 92.6 93.4 93.3 93.3 93.6 70.3 70.3 70.3 70.3 70.3 99.3 98.1 98.0 97.9 98.4BG 75.3 75.8 76.4 77.1 77.2 88.1 88.4 88.1 89.0 89.1 52.3 52.3 52.3 52.3 52.3 92.6 94.1 96.9 98.5 98.5CZ 85.7 85.7 86.0 86.3 86.3 89.1 89.0 89.6 90.0 90.0 72.3 72.3 72.3 72.3 72.3 97.9 98.0 98.2 98.7 98.9DK 90.3 90.2 89.6 89.9 89.7 92.2 92.6 91.6 92.4 91.1 81.7 81.7 81.7 81.7 81.7 97.8 96.9 96.2 96.3 96.8DE 89.3 89.4 90.5 90.5 90.6 90.4 90.2 91.8 92.0 92.3 80.9 80.9 80.9 80.9 80.9 97.5 97.9 99.7 99.7 99.7EE 82.7 82.1 81.5 81.9 81.6 83.4 83.2 84.1 83.9 83.8 70.1 70.1 70.1 70.1 70.1 96.8 94.7 91.9 93.5 92.6IE 90.7 90.4 90.6 90.9 91.3 96.5 96.5 96.8 97.1 97.6 79.0 79.0 79.0 79.0 79.0 98.0 97.0 97.3 97.9 98.8EL 84.3 83.9 83.1 83.5 84.0 94.1 93.5 93.4 93.3 94.4 66.6 66.6 66.6 66.6 66.6 95.7 94.8 92.3 93.8 94.1ES 88.6 89.1 89.6 90.1 90.1 92.4 93.6 93.2 94.1 94.4 78.6 78.6 78.6 78.6 78.6 95.7 96.2 98.3 98.9 98.7FR 86.7 86.8 87.1 87.4 87.4 91.0 91.6 91.6 91.9 92.1 74.0 74.0 74.0 74.0 74.0 96.8 96.6 97.6 98.1 97.9HR 81.5 82.8 83.3 83.7 83.7 85.1 85.7 86.4 87.5 87.4 68.3 68.3 68.3 68.3 68.3 93.1 97.0 97.8 98.1 98.3IT 86.3 86.5 86.3 88.7 88.4 91.1 91.3 91.3 95.1 94.3 74.2 74.2 74.2 74.2 74.2 94.9 95.5 94.8 99.0 98.6CY 86.4 87.1 88.2 88.4 88.0 93.7 94.4 95.5 96.1 94.8 73.0 73.0 73.0 73.0 73.0 94.4 96.0 98.4 98.4 98.4LV 77.3 77.9 78.4 78.3 78.4 80.0 80.5 79.8 79.0 79.9 65.5 65.5 65.5 65.5 65.5 88.3 89.7 92.3 92.9 92.1LT 80.4 79.6 79.1 79.8 80.0 81.9 79.7 78.5 80.0 81.0 64.8 64.8 64.8 64.8 64.8 98.1 97.7 97.5 98.2 97.8LU 89.8 90.0 89.0 89.6 89.5 93.8 94.4 92.0 91.9 91.5 78.5 78.5 78.5 78.5 78.5 98.3 98.4 97.7 99.7 99.7HU 85.4 85.9 86.0 86.6 87.0 84.2 85.9 85.8 86.6 87.6 76.8 76.8 76.8 76.8 76.8 96.3 96.0 96.5 97.6 97.9MT 90.6 91.6 91.8 92.1 92.0 93.8 95.3 95.6 96.2 95.8 81.7 81.7 81.7 81.7 81.7 97.0 98.6 99.0 99.6 99.4NL 90.3 89.7 89.9 90.0 90.0 93.6 91.8 91.7 92.1 92.2 79.3 79.3 79.3 79.3 79.3 99.2 99.3 99.9 99.9 99.9AT 91.1 91.5 91.7 91.7 91.9 91.0 91.7 91.3 91.5 91.8 84.6 84.6 84.6 84.6 84.6 98.1 98.8 99.8 99.7 99.9PL 81.6 81.7 82.2 83.2 83.1 85.8 85.9 86.6 87.3 87.4 67.9 67.9 67.9 67.9 67.9 93.4 93.6 94.5 97.0 96.7PT 84.3 84.4 83.6 84.5 84.6 83.3 84.6 82.6 84.0 84.2 75.5 75.5 75.5 75.5 75.5 95.2 94.2 93.9 95.2 95.2RO 69.9 70.2 70.4 71.1 71.2 87.9 88.5 88.6 88.6 88.7 42.5 42.5 42.5 42.5 42.5 91.6 92.1 92.9 95.7 96.0SI 86.8 87.3 87.7 87.1 86.9 86.3 87.9 89.1 89.4 88.3 75.9 75.9 75.9 75.9 75.9 99.8 99.8 99.8 97.5 97.8SK 84.8 85.0 85.3 85.8 85.5 85.4 86.1 87.4 88.1 87.8 73.1 73.1 73.1 73.1 73.1 97.6 97.5 97.3 98.0 97.4FI 89.5 89.3 89.7 89.7 89.3 90.5 90.2 91.1 90.9 90.3 81.9 81.9 81.9 81.9 81.9 96.6 96.4 96.8 96.8 96.3SE 93.2 93.0 94.1 94.7 94.5 95.7 95.7 97.4 96.9 96.3 89.3 89.3 89.3 89.3 89.3 94.5 94.2 95.8 98.0 98.1UK 94.1 93.7 93.1 93.3 92.8 95.6 94.3 93.7 94.1 93.5 88.5 88.5 88.5 88.5 88.5 98.4 98.4 97.5 97.6 96.5
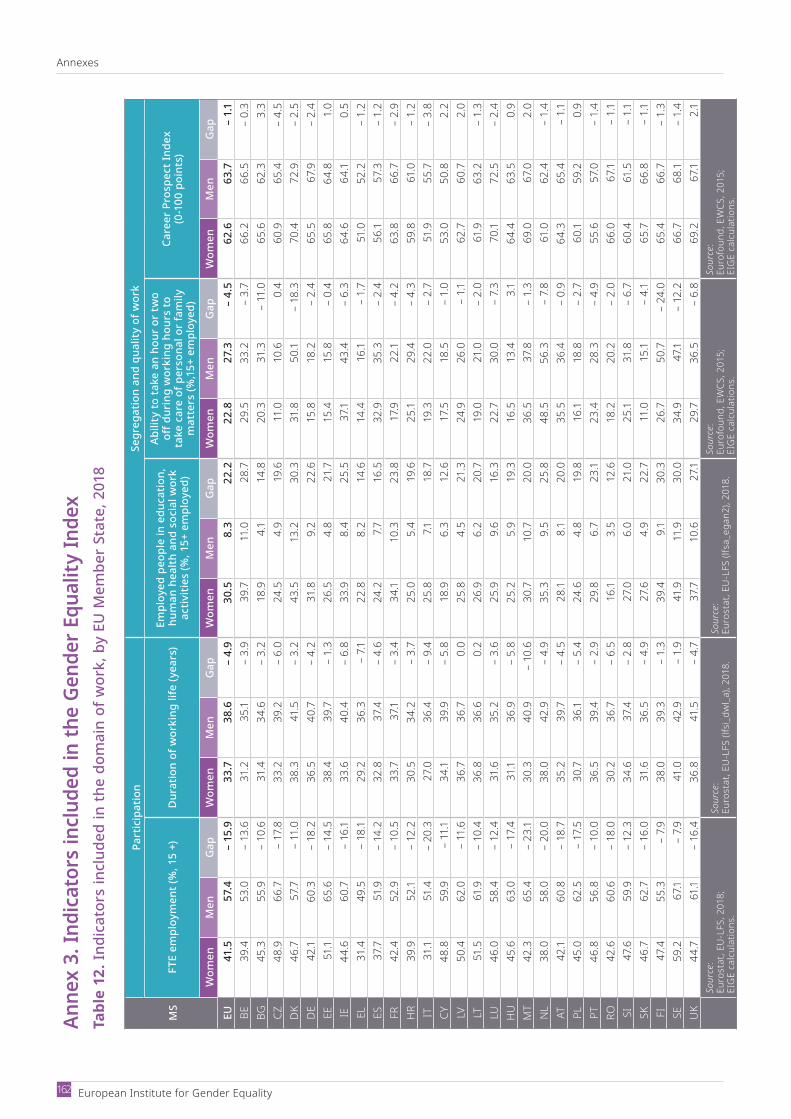
Annexes
European Institute for Gender Equality 162
Anne
x 3.
Indi
cato
rs in
clud
ed in
the
Gend
er E
qual
ity In
dex
Tabl
e 12
. Ind
icat
ors
incl
uded
in th
e do
mai
n of
wor
k, b
y EU
Mem
ber
Stat
e, 2
018
MS
Part
icip
atio
nSe
greg
atio
n an
d qu
ality
of w
ork
FTE
empl
oym
ent (
%, 1
5 +)
Dur
atio
n of
wor
king
life
(yea
rs)
Empl
oyed
peo
ple
in e
duca
tion,
hu
man
hea
lth a
nd s
ocia
l wor
k ac
tiviti
es (%
, 15+
em
ploy
ed)
Abili
ty to
take
an
hour
or
two
off d
urin
g w
orki
ng h
ours
to
take
car
e of
per
sona
l or
fam
ily
mat
ters
(%,1
5+ e
mpl
oyed
)
Care
er P
rosp
ect I
ndex
(0
-100
poi
nts)
Wom
enM
enG
apW
omen
Men
Gap
Wom
enM
enG
apW
omen
Men
Gap
Wom
enM
enG
apEU
41.5
57.4
–15
.933
.738
.6–
4.9
30.5
8.3
22.2
22.8
27.3
–4.
562
.663
.7–
1.1
BE39
.453
.0–
13.6
31.2
35.1
– 3.
939
.711
.028
.729
.533
.2–
3.7
66.2
66.5
–0.
3BG
45.3
55.9
–10
.631
.434
.6–
3.2
18.9
4.1
14.8
20.3
31.3
–11
.065
.662
.33.
3CZ
48.9
66.7
–17
.833
.239
.2–
6.0
24.5
4.9
19.6
11.0
10.6
0.4
60.9
65.4
–4.
5D
K46
.757
.7–
11.0
38.3
41.5
–3.
243
.513
.230
.331
.850
.1–
18.3
70.4
72.9
–2.
5D
E42
.160
.3–
18.2
36.5
40.7
–4.
231
.89.
222
.615
.818
.2–
2.4
65.5
67.9
–2.
4EE
51.1
65.6
–14
.538
.439
.7–
1.3
26.5
4.8
21.7
15.4
15.8
–0.
465
.864
.81.
0IE
44.6
60.7
–16
.133
.640
.4–
6.8
33.9
8.4
25.5
37.1
43.4
–6.
364
.664
.10.
5EL
31.4
49.5
–18
.129
.236
.3–
7.122
.88.
214
.614
.416
.1–
1.7
51.0
52.2
–1.
2ES
37.7
51.9
–14
.232
.837
.4–
4.6
24.2
7.716
.532
.935
.3–
2.4
56.1
57.3
–1.
2FR
42.4
52.9
–10
.533
.737
.1–
3.4
34.1
10.3
23.8
17.9
22.1
–4.
263
.866
.7–
2.9
HR
39.9
52.1
–12
.230
.534
.2–
3.7
25.0
5.4
19.6
25.1
29.4
–4.
359
.861
.0–
1.2
IT31
.151
.4–
20.3
27.0
36.4
– 9.
425
.87.1
18.7
19.3
22.0
–2.
751
.955
.7–
3.8
CY48
.859
.9–
11.1
34.1
39.9
–5.
818
.96.
312
.617
.518
.5–
1.0
53.0
50.8
2.2
LV50
.462
.0–
11.6
36.7
36.7
0.0
25.8
4.5
21.3
24.9
26.0
–1.1
62.7
60.7
2.0
LT51
.561
.9–
10.4
36.8
36.6
0.2
26.9
6.2
20.7
19.0
21.0
–2.
061
.963
.2–
1.3
LU46
.058
.4–
12.4
31.6
35.2
–3.
625
.99.
616
.322
.730
.0–
7.3
70.1
72.5
–2.
4H
U45
.663
.0–
17.4
31.1
36.9
–5.
825
.25.
919
.316
.513
.43.
164
.463
.50.
9M
T42
.365
.4–
23.1
30.3
40.9
–10
.630
.710
.720
.036
.537
.8–
1.3
69.0
67.0
2.0
NL
38.0
58.0
–20
.038
.042
.9–
4.9
35.3
9.5
25.8
48.5
56.3
–7.
861
.062
.4–
1.4
AT42
.160
.8–
18.7
35.2
39.7
–4.
528
.18.
120
.035
.536
.4–
0.9
64.3
65.4
–1.1
PL45
.062
.5–
17.5
30.7
36.1
–5.
424
.64.
819
.816
.118
.8–
2.7
60.1
59.2
0.9
PT46
.856
.8–
10.0
36.5
39.4
– 2.
929
.86.
723
.123
.428
.3–
4.9
55.6
57.0
–1.
4RO
42.6
60.6
–18
.030
.236
.7–
6.5
16.1
3.5
12.6
18.2
20.2
–2.
066
.067
.1–
1.1SI
47.6
59.9
–12
.334
.637
.4–
2.8
27.0
6.0
21.0
25.1
31.8
–6.
760
.461
.5–
1.1SK
46.7
62.7
–16
.031
.636
.5–
4.9
27.6
4.9
22.7
11.0
15.1
–4.
165
.766
.8–
1.1FI
47.4
55.3
– 7.9
38.0
39.3
–1.
339
.49.
130
.326
.750
.7–
24.0
65.4
66.7
–1.
3SE
59.2
67.1
– 7.9
41.0
42.9
– 1.
941
.911
.930
.034
.947
.1–
12.2
66.7
68.1
–1.
4U
K44
.761
.1–
16.4
36.8
41.5
–4.
737
.710
.627
.129
.736
.5–
6.8
69.2
67.1
2.1
Sour
ce:
Euro
stat
, EU
LFS
, 201
8;EI
GE
calc
ulat
ions
.So
urce
: Eu
rost
at, E
UL
FS (l
fsi_
dwl_
a), 2
018.
Sour
ce:
Euro
stat
, EU
LFS
(lfs
a_eg
an2)
, 201
8.So
urce
: Eu
rofo
und,
EW
CS, 2
015;
EIG
E ca
lcul
atio
ns.
Sour
ce:
Euro
foun
d, E
WCS
, 201
5;
EIG
E ca
lcul
atio
ns.
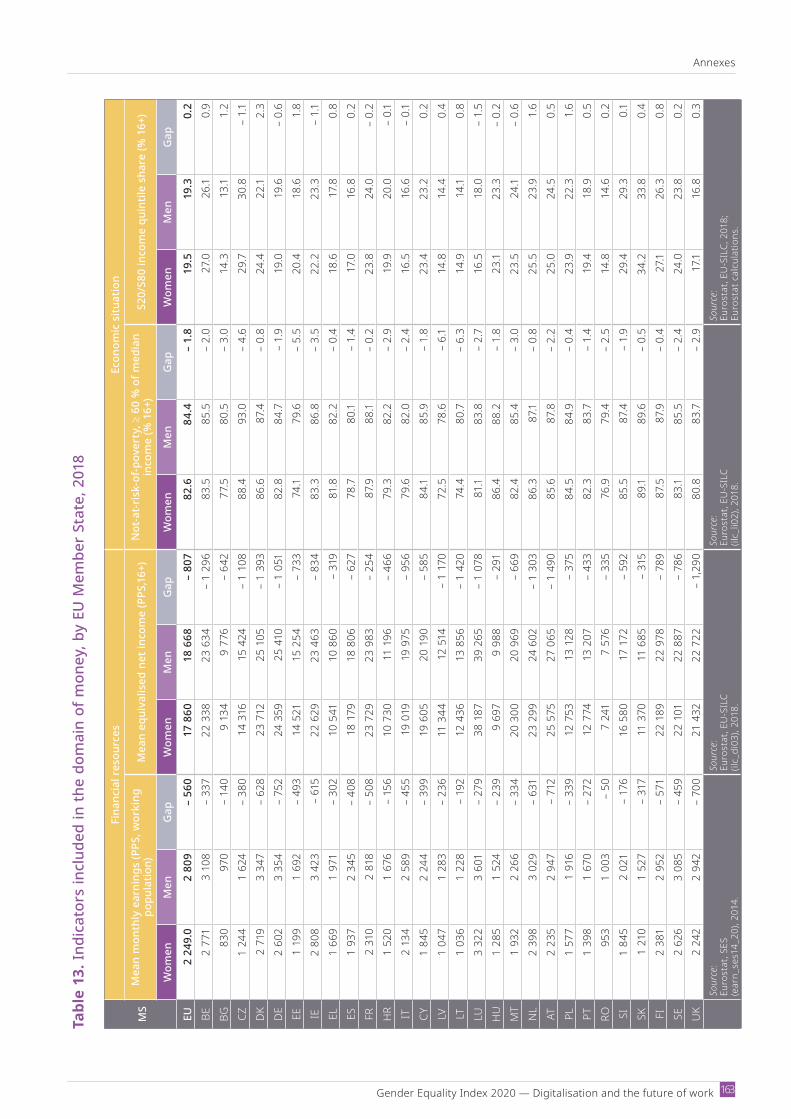
Gender Equality Index 2020 — Digi talisation and the future of work
Annexes
163
Tabl
e 13
. Ind
icat
ors
incl
uded
in th
e do
mai
n of
mon
ey, b
y EU
Mem
ber
Stat
e, 2
018
MS
Fina
ncia
l res
ourc
esEc
onom
ic s
ituat
ion
Mea
n m
onth
ly e
arni
ngs
(PPS
, wor
king
po
pula
tion)
Mea
n eq
uiva
lised
net
inco
me
(PPS
,16+
)N
ot-a
t-ris
k-of
-pov
erty
, ≥ 6
0 %
of m
edia
n in
com
e (%
16+
)S2
0/S8
0 in
com
e qu
intil
e sh
are
(% 1
6+)
Wom
enM
enG
apW
omen
Men
Gap
Wom
enM
enG
apW
omen
Men
Gap
EU2
249.
02
809
– 56
017
860
18 6
68–
807
82.6
84.4
– 1.
819
.519
.30.
2BE
2 77
13
108
– 33
722
338
23 6
34–
1 29
683
.585
.5–
2.0
27.0
26.1
0.9
BG83
097
0–
140
9 13
49
776
– 64
277
.580
.5–
3.0
14.3
13.1
1.2
CZ1
244
1 62
4–
380
14 3
1615
424
– 1
108
88.4
93.0
– 4.
629
.730
.8–
1.1D
K2
719
3 34
7–
628
23 7
1225
105
– 1
393
86.6
87.4
– 0.
824
.422
.12.
3D
E2
602
3 35
4–
752
24 3
5925
410
– 1
051
82.8
84.7
– 1.
919
.019
.6–
0.6
EE1
199
1 69
2–
493
14 5
2115
254
– 73
374
.179
.6–
5.5
20.4
18.6
1.8
IE2
808
3 42
3–
615
22 6
2923
463
– 83
483
.386
.8–
3.5
22.2
23.3
– 1.1
EL1
669
1 97
1–
302
10 5
4110
860
– 31
981
.882
.2–
0.4
18.6
17.8
0.8
ES1
937
2 34
5–
408
18 1
7918
806
– 62
778
.780
.1–
1.4
17.0
16.8
0.2
FR2
310
2 81
8–
508
23 7
2923
983
– 25
487
.988
.1–
0.2
23.8
24.0
– 0.
2H
R1
520
1 67
6–
156
10 7
3011
196
– 46
679
.382
.2–
2.9
19.9
20.0
– 0.
1IT
2 13
42
589
– 45
519
019
19 9
75–
956
79.6
82.0
– 2.
416
.516
.6–
0.1
CY1
845
2 24
4–
399
19 6
0520
190
– 58
584
.185
.9–
1.8
23.4
23.2
0.2
LV1
047
1 28
3–
236
11 3
4412
514
– 1
170
72.5
78.6
– 6.
114
.814
.40.
4LT
1 03
61
228
– 19
212
436
13 8
56–
1 42
074
.480
.7–
6.3
14.9
14.1
0.8
LU3
322
3 60
1–
279
38 1
8739
265
– 1
078
81.1
83.8
– 2.
716
.518
.0–
1.5
HU
1 28
51
524
– 23
99
697
9 98
8–
291
86.4
88.2
– 1.
823
.123
.3–
0.2
MT
1 93
22
266
– 33
420
300
20 9
69–
669
82.4
85.4
– 3.
023
.524
.1–
0.6
NL
2 39
83
029
– 63
123
299
24 6
02–
1 30
386
.387
.1–
0.8
25.5
23.9
1.6
AT2
235
2 94
7–
712
25 5
7527
065
– 1
490
85.6
87.8
– 2.
225
.024
.50.
5PL
1 57
71
916
– 33
912
753
13 1
28–
375
84.5
84.9
– 0.
423
.922
.31.
6PT
1 39
81
670
– 27
212
774
13 2
07–
433
82.3
83.7
– 1.
419
.418
.90.
5RO
953
1 00
3–
507
241
7 57
6–
335
76.9
79.4
– 2.
514
.814
.60.
2SI
1 84
52
021
– 17
616
580
17 1
72–
592
85.5
87.4
– 1.
929
.429
.30.
1SK
1 21
01
527
– 31
711
370
11 6
85–
315
89.1
89.6
– 0.
534
.233
.80.
4FI
2 38
12
952
– 57
122
189
22 9
78–
789
87.5
87.9
– 0.
427
.126
.30.
8SE
2 62
63
085
– 45
922
101
22 8
87–
786
83.1
85.5
– 2.
424
.023
.80.
2U
K2
242
2 94
2–
700
21 4
3222
722
– 1,
290
80.8
83.7
– 2.
917
.116
.80.
3So
urce
: Eu
rost
at, S
ES
(ear
n_se
s14_
20),
2014
.
Sour
ce:
Euro
stat
, EU
SIL
C
(ilc_
di03
), 20
18.
Sour
ce:
Euro
stat
, EU
SIL
C
(ilc_
li02)
, 201
8.
Sour
ce:
Euro
stat
, EU
SIL
C, 2
018;
Eu
rost
at c
alcu
latio
ns.
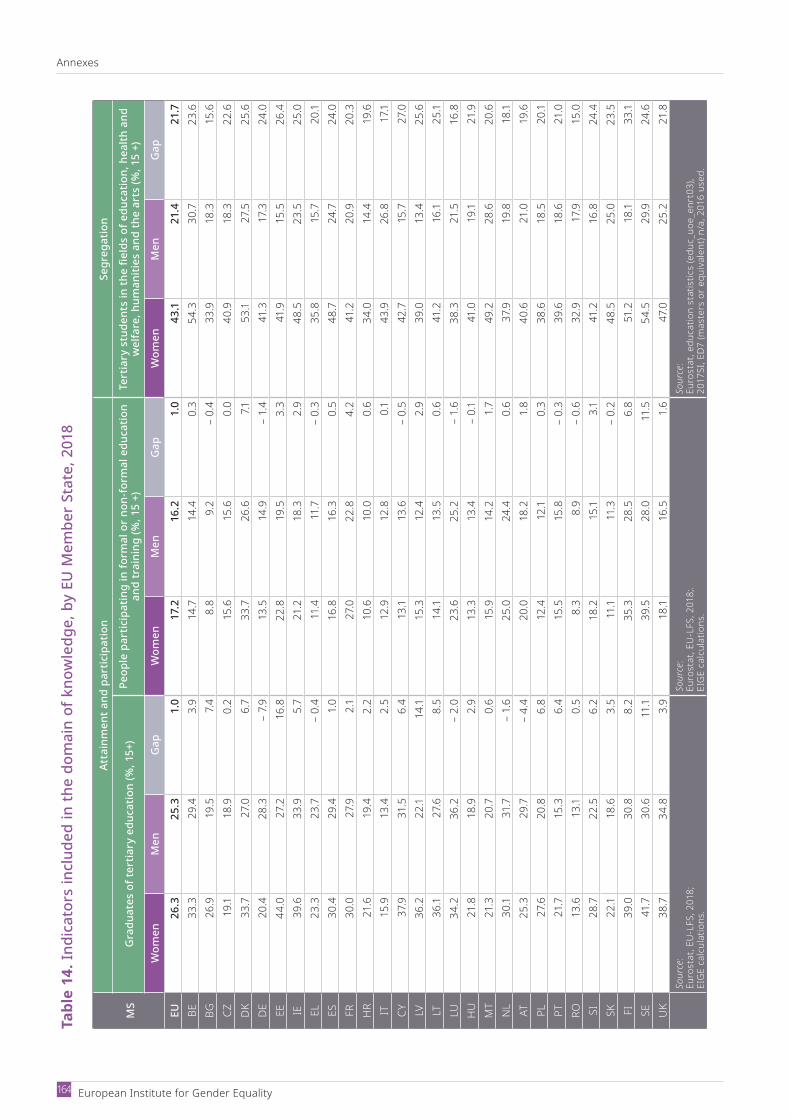
Annexes
European Institute for Gender Equality 164
Tabl
e 14
. Ind
icat
ors
incl
uded
in th
e do
mai
n of
kno
wle
dge,
by
EU M
embe
r St
ate,
201
8
MS
Atta
inm
ent a
nd p
artic
ipat
ion
Segr
egat
ion
Gra
duat
es o
f ter
tiary
edu
catio
n (%
, 15+
)Pe
ople
par
ticip
atin
g in
form
al o
r no
n-fo
rmal
edu
catio
n an
d tr
aini
ng (%
, 15
+)Te
rtia
ry s
tude
nts
in th
e fie
lds
of e
duca
tion,
hea
lth a
nd
wel
fare
, hum
aniti
es a
nd th
e ar
ts (%
, 15
+)
Wom
enM
enG
apW
omen
Men
Gap
Wom
enM
enG
ap
EU26
.325
.31.
017
.216
.21.
043
.121
.421
.7BE
33.3
29.4
3.9
14.7
14.4
0.3
54.3
30.7
23.6
BG26
.919
.57.
48.
89.
2–
0.4
33.9
18.3
15.6
CZ19
.118
.90.
215
.615
.60.
040
.918
.322
.6D
K33
.727
.06.
733
.726
.67.1
53.1
27.5
25.6
DE
20.4
28.3
– 7.9
13.5
14.9
– 1.
441
.317
.324
.0EE
44.0
27.2
16.8
22.8
19.5
3.3
41.9
15.5
26.4
IE39
.633
.95.
721
.218
.32.
948
.523
.525
.0EL
23.3
23.7
– 0.
411
.411
.7–
0.3
35.8
15.7
20.1
ES30
.429
.41.
016
.816
.30.
548
.724
.724
.0FR
30.0
27.9
2.1
27.0
22.8
4.2
41.2
20.9
20.3
HR
21.6
19.4
2.2
10.6
10.0
0.6
34.0
14.4
19.6
IT15
.913
.42.
512
.912
.80.
143
.926
.817
.1CY
37.9
31.5
6.4
13.1
13.6
– 0.
542
.715
.727
.0LV
36.2
22.1
14.1
15.3
12.4
2.9
39.0
13.4
25.6
LT36
.127
.68.
514
.113
.50.
641
.216
.125
.1LU
34.2
36.2
– 2.
023
.625
.2–
1.6
38.3
21.5
16.8
HU
21.8
18.9
2.9
13.3
13.4
– 0.
141
.019
.121
.9M
T21
.320
.70.
615
.914
.21.
749
.228
.620
.6N
L30
.131
.7–
1.6
25.0
24.4
0.6
37.9
19.8
18.1
AT25
.329
.7–
4.4
20.0
18.2
1.8
40.6
21.0
19.6
PL27
.620
.86.
812
.412
.10.
338
.618
.520
.1PT
21.7
15.3
6.4
15.5
15.8
– 0.
339
.618
.621
.0RO
13.6
13.1
0.5
8.3
8.9
– 0.
632
.917
.915
.0SI
28.7
22.5
6.2
18.2
15.1
3.1
41.2
16.8
24.4
SK22
.118
.63.
511
.111
.3–
0.2
48.5
25.0
23.5
FI39
.030
.88.
235
.328
.56.
851
.218
.133
.1SE
41.7
30.6
11.1
39.5
28.0
11.5
54.5
29.9
24.6
UK
38.7
34.8
3.9
18.1
16.5
1.6
47.0
25.2
21.8
Sour
ce:
Euro
stat
, EU
LFS
, 201
8;
EIG
E ca
lcul
atio
ns.
Sour
ce:
Euro
stat
, EU
LFS
, 201
8;.
EIG
E ca
lcul
atio
ns.
Sour
ce:
Euro
stat
, edu
catio
n st
atis
tics
(edu
c_uo
e_en
rt03
),
2017
SI, E
D7 (m
aste
rs o
r equ
ival
ent)
n/a,
201
6 us
ed.

Gender Equality Index 2020 — Digi talisation and the future of work
Annexes
165
Tabl
e 15
. Ind
icat
ors
incl
uded
in th
e do
mai
n of
tim
e, b
y EU
Mem
ber
Stat
e, 2
018
MS
Care
act
iviti
esSo
cial
act
iviti
es
Peop
le c
arin
g fo
r an
d ed
ucat
ing
thei
r ch
ildre
n or
gra
ndch
ildre
n, e
lder
ly o
r pe
ople
with
dis
abili
ties,
eve
ry d
ay (%
, 18+
)Pe
ople
coo
king
and
/or
doin
g ho
usew
ork,
ev
ery
day
(%, 1
8+)
Wor
kers
doi
ng s
port
ing,
cul
tura
l or
leis
urve
act
iviti
es o
utsi
de o
f the
ir ho
me,
at
leas
t dai
ly o
r se
vera
l tim
es a
wee
k (%
, 15
+, e
mpl
oyed
)
Wor
kers
invo
lved
in v
olun
tary
or
char
itabl
e ac
tiviti
es, a
t lea
st o
nce
a m
onth
(%
, 15+
em
ploy
ed)
Wom
enM
enG
apW
omen
Men
Gap
Wom
enM
enG
apW
omen
Men
Gap
EU37
.524
.712
.878
.733
.745
.027
.531
.9–
4.4
12.2
11.4
0.8
BE43
.128
.714
.481
.232
.548
.732
.338
.7–
6.4
9.5
9.9
– 0.
4BG
38.5
25.8
12.7
72.9
13.0
59.9
11.7
19.5
– 7.
82.
92.
40.
5CZ
33.2
19.8
13.4
67.4
15.8
51.6
22.6
27.8
– 5.
212
.311
.31.
0D
K25
.021
.33.
782
.355
.027
.352
.850
.52.
317
.320
.3–
3.0
DE
25.5
18.7
6.8
72.3
29.1
43.2
21.8
25.2
– 3.
415
.813
.32.
5EE
34.6
31.0
3.6
75.8
47.4
28.4
33.5
38.4
– 4.
912
.511
.41.1
IE44
.130
.513
.688
.748
.040
.740
.448
.4–
8.0
15.4
17.9
– 2.
5EL
38.2
20.2
18.0
85.3
16.0
69.3
11.0
17.6
– 6.
66.
65.
70.
9ES
39.8
27.7
12.1
84.5
41.9
42.6
39.3
45.5
– 6.
25.
73.
81.
9FR
45.6
29.4
16.2
79.6
35.6
44.0
32.1
39.0
– 6.
912
.314
.1–
1.8
HR
34.9
21.3
13.6
62.4
11.9
50.5
12.5
19.1
– 6.
610
.810
.30.
5IT
34.1
24.0
10.1
80.9
19.7
61.2
23.6
28.2
– 4.
612
.810
.82.
0CY
50.1
34.1
16.0
80.8
26.6
54.2
9.7
21.7
– 12
.08.
88.
00.
8LV
39.9
38.0
1.9
81.7
56.6
25.1
17.4
22.6
– 5.
28.
57.
41.1
LT41
.324
.217
.179
.028
.850
.213
.517
.9–
4.4
5.2
4.4
0.8
LU41
.535
.65.
978
.338
.639
.736
.845
.8–
9.0
10.4
22.2
– 11
.8H
U30
.124
.55.
655
.813
.842
.016
.612
.54.
111
.38.
72.
6M
T42
.324
.917
.480
.537
.343
.225
.426
.2–
0.8
10.0
10.7
– 0.
7N
L38
.528
.210
.381
.447
.434
.056
.058
.3–
2.3
22.3
22.3
0.0
AT35
.620
.814
.883
.328
.454
.924
.625
.3–
0.7
11.6
14.8
– 3.
2PL
47.0
25.0
22.0
81.7
33.5
48.2
16.9
21.3
– 4.
46.
54.
71.
8PT
36.5
28.1
8.4
78.1
18.8
59.3
10.3
19.6
– 9.
36.
95.
11.
8RO
45.8
25.0
20.8
75.3
40.6
34.7
6.3
8.4
– 2.
16.
17.
6–
1.5
SI35
.227
.57.7
81.0
27.5
53.5
41.4
42.7
– 1.
318
.021
.5–
3.5
SK35
.319
.216
.159
.515
.743
.810
.619
.9–
9.3
8.6
6.3
2.3
FI36
.326
.310
.085
.757
.228
.560
.144
.515
.614
.915
.9–
1.0
SE29
.526
.72.
873
.656
.117
.551
.055
.0–
4.0
27.2
29.8
– 2.
6U
K41
.125
.315
.884
.649
.035
.633
.435
.8–
2.4
13.5
11.4
2.1
Sour
ce:
Euro
foun
d, E
QLS
, 201
6.
EIG
E’s
calc
ulat
ion.
Sour
ce:
Euro
foun
d, E
QLS
, 201
6.
EIG
E’s
calc
ulat
ion.
Sour
ce:
Euro
foun
d, E
WCS
, 201
5.
EIG
E’s
calc
ulat
ion.
Sour
ce:
Euro
foun
d, E
WCS
, 201
5.
EIG
E’s
calc
ulat
ion.

Annexes
European Institute for Gender Equality 166
Tabl
e 16
. Ind
icat
ors
incl
uded
in th
e do
mai
n of
pow
er, b
y EU
Mem
ber
Stat
e, 2
018
MS
Polit
ical
Econ
omic
Soci
al
Shar
e of
min
iste
rs
(%)
Shar
e of
mem
bers
of
par
liam
ent (
%)
Shar
e of
mem
bers
of
reg
iona
l as
sem
blie
s (%
)
Shar
e of
mem
bers
of
boa
rds
in la
rges
t qu
oted
com
pani
es,
supe
rvis
ory
boar
d or
bo
ard
of d
irect
ors
(%)
Shar
e of
mem
bers
of
cen
tral
ban
ks (%
)
Shar
e of
mem
bers
of
pub
lic r
esea
rch
fund
ing
deci
sion
-m
akin
g bo
dies
(%)
Shar
e of
boa
rd
mem
bers
in p
ublic
ly
owne
d br
oadc
astin
g or
gani
satio
ns (%
)
Shar
e of
mem
bers
of
high
est d
ecis
ion-
mak
-in
g bo
dy o
f nat
iona
l O
lym
pic
spor
t org
ani-
satio
ns (%
)
Wom
enM
enW
omen
Men
Wom
enM
enW
omen
Men
Wom
enM
enW
omen
Men
Wom
enM
enW
omen
Men
EU29
.570
.530
.369
.729
.071
.026
.673
.422
.177
.937
.662
.436
.763
.315
.484
.6BE
23.0
77.0
40.8
59.2
41.1
58.9
32.1
67.9
10.6
89.4
45.2
54.8
36.6
63.4
11.6
88.4
BG37
.562
.525
.774
.325
.874
.215
.884
.257
.142
.940
.060
.046
.753
.321
.079
.0CZ
19.9
80.1
20.9
79.1
20.8
79.2
16.2
83.8
0.0
100.
027
.672
.414
.885
.27.
492
.6D
K39
.860
.237
.562
.538
.062
.029
.570
.527
.172
.938
.861
.346
.753
.318
.181
.9D
E40
.159
.933
.067
.031
.168
.932
.967
.125
.075
.039
.061
.029
.670
.415
.784
.3EE
25.6
74.4
28.1
71.9
28.6
71.4
8.0
92.0
18.8
81.3
9.5
90.5
44.8
55.2
10.4
89.6
IE21
.278
.824
.375
.723
.876
.220
.080
.031
.069
.049
.350
.749
.250
.818
.981
.1EL
17.6
82.4
18.9
81.1
21.2
78.8
10.0
90.0
11.1
88.9
12.0
88.0
20.0
80.0
9.4
90.6
ES41
.658
.439
.760
.346
.553
.523
.676
.443
.356
.745
.254
.833
.366
.718
.681
.4FR
48.9
51.1
34.9
65.1
47.6
52.4
43.8
56.2
45.5
54.5
40.6
59.4
45.2
54.8
29.0
71.0
HR
24.2
75.8
19.5
80.5
28.0
72.0
21.8
78.2
8.3
91.7
28.6
71.4
50.0
50.0
8.4
91.6
IT24
.475
.633
.366
.719
.780
.335
.264
.822
.277
.830
.469
.626
.173
.911
.089
.0CY
13.2
86.8
18.0
82.0
15.3
84.7
10.6
89.4
13.0
87.0
25.0
75.0
29.6
70.4
5.4
94.6
LV23
.976
.122
.377
.724
.475
.629
.170
.924
.275
.836
.463
.653
.346
.719
.280
.8LT
26.8
73.2
21.6
78.4
29.8
70.2
12.9
87.1
7.792
.335
.164
.933
.366
.713
.886
.3LU
24.6
75.4
27.1
72.9
24.8
75.2
12.9
87.1
18.5
81.5
51.9
48.1
37.0
63.0
17.2
82.8
HU
4.9
95.1
11.3
88.7
12.1
87.9
14.3
85.7
11.1
88.9
0.0
100.
031
.868
.29.
390
.7M
T11
.688
.414
.285
.822
.177
.98.
891
.214
.385
.733
.366
.723
.876
.27.
492
.6N
L41
.558
.534
.965
.133
.166
.931
.168
.915
.484
.627
.872
.232
.467
.626
.173
.9AT
35.6
64.4
34.9
65.1
31.4
68.6
24.6
75.4
0.0
100.
028
.971
.140
.060
.013
.986
.1PL
17.7
82.3
26.1
73.9
26.6
73.4
20.6
79.4
15.4
84.6
24.0
76.0
0.0
100.
03.
396
.7PT
34.4
65.6
36.0
64.0
26.4
73.6
19.9
80.1
29.4
70.6
37.5
62.5
33.3
66.7
11.6
88.4
RO28
.072
.019
.380
.717
.582
.510
.889
.211
.188
.944
.955
.136
.463
.610
.889
.2SI
41.0
59.0
24.4
75.6
32.3
67.7
25.0
75.0
20.0
80.0
42.9
57.1
39.4
60.6
5.0
95.0
SK22
.577
.520
.979
.114
.385
.723
.876
.30.
010
0.0
15.8
84.2
22.2
77.8
8.6
91.4
FI40
.060
.042
.957
.146
.054
.033
.766
.327
.073
.045
.254
.842
.957
.126
.873
.2SE
51.8
48.2
46.4
53.6
47.8
52.2
36.4
63.6
35.3
64.7
57.7
42.3
56.1
43.9
45.1
54.9
UK
29.3
70.7
28.8
71.2
36.3
63.7
29.7
70.3
28.8
71.2
35.9
64.1
31.6
68.4
27.4
72.6
Sour
ce:
EIG
E, G
ende
r Sta
tistic
s D
atab
ase,
WM
ID
(3-y
ear a
vera
ge,
2017
–201
8–20
19);
natio
nal g
over
nmen
ts
(all
min
iste
rs: j
unio
r m
inis
ters
+ s
enio
r m
inis
ters
);
EIG
E ca
lcul
atio
ns.
Sour
ce:
EIG
E, G
ende
r Sta
tistic
s D
atab
ase,
WM
ID
(3-y
ear a
vera
ge,
2017
–201
8–20
19);
natio
nal p
arlia
men
ts
(bot
h ho
uses
);EI
GE
calc
ulat
ions
.
Sour
ce:
EIG
E, G
ende
r Sta
tistic
s D
atab
ase,
WM
ID (3
-yea
r av
erag
e, 2
017–
2018
–20
19);
BG, E
E, IE
, CY,
LT,
LU
, M
T, S
I, lo
cal l
evel
use
d (2
019)
;EI
GE
calc
ulat
ions
.
Sour
ce:
EIG
E, G
ende
r Sta
tistic
s D
atab
ase,
WM
ID (3
-yea
r av
erag
e, 2
017–
2018
–20
19);
EIG
E ca
lcul
atio
ns.
Sour
ce:
EIG
E, G
ende
r Sta
tistic
s D
atab
ase,
WM
ID
(3-y
ear a
vera
ge,
2017
–201
8–20
19);
EIG
E ca
lcul
atio
ns.
Sour
ce:
EIG
E, G
ende
r Sta
tistic
s D
atab
ase,
WM
ID
(3-y
ear a
vera
ge,
2017
–201
8–20
19);
IT, R
O, b
reak
in ti
me
serie
s (o
nly
2018
);EI
GE
calc
ulat
ions
.
Sour
ce:
EIG
E, G
ende
r Sta
tistic
s D
atab
ase,
WM
ID
(3-y
ear a
vera
ge,
2017
–201
8–20
19);
EIG
E ca
lcul
atio
ns.
Sour
ce:
EIG
E, G
ende
r Sta
tistic
s D
atab
ase,
WM
ID
(3-y
ear a
vera
ge,
2015
–201
8–20
19);
EIG
E ca
lcul
atio
ns.
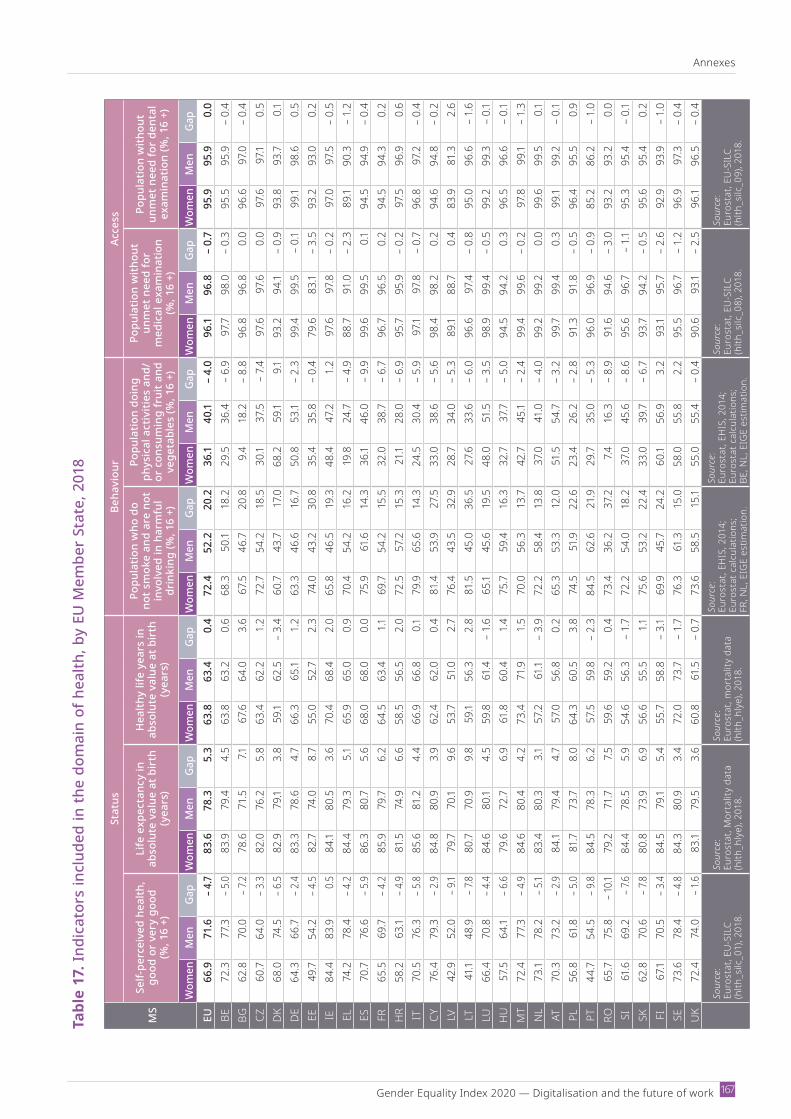
Gender Equality Index 2020 — Digi talisation and the future of work
Annexes
167
Tabl
e 17
. Ind
icat
ors
incl
uded
in th
e do
mai
n of
hea
lth, b
y EU
Mem
ber
Stat
e, 2
018
MS
Stat
usBe
havi
our
Acce
ss
Self-
perc
eive
d he
alth
, go
od o
r ve
ry g
ood
(%
, 16
+)
Life
exp
ecta
ncy
in
abso
lute
val
ue a
t bir
th
(yea
rs)
Hea
lthy
life
year
s in
ab
solu
te v
alue
at b
irth
(y
ears
)
Popu
latio
n w
ho d
o no
t sm
oke
and
are
not
invo
lved
in h
arm
ful
drin
king
(%, 1
6 +)
Popu
latio
n do
ing
phys
ical
act
iviti
es a
nd/
or c
onsu
min
g fr
uit a
nd
vege
tabl
es (%
, 16
+)
Popu
latio
n w
ithou
t un
met
nee
d fo
r m
edic
al e
xam
inat
ion
(%, 1
6 +)
Popu
latio
n w
ithou
t un
met
nee
d fo
r de
ntal
ex
amin
atio
n (%
, 16
+)
Wom
enM
enGa
pW
omen
Men
Gap
Wom
enM
enGa
pW
omen
Men
Gap
Wom
enM
enGa
pW
omen
Men
Gap
Wom
enM
enGa
pEU
66.9
71.6
– 4.7
83.6
78.3
5.3
63.8
63.4
0.4
72.4
52.2
20.2
36.1
40.1
– 4.
096
.196
.8–
0.7
95.9
95.9
0.0
BE72
.377
.3– 5
.083
.979
.44.
563
.863
.20.
668
.350
.118
.229
.536
.4–
6.9
97.7
98.0
– 0.
395
.595
.9–
0.4
BG62
.870
.0– 7
.278
.671
.57.1
67.6
64.0
3.6
67.5
46.7
20.8
9.4
18.2
– 8.
896
.896
.80.
096
.697
.0–
0.4
CZ60
.764
.0– 3
.382
.076
.25.
863
.462
.21.
272
.754
.218
.530
.137
.5–
7.497
.697
.60.
097
.697
.10.
5D
K68
.074
.5– 6
.582
.979
.13.
859
.162
.5–
3.4
60.7
43.7
17.0
68.2
59.1
9.193
.294
.1–
0.9
93.8
93.7
0.1D
E64
.366
.7– 2
.483
.378
.64.
766
.365
.11.
263
.346
.616
.750
.853
.1–
2.3
99.4
99.5
– 0.1
99.1
98.6
0.5
EE49
.754
.2– 4
.582
.774
.08.
755
.052
.72.
374
.043
.230
.835
.435
.8–
0.4
79.6
83.1
– 3.
593
.293
.00.
2IE
84.4
83.9
0.584
.180
.53.
670
.468
.42.
065
.846
.519
.348
.447
.21.
297
.697
.8–
0.2
97.0
97.5
– 0.
5EL
74.2
78.4
– 4.2
84.4
79.3
5.165
.965
.00.
970
.454
.216
.219
.824
.7–
4.9
88.7
91.0
– 2.
389
.190
.3–
1.2
ES70
.776
.6– 5
.986
.380
.75.
668
.068
.00.
075
.961
.614
.336
.146
.0–
9.9
99.6
99.5
0.194
.594
.9–
0.4
FR65
.569
.7– 4
.285
.979
.76.
264
.563
.41.1
69.7
54.2
15.5
32.0
38.7
– 6.
796
.796
.50.
294
.594
.30.
2H
R58
.263
.1– 4
.981
.574
.96.
658
.556
.52.
072
.557
.215
.321
.128
.0–
6.9
95.7
95.9
– 0.
297
.596
.90.
6IT
70.5
76.3
– 5.8
85.6
81.2
4.4
66.9
66.8
0.179
.965
.614
.324
.530
.4–
5.9
97.1
97.8
– 0.
796
.897
.2–
0.4
CY76
.479
.3– 2
.984
.880
.93.
962
.462
.00.
481
.453
.927
.533
.038
.6–
5.6
98.4
98.2
0.2
94.6
94.8
– 0.
2LV
42.9
52.0
– 9.1
79.7
70.1
9.6
53.7
51.0
2.7
76.4
43.5
32.9
28.7
34.0
– 5.
389
.188
.70.
483
.981
.32.
6LT
41.1
48.9
– 7.8
80.7
70.9
9.8
59.1
56.3
2.8
81.5
45.0
36.5
27.6
33.6
– 6.
096
.697
.4–
0.8
95.0
96.6
– 1.
6LU
66.4
70.8
– 4.4
84.6
80.1
4.5
59.8
61.4
– 1.
665
.145
.619
.548
.051
.5–
3.5
98.9
99.4
– 0.
599
.299
.3–
0.1H
U57
.564
.1– 6
.679
.672
.76.
961
.860
.41.
475
.759
.416
.332
.737
.7–
5.0
94.5
94.2
0.3
96.5
96.6
– 0.1
MT
72.4
77.3
– 4.9
84.6
80.4
4.2
73.4
71.9
1.5
70.0
56.3
13.7
42.7
45.1
– 2.
499
.499
.6–
0.2
97.8
99.1
– 1.
3N
L73
.178
.2– 5
.183
.480
.33.1
57.2
61.1
– 3.
972
.258
.413
.837
.041
.0–
4.0
99.2
99.2
0.0
99.6
99.5
0.1AT
70.3
73.2
– 2.9
84.1
79.4
4.7
57.0
56.8
0.2
65.3
53.3
12.0
51.5
54.7
– 3.
299
.799
.40.
399
.199
.2–
0.1PL
56.8
61.8
– 5.0
81.7
73.7
8.0
64.3
60.5
3.8
74.5
51.9
22.6
23.4
26.2
– 2.
891
.391
.8–
0.5
96.4
95.5
0.9
PT44
.754
.5– 9
.884
.578
.36.
257
.559
.8–
2.3
84.5
62.6
21.9
29.7
35.0
– 5.
396
.096
.9–
0.9
85.2
86.2
– 1.
0RO
65.7
75.8
– 10.1
79.2
71.7
7.559
.659
.20.
473
.436
.237
.27.4
16.3
– 8.
991
.694
.6–
3.0
93.2
93.2
0.0
SI61
.669
.2– 7
.684
.478
.55.
954
.656
.3–
1.772
.254
.018
.237
.045
.6–
8.6
95.6
96.7
– 1.1
95.3
95.4
– 0.1
SK62
.870
.6– 7
.880
.873
.96.
956
.655
.51.1
75.6
53.2
22.4
33.0
39.7
– 6.
793
.794
.2–
0.5
95.6
95.4
0.2
FI67
.170
.5– 3
.484
.579
.15.
455
.758
.8–
3.169
.945
.724
.260
.156
.93.
293
.195
.7–
2.6
92.9
93.9
– 1.
0SE
73.6
78.4
– 4.8
84.3
80.9
3.4
72.0
73.7
– 1.7
76.3
61.3
15.0
58.0
55.8
2.2
95.5
96.7
– 1.
296
.997
.3–
0.4
UK
72.4
74.0
– 1.6
83.1
79.5
3.6
60.8
61.5
– 0.
773
.658
.515
.155
.055
.4–
0.4
90.6
93.1
– 2.
596
.196
.5–
0.4
Sour
ce:
Euro
stat
, EU
SIL
C
(hlth
_silc
_01)
, 201
8.
Sour
ce:
Euro
stat
, Mor
talit
y da
ta
(hlth
_hly
e), 2
018.
Sour
ce:
Euro
stat
, mor
talit
y da
ta
(hlth
_hly
e), 2
018.
Sour
ce:
Euro
stat
, EH
IS, 2
014;
Euro
stat
cal
cula
tions
;FR
, NL,
EIG
E es
timat
ion.
Sour
ce:
Euro
stat
, EH
IS, 2
014;
Euro
stat
cal
cula
tions
;BE
, NL,
EIG
E es
timat
ion.
Sour
ce:
Euro
stat
, EU
SIL
C
(hlth
_silc
_08)
, 201
8.
Sour
ce:
Euro
stat
, EU
SIL
C
(hlth
_silc
_09)
, 201
8.
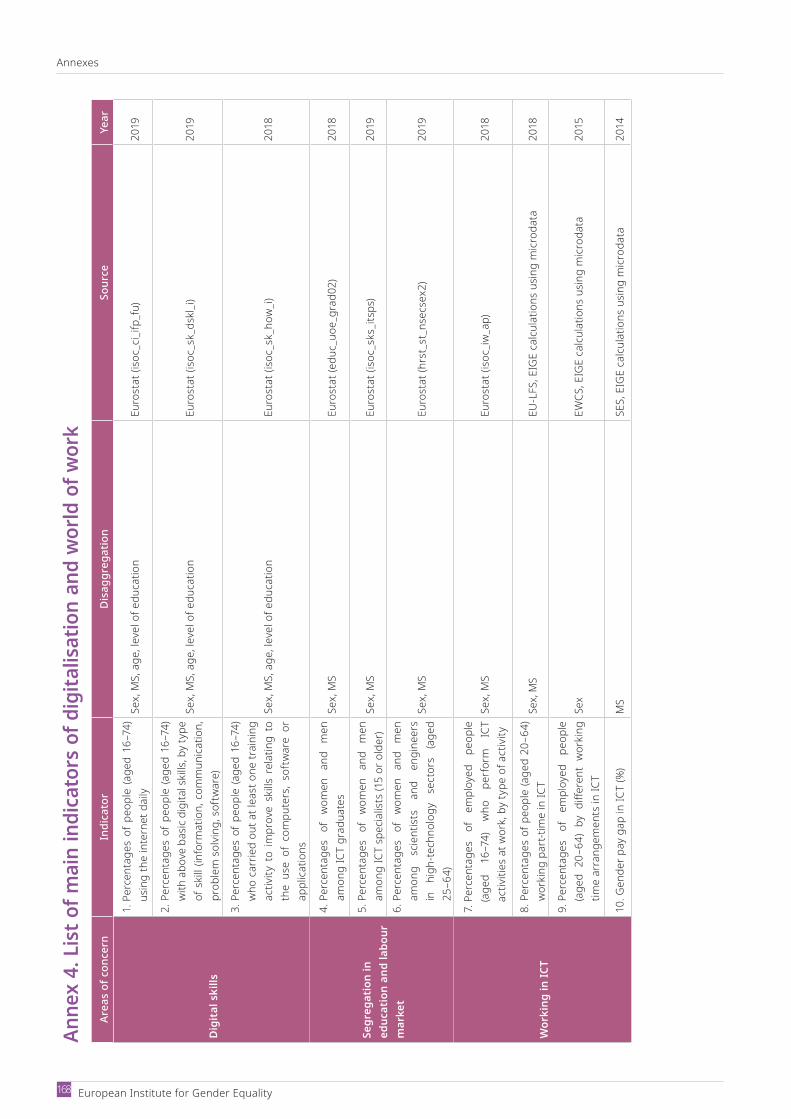
Annexes
European Institute for Gender Equality 168
Anne
x 4.
Lis
t of m
ain
indi
cato
rs o
f dig
italis
atio
n an
d w
orld
of w
ork
Area
s of
con
cern
Indi
cato
rD
isag
greg
atio
nSo
urce
Year
Dig
ital
ski
lls
1. Pe
rcen
tage
s of
peo
ple
(age
d 16
–74)
usin
g th
e in
tern
et d
aily
Sex,
MS,
age
, lev
el o
f edu
catio
nEu
rost
at (i
soc_
ci_if
p_fu
)20
19
2. Pe
rcen
tage
s of
peo
ple
(age
d 16
–74)
with
abo
ve b
asic
digi
tal s
kills
, by
type
of s
kill
(info
rmat
ion,
com
mun
icat
ion,
prob
lem
sol
ving
, sof
twar
e)
Sex,
MS,
age
, lev
el o
f edu
catio
nEu
rost
at (i
soc_
sk_d
skl_
i)20
19
3. Pe
rcen
tage
s of
peo
ple
(age
d 16
–74)
who
car
ried
out a
t lea
st o
ne tr
aini
ngac
tivity
to
impr
ove
skills
rel
atin
g to
th
e us
e of
com
pute
rs,
soft
war
e or
appl
icat
ions
Sex,
MS,
age
, lev
el o
f edu
catio
nEu
rost
at (i
soc_
sk_h
ow_i)
2018
Segr
egat
ion
in
educ
atio
n an
d la
bour
m
arke
t
4. P
erce
ntag
es
of
wom
en
and
men
amon
g IC
T gr
adua
tes
Sex,
MS
Euro
stat
(edu
c_uo
e_gr
ad02
)20
18
5. P
erce
ntag
es
of
wom
en
and
men
amon
g IC
T sp
ecia
lists
(15
or o
lder
)Se
x, M
SEu
rost
at (i
soc_
sks_
itsps
)20
19
6. P
erce
ntag
es
of
wom
en
and
men
amon
g sc
ient
ists
an
d en
gine
ers
in
high
-tech
nolo
gy
sect
ors
(age
d25
–64)
Sex,
MS
Euro
stat
(hrs
t_st
_nse
csex
2)20
19
Wor
king
in IC
T
7. P
erce
ntag
es
of
empl
oyed
pe
ople
(age
d 16
–74)
w
ho
perf
orm
IC
T ac
tiviti
es a
t wor
k, b
y ty
pe o
f act
ivity
Sex,
MS
Euro
stat
(iso
c_iw
_ap)
2018
8. Pe
rcen
tage
s of
peo
ple
(age
d 20
–64)
wor
king
par
t-tim
e in
ICT
Sex,
MS
EUL
FS, E
IGE
calc
ulat
ions
usin
g m
icro
data
2018
9. Pe
rcen
tage
s of
em
ploy
ed
peop
le(a
ged
20–6
4) b
y di
ffere
nt w
orki
ngtim
e ar
rang
emen
ts in
ICT
Sex
EWCS
, EIG
E ca
lcul
atio
ns u
sing
mic
roda
ta20
15
10.G
ende
r pay
gap
in IC
T (%
)M
SSE
S, E
IGE
calc
ulat
ions
usin
g m
icro
data
2014
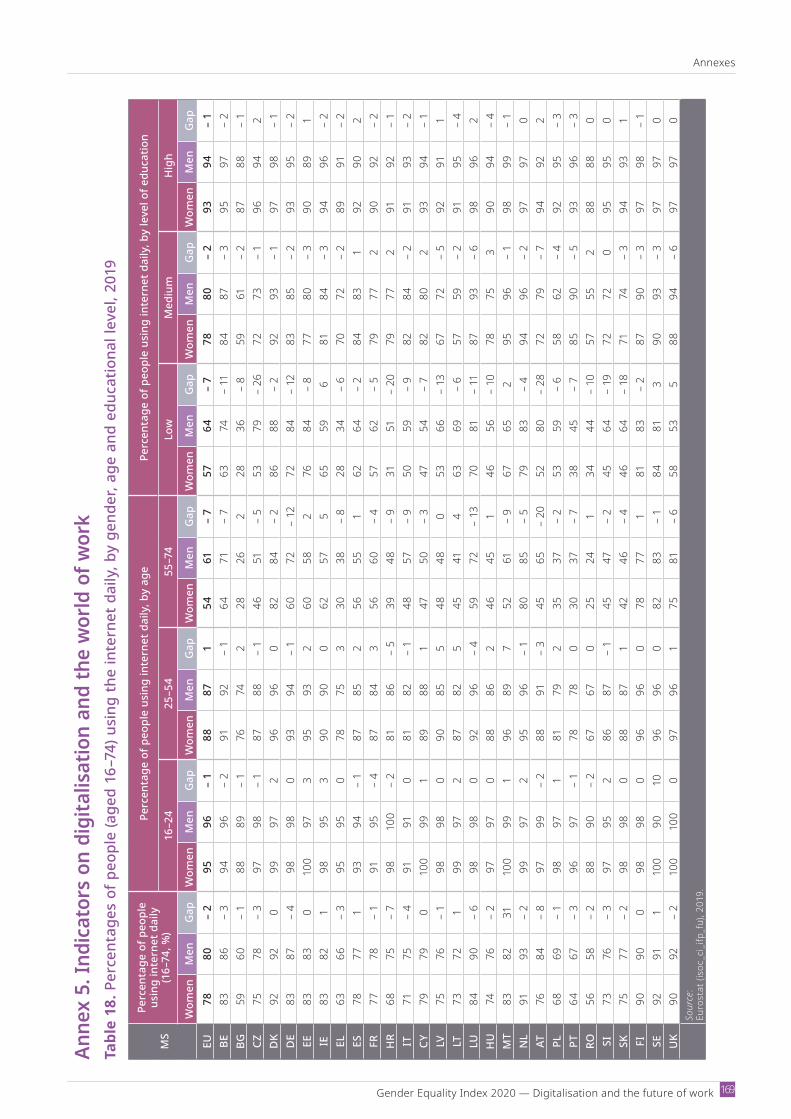
Gender Equality Index 2020 — Digi talisation and the future of work
Annexes
169
Anne
x 5.
Indi
cato
rs o
n di
gita
lisat
ion
and
the
wor
ld o
f wor
kTa
ble
18. P
erce
ntag
es o
f peo
ple
(age
d 16
–74)
usi
ng th
e in
tern
et d
aily
, by
gend
er, a
ge a
nd e
duca
tiona
l lev
el, 2
019
MS
Perc
enta
ge o
f peo
ple
usin
g in
tern
et d
aily
(1
6–74
, %)
Perc
enta
ge o
f peo
ple
usin
g in
tern
et d
aily
, by
age
Perc
enta
ge o
f peo
ple
usin
g in
tern
et d
aily
, by
leve
l of e
duca
tion
16–2
425
–54
55–7
4Lo
w
Med
ium
Hig
h
Wom
enM
enG
apW
omen
Men
Gap
Wom
enM
enG
apW
omen
Men
Gap
Wom
enM
enG
apW
omen
Men
Gap
Wom
enM
enG
apEU
7880
–2
9596
–1
8887
154
61–
757
64–
778
80–
293
94–
1BE
8386
–3
9496
–2
9192
–1
6471
–7
6374
–11
8487
–3
9597
–2
BG59
60–
188
89–
176
742
2826
228
36–
859
61–
287
88–
1CZ
7578
–3
9798
–1
8788
–1
4651
–5
5379
–26
7273
–1
9694
2D
K92
920
9997
296
960
8284
–2
8688
–2
9293
–1
9798
–1
DE
8387
–4
9898
093
94–
160
72–
1272
84–
1283
85–
293
95–
2EE
8383
010
097
395
932
6058
276
84–
877
80–
390
891
IE83
821
9895
390
900
6257
565
596
8184
–3
9496
–2
EL63
66–
395
950
7875
330
38–
828
34–
670
72–
289
91–
2ES
7877
193
94–
187
852
5655
162
64–
284
831
9290
2FR
7778
–1
9195
–4
8784
356
60–
457
62–
579
772
9092
–2
HR
6875
–7
9810
0–
281
86–
539
48–
931
51–
2079
772
9192
–1
IT71
75–
491
910
8182
–1
4857
– 9
5059
– 9
8284
–2
9193
–2
CY79
790
100
991
8988
147
50–
347
54–
782
802
9394
–1
LV75
76–
198
980
9085
548
480
5366
–13
6772
–5
9291
1LT
7372
199
972
8782
545
414
6369
–6
5759
–2
9195
–4
LU84
90–
698
980
9296
–4
5972
–13
7081
–11
8793
–6
9896
2H
U74
76–
297
970
8886
246
451
4656
–10
7875
390
94–
4M
T83
8231
100
991
9689
752
61–
967
652
9596
–1
9899
–1
NL
9193
–2
9997
295
96–
180
85–
579
83–
494
96–
297
970
AT76
84–
897
99–
288
91–
345
65–
2052
80–
2872
79–
794
922
PL68
69–
198
971
8179
235
37–
253
59–
658
62–
492
95–
3PT
6467
–3
9697
–1
7878
030
37–
738
45–
785
90–
593
96–
3RO
5658
–2
8890
–2
6767
025
241
3444
–10
5755
288
880
SI73
76–
397
952
8687
–1
4547
–2
4564
– 19
7272
095
950
SK75
77–
298
980
8887
142
46–
446
64–
1871
74–
394
931
FI90
900
9898
096
960
7877
181
83–
287
90–
397
98–
1SE
9291
110
090
1096
960
8283
–1
8481
390
93–
397
970
UK
9092
–2
100
100
097
961
7581
–6
5853
588
94–
697
970
Sour
ce:
Euro
stat
(iso
c_ci
_ifp
_fu)
, 201
9.
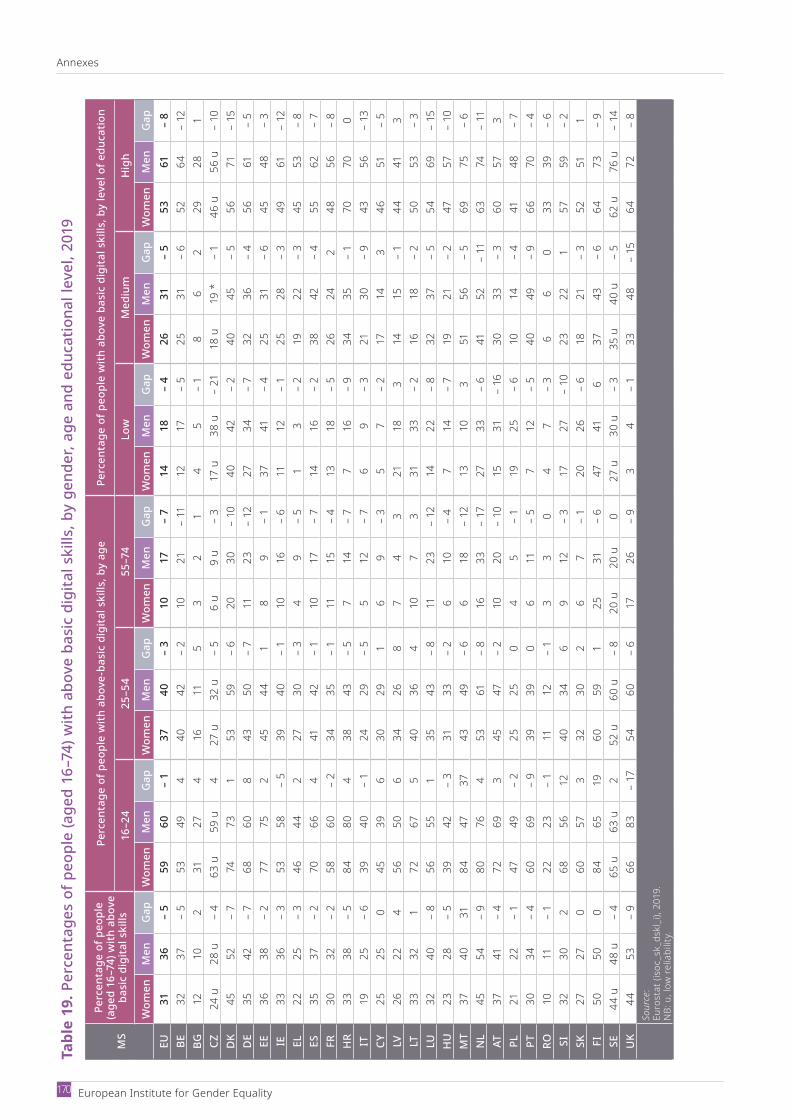
Annexes
European Institute for Gender Equality 170
Tabl
e 19
. Per
cent
ages
of p
eopl
e (a
ged
16–7
4) w
ith a
bove
bas
ic d
igita
l ski
lls, b
y ge
nder
, age
and
edu
catio
nal l
evel
, 201
9
MS
Perc
enta
ge o
f peo
ple
(age
d 16
–74)
with
abo
ve
basi
c di
gita
l ski
lls
Perc
enta
ge o
f peo
ple
with
abo
ve-b
asic
dig
ital s
kills
, by
age
Perc
enta
ge o
f peo
ple
with
abo
ve b
asic
dig
ital s
kills
, by
leve
l of e
duca
tion
16–2
425
–54
55–7
4Lo
w
Med
ium
Hig
h
Wom
enM
enG
apW
omen
Men
Gap
Wom
enM
enG
apW
omen
Men
Gap
Wom
enM
enG
apW
omen
Men
Gap
Wom
enM
enG
apEU
3136
– 5
5960
– 1
3740
– 3
1017
– 7
1418
– 4
2631
– 5
5361
– 8
BE32
37–
553
494
4042
– 2
1021
– 11
1217
– 5
2531
– 6
5264
– 12
BG12
102
3127
416
115
32
14
5–
18
62
2928
1CZ
24 u
28 u
– 4
63 u
59 u
427
u32
u–
56
u9
u–
317
u38
u–
2118
u19
*–
146
u56
u–
10D
K45
52–
774
731
5359
– 6
2030
– 10
4042
– 2
4045
– 5
5671
– 15
DE
3542
– 7
6860
843
50–
711
23–
1227
34–
732
36–
456
61–
5EE
3638
– 2
7775
245
441
89
– 1
3741
– 4
2531
– 6
4548
– 3
IE33
36–
353
58–
539
40–
110
16–
611
12–
125
28–
349
61–
12EL
2225
– 3
4644
227
30–
34
9–
51
3–
219
22–
345
53–
8ES
3537
– 2
7066
441
42–
110
17–
714
16–
238
42–
455
62–
7FR
3032
– 2
5860
– 2
3435
– 1
1115
– 4
1318
– 5
2624
248
56–
8H
R33
38–
584
804
3843
– 5
714
– 7
716
– 9
3435
– 1
7070
0IT
1925
– 6
3940
– 1
2429
– 5
512
– 7
69
– 3
2130
– 9
4356
– 13
CY25
250
4539
630
291
69
– 3
57
– 2
1714
346
51–
5LV
2622
456
506
3426
87
43
2118
314
15–
144
413
LT33
321
7267
540
364
107
331
33–
216
18–
250
53–
3LU
3240
– 8
5655
135
43–
811
23–
1214
22–
832
37–
554
69–
15H
U23
28–
539
42–
331
33–
26
10–
47
14–
719
21–
247
57–
10M
T37
4031
8447
3743
49–
66
18–
1213
103
5156
– 5
6975
– 6
NL
4554
– 9
8076
453
61–
816
33–
1727
33–
641
52–
1163
74–
11AT
3741
– 4
7269
345
47–
210
20–
1015
31–
1630
33–
360
573
PL21
22–
147
49–
225
250
45
– 1
1925
– 6
1014
– 4
4148
– 7
PT30
34–
460
69–
939
390
611
– 5
712
– 5
4049
– 9
6670
– 4
RO10
11–
122
23–
111
12–
13
30
47
– 3
66
033
39–
6SI
3230
268
5612
4034
69
12–
317
27–
1023
221
5759
– 2
SK27
270
6057
332
302
67
– 1
2026
– 6
1821
– 3
5251
1FI
5050
084
6519
6059
125
31–
647
416
3743
– 6
6473
– 9
SE44
u48
u–
465
u63
u2
52 u
60 u
– 8
20 u
20 u
027
u30
u–
335
u40
u–
562
u76
u–
14U
K44
53–
966
83–
1754
60–
617
26–
93
4–
133
48–
1564
72–
8So
urce
: Eu
rost
at (i
soc_
sk_d
skl_
i), 2
019.
NB:
u, l
ow r
elia
bilit
y.
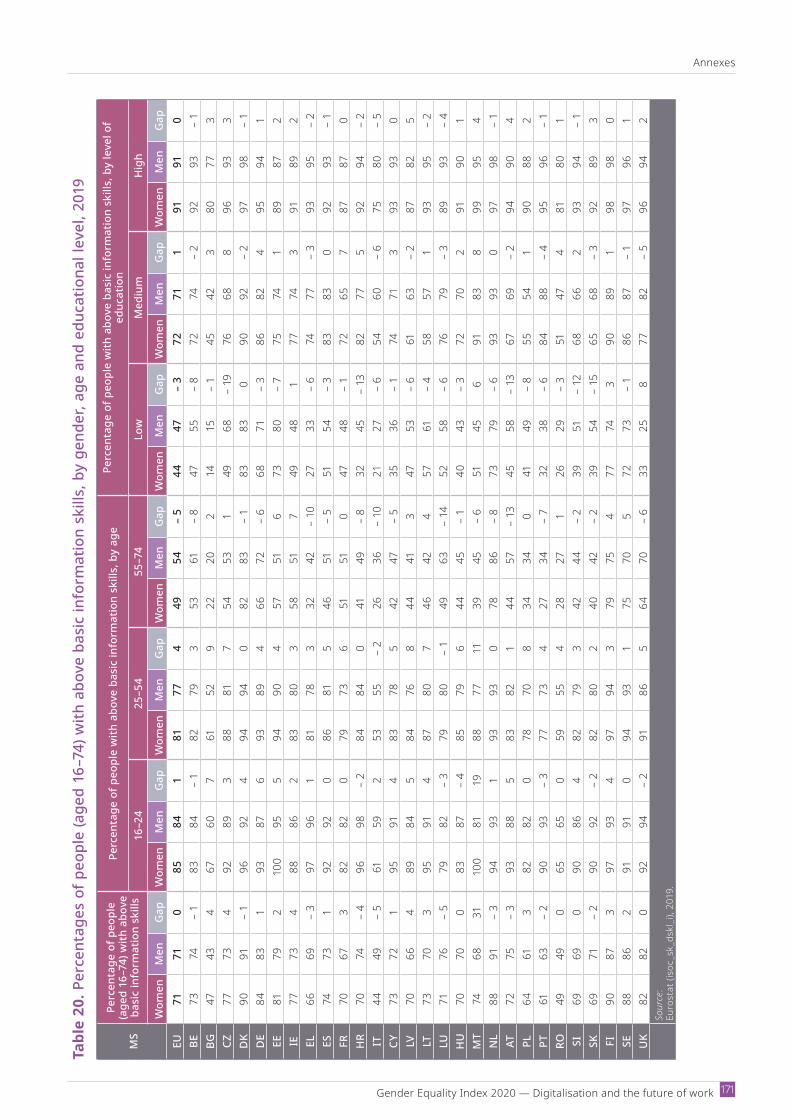
Gender Equality Index 2020 — Digi talisation and the future of work
Annexes
171
Tabl
e 20
. Per
cent
ages
of p
eopl
e (a
ged
16–7
4) w
ith a
bove
bas
ic in
form
atio
n sk
ills,
by
gend
er, a
ge a
nd e
duca
tiona
l lev
el, 2
019
MS
Perc
enta
ge o
f peo
ple
(age
d 16
–74)
with
abo
ve
basi
c in
form
atio
n sk
ills
Perc
enta
ge o
f peo
ple
with
abo
ve b
asic
info
rmat
ion
skill
s, b
y ag
ePe
rcen
tage
of p
eopl
e w
ith a
bove
bas
ic in
form
atio
n sk
ills,
by
leve
l of
educ
atio
n
16–2
425
–54
55–7
4Lo
w
Med
ium
Hig
h
Wom
enM
enG
apW
omen
Men
Gap
Wom
enM
enG
apW
omen
Men
Gap
Wom
enM
enG
apW
omen
Men
Gap
Wom
enM
enG
apEU
7171
085
841
8177
449
54–
544
47–
372
711
9191
0BE
7374
– 1
8384
– 1
8279
353
61–
847
55–
872
74–
292
93–
1BG
4743
467
607
6152
922
202
1415
– 1
4542
380
773
CZ77
734
9289
388
817
5453
149
68–
1976
688
9693
3D
K90
91–
196
924
9494
082
83–
183
830
9092
– 2
9798
– 1
DE
8483
193
876
9389
466
72–
668
71–
386
824
9594
1EE
8179
210
095
594
904
5751
673
80–
775
741
8987
2IE
7773
488
862
8380
358
517
4948
177
743
9189
2EL
6669
– 3
9796
181
783
3242
– 10
2733
– 6
7477
– 3
9395
– 2
ES74
731
9292
086
815
4651
– 5
5154
– 3
8383
092
93–
1FR
7067
382
820
7973
651
510
4748
– 1
7265
787
870
HR
7074
– 4
9698
– 2
8484
041
49–
832
45–
1382
775
9294
– 2
IT44
49–
561
592
5355
– 2
2636
– 10
2127
– 6
5460
– 6
7580
– 5
CY73
721
9591
483
785
4247
– 5
3536
– 1
7471
393
930
LV70
664
8984
584
768
4441
347
53–
661
63–
287
825
LT73
703
9591
487
807
4642
457
61–
458
571
9395
– 2
LU71
76–
579
82–
379
80–
149
63–
1452
58–
676
79–
389
93–
4H
U70
700
8387
– 4
8579
644
45–
140
43–
372
702
9190
1M
T74
6831
100
8119
8877
1139
45–
651
456
9183
899
954
NL
8891
– 3
9493
193
930
7886
– 8
7379
– 6
9393
097
98–
1AT
7275
– 3
9388
583
821
4457
– 13
4558
– 13
6769
– 2
9490
4PL
6461
382
820
7870
834
340
4149
– 8
5554
190
882
PT61
63–
290
93–
377
734
2734
– 7
3238
– 6
8488
– 4
9596
– 1
RO49
490
6565
059
554
2827
126
29–
351
474
8180
1SI
6969
090
864
8279
342
44–
239
51–
1268
662
9394
– 1
SK69
71–
290
92–
282
802
4042
– 2
3954
– 15
6568
– 3
9289
3FI
9087
397
934
9794
379
754
7774
390
891
9898
0SE
8886
291
910
9493
175
705
7273
– 1
8687
– 1
9796
1U
K82
820
9294
– 2
9186
564
70–
633
258
7782
– 5
9694
2So
urce
: Eu
rost
at (i
soc_
sk_d
skl_
i), 2
019.
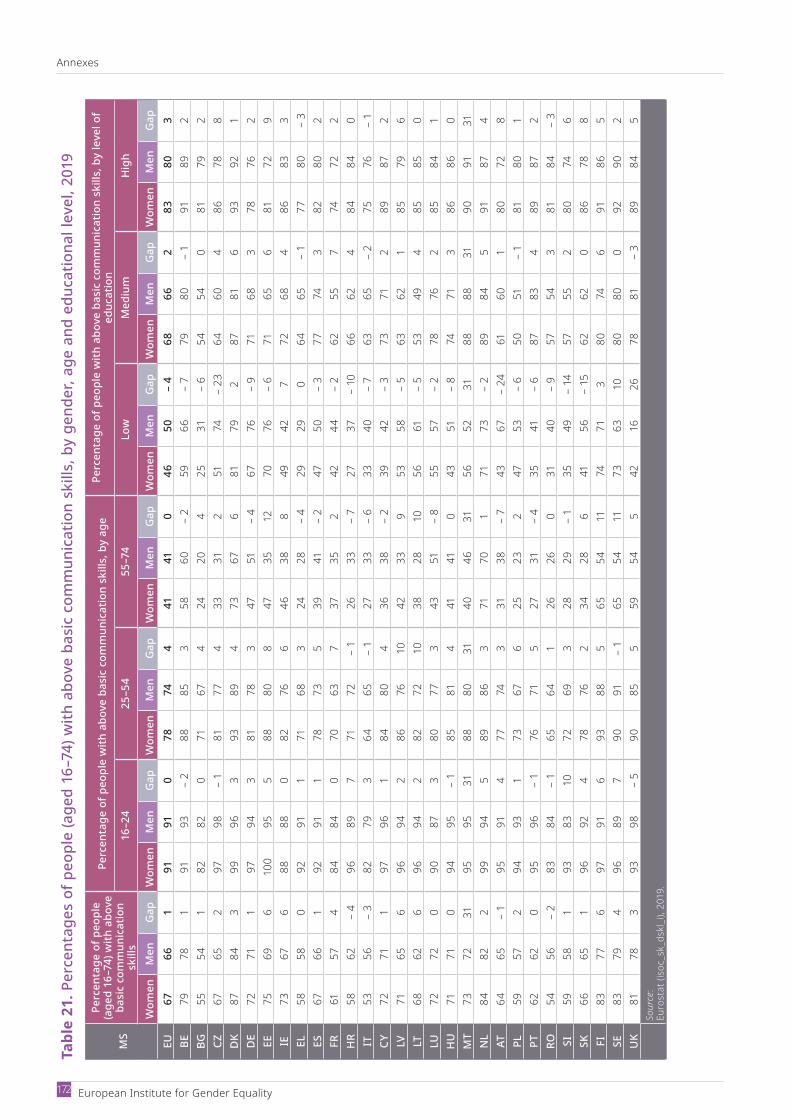
Annexes
European Institute for Gender Equality 172
Tabl
e 21
. Per
cent
ages
of p
eopl
e (a
ged
16–7
4) w
ith a
bove
bas
ic c
omm
unic
atio
n sk
ills,
by
gend
er, a
ge a
nd e
duca
tiona
l lev
el, 2
019
MS
Perc
enta
ge o
f peo
ple
(age
d 16
–74)
with
abo
ve
basi
c co
mm
unic
atio
n sk
ills
Perc
enta
ge o
f peo
ple
with
abo
ve b
asic
com
mun
icat
ion
skill
s, b
y ag
ePe
rcen
tage
of p
eopl
e w
ith a
bove
bas
ic c
omm
unic
atio
n sk
ills,
by
leve
l of
educ
atio
n16
–24
25–5
455
–74
Low
M
ediu
mH
igh
Wom
enM
enG
apW
omen
Men
Gap
Wom
enM
enG
apW
omen
Men
Gap
Wom
enM
enG
apW
omen
Men
Gap
Wom
enM
enG
apEU
6766
191
910
7874
441
410
4650
– 4
6866
283
803
BE79
781
9193
– 2
8885
358
60–
259
66–
779
80–
191
892
BG55
541
8282
071
674
2420
425
31–
654
540
8179
2CZ
6765
297
98–
181
774
3331
251
74–
2364
604
8678
8D
K87
843
9996
393
894
7367
681
792
8781
693
921
DE
7271
197
943
8178
347
51–
467
76–
971
683
7876
2EE
7569
610
095
588
808
4735
1270
76–
671
656
8172
9IE
7367
688
880
8276
646
388
4942
772
684
8683
3EL
5858
092
911
7168
324
28–
429
290
6465
– 1
7780
– 3
ES67
661
9291
178
735
3941
– 2
4750
– 3
7774
382
802
FR61
574
8484
070
637
3735
242
44–
262
557
7472
2H
R58
62–
496
897
7172
– 1
2633
– 7
2737
– 10
6662
484
840
IT53
56–
382
793
6465
– 1
2733
– 6
3340
– 7
6365
– 2
7576
– 1
CY72
711
9796
184
804
3638
– 2
3942
– 3
7371
289
872
LV71
656
9694
286
7610
4233
953
58–
563
621
8579
6LT
6862
696
942
8272
1038
2810
5661
– 5
5349
485
850
LU72
720
9087
380
773
4351
– 8
5557
– 2
7876
285
841
HU
7171
094
95–
185
814
4141
043
51–
874
713
8686
0M
T73
7231
9595
3188
8031
4046
3156
5231
8888
3190
9131
NL
8482
299
945
8986
371
701
7173
– 2
8984
591
874
AT64
65–
195
914
7774
331
38–
743
67–
2461
601
8072
8PL
5957
294
931
7367
625
232
4753
– 6
5051
– 1
8180
1PT
6262
095
96–
176
715
2731
– 4
3541
– 6
8783
489
872
RO54
56–
283
84–
165
641
2626
031
40–
957
543
8184
– 3
SI59
581
9383
1072
693
2829
– 1
3549
– 14
5755
280
746
SK66
651
9692
478
762
3428
641
56–
1562
620
8678
8FI
8377
697
916
9388
565
5411
7471
380
746
9186
5SE
8379
496
897
9091
– 1
6554
1173
6310
8080
092
902
UK
8178
393
98–
590
855
5954
542
1626
7881
– 3
8984
5So
urce
: Eu
rost
at (i
soc_
sk_d
skl_
i), 2
019.
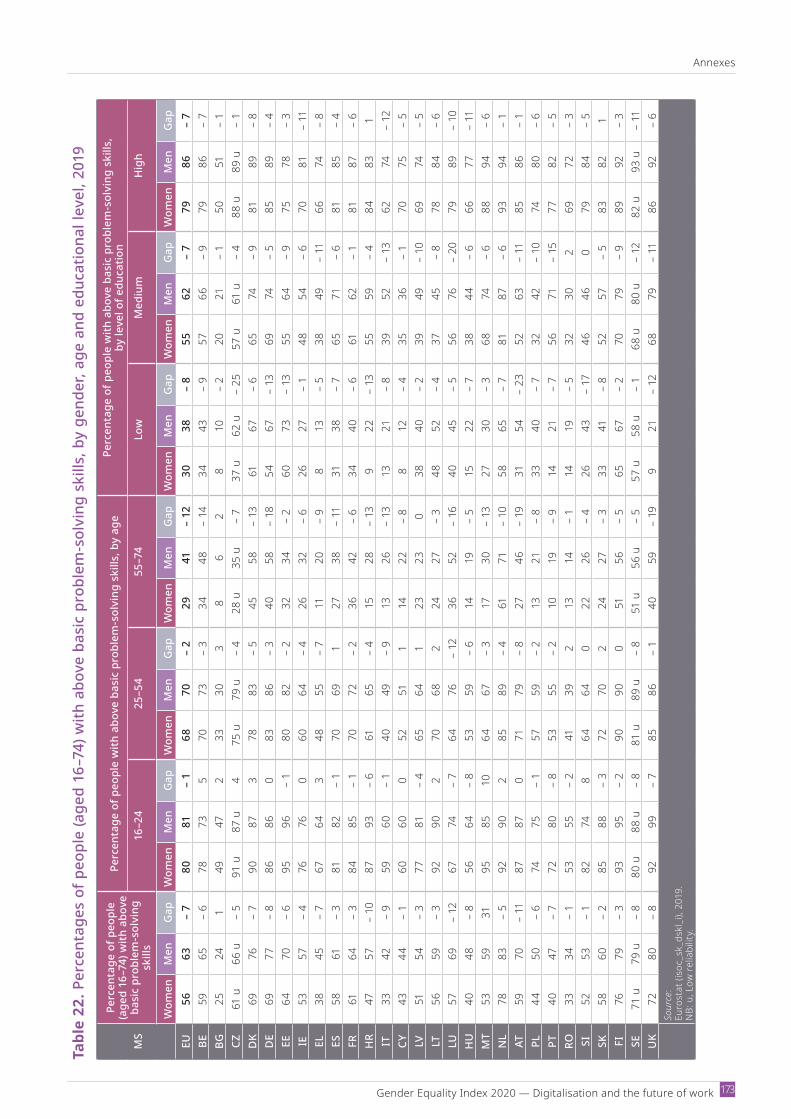
Gender Equality Index 2020 — Digi talisation and the future of work
Annexes
173
Tabl
e 22
. Per
cent
ages
of p
eopl
e (a
ged
16–7
4) w
ith a
bove
bas
ic p
robl
em-s
olvi
ng s
kills
, by
gend
er, a
ge a
nd e
duca
tiona
l lev
el, 2
019
MS
Perc
enta
ge o
f peo
ple
(age
d 16
–74)
with
abo
ve
basi
c pr
oble
m-s
olvi
ng
skill
s
Perc
enta
ge o
f peo
ple
with
abo
ve b
asic
pro
blem
-sol
ving
ski
lls, b
y ag
ePe
rcen
tage
of p
eopl
e w
ith a
bove
bas
ic p
robl
em-s
olvi
ng s
kills
, by
leve
l of e
duca
tion
16–2
425
–54
55–7
4Lo
w
Med
ium
Hig
h
Wom
enM
enG
apW
omen
Men
Gap
Wom
enM
enG
apW
omen
Men
Gap
Wom
enM
enG
apW
omen
Men
Gap
Wom
enM
enG
apEU
5663
– 7
8081
– 1
6870
– 2
2941
– 12
3038
– 8
5562
– 7
7986
– 7
BE59
65–
678
735
7073
– 3
3448
– 14
3443
– 9
5766
– 9
7986
– 7
BG25
241
4947
233
303
86
28
10–
220
21–
150
51–
1CZ
61 u
66 u
– 5
91 u
87 u
475
u79
u–
428
u35
u–
737
u62
u–
2557
u61
u–
488
u89
u–
1D
K69
76–
790
873
7883
– 5
4558
– 13
6167
– 6
6574
– 9
8189
– 8
DE
6977
– 8
8686
083
86–
340
58–
1854
67–
1369
74–
585
89–
4EE
6470
– 6
9596
– 1
8082
– 2
3234
– 2
6073
– 13
5564
– 9
7578
– 3
IE53
57–
476
760
6064
– 4
2632
– 6
2627
– 1
4854
– 6
7081
– 11
EL38
45–
767
643
4855
– 7
1120
– 9
813
– 5
3849
– 11
6674
– 8
ES58
61–
381
82–
170
691
2738
– 11
3138
– 7
6571
– 6
8185
– 4
FR61
64–
384
85–
170
72–
236
42–
634
40–
661
62–
181
87–
6H
R47
57–
1087
93–
661
65–
415
28–
139
22–
1355
59–
484
831
IT33
42–
959
60–
140
49–
913
26–
1313
21–
839
52–
1362
74–
12CY
4344
– 1
6060
052
511
1422
– 8
812
– 4
3536
– 1
7075
– 5
LV51
54–
377
81–
465
641
2323
038
40–
239
49–
1069
74–
5LT
5659
– 3
9290
270
682
2427
– 3
4852
– 4
3745
– 8
7884
– 6
LU57
69–
1267
74–
764
76–
1236
52–
1640
45–
556
76–
2079
89–
10H
U40
48–
856
64–
853
59–
614
19–
515
22–
738
44–
666
77–
11M
T53
5931
9585
1064
67–
317
30–
1327
30–
368
74–
688
94–
6N
L78
83–
592
902
8589
– 4
6171
– 10
5865
– 7
8187
– 6
9394
– 1
AT59
70–
1187
870
7179
– 8
2746
– 19
3154
– 23
5263
– 11
8586
– 1
PL44
50–
674
75–
157
59–
213
21–
833
40–
732
42–
1074
80–
6PT
4047
– 7
7280
– 8
5355
– 2
1019
– 9
1421
– 7
5671
– 15
7782
– 5
RO33
34–
153
55–
241
392
1314
– 1
1419
– 5
3230
269
72–
3SI
5253
– 1
8274
864
640
2226
– 4
2643
– 17
4646
079
84–
5SK
5860
– 2
8588
– 3
7270
224
27–
333
41–
852
57–
583
821
FI76
79–
393
95–
290
900
5156
– 5
6567
– 2
7079
– 9
8992
– 3
SE71
u79
u–
880
u88
u–
881
u89
u–
851
u56
u–
557
u58
u–
168
u80
u–
1282
u93
u–
11U
K72
80–
892
99–
785
86–
140
59–
199
21–
1268
79–
1186
92–
6So
urce
: Eu
rost
at (i
soc_
sk_d
skl_
i), 2
019.
NB:
u, L
ow r
elia
bilit
y.
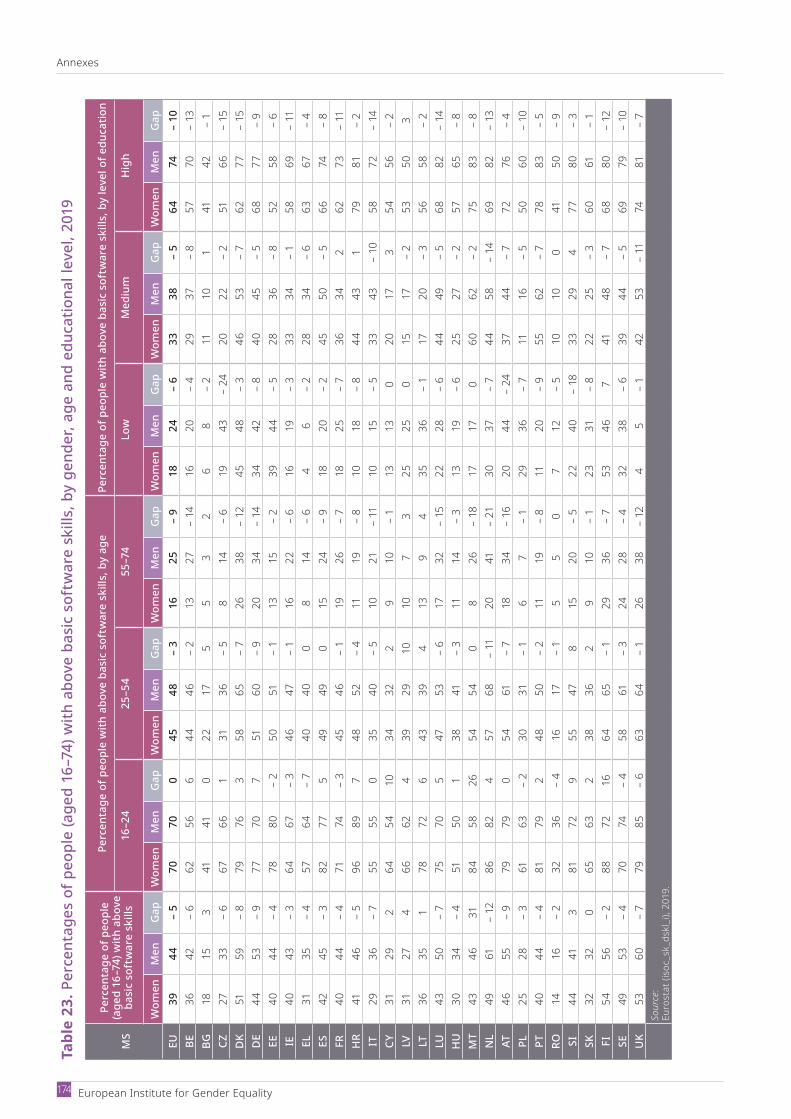
Annexes
European Institute for Gender Equality 174
Tabl
e 23
. Per
cent
ages
of p
eopl
e (a
ged
16–7
4) w
ith a
bove
bas
ic s
oftw
are
skill
s, b
y ge
nder
, age
and
edu
catio
nal l
evel
, 201
9
MS
Perc
enta
ge o
f peo
ple
(age
d 16
–74)
with
abo
ve
basi
c so
ftw
are
skill
s
Perc
enta
ge o
f peo
ple
with
abo
ve b
asic
sof
twar
e sk
ills,
by
age
Perc
enta
ge o
f peo
ple
with
abo
ve b
asic
sof
twar
e sk
ills,
by
leve
l of e
duca
tion
16–2
425
–54
55–7
4Lo
w
Med
ium
Hig
h
Wom
enM
enG
apW
omen
Men
Gap
Wom
enM
enG
apW
omen
Men
Gap
Wom
enM
enG
apW
omen
Men
Gap
Wom
enM
enG
apEU
3944
– 5
7070
045
48–
316
25–
918
24–
633
38–
564
74–
10BE
3642
– 6
6256
644
46–
213
27–
1416
20–
429
37–
857
70–
13BG
1815
341
410
2217
55
32
68
– 2
1110
141
42–
1CZ
2733
– 6
6766
131
36–
58
14–
619
43–
2420
22–
251
66–
15D
K51
59–
879
763
5865
– 7
2638
– 12
4548
– 3
4653
– 7
6277
– 15
DE
4453
– 9
7770
751
60–
920
34–
1434
42–
840
45–
568
77–
9EE
4044
– 4
7880
– 2
5051
– 1
1315
– 2
3944
– 5
2836
– 8
5258
– 6
IE40
43–
364
67–
346
47–
116
22–
616
19–
333
34–
158
69–
11EL
3135
– 4
5764
– 7
4040
08
14–
64
6–
228
34–
663
67–
4ES
4245
– 3
8277
549
490
1524
– 9
1820
– 2
4550
– 5
6674
– 8
FR40
44–
471
74–
345
46–
119
26–
718
25–
736
342
6273
– 11
HR
4146
– 5
9689
748
52–
411
19–
810
18–
844
431
7981
– 2
IT29
36–
755
550
3540
– 5
1021
– 11
1015
– 5
3343
– 10
5872
– 14
CY31
292
6454
1034
322
910
– 1
1313
020
173
5456
– 2
LV31
274
6662
439
2910
107
325
250
1517
– 2
5350
3LT
3635
178
726
4339
413
94
3536
– 1
1720
– 3
5658
– 2
LU43
50–
775
705
4753
– 6
1732
– 15
2228
– 6
4449
– 5
6882
– 14
HU
3034
– 4
5150
138
41–
311
14–
313
19–
625
27–
257
65–
8M
T43
4631
8458
2654
540
826
– 18
1717
060
62–
275
83–
8N
L49
61–
1286
824
5768
– 11
2041
– 21
3037
– 7
4458
– 14
6982
– 13
AT46
55–
979
790
5461
– 7
1834
– 16
2044
– 24
3744
– 7
7276
– 4
PL25
28–
361
63–
230
31–
16
7–
129
36–
711
16–
550
60–
10PT
4044
– 4
8179
248
50–
211
19–
811
20–
955
62–
778
83–
5RO
1416
– 2
3236
– 4
1617
– 1
55
07
12–
510
100
4150
– 9
SI44
413
8172
955
478
1520
– 5
2240
– 18
3329
477
80–
3SK
3232
065
632
3836
29
10–
123
31–
822
25–
360
61–
1FI
5456
– 2
8872
1664
65–
129
36–
753
467
4148
– 7
6880
– 12
SE49
53–
470
74–
458
61–
324
28–
432
38–
639
44–
569
79–
10U
K53
60–
779
85–
663
64–
126
38–
124
5–
142
53–
1174
81–
7So
urce
: Eu
rost
at (i
soc_
sk_d
skl_
i), 2
019.
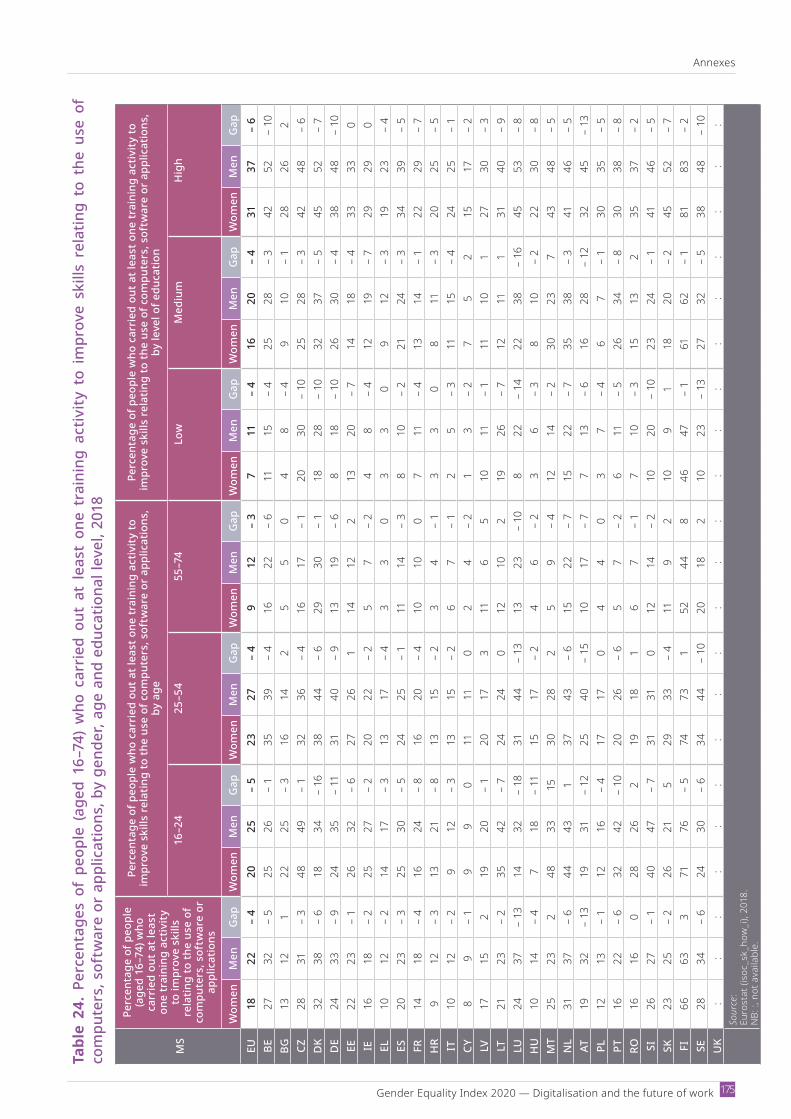
Gender Equality Index 2020 — Digi talisation and the future of work
Annexes
175
Tabl
e 24
. Pe
rcen
tage
s of
peo
ple
(age
d 16
–74)
who
car
ried
out
at l
east
one
tra
inin
g ac
tivity
to
impr
ove
skill
s re
latin
g to
the
use
of
com
pute
rs, s
oftw
are
or a
pplic
atio
ns, b
y ge
nder
, age
and
edu
catio
nal l
evel
, 201
8
MS
Perc
enta
ge o
f peo
ple
(age
d 16
–74)
who
ca
rrie
d ou
t at l
east
on
e tr
aini
ng a
ctiv
ity
to im
prov
e sk
ills
rela
ting
to th
e us
e of
co
mpu
ters
, sof
twar
e or
ap
plic
atio
ns
Perc
enta
ge o
f peo
ple
who
car
ried
out a
t lea
st o
ne tr
aini
ng a
ctiv
ity to
im
prov
e sk
ills
rela
ting
to th
e us
e of
com
pute
rs, s
oftw
are
or a
pplic
atio
ns,
by a
ge
Perc
enta
ge o
f peo
ple
who
car
ried
out a
t lea
st o
ne tr
aini
ng a
ctiv
ity to
im
prov
e sk
ills
rela
ting
to th
e us
e of
com
pute
rs, s
oftw
are
or a
pplic
atio
ns,
by le
vel o
f edu
catio
n
16–2
425
–54
55–7
4Lo
w
Med
ium
Hig
h
Wom
enM
enG
apW
omen
Men
Gap
Wom
enM
enG
apW
omen
Men
Gap
Wom
enM
enG
apW
omen
Men
Gap
Wom
enM
enG
apEU
1822
– 4
2025
– 5
2327
– 4
912
– 3
711
– 4
1620
– 4
3137
– 6
BE27
32–
525
26–
135
39–
416
22–
611
15–
425
28–
342
52–
10BG
1312
122
25–
316
142
55
04
8–
49
10–
128
262
CZ28
31–
348
49–
132
36–
416
17–
120
30–
1025
28–
342
48–
6D
K32
38–
618
34–
1638
44–
629
30–
118
28–
1032
37–
545
52–
7D
E24
33–
924
35–
1131
40–
913
19–
68
18–
1026
30–
438
48–
10EE
2223
– 1
2632
– 6
2726
114
122
1320
– 7
1418
– 4
3333
0IE
1618
– 2
2527
– 2
2022
– 2
57
– 2
48
– 4
1219
– 7
2929
0EL
1012
– 2
1417
– 3
1317
– 4
33
03
30
912
– 3
1923
– 4
ES20
23–
325
30–
524
25–
111
14–
38
10–
221
24–
334
39–
5FR
1418
– 4
1624
– 8
1620
– 4
1010
07
11–
413
14–
122
29–
7H
R9
12–
313
21–
813
15–
23
4–
13
30
811
– 3
2025
– 5
IT10
12–
29
12–
313
15–
26
7–
12
5–
311
15–
424
25–
1CY
89
– 1
99
011
110
24
– 2
13
– 2
75
215
17–
2LV
1715
219
20–
120
173
116
510
11–
111
101
2730
– 3
LT21
23–
235
42–
724
240
1210
219
26–
712
111
3140
– 9
LU24
37–
1314
32–
1831
44–
1313
23–
108
22–
1422
38–
1645
53–
8H
U10
14–
47
18–
1115
17–
24
6–
23
6–
38
10–
222
30–
8M
T25
232
4833
1530
282
59
– 4
1214
– 2
3023
743
48–
5N
L31
37–
644
431
3743
– 6
1522
– 7
1522
– 7
3538
– 3
4146
– 5
AT19
32–
1319
31–
1225
40–
1510
17–
77
13–
616
28–
1232
45–
13PL
1213
– 1
1216
– 4
1717
04
40
37
– 4
67
– 1
3035
– 5
PT16
22–
632
42–
1020
26–
65
7–
26
11–
526
34–
830
38–
8RO
1616
028
262
1918
16
7–
17
10–
315
132
3537
– 2
SI26
27–
140
47–
731
310
1214
– 2
1020
– 10
2324
– 1
4146
– 5
SK23
25–
226
215
2933
– 4
119
210
91
1820
– 2
4552
– 7
FI66
633
7176
– 5
7473
152
448
4647
– 1
6162
– 1
8183
– 2
SE28
34–
624
30–
634
44–
1020
182
1023
– 13
2732
– 5
3848
– 10
UK
::
::
::
::
::
::
::
::
::
::
:So
urce
: Eu
rost
at (i
soc_
sk_h
ow_i
), 20
18.
NB:
:, n
ot a
vaila
ble.
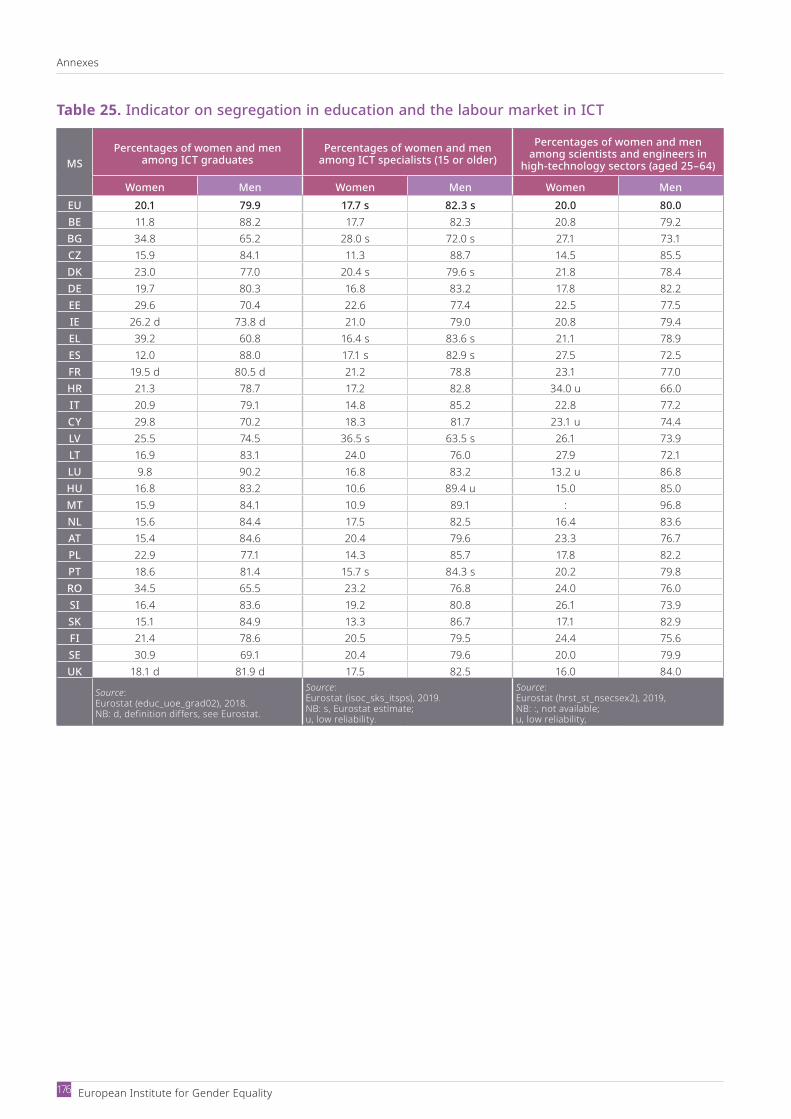
Annexes
European Institute for Gender Equality 176
Table 25. Indicator on segregation in education and the labour market in ICT
MSPercentages of women and men
among ICT graduatesPercentages of women and men
among ICT specialists (15 or older)Percentages of women and men
among scientists and engineers in high-technology sectors (aged 25–64)
Women Men Women Men Women MenEU 20.1 79.9 17.7 s 82.3 s 20.0 80.0BE 11.8 88.2 17.7 82.3 20.8 79.2BG 34.8 65.2 28.0 s 72.0 s 27.1 73.1CZ 15.9 84.1 11.3 88.7 14.5 85.5DK 23.0 77.0 20.4 s 79.6 s 21.8 78.4DE 19.7 80.3 16.8 83.2 17.8 82.2EE 29.6 70.4 22.6 77.4 22.5 77.5IE 26.2 d 73.8 d 21.0 79.0 20.8 79.4EL 39.2 60.8 16.4 s 83.6 s 21.1 78.9ES 12.0 88.0 17.1 s 82.9 s 27.5 72.5FR 19.5 d 80.5 d 21.2 78.8 23.1 77.0HR 21.3 78.7 17.2 82.8 34.0 u 66.0IT 20.9 79.1 14.8 85.2 22.8 77.2CY 29.8 70.2 18.3 81.7 23.1 u 74.4LV 25.5 74.5 36.5 s 63.5 s 26.1 73.9LT 16.9 83.1 24.0 76.0 27.9 72.1LU 9.8 90.2 16.8 83.2 13.2 u 86.8HU 16.8 83.2 10.6 89.4 u 15.0 85.0MT 15.9 84.1 10.9 89.1 : 96.8NL 15.6 84.4 17.5 82.5 16.4 83.6AT 15.4 84.6 20.4 79.6 23.3 76.7PL 22.9 77.1 14.3 85.7 17.8 82.2PT 18.6 81.4 15.7 s 84.3 s 20.2 79.8RO 34.5 65.5 23.2 76.8 24.0 76.0SI 16.4 83.6 19.2 80.8 26.1 73.9SK 15.1 84.9 13.3 86.7 17.1 82.9FI 21.4 78.6 20.5 79.5 24.4 75.6SE 30.9 69.1 20.4 79.6 20.0 79.9UK 18.1 d 81.9 d 17.5 82.5 16.0 84.0
Source: Eurostat (educ_uoe_grad02), 2018.NB: d, definition differs, see Eurostat.
Source: Eurostat (isoc_sks_itsps), 2019.NB: s, Eurostat estimate;u, low reliability.
Source: Eurostat (hrst_st_nsecsex2), 2019,NB: :, not available;u, low reliability,
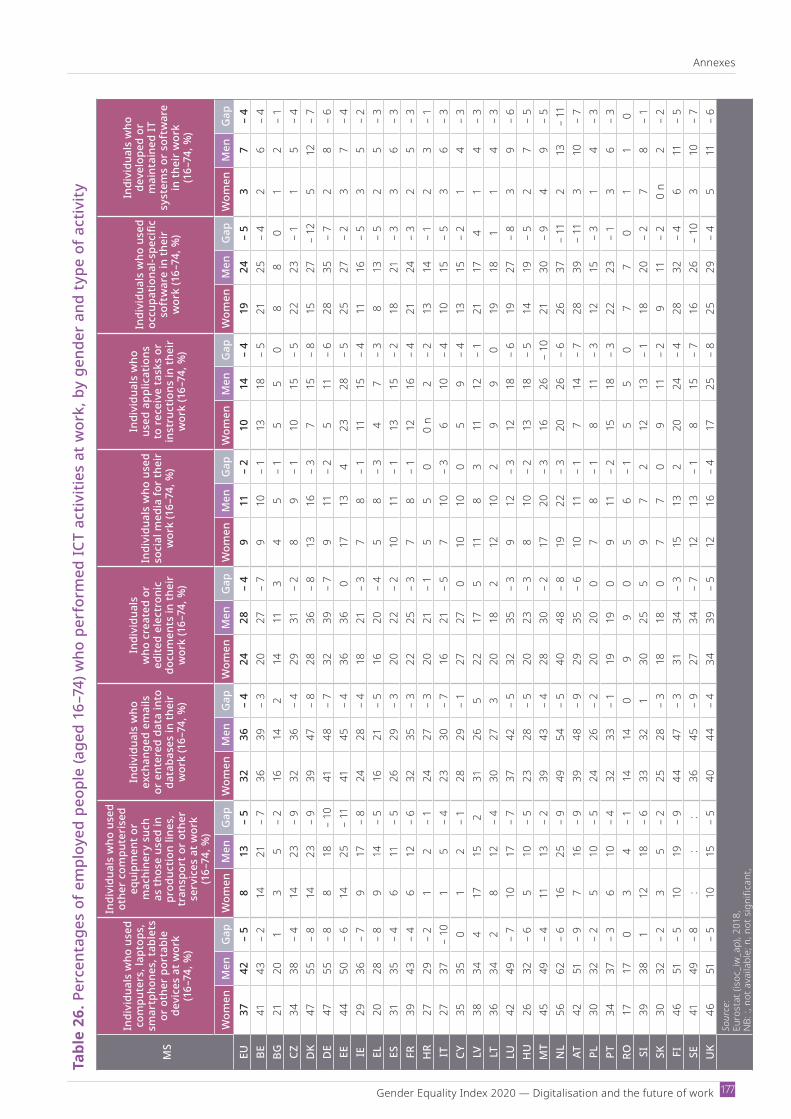
Gender Equality Index 2020 — Digi talisation and the future of work
Annexes
177
Tabl
e 26
. Per
cent
ages
of e
mpl
oyed
peo
ple
(age
d 16
–74)
who
per
form
ed IC
T ac
tiviti
es a
t wor
k, b
y ge
nder
and
typ
e of
act
ivity
MS
Indi
vidu
als
who
use
d co
mpu
ters
, lap
tops
, sm
artp
hone
s, ta
blet
s or
oth
er p
orta
ble
devi
ces
at w
ork
(16–
74, %
)
Indi
vidu
als
who
use
d ot
her
com
pute
rise
d eq
uipm
ent o
r m
achi
nery
suc
h as
thos
e us
ed in
pr
oduc
tion
lines
, tr
ansp
ort o
r ot
her
serv
ices
at w
ork
(16–
74, %
)
Indi
vidu
als
who
ex
chan
ged
emai
ls
or e
nter
ed d
ata
into
da
taba
ses
in th
eir
wor
k (1
6–74
, %)
Indi
vidu
als
who
cre
ated
or
edite
d el
ectr
onic
do
cum
ents
in th
eir
wor
k (1
6–74
, %)
Indi
vidu
als
who
use
d so
cial
med
ia fo
r th
eir
wor
k (1
6–74
, %)
Indi
vidu
als
who
us
ed a
pplic
atio
ns
to r
ecei
ve ta
sks
or
inst
ruct
ions
in th
eir
wor
k (1
6–74
, %)
Indi
vidu
als
who
use
d oc
cupa
tiona
l-spe
cific
so
ftw
are
in th
eir
wor
k (1
6–74
, %)
Indi
vidu
als
who
de
velo
ped
or
mai
ntai
ned
IT
syst
ems
or s
oftw
are
in th
eir
wor
k
(16–
74, %
)
Wom
enM
enG
apW
omen
Men
Gap
Wom
enM
enG
apW
omen
Men
Gap
Wom
enM
enG
apW
omen
Men
Gap
Wom
enM
enG
apW
omen
Men
Gap
EU37
42–
58
13–
532
36–
424
28–
49
11–
210
14–
419
24–
53
7–
4BE
4143
– 2
1421
– 7
3639
– 3
2027
– 7
910
– 1
1318
– 5
2125
– 4
26
– 4
BG21
201
35
– 2
1614
214
113
45
– 1
55
08
80
12
– 1
CZ34
38–
414
23–
932
36–
429
31–
28
9–
110
15–
522
23–
11
5–
4D
K47
55–
814
23–
939
47–
828
36–
813
16–
37
15–
815
27–
125
12–
7D
E47
55–
88
18–
1041
48–
732
39–
79
11–
25
11–
628
35–
72
8–
6EE
4450
– 6
1425
– 11
4145
– 4
3636
017
134
2328
– 5
2527
– 2
37
– 4
IE29
36–
79
17–
824
28–
418
21–
37
8–
111
15–
411
16–
53
5–
2EL
2028
– 8
914
– 5
1621
– 5
1620
– 4
58
– 3
47
– 3
813
– 5
25
– 3
ES31
35–
46
11–
526
29–
320
22–
210
11–
113
15–
218
21–
33
6–
3FR
3943
– 4
612
– 6
3235
– 3
2225
– 3
78
– 1
1216
– 4
2124
– 3
25
– 3
HR
2729
– 2
12
– 1
2427
– 3
2021
– 1
55
00
n2
– 2
1314
– 1
23
– 1
IT27
37–
101
5–
423
30–
716
21–
57
10–
36
10–
410
15–
53
6–
3CY
3535
01
2–
128
29–
127
270
1010
05
9–
413
15–
21
4–
3LV
3834
417
152
3126
522
175
118
311
12–
121
174
14
– 3
LT36
342
812
– 4
3027
320
182
1210
29
90
1918
11
4–
3LU
4249
– 7
1017
– 7
3742
– 5
3235
– 3
912
– 3
1218
– 6
1927
– 8
39
– 6
HU
2632
– 6
510
– 5
2328
– 5
2023
– 3
810
– 2
1318
– 5
1419
– 5
27
– 5
MT
4549
– 4
1113
– 2
3943
– 4
2830
– 2
1720
– 3
1626
– 10
2130
– 9
49
– 5
NL
5662
– 6
1625
– 9
4954
– 5
4048
– 8
1922
– 3
2026
– 6
2637
– 11
213
– 11
AT42
51–
97
16–
939
48–
929
35–
610
11–
17
14–
728
39–
113
10–
7PL
3032
– 2
510
– 5
2426
– 2
2020
07
8–
18
11–
312
15–
31
4–
3PT
3437
– 3
610
– 4
3233
– 1
1919
09
11–
215
18–
322
23–
13
6–
3RO
1717
03
4–
114
140
99
05
6–
15
50
77
01
10
SI39
381
1218
– 6
3332
130
255
97
212
13–
118
20–
27
8–
1SK
3032
– 2
35
– 2
2528
– 3
1818
07
70
911
– 2
911
– 2
0 n
2–
2FI
4651
– 5
1019
– 9
4447
– 3
3134
– 3
1513
220
24–
428
32–
46
11–
5SE
4149
– 8
::
:36
45–
927
34–
712
13–
18
15–
716
26–
103
10–
7U
K46
51–
510
15–
540
44–
434
39–
512
16–
417
25–
825
29–
45
11–
6So
urce
: Eu
rost
at (i
soc_
iw_a
p), 2
018,
NB:
:, n
ot a
vaila
ble;
n, n
ot s
igni
fican
t,

Annexes
European Institute for Gender Equality 178
Table 27. Percentages of people (aged 20–64) working part-time in ICT, by gender, and gender pay gap in ICT
MSPercentage of people (aged 20–64) working part-time in ICT Gender pay gap (%)
Women Men Gap ICT professions All professionsEU 16.5 5.4 11.1 11.1 17.1BE 15.1 5.0 10.1 1.6 6.6BG 1.2 d 1.8 d – 0.6 8.7 14.2CZ 10.3 3.8 6.5 17.2 22.5DK 16.7 8.3 8.4 5.7 16.0DE 27.6 7.7 19.9 6.3 22.3EE 7.5 6.5 1.0 17.5 28.1IE 6.1 1.8 4.3 11.6 13.9EL 4.3 3.1 1.2 12.1 12.5ES 12.7 3.5 9.2 6.4 14.9FR 13.2 3.8 9.4 2.1 15.5HR 0.0 4.5 – 4.5 6.9 8.7IT 18.0 4.8 13.2 14.6 6.1CY 1.7 2.1 – 0.4 – 7.6 14.2LV : 0.9 : 9.4 17.3LT 4.6 3.6 1.0 18.0 13.3LU 24.7 4.0 20.7 6.9 5.4HU 0.7 0.9 – 0.2 : 15.1MT : : : 8.4 10.6NL 44.2 17.3 26.9 9.0 16.1AT 34.2 9.8 24.4 15.9 22.2PL 5.7 d 2.5 d 3.2 16.6 7.7PT 3.2 2.7 0.5 – 1.5 14.9RO 0.0 0.6 – 0.6 13.9 4.5SI 8.5 d 5.3 d 3.2 7.4 7.0SK 3.2 4.0 – 0.8 13.6 19.7FI 9.7 5.9 3.8 3.8 18.4SE 11.2 7.4 3.8 3.6 13.8UK 16.2 3.1 13.1 13.9 20.9
Source: EULFS, EIGE’s elaboration on microdata, 2018,NB: d, definition differs (ICT workers do not include service managers).
Source: SES, EIGE calculations using microdata, 2014.NB: :, not available.

GETTING IN TOUCH WITH THE EU
IN PERSONAll over the European Union there are hundreds of Europe Direct information centres. You can find the address of the centre nearest you at: https://europa.eu/european-union/contact_en
ON THE PHONE OR BY EMAILEurope Direct is a service that answers your questions about the European Union.
You can contact this service:– by freephone: 00 800 6 7 8 9 10 11 (certain operators may charge for these calls),– at the following standard number: +32 22999696, or – by email via: https://europa.eu/european-union/contact_en
FINDING INFORMATION ABOUT THE EU
ONLINEInformation about the European Union in all the official languages of the EU is available on the Europa website at: https://europa.eu/european-union/index_en
EU PUBLICATIONSYou can download or order free and priced EU publications from: https://publications.europa.eu/en/publications. Multiple copies of free publications may be obtained by contacting Europe Direct or your local information centre (see https://europa.eu/european-union/contact_en).
EU LAW AND RELATED DOCUMENTSFor access to legal information from the EU, including all EU law since 1952 in all the official language versions, go to EUR-Lex at: http://eur-lex.europa.eu
OPEN DATA FROM THE EUThe EU Open Data Portal (http://data.europa.eu/euodp/en) provides access to datasets from the EU. Data can be downloaded and reused for free, for both commercial and non-commercial purposes.
www.eige.europa.eu