
GCSE (9–1) Combined Science (Biology) A (Gateway ... - OCR
24
*7025185164* F Oxford Cambridge and RSA GCSE (9–1) Combined Science (Biology) A (Gateway Science) J250/02 Paper 2, B4–B6 and CS7 (PAGs B1–B5) (Foundation Tier) Monday 11 June 2018 – Morning Time allowed: 1 hour 10 minutes You must have: • a ruler (cm/mm) You may use: • a scientific or graphical calculator • an HB pencil Last name First name Candidate number Centre number INSTRUCTIONS • Use black ink. You may use an HB pencil for graphs and diagrams. • Complete the boxes above with your name, centre number and candidate number. • Answer all the questions. • Write your answer to each question in the space provided. If additional space is required, use the lined page(s) at the end of this booklet. The question number(s) must be clearly shown. • Do not write in the barcodes. INFORMATION • The total mark for this paper is 60. • The marks for each question are shown in brackets [ ]. • Quality of extended responses will be assessed in questions marked with an asterisk (*). • This document consists of 24 pages. Turn over © OCR 2018 [601/8687/2] DC (ST/JG) 156212/9 OCR is an exempt Charity * J 2 5 0 0 2 *
-
Upload
khangminh22 -
Category
Documents
-
view
2 -
download
0
Transcript of GCSE (9–1) Combined Science (Biology) A (Gateway ... - OCR

*7025185164*
FOxford Cambridge and RSA
GCSE (9–1) Combined Science (Biology) A (Gateway Science)J250/02 Paper 2, B4–B6 and CS7 (PAGs B1–B5) (Foundation Tier)
Monday 11 June 2018 – MorningTime allowed: 1 hour 10 minutes
You must have:• a ruler (cm/mm)
You may use:• a scientific or graphical calculator• an HB pencil
Last name
First name
Candidatenumber
Centrenumber
INSTRUCTIONS• Use black ink. You may use an HB pencil for graphs and diagrams. • Complete the boxes above with your name, centre number and candidate number.• Answer all the questions.• Write your answer to each question in the space provided. If additional space is
required, use the lined page(s) at the end of this booklet. The question number(s) must be clearly shown.
• Do not write in the barcodes.
INFORMATION• The total mark for this paper is 60.• The marks for each question are shown in brackets [ ].• Quality of extended responses will be assessed in questions marked with an
asterisk (*).• This document consists of 24 pages.
Turn over© OCR 2018 [601/8687/2]DC (ST/JG) 156212/9
OCR is an exempt Charity
* J 2 5 0 0 2 *

2
© OCR 2018
SECTION A
Answer all the questions.
You should spend a maximum of 20 minutes on this section.
1 Look at the diagram of the carbon cycle.
Coal, oiland gas
Gradual production offossil fuels
Carbon dioxide inatmosphere
X
Which process is shown by the arrow labelled X?
A Decomposition
B Evaporation
C Photosynthesis
D Respiration
Your answer [1]

3
Turn over© OCR 2018
2 AIDS is a human disease.
Which statement describes AIDS?
A Communicable bacterial disease
B Communicable viral disease
C Non-communicable bacterial disease
D Non-communicable viral disease
Your answer [1]
3 The diagram shows tissue that lines the airways of the lungs.
This tissue has structures to help defend the body against pathogens.
What are the structures?
A Cilia and cells that make acid
B Cilia and cells that make mucus
C Nasal hairs and cells that make acid
D Nasal hairs and cells that make mucus
Your answer [1]

4
© OCR 2018
4 Human waste can contain bacteria called E. coli. Human waste is found in sewage.
BA
C
D
Cleanwater
Sewageworks
Forest
Riversource
Houses withsewage pipes
to the river
Crops heavilytreated with
fertiliser
Sea
River flowstoward sea
Which zone of the river will have the highest levels of E. coli?
Your answer [1]
5 Some countries plant new forests to help reduce their greenhouse gas emissions.
Why does planting new forests help reduce greenhouse gas emissions?
A Trees produce biomass.
B Trees take carbon dioxide from the air.
C Trees put oxygen into the air.
D Trees take water from the soil to prevent flooding.
Your answer [1]

5
Turn over© OCR 2018
6 The more salt you eat, the more salt will be found in the urine you make.
The graph shows the relationship between the amount of salt in urine and blood pressure.
151296300
0.4
0.8
1.2
0.2
0.6
1.0
1.4
Salt in urine(grams per day)
Blood pressure(arbitrary units)
Which statement is supported by the data?
A High blood pressure leads to an increased risk of developing heart disease.
B Less salt in the diet can lead to higher blood pressure.
C Less salt in the diet can lead to lower blood pressure.
D Low blood pressure leads to an increased risk of developing heart disease.
Your answer [1]

6
© OCR 2018
7 Sperm are made by meiosis.
Look at the diagram of meiosis.
Repeated celldivision and growth
MATURE SPERM
GERMINAL EPITHELIUM
A
B
C
D
At which stage A, B, C or D is the chromosome number halved?
Your answer [1]

7
Turn over© OCR 2018
8 There were 452 222 adult deaths in England in 2009.
It is estimated that 81 400 of these adult deaths were caused by smoking.
What percentage of adult deaths were caused by smoking in England in 2009?
A 0.18%
B 5.6%
C 18%
D 56%
Your answer [1]
9 Genes control eye colour.
The allele for brown eyes (B) is dominant over the allele for blue eyes (b).
Look at the genetic cross.
Bb x BB
Choose the possible outcome of offspring from this cross.
GenotypeOffspring genotype
ratioPhenotype
A All BB 1:0 All brown eyes
B BB and Bb 1:1 All brown eyes
C BB and Bb 3:1 Brown eyes and blue eyes
D Bb and bb 3:1 Brown eyes and blue eyes
Your answer [1]

8
© OCR 2018
10 Phylogeny is the study of evolutionary links.
Which of the following is important to make molecular phylogenic links?
A Behavioural features
B DNA sequencing
C Habitat analysis
D Phenotypical features
Your answer [1]
9
Turn over© OCR 2018
SECTION B
Answer all the questions.
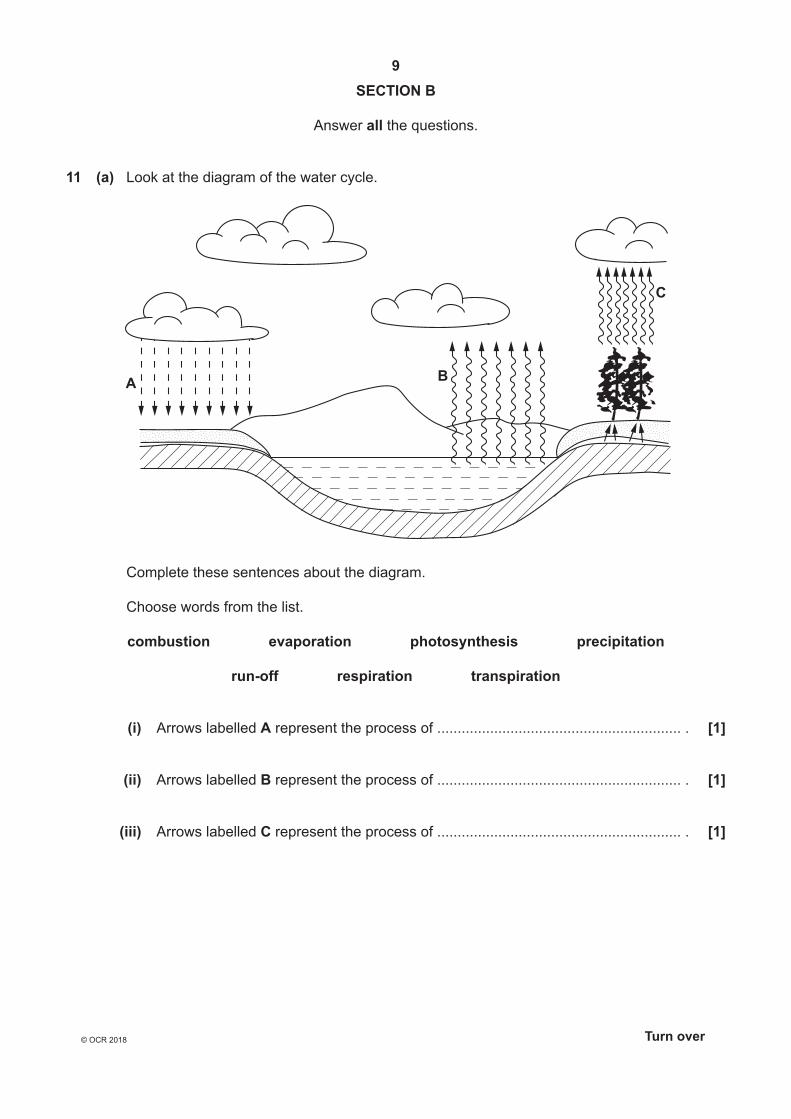
11 (a) Look at the diagram of the water cycle.
A B
C
Complete these sentences about the diagram.
Choose words from the list.
combustion evaporation photosynthesis precipitation
run-off respiration transpiration
(i) Arrows labelled A represent the process of ............................................................ . [1]
(ii) Arrows labelled B represent the process of ............................................................ . [1]
(iii) Arrows labelled C represent the process of ............................................................ . [1]

10
© OCR 2018
(b) Look at the diagram showing the food web in the lake.
Eagle Human
TroutGull
Shrimp Waterfowl
Invertebrates
PlanktonBacteriaand fungi
Water plants
Decomposing plant material
(i) How many predators does the shrimp have in this food web?
...................................................................................................................................... [1]
(ii) When plant material is decomposed by fungi, there is an increase in temperature.
Complete the sentences to explain why.
Choose words from the list.
endothermic excretion exothermic
respiration photosynthesis
During decomposition fungi release energy from the plants by the process of
................................................... .
This process releases energy as heat because the reaction is
................................................... . [2]

11
Turn over© OCR 2018
(c) Dogfish and minnows are fish that live in lakes.
Dogfish build nests to lay their eggs in. Minnows lay their eggs in the same nests as dogfish.
The dogfish protect the nest from predators.
Minnows move in and out of the nest. This helps to remove harmful bacteria and get oxygen to the eggs.
Dogfish usually eat minnows. When the dogfish have eggs they do not eat minnows.
(i) Dogfish have two different interactions with the minnows.
Write down the names of these two types of interactions.
Describe when each interaction takes place.
Interaction 1 ......................................................................................................................
...........................................................................................................................................
Interaction 2 ......................................................................................................................
...........................................................................................................................................[2]
(ii) One of the interactions benefits both minnows and dogfish.
Explain how.
...........................................................................................................................................
...........................................................................................................................................
...........................................................................................................................................
...................................................................................................................................... [2]

12
© OCR 2018
12 Farmers use fertilisers to improve crop yields.
The graph shows how the mass of one fertiliser affects maize yield.
00
2000
4000Maize yield(per hectare
/ kg)
Mass of fertiliser used (per hectare / kg)
6000
50 100 150 200 250 300
(a) What mass of fertiliser would you recommend to produce the best yield?
Explain your answer.
...................................................................................................................................................
...................................................................................................................................................
.............................................................................................................................................. [2]
(b) The fertiliser contains high amounts of nitrogen.
Describe one negative effect using fertiliser might have on the environment.
...................................................................................................................................................
.............................................................................................................................................. [1]

13
Turn over© OCR 2018
13 (a) Complete these sentences about the hormone FSH.
FSH is secreted by the ............................................... gland.
FSH causes an ............................................... to mature in the ovary.
FSH stimulates the ovaries to release the hormone ............................................... . [3]
(b) FSH hormone can be genetically engineered. The human gene for FSH is transferred into an animal cell.
Look at the diagram of a cell.
B
A
CD
The gene is put inside one of the structures labelled in the diagram.
Which structure is the gene put inside?
Choose from A, B, C, or D. ......................................
State why the gene is put there.
...................................................................................................................................................
.............................................................................................................................................. [2]

14
© OCR 2018
(c)* Beta carotene is the substance that makes carrots orange. Humans use beta carotene to make vitamin A. Vitamin A is needed for good vision.
‘Golden’ rice is a genetically modified (GM) crop. ‘Golden’ rice is made when the gene for beta carotene is added to rice.
Scientists do not know if the levels of beta carotene in ‘Golden’ rice will have any other effects on people eating the rice.
In some countries many people survive on a diet of mainly rice with no vegetables.
Do you think ‘Golden’ rice should be made to provide food for these people?
Include arguments for and against ‘Golden’ rice in your answer.
...................................................................................................................................................
...................................................................................................................................................
...................................................................................................................................................
...................................................................................................................................................
...................................................................................................................................................
...................................................................................................................................................
...................................................................................................................................................
...................................................................................................................................................
...................................................................................................................................................
...................................................................................................................................................
...................................................................................................................................................
.............................................................................................................................................. [6]

15
Turn over© OCR 2018
14 (a) Some children can inherit a rare kidney condition called ARPKD. It is caused by a recessive allele.
A pregnant woman has ARPKD. The baby’s father is heterozygous for ARPKD.
What is the probability of their baby having ARPKD?
Complete the genetic diagram to explain your answer.
Use the letters:
• R for the dominant allele
• r for the recessive allele.
r
r
Answer = ...................................... [2]
(b) (i) It is estimated that 1 in 70 people in the UK is a carrier of ARPKD.
The estimated population of the UK in 2011 was 63.2 million.
Estimate the number of people in the UK in 2011 who were carriers.
Answer = ...................................... [2]
(ii) Explain why this number is only an estimate and not the real number of carriers.
...........................................................................................................................................
...................................................................................................................................... [1]

16
© OCR 2018
(c) ARPKD can lead to kidney failure. People with kidney failure can use a dialysis machine.
The diagram shows how a dialysis machine works.
Blood in
Flow meter
Clot andbubble trap
Blood out
Dialysingfluid out
Partiallypermeablemembrane
Dialysingfluid in
A molecular model can be used to explain how the dialysis machine removes urea.
Pore inmembrane
Blood in Dialysing fluid
Key
= Water molecule
= Sugar molecule
= Urea molecule
The dialysis machine removes urea but not sugar.
Use the diagram to explain how.
...................................................................................................................................................
...................................................................................................................................................
.............................................................................................................................................. [2]

17
Turn over© OCR 2018
(d) The kidneys in people with ARPKD have not developed normally.
Stem cells could be used to repair the damaged kidneys.
Discuss reasons for and against using stem cells to treat ARPKD.
Reasons for ..............................................................................................................................
...................................................................................................................................................
...................................................................................................................................................
Reasons against ........................................................................................................................
...................................................................................................................................................
................................................................................................................................................... [3]

18
© OCR 2018
15 Three students model the determination of sex in humans.
They toss a coin 18 times and record the result.
The table shows the results and the ratio of the total heads : total tails.
Toss Outcome Total heads Total tails Ratio
1 Heads 1 0 1:0
2 Heads 2 0 2:0
3 Tails 2 1 2:1
4 Heads 3 1 3:1
5 Heads 4 1 4:1
6 Heads 5 1 5:1
7 Tails 5 2 5:2
8 Tails 5 3 5:3
9 Heads 6 3 2:1
10 Heads 7 3 7:3
11 Tails 7 4 7:4
12 Tails 7 5 7:5
13 Heads 8 5 8:5
14 Tails 8 6 8:6
15 Heads 9 6 3:2
16 Heads 10 6 .............
17 Tails 10 7 10:7
18 Tails 10 8 5:4
(a) The ratio for 16 is missing.
Calculate the ratio for 16 tosses.
Answer = ..................................... [1]

19
Turn over© OCR 2018
(b) None of the ratios match the expected ratio of males to females you would show in a genetic cross.
Here are three statements about the results:
Student A – The ratio after five tosses is closest to the expected outcome.
Student B – The ratio after ten tosses is closest to the expected outcome.
Student C – The ratio after eighteen tosses is closest to the expected outcome.
Which statement is correct?
Explain your answer.
...................................................................................................................................................
...................................................................................................................................................
.............................................................................................................................................. [2]
(c) The students want to improve the method to get a result that matches the expected ratio.
Write down one way to improve the method.
...................................................................................................................................................
.............................................................................................................................................. [1]

20
© OCR 2018
16 The picture shows a mealybug insect.
5 mm
This mealybug is a pest for orange tree growers.
The scientists compared the number of mealybugs found on two trees, tree A and tree B.
For each tree they:
• Collected a sample of mealybugs from the tree• Counted the number of mealybugs in each sample• Marked the mealybugs• Released the mealybugs back onto the tree they were collected from.
The next day another sample was collected from each tree.

21
Turn over© OCR 2018
(a) Describe how the scientists should collect and mark the mealybugs.
Include the equipment they need to use. You may include a diagram with your answer.
...................................................................................................................................................
...................................................................................................................................................
...................................................................................................................................................
...................................................................................................................................................
...................................................................................................................................................
.............................................................................................................................................. [3]
(b) Write down three precautions that should be taken when deciding how to mark the mealybugs.
1 ................................................................................................................................................
...................................................................................................................................................
2 ................................................................................................................................................
...................................................................................................................................................
3 ................................................................................................................................................
...................................................................................................................................................[3]

22
© OCR 2018
(c) The table shows the results for tree A.
Total number of mealybugs collected
on day 1
Total number of mealybugs collected on
day 2
Number of marked mealybugs collected on
day 2
150 60 18
(i) Estimate the population size of mealybugs on tree A.
Use the formula: Estimated population size =
Number in 1st sample × Number in 2nd sampleNumber in 2nd sample previously marked
Answer = ..................................... [1]
(ii) When using this method to estimate population, the scientists make several assumptions. One assumption is that there was no immigration of mealybugs between day 1 and 2.
Suggest two other assumptions they would make.
1 ........................................................................................................................................
...........................................................................................................................................
2 ........................................................................................................................................
...........................................................................................................................................[2]

23
© OCR 2018
(d) The number of mealybugs on each tree may be affected by the light intensity.
The scientists measured the light intensity for each tree at midday on day 1 of their investigation. Light intensity is measured using a light meter.
position of light meter
(i) Tree B had an estimated population of 250 mealybugs at the end of the investigation. Tree B had a higher light intensity reading than tree A.
Read this statement.
The mealybugs are thought to breed rapidly in low light conditions.
Do the results for the two trees support this statement?
Use the information above and your answer to (c)(i).
Explain your answer.
...........................................................................................................................................
...................................................................................................................................... [1]
(ii) Errors can occur when taking light meter readings.
Explain how errors occur and write down one way to take more precise readings.
...........................................................................................................................................
...........................................................................................................................................
...................................................................................................................................... [2]
END OF QUESTION PAPER

24
© OCR 2018
ADDITIONAL ANSWER SPACE
If additional space is required, you should use the following lined page(s). The question number(s) must be clearly shown in the margin(s).
..................................................................................................................................................................
..................................................................................................................................................................
..................................................................................................................................................................
..................................................................................................................................................................
..................................................................................................................................................................
..................................................................................................................................................................
..................................................................................................................................................................
..................................................................................................................................................................
..................................................................................................................................................................
..................................................................................................................................................................
..................................................................................................................................................................
..................................................................................................................................................................
..................................................................................................................................................................
..................................................................................................................................................................
..................................................................................................................................................................
..................................................................................................................................................................
..................................................................................................................................................................
..................................................................................................................................................................
..................................................................................................................................................................
..................................................................................................................................................................
Oxford Cambridge and RSA
Copyright Information
OCR is committed to seeking permission to reproduce all third-party content that it uses in its assessment materials. OCR has attempted to identify and contact all copyright holders whose work is used in this paper. To avoid the issue of disclosure of answer-related information to candidates, all copyright acknowledgements are reproduced in the OCR Copyright Acknowledgements Booklet. This is produced for each series of examinations and is freely available to download from our public website (www.ocr.org.uk) after the live examination series.
If OCR has unwittingly failed to correctly acknowledge or clear any third-party content in this assessment material, OCR will be happy to correct its mistake at the earliest possible opportunity.
For queries or further information please contact the Copyright Team, First Floor, 9 Hills Road, Cambridge CB2 1GE.
OCR is part of the Cambridge Assessment Group; Cambridge Assessment is the brand name of University of Cambridge Local Examinations Syndicate (UCLES), which is itself a department of the University of Cambridge.