Gas phase infrared multiple-photon dissociation spectra of methanol, ethanol and propanol...
12
Gas phase infrared multiple-photon dissociation spectra of methanol, ethanol and propanol proton-bound dimers, protonated propanol and the propanol/water proton-bound dimer Travis D. Fridgen,* a Luke MacAleese, b Terry B. McMahon, c Joel Lemaire b and Philippe Maitre b Received 23rd November 2005, Accepted 11th January 2006 First published as an Advance Article on the web 26th January 2006 DOI: 10.1039/b516661f The infrared multiphoton dissociation (IRMPD) spectra of three homogenous proton-bound dimers are presented and the major features are assigned based on comparisons with the neutral alcohol and with density functional theory calculations. As well, the IRMPD spectra of protonated propanol and the propanol/water proton-bound dimer (or singly hydrated protonated propanol) are presented and analysed. Two primary IRMPD photoproducts were observed for each of the alcohol proton bound dimers and were found to vary with the frequency of the radiation impinging upon the ions. For example, when the proton-bound dimer absorbs weakly a larger amount of S N 2 product, protonated ether and water, are observed. When the proton-bound dimer absorbs more strongly, an increase in the simple dissociation product, protonated alcohol and neutral alcohol, is observed. With the aid of RRKM calculations this frequency dependence of the branching ratio is explained by assuming that photon absorption is faster than dissociation for these species and that only a few photons extra are necessary to make the higher-energy dissociation channel (simple cleavage) competitive with the lower energy (S N 2) reaction channel. 1. Introduction Among the many novel bonding features exhibited by gas phase ions, strong hydrogen bonding is perhaps the most interesting and most important. In the formation of an ion– molecule association adduct, the presence of a centre of charge enhances both electrostatic and polarization interactions but, in addition, can also induce changes in the covalent structure of the participants in the association adduct. In the case of hydrogen bonded adducts, this change in covalent structure frequently takes the form of a partial proton transfer in which a proton appears to be shared between two, or more, basic sites of the molecules involved in adduct formation. In the case of adducts involving the same atom or molecule, the proton may be shared equally by the participants. Thus, for example, the protonated water dimer, H 5 O 2 1 , is predicted to exhibit a structure in which the bridging proton is equidistant from the two oxygen atoms of the participating water molecules. 1 This yields the so-called Zundel structure for the protonated water dimer. Similarly, the bifluoride ion, FHF , which has the strongest known hydrogen bond, has a proton symmetrically disposed between the two fluoride ions in a linear geometry. 2 Structures such as these two give rise to a relatively broad potential well for the proton motion which is flatter than a more conventional parabolic potential and thus leads to an anharmonic character of the vibrational motion associated with the proton motion. Very recently, the advent of the use of tunable, high-power, infrared-output, free-electron lasers (FEL) in conjunction with ion trap mass spectrometers (either FTICR or quadrupole) has permitted the study of the wavelength dependence of photo-dissociation of ion–molecule adducts which, in effect, yields a vibrational signature of the adduct in question. In addition OPO lasers have recently become available with tunability through the common fingerprint range of many molecules in the 600–2000 cm 1 range. Although the power of these OPO lasers is usually insufficient to induce the dissociation of strongly hydrogen bonded adducts, the use of a ‘‘messenger’’ atom or molecule, 3 weakly attached to the species of interest, permits a vibrational signature to be obtained through the loss of the messenger species. Both FEL and OPO techniques have recently been applied to the investigation of the vibrational spectrum of the H 5 O 2 1 species. The two FEL studies 4,5 and the OPO investigation 6 all agree on the presence of an intense band in the 1740–1770 cm 1 range corresponding to the bending motion of the terminal water molecules with mixing of the central O–H–O stretch. Based on a fairly low level density functional theory (DFT) calculation of the harmonic frequency of the central O–H–O asymmetric stretch as 1004 cm 1 , Fridgen et al. 4 assigned the relatively sharp feature in their FEL spectrum at 990 cm 1 to this vibration. Using a more sophisticated quantum 4D model Vener et al. 7 calculated a value of 1158 cm 1 for this vibration to which Asmis et al. 5 assigned a 1317 cm 1 feature in their FEL spectrum. The OPO-messenger technique of Headrick a Department of Chemistry, Memorial University of Newfoundland, St. John’s NL, Canada A1B 3X7 b Laboratoire de Chimie Physique, UMR 8000 CNRS-Universite de Paris XI, Campus d’Orsay, Batiment 350, 91405 Orsay Cedex, France c Department of Chemistry, University of Waterloo, Waterloo, ON, Canada N2L 3G1 This journal is c the Owner Societies 2006 Phys. Chem. Chem. Phys., 2006, 8, 955–966 | 955 PAPER www.rsc.org/pccp | Physical Chemistry Chemical Physics
-
Upload
independent -
Category
Documents
-
view
1 -
download
0
Transcript of Gas phase infrared multiple-photon dissociation spectra of methanol, ethanol and propanol...
Gas phase infrared multiple-photon dissociation spectra of methanol,
ethanol and propanol proton-bound dimers, protonated propanol and the
propanol/water proton-bound dimer
Travis D. Fridgen,*aLuke MacAleese,
bTerry B. McMahon,
cJoel Lemaire
band
Philippe Maitreb
Received 23rd November 2005, Accepted 11th January 2006
First published as an Advance Article on the web 26th January 2006
DOI: 10.1039/b516661f
The infrared multiphoton dissociation (IRMPD) spectra of three homogenous proton-bound
dimers are presented and the major features are assigned based on comparisons with the neutral
alcohol and with density functional theory calculations. As well, the IRMPD spectra of
protonated propanol and the propanol/water proton-bound dimer (or singly hydrated protonated
propanol) are presented and analysed. Two primary IRMPD photoproducts were observed for
each of the alcohol proton bound dimers and were found to vary with the frequency of the
radiation impinging upon the ions. For example, when the proton-bound dimer absorbs weakly a
larger amount of SN2 product, protonated ether and water, are observed. When the proton-bound
dimer absorbs more strongly, an increase in the simple dissociation product, protonated alcohol
and neutral alcohol, is observed. With the aid of RRKM calculations this frequency dependence
of the branching ratio is explained by assuming that photon absorption is faster than dissociation
for these species and that only a few photons extra are necessary to make the higher-energy
dissociation channel (simple cleavage) competitive with the lower energy (SN2) reaction channel.
1. Introduction
Among the many novel bonding features exhibited by gas
phase ions, strong hydrogen bonding is perhaps the most
interesting and most important. In the formation of an ion–
molecule association adduct, the presence of a centre of charge
enhances both electrostatic and polarization interactions but,
in addition, can also induce changes in the covalent structure
of the participants in the association adduct. In the case of
hydrogen bonded adducts, this change in covalent structure
frequently takes the form of a partial proton transfer in which
a proton appears to be shared between two, or more, basic
sites of the molecules involved in adduct formation. In the case
of adducts involving the same atom or molecule, the proton
may be shared equally by the participants. Thus, for example,
the protonated water dimer, H5O21, is predicted to exhibit a
structure in which the bridging proton is equidistant from the
two oxygen atoms of the participating water molecules.1 This
yields the so-called Zundel structure for the protonated water
dimer. Similarly, the bifluoride ion, FHF�, which has the
strongest known hydrogen bond, has a proton symmetrically
disposed between the two fluoride ions in a linear geometry.2
Structures such as these two give rise to a relatively broad
potential well for the proton motion which is flatter than a
more conventional parabolic potential and thus leads to an
anharmonic character of the vibrational motion associated
with the proton motion.
Very recently, the advent of the use of tunable, high-power,
infrared-output, free-electron lasers (FEL) in conjunction with
ion trap mass spectrometers (either FTICR or quadrupole)
has permitted the study of the wavelength dependence of
photo-dissociation of ion–molecule adducts which, in effect,
yields a vibrational signature of the adduct in question. In
addition OPO lasers have recently become available with
tunability through the common fingerprint range of many
molecules in the 600–2000 cm�1 range. Although the power
of these OPO lasers is usually insufficient to induce the
dissociation of strongly hydrogen bonded adducts, the use of
a ‘‘messenger’’ atom or molecule,3 weakly attached to the
species of interest, permits a vibrational signature to be
obtained through the loss of the messenger species. Both
FEL and OPO techniques have recently been applied to the
investigation of the vibrational spectrum of the H5O21 species.
The two FEL studies4,5 and the OPO investigation6 all agree
on the presence of an intense band in the 1740–1770 cm�1
range corresponding to the bending motion of the terminal
water molecules with mixing of the central O–H–O stretch.
Based on a fairly low level density functional theory (DFT)
calculation of the harmonic frequency of the central O–H–O
asymmetric stretch as 1004 cm�1, Fridgen et al.4 assigned the
relatively sharp feature in their FEL spectrum at 990 cm�1 to
this vibration. Using a more sophisticated quantum 4D model
Vener et al.7 calculated a value of 1158 cm�1 for this vibration
to which Asmis et al.5 assigned a 1317 cm�1 feature in their
FEL spectrum. The OPO-messenger technique of Headrick
aDepartment of Chemistry, Memorial University of Newfoundland,St. John’s NL, Canada A1B 3X7
bLaboratoire de Chimie Physique, UMR 8000 CNRS-Universite deParis XI, Campus d’Orsay, Batiment 350, 91405 Orsay Cedex,France
cDepartment of Chemistry, University of Waterloo, Waterloo, ON,Canada N2L 3G1
This journal is �c the Owner Societies 2006 Phys. Chem. Chem. Phys., 2006, 8, 955–966 | 955
PAPER www.rsc.org/pccp | Physical Chemistry Chemical Physics
et al.6 yields much sharper features, although admittedly
somewhat blue-shifted in the case of the asymmetric stretch
by the perturbation induced by the presence of the Ar or Ne
messenger.8 They find this band to be centered at 1080 cm�1
and estimate the blue-shift to be on the order of 60–110 cm�1
which would place the vibration for the isolated H5O21 species
at 970–1020 cm�1, in excellent agreement with the 990 cm�1
experimental assignment of Fridgen et al.4
Protonated dimers of oxygen n-donor bases in general
represent an especially interesting class of species for study.
The high electronegativity of oxygen results in substantial
hydrogen bond energies. For example, Larson andMcMahon9
have shown experimentally that symmetric proton bound
dimers of oxygen bases, no matter of what functionality, all
have hydrogen bond strengths of 30.5 � 1 kcal mol�1 and
quantum chemical calculations suggest that all have a sym-
metric, single minimum structure associated with the central
proton. With the exception of the hydrogen bonds found in
the bifluoride ion,10,11 FHF�, and the proton-bound dimer of
fluoromethane,12 (CH3F)2H1, these represent the strongest
known hydrogen bonds and are thus of considerable interest
to study as a class of bonding. Moore et al.13 were the first to
investigate the IR spectrum of proton bound dimers of an
organic oxygen base using a FEL facility. They obtained the
IR photo-dissociation spectra of the proton bound dimers of
dimethyl ether and diethyl ether from 600–1800 cm�1. In both
cases a well resolved feature was observed between 750 and
825 cm�1 which could be associated with the asymmetric
stretch mode of the O–H–O unit. Fridgen et al.14 subsequently
obtained spectra of the homogenous-proton bound dimers of
dimethyl ether, tetrahydrofuran and 1,4 dioxane. The spec-
trum for dimethyl ether was in excellent accord with that of
Moore et al.13 and they also showed that the two cyclic ethers
each exhibited well resolved bands in the same range for the
asymmetric stretch at 801 and 753 cm�1, respectively. In
addition the IRMPD spectrum of protonated diglyme was
also obtained which, in essence is an intramolecular symmetric
proton bound dimer.13 It too showed a sharp absorption
feature at 760 cm�1 associated with the asymmetric stretch
of the intramolecular bonding hydrogen. It is noteworthy that,
in the cases of all of the symmetric proton bound dimer of
ether species studied, excellent agreement was obtained be-
tween hybrid-DFT (B3LYP/6-31þG**) calculated vibrational
frequencies for the asymmetric stretching motion and those
experimentally observed.14 This was, however, not the case for
asymmetric proton bound dimers where considerable differ-
ences between calculated and observed frequencies were
found.14 This can be attributed to the sensitivity of the
calculated frequency to the exact position of the bridging
proton in the asymmetric hydrogen bond. While minor dis-
placements have little effect on the hydrogen bond energy, due
to the rather flat nature of the potential, such displacements
can, in fact, have a considerable influence on the calculated
vibrational frequency.
In the present work, the study of the vibrational signature of
proton bound dimers of oxygen n-donor bases is extended to
alcohols. These species represent an interesting case since they
are intermediates in the SN2 reaction between protonated and
neutral alcohols from which water elimination may occur to
yield protonated ether as the ionic product (see eqn (1) and
Scheme 1).
ðROHÞ2Hþ �!nhn
R2OHþ þH2O ð1Þ
Thus the dissociation of activated proton bound dimers may
proceed either via simple dissociation to yield the protonated
plus neutral alcohol (eqn (2)) or via rearrangement to the SN2
intermediate to yield protonated ether plus water. Fridgen and
McMahon have previously examined the potential energy
surfaces for these reactions, both experimentally and theore-
tically, and found that the SN2 reaction channel is favored
enthalpically, although involving a tighter, less entropically
favored, transition state.15,16 In previous IRMPD experiments
using a continuous wave CO2 laser, Bomse and Beauchamp17
observed exclusive formation of protonated ether products
from the proton bound dimers of methanol, ethanol and iso-
propanol. For n-propyl and n-butyl alcohol proton bound
dimers, however, other products were observed. In the n-
propyl case, for example, the major ionic product was proto-
nated n-propanol from simple bond cleavage (eqn (2)) with
small amounts of protonated di n-propyl ether (17%) and a
protonated propanol–water adduct (12%, eqn (3)) being
formed.
ðROHÞ2Hþ �!nhn
ROHþ2 þROH ð2Þ
ðCH3ðCH2Þ2OHÞ2Hþ �!nhn
CH3ðCH2Þ2OHþ2 ðH2OÞþ CH3CHQCH2 ð3Þ
In addition to the straightforward assignment of the vibra-
tional spectra of proton bound dimers of alcohols, the present
work shows very interesting trends in branching ratios for the
possible dissociation products. These trends provide some
considerable insight into the nature of the FEL IR photo-
dissociation process.
2. Methods
2.1 Experimental
The coupling of the FTICR and FEL as well as the method for
generating the proton bound dimers has been described in
detail previously14 and will not be repeated here. All experi-
ments were conducted at the Centre Laser Infrarouge d’Orsay
(CLIO),18 which houses a free electron laser (FEL) to which a
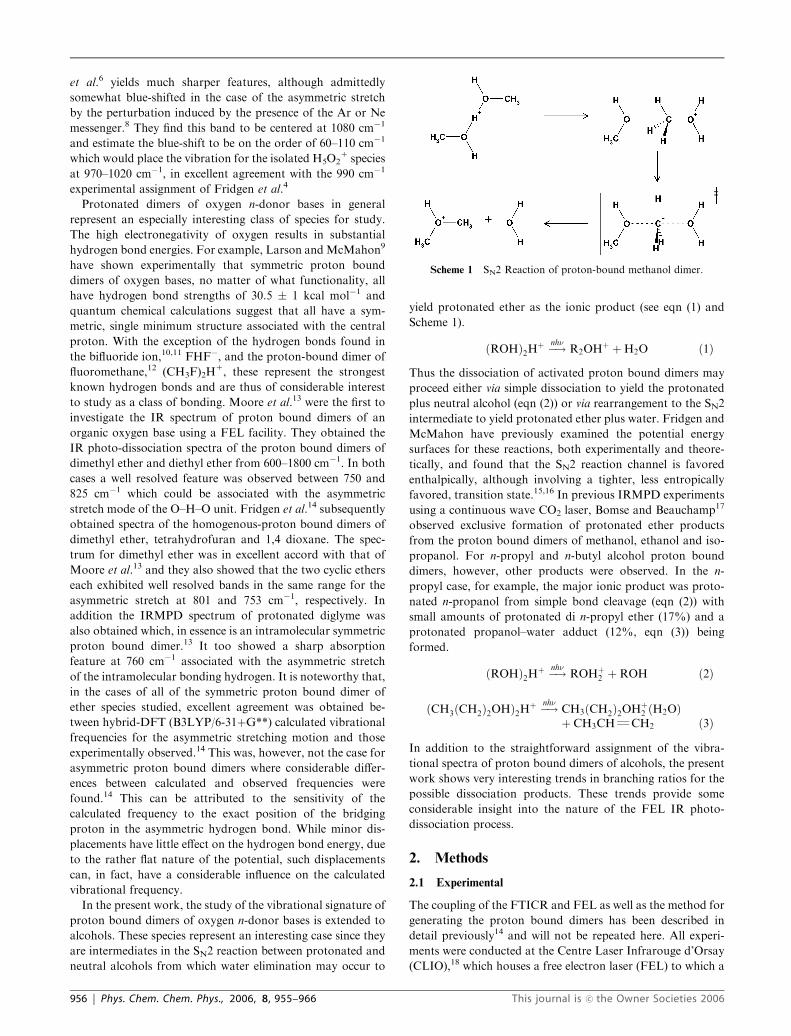
Scheme 1 SN2 Reaction of proton-bound methanol dimer.
956 | Phys. Chem. Chem. Phys., 2006, 8, 955–966 This journal is �c the Owner Societies 2006

Mobile Ion Cyclotron Resonance Analyser (MICRA)19 has
been coupled. IRMPD Efficiency spectra are obtained by
observing IRMPD of an ion of interest and all photoproducts
of IRMPD as a function of radiation wavelength. The
IRMPD efficiency is defined in eqn (4).
� lnIparent
Iparent þPi
IfragmentðiÞ
0@
1A ð4Þ
The FEL wavelength was scanned by B5 cm�1 steps, the laser
bandwidth is about 0.3–0.5% of the spectral wavelength. Ions
were irradiated for typically 2 s. The laser wavelength and its
bandwidth are monitored with a monochromator associated
with a spiricon multichannel detector.
2.2 Computational
Geometry optimization and frequency calculations were per-
formed using the hybrid density functional method B3LYP
and the 6-31þG** basis set within the Gaussian 0320 suite of
programs. These calculations have proven to be quite ade-
quate in predicting the infrared spectrum of the proton-bound
dimer of water4 and the complex of H5O21 with Ar,6 as well as
various ether proton-bound dimers.14 Except for protonated
propanol the infrared frequencies were used unscaled.
2.3 RRKM calculations
The rate constants for the SN2 reaction and for simple
dissociation of the proton-bound alcohol dimers, eqn (1) and
(2), respectively were calculated using RRKM theory21 given
by,
kuni ¼sh
NaðE � E0ÞrðEÞ ð5Þ
where s is the symmetry number, h is Planck’s constant. The
sum (Na) and density (r) of states were calculated using the
Beyer–Swinehart direct count algorithm, E is the internal
energy of the reacting proton-bound dimer, and E0 is the
activation energy. The vibrational wavenumbers for the pro-
ton-bound dimers of methanol, ethanol and propanol as well
as the transition states for reactions 1 and 2 used in this
RRKM modeling were taken from McCormack and Mayer.22
The activation energies used were 135, 135 and 132 kJ mol�1
for the methanol, ethanol, and propanol proton-bound di-
mers, respectively,23 for the simple dissociation reaction (eqn
(2)) and were 16.9, 16.1 and 15.7 kJ mol�1 less, respectively,
for the SN2 reactions (eqn (1)).15,16
3. Results and discussion
3.1 IRMPD of protonated alcohol dimers
Upon resonant infrared irradiation of the alcohol proton-
bound dimers with the CLIO FEL dissociation was observed.
For all three proton bound dimers the observed products
following infrared multiple photon absorption included pro-
tonated alcohol, produced by loss of neutral alcohol (eqn (2)),
as well as protonated ether formed by dehydration of the
proton-bound dimer (eqn (1)). In Fig. 1 is shown the mass
spectra recorded without (Fig. 1a) irradiating proton-bound
ethanol dimers and after irradiation of proton-bound ethanol
dimers with light centred at 760 cm�1 from the CLIO FEL
(Fig. 1b), clearly showing both products.
In previous experiments conducted by irradiating proton-
bound alcohol dimers with a low-powered (15–50 W cm�2)
CO2 laser (10.6 mm line), Bomse and Beauchamp17 found that
only when the alkyl group (R) is n-propyl, i-propyl, and
s-butyl, were multiple products observed. When R is methyl or
ethyl, the only products were the protonated ethers, eqn (1), as
discussed above. For the proton-bound dimer of n-propanol
the major ionic product was protonated propanol at 71% (eqn
(2)). That multiple products are also observed for R = CH3
and CH2CH3 in the present IRMPD experiments certainly
deserves some discussion.
3.1.1 IRMPD of methanol proton-bound dimer. As already
stated, for the present experiments both protonated ether and
protonated alcohol were observed for the proton-bound di-
mers of methanol, ethanol and propanol. In the case of
methanol, the major dissociation product was observed at
m/z 47, protonated dimethyl ether. Fig. 2 contains a plot of the
product signal intensities against the wavenumber of irradia-
tion as well as the IRMPD efficiency spectrum (or infrared
spectrum) of protonated methanol (to be discussed in Section
3.2.1). It is interesting to compare these two plots. It should be
pointed out first, that over the entire range of the infrared
covered in these experiments, the proton-bound dimer dis-
sociates to a small extent indicating that there is at least a small
amount of absorption by the proton-bound dimer at all
frequencies. Both products increase in intensity upon strong
absorption as might be expected for two competing dissocia-
tion pathways. What may not be quite apparent from Fig. 2, is
Fig. 1 Mass spectra recorded after (a) no irradiation and (b) irradia-
tion of ethanol proton-bound dimers with the CLIO FEL tuned to
produce light with a wavenumber value of 760 (�10) cm�1.
This journal is �c the Owner Societies 2006 Phys. Chem. Chem. Phys., 2006, 8, 955–966 | 957
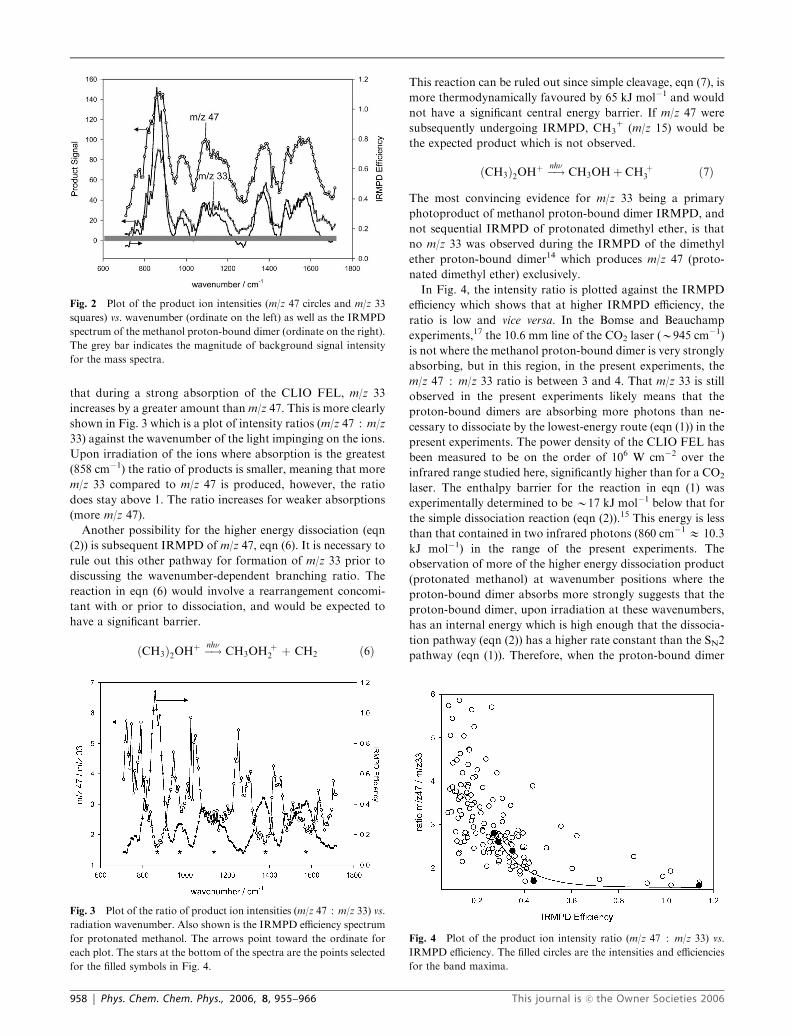
that during a strong absorption of the CLIO FEL, m/z 33
increases by a greater amount than m/z 47. This is more clearly
shown in Fig. 3 which is a plot of intensity ratios (m/z 47 : m/z
33) against the wavenumber of the light impinging on the ions.
Upon irradiation of the ions where absorption is the greatest
(858 cm�1) the ratio of products is smaller, meaning that more
m/z 33 compared to m/z 47 is produced, however, the ratio
does stay above 1. The ratio increases for weaker absorptions
(more m/z 47).
Another possibility for the higher energy dissociation (eqn
(2)) is subsequent IRMPD of m/z 47, eqn (6). It is necessary to
rule out this other pathway for formation of m/z 33 prior to
discussing the wavenumber-dependent branching ratio. The
reaction in eqn (6) would involve a rearrangement concomi-
tant with or prior to dissociation, and would be expected to
have a significant barrier.
ðCH3Þ2OHþ �!nhn CH3OH þ2 þ CH2 ð6Þ
This reaction can be ruled out since simple cleavage, eqn (7), is
more thermodynamically favoured by 65 kJ mol�1 and would
not have a significant central energy barrier. If m/z 47 were
subsequently undergoing IRMPD, CH31 (m/z 15) would be
the expected product which is not observed.
ðCH3Þ2OHþ �!nhn CH3OHþ CH þ3 ð7Þ
The most convincing evidence for m/z 33 being a primary
photoproduct of methanol proton-bound dimer IRMPD, and
not sequential IRMPD of protonated dimethyl ether, is that
no m/z 33 was observed during the IRMPD of the dimethyl
ether proton-bound dimer14 which produces m/z 47 (proto-
nated dimethyl ether) exclusively.
In Fig. 4, the intensity ratio is plotted against the IRMPD
efficiency which shows that at higher IRMPD efficiency, the
ratio is low and vice versa. In the Bomse and Beauchamp
experiments,17 the 10.6 mm line of the CO2 laser (B945 cm�1)
is not where the methanol proton-bound dimer is very strongly
absorbing, but in this region, in the present experiments, the
m/z 47 : m/z 33 ratio is between 3 and 4. That m/z 33 is still
observed in the present experiments likely means that the
proton-bound dimers are absorbing more photons than ne-
cessary to dissociate by the lowest-energy route (eqn (1)) in the
present experiments. The power density of the CLIO FEL has
been measured to be on the order of 106 W cm�2 over the
infrared range studied here, significantly higher than for a CO2
laser. The enthalpy barrier for the reaction in eqn (1) was
experimentally determined to be B17 kJ mol�1 below that for
the simple dissociation reaction (eqn (2)).15 This energy is less
than that contained in two infrared photons (860 cm�1 E 10.3
kJ mol�1) in the range of the present experiments. The
observation of more of the higher energy dissociation product
(protonated methanol) at wavenumber positions where the
proton-bound dimer absorbs more strongly suggests that the
proton-bound dimer, upon irradiation at these wavenumbers,
has an internal energy which is high enough that the dissocia-
tion pathway (eqn (2)) has a higher rate constant than the SN2
pathway (eqn (1)). Therefore, when the proton-bound dimer
Fig. 2 Plot of the product ion intensities (m/z 47 circles and m/z 33
squares) vs. wavenumber (ordinate on the left) as well as the IRMPD
spectrum of the methanol proton-bound dimer (ordinate on the right).
The grey bar indicates the magnitude of background signal intensity
for the mass spectra.
Fig. 3 Plot of the ratio of product ion intensities (m/z 47 : m/z 33) vs.
radiation wavenumber. Also shown is the IRMPD efficiency spectrum
for protonated methanol. The arrows point toward the ordinate for
each plot. The stars at the bottom of the spectra are the points selected
for the filled symbols in Fig. 4.
Fig. 4 Plot of the product ion intensity ratio (m/z 47 : m/z 33) vs.
IRMPD efficiency. The filled circles are the intensities and efficiencies
for the band maxima.
958 | Phys. Chem. Chem. Phys., 2006, 8, 955–966 This journal is �c the Owner Societies 2006
absorbs strongly, absorption competes effectively with the SN2
reaction pathway (eqn (1)), thereby increasing the internal
energy of the proton-bound dimer, making the simple disso-
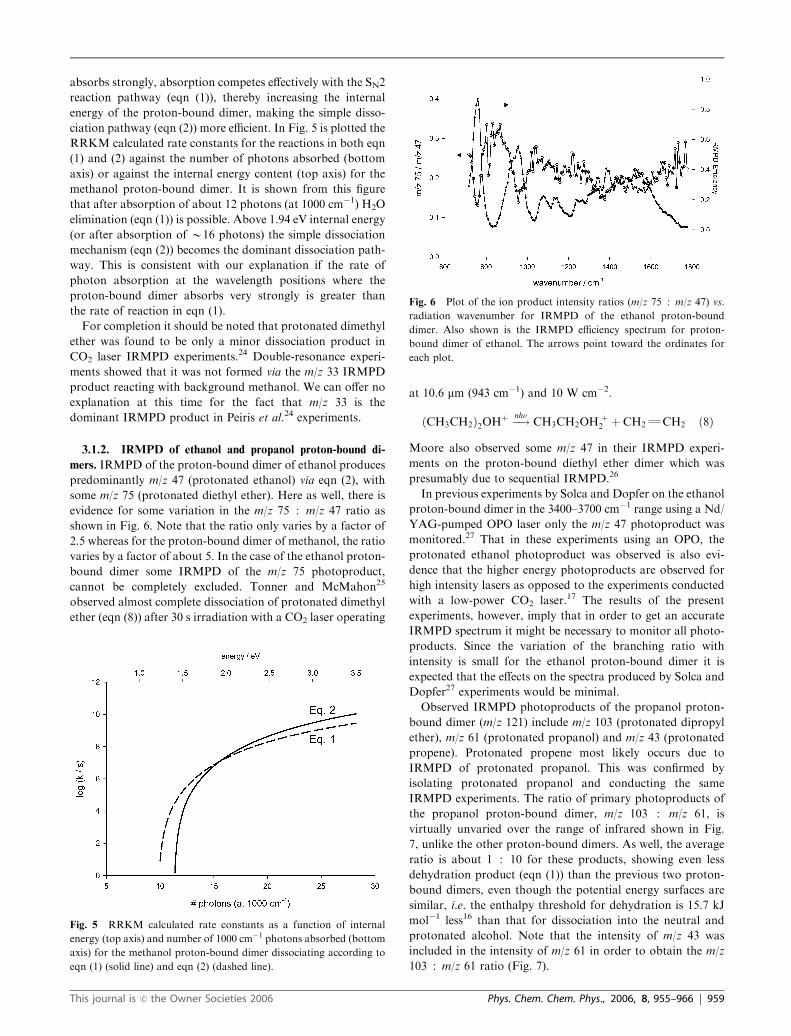
ciation pathway (eqn (2)) more efficient. In Fig. 5 is plotted the
RRKM calculated rate constants for the reactions in both eqn
(1) and (2) against the number of photons absorbed (bottom
axis) or against the internal energy content (top axis) for the
methanol proton-bound dimer. It is shown from this figure
that after absorption of about 12 photons (at 1000 cm�1) H2O
elimination (eqn (1)) is possible. Above 1.94 eV internal energy
(or after absorption of B16 photons) the simple dissociation
mechanism (eqn (2)) becomes the dominant dissociation path-
way. This is consistent with our explanation if the rate of
photon absorption at the wavelength positions where the
proton-bound dimer absorbs very strongly is greater than
the rate of reaction in eqn (1).
For completion it should be noted that protonated dimethyl
ether was found to be only a minor dissociation product in
CO2 laser IRMPD experiments.24 Double-resonance experi-
ments showed that it was not formed via the m/z 33 IRMPD
product reacting with background methanol. We can offer no
explanation at this time for the fact that m/z 33 is the
dominant IRMPD product in Peiris et al.24 experiments.
3.1.2. IRMPD of ethanol and propanol proton-bound di-
mers. IRMPD of the proton-bound dimer of ethanol produces
predominantly m/z 47 (protonated ethanol) via eqn (2), with
some m/z 75 (protonated diethyl ether). Here as well, there is
evidence for some variation in the m/z 75 : m/z 47 ratio as
shown in Fig. 6. Note that the ratio only varies by a factor of
2.5 whereas for the proton-bound dimer of methanol, the ratio
varies by a factor of about 5. In the case of the ethanol proton-
bound dimer some IRMPD of the m/z 75 photoproduct,
cannot be completely excluded. Tonner and McMahon25
observed almost complete dissociation of protonated dimethyl
ether (eqn (8)) after 30 s irradiation with a CO2 laser operating
at 10.6 mm (943 cm�1) and 10 W cm�2.
ðCH3CH2Þ2OHþ �!nhn CH3CH2OH þ2 þ CH2QCH2 ð8Þ
Moore also observed some m/z 47 in their IRMPD experi-
ments on the proton-bound diethyl ether dimer which was
presumably due to sequential IRMPD.26
In previous experiments by Solca and Dopfer on the ethanol
proton-bound dimer in the 3400–3700 cm�1 range using a Nd/
YAG-pumped OPO laser only the m/z 47 photoproduct was
monitored.27 That in these experiments using an OPO, the
protonated ethanol photoproduct was observed is also evi-
dence that the higher energy photoproducts are observed for
high intensity lasers as opposed to the experiments conducted
with a low-power CO2 laser.17 The results of the present
experiments, however, imply that in order to get an accurate
IRMPD spectrum it might be necessary to monitor all photo-
products. Since the variation of the branching ratio with
intensity is small for the ethanol proton-bound dimer it is
expected that the effects on the spectra produced by Solca and
Dopfer27 experiments would be minimal.
Observed IRMPD photoproducts of the propanol proton-
bound dimer (m/z 121) include m/z 103 (protonated dipropyl
ether), m/z 61 (protonated propanol) and m/z 43 (protonated
propene). Protonated propene most likely occurs due to
IRMPD of protonated propanol. This was confirmed by
isolating protonated propanol and conducting the same
IRMPD experiments. The ratio of primary photoproducts of
the propanol proton-bound dimer, m/z 103 : m/z 61, is
virtually unvaried over the range of infrared shown in Fig.
7, unlike the other proton-bound dimers. As well, the average
ratio is about 1 : 10 for these products, showing even less
dehydration product (eqn (1)) than the previous two proton-
bound dimers, even though the potential energy surfaces are
similar, i.e. the enthalpy threshold for dehydration is 15.7 kJ
mol�1 less16 than that for dissociation into the neutral and
protonated alcohol. Note that the intensity of m/z 43 was
included in the intensity of m/z 61 in order to obtain the m/z
103 : m/z 61 ratio (Fig. 7).
Fig. 5 RRKM calculated rate constants as a function of internal
energy (top axis) and number of 1000 cm�1 photons absorbed (bottom
axis) for the methanol proton-bound dimer dissociating according to
eqn (1) (solid line) and eqn (2) (dashed line).
Fig. 6 Plot of the ion product intensity ratios (m/z 75 : m/z 47) vs.
radiation wavenumber for IRMPD of the ethanol proton-bound
dimer. Also shown is the IRMPD efficiency spectrum for proton-
bound dimer of ethanol. The arrows point toward the ordinates for
each plot.
This journal is �c the Owner Societies 2006 Phys. Chem. Chem. Phys., 2006, 8, 955–966 | 959

For methanol, the rate constants for the two pathways
become equal after the proton-bound dimer absorbs 16
photons (1.94 eV internal energy) and have a value of B1.3 �107 s�1. In experiments conducted with a low power CO2
laser,17,28 dissociation must be dominant over net29 IRMP
absorption which is why only the product with the lowest
energy requirement (SN2 pathway, reaction 1) is observed. In
the present experiments on the proton-bound methanol dimer,
both products are observed because a very high powered laser
is used so that IRMP absorption is competing with the
dissociation processes. Furthermore, when the molecule ab-
sorbs most strongly, net IRMP absorption is even faster such
that enough photons are absorbed to make reaction 2 more
competitive with reaction 1. For the ethanol and propanol
proton-bound dimers, the rate constants become equal at
higher internal energies, 2.10 eV and 2.28 eV, respectively,
where the rate constants are 6.3 � 104 and 1.0 � 105 s�1,
respectively, two orders of magnitude lower than the rate
constants for the proton-bound dimer. Since the IR absorp-
tion cross sections for all three proton-bound dimers are
predicted to be similar, the rate constant for IRMP absorption
is expected to be similar for all three proton-bound dimers. It
is therefore easy to postulate that the ethanol and propanol
proton-bound dimers will absorb more photons than the
methanol proton-bound dimer prior to dissociation, increas-
ing the internal energy to such a level that the rate constant for
the higher energy route, eqn (2), is greater making this simple
dissociation channel the dominant one. In fact, this explana-
tion is consistent with the observation of both reaction chan-
nels for the propanol proton-bound dimer being observed in
the CO2 laser IRMPD experiments by Bomse and Beau-
champ.17 Even with the low-power CO2 laser, the rate of
absorption is competitive with the dissociation rates, especially
for the larger proton-bound dimers.
3.2. IRMPD spectra
3.2.1 Proton-bound dimer of methanol. In Fig. 8 and Fig. 9
the IRMPD spectrum of the methanol proton-bound dimer is
presented (solid black trace). Also shown in Fig. 9 are the
computed infrared spectra for the two lowest energy structures
found at the B3LYP/6-31þG** level of theory. The computed
spectra shown are unscaled. Conformer MA is lower in energy
than MB by only 1.3 kJ mol�1. Both conformers are of C2
symmetry and their geometries are shown in Fig. 10.
The strongest absorption is centred at 866 cm�1 and is
attributed to the asymmetric O–H–O stretch. This strong band
is in the same vicinity as was observed for the homogenous
proton-bound dimers of ether previously.13,14 For both con-
formers, the O–H–O asymmetric stretch is predicted to occur
at 801 cm�1 (796 cm�1 for conformer MA) which is in general
agreement. The band observed at 982 cm�1 is most likely the
C–O stretching vibration. For conformer MA, the in-phase
(ip) and out of phase (op) C–O stretches are both predicted to
occur at 969 cm�1, the op stretch is predicted to be of
considerable intensity. For the conformer MB, the C–O
stretching vibrations are predicted to occur at 953 cm�1 (op)
and 991 cm�1 (ip). These predicted values are in good
Fig. 7 Plot of the ion product intensity ratios (m/z 103 : m/z 61) vs.
radiation wavenumber for IRMPD of the propanol proton-bound
dimer. Also shown is the IRMPD efficiency spectrum for proton-
bound dimer of propanol. The arrows point to the corresponding
ordinates.
Fig. 8 RRKM calculated rate constants as a function of internal
energy (top axis) and number of 1000 cm�1 photons absorbed (bottom
axis) for the ethanol (A) and propanol (B) proton-bound dimer
dissociating according to eqn (1) (solid line) and eqn (2) (dashed line).
960 | Phys. Chem. Chem. Phys., 2006, 8, 955–966 This journal is �c the Owner Societies 2006
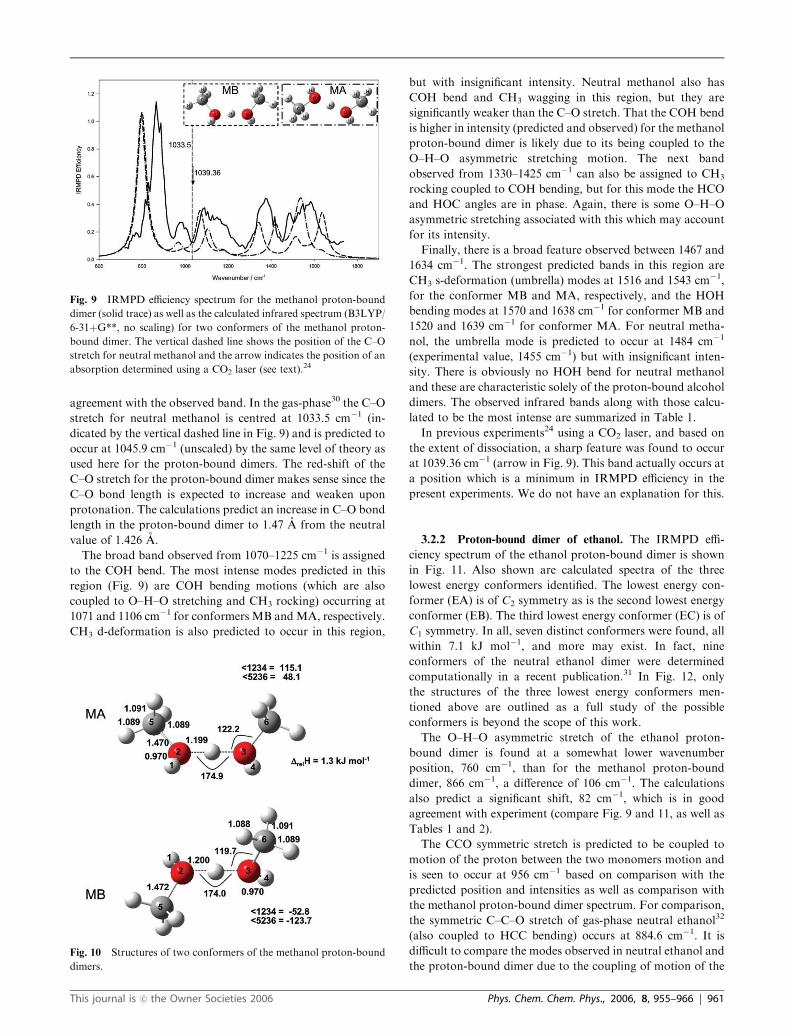
agreement with the observed band. In the gas-phase30 the C–O
stretch for neutral methanol is centred at 1033.5 cm�1 (in-
dicated by the vertical dashed line in Fig. 9) and is predicted to
occur at 1045.9 cm�1 (unscaled) by the same level of theory as
used here for the proton-bound dimers. The red-shift of the
C–O stretch for the proton-bound dimer makes sense since the
C–O bond length is expected to increase and weaken upon
protonation. The calculations predict an increase in C–O bond
length in the proton-bound dimer to 1.47 A from the neutral
value of 1.426 A.
The broad band observed from 1070–1225 cm�1 is assigned
to the COH bend. The most intense modes predicted in this
region (Fig. 9) are COH bending motions (which are also
coupled to O–H–O stretching and CH3 rocking) occurring at
1071 and 1106 cm�1 for conformers MB andMA, respectively.
CH3 d-deformation is also predicted to occur in this region,
but with insignificant intensity. Neutral methanol also has
COH bend and CH3 wagging in this region, but they are
significantly weaker than the C–O stretch. That the COH bend
is higher in intensity (predicted and observed) for the methanol
proton-bound dimer is likely due to its being coupled to the
O–H–O asymmetric stretching motion. The next band
observed from 1330–1425 cm�1 can also be assigned to CH3
rocking coupled to COH bending, but for this mode the HCO
and HOC angles are in phase. Again, there is some O–H–O
asymmetric stretching associated with this which may account
for its intensity.
Finally, there is a broad feature observed between 1467 and
1634 cm�1. The strongest predicted bands in this region are
CH3 s-deformation (umbrella) modes at 1516 and 1543 cm�1,
for the conformer MB and MA, respectively, and the HOH
bending modes at 1570 and 1638 cm�1 for conformer MB and
1520 and 1639 cm�1 for conformer MA. For neutral metha-
nol, the umbrella mode is predicted to occur at 1484 cm�1
(experimental value, 1455 cm�1) but with insignificant inten-
sity. There is obviously no HOH bend for neutral methanol
and these are characteristic solely of the proton-bound alcohol
dimers. The observed infrared bands along with those calcu-
lated to be the most intense are summarized in Table 1.
In previous experiments24 using a CO2 laser, and based on
the extent of dissociation, a sharp feature was found to occur
at 1039.36 cm�1 (arrow in Fig. 9). This band actually occurs at
a position which is a minimum in IRMPD efficiency in the
present experiments. We do not have an explanation for this.
3.2.2 Proton-bound dimer of ethanol. The IRMPD effi-
ciency spectrum of the ethanol proton-bound dimer is shown
in Fig. 11. Also shown are calculated spectra of the three
lowest energy conformers identified. The lowest energy con-
former (EA) is of C2 symmetry as is the second lowest energy
conformer (EB). The third lowest energy conformer (EC) is of
C1 symmetry. In all, seven distinct conformers were found, all
within 7.1 kJ mol�1, and more may exist. In fact, nine
conformers of the neutral ethanol dimer were determined
computationally in a recent publication.31 In Fig. 12, only
the structures of the three lowest energy conformers men-
tioned above are outlined as a full study of the possible
conformers is beyond the scope of this work.
The O–H–O asymmetric stretch of the ethanol proton-
bound dimer is found at a somewhat lower wavenumber
position, 760 cm�1, than for the methanol proton-bound
dimer, 866 cm�1, a difference of 106 cm�1. The calculations
also predict a significant shift, 82 cm�1, which is in good
agreement with experiment (compare Fig. 9 and 11, as well as
Tables 1 and 2).
The CCO symmetric stretch is predicted to be coupled to
motion of the proton between the two monomers motion and
is seen to occur at 956 cm�1 based on comparison with the
predicted position and intensities as well as comparison with
the methanol proton-bound dimer spectrum. For comparison,
the symmetric C–C–O stretch of gas-phase neutral ethanol32
(also coupled to HCC bending) occurs at 884.6 cm�1. It is
difficult to compare the modes observed in neutral ethanol and
the proton-bound dimer due to the coupling of motion of the
Fig. 9 IRMPD efficiency spectrum for the methanol proton-bound
dimer (solid trace) as well as the calculated infrared spectrum (B3LYP/
6-31þG**, no scaling) for two conformers of the methanol proton-
bound dimer. The vertical dashed line shows the position of the C–O
stretch for neutral methanol and the arrow indicates the position of an
absorption determined using a CO2 laser (see text).24
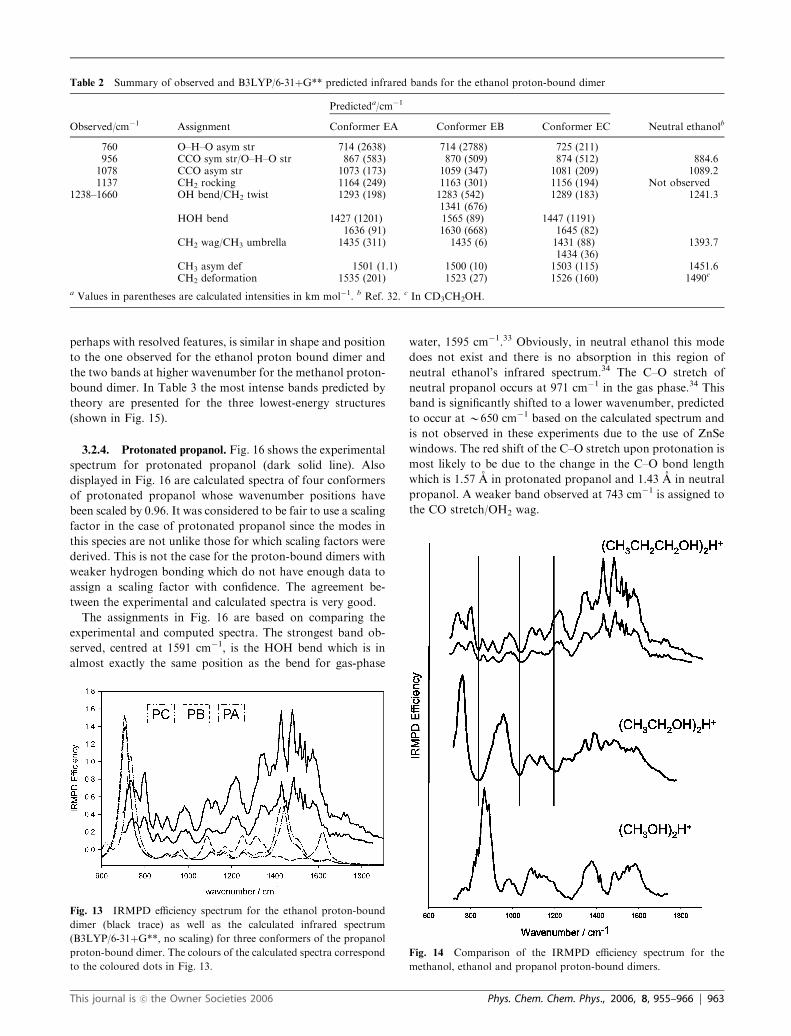
Fig. 10 Structures of two conformers of the methanol proton-bound
dimers.
This journal is �c the Owner Societies 2006 Phys. Chem. Chem. Phys., 2006, 8, 955–966 | 961

central proton which obviously cannot be the case for neutral
ethanol.
The next band is seen to be somewhat resolved showing two
features centred at 1078 and 1137 cm�1 which are assigned to
asymmetric C–C–O stretching and CH2 rocking, respectively.
The asymmetric C–C–O stretch in gas-phase neutral ethanol
occurs at a similar position, 1089.2 cm�1. The next feature is
abroad, perhaps with some resolved features occurring be-
tween 1238–1660 cm�1. Rather than assigning any of the
resolved features, a number of modes predicted to be fairly
intense are listed in Table 2. This broad feature is most likely
due to CH2 and CH3 motions and quite obviously, HOH
bending as it is the strongest predicted absorption.
3.2.3 Proton-bound dimer of propanol. In Fig. 13 two
IRMPD spectra of the propanol proton-bound dimer (solid
line). For the less intense spectrum, an attenuator was used to
decrease the intensity of light impinging on the ions from the
CLIO FEL by a factor of three. That the relative intensities of
the bands remains similar in both spectra suggests that
IRMPD is not saturated at full laser power. The spectrum
of the propanol proton-bound dimer may, at first glance, seem
different from the methanol and ethanol proton-bound dimers
(see Fig. 14). The band(s) around 750 cm�1 are not nearly as
intense as observed for the other alcohols and there are more
bands resolved in the rest of the spectrum. Clearly the spec-
trum of the propanol proton-bound dimer is more complex
and will prove to be more difficult to interpret, which might be
expected since there are significantly more vibrational modes
compared to the ethanol and methanol proton-bound dimers.
There are also, however, many similarities between the three
spectra. While the methanol proton-bound dimer O–H–O
asymmetric stretch is significantly red-shifted, for the ethanol
and propanol proton-bound dimers this mode occurs in the
same vicinity, an observation which is reproduced by theory
(see Fig. 13 and Table 3). The bands observed with maxima at
737, 758(shoulder), and 802 cm�1 are likely all O–H–O asym-
metric stretching modes of different conformers. As well, the
band centred at 982 cm�1 is most likely the C–O stretching
vibration based on comparing the bands observed for the
other dimers and the calculated spectra (see Table 3 and Fig.
13). Finally the broad band between 1300 and 1600 cm�1,
Table 1 Summary of observed and B3LYP/6-31þG** predicted infrared bands for the methanol proton-bound dimer
Predicteda/cm�1
Observed/cm�1 Assignment Conformer MA Conformer MBNeutral methanolb
(gas-phase/cm�1)
866 O–H–O asym str 796 (2394) 801 (2449)982 CO str 969 (196) 991 (55) 1033.5 (vs)
1070–1225 COH bend/CH3 rock/O–H–O asym str 1106 (469) 1071 (766) 1060 (w)CH3 d-deformation/CH3 rock 1178 (77) 1177 (78) 1165 (w)
1330–1425 In phase COH bend/CH3 rock/ O–H–O asym str 1421 (505) 1352 (578) 1345 (s)1467–1634 CH3 s-deformation (umbrella) 1543 (760) 1516 (263) 1455 (m)
HOH bend 1520 (346) 1570 (73)1639 (69) 1638 (741)
a Values in parentheses are calculated intensities in km mol�1. b Ref. 30.
Fig. 11 IRMPD efficiency spectrum for the ethanol proton-bound
dimer (solid trace) as well as the calculated infrared spectrum (B3LYP/
6-31þG**, no scaling) for three conformers of the ethanol proton-
bound dimer.
Fig. 12 Structures of the three lowest-energy conformers found for
the ethanol proton-bound dimer.
962 | Phys. Chem. Chem. Phys., 2006, 8, 955–966 This journal is �c the Owner Societies 2006
perhaps with resolved features, is similar in shape and position
to the one observed for the ethanol proton bound dimer and
the two bands at higher wavenumber for the methanol proton-
bound dimer. In Table 3 the most intense bands predicted by
theory are presented for the three lowest-energy structures
(shown in Fig. 15).
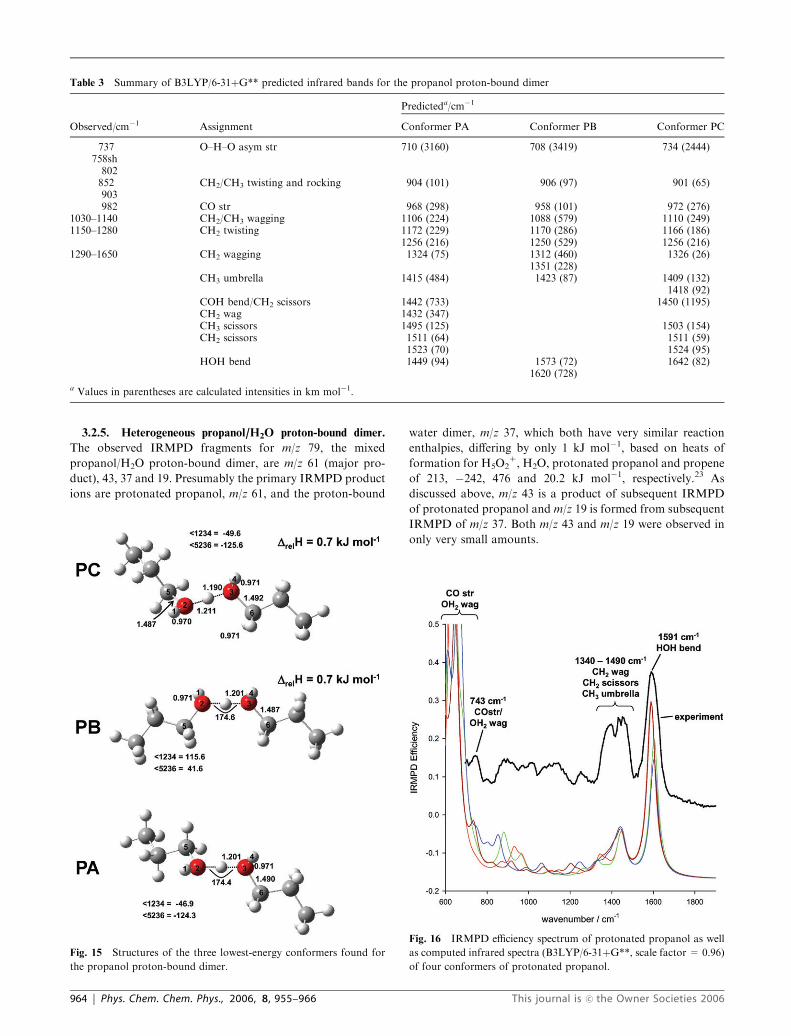
3.2.4. Protonated propanol. Fig. 16 shows the experimental
spectrum for protonated propanol (dark solid line). Also
displayed in Fig. 16 are calculated spectra of four conformers
of protonated propanol whose wavenumber positions have
been scaled by 0.96. It was considered to be fair to use a scaling
factor in the case of protonated propanol since the modes in
this species are not unlike those for which scaling factors were
derived. This is not the case for the proton-bound dimers with
weaker hydrogen bonding which do not have enough data to
assign a scaling factor with confidence. The agreement be-
tween the experimental and calculated spectra is very good.
The assignments in Fig. 16 are based on comparing the
experimental and computed spectra. The strongest band ob-
served, centred at 1591 cm�1, is the HOH bend which is in
almost exactly the same position as the bend for gas-phase
water, 1595 cm�1.33 Obviously, in neutral ethanol this mode
does not exist and there is no absorption in this region of
neutral ethanol’s infrared spectrum.34 The C–O stretch of
neutral propanol occurs at 971 cm�1 in the gas phase.34 This
band is significantly shifted to a lower wavenumber, predicted
to occur at B650 cm�1 based on the calculated spectrum and
is not observed in these experiments due to the use of ZnSe
windows. The red shift of the C–O stretch upon protonation is
most likely to be due to the change in the C–O bond length
which is 1.57 A in protonated propanol and 1.43 A in neutral
propanol. A weaker band observed at 743 cm�1 is assigned to
the CO stretch/OH2 wag.
Table 2 Summary of observed and B3LYP/6-31þG** predicted infrared bands for the ethanol proton-bound dimer
Predicteda/cm�1
Observed/cm�1 Assignment Conformer EA Conformer EB Conformer EC Neutral ethanolb
760 O–H–O asym str 714 (2638) 714 (2788) 725 (211)956 CCO sym str/O–H–O str 867 (583) 870 (509) 874 (512) 884.6
1078 CCO asym str 1073 (173) 1059 (347) 1081 (209) 1089.21137 CH2 rocking 1164 (249) 1163 (301) 1156 (194) Not observed
1238–1660 OH bend/CH2 twist 1293 (198) 1283 (542) 1289 (183) 1241.31341 (676)
HOH bend 1427 (1201) 1565 (89) 1447 (1191)1636 (91) 1630 (668) 1645 (82)
CH2 wag/CH3 umbrella 1435 (311) 1435 (6) 1431 (88) 1393.71434 (36)
CH3 asym def 1501 (1.1) 1500 (10) 1503 (115) 1451.6CH2 deformation 1535 (201) 1523 (27) 1526 (160) 1490c
a Values in parentheses are calculated intensities in km mol�1. b Ref. 32. c In CD3CH2OH.
Fig. 13 IRMPD efficiency spectrum for the ethanol proton-bound
dimer (black trace) as well as the calculated infrared spectrum
(B3LYP/6-31þG**, no scaling) for three conformers of the propanol
proton-bound dimer. The colours of the calculated spectra correspond
to the coloured dots in Fig. 13.
Fig. 14 Comparison of the IRMPD efficiency spectrum for the
methanol, ethanol and propanol proton-bound dimers.
This journal is �c the Owner Societies 2006 Phys. Chem. Chem. Phys., 2006, 8, 955–966 | 963
3.2.5. Heterogeneous propanol/H2O proton-bound dimer.
The observed IRMPD fragments for m/z 79, the mixed
propanol/H2O proton-bound dimer, are m/z 61 (major pro-
duct), 43, 37 and 19. Presumably the primary IRMPD product
ions are protonated propanol, m/z 61, and the proton-bound
water dimer, m/z 37, which both have very similar reaction
enthalpies, differing by only 1 kJ mol�1, based on heats of
formation for H5O21, H2O, protonated propanol and propene
of 213, �242, 476 and 20.2 kJ mol�1, respectively.23 As
discussed above, m/z 43 is a product of subsequent IRMPD
of protonated propanol and m/z 19 is formed from subsequent
IRMPD of m/z 37. Both m/z 43 and m/z 19 were observed in
only very small amounts.
Table 3 Summary of B3LYP/6-31þG** predicted infrared bands for the propanol proton-bound dimer
Predicteda/cm�1
Observed/cm�1 Assignment Conformer PA Conformer PB Conformer PC
737 O–H–O asym str 710 (3160) 708 (3419) 734 (2444)758sh802852 CH2/CH3 twisting and rocking 904 (101) 906 (97) 901 (65)903982 CO str 968 (298) 958 (101) 972 (276)
1030–1140 CH2/CH3 wagging 1106 (224) 1088 (579) 1110 (249)1150–1280 CH2 twisting 1172 (229) 1170 (286) 1166 (186)
1256 (216) 1250 (529) 1256 (216)1290–1650 CH2 wagging 1324 (75) 1312 (460) 1326 (26)
1351 (228)CH3 umbrella 1415 (484) 1423 (87) 1409 (132)
1418 (92)COH bend/CH2 scissors 1442 (733) 1450 (1195)CH2 wag 1432 (347)CH3 scissors 1495 (125) 1503 (154)CH2 scissors 1511 (64) 1511 (59)
1523 (70) 1524 (95)HOH bend 1449 (94) 1573 (72) 1642 (82)
1620 (728)
a Values in parentheses are calculated intensities in km mol�1.
Fig. 15 Structures of the three lowest-energy conformers found for
the propanol proton-bound dimer.
Fig. 16 IRMPD efficiency spectrum of protonated propanol as well
as computed infrared spectra (B3LYP/6-31þG**, scale factor = 0.96)
of four conformers of protonated propanol.
964 | Phys. Chem. Chem. Phys., 2006, 8, 955–966 This journal is �c the Owner Societies 2006
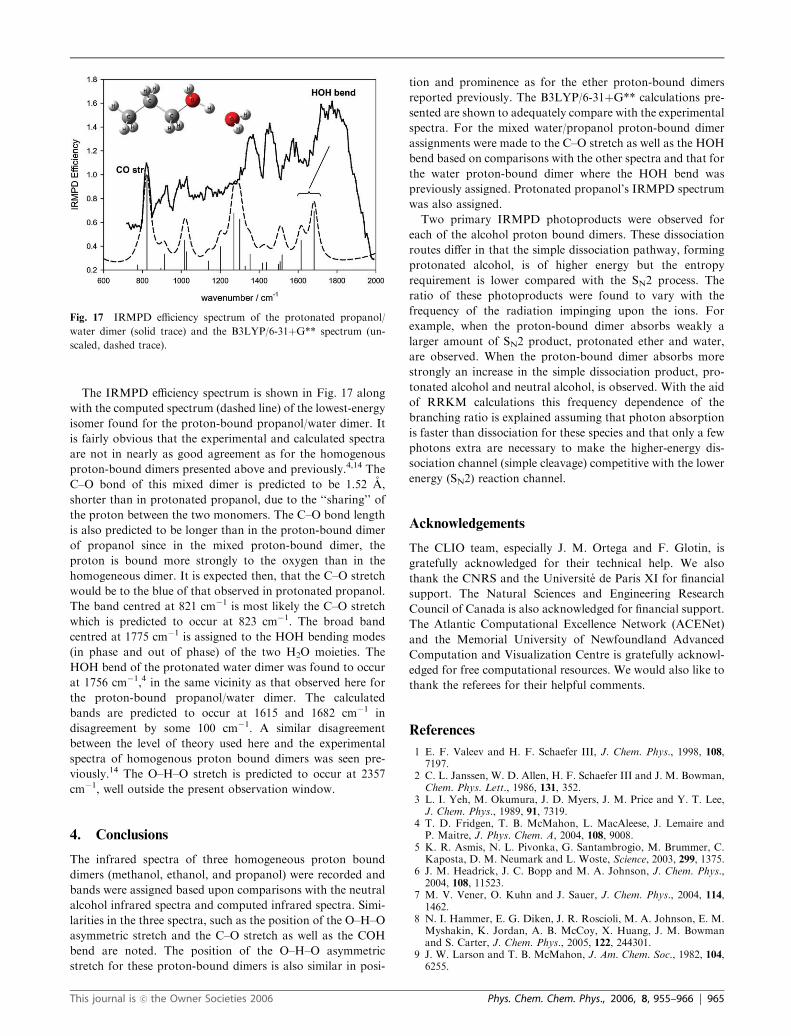
The IRMPD efficiency spectrum is shown in Fig. 17 along
with the computed spectrum (dashed line) of the lowest-energy
isomer found for the proton-bound propanol/water dimer. It
is fairly obvious that the experimental and calculated spectra
are not in nearly as good agreement as for the homogenous
proton-bound dimers presented above and previously.4,14 The
C–O bond of this mixed dimer is predicted to be 1.52 A,
shorter than in protonated propanol, due to the ‘‘sharing’’ of
the proton between the two monomers. The C–O bond length
is also predicted to be longer than in the proton-bound dimer
of propanol since in the mixed proton-bound dimer, the
proton is bound more strongly to the oxygen than in the
homogeneous dimer. It is expected then, that the C–O stretch
would be to the blue of that observed in protonated propanol.
The band centred at 821 cm�1 is most likely the C–O stretch
which is predicted to occur at 823 cm�1. The broad band
centred at 1775 cm�1 is assigned to the HOH bending modes
(in phase and out of phase) of the two H2O moieties. The
HOH bend of the protonated water dimer was found to occur
at 1756 cm�1,4 in the same vicinity as that observed here for
the proton-bound propanol/water dimer. The calculated
bands are predicted to occur at 1615 and 1682 cm�1 in
disagreement by some 100 cm�1. A similar disagreement
between the level of theory used here and the experimental
spectra of homogenous proton bound dimers was seen pre-
viously.14 The O–H–O stretch is predicted to occur at 2357
cm�1, well outside the present observation window.
4. Conclusions
The infrared spectra of three homogeneous proton bound
dimers (methanol, ethanol, and propanol) were recorded and
bands were assigned based upon comparisons with the neutral
alcohol infrared spectra and computed infrared spectra. Simi-
larities in the three spectra, such as the position of the O–H–O
asymmetric stretch and the C–O stretch as well as the COH
bend are noted. The position of the O–H–O asymmetric
stretch for these proton-bound dimers is also similar in posi-
tion and prominence as for the ether proton-bound dimers
reported previously. The B3LYP/6-31þG** calculations pre-
sented are shown to adequately compare with the experimental
spectra. For the mixed water/propanol proton-bound dimer
assignments were made to the C–O stretch as well as the HOH
bend based on comparisons with the other spectra and that for
the water proton-bound dimer where the HOH bend was
previously assigned. Protonated propanol’s IRMPD spectrum
was also assigned.
Two primary IRMPD photoproducts were observed for
each of the alcohol proton bound dimers. These dissociation
routes differ in that the simple dissociation pathway, forming
protonated alcohol, is of higher energy but the entropy
requirement is lower compared with the SN2 process. The
ratio of these photoproducts were found to vary with the
frequency of the radiation impinging upon the ions. For
example, when the proton-bound dimer absorbs weakly a
larger amount of SN2 product, protonated ether and water,
are observed. When the proton-bound dimer absorbs more
strongly an increase in the simple dissociation product, pro-
tonated alcohol and neutral alcohol, is observed. With the aid
of RRKM calculations this frequency dependence of the
branching ratio is explained assuming that photon absorption
is faster than dissociation for these species and that only a few
photons extra are necessary to make the higher-energy dis-
sociation channel (simple cleavage) competitive with the lower
energy (SN2) reaction channel.
Acknowledgements
The CLIO team, especially J. M. Ortega and F. Glotin, is
gratefully acknowledged for their technical help. We also
thank the CNRS and the Universite de Paris XI for financial
support. The Natural Sciences and Engineering Research
Council of Canada is also acknowledged for financial support.
The Atlantic Computational Excellence Network (ACENet)
and the Memorial University of Newfoundland Advanced
Computation and Visualization Centre is gratefully acknowl-
edged for free computational resources. We would also like to
thank the referees for their helpful comments.
References
1 E. F. Valeev and H. F. Schaefer III, J. Chem. Phys., 1998, 108,7197.
2 C. L. Janssen, W. D. Allen, H. F. Schaefer III and J. M. Bowman,Chem. Phys. Lett., 1986, 131, 352.
3 L. I. Yeh, M. Okumura, J. D. Myers, J. M. Price and Y. T. Lee,J. Chem. Phys., 1989, 91, 7319.
4 T. D. Fridgen, T. B. McMahon, L. MacAleese, J. Lemaire andP. Maitre, J. Phys. Chem. A, 2004, 108, 9008.
5 K. R. Asmis, N. L. Pivonka, G. Santambrogio, M. Brummer, C.Kaposta, D. M. Neumark and L. Woste, Science, 2003, 299, 1375.
6 J. M. Headrick, J. C. Bopp and M. A. Johnson, J. Chem. Phys.,2004, 108, 11523.
7 M. V. Vener, O. Kuhn and J. Sauer, J. Chem. Phys., 2004, 114,1462.
8 N. I. Hammer, E. G. Diken, J. R. Roscioli, M. A. Johnson, E. M.Myshakin, K. Jordan, A. B. McCoy, X. Huang, J. M. Bowmanand S. Carter, J. Chem. Phys., 2005, 122, 244301.
9 J. W. Larson and T. B. McMahon, J. Am. Chem. Soc., 1982, 104,6255.
Fig. 17 IRMPD efficiency spectrum of the protonated propanol/
water dimer (solid trace) and the B3LYP/6-31þG** spectrum (un-
scaled, dashed trace).
This journal is �c the Owner Societies 2006 Phys. Chem. Chem. Phys., 2006, 8, 955–966 | 965
10 T. B. McMahon and P. Kebarle, J. Am. Chem. Soc., 1983, 105,2944.
11 P. G. Wenthold and R. R. Squires, J. Phys. Chem., 1995, 99, 2002.12 T. B. McMahon and P. Kebarle, J. Phys. Chem., 1986, 108, 6502.13 D. T. Moore, J. Oomens, L. van der Meer, G. von Helden, G.
Meijer, J. Valle, A. G. Marshall and J. R. Eyler, ChemPhysChem,2004, 5, 740.
14 T. D. Fridgen, L. MacAleese, P. Maitre, T. B. McMahon, P.Boissel and J. Lemaire, Phys. Chem. Chem. Phys., 2005, 7, 2747.
15 T. D. Fridgen, J. D. Keller and T. B. McMahon, J. Phys. Chem. A,2001, 105, 3816.
16 T. D. Fridgen and T. B. McMahon, J. Phys. Chem. A, 2002, 106,9648.
17 D. S. Bomse and J. L. Beauchamp, J. Am. Chem. Soc., 1981, 103,3292.
18 R. Prazeres, F. Glotin, C. Insa, D. A. Jaroszynski and J. M.Ortega, Eur. Phys. J. D, 1998, 3, 87.
19 G. Mauclaire, J. Lemaire, P. Boissel, G. Bellec and M. Heninger,Eur. J. Mass Spectrom., 2004, 10, 155.
20 M. J. Frisch, G. W. Trucks, H. B. Schlegel, G. E. Scuseria, M. A.Robb, J. R. Cheeseman, J. A. Montgomery Jr, T. Vreven, K. N.Kudin, J. C. Burant, J. M. Millam, S. S. Iyengar, J. Tomasi, V.Barone, B. Mennucci, M. Cossi, G. Scalmani, N. Rega, G. A.Petersson, H. Nakatsuji, M. Hada, M. Ehara, K. Toyota, R.Fukuda, J. Hasegawa, M. Ishida, T. Nakajima, Y. Honda, O.Kitao, H. Nakai, M. Klene, X. Li, J. E. Knox, H. P. Hratchian, J.B. Cross, C. Adamo, J. Jaramillo, R. Gomperts, R. E. Stratmann,O. Yazyev, A. J. Austin, R. Cammi, C. Pomelli, J. W. Ochterski, P.Y. Ayala, K. Morokuma, G. A. Voth, P. Salvador, J. J. Dannen-berg, V. G. Zakrzewski, S. Dapprich, A. D. Daniels, M. C. Strain,O. Farkas, D. K. Malick, A. D. Rabuck, K. Raghavachari, J. B.Foresman, J. V. Ortiz, Q. Cui, A. G. Baboul, S. Clifford, J.Cioslowski, B. B. Stefanov, G. Liu, A. Liashenko, P. Piskorz, I.
Komaromi, R. L. Martin, D. J. Fox, T. Keith, M. A. Al-Laham, C.Y. Peng, A. Nanayakkara, M. Challacombe, P. M. W. Gill, B.Johnson, W. Chen, M. W. Wong, C. Gonzalez and J. A. Pople,GAUSSIAN 03, (Revision B.04), Gaussian, Inc., Pittsburgh PA,2003.
21 T. Baer and W. L. Hase, Unimolecular Reaction Dynamics, Theoryand Experiments, Oxford University Press, New York, 1996.
22 J. A. D. McCormack and P. M. Mayer, Int. J. Mass Spectrom.,2001, 207, 183.
23 NIST Chemistry WebBook, NIST Standard Reference DatabaseNumber 69, ed. P. J. Linstrom and W. G. Mallard, June 2005,National Institute of Standards and Technology, GaithersburgMD, 20899, (http://webbook.nist.gov).
24 D. M. Peiris, J. M. Riveros and J. R. Eyler, Int. J. Mass Spectrom.Ion Processes, 1996, 159, 169.
25 D. S. Tonner and T. B. McMahon, Anal. Chem., 1997, 69, 4735.26 D. T. Moore, personal communication, June 23rd, 2005.27 N. Solca and O. Dopfer, J. Am. Chem. Soc., 2004, 126, 9520.28 G. Wu and A. Stace, Chem. Phys. Lett., 2005, 412, 1.29 There are of course photon emission process in effect such as
stimulated emission and the slower spontaneous emission which iswhy we say ‘‘net’’ absorption.
30 A. Serrallach, R. Meyer and Hs. H. Gunthard, J. Mol. Spectrosc.,1974, 52, 94.
31 C. Emmeluth, V. Dyczmons, T. Kinzel, P. Botschwina, M. A.Suhm and M. Yanez, Phys. Chem. Chem. Phys., 2005, 7, 991.
32 J. P. Perchard and M. L. Josien, J. Chem. Phys., 1968, 65,1834.
33 J.-M. Flaud, C. Camy-Peyret and R. A. Toth, Water Vapour LineParameters from Microwave to Medium Infrared, Pergamon Press,London, 1981.
34 K. Fukushima and B. J. Zwolinski, J. Mol. Spectrosc., 1968, 26,368.
966 | Phys. Chem. Chem. Phys., 2006, 8, 955–966 This journal is �c the Owner Societies 2006