Gas Events and Market Results of February 6, 2014 May 2014
21
TECHNICAL BULLETIN www.caiso.com │ 250 Outcropping Way, Folsom, CA 95630 │ 916.351.4400 Author: Guillermo Bautista Alderete Gas Events and Market Results of February 6, 2014 May 2014
-
Upload
khangminh22 -
Category
Documents
-
view
1 -
download
0
Transcript of Gas Events and Market Results of February 6, 2014 May 2014
TECHNICAL BULLETIN
www.caiso.com │ 250 Outcropping Way, Folsom, CA 95630 │ 916.351.4400
Author: Guillermo Bautista Alderete
Gas Events and Market Results
of February 6, 2014
May 2014
TECHNICAL BULLETIN
Gas Events and Market Results of February 6, 2014
www.caiso.com Revision History Author: Guillermo Bautista Alderete
Revision History
Date Version Description Author 2014-05-19 1.0 Guillermo Bautista Alderete
TECHNICAL BULLETIN
Gas Events and Market Results of February 6, 2014
www.caiso.com Page 3 of 21
Author: Guillermo Bautista Alderete
Contents
INTRODUCTION .................................................................................................................................4
DAY AHEAD MARKET .........................................................................................................................5
REAL-TIME MARKET ......................................................................................................................... 14
HOUR AHEAD MARKET ..................................................................................................................... 18
ANCILLARY SERVICES ........................................................................................................................ 20
FINAL REMARKS ............................................................................................................................... 21
TECHNICAL BULLETIN
Gas Events and Market Results of February 6, 2014
www.caiso.com Page 4 of 21
Author: Guillermo Bautista Alderete
Introduction
The ISO operates the bulk electric high-voltage transmission system that makes up
approximately 80 percent of California’s power grid. Approximately 60 percent of the installed
capacity in the ISO’s balancing authority area uses natural gas as fuel. The ISO also imports power,
a portion of which is also sourced from natural gas-fired electric generating units. While the “polar
vortex” weather condition that occurred in early January 2014 did not materially impact the ISO’s
balancing authority, the ISO experienced certain operational challenges due to natural gas
conditions arising from cold weather events in December 2013 and February 2014.
Market participants have raised a number of questions concerning how the ISO’s markets
functioned during the February 6, 2014 cold weather event. This technical bulletin describes the
market outcomes and their interplay with the natural gas conditions of February 6, 2014.
Separately, the ISO has started a stakeholder process to examine refinements regarding how it
determines commitment costs for natural gas-fired generators.1
1 http://www.caiso.com/informed/Pages/StakeholderProcesses/CommitmentCostEnhancements.aspx
TECHNICAL BULLETIN
Gas Events and Market Results of February 6, 2014
www.caiso.com Page 5 of 21
Author: Guillermo Bautista Alderete
Day Ahead Market
On February 6, 2014, natural gas prices increased three-fold from approximately $7/MMBtu the
previous day to over $20/MMBtu at some of the western trading hubs. This increase in prices
appears to have been linked to a shortage of natural gas, triggered by cold weather. The increase
in gas price for flow day February 6 reflected tight supply prior to the ISO day-ahead market had
completed. SoCalGas informed the ISO that storage levels were near all-time lows in part because
higher gas prices outside of California led to higher storage withdrawals.
In the weeks and days before February 6, the ISO monitored infrastructure outages for
reliability concerns, and ensured daily gas usage reports reflecting the day market results were sent
to gas pipeline operators. While the ISO had initiated efforts to enhance the granularity of the gas
usage rate reports to the pipeline operator at the unit level, those changes were not in place in
early February. This information will, in time, help gas pipeline operators anticipate constraints on
their systems due to the expected fuel use.
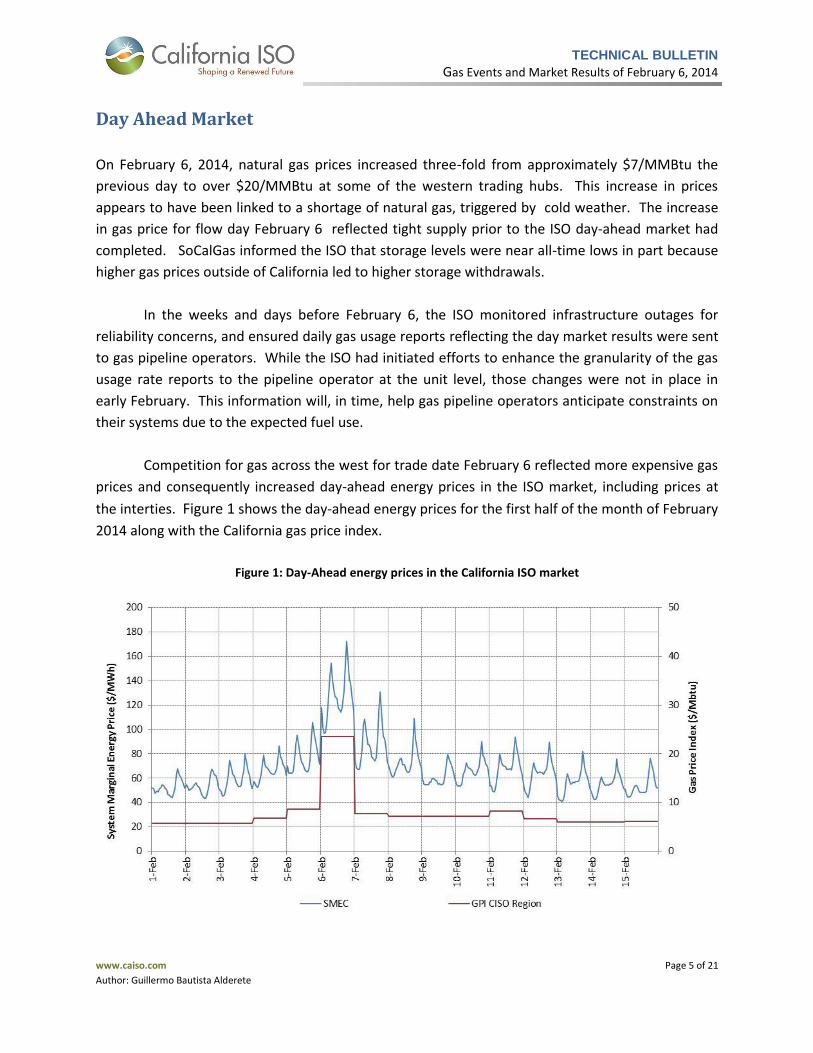
Competition for gas across the west for trade date February 6 reflected more expensive gas
prices and consequently increased day-ahead energy prices in the ISO market, including prices at
the interties. Figure 1 shows the day-ahead energy prices for the first half of the month of February
2014 along with the California gas price index.
Figure 1: Day-Ahead energy prices in the California ISO market
TECHNICAL BULLETIN
Gas Events and Market Results of February 6, 2014
www.caiso.com Page 6 of 21
Author: Guillermo Bautista Alderete
The ISO uses a gas price index to calculate various generator commitment costs, including
minimum load costs (MLC), start-up costs (STUC), transition costs and generated bids, as well as
costs for default energy bids. The ISO uses those costs as an input to its day-ahead market in order
to clear economic and feasible schedules. The gas price index for the day-ahead market run is
provided the night prior to running the day-ahead market; that is, for day-ahead market for trading
date of February 6, which was run on February 5 at 10am, the gas price index used was the value
available and coming into the system on the night of February 4.2 This gas price index was used for
the February 6 trading date to calculate MLC and STUC costs for units under the proxy cost option
to determine their commitment costs. Another set of resources operated under the registered cost
option; such resources have their MLC and STUC calculated based on a projected monthly price and
were not subject to the daily gas price changes.
For February 6, even if a more updated gas price would have been available and could have
been used, only those resources under the proxy option could have relied on this higher price for
their MLC and STCUC. The registered MLC and STUC cannot be modified for a period of 30 days
after becoming effective.3
Under the current policy as reflected in the tariff, the ISO must use at least two gas prices
among Natural Gas Intelligence, SNL Daily Gas Wire, Platt’s Gas Daily and Intercontinental Exchange
(ICE) to calculate its gas price index for purposes of commitment costs. These indices become
available as early as 10:00am and as late as 19:00pm on the day before the gas flow date; that is
one day before the day-ahead trading date. Based on the availability and timing of these indices,
the ISO implemented certain requirements4, such as using more than one gas price index. However,
there is only one gas price available on the morning that the day-ahead market runs. The only gas
price published prior to running the day-ahead market is the ICE index, which appears after 10:00
am and is after the day-ahead market is closed.
As a temporary measure, in March 2014 the ISO requested that FERC grant a waiver to
allow the ISO to: i) rely on only one gas index from ICE under certain circumstances which is the
only gas index that may be available reasonably close to the time the day-ahead market closes, and
ii) switch certain resources from their registered option to proxy cost option for commitment costs
in order to better reflect gas price changes as long as such resources pass the eligibility criteria for
2 For the real-time market, the gas price index provided on the night of February 5 was used, and such index reflected the high
gas price. 3 A generating unit with registered commitment costs may switch to a proxy cost option if fuel costs increase such that the
unit’s actual MLC and STCUC, as calculated under the proxy cost option, exceed the unit’s registered value under the registered cost option in the ISO’s master file. Once the unit switches to the proxy cost option during a 30 day period, it must remain on the proxy cost option for the remainder of the current 30 day period.
4 Appendix C of the Business Practice Manual for Market instruments.
TECHNICAL BULLETIN
Gas Events and Market Results of February 6, 2014
www.caiso.com Page 7 of 21
Author: Guillermo Bautista Alderete
switching. This temporary workaround would trigger if the ICE gas price index exceeded 150
percent of the most recent gas index available. This waiver was granted and became in effect from
March 21 through April 30, 2014.5 IN March and April, this workaround did not trigger. The ISO is
currently going through a stakeholder process for refinement of commitments costs.6
The day-ahead market for February 6 used a gas price index of about $8. With gas trading
on February 5th at prices over $20, there was interplay of incremental energy bids in the least-cost
solution of the day-ahead market solution. First, the MLC and STCUC of resources using the
registered cost option were based on the gas future price of $4.53 and they could not use any other
gas price index even if available. Their MLC and STCUC could reflect up to 150% of the future gas
price of $4.53. Second, the MLC and STCUC for resources under proxy option reflected the daily gas
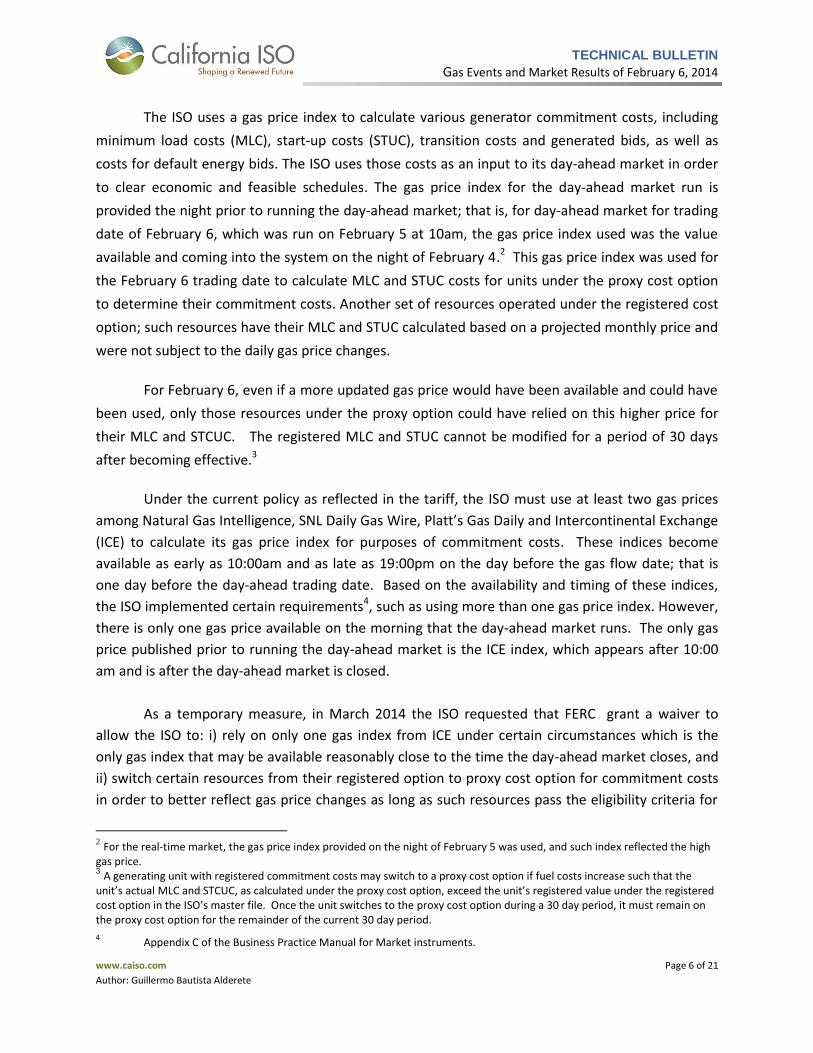
price index of $8 dollars. Third, given the flexibility to submit incremental energy bids up to the
time the day market closes, multiple resources reflected the higher gas prices in their incremental
energy bids, including energy bids for intertie resources, as shown in Figure 2. This figure shows a
one-week trend of incremental energy bids submitted for the day-ahead market starting on
February 2, 2014.
Figure 2: Incremental energy bid-in prices in the day-ahead market
5 California Indep. Sys. Operator Corp., 146 FERC 61,218 (2014)
http://elibrary.ferc.gov/idmws/File_list.asp?document_id=14196672
6 More details of this stakeholder process are available at
http://www.caiso.com/informed/Pages/StakeholderProcesses/CommitmentCostEnhancements.aspx
TECHNICAL BULLETIN
Gas Events and Market Results of February 6, 2014
www.caiso.com Page 8 of 21
Author: Guillermo Bautista Alderete
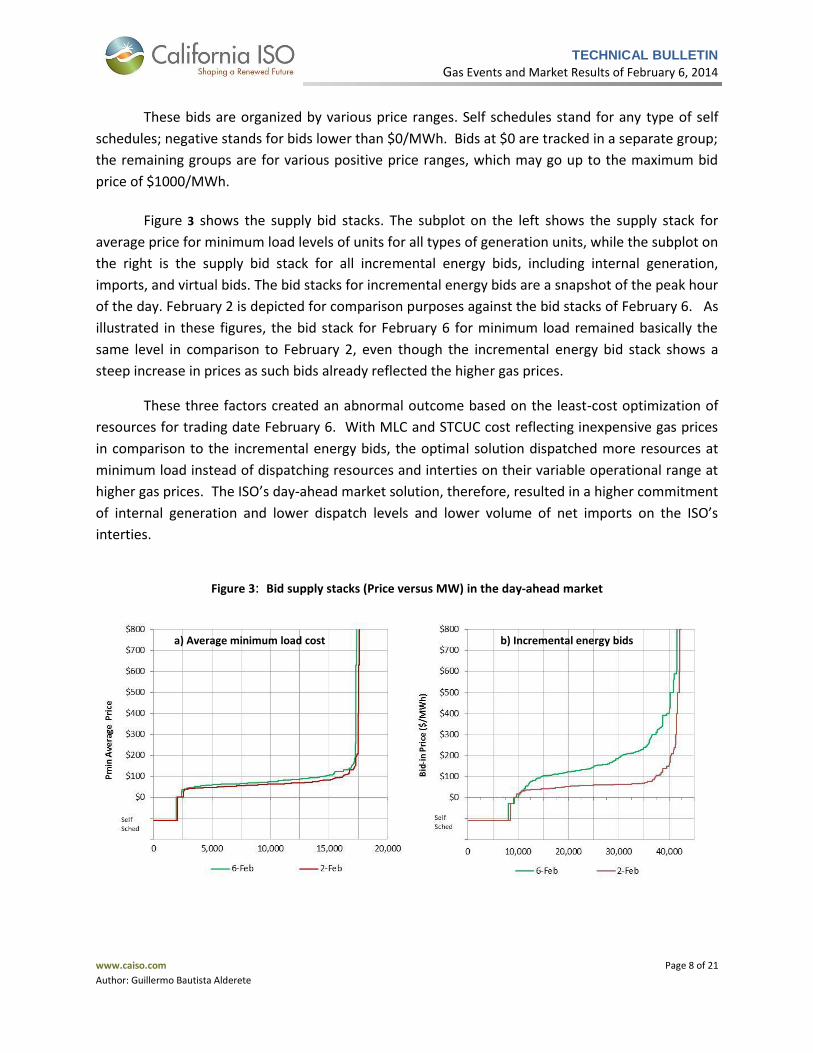
These bids are organized by various price ranges. Self schedules stand for any type of self
schedules; negative stands for bids lower than $0/MWh. Bids at $0 are tracked in a separate group;
the remaining groups are for various positive price ranges, which may go up to the maximum bid
price of $1000/MWh.
Figure 3 shows the supply bid stacks. The subplot on the left shows the supply stack for
average price for minimum load levels of units for all types of generation units, while the subplot on
the right is the supply bid stack for all incremental energy bids, including internal generation,
imports, and virtual bids. The bid stacks for incremental energy bids are a snapshot of the peak hour
of the day. February 2 is depicted for comparison purposes against the bid stacks of February 6. As
illustrated in these figures, the bid stack for February 6 for minimum load remained basically the
same level in comparison to February 2, even though the incremental energy bid stack shows a
steep increase in prices as such bids already reflected the higher gas prices.
These three factors created an abnormal outcome based on the least-cost optimization of
resources for trading date February 6. With MLC and STCUC cost reflecting inexpensive gas prices
in comparison to the incremental energy bids, the optimal solution dispatched more resources at
minimum load instead of dispatching resources and interties on their variable operational range at
higher gas prices. The ISO’s day-ahead market solution, therefore, resulted in a higher commitment
of internal generation and lower dispatch levels and lower volume of net imports on the ISO’s
interties.
Figure 3: Bid supply stacks (Price versus MW) in the day-ahead market
a) Average minimum load cost b) Incremental energy bids
TECHNICAL BULLETIN
Gas Events and Market Results of February 6, 2014
www.caiso.com Page 9 of 21
Author: Guillermo Bautista Alderete
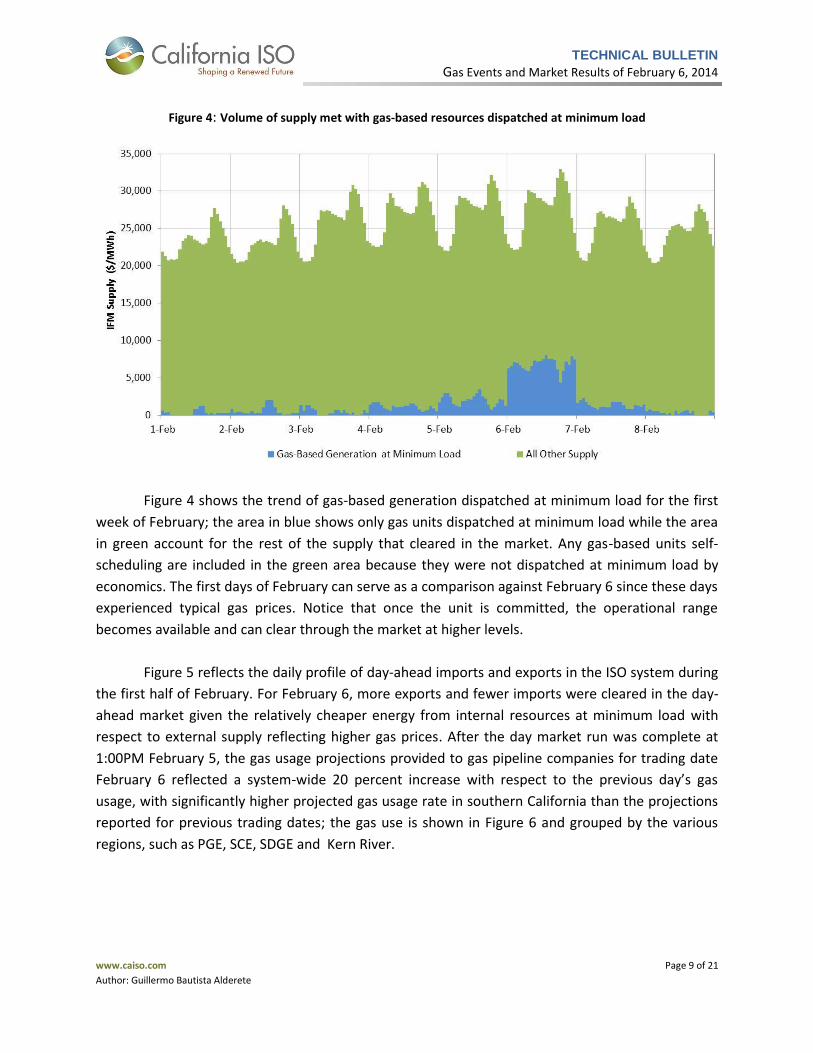
Figure 4: Volume of supply met with gas-based resources dispatched at minimum load
Figure 4 shows the trend of gas-based generation dispatched at minimum load for the first
week of February; the area in blue shows only gas units dispatched at minimum load while the area
in green account for the rest of the supply that cleared in the market. Any gas-based units self-
scheduling are included in the green area because they were not dispatched at minimum load by
economics. The first days of February can serve as a comparison against February 6 since these days
experienced typical gas prices. Notice that once the unit is committed, the operational range
becomes available and can clear through the market at higher levels.
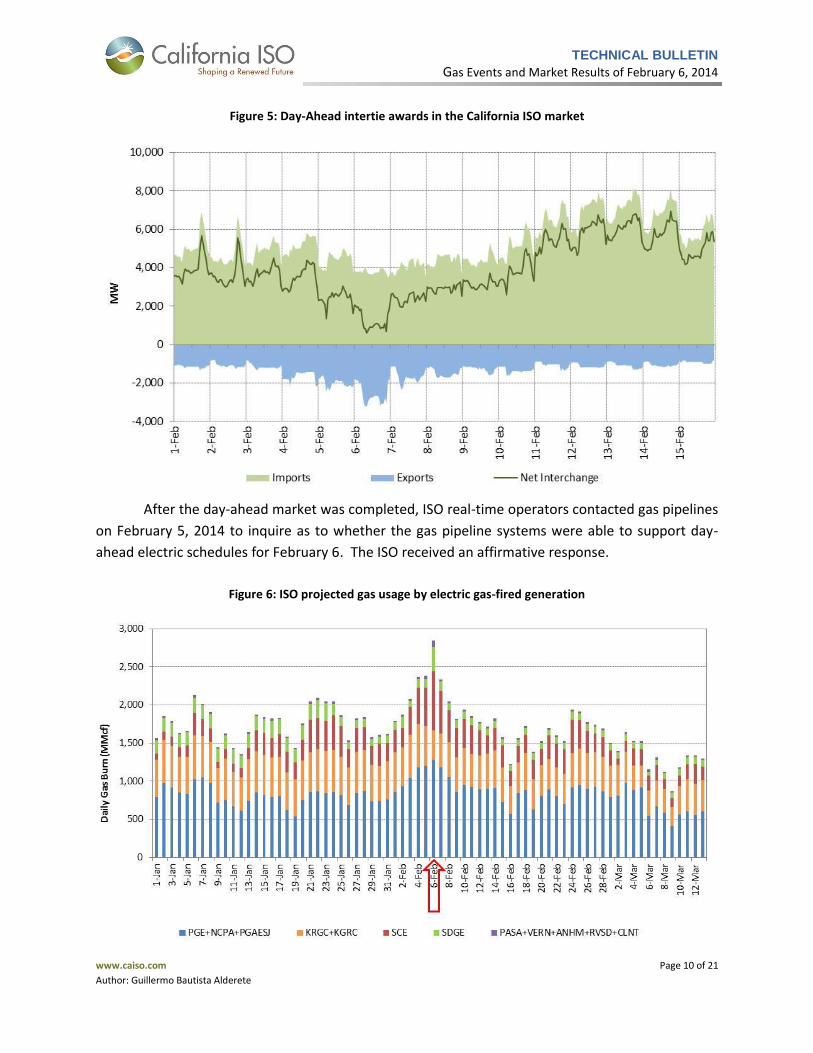
Figure 5 reflects the daily profile of day-ahead imports and exports in the ISO system during
the first half of February. For February 6, more exports and fewer imports were cleared in the day-
ahead market given the relatively cheaper energy from internal resources at minimum load with
respect to external supply reflecting higher gas prices. After the day market run was complete at
1:00PM February 5, the gas usage projections provided to gas pipeline companies for trading date
February 6 reflected a system-wide 20 percent increase with respect to the previous day’s gas
usage, with significantly higher projected gas usage rate in southern California than the projections
reported for previous trading dates; the gas use is shown in Figure 6 and grouped by the various
regions, such as PGE, SCE, SDGE and Kern River.
TECHNICAL BULLETIN
Gas Events and Market Results of February 6, 2014
www.caiso.com Page 10 of 21
Author: Guillermo Bautista Alderete
Figure 5: Day-Ahead intertie awards in the California ISO market
After the day-ahead market was completed, ISO real-time operators contacted gas pipelines
on February 5, 2014 to inquire as to whether the gas pipeline systems were able to support day-
ahead electric schedules for February 6. The ISO received an affirmative response.
Figure 6: ISO projected gas usage by electric gas-fired generation
TECHNICAL BULLETIN
Gas Events and Market Results of February 6, 2014
www.caiso.com Page 11 of 21
Author: Guillermo Bautista Alderete
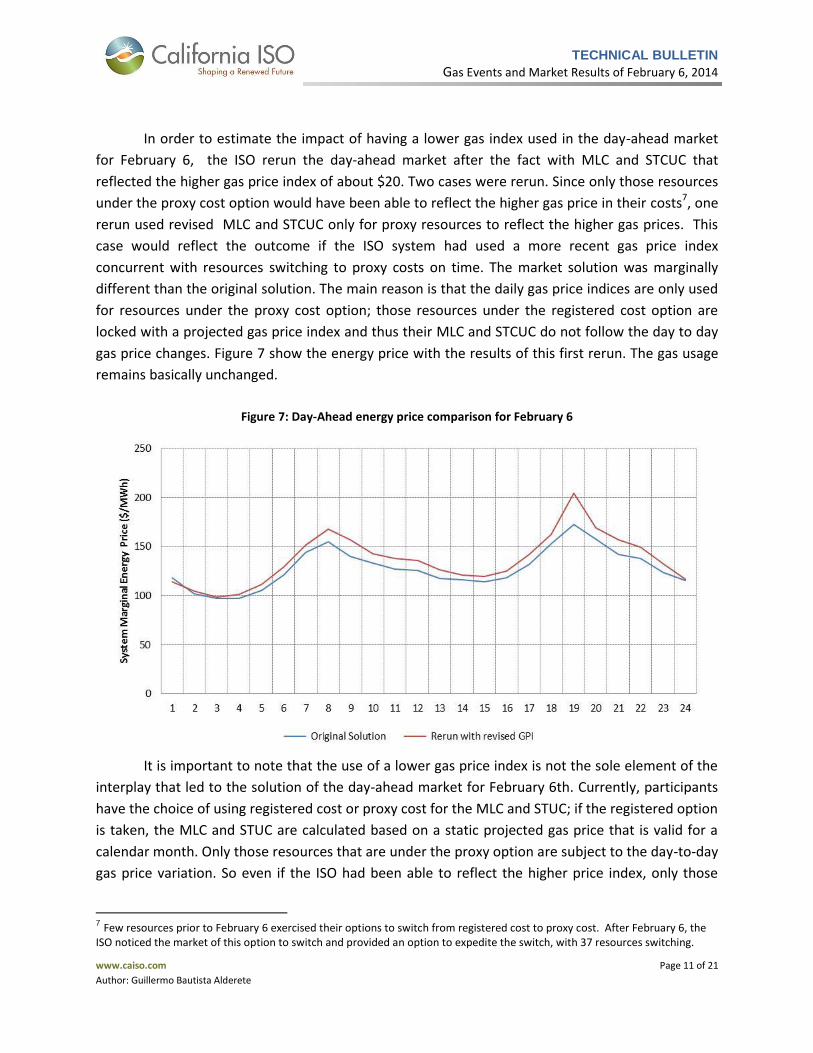
In order to estimate the impact of having a lower gas index used in the day-ahead market
for February 6, the ISO rerun the day-ahead market after the fact with MLC and STCUC that
reflected the higher gas price index of about $20. Two cases were rerun. Since only those resources
under the proxy cost option would have been able to reflect the higher gas price in their costs7, one
rerun used revised MLC and STCUC only for proxy resources to reflect the higher gas prices. This
case would reflect the outcome if the ISO system had used a more recent gas price index
concurrent with resources switching to proxy costs on time. The market solution was marginally
different than the original solution. The main reason is that the daily gas price indices are only used
for resources under the proxy cost option; those resources under the registered cost option are
locked with a projected gas price index and thus their MLC and STCUC do not follow the day to day
gas price changes. Figure 7 show the energy price with the results of this first rerun. The gas usage
remains basically unchanged.
Figure 7: Day-Ahead energy price comparison for February 6
It is important to note that the use of a lower gas price index is not the sole element of the
interplay that led to the solution of the day-ahead market for February 6th. Currently, participants
have the choice of using registered cost or proxy cost for the MLC and STUC; if the registered option
is taken, the MLC and STUC are calculated based on a static projected gas price that is valid for a
calendar month. Only those resources that are under the proxy option are subject to the day-to-day
gas price variation. So even if the ISO had been able to reflect the higher price index, only those
7 Few resources prior to February 6 exercised their options to switch from registered cost to proxy cost. After February 6, the
ISO noticed the market of this option to switch and provided an option to expedite the switch, with 37 resources switching.
TECHNICAL BULLETIN
Gas Events and Market Results of February 6, 2014
www.caiso.com Page 12 of 21
Author: Guillermo Bautista Alderete
resources under the proxy option could have taken advantage of it. But on that day and as of now,
multiple resources were and are under the registered cost option, under which and for effective
purposes are insensitive to the gas price spikes. Based on the rerun i) the gas usage remained
basically the same and ii) the system energy prices saw a 15% ($30) increase at the peak hour.
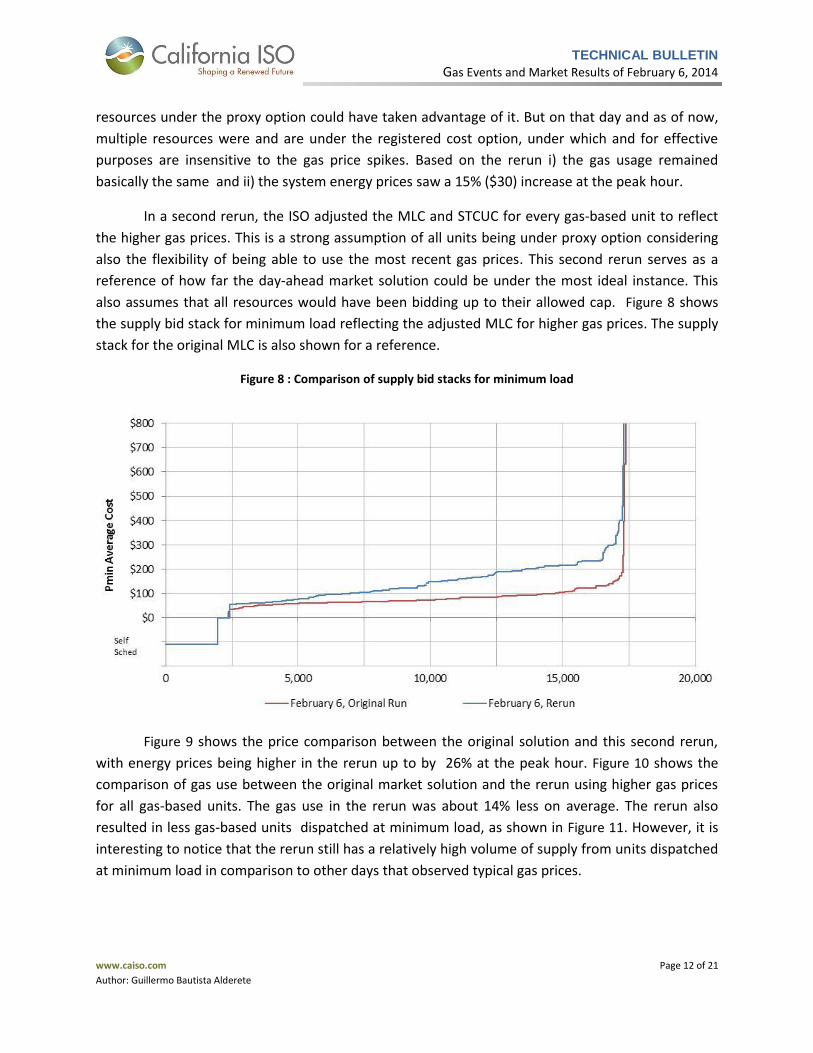
In a second rerun, the ISO adjusted the MLC and STCUC for every gas-based unit to reflect
the higher gas prices. This is a strong assumption of all units being under proxy option considering
also the flexibility of being able to use the most recent gas prices. This second rerun serves as a
reference of how far the day-ahead market solution could be under the most ideal instance. This
also assumes that all resources would have been bidding up to their allowed cap. Figure 8 shows
the supply bid stack for minimum load reflecting the adjusted MLC for higher gas prices. The supply
stack for the original MLC is also shown for a reference.
Figure 8 : Comparison of supply bid stacks for minimum load
Figure 9 shows the price comparison between the original solution and this second rerun,
with energy prices being higher in the rerun up to by 26% at the peak hour. Figure 10 shows the
comparison of gas use between the original market solution and the rerun using higher gas prices
for all gas-based units. The gas use in the rerun was about 14% less on average. The rerun also
resulted in less gas-based units dispatched at minimum load, as shown in Figure 11. However, it is
interesting to notice that the rerun still has a relatively high volume of supply from units dispatched
at minimum load in comparison to other days that observed typical gas prices.

TECHNICAL BULLETIN
Gas Events and Market Results of February 6, 2014
www.caiso.com Page 13 of 21
Author: Guillermo Bautista Alderete
Figure 9 : Day-Ahead energy price comparison for February 6
Figure 10: Comparison of gas use between runs for February 6
It is important to notice that the second rerun is based on a second level of assumptions
made about resources that would have switched from registered to proxy, but the reality is that by
February 5 when the day-ahead market was run such switching from registered to proxy did not
take place. As of now many resources are still under registered cost option, and for one or another
reason this is the option they have chosen to manage their risk under the current paradigm even
TECHNICAL BULLETIN
Gas Events and Market Results of February 6, 2014
www.caiso.com Page 14 of 21
Author: Guillermo Bautista Alderete
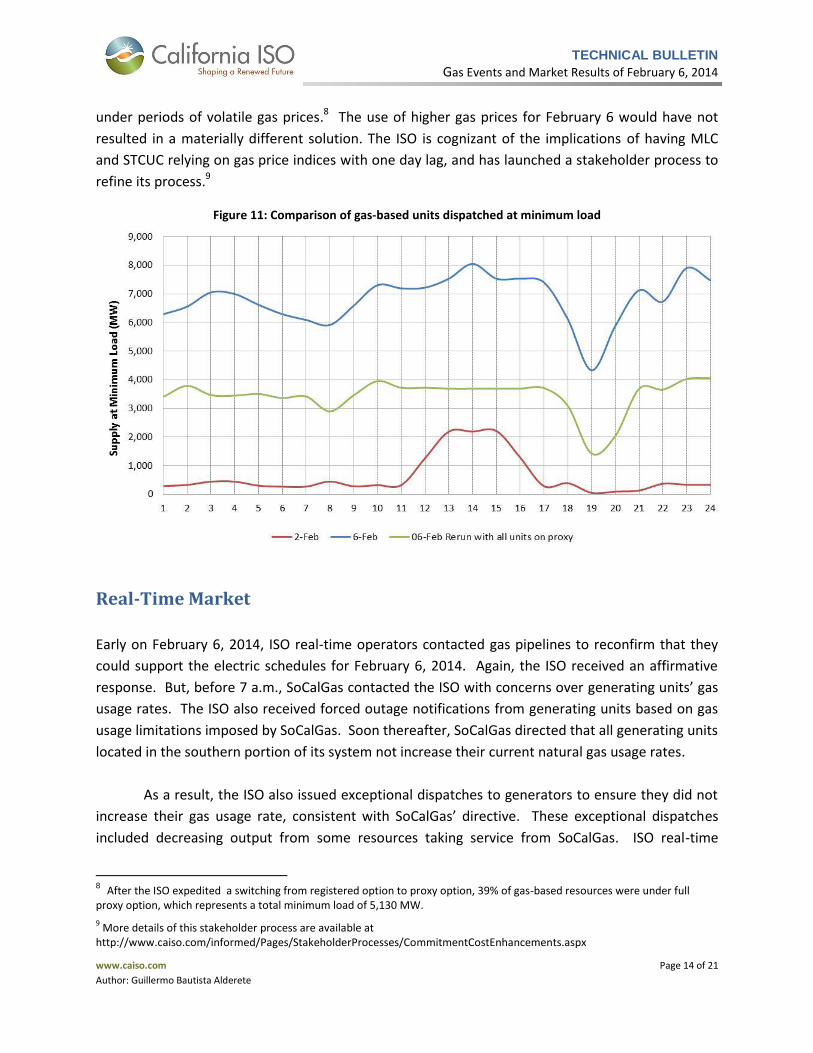
under periods of volatile gas prices.8 The use of higher gas prices for February 6 would have not
resulted in a materially different solution. The ISO is cognizant of the implications of having MLC
and STCUC relying on gas price indices with one day lag, and has launched a stakeholder process to
refine its process.9
Figure 11: Comparison of gas-based units dispatched at minimum load
Real-Time Market
Early on February 6, 2014, ISO real-time operators contacted gas pipelines to reconfirm that they
could support the electric schedules for February 6, 2014. Again, the ISO received an affirmative
response. But, before 7 a.m., SoCalGas contacted the ISO with concerns over generating units’ gas
usage rates. The ISO also received forced outage notifications from generating units based on gas
usage limitations imposed by SoCalGas. Soon thereafter, SoCalGas directed that all generating units
located in the southern portion of its system not increase their current natural gas usage rates.
As a result, the ISO also issued exceptional dispatches to generators to ensure they did not
increase their gas usage rate, consistent with SoCalGas’ directive. These exceptional dispatches
included decreasing output from some resources taking service from SoCalGas. ISO real-time
8 After the ISO expedited a switching from registered option to proxy option, 39% of gas-based resources were under full
proxy option, which represents a total minimum load of 5,130 MW.
9 More details of this stakeholder process are available at
http://www.caiso.com/informed/Pages/StakeholderProcesses/CommitmentCostEnhancements.aspx

TECHNICAL BULLETIN
Gas Events and Market Results of February 6, 2014
www.caiso.com Page 15 of 21
Author: Guillermo Bautista Alderete
operators then dispatched other generating units and intertie resources to make up for the loss of
electric supply. Figure 12 shows the daily profile of exceptional dispatches (ED) and reflects the
absolute sum of all exceptional dispatches (incremental plus decremental) during the applicable
timeframe, including decreased output from certain resources and increased output from other
resources.
Figure 12: Daily exceptional dispatch by reason
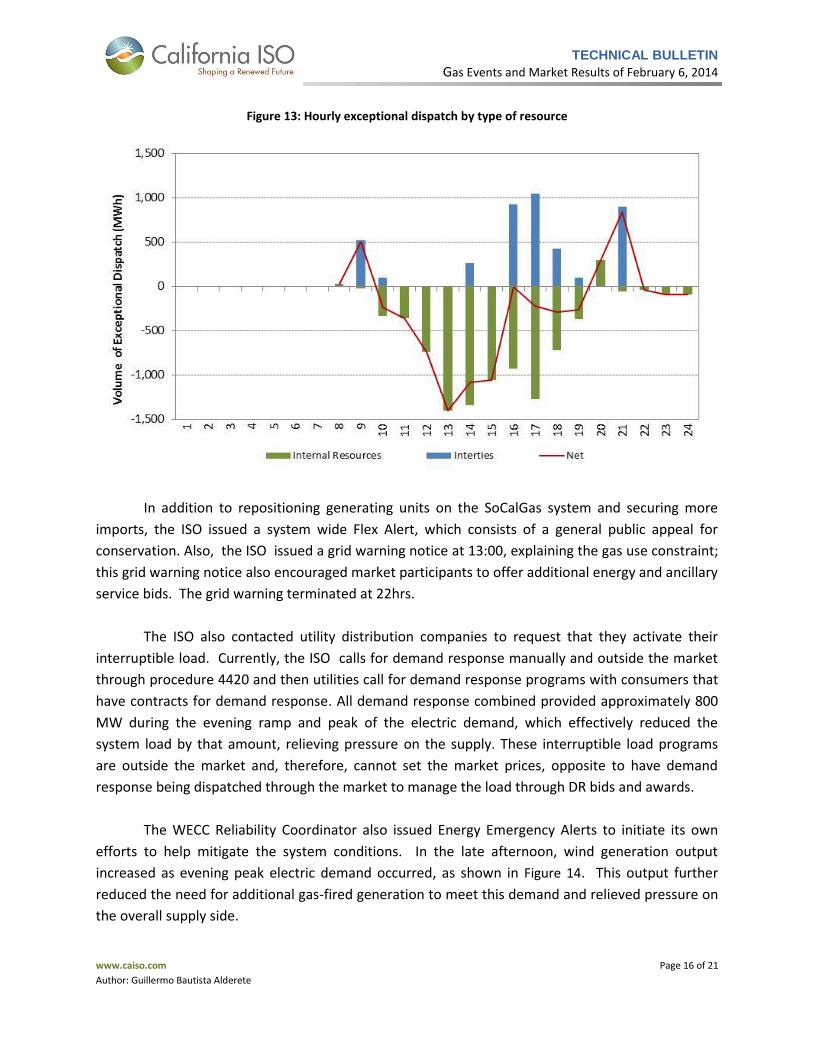
Figure 13 shows the hourly trend of exceptional dispatches; this is grouped into internal
resources and interties. The majority of exceptional dispatches were decremental since the output
for multiple gas-based units in the south were limited to manage the gas usage. With concerns of
limited supply with the projected evening peak, the ISO acquired intertie energy through
exceptional dispatches in the real-time market in order to secure more imports. The negotiated
price of the exceptional dispatch on ties was on average about $250.
Some participants raised concerns that the data posted on OASIS regarding exceptional
dispatches did not include EDs for interties. Exceptional dispatches for interties are not currently
included on OASIS. The ISO expects to improve the OASIS report after the implementation of the
Spring release to reflect the interties EDs as well. However, it is important to note that the ISO
provides another mechanism to report the exceptional dispatches, including interties. As per FERC
order ER08-1178, the ISO issues on a monthly basis two ED reports10.
10
Exceptional Dispatch reports, namely Table I and Table II, contain specific details of all exceptional dispatches issued during a given month, including (1) Megawatts (MW); (2) Commitment; (3) Inc or Dec; (4) Hours; (5) Begin Time; (6) End Time; (7) Total Volume (MWh); (8) Min Load Cost; (9) Start Up Cost; (10) CC6470; (11) ED Volume (MWh INC/DEC); (12) CC6470 INC; (13) CC6470 DEC; (14) CC6482; (15) CC6488; and (16) CC6620. Exceptional Dispatch reports are available through the ISO public website at http://www.caiso.com/Pages/documentsbygroup.aspx?GroupID=240C755B-777E-4816-A75C-80C0702E7F8D
TECHNICAL BULLETIN
Gas Events and Market Results of February 6, 2014
www.caiso.com Page 16 of 21
Author: Guillermo Bautista Alderete
Figure 13: Hourly exceptional dispatch by type of resource
In addition to repositioning generating units on the SoCalGas system and securing more
imports, the ISO issued a system wide Flex Alert, which consists of a general public appeal for
conservation. Also, the ISO issued a grid warning notice at 13:00, explaining the gas use constraint;
this grid warning notice also encouraged market participants to offer additional energy and ancillary
service bids. The grid warning terminated at 22hrs.
The ISO also contacted utility distribution companies to request that they activate their
interruptible load. Currently, the ISO calls for demand response manually and outside the market
through procedure 4420 and then utilities call for demand response programs with consumers that
have contracts for demand response. All demand response combined provided approximately 800
MW during the evening ramp and peak of the electric demand, which effectively reduced the
system load by that amount, relieving pressure on the supply. These interruptible load programs
are outside the market and, therefore, cannot set the market prices, opposite to have demand
response being dispatched through the market to manage the load through DR bids and awards.
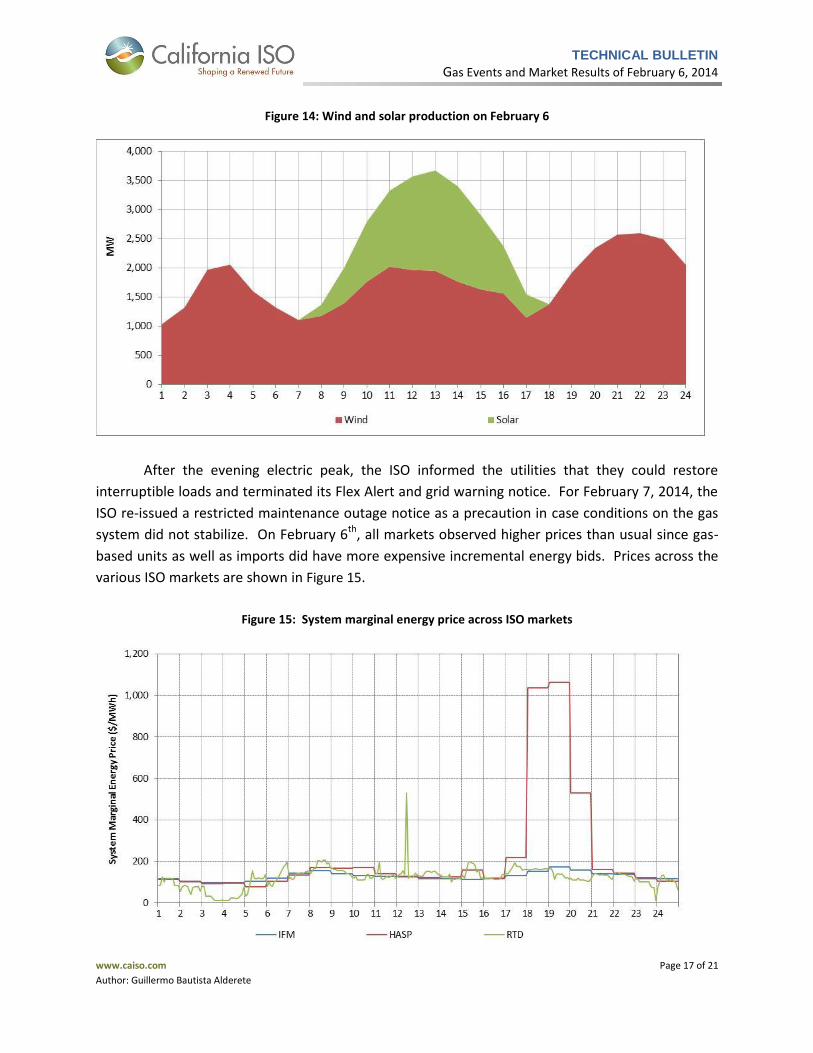
The WECC Reliability Coordinator also issued Energy Emergency Alerts to initiate its own
efforts to help mitigate the system conditions. In the late afternoon, wind generation output
increased as evening peak electric demand occurred, as shown in Figure 14. This output further
reduced the need for additional gas-fired generation to meet this demand and relieved pressure on
the overall supply side.
TECHNICAL BULLETIN
Gas Events and Market Results of February 6, 2014
www.caiso.com Page 17 of 21
Author: Guillermo Bautista Alderete
Figure 14: Wind and solar production on February 6
After the evening electric peak, the ISO informed the utilities that they could restore
interruptible loads and terminated its Flex Alert and grid warning notice. For February 7, 2014, the
ISO re-issued a restricted maintenance outage notice as a precaution in case conditions on the gas
system did not stabilize. On February 6th, all markets observed higher prices than usual since gas-
based units as well as imports did have more expensive incremental energy bids. Prices across the
various ISO markets are shown in Figure 15.
Figure 15: System marginal energy price across ISO markets
TECHNICAL BULLETIN
Gas Events and Market Results of February 6, 2014
www.caiso.com Page 18 of 21
Author: Guillermo Bautista Alderete
One concern raised for this day is the real-time prices not reaching levels beyond $200. As
explained through the document, there are three main factors at play: demand response help to
shave the load across the evening ramp and peak, ii) the wind generation picked up just right
around the evening peak, and iii) given the projected tight conditions for the peak the ISO secured
more interties to position the system for the evening peak. All these factors combined resulted in
less demand and more supply available that help manage the gas supply limitations and that also
resulted in the system clearing at a lower level in the supply stack that resulted in such prices.
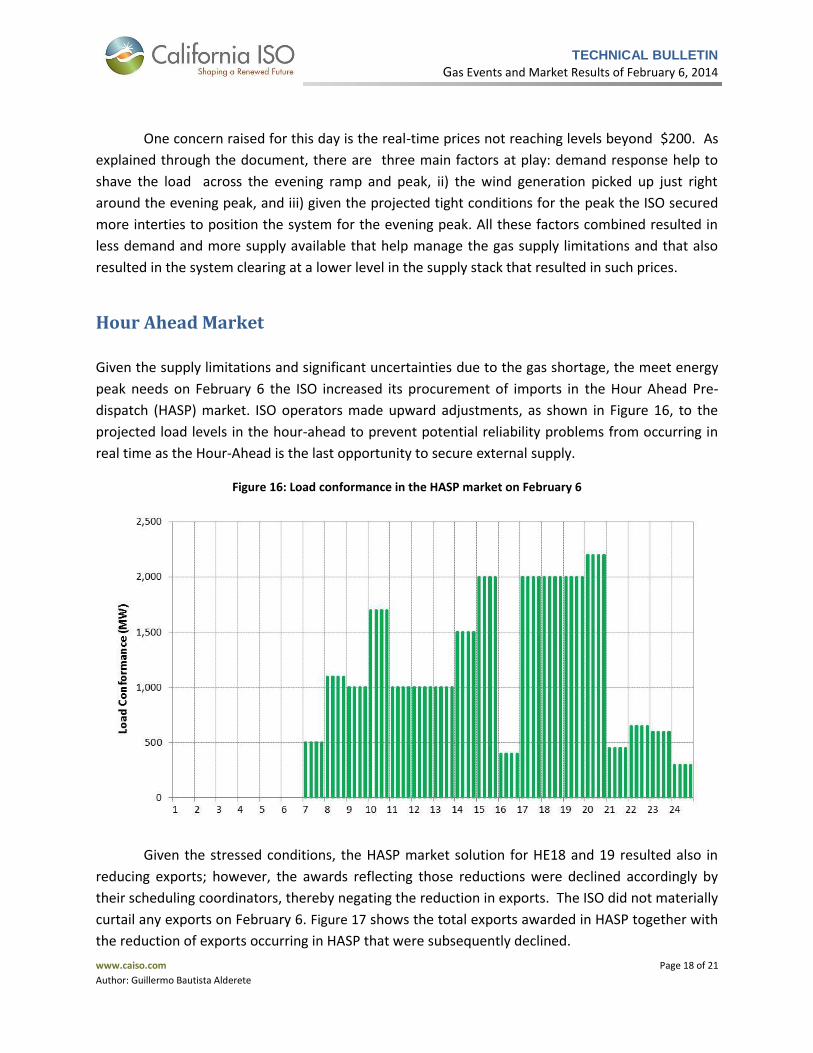
Hour Ahead Market
Given the supply limitations and significant uncertainties due to the gas shortage, the meet energy
peak needs on February 6 the ISO increased its procurement of imports in the Hour Ahead Pre-
dispatch (HASP) market. ISO operators made upward adjustments, as shown in Figure 16, to the
projected load levels in the hour-ahead to prevent potential reliability problems from occurring in
real time as the Hour-Ahead is the last opportunity to secure external supply.
Figure 16: Load conformance in the HASP market on February 6
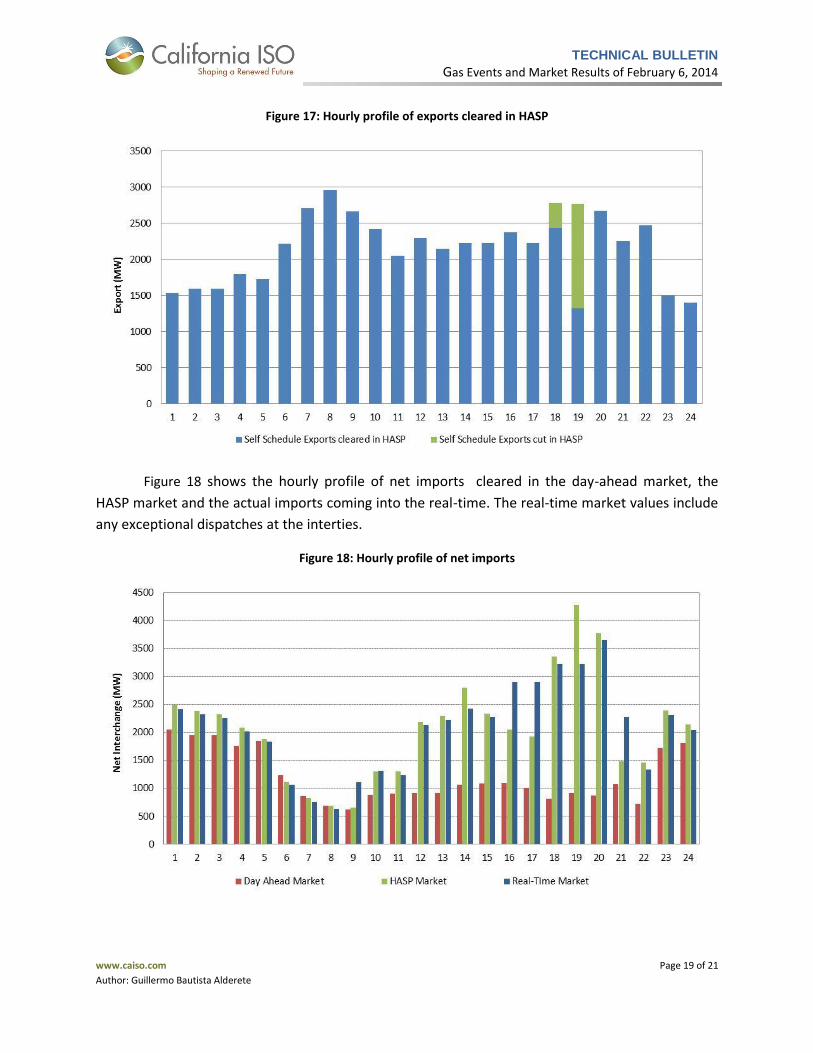
Given the stressed conditions, the HASP market solution for HE18 and 19 resulted also in
reducing exports; however, the awards reflecting those reductions were declined accordingly by
their scheduling coordinators, thereby negating the reduction in exports. The ISO did not materially
curtail any exports on February 6. Figure 17 shows the total exports awarded in HASP together with
the reduction of exports occurring in HASP that were subsequently declined.
TECHNICAL BULLETIN
Gas Events and Market Results of February 6, 2014
www.caiso.com Page 19 of 21
Author: Guillermo Bautista Alderete
Figure 17: Hourly profile of exports cleared in HASP
Figure 18 shows the hourly profile of net imports cleared in the day-ahead market, the
HASP market and the actual imports coming into the real-time. The real-time market values include
any exceptional dispatches at the interties.
Figure 18: Hourly profile of net imports
TECHNICAL BULLETIN
Gas Events and Market Results of February 6, 2014
www.caiso.com Page 20 of 21
Author: Guillermo Bautista Alderete
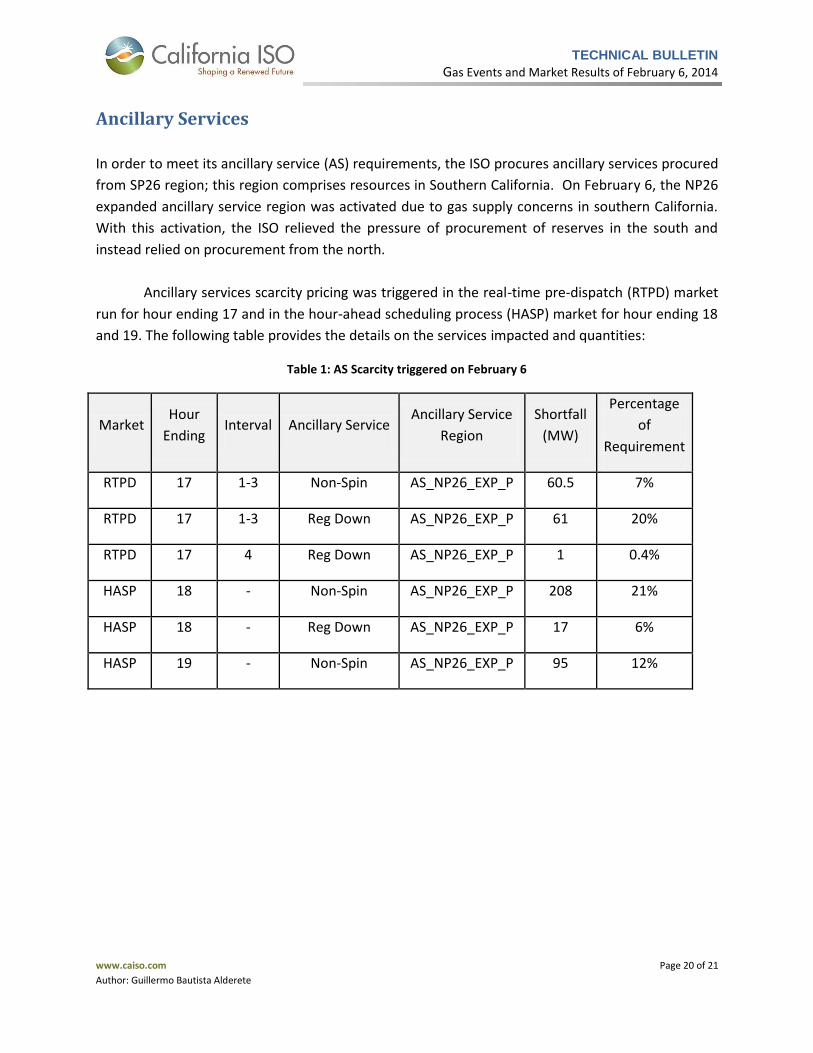
Ancillary Services
In order to meet its ancillary service (AS) requirements, the ISO procures ancillary services procured
from SP26 region; this region comprises resources in Southern California. On February 6, the NP26
expanded ancillary service region was activated due to gas supply concerns in southern California.
With this activation, the ISO relieved the pressure of procurement of reserves in the south and
instead relied on procurement from the north.
Ancillary services scarcity pricing was triggered in the real-time pre-dispatch (RTPD) market
run for hour ending 17 and in the hour-ahead scheduling process (HASP) market for hour ending 18
and 19. The following table provides the details on the services impacted and quantities:
Table 1: AS Scarcity triggered on February 6
Market Hour
Ending Interval Ancillary Service
Ancillary Service
Region
Shortfall
(MW)
Percentage
of
Requirement
RTPD 17 1-3 Non-Spin AS_NP26_EXP_P 60.5 7%
RTPD 17 1-3 Reg Down AS_NP26_EXP_P 61 20%
RTPD 17 4 Reg Down AS_NP26_EXP_P 1 0.4%
HASP 18 - Non-Spin AS_NP26_EXP_P 208 21%
HASP 18 - Reg Down AS_NP26_EXP_P 17 6%
HASP 19 - Non-Spin AS_NP26_EXP_P 95 12%

TECHNICAL BULLETIN
Gas Events and Market Results of February 6, 2014
www.caiso.com Page 21 of 21
Author: Guillermo Bautista Alderete
Final Remarks
Based on outcomes from February 6, the ISO continues to work with natural gas pipeline operators
to improve communications and awareness between real-time operators of the ISO and pipeline
systems.
Among the lessons learned from the February 6 cold weather events was that gas prices
used for the calculation of generating unit MLC and STCUC may not reflect the current gas price in
the event of a sudden gas price spike. This is because the ISO uses gas market indices that are based
on gas trades the day prior to the ISO’s day-ahead market. As a result, the ISO’s market committed
resources in the day-ahead market that reflected the lower gas prices traded the previous day. This
created concerns because the situation resulted in an inefficient dispatch that did not accurately
reflect generation production costs.
To address this issue, the ISO requested, and the Commission granted, temporary waivers of
its tariff to allow the ISO to incorporate a more recent gas price forecast into its day-ahead market
solution as well as settlement practices under certain conditions, including the option for
registered-cost resources to switch to proxy cost option when gas price spikes occur. The time
period for those waivers has expired. The ISO is now undertaking a stakeholder process to explore
refinements to its market rules. The ISO plans to include this item in the agenda of the upcoming
Market Performance and Update Forum on May 22, 2014.