Functional Requirements Document Template - ARLIS
26
Standard Operating Procedure Exxon Valdez Oil Spill Trustee Council Prince William Sound Herring Ecosystem Data Management System Rob Bochenek Axiom Consulting & Design May 2011
-
Upload
khangminh22 -
Category
Documents
-
view
0 -
download
0
Transcript of Functional Requirements Document Template - ARLIS
Standard Operating Procedure
Exxon Valdez Oil Spill Trustee Council Prince William Sound Herring Ecosystem Data Management System Rob Bochenek Axiom Consulting & Design May 2011

Revision Sheet
Standard Operating Procedures Page i
Revision Sheet Release No. Date Revision Description
Standard Operating Procedures Page ii
The intent of this standard operating procedure is to define a framework and process for managing multidisciplinary data to inform and power an integrated ecosystem research program.
The following document takes into account voiced needs of various user groups in addition to emerging national data management and communication protocols and standards.
1.0 General Information
Standard Operating Procedure
STANDARD OPERATING PROCEDURE
TABLE OF CONTENTS
Page #
Background .......................................................................................................................................... 1-1
1.0 GENERAL INFORMATION ...................................................................................................... 1-1
1.1 Purpose .................................................................................................................................... 1-1
1.2 Problem Statement ................................................................................................................. 1-1
1.3 Requirements Gathering Methodology ................................................................................ 1-2 1.3.1 Isolation of User Groups .....................................................................................................................1-2 1.3.2 User Engagement and Assessment .....................................................................................................1-2 1.3.3 Workshops ..........................................................................................................................................1-2
2.0 INFORMATION SYSTEM VISION ........................................................................................... 2-1
2.1 Consolidation of User Needs into Guiding Principles ......................................................... 2-1 2.1.1 Provide Granular Queriable Access to Raw Data for User Groups ....................................................2-1 2.1.2 Provide Standardized Metadata for Datasets ......................................................................................2-1 2.1.3 Enable All Data to Be Spatially/Temporally Explicit at Multiple Scales ...........................................2-2 2.1.4 Embrace Distributed Data Management .............................................................................................2-2 2.1.5 Automate Data Management Practices ...............................................................................................2-2 2.1.6 Implement Systems which are Open Source and Standards Based .....................................................2-3
3.0 Implementation Architecture ....................................................................................................... 3-1
3.1 Data Knowledge Pyramid ...................................................................................................... 3-1
4.0 Data Flow Diagrams .................................................................................................................... 4-1
4.1 Data Flow Diagram 1.0 – Complete System ......................................................................... 4-1
4.2 Data Flow Diagram 1.1 – Data Preparation & Salvage ...................................................... 4-4
4.3 Data Flow Diagram 1.2 – Interoperability Integration ....................................................... 4-6
1.0 General Information
Standard Operating Procedure
1.0 GENERAL INFORMATION
1.0 General Information
Standard Operating Procedure Page 1-1
Background This standard operating procedure document is distilled from the protocols and methodologies developed during the Exxon Valdez Oil Spill Trustee Council (EVOSTC) sponsored Prince William Sound (PWS) Herring Portal project. This project was funded by between 2007 and 2009 and involved the entire spectrum of data management activities from data salvage to data access and visualization. The focus of the project was to develop data management tools for herring information which directly addressed the needs of the user community. This document was developed during the final phase of the project and constitutes a post implementation assessment of the project activities, formally describes the developed approach, and attempts to provide a roadmap to guide future data management efforts in this area.
1.0 GENERAL INFORMATION
1.1 Purpose This intent of this document is to provide a high level directive for implementation of data management practices to provide a foundation for ecosystem based long term monitoring and strategic guidance for addressing the needs of all potential users of the data management system. Documenting system requirements from the perspective of user groups provides a solid base for the development of use cases, measurable goals, data flow diagrams and other software design methodologies. These methodologies will enable data managers to more effectively plan, design, code, implement and maintain the emerging long term monitoring data system.
1.2 Problem Statement Managing oceanographic data is particularly challenging due to the variety of data collection protocols and the vast range of oceanographic variables studied. Data may derive from automated real-time sensors, remote sensing satellite/observational platforms, field/cruise observations, model outputs, and various other sources. Variables can range from mesoscale ocean dynamics to microscale zooplankton counts. The resulting datasets are packaged and stored in advanced formats, and describe a wide spectrum of scientific observations and metrics. Due to the complexity of the data, developing data management strategies to securely organize and disseminate information is also technically challenging. Distilling the underlying information into usable products for various user groups requires a cohesive, end-to-end approach in addition to a fundamental understanding of the needs and requirements of the user groups and stakeholders. Data management activities for oceanographic information occur in isolated, physically distributed agencies, leading to low cross-agency utilization of data. Technical barriers, complex data formats, a lack of standardization and missing metadata have limited access to data and made the utilization of available scientific information cumbersome and daunting. As a consequence, existing data is underutilized and often has not undergone quality assurance.
1.0 General Information
Standard Operating Procedure Page 1-2
1.3 Requirements Gathering Methodology
1.3.1 Isolation of User Groups Users of the data management system were sorted logically into two categories: Customers and Stakeholders. Customers are defined as 'the primary beneficiaries of project outcomes,' while Stakeholders are much more on the periphery. Customers are directly impacted in their everyday business operations by the capabilities of the information system, and thus their success is tied intimately to the overall success of the proposed system. Stakeholders are much less tied to the system but will benefit from the added functionality that the information system will provide. The information system must ultimately meet as many of the needs of its users as possible but should be focused primarily on meeting the core needs of the customer group. For the purpose of this analysis the following groups were engaged: Customers
• Principal Investigators of the EVOSTC Integrated Herring Research Program • Alaska Department of Fish & Game Commercial Fisheries Cordova Staff
Stakeholders
• Bioinformatics research community • Policy makers • Non-government organizations (NGOs) • Interested public • Education and outreach
1.3.2 User Engagement and Assessment A core component of the PWS Herring Portal project involved engaging users with developed data management systems to solicit feedback on functional capabilities and prioritize data needs. User engagement was facilitated through a large number of demonstrations of the PWS Herring Portal during various meetings, symposia and one-on-one working sessions with users. These user interactions provided a foundation for the development of the standard operating procedures and methodologies defined in this document.
1.3.3 Workshops A series of workshops were held by the EVOS Trustee Council staff to facilitate development of the Integrated Herring Research Program (IHRP). These workshops provided an ideal environment to assess specific user needs as they pertained to the scientific domain. The goals of these workshops focused on the integration of research efforts to support an ecosystem approach to monitoring of herring. At the core of this strategy lies the need to manage multi-disciplinary datasets in a common framework while providing pathways for data discovery and synthesis.
2.0 Information System Vision
Functional Requirements Document
2.0 INFORMATION SYSTEM VISION
2.0 Information System Vision
Standard Operating Procedure Page 2-1
2.0 INFORMATION SYSTEM VISION This section was developed from a synthesis of information gathered during user interviews, workshops, and meetings. It attempts to lay out a conceptual model to guide system implementation which effectively meets the needs voiced by the user community.
2.1 Consolidation of User Needs into Guiding Principles Information gathered from the initial user interviews was forged into a series of coherent principles. This process involved merging analogous user needs in addition to reconciling conflicts between user needs in opposition to one another. The combined list of reconciled and consolidated user needs was then distilled into a much smaller set of development directives. This process involved looking at individual user needs as clues to larger overall goals that the data management system needs to address. The development of succinct guiding principles will enable efficient system development in addition to providing a framework for assessment and the creation of performance metrics.
2.1.1 Provide Granular Queryable Access to Raw Data for User Groups Although summarized data products will be the desired output for most user groups (e.g. the general public and fisheries managers), other groups including the research and academic communities need access to raw data. While summarized data products provide an efficient high level view that allows easy ingestion of datasets by consumers with varying degrees of expertise, expert users need raw data for analysis, modeling, and custom visualizations. As with summarized data products, raw data should ideally be accessed through a universal query interface where users can select datasets, geospatial extent, temporal extent, and data output format.
2.1.2 Provide Standardized Metadata for Datasets While providing intuitive access to raw data and data summary products is important, these datasets are of limited value without the accompaniment of descriptive metadata records. Federal Geographic Data Committee (FGDC) compliant metadata records are required for all federally funded projects. Even when not required, the production of FGDC metadata are considered a best practice for all projects since this allows for a dataset to be included into data clearinghouses where it can be discovered and used by others. Other metadata formats also exist including the National Center for Environmental Analysis and Synthesis’ (NCEAS) Ecological Metadata Language (EML) and the emerging ISO 19115 metadata standard. Standardized metadata links data collected by specific agencies and investigators to the rest of the world; datasets without proper metadata are subject to misinterpretation by users, isolation from other associated datasets, exclusion from analyses and visualizations where they would have been applicable, and possible extinction when they cannot be identified or verified. Besides allowing for data discovery, metadata can also communicate detailed data collection methods, notes on data quality, and other important aspects that are not captured in the data itself.

2.0 Information System Vision
Standard Operating Procedure Page 2-2
2.1.3 Enable All Data to Be Spatially/Temporally Explicit at Multiple Scales Developing a data management framework which explicitly defines geometric objects (points, lines and polygons) and couples these objects with data will greatly assist all user groups in accessing, understanding, analyzing, and utilizing salmon data. Users will be able to view summarized regional aggregates or intuitively drill down into hierarchically nested spatial regimes to look at data at a granular level. In addition, spatially enabling data will provide transparent data access for user groups who are not familiar with the subjectively created spatial qualifiers (e.g. common name, management area, or stat area). Latitude and longitude are universally meaningful metrics for spatial description. Providing a geospatial context for information is a fundamental requirement for developing the ability to programmatically marshal data between computer systems via standardized interoperability protocols (Web Feature Service [WFS] and Web Map Service [WMS]).
2.1.4 Embrace Distributed Data Management Centralized data management approaches place the complete responsibility of ingesting, managing and serving data on a single organization with finite support staff, internet bandwidth, and available computational power. The centralized approach also consumes vital staff resources by requiring data providers to manually compile and transfer source data to staff who must then assimilate the information in a repetitive and time consuming process. Additionally, embracing a centralized approach ignores the large amount of effort and resources currently being invested by external agencies to serve up their own data.
In contrast, the herring portal embraces a distributed data management approach which allows data to seamlessly flow between participating agencies. The system will be composed of an internal master node coupled with external data provider nodes existing within the agencies producing and managing source data. This distributed configuration will increase capacity and technical knowledge within agencies, allowing them to better meet their own internal data management goals. The distributed architecture will also leverage hardware, bandwidth and staff resources across multiple systems and groups. Integrating available sources of interoperable data feeds into data access applications and data management systems will add a variety of data resources at little to no cost. Large quantities of real-time and historical sensor information, remote sensing satellite information, and marine habitat and biological data for the Alaska region are openly available for use through interoperability protocols. For example, NASA Earth Observations (NEO) provides an expansive array of long term oceanographic, climate, and atmospheric remote sensing datasets. Real-time and historical sensor data feeds for the Alaska region are available for hundreds of sensors via SNOTEL, the National Data Buoy Center (NDBC), the Center for Operational Oceanographic Products and Services (CO-OPS), and other NOAA programs. Additional sources of interoperable data include those hosted at NASA’s Jet Propulsion Laboratory (JPL), U.S. Geological Survey (USGS) TerraServer, and other research organizations.
2.1.5 Automate Data Management Practices
2.0 Information System Vision
Standard Operating Procedure Page 2-3
Automating aspects of the data ingestion and serving lifecycle will improve cost effectiveness, provide more immediate access to data for users, and free up staff time for the development of applications to address specific user needs. Data management frameworks which require unnecessary manual intervention during data ingestion and data access processes introduce issues of latency, human error, and consume staff time. Additionally, this model does not scale well and this factor will become increasingly important as larger amounts of data flow into and out of the system.
Developing web based tools which provide end-to-end automated data management solutions for data providers and users will provide a scalable solution that can meet the needs of the growing user base. Targeted tools which enable data providers to manage datasets and efficiently author metadata will greatly increase the contribution of information resources by the scientific community. Developing a small number of data serving web applications will consolidate access points to information, decrease the learning curve for users, and drastically reduce user interface complexity and maintenance issues.
2.1.6 Implement Systems which are Open Source and Standards Based The strategy detailed in this proposal builds upon mature open source technology, data standards, and data transport protocols that support data management in a distributed, open environment. The technical foundation of the PWS Herring Portal data management platform relies upon a suite of existing and mature open source software projects and informatics efforts that are actively supported by the open source community and used globally. Utilizing these open source products enables data managers to build upon a constantly maturing set of technologies by simply tapping into the efforts of a large body of programmers and developers who are committed to advancing these technologies. This strategy ensures that core components of the data management framework will advance in functionality with minimal effort of the project team. Utilizing free and open source technologies will also enable the system to scale in a cost effective manner by allowing additional hardware to be configured to support the growing user base without increases in software licensing costs. Finally, the use of open source technology prevents proprietary software restrictions from obstructing the development and use of data systems.
3.0 Implementation Architecture
Standard Operating Procedure
3.0 Implementation Architecture
4.0 Data Flow Diagrams
Standard Operating Procedure Page 3-1
3.0 IMPLEMENTATION ARCHITECTURE This section of the Standard Operating Procedure provides a high level architectural view of how various technology tiers should be structured to best manage data so that it can be most effectively utilized by the user base.
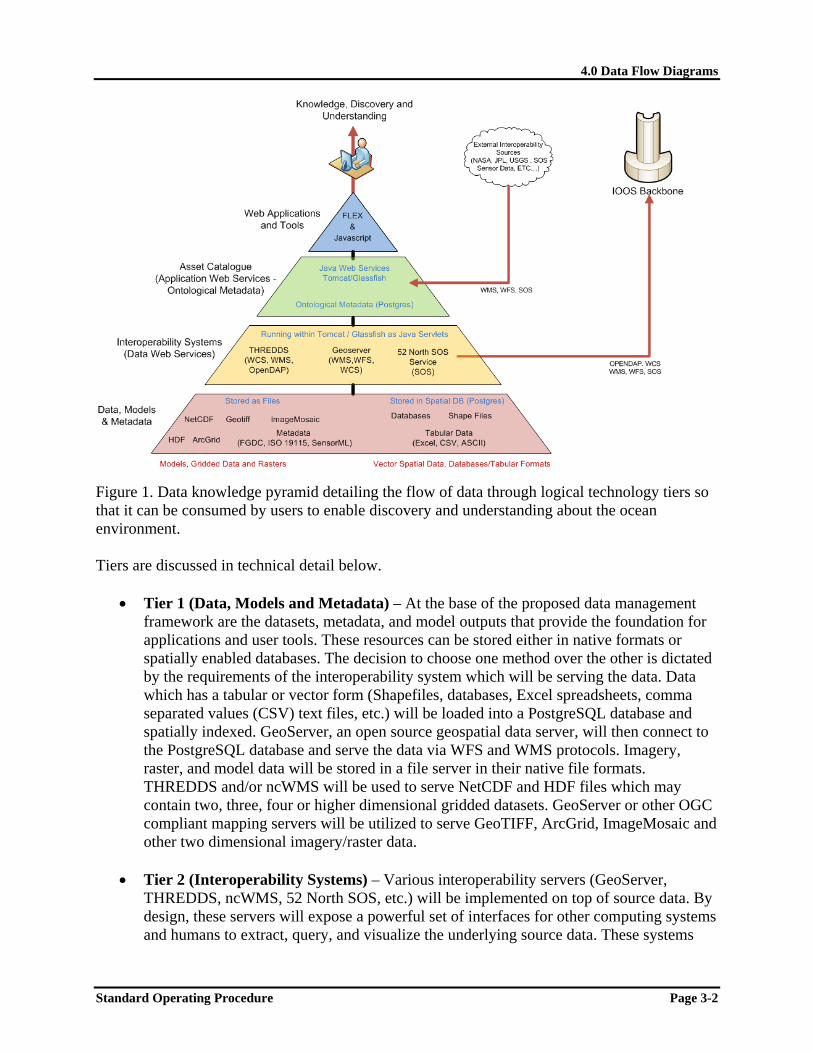
3.1 Data Knowledge Pyramid The overarching strategy for this effort involves implementing an end-to-end technological solution which allows data and information to be channeled and distilled into user-friendly products while simultaneously enabling the underlying data to be assimilated and used by the emerging external data assembly systems. The following diagram (Figure 1) details the four logical technical tiers of the approach. At the base (Tier 1) of the pyramid lie the source data produced by researchers, instruments, models, and remote sensing platforms which are stored as files or loaded within geospatial databases. Interoperability systems (Tier 2), such as Web Map Services (WMS) and Web Coverage Services (WCS), are then implemented and connected to these underlying data sources. The asset catalogue (Tier 3) connects to internal interoperability systems in addition to known external sources of interoperable data and populates a database describing the dimensional characteristics (space, time, measured parameter, and taxonomy) of each data resource. Also in this third tier are web services which provide access to the descriptive information contained in the asset catalogue database so that applications can more easily utilize data from multiple sources, formats, and types. The final technical level (Tier 4) is composed of the web based applications and tools which provide users access to data and products. Users sit at the top of the pyramid with all underlying systems working together to create a powerful and intuitive user experience. The intended result is the facilitation of rapid data discovery, improved data access, understanding, and the development of knowledge about the physical and biological marine environment.
4.0 Data Flow Diagrams
Standard Operating Procedure Page 3-2
Figure 1. Data knowledge pyramid detailing the flow of data through logical technology tiers so that it can be consumed by users to enable discovery and understanding about the ocean environment. Tiers are discussed in technical detail below.
• Tier 1 (Data, Models and Metadata) – At the base of the proposed data management framework are the datasets, metadata, and model outputs that provide the foundation for applications and user tools. These resources can be stored either in native formats or spatially enabled databases. The decision to choose one method over the other is dictated by the requirements of the interoperability system which will be serving the data. Data which has a tabular or vector form (Shapefiles, databases, Excel spreadsheets, comma separated values (CSV) text files, etc.) will be loaded into a PostgreSQL database and spatially indexed. GeoServer, an open source geospatial data server, will then connect to the PostgreSQL database and serve the data via WFS and WMS protocols. Imagery, raster, and model data will be stored in a file server in their native file formats. THREDDS and/or ncWMS will be used to serve NetCDF and HDF files which may contain two, three, four or higher dimensional gridded datasets. GeoServer or other OGC compliant mapping servers will be utilized to serve GeoTIFF, ArcGrid, ImageMosaic and other two dimensional imagery/raster data.
• Tier 2 (Interoperability Systems) – Various interoperability servers (GeoServer, THREDDS, ncWMS, 52 North SOS, etc.) will be implemented on top of source data. By design, these servers will expose a powerful set of interfaces for other computing systems and humans to extract, query, and visualize the underlying source data. These systems
4.0 Data Flow Diagrams
Standard Operating Procedure Page 3-3
will facilitate all aspects of data delivery to users in addition to providing the muscle for the machine-to-machine data transfer to national data assembly systems as required. Because these systems have been developed using the Java programming language, they will run within a servlet container such as Tomcat or Glassfish.
• Tier 3 (Asset Catalogue, Ontological Metadata and Services) – The asset catalogue
provides a description of known internal and external available data resources, access protocols for these resources (interoperability services, raw file download, etc.), and directives on how to ultimately utilize these data resources in applications. Because documentation and access methods vary widely between data sources, a system which catalogs data sources and reconciles these inconsistencies must be implemented if the data are to be used in an efficient manner. In addition to managing information about data availability and access methods, the asset catalogue will also contain an ontology that maps source data descriptions and metadata to a common set of internally stored terms with strict definitions. This mapping will allow users to easily locate related sets of information without having explicit knowledge of the internal naming conventions of each data-providing agency. The development of an internal ontology will also enable future endeavors to connect the asset catalogue to global ontologies in the semantic web. The following dimensions are to be stored in the database for mapping the heterogeneous characteristics of source data to common metrics:
• Source – Service URLs and methods of interaction for these services. • Data formats and return types – Data format returned by the service and how
data can be equated between various formats. • Space (x, y, z) – Spatial dimensions of dataset (1D, 2D, 3D). Upper and lower
spatial bounds (bounding box or cube) stored in common projection (EPSG 4326).
• Time (t) – For data resources with a time component: document time span, whether time corresponds to a single moment or if it is representative of a time period. If data is in discrete periods, document individual available periods.
• Taxonomy – Taxonomic data mapped to International Taxonomic Information System (ITIS) codes.
• Parameter – Parameter(s) and units in the data resource and how they map to internally defined universal terms. For example: Datasets SST, AVHRR, and Sea_Surface all contain parameters that map to internal universal term Sea Surface Temperature.
Web services written in the Java programming language will be developed to connect to the asset catalogue and provide applications with access to the underlying descriptions of all known data sources. Because the asset catalogue contains a structured ontological definition of data sources and maps all known data sources to a common definition, applications can be developed which connect users to vast arrays of data through simple but powerful interfaces. The following is a list of example functionality that is possible utilizing this methodology:
4.0 Data Flow Diagrams
Standard Operating Procedure Page 3-4
• Users can load multiple data layers (potentially existing in different physical
locations and being served by different systems) onto a single web based map. Users can also filter all layers simultaneously by time or request spatial and temporal subsamples of data that can be pulled from multiple sources and automatically packaged into a single download.
• All real time sensor feeds can be accessed and visualized on a single uniform user interface by parameter even though the sources of the sensor feeds may exist in a wide array of formats and service protocols.
• Users can query the asset catalogue to discover which data is available for an area, time period, parameter, and species.
• Tier 4 (User Applications) – Users interface with web based applications that bring
together combinations of underlying data and allow users to make discoveries, improve understanding, and develop knowledge through visualization and data access. These types of applications would most likely be interactive map based data portals. Applications will also be developed which provide specific targeted functionality. These focused applications could include marine spatial planning tools, emergency response applications, and educational/outreach portals. All developed tools are designed to meet user needs and thus require user input into their initial design and periodic feedback to direct functional improvements for future design iterations.
4.0 Data Flow Diagrams
Standard Operating Procedure
4.0 Data Flow Diagrams
4.0 Data Flow Diagrams
Standard Operating Procedure Page 4-1
4.0 DATA FLOW DIAGRAMS The following portion of the Standard Operating Procedure documents the steps required to prepare and load data into PWS Herring Data Management System and also provides insight into how the information moves through various system level processes to ultimately meet the needs of the user base. This section relies upon the use of data flow diagrams (DFDs). These diagrams detail the flow of information in and out of data sources, data processing steps and interaction with external entities. These relationships have been documented via the Yourdon/DeMarko data flow diagram notation.
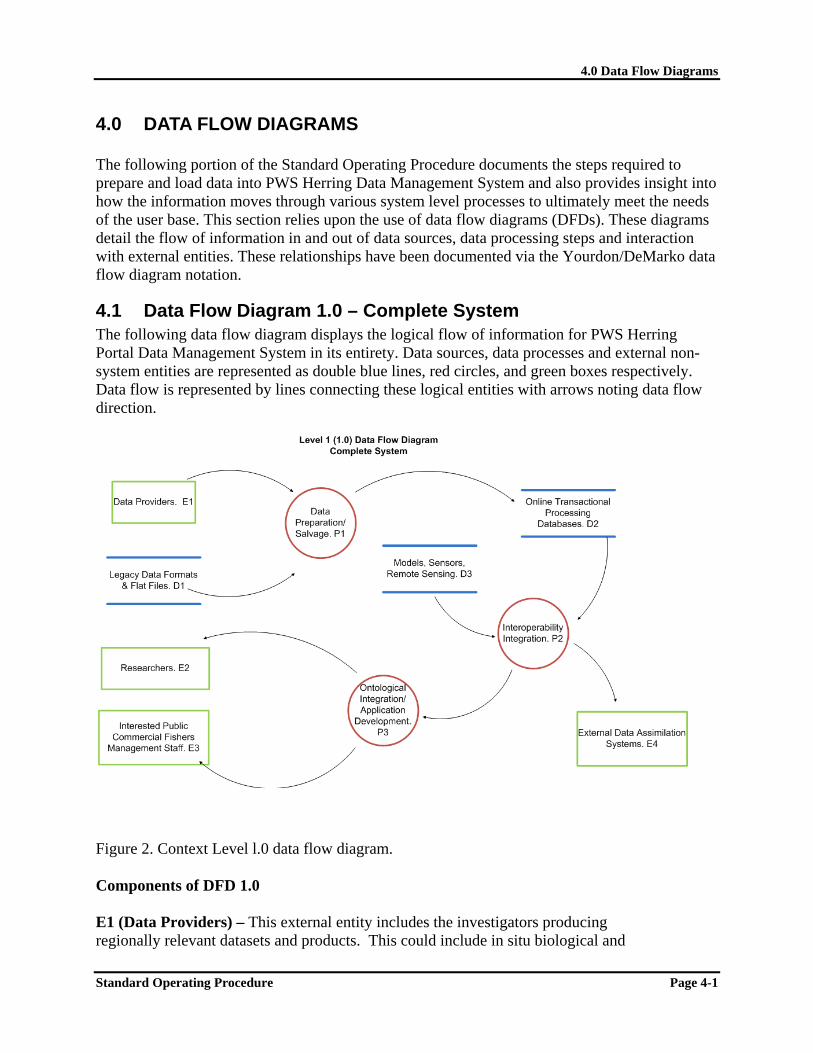
4.1 Data Flow Diagram 1.0 – Complete System The following data flow diagram displays the logical flow of information for PWS Herring Portal Data Management System in its entirety. Data sources, data processes and external non-system entities are represented as double blue lines, red circles, and green boxes respectively. Data flow is represented by lines connecting these logical entities with arrows noting data flow direction.
Figure 2. Context Level l.0 data flow diagram. Components of DFD 1.0 E1 (Data Providers) – This external entity includes the investigators producing regionally relevant datasets and products. This could include in situ biological and

4.0 Data Flow Diagrams
Standard Operating Procedure Page 4-2
physical observational data in addition to synthesized datasets. E2 (Researchers) – Researchers who will be accessing, visualizing and browsing data and other information through the application interfaces (P3) and accessing data and map/geographic information system (GIS) based products through the interoperability systems (P2). E3 (Interested Public, Resource Managers, Commercial Fisherman) – All users accessing data and reports outside core research group have been grouped into this external entity. These users will be accessing the same interfaces as the research group but may have less granular access or summarized compilations of certain resources based on specific needs. Additionally, data may be packaged in different ways for these user groups. E4 (External Data Assimilation Systems) – A core component of interoperability architecture is the enablement of data and metadata to be marshaled between machines. This external entity represents those national data assimilation centers which would be participating in these types of machine to machine data transactions. D1 (Legacy Storage Formats) – A large quantity of historical ecosystem data are stored in poorly enabled legacy formats. These data sources will need to process into modern formats, documented, and loaded into the data management system. D2 (OLTP Databases) – In order to enable in situ style datasets to be visualized, analyzed, and staged for interoperability transactions these resources must be loaded into a spatially explicit enterprise relational database management system. D3 (Models, Sensors and Remote Sensing) – There exist a large number of highly valuable resources describing physical and biological parameters which are collected by remote sensing systems/sensors in addition to being extrapolated and forecasted by numerical models. These data are not being produced by in situ researchers but by mechanical platforms and high performance compute clusters. Tying these resources into the overall data management system will be critical for filling data gaps and providing long term time series. Numerical models can also elucidate various ecosystem level connections between biological and physical processes which may be difficult to comprehend by simply looking at sparse observational data. P1 (Data Preparation/Salvage) – Ideally, data being produced from projects is being staged during the entire project lifecycle for inclusion into the data management system. This will involve the development of data management plans and drafting of metadata to document methods and data structures. Historical data prioritized for inclusion into the data management system which are stored in legacy data archive systems (static databases, spreadsheets, text files, and other legacy
4.0 Data Flow Diagrams
Standard Operating Procedure Page 4-3
formats) will need to be processed into modern formats and potentially manually salvaged through custom loading processes and data entry. These historical resources will also need to be documented using standardized metadata. P2 (Interoperability Integration) – Staging and plugging data into interoperability frameworks is critical for data visualization, access, and making the data openly available for use by the broader community. These systems provide a series of standard interfaces for query and data extraction which will enable user tools to be developed rapidly. Interoperability frameworks also enable the data to be seamlessly interchanged with other external data assimilation and analysis systems. P3 (Ontological Integration/Application Development) – Once data has been staged and exposed through interoperability frameworks, the underlying dimensional characteristics of the information must be mapped to each other so that parameter, spatial/temporal, and taxonomic components can be equated with each other across disciplines and types. Developing and populating an ontological database which equates these traits across data types and maps these qualities to common definitions is the most effective way to integrate highly heterogeneous multidisciplinary datasets. Once the ontological scheme is established and populated, applications can be developed which provide users with effective pathways for discovery and access. Equating disparate datasets through an ontological structure also poises the data for rapid synthesis.

4.0 Data Flow Diagrams
Standard Operating Procedure Page 4-4
4.2 Data Flow Diagram 1.1 – Data Preparation & Salvage
Figure 3. Level l.1 data flow diagram for data preparation & salvage. Components of DFD 1.1 D1.1 (Active Project Level Data) – This resource includes data that is being produced by active projects collecting data for the integrated ecosystem research effort. D1.2 (Historical Datasets) – These data are archived at agencies, stored on PIs’ computers, and often use antiquated formats which will require significant
4.0 Data Flow Diagrams
Standard Operating Procedure Page 4-5
reformatting and processing to integrate into the data management system. D1.3 (Online Analytical Processing Database) – Data from all projects will eventually be stored in their native formats or loaded into OLTP databases which are spatially enabled. P1.1 (Data Management Plan) – Data managers will work with investigators to document the types of data which will be collected during sampling efforts in addition to document Standard Operating Procedures (SOPs) for data collection to create metadata templates in addition to gauging general data management needs of PIs. This assessment is critical to identify the data management needs and the types of tools needed by researchers to increase their abilities to manage their data in an automated, standard fashion. The assessment will also isolate reporting requirements and specific data transfer needs. Based on the assessment results investigators will develop a data management plan for each logical data collection effort. This plan will address metadata creation and data delivery for investigators. P1.2 (Data Salvage and Staging) – This task will involve isolating and standardizing historical datasets deemed necessary for retrospective analysis by synthesis efforts. Data will need to be processed into modern electronic formats. P1.3 (Spatial Enablement and Flattening) – Data with geospatial components will be enabled to store these features in Open Geospatial Consortium Simple Feature Specification standards. Additionally, datasets which are composed of relational database tables will be flattened if possible to simplify the process of absorption and serving of the data through interoperability protocols. P1.4 (Metadata Generation) – Ample documentation of datasets is critical for discovery, correct usage, interpretation, and accreditation. Employing standards such as the Federal Geospatial Data Committee (FGDC), Ecological Metadata language (EML) or the emerging ISO 19115 standards will provide this critical information. Drafting metadata is much more arduous after the fact than it is during project implementation. For this reason, metadata generation should be integrated into the project lifecycle when possible. For documentation of historical datasets this is much more difficult due to quality of contextual information degrading over time.

4.0 Data Flow Diagrams
Standard Operating Procedure Page 4-6
4.3 Data Flow Diagram 1.2 – Interoperability Integration
Figure 4. Level l.2 data flow diagram interoperability integration. Components of DFD 1.2 E2.1 (GIS Client Software) – GIS client software systems will connect to the WFS (P3.2) over the network or internet and pull data for use. Example GIS software systems which can access the WFS include ESRI Arcview, Manifold, QGIS, and many others that are Open Geospatial Consortium (OGC) compliant. E2.2 (Data Assimilation Centers) – This entity represents external data assimilation centers such as the National Ocean Data Center (NODC) and the Integrated Ocean Observing System. These external entities serve as national data assembly centers and archive silos. Proving service endpoints through interoperability protocols allows these systems to seamlessly and automatically access data stored in the data management system.
4.0 Data Flow Diagrams
Standard Operating Procedure Page 4-7
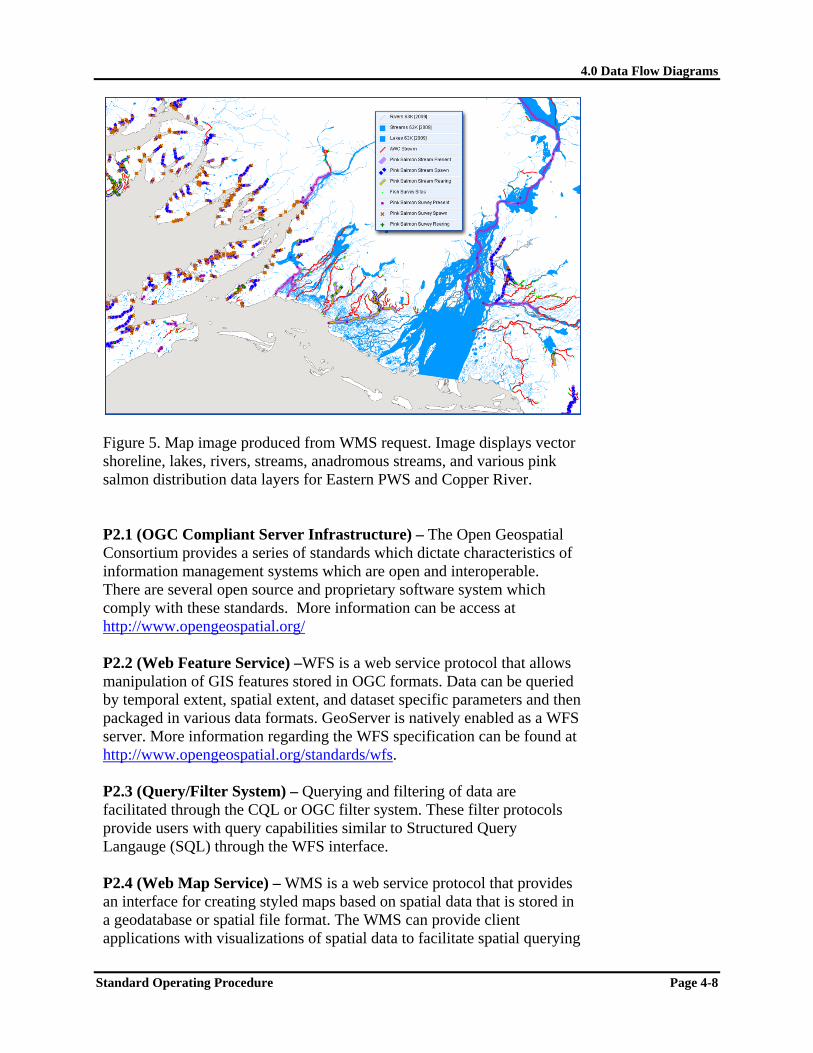
D2.1 (Spatially Enabled Vector Data) – These data consist of points, lines, and polygons which describe spatial characteristics of data in vector terms. These data can be encapsulated in text files, ESRI shapefiles, or other spatially explicit formats. D2.2 (Raster GIS Data) – Raster data is composed of spatial two dimensional grids which describe parameter values associated with a generalized orthogonal structure which conforms to a specific map projection. D2.3 (Multi Dimensional Models and Coverages) – Many times data is packaged into higher dimensional formats which describe three or higher dimensional orthogonal and curvilinear grids in multiple projections. These are most often packaged in netCDF or HDF formats. Data resources which are packaged in this way include numerical model outputs and satellite remote sensing datasets. D2.4 (Sensor Feeds) – Sensor output streams are structured in a wide array of formats and require custom processing to homogenize parameters, units, periodicity, and other sensor feed specific information. D2.5 (Data Output) – The WFS (P2.2) architecture allows for the export of data into large numbers of standard spatial formats (ESRI shapefiles, GeoJSON, Geographic Markup Language, Well Known Text, etc.). Data can also be exported in any standard map projection depending upon the needs of the user or service requesting the data. Querying and filtering of data are facilitated through the Common Query Language (CQL) or OGC filter system (P3.3). D2.6 (Styled Maps) – The WMS returns styled maps as image files per web service vendor requests. The maps can be produced in a large number of image types (e.g. .jpg, .png, .gif). The following figure shows an image that was produced from a WMS request.
4.0 Data Flow Diagrams
Standard Operating Procedure Page 4-8
Figure 5. Map image produced from WMS request. Image displays vector shoreline, lakes, rivers, streams, anadromous streams, and various pink salmon distribution data layers for Eastern PWS and Copper River. P2.1 (OGC Compliant Server Infrastructure) – The Open Geospatial Consortium provides a series of standards which dictate characteristics of information management systems which are open and interoperable. There are several open source and proprietary software system which comply with these standards. More information can be access at http://www.opengeospatial.org/ P2.2 (Web Feature Service) –WFS is a web service protocol that allows manipulation of GIS features stored in OGC formats. Data can be queried by temporal extent, spatial extent, and dataset specific parameters and then packaged in various data formats. GeoServer is natively enabled as a WFS server. More information regarding the WFS specification can be found at http://www.opengeospatial.org/standards/wfs. P2.3 (Query/Filter System) – Querying and filtering of data are facilitated through the CQL or OGC filter system. These filter protocols provide users with query capabilities similar to Structured Query Langauge (SQL) through the WFS interface. P2.4 (Web Map Service) – WMS is a web service protocol that provides an interface for creating styled maps based on spatial data that is stored in a geodatabase or spatial file format. The WMS can provide client applications with visualizations of spatial data to facilitate spatial querying
4.0 Data Flow Diagrams
Standard Operating Procedure Page 4-9
and aggregation in reporting. GeoServer is natively enabled as a WMS server. More information regarding the WMS specification can be found at http://www.opengeospatial.org/standards/wms. P5.5 (Sensor Observation Service) – This web service provides a mechanism to query and extract sensor feed information out of an OGC compliant data management system. More information regarding this protocol can be accessed at http://www.opengeospatial.org/standards/sos. P3.6 (Web Coverage Service) – This web service provides endpoints for the marshalling of multidimensional coverage based datasets like models and remote satellite observations. The protocol allows these datasets to be aggregated and sub sampled based upon dimensional slices. More information concerning this protocol can be accessed here http://www.opengeospatial.org/standards/wcs.