ASAP FEIS: Chapter 5.13: Cultural Resources - ARLIS
695
US Army Corps of Engineers Alaska District Final Environmental Impact Statement AI.aska Stand Alone Gas PipeUne October 2012 Volume 2 Sections 5.13 through 6.0
-
Upload
khangminh22 -
Category
Documents
-
view
0 -
download
0
Transcript of ASAP FEIS: Chapter 5.13: Cultural Resources - ARLIS
US Army Corpsof EngineersAlaska District
Final Environmental Impact Statement
AI.aska Stand AloneGas PipeUne
October 2012
Volume 2Sections 5.13 through 6.0
~~
United States Army Corps of EngineersAlaska District
Final Environmental Impact Statement
Alaska Stand Alone Gas PipelineOctober 2012
In cooperation with:
Alaska Department of Natural Resources, State Pipeline Coordinator's Office (ADNR, SPCO)
U.S. Coast Guard (USGS)
U.S. Department of the Interior, Bureau of Land Management (BLM)
U.S. Department of the Interior, National Park Service (NPS)
U.S. Department of Transportation, Pipeline and Hazardous Materials Safety Administration (USDOT, PHMSA)
U.S. Environmental Protection Agency (EPA)
Volume 2Sections 5,13 through 6.0
Photo credits (cover): Michael Baker Corp. (top left and middle); Ryan Hagerty (top right): and Carl Johnson (bollom).

Alaska Stand Alone Gas Pipeline
5.13 CULTURAL RESOURCES
Final EIS
Alaska Stand Alone Gas Pipeline 5.13-1 Final EIS
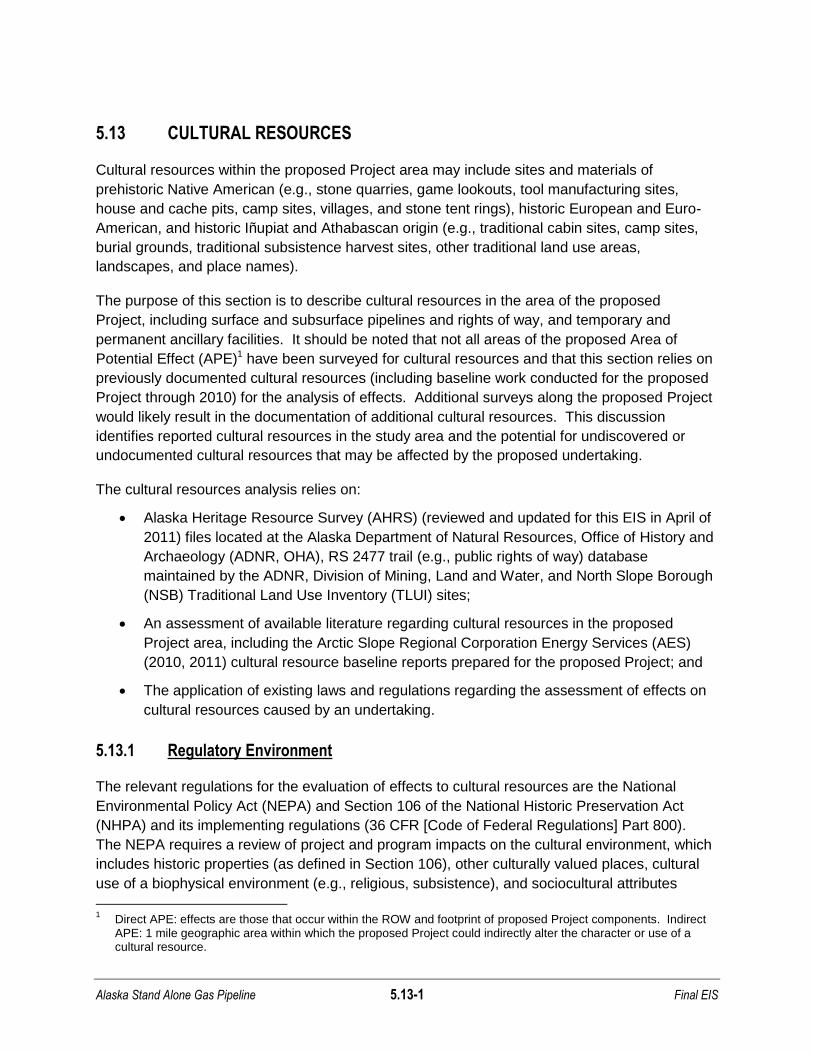
5.13 CULTURAL RESOURCES
Cultural resources within the proposed Project area may include sites and materials of
prehistoric Native American (e.g., stone quarries, game lookouts, tool manufacturing sites,
house and cache pits, camp sites, villages, and stone tent rings), historic European and Euro-
American, and historic Iñupiat and Athabascan origin (e.g., traditional cabin sites, camp sites,
burial grounds, traditional subsistence harvest sites, other traditional land use areas,
landscapes, and place names).
The purpose of this section is to describe cultural resources in the area of the proposed
Project, including surface and subsurface pipelines and rights of way, and temporary and
permanent ancillary facilities. It should be noted that not all areas of the proposed Area of
Potential Effect (APE)1 have been surveyed for cultural resources and that this section relies on
previously documented cultural resources (including baseline work conducted for the proposed
Project through 2010) for the analysis of effects. Additional surveys along the proposed Project
would likely result in the documentation of additional cultural resources. This discussion
identifies reported cultural resources in the study area and the potential for undiscovered or
undocumented cultural resources that may be affected by the proposed undertaking.
The cultural resources analysis relies on:
Alaska Heritage Resource Survey (AHRS) (reviewed and updated for this EIS in April of
2011) files located at the Alaska Department of Natural Resources, Office of History and
Archaeology (ADNR, OHA), RS 2477 trail (e.g., public rights of way) database
maintained by the ADNR, Division of Mining, Land and Water, and North Slope Borough
(NSB) Traditional Land Use Inventory (TLUI) sites;
An assessment of available literature regarding cultural resources in the proposed
Project area, including the Arctic Slope Regional Corporation Energy Services (AES)
(2010, 2011) cultural resource baseline reports prepared for the proposed Project; and
The application of existing laws and regulations regarding the assessment of effects on
cultural resources caused by an undertaking.
5.13.1 Regulatory Environment
The relevant regulations for the evaluation of effects to cultural resources are the National
Environmental Policy Act (NEPA) and Section 106 of the National Historic Preservation Act
(NHPA) and its implementing regulations (36 CFR [Code of Federal Regulations] Part 800).
The NEPA requires a review of project and program impacts on the cultural environment, which
includes historic properties (as defined in Section 106), other culturally valued places, cultural
use of a biophysical environment (e.g., religious, subsistence), and sociocultural attributes
1
Direct APE: effects are those that occur within the ROW and footprint of proposed Project components. Indirect APE: 1 mile geographic area within which the proposed Project could indirectly alter the character or use of a cultural resource.
Alaska Stand Alone Gas Pipeline 5.13-2 Final EIS
(e.g., social cohesion, social institutions, lifeways, religious practices, and/or other cultural
institutions) (National Preservation Institute 2011).
The NHPA requires federal agencies to consider the effects of their undertakings on historic
properties (i.e., cultural resources that are eligible for the National Register of Historic Places
[NRHP]) and to provide a reasonable opportunity for interested parties to comment on such
undertakings. Section 106 applies when a project has been determined to be an undertaking,
which is defined as a project, activity, or program funded in whole or part under the direct or
indirect jurisdiction of a federal agency, including those carried out by or on the behalf of a
federal agency; those carried out with federal financial assistance; those requiring a federal
permit, license, or approval; and those subject to state or local regulation administered pursuant
to a delegation or approval by a federal agency (36 CFR 800.16[y]). If the undertaking will have
an adverse effect on historic properties, the agency must continue to consult with interested
parties to resolve the adverse effects. Federal agencies follow the Section 106 process in
reviewing project activities and prescribing appropriate actions to meet the requirements for
compliance.
The NHPA defines historic properties as prehistoric and historic districts, sites, buildings,
structures, and objects listed on or eligible for inclusion on the NRHP including artifacts,
records, and material remains related to the property (NHPA, 16 USC [United States Code]
470w, Sec. 301.5). Consideration is given to both the criteria of significance and integrity of the
property’s historic qualities. The NRHP was created with the passage of the NHPA of 1966
(16 USC 470 Sec. 101). For a historic property (e.g., districts, sites, buildings, structures and
objects) to be eligible for the NRHP, it must be significant (i.e., meet one or more of the NRHP
criteria) and possess integrity of location, design, setting, materials, workmanship, feeling and/or
association (36 CFR 60.4). For the proposed Project of the cultural resources analysis, all
cultural resources are assumed to be eligible for the NRHP unless stated otherwise. Congress
passed the Act to preserve and protect the nation’s historic properties in response to the
country’s rapid expansion and development, and the effects to the historic and cultural
landscape of federal projects including the Interstate Highways and Urban Renewal programs.
Other relevant legislation that applies to cultural resources includes the Antiquities Act of
1906,16 U.S.C. § 431; the Archaeological Resources Protection Act of 1979, 16 U.S.C. § 470;
the National Trails System Act, 16 U.S.C. § 1241; the American Indian Religious Freedom Act
of 1978, 42 U.S.C. § 1996; Section 4(f) of the U.S. Department of Transportation Act of 1966,
49 U.S.C. § 303; the Archaeological and Historic Preservation Act of 1974 (―Moss-Bennett‖ Act),
16 U.S.C. § 469; Executive Order (E.O.) 11593: Protection and Enhancement of the Cultural
Environmen; E.O. 13007: Indian Sacred Sites; E.O. 13287: Preserve America, 61 Federal
Register 25131(May 17, 1996); and the Native American Graves Protection and Repatriation
Act, 25 U.S.C. §§ 3001- 3013.
The Section 106 process involves the development of the APE, as well as a Programmatic
Agreement (PA) between the State Historic Preservation Office (SHPO) and the Lead Agency
(USACE for this proposed Project) and the cooperating agencies that have chosen to participate
(at this time the BLM is the only additional agency that has asked to be a party to the PA; other
Alaska Stand Alone Gas Pipeline 5.13-3 Final EIS
agencies will utilize the completed work for their purposes). The PA will lay out a phased
completion process for continued surveying and identifying of previously unknown cultural
resources, as well as the processes for monitoring and potential discovery of previously
unidentified cultural resources, including human remains, during construction, and the process
for mitigating potential adverse effects which have not yet been identified. It will also include
collection and curation policies, construction monitoring, monitoring for looting activities, etc.
5.13.2 Affected Environment
The study area includes the proposed Project ROW, with 730 miles of buried and 6 miles of
aboveground pipe, access roads, and a suite of temporary and permanent facilities. Permanent
facilities would include a gas conditioning facility (GCF) at Prudhoe Bay, a maximum of
2 compressor facilities, a straddle and off-take facility to provide utility grade natural gas for the
Fairbanks Lateral, 37 mainline valves (MLVs) and 5 pig launcher/receiver stations, 3 metering
stations, and the Cook Inlet Natural Gas Liquids Extraction Plant (NGLEP) Facility and pipeline
terminus. Temporary facilities would include construction support facilities such as proposed
Project offices, construction camps, laydown and work pad areas, pipe storage areas, fuel
storage areas, and access roads.
The proposed Project would cross 3 ecological regions of the state: the North Slope
(approximately MP 0 to 174), the Interior (approximately MP 174.1 to 580), and Southcentral
(approximately MP 580.1 to 737). These 3 regions include 2 major cultural groups, the Iñupiat
and the Athabascans, divided by the Brooks Range, which separates the North Slope from the
interior of Alaska. Athabascan language speaking peoples along the route include the Koyukon,
Tanana, Ahtna, and Dena’ina. The Koyukon and Tanana speaking peoples live in the Interior,
from the Brooks Range to the Alaska Range, and the Ahtna and Dena’ina live south of the
Alaska Range in the Matanuska, Susitna, and Copper River valleys.
5.13.2.1 North Slope Region
Overview of Regional Prehistory (12,000 years ago to 1815 A.D.)
Paleoindian / Paleo-Arctic
The early prehistory of the North Slope area has been documented at numerous sites in
northern Alaska. The oldest sites found date from the end of the Pleistocene era, perhaps
12,000 years ago, to the early Holocene some 10,000 years ago. These sites are attributed to
bearers of the Paleoindian and Paleo-Arctic tool traditions (Table 5.13-1). The Paleoindian
tradition is thought to be the tool technology of the earliest migrants into the North American
Arctic, whose bifacial stone tool (i.e., with flaking on two sides of a flat core or preform)
technology is considered by archaeologists to be specific to procuring large mammals such as
bison, musk oxen, and caribou. Paleoindian sites on the North Slope include the Bedwell site
(PSM-00027) (Reanier 1996, Bever 2006), the Mesa Site (KIR-00102) (Kunz and
Reanier 1996), and the Hilltop Site (PSM-00017) (Reanier 1995). These sites contain data on
Old World to New World cultural diversification and human occupation of eastern Beringia at the

Alaska Stand Alone Gas Pipeline 5.13-4 Final EIS
end of the last glacial episode. They represent the most ancient known locale of human
occupation on Alaska’s North Slope.
TABLE 5.13-1 Sequence of North Slope Archaeological Cultures
Tradition Date Finds Representative Sites
Historic Iñupiat AD 1826 –
present
Stone, metal, trade goods, organic artifacts, plus historic, ethnographic and informant accounts
Bullen Point, Point Hopson, Natvavak
Late Prehistoric (Birnirk, Thule)
2,000 BP–-AD 1826
Lithic, wood, leather, bone artifacts, house ruins
Pingok Island, Thetis Island, Niglik, Birnirk, Walakpa, Point Hope, Cape Krusenstern, Nunagiak, Utqiaġvik, Nuwuk
Arctic Small Tool (Denbigh, Choris, Norton, Ipiutak)
4,500–1,200 BP
Diminutive lithic microtools, cores, burins, blades
Putuligayuk River, Central Creek Pingo, Onion Portage, Mosquito Lake, Choris, Walakpa, Iyatayet, Point Hope, Coffin, Jack’s Last Pingo, HAR-047, TES-008, TES-009, TES-012
Northern Archaic 6,000–
3,000 BP Side-notched points, microblades, bone tools
Putuligayuk River, Kuparuk Pingo, Kurupa Lake, Tuktu
Paleo-Arctic 10,000–7,000 BP
Cores and blades, microcores, microtools, bifaces
Putuligayuk River, Jones Pingo, Gallagher Flint Station, Lisburne, Tunalik
Paleoindian 12,000–9,800 BP
Extinct fauna, large lanceolate points, bifaces
Mesa, Bedwell, Putu, Hilltop
BP – Before Present (i.e., years ago). Sources: Table 2 from Lobdell and Lobdell 2000: Table 1 from Reanier 2002: ADNR, OHA 2011; Stephen R. Braund & Associates 2011.
The Old World affiliated Paleo-Arctic tradition continued through the Holocene, while no
Paleoindian sites have been found on the North Slope that date later than 9,800 years ago. The
Paleo-Arctic tradition is generally defined as a stone tool industry that utilized a core and blade
technology that produced unifacial tools such as burins, scrapers, and drills on blades.
Evidence of the Paleo-Arctic Tradition is found at sites across the North Slope, including
Gallagher Flint Station near Galbraith Lake (PSM-00050)(Dixon 1975)(Ferguson 1997) and the
Lisburne Site, 5 miles north of the Mesa Site in the Iteriak Creek valley (KIR-00096)
(Bowers 1982, 1999). Although it is difficult to determine an end date for this cultural tradition, it
is believed to have occurred sometime after 8,000 years ago (Anderson 1970). The
Paleoindian and Paleo-Arctic sites discussed above contain cultural remains that could
contribute to research questions associated with the ways in which humans adapted to
environments of the high latitudes in North America and the arrival of humans in the region at
the Pleistocene-Holocene boundary.
Northern Archaic
The transitional Ice-Age cultures were followed by a group referred to generically by
archaeologists as Northern Archaic peoples (Table 5.13-1) (Anderson 1968). Peoples using
Northern Archaic technology, usually distinguished by corner notched arrow type points,
inhabited the North Slope from sometime after 8,000 years ago to as recently as 2,000 –
3,000 years ago. Most Northern Archaic artifacts found throughout the Arctic Foothills and the
Brooks Range are surface finds (Lobdell and Lobdell 2000). More recently, researchers have
found better stratified sites and acquired more information about the environment and climate of
the time, leading to some reassessment of the period (Esdale and Rasic 2008).

Alaska Stand Alone Gas Pipeline 5.13-5 Final EIS
Northern Archaic sites in the vicinity of the proposed Project area include the Putuligayuk River
Delta Overlook site at Prudhoe Bay (XBP-00007), the Kuparuk Pingo site (XBP-00033), the
Kurupa Lake archaeological district in the foothills of the Brooks Range (e.g., KIR-00124), and
the Tuktu site north of Anaktuvuk Pass (XCL-00003) (Lobdell 1985, 1986, 1995; Lobdell and
Lobdell 2000; Reanier 2002; Schoenberg 1995). The location of the Kuparuk Pingo site
adjacent to the north Alaska coast indicates that Northern Archaic people used coastal or ice
edge resources in addition to the terrestrial fauna long believed to be the primary focus of
Northern Archaic subsistence (Lobdell 1995).
Arctic Small Tool Tradition
Earliest documentation of the Arctic Small Tool tradition (ASTt) in Alaska is from approximately
4,800 years ago at Cape Denbigh (NOB-00002) and Kuzitrin Lake (BEN-00107) in the central
Seward Peninsula (Table 5.13-1) (Harritt 1994). The ASTt is generally believed to be the
earliest archaeological tradition associated with modern Iñupiat people (Reanier 2002). While
the ASTt people were not among the first residents of the North Slope, their more varied and
sophisticated technology allowed them to more fully exploit the resources of the region than
their predecessors. ASTt-bearing populations expanded into Canada, Siberia, and Greenland,
and there is an unbroken record of their use of the North Slope since their first appearance in
the archaeological record (Reanier 1997, Sheehan 1997). ASTt components are characterized
by a chipped stone industry of small, well-made bifacial projectile points, ground stone
implements, a variety of carefully crafted and decorated bone, ivory, and antler tools and items
of personal adornment, and a proliferation of composite tools (Irving 1964, Dumond 1987). The
succession of the ASTt phases began with the Denbigh Flint Complex, followed by the Choris,
Norton, and Ipiutak cultures (Irving 1964, Giddings 1964, Dumond 1987). These early ASTt
people may have spent as much or more time living in and exploiting the subsistence resources
of the foothills and mountains of the Brooks Range as they did the coast.
Late Holocene Cultures
Beginning approximately 2,000 years ago, ancestral forms of the historic Iñupiat culture
emerged and became the cultural forms encountered by European and Euro-American
explorers in the nineteenth century (Table 5.13-1).
The Birnirk phase, a direct ancestor of the historic Thule culture, appeared in the Bering Strait
by 1,600 years ago. From the Birnirk period onward, the cultural continuity of arctic peoples into
the twenty-first century is well established. Birnirk peoples lived in semi-subterranean winter
houses and engaged in the harvest of marine and land mammals, birds, and fish. The Birnirk
type-site (BAR-00001) is located near Barrow at the base of the Barrow spit (Piġniq). Birnirk-
style artifacts have been found from northeastern Siberia to northwestern Canada, indicating a
large trade network reminiscent of the extensive Iñupiat trade network in place at historic
contact.
Thule is the immediate prehistoric ancestor of the various historic Iñupiat groups.
Approximately 1,000 years ago, a favorable climate coupled with technological innovations such
as the umiaq (a large skin boat), the qataq (cold trap door for winter houses), and the uniat
Alaska Stand Alone Gas Pipeline 5.13-6 Final EIS
(sled) resulted in the rapid expansion of Thule populations from the Bering Strait along the
shores of the Beaufort Sea to Greenland, and southeast around the shores of the Bering Sea
ultimately to Kodiak Island and Prince William Sound (Fitzhugh 2003). Thule persisted in the
North American Arctic to historic contact, between 1800 and 1850 (Collins 1964, Giddings and
Anderson 1986). Thule people hunted sea mammals, including seals and whales, fished, and
hunted terrestrial game such as caribou. Salmon were also an important subsistence resource
in some areas with Thule associations. Thule sites include Nuwuk (BAR-00011), Utqiaġvik
(BAR-00002), Thetis Island (HAR-00001, destroyed), Pingok Island (XBP-00012), and Niglik
(HAR-00169; also Neglik, Nigliq).
At the same time as Thule on the coast, related but less numerous populations continued to
exploit the resources of the interior, primarily subsisting on caribou and other large terrestrial
mammals, and overwintering on the margins of lakes that contained plentiful fish resources
(Gerlach and Hall 1988). These people may have been the antecedents of the modern
Nunamiut or Inland Eskimo; Athabascans from the Interior, or may reflect part of an extensive
cyclical land use pattern (Peter Raboff 2001).
Overview of Regional History
Some of the earliest recorded observations of northern Alaska and its inhabitants occurred in
the Arctic region in the early to mid-nineteenth century when contact between Euro-American
explorers, as well as the arctic whaling fleet, and Alaskan Natives first occurred. The following
years of continuous contact between commercial whalers and North Slope Iñupiat altered the
traditional culture (e.g., populations, subsistence practices, and settlement patterns)
(Bockstoce 1978, 1995). The following descriptions outline the history in the region.
European/Euro-American Expansion, Exploration, and Ethnographic Research
The exploratory period on the North Slope began in 1826 with the second of three Franklin
expeditions. Sir John Franklin and his crew descended the Mackenzie River, overwintered at
Fort Franklin, and sailed westward from the delta to the Return Islands, just west of Prudhoe
Bay. That same year, Beechey’s expedition sailed north from the Bering Strait to Point Barrow.
Franklin, as well as other early explorers, noted that the presence of European trade goods
(such as tobacco, iron, and copper) preceded their arrival among the Iñupiat on the North Slope.
Between 1847 and 1854, contact between Europeans, Americans, and the Iñupiat increased
because of the influx of whalers to the region. Exploration of the region further increased as
ships searched for the third Franklin expedition, launched in 1845 in the ships Erebus and
Terror. During the commercial whaling period, items such as metal tools and firearms became
increasingly important as part of Iñupiat material culture. By the 1850s, guns were in use by
local Iñupiat people, and by the 1880s, Iñupiat whalers were using the darting guns and bombs
used by commercial whalers. During the last quarter of the nineteenth century, smallpox and
influenza outbreaks caused a severe population decline among the North Slope Iñupiat, and
declines in caribou populations resulted in famine that forced inland Iñupiat to leave their homes
and relocate to coastal communities such as Barrow (Reanier 2002).

Alaska Stand Alone Gas Pipeline 5.13-7 Final EIS
Interest in the geology and history of the early culture of the area began in earnest at the
beginning of the twentieth century, but access was limited to coastal areas. Stefansson
conducted ethnographic studies along the coast east of Barrow in 1906–1907, 1908–1912, and
1913–1918. Between 1906 and 1914, geologist Ernest de K. Leffingwell conducted geological
and geographical research along the Arctic coast, based from Flaxman Island
(Leffingwell 1919). As an extension of the fifth Thule Expedition, Knud Rasmussen crossed into
Alaska from Canada in 1924. He compiled ethnographic data on the Alaskan Iñupiat and their
camps and recorded place names on the Utuqqaq (Utukok) River.
Missionary Efforts, Trading Posts, and Reindeer Herding
At the beginning of the twentieth century, whale oil and baleen decreased in importance as
commodities on the world market. Mineral oils and distillates replaced whale oil for illumination
and lubricants, and spring steel, early plastics, and changes in fashion made baleen a
redundant product. The fur trade filled some of the economic gap left by the collapse of the
whalebone (baleen) market and the subsequent demise of commercial whaling. The fur trading
business in the area declined in the 1930s due to reduced fur demand during the Great
Depression. Most of the trading posts ceased operations by the 1940s (Schneider and
Libbey 1979).
Christian missionaries first arrived in Barrow in 1890. Mission schools were established
between 1890 and 1910 at Wales, Point Hope, and Barrow, as well as other places that were
not previously occupied year round. Eventually, the original mission schools split into separate
entities: government schools and church-operated missions. Trading posts were also
established near missions and schools. These areas became focal points for the Native
population, and settlements grew up around some of these locations (Schneider and
Libbey 1979).
At the end of the nineteenth century, Presbyterian missionary Sheldon Jackson introduced
reindeer herding to Alaska Natives with government support. Reindeer herds were maintained
by Iñupiat near Wainwright, Barrow, and Nuiqsut, as well as other settlements on the North
Slope (Schneider and Libbey 1979). Reindeer herding ended in 1938 across much of the North
Slope, partially due to the collapse of the market for meat and hides (Reanier 2002).
Military Presence
During the early part of World War II, the Alaskan Command had concerns about the possibility
of Japanese troops invading mainland Alaska after their successful initial campaign into the
Aleutians. To create an organized defense group, Major ―Muktuk‖ Marston was assigned the
task of organizing the Alaska Territorial Guard with units composed of Alaska Natives from
central rural communities such as Point Hope, Barrow, Wainwright, Kaktovik, and Nome. The
Alaska Territorial Guard was disbanded in 1946, with Colonel Marston resigning
(Chandonnet 2008).
In the early 1950s, the U.S. and Canada, under threat of atomic warfare, planned a Distant
Early Warning (DEW) Line that was to expand across the northern regions of Alaska and
Alaska Stand Alone Gas Pipeline 5.13-8 Final EIS
Canada to provide advance warning for interception and counterattack of incoming heavy
bombers from the Soviet Union (Denfeld 1994). Another system was the Aircraft Control and
Warning (ACW) System, a set of relatively short-range radar sites completed before the DEW
line using less sophisticated radar equipment, some dating back to World War II (Argonne
National Laboratories 2001). The communications system designed to connect the network of
DEW Line radars to the lower 48 was called White Alice (USACE 2001). The DEW Line-Alaska
Segment has been found to be eligible for inclusion on the NRHP and the U.S. Air Force has
documented two of the DEW Line sites for future historical research (Whorton 2002,
ADNR, OHA 2011).
Hydrocarbon Exploration, Production, and Development
The Iñupiat have known of oil and gas on the North Slope for generations, well before European
explorers and U.S. Geological Survey (USGS) researchers began reporting oil seeps in the mid-
nineteenth and early twentieth century (Haycox 2009, Brower 1994, Leffingwell 1919, Ebbley
and Joesting 1943). By the early 1920s, commercial interests began surveying the North Slope
and staking mineral claims for oil in the region (Smith et al. 1926). In 1923, President Warren
Harding set aside a large tract of land on the North Slope as the fourth Naval Petroleum
Reserve (NPR4), intended to secure petroleum to supply Navy ships that had switched from
coal to petroleum as fuel. The USGS conducted a preliminary geological survey of the region
from 1923 to 1926 (Smith and Mertie 1930). In 1943, the Bureau of Mines sent a party to
investigate the region’s known oil seeps with Simon Paneak, then of Chandler Lake, as their
guide (Ebbley and Joesting 1943). In 1944, the U.S. Navy returned to further survey NPR-4 and
discovered a number of oil and gas deposits in the reserve (Reed 1958). Private companies
continued the search for commercially exploitable oil and gas deposits, culminating with Atlantic
Richfield Company (ARCO)’s discovery of the Prudhoe Bay field in 1968 (Naske and
Slotnick 1994). The resulting rush by several companies to produce oil from the massive field
and bring it to market through construction of the Trans-Alaska Pipeline System (TAPS)
required groundbreaking federal legislation, investment, and engineering work to build
infrastructure to support production and transportation of the crude oil (Roderick 1997).
The initiation of petroleum development has led to intensive investigations of cultural resources
on the North Slope. These investigations occurred after World War II in the Naval Petroleum
Reserve No. 4 (now designated the NPR-A), and before and during construction of the TAPS.
The NSB Commission on History and Culture initiated the traditional lane use inventory for the
North Slope in the 1970s in anticipation, of and in response to, increased resource development
on the North Slope (Schneider and Libbey 1979).
Previously Reported Cultural Resources in the Proposed Project Area – North Slope Region
There are 178 previously reported AHRS sites located within 1 mile of the proposed Project
area in the North Slope region; a total of 9 AHRS sites are located within the construction ROW.
The sites that exist within the ROW are prehistoric and historic or a combination of multiple time
periods. Included are lithic scatters and isolated flakes, faunal remains, and historic built-
environment resources i.e., aboveground structures as opposed to buried cultural deposits.

Alaska Stand Alone Gas Pipeline 5.13-9 Final EIS
Also previously reported are the Dalton (PSM-00570/SAG-00097/XBP-00114) and Hickel
(SAG-00098) highways. None of the 9 previously recorded AHRS sites located within the
construction ROW have undergone determinations of eligibility for the NRHP. The TAPS and
the oilfield are potentially eligible historic properties that have not yet been evaluated for
inclusion on the NRHP; however, these properties constitute an important historic theme for the
region (BLM 2002). The Dalton Highway is currently treated as eligible under the Alaska
Highway System Roads Programmatic Agreement, until a formal determination of eligibility can
be made following completion of the Historic Roads context for Alaska (DOT&PF 2010).
TABLE 5.13-2 Previously Reported AHRS Sites within the Proposed Project Area ROW – North Slope Region
AHRS Site Name Period Site Description Preservation Status
PSM-00172 PSM-00172 Prehistoric Site: Isolated find NDE
PSM-00192 PSM-00192 Prehistoric Site: Activity area; Lithics, Faunal remain NDE
PSM-00476 PSM-00476 Prehistoric Site: Lithic scatter; Flakes, Bone fragments NDE
PSM-00534 PSM-00534 Prehistoric Site: Isolated find, Flake NDE
PSM-00570 Dalton Hwy (MP 1 to 414) Site NDE
SAG-00006 SAG-00006 Prehistoric/
Historic Site NDE
SAG-00097 Dalton Hwy (MP 1 to 414) Site NDE
SAG-00098 Hickel Highway Site: Transportation; Winter road NDE
XBP-00114 Dalton Hwy (MP 1 to 414) Site NDE
NDE – No Determination of Eligibility. Sources: ADNR, OHA 2011; Stephen R. Braund & Associates 2011.

Alaska Stand Alone Gas Pipeline 5.13-10 Final EIS
FIGURE 5.13-1 Reported Cultural Resources within 1 Mile of the Proposed Project – North Slope Region
•TLUI Site
Within 1 mile,but beyond ROW
AHRS Trail
-""v-- Intersects ROW
REPORTEDCULTURAL RESOURCES:
AHRS Site
• Within ROW
Within 1 mile,but beyond ROW
RS 2477 Trail
~ Intersects ROW
• The Hickel Highway isalso an AHRS traiL
AHRS data from AONR, OHA 2011.RS 2477 dala fromADNR, IRMS 2006.
TLUI data from NSB, IHLC 2011.
Deadhorse
Hickel Highway' ~
Gas Conditioning Facility~Nuiqsut
S1ephef1 R Braund & AssociatesPO Bo~ 1480
Anchorage, Alaska 99510(907) 276-8222 ~@a1aska net
M~es
" 20
LEGEND:
ASAPMainline
""-Highway
""Community
'"
This m.>pand oil datacolltainedwilhill .....uppliedu II willlllC>..arrOllly. can:I... ENnlX, In<. upru.1y 'Iocl.uns ,upolUlbtlilyb,d..mI.,.. orl ..bihtyfromotDfdalm'th1t "'OJ' ann.lIt.f,m",uem"''''' ofthism.p. Ili,th• ..,\< =F<'=bility .lthGus,,"to determlnt,ftll< dati on l!llf ...p ..etta the .... r'1 .Hdo. TIIamap was "'" a ..t«! .. 'UJ'\'<Y da.... DO' ,nould it be~ osN<!L1t 11th.....r'. rnpo""ih'btj"to obuin prop" Nn'ey da....pr.p....d b)'1 ti"f\..d.~or. Ifh.... 'tqulted bylaw.
Alaska Stand Alone Gas PipelineReported Cultural Resources within One Mileofthe Proposed Project, North Slope Region NHembu 1011
"'''I' Proj«llOn, NAD Sl H.... Plan"
Alaska Stand Alone Gas Pipeline 5.13-11 Final EIS
There are two TLUI sites present within a mile of the proposed ROW in the North Slope region.
Natvavak (TLUIPSM 006) represents a broad landscape of fishing, hunting, and trapping
associated with Galbraith Lake and the surrounding mountains and drainages, including the
Atigun area cultural resources sites listed by the AHRS. Grave Site No. 2 (TLUIPMS 014) is
near a small lake on a raised bench west of the TAPS ROW. A description of TLUI sites within
1 mile of the proposed Project is provided in Table 5.13-3.
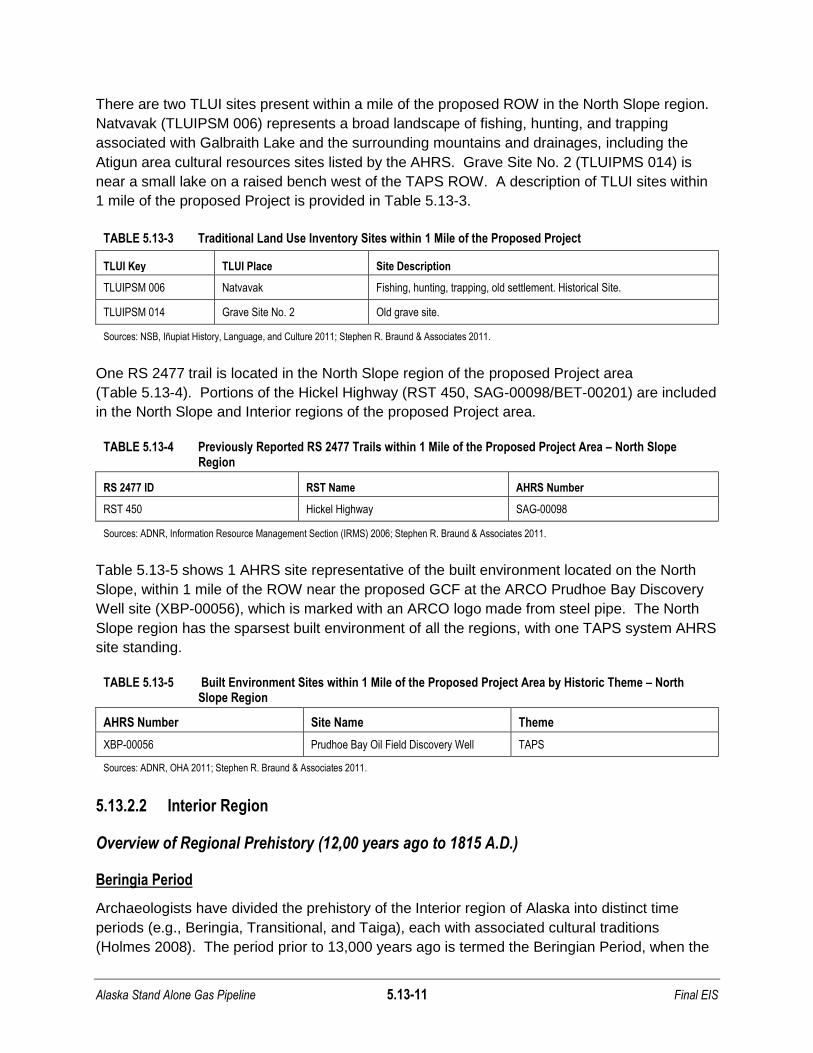
TABLE 5.13-3 Traditional Land Use Inventory Sites within 1 Mile of the Proposed Project
TLUI Key TLUI Place Site Description
TLUIPSM 006 Natvavak Fishing, hunting, trapping, old settlement. Historical Site.
TLUIPSM 014 Grave Site No. 2 Old grave site.
Sources: NSB, Iñupiat History, Language, and Culture 2011; Stephen R. Braund & Associates 2011.
One RS 2477 trail is located in the North Slope region of the proposed Project area
(Table 5.13-4). Portions of the Hickel Highway (RST 450, SAG-00098/BET-00201) are included
in the North Slope and Interior regions of the proposed Project area.
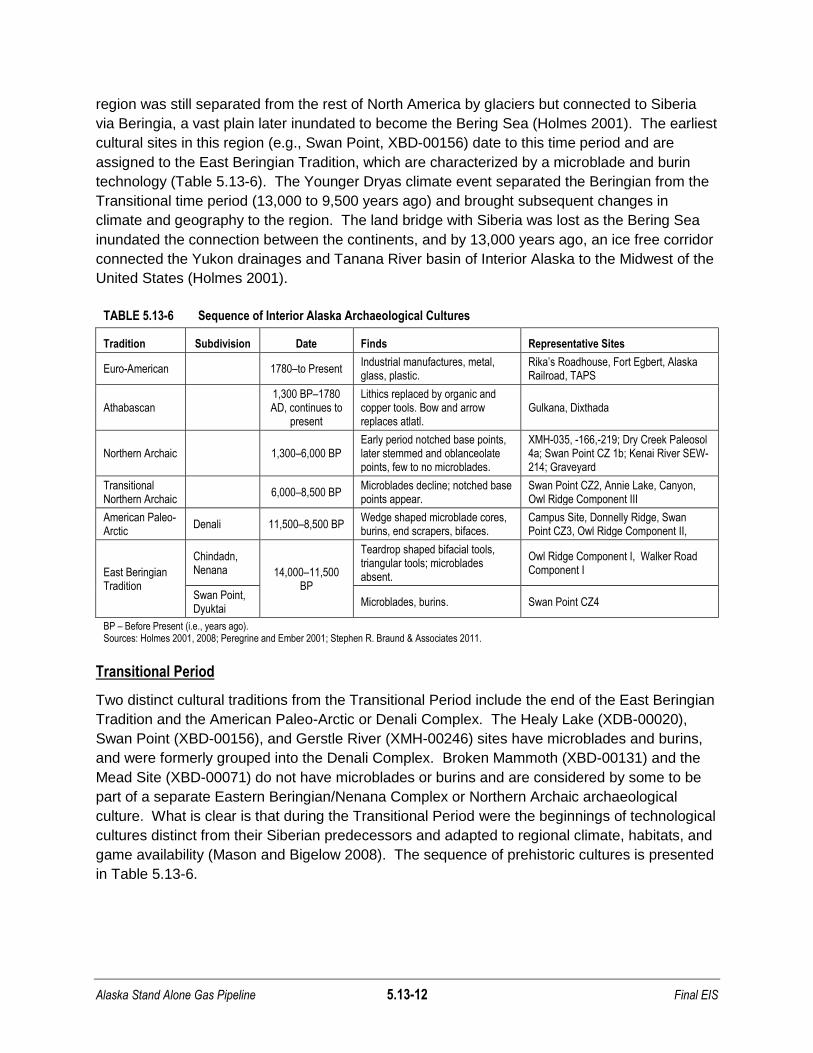
TABLE 5.13-4 Previously Reported RS 2477 Trails within 1 Mile of the Proposed Project Area – North Slope Region
RS 2477 ID RST Name AHRS Number
RST 450 Hickel Highway SAG-00098
Sources: ADNR, Information Resource Management Section (IRMS) 2006; Stephen R. Braund & Associates 2011.
Table 5.13-5 shows 1 AHRS site representative of the built environment located on the North
Slope, within 1 mile of the ROW near the proposed GCF at the ARCO Prudhoe Bay Discovery
Well site (XBP-00056), which is marked with an ARCO logo made from steel pipe. The North
Slope region has the sparsest built environment of all the regions, with one TAPS system AHRS
site standing.
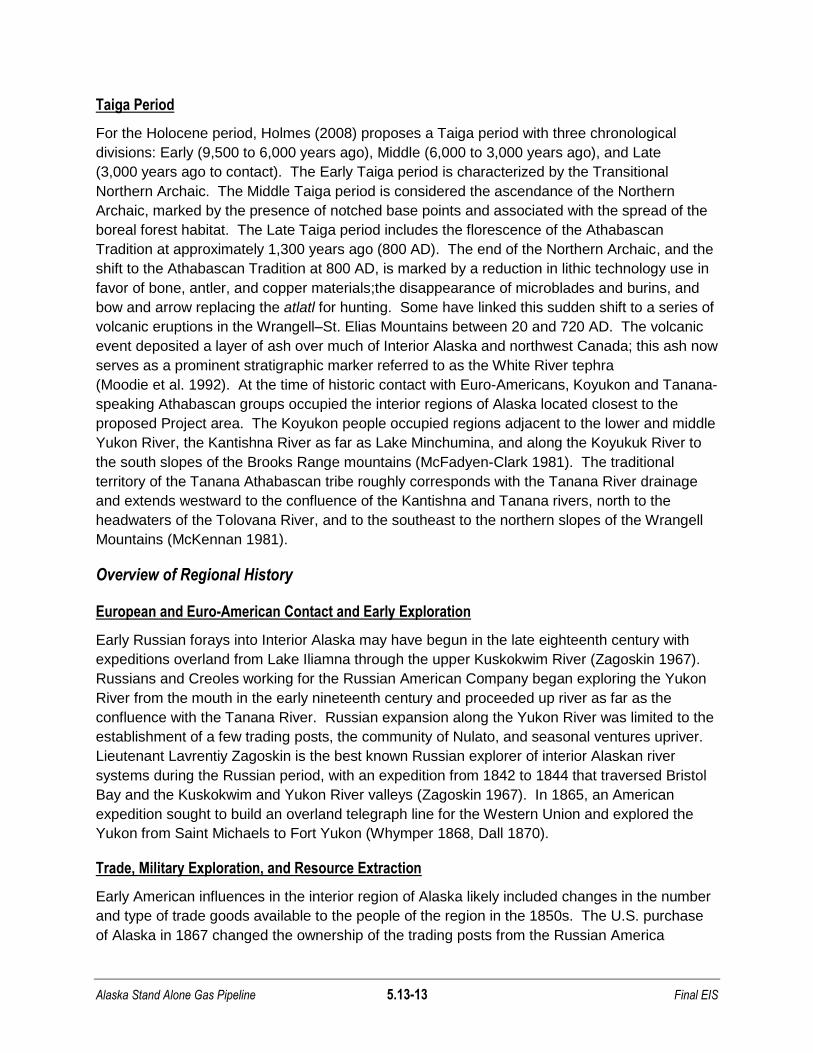
TABLE 5.13-5 Built Environment Sites within 1 Mile of the Proposed Project Area by Historic Theme – North Slope Region
AHRS Number Site Name Theme
XBP-00056 Prudhoe Bay Oil Field Discovery Well TAPS
Sources: ADNR, OHA 2011; Stephen R. Braund & Associates 2011.
5.13.2.2 Interior Region
Overview of Regional Prehistory (12,00 years ago to 1815 A.D.)
Beringia Period
Archaeologists have divided the prehistory of the Interior region of Alaska into distinct time
periods (e.g., Beringia, Transitional, and Taiga), each with associated cultural traditions
(Holmes 2008). The period prior to 13,000 years ago is termed the Beringian Period, when the
Alaska Stand Alone Gas Pipeline 5.13-12 Final EIS
region was still separated from the rest of North America by glaciers but connected to Siberia
via Beringia, a vast plain later inundated to become the Bering Sea (Holmes 2001). The earliest
cultural sites in this region (e.g., Swan Point, XBD-00156) date to this time period and are
assigned to the East Beringian Tradition, which are characterized by a microblade and burin
technology (Table 5.13-6). The Younger Dryas climate event separated the Beringian from the
Transitional time period (13,000 to 9,500 years ago) and brought subsequent changes in
climate and geography to the region. The land bridge with Siberia was lost as the Bering Sea
inundated the connection between the continents, and by 13,000 years ago, an ice free corridor
connected the Yukon drainages and Tanana River basin of Interior Alaska to the Midwest of the
United States (Holmes 2001).
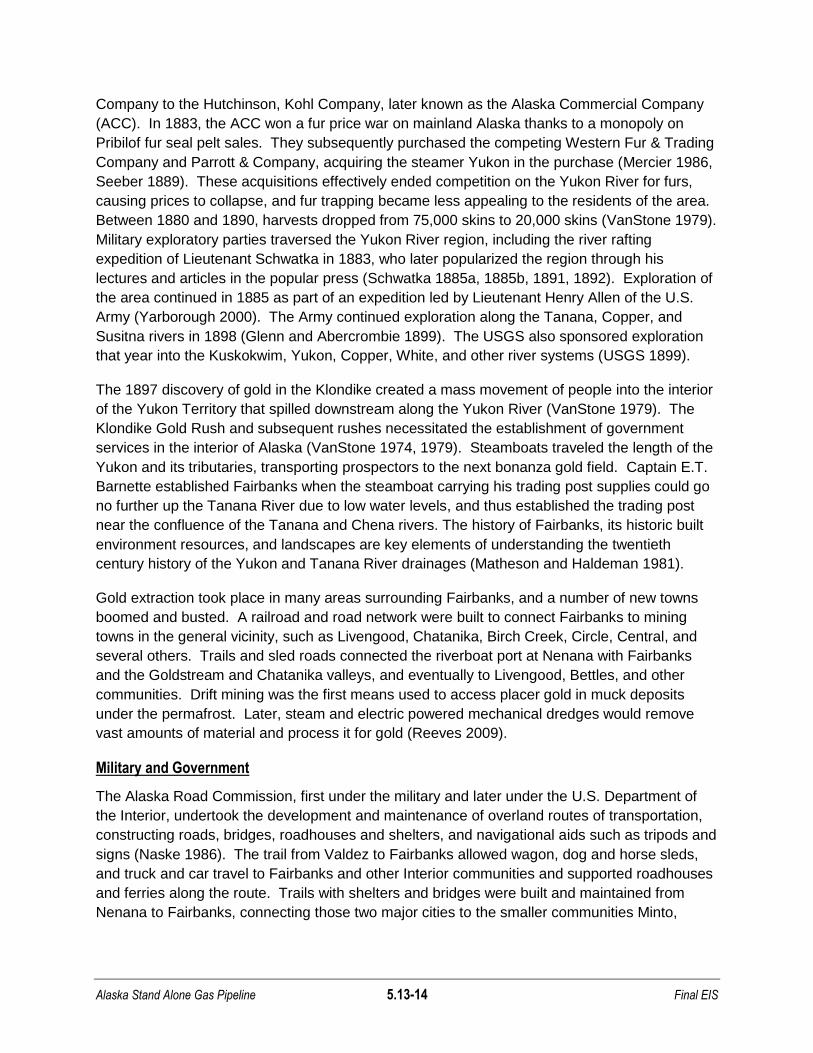
TABLE 5.13-6 Sequence of Interior Alaska Archaeological Cultures
Tradition Subdivision Date Finds Representative Sites
Euro-American 1780–to Present Industrial manufactures, metal, glass, plastic.
Rika’s Roadhouse, Fort Egbert, Alaska Railroad, TAPS
Athabascan 1,300 BP–1780 AD, continues to
present
Lithics replaced by organic and copper tools. Bow and arrow replaces atlatl.
Gulkana, Dixthada
Northern Archaic 1,300–6,000 BP Early period notched base points, later stemmed and oblanceolate points, few to no microblades.
XMH-035, -166,-219; Dry Creek Paleosol 4a; Swan Point CZ 1b; Kenai River SEW-214; Graveyard
Transitional Northern Archaic
6,000–8,500 BP Microblades decline; notched base points appear.
Swan Point CZ2, Annie Lake, Canyon, Owl Ridge Component III
American Paleo-Arctic
Denali 11,500–8,500 BP Wedge shaped microblade cores, burins, end scrapers, bifaces.
Campus Site, Donnelly Ridge, Swan Point CZ3, Owl Ridge Component II,
East Beringian Tradition
Chindadn, Nenana 14,000–11,500
BP
Teardrop shaped bifacial tools, triangular tools; microblades absent.
Owl Ridge Component I, Walker Road Component I
Swan Point, Dyuktai
Microblades, burins. Swan Point CZ4
BP – Before Present (i.e., years ago). Sources: Holmes 2001, 2008; Peregrine and Ember 2001; Stephen R. Braund & Associates 2011.
Transitional Period
Two distinct cultural traditions from the Transitional Period include the end of the East Beringian
Tradition and the American Paleo-Arctic or Denali Complex. The Healy Lake (XDB-00020),
Swan Point (XBD-00156), and Gerstle River (XMH-00246) sites have microblades and burins,
and were formerly grouped into the Denali Complex. Broken Mammoth (XBD-00131) and the
Mead Site (XBD-00071) do not have microblades or burins and are considered by some to be
part of a separate Eastern Beringian/Nenana Complex or Northern Archaic archaeological
culture. What is clear is that during the Transitional Period were the beginnings of technological
cultures distinct from their Siberian predecessors and adapted to regional climate, habitats, and
game availability (Mason and Bigelow 2008). The sequence of prehistoric cultures is presented
in Table 5.13-6.
Alaska Stand Alone Gas Pipeline 5.13-13 Final EIS
Taiga Period
For the Holocene period, Holmes (2008) proposes a Taiga period with three chronological
divisions: Early (9,500 to 6,000 years ago), Middle (6,000 to 3,000 years ago), and Late
(3,000 years ago to contact). The Early Taiga period is characterized by the Transitional
Northern Archaic. The Middle Taiga period is considered the ascendance of the Northern
Archaic, marked by the presence of notched base points and associated with the spread of the
boreal forest habitat. The Late Taiga period includes the florescence of the Athabascan
Tradition at approximately 1,300 years ago (800 AD). The end of the Northern Archaic, and the
shift to the Athabascan Tradition at 800 AD, is marked by a reduction in lithic technology use in
favor of bone, antler, and copper materials;the disappearance of microblades and burins, and
bow and arrow replacing the atlatl for hunting. Some have linked this sudden shift to a series of
volcanic eruptions in the Wrangell–St. Elias Mountains between 20 and 720 AD. The volcanic
event deposited a layer of ash over much of Interior Alaska and northwest Canada; this ash now
serves as a prominent stratigraphic marker referred to as the White River tephra
(Moodie et al. 1992). At the time of historic contact with Euro-Americans, Koyukon and Tanana-
speaking Athabascan groups occupied the interior regions of Alaska located closest to the
proposed Project area. The Koyukon people occupied regions adjacent to the lower and middle
Yukon River, the Kantishna River as far as Lake Minchumina, and along the Koyukuk River to
the south slopes of the Brooks Range mountains (McFadyen-Clark 1981). The traditional
territory of the Tanana Athabascan tribe roughly corresponds with the Tanana River drainage
and extends westward to the confluence of the Kantishna and Tanana rivers, north to the
headwaters of the Tolovana River, and to the southeast to the northern slopes of the Wrangell
Mountains (McKennan 1981).
Overview of Regional History
European and Euro-American Contact and Early Exploration
Early Russian forays into Interior Alaska may have begun in the late eighteenth century with
expeditions overland from Lake Iliamna through the upper Kuskokwim River (Zagoskin 1967).
Russians and Creoles working for the Russian American Company began exploring the Yukon
River from the mouth in the early nineteenth century and proceeded up river as far as the
confluence with the Tanana River. Russian expansion along the Yukon River was limited to the
establishment of a few trading posts, the community of Nulato, and seasonal ventures upriver.
Lieutenant Lavrentiy Zagoskin is the best known Russian explorer of interior Alaskan river
systems during the Russian period, with an expedition from 1842 to 1844 that traversed Bristol
Bay and the Kuskokwim and Yukon River valleys (Zagoskin 1967). In 1865, an American
expedition sought to build an overland telegraph line for the Western Union and explored the
Yukon from Saint Michaels to Fort Yukon (Whymper 1868, Dall 1870).
Trade, Military Exploration, and Resource Extraction
Early American influences in the interior region of Alaska likely included changes in the number
and type of trade goods available to the people of the region in the 1850s. The U.S. purchase
of Alaska in 1867 changed the ownership of the trading posts from the Russian America
Alaska Stand Alone Gas Pipeline 5.13-14 Final EIS
Company to the Hutchinson, Kohl Company, later known as the Alaska Commercial Company
(ACC). In 1883, the ACC won a fur price war on mainland Alaska thanks to a monopoly on
Pribilof fur seal pelt sales. They subsequently purchased the competing Western Fur & Trading
Company and Parrott & Company, acquiring the steamer Yukon in the purchase (Mercier 1986,
Seeber 1889). These acquisitions effectively ended competition on the Yukon River for furs,
causing prices to collapse, and fur trapping became less appealing to the residents of the area.
Between 1880 and 1890, harvests dropped from 75,000 skins to 20,000 skins (VanStone 1979).
Military exploratory parties traversed the Yukon River region, including the river rafting
expedition of Lieutenant Schwatka in 1883, who later popularized the region through his
lectures and articles in the popular press (Schwatka 1885a, 1885b, 1891, 1892). Exploration of
the area continued in 1885 as part of an expedition led by Lieutenant Henry Allen of the U.S.
Army (Yarborough 2000). The Army continued exploration along the Tanana, Copper, and
Susitna rivers in 1898 (Glenn and Abercrombie 1899). The USGS also sponsored exploration
that year into the Kuskokwim, Yukon, Copper, White, and other river systems (USGS 1899).
The 1897 discovery of gold in the Klondike created a mass movement of people into the interior
of the Yukon Territory that spilled downstream along the Yukon River (VanStone 1979). The
Klondike Gold Rush and subsequent rushes necessitated the establishment of government
services in the interior of Alaska (VanStone 1974, 1979). Steamboats traveled the length of the
Yukon and its tributaries, transporting prospectors to the next bonanza gold field. Captain E.T.
Barnette established Fairbanks when the steamboat carrying his trading post supplies could go
no further up the Tanana River due to low water levels, and thus established the trading post
near the confluence of the Tanana and Chena rivers. The history of Fairbanks, its historic built
environment resources, and landscapes are key elements of understanding the twentieth
century history of the Yukon and Tanana River drainages (Matheson and Haldeman 1981).
Gold extraction took place in many areas surrounding Fairbanks, and a number of new towns
boomed and busted. A railroad and road network were built to connect Fairbanks to mining
towns in the general vicinity, such as Livengood, Chatanika, Birch Creek, Circle, Central, and
several others. Trails and sled roads connected the riverboat port at Nenana with Fairbanks
and the Goldstream and Chatanika valleys, and eventually to Livengood, Bettles, and other
communities. Drift mining was the first means used to access placer gold in muck deposits
under the permafrost. Later, steam and electric powered mechanical dredges would remove
vast amounts of material and process it for gold (Reeves 2009).
Military and Government
The Alaska Road Commission, first under the military and later under the U.S. Department of
the Interior, undertook the development and maintenance of overland routes of transportation,
constructing roads, bridges, roadhouses and shelters, and navigational aids such as tripods and
signs (Naske 1986). The trail from Valdez to Fairbanks allowed wagon, dog and horse sleds,
and truck and car travel to Fairbanks and other Interior communities and supported roadhouses
and ferries along the route. Trails with shelters and bridges were built and maintained from
Nenana to Fairbanks, connecting those two major cities to the smaller communities Minto,
Alaska Stand Alone Gas Pipeline 5.13-15 Final EIS
Kantishna, Tanana, Livengood, Wiseman, and Coldfoot, as well as many other villages and
camps (Naske 1986).
The Alaska Railroad (ARR) project (originally the Alaska Central Railway), began in 1903 at the
newly established port of Seward (ARR 2010) and was a government project designed to link
Interior Alaska with ice free ports on the Pacific Ocean. President Woodrow Wilson formed the
Alaska Engineering Commission on March 12, 1914, which surveyed potential routes, and then
purchased the bankrupt Alaska Northern and Tanana Valley railroads and proceeded to link and
improve them. Construction began in 1915 at Anchorage, and the line was completed between
Seward and Fairbanks by 1923, when President Warren G. Harding drove the golden spike at
North Nenana on July 15th (Wilson 1977). The ARR supported coal mining at Healy and vicinity
that continues to this day, as well as transporting fuel, supplies, and equipment for the Interior
since its completion.
In 1939, just before World War II, an Army Air Base (Ladd Field) was built in Fairbanks on the
Chena River (Price 2004). World War II brought a new wave of development to the interior
section of Alaska. Road connections were established and improved, linking Fairbanks directly
to the contiguous United States through Canada (Haigh 2008). Airfields were built along travel
routes leading to Fairbanks, and from there along routes to Siberia and the Aleutians for Lend-
Lease support of the Soviets, and to supply and defend Alaska from Japan following their
invasion of the Aleutians (Dolitsky 2008). An Army air base (26 Mile Airfield) was constructed
near Fairbanks, and the existing Ladd Field was expanded closer to town. Tracts of land in the
region were set aside for training areas (Price 2004). The new road system and military
presence brought a new level of economic prosperity to the interior region of Alaska, particularly
following the construction of the Alaska Highway (Chandonnet 2008).
The Cold War brought further military exploration and development into all regions of Alaska.
Nike missile sites were built to protect military bases in the Tanana basin, connected by
communications systems that allowed immediate contact throughout the state and with
command centers in the continental United States. Some of these facilities are still in use, such
as the Clear AFB Ballistic Missile Early Warning System and other remote communications
facilities, while many of the White Alice communications sites, Aircraft Control and Warning
sites, and Forward Operating Bases have been removed (Price 2004).
Previously Reported Cultural Resources in the Proposed Project Area – Interior Region
There are 436 previously reported AHRS sites located within 1 mile of the proposed Project
area in the Interior region; a total of 24 AHRS sites are located within the proposed Project
ROW (Figure 5.13-2; Table 5.13-7). These sites include cultural materials from multiple time
periods; a prehistoric archaeological district, prehistoric lithic remains, subsurface flakes, and a
campsite; and historic sites associated with mining, the construction of the Dalton, Denali, and
Hickel highways, the construction of the Alaska Railroad, and structures. One site (CHN-00025)
has a nomination pending for the NRHP, 1 site (HEA-00062) has been determined eligible for
the NRHP, and 2 sites (LIV-00040, LIV-00284) have been determined eligible as part of a
NRHP nomination process, but not formally nominated (listed as ―NCL‖ in Table 5.13-7). A total

Alaska Stand Alone Gas Pipeline 5.13-16 Final EIS
of 27 RS 2477 trails are located in the Interior region of the proposed Project area
(Table 5.13-8). The Hickel Highway (RST 450, SAG-00098/BET-00201) includes portions
located within the North Slope and Interior regions. AHRS properties listed as modern, historic,
and protohistoric were examined for their contribution to a built environment and grouped
according to historic themes in Table 5.13-9. Standing Interior region properties include
3 highway related properties, 44 ARR properties, 22 Cold War-era properties at Clear Air Force
Station, 26 Gold Rush properties, and 25 properties in the Other Historic Theme category.
TABLE 5.13-7 Previously Reported AHRS Sites within the Proposed Project Area ROW – Interior Region
AHRS Site Name Period Site Description Preservation Status
BET-00121 BET-00121 Prehistoric Site, Camp, Hearth, Firewood, Tci-tho NDE
BET-00139 BET-00139 Prehistoric Site, Lithic remains, Flakes, Reduction, Obsidian
NDE
BET-00200 Dalton Hwy (MP 1 to 414) Site NDE
BET-00201 Hickel Highway Historic Site, Transportation, Winter road NDE
CHN-00025 CHN-00025 Historic Site, Can scatter NPD
CHN-00070 Dalton Hwy (MP 1 to 414) Site NDE
FAI-02102 Dunbar Trail Site NDE
HEA-00014 Coyote Creek Site Prehistoric Site, Isolated find NDE
HEA-00015 HEA-00015 Prehistoric Site, Lithics NDE
HEA-00062 Nenana River Gorge Site Prehistoric/Historic Site, Lithics, FCR, Faunal, Pottery, Railroad NRE
HEA-00091 Stampede Trail Historic Structure, Trail, Mining NDE
HEA-00448 HEA-00448 Historic Mining, Resource Utilization NDE
HEA-00449 HEA-00449 Historic Site, Mining, Resource Utilization NDE
HEA-00450 Denali Hwy (MP 1 to 134.5) Site NDE
LIV-00040 LIV-00040 (Tolovana 1, Tolovana 2) [Rosebud Knob AD]
Prehistoric Site, Activity area, Lithic remains NCL
LIV-00284 Rosebud Knob Archaeological District
Prehistoric District, Archaeological NCL
LIV-00501 Dalton Hwy (MP 1 to 414) Site NDE
LIV-00556 Dunbar Trail Site NDE
PSM-00186 PSM-00186 Historic Site NDE
PSM-00188 PSM-00188 Historic/Modern Site NDE
PSM-00570 Dalton Hwy (MP 1 to 414) Site NDE
TAN-00118 Dalton Hwy (MP 1 to 414) Site NDE
WIS-00408 Dalton Hwy (MP 1 to 414) Site NDE
WIS-00020 WIS-00020 Prehistoric Site NDE
NDE – No Determination of Eligibility; NRE – Determined Eligible; NPD – Nomination Pending; NCL – Nomination Closed. Sources: ADNR, OHA 2011; Stephen R. Braund & Associates 2011.

Alaska Stand Alone Gas Pipeline 5.13-17 Final EIS
TABLE 5.13-8 Previously Reported RS 2477 Trails within 1 Mile of the Proposed Project Area – Interior Region
RS 2477 ID RST NAME AHRS Number
RST 119 Kobi–Bonnifield Trail to Tatlanika Crk
RST 152 Nenana-Tanana (serum run)
RST 1595 Dunbar-Minto-Tolovana
RST 1602 Ester Dome-Nugget Creek Trail
RST 1611 Bergman-Cathedral Mountain
RST 1824 Alder Creek Trail
RST 209 Bettles-Coldfoot
RST 254 Wiseman-Chandalar
RST 262 Caro-Coldfoot
RST 264 Old Mail Trail (Nenana-Minto)
RST 340 Lignite-Stampede
RST 343 Kobi-Kantishna
RST 344 Lignite-Kantishna
RST 345 Kobi-McGrath (via Nikolai & Big River)
RST 346 Nenana-Kantishna
RST 412 Slate Creek
RST 450 Hickel Highway BET-00201
RST 468 Hunter Creek-Livengood
RST 491 Rex-Roosevelt
RST 591 Coldfoot-Junction Trail 49 (east route)
RST 625 Cantwell Small Tracts Road (Lovers Lane)
RST 66 Dunbar-Brooks Terminal FAI-02102; LIV-00556
RST 70 Ester-Dunbar
RST 707 Windy Creek Trails (Cantwell)
RST 709 Healy-Diamond Coal Mine Dirt Road
RST 899 Hammond River Trail
RST 9 Coldfoot-Chandalar Lake Trail
Sources: ADNR, IRMS 2006; Stephen R. Braund & Associates 2011.

Alaska Stand Alone Gas Pipeline 5.13-18 Final EIS
TABLE 5.13-9 Built Environment Sites within 1 Mile of the Proposed Project Area by Historic Themes – Interior Region
AHRS Numbers Site Names Theme
HEA-00300, HEA-00302, HEA-00303, FAI-00074, FAI-00081, FAI-00089, FAI-00090, FAI-00092, FAI-00093, FAI-00095, FAI-00097, FAI-00098, FAI-00105, FAI-00225, FAI-00440, FAI-01555, FAI-01558, FAI-01728, FAI-01735, HEA-00068, HEA-00069, HEA-00072, HEA-00074, HEA-00075, HEA-00079, HEA-00084, HEA-00224, EA-00252, HEA-00280, HEA-00293, HEA-00301, HEA-00305, HEA-00326, HEA-00328, HEA-00337, HEA-00338, HEA-00350, HEA-00377, HEA-00380, HEA-00382, HEA-00383, HEA-00387, HEA-00427, WIS-00009
cabin, yanert mouth cabin (cabin #176), yanert coal mine, jap roadhouse, golden spike site, nenana river r.r. bridge, ferry r.r. station (residency 4, nenana river ferry village), tanana river r.r. bridge, arr bridge 422.9, arr bridge 432.1, arr bridge 439.7,arr bridge 447.7, nenana depot (nenana r.r. station), saulich homestead, alaska railroad bed, railroad cemetery north of nenana, historic cabin, old george hall, nenana river bridge at rex, cantwell r.r. section house, cantwell (cantwell r.r. station, cantwell river station), clear creek r.r. bridge, riley creek r.r. bridge, mckinley park station (mckinley park r.r. station), garner tunnel (tunnel 10), sheep creek r.r. bridge (arrc bridge 352.7), lower windy creek ranger cabin #15 [ptl cab], healy hotel, maurice morino grave, nenana canyon roadhouse and patrol cabin complex, lagoon section station (cabin #175), shed at oliver flag stop, ak r.r. bridge mp 351.4 unnamed trib of nenana river, hea-00328, chulitna river railroad bridge, bridge 305.7, railroad bridge, bridge 354.4, hea-00350, arr bridge 355.2 [arr bridge], arrc timber bridge mp 319.7, arrc timber bridge mp 337.0, arrc timber bridge mp 348.8, arrc timber bridge mp 369.7, healy school house (stickle home), slisco’s roadhouse (jack flowers’ roadhouse, wiseman roadhouse)
ARR
FAI-00569, FAI-00570, FAI-00571, FAI-00572, FAI-00573, FAI-00574, FAI-00575, FAI-00576, FAI-00577, FAI-00578, FAI-00579, FAI-00580, FAI-00581, FAI-00582, FAI-00583, FAI-00584, FAI-00585, FAI-00586, FAI-00587, FAI-00588, FAI-00589, FAI-01769
clear afs: building 101, transmitter building, building 102, transmitter building, building 103, supply and equipment warehouse, building 104, scanner building, building 105, scanner building, building 106, scanner building, building 110, thaw shed, building 111, electric power station, building 113, chemical storage, building 114, ash silo, refuse incinerator, building 115, coal transfer crusher house, building 118, locomotive shelter, building 121, fire station, building 125, water pump station, building 126, water supply, building 127, water supply, building 128, water supply, building 129, water supply, an/fps-50 radar, detection radar antenna screen, structure 735 as], an/fps-50 radar, detection radar antenna screen, structure 736 [cas], an/fps-50 radar, detection radar antenna screen, structure 737 [cas], utilitor
Cold War
FAI-00226, FAI-00388, FAI-00389, FAI-00390, FAI-00414, FAI-00415, LIV-00039, WIS-00007, WIS-00008, WIS-00038, WIS-00040, WIS-00050, WIS-00281, WIS-00290, WIS-00291, WIS-00384, WIS-00405
cabin ruins, gold creek cabin no.1 (arc shelter cabin), gold creek cabin 2 (ems 39-3/1/f), rainbow gulch log and sod house, chn-00021, wilcox drift mine complex, sheep creek cabin 2007-1, rainbow gulch cabin, fe dredge #6, strawberry joe nettleton’s cabin, cabin #2, cabin #3 (cabin ruin #3), fairbanks exploration company camp, moose creek cabin, moose creek prospects, lost creek cabin, coldfoot , townsite (slate creek), wiseman historic district (nolan, wrights), wis-00038, coldfoot historic district, minnie creek mine shaft, jonas cabin (big jim’s cabin, florence jonas cabin, klhabuk’s cabin), minnie creek drift mine complex, larson creek cabin, frank miller cabin residence, wiseman cemetery
gold rush
FAI-01736, FAI-01767, LIV-00455 little goldstream creek bridge, moose creek bridge, yukon river bridge highways
BET-00050, CHN-00013, CHN-00015, CHN-00016, CHN-00018, CHN-00041, FAI-00031, FAI-00039, FAI-00099, FAI-00169, FAI-00410, FAI-00442, FAI-00444, FAI-01554, HEA-00043, HEA-00188, HEA-00282, HEA-00289, HEA-00290, HEA-00291, HEA-00292, HEA-00306, PSM-00186, PSM-00187, PSM-00188
bet-00050, chn-00013 (as 040/1/c), arctic john etalook cabin, chn-00016 (ems 37-3/1d), chn-00018, john etalook’s summer camp, saint marks mission, mv taku chief, st theresa’s catholic church, strand family cemetery, powder keg road, fish camp and possible village site, agnes homeier house, older native cemetery north of nenana, cabin site, hea-00188, mcclarty/smith graves, old cantwell cemetery, jack river graves, jack secondchief grave, fanny’s grave, johnny romanov cabin, psm-00186, psm-00187, psm-00188
other historic themes
Sources: ADNR, OHA 2011; Stephen R. Braund & Associates 2011.

Alaska Stand Alone Gas Pipeline 5.13-19 Final EIS
FIGURE 5.13-2 Reported Cultural Resources within 1 Mile of the Proposed Project – Interior Region
.i
N...mb«2Gll
•
~ Intersects ROW
Within 1 mile,but beyond ROW
AHRS Trail
0Chena Hot Springs
f:\P!easant Valley0w-Two Rivers
orth Pole
EielsonAFB~rai Delta
t
Delta Junction ~bak"l 0
Fort Greely0 I<%-L"... Jt,
~. ~~a \
'J;o-;)
{""
Paxson
REPORTEDCULTURAL RESOURCES:
AHRS Site
• Within ROW
RS 2477 Trail
~ Intersects ROW
~ Within 1 mile,but beyond ROW
• The Hickel Highway and the Dunbar-Brooks ,..Tenninal trail are alsoAHRS trails.
AHRS data from ADNR, OHA2011.RS 2477 data from ADNR, IRMS 2006.
8e~~~;)
I
Alaska Stand Alone Gas PipelineRep0l1ed Cultural Resources within One Mile
of the Pr~~.~~,~~.~:.~!~,e:t:,.~~teriorRegion
aktuvuk Pass
"~'i,
~Bettles
Telida
LEGEND:
ASAPMainline
""-
Alatna ~Iakak
20
Slepht'll R Braund & AssociatesPO Box 1480
Anchorage,Alaska 99510(907) 276-8222 srba@a1aska net
M~es
H~ ?Community
o
This IrUpand a11<latacon,ain,d withiD o"'''.ppli<d.. is with no...,.,.."ty. CudllO E,NnlX. Inc. upr""T ,..clal .... respotlSlbllit)'brdom"ll" o<hoblhtyfrom:IDY claim.",.. ""1:1ris' o",oft}.,",.oem.."" oflbi.mop. 1,,.lIto ..1< =J'O=bibty ollho".«UI <lettrmlno,flhod.lla on this _p m..... lIto ....r'. no.ds. Tillsmap w.. not "...<0<1 ...tll'Wf <lata, lIOr .hould it b< used ..sud\. It Is tho ....,. re.pollSilKbty UI obtain p"'por 1W'V<y data,propattd 1»' 0 b..llStd ."....<yo<. ""'Or< "''lulred by la...
(

Alaska Stand Alone Gas Pipeline 5.13-20 Final EIS
5.13.2.3 Southcentral Region
Overview of Regional Prehistory (12,000 years ago to 1815 A.D.)
Much of Southcentral Alaska, including the entire upper Cook Inlet trough, was glaciated
repeatedly during the Quaternary Period – the most recent period of geologic time spanning
from three million years ago to the present. Multiple sub-periods of glacial growth occurred in
this period, with the Wisconsin era being the most recent. Before 12,000 years ago, the upper
Cook Inlet was alternately covered by thick glacial ice masses or the marine waters from the
North Pacific Ocean. Ice fields reaching up to 4,000 feet in depth covered the lowlands and
valleys between the mountains surrounding the lower Susitna River and Matanuska River
basins.
Early and Late Holocene
As the climate warmed, the ice sheets of the last ice age melted and the exposed lands were
covered with pioneer vegetation dominated by low shrubs and other tundra plants. Glaciers
continued to block the mountain passes ringing Cook Inlet until about 9,500 years ago, possibly
affecting human and animal passage between Southcentral and Interior Alaska. After that time
the mountain passes were ice free (Reger and Bundtzen 1990). The early prehistoric record of
human activity in Southcentral Alaska has been documented at few locations (Table 5.13-10).
Known sites include Beluga Point (ANC-00054) on Turnagain Arm (Reger 1996, 1998), sites in
the Kenai Mountains (Reger and Pipkin 1996), several sites in the Matanuska Canyon
(West 1996), and a series of sites along the upper Susitna River (Dixon et al.1985). These sites
evidence an early core and blade technology in which stone blades were struck from a core
material and later worked and retouched into finished form. There have been no Paleoindian
sites found in Southcentral Alaska with diagnostic type artifacts such as fluted points (chipped
tools notched near the base for hafting) and burins (stone tools with a characteristic flaked end
used for engraving).
People using early core-and-blade technology likely hunted land animals in the Southcentral
region. Elsewhere, core-and-blade technologies are found on the coast, probably the tools of
marine-mammal hunters. Analogous to other radiocarbon dated sites in Alaska, Southcentral
core-and-blade technologies date from 7,500 to 10,000 years ago (Reger 2003). The
interpretation of the period after these core-and-blade occupations is not clear, probably
because several different culture groups with various stone-tool technologies were in the area at
the same time. Some 4,000–5,000 years ago, notched stone points were used in the upper
Susitna River basin. Reger (2003) describes a ―distinctive, stemmed, chipped stone projectile
point and a high shoulder form of knife‖ from Beluga Point (ANC-00054) during this time. There
are no slate tools—ground, polished, or pecked—in the core-and-blade assemblages.

Alaska Stand Alone Gas Pipeline 5.13-21 Final EIS
TABLE 5.13-10 Sequence of Southcentral Archaeological Cultures
Tradition Date Finds Representative Sites
Euro-American 1780–Present Industrial manufactures, metal, glass, plastic. ARR, Iditarod Dog Mushing Landscape,
Matanuska Colony Farms, Independence
Mine, Sullivan’s Roadhouse
Chugach 800 BP–1780
AD, continues to
Present
Polished slate projectiles, knives, spear points.
Occurs contemporaneously with Dena’ina
materials.
Beluga Point
Athabascan 1,500 BP–1780
AD, continues to
Present
Lithics replaced by organic and copper tools.
Bow and arrow replaces atlatl.
House and cache pit sites, Ch’u’itnu
Archaeological District, Red Shirt Lake
Village
Kachemak 3,000–1,400 BP Grooved and notched pebble and cobble
weights, toggling harpoon points, ground slate
ulus, bone tools, cobble spall tools, adzes.
Yukon Island, Yukon Island Bluff, Yukon
Fox Farm, Yukon Island West Beach,
Cottonwood Creek, Merrill, Chugachik
Island
Arctic Small Tool
Tradition
4,000–3,000 BP Burins, gravers, unifaces, abraders, small
bifacial points, no ground slate.
Chugachik Island, Beluga Point North II
Late Ocean Bay 4,000–5,000 BP Ground slate lance heads and knives, flaked
projectile points, bifaces and unifaces,
retouched flakes, stone wedges and cores.
SEW-0214, Sylva site, Beluga Point South
I and North II
Late Mid-Holocene
(Northern Archaic-
like)
4,000–5,000 BP Side notched points, uniface, cobble chopper. SEW-0214, Beluga Point component
South III
Early Holocene
Core and Blade
10,000–5,000 BP Wedge shaped microblade cores, burins, end
scrapers, bifaces.
SEW-214, KEN-094, SEW-187, Long
Lake, Beluga Point
BP – Before Present (i.e., years ago)
Sources: Workman 1996, Clark 2001. Stephen R. Braund & Associates 2011.
Kachemak
Approximately 4,200 years ago, people with ground slate spear points and knives camped at
Beluga Point (ANC-00054) and probably in the Upper Yentna River Drainage (Dixon 1993,
Reger 1981). Kachemak Culture people with a marine-oriented harvest technology spread over
much of the Cook Inlet Basin during the period of 2,500- 1,000 years ago. The Kachemak
Culture was comprised of Eskimo people that originated in the Kodiak Archipelago and was
characterized by elaborate and distinctive burial practices, notched cylindrical stones, fishing
hooks, and other utilitarian items that allowed them to harvest from a marine environment
(Langdon 2002). Inland, the stratified Hewitt Lake (TAL-00049 and TAL-00050) site has a
Riverine Kachemak component in the lower levels, while upper levels contain later Dena’ina
components (Dixon 1996). Riverine Kachemak people relied on salmon harvests, as evidenced
by numerous small, notched pebble net sinkers. Ground slate was used for ulus (semi-lunate
knives) and spear points. Chipped stone arrow points are common in these assemblages
(Clark 2001). These people were likely hunters and gatherers who followed game and plant
resources with the seasons to support themselves.

Alaska Stand Alone Gas Pipeline 5.13-22 Final EIS
Dena’ina and Chugach
The Dena’ina, an Athabascan-speaking culture, occupied the Southcentral area approximately
1,500 years ago and were characterized by semi-subterranean houses, tools of primarily bone
and wood, and exploitation of both a marine and terrestrial subsistence environment
(Reger 2003). Occupation and use of Southcentral Alaska was not confined solely to Dena’ina
in the late prehistoric period. Levels at the Beluga Point (ANC-00054) site radiocarbon dated
from 600 to 800 years ago show a Chugach Eskimo occupation with characteristic ground slate
tools, polished adze bits, and stone scrapers left from repeated uses at this stopover locality
(Reger 1981). The interplay of occupations and a long tradition of orally recorded accounts of
both trade and conflict between the Dena’ina and various Eskimo descended groups of the
Alaska Peninsula, Kodiak Archipelago, Prince William Sound, and Kenai Peninsula are
recounted in several sources, including Kari and Fall (2003), Wrangell (1980), and Znamenski
(2003). In the Upper Susitna Valley is an interface between the upper Cook Inlet Dena’ina-
speakers and peoples who spoke Ahtna, Tanana, and Upper Kuskokwim languages. These
contacts took place through a number of well-traveled passes through the Alaska Range
Mountains (Kari and Kari 1982). The sequence of prehistoric to historic cultures is presented in
Table 5.13-10.
Overview of Regional History
Russian America, 1740 to 1867
Early interactions in the late 1700s between the Dena’ina, the Russians, and other European
groups were limited by the intense interest elsewhere in Alaska for sea otter pelts that were
traded to China in exchange for tea, spices, chinaware, cotton, and silk. There were few sea
otters in the Outer Cook Inlet and in Upper Cook Inlet when British explorers James Cook and
George Vancouver visited in the 1770s (Beaglehole 1967, Vancouver 1967). French, British,
Spanish, and American traders and explorers were encroaching on Russian territory by the
1790s. They traded for otter and other pelts both in the waters of the Pacific and inland, where
the Northwest Company, Hudson’s Bay Company, and other fur traders had trading posts.
With the sea otters depleted, the Russians began a period of otter management in their territory
to rebuild the population. This shifted their trading efforts to land furs, especially beaver, but
including mink, bear, river otter, moose, and caribou hides (Black 2004, Wrangell 1980). These
were traded within Alaska, with Russians serving as go-betweens for trade between Indians and
Eskimos, and with China and Britain. The Russian fur- trade companies designated local
residents in each village to serve as managers for trade, or ―toions,‖ who kept track of the pelts
stored for trade to the Russians and encouraged men to hunt for fur animals (Black 2004,
Solovjova and Vovnyanko 2002). The Dena’ina used their central geographic position and
network of trails to serve as middlemen traders between the Russians and the groups farther in
the interior, gathering relatively great wealth in a short time (De Laguna 1934, Osgood 1937,
Townsend 1981, Stafeev 1985).
From 1741 to 1838, Europeans inadvertently introduced the first of many epidemic diseases
that devastated Native populations throughout the Arctic (Fortuine 1992). Smallpox,
Alaska Stand Alone Gas Pipeline 5.13-23 Final EIS
tuberculosis, measles, mumps, chicken pox, influenza, and other diseases would flare up and
spread widely due to poor hygiene, wide travel, and winter crowding – killing perhaps more than
half of all Native people in Alaska in one epidemic that started in 1838. Subsequent periodic
epidemics caused numerous deaths and long-term debilitating illnesses, ameliorated in the
1840s with the first vaccines and in the 1940s with the introduction of antibiotics.
Early Settlement, 1867 to 1915
In 1867, the United States purchased Alaska from Russia. Under the Treaty of Cession, the
Dena’ina were to be treated as semi-settled peoples, equivalent to contemporary Indians
(Black 2004). However, during much of the early days of American administration there was no
direct supervision or provision for government, schools, or other services. The U.S. Army had
several small posts in Alaska, then the U.S. Navy administered the territory, and finally the
Revenue Cutter Service – precursor to the U.S. Coast Guard – conducted court and provided
medical care during cruises around the coast. Only after the first gold rushes in Canada, which
spilled over into Alaska, was a territorial government formed to record land claims for mineral
development (Bancroft 1886, Naske and Slotnick 1994).
The Gold Rush in the Klondike in 1898 was the first of several events that would change Alaska
from an isolated, ignored outpost to an organized territory with allure for hunters, adventurers,
and sportsmen. Government explorers like Herron (1901), Mendenhall (1900), Brooks (1911),
and Glenn (1900) were accompanied by private explorers, hunters, and mountain climbers like
Browne (1913), Hawthorne (McKeown 1951), and Studley (1911).
Gold prospecting created the next great influx of Euro-Americans into Upper Cook Inlet,
beginning with discoveries on the Kenai Peninsula and Turnagain areas in 1891 (Buzzell 1986).
Soon communities began to spring up to serve the provisioning needs of the Klondike and other
gold rushes taking place throughout Alaska. In some cases, existing trading posts filled this
need; in other cases, towns such as Knik (ANC-00036) and Susitna Station (TYO-00018) grew
up along Cook Inlet (Potter 1967). The community of Knik (ANC-00036) was the largest
settlement in the Matanuska-Susitna Valley in the 1890s. Knik (ANC-00036) served as a
transfer point for passengers and freight from ocean-going steamers to smaller vessels or for
overland travel. In response to the need for an overland route to connect Nome to the ―Outside‖
during the winter months, and in light of recent gold discoveries over 200 miles to the northwest
of Knik in interior Alaska’s Innoko District, the Army appointed Walter Goodwin to blaze a trail in
1908 from Seward through Cook Inlet at Knik and on to Nome (BLM 1986). After the discovery
of gold in 1909 in the Iditarod district, located just southwest of the Innoko district, this trail later
became known as the Iditarod Trail. Traffic along the trail increased; as many as 120 mushers
reportedly traveled through Knik in one week during November of 1911, bound for the interior
districts. By 1914, an overland mail route passed through Knik from Seward to Nome. The
establishment of Anchorage in 1915 as the Alaska Railroad construction headquarters and ship
anchorage spelled the end of Knik’s prosperity. By 1917, it was virtually abandoned
(Potter 1967).

Alaska Stand Alone Gas Pipeline 5.13-24 Final EIS
Establishing Government, 1915 to 1941
American government did not reach Upper Cook Inlet with any lasting authority until the 1915
establishment of Anchorage at the site of what was then known as Knik Anchorage at the mouth
of Ship Creek. From here, the farthest point of navigability for ocean-going ships in Knik Arm,
materials for construction of the Alaska Railroad were unloaded and barged to shore.
Connections were soon built to existing rail lines of the former Alaska Northern Railroad in
Turnagain Arm. The government, having purchased the failed private railroad to create the
Alaska Railroad system, reached the coal fields of the Matanuska Valley, the ice-free port at
Seward, and the interior river ports of Nenana and Fairbanks (Wilson 1977).
Increasing populations of European-Americans in the Upper Cook Inlet area made it
correspondingly difficult for the Dena’ina to maintain their traditional land use patterns, because
homesteaders, settlers, and farmers began to colonize the promising lands of the Susitna and
Matanuska valleys. Following the construction of the railroad, the Federal Government
subdivided lands for homesteads and farms, and, in the 1930s, began a New Deal-era program
to resettle farmers from Minnesota to the area as a poverty reduction effort (Miller 1975). The
1930s saw two ethnographic and archaeological surveys of the Dena’ina conducted by
Frederica De Laguna and Cornelius Osgood, with some observations by Aleš Hrdlička, who
traveled through Alaska several times studying the physical anthropology of its Native and
immigrant peoples (De Laguna 1934, 1996, Hrdlička 1943, Osgood 1937).
World War II and Statehood, 1941 to Present
The entry of the United States into World War II on December 7, 1941, caused far-reaching
consequences throughout the Alaska Territory. Before the war, the federal government
underestimated the Territory’s strategic importance. By the end of the war, after the Japanese
had attacked, occupied, bombed, and been routed from the Aleutian Islands, the federal
government better understood the Territory’s location and importance. Tens of thousands of
military personnel served in the Territory, dozens of airfields were built, the AlCan (Alaska)
Highway was constructed, and billions of dollars were spent on other civilian and military
projects (Bush 1984). Alaska officially became the 49th state on January 3, 1959.
After World War II, concerns about the USSR’s ability to attack the continental U.S. by flying
over Alaska and Canada led to a series of developments designed to defend against such an
occurrence. Early radar stations and communications systems were inadequate to defend this
frontier, so a system of Airborne Control and Warning stations was constructed with
headquarters in Anchorage. This developed into the Pine Tree and Distant Early Warning
systems, which communicated with Anchorage via the White Alice radio telephony system
(Denfeld 1994, 2001). Nike missile bases Summit, Point, and Tare were built on Mount Gordon
Lyon, at Point Woronzof, and Goose Bay - ringing Anchorage to provide defense against aerial
attack. The effect of this was a level of development in Anchorage that was similar to that
during World War II, as construction and support of Cold War defense installations blossomed
and continued through the 1990s (Fried and Windisch-Cole 2006).

Alaska Stand Alone Gas Pipeline 5.13-25 Final EIS
The hydrocarbon industry had major economic effects on Southcentral Alaska. Starting with the
1957 discovery of oil on the Kenai Peninsula, several major oil production companies built their
headquarters in Anchorage. Beluga, on the north shore of Cook Inlet, became a center for gas
production and power generation in the 1960s and 1970s. Construction of the Parks Highway in
1973 connected Anchorage to the Susitna Valley, Denali National Park, and ultimately to
Fairbanks. By the 1980s, Anchorage was the center of activity in the state of Alaska
(Tower 1999).
Previously Reported Cultural Resources in the Proposed Project Area – Southcentral
Region
There are 90 previously reported AHRS sites within 1 mile of the proposed Project area in the
Southcentral region; 6 AHRS sites are located within the proposed Project ROW (Figure 5.13-3,
Table 5.13-11). These sites are mostly from the historic time period, and only the Iditarod Dog
Sledding cultural landscape has been evaluated for inclusion on the NRHP and been
determined eligible. Sites that are located within the ROW include 4 roads/trails and one bridge.
Six RS 2477 trails are located within 1 mile of the proposed Project area (Table 5.13-12). The
Southcentral region has 33 AHRS properties with standing modern, historic, or protohistoric
eras listed (Table 5.13-13). These 33 include 3 Highway properties, 22 ARR properties, and 8
in the Other Historic Theme category. In the Southcentral region the Other Historic Theme
properties include a cemetery and a grave site with built elements, a barn, and a number of
cabins.
TABLE 5.13-11 Previously Reported AHRS Sites within the Proposed Project Area ROW – Southcentral Region
AHRS Site Name Period Site Description Preservation Status
TAL-00117 Petersville Road Historic Structure: Wagon road NDE
TYO-00084 Knik–Rainy Pass Trail [INHT-
PT]
Historic Site, Trail, INHT NDE
TYO-00110 Little Willow Creek Bridge Historic Structure, Bridge, Transportation, Road NDE
TYO-00170 Trail Site NDE
TYO-00184 Trail Site NDE
TYO-00203,
ANC-03326
Iditarod Dog Sledding Cultural
Landscape
Historic Network of historic dog mushing trails
and destinations
NRE
NDE – No Determination of Eligibility.
NRE – Determined Eligible.
Sources: ADNR, OHA 2011; ADNR, OHA 2010; Stephen R. Braund & Associates 2011.
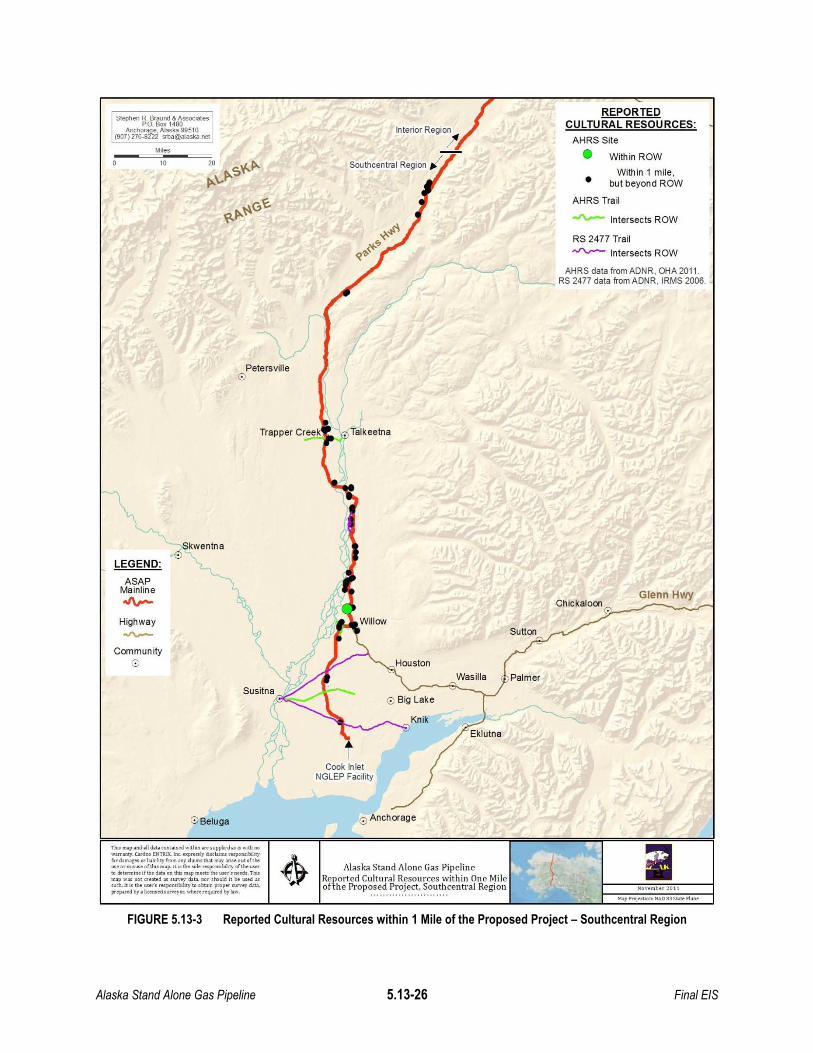
Alaska Stand Alone Gas Pipeline 5.13-26 Final EIS
FIGURE 5.13-3 Reported Cultural Resources within 1 Mile of the Proposed Project – Southcentral Region
~ Intersects ROW
Glenn Hwy
• Within 1 mile,but beyond ROW
AHRS Trail
RS 2477 Trail
...rv-- Intersects ROW
REPORTEDCULTURAL RESOURCES:
AHRS Site
• Within ROW
AHRS data fromAONR, OHA 2011.RS 2477 data fromAONR,lRMS 2006.
Chickaloon
Suttoo
PalmerWasilla
Cook InletNGlEP Facility
Petersvilleo
S1ephef1 R Braund & AssociatesPO Bo~ 1480
Anchorage, Alaska 99510(907) 276-8222 ~@a1aska net
M~es
"
LEGEND:
ASAPMainline
""-Highway
""Community
o
'\
~-
0Beluga o AnchOf'age
This m.>pand all datacontainedwilhill are cuppliedu II witllllC>
..arrOllly. can:llIO ENnlX, In<. upru.1y 'Iocl.uns ruponslbtlilybr<Um'l"c orl ..bihlyfromotDfdaim.tIl1t "'OJ' annollt.ftbt",uem""" oftbi.map. Iti.tIl• ..,1< =p<!=bilily oltbeus",to determln. If til< data on llllf m.>p tll.....r'ln..ds.TIuImap was no' a ..t<d as SUJ'\'<Y da lIOr s..uId it be used OJ
NeILl< Is til.....r'. rnpollSib,btj'lo obuin p"'per Nn'ey d.....pr.p....d b)'. ti"IlSeda~or.Ifb.... 'tqulted bylaw,
Alaska Stand Alone Gas PipelineReported Cultural Resources within One Mileofthe Proposed Project, Southcentral Region NH.mbu 1011
"'''I' ""'ion.. n, NAD Sl ~ta.. Pl.n"
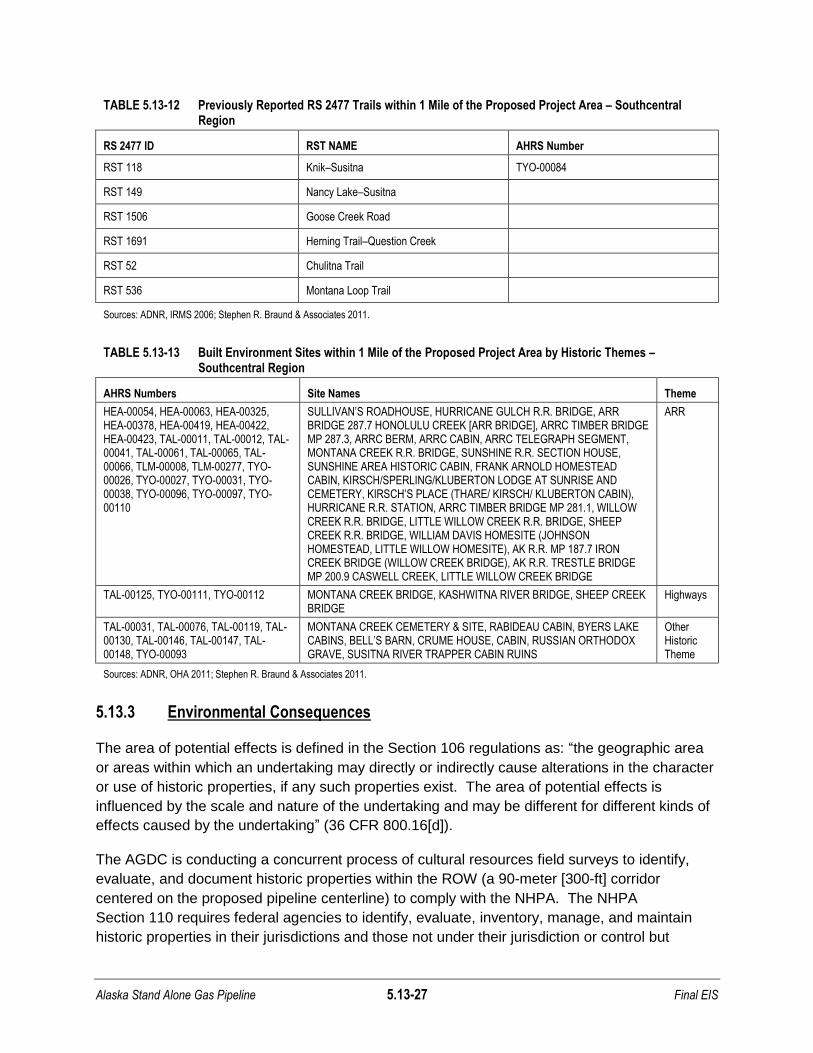
Alaska Stand Alone Gas Pipeline 5.13-27 Final EIS
TABLE 5.13-12 Previously Reported RS 2477 Trails within 1 Mile of the Proposed Project Area – Southcentral Region
RS 2477 ID RST NAME AHRS Number
RST 118 Knik–Susitna TYO-00084
RST 149 Nancy Lake–Susitna
RST 1506 Goose Creek Road
RST 1691 Herning Trail–Question Creek
RST 52 Chulitna Trail
RST 536 Montana Loop Trail
Sources: ADNR, IRMS 2006; Stephen R. Braund & Associates 2011.
TABLE 5.13-13 Built Environment Sites within 1 Mile of the Proposed Project Area by Historic Themes – Southcentral Region
AHRS Numbers Site Names Theme
HEA-00054, HEA-00063, HEA-00325, HEA-00378, HEA-00419, HEA-00422, HEA-00423, TAL-00011, TAL-00012, TAL-00041, TAL-00061, TAL-00065, TAL-00066, TLM-00008, TLM-00277, TYO-00026, TYO-00027, TYO-00031, TYO-00038, TYO-00096, TYO-00097, TYO-00110
SULLIVAN’S ROADHOUSE, HURRICANE GULCH R.R. BRIDGE, ARR BRIDGE 287.7 HONOLULU CREEK [ARR BRIDGE], ARRC TIMBER BRIDGE MP 287.3, ARRC BERM, ARRC CABIN, ARRC TELEGRAPH SEGMENT, MONTANA CREEK R.R. BRIDGE, SUNSHINE R.R. SECTION HOUSE, SUNSHINE AREA HISTORIC CABIN, FRANK ARNOLD HOMESTEAD CABIN, KIRSCH/SPERLING/KLUBERTON LODGE AT SUNRISE AND CEMETERY, KIRSCH’S PLACE (THARE/ KIRSCH/ KLUBERTON CABIN), HURRICANE R.R. STATION, ARRC TIMBER BRIDGE MP 281.1, WILLOW CREEK R.R. BRIDGE, LITTLE WILLOW CREEK R.R. BRIDGE, SHEEP CREEK R.R. BRIDGE, WILLIAM DAVIS HOMESITE (JOHNSON HOMESTEAD, LITTLE WILLOW HOMESITE), AK R.R. MP 187.7 IRON CREEK BRIDGE (WILLOW CREEK BRIDGE), AK R.R. TRESTLE BRIDGE MP 200.9 CASWELL CREEK, LITTLE WILLOW CREEK BRIDGE
ARR
TAL-00125, TYO-00111, TYO-00112 MONTANA CREEK BRIDGE, KASHWITNA RIVER BRIDGE, SHEEP CREEK BRIDGE
Highways
TAL-00031, TAL-00076, TAL-00119, TAL-00130, TAL-00146, TAL-00147, TAL-00148, TYO-00093
MONTANA CREEK CEMETERY & SITE, RABIDEAU CABIN, BYERS LAKE CABINS, BELL’S BARN, CRUME HOUSE, CABIN, RUSSIAN ORTHODOX GRAVE, SUSITNA RIVER TRAPPER CABIN RUINS
Other Historic Theme
Sources: ADNR, OHA 2011; Stephen R. Braund & Associates 2011.
5.13.3 Environmental Consequences
The area of potential effects is defined in the Section 106 regulations as: ―the geographic area
or areas within which an undertaking may directly or indirectly cause alterations in the character
or use of historic properties, if any such properties exist. The area of potential effects is
influenced by the scale and nature of the undertaking and may be different for different kinds of
effects caused by the undertaking‖ (36 CFR 800.16[d]).
The AGDC is conducting a concurrent process of cultural resources field surveys to identify,
evaluate, and document historic properties within the ROW (a 90-meter [300-ft] corridor
centered on the proposed pipeline centerline) to comply with the NHPA. The NHPA
Section 110 requires federal agencies to identify, evaluate, inventory, manage, and maintain
historic properties in their jurisdictions and those not under their jurisdiction or control but

Alaska Stand Alone Gas Pipeline 5.13-28 Final EIS
potentially affected by agency actions. Section 106 of the NHPA states that agency heads shall
take into account the effects of agency actions, including agency undertakings and non-agency
undertakings that require agency licenses to ―take into account the effects of the undertaking on
any district, site, building, structure, or object that is included in or eligible for inclusion in the
National Register.‖ Section 106 requires agency heads to seek comment on the effects of
undertakings from the Advisory Council on Historic Preservation, and Section 110 requires the
head of a federal agency to consult with federal, state, and local agencies, Indian tribes, Native
Hawaiian organizations, and the interested public in identifying, evaluating, and considering
effects of an undertaking upon historic properties.
An adverse effect to a cultural resource occurs when an undertaking may alter, directly or
indirectly, any of the characteristics of a cultural resource that could qualify the property for
inclusion in the NRHP in a manner that would diminish the property’s integrity (location, design,
setting, materials, workmanship, feeling, association), and/or association (i.e., association with
an important event or person [Criteria A and B], style of architecture [Criterion C], or information
potential [Criterion D]) thus rendering it ineligible for the NRHP.
For this analysis, direct effects are those that occur within the ROW and footprint of proposed
Project components (direct Area of Potential Effect [APE]). Examples of direct effects to cultural
resources from ongoing or proposed activities could include physical destruction of, or damage
to, all or part of the resource, removal of the resource from its original location, change of the
character of the resource’s use or of physical features within the resource’s setting that
contribute to its historic significance, change in access to traditional use sites by traditional
users, or loss of cultural identity with a resource.
Indirect effects to cultural resources include those impacts that result from the action later in
time or further removed in distance but still reasonably foreseeable. The geographic area within
which the proposed Project could indirectly alter the character or use of a cultural resource was
set at 1 mile (indirect APE) on either side of the ROW centerline. One mile broadly
encompasses the maximum extent for visual elements that have the potential to diminish the
integrity of a property’s significant historic features, particularly in areas of low vegetation and
flat topography. Other indirect alterations would typically have the potential to alter the
character or use of a cultural resource much closer to the ROW centerline than 1 mile. Such
indirect alterations could be caused by the introduction of vibration, noise, or atmospheric
elements, neglect of a property that causes its deterioration, transfer, lease, or sale out of
federal ownership without proper restrictions, vulnerability to erosion, and increased access to
and proximity of proposed Project components to culturally sensitive areas. Increased access
could result in a greater vulnerability of cultural resources to intentional and inadvertent damage
caused by the general public or by proposed Project personnel and equipment during
construction and operation. Changes to stream banks, flow patterns, and erosion
characteristics at stream crossings can cause erosion damage to cultural resource sites in the
vicinity of the stream and floodplain. These indirect and direct APEs may be modified following
consultation under the NEPA and the NHPA with interested parties, Alaska Native tribes, local
governments, and state and federal agencies.
Alaska Stand Alone Gas Pipeline 5.13-29 Final EIS
5.13.3.1 Assumptions
The following three assumptions governed the assessment of effects:
All cultural resources in the study area are assumed to be National Register eligible
unless otherwise specified;
If an aspect of the proposed Project would negatively affect any of the characteristics of
a cultural resource that qualify it or make it eligible for inclusion on the National Register
(e.g., diminish the integrity of the property’s location, design, setting, materials,
workmanship, feeling, or association), that would be an adverse effect. An adverse
effect could be direct or indirect; and
All unsurveyed areas of the proposed ROW could contain cultural resources eligible for
listing on the National Register, and surveyed areas could have buried archaeological
sites that are eligible but undiscovered.
5.13.3.2 No Action Alternative
No direct or indirect effects would occur to cultural resources within the ROW or within the
1-mile perimeter of the proposed Project area were the proposed Project not undertaken.
5.13.3.3 Proposed Action
Pipeline Facilities
Mainline
The construction ROW would be approximately 100 feet wide. For tundra, normal and rock
ditching approximately 40 feet of the ROW would be used for storing sediment from the 10-foot
wide pipeline excavation; on the opposite side of the excavation, 25 feet would be used for
ditching and pipelaying equipment and 25 feet for vehicles to deliver pipe and supplies.
Hillsides along the ROW would be built up with gravel for work pads and ROW preparation,
while others would be graded out of the slopes they cross and in some cases would have wider
ROW widths than those on flatter ground (AGDC 2011). The pipeline itself would be buried
6 feet below grade with the topsoil and spoils from the ditch stored on the opposite side from the
work pads, then replaced over the pipeline (e.g., Baker 2009: Attachment 2). Operation and
maintenance of the pipeline would include vegetation management, facilities security, and
pipeline maintenance and inspection activities. These activities would take place periodically,
with efforts to repair or prevent damage to the pipeline infrastructure as needed.
The following tables provide a summary of the number of previously reported cultural resource
sites that may be potentially affected by construction and operation of the proposed Project.
Table 5.13-14 shows the number of AHRS sites located within the proposed Project ROW
(direct APE) and 1 mile of the ROW (indirect APE). Table 5.13-15 provides a list of RS 2477
trails that would either be crossed by the proposed Project ROW (within direct APE) or
approach within 1 mile of the proposed Project (indirect APE).

Alaska Stand Alone Gas Pipeline 5.13-30 Final EIS
TABLE 5.13-14 AHRS Sites within the ROW and 1 Mile of Proposed Project Segments
Pipeline Segment
AHRS Sites within proposed Project
ROW AHRS Site Number within proposed Project ROWa
AHRS Sites within 1 Mile
Built Environment AHRS Sites within 1 Mile
GCF to MP 540 31 BET-00121, 00139, 00200, 00201, CHN-00025, 00070, FAI-02102, HEA-00014, 00015, 00062, 00091, 00448, 00449, LIV-00040, 00284, 00501, 00556, PSM-00172, 00186, 00188, 00192, 00476, 00534, 00570, SAG-00006, 00097, 00098, TAN-00118, WIS-00408, 00020, XBP-00114
531 87b,c
Fairbanks Lateral 0 35 14b
MP 540 to MP 555 0 9 3c
Denali National Park Route Variation
0 12 10c
MP 555 to End 8 ANC-03326, HEA-00450, TAL-00117, TYO-00084, 00110, 00170, 00184, 00203
118 45
a For AHRS site descriptions, refer to Table 5.13-2, 7, 11. b FAI-00095 included within 1 mile of Fairbanks Lateral and GCF to MP 540. c HEA-00306 and HEA-00075 included within 1 mile of GCF to MP 540, MP 540 to MP 555, and Denali National Park Route. Sources: ADNR, OHA 2011; Stephen R. Braund and Associates, 2011.
TABLE 5.13-15 RS 2477 Trails within the ROW and 1 Mile of Proposed Project Segments
Pipeline Segment
RS 2477 Crossed
By Proposed
Project ROW ID / Namea
RS 2477 within 1 Mile but
Not Crossed by Proposed
Project ROW ID / Namea
GCF to MP 540 15 RST 1595, 254, 262, 343,
345, 346, 412, 450, 468,
491, 591, 66, 70, 709, 9
8 RST 119, 152, 1611,
209, 264, 340, 344, 899
Fairbanks Lateral 4 RST 1595, 66, 70, 1602 1 RST 1824
MP 540 to MP 555 0 0
Denali National Park
Route Variation 0 0
MP 555 to End 4 RST 118, 149, 1506, 625 4 RST 1691, 52, 536, 707
a For RS 2477 trail descriptions, refer to Table 4, 7, 10.
Sources: ADNR, IRMS 2006; Stephen R. Braund and Associates, 2011.
Gas Conditioning Facility to MP 540
This section of the pipeline that would extend from the Prudhoe Bay GCF to MP 540 roughly
follows the TAPS route. For the GCF to MP 540 segment, there would be a total of 31 sites that
could potentially experience direct effects from the proposed Project construction and 531 sites
that fall within the area for potential indirect effects (Table 5.13-14). Fifteen RS 2477 trails
would be crossed by the proposed Project within this segment, and an additional 8 would be
within 1 mile, but not crossed (Table 5.13-15). Two TLUI sites would also be located within
1 mile of the proposed Project along this segment. There are 87 built environment AHRS sites
within 1 mile of this segment, encompassing ARR structures and roadbed from Dunbar to MP

Alaska Stand Alone Gas Pipeline 5.13-31 Final EIS
540; TAPS related elements; Gold Rush elements, including the Wiseman and Coldfoot
districts; Highway bridges; and other built elements related to other historic themes, such as fur
trapping and recreation.
Yukon River Crossing Options
Three options have been proposed for crossing the Yukon River: construct a new aerial
suspension bridge (the Applicant’s Preferred Option); utilize the existing E.L. Patton Bridge
(LIV-00455) (Option 2); or utilize horizontal directional drill (HDD) methods to cross underneath
the Yukon River (Option 3). The Applicant’s Preferred Option and Option 3 would not result in
impacts to cultural resources. Option 2 would directly involve a property (the E.L. Patton
Bridge) on the Dalton Highway that is listed as eligible for the National Register. The E.L.
Patton Bridge opened in October of 1975, and was named for a former Alyeska Pipeline Service
Company president. The bridge was designed to allow for a natural gas pipeline crossing in the
same structure where the TAPS line crosses the Yukon River (Magnus and Sun 2000). The
pipeline infrastructure would hang below the bridge surface and would not result in additional
impacts to known cultural resources, but could potentially impact previously unknown cultural
resources.
MP 540 to MP 555
This section of the proposed Project would diverge from the Parks Highway at pipeline MP 540
and continue southeast of the Nenana River, approximately parallel to an existing power line
ROW, crossing Lynx Creek, Montana Creek, and Yanert River en route to MP 555. There are
no previously reported sites or RS 2477 trails that could potentially experience direct effects
from the proposed Project construction along this pipeline segment (Table 5.13-14 and
Table 5.13-15). Nine previously reported sites fall within the area for potential indirect effects.
The Yanert Mouth Cabin (HEA-00302), Johnny Romanov Cabin (HEA-00306), and McKinley
Park Station (HEA-00075) are the only standing built AHRS sites along this route segment.
MP 555 to End
Construction would be conducted along the George Parks Highway ROW. The proposed route
leaves the Parks Highway ROW at MP 707 and proceeds south around the Nancy Lakes State
Recreation Area, along an elevated glacial feature, to arrive at the junction with the Beluga
Pipeline near the northernmost farm fields of the Point MacKenzie area. Much of this corridor
has never been surveyed for cultural resources beyond the small samples surveyed for the
proposed Project and other projects in the Point MacKenzie vicinity. For the MP 555 to End
segment, there are a total of 8 previously reported sites that could potentially experience direct
effects from the proposed Project construction and 118 sites that fall within the area for potential
indirect effects (Table 5.13-14). Four RS 2477 trails would be crossed by the proposed Project
within this segment, and an additional four would be within 1 mile, but not crossed
(Table 5.13-15). The Iditarod Dog Sledding Cultural Landscape (ANC-03326 and TYO-00203),
a historic district determined eligible for the NRHP, is also located in this region and extends
from the east bank of the Susitna River, east to Point MacKenzie and Knik, and north to the
Parks Highway, including Houston and the area just north of Willow. The cultural landscape
Alaska Stand Alone Gas Pipeline 5.13-32 Final EIS
consists of winter dog sledding trails and other properties related to the history of dog mushing
in the area. AHRS sites from the built environment include ARR structures, highway bridges,
and AHRS sites from other historic themes including fur trapping cabins and several cemeteries
or burials.
Construction
Direct Effects
The construction phase would be the most likely to disturb reported and undiscovered cultural
resource sites in the proposed Project ROW. Often the extent of reported archaeological sites
is poorly defined, and sites discovered before GPS systems were available are imprecisely
located (BLM 2002). Not all areas of the proposed Mainline have been surveyed for
archaeological, historic, or other categories of cultural resources. However, AGDC plans to
have the entire mainline surveyed prior to construction. Unanticipated site discovery may occur
as pipeline excavation penetrates surface sediments more deeply than archaeological testing
typically can achieve. A plan for procedures in the event of unanticipated discovery of cultural
material and human remains should be in place prior to proposed Project mobilization.
Placement of gravel for work pads and spoil and subsequent demobilization of gravel pads and
replacement of spoil could disturb or dislocate buried artifacts, features, and possibly human
remains. Operation of heavy equipment over wet tundra, water saturated soils or incompletely
frozen wet tundra, even with tundra mats, could cause displacement of buried archaeological
deposits. Historic built-environment resources and artifacts are generally more easily identified
and less likely to be damaged or disturbed during construction activities. Culturally modified
trees and elements of cultural landscapes associated with subsistence, trapping, and travel
across the landscape in prehistoric and historic periods may be damaged or removed. RS 2477
trails may be obstructed or rerouted around construction activity, adversely impacting their
historic integrity. Activity along the ROW and soil displacement may adversely affect cultural
landscapes and Traditional Cultural Properties (TCPs). Construction could block contributing
trails in the dog sledding landscape for the duration of construction operations. Built-
environment AHRS sites in close proximity are mainly ARR bridges; other built elements are
more than 1,000 feet from the ROW.
Indirect Effects
Increased human presence and activity on the ROW during the construction phase would likely
result in the location of reported, and previously undiscovered, cultural resource sites in and
along the ROW, which could result in a greater vulnerability of cultural resources to damage or
looting. Open cut crossings on streams may cause changes in stream banks, resulting in bank
cutting or channel infill, potentially exposing, eroding, or flooding cultural resource sites.
Operations and Maintenance
Direct Effects
Maintenance and operation of the pipeline ROW would result in a pathway ranging from 30-feet
wide on non-federal lands to 52 feet wide on federal lands covered with low, shallow rooted
Alaska Stand Alone Gas Pipeline 5.13-33 Final EIS
vegetation. This vegetation may be maintained with a variety of methods including herbicides,
manual vegetation management, and selective re-vegetation using native species selected for
their low-level growth and shallow root systems. Aboveground facilities are addressed under
specific sections below.
Contributing trails to the historic dog sledding landscape, including RS 2477 trails, may be
obstructed or rerouted by surface infrastructure, such as access control points and fences,
causing the trail to lose its historic integrity, although these effects are likely minimal and easily
mitigated due to the small footprint of aboveground facilities in the area. Additional traffic and
use of these trails may also result, as the pipeline ROW will be cleared of vegetation, and will
create additional access to a well-used recreational trail system with historic trail elements and
thus enhancing its value to the community. Product spills, modifications or changes to the
pipeline and possible future upgrades to the pipeline system could result in direct effects
through displacement of reported or undiscovered cultural resource sites.
Indirect Effects
Indirect effects would likely include increased access by the public to the ROW and adjacent
lands, which could result in a greater vulnerability of cultural resources to damage or looting.
Visual impacts to the landscape would include the linear feature of the cleared ROW, with
periodic indications of the presence of the pipeline where it surfaces, which may be intrusive to
a potential cultural landscape.
Fairbanks Lateral
The Fairbanks Lateral would connect the main stem of the pipeline near the former Dunbar ARR
station to Fairbanks along the ARR ROW, with a small section at Sheep Creek Road briefly
diverging from the ARR ROW. For the Fairbanks Lateral, there are no reported sites that could
potentially experience direct effects from the proposed Project construction and 35 sites that fall
within the area for potential indirect effects. Four RS 2477 trails would be crossed by the
proposed Project within this segment and 1 additional trail is within 1 mile, but not crossed.
There are 14 built-environment AHRS sites within 1 mile of the ROW, including ARR, Gold
Rush, and Highway related properties.
Construction
Direct Effects
Direct effects from construction of the Fairbanks Lateral would be the same as those described
above under ―Mainline.‖
Indirect Effects
Indirect effects from construction of the Fairbanks Lateral would be the same as those
described above under ―Mainline.‖

Alaska Stand Alone Gas Pipeline 5.13-34 Final EIS
Operations and Maintenance
Direct Effects
Direct effects from operations and maintenance of the Fairbanks Lateral would be the same as
those described above under ―Mainline.‖
Indirect Effects
Indirect effects from operations and maintenance of the Fairbanks Lateral would be the same as
those described above under ―Mainline.‖
Aboveground Facilities
Gas Conditioning Facility
Construction of the GCF would require a gravel pad covering approximately 70 acres of tundra
near existing facilities. No reported cultural resource sites are located within the proposed
construction footprint. Two sites are located within the area for potential indirect effects. The
monument built on the Prudhoe Bay Oil Field Discovery Well site (XBP-00056) is visible from
the proposed location.
Construction
Direct Effects
No reported cultural resource sites would be located within the proposed construction footprint.
Construction could affect undiscovered cultural resource sites in the GCF footprint.
Indirect Effects
An increased number of people would be active on the landscape at the time of construction,
increasing the likelihood that the two nearby cultural resource sites would be visited, discovered,
or damaged.
Operations and Maintenance
Direct Effects
No direct effects would be expected from operation and maintenance of the GCF.
Indirect Effects
No indirect effects would be expected from operation and maintenance of the GCF. The GCF
would represent a small, incremental addition to the existing array of facilities of similar
appearance and purpose in the Prudhoe Bay area and thus would not be an incompatible visual
and architectural element on the landscape.
Alaska Stand Alone Gas Pipeline 5.13-35 Final EIS
Compressor Stations
One to two additional compressor stations could be necessary. If one only is needed, it would
be located at MP 285.6, near the Prospect Camp. If two are needed they will be at MP 225.1,
north of Wiseman, and MP 458.1, at the straddle and off-take facility. Construction would
require 1.4acre parcels along the pipeline ROW and the placement of large equipment in a
modular structure. No reported cultural resource sites would be located within the proposed
construction footprints. Six previously documented sites are located within 1 mile of the
potential Wiseman compressor location and 1 site within 1 mile of the Prospect Camp
compressor station. Impacts from the potential compressor station located at the straddle and
off-take facility are discussed under the ―Straddle and Off-Take Facility‖ section.
Construction
Direct Effects
Construction could affect undiscovered cultural resource sites in the compressor station
footprint.
Indirect Effects
An increased number of people would be active on the landscape at the time of construction,
increasing the likelihood that nearby cultural resource sites would be visited, discovered, or
damaged.
Operations and Maintenance
Direct Effects
No direct effects would be expected from operation and maintenance of the compressor
stations.
Indirect Effects
Operation of the compressor stations would create noise and could present a visual adverse
effect in the rural environments they would occupy. Noise and activity near the potential
Wiseman compressor location could affect the integrity of the 6 cultural resources in that
vicinity. The structure housing the compressor and other equipment could be an incompatible
visual and architectural element on the landscape. Collocation of facilities with other facilities
would reduce the overall visual impact by concentrating those effects in one location.
Straddle and Off-Take Facility
The straddle and off-take facility would require a 3.3 acre pad. Two previously documented
sites are located within the footprint of the potential zone for the facility. The Dunbar Railroad
Station site (FAI-00008) and the Dunbar roadhouse site (FAI-00075) are located in this potential
footprint. The structures associated with these sites are alleged to have been removed by the
ARR (AES 2011).

Alaska Stand Alone Gas Pipeline 5.13-36 Final EIS
Construction
Direct Effects
Construction could affect the integrity of the two sites within the potential zone, as well as any
other undiscovered cultural resource sites in the straddle and off-take facility footprint.
Indirect Effects
An increased number of people would be active on the landscape at the time of construction,
increasing the likelihood that cultural resource sites would be visited, discovered, or damaged.
Operations and Maintenance
Direct Effects
No direct effects would be expected from operation and maintenance of the straddle and off-
take facility.
Indirect Effects
Operation of the straddle and off-take facility would create noise and could present a visual
adverse effect in its rural location. The structure housing the facility could be an incompatible
visual and architectural element with the nearby ARR station and roadhouse.
Cook Inlet Natural Gas Liquids Extraction Plant Facility
The NGLEP facility would require a 5.2 acre parcel at the terminus of the pipeline.
Construction
Direct Effects
No reported cultural resource sites would be located within 1 mile of the proposed construction
footprint. Construction could affect undiscovered cultural resource sites in the facility footprint.
Indirect Effects
An increased number of people would be active on the landscape at the time of construction,
increasing the likelihood that cultural resource sites would be visited, discovered, or damaged.
Operations and Maintenance
Direct Effects
No direct effects would be expected from operation and maintenance of the facility.
Indirect Effects
No indirect effects would be expected from operation and maintenance of the facility.
Alaska Stand Alone Gas Pipeline 5.13-37 Final EIS
Mainline Valves and Pig Launcher/Receivers
There would be up to 37 MLVs and 6 pig launcher and receiver stations along the pipeline, with
collocation where feasible with other aboveground facilities along the route.
Construction
Direct Effects
Construction could affect undiscovered cultural resource sites in the footprint of the valves and
receivers. Pig stations would be collocated with aboveground facilities where possible to reduce
the number of areas where direct effects could occur.
Indirect Effects
An increased number of people would be active on the landscape at the time of construction,
increasing the likelihood that cultural resource sites would be visited, discovered, or damaged.
Operations and Maintenance
Direct Effects
No direct effects would be expected from operation and maintenance of the MLVs and pig
launcher/receivers.
Indirect Effects
The appearance of the MLVs could be an incompatible visual and architectural element on the
landscape. The range of this impact would be reduced in forested areas of the ROW and
greatest on tundra landscapes. Collocation of pig stations with other aboveground facilities
should reduce the overall effects, as contrasted to placing them separately.
Access Roads
Access roads include temporary snow and ice roads and both temporary and permanent gravel
roads. Access roads would allow lowboy trailers with tracked construction vehicles and pipe,
buses, sport utility vehicles, and pickups. For this analysis, the width of the access roads was
assumed to be 100 feet. Only new access roads were included in the analysis.
Construction
Direct Effects
Construction activity could have an adverse effect on 11 reported cultural resources as well as
previously undiscovered cultural resource sites, or potential cultural landscapes and TCPs in
and adjacent to the proposed access roads. Of these 11 AHRS numbers, 6 are the Dalton
Highway itself (BET-002000, CHN-00070, LIV-00501, SAG-00097, and XBP-00114), 1 is a
railroad tunnel (Moody Tunnel, HEA-00076), one is a prehistoric archaeological site adjacent to
the ARR (Nenana Gorge Site, HEA-00062), 1 is a historic trail (Dunbar Trail, LIV-00556 and
FAI-02102), and 1 (LIV-00170), near the E.L. Patton Bridge across the Yukon River, has no

Alaska Stand Alone Gas Pipeline 5.13-38 Final EIS
information in the AHRS files. One RS 2477 trail, the Dunbar-Brooks Terminal segment of the
Dunbar Trail (FAI-02102), is crossed by access roads.
Indirect Effects
Runoff, erosion, and redeposition of sediment due to road construction activities could expose,
disturb, or bury evidence of cultural resources. Access to areas previously unsurveyed for
cultural resources would be increased as personnel built the access roads, increasing the
likelihood of inadvertent discovery and potential damage or looting.
Operations and Maintenance
Direct Effects
No direct effects are expected from operation and maintenance of the access roads.
Indirect Effects
Access roads, coupled with a cleared and maintained ROW, would create new networks of trails
for summer and winter users. Access pattern changes could redistribute the use of existing trail
networks such that cultural resources not previously accessible could be adversely affected.
Potentially these new access roads could increase access to 145 AHRS sites and 7 RS 2477
trails.
Support Facilities
Operations and Maintenance Buildings
Construction
Direct Effects
Support facilities would occur within the footprint of the GCF at Prudhoe Bay, the straddle and
off-take facility, and the Cook Inlet NGLEP Facility, and direct effects would be the same as
described above.
Indirect Effects
Support facilities would occur within the footprint of the GCF at Prudhoe Bay, the straddle and
off-take facility, and the Cook Inlet NGLEP Facility, and indirect effects would be the same as
described above.
Operations and Maintenance
Direct Effects
Support facilities would occur within the footprint of the GCF at Prudhoe Bay, the straddle and
off-take facility, and the Cook Inlet NGLEP Facility, and direct effects would be the same as
described above.
Alaska Stand Alone Gas Pipeline 5.13-39 Final EIS
Indirect Effects
Support facilities would occur within the footprint of the GCF at Prudhoe Bay, the straddle and
off-take facility, and the Cook Inlet NGLEP Facility, and indirect effects would be the same as
described above.
Construction Camps and Pipeline Yards
Construction
Direct Effects
Construction could affect undiscovered cultural resource sites in the footprint of the construction
camps and pipeline yards.
Indirect Effects
An increased number of people would be active on the landscape near the construction camps
and pipeline yards at the time of construction, increasing the likelihood that cultural resource
sites would be visited, discovered, or damaged.
Operations and Maintenance
Direct Effects
No direct effects would be anticipated, as the construction camps and pipeline yards would not
be used during operations and maintenance.
Indirect Effects
No indirect effects would be anticipated, as the construction camps and pipeline yards would not
be used during operations and maintenance.
Material Sites
An estimated 13,100,000 cubic yards of material may be required for proposed Project
construction. The proposed Project expects that the use of 546 existing material sites would be
sufficient to meet the proposed Project’s needs. A majority of these sites would be located
within 10 miles of the proposed Project.
Construction
Direct Effects
No direct effects would be expected from use of the material sites, because the proposed
Project is proposing to use only existing material sites. If new material sites are proposed,
construction could affect undiscovered cultural resource sites through site disturbance or
removal.

Alaska Stand Alone Gas Pipeline 5.13-40 Final EIS
Indirect Effects
An increased number of people would be active on the landscape near the material sites at the
time of construction, increasing the likelihood that cultural resource sites would be visited,
discovered, or damaged.
Operations and Maintenance
Direct Effects
No direct effects would be anticipated as the material sites would not be used during operations
and maintenance.
Indirect Effects
No indirect effects would be anticipated as the material sites would not be used during
operations and maintenance.
5.13.3.4 Denali National Park Route Variation
The Denali National Park Route Variation would be located along the Parks Highway east of the
McKinley Village area. For the Denali National Park Route Variation segment, there are no
reported sites that could potentially experience direct effects from the proposed Project
construction and 12 sites that fall within the area for potential indirect effects (Table 5.13-14).
No RS 2477 trails would be crossed by the proposed Project within this segment
(Table 5.13-15). Two cabins, 6 ARR structures, and 2 grave AHRS sites constitute the built
environment on this route segment-the graves may be associated with the ARR. The potential
for unanticipated discovery of archaeological deposits would be lower for this alternative than for
the corresponding MP 540 to MP 555 segment, as this alternative follows the Parks Highway,
which has already been previously disturbed.
Construction
Direct Effects
Direct effects from construction of the Denali National Park Route Variation would be the same
as those described above under ―Mainline.‖
Indirect Effects
Indirect effects from construction of the Denali National Park Route Variation would be the same
as those described above under ―Mainline.‖
Operations and Maintenance
Direct Effects
Direct effects from operations and maintenance of the Denali National Park Route Variation
would be the same as those described above under ―Mainline.‖

Alaska Stand Alone Gas Pipeline 5.13-41 Final EIS
Indirect Effects
Indirect effects from operations and maintenance of the Denali National Park Route Variation
would be the same as those described above under ―Mainline.‖
5.13.4 References
ADNR, IRMS. See Alaska Department of Natural Resources, Information Resource
Management Section.
ADNR, OHA. See Alaska Department of Natural Resources, Office History and Archaeology.
AES. See Arctic Slope Regional Corporation Energy Services.
Alaska Department of Natural Resources, Office History and Archaeology (ADNR, OHA). 2010.
Port MacKenzie Rail Line Extension. Letter to Victoria Rutson. Section of Environmental
Analysis, Surface Transportation Board.
Alaska Department of Natural Resources, Office History and Archaeology (ADNR, OHA). 2011.
Alaska Heritage Resource Survey. Database on file at Office of History and
Archaeology. Anchorage, Alaska.
Alaska Department of Natural Resources, Information Resource Management Section (ADNR,
IRMS). 2006. GIS Shapefile of RS 2477 Trails. Website:
(http://dnr.alaska.gov/SpatialUtility/SUC?cmd=vmd&layerid=35) accessed on
April 13, 2011.
Alaska Department of Transportation and Public Facilities (DOT&PF). 2010. Alaska Highway
System Roads Programmatic Agreement. ―Alaska Roads Treated as Eligible for the
National Register (11/30/10).‖
Alaska Railroad Corporation (ARR). 2010. Alaska Railroad History. Website:
(http://alaskarailroad.com/AboutARRC/ARRCHistory/tabid/453/Default.aspx).
Anderson, D. 1968. A Stone Age Campsite at the Gateway to America. Scientific American
218(6):24-33.
Anderson, D. 1970. Microblade Traditions in Northwest Alaska. Arctic Anthropology 7(2):2-15.
Arctic Slope Regional Corporation Energy Services (AES). 2010. 2010 Cultural Resources
Technical Report for the Alaska In-State Gas Pipeline Project. Prepared for State of
Alaska. April.
Arctic Slope Regional Corporation Energy Services (AES). 2011. Alaska Stand Alone Gas
Pipeline/ASAP. Cultural Resource Report for the 2010 Field Season. Prepared for
Alaska Gasline Development Corporation. March.

Alaska Stand Alone Gas Pipeline 5.13-42 Final EIS
Argonne National Laboratories. 2001. Defending Attack from the North: Alaska’s Aircraft
Control and Warning Radar System during the Cold War. Prepared by Argonne National
Laboratories in cooperation with the Alaska Office of History and Archaeology,
Anchorage, AK. Prepared for the Environmental Planning (Cultural Resources) unit,
611th Civil Engineer Squadron, Pacific Air Forces, U.S. Air Force. Anchorage, AK.
ARR. See Alaska Railroad Corporation.
Bancroft, H. 1886. History of Alaska, 1730-1885. San Francisco, California: A.L. Bancroft &
Company.
Beaglehole, J. (ed.). 1967. The Journals of Captain James Cook on his Voyages of Discovery,
Volume 3,Part 1: The Voyage of the Resolution and Discovery, 1776-1780. Cambridge:
The Hakluyt Society.
Bever, M. 2006. Rethinking the Putu Site: Results of a Spatial Analysis of a Fluted Point Site in
Northern Alaska. Arctic Anthropology Volume 43, No. 1, pages 20-39.
Black, L. 2004. Russians in Alaska 1732-1867. Fairbanks, Alaska: University of Alaska Press.
BLM. See U.S. Bureau of Land Management.
Bockstoce, J. 1978. History of Commercial Whaling in Arctic Alaska. Alaska Geographic
54:17-26.
Bockstoce, J. 1995. Whales, Ice and Men: The History of Whaling in the Western Arctic.
Seattle, Washington: University of Washington Press.
Bowers, P. 1982. The Lisburne Site: Analysis and Cultural History of a Multi-Component Lithic
Workshop in the Iteriak Valley, Arctic Foothills, Northern Alaska. Anthropological Papers
of the University of Alaska 20(1-2):79-112.
Bowers, P. 1999. AMS Dating of the Area 22 American Paleoarctic Tradition Microblade
Component at the Lisburne Site, Arctic Alaska. Current Research in the Pleistocene
16:12-14.
Brooks, A. 1911. The Mount McKinley Region, Alaska, with Descriptions of the Igneous Rocks
and of the Bonnifield and Kantishna Districts by L.M. Prindle. U.S. Geological Survey
Professional Paper 70, 234 p., 5 sheets, scale 1:250,000.
Brower, C. 1994. Fifty Years Below Zero: A Lifetime of Adventure in the Far North. University
of Alaska Press’ Classic Reprint Series, Volume 3. Fairbanks, Alaska: University of
Alaska Press.
Browne, B. 1913. The Conquest of Mount McKinley: The Story of Three Expeditions through
the Alaskan Wilderness to Mount McKinley, North America’s Highest and Most
Inaccessible Mountain. New York and London: G.P. Putnam’s Sons.

Alaska Stand Alone Gas Pipeline 5.13-43 Final EIS
Bush, N. 1984. The Alcan Saga, 1942-1943. Pp179-184 in Fern Chandonnet, Alaska At War,
1941-1945: The Forgotten War Remembered. University of Alaska Press,
Fairbanks, AK
Buzzell, R. 1986. Settlement Patterns of the Upper Kenai River Area since the American
Purchase of Alaska. In Holmes 1986: Supplemental Report: Sterling Highway
Archaeology, 1985-1986. Public Data File 86-35. Alaska Division of Geological and
Geophysical Surveys. Fairbanks, Alaska.
Chandonnet, F. (ed.). 2008. Alaska at War, 1941-1945: The Forgotten War Remembered.
Fairbanks, Alaska: University of Alaska Press. Originally published 1995 by the Alaska
At War Committee, Anchorage, AK. A Collection of Papers from the Alaska At War
Symposium, Anchorage, AK, November 11-13, 1993.
Clark, D. 2001. Ocean Bay. Pages 152-164 in Encyclopedia of Prehistory, Volume 2: Arctic
and Subarctic. Peter Peregrine and Melvin Ember, eds. New York, Boston, London,
Dordrecht, Moscow: Kluwer Academic/Plenum Press.
Collins, H. 1964. The Arctic and Subarctic. Pp. 85-114 in Prehistoric Man in the New World.
J.D. Jennings and E. Norbeck, eds. Chicago, Illinois: University of Chicago Press.
Dall, W. 1870. Alaska and Its Resources. Boston, Massachusetts: Lee and Shepard.
Website: (http://books.google.com/books?id=zMsQAAAAIAAJ&dq=Dall%20Yukon&pg=
PR1#v=onepage&q=Dall%20Yukon&f=true) accessed on May 18, 2011.
De Laguna, F. 1934. The Archaeology of Cook Inlet, Alaska. Philadelphia, Pennsylvania:
University of Pennsylvania Press. Reprinted 1975.
De Laguna, F. 1996. Cook Inlet Adventures and Afterthoughts: Alaska 1930. Pp. 65-88 in
Adventures Through Time: Readings in the Anthropology of Cook Inlet, Alaska.
Proceedings of a Symposium (N.Y. Davis and W.E. Davis, eds.). Cook Inlet Historical
Society. Anchorage, Alaska.
Denfeld, D. 1994. The Cold War in Alaska: A Management Plan for Cultural Resources, 1994-
1999. With contributions from J. Abel and D. Slaughter. U.S. Army Corps of Engineers,
Alaska District. Anchorage, Alaska.
Denfeld, D. 2001. The White Alice Communications System. U.S. Army Corps of Engineers,
Alaska District, April 2001.
Dixon, E. 1975. The Gallagher Flint Station, an Early Man Site on the North Slope, Arctic
Alaska and its Role in Relation to the Bering Land Bridge. Arctic Anthropology
12(1):68 75.
Dixon, E., ed. 1993. Quest for the Origins of the First Americans. Albuquerque, New Mexico:
University of New Mexico Press.

Alaska Stand Alone Gas Pipeline 5.13-44 Final EIS
Dixon, G. 1996. Tiq’atl’ena Bena (Hewitt Lake) Archaeological Research Project. Pp. 93-108
in Adventures Through Time: Readings in the Anthropology of Cook Inlet, Alaska.
Proceedings of a Symposium (N.Y. Davis and W.E. Davis, eds.) Cook Inlet Historical
Society. Anchorage, Alaska.
Dixon, E., Smith, Andrefsky, Saleeby, and Utermohle. 1985. Susitna Hydroelectric Project,
Cultural Resources Investigations 1979-1985. Draft Report. Alaska Power Authority.
Anchorage, Alaska.
Dolitsky, A. 2008. The Alaska-Siberia Lend Lease Program. In Chandonnet 2008 Alaska at
War, 1941-1945: The Forgotten War Remembered.
DOT&PF. See Alaska Department of Transportation and Public Facilities.
Dumond, D. 1987. The Eskimos and Aleuts. Revised Second Edition. London: Thames and
Hudson.
Ebbley, N. and H. Joesting. 1943. Report of Investigation of Petroleum Seepages, Arctic Slope
Area, Alaska. Report on investigations by the U.S. Bureau of Mines and the Territorial
department of Mines to the Department of the Interior. Unpublished ms.
Esdale, J. and J. Rasic. 2008. Current Perspectives on the Northern Archaic, papers from a
symposium. Arctic Anthropology, Volume 45, Number 2, 2008.
Ferguson, D. 1997. Revised Temporal Assessment of a Proposed Paleoarctic Site in the
Sagavanirktok Valley, Northern Alaska. Current Research in the Pleistocene 14:24-26.
Fitzhugh, B. 2003. The Evolution of Complex hunter Gatherers: Archaeological Evidence from
the North Pacific. Springer Verlag, Berlin
Fortuine, R. 1992. Chills and Fever: Health and Disease in the Early History of Alaska.
Fairbanks, Alaska: University of Alaska Press.
Fried, N. and B. Windisch-Cole. 2006. The Military is Big Business in Anchorage. Website:
(http://www.labor.state.ak.us/research/trends/jun06ind.pdf) accessed on April 25, 2011.
Gerlach, C. and E. Hall. 1988. The Later Prehistory of Northern Alaska: The View from Tukuto
Lake. Pp. 107-135 in the Late Prehistoric Development of Alaska’s Native People (R.D.
Shaw, R.K. Harritt and D.E. Dumond, eds.). Aurora No. IV. Anchorage, Alaska: Alaska
Anthropological Association.
Giddings, J. 1964. The Archaeology of Cape Denbigh. Providence, Rhode Island: Brown
University Press.
Giddings, J. and D. Anderson. 1986. Beach Ridge Archaeology of Cape Krusenstern: Eskimo
and Pre-Eskimo Settlements around Kotzebue Sound, Alaska. Publication in
Archaeology 20. Washington, D.C.: National Park Service.
Alaska Stand Alone Gas Pipeline 5.13-45 Final EIS
Glenn, E. 1900. Compilation of Narratives of Explorations in Alaska. U.S. Congress, Senate
Committee on Military Affairs. Washington, D.C.: U.S. Government Printing Office.
Glenn, E. and W. Abercrombie. 1899. Reports of Explorations in the Territory of Alaska (Cooks
Inlet, Sushitna, Copper, and Tanana Rivers) 1898, Made under the direction of the
Secretary of War. Washington, D.C.: U.S. Government Printing Office. Website:
(http://books.google.com/books?id=vYQUAAAAYAAJ&dq=Allen%20glenn%20matanusk
a%20alaska%201898&pg=PP7#v=onepage&q&f=true) accessed on May 18, 2011.
Haigh, J. 2008. Roadside Development along the Alaska Highway: The Impact of World War II
Military Construction on the Alaska Highway Corridor. Pp 189-194 in Chandonnet, Fern,
2007, Alaska at War, 1941-1945: The Forgotten War Remembered. Fairbanks, AK:
University of Alaska Press. Originally published 1995 by the Alaska At War Committee,
Anchorage, AK. A Collection of Papers from the Alaska at War Symposium, Anchorage,
AK, November 11-13, 1993.
Harritt, R. 1994. Eskimo Prehistory on the Seward Peninsula, Alaska. Resources Report
NPS/ARORCR/CRR-93/21. Anchorage, Alaska: National Park Service.
Haycox, S. 2009. Brief Economic History of Alaska. In Synthesis: Three Decades of Research
on Socioeconomic Effects Related to Offshore Petroleum Development in Coastal
Alaska edited by Stephen R. Braund and Jack Kruse, pp. 27-43. OCS Study MMS
2009-006. Funded by the U.S. Department of the Interior, Minerals Management
Service, Contract Number 1435-01-98-CT-30914, Alaska Region Environmental Studies
Program. Website: (http://alaska.boemre.gov/reports/2009rpts/2009_006/2009_006.pdf)
accessed March 3, 2011.
Herron, J. 1901. Explorations in Alaska, 1899. U.S. Adjutant General’s Office, Military
Information Division, Publication 31. Washington, D.C.: U.S. Government
Printing Office.
Holmes, C. 2001. Tanana River Valley Archaeology Circa 14,000 to 9,000 years BP. Arctic
Anthropology 38(2):154-170.
Holmes, C. 2008. The Taiga Period: Holocene Archaeology of the Northern Boreal Forest,
Alaska. Alaska Journal of Anthropology, Volume 6, Numbers 1 & 2, pp. 69-81.
Hrdlička, A. 1943. Alaska Diary, 1926-1931. The Jacques Cattell Press, Lancaster, PA.
Irving, W. 1964. Punyik Point and the Arctic Small Tool tradition. Ph.D. Dissertation, University
of Wisconsin Department of Anthropology. Ann Arbor: University Microfilms
Kari, J. and J. Fall. 2003. Shem Pete’s Alaska: The Territory of the Upper Cook Inlet Dena’ina.
Fairbanks, Alaska: University of Alaska Press.
Kari, J. and P. Kari. 1982. Tanaina Country=Dena’ina Ełnena. Jane McGary, ed. Fairbanks,
AK: Alaska Native Language Center, University of Alaska.
Alaska Stand Alone Gas Pipeline 5.13-46 Final EIS
Kunz, M. and R. Reanier. 1996. The Mesa Site, Iteriak Creek. In American Beginnings: The
Prehistory and Paleoecology of Beringia, F. West, ed. London: University of Chicago
Press.
Langdon, S. 2002. The Native People of Alaska. Traditional Living in a Northern Land. Fourth
Edition. Greatland Graphics. Anchorage, Alaska.
Leffingwell, E. 1919. The Canning River Region, Northern Alaska. U.S.G.S. Professional
Paper 109. Washington, D.C.: U.S. Government Printing Office.
Lobdell, J. 1985. The Putuligayuk River Delta Overlook Site: Fragile Traces of Ancient Man at
Prudhoe Bay, Beaufort Sea, Alaska, Second Edition. Anchorage, Alaska: ARCO Alaska,
Inc.
Lobdell, J. 1986. The Kuparuk Pingo Site: A Northern Archaic Hunting Camp of the Arctic
Coastal Plain, North Alaska. Arctic 39(1): 47-51.
Lobdell, J. 1995. North Alaska Pingos: Ephemeral Refugia in Prehistory. Arctic Anthropology,
32(1):62-81.
Lobdell, J. and G. Lobdell. 2000. 1999 NPR-A Exploration Program Archaeological and
Cultural Resources Reconnaissance, North Slope, Alaska. Anchorage, Alaska: BP
Exploration, Inc.
Mangus, A. and S. Sun. 2000. Orthotropic Deck Bridges. In Chen and Duan 2000, Bridge
Engineering Handbook, pp. 14-1-14-46.
Mason, O. and N. Bigelow. 2008. The Crucible of Early to Mid-Holocene Climate in Northern
Alaska: Does Northern Archaic Represent the People of the Spreading Forest? Arctic
Anthropology, 45(2): 39-70.
Matheson, J. and F. Haldeman. 1981. Historic Resources in the Fairbanks North Star Borough.
Report prepared for Fairbanks North Star Borough Planning Department. On file at the
Office of History and Archaeology: Anchorage, Alaska.
McFadyen-Clark, A. 1981. Koyukon. In Handbook of North American Indians, Volume 6:
Subarctic. Washington, D.C.: Smithsonian Institution.
McKennan, R. 1981. Tanana. In Handbook of North American Indians, Volume 6: Subarctic.
Washington, D.C. Smithsonian Institution.
McKeown, M. 1951. Alaska Silver, Another Mont Hawthorne Story. The MacMillan Company.
New York.
Mendenhall, W. 1900. A Reconnaissance from Resurrection Bay to the Tanana River, Alaska,
in 1898. U.S. Geological Survey Annual Report 20(7):265-340.

Alaska Stand Alone Gas Pipeline 5.13-47 Final EIS
Mercier, F. 1986. Recollections of the Youkon, Memoires from the years 1868-1885. Alaska
Historical Commission No. 188. The Alaska Historical Society, Anchorage
Miller, O. 1975. The Frontier in Alaska and the Matanuska Colony. Yale University Press, New
Haven and London.
Moodie, W., A. Catchpole and K. Abel. 1992. Northern Athapaskan Oral Traditions and the
White River Volcano. Ethnohistory, 39(2), Spring 1992.
Naske, C. 1986. Paving Alaska’s Trails: The Work of the Alaska Road Commission. Alaska
Historical Commission Studies in History No. 152. Lanham, MD: University Press of
America.
Naske, C. and H. Slotnick. 1994. Alaska: A History of the 49th State. Tulsa, Oklahoma:
University of Oklahoma Press.
National Preservation Institute. 2011. What are ―Cultural Resources‖? Website:
(http://npi.org/NEPA/whatare.html) accessed on May 16, 2011.
North Slope Borough, Iñupiat History, Language, and Culture. 2011. Traditional Land Use
Inventory (TLUI). Website: (http://nsb-ihlc.com/index.php?option=com_content&view=
article&id=146&Itemid=89) accessed on April 13, 2011.
Osgood, C. 1937. The Ethnography of the Tanaina. Yale University. Publications in
Anthropology, No. 16. New Haven: Yale University Press. Reprinted 1966.
Peregrine, P. and M. Ember. 2001. Encyclopedia of Prehistory, Volume 2: Arctic and
Subarctic. New York, Boston, Dordrecht, London and Moscow: Human Relations Area
Files, Inc. in association with Kluwer Academic/Plenum Press.
Peter Raboff, A. 2001. Inuksuk: Northern Koyukon, Gwich’in and Lower Tanana, 1800-1901.
Fairbanks, Alaska: Alaska Native Knowledge Network.
Potter, L. 1967. Old Times on Upper Cook’s Inlet. Anchorage: The Book Cache.
Price, K. 2004. The World War II Heritage of Ladd Field, Fairbanks, Alaska. Center for the
Environmental Management of Military Lands (CEMML) Technical Paper Series 04-07.
Conservation Branch Directorate of Public Works, U.S. Army Garrison Alaska. Fort
Collins, CO and Fort Wainwright, AK.
Reanier, R. 1995. The Antiquity of Paleoindian Materials in Northern Alaska. Arctic
Anthropology, 32(1):31-50.
Reanier, R. 1996. Putu and Bedwell. In American Beginnings: The Prehistory and
Paleoecology of Beringia (F. West, ed.). London: University of Chicago Press.
Reanier, R. 1997. Regional Cultural History and Prehistoric Sites 10,000 B.C. to 1,500 A.D. In
NPR-A Symposium Proceedings: Traditional Knowledge and the Resources of the
Alaska Stand Alone Gas Pipeline 5.13-48 Final EIS
Northeast Planning Area of the National Petroleum Reserve-Alaska. OCS Report, MMS
97-0013. USDOI, MMS, Alaska OCS Region. Anchorage, Alaska.
Reanier, R. 2002. Archaeological and Cultural Resources Reconnaissance in the Phillips
Alaska Exploration Area, National Petroleum Reserve, Alaska, for the Year 2001. For
PHILLIPS Alaska, Inc.
Reed, J. 1958. Exploration of Naval Petroleum Reserve No. 4 and Adjacent Areas, Northern
Alaska, 1944-1953 Part 1, History of the Exploration. U.S. Geological Survey
Professional Paper 301. Prepared and published at the request of and in cooperation
with the U.S. Department of the Navy, Office of Naval Petroleum and Oil Shale
Reserves. Washington, D.C.: U.S. Government Printing Office.
Reeves, M. 2009. Alaska Gold: The History of Gold Dredge Number Eight. Gold Fever Press,
Fairbanks, AK
Reger, D. 1981. A Model for Culture History in Upper Cook Inlet, Alaska. Ph. D. Dissertation.
Washington State University, Department of Anthropology. University Microfilms. Ann
Arbor, Michigan.
Reger, D. 1996. Beluga Point. In American Beginnings: the Prehistory and Paleoecology of
Beringia (F. Hadleigh-West, ed.) Chicago, Illinois: University of Chicago Press.
Reger, D. 1998. Archaeology of the Northern Kenai Peninsula and Upper Cook Inlet. Arctic
Anthropology, 35(1):160-171.
Reger, D. 2003. Upper Cook Inlet Prehistory: the Archaeological Evidence. In Shem Pete’s
Alaska: The Territory of the Upper Cook Inlet Dena’ina, Second Edition. (J. Kari and J.
Fall, eds.). Fairbanks, Alaska: University of Alaska Press.
Reger, D. and M. Pipkin. 1996. Round Mountain Microblade Locality. In American Beginnings:
the Prehistory and Paleoecology of Beringia (F. Hadleigh-West, ed.) Chicago, Illinois:
University of Chicago Press.
Reger, R. and T. Bundtzen. 1990. Multiple Glaciation and Gold Placer Formation, Valdez
Creek Valley, Western Clearwater Mountains, Alaska. Professional Report 107. Alaska
Division of Geological and Geophysical Surveys. Fairbanks, Alaska.
Roderick, J. 1997. Crude Dreams: A Personal History of Oil and Politics in Alaska. Anchorage,
AK: Epicenter Press.
Schneider, W. and D. Libbey. 1979. Historic Context of Life on the North Slope. In Native
Livelihood and Dependence: A Study of Land Use Values Through Time. North Slope
Borough Contract Staff. U.S. Department of the Interior, National Petroleum Reserve in
Alaska. Anchorage, Alaska.
Alaska Stand Alone Gas Pipeline 5.13-49 Final EIS
Schoenberg, K. 1995. The Post-Paleoarctic Interval in the Central Brooks Range. Arctic
Anthropology, 32(1):51-61.
Schwatka, Lt. F. 1885a. Report of a Military Reconnaissance in Alaska, Made in 1883.
Washington, D.C.: U.S. government Printing Office. Website: (http://books.google.com/
books?id=kLNJAc8wr4oC&dq=Schwatka%20Frederick%201883&pg=PP3#v=onepage&
q&f=false) accessed on May 18, 2011.
Schwatka, Lt. F. 1885b. Along Alaska’s Great River: A Popular Account of the Travels of the
Alaska Exploring Expedition of 1883, along the Great Yukon River, from its Source to its
Mouth, in the British North-West Territory’ and in the Territory of Alaska. New York:
Cassell & Company, Limited. Website: (http://books.google.com/books?id=
RigAAAAAQAAJ&ots=ObgStRVJqs&dq=Schwatka%20Frederick%201883&pg=PP5#v=
onepage&q&f=true) accessed on May 18, 2011.
Schwatka, Lt. F. 1891. A Summer in Alaska: A Popular Account of the Travels of an Alaska
Exploring Expedition along the Great Yukon River, from its Source to its Mouth, in the
British North-West territory, and in the Territory of Alaska. Philadelphia, Pennsylvania:
John Y. Huber Company. Website: (http://books.google.com/books?id=FtFYAAA
AMAAJ&dq=Schwatka%20Frederick%201883&pg=PA1#v=onepage&q&f=true)
accessed on May 18, 2011.
Schwatka, Lt. F. 1892. Nimrod in the North, or Hunting and Fishing Adventures in the Arctic
Regions. New York: Cassell & Company, Limited. Website: (http://books.google.com/
books?id=5nkvAAAAYAAJ&dq=Schwatka%20Frederick%201883&pg=PA7#v=onepage
&q=Schwatka%20Frederick%201883&f=true) accessed on May 18, 2011.
Seeber, C. 1889. Letter of August 25, 1888. In Investigation of the Fur Seal and other
Fisheries of Alaska: Report from the Committee on Merchant Marine and Fisheries of
the House of Representatives. 50th Congress, 2nd Session, House of Representatives
Report No. 3883. Washington, D.C.: U.S. Government Printing Office.
Sheehan, G. 1997. Overview of Late Prehistoric Sites and Culture. A paper presented at The
NPR-A Symposium: Science, Traditional Knowledge, and the Resources of the National
Petroleum Reserve in Alaska, Anchorage, Alaska, April 16-18, 1997. USDOI BLM and
MMS, Alaska OCS Region. Anchorage, Alaska.
Smith, P. and J. Mertie. 1930. Geology and Mineral Resources of Northwestern Alaska. U.S.
Geological Survey Bulletin 815. Washington, D.C.: U.S. Government Printing Office.
Smith, P., J. Mertie and W. Foran. 1926. Summary of recent surveys in northern Alaska. In
Mineral Resources of Alaska: Report on Progress of Investigations in 1924, U.S.
Geological Survey Bulletin 183. Washington, D.C.: U.S. Government Printing Office.

Alaska Stand Alone Gas Pipeline 5.13-50 Final EIS
Solovjova, K. and A. Vovnyanko. 2002. The Fur Rush: Essays and Documents on the History
of Alaska at the End of the Eighteenth Century. Translated by Richard L. Bland and
Katya S. Wessels. Anchorage, Alaska: Pheniks Press.
Stafeev, V. 1985. The Writings of the Russian Trader Vladimir Stafeev. Translated from
Russian by Julie W. deSherbinin from Original Manuscripts at the Alaska Historical
Library, Juneau. Fairbanks, Alaska: Division of Geological and Geophysical Surveys.
Stephen R. Braund & Associates. 2011. Archaeological Field Survey and Identification and
Evaluation of Buildings and Structures for the National Register of Historic Places.
March.
Studley, J. 1911. The Journal of a Sporting Nomad. John Lane Company, New York, and
John Lane, The Bodley Head, London
Tower, E. 1999. Anchorage: From its Humble Origins as a Railroad Construction Camp.
Fairbanks, AK: Epicenter Press.
Townsend, J. 1981. Tanaina. In Helm, J., ed. Handbook of North American Indians. Vol. 6:
Subarctic. Washington: Smithsonian Institution. Pgs. 623-640.
U.S. Army Corps of Engineers (USACE). 2001. USACE Alaska District. The White Alice
Communications System. Fort Richardson, Alaska.
U.S. Bureau of Land Management (BLM). 1986. The Iditarod National Historic Trail, Seward to
Nome Route. A Comprehensive Management Plan. U.S. Dept. of the Interior, Bureau
of Land Management. Anchorage, Alaska.
U.S. Bureau of Land Management (BLM). 2002. Final Environmental Impact Statement
Renewal of the Federal Grant for the Trans-Alaska Pipeline System Right-of-Way.
Website: (http://www.tapseis.anl.gov/documents/eis/index.cfm) accessed April 2011.
U.S. Geological Survey (USGS). 1899. Maps and Descriptions of Routes of Exploration in
Alaska in 1898, with General Information Concerning the Territory (Ten Maps in
Accompanying Envelope). United States Geological Survey Engraving and Printing
Division, Washington, D.C.
USGS. See U.S. Geological Survey.
Vancouver, G. 1967. A Voyage of Discovery to the North Pacific Ocean in the Years 1790-
1795, Volume 3. New York: Da Capo Press.
VanStone, J. 1974. Athapaskan Adaptations: Hunters and Fishermen of the Subarctic Forests.
Chicago, Illinois: Aldine Publishing Company.
VanStone, J. 1979. Ingalik Contac Ecology: An Ethnohistory of the Lower-Middle Yukon, 1790-
1935. Chicago: Field Museum of Natural History.

Alaska Stand Alone Gas Pipeline 5.13-51 Final EIS
West, F. (ed.). 1996. American Beginnings: The Prehistory and Paleoecology of Beringia.
New York and London: University of Chicago Press.
Whorton, M. 2002. Evaluating and managing Cold War era historic properties: The cultural
significance of US Air Force defensive radar systems. In Matériel Culture: The
Archaeology of Twentieth Century Conflict. Edited by John Schofield, William Gray
Johnson and Colleen M. Beck. One World Archaeology Volume 44, Executive Editor
Peter Stone. London and New York: Routledge.
Whymper, F. 1868. Travel and Adventure in the Territory of Alaska, Formerly Russian America
Now Ceded to the United States-And in Various Other Parts of the North Pacific.
London: John Murray. Website: (http://books.google.com/books?id=J3oFAAAAQAAJ&
dq=Whymper%20Yukon&pg=PP1#v=onepage&q=Whymper%20Yukon&f=false)
accessed on May 18, 2011.
Wilson, W. 1977. Railroad in the Clouds: The Alaska Railroad in the Age of Steam, 1914-1945.
Boulder, CO: Pruett Publishing Company.
Workman, W. 1996. Human Colonizations of the Cook Inlet Basin Before 3,000 Years Ago. In
Adventures Through Time: Readings in the Anthropology of Cook Inlet, Alaska.
Proceedings of a Symposium. (N.Y. Davis and W.E. Davis, eds.) Anchorage, Alaska:
Cook Inlet Historical Society.
Wrangell, F. 1980. Russian America: Statistical and Ethnographic Information. Translated
from the German edition of 1839 by Mary Sadouski. (R.A. Pierce, ed.) Kingston,
Ontario: The Limestone Press.
Yarborough, M. 2000. Archaeological Reconnaissance Surveys of Portions of the Pogo Claims
Project Area. Prepared for Teck Resources, Inc., Fairbanks. Cultural Resource
Consultants, Anchorage, Alaska.
Zagoskin, L. 1967. Lieutenant Zagoskin’s Travels in Russian America, 1842-1844. Edited by
Henry N. Michael. Arctic Institution of North America, Anthropology of the North:
Translations from Russian Sources No. 7. Toronto, ON: Arctic Institute of North
America, University of Toronto Press.
Znamenski, A. 2003. Through Orthodox Eyes: Russian Missionary Narratives of Travels to the
Dena’ina and Ahtna, 1850s-1930s. Rasmuson Library Historical Translation Series
Number 13. Fairbanks, AK: University of Alaska Press.

Alaska Stand Alone Gas Pipeline 5.13-52 Final EIS
This page intentionally left blank.
Alaska Stand Alone Gas Pipeline
5.14 SUBSISTENCE
.. Finai EIS
Alaska Stand Alone Gas Pipeline 5.14-1 Final EIS
5.14 SUBSISTENCE
Subsistence uses are central to the customs and traditions of many cultural groups in Alaska,
including the North Slope Iñupiat and Athabascans of Interior and Southcentral Alaska.
Subsistence customs and traditions encompass processing, sharing, redistribution networks,
and cooperative and individual hunting, fishing, and ceremonial activities. Both federal and
state regulations define subsistence uses to include the customary and traditional uses of wild
renewable resources for food, shelter, fuel, clothing, and other uses (Alaska National Interest
Lands Conservation Act [ANILCA], Title VIII, Section 803, and Alaska Statute [AS]
16.05.940[33]). The Alaska Federation of Natives (AFN) not only views subsistence as the
traditional hunting, fishing, and gathering of wild resources, but also recognizes the spiritual and
cultural importance of subsistence in forming Native peoples‟ worldview and maintaining ties to
their ancient cultures (Alaska Federation of Natives 2005).
Subsistence fishing and hunting are traditional activities that help transmit cultural knowledge
between generations, maintain the connection of people to their land and environment, and
support healthy diet and nutrition in almost all rural communities in Alaska. The Alaska
Department of Fish and Game (ADF&G) estimates that the annual wild food harvest in rural
areas of Southcentral Alaska is approximately 1.7 million pounds, or 153 pounds per person per
year. In the Interior area of Alaska annual wild food harvest is approximately 6.4 million pounds,
or 613 pounds per person per year. The annual wild food harvest in the Arctic area of Alaska
(home to the North Slope Iñupiat) is approximately 10.5 million pounds or 516 pounds per
person per year (Wolfe 2000). Subsistence harvest levels vary widely from one community to
the next. Sharing of subsistence foods is common in rural Alaska and can exceed 80 percent of
households giving or receiving resources (ADF&G 2001). The term “harvest” and its variants –
harvesters and harvested – are used as the inclusive term to characterize the broad spectrum of
subsistence activities, including hunting, fishing, and gathering.
Subsistence is part of a rural economic system called a “mixed, subsistence-market” economy,
wherein families invest money into small-scale, efficient technologies to harvest wild foods
(Wolfe 2000). According to Wolfe and Walker (1985), fishing and hunting for subsistence
resources provide a reliable economic base for many rural regions and these important activities
are conducted by domestic family groups who have invested in fish wheels, gill nets, motorized
skiffs, and snow machines. Subsistence is not oriented toward sales, profits, or capital
accumulation (commercial market production), but is focused toward meeting the self-limiting
needs of families and small communities. Participants in this mixed economy in rural Alaska
augment their subsistence production by cash employment. Cash (from commercial fishing,
trapping, and/or wages from public sector employment, construction, firefighting, oil and gas
industry, or other services) provides the means to purchase the equipment, supplies, and gas
used in subsistence activities. The combination of subsistence and commercial-wage activities
provides the economic basis for the way of life so highly valued in rural communities
(Wolfe and Walker 1985). As one North Slope hunter observed, “The best mix is half and half.
If it was all subsistence, then we would have no money for snow machines and ammunition. If it

Alaska Stand Alone Gas Pipeline 5.14-2 Final EIS
was all work, we would have no Native foods. Both work well together” (Alaska Consultants Inc.
and Stephen R. Braund & Associates [SRB&A] 1984).
Participation in subsistence activities promotes transmission of traditional knowledge from
generation to generation and serves to maintain people‟s connection to the physical and
biological environment. The subsistence way of life encompasses cultural values such as
sharing, respect for elders, respect for the environment, hard work, and humility. In addition to
being culturally important, subsistence is a source of nutrition for residents in an area of Alaska
where food prices are high. While some people earn income from employment, these and other
residents rely on subsistence to supplement their diets throughout the year. Furthermore,
subsistence activities support a healthy diet and contribute to residents‟ overall well-being.
5.14.1 Regulatory Environment
Alaska and the federal government regulate subsistence hunting and fishing in the state under a
dual management system. The federal government recognizes subsistence priorities for rural
residents on federal public lands, while Alaska considers all residents to have an equal right to
participate in subsistence hunting and fishing when resource abundance and harvestable
surpluses are sufficient to meet the demand for all subsistence and other uses. Much of the
land traversed by the proposed Project is owned and managed by the state and federal
governments, including the Alaska Department of Natural Resources (ADNR), the U.S.
Department of the Interior (DOI) Bureau of Land Management (BLM) and U.S. Department of
Defense (DOD). Portions of the GCF to Mile Post (MP) 540 segment would be located in the
vicinity of, but would not intersect, lands managed by the U.S. Fish & Wildlife Service (USFWS)
and the National Park Service (NPS).
5.14.1.1 Federal Regulations
The U.S. Congress adopted ANILCA recognizing that “the situation in Alaska is unique”
regarding food supplies and subsistence practices. The Act specifies that any decision to
withdraw, reserve, lease, or permit the use, occupancy, or disposition of public lands must
evaluate the effects of such decisions on subsistence use and needs (16 United States Code
[U.S.C] 3111-3126). In 1990, the USDOI and the U.S. Department of Agriculture established a
Federal Subsistence Board to administer the Federal Subsistence Management Program
(55 Federal Register [FR] 27114). The Federal Subsistence Board, under Title VIII of ANILCA
and regulations at 36 CFR 242.1 and 50 CFR 100.1, recognizes and regulates subsistence
practices for rural residents on federal lands. Federal regulations recognize subsistence
activities based on a person‟s residence in Alaska, defined as either rural or non-rural. Only
individuals who permanently reside outside federally designated non-rural areas are considered
rural residents and qualify for subsistence harvesting on federal lands under federal subsistence
regulations. However, federal subsistence regulations do not apply to certain federal lands,
regardless of residents‟ rural designations. These include lands withdrawn for military use that
are closed to general public access (50 CFR Part 100.3). Non-rural areas are depicted on
Figure 5.14-1.

Alaska Stand Alone Gas Pipeline 5.14-3 Final EIS
FIGURE 5.14-1 Federally Designated Non-rural Areas
Nuiqsut •
ARCTICKaktovik
oOCEAN
"'"'"
Stephen R. Braund & AssoclaotesPO Box 1480
Ar>chorage, Alaska 995tO(907) 276.8222 [email protected]
WRANGELMTNS
ALASKA
koil".\\\'
~ ---..
'"J 0,...
~
I'R/.\,CEWILLIAMSOl..'.\'D
eaver
GULF OF
Seward
BelUg~
Tyonek
~Fenai~",
~~<.,~ Homer
•
Houston-----~....Big Lake
Knik
AnaktuvukPass 0
BROoKS
BettlesA1atna
1t.i~~~
j
Kenai *
III
Highway..-..--
Valdez *
III
INasilla-Palmer
Homer *
III*non·study communities·
LEGEND:
ASAP FederalMainline Land
..IV--
Federal Nonrural Areas
Study 0Community
Anchorage
M
Fairbanks
M
Seward *
'III
TllI.""'po.nd .. d."'''''' ...,..dwltill".'"."ppll.........~."''......n'>', (ani"" ENnux, rn~ • .,..,...Iy d;.doim. ,.,p<m,IMltyf<>r <!.om..,. or h.b<llty f""" any <I.;m, 'hot may >ri.. "'" 01 the..... "'1.... 01' ""'1'. l'Ulhotolo'ospo.ulbllltyof<l1......to d".",,; .. 11th, d on 'h', mop m.... ,ho _ .....«d. This......... no< , ~ <yd.ota, n.. >ho<old "h,nO«! .."'ch,11 I. t1t (."'po<l.lbUll)'l<I"",..lnp,.,."., ... rvoyda,.."'.....-..l by. II...n....."'l'Oyoo-, w"""''"'lol,od bj'l>w
Alaska Stand Alone Gas Pipeline
Federally Designated Nonrural Areas
(Scale 1:5,300,000)
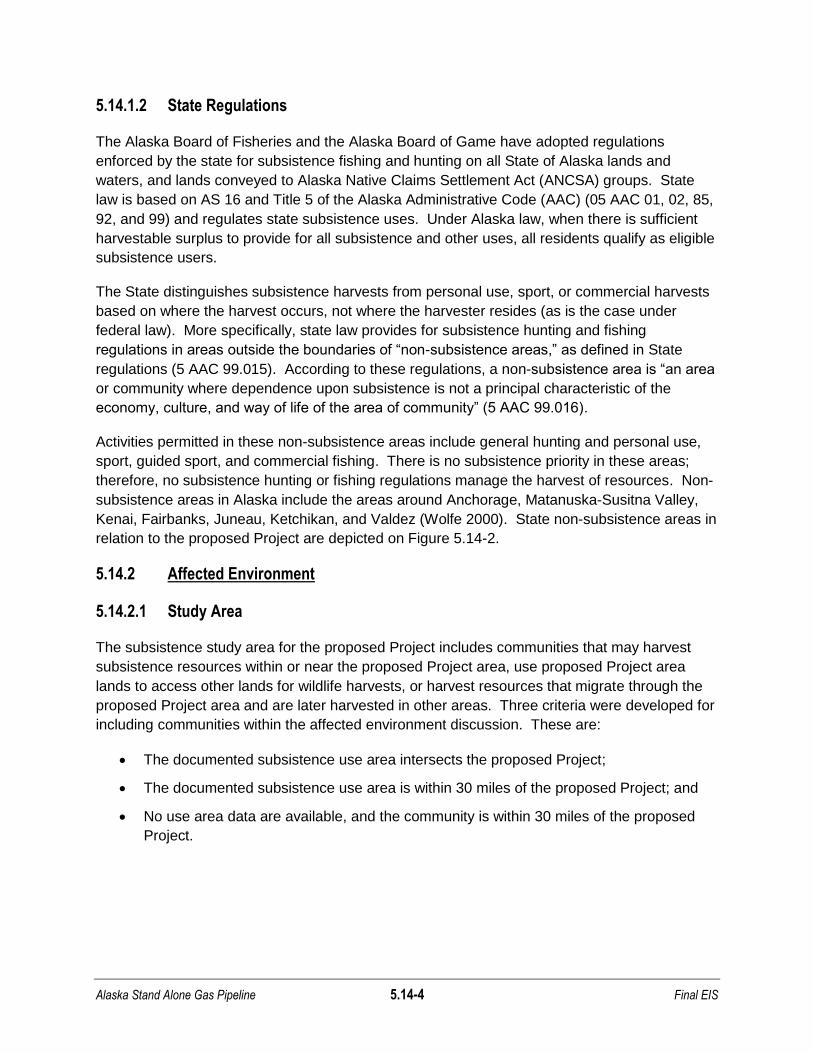
Alaska Stand Alone Gas Pipeline 5.14-4 Final EIS
5.14.1.2 State Regulations
The Alaska Board of Fisheries and the Alaska Board of Game have adopted regulations
enforced by the state for subsistence fishing and hunting on all State of Alaska lands and
waters, and lands conveyed to Alaska Native Claims Settlement Act (ANCSA) groups. State
law is based on AS 16 and Title 5 of the Alaska Administrative Code (AAC) (05 AAC 01, 02, 85,
92, and 99) and regulates state subsistence uses. Under Alaska law, when there is sufficient
harvestable surplus to provide for all subsistence and other uses, all residents qualify as eligible
subsistence users.
The State distinguishes subsistence harvests from personal use, sport, or commercial harvests
based on where the harvest occurs, not where the harvester resides (as is the case under
federal law). More specifically, state law provides for subsistence hunting and fishing
regulations in areas outside the boundaries of “non-subsistence areas,” as defined in State
regulations (5 AAC 99.015). According to these regulations, a non-subsistence area is “an area
or community where dependence upon subsistence is not a principal characteristic of the
economy, culture, and way of life of the area of community” (5 AAC 99.016).
Activities permitted in these non-subsistence areas include general hunting and personal use,
sport, guided sport, and commercial fishing. There is no subsistence priority in these areas;
therefore, no subsistence hunting or fishing regulations manage the harvest of resources. Non-
subsistence areas in Alaska include the areas around Anchorage, Matanuska-Susitna Valley,
Kenai, Fairbanks, Juneau, Ketchikan, and Valdez (Wolfe 2000). State non-subsistence areas in
relation to the proposed Project are depicted on Figure 5.14-2.
5.14.2 Affected Environment
5.14.2.1 Study Area
The subsistence study area for the proposed Project includes communities that may harvest
subsistence resources within or near the proposed Project area, use proposed Project area
lands to access other lands for wildlife harvests, or harvest resources that migrate through the
proposed Project area and are later harvested in other areas. Three criteria were developed for
including communities within the affected environment discussion. These are:
The documented subsistence use area intersects the proposed Project;
The documented subsistence use area is within 30 miles of the proposed Project; and
No use area data are available, and the community is within 30 miles of the proposed
Project.
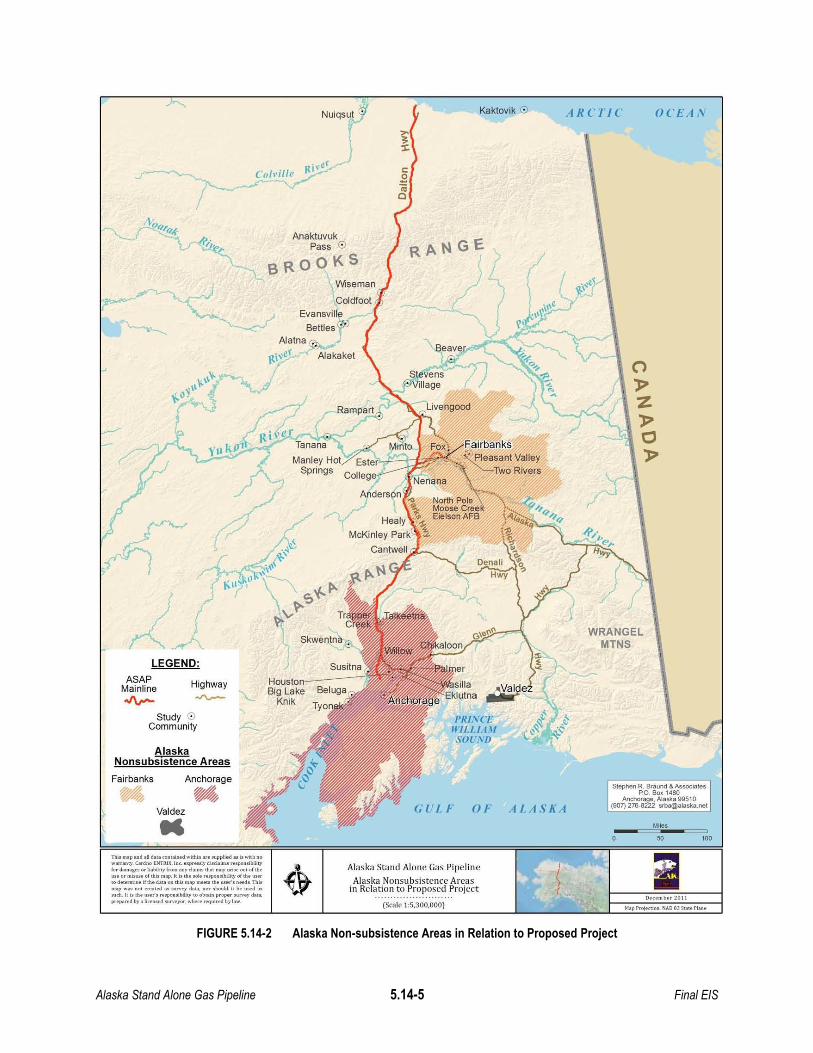
Alaska Stand Alone Gas Pipeline 5.14-5 Final EIS
FIGURE 5.14-2 Alaska Non-subsistence Areas in Relation to Proposed Project
Nuiqsut Kaktovik 0 ARCTIC OCEAN
ColdUe
50 100
Oe<embu zen
"'.p ~tojo"lon, ~~O US..'" "",n,
Stephen R. Braund &As!;OCiatesP.O. Sox 1480
Anchorage, Alaska 99510(907) 276-8222 srba@alaska,net
WRANGELMTNS
OF ALASKA
PRINCEWILL/A"tSOl..r\,D
GULF
(Scale 1:5.300.000)
Alaska Stand Alone Gas Pipeline
Alaska Nonsubsistence Areasin Relation to Proposed Project
Houston'---Big Lake
Knik
Highway~
Study 0Community
~\\"'r--~~oi\\ ~
·ve','. III Tanana
Manley Hot Este'''r''''''''-'H~Springs College
LEGEND:
ASAPMainline-JV-
AlaskaNonsubSiStiiiCe Areas
Fairbanks Anchorage
M MValdez
MT1IUl "'p.,.d .. 01 ... "", ..1..01 wlthl" "ppllood .. UlwkhM......n'>". c.nlno E,""IX.ln, y d,.da... ".""""bd,,>"I.,. 4om.., Ii.bll;,>" t",m .ny <loom. tho, '""f an.. "'" '" do,..... ,"I of'b p, l'Ulth.oolo,..,..,.,.lbWtyof"'. "_to dot...,,;,.. Ifth.d on dol. m.p m_ 'ho ....,f. nOO<l. T1II."'p w•• nQ! , ""tvO)' 40,", not oh<>uld I' b. noo<l ..
"'cb, Ill. tho f. , ••pon.lbillty to oo..ln .'0_ ""'0)' 40......_to<! by. Il<onood .....yoo-, ..boR ~"I,od b~ 1....
~~-f; Anaktuvuk
, BROP~S;S1 1Wseman
~"" '\.,.~-'v' ColdfootEvansvil?e
BettlesA1atna
\l.l\1ef
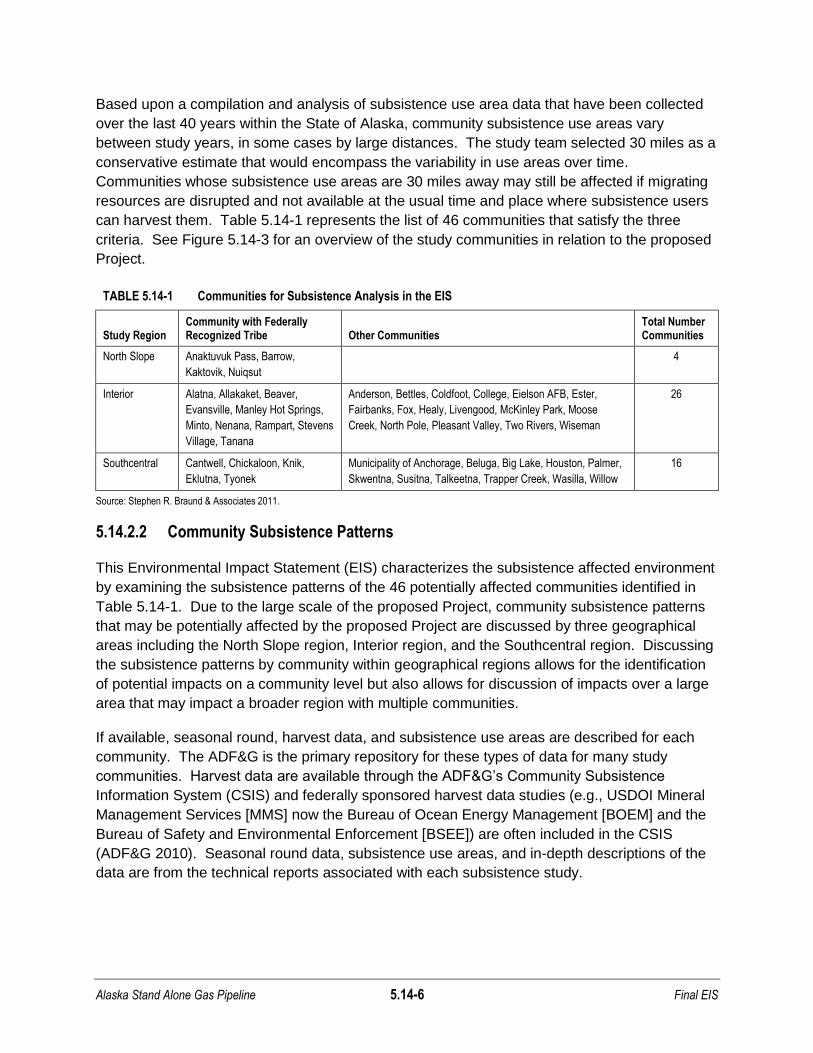
Alaska Stand Alone Gas Pipeline 5.14-6 Final EIS
Based upon a compilation and analysis of subsistence use area data that have been collected
over the last 40 years within the State of Alaska, community subsistence use areas vary
between study years, in some cases by large distances. The study team selected 30 miles as a
conservative estimate that would encompass the variability in use areas over time.
Communities whose subsistence use areas are 30 miles away may still be affected if migrating
resources are disrupted and not available at the usual time and place where subsistence users
can harvest them. Table 5.14-1 represents the list of 46 communities that satisfy the three
criteria. See Figure 5.14-3 for an overview of the study communities in relation to the proposed
Project.
TABLE 5.14-1 Communities for Subsistence Analysis in the EIS
Study Region Community with Federally Recognized Tribe Other Communities
Total Number Communities
North Slope Anaktuvuk Pass, Barrow,
Kaktovik, Nuiqsut
4
Interior Alatna, Allakaket, Beaver,
Evansville, Manley Hot Springs,
Minto, Nenana, Rampart, Stevens
Village, Tanana
Anderson, Bettles, Coldfoot, College, Eielson AFB, Ester,
Fairbanks, Fox, Healy, Livengood, McKinley Park, Moose
Creek, North Pole, Pleasant Valley, Two Rivers, Wiseman
26
Southcentral Cantwell, Chickaloon, Knik,
Eklutna, Tyonek
Municipality of Anchorage, Beluga, Big Lake, Houston, Palmer,
Skwentna, Susitna, Talkeetna, Trapper Creek, Wasilla, Willow
16
Source: Stephen R. Braund & Associates 2011.
5.14.2.2 Community Subsistence Patterns
This Environmental Impact Statement (EIS) characterizes the subsistence affected environment
by examining the subsistence patterns of the 46 potentially affected communities identified in
Table 5.14-1. Due to the large scale of the proposed Project, community subsistence patterns
that may be potentially affected by the proposed Project are discussed by three geographical
areas including the North Slope region, Interior region, and the Southcentral region. Discussing
the subsistence patterns by community within geographical regions allows for the identification
of potential impacts on a community level but also allows for discussion of impacts over a large
area that may impact a broader region with multiple communities.
If available, seasonal round, harvest data, and subsistence use areas are described for each
community. The ADF&G is the primary repository for these types of data for many study
communities. Harvest data are available through the ADF&G‟s Community Subsistence
Information System (CSIS) and federally sponsored harvest data studies (e.g., USDOI Mineral
Management Services [MMS] now the Bureau of Ocean Energy Management [BOEM] and the
Bureau of Safety and Environmental Enforcement [BSEE]) are often included in the CSIS
(ADF&G 2010). Seasonal round data, subsistence use areas, and in-depth descriptions of the
data are from the technical reports associated with each subsistence study.
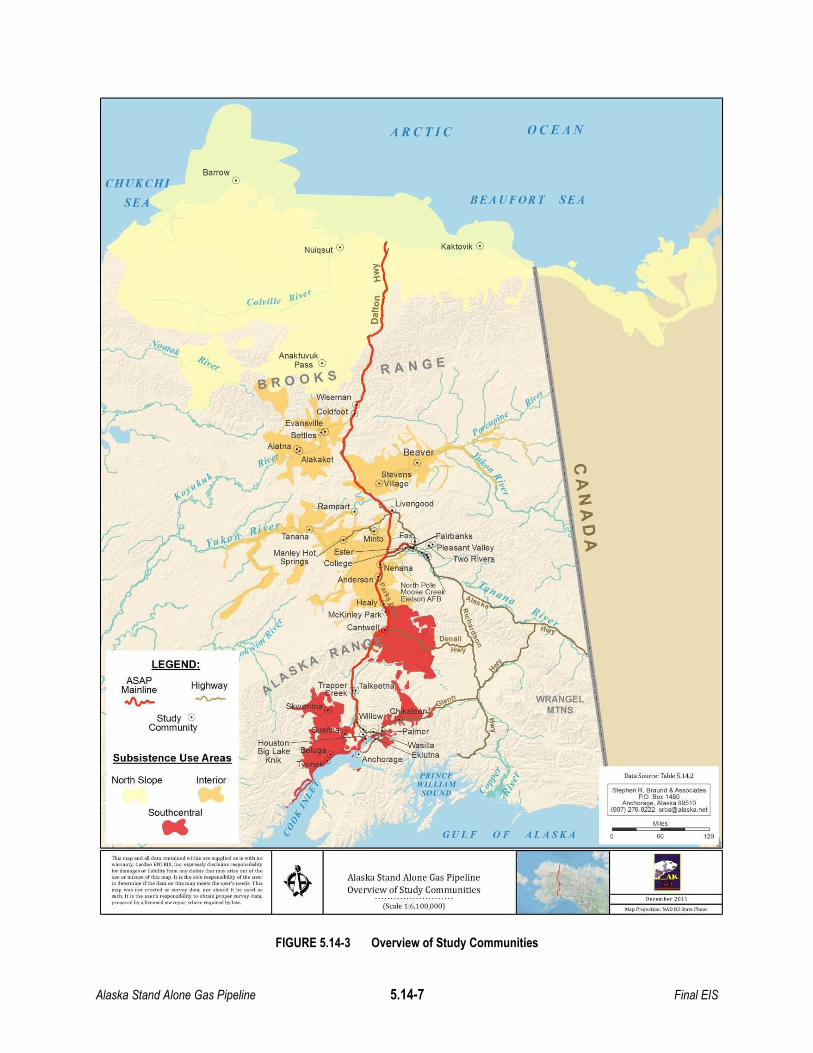
Alaska Stand Alone Gas Pipeline 5.14-7 Final EIS
FIGURE 5.14-3 Overview of Study Communities
ARCTIC OCEAN
CHUKCHI
SEA
Barrow(;)
IJEA U FOR T SEA
Nuiqsut 0 Kaktovik 0
cE..c
Subsistence Use Areas .....
Study 0Community
120 ~'"MileS
[)ataSourre: Table 5.14.2
Stephen R. Braund &AssoclillesP.O. Bo~ 1480
Anchorage, Alaska 99510(907) 278-8222 [email protected]
\
WRANGELMTNS
PHI\'CEIHLLI. 01.meso
GVLF OF ALASKA
AnaktuvukPass 0
BROoKS
Interior
Highway-J"v-
Coldfoot
Evansville
Bettles@
Alatnaee>
J\,.tf Alakaket
\'\\'i- ""'", l'~\\
~(
Southcentral
M
LEGEND:
ASAPMainline
oI\r-
North Slope
TlII.",.p ....d .. d... """I.O.l..d""thl........ppll..........~~oo......ut)'. ~orO"" ~NTR'X.ln~ • .,..oalyd~"" ""p<>n,'hihty
"" dom•• or hob"'ty ''''''' a.y do'm, tho, may .,;.. 0'" <I "'.OM or "" o.:,hlo p. I, isth. tolo ,...,.,.,.'bUl<y ofdl.~_to d ' "',~.d "" "'"' map ...... "'" ..........b n","'p w.. no< , t«!., .....0)' ""'" nor oh<>uld "b. uood .."'ell., I, I. tho ,..""".IOIII!)' '" .,.".1. p''''''' tv.,. 4.1...........-.d by. 1I"..oH '.__yo<, W....... ~"lrod ~ 1 .
Alaska Stand Alone Gas PipelineOverview of Study Communities
(Scale 1:6,100,000)D«emb.. lOll
Alaska Stand Alone Gas Pipeline 5.14-8 Final EIS
Table 5.14-2 lists the 46 study communities and associated harvest data, seasonal round data,
and use area studies identified by the study team. Subsistence harvest information, seasonal
round data, and subsistence use area maps are also available in baseline studies done for EIS‟
and federally or academically funded studies. While under state regulations all residents of
Alaska may qualify as subsistence users, the majority of previous state sponsored subsistence
studies have focused on those communities where the “mixed, subsistence-market” economy is
the driving economic force in the community. As such, fewer rural areas of the state that do not
rely on the mixed subsistence economy have had far fewer, if any, comprehensive subsistence
studies that characterize their seasonal round, harvest data, and subsistence use areas.
Because a number of communities lack subsistence data and documentation, this EIS is not
able to characterize their subsistence uses, and thus it is difficult to quantify the impacts for all
potentially affected study communities.
Many of the studies that do exist for potentially affected study communities are two or more
decades old and caution is advised when using older data to characterize current uses. These
older data, however, represent the best available information and are sometimes the only
subsistence data that exist for a community. Changes to resource availability, competition, and
access to use areas occur over time and communities adapt their subsistence patterns in
response to these changes. Communities with multiple study years may be the best indicators
of a region‟s subsistence uses as trends may be identifiable across study years.
North Slope Region
The North Slope region is the geographical area north of the Brooks Range to the Beaufort Sea.
The Brooks Range, Arctic Foothills, and Arctic Coastal Plain ecoregions comprise the North
Slope environment. The Arctic Coastal Plain is primarily a flat tundra environment with poor
drainage and numerous lakes; the Arctic Foothills are characterized by treeless rolling hills and
plateaus with defined drainage patterns; and the Brooks Range is comprised of rugged
mountain terrain shaped by Pleistocene glaciations and dwarf scrub vegetation (Gallant 1995).
Low mean annual temperatures and annual precipitation typify climate in all three regions.
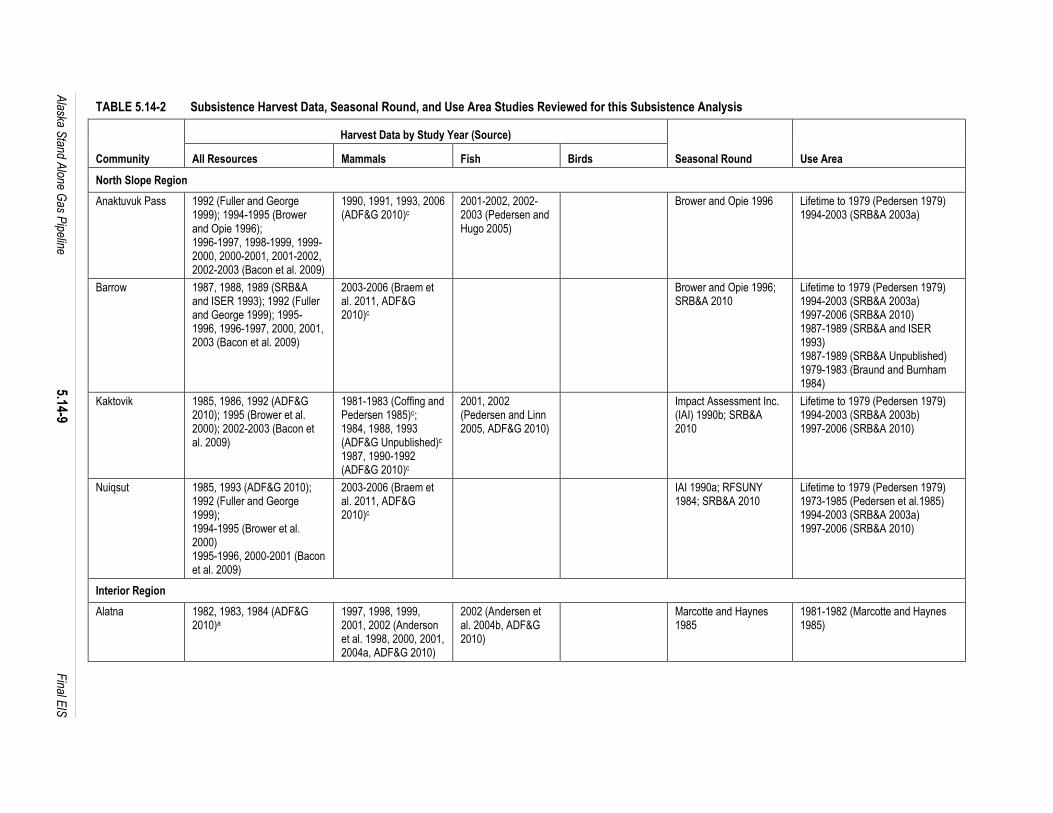
Alaska S
tand Alone G
as Pipeline
5.14-9
F
inal EIS
TABLE 5.14-2 Subsistence Harvest Data, Seasonal Round, and Use Area Studies Reviewed for this Subsistence Analysis
Community
Harvest Data by Study Year (Source)
Seasonal Round Use Area All Resources Mammals Fish Birds
North Slope Region
Anaktuvuk Pass 1992 (Fuller and George 1999); 1994-1995 (Brower and Opie 1996); 1996-1997, 1998-1999, 1999-2000, 2000-2001, 2001-2002, 2002-2003 (Bacon et al. 2009)
1990, 1991, 1993, 2006 (ADF&G 2010)c
2001-2002, 2002-2003 (Pedersen and Hugo 2005)
Brower and Opie 1996 Lifetime to 1979 (Pedersen 1979) 1994-2003 (SRB&A 2003a)
Barrow 1987, 1988, 1989 (SRB&A and ISER 1993); 1992 (Fuller and George 1999); 1995-1996, 1996-1997, 2000, 2001, 2003 (Bacon et al. 2009)
2003-2006 (Braem et al. 2011, ADF&G 2010)c
Brower and Opie 1996; SRB&A 2010
Lifetime to 1979 (Pedersen 1979) 1994-2003 (SRB&A 2003a) 1997-2006 (SRB&A 2010) 1987-1989 (SRB&A and ISER 1993) 1987-1989 (SRB&A Unpublished) 1979-1983 (Braund and Burnham 1984)
Kaktovik 1985, 1986, 1992 (ADF&G 2010); 1995 (Brower et al. 2000); 2002-2003 (Bacon et al. 2009)
1981-1983 (Coffing and Pedersen 1985)c; 1984, 1988, 1993 (ADF&G Unpublished)c 1987, 1990-1992 (ADF&G 2010)c
2001, 2002 (Pedersen and Linn 2005, ADF&G 2010)
Impact Assessment Inc. (IAI) 1990b; SRB&A 2010
Lifetime to 1979 (Pedersen 1979) 1994-2003 (SRB&A 2003b) 1997-2006 (SRB&A 2010)
Nuiqsut 1985, 1993 (ADF&G 2010); 1992 (Fuller and George 1999); 1994-1995 (Brower et al. 2000) 1995-1996, 2000-2001 (Bacon et al. 2009)
2003-2006 (Braem et al. 2011, ADF&G 2010)c
IAI 1990a; RFSUNY 1984; SRB&A 2010
Lifetime to 1979 (Pedersen 1979) 1973-1985 (Pedersen et al.1985) 1994-2003 (SRB&A 2003a) 1997-2006 (SRB&A 2010)
Interior Region
Alatna 1982, 1983, 1984 (ADF&G 2010)a
1997, 1998, 1999, 2001, 2002 (Anderson et al. 1998, 2000, 2001, 2004a, ADF&G 2010)
2002 (Andersen et al. 2004b, ADF&G 2010)
Marcotte and Haynes 1985
1981-1982 (Marcotte and Haynes 1985)

Alaska S
tand Alone G
as Pipeline
5.14-10
F
inal EIS
TABLE 5.14-2 Subsistence Harvest Data, Seasonal Round, and Use Area Studies Reviewed for this Subsistence Analysis
Community
Harvest Data by Study Year (Source)
Seasonal Round Use Area All Resources Mammals Fish Birds
Allakaket 1982, 1983, 1984 (ADF&G 2010)a
1997, 1998, 1999, 2001, 2002 (Anderson et al. 1998, 2000, 2001, 2004a, ADF&G 2010)
2002 (Andersen et al. 2004b, ADF&G 2010)
Marcotte and Haynes 1985
1981-1982 (Marcotte and Haynes 1985)
Anderson 1987 (ADF&G 2010) ND ND ND ND ND
Beaver 1985, 1993, 1994, 1995, 1996 (ADF&G 2010)
1984-1985 (Sumida and Alexander 1985)
2005 (Koskey and Mull 2011, ADF&G 2010)
2000 (Andersen and Jennings 2001, ADF&G 2010)
Sumida 1989, SRB&A 2007a
Lifetime (Sumida 1989); 1997-2006 (SRB&A 2007a)
Bettles 1982, 1983, 1984 (ADF&G 2010)b
1997, 1998, 1999, 2002 (Anderson et al. 1998, 2000, 2001, ADF&G 2010)
2002 (Andersen et al. 2004b, ADF&G 2010)b
Marcotte and Haynes 1985
1981-1982 (Marcotte and Haynes 1985)
Coldfoot ND ND ND ND ND ND
College ND ND ND ND ND ND
Eielson AFB ND ND ND ND ND ND
Ester ND ND ND ND ND ND
Evansville 1982, 1983, 1984 (ADF&G 2010)b
1997, 1998, 1999, 2002 (Anderson et al. 1998, 2000, 2001, ADF&G 2010)
2002 (Andersen et al. 2004b, ADF&G 2010)b
Marcotte and Haynes 1985
Fairbanks ND ND ND ND ND ND
Fox ND ND ND ND ND ND
Healy 1987 (ADF&G 2010) ND ND ND ND ADF&G n.d.
Livengood ND ND ND ND ND ND
Manley Hot Springs
ND 2004 (ADF&G 2010) 2004 (ADF&G 2010) ND Betts 1997 1975-1995 (Betts 1997)
McKinley Park 1987 (ADF&G 2010) ND ND ND ND ND
Minto 1984 (ADF&G 2010) 2004 (ADF&G 2010) 2004 (ADF&G 2010) Andrews 1988 1960-1984 (ADF&G 1986)
Moose Creek ND ND ND ND ND ND

Alaska S
tand Alone G
as Pipeline
5.14-11
F
inal EIS
TABLE 5.14-2 Subsistence Harvest Data, Seasonal Round, and Use Area Studies Reviewed for this Subsistence Analysis
Community
Harvest Data by Study Year (Source)
Seasonal Round Use Area All Resources Mammals Fish Birds
Nenana ND 2004 (ADF&G 2010) 2004 (ADF&G 2010) ND ND 1981-1982 (ADF&G 1986)
North Pole ND ND ND ND ND ND
Pleasant Valley ND ND ND ND ND ND
Rampart 1993, 1994, 1995, 1997 (ADF&G 2010)
1998 (ADF&G 2010) 1996 (ADF&G 2010) 2000 (Andersen and Jennings 2001, ADF&G 2010)
ND ND
Stevens Village 1984, 1993, 1994, 1997 (ADF&G 2010)
ND 1995 (ADF&G 2010) 1995, 2000 (Andersen and Jennings 2001, ADF&G 2010)
Sumida 1988 1974-1984 (Sumida 1988)
Tanana 1987 (Case and Halpin 1990, ADF&G 2010)
1996, 1997, 1998, 1999, 2002 (Anderson et al. 1998, 2000, 2001, ADF&G 2010)
2006 (Brown et al. 2010, ADF&G 2010)
Case and Halpin 1990 1968-1988 (Case and Halpin 1990)
Two Rivers ND ND ND ND ND ND
Wiseman ND ND ND ND ND ND
Southcentral Region
ND ND ND ND ND ND
Municipality of Anchorage
ND 1995-2008 (ADF&G 2010)
ND ND ND ND
Beluga 2006 (ADF&G 2010) ND ND ND SRB&A 2007b, Stanek et al. 2007
ADF&G 1986d; 1987-2006 (SRB&A 2007b); 2005-2006 (Stanek et al. 2007)
Big Lake ND ND ND ND ND ND
Cantwell 1982, 1999 (Simeone 2002, ADF&G 2010)
ND ND 2000 (ADF&G 2010) Simeone 2002 1964-1984 (Stratton and Georgette 1985, ADF&G 1986)
Chickaloon 1982 (ADF&G 2010) ND ND ND ND 1964-1984 (Stratton and Georgette 1985, ADF&G 1986)
Eklutna ND ND ND ND ND SRB&A Unpublished
Houston ND ND ND ND ND ND
Knik-Fairview ND ND ND ND ND ND

Alaska S
tand Alone G
as Pipeline
5.14-12
F
inal EIS
TABLE 5.14-2 Subsistence Harvest Data, Seasonal Round, and Use Area Studies Reviewed for this Subsistence Analysis
Community
Harvest Data by Study Year (Source)
Seasonal Round Use Area All Resources Mammals Fish Birds
Palmer ND ND ND ND ND ND
Skwentna ND ND ND ND ND 1983-1985 (Fall et al 1983, ADF&G 1986)
Susitna ND ND ND ND ND 1984 (Stanek 1987)
Talkeetna 1985 (ADF&G 2010) ND ND ND ND ND
Trapper Creek 1985 (ADF&G 2010) ND ND ND ND ADF&G 1986d
Tyonek 1983, 2006 (ADF&G 2010) 1995-2005, 2007, 2008 (ADF&G 2010)
ND ND Foster 1982, SRB&A 2007b, Stanek et al. 2007
1978-1982 (Fall et al. 1983, ADF&G 1986); 1987-2006 (SRB&A 2007b); 2005-2006 (Stanek et al. 2007)
Wasilla ND ND ND ND ND ND
Willow ND ND ND ND ND ND
a Harvest study years for Alatna/Allakaket combined. b Harvest study years for Bettles/Evansville combined. c Caribou only d Use area data are known but are not digitized or are unavailable.
ND = No Data: No current (e.g., post-1960) systematically collected subsistence harvest, seasonal round, or use area data discovered for this community.
Source: Stephen R. Braund & Associates 2011.
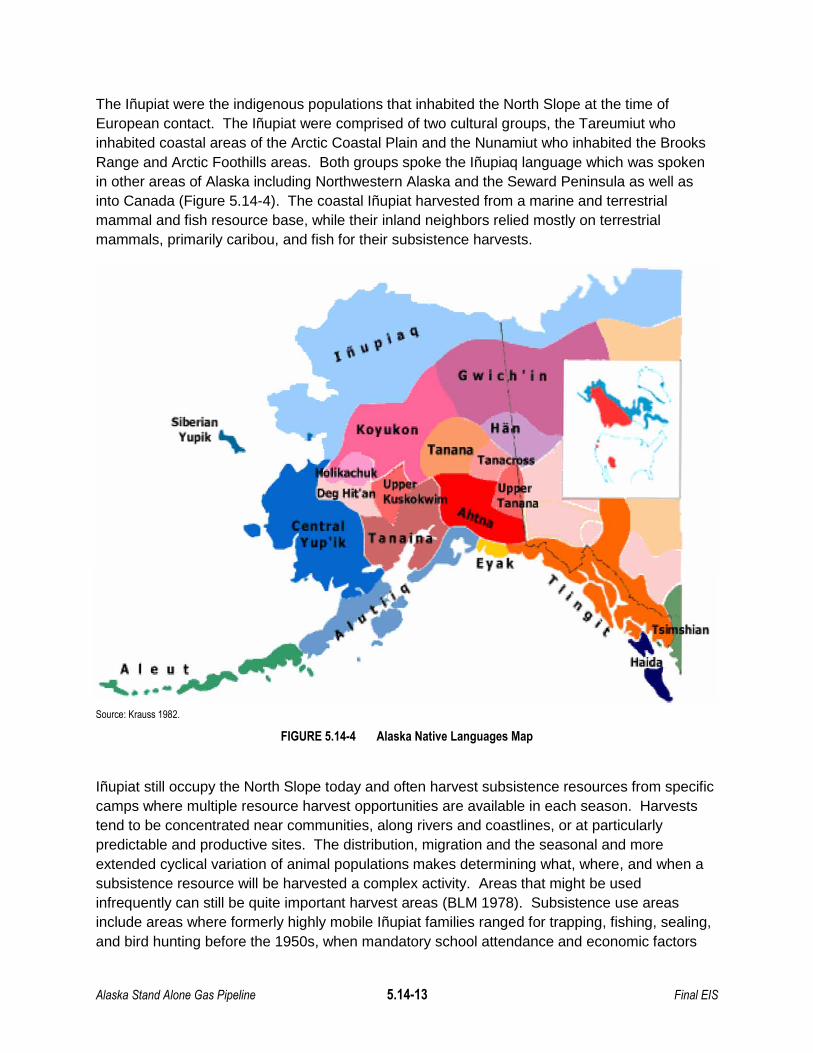
Alaska Stand Alone Gas Pipeline 5.14-13 Final EIS
The Iñupiat were the indigenous populations that inhabited the North Slope at the time of
European contact. The Iñupiat were comprised of two cultural groups, the Tareumiut who
inhabited coastal areas of the Arctic Coastal Plain and the Nunamiut who inhabited the Brooks
Range and Arctic Foothills areas. Both groups spoke the Iñupiaq language which was spoken
in other areas of Alaska including Northwestern Alaska and the Seward Peninsula as well as
into Canada (Figure 5.14-4). The coastal Iñupiat harvested from a marine and terrestrial
mammal and fish resource base, while their inland neighbors relied mostly on terrestrial
mammals, primarily caribou, and fish for their subsistence harvests.
Source: Krauss 1982.
FIGURE 5.14-4 Alaska Native Languages Map
Iñupiat still occupy the North Slope today and often harvest subsistence resources from specific
camps where multiple resource harvest opportunities are available in each season. Harvests
tend to be concentrated near communities, along rivers and coastlines, or at particularly
predictable and productive sites. The distribution, migration and the seasonal and more
extended cyclical variation of animal populations makes determining what, where, and when a
subsistence resource will be harvested a complex activity. Areas that might be used
infrequently can still be quite important harvest areas (BLM 1978). Subsistence use areas
include areas where formerly highly mobile Iñupiat families ranged for trapping, fishing, sealing,
and bird hunting before the 1950s, when mandatory school attendance and economic factors
SiberianYUPik"\.
•
Koyukon
G
HII~,
•••
1!I!'.:1,TI'" hian

Alaska Stand Alone Gas Pipeline 5.14-14 Final EIS
such as a decline in fur prices compelled families to permanently settle in one of a few
centralized communities. The advent of snow machines and all-terrain vehicles (ATVs),
including four wheelers and amphibious and tracked rigs, reduced the time needed to return to
former use areas far from the main communities, but increased the need for cash employment
to pay for purchase, maintenance, and supplies for the new equipment (Ahtuangaruak 1997;
IAI 1990a, 1990b; Worl and Smythe 1986). Modern technology has allowed far ranging
subsistence trips over a shorter period of time. An evolution of the nomadic subsistence
residence pattern is the base camp system for harvesting freshwater and land based resources
using modern technology, where camps, cabins, caches, and tent platforms are pre-positioned
in places central to a set of resource harvest areas, and hunting and fishing expeditions are
based out of these locations (IAI 1990b).
The North Slope region encompasses the study communities of Barrow, Nuiqsut, Kaktovik, and
Anaktuvuk Pass (Figure 5.14-3). All four communities are federally recognized tribes. These
tribes have traditional and current resource uses, including customary and traditional,
educational, or ceremonial uses in or near the proposed Project area. See the following
discussion for a description of the four communities and their subsistence use areas, harvest
patterns, and seasonal round.
Community Descriptions
Anaktuvuk Pass
Anaktuvuk Pass is in the Brooks Range just south of the continental divide in a low pass
connecting the drainages of the Anaktuvuk and John Rivers, 60 miles west of the Dalton
Highway. The 2010 population was 324, of whom 83 percent were Alaska Native
(U.S. Census Bureau 2011). The area has been used by the interior Iñupiat people, called the
Nunamiut, for at least 500 years and by Iñupiat predecessor groups for at least 4,000 years.
The modern village began in 1949 with the establishment of a trading post, followed by a post
office in 1951 and a church in 1958. Residents incorporated as a fourth-class city in 1959. A
permanent school was established in 1961, and the community was reclassified as a second-
class city in 1971 (Hall et al. 1985). The Naqsragmuit Tribal Council is a federally recognized
tribe.
Barrow
Barrow is situated near Point Barrow or Nuvuk, the demarcation point between the Chukchi and
Beaufort seas, where the sea ice is prone to cracking open creating leads for sea mammals to
breathe. The 2010 population was 4,212, of whom 61 percent were Alaska Native
(U.S. Census Bureau 2011). The Native Village of Barrow is a federally recognized tribe. The
Iñupiat name for the modern Barrow area is Utqiagviq, meaning “the place where we hunt
snowy owls.” A main subsistence focus has been marine mammal (e.g., walrus and seal)
hunting and whaling in particular. Barrow is one of 11 Alaska Eskimo bowhead whaling
communities. Bowhead whale hunting is the key activity in the organization of social relations in
the community and represents one of the greatest concentrations of effort, time, money, group
symbolism, and significance (SRB&A and ISER 1993). Other harvested resources, such as
Alaska Stand Alone Gas Pipeline 5.14-15 Final EIS
caribou, waterfowl, and several varieties of fish, are vital for subsistence and available near
Barrow.
Kaktovik
Kaktovik is located on the northeast coast of Barter Island on the Beaufort Sea between the
Okpilak and Jago Rivers, surrounded by the Arctic National Wildlife Refuge. The location was
formerly used by Iñupiat people from Canada and Alaska when trading with Athabascan Indians
from the interior (IAI 1990b). The 2010 population was 239 of whom 89 percent were Alaska
Native (U.S. Census Bureau 2011). The Native Village of Kaktovik is a federally recognized
tribe. Kaktovik, one of the 11 Alaska Eskimo bowhead whaling communities, was established in
its contemporary form in 1923, when the Gordon family moved their trading post from
Demarcation Point to Barter Island to be closer to Tom Gordon‟s Iñupiat relatives. While few
settled there in a permanent year-round sense, the trading post became a center of annual
travel for Iñupiat people from Barrow to Herschel Island. By the late 1920s, reindeer herding
was a commercial undertaking in the region, with families herding reindeer in their normal
hunting and trapping territories until the practice ended in the late 1930s, concurrent with the
death of Tom Gordon and the closure of his trading post. The community dispersed again, with
some moving to Herschel Island or Barrow, but soon a U.S. Geodetic Survey base camp was
built on Tigvariak Island and preparations for the Distant Early Warning (DEW) Line site at
Barter Island drew Iñupiat people back to Kaktovik for jobs. The Bureau of Indian Affairs (BIA)
opened a school in 1951. The community started bowhead whaling again in the early 1960s
(IAI 1990b). The community relies primarily on marine mammals, caribou, fish, and birds.
Nuiqsut
Nuiqsut‟s location on the Colville River, some 35 miles upstream from the Beaufort Sea, is a
prime area for fish and caribou harvests, and although less advantageous for marine mammal
harvests, residents do travel to the ocean to harvest them. The 2010 population was 402, with
87 percent of residents Alaska Native (U.S. Census Bureau 2011). The Native Village of
Nuiqsut is a federally recognized tribe. The Colville River is the largest river system on the
North Slope and supports the largest overwintering areas for whitefish (Craig 1987). Twenty-
seven families from Barrow permanently resettled Nuiqsut in 1973. The Nuiqsut area was
formerly a place where Iñupiat and Athabascan people gathered to trade and fish, maintaining
connections between the Nunamiut of the inland areas and the Taremiut of the coast
(Brown 1979). ANCSA allowed Iñupiat from Barrow who wished to live in a more traditional
manner to select the site for resettlement, and many of those who moved there had some family
connection to the area (IAI 1990a). Easy access to the main channel of the Colville River for
fishing, hunting, and ease of movement between upriver hunting sites and downriver whaling
and sealing sites was the primary reason for selection of the site (Brown 1979).
Nuiqsut is one of 11 Alaska Eskimo whaling communities. Many of those who resettled Nuiqsut
were experienced whalers and crew who remembered past whale harvests before the
temporary abandonment of the settlement (IAI 1990a). Nuiqsut whale hunting is based from
Cross Island, approximately 70 miles northeast of Nuiqsut and approximately 15 miles from
West Dock on the west side of Prudhoe Bay. Nuiqsut whalers travel approximately 100 miles

Alaska Stand Alone Gas Pipeline 5.14-16 Final EIS
from Nuiqsut to the Cross Island whaling camp. Nuiqsut whaling occurs in the fall when the
whales migrate closer to shore, because the spring migration path is too distant from shore for
effective hunting with small boats. Nuiqsut residents also participate in Barrow‟s spring whale
hunt through close family ties in that community (Fuller and George 1999). Nuiqsut residents
primarily harvest fish, caribou, marine mammals, and birds.
Subsistence Use Areas
Residents of the four North Slope study communities utilize an expansive area from which they
harvest subsistence resources (Figure 5.14-5). These use areas represent the combination of
several mapping study years in each of the communities.
The combined use areas for these four communities extend from the Chukchi Sea coast and
headwaters of the Colville River in the west to the border of Canada and beyond in the east.
Marine resources are hunted in the Beaufort and Chukchi seas and the most southern use
areas extend far into the Brooks Range and along the Noatak River. Snowmachines are the
primary mode of transportation to access winter and spring use areas; boat is the primary mode
of transportation in the summer and fall and some areas are accessed by ATV as well during
the ice free months. Whereas other North Slope study communities utilize boats during the
summer to access marine and river use areas, Anaktuvuk Pass residents travel to summer use
areas primarily by ATV.
Anaktuvuk Pass subsistence use areas are primarily located within the Brooks Range region
around the community with some use to the north towards Nuiqsut and to the west along the
Noatak River.
The time period for the use areas shown on Figure 5.14-5 for Anaktuvuk Pass includes use
areas reported for Anaktuvuk Pass residents‟ lifetime use areas pre-1979 and as recent as
2003. Anaktuvuk Pass is the only North Slope study community that does not utilize a marine
environment. Because of their inland location, residents rely heavily on land mammal
resources, particularly caribou, as they migrate through Anaktuvuk Pass. Anaktuvuk Pass use
areas in the Arctic Foothills regions are overlapped by use areas from Nuiqsut and Barrow. A
portion of the Anaktuvuk Pass use area intersects with the proposed Project.
Barrow subsistence use areas include the large expanse of open tundra areas south of the
community and into the Arctic foothills near the Colville River. The time period for the use areas
shown on Figure 5.14-5 for Barrow includes use areas reported for Barrow residents‟ lifetime
use areas pre-1979 and as recent as 2006. The furthest extent of marine use occurs directly
north of the community and closer areas are located along the coast west and east of Barrow in
both the Chukchi and Beaufort seas. Barrow residents have reported use areas just east of
Nuiqsut; these use areas overlap with the area used by Nuiqsut as well as a portion of
Anaktuvuk Pass‟ northernmost use areas. Barrow use areas do not intersect the proposed
Project.

Alaska Stand Alone Gas Pipeline 5.14-17 Final EIS
FIGURE 5.14-5 North Slope Region Study Communities Subsistence Use Areas
Barrow Subsistence Use Areas Kaktovik Subsistence Use Areas
ARCTIC OCEANARCTIC OCEAN
Kaktoviko
HFlfFOH1 SF.f
- -Anaktuvuk
Pass 0
J\
Kaktovik 0
HE.lif'ONr
051:,1
Nuiqsut o
AnaktuvukPass.0
OOKS RANGE
Barrowo
Ull ACUIShl
-Nuiqsut Subsistence Use Areas Anaktuvuk Pass Subsistence Use Areas
~"'Jti"'"
I"",,,,, AnaktuvukPass 0
I
Kaktoviko
IRCTlC {)CEAS
Nuiqsut
Barrowo
r
ClllKClII
Sf-I
0Kaktovik
"
lJE.HFONT SL-l
\
Nuiqsuto
ARCTIC OCE,n
BarrowoCHt A'ClII
SE.1
100__ IMIles
Data Source: Table 5,14.2
ARCTIC OCEANStephen R. Braund & Associates
p.e Box 1480Anchorage. Alaska 99510
(001) 216-8222 [email protected]
CHUKCHI
SEA
BarrowoIIEAUFORT SEA
Kaktovik
M Anaktuvuk Pass
Subsistence Use Areas
Nuiqsut
MBarrow
Study 0Community
Kaktovik 0
/
6\1.00\(5
LEGEND:
ASAP-J'v-Mainline
MIIe~
TIll> "",patld .. da" """..tnod wlthl ppllod .. "w~hMw ......nt)'. Cord"" ENTRI~.ln~••pr yd~... "'p"",'b;!;t)'f.,..d.omoga. or lixbH;t)'f",m .ny<l.'m. that mxyari.. ou,<>fth.... "''''I..... o>fth .. ....."It isth. I0Io ".poo.lbmty ofth.,....t" dotannina Wth.d.ta on th;. map ....... tho _T. nMd. n;amap W•• not < bed 'a a,".O)" d.ota, nnr ohould ;t b. no«! ..IlJrn, Il .. tit (.'••p"oslbliity to obtai. p'opor ..",O)'d.ot..pr.parod by .11<0......."'.yor, who... o'«l.~ b\i law
Alaska Stand Alone Gas PipelineNorth Slope Region Study Communities'
Subsistence Usc Areas No.emb,u 2Ul1

Alaska Stand Alone Gas Pipeline 5.14-18 Final EIS
Nuiqsut inland subsistence use areas are located as far west as Barrow and as far east as
Kaktovik; however the majority of their use occurs west of the Dalton Highway and south along
the Colville River area to the foothills of the Brooks Range (Figure 5.14-5). Offshore use areas
are located north of the community and towards the east in the vicinity of Cross Island, the
community‟s base for fall whaling activities. The time period for the use areas shown on
Figure 5.14-5 for Nuiqsut includes use areas reported for Nuiqsut residents‟ lifetime use areas
pre-1979 and as recent as 2006. Portions of Nuiqsut‟s western, eastern, and southern use
areas are overlapped by use areas from Barrow, Kaktovik, and Anaktuvuk Pass respectively.
Nuiqsut use areas intersect the proposed Project.
Kaktovik subsistence use areas are nearly all located east of the Dalton Highway and extend
into Canada (Figure 5.14-5). Kaktovik residents share close family ties with the Aklavik and
Inuvik communities in Canada and this figure depicts use areas in Canada near these
communities. South of the community, use areas reach into the mountains of the Brooks
Range. Offshore use areas for marine resources are located directly north of the community
and along the coastline to the east and west. The time period for the use areas shown on
Figure 5.14-5 for Kaktovik includes use areas reported for Kaktovik residents‟ lifetime use areas
pre-1979 and as recent as 2006. A small portion of the westernmost extent of Kaktovik‟s use
area overlaps with the proposed Project. These westernmost use areas are overlapped by
Nuiqsut use areas.
Subsistence Harvest Patterns
All of the North Slope study communities, except for Anaktuvuk Pass, utilize a broad base of
subsistence resources with the majority of harvests coming from marine mammals, land
mammals, and fish (Figure 5.14-6). Vegetation and birds/eggs also contribute to the
subsistence harvest. Anaktuvuk Pass, which is the only North Slope study community not
situated on or near the coast, relies more heavily on a land mammal resource base
supplemented by fish, vegetation, birds, and eggs. In Barrow and Kaktovik, marine mammals
contribute the most to the overall harvest, while marine mammals, land mammals, and fish
contribute an approximately equal percentage to the overall harvest in Nuiqsut. The average of
all North Slope study communities shows that marine mammals and land mammals comprise
over 80 percent of total harvested pounds for the region.
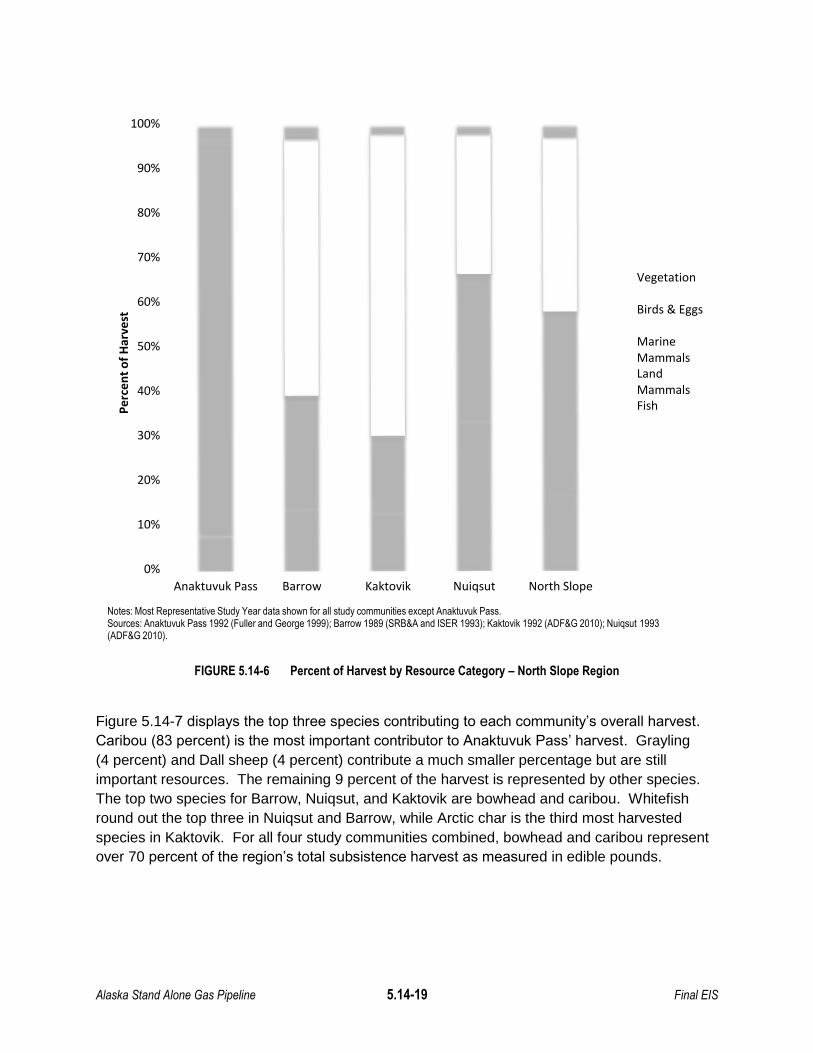
Alaska Stand Alone Gas Pipeline 5.14-19 Final EIS
FIGURE 5.14-6 Percent of Harvest by Resource Category – North Slope Region
Figure 5.14-7 displays the top three species contributing to each community‟s overall harvest.
Caribou (83 percent) is the most important contributor to Anaktuvuk Pass‟ harvest. Grayling
(4 percent) and Dall sheep (4 percent) contribute a much smaller percentage but are still
important resources. The remaining 9 percent of the harvest is represented by other species.
The top two species for Barrow, Nuiqsut, and Kaktovik are bowhead and caribou. Whitefish
round out the top three in Nuiqsut and Barrow, while Arctic char is the third most harvested
species in Kaktovik. For all four study communities combined, bowhead and caribou represent
over 70 percent of the region‟s total subsistence harvest as measured in edible pounds.
0%
10%
20%
30%
40%
50%
60%
70%
80%
90%
100%
Anaktuvuk Pass Barrow Kaktovik Nuiqsut North Slope
Pe
rce
nt
of
Har
vest
Vegetation
Birds & Eggs
Marine Mammals Land Mammals Fish
Notes: Most Representative Study Year data shown for all study communities except Anaktuvuk Pass. Sources: Anaktuvuk Pass 1992 (Fuller and George 1999); Barrow 1989 (SRB&A and ISER 1993); Kaktovik 1992 (ADF&G 2010); Nuiqsut 1993 (ADF&G 2010).

Alaska Stand Alone Gas Pipeline 5.14-20 Final EIS
FIGURE 5.14-7 Percent of Harvest by Top Three Species – North Slope Region
Residents in the North Slope study communities reported harvests ranging from just over
200 pounds per person to nearly 900 pounds a person (Figure 5.14-8). As the figure shows,
harvest amounts can vary from year to year and certain resources such as bowhead (which can
contribute as much as 25,000 pounds to a community‟s total harvest) can make a major
difference in a community‟s per capita harvest. For example, during Kaktovik‟s first harvest
study, residents did not harvest a bowhead and reported a per capita harvest of just over
300 pounds; in Kaktovik‟s third harvest study however, residents reported harvesting three
bowhead whales resulting in a per capita harvest of nearly 900 pounds. The average per capita
harvest for the North Slope study communities for all study years is nearly 600 pounds.
0%
10%
20%
30%
40%
50%
60%
70%
80%
90%
100%
Anaktuvuk Pass Barrow Kaktovik Nuiqsut North Slope
Per
cen
t o
f H
arve
st
Other
Dall Sheep
Grayling
Arctic Char
Whitefish
Caribou
Bowhead
Notes: Most Representative Study Year data shown for all study communities except Anaktuvuk Pass. Sources: Anaktuvuk Pass 1992 (Fuller and George 1999); Barrow 1989 (SRB&A and ISER 1993); Kaktovik 1992 (ADF&G 2010); Nuiqsut 1993 (ADF&G 2010).
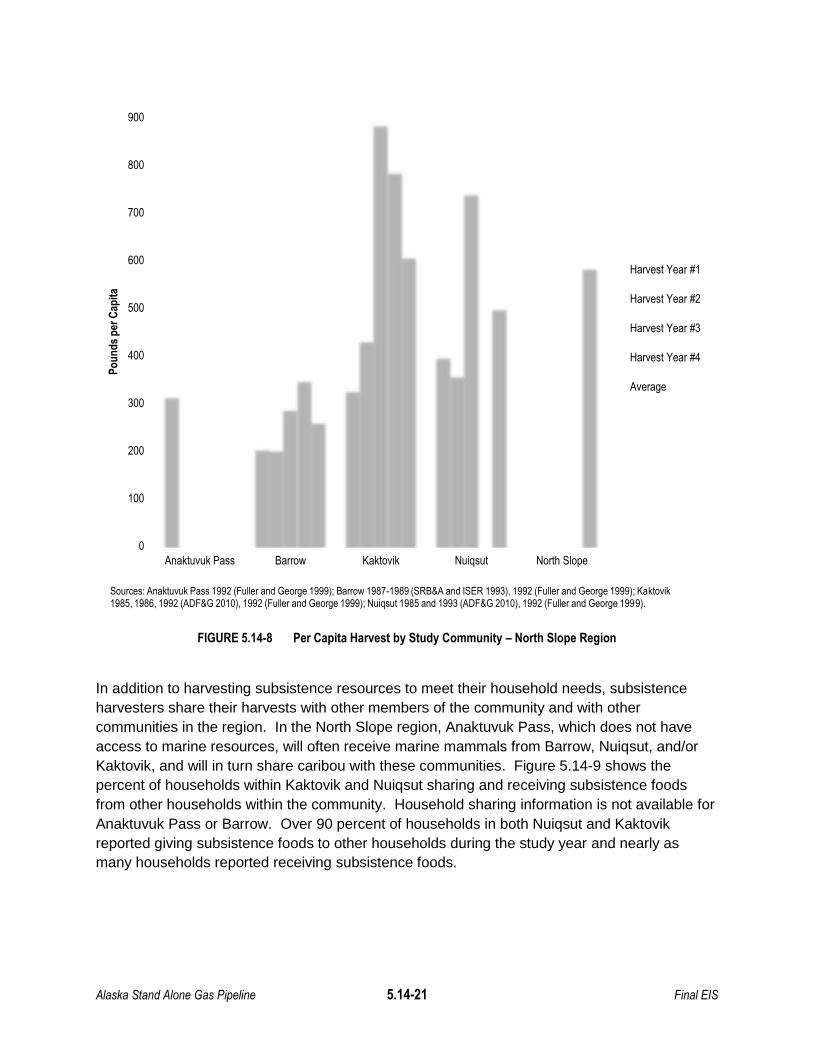
Alaska Stand Alone Gas Pipeline 5.14-21 Final EIS
FIGURE 5.14-8 Per Capita Harvest by Study Community – North Slope Region
In addition to harvesting subsistence resources to meet their household needs, subsistence
harvesters share their harvests with other members of the community and with other
communities in the region. In the North Slope region, Anaktuvuk Pass, which does not have
access to marine resources, will often receive marine mammals from Barrow, Nuiqsut, and/or
Kaktovik, and will in turn share caribou with these communities. Figure 5.14-9 shows the
percent of households within Kaktovik and Nuiqsut sharing and receiving subsistence foods
from other households within the community. Household sharing information is not available for
Anaktuvuk Pass or Barrow. Over 90 percent of households in both Nuiqsut and Kaktovik
reported giving subsistence foods to other households during the study year and nearly as
many households reported receiving subsistence foods.
0
100
200
300
400
500
600
700
800
900
Anaktuvuk Pass Barrow Kaktovik Nuiqsut North Slope
Po
un
ds
per
Cap
ita
Harvest Year #1
Harvest Year #2
Harvest Year #3
Harvest Year #4
Average
Sources: Anaktuvuk Pass 1992 (Fuller and George 1999); Barrow 1987-1989 (SRB&A and ISER 1993), 1992 (Fuller and George 1999); Kaktovik 1985, 1986, 1992 (ADF&G 2010), 1992 (Fuller and George 1999); Nuiqsut 1985 and 1993 (ADF&G 2010), 1992 (Fuller and George 1999).

Alaska Stand Alone Gas Pipeline 5.14-22 Final EIS
FIGURE 5.14-9 Percent of Households Sharing Subsistence Resources – North Slope Region
Seasonal Round
Seasonal subsistence activities for the four study communities are summarized in Table 5.14-3
through Table 5.14-6. Caribou hunting is the mainstay of the Anaktuvuk Pass subsistence hunt,
and caribou are hunted year-round as needed, but in particular from July through November
(Table 5.14-3). Caribou migrate through the Anaktuvuk Pass area twice a year, in the spring
and fall, but the number and specific timing of the caribou migrating through the area vary from
year to year. Dall sheep, brown bear, and moose are hunted in August, September, and
October some distance from the village, with Dall sheep the main target and the others
secondary (Brower and Opie 1996). Birds and fish are supplementary to terrestrial mammals
but are harvested when available and are more important if caribou numbers are low
(Brower and Opie 1996). Berries are seasonally important, with salmonberries and blueberries
providing the majority of vegetable foods (Brower and Opie 1996).
0
10
20
30
40
50
60
70
80
90
100
Kaktovik Nuiqsut North Slope
Per
cen
t o
f H
ou
seh
old
s
Give
Receive
Sources: Kaktovik 1992, Nuiqsut 1993 (ADF&G 2010).

Alaska Stand Alone Gas Pipeline 5.14-23 Final EIS
TABLE 5.14-3 Annual Cycle of Subsistence Activities –Anaktuvuk Pass
Winter Spring Summer Fall
Nov Dec Jan Feb Mar Apr May Jun Jul Aug Sep Oct
Caribou
Sheep
Moose
Ptarmigan
Furbearers
Fish
Berries
No to Very Low Levels of Subsistence Activity
Low to Medium Levels of Subsistence Activity
High Levels of Subsistence Activity
Sources: Brower and Opie 1996, Stephen R. Braund & Associates 2011.
Barrow‟s seasonal round, like many communities, is dictated mostly by the timing of subsistence
resources migration through the area (see Table 5.14-4). Spring bowhead hunting is
undertaken in April and May, with May the most successful month (SRB&A and ISER 1993).
Whaling crew members hunt seals and polar bears following spring whaling. Barrow hunters
harvest caribou in April but usually refrain from taking caribou during May because of calving
and the spring thaw. The harvest of eiders and geese begins in early to mid-May at Shooting
Station, weather and ice conditions permitting. In June, Iñupiat hunters continue to hunt geese
and opportunistically harvest caribou, ptarmigan, and eiders. Barrow residents harvest the
largest number of caribou in July and August when they are available to people hunting from
boats. Depending on the weather and ice conditions, Barrow hunters harvest marine mammals,
eiders, and fish in August. Freshwater fishing occurs from breakup (June) through November
(Fuller and George 1999). Barrow residents harvest eiders during the “fall migration” in July at
Pigniq or “Duck Camp.” Families may go up the Colville River to harvest moose and berries
during moose hunting season in August and early September (Fuller and George 1999). Fall
bowhead whaling may occur as early as mid-August and continue into October depending upon
ice conditions. Barrow residents also harvest ground (or parka) squirrels and ptarmigan, and, if
weather and ice conditions permit and the animals appear close to town, seals and caribou are
harvested during November and December (SRB&A and ISER 1993). During the winter
months, some residents of Barrow harvest furbearers.

Alaska Stand Alone Gas Pipeline 5.14-24 Final EIS
TABLE 5.14-4 Annual Cycle of Subsistence Activities – Barrow
Winter Spring Summer Fall
Nov Dec Jan Feb Mar Apr May Jun Jul Aug Sep Oct
Fish
Birds
Berries
Furbearers
Caribou
Polar Bear
Seals
Walrus
Bowhead
No to Very Low Levels of Subsistence Activity
Low to Medium Levels of Subsistence Activity
High Levels of Subsistence Activity
Sources: Brower and Opie 1996, Stephen R. Braund & Associates 2011.
The annual round in Kaktovik is based on the seasonal availability of resources (Table 5.14-5).
Arctic squirrel hunting begins in April and peaks in May. Kaktovik residents may hunt ptarmigan
year-round, but hunters primarily hunt ptarmigan in April and May. Dall sheep, brown bear,
wolf, and wolverine are also harvested in the spring, but these resources become less desirable
after mid-May (Jacobson and Wentworth 1982). In late May or early in June, migratory
waterfowl hunting begins. Subsistence activities in June are scant because there is not enough
snow for snowmachine transportation and the ice conditions make boat travel difficult. Caribou
hunting occurs from July to late August, peaking in July when animals seek relief from insects at
the coast, and often continuing into the fall months (Pedersen 1990). Fishing begins in July,
usually with set gill nets, in the rivers, lagoon systems, and along the barrier islands. Arctic char
and cisco are primarily harvested from August through September.
Kaktovik hunters also harvest bearded, ringed, and spotted seals during this time. Preparation
for whaling season usually occurs in late August, when the whales migrate closest to the shore
and whaling concludes in September. Kaktovik‟s proximity to the Brooks Range allows access
to Dall sheep, generally hunted in late October through November (Jacobson and
Wentworth 1982). Kaktovik is unique among the 11 whaling communities due to its regular use
of Dall sheep by residents (Pedersen et al. 1985). Hunting and trapping usually begins early in
November and continues throughout the winter months. Polar bears are harvested on an
opportunistic basis. Wolf and wolverine hunting occurs from early December through mid-May.
Winter fishing occurs from late February through early April. Dall sheep, wolf, wolverine,
caribou, and an occasional moose are also harvested from late February through early April
(Jacobson and Wentworth 1982).

Alaska Stand Alone Gas Pipeline 5.14-25 Final EIS
TABLE 5.14-5 Annual Cycle of Subsistence Activities – Kaktovik
Winter Spring Summer Fall
Nov Dec Jan Feb Mar Apr May Jun Jul Aug Sep Oct
Fish
Birds/Eggs
Moose
Caribou
Brown Bear
Small Mammals
Furbearers
Dall Sheep
Polar Bear
Seals
Bowhead Whale
No to Very Low Levels of Subsistence Activity
Low to Medium Levels of Subsistence Activity
High Levels of Subsistence Activity
Sources: Jacobson and Wentworth 1982, ADF&G 1986, Stephen R. Braund & Associates 2011.
The seasonal availability of many important subsistence resources directs the timing of
Nuiqsut‟s subsistence harvest activities (Table 5.14-6). This table summarizes Nuiqsut‟s annual
cycle of subsistence activities according primarily to data collected in the 1970s and 1980s.
Due to climate change and other factors, the timing of certain subsistence activities may have
changed since that time. Fishing may occur year-round, but is most common from breakup (late
June) through November (Fuller and George 1999). Beginning in March, Nuiqsut residents hunt
ptarmigan. Waterfowl hunting begins in the spring, and hunters typically harvest ducks and
geese while participating in other subsistence activities such as jigging for burbot or lingcod
(IAI 1990a). Caribou are harvested primarily during the late summer and fall months but are
hunted year-round. Moose hunting takes place in August and September in boat-accessible
hunting areas south of Nuiqsut (Fuller and George 1999). Many Nuiqsut residents participate in
subsistence fishing. If weather and ice conditions permit, summer net fishing at fish camps or
near the community begins in June or July. Bowhead whaling usually occurs in September
when the whales migrate closer to the shore. Nuiqsut hunters harvest few polar bears, but if
they are harvested it is often after the fall whaling season. Gill netting at campsites is the most
productive between October and mid-November. Furbearer hunters pursue wolves and
wolverines through the winter months, primarily in mid-March and April. Furbearer hunting can
be undertaken anytime during the winter; however, most hunters avoid going out in the middle
of winter because of poor weather conditions and lack of daylight (IAI 1990a).

Alaska Stand Alone Gas Pipeline 5.14-26 Final EIS
TABLE 5.14-6 Annual Cycle of Subsistence Activities – Nuiqsut
Winter Spring Summer Fall
Nov Dec Jan Feb Mar Apr May Jun Jul Aug Sep Oct
Fish
Birds/Eggs
Berries
Moose
Caribou
Furbearers
Polar bear
Seals
Bowhead
No to Very Low Levels of Subsistence Activity
Low to Medium Levels of Subsistence Activity
High Levels of Subsistence Activity
Sources: IAI 1990a and RFSUNY 1984, Stephen R. Braund & Associates 2011.
Interior Region
The Interior region is a diverse geographical area located south of the Brooks Range and north
of the Alaska Range comprised of highlands, forested lowlands, bottomlands, and flats that are
drained by the Koyukuk, Yukon, and Tanana rivers. The Interior Highlands, Interior Forested
Lowlands and Uplands, Interior Bottomlands, and Yukon Flats ecoregions characterize this
environment. The Interior Highlands are low rounded mountains interspersed with glaciated
rugged peaks with dwarf scrub vegetation and open spruce stands. The Interior Forested
Lowlands and Uplands have a continental climate, lack Pleistocene glaciations, and have a
predominance of forests. The landscape of the Interior Bottomlands is flat and poorly drained
terrain along large rivers surrounded by forests and wetlands. Finally, the Yukon Flats
ecoregion is similar to the Interior Bottomlands but differs in that it has more extreme climate
and less precipitation (Gallant 1995).
The people residing in this region are primarily descendants of Athabascan-language speaking
groups with regional and linguistic distinctions. Athabascan-language groups in the Interior
region near the proposed Project corridor include Koyukon and Tanana. The Athabascan-
language speaking peoples of Interior Alaska in the late prehistoric and early historic period
typically lived in small bands along river drainages and lakes. Koyukon-speaking people lived
along the Koyukuk and Yukon rivers and their tributaries. Tanana-speaking bands lived along
the Tanana River from near the Kantishna River confluence east beyond the present border
with Canada (McKennan 1981) (Figure 5.14-4). Interior people may also speak Iñupiaq or have
Iñupiat heritage in communities such as Alatna and Beaver. Alatna and Beaver include Iñupiat
Alaska Stand Alone Gas Pipeline 5.14-27 Final EIS
people from Kobuk and Barrow, respectively, who moved to those areas just before the turn of
the 20th century in search of better living conditions, trade, and to escape what they perceived
as “crowding” where they came from. Centuries of conflict and cooperation along the borders
between the Iñupiat and Athabascan speakers have created blurred boundaries between
peoples especially in the upper Koyukuk River drainage, where some researchers theorize that
Athabascan people once lived in the Brooks Range in the vicinity of Anaktuvuk Pass and other
mountain valleys (Raboff 2001).
The timing and location of harvests favored small, family centered bands that in some cases
gathered together for salmon harvests or trade, but for most of their history were dispersed on
the landscape in small camps. Bands in close proximity often shared a dialect or language, but
over the vast spaces of the interior regions changes accumulated such that the differences
constitute a dialectical or linguistic boundary. These boundaries are exclusively linguistic, as
across the interior material culture, technology, food harvesting techniques and social culture
are very similar. Caribou were hunted using drivelines and snares. Moose could be snared or
stalked. Bears could be snared, stalked, or harvested from their dens during the winter. Fish
were harvested with a variety of traps and weirs as well as spears and arrows. Grouse,
ptarmigan, arctic hares, and other small mammals were trapped and snared. These resources
were then used or stored in an array of caches both above and below ground for later use or
trade. Travel was on foot or by birch bark canoe, with some use of boats made of fresh animal
hides stretched over a wooden frame if the hunters had traveled far up a stream drainage and
successfully harvested animals (VanStone 1974).
The Interior of Alaska includes a variety of Alaska Native peoples as well as more recent
residents of various ethnic backgrounds. Athabascan peoples in the Yukon River drainages rely
for subsistence on a mix of salmon, caribou, moose, freshwater fish, small mammals, birds, and
seasonal vegetation. Modern Athabascan and other Interior residents use snowmachines, light
planes, ATVs, and outboard equipped boats to access the same suite of subsistence resources
today. Subsistence resource harvests are limited by the time available to harvest them in a
mixed subsistence and wage economy, regulations intended to manage fish, game, and
migratory waterfowl, and the costs of fuel and equipment needed to harvest game
(Andersen and Alexander 1992). A further complication occurs where road access enables
urban sport hunters to compete for resources on an even footing with local hunters, particularly
where snowmachines and ATVs allow broad land access at high speeds (Simeone 2002).
The Interior region encompasses 26 study communities (Table 5.14-1). Of the 26 communities,
10 are federally recognized tribes and include Alatna, Allakaket, Beaver, Evansville, Manley Hot
Springs, Minto, Nenana, Rampart, Stevens Village, and Tanana. These tribes have traditional
and current resource uses, including customary and traditional, educational, or ceremonial uses
in or near the proposed Project area. Other communities within this region included in this
analysis are Anderson, Bettles, Coldfoot, College, Eielson AFB, Ester, Fairbanks, Fox, Healy,
Livengood, McKinley Park, Moose Creek, North Pole, Pleasant Valley, Two Rivers, and
Wiseman. Based on the available information, the following discussion provides a description of
the 26 communities and their subsistence harvest patterns, seasonal round, and use areas.
Alaska Stand Alone Gas Pipeline 5.14-28 Final EIS
Community Descriptions
Alatna
The 2010 population reported by the U.S. Census Bureau (2011) showed 32 residents in
Alatna, with 97 percent Alaska Native. The community was formerly located on a river bar, but
relocated following a flood in 1994. Alatna is located downstream from and across the river
from Allakaket at a site that formerly was the location of a trading village where Kobuk and
Koyukon people met to trade products from the coast for the furs of the interior (Marcotte and
Haynes 1985). The modern community began in 1914 when several Kobuk River Iñupiat
families settled there, where a small Gold Rush era boomtown had left an abandoned trading
post. After the flood of 1964, the community rebuilt on the same location, but after the 1994
floods the community was moved to high ground further downstream. The Alatna Tribal Council
is a federally recognized tribe.
Allakaket
Allakaket and its environs were the location of a seasonal trading camp, where Athabascans
would trade with Iñupiat people who had descended the Alatna River (Raboff 2001). Allakaket
was established as a permanent residential location in 1906 when the Reverend Hudson Stuck
established a mission school for Native children, the St. John‟s in the Wilderness Episcopal
Mission (ADCCED 2011). A post office was established in 1925. The general vicinity of the
confluence of the Alatna River with the Koyukuk River was referred to as Alatna until 1938,
when the name for the primarily Koyukon mission community was changed to Allakaket and the
Iñupiat community across the river became Alatna. In 1978, a clinic and airport were
constructed for village residents. The community was flooded in 1964 and 1994, and rebuilt
afterwards; following the 1994 flood a new housing development was built on an adjacent hill,
but many rebuilt on the floodplain (ADCCED 2011). In 2010, the population was 105 persons,
of whom 95 percent were Alaska Native (U.S. Census Bureau 2011). The Allakaket Tribal
Council is a federally recognized tribe.
Anderson
Anderson is a small community on a spur of the Parks Highway adjacent to and closely
associated with the Clear Air Force Base, within the city limits of Anderson. The population
reported by the 2010 U.S. Census was 246 (U.S. Census Bureau 2011). The majority of the
population is non-Native with only 3 percent Alaska Native. The community is named for Arthur
Anderson, a homesteader who divided his 80 acre plot into 0.25 acre lots in 1959 for sale to
civilian and military workers at the Ballistic Missile Early Warning System site, which began
construction in 1958 and concluded in 1961 (ADCCED 2011).
Beaver
The community of Beaver is located on the north bank of the Yukon River in a floodplain area
called the Yukon Flats. The community was established in 1910 during a gold rush on the
Chandalar River following the construction of a government road from the site north to the gold
fields near Caro. Thomas Carter and H.E. Ashelby established a trading post there in 1910.

Alaska Stand Alone Gas Pipeline 5.14-29 Final EIS
Frank Yasuda, a Japanese-American trader from Barrow, arrived with his extended family in
1911 and became a partner in the trading post. The present community is composed of North
Slope and Kobuk Iñupiat and Koyukon and Gwich‟in Athabascan speakers (ADCCED 2011). In
2010 the population was 84 people in residence in Beaver, 98 percent of whom were Alaska
Native (U.S. Census Bureau 2011). The Beaver Tribal Council is a federally recognized tribe.
Bettles
Bettles is primarily Euro-American with zero percent Alaska Native population (U.S. Census
Bureau 2011). In 2010, the U.S. Census population was 12. Old Bettles was founded during
the 1899 Koyukuk River gold rush at the end of steamboat navigation and hosted a post office
from 1901 to 1956. New Bettles grew around a Federal Aviation Administration (FAA) runway
built in 1948 some 6 miles from Old Bettles. This airfield was used to service Cold War defense
sites such as the DEW Line radar sites and the White Alice Communications System (WACS)
sites, and to explore Naval Petroleum Reserve A properties (Airnav.com 2010, ADCCED 2011,
Anderson 2010).
Coldfoot
Coldfoot is located at the mouth of Slate Creek on the east bank of the Middle Fork Koyukuk
River at MP 175 of the Dalton Highway, formerly known as the North Slope Haul Road. The
2010 reported population was 10, of whom 10 percent were Alaska Native
(U.S. Census Bureau 2011). Slate Creek was the point on the Koyukuk River where
prospectors supposedly got “cold feet” and turned around. In 1902, Coldfoot had two
roadhouses, two stores, seven saloons, a post office, and a gambling house. In 1912, however,
the town was abandoned as gold rushes took place to the north on Nolan and Wiseman Creeks
(ADCCED 2011). The community now services individuals traveling along the Dalton Highway
(e.g., motel, restaurant, gas station) as well as holding a few limited government jobs for a state
trooper, state Fish and Wildlife officer, and BLM office.
College
College, where the University of Alaska was established in 1916 at MP 467 of the Alaska
Railroad (ARR) is immediately adjacent to Fairbanks now. The 2010 reported population was
12,964, of whom 9 percent were Alaska Native (U.S. Census Bureau 2011). College today is a
suburb of Fairbanks.
Eielson AFB
Eielson Air Force Base is located 26 miles south of Fairbanks on the Richardson Highway past
the City of North Pole. The 2010 population was 2,647, of whom 1 percent were Alaska Native
(U.S. Census Bureau 2011). Eielson was originally established as the 26 Mile Airfield, named
for its distance from Fairbanks, during World War II as an alternative landing field for aircraft
being ferried to Fairbanks for delivery to Russia as part of the Lend-Lease program. The base
served the Air Force through the Korean, Vietnam, and Cold War periods and continues to host
exercises and maintain the facilities as part of its current military mission
(U.S. Department of Defense n.d.).
Alaska Stand Alone Gas Pipeline 5.14-30 Final EIS
Ester
Ester is located 8.5 miles west of Fairbanks on the George Parks Highway and was originally a
mining camp established before 1905 near Ester Creek. The 2010 reported population was
2,422, of whom 7 percent were Alaska Native. The Ester Gold Camp was established in 1936.
Today Ester is a suburban enclave of Fairbanks.
Evansville
Evansville is located adjacent to the community of Bettles (Bettles Lodge) and had a population
of 15 in 2010, with 53 percent Alaska Native (U.S. Census Bureau 2011). Wilford Evans, owner
and proprietor of a tow and barge company in Allakaket, established a lumber mill at the site
before World War II, and later built a lodge and general store. In 1948, the FAA built an airfield
nearby which became the center for a new town. Evansville is less than a mile away from
Bettles and has a mixed population of Koyukon and Iñupiat residents, some of whom came to
the area from Alatna and Allakaket with Evans (Anderson 2010, ADCCED 2011). Evansville
Tribal Council is a federally recognized tribe.
Fairbanks
Fairbanks is located on the Chena River near its confluence with the Tanana River some
358 miles north of Anchorage on the George Parks Highway. The 2010 population was 31,535,
10 percent of whom were Alaska Native (U.S. Census Bureau 2011). The total population for
the Fairbanks North Star Borough which includes Fairbanks and several outlying census
designated places was 97,581 in 2010. Fairbanks has the second largest city population in
Alaska. Koyukon and/or Tanana Athabascan had used the vicinity for centuries, and the
Campus site on the University of Alaska campus is one of the older known sites in interior
Alaska (Mobley 1996). Fairbanks was established as Barnette‟s Cache in 1901, where Captain
E.T. Barnette established a trading post on the Chena River. A year later, gold was discovered
16 miles north at Pedro Dome, and the community was named for Indiana Senator Charles
Fairbanks. In 1903, Judge James Wickersham moved the district court from Eagle, on the
Yukon River, to Fairbanks. Barnette was mayor and rapidly established a steam heat plant,
electrical power plant, telephone service, fire, police and sanitation ordinances, and the
Washington Alaska Bank. As Fairbanks continued to grow into the hub of Interior Alaska, it
became the county seat, home of the courthouse, jail, and other government services, and in
1923 the terminus of the ARR. Gold mining in surrounding areas and transportation of goods to
mining towns on the river system continued to contribute to the local economy. In 1940, the Air
Corps established Ladd Field in Fairbanks. In World War II, Fairbanks and Ladd Field became
a center of military aviation as aircraft were ferried through and transferred to Soviet pilots in the
Lend-Lease program (U.S. Department of Defense undated), and construction of the Alaska
Highway and other defense based infrastructure helped Fairbanks grow through the Cold War
years. In 1961, the Army assumed control of Ladd Air Force Base and renamed it to Fort
Wainwright (U.S. Army 2011). In the 1970s, Fairbanks was a construction hub for the Trans
Alaska Pipeline System (TAPS), connecting the North Slope to tidewater oil facilities at Valdez
(ADCCED 2011).

Alaska Stand Alone Gas Pipeline 5.14-31 Final EIS
Fox
Fox is located on the right bank of Fox Creek in the Goldstream Valley 10 miles northeast of
Fairbanks. The 2010 population was 417, of whom 7 percent were Alaska Native (U.S. Census
Bureau 2011). Fox was established as a mining camp and later served other mining activities in
the Goldstream Valley, including as a railroad station on the Tanana Valley Railroad on its route
from Fairbanks to Chatanika. Fox had a post office from 1908 to 1947. Today, Fox is on the
road system and connected to Fairbanks (ADCCED 2011). The Elliott Highway which connects
Livengood, Minto, and Manley Hot Springs to the Fairbanks area begins in Fox.
Healy
Healy is located at the confluence of Healy Creek and the Nenana River, 78 miles southwest of
Fairbanks, originally on a 2.5 mile spur road off the George Parks Highway just north of the
entrance to Denali National Park. Today residents live on both sides of the Parks Highway. In
2010, Healy had a population of 1,021, of whom 2 percent were Alaska Native (U.S. Census
Bureau 2011). Healy was established as a town in 1904, but coal mining became its major
business in 1921 and continues to this day (ADCCED 2011, Stewart 1921).
Livengood
Livengood is located 80 road miles northwest of Fairbanks on the Elliott Highway just south of
the junction with the Dalton Highway. The 2010 population was 13, of whom 23 percent were
Alaska Native (U.S. Census Bureau 2011). Gold was discovered on Livengood Creek in 1914
and a mining camp was established that winter, with a post office built in 1915 and operating
until 1957 (ADCCED 2011).
Manley Hot Springs
Manley Hot Springs is located approximately 40 miles southwest of Minto and 5 miles north of
the Tanana River. The U.S. Census Bureau (2011) reported that the 2010 population of Manley
Hot Springs was 89, 13.5 percent of whom were Alaska Native. The Manley Hot Springs Village
is a federally recognized tribe. Originally named “Hot Springs,” the community was established
in the early 1900s as a supply station for miners in the Eureka and Tofty mining districts
(ADCCED 2011). In 1907, The Hot Springs Resort and Hotel was constructed by Frank Manley
and catered to guests taking overland stagecoaches from Fairbanks. The community grew and
a bakery, clothing stores, and other businesses were established (ADCCED 2011). At its peak,
the population of Hot Springs surpassed 500. In 1913, the Hot Springs Resort burned down
and the closure of the resort, in combination with the decrease in mining activity, resulted in all
but 29 residents leaving Hot Springs. The name of the community was officially changed to
“Manley Hot Springs” in 1957, after which a small school was established.
McKinley Park
McKinley Park is a community that formed at the entrance to Denali National Park on the
George Parks Highway, 122 miles south of Fairbanks and 237 miles north of Anchorage. The
2010 population was 185, of whom zero percent were Alaska Native (U.S. Census Bureau
2011). The community primarily serves tourists who come to the area to access Denali National
Alaska Stand Alone Gas Pipeline 5.14-32 Final EIS
Park. From May to September, during the peak tourist season, the population of the community
increases to serve the tourists and then shrinks to a small number of year-round residents
during the off-season winter months.
Minto
Minto is a predominantly Alaska Native community located on the Tolovana River some 40 air
miles west of Fairbanks (the village is located on the road system 130 miles from Fairbanks).
The 2010 population was 210, of whom 90 percent were Alaska Native (U.S. Census
Bureau 2011). The current site of Minto, a seasonal hunting camp since at least 1900, was
established as a permanent community from 1969 to 1971 when the BIA resettled residents
from the site of Old Minto on the Tanana River, 20 miles to the south. The community was
relocated into a planned community on the road system to escape flooding and erosion at the
Old Minto site. The Native Village of Minto is a federally recognized tribe. Minto people lived
out on the land in a number of small communities, camps, and trapline areas until Old Minto
was established in 1917 as a semi-permanent settlement for small family-based groups who
lived on the Minto Flats for much of the year (Andrews 1988). Old Minto had a BIA school by
1937, but area residents did not live in Minto year-round until the 1950s (ADCCED 2011).
Residents primarily speak Tanana, with some speaking Koyukon Athabascan languages. They
moved seasonally in search of game and furbearers for trade, traveling on the river systems of
the flats and over a system of trails and portages, with some traveling as far as Fort Yukon,
Tanana, and Rampart during the year (Andrews 1988).
Moose Creek
Moose Creek is a predominantly Euro-American community located 20 miles southeast of
Fairbanks, 6 miles south of North Pole, and adjacent to Eielson Air Force Base. The community
had population of 747 in 2010, of whom 5 percent were Alaska Native (U.S. Census
Bureau 2011). The Moose Creek area is a suburb of the greater Fairbanks area.
Nenana
Nenana is located on the south bank of the Tanana River on the ARR and Parks Highway, 55
miles south of Fairbanks. It lies in the western extent of Tanana Athabascan territory in an area
with some of the oldest known archaeological sites in the state, the 11,000 to 12,000 year old
Nenana Complex. The 2010 population was 378, of whom 38 percent were Alaska Native (U.S.
Census Bureau 2011). Nenana Native Association is a federally recognized tribe. The
community was originally called Tortella, an English language interpretation of “Toghotthele,”
meaning “mountain that parallels the river” (ADCCED 2011). In legendary times, it was a place
where humans and animals could talk to one another (Shinkwin and Case 1984). It was
founded after the turn of the 20th century when three bands began to live for some or all of the
year near an Episcopalian mission (1905) and a fur trading post (1903) (ADCCED 2011,
Shinkwin and Case 1984). These bands included the Tanana-speaking Nenana-Toklat and
Wood River bands, while the third band, Mouth of Toklat, spoke Koyukon (Shinkwin
and Case 1984). The Euro-American population increased dramatically with the construction of
the ARR beginning in 1916 (Shinkwin and Case 1984). The town served as the starting place
Alaska Stand Alone Gas Pipeline 5.14-33 Final EIS
for the 1925 serum run to Nome, the inspiration for the Iditarod sled dog race (ADCCED 2011).
The town continues to be a river port, rail depot, and highway stop for freight and tourists.
North Pole
North Pole is located 14 miles southeast of Fairbanks on the Richardson Highway. The 2010
population was 2,117, with 3 percent of residents Alaska Native (U.S. Census Bureau 2011).
As noted above, the population for the Fairbanks North Star Borough which includes North Pole
and several outlying census designated places was 97,581 in 2010. North Pole was
homesteaded in 1944; this homestead was bought out and subdivided, with the subdivision
named North Pole in the hopes that a toy manufacturer would locate a factory there based on
the name. The city was incorporated in 1953 and grew with the development of Fairbanks, Fort
Wainwright, and Eielson Air Force Base, between which the nascent community was situated.
Santa Claus House was established in 1953 and continues to be a popular attraction
(ADCCED 2011).
Pleasant Valley
Pleasant Valley is a suburb of Fairbanks, located in the unincorporated North Star Borough a
few miles past Two Rivers on Chena Hot Springs Road. Development in the area is largely the
result of population growth in the Fairbanks area. The 2010 population was 725, of whom 4
percent were Alaska Native (U.S. Census Bureau 2011).
Rampart
Rampart City was a gold rush boomtown established in 1897 on the south bank of the Yukon
River in a low range of mountains that form a figurative “rampart” or defensive wall dividing the
Yukon Flats from downstream. The community boomed in 1898 and by 1903 a community of
10,000 had been built, and then subsequently abandoned, as gold strikes were made in other
areas of the region. Places such as Nome, Fairbanks, Anvil Creek, and the Upper Koyukuk
River drew boomers away. Koyukon Athabascans from area communities moved into the
community and concentrated there over time. A U.S. Department of Agriculture (USDA)
experimental farm was operated on the north bank from 1900 to 1925. Gold mining, salmon
canning, and forest products have provided income for residents in the past. The school closed
for lack of students in 1999 and many families were forced to relocate for this reason. The 2010
population was 24 with 96 percent Alaska Native (U.S. Census Bureau 2011). Rampart Village
Council is a federally recognized tribe.
Stevens Village
Stevens Village is located on the north bank of the Yukon River, 17 miles upstream of the
Dalton Highway Bridge (ADCCED 2011). The community was established by three Koyukon-
speaking brothers, Old Jacob, Gochonayeeya, and Old Steven, for whom the village was
named when he became chief in 1902 (ADCCED 2011). The community is the furthest east
community where Koyukon Athabascan is the majority population (Sumida 1988). The
community cut wood to sell to miners and to supply steamboats heading upriver from St.
Michaels en route to Fort Yukon and other communities in the Upper Yukon River region. A
Alaska Stand Alone Gas Pipeline 5.14-34 Final EIS
trading post handled furs as well as serving gold miners in the region. The population in 2010
was 78, of whom 85 percent were Alaska Native (U.S. Census Bureau 2011). Stevens Village
Indian Reorganization Act Council is a federally recognized tribe.
Tanana
Tanana is located near the confluence of the Tanana and Yukon rivers. Tanana‟s population in
2010 was 246, of whom 87 percent were Alaska Native (U.S. Census Bureau 2011). The
Native Village of Tanana is a federally recognized tribe. The confluence had long been the
location of a trade fair, called Nuklukayet, where people from all along the Yukon River
drainages would gather to trade goods; however, the name was not specific to a certain location
and a number of places were given that name (de Laguna 2000). Tanana people were primarily
speakers of Koyukon Athabascan.
Two Rivers
Two Rivers is an unincorporated area of the Fairbanks North Star Borough spread along the
Chena Hot Springs Road from MP 13 to 25. The area had a population in 2010 of 719, of whom
4 percent were Alaska Native (U.S. Census Bureau 2011). The area was the site of a territorial
school at one time.
Wiseman
Wiseman is located off the Dalton Highway on the Middle Fork of the Koyukuk River at the
confluence with Wiseman Creek, some 260 miles north of Fairbanks. The population in 2010
was 14, none of whom were Alaska Native (U.S. Census Bureau 2011). Wiseman is the
successor city to Coldfoot, 13 miles south, and was established in 1907 at the end of a horse
drawn barge route to gold mines further upstream. Many structures from the peak occupation of
the community are still present and standing. The community was connected to the road
system in 1974, when the TAPS haul road was built, and public access was allowed in 1994
(ADCCED 2011).
Subsistence Use Areas
The subsistence use areas for the Interior region cover an expansive and diverse geographical
area as shown on Figure 5.14-10. The source and time period for these mapping studies are
listed in Table 5.14-2. Not all study communities in this region have had subsistence use area
mapping studies conducted in their community; very few non-rural communities (e.g., Fairbanks,
College, and North Pole) have had subsistence mapping studies. Figure 5.14-10 shows
subsistence use areas for 11 of the 26 Interior region communities. The combined use areas
for the 11 study communities with mapped data extend from the middle Yukon River area in the
west towards the Canadian border in the east; in the north, use areas are located within the
Brooks Range and to the south use areas extend into the Denali Highway area. Residents use
boats to travel along rivers for both subsistence harvesting and for traveling. For those study
communities with access to the road system, the roads can be important use areas as well as
transportation corridors that allow residents to access other subsistence use areas. Inland
areas off of the road system are often accessed using ATVs. Planes, while not the primary
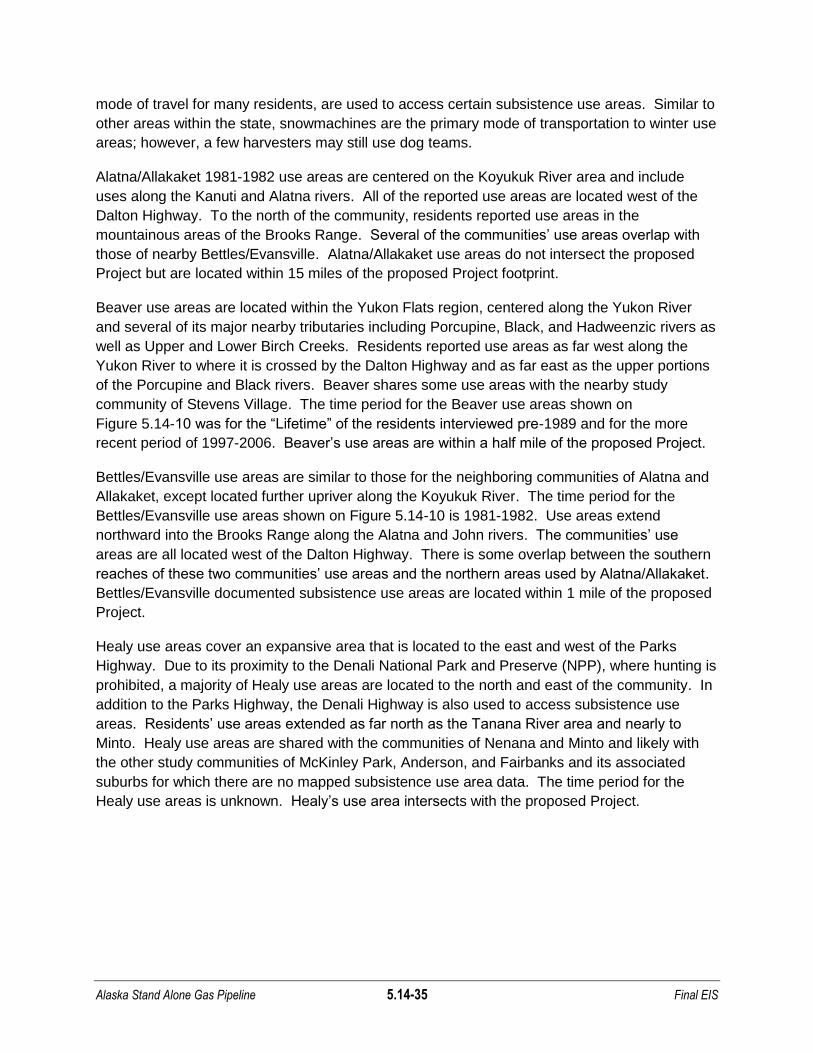
Alaska Stand Alone Gas Pipeline 5.14-35 Final EIS
mode of travel for many residents, are used to access certain subsistence use areas. Similar to
other areas within the state, snowmachines are the primary mode of transportation to winter use
areas; however, a few harvesters may still use dog teams.
Alatna/Allakaket 1981-1982 use areas are centered on the Koyukuk River area and include
uses along the Kanuti and Alatna rivers. All of the reported use areas are located west of the
Dalton Highway. To the north of the community, residents reported use areas in the
mountainous areas of the Brooks Range. Several of the communities‟ use areas overlap with
those of nearby Bettles/Evansville. Alatna/Allakaket use areas do not intersect the proposed
Project but are located within 15 miles of the proposed Project footprint.
Beaver use areas are located within the Yukon Flats region, centered along the Yukon River
and several of its major nearby tributaries including Porcupine, Black, and Hadweenzic rivers as
well as Upper and Lower Birch Creeks. Residents reported use areas as far west along the
Yukon River to where it is crossed by the Dalton Highway and as far east as the upper portions
of the Porcupine and Black rivers. Beaver shares some use areas with the nearby study
community of Stevens Village. The time period for the Beaver use areas shown on
Figure 5.14-10 was for the “Lifetime” of the residents interviewed pre-1989 and for the more
recent period of 1997-2006. Beaver‟s use areas are within a half mile of the proposed Project.
Bettles/Evansville use areas are similar to those for the neighboring communities of Alatna and
Allakaket, except located further upriver along the Koyukuk River. The time period for the
Bettles/Evansville use areas shown on Figure 5.14-10 is 1981-1982. Use areas extend
northward into the Brooks Range along the Alatna and John rivers. The communities‟ use
areas are all located west of the Dalton Highway. There is some overlap between the southern
reaches of these two communities‟ use areas and the northern areas used by Alatna/Allakaket.
Bettles/Evansville documented subsistence use areas are located within 1 mile of the proposed
Project.
Healy use areas cover an expansive area that is located to the east and west of the Parks
Highway. Due to its proximity to the Denali National Park and Preserve (NPP), where hunting is
prohibited, a majority of Healy use areas are located to the north and east of the community. In
addition to the Parks Highway, the Denali Highway is also used to access subsistence use
areas. Residents‟ use areas extended as far north as the Tanana River area and nearly to
Minto. Healy use areas are shared with the communities of Nenana and Minto and likely with
the other study communities of McKinley Park, Anderson, and Fairbanks and its associated
suburbs for which there are no mapped subsistence use area data. The time period for the
Healy use areas is unknown. Healy‟s use area intersects with the proposed Project.
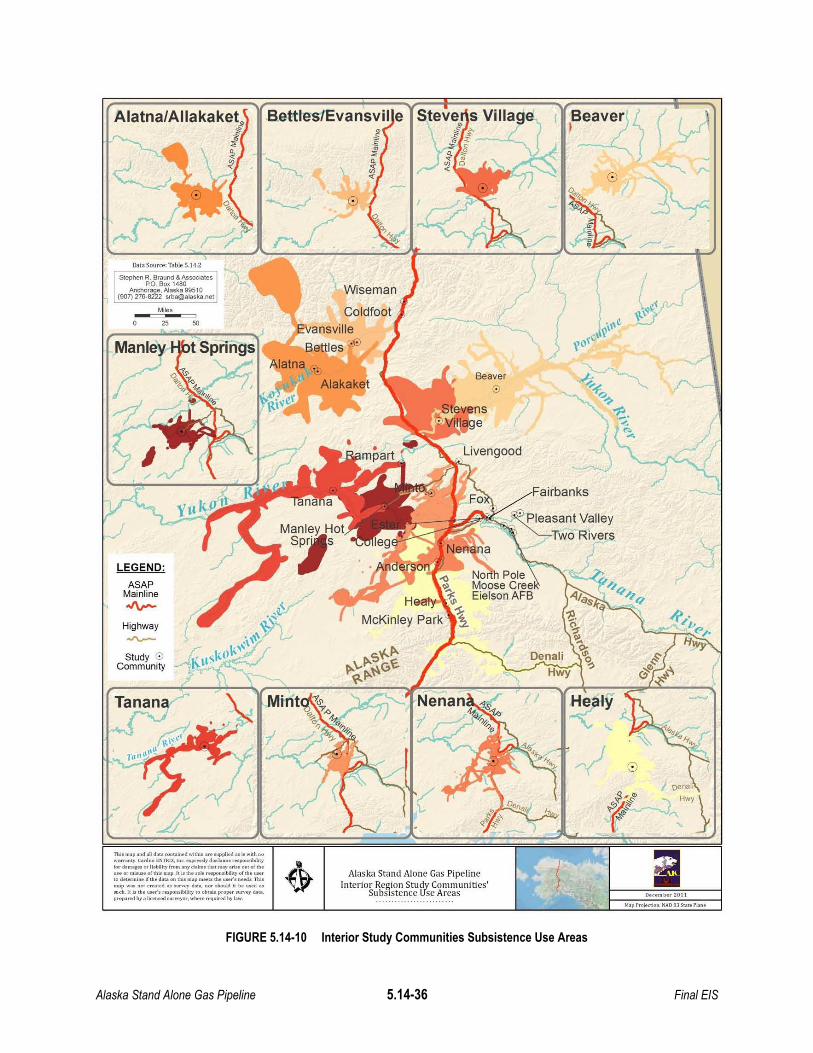
Alaska Stand Alone Gas Pipeline 5.14-36 Final EIS
FIGURE 5.14-10 Interior Study Communities Subsistence Use Areas
Data Soun:e: Table 5,14.2
Slepl>en R. Braund & AssociatesP,O. Bo. 1480
Anchofage, Alaska 99510(907) 27&-8222 [email protected]
Miles
LEGEND:
ASAPMainline
""'-Highway
""'---
Study'"Community
TItt, p "'d all d... "",tI.l...d wltill........ppll..... "w~hAOw ty. (on!"" ~NTR".,.,. ,,,,,,,<OIly dlJ<i,im ••"po.,lbmty
f<>r d.om.., h.bHltyf..,m ••yd.lm. 'ho' mor Iri.. "",.,..til. ~1)... '" "'I ol,hll p, I, ","1Oio ,..po."lbUlty ol,h• .-'0 d ' .. 'Itil,d on ,h'. m.p m the .......ee<I. '"'''""'p w•••ot , ... ted oy d.o ", olw>uld "be ooe<l ..",<It, It I, Ut• ... f • •••""".lbUity to ob,.I. p'op'" ""'0)' 41..."'......... by a U.............~y<>t, who« '"'1"1,... ~ Jaw.
Alaska Stand Alone Gas PipelineInterior Region Study Communities'
SubsIstence Use Areas
I Denali
~,. Hw \
:~~ y)
De<.mb.r lOll
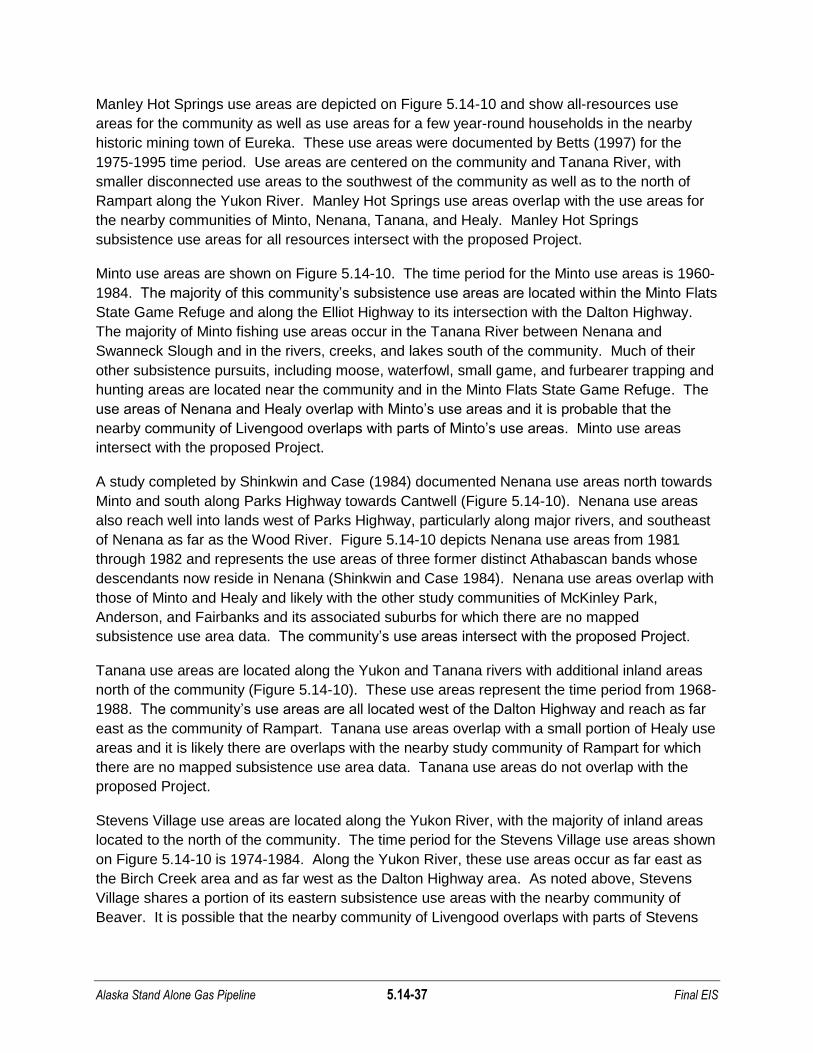
Alaska Stand Alone Gas Pipeline 5.14-37 Final EIS
Manley Hot Springs use areas are depicted on Figure 5.14-10 and show all-resources use
areas for the community as well as use areas for a few year-round households in the nearby
historic mining town of Eureka. These use areas were documented by Betts (1997) for the
1975-1995 time period. Use areas are centered on the community and Tanana River, with
smaller disconnected use areas to the southwest of the community as well as to the north of
Rampart along the Yukon River. Manley Hot Springs use areas overlap with the use areas for
the nearby communities of Minto, Nenana, Tanana, and Healy. Manley Hot Springs
subsistence use areas for all resources intersect with the proposed Project.
Minto use areas are shown on Figure 5.14-10. The time period for the Minto use areas is 1960-
1984. The majority of this community‟s subsistence use areas are located within the Minto Flats
State Game Refuge and along the Elliot Highway to its intersection with the Dalton Highway.
The majority of Minto fishing use areas occur in the Tanana River between Nenana and
Swanneck Slough and in the rivers, creeks, and lakes south of the community. Much of their
other subsistence pursuits, including moose, waterfowl, small game, and furbearer trapping and
hunting areas are located near the community and in the Minto Flats State Game Refuge. The
use areas of Nenana and Healy overlap with Minto‟s use areas and it is probable that the
nearby community of Livengood overlaps with parts of Minto‟s use areas. Minto use areas
intersect with the proposed Project.
A study completed by Shinkwin and Case (1984) documented Nenana use areas north towards
Minto and south along Parks Highway towards Cantwell (Figure 5.14-10). Nenana use areas
also reach well into lands west of Parks Highway, particularly along major rivers, and southeast
of Nenana as far as the Wood River. Figure 5.14-10 depicts Nenana use areas from 1981
through 1982 and represents the use areas of three former distinct Athabascan bands whose
descendants now reside in Nenana (Shinkwin and Case 1984). Nenana use areas overlap with
those of Minto and Healy and likely with the other study communities of McKinley Park,
Anderson, and Fairbanks and its associated suburbs for which there are no mapped
subsistence use area data. The community‟s use areas intersect with the proposed Project.
Tanana use areas are located along the Yukon and Tanana rivers with additional inland areas
north of the community (Figure 5.14-10). These use areas represent the time period from 1968-
1988. The community‟s use areas are all located west of the Dalton Highway and reach as far
east as the community of Rampart. Tanana use areas overlap with a small portion of Healy use
areas and it is likely there are overlaps with the nearby study community of Rampart for which
there are no mapped subsistence use area data. Tanana use areas do not overlap with the
proposed Project.
Stevens Village use areas are located along the Yukon River, with the majority of inland areas
located to the north of the community. The time period for the Stevens Village use areas shown
on Figure 5.14-10 is 1974-1984. Along the Yukon River, these use areas occur as far east as
the Birch Creek area and as far west as the Dalton Highway area. As noted above, Stevens
Village shares a portion of its eastern subsistence use areas with the nearby community of
Beaver. It is possible that the nearby community of Livengood overlaps with parts of Stevens

Alaska Stand Alone Gas Pipeline 5.14-38 Final EIS
Village use areas, particularly those located near the Dalton Highway. The proposed Project
overlaps with a portion of Stevens Village use areas.
Subsistence Harvest Patterns
Comprehensive all-resources harvest data exists for 10 of the 26 Interior study communities
(see Figure 5.14-11 and Table 5.14-2). In this region, fish and land mammals are the primary
contributors to the total subsistence harvest. In most communities, vegetation and birds/eggs
comprise less than 5 percent of the total harvest. Unlike the study communities on the North
Slope, the Interior study communities do not use marine mammals, although a few communities
(e.g., Anderson and Healy) did report harvest of marine invertebrates. Only Bettles/Evansville
reported higher harvests of land mammals than fish; all other study communities reported fish
as the greatest contributor to their community‟s subsistence harvest. The average of data from
the 10 Interior study communities displayed in Figure 5.14-11 shows that fish contributes
75 percent of the total harvest, followed by land mammals (21 percent), vegetation and
birds/eggs (2 percent), and marine invertebrates (less than 1 percent).
FIGURE 5.14-11 Percent of Harvest by Resource Category – Interior Region
0%
10%
20%
30%
40%
50%
60%
70%
80%
90%
100%
Per
cen
t o
f H
arve
st
Vegetation
Birds & Eggs
Marine Invertebrates
Land Mammals
Fish
Notes: Most Representative or Baseline Study Year data shown for all study communities except Rampart. Source: ADF&G 2010.

Alaska Stand Alone Gas Pipeline 5.14-39 Final EIS
Figure 5.14-12 shows the top three species harvested by each study community in terms of
percent of total harvest. Residents reported chum salmon to be among the top three resources
harvested for all of the 10 study communities with all resources harvest data. Chum salmon
harvests ranged from 19 to 62 percent of the total harvest. All communities except for Tanana
reported moose to be one of the top three species harvested. Moose harvests ranged from a
low of 5 percent (Stevens Village) to a high of 37 percent (Bettles/Evansville). Caribou was the
only other mammal that ranked among the top three species harvested (Anderson). Fish,
including whitefish, sheefish, Chinook salmon, northern pike, and Coho salmon comprised the
remaining top species harvested by Interior study communities. Other species not shown in
Figure 5.14-12 (e.g., black bear, hare, grayling, ptarmigan, beaver, and berries) are also
important contributors to the overall subsistence harvest and are represented in the “Other”
category. For several of the communities, the “Other” category represented over one quarter of
the subsistence harvest.
FIGURE 5.14-12 Percent of Harvest by Top Three Species – Interior Region
0%
10%
20%
30%
40%
50%
60%
70%
80%
90%
100%
Per
cen
t o
f H
arve
st
Other
Northern Pike
Caribou
Whitefish
Sheefish
Coho Salmon
Chinook Salmon
Moose
Chum Salmon
Notes: Most Representative or Baseline Study Year data shown for all study communities except Rampart. Source: ADF&G 2010.
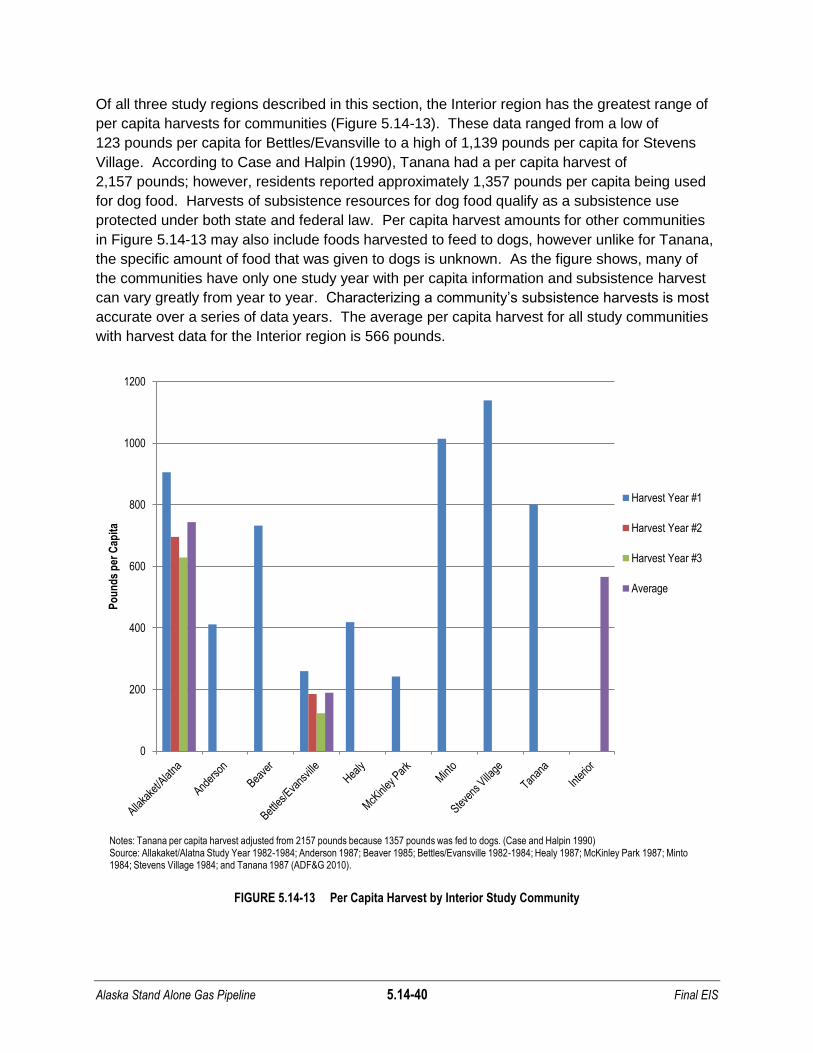
Alaska Stand Alone Gas Pipeline 5.14-40 Final EIS
Of all three study regions described in this section, the Interior region has the greatest range of
per capita harvests for communities (Figure 5.14-13). These data ranged from a low of
123 pounds per capita for Bettles/Evansville to a high of 1,139 pounds per capita for Stevens
Village. According to Case and Halpin (1990), Tanana had a per capita harvest of
2,157 pounds; however, residents reported approximately 1,357 pounds per capita being used
for dog food. Harvests of subsistence resources for dog food qualify as a subsistence use
protected under both state and federal law. Per capita harvest amounts for other communities
in Figure 5.14-13 may also include foods harvested to feed to dogs, however unlike for Tanana,
the specific amount of food that was given to dogs is unknown. As the figure shows, many of
the communities have only one study year with per capita information and subsistence harvest
can vary greatly from year to year. Characterizing a community‟s subsistence harvests is most
accurate over a series of data years. The average per capita harvest for all study communities
with harvest data for the Interior region is 566 pounds.
FIGURE 5.14-13 Per Capita Harvest by Interior Study Community
0
200
400
600
800
1000
1200
Po
un
ds
per
Cap
ita
Harvest Year #1
Harvest Year #2
Harvest Year #3
Average
Notes: Tanana per capita harvest adjusted from 2157 pounds because 1357 pounds was fed to dogs. (Case and Halpin 1990) Source: Allakaket/Alatna Study Year 1982-1984; Anderson 1987; Beaver 1985; Bettles/Evansville 1982-1984; Healy 1987; McKinley Park 1987; Minto 1984; Stevens Village 1984; and Tanana 1987 (ADF&G 2010).
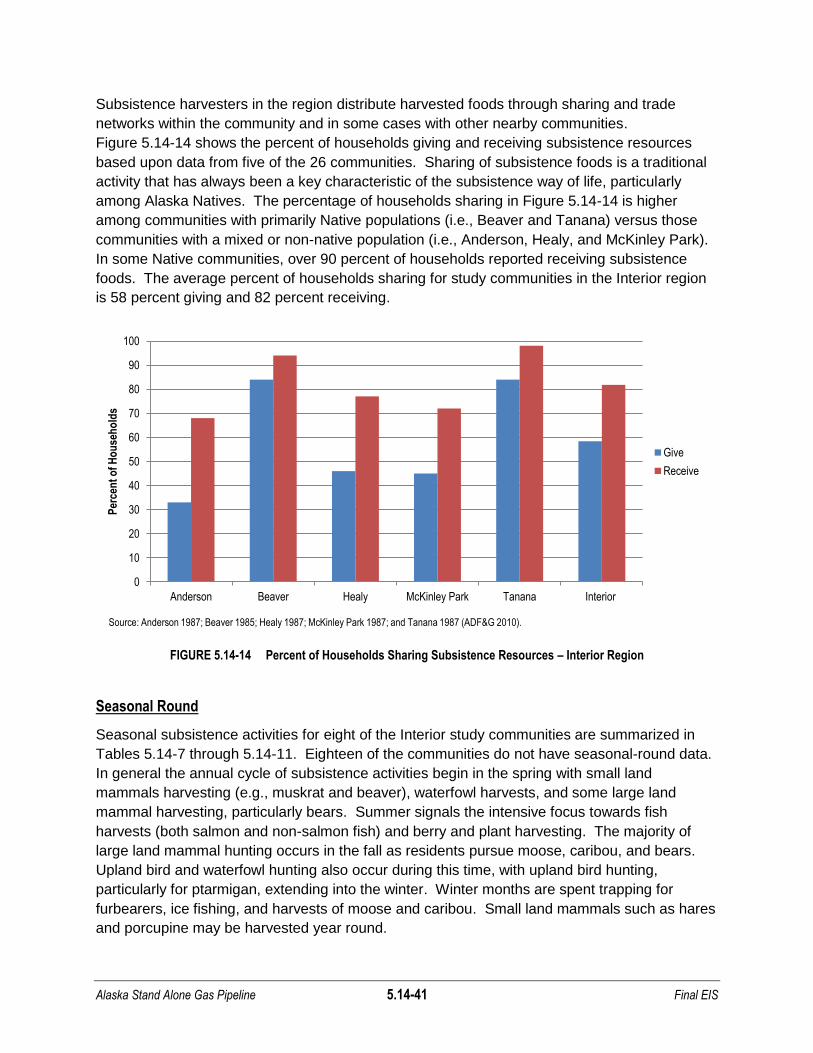
Alaska Stand Alone Gas Pipeline 5.14-41 Final EIS
Subsistence harvesters in the region distribute harvested foods through sharing and trade
networks within the community and in some cases with other nearby communities.
Figure 5.14-14 shows the percent of households giving and receiving subsistence resources
based upon data from five of the 26 communities. Sharing of subsistence foods is a traditional
activity that has always been a key characteristic of the subsistence way of life, particularly
among Alaska Natives. The percentage of households sharing in Figure 5.14-14 is higher
among communities with primarily Native populations (i.e., Beaver and Tanana) versus those
communities with a mixed or non-native population (i.e., Anderson, Healy, and McKinley Park).
In some Native communities, over 90 percent of households reported receiving subsistence
foods. The average percent of households sharing for study communities in the Interior region
is 58 percent giving and 82 percent receiving.
FIGURE 5.14-14 Percent of Households Sharing Subsistence Resources – Interior Region
Seasonal Round
Seasonal subsistence activities for eight of the Interior study communities are summarized in
Tables 5.14-7 through 5.14-11. Eighteen of the communities do not have seasonal-round data.
In general the annual cycle of subsistence activities begin in the spring with small land
mammals harvesting (e.g., muskrat and beaver), waterfowl harvests, and some large land
mammal harvesting, particularly bears. Summer signals the intensive focus towards fish
harvests (both salmon and non-salmon fish) and berry and plant harvesting. The majority of
large land mammal hunting occurs in the fall as residents pursue moose, caribou, and bears.
Upland bird and waterfowl hunting also occur during this time, with upland bird hunting,
particularly for ptarmigan, extending into the winter. Winter months are spent trapping for
furbearers, ice fishing, and harvests of moose and caribou. Small land mammals such as hares
and porcupine may be harvested year round.
0
10
20
30
40
50
60
70
80
90
100
Anderson Beaver Healy McKinley Park Tanana Interior
Per
cen
t o
f H
ou
seh
old
s
Give
Receive
Source: Anderson 1987; Beaver 1985; Healy 1987; McKinley Park 1987; and Tanana 1987 (ADF&G 2010).

Alaska Stand Alone Gas Pipeline 5.14-42 Final EIS
The seasonal round of subsistence harvest activities for communities in the Upper Koyukuk
River region (Alatna, Allakaket, Bettles, and Evansville) are presented in Table 5.14-7.
TABLE 5.14-7 Annual Cycle of Subsistence Activities – Alatna, Allakaket, Bettles/Evansville
Winter Spring Summer Fall
Nov Dec Jan Feb Mar Apr May Jun Jul Aug Sep Oct
King Salmon
Summer Chum
Fall Chum
Sheefish
Whitefish
Pike
Grayling
Sucker
Burbot
Trout
Hare
Waterfowl
Grouse
Ptarmigan
Black Bear
Moose
Sheep
Wolf
Fox
Wolverine
Lynx
Otter
Beaver
Marten
Muskrat
No to Very Low Levels of Subsistence Activity
Low to Medium Levels of Subsistence Activity
High Levels of Subsistence Activity
Sources: Marcotte and Haynes 1985: Figure 3 and 8; Stephen R. Braund & Associates 2011.

Alaska Stand Alone Gas Pipeline 5.14-43 Final EIS
Salmon and other anadromous fish harvests take place in the summer and fall, but fishing takes
place all year by various methods for a wide variety of non-salmon fish (Andersen et al. 2004b).
Waterfowl harvests occur during the spring and again in the fall months; ptarmigan and grouse
harvests occur primarily in the fall and the winter months. Large land mammals (moose, sheep,
and black bear) primary harvest months include August, September, and October. A winter
harvest also takes place in March for moose and in May for black bear. All furbearer harvests
occur in the winter and muskrat harvests continue into the spring. These are the months when
the furs are in their most prime condition. Table 5.14-8 shows the seasonal round for a typical
year as reported by Betts (1997).
TABLE 5.14-8 Annual Cycle of Subsistence Activities – Manley Hot Springs
Winter Spring Summer Fall
Nov Dec Jan Feb Mar Apr May Jun Jul Aug Sep Oct
Moose
Black Bear
Porcupine
Hare
Grouse
Ptarmigan
Waterfowl
Marten
Fox
Mink
Lynx
Otter
Weasel
Wolf
Wolverine
Beaver
Muskrat
Chinook
Summer Chum
Fall Chum
Coho
Whitefish
Sheefish
Longnose Sucker
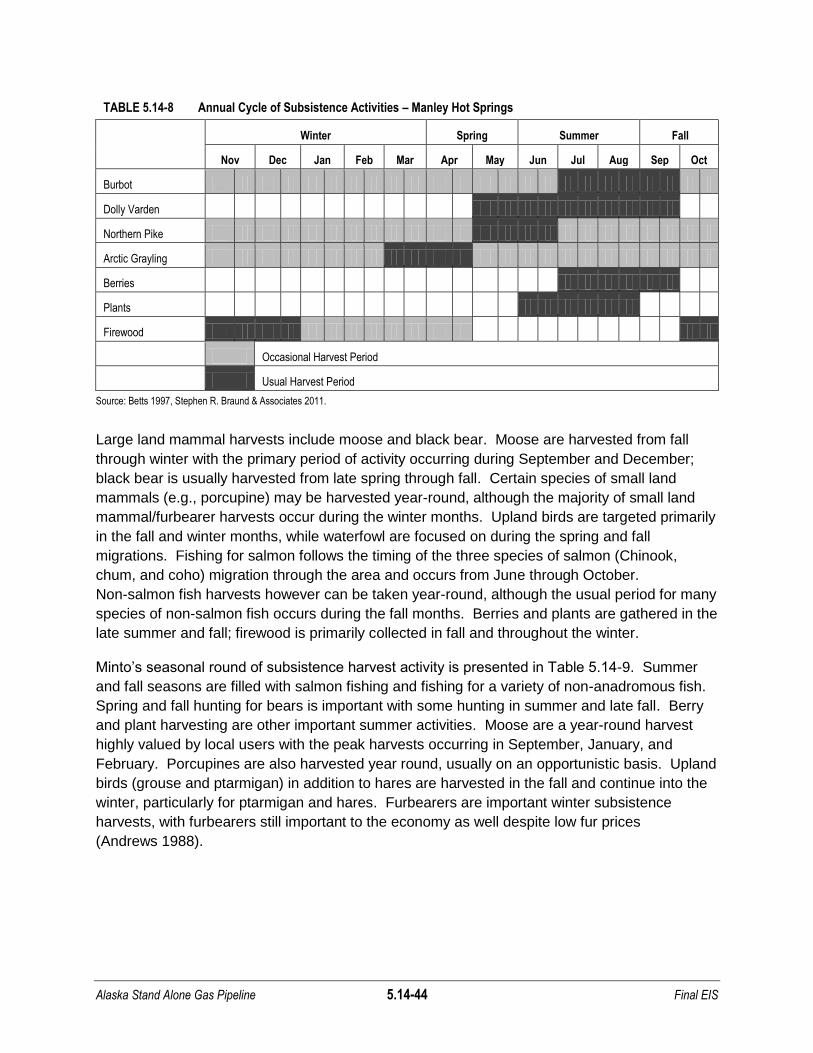
Alaska Stand Alone Gas Pipeline 5.14-44 Final EIS
TABLE 5.14-8 Annual Cycle of Subsistence Activities – Manley Hot Springs
Winter Spring Summer Fall
Nov Dec Jan Feb Mar Apr May Jun Jul Aug Sep Oct
Burbot
Dolly Varden
Northern Pike
Arctic Grayling
Berries
Plants
Firewood
Occasional Harvest Period
Usual Harvest Period
Source: Betts 1997, Stephen R. Braund & Associates 2011.
Large land mammal harvests include moose and black bear. Moose are harvested from fall
through winter with the primary period of activity occurring during September and December;
black bear is usually harvested from late spring through fall. Certain species of small land
mammals (e.g., porcupine) may be harvested year-round, although the majority of small land
mammal/furbearer harvests occur during the winter months. Upland birds are targeted primarily
in the fall and winter months, while waterfowl are focused on during the spring and fall
migrations. Fishing for salmon follows the timing of the three species of salmon (Chinook,
chum, and coho) migration through the area and occurs from June through October.
Non-salmon fish harvests however can be taken year-round, although the usual period for many
species of non-salmon fish occurs during the fall months. Berries and plants are gathered in the
late summer and fall; firewood is primarily collected in fall and throughout the winter.
Minto‟s seasonal round of subsistence harvest activity is presented in Table 5.14-9. Summer
and fall seasons are filled with salmon fishing and fishing for a variety of non-anadromous fish.
Spring and fall hunting for bears is important with some hunting in summer and late fall. Berry
and plant harvesting are other important summer activities. Moose are a year-round harvest
highly valued by local users with the peak harvests occurring in September, January, and
February. Porcupines are also harvested year round, usually on an opportunistic basis. Upland
birds (grouse and ptarmigan) in addition to hares are harvested in the fall and continue into the
winter, particularly for ptarmigan and hares. Furbearers are important winter subsistence
harvests, with furbearers still important to the economy as well despite low fur prices
(Andrews 1988).
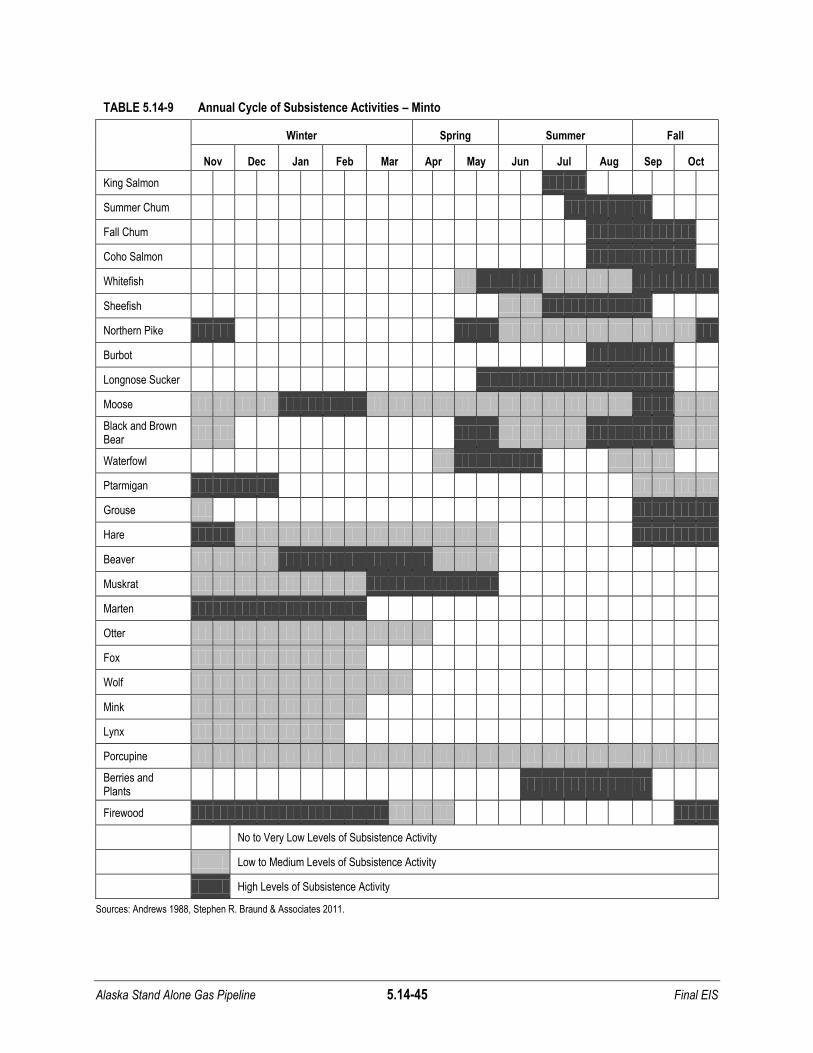
Alaska Stand Alone Gas Pipeline 5.14-45 Final EIS
TABLE 5.14-9 Annual Cycle of Subsistence Activities – Minto
Winter Spring Summer Fall
Nov Dec Jan Feb Mar Apr May Jun Jul Aug Sep Oct
King Salmon
Summer Chum
Fall Chum
Coho Salmon
Whitefish
Sheefish
Northern Pike
Burbot
Longnose Sucker
Moose
Black and Brown Bear
Waterfowl
Ptarmigan
Grouse
Hare
Beaver
Muskrat
Marten
Otter
Fox
Wolf
Mink
Lynx
Porcupine
Berries and Plants
Firewood
No to Very Low Levels of Subsistence Activity
Low to Medium Levels of Subsistence Activity
High Levels of Subsistence Activity
Sources: Andrews 1988, Stephen R. Braund & Associates 2011.

Alaska Stand Alone Gas Pipeline 5.14-46 Final EIS
Stevens Village seasonal round of subsistence harvest activities is presented in Table 5.14-10.
Salmon are harvested during the summer runs, and non-salmon fish are harvested in spring
through late fall. Berry harvests also occur during the summer. Moose are harvested in any
month with the highest levels of activity occurring in September, December, and February, and
black bear in spring, summer, and fall. Caribou are harvested throughout the winter and into
spring. Small mammals are harvested in various seasons, with furbearers harvested in winter
and muskrats and porcupines in the summer to fall. Waterfowl are sought in the spring and fall,
while upland game birds are harvested in fall, winter, and spring.
TABLE 5.14-10 Annual Cycle of Subsistence Activities – Stevens Village
Winter Spring Summer Fall
Nov Dec Jan Feb Mar Apr May Jun Jul Aug Sep Oct
King Salmon
Summer Chum
Fall Chum
Coho Salmon
Whitefish
Sheefish
Northern Pike
Burbot
Longnose Sucker
Grayling
Moose
Black Bear
Caribou
Hare
Muskrat
Porcupine
Lynx
Mink
Beaver
Other Furbearers
Waterfowl
Grouse
Ptarmigan
Berries
No to Very Low Levels of Subsistence Activity
Low to Medium Levels of Subsistence Activity
High Levels of Subsistence Activity
Sources: Sumida 1988, Stephen R. Braund & Associates 2011.

Alaska Stand Alone Gas Pipeline 5.14-47 Final EIS
The seasonal round of subsistence harvests for Tanana is presented in Table 5.14-11. Summer
and fall are occupied with harvesting a sequence of salmon species and berries, and processing
them for storage and use throughout the year. Non-salmon fish are pursued from summer
through fall and whitefish are fished into the winter months. Moose are pursued in the late
winter and spring, with most effort in September during a fall hunt. Caribou are harvested in
early and late winter to spring. Bears are hunted spring, summer, and fall. Furbearers are
hunted in fall and winter, and porcupines are pursued May through October. Waterfowl are
hunted during the spring and fall migrations, while grouse hunting occurs in fall and early winter
and ptarmigan in fall to spring.
TABLE 5.14-11 Annual Cycle of Subsistence Activities –Tanana
Winter Spring Summer Fall
Nov Dec Jan Feb Mar Apr May Jun Jul Aug Sep Oct
King Salmon
Summer Chum
Fall Chum
Coho Salmon
Whitefish
Sheefish
Northern Pike
Burbot
Longnose Sucker
Grayling
Moose
Black Bear
Brown Bear
Caribou
Hare
Muskrat
Porcupine
Beaver
Other Furbearers
Waterfowl
Grouse
Ptarmigan
Berries
No to Very Low Levels of Subsistence Activity
Low to Medium Levels of Subsistence Activity
High Levels of Subsistence Activity
Sources: Case and Halpin 1990: 34, Figure 5; Stephen R. Braund & Associates 2011.
Alaska Stand Alone Gas Pipeline 5.14-48 Final EIS
Southcentral Region
The Cook Inlet ecoregion is located in Southcentral Alaska and is surrounded by the Alaska
Range and Pacific Coast Mountain ecoregions. Cook Inlet is characterized by a mild climate,
level to rolling topography, and spruce and hardwood forests; the region was heavily glaciated
during the Pleistocene epoch which had a major shaping factor in the landscape‟s topography
(Gallant 1995). The Susitna and Matanuska rivers, two major rivers in this region, drain into
Cook Inlet, a long glacially formed fjord in Southcentral Alaska.
Much of the Southcentral region was the province of the Dena‟ina (or Tanaina), the only group
of Athabascan speakers in Alaska to live on a marine coast (Figure 5.14-4). As such, the
Dena‟ina had access to marine mammal resources such as seals, belugas, and occasionally
larger whales, as well as a profuse seasonal abundance of salmon and other fish, waterfowl,
moose, caribou, and Dall sheep. Marine mammal fat was harvested for local use and for trade
with neighboring groups such as the Ahtna, Tanana, and Upper Kuskokwim Athabascans.
Occasionally, hostile relations occurred with neighboring Alutiiq peoples from Prince William
Sound, the outer Kenai Peninsula, and Kodiak Island. Dena‟ina speakers shared the upper
Susitna and upper Matanuska valleys with their Ahtna speaking neighbors on a friendly basis,
intermarrying and sharing hunting and fishing territories. When the Russians arrived in the late
1770s, the Dena‟ina began fur trading with the Russian companies and later the Russian
American Company state chartered monopoly, as well as with explorers from Britain, France,
and Spain. Following the purchase of Alaska by the United States in 1867, the Dena‟ina
continued much as they had under the Russians until the ARR construction project began in
1915. Dena‟ina people worked on the railroad in several capacities, and direct contact and
economic opportunity drew Dena‟ina people to places where they could both subsist on wild
foods and take advantage of employment opportunities and access to imported goods.
Unlike the other regions previously discussed in this section, much of the Southcentral region
lies within the state‟s Anchorage-Matsu-Kenai non-subsistence area (Figure 5.14-2). Under
state definitions, all harvests of wildlife and fish within this non-subsistence area do not qualify
as subsistence activities and are instead managed under general sport hunting regulations, or
by personal use or sport fishing regulations. All residents outside the federally designated
Wasilla-Palmer and Anchorage non-rural areas are considered rural and are eligible for
subsistence harvesting on federal lands (Figure 5.14-2). However, there are no major tracts of
federal public lands in or near the proposed Project within the Southcentral area, and any
harvests of fish or wildlife on proposed Project area lands within the Southcentral region do not
qualify as federal subsistence activities.
The Southcentral region encompasses 16 study communities (Table 5.14-1). Of the 16
communities, five are federally recognized tribes and include Cantwell, Chickaloon, Eklutna,
Knik, and Tyonek. These tribes have traditional and current resource uses, including customary
and traditional, educational, or ceremonial uses in or near the proposed Project area. The other
11 communities within this region included in this analysis are the Municipality of Anchorage,
Beluga, Big Lake, Houston, Palmer, Skwentna, Susitna, Talkeetna, Trapper Creek, Wasilla, and
Alaska Stand Alone Gas Pipeline 5.14-49 Final EIS
Willow. Based on available information, the following discussion provides a description of the
16 communities and their subsistence harvest patterns, seasonal round, and use areas.
Community Descriptions
(Municipality of) Anchorage
Anchorage is located in Southcentral Alaska at the upper end of Cook Inlet near the mouth of
the Knik River. Anchorage is the most populated city in Alaska and approximately 41 percent of
the State‟s population resides within the Anchorage municipality (includes Eklutna, Chugiak,
Eagle River, Rainbow, Indian, Bird Creek, Girdwood, and Portage). The 2010 population of the
Anchorage municipality was 291,826 people, with 8 percent Alaska Native (U.S. Census
Bureau 2011). At the time of first European contact in upper Cook Inlet, the Anchorage area
was occupied by the K'enaht'ana, or Knik Arm Dena‟ina, speakers of the „Upper Cook Inlet‟
dialect of the Athabascan language (Fall 1981). Beginning in 1915, thousands of individuals
moved to Anchorage to find jobs associated with the construction of the ARR. Throughout the
1940s and into the 1950s, more growth occurred in Anchorage with the development of the Fort
Richardson military base. The construction of the Trans-Alaska Pipeline in the 1970s brought
additional development and growth to the region (ADCCED 2011). Today, Anchorage serves
as a hub for Alaska‟s transportation, government agencies, communications, development
industries, and finance and real estate market (ADCCED 2011).
Beluga
The community of Beluga is located 40 miles west of Anchorage along the west side of Cook
Inlet and 8 miles north of the neighboring community of Tyonek. The 2010 population was 20,
with 10 percent Alaska Native (U.S. Census Bureau 2011). The area surrounding both Beluga
and Tyonek was part of the area occupied by the Dena‟ina Athabascan. Later trading
settlements were established in the area by the Russians in the late 18th century, followed by
the Alaska Commercial Company trading post and a saltery in 1896 (ADCCED 2011). Many of
the homes are seasonally used; some residents work at the Chugach Electric Association
power plant and others offer sport fishing and hunting guide services.
Big Lake
The community of Big Lake is located on the shores of Big Lake, 13 miles southwest of Wasilla
(although the actual location is accessed 13 miles north of Wasilla by the Parks Highway and
52 miles from Anchorage). The 2010 population was 3,350 persons, with 7 percent Alaska
Native (U.S. Census Bureau 2011). The vicinity was used by Dena‟ina Athabascan people. In
1899, the Boston and Klondike Company made the first sled trail north into the Talkeetna
Mountains from Knik via Big Lake (ADCCED 2011). Beginning in 1929, homesteaders settled
around the lake, shipping materials through the ARR station at Pittman, and by 1959, a number
of camps, lodges, and over 300 recreation cabins and homes were present around the lake
(ADCCED 2011).

Alaska Stand Alone Gas Pipeline 5.14-50 Final EIS
Cantwell
Cantwell is located on the Parks Highway 28 miles south of Denali NPP and 211 miles north of
Anchorage. The community is the site where the Denali Highway intersects with the ARR and
the Parks Highway (Simeone 2002). The 2010 population was 219, with 16 percent of residents
Alaska Native (U.S. Census Bureau 2011). The Native Village of Cantwell is a federally
recognized tribe. Ahtna speakers from the upper Susitna River drainage used the Broad Pass
area near Cantwell for hunting. The first Euro-Americans in the area mined the Valdez Creek
basin for gold. In 1916, railroad construction lured both groups to the construction camp of
Cantwell, which became the “jumping off” place for travelers to the Valdez Creek mines. In the
1920s and 1930s, improvements, including Alaska Road Commission cabins, were made to the
55 mile trail to the mines. In 1921, the government established commercial reindeer herds in
Broad Pass with herds driven from government herds at Goodnews Bay; the enterprise failed by
1928. A film, Lure of the Yukon, was filmed in Cantwell in 1923. In 1950, construction of the
Denali Highway was begun and by its 1957 completion provided the only road access to Denali
NPP until the Parks Highway was built in 1971. Once the Parks Highway was built, the
community reoriented itself away from serving the railroad to serving the needs of highway
travelers with two gas stations, a lodge, store, bed and breakfast, and a post office
(Simeone 2002).
Chickaloon
Chickaloon is an unincorporated community in the Matanuska Susitna Borough northeast of
Sutton, spread out along the Chickaloon River road. The 2010 population was 272, with
6 percent Alaska Native (U.S. Census Bureau 2011). The Chickaloon Native Village is a
federally recognized tribe, which operates the Ya Ne Dah Ah (Ancient Teachings) School in
Moose Creek (ADCCED 2011). A Dena‟ina village was located at this site, called Nuk‟din‟iytnu,
and was the furthest inland Dena‟ina village going east from Cook Inlet (Stratton and
Georgette 1985). The village was later repopulated by Ahtna speakers from the Tyone Lake
vicinity and renamed Chickaloon after the last Dena‟ina chief, named Chiklu. In 1913, the Navy
organized an expedition to the Matanuska coal field, which established a camp at Chickaloon.
At Chickaloon the Navy mined 1,000 tons of coal for tests, with 900 pounds sent to Pittsburgh,
Pennsylvania for coking tests and 800 tons sent to Seattle by sled, rail, and ship for testing in a
warship (USDOI 1915). The community was soon connected by rail to Anchorage and Seward
and became the center of a coal mining district that included a number of small towns in the
vicinity. Coal mining was consolidated in nearby Eska soon after construction of the railroad to
Chickaloon with occasional production at other mines in the district, but Chickaloon never
became a major coal production center (Barnes and Payne 1956).
Eklutna
Eklutna is located near the river of the same name where it joins Cook Inlet, 25 miles northeast
of Anchorage, and has been the site of a railroad station, Native school, and village. The 2010
population was 54 persons, of whom 74 percent were Alaska Native (U.S. Census
Bureau 2011). The Native Village of Eklutna is a federally recognized tribe. The site of the
present community of Eklutna was once the junction of several Dena‟ina trails used during

Alaska Stand Alone Gas Pipeline 5.14-51 Final EIS
annual moves from winter villages to fish camps along the shore. Remains of several nichił
(winter semi-subterranean multi-family dwellings) and accounts from Dena‟ina elders indicate
long Dena‟ina occupation in the area (Kari and Fall 2003). Fran Seager-Boss (in Kari and
Fall 2003) stated that a number of Dena‟ina families of Russian Orthodox faith moved to the
present site of Eklutna in 1897 “to distance themselves from the traders and miners at Knik.” In
1924, the Department of the Interior‟s Bureau of Education built and maintained the Eklutna
Industrial School, moving the orphanage for Indian children from Tyonek to Eklutna. In 1961,
“the Eklutna Tribal Council was formed by several people living in the village because too much
land was being taken from the reserve set aside for the Village of Eklutna” (Stephan 1996).
Houston
Houston is located 18 miles northwest of Wasilla and 57 miles by road north of Anchorage on
the George Parks Highway (ADCCED 2011). Coal was located there during construction of the
ARR and a siding was built to serve coal mines that excavated lignitic coal from the veins
discovered there (Alaska Engineering Commission 1918). The 2010 population was 1,912
persons, of whom 7 percent were Alaska Native (U.S. Census Bureau 2011). Houston today is
a rural residential community and a second-class city (ADCCED 2011).
Knik-Fairview
Knik-Fairview (formerly Knik) is located on the northwest bank of the Knik Arm of Cook Inlet
37 road miles from Anchorage in the Mat-Su Borough. Knik is named after the Dena‟ina word
for “fire” and has long been a residential site for Alaska Natives (ADCCED 2011). The Knik
Tribal Council is a federally recognized tribe. In the 1880s, George Palmer had a trading post
and store there to take advantage of the fur trade, and the community grew from 500 to 1,000
people between 1913 and 1915 (ADCCED 2011). The town also served as a major station on
the Iditarod Trail to Nome. However, the ARR bypassed Knik. By 1917, the growth of
Anchorage and Wasilla with the construction of the railroad drew residents away from the
community. In 1935, Matanuska Colony Camp 13 was built in the vicinity and six farms were
established along Fairview Road. After World War II and Korea, waves of military veterans
homesteaded in the area. Most of the historic town of Knik was destroyed during road
construction for the Knik-Goose Bay road in the 1960s. The 2010 population was 14,923, of
whom 5 percent were Alaska Native (U.S. Census Bureau 2011).
Palmer
Palmer is a small farming and residential community named after George Palmer, a trader with
a post in Knik beginning in 1875, and the site of the 1935 Matanuska Valley Colony. It is
located on the Glenn Highway, 7 miles from the junction with the George Parks Highway. The
2010 population was 5,937, of whom 9 percent were Alaska Native (U.S. Census Bureau 2011).
The total population for the Matanuska-Susitna Borough which includes Palmer and several
outlying census designated places was 88,995 in 2010. Some descendants of the 203 families
who came to Palmer in 1935 from Michigan, Wisconsin, and Minnesota for the Matanuska
Valley Colony agricultural project remain in the area (ADCCED 2011). Palmer hosts the Alaska

Alaska Stand Alone Gas Pipeline 5.14-52 Final EIS
State Fair. The City of Palmer was formed in 1951 and is today classified as a small city
(ADCCED 2011).
Skwentna
Skwentna, 70 miles northwest of Anchorage, is located along the Skwentna River at its junction
with Eight Mile Creek. The Skwentna and nearby Yenta River were utilized by the Dena‟ina
who inhabited the region at the time of contact with European explorers and traders. During the
Alaska Gold Rush period in the early 1900s, the Skwentna area served as an important stop
along the Iditarod Trail. The area was later homesteaded and also the site of a U.S. Army radar
station and recreation camp at Shell Lake (ADCCED 2011). In 2010, the population was 37
individuals with zero percent of the population Alaska Native (U.S. Census Bureau 2011).
Susitna
Susitna is located on the west bank of the Susitna River at the foot of Mount Susitna, some 30
air miles northwest of Anchorage and west of Big Lake in the Mat-Su Borough. The 2010
population was 18, of whom zero percent were Alaska Native (U.S. Census Bureau 2011). The
location was once a Dena‟ina village and trading place for bands living along the Susitna River
and its tributaries. Susitna became a port for gold prospectors and others traveling up the river
by steamboat, and a post office operated there from 1906 to 1943 (Browne 1913).
Talkeetna
Talkeetna is located at the confluence of the Susitna and Talkeetna rivers, 112 railroad miles
north of Anchorage. It is connected to the George Parks Highway at MP 98 by the 14-mile
Talkeetna Spur Road. The 2010 population was 876, of whom 4 percent were Alaska Native
(U.S. Census Bureau 2011). Talkeetna was established as a fur trading post and mining town
in 1896 and by 1910 was a steamboat port for the Susitna River and its tributaries. In 1915,
Talkeetna became a district center for construction of the ARR. The onset of World War I and
America‟s entry into the conflict severely depleted the community population (Fall and
Foster 1987). Today, Talkeetna is a tourism hub, serving sightseers and mountain climbers
attempting the summit of Denali and other peaks in the Alaska Range (ADCCED 2011).
Trapper Creek
Trapper Creek is located between MP 107 and 133 of the George Parks Highway in the Mat-Su
Borough. The 2010 population was 481, of whom 6 percent were Alaska Native (U.S. Census
Bureau 2011). Trapper Creek and Petersville are two closely related communities. The 2010
population for Petersville was four people, of whom zero percent were Alaska Native. Only four
of the 179 homes in Petersville are occupied year-round (ADCCED 2011). The vicinity was long
used by Dena‟ina people for hunting, fishing, and trapping. Homesteaders were allowed entry
to the area starting in 1948 and a prominent group from Detroit, Michigan in 1959 was called the
“Fifty-Niners”. The Parks Highway was completed to Trapper Creek in 1967, and completed to
Fairbanks in 1971 (ADCCED 2011).

Alaska Stand Alone Gas Pipeline 5.14-53 Final EIS
Tyonek
Tyonek is a Dena‟ina Athabascan village located on a bluff above Cook Inlet some 43 miles
southwest of Anchorage by water. Tyonek is made up of residents centralized from several
smaller communities, including Old Tyonek, Beluga, Robert Creek, Timber Camp, and other
places (ADCCED 2011). The 2010 population was 171, of whom 88 percent were Alaska
Native (U.S. Census Bureau 2011). The Native Village of Tyonek is a federally recognized
tribe. Tyonek has long been a Dena‟ina Athabascan community, and was present when
Russian and English explorers passed through in the late eighteenth century. A Russian fur
trading post was located there in the 1790s, but was destroyed in a conflict between the
Russians and their Aleut workers and the Dena‟ina. A new post was later established and
operated for many years under the Russians and was sold to the Alaska Commercial Company
as part of the sale of Alaska to the United States. In 1880, gold rushes on Turnagain Arm made
Tyonek the port of choice for miners and prospectors. In 1896, a salmon saltery was built at the
mouth of the nearby Chuitna River. Later this became a cannery, but the facility was washed
out by powerful storms coming from Turnagain Arm. Disease epidemics in 1836-1840, 1904,
and 1918 devastated the population. The Iditarod Trail route to gold rushes in the north and
interior of the state drew more people to Knik and Susitna Station; the establishment of
Anchorage in 1915 drew even more people away from Tyonek, while the Bureau of Indian
Affairs established the Moquawkie Indian Reservation for the tribe. The town was moved to the
bluff top in 1930 after a storm flooded the site. In 1965, the tribe affirmed the right to sell oil and
gas leases on its reservation lands through a court judgment. The Alaska Native Claims
Settlement Act extinguished the reservation in 1971 (ADCCED 2011).
Wasilla
Wasilla is located 43 miles northeast of Anchorage on the Parks Highway, between the
Matanuska and Susitna valleys. The 2010 population was 7,831 persons, of whom 5 percent
were Alaska Native (U.S. Census Bureau 2011). The total population for the Matanuska-
Susitna Borough which includes Wasilla and several outlying census designated places was
88,995 in 2010. The community was named for the local Dena‟ina chief Wasilla, a variation of
his Russian Orthodox baptismal name Vassiliy. The community was established in 1917 at the
crossing of the Carle Wagon Road and the ARR, with the former becoming the Wasilla
Fishhook Road. The crossroads served as a transshipment point for mining supplies supporting
gold mining in the Talkeetna Mountains. The Susitna Valley Colonists came through Wasilla en
route to the Palmer colonies and some homesteads were established in the Wasilla vicinity.
Today the community serves as a suburb for Anchorage (ADCCED 2011).
Willow
Willow is located between MP 60 and 80 of the George Parks Highway. The 2010 population
was 2,102, of whom 5 percent were Alaska Native (U.S. Census Bureau 2011). The area was
used by Dena‟ina people for hunting and fishing, and was used as a camp en route to the
Talkeetna Mountains via Willow and Cottonwood Creeks. In 1897, gold was discovered on
Willow Creek, and supplies and equipment were brought to the area from Knik. The ARR
connected to the community in 1917 and a station house was built in 1920. An airfield and a

Alaska Stand Alone Gas Pipeline 5.14-54 Final EIS
radar station were built there during World War II, and after the war a lodge was constructed.
Gold mining continued through the 1950s, and in 1954, Willow Creek was the most productive
district in Alaska. In 1971, the Parks Highway was built through Willow and in 1976 voters
selected Willow for the new state capital, but funding for moving the capital from Juneau was
defeated in November 1982 (ADCCED 2011).
Subsistence Use Areas
The documented subsistence use areas for the Southcentral region are concentrated in areas
west of the Parks Highway for the communities of Tyonek, Beluga, Skwentna, and Susitna, and
along the Glenn Highway for the communities of Eklutna and Chickaloon (Figure 5.14-15).
Cantwell use areas are concentrated east of the Parks Highway due to the Denali NPP. The
source and time period for the seven communities for which mapped data exist are listed in
Table 5.14-2.
The remaining nine Southcentral study communities do not have documented subsistence use
areas; although a majority of these (all but Talkeetna and Willow) are non-rural communities
near Palmer, Wasilla, and Anchorage. The combined use areas for this region show use from
southern Cook Inlet north to the Alaska Range north of Cantwell. The Alaska Range is also the
western limit of use areas in Cook Inlet; use areas occur approximately 75 miles east of the
proposed Project along the Glenn and Denali highways. While roads can provide access to
certain use areas within the Cook Inlet area, these areas experience much competition, and the
more productive use areas are accessed by other means of transportation. Communities west
of the Parks Highway primarily rely on boats, snow machines, and ATVs to access their use
areas. Planes are also used by some residents. Communities along the Glenn Highway rely
more heavily on tracked or wheeled transportation to access use areas rather than boats, as
many of the rivers are not as easily navigated as those in western Cook Inlet.
The majority of Beluga use areas occur between the Susitna and Chuitna rivers. Residents in
particular use areas along the local road system and between Threemile Creek and Beluga
River. Several small use areas along Cook Inlet are located south of the community. These
use areas were reported for the time periods of 1987-2006 and 2005-2006. Beluga use areas
are overlapped by other study communities in western Cook Inlet including Tyonek, Susitna,
and Skwentna. Beluga use areas do not intersect with the proposed Project.
Cantwell subsistence use areas are documented from 1964 through 1984. The majority of
these use areas appear east of George Parks Highway, and to the north and south of the Denali
Highway. A more recent study by Simeone (2002) documented lifetime subsistence use areas
of seven Cantwell households for moose, caribou, black bear, sheep, furbearers, salmon, non-
salmon fish, birds, berries, and plants and represents the minimum extent of Cantwell residents‟
land use (Simeone 2002). Similar to the use areas documented for 1964 to 1984, respondents
reported the majority of their lifetime use areas east of George Parks Highway in areas located
north and south of Denali Highway. Trapper Creek and Talkeetna, which do not have
documented use areas, may overlap with Cantwell‟s use areas, and Healy and Nenana (Interior
study communities) use areas overlap with those of Cantwell (Figure 5.14-10). The proposed
Project intersects Cantwell use areas.

Alaska Stand Alone Gas Pipeline 5.14-55 Final EIS
FIGURE 5.14-15 Southcentral Study Communities Subsistence Use Areas
Highway~
Stephen R. Braund & AssociatesP.O. Box 1480
And,orage. Alaska 99510(907) <'76·8222 ",[email protected]
DataSourre: Table 5.14.2
Miles
Study 0Community
LEGEND:
ASAPMainline
..tV--
\II
P.RINCEIVlUIAMSOU/I'/)
(:lJ~~~~~-PalmerWasilla
Eklutna.:tInchorage
(additional use areas alongsouthern Cook Inlet)
~'Ug~
HoustonBig Lake
KnikTyOri
r
..\...
/r
~F .....
\.-.- f-v'
Tyonek ~ ... j
0
~ .r-
....10 .... 1' ",,01 all d... "", ..1..01 within "ppli "WkhM
......,,'>'. Canl..., ENTRiX. In<- • .,.."..J,y Oi """.;1>;1;'1r.,.. <1.0"'''«''' or ';,,"U'ty t",., .ny d.;m, 'hot ""'l' ...; of "'.nM or "'I of'hlo p. I, 1.,"0I0Io , ..""".Ibm!)' ."" ....In d ' ifd,.d "" ,h', map..- tho ....... n Thi.nul' not <>Nt«!., ...tv.,. <1.0", nor ohould "b. nO«! ..... eIl, I, .. til....... ,..po,,,lbIIl<y '" ob,.ln P'''''''' tII,..toy dn..."..ovo~ by.n"......t ......)'00", wlloN! -,,,11'" 1>\11....
Alaska Stand Alone Gas PipelineSouthccntral Region Study Communities'
Subsistence Use Areas NovembU lOll
Alaska Stand Alone Gas Pipeline 5.14-56 Final EIS
Chickaloon use areas occur to the north and south of the Glenn Highway, with the majority of
use areas located to the north. The western extent of their reported use areas is located near
Palmer and the eastern extent is located along the Glenn Highway on the eastern edge of the
Talkeetna Mountains. Chickaloon use areas do not overlap with other documented use areas;
however, given the community‟s proximity to the Glenn Highway, the community likely
experiences competition from many Cook Inlet study community residents. The proposed
Project is within 30 miles of Chickaloon use areas. The time period for the Chickaloon use
areas was 1964-1984.
Eklutna traditional use areas, documented in 2005, are centered around Knik Arm with
additional use areas on Fire Island, Turnagain Arm, and small locations along western Cook
Inlet. The majority of use areas occur along western Knik Arm south of Knik and to the north
and east of the community into the Chugach Mountains. The flats around the community are
also used by residents. Eklutna use areas are all located within the State‟s Anchorage, Mat-Su,
Kenai non-subsistence use area. Thus, Eklutna residents who continue to practice their
traditional harvesting patterns do so under state general hunting and personal use, sport,
guided sport, and commercial fishing regulations, and compete with other Cook Inlet residents
who harvest resources under the same regulations. Eklutna use areas are within 30 miles of
the proposed Project.
Skwentna use areas are all located west of the Parks Highway to the base of the Alaska Range
and are centered along the Skwentna and Yentna rivers. Smaller use areas were reported in
the Peters and Dutch hills to the north and south in the upland areas at the base of the Alaska
Range. Use areas overlap with those of Susitna, Beluga, and Tyonek, but do not intersect the
proposed Project. Skwentna use areas are documented for the1983-1985 time period;
residents continue to subsist in the area.
Susitna use areas, similar to those of Skwentna, are located primarily west of the Parks
Highway to the base of the Alaska Range, and also occur to the north into the Peters and Dutch
hills. Susitna use areas extend farther to the south than Skwentna‟s all the way to the
northwestern shoreline of Cook Inlet. These use areas only show the areas that were utilized
for trapping during 1984, and thus under-represent the areas used by Susitna residents for
other resources. Susitna use areas overlap with those of Skwentna, Beluga, and Tyonek and a
small portion intersect the proposed Project.
Tyonek use areas are documented from 1987-2006 and 2005-2006. Respondents reported
continuous use areas from the shores of lower Cook Inlet north to the mouth of the Susitna
River. Isolated use areas are also located across the inlet on the eastern shore of lower Cook
Inlet. The local road system is an important mode of access to hunting areas for Tyonek
residents. Tyonek shares a majority of its use area with neighboring Beluga residents, with less
overlap with Susitna area harvesters. Tyonek use areas do not intersect with the proposed
Project.

Alaska Stand Alone Gas Pipeline 5.14-57 Final EIS
Subsistence Harvest Patterns
Harvest data for all resources is available for 6 of the 16 Southcentral study communities (see
Figure 5.14-16 and Table 5.14-2). Southcentral study communities near the coast or with
access to major rivers (Beluga, Talkeetna, Trapper Creek, and Tyonek) rely more heavily on
fish for the majority of their subsistence harvest, whereas study communities located further
inland (Cantwell and Chickaloon) rely on land mammals for the majority of their harvests. Fish
harvest (in terms of edible pounds) ranged from a low of 24 percent of the total harvest
(Cantwell) to a high of 75 percent (Trapper Creek). Land-mammal harvest ranged from
16 percent (Trapper Creek) to 66 percent (Cantwell). Combined marine invertebrates,
birds/eggs, and vegetation comprised from 4 to 11 percent of the harvests across the study
communities. Tyonek reported 1 percent of their harvest from marine mammals. On average,
fish contributed 54 percent to the total harvest of Southcentral study communities, land
mammals contributed 37 percent, and marine invertebrates (1 percent), birds/eggs (2 percent),
and vegetation (6 percent) account for the remaining harvest.
FIGURE 5.14-16 Percent of Harvest by Resource Category – Southcentral
0%
10%
20%
30%
40%
50%
60%
70%
80%
90%
100%
Beluga Cantwell Chickaloon Talkeetna Trapper Creek
Tyonek Southcentral
Per
cen
t o
f H
arve
st
Marine Mammals
Vegetation
Birds & Eggs
Marine Invertebrates
Land Mammals
Fish
Notes: Most Representative Study Year data shown for all study communities. Source: ADF&G 2010.
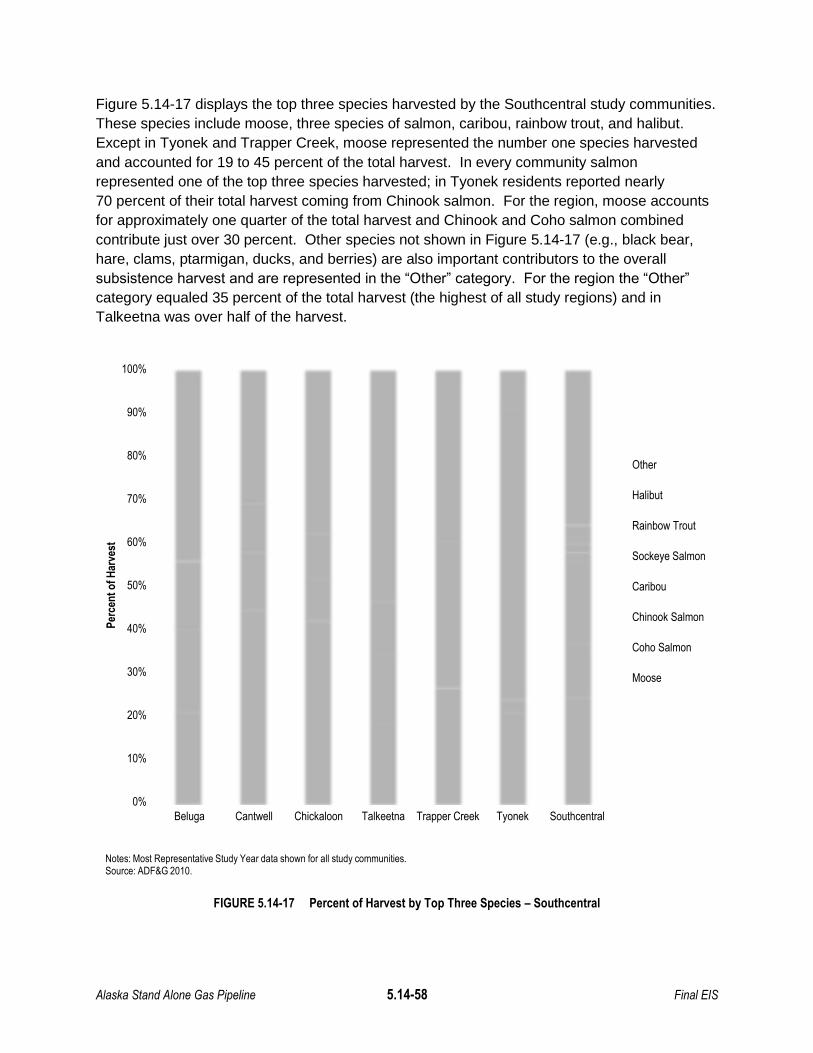
Alaska Stand Alone Gas Pipeline 5.14-58 Final EIS
Figure 5.14-17 displays the top three species harvested by the Southcentral study communities.
These species include moose, three species of salmon, caribou, rainbow trout, and halibut.
Except in Tyonek and Trapper Creek, moose represented the number one species harvested
and accounted for 19 to 45 percent of the total harvest. In every community salmon
represented one of the top three species harvested; in Tyonek residents reported nearly
70 percent of their total harvest coming from Chinook salmon. For the region, moose accounts
for approximately one quarter of the total harvest and Chinook and Coho salmon combined
contribute just over 30 percent. Other species not shown in Figure 5.14-17 (e.g., black bear,
hare, clams, ptarmigan, ducks, and berries) are also important contributors to the overall
subsistence harvest and are represented in the “Other” category. For the region the “Other”
category equaled 35 percent of the total harvest (the highest of all study regions) and in
Talkeetna was over half of the harvest.
FIGURE 5.14-17 Percent of Harvest by Top Three Species – Southcentral
0%
10%
20%
30%
40%
50%
60%
70%
80%
90%
100%
Beluga Cantwell Chickaloon Talkeetna Trapper Creek Tyonek Southcentral
Per
cen
t o
f H
arve
st
Other
Halibut
Rainbow Trout
Sockeye Salmon
Caribou
Chinook Salmon
Coho Salmon
Moose
Notes: Most Representative Study Year data shown for all study communities. Source: ADF&G 2010.
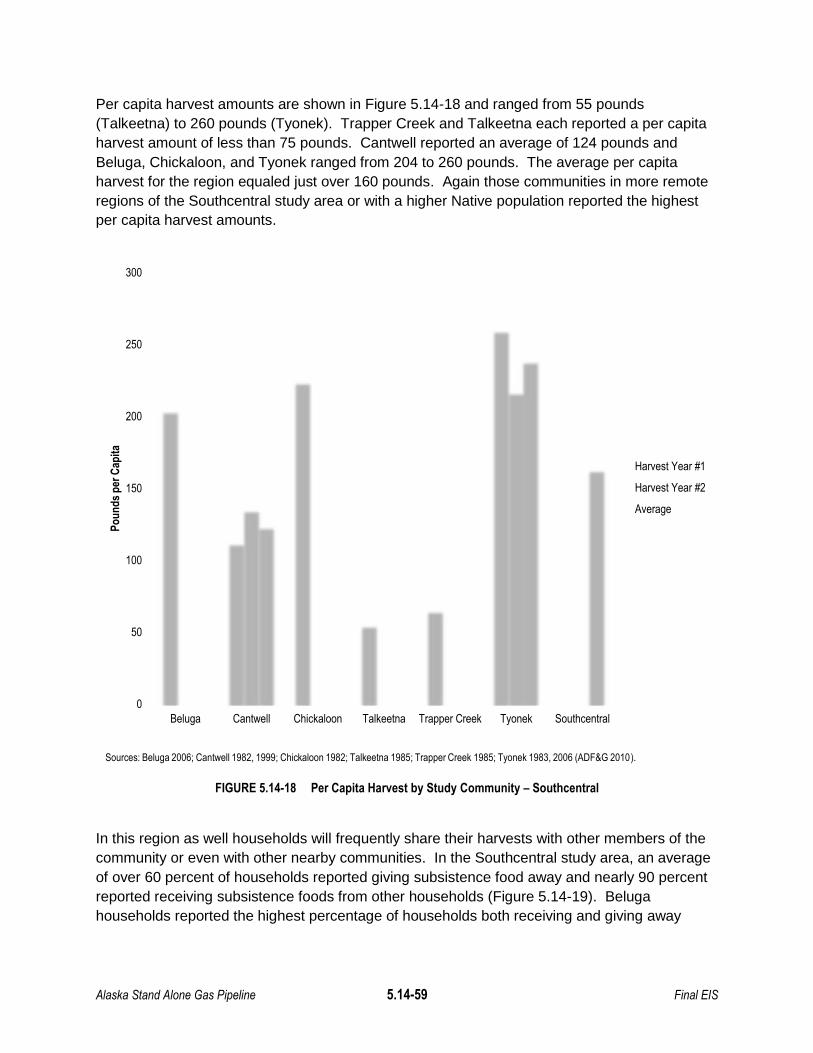
Alaska Stand Alone Gas Pipeline 5.14-59 Final EIS
Per capita harvest amounts are shown in Figure 5.14-18 and ranged from 55 pounds
(Talkeetna) to 260 pounds (Tyonek). Trapper Creek and Talkeetna each reported a per capita
harvest amount of less than 75 pounds. Cantwell reported an average of 124 pounds and
Beluga, Chickaloon, and Tyonek ranged from 204 to 260 pounds. The average per capita
harvest for the region equaled just over 160 pounds. Again those communities in more remote
regions of the Southcentral study area or with a higher Native population reported the highest
per capita harvest amounts.
FIGURE 5.14-18 Per Capita Harvest by Study Community – Southcentral
In this region as well households will frequently share their harvests with other members of the
community or even with other nearby communities. In the Southcentral study area, an average
of over 60 percent of households reported giving subsistence food away and nearly 90 percent
reported receiving subsistence foods from other households (Figure 5.14-19). Beluga
households reported the highest percentage of households both receiving and giving away
0
50
100
150
200
250
300
Beluga Cantwell Chickaloon Talkeetna Trapper Creek Tyonek Southcentral
Po
un
ds
per
Cap
ita
Harvest Year #1
Harvest Year #2
Average
Sources: Beluga 2006; Cantwell 1982, 1999; Chickaloon 1982; Talkeetna 1985; Trapper Creek 1985; Tyonek 1983, 2006 (ADF&G 2010).

Alaska Stand Alone Gas Pipeline 5.14-60 Final EIS
subsistence resources. Talkeetna residents had the lowest reported rates of sharing among
households.
FIGURE 5.14-19 Percent of Households Sharing Subsistence Resources – Southcentral
Seasonal Round
Comprehensive seasonal-round data are not available for 14 of the 16 Southcentral study
communities. Table 5.14-12 depicts the seasonal round of harvest activities for Cantwell for the
year 1999, the most recent year of research data for the community. Subsistence harvests
conform to local regulated seasons (Simeone 2002). In the spring, residents hunt both brown
and black bears. Although some ice fishing occurs in the winter, the main season of freshwater
fishing begins in late April and continues through the arrival of the first salmon in late June/early
July. Cantwell harvesters hunt moose and Dall sheep and collect berries and plants in August
and September, and in late fall, caribou and migratory waterfowl become the primary focus of
residents‟ subsistence pursuits. During the winter months, residents engage in caribou and
upland bird hunting as well as furbearer trapping activities for income. Community members
also collect wood throughout the winter, spring, and early summer.
0%
10%
20%
30%
40%
50%
60%
70%
80%
90%
100%
Beluga Cantwell Talkeetna Trapper Creek Tyonek Southcentral
Per
cen
t o
f H
ou
seh
old
s
Give
Receive
Sources: Beluga 2006; Cantwell 1999; Chickaloon 1982; Talkeetna 1985; Trapper Creek 1985; Tyonek 1983 (ADF&G 2010).

Alaska Stand Alone Gas Pipeline 5.14-61 Final EIS
TABLE 5.14-12 Annual Cycle of Subsistence Activities – Cantwell
Winter Spring Summer Fall
Nov Dec Jan Feb Mar Apr May Jun Jul Aug Sep Oct
Salmon
Freshwater Fish
Black Bears
Brown Bears
Moose
Dall Sheep
Caribou
Migratory Waterfowl
Grouse/Ptarmigan
Berries and Plants
Trapping
Wood
No to Very Low Levels of Subsistence Activity
Low to Medium Levels of Subsistence Activity
High Levels of Subsistence Activity
Sources: Simeone 2002: Figure 4, page 33 and page 31; Stephen R. Braund & Associates 2011.
The seasonal round of subsistence harvest activities for Tyonek, presented in Table 5.14-13,
was collected in 1982 and covers the preceding 5 years, from 1978 to 1982. The seasonal
round was updated for 2005-2006, but did not change, save for increased regulation of beluga,
waterfowl, and moose harvests (Stanek et al. 2007). Shellfish are harvested in a community
effort that begins during the spring and includes a trip to Redoubt Bay for harvest, and the
transport of harvested clams back to Tyonek for distribution (Foster 1982). Beluga could be
harvested beginning in the spring and throughout the summer near river mouths when the
animals were feeding on eulachon and salmon returning to spawning streams; however, none
have been harvested since 2005 (NMFS 2008). Harbor seals were harvested during the
summer incidentally in the course of other subsistence activities. Five species of salmon were
available to Tyonek beginning in May and continuing through October and at the time of the
survey were harvested for both commercial and subsistence purposes. Other summer activities
included plant harvest and rainbow trout and Dolly Varden fishing. While some harvest activity
for ducks, geese, and brown and black bear occurred in the spring, the most intensive season
for these resources occurred in September and October. Moose, spruce grouse, porcupine,
snowshoe hare, and berries are also harvested intensively in the fall months. Upland bird,
snowshoe hare, and furbearers are the primary focus of Tyonek residents‟ winter activities with
occasional harvest of moose and porcupine.

Alaska Stand Alone Gas Pipeline 5.14-62 Final EIS
TABLE 5.14-13 Annual Cycle of Subsistence Activities – Tyonek
Winter Spring Summer Fall
Nov Dec Jan Feb Mar Apr May Jun Jul Aug Sep Oct
Razor Clam
Butter Clam
Redneck Clam
Cockle
Eulachon
Herring
King Salmon
Red Salmon
Pink Salmon
Chum Salmon
Silver Salmon
Tomcod
Rainbow Trout
Dolly Varden
Harbor Seal
Beluga
Ducks
Geese
Moose
Black Bear
Brown Bear
Spruce Grouse
Ptarmigan
Porcupine
Snowshoe Hare
Mink
Marten
Fox
Coyote
Beaver
Otter

Alaska Stand Alone Gas Pipeline 5.14-63 Final EIS
TABLE 5.14-13 Annual Cycle of Subsistence Activities – Tyonek
Winter Spring Summer Fall
Nov Dec Jan Feb Mar Apr May Jun Jul Aug Sep Oct
Berries
Edible Plants
Medicinal Plants
Coal
Wood
No to Very Low Levels of Subsistence Activity
Low to Medium Levels of Subsistence Activity
High Levels of Subsistence Activity
Sources: Foster 1982, Stephen R. Braund & Associates 2011.
5.14.3 Environmental Consequences
Subsistence use and harvest studies conducted in the study communities indicate use of the
proposed Project area both in residents‟ lifetimes and in the last 10 to 20 years (see
Table 5.14-2). Subsistence use impacts common to all alternatives include direct and indirect
effects on subsistence use areas, user access, resource availability, and competition in those
areas. Assessment of the consequences noted below is guided by prior assessments made for
similar studies in the area of the proposed Project. For example, EISs for similar projects with
corridors (e.g., roads, pipelines) published by the BLM (e.g., the renewal of the federal grant for
the Trans-Alaska Pipeline System Right of Way [BLM 2002] and the Alpine Satellite
Development Project [BLM 2004]) and the USEPA (e.g., the Supplemental EIS by the
USEPA [2009] for the Red Dog Mine Extension Project were reviewed and the results
incorporated into this analysis. In addition, reports documenting the local (e.g., SRB&A 2009)
and statewide assessments (National Research Council 2003) of the impact of oil industry
development on subsistence in Alaska were incorporated into this analysis.
If a portion of a community‟s subsistence use area were within the proposed Project, then a
direct effect on subsistence use would occur. With the exception of downstream effects, the
farther a community‟s subsistence use area is from the proposed Project, the less the potential
exists for a direct impact on residents‟ subsistence uses. Successful subsistence harvests
depend on continued access to subsistence resources without physical, regulatory, or social
barriers. Access could be negatively affected or enhanced with a project. Successful
subsistence harvests depend on continued resource availability in adequate numbers and
health in traditional use areas. Subsistence availability is affected by resource mortality or
health changes, displacement from traditional harvest locations, or contamination (including
actual and/or perceived contamination of resources and habitat or habituation of resources to
development activities). Changes in access can result in changes in competition for resources.
Increased access to an area may result in more competition for resources from outsiders and/or
Alaska Stand Alone Gas Pipeline 5.14-64 Final EIS
from community or nearby community residents who did not previously use the area. A
decrease in access may decrease competition in the potentially affected area and introduce
additional competition in new areas because harvesters can no longer access previously used
hunting or fishing areas. A decrease in resource availability may result in increased competition
among harvesters as they try to meet their harvest needs from a depleted or displaced resource
stock. When possible, impacts to resource availability are based on identified impacts in
Section 5.5, Wildlife; Section 5.6, Fish; and Section 5.8, Threatened and Endangered Species.
The impacts on resource use are also developed from prior studies such as BLM 2002, 2004;
National Research Council 2003; SRB&A 2009; and USEPA 2009.
The magnitude of impacts to subsistence would vary, however; communities that are located
along the proposed Project ROW or whose use areas are bisected (e.g., intersecting in or near
the middle of the use area) by the proposed Project would likely experience greater impacts
versus those communities located further away or only have a small portion of their use areas
intersected by the proposed Project. As noted above in Section 5.14.1, subsistence use area
data are not available for some communities located near the proposed Project, such as
Livengood, Anderson, and Trapper Creek. The rationale that the magnitude of impact would be
greater when the proposed Project bisects a community‟s use area than when the proposed
Project passes through only a small portion of a use area or through use areas located furthest
from the community is based on the analysis of subsistence use area mapping studies that
record the number of harvesters by use area. For example, Figure 5.14-20 shows Nuiqsut
subsistence use areas for the 1995-2006 time period (SRB&A 2010) by number of harvesters.
The red areas on the figure are locations where multiple harvesters reported use areas; the
yellow areas represent locations where fewer harvesters reported use areas. As shown on the
figure, the majority of red overlapping use areas are located near the community and gradually
reduce in frequency of subsistence use area overlaps (i.e., red to orange to yellow shading) as
they extend farther from the community.
The yellow shaded areas, which indicate the fewest number of harvesters, are located on the
outer edge of overall Nuiqsut subsistence use areas. For the proposed Project, the ROW
passes through an area in which only 3 of 33 Nuiqsut harvesters reported hunting during the
1995-2006 time period. This analysis assumes that a project that passes through an area used
by multiple harvesters, versus an area used by a few harvesters, would have an impact of
greater magnitude because it affects a greater number of harvesters. There is not enough data
for the majority of communities along the proposed Project corridor to conduct this type of
analysis (e.g., number of harvester overlaps along proposed Project); however, a review of the
communities in which these data are available (e.g., Barrow, Kaktovik, Anaktuvuk Pass,
Tyonek, Beluga) confirmed the same results as described above for Nuiqsut. Thus, the same
rationale (i.e., fewer harvesters go to use areas located furthest from the community) was
extended for the other study communities. The analysis includes exceptions if the outer edge is
close to the community and limited by a regulatory boundary (e.g., Cantwell‟s use along Denali
National Park) or prominent natural feature (e.g., coastline or mountain range).
Except for the Fairbanks Lateral and Denali National Park Route Variation, the remainder of
impacts from proposed Project segments (i.e., Gas Conditioning Facility [GCF] to MP 540, MP
Alaska Stand Alone Gas Pipeline 5.14-65 Final EIS
540 to 555, and MP 555 to Cook Inlet Natural Gas Liquids Extraction Plant Facility [NGLEP])
are analyzed together as the types of impacts between all segments are similar. Where
relevant, the magnitude and likelihood of impacts are distinguished by communities or region
(i.e., North Slope, Interior, or Southcentral).
In the North Slope region, the proposed Project intersects with the eastern portion of Nuiqsut
use areas and even smaller portions of Anaktuvuk Pass and Kaktovik use areas (Figure 5.14-5).
The proposed Project does not intersect with Barrow use areas. Because of the limited direct
impact to subsistence use areas, impacts from the proposed Project would primarily affect
resource availability (e.g., disrupt caribou migration) for the four North Slope communities,
whereas impacts to user access and competition are expected to be negligible. Because of
their closer proximity to the proposed Project, resource availability impacts would be greater for
the communities of Nuiqsut and Anaktuvuk Pass.
In the Interior region, the proposed Project bisects Minto, Nenana, and Healy subsistence use
areas (Figure 5.14-10). The proposed Project also passes through the communities of
Wiseman, Coldfoot, Anderson, and McKinley Park, for which there are no documented
subsistence use area data. Because of their proximity to the proposed Project, impacts to user
access, competition, and resource availability would be the greatest among these seven Interior
region study communities. Fairbanks, North Pole, Moose Creek, Eielson AFB, Pleasant Valley,
Two Rivers, Fox, Ester, College, Livengood, and Rampart are Interior region communities within
30 miles of the proposed Project, the cutoff for communities included in the EIS analysis. These
communities do not have documented use area data; however, all of these communities except
for Rampart are located along the road system and likely areas associated with use areas
crossed by the proposed Project and could experience impacts to user access, competition, and
resource availability.
The western portion of Stevens Village and Beaver use areas and the eastern portion of Manley
Hot Springs use areas are intersected by the proposed Project, and the proposed Project
borders the use areas of Alatna/Allakaket, Bettles/Evansville and Tanana. Because the majority
of these communities use areas are located away from the proposed Project, and only Manley
Hot Springs is connected by road to the proposed Project in addition to a four-month winter road
access for Bettles/Evansville, impacts to user access and competition would have the least
affect among these Interior region communities. Resource availability impacts could still occur
but to a lesser extent than for closer communities such as Minto, Nenana, and Healy. Many of
the areas to the east of the proposed Project in the Interior region between Livengood and
McKinley Park are in the Fairbanks non-subsistence area (Figure 5.14-2).

Alaska Stand Alone Gas Pipeline 5.14-66 Final EIS
FIGURE 5.14-20 Nuiqsut Subsistence Use Areas by Harvester, 1996-2006
Sleptlen R Braund & AssociatesPO Box 1480
Anchorage, Alaska 99510(907) 278·8222 [email protected]
ARCTIC OCEAN
Barrow o
/
Novemhu 2011
Kaktoviko
High: 33 harvesters
Low: harvesters
Subsistence Use Areas
Alaska Stand Alone Gas PipelineNuiqsut Subsistence Use Areas
by Individual
ThiJ .... p."d .. d.", "",,,,i...d wl<hln "ppllod .. iJwltb"".......nt)'. c "" ENnUX,ln,.•"I"" y dla<;b .... "'p"",lbllityr.,.. dom., hob"lty f""" .ny <l.lm, , ..., may moo 0'" of 'he"..... ",I, of, ""'p, l'iJ'ho""",.'p".",hlllt)'oIth.......'n dot"""'''' 'f,h.d th" m.p m_ tho .,..", nood. Th',"'p w., "'" ,roo"" .. ",,"'I)' do... n(N" ohonld "h. nood ..",<11,111, th "',.'p""'lbillty to ob""n P," tvoy do....",.pa.-od hy .ll ,"",}'O', wllo« '"'I"lto<! ~ I .
Colville
Anaktuvuko Pass
~ BROOKS RANGE\
J \LEGEND:
ASAP",,-Mainline
Miles Study 0
" "Community
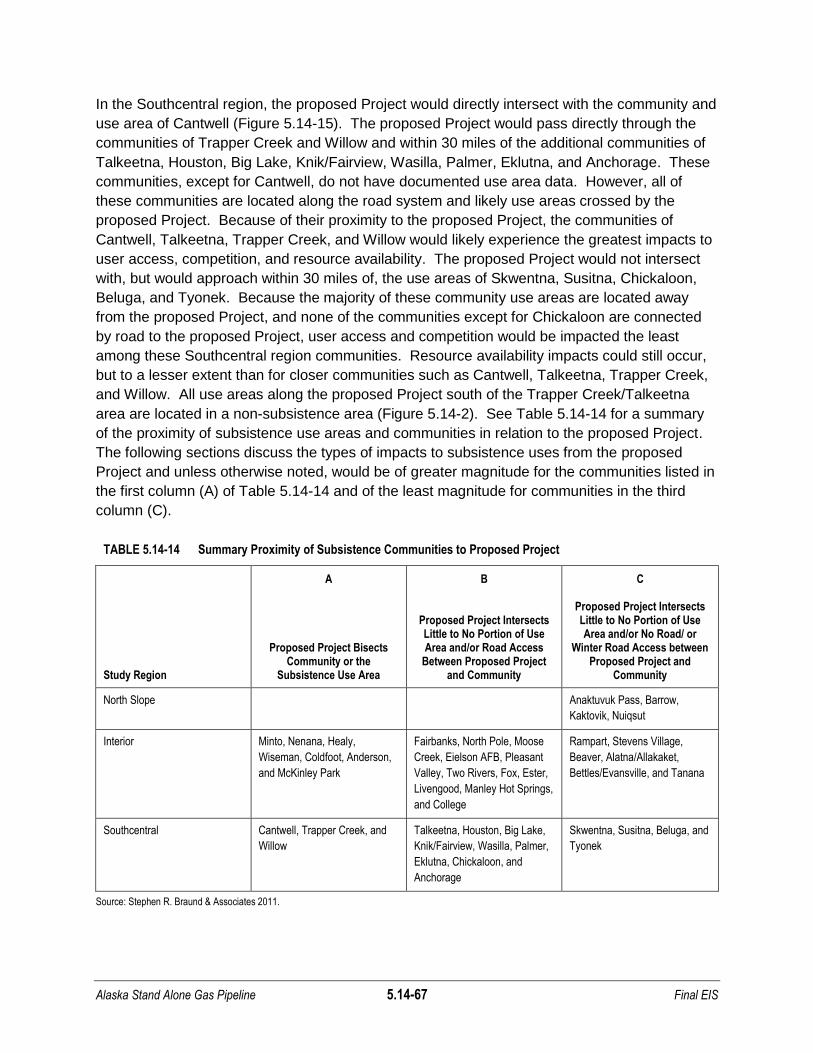
Alaska Stand Alone Gas Pipeline 5.14-67 Final EIS
In the Southcentral region, the proposed Project would directly intersect with the community and
use area of Cantwell (Figure 5.14-15). The proposed Project would pass directly through the
communities of Trapper Creek and Willow and within 30 miles of the additional communities of
Talkeetna, Houston, Big Lake, Knik/Fairview, Wasilla, Palmer, Eklutna, and Anchorage. These
communities, except for Cantwell, do not have documented use area data. However, all of
these communities are located along the road system and likely use areas crossed by the
proposed Project. Because of their proximity to the proposed Project, the communities of
Cantwell, Talkeetna, Trapper Creek, and Willow would likely experience the greatest impacts to
user access, competition, and resource availability. The proposed Project would not intersect
with, but would approach within 30 miles of, the use areas of Skwentna, Susitna, Chickaloon,
Beluga, and Tyonek. Because the majority of these community use areas are located away
from the proposed Project, and none of the communities except for Chickaloon are connected
by road to the proposed Project, user access and competition would be impacted the least
among these Southcentral region communities. Resource availability impacts could still occur,
but to a lesser extent than for closer communities such as Cantwell, Talkeetna, Trapper Creek,
and Willow. All use areas along the proposed Project south of the Trapper Creek/Talkeetna
area are located in a non-subsistence area (Figure 5.14-2). See Table 5.14-14 for a summary
of the proximity of subsistence use areas and communities in relation to the proposed Project.
The following sections discuss the types of impacts to subsistence uses from the proposed
Project and unless otherwise noted, would be of greater magnitude for the communities listed in
the first column (A) of Table 5.14-14 and of the least magnitude for communities in the third
column (C).
TABLE 5.14-14 Summary Proximity of Subsistence Communities to Proposed Project
Study Region
A
Proposed Project Bisects Community or the
Subsistence Use Area
B
Proposed Project Intersects Little to No Portion of Use Area and/or Road Access
Between Proposed Project and Community
C
Proposed Project Intersects Little to No Portion of Use Area and/or No Road/ or
Winter Road Access between Proposed Project and
Community
North Slope Anaktuvuk Pass, Barrow,
Kaktovik, Nuiqsut
Interior Minto, Nenana, Healy,
Wiseman, Coldfoot, Anderson,
and McKinley Park
Fairbanks, North Pole, Moose
Creek, Eielson AFB, Pleasant
Valley, Two Rivers, Fox, Ester,
Livengood, Manley Hot Springs,
and College
Rampart, Stevens Village,
Beaver, Alatna/Allakaket,
Bettles/Evansville, and Tanana
Southcentral Cantwell, Trapper Creek, and
Willow
Talkeetna, Houston, Big Lake,
Knik/Fairview, Wasilla, Palmer,
Eklutna, Chickaloon, and
Anchorage
Skwentna, Susitna, Beluga, and
Tyonek
Source: Stephen R. Braund & Associates 2011.

Alaska Stand Alone Gas Pipeline 5.14-68 Final EIS
5.14.3.1 No Action Alternative
Under the No Action Alternative, the proposed Project would not be constructed and as a result
there would be no expected impacts on subsistence uses. The existing conditions of
subsistence uses including use areas, user access, resource harvest, and seasonal round of
activities as described in Section 5.14.1 would remain the same. One potential benefit from the
proposed Project that would not occur under the No Action Alternative is the increase in
employment opportunities for communities along the proposed Project corridor. Increased
employment and wages could result in increased opportunities to participate in subsistence
activities.
5.14.3.2 Proposed Action
The proposed Project consists of a 24-inch-diameter pipeline that runs from Prudhoe Bay on the
North Slope to its terminus at the Beluga Pipeline in Southcentral Alaska. Except for the first
6 miles of the proposed Project and at certain stream crossings and pipeline facilities, the
proposed pipeline would be buried. To minimize new ground disturbances, the proposed
Project generally follows existing or officially designated transportation and utility corridors
including the TAPS corridor and Parks Highway (AGDC 2011). See Section 5.23, Mitigation for
further discussion.
Pipeline Facilities
Mainline
Construction
Construction related activities resulting from the development of the proposed Project would
have both direct and indirect effects on subsistence resources, use areas, and subsistence
users in terms of availability, access, and competition, as well as hunter responses and effects
on culturally significant activities. These impacts would occur for the duration of construction
activities and may continue throughout operations and maintenance (e.g., introduction of
invasive plants and fish). Construction activities under the proposed Project would occur over a
two and half year period. However, many sections of the proposed Project are estimated to be
completed during one winter or summer construction season, with pre-construction activities
(e.g., access roads, laydown yards, and camps) constructed during the previous summer
(AGDC 2011). Thus, impacts to subsistence during the construction phase are expected to be
temporary in duration. Timing of pre-construction and construction activities will have direct
effects on subsistence activities. Subsistence impacts would be most acute in the area around
Minto Flats which is largely undeveloped, whereas other areas of the proposed Project already
experience impacts associated with the TAPS and Parks Highway corridors.
Direct Effects
Construction activities include ditch excavation, soil blasting, brush clearing, and pipe
placement. In the short-term, blasting can displace or divert resources due to the noise
associated with such activities. Further, blasting destroys the vegetation and surrounding
Alaska Stand Alone Gas Pipeline 5.14-69 Final EIS
habitat for resources such as caribou, moose, or Dall sheep. The clearing of trees and brush,
stripping of topsoil and organic material, and associated erosion potential can have a direct
effect on resource habitat, particularly for herbivores that depend on surface vegetation. The
seasonal migration of animals, such as caribou, which use land within all three study regions,
could be displaced or diverted due to increased human and material presence, noise, and/or
contamination and dust from construction activities. The removal of surface vegetation has a
direct effect on the availability of subsistence resources in the area due to changes in water
quality as a result of unstable soils that could likely damage aquatic habitats. During
construction and the preparation for the construction (placing of supplies), the open trench and
stored pipeline sections can block the movement of large and small animals across the ROW
(see Section 5.5.2). This general disturbance of wildlife could result in subsistence resources
being unavailable at the time and place that subsistence users are accustomed to finding them.
Displacement of subsistence resources from habitat disturbance during construction would have
the greatest effect on subsistence uses in the undeveloped Minto Flats vicinity and for
subsistence users in communities that lie directly along the proposed Project (e.g., Minto,
Nenana, Healy, Wiseman, Coldfoot, Anderson, McKinley Park, Cantwell, Trapper Creek, and
Willow). Disruption of migratory resources, such as caribou, may affect a greater number of
communities.
During all construction activities, noise and traffic are a concern due to equipment, pipe
installation, vehicles, aircraft and helicopters, and personnel. Resources can be displaced
and/or diverted, and resources may decline as a result of death/injury to animals due to
collisions with vehicles (see Section 5.5.2). Traffic itself causes a physical barrier for migratory
animals, particularly caribou, and can also displace or divert resources when herds are
separated (Vistnes and Nellemann 2008; Wolfe et al. 2000). Further, increased traffic in a use
area has the potential to habituate animals. Short-term displacement of subsistence resources
from noise and traffic during construction would have the greatest effect in the undeveloped
Minto Flats vicinity and for subsistence users in communities that lie directly along the proposed
Project (e.g., Minto, Nenana, Healy, Wiseman, Coldfoot, Anderson, McKinley Park, Cantwell,
Trapper Creek, and Willow). Disruption of migratory resources, such as caribou, may affect a
greater number of communities. Of all study communities, Anaktuvuk Pass has the greatest
reliance on caribou (over 80 percent of total harvest) to meet their subsistence needs. Vessel
traffic associated with the proposed Project at the Port of Anchorage may affect beluga whales
(although the plan is to have most if not all vessel traffic using the Port of Seward) (see
Section 5.8.5.3). Tyonek and Alaska Native harvesters from Anchorage may harvest beluga
under the Marine Mammal Protection Act; however since 2006, Tyonek has not attempted to
harvest beluga whales due to their declining population. Beluga were listed under the
Endangered Species Act in 2008, and under the Cook Inlet Beluga Whale Subsistence Harvest
Management Plan, agreed upon by the Cook Inlet Marine Mammal Council and National Marine
Fisheries Service, there will be no subsistence harvest from 2008 to 2012. The plan will be
reassessed in 2012 and it is possible that beluga subsistence harvests may resume in the
future.
Water is required to support construction activities. An estimated 1,088 million gallons of water
are required for the construction and hydrotesting phases of the proposed Project

Alaska Stand Alone Gas Pipeline 5.14-70 Final EIS
(AGDC 2011). Furthermore, the proposed ROW “will cross an estimated 495 waterways and
drainages of which 27 are major streams, 75 are anadromous fish streams, and an additional
7 have been nominated for inclusion in Anadromous Waters Catalogue” (ADCG 2011).
Potential impacts from these activities include habitat alteration and loss as well as reduced
survival and/or productivity for fish resources due to direct mortality, short-term barriers, loss of
riparian vegetation, changes in water quality, interference of water flows and benthic
invertebrates, and introduction of invasive species (see Section 5.6.2.2). Habitat loss and
displacement and/or reduced survival and productivity would affect the availability of fish for
communities located along the proposed Project. The introduction of invasive species (both fish
and/or aquatic plants) could also impact fish habitat and/or productivity and impact fish
availability to subsistence users. Unlike the other construction impacts that are expected to be
short-term, the introduction of invasive species could become a long-term impact if their spread
is uncontrolled, thus potentially signaling a long-term reduced fish availability for subsistence
users along the proposed Project. Reduced fish availability could potentially occur and affect
subsistence uses in all three study regions and have the greatest effect on communities in the
Interior (where fish account for over 70 percent of harvest) and Southcentral (where fish account
for over 50 percent of harvest) with less impact on communities in the North Slope (where fish
account for less than 20 percent of the harvest). In addition to the study communities, other
communities located further downstream (e.g., Hughes, Galena, Kaltag) and upstream of the
proposed Project (e.g., Fort Yukon, Birch Creek, Circle) could also experience reduced fish
availability if there were a large scale reduction in fish populations. However, large scale
impacts on fish populations are not indicated in Section 5.6, Fish.
In addition to direct effects on resource availability, the proposed Project construction activities
could also impact communities‟ subsistence use areas and affect user access and competition.
User access could be temporarily impinged due to both physical and regulatory barriers related
to the use of explosives, water extraction efforts, pipe laydown, noise, traffic, and other
construction activities. Subsistence users may be temporarily blocked from certain waterways
and existing trails during pipe installation and thus unable to access their traditional harvest
areas. Even if regulatory and physical barriers do not exist in certain areas of the proposed
Project, subsistence users may choose not to access nearby subsistence use areas any longer
because construction-related sites, smells, lights, noises, and activities can disturb resources
and reduce the potential for a successful harvest. Competition among and within the
subsistence communities could also experience short-term increases due to the influx of
construction workers. Short-term decreased user access and increased competition for
subsistence resources would have the greatest effect in the undeveloped Minto Flats vicinity
and for subsistence users in communities that lie directly along the proposed Project, in
particular the communities of Minto, Nenana, Healy, Wiseman, Coldfoot, Anderson, McKinley
Park, Cantwell, Trapper Creek, and Willow.
Indirect Effects
As identified in the ASAP POD (AGDC 2011) the proposed Project has a variety of potential
socio-economic effects, including: increased employment opportunities and workforce
development (i.e., Summer 1 peaks at 5,400 personnel); changes in community demographics

Alaska Stand Alone Gas Pipeline 5.14-71 Final EIS
(i.e., population numbers and characteristics; increase in seasonal residents); former non-cash
economy communities experience influx of cash; creation of localized employment
opportunities; and changes in aesthetics of community (temporary and permanent structures).
Each of these effects has its own cost and benefit with regards to subsistence. These effects
begin during the construction phase and may continue on throughout operations and
maintenance.
Where increased employment and workforce development are concerned, subsistence users
might have less time available for subsistence activities due to employment commitments and
might travel less to traditional places. Furthermore, a decline in the consumption of traditional
foods means an increased cost for obtaining substitute foods. Employment does however
provide the benefit of increased income which residents can in turn use to participate in
subsistence activities. Changes in community demographics, particularly an increase in
seasonal residents, means increased competition for use areas and access to resources. The
increase of cash in a mixed economy can have effects on culturally significant activities in
particular, such as autonomy. When communities decrease their use and consumption of
traditional foods they increase their expenses on substitute foods. This, in turn, impacts on a
broader practice of harvesting, participating in harvests, sharing fish and wildlife, and producing
or processing traditional foods. Further, communities‟ sharing and transfer of knowledge can
begin to decline. Finally, changes in community aesthetics impact on the integrity of its own
culturally significant place.
Indirect effects also include concerns of contamination, in particular dust and smoke, from soil
disturbance, burning wastes, and clearing and burning brush. The concerns of contamination
from dust and smoke are often related to harvest of vegetation which occurs in all communities
to varying degrees. There is a possibility of water contamination as a result of erosion and/or
drilling, as drilling fluid can escape due to seepage or hydraulic fracture during horizontal
directional drilling. Indirectly, subsistence users may decrease consumption of a resource if
there is a fear of contamination concerns. Contamination concerns would be most present
among subsistence users in communities that lie directly along the proposed Project (e.g.,
Minto, Nenana, Healy, Wiseman, Coldfoot, Anderson, McKinley Park, Cantwell, Trapper Creek,
and Willow).
Changes in resource availability and user access can lead to increased competition in other use
areas and also require subsistence users to augment their efforts, costs, and risks. Increased
hunting efforts, costs, and risks are a result of the need to work harder and travel farther to
access less familiar or more distant subsistence use areas. Those subsistence users who
cannot or choose not to travel farther to find the displaced or diverted resources may experience
indirect effects associated with the loss of the use and consumption of traditional foods and
other culturally significant activities such as traditional practices of harvest. Subsistence users
hunting or harvesting resources in the vicinity of the proposed Project may have other
alternative harvest areas potentially available to them. However, certain locations in the vicinity
of the proposed Project could have traditional and historic associations with certain communities
and harvesters. Those areas could be preferred by harvesters because of familiarity based on
long-time use of the area patterned by culturally-based rules of land use, tenure, and

Alaska Stand Alone Gas Pipeline 5.14-72 Final EIS
association. As stated above, construction related impacts are expected to be temporary and in
many areas would only occur during one season.
Operations and Maintenance
Operation and Maintenance related activities resulting from the development of the proposed
Project would have both direct and indirect effects on subsistence resources, resource use
areas, and subsistence users in terms of availability, access, and competition, as well as hunter
responses and effects on culturally significant activities. In particular, waste, toxicity, emissions,
noise, and operating temperatures of the pipeline will be ongoing issues for the duration of the
proposed Project. These impacts would occur throughout operations and maintenance, which
could exceed 50 years and may, in some instances (e.g., use of the ROW), extend beyond the
duration of operations.
Direct Effects
After construction, increased user access along the proposed Project ROW in the Minto Flats
will be a long-term concern and could affect subsistence uses. A cleared ROW may attract
additional harvesters to an area who use off road vehicles (e.g., snow machines and ATVs) to
travel along the ROW. Because the proposed Project ROW generally follows existing or
officially designated transportation and utility corridors including the TAPS corridor and Parks
Highway, an increase in user access and in additional harvesters would not be expected in
these areas. However, increased access in areas that do not follow existing transportation or
utility corridors, particularly between the TAPS corridor and Parks Highway in the Minto Flats
vicinity, could have an impact on subsistence uses. These impacts would have the greatest
effect on the nearby communities of Minto, Healy, and Nenana who have documented use of
this area. Due to their proximity, Livengood subsistence users would also likely be affected.
Preventative access measures such as boulders, berms, or fencing near entry points will be
used to limit access to the proposed Project ROW (AGDC 2011). These preventative measures
would help lessen the impact of increased use along the ROW although would not likely
eliminate the impact. However, boulders, berms, and fencing could also limit current local
subsistence use patterns in the area.
Resource availability of terrestrial wildlife could be affected through human activity, including
aerial and ground-based pipeline inspections, along the pipeline ROW resulting in wildlife
disturbance and potential direct wildlife mortality from vehicle-animal collision and wildlife
harvests (see Section 5.5.2). Noise from maintenance includes vehicles, small fixed-wing
aircraft and helicopters, and equipment. Noise above ambient levels can displace or divert
resources from traditional areas. Displacement of subsistence resources from operations would
have the greatest effect in the undeveloped Minto Flats vicinity whereas displacement of
subsistence resources during operations along other parts of the proposed Project (i.e., TAPS
and Parks Highway) would be negligible because of already existing disruption. Fish availability
could be affected during operations and maintenance from the chilled pipeline which may
reduce the water temperature at stream crossings and affect fish behavior or cause direct
effects on fish habitat (i.e., delaying hatching of fish eggs) (see Section 5.6.2.2). As discussed
above under “Operations,” the introduction of non-native plants and fish during construction
Alaska Stand Alone Gas Pipeline 5.14-73 Final EIS
could affect fish availability and extend into the operations and maintenance phase of the
proposed Project. Reduced availability of wildlife and fish during operations could result in
subsistence resources being unavailable at the time and place that subsistence users are
accustomed to finding them. Reduced fish availability could potentially occur and affect
subsistence uses in all three study regions and have the greatest effect on communities in the
Interior (where fish account for over 70 percent of harvest) and Southcentral (where fish account
for over 50 percent of harvest) with less impact on communities in the North Slope (where fish
account for less than 20 percent of the harvest).
Natural gas and NGLs are hazardous due to their low flashpoint and flammability (AGDC 2011).
In the case of a potential leak, the low flashpoint and flammability could lead to an increased
risk of forest fires. Forest fires have a direct effect on resource availability; habitat loss,
resource damage, and resource displacement/diversion are potential consequences where fires
are concerned. This impact could potentially occur and affect subsistence uses in all three
study regions.
Indirect Effects
Concern about contamination, risk of fires, decreased resource availability, and increased
competition along certain parts of the ROW near Minto Flats have potential indirect implications
for hunters‟ efforts, costs, and risks associated with having to travel to other places in search of
resources or obtaining substitute foods. Any reduction in the pursuance and consumption of
traditional foods may, depending on the magnitude of that reduction, have effects on culturally
significant activities such as: harvest effort, participation, production, and processing; sharing,
transfer of knowledge; having the satisfaction of eating traditional foods; and a sense of
autonomy. These potential effects would be primarily in the Minto Flats area.
Yukon River Crossing Options
Three options have been proposed for crossing the Yukon River: (Option1) construct a new
aerial suspension bridge; (Option 2) utilize the existing E.L. Patton Bridge; or (Option 3) utilize
horizontal directional drill (HDD) methods to cross underneath the Yukon River.
Impacts to subsistence resources from the Preferred Option could include the potential for
contamination from oil and fuel leaks from vessels and cranes used in the Yukon River to
construct the suspension bridge. However, these impacts would not likely adversely impact
water quality in the Yukon River and no permanent structures such as footings would be placed
below the ordinary high water mark, which would result in minimal impacts from constructing a
suspension bridge. Impacts from Option 2 would be negligible since there would be no surface
water disturbance. For Option 3, there would also be no adverse effects to fishery resources
since there would be no in-stream construction for the HDD method. However, impacts to
subsistence resources from HDD could occur during a frac-out. In addition, availability of
subsistence resources could be affected during operations and maintenance from the chilled
pipeline which may reduce the water temperature at stream crossings and affect fish behavior
or cause direct effects on aquatic habitat (i.e., delaying hatching of fish eggs) (see Section 5.6,
Fish).

Alaska Stand Alone Gas Pipeline 5.14-74 Final EIS
Fairbanks Lateral
The Fairbanks Lateral diverges from the main pipeline north of Nenana at Dunbar and extends
35 miles northeast to Fairbanks. The Fairbanks Lateral will generally follow the existing ARR
corridor. Any potential impacts to subsistence users and resources would most likely affect
harvesters from the nearby communities of Fox, Ester, College, Fairbanks, Pleasant Valley,
Two Rivers, North Pole, Moose Creek, and Eielson AFB.
Construction
Construction impacts would be temporary in duration and similar in type to those described
above for the mainline.
Operations and Maintenance
Operations and Maintenance impacts would be similar in type to those described above for the
mainline. However, because the Fairbanks Lateral parallels the existing ARR corridor, an
increase in user access would not be expected, and displacement of resources would be
negligible because of the existing disruption from the ARR corridor.
Aboveground Facilities
Gas Conditioning Facility
Construction and operation of the GCF will occur within existing infrastructure of Prudhoe Bay.
While construction and operation of the GCF may displace resources such as caribou, there are
no subsistence uses in the vicinity of the proposed GCF and potential subsistence impacts
would be negligible.
Compressor Stations
A maximum of a two compressor stations will be required for the proposed Project. One will be
located in the vicinity of MP 225 (MP 196 Dalton Hwy) north of Wiseman and the other will be
located near the Minto Flats Game Refuge. Potential compressor station sites, particularly the
one located near the Minto Flats Game Refuge could introduce additional noise, emissions, and
activity in an area of the proposed Project and disrupt subsistence users and resources.
Straddle and Off-Take Facility
The Straddle and Off-Take Facility will be located at the Fairbanks Lateral Tie-In at
approximately MP 458.1. The facility requires less than 5 acres. Potential subsistence impacts
from construction and operations of the facility would be negligible.
Cook Inlet Natural Gas Liquids Extraction Plant Facility
Construction and operation of the NGLEP Facility will occur near MP 39 of the existing ENSTAR
Beluga Pipeline. While construction and operation of the NGLEP may displace resources, such
as moose, the facility lies within a state-defined non-subsistence area and potential subsistence
impacts from construction and operation of the facility would be negligible.
Alaska Stand Alone Gas Pipeline 5.14-75 Final EIS
Mainline Valves and Pig Launcher/Receivers
Any potential subsistence impacts from construction and operations of MLVs and pig
launchers/receivers would be negligible due to collocation with other components and small
footprint size.
Access Roads
A total of 28 temporary and 107 permanent access roads will be utilized for the proposed
Project. Of the permanent access roads, 60 would be of new construction. The Fairbanks
Lateral would utilize five existing roads to support construction and operation and thus no
impacts would be associated with these five roads.
Construction
Construction of new access roads can have direct effects on resource availability (such as
migrating caribou) resulting in changes in resource abundance and habitat loss due to damaged
surface vegetation. Resources, such as caribou or moose, can also be displaced or diverted
due to new physical barriers and/or increased human presence.
Operations and Maintenance
User access also changes with the introduction of new roads. Competition can increase
causing local subsistence users‟ increased effort, costs, and risks associated with having to
travel farther afield to obtain resources and/or substitute foods. Only five of the proposed new
construction access roads are greater than 2 miles in length. The longest of these five roads is
just over 21 miles. These five roads access the Minto Flats area of the proposed Project that
connects the TAPS portion of the proposed Project near Livengood to the Parks Highway near
Nenana; three of these roads are connected to existing roadways (e.g., Elliot Highway). As
described above under “Mainline, Operations” this area of the proposed Project could
experience increased user access and accompanying rise in the number of non-local harvesters
to the area due to the cleared ROW and result in increased competition for resources that would
affect Minto, Nenana, and Livengood subsistence users who already use the area. These
access roads would add to the impact by increasing the ease of access to this portion of the
proposed Project. The remaining 55 new permanent access roads are less than 2 miles in
length and thus potential subsistence impacts from these roads would be negligible.
Support Facilities
Maintenance Buildings
Any potential subsistence impacts from construction and operations of maintenance buildings
would be negligible due to small footprint size compared to overall use areas and construction
within already developed areas of Prudhoe Bay, Fairbanks, and Wasilla.
Alaska Stand Alone Gas Pipeline 5.14-76 Final EIS
Construction Camps and Pipeline Yards
Any potential subsistence impacts from construction and operations of construction camps and
pipeline yards would be temporary and negligible. Impacts associated with the influx of
construction workers are described under “Mainline.”
Material Sites
A total of 546 existing material sites have been identified. However, areas such as Minto Flats
and south of Willow have no developed material sites. Material sites near Minto Flats would
add to the subsistence impacts identified under “Mainline” as the area is largely undeveloped.
Material sites south of Willow would be located in a non-subsistence area.
5.14.3.3 Denali National Park Route Variation
The Denali National Park Route Variation would be located along the Parks Highway east of the
McKinley Village area. Types of potential construction (e.g., resource disturbance due to noise)
and operation-related subsistence impacts would be similar to those described for the mainline.
Subsistence related impacts from the Denali National Park Route Variation would likely be less
than the corresponding mainline route between MP 540 and MP 555 because the Nenana
Route is immediately adjacent to the Parks Highway where noise and disturbance are already
occurring. Any potential subsistence impacts from either the Denali National Park Route
Variation or the mainline between MP 540 and MP 555 would be negligible to overall community
subsistence use patterns in the area.
5.14.4 ANILCA 810 Subsistence Finding
Based on the detailed information presented in this chapter and pursuant to Section 810 of
ANILCA, the BLM has conducted an analysis of subsistence impacts from the proposed ASAP
Project that includes findings on the following three issues:
The effect of use, occupancy, or disposition on subsistence uses and needs;
The availability of other lands for the purpose sought to be achieved; and
Other alternatives that would reduce or eliminate the use, occupancy, or disposition of
public lands needed for subsistence purposes (16 USC Sec. 3120).
The ANILCA 810 Subsistence Finding is provided in Appendix L of the EIS

Alaska Stand Alone Gas Pipeline 5.14-77 Final EIS
5.14.5 References
ADCCED. See Alaska Department of Commerce, Community & Economic Development.
ADF&G. See Alaska Department of Fish and Game.
AGDC. See Alaska Gasline Development Corporation.
Ahtuangaruak, R. 1997. Public Testimony. In Beaufort Sea Oil and Gas Lease Sale 170
Public Hearings, Nuiqsut, 1997.
Airnav.com. 2010. Airport Database for PABT, Bettles Airport. Website:
(http://www.airnav.com/airport/PABT) accessed March 12, 2010.
Alaska Consultants Inc. and Stephen R. Braund & Associates (SRB&A). 1984. Subsistence
Study of Alaska Eskimo Whaling Villages. Prepared for the U.S. Department of the
Interior.
Alaska Department of Commerce, Community, and Economic Development (ADCCED). 2011.
Alaska Community Database, Community Information Summaries. Alaska Division of
Community and Regional Affairs. Website: (http://www.commerce.state.ak.us/dca/
commdb/CIS.cfm) accessed April 14, 2011.
Alaska Department of Fish and Game (ADF&G). n.d. Healy Subsistence Use Area Data.
Digitized files provided to SRB&A in 2005.
Alaska Department of Fish and Game (ADF&G). Unpublished. Kaktovik Subsistence Harvest
Data. Received unpublished data from ADF&G in 2003.
Alaska Department of Fish and Game (ADF&G). 1986. Alaska Habitat Management Guide.
Southcentral Region: Reference Maps. Division of Habitat. Juneau, Alaska.
Alaska Department of Fish and Game (ADF&G). 2001. Community Profile Database,
Version 3.11. Designed by Cheryl L. Scott. Compiled by Louis A. Brown, Gretchen B.
Jennings, Cheryl L. Scott, and Charles J. Utermohle. Division of Subsistence.
Fairbanks, Alaska.
Alaska Department of Fish and Game (ADF&G). 2010. Community Subsistence Information
System. Harvest Information for Community. Website: (http://subsistence.adfg.state.
ak.us/CSIS/index.cfm/FA/harvInfo.harvestCommSelComm) accessed September 21.
Alaska Engineering Commission. 1918. Alaska Railroad Record. Volume II No. 10 page 77.
Alaska Engineering Commission, Anchorage, Alaska
Alaska Federation of Natives. 2005. Subsistence - Introduction. Website:
(http://www.nativefederation.org/frames/subsistence.html) accessed February 8, 2005.

Alaska Stand Alone Gas Pipeline 5.14-78 Final EIS
Alaska Gasline Development Corporation (AGDC). 2011. Alaska Stand Alone Gas
Pipeline/ASAP. Plan of Development Revision 1. March.
Andersen, D., and C. Alexander. 1992. Subsistence Hunting Patterns and Compliance with
Moose Harvest Reporting Requirements in Rural Interior Alaska. Technical Paper No.
215. Alaska Department of Fish and Game.
Andersen, D. B., C. Brown, R. Walker, and G. Jennings. 2004a. The 2001–2002 Harvest of
Moose, Caribou, and Bear in Middle Yukon and Koyukuk River Communities: Results of
the 2002 Big Game Harvest Assessment Project. ADF&G, Division of Subsistence
Technical Paper 278. Juneau, Alaska.
Andersen, D. B., C. L. Brown, R. J. Walker, and K. Elkin. 2004b. Traditional Ecological
Knowledge and Contemporary Subsistence Harvest of Non-Salmon Fish in the Koyukuk
River Drainage, Alaska. ADF&G Division of Subsistence Technical Paper No. 282.
Juneau, Alaska.
Andersen, D. B. and G. Jennings. 2001. The 2000 Harvest of Migratory Birds in Ten Upper
Yukon River Communities, Alaska. ADF&G Division of Subsistence Technical Paper
No. 268. Fairbanks, Alaska.
Andersen, D. B., C. J. Utermohle, and L. Brown. 1998. The 1997–98 Harvest of Moose,
Caribou, and Bear in Middle Yukon and Koyukuk River Communities, Alaska. ADF&G,
Division of Subsistence Technical Paper 245. Juneau, Alaska.
Andersen, D. B., C. J. Utermohle, and L. Brown. 2000. The 1998–99 Harvest of Moose,
Caribou, and Bear in Ten Middle Yukon and Koyukuk River Communities: Results of the
1999 Big Game Harvest Assessment Project. ADF&G, Division of Subsistence
Technical Paper 251. Juneau, Alaska.
Andersen, D. B., C. J. Utermohle, and G. Jennings. 2001. The 1999–2000 Harvest of Moose,
Caribou, and Bear in Ten Middle Yukon and Koyukuk River Communities: Results of the
2000 Big Game Harvest Assessment Project. ADF&G, Division of Subsistence
Technical Paper 262. Juneau, Alaska.
Anderson, H. 2010. Interview with Hannah Anderson of Bettles. Interview conducted by Marla
Statscewich on October 25, 2005 in Anderson‟s Bettles home. Website:
(http://jukebox.uaf.edu/CHA/htm/handerson.htm) accessed March 12, 2010.
Andrews, E. 1988. The Harvest of Fish and Wildlife for Subsistence by Residents of Minto,
Alaska, Technical Paper No. 137. Alaska Department of Fish and Game, Division of
Subsistence. Fairbanks, Alaska.
Bacon, J., T. Hepa, H. Brower, Jr., M. Pederson, T. Olemaun, J. George, and B. Corrigan.
2009. Estimates of Subsistence Harvest for Villages on the North Slope of Alaska,
1994–2003. North Slope Borough Department of Wildlife Management. Barrow, Alaska.

Alaska Stand Alone Gas Pipeline 5.14-79 Final EIS
Barnes, F. and T. Payne. 1956. The Wishbone Hill District, Matanuska Coal Field, Alaska.
Geological Survey Bulletin 1016. U.S. Government Printing Office, Washington, D.C.
Betts, M. 1997. Subsistence Harvest and Use Patterns for Rampart, Tanana, Stevens Village,
Manley Hot Springs, Eureka, and Minto, Alaska: Eureka-Rampart Road Study
Environmental Assessment. Northern Land Use Research, Inc. Prepared for Tryck
Nyman Hayes Inc. and Alaska Department of Transportation and Public Facilities.
BLM. See U.S. Bureau of Land Management.
Braem, N. M., S. Pedersen, J. Simon, D. Koster, T. Kaleak, P. Leavitt, J. Patkotak, and P.
Neakok. 2011. Monitoring of Annual Caribou Harvests in the National Petroleum
Reserve in Alaska: Atqasuk, Barrow, and Nuiqsut, 2003–2007. ADF&G Division of
Subsistence, Technical Paper No. 361.
Braund, S. R. and D. C. Burnham. 1984. Subsistence Economics and Marine Resource Use
Patterns. In: The Barrow Arch Environment and Possible Consequences of Planned
Offshore Oil and Gas Development. In: Proceedings of a Synthesis Meeting, Girdwood,
Alaska. Oct. 30–Nov. 1, 1984. J. C. Truett (ed.). Anchorage, AK.
Brower, H., T. Olemaun, and T. Hepa. 2000. North Slope Borough Subsistence Harvest
Documentation Project: Data for Kaktovik, Alaska for the Period December 1, 1994, to
November 30, 1995. North Slope Borough, Deptartment of Wildlife Management.
Brower, H., Jr. and R. Opie. 1996. North Slope Borough Subsistence Harvest Documentation
Project: Data for Anaktuvuk Pass, Alaska for the period July 1, 1994, to June 30, 1995.
North Slope Borough, Department of Wildlife Management. Barrow, Alaska.
Brown, C., D. Koster, and P. Koontz. 2010. Traditional Ecological Knowledge and Harvest
Survey of Nonsalmon Fish in the Middle Yukon River Region, Alaska, 2005–2008.
ADF&G Division of Subsistence Technical Paper No. 358. Fairbanks, Alaska.
Brown, W. 1979. Nuiqsut Paisaŋich: Nuiqsut Heritage: A Cultural Plan. Prepared for the North
Slope Borough Commission on History and Culture, North Slope Borough Planning
Commission and the Native Village of Nuiqsut. Arctic Environmental Information and
Data Center.
Browne, B. 1913. The Conquest of Mount McKinley: The Story of Three Expeditions Through
the Alaskan Wilderness to Mount McKinley, North America‟s Highest and Most
Inaccessible Mountain. New York and London: G.P. Putnam‟s Sons.
Case, M. and L. Halpin. 1990. Contemporary Wild Resource Use Patterns in Tanana, Alaska,
1987. Alaska Department of Fish and Game, Division of Subsistence. Juneau, Alaska.
Coffing, M. and S. Pedersen. 1985. Caribou Hunting: Land Use Dimensions, Harvest Level,
and Selected Aspects of the Hunt During Regulatory Year 1983-1984 in Kaktovik,
Alaska. Technical Paper No. 120. ADF&G Division of Subsistence. Juneau, Alaska.
Alaska Stand Alone Gas Pipeline 5.14-80 Final EIS
Craig, P. 1987. Anadromous Fishes in the Arctic Environment - A Precarious or Relatively
Stable Existence? Biological Papers of the University of Alaska. University of Alaska,
Juneau. Juneau, Alaska.
De Laguna, F. 2000. Travels Among the Dena: Exploring Alaska‟s Yukon Valley. University of
Washington Press. Seattle, Washington.
Fall, J. 1981. Traditional Resource Uses in the Knik Arm Area: Historical and Contemporary
Patterns, Technical Paper No. 25. Alaska Department of Fish and Game, Division of
Subsistence. Anchorage, Alaska.
Fall, J. and D. Foster. 1987. Fish and Game Harvest and Use in the Middle Susitna Basin: The
Results of a Survey of Residents of the Road Connected Areas of Game Management
Units 14B and 16A, Technical Paper No. 143. Alaska Department of Fish and Game,
Division of Subsistence. Anchorage, Alaska.
Fall, J., D. Foster, and R. Stanek. 1983. The Use of Moose and Other Wild Resources in the
Tyonek and Upper Yentna Areas: A Background Report. Technical Paper No. 74.
Division of Subsistence, Alaska Department of Fish and Game. Anchorage, Alaska.
Foster, D. 1982. The Utilization of King Salmon and the Annual Round of Resource Uses in
Tyonek, Alaska; Technical Paper Number 27. Alaska Department of Fish and Game,
Division of Subsistence. Anchorage, Alaska.
Fuller, A., and J. George. 1999. Evaluation of Subsistence Harvest Data from the North Slope
Borough 1993 Census for Eight North Slope Villages for the Calendar Year 1992. North
Slope Borough Department of Wildlife Management. Barrow, Alaska.
Gallant, A. 1995. Ecoregions of Alaska. U.S. G.P.O. U.S. Geological Survey, Information
Services [distributor]. Denver, CO.
Hall, E. S., S. C. Gerlach and M. B. Blackman. 1985. In the National Interest: A Geographically
Based Study of Anaktuvuk Pass Iñupiat Subsistence Through Time. 2 volumes. North
Slope Borough, Barrow, Alaska.
IAI. See Impact Assessment Inc.
Impact Assessment Inc (IAI). 1990a. Subsistence Resource Harvest Patterns: Nuiqsut.
Prepared for U.S. Department of the Interior Minerals Management Service. OCS Study
No. MMS 90-0038. Special Report No. 8.
Impact Assessment Inc (IAI). 1990b. Subsistence Resource Harvest Patterns: Kaktovik. U.S.
Department of the Interior, Minerals Management Service, Alaska OCS Region Social
and Economic Studies No. 9. MMS OCS Study No. 90-0039.

Alaska Stand Alone Gas Pipeline 5.14-81 Final EIS
Jacobson, M. J. and C. Wentworth. 1982. Kaktovik Subsistence, Land Use Values Though
Time in the Arctic National Wildlife Refuge Area. U.S. Fish and Wildlife Service,
Northern Alaska Ecological Services. Fairbanks, Alaska.
Kari, J. and J. Fall. 2003. Shem Pete‟s Alaska: The Territory of the Upper Cook Inlet Dena‟ina.
Fairbanks, Alaska: University of Alaska Press.
Koskey, M. and K. Mull. 2011. Traditional Ecological Knowledge and Biological Sampling of
Nonsalmon Fish Species in the Yukon Flats Region, Alaska. ADF&G Division of
Subsistence Technical Paper No. 362. Fairbanks, Alaska.
Krauss, M. 1982. Native Peoples and Laguages of Alaska. Alaska Native Language Center.
Fairbanks, Alaska.
Marcotte, J. and T. Haynes. 1985. Contemporary Resource Use Patterns in the Upper
Koyukuk Region, Alaska. Technical Paper No. 93. Alaska Department of Fish and
Game, Division of Subsistence. Fairbanks, Alaska.
McKennan, R. 1981. Tanana. In: Handbook of North American Indians, Volume 6: Subarctic.
Washington, D.C. Smithsonian Institution.
Mobley, C. 1996. The Campus Site. In American Beginnings: The Prehistory and Paleoecology
of Beringia. Edited by Frederick Hadleigh West and Constance F. West. University of
Chicago Press, Chicago.
National Marine Fisheries Service (NMFS). 2008. Cook Inlet Beluga Whale Subsistence
Harvest Final Supplemental Environmental Impact Statement. June, 2008. NMFS,
NOAA, U.S. Deptartment of Commerce.
National Research Council. 2003. Cumulative Environmental Effects of Oil and Gas Activities
on Alaska‟s North Slope. Prepared by the Committee on Cumulative Environmental
Effects of Oil and Gas Activities on Alaska‟s North Slope, Board on Environmental
Studies and Toxicology, Polar Research Board, Division on Earth and Life Studies, and
National Research Council of the National Academies. The National Academies Press:
Washington, D.C.
NMFS. See National Marine Fisheries Service.
Pedersen, S. 1979. Regional Subsistence Land Use, North Slope Borough, Alaska.
Occasional Paper No. 21. Anthropology and Historic Preservation, Cooperative Park
Studies Unit, University of Alaska, Fairbanks, Alaska and Conservation and
Environmental Protection, North Slope Borough, Barrow, Alaska.
Pedersen, S. 1990. Caribou Hunting: Land Use Dimensions, Harvest Level, and Selected
Aspects of the Hunt During Regulatory Year 1987–88 in Kaktovik, Alaska. Technical
Paper No. 172. ADF&G Division of Subsistence. Juneau, Alaska.

Alaska Stand Alone Gas Pipeline 5.14-82 Final EIS
Pedersen, S., M. Coffing, and J. Thompson. 1985. Subsistence Land Use and Place Names
Maps For Kaktovik, Alaska. Technical Paper No. 109. ADF&G, Division of Subsistence.
Fairbanks, Alaska.
Pedersen, S. and C. Hugo. 2005. Anaktuvuk Pass Subsistence Fishery Harvest Assessment:
October 2001 through September 2003. U.S. Fish and Wildlife Service Office of
Subsistence Management. Final Report for FIS Study 02-050.
Pedersen, S., and A. Linn. 2005. Kaktovik 2000–2002 Subsistence Fishery Harvest
Assessment. U.S. Fish and Wildlife Service, Office of Subsistence Management,
Fisheries Resource Monitoring Program. Anchorage, Alaska.
Raboff, A. 2001. Iñuksuk: Northern Koyukon, Gwich‟in and Lower Tanana, 1800–1901. Alaska
Native Knowledge Network. Fairbanks, Alaska.
Research Foundation of the State University of New York (RFSUNY). 1984. Ethnographic
Study and Monitoring Methodology of Contemporary Economic Growth, Socio-cultural
Change and Community Development in Nuiqsut, Alaska. Prepared for Minerals
Management Service, Alaska Outer Continental Shelf Region, Leasing and Environment
Office, Social and Economic Studies Unit. Anchorage, Alaska.
RFSUNY. See Research Foundation of the State University of New York.
Shinkwin, A. and M. Case. 1984. Modern Foragers: Wild Resource Use in Nenana Village,
Alaska, Technical Paper No. 91. Alaska Department of Fish and Game, Division of
Subsistence. Juneau, AK.
Simeone, W. 2002. Wild Resource Harvests and Uses by Residents of Cantwell, Alaska, 2000.
ADF&G Division of Subsistence, Technical Paper No. 272. Juneau, Alaska.
SRB&A. See Stephen R. Braund & Associates.
Stanek, R. 1987. Historical and Contemporary Trapping in the Western Susitna Basin.
Technical Paper No. 134. Alaska Department of Fish and Game, Division of
Subsistence. Anchorage, Alaska.
Stanek, R., D. Holen and C. Wassillie. 2007. Harvest and Uses of Wild Resources in Tyonek
and Beluga, Alaska, 2005–2006; Technical Paper Number 321. Alaska Department of
Fish and Game, Division of Subsistence. Anchorage, AK.
Stephan, A. 1996. Athabaskan Natives of the Upper Cook Inlet. p. 147–150. In: Adventures
Through Time: Readings in the Anthropology of Cook Inlet, Alaska. (N.Y. Davis and
W.E. Davis, eds.). Cook Inlet Historical Society. Anchorage, Alaska.
Stephen R. Braund & Associates (SRB&A). Unpublished. Discussions with Knik and Eklutna
tribal representatives.
Alaska Stand Alone Gas Pipeline 5.14-83 Final EIS
Stephen R. Braund & Associates (SRB&A). 2003a. Alpine Satellite Development Plan
Preliminary Draft Environmental Impact Statement. Subsistence, Cultural Resources,
and Traditional Knowledge Sections. Prepared by SRBA. Anchorage, Alaska.
Stephen R. Braund & Associates (SRB&A). 2003b. Field Notes from Interviews Conducted in
Nuiqsut, Barrow, Atqasuk, and Anaktuvuk Pass. July and August 2003. Anchorage,
Alaska.
Stephen R. Braund & Associates (SRB&A). 2007a. Yukon Flats Land Exchange EIS
Supplemental Baseline Study: Subsistence Use Areas and Traditional Knowledge Study
for Beaver, Birch Creek, and Fort Yukon, Alaska. Prepared for the U.S. Fish and Wildlife
Service. Anchorage, AK.
Stephen R. Braund & Associates (SRB&A). 2007b. Quantification of Subsistence and Cultural
Need for Bowhead Whales by Alaska Eskimos. 2007 update based on 2000 U.S.
Census Data. April 2007. Report to the International Whaling Commission.
Stephen R. Braund & Associates (SRB&A). 2009. Impacts and Benefits of Oil and Gas Development to Barrow, Nuiqsut, Wainwright, and Atqasuk Harvesters. Prepared for the North Slope Borough, Department of Wildlife Management. Barrow, Alaska.
Stephen R. Braund & Associates (SRB&A). 2010. Nuiqsut Caribou Subsistence Monitoring
Project: Results of 2009 Hunter Interviews.
Stephen R. Braund & Associates (SRB&A). 2011. Relationship Between the Native Village of
Tyonek, Alaska and Beluga Whales in Cook Inlet, Alaska. Prepared for NOAA
Fisheries. June.
Stephen R. Braund & Associates (SRB&A) and Institute of Social and Economic Research
(ISER). 1993. North Slope Subsistence Study - Barrow, 1987, 1988 and 1989.
Minerals Management Service Technical Report No. 149. Prepared for U.S. Department
of Interior, Minerals Management Service, and the North Slope Borough. Anchorage,
Alaska.
Stewart, B. 1921. Annual Report of the Territorial Mine Inspector to the Governor of Alaska,
1920. Alaska Daily Empire Printing Company. Juneau, Alaska.
Stratton, L. and S. Georgette. 1985. Copper Basin Resource Use Map Index and Methodology.
Technical Paper No. 124. Division of Subsistence, Alaska Department of Fish and
Game. Anchorage, Alaska.
Sumida, V. 1988. Land and Resource Use Patterns in Stevens Village, Alaska, Technical Paper
No. 129. Alaska Department of Fish and Game, Division of Subsistence, Fairbanks,
Alaska.
Alaska Stand Alone Gas Pipeline 5.14-84 Final EIS
Sumida, V. 1989 Patterns of Fish and Wildlife Harvest and Use in Beaver, Alaska. Alaska
Department of Fish and Game, Division of Subsistence. Technical Paper No. 150.
Faribanks, Alaska.
Sumida, V. and C. Alexander. 1985. Moose Hunting by Residents of Beaver, Birch Creek, Fort
Yukon, and Stevens Village in the Western GMU 25(D) Permit Moose Hunt Area, 1984–
85. ADF&G Division of Subsistence Technical Paper No. 121. Juneau, Alaska.
U.S. Army. 2011. Fort Wainwright History. Accessed December 2011. Website:
(http://www.wainwright.army.mil/history/FWA_history.pdf).
U.S. Bureau of Land Management (BLM). 1978. National Petroleum Reserve-Alaska 105(c)
Investigations. U.S. Department of Interior, Bureau of Land Management. Anchorage,
Alaska.
U.S. Bureau of Land Management (BLM). 2002. Final Environmental Impact Statement: Renewal of the Federal Grant for the Trans-Alaska Pipeline System Right-of-Way. U.S. Bureau of Land Management, Alaska State Office. Anchorage, Alaska.
U.S. Bureau of Land Management (BLM). 2004. Alpine Satellite Development Plan Final Environmental Impact Statement (FEIS). U.S. Department of the Interior, Bureau of Land Management.
U.S. Census Bureau. 2011. 2010 Census Tables. Website: (http://factfinder2.census.gov/
faces/nav/jsf/pages/index.xhtml) accessed April 14, 2011.
U.S. Department of Defense. n.d. Department of the Air Force. History of the 354th Fighter
Wing and Eielson AFB. Website: (www.eielson.af.mil/shared/media/document/AFD-
070510-044.pdf) accessed April 12, 2010.
U.S. Department of the Interior. 1915. Reports of the Department of the Interior for the Fiscal
Year Ended June 30, 1914: Administrative Reports in 2 Volumes, Volume 1: Secretary
of the Interior Bureaus, Except Office of Indian Affairs, Eleemosynary Institutions,
National Parks and Reservations. U.S. Government Printing Office, Washington DC.
U.S. Environmental Protection Agency [USEPA]. 2009. Red Dog Mine Extension Aqqaluk Project. Final Supplemental Environmental Impact Statement. Prepared by Tetra Tech. Anchorage, Alaska.
VanStone, J. 1974. Athapaskan Adaptations: Hunters and Fishermen of the Subarctic Forests.
Chicago, Illinois: Aldine Publishing Company.
Vistnes, I. and C. Nellemann. 2008. The Matter of Spatial and Temporal Scales: A Review of
Reindeer and Caribou Response to Human Activity. Polar Biology 31:399-407.
Wolfe, R. 2000. Subsistence in Alaska: A Year 2000 Update. Alaska Department of Fish and
Game Division of Subsistence. Juneau, Alaska.

Alaska Stand Alone Gas Pipeline 5.14-85 Final EIS
Wolfe, R., and R. Walker. 1985. Subsistence Economies in Alaska: Productivity, Geography,
and Development Impacts. Alaska Department of Fish and Game, Division of
Subsistence. Juneau, AK.
Wolfe, S. A., B. Griffith, and C. A. G. Wolfe. 2000. Response of Reindeer and Caribou to
Human Activities. Polar Research. 19(1):63-73.
Worl, R., and C. Smythe. 1986. Barrow: A Decade of Modernization. The Barrow Case Study.
The Program. Anchorage, Alaska.

Alaska Stand Alone Gas Pipeline 5.14-86 Final EIS
This page intentionally left blank.

Alaska Stand Alone Gas Pipeline
5.15 PUBLIC HEALTH
Final EIS

Alaska Stand Alone Gas Pipeline 5.15-1 Final EIS
5.15 PUBLIC HEALTH
5.15.1 Proposed Project Background
This public health section identifies the potential human health impacts (both positive and
negative) associated with the proposed construction and operation of a pipeline to transport
natural gas and natural gas liquids (NGLs) from the North Slope of Alaska near Prudhoe Bay to
Fairbanks, Anchorage, and the Cook Inlet area, as proposed by the AGDC. The U.S. Army
Corps of Engineers (USACE) has not yet authorized this proposed Project, which is currently in
the National Environmental Policy Act (NEPA) Review/Environmental Impact Statement (EIS)
process. A brief description of the proposed Project, schedule, site access, materials site, and
workforce is provided below; a more detailed discussion is provided in Section 2.0.
5.15.1.1 Overview
The proposed pipeline would transport natural gas and NGLs from existing reserves within
Prudhoe Bay gas fields on the North Slope of Alaska for delivery to in-state markets in
Fairbanks and Southcentral Alaska (Anchorage and the Cook Inlet area). Discovered
technically recoverable natural gas resources on the Alaska North Slope are estimated to be
about 35 trillion cubic feet (TCF) (USDOE 2009). The proposed Project would be the first
pipeline system available to transport natural gas from the North Slope. The gas and NGLs
would be used to: heat homes, business, and institutions; generate electrical power; and for
potential industrial uses. NGLs in excess of in-state demand could be transported to export
markets via marine transport from Nikiski. However, the export of NGLs is not proposed by the
AGDC as a component of the proposed action.
The Preliminary Final Environmental Impact Statement (EIS) also assesses the environmental
effects of the Denali National Park Route Variation. The 15.3-mile-long Denali National Park
Route Variation would replace a 15.5-mile-long segment of the proposed Project between
approximately MP 540 to MP 555 and would follow the Parks Highway corridor through Denali
National Park and Preserve (Denali NPP). South of the Denali NPP, the route variation would
cross the Nenana River at McKinley Village and continue south within the Parks Highway rights-
of-way (ROW). Section 2.0 describes the proposed action in detail, while the Denali National
Park Route Variation is described in Section 4.0.
5.15.1.2 Schedule
As currently proposed by the AGDC, construction of the major aboveground facilities would
commence in the summer of 2016 and would extend to the summer of 2019. Pipeline
construction would be initiated in the winter of 2017 and completed to accommodate an in-
service in the fall of 2019. The AGDC primarily proposes winter and summer construction and
intends to use five construction spreads to construct the proposed Project. As described by the
AGDC, the approximate mileposts for each spread are:

Alaska Stand Alone Gas Pipeline 5.15-2 Final EIS
Spread 1: MP 0.0 to MP 183.0;
Spread 2: MP 183.0 to MP 360.0;
Spread 3: MP 360.0 to MP 529.0;
Spread 4: MP 529.0 to MP 737.1; and
Fairbanks Lateral Spread: MP FL 0.0 to MP FL 34.4.
According to the AGDC, the length of time the trench would remain open (i.e., trenching to
backfill) during construction at any one location would range from one to three days.
Construction at any single point along the proposed pipeline, from ROW clearing to backfill and
final grading, would typically last about 90 to 120 days (three to four months). Due to weather
and trench settling, final grading could occur up to one year after trench backfilling.
The AGDC has indicated that the proposed Project could be operated up to 50 years,
contingent on natural gas availability. The AGDC currently has no plans for future expansion of
the facilities proposed. Upon reaching the end of the proposed Project‘s functional life, the
pipeline would be shut down and decommissioned (see Section 2.4).
5.15.1.3 Site Access
The AGDC would use existing public roads, ports, and railroads to facilitate equipment and
material distribution along the proposed Project route. Approximately 3,800 rail cars would be
required to transport the pipe from Seward to Fairbanks for double jointing, and approximately
9,000 truckloads would be required to distribute the pipe to laydown yards. Several temporary
and permanent access roads would be required to transport equipment, materials, and workers
to the proposed Project areas. Furthermore, access roads would be used to access water
sources, material sites, and various aboveground facilities.
The AGDC would construct gravel roads, ice roads, and snow roads as well as improve some
existing roads for proposed Project construction and/or operation. As proposed, mainline
Project construction would require the temporary use of 28 gravel and ice roads (12 of which
are existing roads) to access the proposed Project ROW. Further, 107 permanent gravel roads
(of which 60 would be new) would be required for proposed Project mainline construction and
operation. Five existing roads have been proposed for permanent use to support construction
and operation of the Fairbanks Lateral. See Section 2.0 for more information.
Proposed Project-related use of highways, maintained borough roads, and other types of public
roadways would typically not require improvements. Additional information on access roads
and the associated land requirements is provided in Section 5.9 (Land Use).
5.15.1.4 Material Sites
Material sites (sand and gravel pits) located along the proposed Project would be used to
provide gravel for workpads, access roads, pipeline bedding and padding, and the construction

Alaska Stand Alone Gas Pipeline 5.15-3 Final EIS
of aboveground facilities. The AGDC has estimated that approximately 13.1 million cubic yards
of material might be required for proposed Project construction. The AGDC has identified 546
existing material sites using Alaska Department of Transportation and Public Facilities
(DOT&PF) material site information sources. The AGDC expects that the use of existing
material sites would be sufficient to meet the proposed Project‘s needs. A majority of these
sites would be located within 10 miles of the proposed Project, thereby reducing the material
hauling distance. Every effort will be expended to ensure that these material sites are not
located in close proximity to areas of human activity.
The AGDC will develop a Material Site Mining Plan and Reclamation Plan for each proposed
site prior to development. The AGDC would also develop a Storm Water Pollution Prevention
Plan (SWPPP) for each proposed site prior to development and maintain best management
practices (BMPs) during construction and operation of the material source.
5.15.1.5 Workforce
As provided in Table 5.15-1, the AGDC has proposed 15 work (construction) camps to house
workers during proposed Project construction (see Sections 2.1.3 and 5.9 of the EIS). All of
these camps would be located at existing construction camps or previously cleared and
disturbed areas. As illustrated below, 6 of the 15 work camps are anticipated to be within the
boundaries of nearby communities, including Coldfoot, Livengood, Nenana, Healy, Cantwell,
and Talkeetna Junction, also known as Y (Y). Workers would also be housed in local
accommodations when available.
TABLE 5.15-1 Proposed Action Work Camp Housing and Nearest Communities
Borough Location Mile Post Nearest
Community
Distance from Nearest
Community (miles)
Camp Capacity Camp Staff
North Slope
Prudhoe Bay 4 Deadhorsea 4.8 NA NA
Franklin Bluffs 45 Deadhorsea 31.1 500 44
Happy Valley 88 Deadhorsea 73.6 500 44
Galbraith Lake 146.5 Anaktuvuk
Passb 62.1 500 44
Atigun 171 Wiseman 51.9 250 21
Chandler 179.8 Wiseman 43.2 500 44
Yukon-Koyukuk
Coldfoot 246.5 Coldfoot NA 500 44
Old Man 313 Bettlesb 41.9 500 44
Seven Mile 356 Stevens Villageb
21.9 500 44
Livengood 406 Livengood NA 500 44
Nenana 476 Nenana NA 500 44
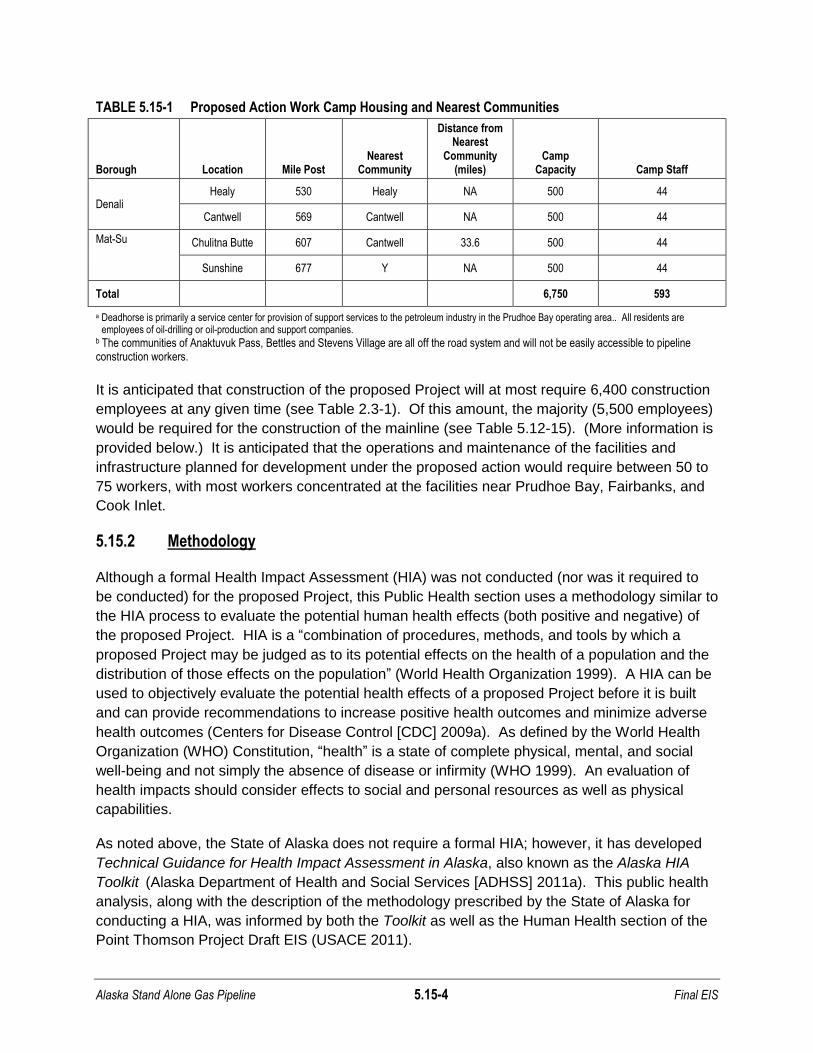
Alaska Stand Alone Gas Pipeline 5.15-4 Final EIS
TABLE 5.15-1 Proposed Action Work Camp Housing and Nearest Communities
Borough Location Mile Post Nearest
Community
Distance from Nearest
Community (miles)
Camp Capacity Camp Staff
Denali Healy 530 Healy NA 500 44
Cantwell 569 Cantwell NA 500 44
Mat-Su Chulitna Butte 607 Cantwell 33.6 500 44
Sunshine 677 Y NA 500 44
Total 6,750 593
a Deadhorse is primarily a service center for provision of support services to the petroleum industry in the Prudhoe Bay operating area.. All residents are employees of oil-drilling or oil-production and support companies.
b The communities of Anaktuvuk Pass, Bettles and Stevens Village are all off the road system and will not be easily accessible to pipeline construction workers.
It is anticipated that construction of the proposed Project will at most require 6,400 construction
employees at any given time (see Table 2.3-1). Of this amount, the majority (5,500 employees)
would be required for the construction of the mainline (see Table 5.12-15). (More information is
provided below.) It is anticipated that the operations and maintenance of the facilities and
infrastructure planned for development under the proposed action would require between 50 to
75 workers, with most workers concentrated at the facilities near Prudhoe Bay, Fairbanks, and
Cook Inlet.
5.15.2 Methodology
Although a formal Health Impact Assessment (HIA) was not conducted (nor was it required to
be conducted) for the proposed Project, this Public Health section uses a methodology similar to
the HIA process to evaluate the potential human health effects (both positive and negative) of
the proposed Project. HIA is a ―combination of procedures, methods, and tools by which a
proposed Project may be judged as to its potential effects on the health of a population and the
distribution of those effects on the population‖ (World Health Organization 1999). A HIA can be
used to objectively evaluate the potential health effects of a proposed Project before it is built
and can provide recommendations to increase positive health outcomes and minimize adverse
health outcomes (Centers for Disease Control [CDC] 2009a). As defined by the World Health
Organization (WHO) Constitution, ―health‖ is a state of complete physical, mental, and social
well-being and not simply the absence of disease or infirmity (WHO 1999). An evaluation of
health impacts should consider effects to social and personal resources as well as physical
capabilities.
As noted above, the State of Alaska does not require a formal HIA; however, it has developed
Technical Guidance for Health Impact Assessment in Alaska, also known as the Alaska HIA
Toolkit (Alaska Department of Health and Social Services [ADHSS] 2011a). This public health
analysis, along with the description of the methodology prescribed by the State of Alaska for
conducting a HIA, was informed by both the Toolkit as well as the Human Health section of the
Point Thomson Project Draft EIS (USACE 2011).
Alaska Stand Alone Gas Pipeline 5.15-5 Final EIS
The Alaska HIA Toolkit notes that reasonable limits need to be placed on the scope of the
assessment:
A limited scope means that the HIA team will not address every conceivable
health effect or effects that are primarily nuisance impacts and rarely observed.
Instead, scoping highlights health effects that produce intense impacts—with
persistent duration and broad geographical scope—that are highly likely to occur.
There must also be a clearly-defined causal link between the Project and the
anticipated health effect.
HIAs typically do not address so-called ―inside the fence‖ impacts, which are impacts on the
proposed Project workforce. (These would be addressed in a separate Health Risk Assessment
according to the Toolkit.) However, this analysis does include some analyses of worker
impacts. This is done for two reasons:
For some impacts, such as traffic accidents, available data do not distinguish between
injuries for workers and non-workers. Both are included in this analysis.
Some impacts on workers, such as injuries on the job, might have the potential to impact
available community health resources.
Data Sets and Limitations
As noted below, this is a ―desktop-level‖ HIA (requiring no new data collection) using relevant
and existing data. One commenter on an earlier draft of this document raised the issue of the
quality and coverage of the datasets used in this analysis. Where available, data used in this
analysis were taken from federal, state, and local governments and agencies. Where such data
were unavailable, data were taken from (in preference order) the peer-reviewed literature,
reports from various agencies, other sections of this EIS, and popular accounts. The sources of
all data are provided in this section either in the text or at the bottom of the various tables.
Readers interested in quality, coverage, and possible precision of the data are advised to
consult the references for each data source. Comments on data limitations are provided in
particularly noteworthy cases, as for example, in certain rate data on a census area (CA) or
borough basis. All data identified as ‗anecdotal‘ must be viewed with caution.
Input from Public and Agency Comments
From the scoping process onward this section has benefited greatly from public and agency
review and comment. In most cases the substance of these comments has been incorporated
directly in the organization or content of the text. In a few cases specific comments have been
acknowledged and responses singled out for mention.

Alaska Stand Alone Gas Pipeline 5.15-6 Final EIS
5.15.2.1 Framework
The general approach to HIAs typically involves a five-step process consisting of Screening,
Scoping, Assessment, Reporting, and Monitoring (ANGDA 2010):
Screening is the process by which a determination is made as to whether an HIA is
necessary for the proposed Project at hand and whether it is likely to be beneficial;
Scoping is the process of identifying concerns to be analyzed in the HIA. The scoping
should identify proposed Project alternatives that will be evaluated, the boundaries of the
study, the available data, and gaps in the data;
Assessment has three components: it should include a profile of baseline health
conditions for the affected communities, a qualitative or quantitative evaluation of
potential health impacts, and management strategies for any identified adverse health
impacts;
Reporting includes the documentation of the methodology, findings, and
recommendations of the scoping and assessment phases; and
Monitoring is a more long-term step where the mitigation recommendations developed in
the report (if needed) may be incorporated into longer-term strategies for monitoring and
management of health impacts.
These steps are described in more detail below.
Screening
For the proposed Project, the screening step was conducted by the lead agency; the USACE
initiated a Public Health analysis to be developed as a section of the EIS. This Public Health
section was developed in a manner similar to a desktop-level HIA. Desktop HIAs require no
new data collection and instead present existing and accessible data. At the desktop level, a
broad overview of possible health impacts is considered.
The description of baseline health status in this Public Health section is based on readily
available public health data.
Scoping
The Alaska HIA Toolkit (Alaska Department of Health and Social Services [ADHSS] 2011a)
provides a table of various potentially relevant Health Effects Categories (HECs). The broad
HECs identified in the Alaska HIA Toolkit include social determinants of health (SDH); accidents
and injuries; exposure to potentially hazardous materials; food, nutrition, and subsistence
activity; infectious disease; water and sanitation; non-communicable and chronic diseases; and
health services infrastructure and capacity (see Table 5.15-2). Each of these broad HECs
includes several elements. For example, the broad HEC of social determinants of health
includes psychological issues related to drugs and alcohol, teenage pregnancy, family stress,
Alaska Stand Alone Gas Pipeline 5.15-7 Final EIS
domestic violence, depression and anxiety, isolation, work rotations and hiring practices, cultural
change, and economy, employment, and education.
To supplement HECs identified in the toolkit, the scoping process relied on comments received
from the public and the stakeholders during EIS scoping meetings to identify public health
concerns. In its March 8, 2010 letter to the USACE, the EPA raised concerns directly or
indirectly applicable to human health, which may be grouped under the following categories of
impacts: air quality, hazardous materials, seismically-induced pipeline rupture, climate change,
socio-cultural, subsistence, water quality, and cumulative effects1. Comments submitted by
individual members of the public, Copper Country Alliance, Tanana Chiefs Conference, and the
Trustees for Alaska also raised concerns related to public health. In particular, commenters
requested that the EIS assess the potential effects of the proposed Project on the following2:
Water resources, including water uses and potential water pollution;
Air quality effects to communities near the proposed pipeline ROW or aboveground
facilities;
Impacts to the way of life of remote residents and access to their properties;
Effects to subsistence, especially during the construction phase;
Noise from compressor stations;
Socioeconomic benefits, including the benefits of lowering energy costs and increased
employment, training, and business opportunities;
Socioeconomic costs, including effects to tourism and to businesses during the
construction period and the need for just compensation for the taking of lands;
Changes in infectious and chronic diseases rates related to a large transient workforce;
Increased demand on rural medical clinics;
Waste production from the construction camps;
Environmental justice; and
Cumulative effects.
Most of these categories are evaluated in greater detail in other sections of the EIS; however,
these issues are considered within this Public Health section as they relate to the health effects
categories (HECs) identified above and described below.
1 Copies of agency comment submissions are included in Appendix D of the Scoping Report (Appendix B of this
Draft EIS). 2 Copies of public comment submissions are included in Appendix E of the Scoping Report (Appendix B of this Draft
EIS).

Alaska Stand Alone Gas Pipeline 5.15-8 Final EIS
―Noise from compressor stations‖ identified by commenters in the above list is not addressed in
the detailed assessment below. This is because (see Section 5.17) the noise impacts are not
expected to be material. The distances from the compressor stations to various sensitive noise
receptors (see Table 5.17-2) range from 7.5 miles (Wiseman) to 212.3 miles (Willow).
Specifically, Section 5.17 contains the following assessment for both construction and
operations and maintenance of the compressor stations as follows:
“Construction
According to Table 5.17-2, the nearest sensitive receptor to compressor stations
construction would be the city of Wiseman, approximately 7.5 miles (39,511 feet)
from the station. The estimated noise levels from construction activities at this
receptor would be approximately 55 dBA (LEQ) using a nominal existing ambient
level of 55 dBA (adapted from Table 5.17-4). The calculation assumes a terrain
coefficient of 0.007 for brush, an integration loss of 3 for berm or rough terrain,
and typical usage factors. The exact value would depend on the number of
sources operating at this distance. This noise level would be perceived as
insignificant, thus creating no noise impact (i.e., increase of 0 dBA over
estimated ambient levels).
The estimated vibration level at this receptor from construction equipment would
be less than 16 VdB, which would be well below the FTA damage threshold for
buildings of 100 VdB (adapted from Table 5.17-5). This level is also below the
human perceptibility threshold of about 65 VdB and, thus, would not constitute an
impact.
Operations and Maintenance
Compressor stations are used to increase the pressure and keep the flow of
natural gas moving through the pipeline at an appropriate rate and typically
contain gas turbine-driven centrifugal compressors. Additional facilities would
include gas and utility piping, a filter separator/scrubber, refrigerant condensers,
a helicopter port, communication tower, tank farm, power generators, and various
control and compressor buildings. Noise and vibration levels from operations
would be perceived as insignificant…‖
Based on this analysis, no significant health related impacts are expected from either
construction or operation and maintenance of the compressor facilities. However, Section 5.14
addresses subsistence and concludes:
Potential compressor station sites, particularly the one located near the Minto
Flats Game Refuge, could introduce additional noise, emissions, and activity in
an area of the Project and disrupt subsistence users and resources.
Because of this potential impact on subsistence resources, noise, emissions, and activity in the
vicinity of the compressor station will be included in this analysis.

Alaska Stand Alone Gas Pipeline 5.15-9 Final EIS
Assessment
The impact assessment evaluates the public health impacts by drawing on:
Available health baseline data from the literature review (see the Affected Environment
section);
Review of the proposed Project context, alternatives and developments; and
Review of pertinent resource sections of this Draft EIS, particularly Section 5.2, Water
Resources, Section 5.13, Socioeconomics, Section 5.14, Subsistence – developed by
Stephen R. Braund & Associates, and Section 5.16, Air Quality. Where appropriate, the
analysis may refer to these sections to note that there may be some overlap among the
resource evaluations.
This Public Health section does not address classic occupational health concerns. However,
―cross-over‖ issues (e.g., health issues that arise as workers interact with local communities) are
analyzed within the section.
Health Effects Categories
The impacts were analyzed according to the eight Alaska-specific HECs noted above and
specific health issues relevant to the proposed Project (see Table 5.15-2). These HECs were
developed for the Alaska HIA Toolkit, specifically the Health Effects Category table contained on
pages 29-30. The Alaska HIA Toolkit introduces this table as follows:
The table shown presents a list of health effects relevant for Alaskan resource
development Projects. The HECs can be used for desktop, rapid appraisal and
comprehensive HIAs.
The toolkit also notes that not every aspect associated with the HECs listed in Table
5.15-2 is relevant for a given Project, but at least initial consideration should be given to
all of the standard HEC categories during scoping exercises. For this reason, the
analysis developed in the Environmental Consequences section (5.15.4) focuses on the
relevant aspects of each of the HECs listed in Table 5.1.5-2.
Impact Evaluation Criteria
The level of the human health impacts from the proposed Project were determined and ranked
based on the impact assessment criteria for human health presented in Table 5.15-3. This table
is derived from the Impact Assessment methodology described in the Alaska HIA Toolkit. The
scoring system includes consequences (health effect, duration, magnitude, and geographic
extent), which collectively determine the severity rating. Together the severity rating and the
estimated likelihood determine the impact rating. Potential public health impacts from the
proposed Project were ranked and rated by using the following four-step semi-quantitative risk
assessment procedure:

Alaska Stand Alone Gas Pipeline 5.15-10 Final EIS
Step 1. Score the level of each consequence (health effect, duration, magnitude, and
geographic extent,) on a four-point scale: low (0), medium (1), high (2), and very high
(3), as described in Table 5.15-3;
Step 2. Rate the severity of the health impact (low, medium, high, or very high) based
on the sum of the scores of the consequences;
Step 3. Rate the potential (or likelihood) of the impact to occur based on professional
judgment on the percent probability of the impact occurring; and
Step 4. Rate the identified health impacts (low, medium, high, or very high) based on
the intersection of the level of severity and potential (or likelihood) as shown in
Table 5.15-4. Health issues anticipated to have negligible or zero impacts were
identified as having no impacts.
The ranking of consequences assessed in Step 1 is presented in Table 5.15-3 and the severity,
likelihood, and impact ratings assessed in Steps 2, 3, and 4 are presented in Table 5.15-4.
TABLE 5.15-2 Health Effect Category and Specific Health Issues developed in the Alaska HIA Toolkit
Health Effects Category Description
Water and Sanitation This category includes the changes to access, quantity and quality of water supplies The pathways include:
Lack of adequate water service is linked to the high rates of lower respiratory infections observed in some regions, and to invasive skin infections.
Revenue from the Project that supports construction and maintenance of water & sanitation facilities.
Increased demand on water and sanitation infrastructure secondary to influx of non-resident workers.
Accidents and Injuries This category includes impacts related to both fatal and non-fatal injury patterns for individuals and communities. Changed patterns of accidents and injuries may arise due to:
Influx of non-resident personnel (increased traffic on roadways, rivers, air corridors).
Distance of travel required for successful subsistence.
Project-related income and revenue used for improved infrastructure (e.g., roadways) and improved subsistence equipment/technology.
Exposure to Hazardous Materials
This category includes Project emissions and discharges that lead to potential exposure. Exposure pathways include:
Food. Quality changes in subsistence foods (risk based on analysis of foods or modeled environmental concentrations).
Drinking water.
Air. Respiratory exposures to fugitive dusts, criteria pollutants, VOCs, mercury, and other substances.
Work. Secondary occupational exposure such as a family member’s exposure to lead on a worker’s clothing.
Indirect pathways, such as changing heating fuels/energy production fuels in communities
Food, Nutrition, and Subsistence Activity
This section depends on the subsistence analysis and nutritional surveys (if completed) and considers:
Effect on Diet: This pathway considers how changes in wildlife habitat, hunting patterns, and food choices will influence the diet of and cultural practices of local communities. While nutritional surveys are the most effective way to assess dietary intake, conclusions can be drawn if certain assumptions are accepted.
Effect on Food Security: This discussion considers Project-specific impacts that may limit or increase the availability of foods needed by local communities to survive in a mixed cash and subsistence economy present in rural Alaska.
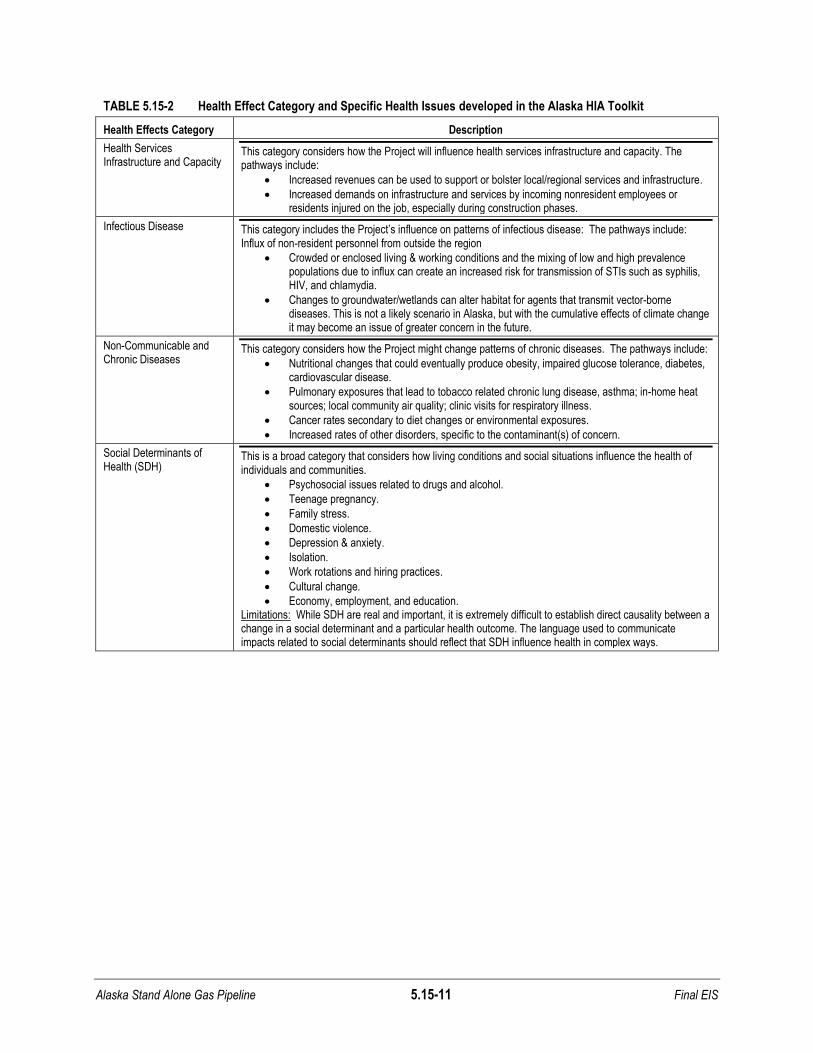
Alaska Stand Alone Gas Pipeline 5.15-11 Final EIS
TABLE 5.15-2 Health Effect Category and Specific Health Issues developed in the Alaska HIA Toolkit
Health Effects Category Description
Health Services Infrastructure and Capacity
This category considers how the Project will influence health services infrastructure and capacity. The pathways include:
Increased revenues can be used to support or bolster local/regional services and infrastructure.
Increased demands on infrastructure and services by incoming nonresident employees or residents injured on the job, especially during construction phases.
Infectious Disease This category includes the Project’s influence on patterns of infectious disease: The pathways include: Influx of non-resident personnel from outside the region
Crowded or enclosed living & working conditions and the mixing of low and high prevalence populations due to influx can create an increased risk for transmission of STIs such as syphilis, HIV, and chlamydia.
Changes to groundwater/wetlands can alter habitat for agents that transmit vector-borne diseases. This is not a likely scenario in Alaska, but with the cumulative effects of climate change it may become an issue of greater concern in the future.
Non-Communicable and Chronic Diseases
This category considers how the Project might change patterns of chronic diseases. The pathways include:
Nutritional changes that could eventually produce obesity, impaired glucose tolerance, diabetes, cardiovascular disease.
Pulmonary exposures that lead to tobacco related chronic lung disease, asthma; in-home heat sources; local community air quality; clinic visits for respiratory illness.
Cancer rates secondary to diet changes or environmental exposures.
Increased rates of other disorders, specific to the contaminant(s) of concern.
Social Determinants of Health (SDH)
This is a broad category that considers how living conditions and social situations influence the health of individuals and communities.
Psychosocial issues related to drugs and alcohol.
Teenage pregnancy.
Family stress.
Domestic violence.
Depression & anxiety.
Isolation.
Work rotations and hiring practices.
Cultural change.
Economy, employment, and education. Limitations: While SDH are real and important, it is extremely difficult to establish direct causality between a change in a social determinant and a particular health outcome. The language used to communicate impacts related to social determinants should reflect that SDH influence health in complex ways.
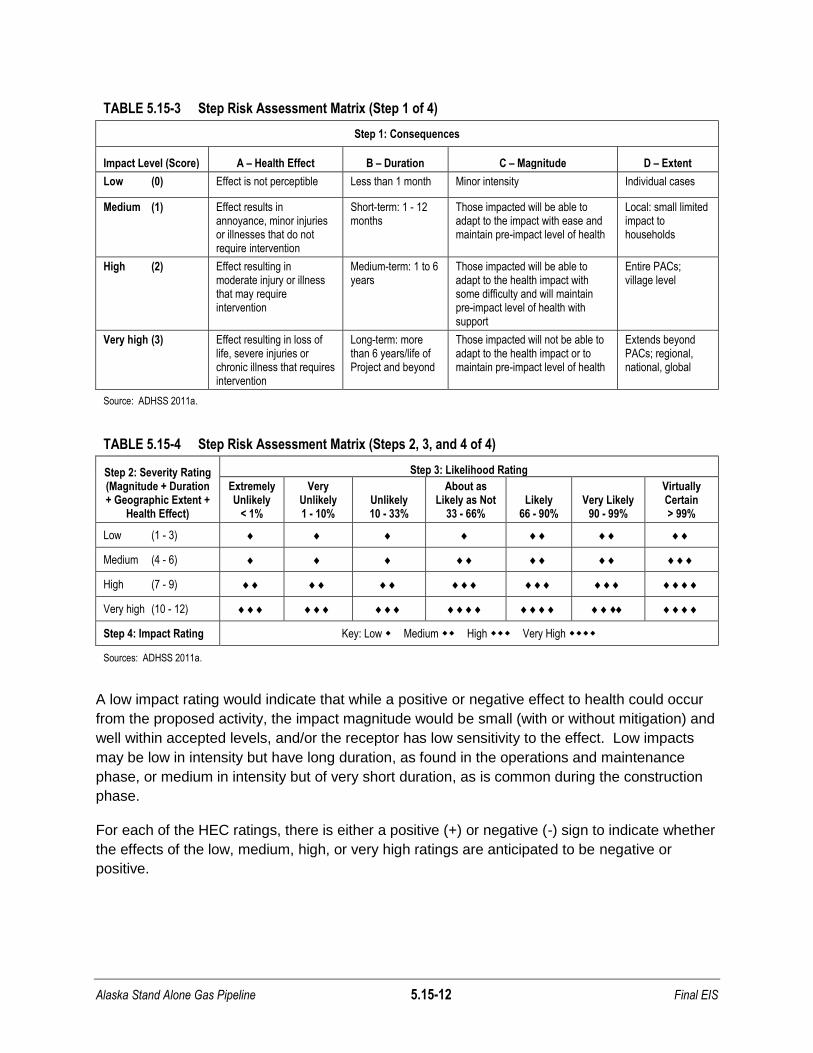
Alaska Stand Alone Gas Pipeline 5.15-12 Final EIS
TABLE 5.15-3 Step Risk Assessment Matrix (Step 1 of 4)
Step 1: Consequences
Impact Level (Score) A – Health Effect B – Duration C – Magnitude D – Extent
Low (0) Effect is not perceptible Less than 1 month Minor intensity Individual cases
Medium (1) Effect results in annoyance, minor injuries or illnesses that do not require intervention
Short-term: 1 - 12 months
Those impacted will be able to adapt to the impact with ease and maintain pre-impact level of health
Local: small limited impact to households
High (2) Effect resulting in moderate injury or illness that may require intervention
Medium-term: 1 to 6 years
Those impacted will be able to adapt to the health impact with some difficulty and will maintain pre-impact level of health with support
Entire PACs; village level
Very high (3) Effect resulting in loss of life, severe injuries or chronic illness that requires intervention
Long-term: more than 6 years/life of Project and beyond
Those impacted will not be able to adapt to the health impact or to maintain pre-impact level of health
Extends beyond PACs; regional, national, global
Source: ADHSS 2011a.
TABLE 5.15-4 Step Risk Assessment Matrix (Steps 2, 3, and 4 of 4)
Step 2: Severity Rating (Magnitude + Duration + Geographic Extent +
Health Effect)
Step 3: Likelihood Rating
Extremely Unlikely
< 1%
Very Unlikely 1 - 10%
Unlikely 10 - 33%
About as Likely as Not
33 - 66% Likely
66 - 90% Very Likely
90 - 99%
Virtually Certain > 99%
Low (1 - 3)
Medium (4 - 6)
High (7 - 9)
Very high (10 - 12) ♦
Step 4: Impact Rating Key: Low Medium High Very High
Sources: ADHSS 2011a.
A low impact rating would indicate that while a positive or negative effect to health could occur
from the proposed activity, the impact magnitude would be small (with or without mitigation) and
well within accepted levels, and/or the receptor has low sensitivity to the effect. Low impacts
may be low in intensity but have long duration, as found in the operations and maintenance
phase, or medium in intensity but of very short duration, as is common during the construction
phase.
For each of the HEC ratings, there is either a positive (+) or negative (-) sign to indicate whether
the effects of the low, medium, high, or very high ratings are anticipated to be negative or
positive.
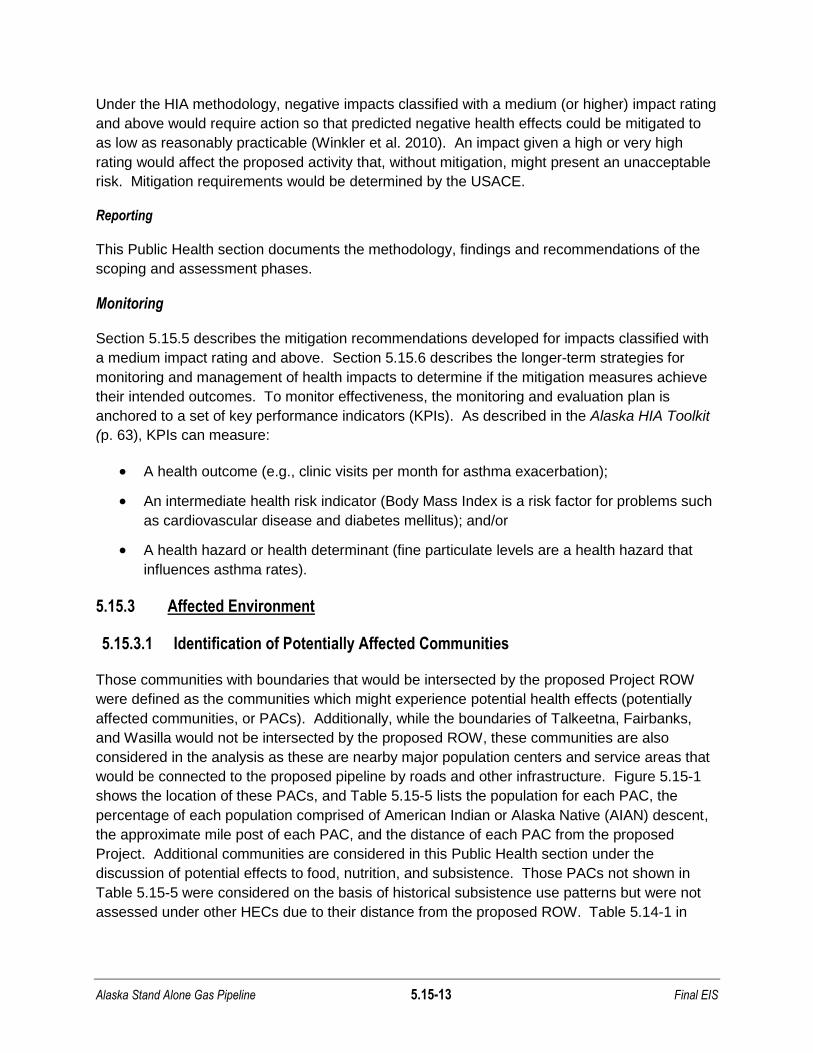
Alaska Stand Alone Gas Pipeline 5.15-13 Final EIS
Under the HIA methodology, negative impacts classified with a medium (or higher) impact rating
and above would require action so that predicted negative health effects could be mitigated to
as low as reasonably practicable (Winkler et al. 2010). An impact given a high or very high
rating would affect the proposed activity that, without mitigation, might present an unacceptable
risk. Mitigation requirements would be determined by the USACE.
Reporting
This Public Health section documents the methodology, findings and recommendations of the
scoping and assessment phases.
Monitoring
Section 5.15.5 describes the mitigation recommendations developed for impacts classified with
a medium impact rating and above. Section 5.15.6 describes the longer-term strategies for
monitoring and management of health impacts to determine if the mitigation measures achieve
their intended outcomes. To monitor effectiveness, the monitoring and evaluation plan is
anchored to a set of key performance indicators (KPIs). As described in the Alaska HIA Toolkit
(p. 63), KPIs can measure:
A health outcome (e.g., clinic visits per month for asthma exacerbation);
An intermediate health risk indicator (Body Mass Index is a risk factor for problems such
as cardiovascular disease and diabetes mellitus); and/or
A health hazard or health determinant (fine particulate levels are a health hazard that
influences asthma rates).
5.15.3 Affected Environment
5.15.3.1 Identification of Potentially Affected Communities
Those communities with boundaries that would be intersected by the proposed Project ROW
were defined as the communities which might experience potential health effects (potentially
affected communities, or PACs). Additionally, while the boundaries of Talkeetna, Fairbanks,
and Wasilla would not be intersected by the proposed ROW, these communities are also
considered in the analysis as these are nearby major population centers and service areas that
would be connected to the proposed pipeline by roads and other infrastructure. Figure 5.15-1
shows the location of these PACs, and Table 5.15-5 lists the population for each PAC, the
percentage of each population comprised of American Indian or Alaska Native (AIAN) descent,
the approximate mile post of each PAC, and the distance of each PAC from the proposed
Project. Additional communities are considered in this Public Health section under the
discussion of potential effects to food, nutrition, and subsistence. Those PACs not shown in
Table 5.15-5 were considered on the basis of historical subsistence use patterns but were not
assessed under other HECs due to their distance from the proposed ROW. Table 5.14-1 in

Alaska Stand Alone Gas Pipeline 5.15-14 Final EIS
Section 5.14 provides a listing of all communities for which subsistence resources may be
affected.
Section 5.12 (Socioeconomics) provides a demographic overview of the boroughs and census
areas crossed by each alternative, including population (see Table 5.12-1) and ethnic and racial
composition data at the census block level (see Table 5.12-11). Additional socioeconomic data
is presented in this Public Health section within the discussion of determinants of health for the
PACs (Section 5.15.3.3). Information regarding land use and land ownership along the
proposed ROW is provided in Section 5.9 (Land Use).
TABLE 5.15-5 Potentially Affected Communities
Community Name
Borough or Census Area
Mile Post
Distance to Proposed Pipeline
ROW (Miles) Population
2000 Census Population
2010 Census Percent
White (2010)
Percent AK Native (2010)
Prudhoe Bay North Slope 2 0
(also 0 miles from gas
conditioning facility)
5 2,174a 85.2 7.8
Wiseman Yukon-Koyukuk
Census Area
235 0 21 14 92.9 0.0
Coldfoot Yukon-Koyukuk
Census Area
246 0 13 10 90.0 10.0
Livengood Yukon-Koyukuk
Census Area
403 0 29 13 69.2 23.1
Ester Fairbanks North
Star Borough
FB
26
0 1,680 2,422 84.6 6.7
College Fairbanks North
Star Borough
FB
34
0 11,402 12,964 73.1 9.5
Fairbanks Fairbanks North
Star Borough
FB
34
2.1 30,224 31,535 66.1 10.0
Four Mile
Road
Yukon-Koyukuk
Census Area
473 0
(also 13.7 miles from
straddle and off-take
facility)
38 43 53.5 30.2
Nenana Yukon-Koyukuk
Census Area
477 0 402 378 56.1 37.6
Anderson Denali Borough 494 0 367 246 87.8 2.8
Healy Denali Borough 530 0 1,000 1,021 91.5 2.1
McKinley
Park
Denali Borough 543 0 142 185 94.1 0.0
Cantwell Denali Borough 570 0 222 219 77.2 15.5
Talkeetna Matanuska-
Susitna Borough
663 0 772 876 91.4 3.7

Alaska Stand Alone Gas Pipeline 5.15-15 Final EIS
TABLE 5.15-5 Potentially Affected Communities
Community Name
Borough or Census Area
Mile Post
Distance to Proposed Pipeline
ROW (Miles) Population
2000 Census Population
2010 Census Percent
White (2010)
Percent AK Native (2010)
Trapper
Creek
Matanuska-
Susitna Borough
668 0 423 481 86.5 6.4
Y Matanuska-
Susitna Borough
686 0 956 1,483b 74.5 b 0.8 a
Willow Matanuska-
Susitna Borough
707 0 1,658 2,102 90.8 5.2
Big Lake Matanuska-
Susitna Borough
731 0
(also 0 miles from
Cook Inlet Natural
Gas Liquid Extraction
Plant Facility)
2,635 3,350 86.1 7.0
Wasilla Matanuska-
Susitna Borough
733 19.5 5,469 7,831 83.4 5.2
a While the 2010 Census considered oil workers in its population estimate for Prudhoe Bay, all residents are employees of oil-drilling or oil-production and support companies and most travel to Anchorage or the lower 48 states when off-duty.
b U.S. Census Bureau 2010 data is not available for the community of Y. The latest population and race estimates for Y were obtained from the U.S. Census Bureau 2005-2009 American Community Survey.
Sources: U.S. Census Bureau. 2000; U.S. Census Bureau. 2011d.
5.15.3.2 Community Profiles
The community profiles below (presented from North to South) are derived from the Alaska
Community Database Community Information Summaries (CIS), which contain information
about the accessibility of clean water and healthcare within the PACs, as well as a brief
overview of each community‘s history and accessibility via the transportation network
(ADCCED 2011). Information regarding grocery and convenience stores within the PACs is
limited and, where available, was derived from the Yellow Pages.
North Slope Borough
Within the North Slope Borough, the Prudhoe Bay-Kaktovik Service Area is classified as a
medically underserved area (MUA). The community of Prudhoe Bay is located within the
borough and would potentially be subject to health effects from the proposed Project.
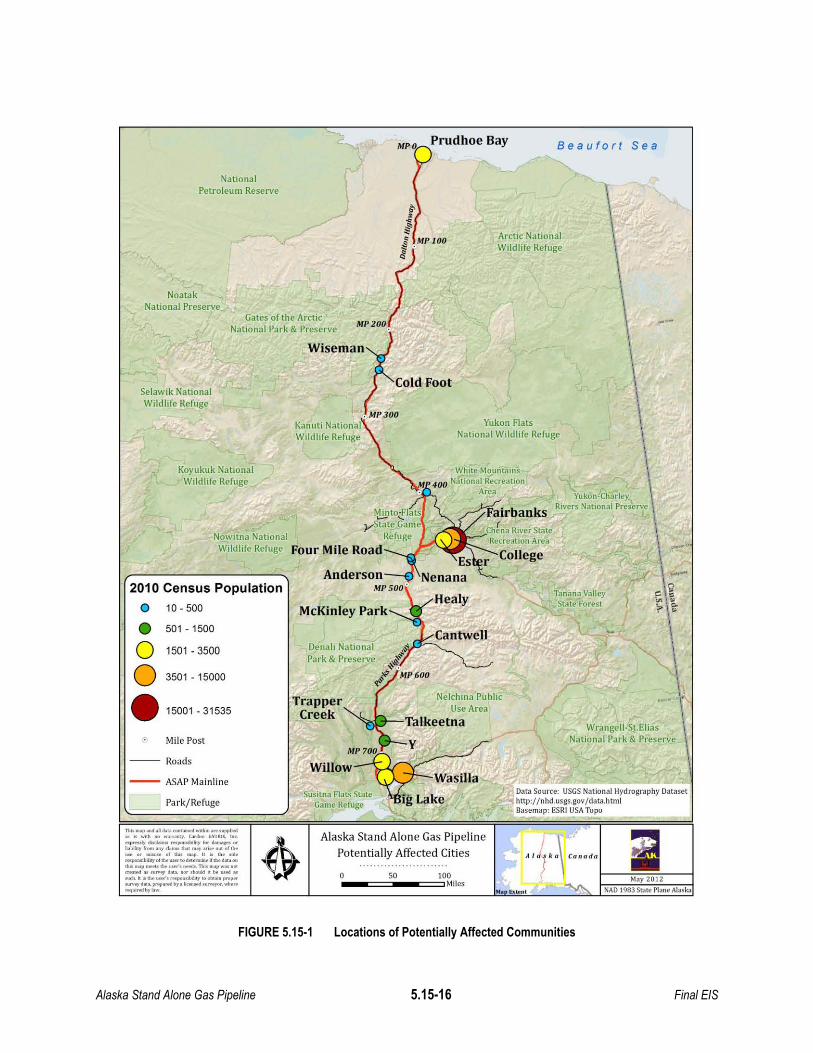
Alaska Stand Alone Gas Pipeline 5.15-16 Final EIS
FIGURE 5.15-1 Locations of Potentially Affected Communities
MPO Prudhoe Bay Beaufort Sea
May 2012
NAO 1983 State Plane Alaska
\\
"\i\I\\\
Yukon-Charley \Rivers National Preserve \,
iiII r- ex
\(" \ .........
'I)e 0ill 'II>
?'\~\\
"\
\,\
WrangeJl-St.Elias \
N"'on,1 Pock & P"''''' \
Tanana ValleyState Forest
Data Source: USGS National Hydrography Datasethttp://nhd.usgs.gov/data.htm IB<lsemap: [SRI USA Topo
Arctic NationalWildlife Refuge
Yukon FlatsNational Wildlife Refuge
100Miles
Nelchina PublicUse Area
Cantwell
Healy
MP 100
50o
Alaska Stand Alone Gas PipelinePotentially Affected Cities
Susitna Flats StateGame Refuge
McKinley Park
TrapperCreek
NationalPelroleum Reserve
Gates of the ArcticNational Park & Preserve
Koyukuk NationalWildlife Refuge
~t0.:flats
yState GameNowitna Nalional Refuge
Wildlife Refuge Four Mile Road
NoatakNational Preserve
Selawik NationalWildlife Refuge
• 501 - 1500
0 1501 - 3500
0 3501 -15000
• 15001·31535
e Mile Post
Roads
ASAP Mainline
Park/Refuge
2010 Census Papu lalian
o 10-500
TlMI .... oool .. O'U.-.-__........,;,.,j.. " with .. _,. c.-. ""IlUl. 1.<.<Sl'....."._ _ibIltty""-.,orl.ob;ltty ,,- ..,d II... ...,. ...... _ of ....... or ........ of tIW ""l'- 11 ;, ...._ ....~"Yof...._' ;,.~ ..___ tloo_ Th ,.. ..
........................ _.Ioou.. rt .
,""'_ ''"'P<>I'sibiltty'.ot.ui.prof'''"........ d _ bjI.Il<oo<.....ut'IOj'O<,""....

Alaska Stand Alone Gas Pipeline 5.15-17 Final EIS
Prudhoe Bay
Prudhoe Bay is a large work camp for the oil industry. The 2010 Census considered oil workers
in its population estimate for Prudhoe Bay, estimating approximately 2,174 permanent
residents, but all residents are employees of oil-drilling or oil-production and support companies
most travel to Anchorage or the lower 48 states when off-duty. Approximately 7.8 percent of
Prudhoe Bay‘s population as estimated by the 2010 Census identify as AIAN (Table 5.15-5).
Prudhoe Bay was extensively developed for oil drilling in the 1970s and sits at the north
terminus of an 800-mile long pipeline that transports crude oil to Valdez. Prudhoe Bay oil fields
provide approximately 10 percent of the nation‘s domestic oil supply (DOE 2012). More than
5,000 workers are employed in the oil fields and work long consecutive shifts. There is no
economy in the area outside of the oil fields.
Sanitation facilities are located within the oil field group quarters. Health care is provided by
medical staff employed by oil companies. Foods are most easily available at employee
cafeterias which are designed to meet the needs of oil field or industrial workers.
Yukon-Koyukuk Census Area
The Yukon-Koyukuk Census Area contains three MUAs: Koyukuk-Middle Yukon, McGrath-Holy
Cross Service Area, and Yukon Flats Service Area. The communities of Wiseman, Coldfoot,
Livengood, Four Mile Road, and Nenana are located within the census area and would
potentially be subject to health effects from the proposed Project.
Wiseman
An estimated 14 people live in Wiseman, with no individuals classified as AIAN (see
Table 5.15-5). The town is situated about 13 miles north of Coldfoot. When mining activities
increased on Nolan Creek in the early 1900s, people began moving from Coldfoot to Wiseman.
Today, the Dalton highway runs nearby, following the pipeline. A dirt airstrip exists in Wiseman,
but it is not maintained. The local school closed in 2002 due to low enrollment and children are
now homeschooled. Residents are sustained by subsistence hunting, fishing, and trapping.
Local health care is provided by the Wiseman Health Clinic. Itinerant care is provided during a
visit every October by a public health nurse. Emergency services are within 30 minutes of a
higher-level satellite health care facility. Fairbanks hospitals offer auxiliary health care.
Some homes haul water and use outhouses, while others have individual wells and septic
tanks.
Coldfoot
An estimated 10 people reside in Coldfoot, with 10.0 percent classified as AIAN (see
Table 5.15-5). Once a bustling mining town, Coldfoot was abandoned when people began
mining north in Wiseman. Coldfoot is located along the Dalton highway. Today, the community
has a hotel, a restaurant, a gas station, an RV park, and a BLM office.

Alaska Stand Alone Gas Pipeline 5.15-18 Final EIS
Houses are connected to individual wells and septic tanks. Residents must travel to Fairbanks
hospitals for health care. Emergency service is provided by volunteers. Some grocery goods
are available at the Coldfoot Camp Grocery.
Livengood
The population of Livengood is estimated at 13 people, with 23.1 percent of the population
classified as AIAN (see Table 5.15-5). The village was founded in 1915 after gold was
discovered on Livengood Creek. Livengood is 80 miles northwest of Fairbanks on the Elliott
Highway, which provides year-round access. In addition, a 50-foot gravel runway is available.
Most residents of Livengood are seasonal and/or retired. The highway provides some
opportunity for roadside services, but year-round employment is limited. Approximately two-
thirds of residences are completely plumbed, with individual wells and septic tanks.
Four Mile Road
Four Mile Road is populated by approximately 43 individuals, with 30.2 percent classified as
AIAN (see Table 5.15-5). It is located about 50 miles southwest of Fairbanks on the Parks
Highway. The city of Nenana, located just south of Four Mile Road, has a growing community
which in turn creates growth for Four Mile Road. Most residents of Four Mile Road also work in
Nenana.
Fewer than half of the residences have complete plumbing, and health care services must be
obtained through the Nenana Native Clinic or Fairbanks hospitals.
Nenana
The population of Nenana is estimated at 378 people, with 37.6 percent classified as AIAN (see
Table 5.15-5). It is located 55 miles southwest of Fairbanks on the Parks Highway. Nenana is
also located along the Alaska Railroad (ARR). The gold rush in 1902 brought many people to
the area; however, by 1930 the population had dropped to fewer than 300 people. Currently,
most jobs in Nenana are government-funded. It is the center of the rail-to-river barge
transportation center for the Interior. The town enjoys a strong seasonal private-sector
economy. In addition, subsistence foods such as salmon, moose, caribou, bear, waterfowl, and
berries remain important. Basic groceries are available at Coghill‘s Store.
Nenana is accessible by road, river, rail, and air. Daily buses to Fairbanks and Anchorage are
available all year long. Local health care is provided by the Nenana Clinic, with emergency
service provided by 911 telephone service, volunteers, and a health aide. Auxiliary health care
is offered by the Nenana Volunteer Fire/Emergency Medical Service (EMS) Department.
Circulating loops distribute treated well water throughout the community. Sewage is collected
by a piped gravity system and treated at a secondary treatment plan. The majority of the city is
connected to the piped water and sewer system; the remainder of the residences have
individual wells and septic systems.

Alaska Stand Alone Gas Pipeline 5.15-19 Final EIS
Fairbanks North Star Borough
The FNSB is the second-largest population center in the state, with approximately 97,581
residents. Approximately 7 percent of the population was classified as AIAN. More than one-
third of employment in the borough is provided through the public sector, including the FNSB
school district, the University of Alaska Fairbanks, and the military. In 2011, nearly 8,600
soldiers were stationed in the FNSB on Fort Jonathan Wainwright or the Eielson Air Force Base.
Retail services, gold mining (including the Fort Knox hard rock gold mine), tourism,
transportation, and medical services also contribute to the local economy.
The FNSB is accessible by road via the Richardson, Parks, Steese, and Elliott Highways. Cargo
transportation is provided by truck, rail, and air services. Air transportation is provided by
scheduled jet services available at Fairbanks International airport. A public seaplane base is
located on the Chena River.
The FNSB is classified as a Medically Underserved Population (MUP), designated at the
request of the Alaskan Governor. The communities of Ester and College and the City of
Fairbanks are located within the borough and would potentially be subject to health effects from
the proposed Project.
Ester
Approximately 2,422 people live in the unincorporated community of Ester, with 6.7 percent
classified as AIAN (see Table 5.15-5). It is located just 8.5 miles west of Fairbanks on the Parks
Highway. Ester was originally a mining camp on Ester Creek, and enjoys a tourism industry
based on the mining heritage. Residents of Ester have access to highways and all
transportation options available in Fairbanks. Most people who live in Ester work in Fairbanks.
More than 80 percent of residences are fully plumbed; the remaining residences haul water from
a central water source within the community. Residents travel to Fairbanks for health care
services and groceries. In addition, the community of Ester holds a seasonal farmer‘s market.
Emergency services are provided by volunteers and 911 telephone services, and auxiliary
health care is offered by the Ester Volunteer Fire Department.
College
College is a large suburban area that is home to approximately 12,964 residents, with 9.5
percent classified as AIAN (see Table 5.15-5). It is located immediately northwest of Fairbanks
and is the location of the University of Alaska at Fairbanks. Most residents of College are
employed or attend school at the University.
The majority of residences are completely plumbed, with two-thirds connected to piped water
and sewer and the remainder connected to individual wells and septic systems. Community
water is supplied by a deep well, and water treatment is performed at a water treatment facility
operated by College Utilities Corporation.

Alaska Stand Alone Gas Pipeline 5.15-20 Final EIS
Residents of College obtain health care services from private clinics and Fairbanks hospitals.
Auxiliary health care is offered by Chena/Goldstream Fire & Rescue and Fairbanks hospitals,
and emergency service is provided by 911 telephone service, paid EMS service, volunteers, a
health aide and the military.
Fairbanks
The City of Fairbanks is the largest community within the FNSB, with a population of 31,535.
Approximately 10.0 percent of the population classified as AIAN (see Table 5.15-5). Fairbanks
was home to Koyukon Athabascans for thousands of years before gold was discovered. A
trading post was set up along the Chena River when the steamer Lavelle Young grounded on
the banks of what is now Fairbanks on its way to establish a trading post in Tanacross. With the
gold rush of 1902 Fairbanks expanded. With construction of the Alcan Highway and the Trans-
Alaska pipeline the area experienced further growth in the community. Today, Fairbanks is the
second largest settlement in Alaska.
Fairbanks is accessible by road, rail, and by air. It is the service and supply center for Interior
Alaska and, decades ago, was the international crossroads for flights into Asia. Fairbanks has a
diverse economy which includes tourism, manufacturing, communications, financial,
transportation, medical, government, and military aspects.
Fairbanks is a small city and is part of the Interior EMS Region. Emergency service is provided
by 911 telephone service, paid EMS service, volunteers, a health aide, and the military. Local
hospitals or health clinics within the Fairbanks area include Fairbanks Memorial Hospital,
Interior Community Health Center, Fairbanks Regional PHN, Chief Andrew Isaac Health Center,
and Bassett Army Community Hospital/Ft. Wainwright. The hospitals are qualified acute care
facilities and provide State-certified Medevac services. Auxiliary health care, specialized care
(FNA Regional Center for Alcohol & Other Addictions), and long-term care services (Fairbanks
Pioneers‘ Home, Denali Center) are also available to the City of Fairbanks.
Water and sewer systems are operated by private companies. Treated water is distributed
throughout the greater Fairbanks area by 15 circulating pump stations. Fairbanks supports
several local, regional, and national grocery stores, including Fred Meyer, Safeway, Sam‘s Club,
Wal-Mart, and Stop & Shop. Goods are transported to the city by truck, air, and rail.
Denali Borough
The Denali Borough is classified as an MUP, designated at the request of the Alaskan
Governor. The communities of Anderson, Healy, McKinley Park, and Cantwell are located
within the borough and would potentially be subject to health effects from the proposed Project.
Anderson
The City of Anderson is home to approximately 246 individuals, with 2.8 percent classified as
AIAN (see Table 5.15-5). The majority of residents are employees of the Clear Air Force
Station and their families. Anderson is located on a spur road off the Parks Highway, 76 miles
southwest of Fairbanks. A road connecting Anderson and Nenana was built allowing easier

Alaska Stand Alone Gas Pipeline 5.15-21 Final EIS
access to Fairbanks in 1962. The Parks Highway, completed in 1973, allows access to
Anchorage, which is 285 miles south of Anderson. Additionally, the ARR services Anderson
and a state-owned runway is located at Clear Airport.
Residences have individual wells, septic systems, and plumbing, and Clear Air Force Station
provides piped water and sewer to all base facilities. The Anderson School has a potable well.
The Anderson Health Clinic provides local health care to the community. The City of Anderson
is part of the Interior EMS Region, with emergency service provided by 911 telephone service
and volunteers. Auxiliary health care is offered by the Anderson Volunteer Fire Department.
Healy
Approximately 1,021 people live in the community of Healy, with 2.1 percent of the population
classified as AIAN (see Table 5.15-5). Healy is located on a spur road off the Parks Highway 12
miles from the entrance to the Denali National Park and Preserve. It is about 109 miles
southwest of Fairbanks. The town was established in 1904 and is home to the Usibelli Coal
Mine, Alaska‘s only operating coal mine. Usibelli dominates the economy of Healy and is an
important employer. Tourism to Denali Park supports RV Parks, guided rafting, helicopter tours,
and small businesses. Healy is accessible by car, air, and rail. The Tri-Valley School is utilized
by the surrounding area.
Healy is an isolated town/sub-regional center that is part of the Interior EMS Region.
Emergency service is provided by 911 telephone service and volunteers. The Tri-Valley
Community Center, a qualified emergency care center affiliated with the Interior Community
Health Center in Fairbanks, provides local health care.3 Specialized care (Railbelt Mental
Health & Addictions and Healy Senior Center) and auxiliary health care via the Canyon Clinic
(summer only) are also offered.
The large majority of homes use individual wells and septic systems, and over 80 percent have
full plumbing. Residents and visitors can acquire some grocery items from Mountain View
Liquor & Grocery and the Denali General Store.
McKinley Park
The population of McKinley Park is estimated at 185 individuals, with no individuals classified as
AIAN (see Table 5.15-5). It is located just outside the entrance to Denali National Park and
Preserve. McKinley Park is primarily a seasonal community and tourism to the park is its main
economic input. Year-round employment can be found at Usibelli Coal Mine and Golden Valley
Electric nearby. Students travel to Cantwell to attend school.
While hotels are served by individual water wells and septic systems, most residences haul
water and use outhouses. Residents must travel to the Healy Health Clinic in Healy for health
3 A public comment was received indicating that the Tri-Valley Community Center provides some medical services
year-round but is not staffed by a physician.
Alaska Stand Alone Gas Pipeline 5.15-22 Final EIS
care services. Auxiliary health care is offered by the Denali National Park Ambulance (summer
only) and the Healy Clinic, and emergency service is provided by volunteers and paid EMS
service.
Cantwell
The community of Cantwell is home to approximately 219 residents, with 15.5 percent of the
population classified as AIAN (see Table 5.15-5). It is located on the Parks Highway 210 miles
north of Anchorage and 27 miles south of Denali Park and Preserve. Cantwell began as a flag
stop on the ARR. The economy of Cantwell is primarily based on the highway tourism for
Denali Park. Some part-time or seasonal jobs are available. Many people also depend on
hunting, trapping, and fishing for subsistence.
Cantwell is accessible by road, rail, and air. The ARR provides train service. Two privately
owned airstrips and one privately owned helipad are available. There is one school in Cantwell.
Local health care is provided by Cantwell Clinic, a primary health care facility. Emergency
service is provided by 911 telephone service, volunteers, and a health aide. The Cantwell
Volunteer Ambulance offers auxiliary health care.
More than half of the residences in Cantwell have complete plumbing, and the majority has
individual water wells and septic systems. Residents can shop for some grocery items at the
Parkway Gift Shop.
Matanuska-Susitna Borough
The Matanuska-Susitna Borough is classified as an MUP, designated at the request of the
Alaskan Governor. The communities of Talkeetna, Trapper Creek, Y, Willow, Wasilla, and Big
Lake are located within the borough and would potentially be subject to health effects from the
proposed Project.
Talkeetna
Approximately 876 people reside in the community of Talkeetna, with 3.7 percent classified as
AIAN (see Table 5.15-5). It is located on a spur road off the Parks Highway, 115 miles north of
Anchorage. Talkeetna began as a mining town and eventually a riverboat steamer station and
then the ARR was built, bringing additional people to the area. The economy of Talkeetna
today depends on tourism to Denali. It is popular for hunting, fishing, boating, skiing, dog
mushing, and sightseeing.
Local health care is provided by the Sunshine Community Health Center, a qualified emergency
care center. Residents also travel to the Mat-Su Regional Hospital between Palmer and
Wasilla. Emergency service is provided by 911 telephone service and volunteers. Auxiliary
health care is offered by Talkeetna Ambulance Service and the Valley Hospital in Palmer.
Talkeetna Elementary School is located in the community. Middle and high school students
attend Susitna Valley High located at the Y junction of the Talkeetna Spur Road and the Parks
Highway.
Alaska Stand Alone Gas Pipeline 5.15-23 Final EIS
The Matanuska-Susitna Borough maintains a piped water and sewer system in the community.
Most residents have individual wells, septic tanks, and complete plumbing, and the high school
operates its own water system. Groceries are available at Cubby‘s Marketplace.
Trapper Creek
The population of Trapper Creek is estimated at 481, with 6.4 percent classified as AIAN (see
(see Table 5.15-5). It is located 17 miles north of Talkeetna on the Parks Highway. The area is
the product of federal homesteading and the initial residents were a group of homesteaders
from Detroit, Michigan who settled in 1959. The economy of Trapper Creek is based on a
variety of industries, such as education, transportation, and construction. Subsistence and
sporting activities are still integral to the lifestyle in Trapper Creek.
Trapper Creek residents travel to Mat-Su Regional Hospital in Palmer or the Sunshine
Community Health Center in Talkeetna for health care. These facilities provide auxiliary health
care, along with Trapper Creek Ambulance Service and Anchorage hospitals. Emergency
service is provided by 911 telephone service and volunteers. Some grocery items are available
at The Alaska Country Store.
Y
The U.S. Census Bureau American Community Survey 2005-2009 estimated the population of
Y at 1,483 people, with 0.8 percent of the population classified as AIAN (see Table 5.15-5). It is
located along the Parks Highway between Willow and Talkeetna at the junction of Talkeetna
Spur Road and the Parks Highway, 99 miles north of Anchorage. Many residents are self-
employed in small businesses tied to the tourism industry, such as guiding or lodging.
The majority of occupied homes has individual wells, septic tanks, and complete plumbing.
Seasonal-use homes haul water and use outhouses.
Willow
Approximately 2,102 people reside in Willow, with 5.2 percent of the population classified as
AIAN (see Table 5.15-5). It is located on the Parks Highway, 41 miles north of Anchorage.
The Willow area was historically occupied by Alaska Native Athabascans in semi-permanent
villages. Gold was discovered in Willow Creek in 1897. During the construction of the ARR,
surveyors, construction crews, and homesteaders began to settle in Willow. Today, many
homes in Willow are vacant or used only for seasonal use. Residents are often self-employed
in lodging, guiding, charter, or retail. Two saw mills also provide employment.
Willow is accessible by road and by air, although the airstrips are private. Groceries and goods
are available at Camps Caswell Food & Tackle and at the Willow Creek Grocery.
Residents travel to Sunshine Community Health Center in Talkeetna or Mat-Su Regional
Hospital in Palmer for health care. Emergency service is provided by 911 telephone service
and volunteers, and auxiliary health care is provided by Willow Ambulance Service and Mat-Su
Regional Hospital in Palmer.
Alaska Stand Alone Gas Pipeline 5.15-24 Final EIS
The school in Willow operates its own water system. While most occupied homes use individual
water wells and septic tanks and are fully plumbed, seasonal-use homes haul water and use
outhouses.
Wasilla
The population of Wasilla is estimated at 7,831 residents, with 5.2 percent of the population
classified as AIAN (see Table 5.15-5). Wasilla is located along the Parks Highway 43 miles
north of Anchorage. The town was established following the building of the ARR. Many
residents commute to Anchorage for work; however, the local economy is diverse. Tourism,
agriculture, wood working, government, retail, and many other opportunities exist in Wasilla.
Wasilla is accessible by road, rail, and air via private airstrips or the Anchorage International
Airport.
Residents travel to Palmer for health care services, which are provided by the Mat-Su Regional
Hospital, a qualified emergency care center. Specialized care is also available at the Alaska
Addiction Rehabilitation Services/Nugen‘s Ranch. Emergency service is provided by 911
telephone service and volunteers, with access to a higher-level satellite health care facility
within 30 minutes. Auxiliary health care is offered by Matanuska-Susitna Borough Emergency
Medical Services.
The City of Wasilla operates a sewer and piped water system; however, the majority of
households use individual wells and septic systems. The City obtains water from two wells at
Iditarod School and one well at Spruce Avenue. Groceries and goods are available at Steve‘s
Food Boy, Carr‘s Quality Center (a division of Safeway), Fred Meyer, and G&G Foodmart.
Big Lake
Approximately 3,350 individuals reside in the unincorporated community of Big Lake, with 7.0
percent classified as AIAN (see Table 5.15-5). Big Lake is located 13 miles southwest of
Wasilla. Initial inhabitants were Athabascan Dena‘ina Natives. Homesteaders began arriving in
1929. The town is located on the shores of Big Lake and lake-front lots became available in the
1960s. The close proximity to Anchorage and Wasilla allows residents of Big Lake to commute
out of the town for work. Several lodges on the lake support the recreational boating industry
that exists in the summer months. Fresh produce, meats, and other groceries are available at
Steve‘s Food Boy store. Big Lake has one state-owned airstrip and several marinas and boat
launches. Most (85 percent) homes have complete plumbing, while the remainder haul water
and use outhouses. Health care services are obtained outside of Big Lake by traveling to the
Mat-Su Regional Hospital in Palmer or to Anchorage hospitals. Emergency service is provided
by volunteers and 911 telephone service.
Alaska Stand Alone Gas Pipeline 5.15-25 Final EIS
Health Related Services within the PACs During Construction and Operation of the Proposed
Project.
The community information presented in this section has been developed from local sources
(e.g. community newspapers, and Websites), State of Alaska government publications and
Websites (e.g. the Alaska Community Database), and information published online and in print
by various public awareness and advocacy groups. Over time, it is possible that the quantity
and level of health related services within each PAC may change. For that reason it is
recommended that ACGD set up an outreach program to coordinate with the PACs to maintain
and update an inventory of health related services. During construction and operation of the
proposed Project, knowledge of the available services will help minimize the potential impacts to
the PACs.
5.15.3.3 Baseline Health Status
Data Collection and Information Sources
The collection of data regarding health status indicators and determinants of health was
completed by reviewing readily available public information from public health agencies and
state, regional, and community-level data bases and publications. Additionally, the comments
compiled during the scoping period held as part of the NEPA process were reviewed.
For each of the boroughs and census areas that would be crossed by the proposed Project and
alternatives, baseline health conditions are described by selecting relevant categories of
information. Two overarching categories of information were selected: health status indicators
and determinants of health. Health status indicators represent the current health condition of
the populations and communities using statistically developed descriptors of general overall
health status. These include leading causes of death, death rates, and incidence of chronic
diseases and morbidity. Health status indicators thus provide a picture of community health
status without necessarily providing insights into the factors or causes that influence health
status. Information on health status indicators is available at the state and regional level; it is
rarely available for small communities (ANGDA 2010).
Determinants of health are factors which influence health status and determine health
differentials or health inequalities. They are many and varied and include, for example, natural,
biological factors, such as age, gender and ethnicity; behavior and lifestyles, such as smoking,
alcohol consumption, diet and physical exercise; the physical and social environment, including
housing quality, the workplace and the wider urban and rural environment; and access to health
care. All of these are closely interlinked and differentials in their distribution lead to health
inequalities (WHO 2011). The relevant determinants of health for this HIA were grouped into
behavioral categories at the regional level. Behavioral categories were not available at the
individual community level; however, access to clean water, sewage treatment services,
healthcare, and emergency services for each PAC were evaluated (see Section 5.15.3.2
Community Profiles).
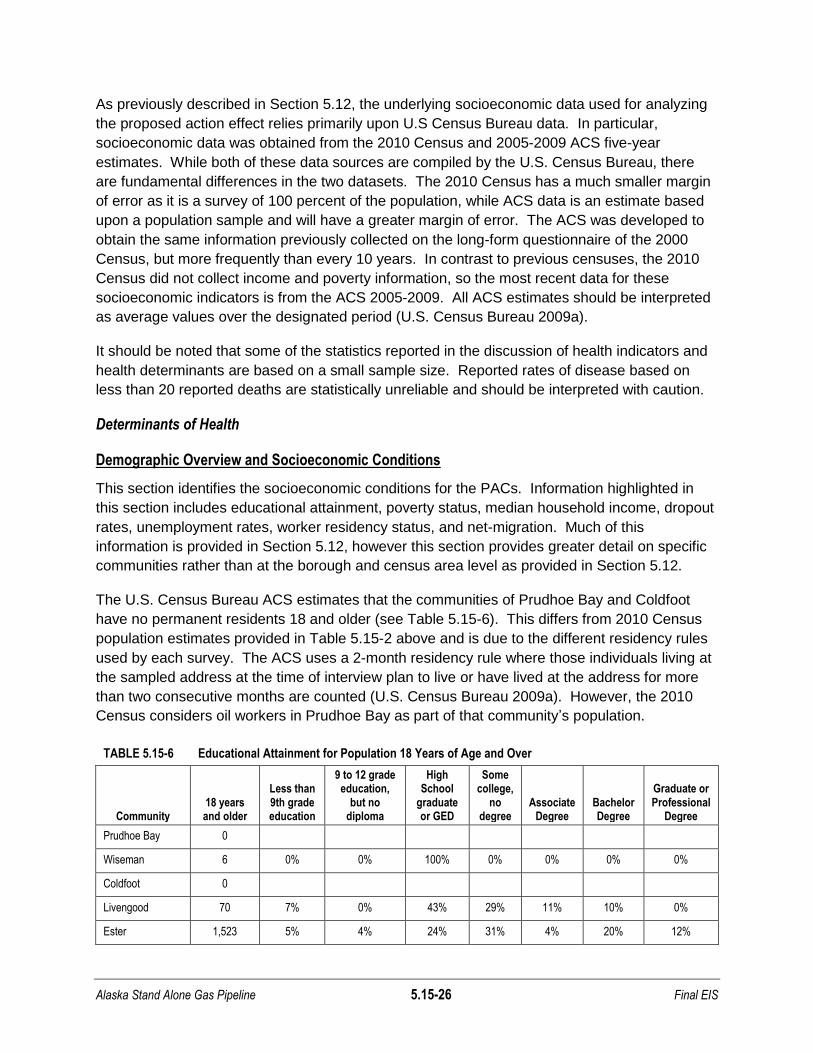
Alaska Stand Alone Gas Pipeline 5.15-26 Final EIS
As previously described in Section 5.12, the underlying socioeconomic data used for analyzing
the proposed action effect relies primarily upon U.S Census Bureau data. In particular,
socioeconomic data was obtained from the 2010 Census and 2005-2009 ACS five-year
estimates. While both of these data sources are compiled by the U.S. Census Bureau, there
are fundamental differences in the two datasets. The 2010 Census has a much smaller margin
of error as it is a survey of 100 percent of the population, while ACS data is an estimate based
upon a population sample and will have a greater margin of error. The ACS was developed to
obtain the same information previously collected on the long-form questionnaire of the 2000
Census, but more frequently than every 10 years. In contrast to previous censuses, the 2010
Census did not collect income and poverty information, so the most recent data for these
socioeconomic indicators is from the ACS 2005-2009. All ACS estimates should be interpreted
as average values over the designated period (U.S. Census Bureau 2009a).
It should be noted that some of the statistics reported in the discussion of health indicators and
health determinants are based on a small sample size. Reported rates of disease based on
less than 20 reported deaths are statistically unreliable and should be interpreted with caution.
Determinants of Health
Demographic Overview and Socioeconomic Conditions
This section identifies the socioeconomic conditions for the PACs. Information highlighted in
this section includes educational attainment, poverty status, median household income, dropout
rates, unemployment rates, worker residency status, and net-migration. Much of this
information is provided in Section 5.12, however this section provides greater detail on specific
communities rather than at the borough and census area level as provided in Section 5.12.
The U.S. Census Bureau ACS estimates that the communities of Prudhoe Bay and Coldfoot
have no permanent residents 18 and older (see Table 5.15-6). This differs from 2010 Census
population estimates provided in Table 5.15-2 above and is due to the different residency rules
used by each survey. The ACS uses a 2-month residency rule where those individuals living at
the sampled address at the time of interview plan to live or have lived at the address for more
than two consecutive months are counted (U.S. Census Bureau 2009a). However, the 2010
Census considers oil workers in Prudhoe Bay as part of that community‘s population.
TABLE 5.15-6 Educational Attainment for Population 18 Years of Age and Over
Community 18 years and older
Less than 9th grade education
9 to 12 grade education,
but no diploma
High School
graduate or GED
Some college,
no degree
Associate Degree
Bachelor Degree
Graduate or Professional
Degree
Prudhoe Bay 0
Wiseman 6 0% 0% 100% 0% 0% 0% 0%
Coldfoot 0
Livengood 70 7% 0% 43% 29% 11% 10% 0%
Ester 1,523 5% 4% 24% 31% 4% 20% 12%
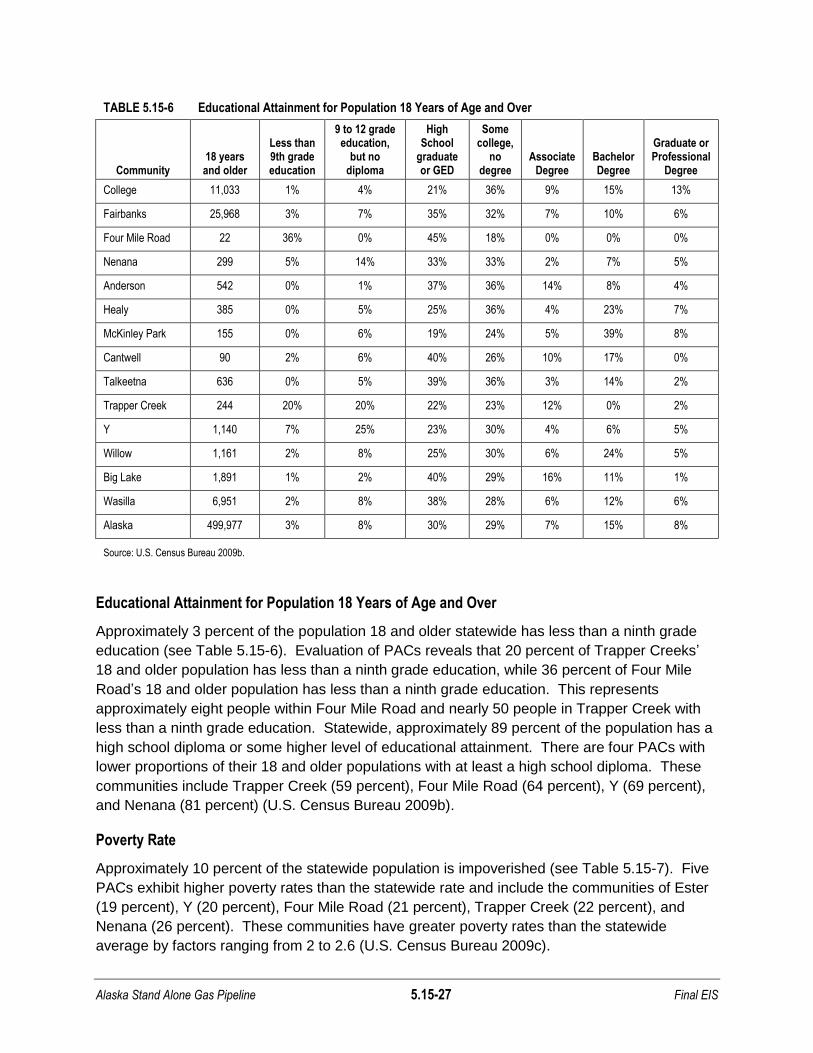
Alaska Stand Alone Gas Pipeline 5.15-27 Final EIS
TABLE 5.15-6 Educational Attainment for Population 18 Years of Age and Over
Community 18 years and older
Less than 9th grade education
9 to 12 grade education,
but no diploma
High School
graduate or GED
Some college,
no degree
Associate Degree
Bachelor Degree
Graduate or Professional
Degree
College 11,033 1% 4% 21% 36% 9% 15% 13%
Fairbanks 25,968 3% 7% 35% 32% 7% 10% 6%
Four Mile Road 22 36% 0% 45% 18% 0% 0% 0%
Nenana 299 5% 14% 33% 33% 2% 7% 5%
Anderson 542 0% 1% 37% 36% 14% 8% 4%
Healy 385 0% 5% 25% 36% 4% 23% 7%
McKinley Park 155 0% 6% 19% 24% 5% 39% 8%
Cantwell 90 2% 6% 40% 26% 10% 17% 0%
Talkeetna 636 0% 5% 39% 36% 3% 14% 2%
Trapper Creek 244 20% 20% 22% 23% 12% 0% 2%
Y 1,140 7% 25% 23% 30% 4% 6% 5%
Willow 1,161 2% 8% 25% 30% 6% 24% 5%
Big Lake 1,891 1% 2% 40% 29% 16% 11% 1%
Wasilla 6,951 2% 8% 38% 28% 6% 12% 6%
Alaska 499,977 3% 8% 30% 29% 7% 15% 8%
Source: U.S. Census Bureau 2009b.
Educational Attainment for Population 18 Years of Age and Over
Approximately 3 percent of the population 18 and older statewide has less than a ninth grade
education (see Table 5.15-6). Evaluation of PACs reveals that 20 percent of Trapper Creeks‘
18 and older population has less than a ninth grade education, while 36 percent of Four Mile
Road‘s 18 and older population has less than a ninth grade education. This represents
approximately eight people within Four Mile Road and nearly 50 people in Trapper Creek with
less than a ninth grade education. Statewide, approximately 89 percent of the population has a
high school diploma or some higher level of educational attainment. There are four PACs with
lower proportions of their 18 and older populations with at least a high school diploma. These
communities include Trapper Creek (59 percent), Four Mile Road (64 percent), Y (69 percent),
and Nenana (81 percent) (U.S. Census Bureau 2009b).
Poverty Rate
Approximately 10 percent of the statewide population is impoverished (see Table 5.15-7). Five
PACs exhibit higher poverty rates than the statewide rate and include the communities of Ester
(19 percent), Y (20 percent), Four Mile Road (21 percent), Trapper Creek (22 percent), and
Nenana (26 percent). These communities have greater poverty rates than the statewide
average by factors ranging from 2 to 2.6 (U.S. Census Bureau 2009c).

Alaska Stand Alone Gas Pipeline 5.15-28 Final EIS
TABLE 5.15-7 Poverty Rate
Community Percent of Population below Poverty Line
Prudhoe Bay NA
Wiseman 0%
Coldfoot NA
Livengood 0%
Ester 19%
College 12%
Fairbanks 10%
Four Mile Road 21%
Nenana 26%
Anderson 4%
Healy 5%
McKinley Park 7%
Cantwell 3%
Talkeetna 6%
Trapper Creek 22%
Y 20%
Willow 12%
Big Lake 15%
Wasilla 14%
Alaska 10%
Source: U.S. Census Bureau 2009b.
Median Household Income
The median household income for the PACs as well as for Alaska statewide is presented in
Table 5.15-8. Given the small sample size for the various communities there is a large margin
of error for some communities‘ median income estimates. Despite this, ACS data is the best
available data for median household estimates. Statewide median household income is nearly
200 percent higher than the median household income in Trapper Creek. Similarly, statewide
median household income is 135 percent higher than the median household income in
Livengood, while it is nearly 100 percent higher than median household income in Four Mile
Road (U.S. Census Bureau 2009d).
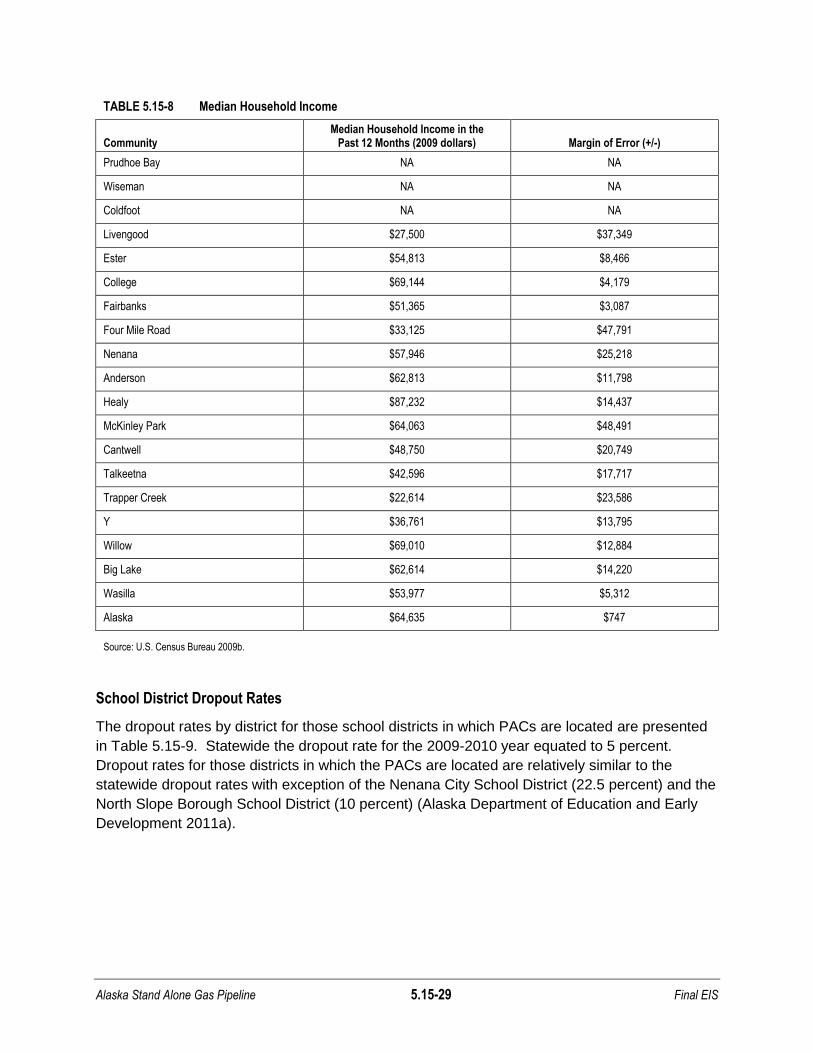
Alaska Stand Alone Gas Pipeline 5.15-29 Final EIS
TABLE 5.15-8 Median Household Income
Community Median Household Income in the
Past 12 Months (2009 dollars) Margin of Error (+/-)
Prudhoe Bay NA NA
Wiseman NA NA
Coldfoot NA NA
Livengood $27,500 $37,349
Ester $54,813 $8,466
College $69,144 $4,179
Fairbanks $51,365 $3,087
Four Mile Road $33,125 $47,791
Nenana $57,946 $25,218
Anderson $62,813 $11,798
Healy $87,232 $14,437
McKinley Park $64,063 $48,491
Cantwell $48,750 $20,749
Talkeetna $42,596 $17,717
Trapper Creek $22,614 $23,586
Y $36,761 $13,795
Willow $69,010 $12,884
Big Lake $62,614 $14,220
Wasilla $53,977 $5,312
Alaska $64,635 $747
Source: U.S. Census Bureau 2009b.
School District Dropout Rates
The dropout rates by district for those school districts in which PACs are located are presented
in Table 5.15-9. Statewide the dropout rate for the 2009-2010 year equated to 5 percent.
Dropout rates for those districts in which the PACs are located are relatively similar to the
statewide dropout rates with exception of the Nenana City School District (22.5 percent) and the
North Slope Borough School District (10 percent) (Alaska Department of Education and Early
Development 2011a).
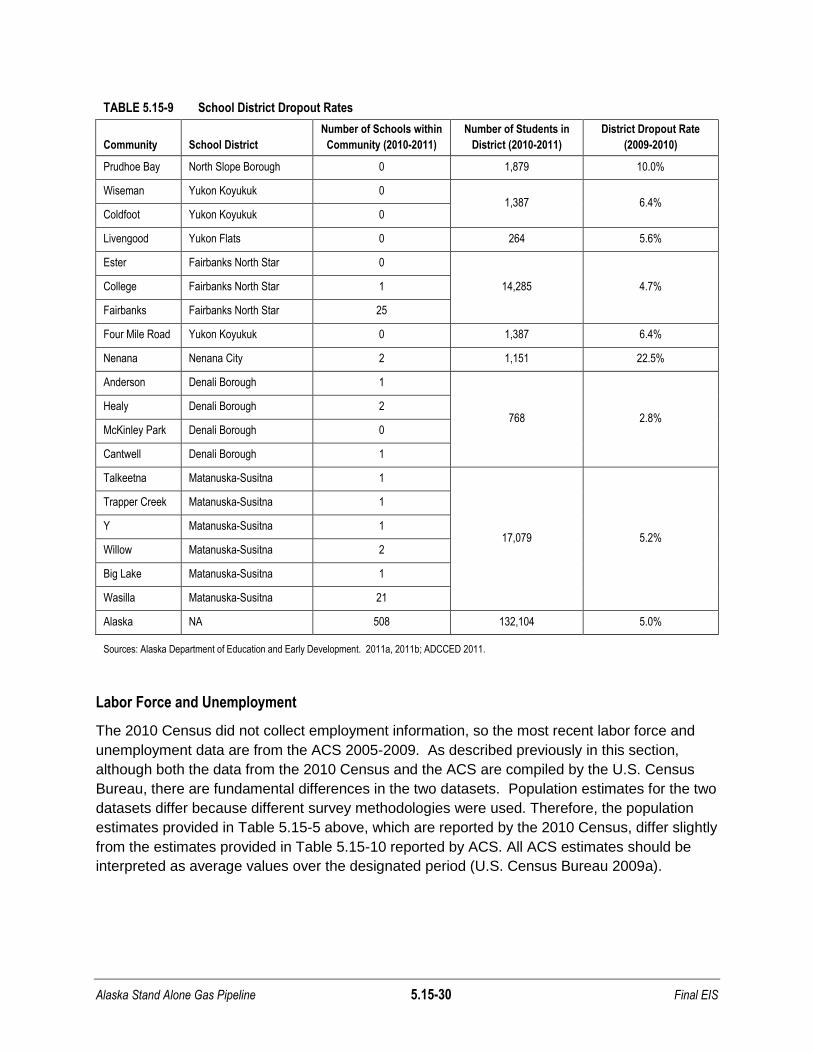
Alaska Stand Alone Gas Pipeline 5.15-30 Final EIS
TABLE 5.15-9 School District Dropout Rates
Community School District
Number of Schools within
Community (2010-2011)
Number of Students in
District (2010-2011)
District Dropout Rate
(2009-2010)
Prudhoe Bay North Slope Borough 0 1,879 10.0%
Wiseman Yukon Koyukuk 0 1,387 6.4%
Coldfoot Yukon Koyukuk 0
Livengood Yukon Flats 0 264 5.6%
Ester Fairbanks North Star 0
14,285 4.7% College Fairbanks North Star 1
Fairbanks Fairbanks North Star 25
Four Mile Road Yukon Koyukuk 0 1,387 6.4%
Nenana Nenana City 2 1,151 22.5%
Anderson Denali Borough 1
768 2.8% Healy Denali Borough 2
McKinley Park Denali Borough 0
Cantwell Denali Borough 1
Talkeetna Matanuska-Susitna 1
17,079 5.2%
Trapper Creek Matanuska-Susitna 1
Y Matanuska-Susitna 1
Willow Matanuska-Susitna 2
Big Lake Matanuska-Susitna 1
Wasilla Matanuska-Susitna 21
Alaska NA 508 132,104 5.0%
Sources: Alaska Department of Education and Early Development. 2011a, 2011b; ADCCED 2011.
Labor Force and Unemployment
The 2010 Census did not collect employment information, so the most recent labor force and
unemployment data are from the ACS 2005-2009. As described previously in this section,
although both the data from the 2010 Census and the ACS are compiled by the U.S. Census
Bureau, there are fundamental differences in the two datasets. Population estimates for the two
datasets differ because different survey methodologies were used. Therefore, the population
estimates provided in Table 5.15-5 above, which are reported by the 2010 Census, differ slightly
from the estimates provided in Table 5.15-10 reported by ACS. All ACS estimates should be
interpreted as average values over the designated period (U.S. Census Bureau 2009a).

Alaska Stand Alone Gas Pipeline 5.15-31 Final EIS
As shown in Table 5.15-10, the statewide average unemployment rate over the 2005-2009
period was 8.7 percent. Unemployment rates in Livengood (14.9 percent), Nenana (14.8
percent), Cantwell (15.2 percent), Y (11.2 percent), and Wasilla (15.9 percent) are between 30
percent and 80 percent higher than statewide unemployment rates over the same period. In
contrast, unemployment rates in Fairbanks, Four Mile Road, Anderson, Healy, McKinley Park,
and Willow were between 30 percent and 100 percent lower than statewide unemployment
rates. All other communities exhibit unemployment rates similar to the statewide unemployment
rate over the 2005-2009 period (U.S. Census Bureau 2009e).
TABLE 5.15-10 Labor Force and Unemployment
Community Population 16 and Over
In Labor Force
In Military
In Civilian Labor Force Employed
Un-employed
Not in Labor force
Un-employment
Rate
Percent not in Labor Force
Prudhoe Bay 0 0 0 0 0 0 0 NA NA
Wiseman 6 0 0 0 0 0 6 NA 100.0%
Coldfoot 0 0 0 0 0 0 0 NA NA
Livengood 70 47 0 47 40 7 23 14.9% 32.9%
Ester 1,545 957 7 950 926 24 588 2.5% 38.1%
College 11,358 7,980 199 7,781 7,090 691 3,378 8.9% 29.7%
Fairbanks 26,861 20,226 3,814 16,412 15,398 1,014 6,635 6.2% 24.7%
Four Mile
Road 22 12 0 12 12 0 10 0.0% 45.5%
Nenana 313 182 0 182 155 27 131 14.8% 41.9%
Anderson 567 484 114 370 370 0 83 0.0% 14.6%
Healy 401 327 0 327 318 9 74 2.8% 18.5%
McKinley Park 155 146 0 146 146 0 9 0.0% 5.8%
Cantwell 94 66 0 66 56 10 28 15.2% 29.8%
Talkeetna 705 496 47 449 408 41 209 9.1% 29.6%
Trapper Creek 257 133 0 133 122 11 124 8.3% 48.2%
Y 1,224 685 0 685 608 77 539 11.2% 44.0%
Willow 1,197 661 8 653 638 15 536 2.3% 44.8%
Big Lake 1,968 1,326 0 1,326 1,200 126 642 9.5% 32.6%
Wasilla 7,244 4,696 71 4,625 3,888 737 2,548 15.9% 35.2%
Alaska 521,998 374,93
2 16,640 358,292 326,950 31,342 147,066 8.7% 28.2%
Source: U.S. Census Bureau 2009b.
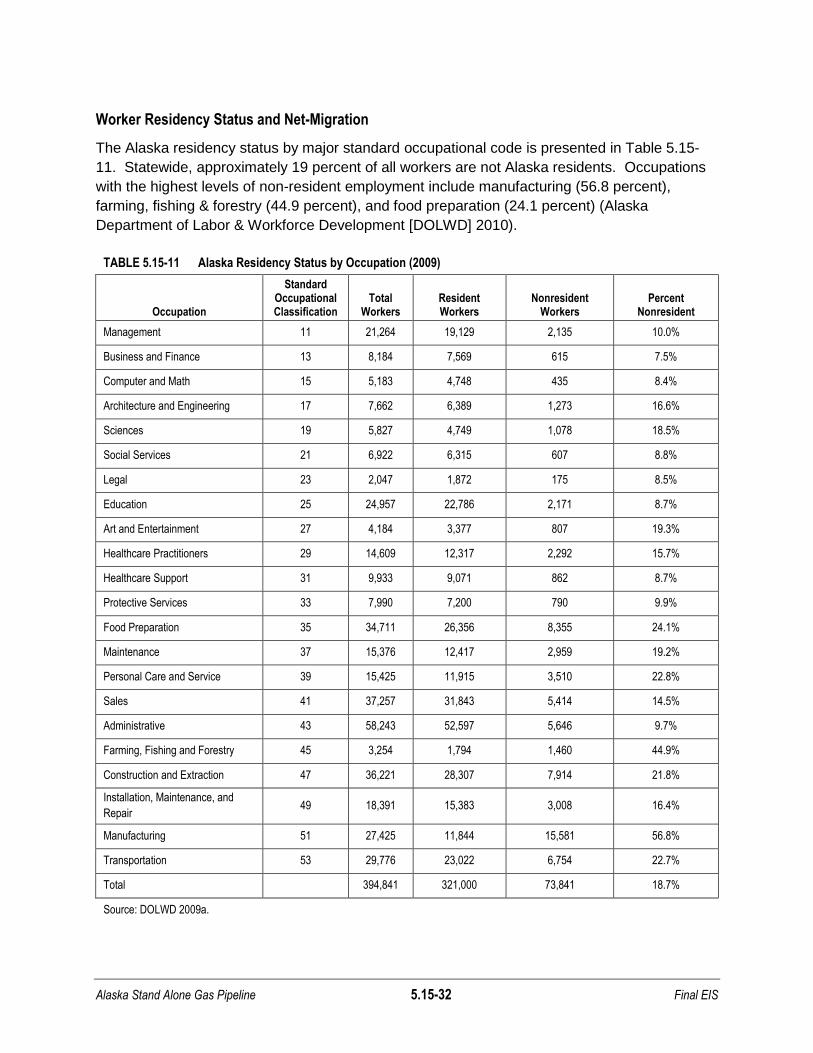
Alaska Stand Alone Gas Pipeline 5.15-32 Final EIS
Worker Residency Status and Net-Migration
The Alaska residency status by major standard occupational code is presented in Table 5.15-
11. Statewide, approximately 19 percent of all workers are not Alaska residents. Occupations
with the highest levels of non-resident employment include manufacturing (56.8 percent),
farming, fishing & forestry (44.9 percent), and food preparation (24.1 percent) (Alaska
Department of Labor & Workforce Development [DOLWD] 2010).
TABLE 5.15-11 Alaska Residency Status by Occupation (2009)
Occupation
Standard Occupational Classification
Total Workers
Resident Workers
Nonresident Workers
Percent Nonresident
Management 11 21,264 19,129 2,135 10.0%
Business and Finance 13 8,184 7,569 615 7.5%
Computer and Math 15 5,183 4,748 435 8.4%
Architecture and Engineering 17 7,662 6,389 1,273 16.6%
Sciences 19 5,827 4,749 1,078 18.5%
Social Services 21 6,922 6,315 607 8.8%
Legal 23 2,047 1,872 175 8.5%
Education 25 24,957 22,786 2,171 8.7%
Art and Entertainment 27 4,184 3,377 807 19.3%
Healthcare Practitioners 29 14,609 12,317 2,292 15.7%
Healthcare Support 31 9,933 9,071 862 8.7%
Protective Services 33 7,990 7,200 790 9.9%
Food Preparation 35 34,711 26,356 8,355 24.1%
Maintenance 37 15,376 12,417 2,959 19.2%
Personal Care and Service 39 15,425 11,915 3,510 22.8%
Sales 41 37,257 31,843 5,414 14.5%
Administrative 43 58,243 52,597 5,646 9.7%
Farming, Fishing and Forestry 45 3,254 1,794 1,460 44.9%
Construction and Extraction 47 36,221 28,307 7,914 21.8%
Installation, Maintenance, and
Repair 49 18,391 15,383 3,008 16.4%
Manufacturing 51 27,425 11,844 15,581 56.8%
Transportation 53 29,776 23,022 6,754 22.7%
Total 394,841 321,000 73,841 18.7%
Source: DOLWD 2009a.

Alaska Stand Alone Gas Pipeline 5.15-33 Final EIS
As shown in Figure 5.15-2 below, migration to and from Alaska from 1970 to the late 1980s was
dramatic. In the mid-1970s TAPs construction was the main driver for increased population
migration for that period, with the creation of 60,000 jobs resulting from the oil boom of the
1980s (DOLWD 2009b). Migration to and from Alaska between the late 1990s to present has
remained relatively constant.
Source: DOLWD 2009b.
FIGURE 5.15-2 Timeline of Net Migration for Alaska
Access to Health Care
According to the ADHSS, nearly one in five adults (19 percent) in Alaska between the ages of
18 and 64 do not have health care coverage (ADHSS 2010a)4. One of the key determinants of
4 This reference refers to a digest of the Alaska Behavioral Risk Factor Surveillance System (BRFSS) by ADHSS.
The BRFSS methodology used to develop this and other health indicator estimates has been used and evaluated by the CDC and participating states since 1984. In general, data from the CDC BRFSS and AK BRFSS are extremely reliable and valid; however, there are some limitations associated with the method of data collection used for BRFSS. First, the BRFSS data are collected by telephone. Individuals who live in households without a residential telephone are not included. Therefore, the BRFSS might exclude persons of lower socioeconomic status or households with cellular phones only. Second, the survey is based on non-institutionalized populations and excludes persons residing elsewhere, such as nursing homes or long-term-care facilities. Third, the BRFSS data are self-reported by respondents, which can be subject to recall bias. Fourth, the sampling frame of the BRFSS is the entire state; therefore, some rural areas might be represented by relatively few interviews. Fifth, many analyses could not be conducted for rural areas because of small sample sizes. Sixth, health conditions are reported based on diagnoses, so the data could overlook individuals whose health problems have not been tested
40,000
30,000
20,000
10,000
o
-10,000
-20,000
III I I I I •r T 1 II..··' "
-30,000
1970 1975 1980 1985 1990 1995 2000 2005
• Net Migration

Alaska Stand Alone Gas Pipeline 5.15-34 Final EIS
health for Alaska is whether a community or a population is classified as ―medically
underserved.‖ MUPs and Medically Underserved Areas (MUAs) are designated by the Health
Resources and Services Administration as having too few primary care providers, high infant
mortality, high poverty, and/or high elderly population (U.S. Department of Health and Human
Services 2011). Health Professional Shortage Areas (HPSAs) are designated by the US
Department of Health and Human Services, Health Resources and Services Administration
(HRSA) as areas that are lacking in primary medical care, dental or mental health providers,
and may be geographic, demographic, or institutional.
HPSAs and MUAs/MUPs were reported for Alaskan boroughs and census areas by the ADHSS
as of March 19, 2009, however, information for specific PACs is not available (ADHSS 2009a).
Table 5.15-12 presents the HPSA and MUA/MUP designations for the potentially affected
boroughs and census areas. Each borough and census area intersected by the proposed ROW
is either characterized as an MUP or contains MUAs within its boundaries.
TABLE 5.15-12 HPSAs and MUAs/MUPs for Potentially Affected Boroughs and Census Areas
Borough
HPSA
MUA
MUP Primary Care Dental Mental
Fairbanks North Star Borough Low income CHC; applying
for low income CHC
yes
North Slope Borough yes yes yes yes - Prudhoe Bay-Kaktovik
Service Area
Yukon-Koyukuk Census Area yes yes yes
yes - Koyukuk-Middle Yukon,
McGrath-Holy Cross, and
Yukon Flats Service Areas
Denali Borough yes applied;
CHC site yes
yes
Matanuska-Susitna Borough yes (north);
2 CHCs
yes (north);
2 CHCs 2 CHCs
yes
Notes:
CHC - there is at least one Community Health Center
yes - in HPSA columns indicates a geographic HPSA designation approved by the HRSA for all or part of the census area or borough
Source: ADHSS 2009a.
Lifestyle Choices
Physical Activity
Consistent physical activity is an important indicator of future cardiovascular risk. Moderate
physical activity is defined as some activity that causes an increase in breathing or heart rate
(30 or more minutes a day, 5 or more days per week). Vigorous physical activity is defined as
some activity that causes a large increase in breathing or heart rate (20 or more minutes a day,
or recognized. Health indicators that report BRFFS data are given for tobacco use and heart attacks later in this Section.
Alaska Stand Alone Gas Pipeline 5.15-35 Final EIS
3 times or more a week). Within the study area, the North Slope Borough has the highest
percentage of adults who are physically inactive (33.5 percent), the highest rate reported within
the State of Alaska, followed by the Yukon-Koyukuk Census Area (27 percent), Denali Borough
(26.1 percent), Fairbanks North Star Borough (22.9 percent), and the Matanuska-Susitna
Borough (22.8 percent) (CDC 2011a).
Tobacco Use
The prevalence of smoking for adult Alaskans was 19 percent state-wide in 2009, with more
men smoking than women and a disproportionately high prevalence among AIAN people.
About 39 percent of AIAN adults reported smoking in 2009 (CDC 2009b). Tobacco use for
specific geographic areas is not currently available past 2007. Reports of tobacco usage from
2007 reported the highest prevalence of smoking in the North/Interior Region (36 percent of
adults). Prevalence of smoking among adults was 26 percent in Matanuska-Susitna Borough
and 22 percent in the Fairbanks North Star Borough in 2007. Overall, in 2007, approximately
22 percent of adults were smokers statewide, suggesting that annual estimated smoking
prevalence has decreased over the past several years (down to 19 percent estimated for 2009).
Usage of smokeless tobacco is less common among Alaskans and ranged from 3 to 6 percent
in 2007 for regions containing PACs. AIAN people report slightly higher rates of smokeless
tobacco use (11 percent of adults) compared to Alaska non-native people (4 percent)
(CDC 2009b).
Substance Abuse
The illegal use of drugs (e.g., marijuana, cocaine, and methamphetamine) and binge drinking
are included in the category of substance abuse. The prevalence of binge drinking (defined as
proportion of males having five or more drinks or females having four or more drinks on one
occasion within a 30-day span) in Alaska is approximately the same as for the entire US. In
2008, 16 percent of Alaskan adults reported engaging in binge drinking. The prevalence was
higher in males (22 percent) than females (10 percent). AIAN people reported significantly
higher rates of binge drinking (26.7 percent) compared to Alaska non-natives (17.1 percent)
during the period of 2007 to 2009 (CDC 2009b). The highest rate of binge drinking among
Alaska Natives occurs in the Interior Region (22 percent). Rates of binge drinking are
21 percent in the Arctic Slope Region and 16 percent in the Anchorage/Matanuska-Susitna
Region for Alaska Natives (Alaska Native Tribal Health Consortium 2009).
Marijuana use statistics are difficult to interpret due to differences in survey date, type, and
definitions. But most surveys suggest that marijuana use is higher among AIAN youths than the
overall population, for example:
Approximately 45 percent of Alaska high school-aged students reported ever using
marijuana (during their life) in a 2009 survey compared to 37 percent in the rest of the
US (CDC 2009c).
According to the Substance and Mental Health Services Administration (2004) data for
2002 and 2003], 49.3% of AIAN persons aged 12 or older reported having used
marijuana sometime during their lifetime compared to 40.5% of all Americans.
Alaska Stand Alone Gas Pipeline 5.15-36 Final EIS
Corresponding figures for the past year and past month for AIAN were 14.5% and 8.3%,
respectively—comparable figures for all Americans were 10.8 and 6.2%. The latest
figures (see Substance and Mental Health Services Administration 2011) for adolescents
aged 12 to 17 from the National Survey on Drug Use and Health (NSDUH) indicated that
13.8% of AIAN adolescents reported using marijuana in the past month compared to a
6.9% national average.
The National Center for Health Statistics (CDC 2010e) reports data for 2008. According
to these data 6.2% of white-only persons 12 years of age or older reported using
marijuana in the past month, compared to 8.2% for AIAN.
The State of Alaska, Epidemiology (1997) department estimated that in 1995 29% of
Alaskan high school students used marijuana in the past 30 days, compared to 29% for
Alaska Natives and 25% of American high school students.
Bachman et al., (1991), analyzing older data (1976-89) for high school seniors reported
higher marijuana use rates than cited above and also that 30-day prevalence rates
differed by ethnic/racial group (AI/AN higher than Caucasian) and males greater than
females. Walters et al. (2002) reported that 38% of AIAN 12th graders used marijuana
relative to 16% of non- AIAN students.
The use of methamphetamine (meth) has been reported for young Alaskans. Estimated meth
use for 2002 to 2005 was almost 3 percent of 18 to 25 year olds surveyed (Rivera and Baker
2010). Alaskan youth are not more likely to use cocaine, heroin, meth, or ecstasy than youth
elsewhere in the U.S. More specific regional data for substance abuse is not available for
Alaska.
Subsistence Harvest
As described in Section 5.14 (Subsistence) and within this section, impacts to subsistence uses
from the proposed Project would be greatest in the undeveloped Minto Flats vicinity and for
subsistence users in communities that lie directly along the proposed Project (e.g., Minto,
Nenana, Healy, Wiseman, Coldfoot, Anderson, McKinley Park, Cantwell, Trapper Creek, and
Willow). Because subsistence impacts would be of a greater magnitude in these communities
than for other subsistence communities described in Section 5.14, detailed harvest estimates for
these communities, where available, are provided in Tables 5.15-13 through 5.15-19.
Subsistence harvest data are not available for the communities of Wiseman, Coldfoot, and
Willow.
Minto
Subsistence harvest data for Minto show 95.6 percent of households harvesting subsistence
resources in 1984, with this level decreasing to 65 percent of households in 2004 (see
Table 5.15-13). Across the same time period, the total harvested weight decreased from
190,619 pounds to 30,606 pounds, with per capita harvests decreasing from 1,015 pounds to
146 pounds. The dominant species harvested also changed. In 1984, salmon species
comprised 67.6 percent (128,891 pounds) of the total harvest weight, followed by non-salmon

Alaska Stand Alone Gas Pipeline 5.15-37 Final EIS
fish (17.1 percent; 32,619 pounds) and moose (7.4 percent; 14,187 pounds). Other species
harvested include small land mammals, birds and eggs, black bear, berries, and plants. In
2004, salmon species were not reported in the harvest data. Instead, subsistence harvest was
predominantly comprised of moose (27,090 pounds; 88.5 percent) and non-salmon fish species
(2,106 pounds; 6.9 percent), followed by small land mammals (1,035 pounds; 3.4 percent) and
black bear (374 pounds; 1.2 percent) (ADF&G 2011). As discussed under the subheading Food
and Nutrition below, moose – the largest contributor to subsistence harvest and subsistence use
for Minto households – is an important source of protein, vitamin B12, and iron.
Minto‘s seasonal round of subsistence harvest activity is described by Stephen R. Braund &
Associates in Section 5.14 and presented in Table 5.15-13. Summer and fall seasons are filled
with salmon fishing and fishing for a variety of non-anadromous fish. Spring and fall hunting for
bears is important with some hunting in summer and late fall. Berry and plant harvesting are
other important summer activities. Moose are a year-round harvest highly valued by local users
with the peak harvests occurring in September, January, and February. Porcupines are also
harvested year round, usually on an opportunistic basis. Upland birds (grouse and ptarmigan)
in addition to hares are harvested in the fall and continue into the winter, particularly for
ptarmigan and hares. Furbearers are important winter subsistence harvests, with furbearers still
important to the economy as well despite low fur prices (Andrews 1988).
Nenana
As shown in Table 5.15-14, subsistence harvest data for Nenana show 64 percent of
households using subsistence resources in 2004, with the total harvest equaling 47,692 pounds.
Nenana residents harvested an estimated 99 pounds per capita, with the majority of the weight
(84.3 percent, or 83 pounds per capita) derived from subsistence harvest of moose
(ADF&G 2011). As discussed under the subheading Food and Nutrition below, moose – the
largest contributor to subsistence harvest (with 49 percent of the harvest reportedly used) for
Nenana households – is an important source of protein, vitamin B12, and iron. In 2004, salmon
species were not reported in the harvest data. Non-salmon fish comprised 9.9 percent of the
total harvest, with approximately 3,106 individual fish weighing a total of 4,738 pounds
harvested. Other subsistence resources harvested include small land mammals (1,818 pounds;
3.8 percent), caribou (653 pounds; 1.4 percent), black bear (116 pounds; 0.2 percent), deer
(85 pounds; 0.2 percent), and Dall sheep (65 pounds; 0.1 percent) (ADF&G 2011).
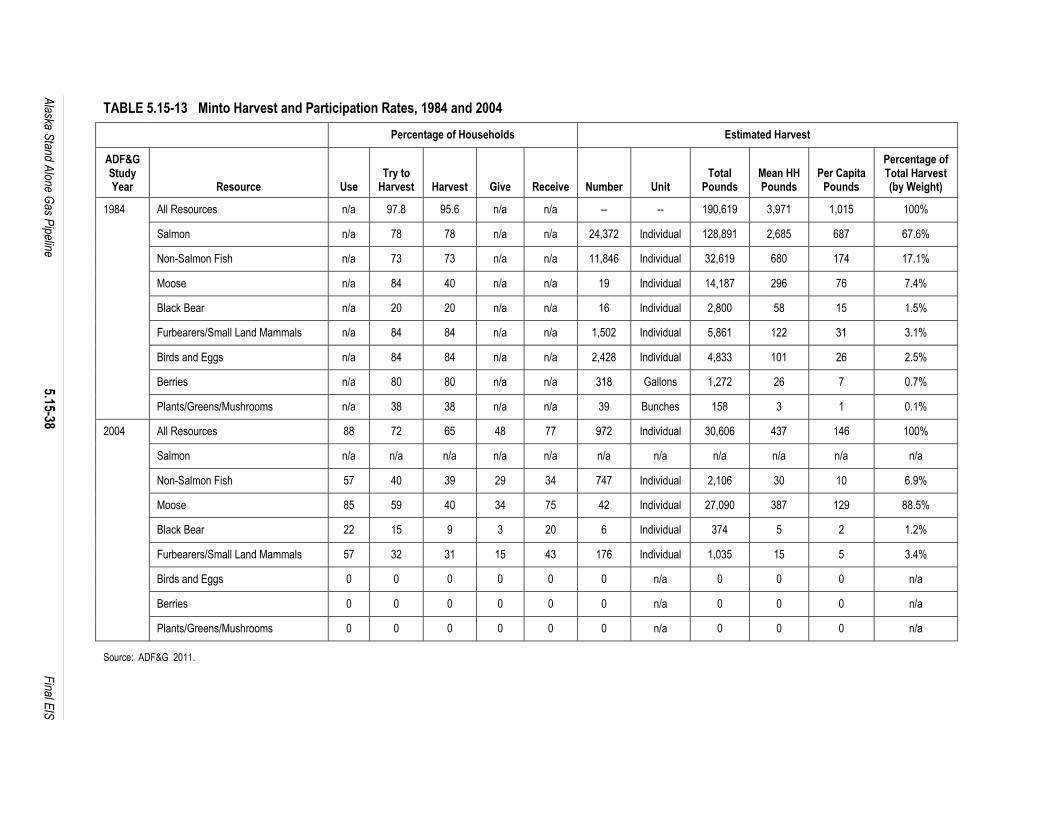
Alaska S
tand Alone G
as Pipeline
5.15-38
F
inal EIS
TABLE 5.15-13 Minto Harvest and Participation Rates, 1984 and 2004
Percentage of Households Estimated Harvest
ADF&G Study Year Resource Use
Try to Harvest Harvest Give Receive Number Unit
Total Pounds
Mean HH Pounds
Per Capita Pounds
Percentage of Total Harvest (by Weight)
1984 All Resources n/a 97.8 95.6 n/a n/a -- -- 190,619 3,971 1,015 100%
Salmon n/a 78 78 n/a n/a 24,372 Individual 128,891 2,685 687 67.6%
Non-Salmon Fish n/a 73 73 n/a n/a 11,846 Individual 32,619 680 174 17.1%
Moose n/a 84 40 n/a n/a 19 Individual 14,187 296 76 7.4%
Black Bear n/a 20 20 n/a n/a 16 Individual 2,800 58 15 1.5%
Furbearers/Small Land Mammals n/a 84 84 n/a n/a 1,502 Individual 5,861 122 31 3.1%
Birds and Eggs n/a 84 84 n/a n/a 2,428 Individual 4,833 101 26 2.5%
Berries n/a 80 80 n/a n/a 318 Gallons 1,272 26 7 0.7%
Plants/Greens/Mushrooms n/a 38 38 n/a n/a 39 Bunches 158 3 1 0.1%
2004 All Resources 88 72 65 48 77 972 Individual 30,606 437 146 100%
Salmon n/a n/a n/a n/a n/a n/a n/a n/a n/a n/a n/a
Non-Salmon Fish 57 40 39 29 34 747 Individual 2,106 30 10 6.9%
Moose 85 59 40 34 75 42 Individual 27,090 387 129 88.5%
Black Bear 22 15 9 3 20 6 Individual 374 5 2 1.2%
Furbearers/Small Land Mammals 57 32 31 15 43 176 Individual 1,035 15 5 3.4%
Birds and Eggs 0 0 0 0 0 0 n/a 0 0 0 n/a
Berries 0 0 0 0 0 0 n/a 0 0 0 n/a
Plants/Greens/Mushrooms 0 0 0 0 0 0 n/a 0 0 0 n/a
Source: ADF&G 2011.

Alaska S
tand Alone G
as Pipeline
5.15-39
F
inal EIS
TABLE 5.15-14 Nenana Harvest and Participation Rates, 2004
Percentage of Households Estimated Harvest
ADF&G Study Year Resource Use
Try to Harvest Harvest Give Receive Number Unit
Total Pounds
Mean HH Pounds
Per Capita Pounds
Percentage of Total Harvest (by Weight)
2004 All Resources 64 58 49 31 41 3,618 Individual 47,692 265 99 100%
Salmon n/a n/a 0 n/a 0 n/a 0 n/a 0 n/a 0 n/a n/a 0 n/a 0 n/a 0 n/a
Non-Salmon Fish 50 41 40 20 26 3,106 Individual 4,738 26 10 9.9%
Black Bear 2 2 1 1 1 2 Individual 116 1 <1 0.2%
Brown Bear 1 1 1 0 0 1 Individual n/a n/a n/a n/a
Caribou 3 4 2 1 1 5 Individual 653 4 1 1.4%
Deer 1 1 1 1 0 2 Individual 85 1 <1 0.2%
Moose 49 43 22 16 33 62 Individual 40,213 223 83 84.3%
Dall Sheep 1 1 1 0 1 1 Individual 65 <1 <1 0.1%
Furbearers/Small Land Mammals 16 15 13 9 4 438 Individual 1,818 10 4 3.8%
Birds and Eggs 0 0 0 0 0 0 n/a 0 0 0 n/a
Berries 0 0 0 0 0 0 n/a 0 0 0 n/a
Plants/Greens/Mushrooms 0 0 0 0 0 0 n/a 0 0 0 n/a
Source: ADF&G 2011.
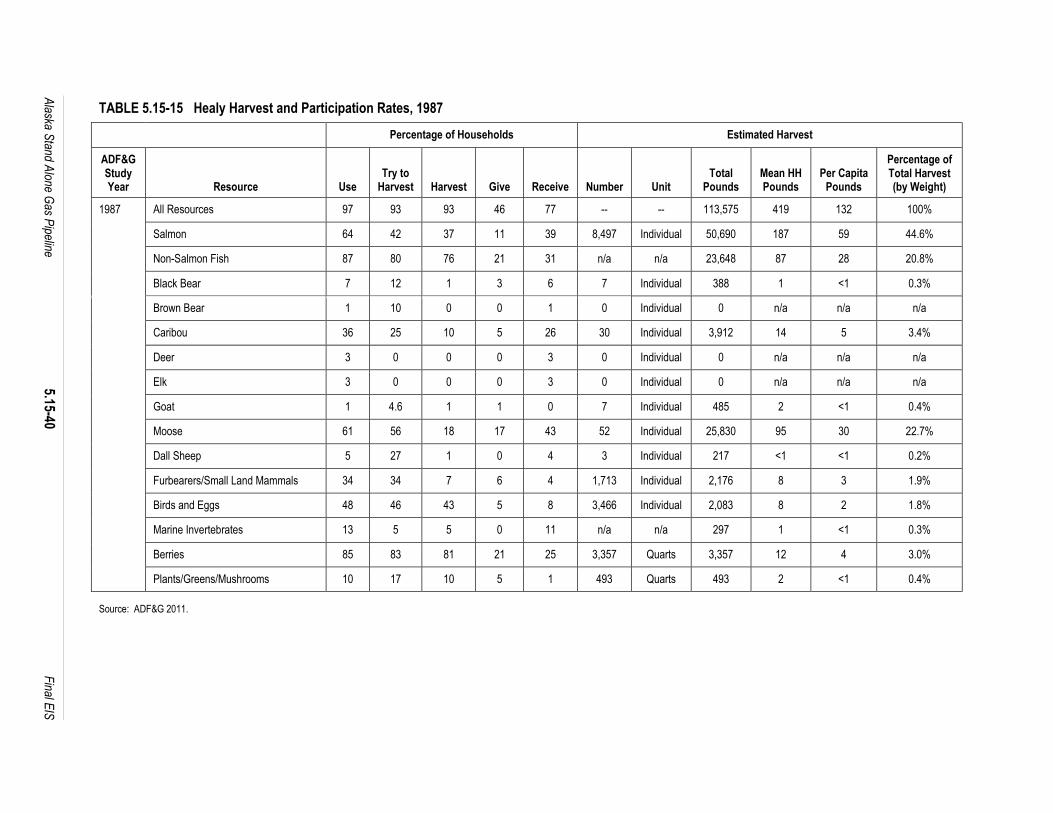
Alaska S
tand Alone G
as Pipeline
5.15-40
F
inal EIS
TABLE 5.15-15 Healy Harvest and Participation Rates, 1987
Percentage of Households Estimated Harvest
ADF&G Study Year Resource Use
Try to Harvest Harvest Give Receive Number Unit
Total Pounds
Mean HH Pounds
Per Capita Pounds
Percentage of Total Harvest (by Weight)
1987 All Resources 97 93 93 46 77 -- -- 113,575 419 132 100%
Salmon 64 42 37 11 39 8,497 Individual 50,690 187 59 44.6%
Non-Salmon Fish 87 80 76 21 31 n/a n/a 23,648 87 28 20.8%
Black Bear 7 12 1 3 6 7 Individual 388 1 <1 0.3%
Brown Bear 1 10 0 0 1 0 Individual 0 n/a n/a n/a
Caribou 36 25 10 5 26 30 Individual 3,912 14 5 3.4%
Deer 3 0 0 0 3 0 Individual 0 n/a n/a n/a
Elk 3 0 0 0 3 0 Individual 0 n/a n/a n/a
Goat 1 4.6 1 1 0 7 Individual 485 2 <1 0.4%
Moose 61 56 18 17 43 52 Individual 25,830 95 30 22.7%
Dall Sheep 5 27 1 0 4 3 Individual 217 <1 <1 0.2%
Furbearers/Small Land Mammals 34 34 7 6 4 1,713 Individual 2,176 8 3 1.9%
Birds and Eggs 48 46 43 5 8 3,466 Individual 2,083 8 2 1.8%
Marine Invertebrates 13 5 5 0 11 n/a n/a 297 1 <1 0.3%
Berries 85 83 81 21 25 3,357 Quarts 3,357 12 4 3.0%
Plants/Greens/Mushrooms 10 17 10 5 1 493 Quarts 493 2 <1 0.4%
Source: ADF&G 2011.

Alaska S
tand Alone G
as Pipeline
5.15-41
F
inal EIS
TABLE 5.15-16 Anderson Harvest and Participation Rates, 1987
Percentage of Households Estimated Harvest
ADF&G Study Year Resource Use
Try to Harvest Harvest Give Receive Number Unit
Total Pounds
Mean HH Pounds
Per Capita Pounds
Percentage of Total Harvest (by Weight)
1987 All Resources 85 83 83 33 68 -- -- 91,122 412 139 100%
Salmon 50 34 32 11 32 9,593 Individual 56,979 258 87 62.5%
Non-Salmon Fish 72 62 56 9 42 8,566 Pounds 8,566 39 13 9.4%
Bison 1 0 0 0 1 0 Individual 0 n/a n/a 0%
Black Bear 17 16 8 5 11 24 Individual 1,379 6 2 1.5%
Caribou 28 11 10 10 20 29 Individual 3,770 17 6 4.1%
Deer 1 0 0 0 1 0 Individual 0 n/a n/a 0%
Moose 53 38 19 20 42 28 Individual 13,750 62 21 15.1%
Dall Sheep 0 2 0 0 0 0 Individual 0 n/a n/a 0%
Furbearers/Small Land Mammals 21 21 1 1 0 764 Individual 560 3 1 0.6%
Birds and Eggs 51 51 8 8 13 3,527 Individual 2,271 10 3 2.5%
Marine Invertebrates 10 6 2 2 6 2,356 Pounds 2,356 11 4 2.6%
Berries 44 44 5 5 6 1,484 Quarts 1,484 7 2 1.6%
Plants/Greens/Mushrooms 1 1 0 0 0 7 Quarts 7 0 0 0.01%
Source: ADF&G 2011.

Alaska S
tand Alone G
as Pipeline
5.15-42
F
inal EIS
TABLE 5.15-17 Trapper Creek Harvest and Participation Rates, 1985
Percentage of Households Estimated Harvest
ADF&G Study Year Resource Use
Try to Harvest Harvest Give Receive Number Unit
Total Pounds
Mean HH Pounds
Per Capita Pounds
Percentage of Total Harvest (by Weight)
1985 All Resources 100 100 100 63 90 -- -- 12,391 207 65 100%
Salmon 95 84 68 26 63 1,052 Individual 6,581 110 35 53.1%
Non-Salmon Fish 79 84 74 16 37 736 Individual 2,672 45 14 21.6%
Black Bear 5 11 0 0 5 0 Individual 0 n/a n/a 0%
Brown Bear 0 5 0 0 0 0 Individual 0 n/a n/a 0%
Caribou 11 5 5 0 5 3 Individual 410 7 2 3.3%
Moose 53 53 5 5 53 3 Individual 1,579 26 8 12.7%
Dall Sheep 11 0 0 0 11 0 Individual 0 n/a n/a 0%
Furbearers/Small Land Mammals 11 11 5 0 5 32 Individual 47 1 0 0.4%
Birds and Eggs 37 32 32 5 11 303 Individual 199 3 1 1.6%
Marine Invertebrates 16 11 11 5 5 2,463 Individual 106 2 1 0.9%
Berries 84 84 84 21 11 568 Quarts 568 9 3 4.6%
Plants/Greens/Mushrooms 47 42 42 16 16 227 Quarts 227 4 1 1.8%
Source: ADF&G 2011.

Alaska S
tand Alone G
as Pipeline
5.15-43
F
inal EIS
TABLE 5.15-18 McKinley Park Harvest and Participation Rates, 1987
Percentage of Households Estimated Harvest
ADF&G Study Year Resource Use
Try to Harvest Harvest Give Receive Number Unit
Total Pounds
Mean HH Pounds
Per Capita Pounds
Percentage of Total Harvest (by Weight)
1987 All Resources 100 100 100 45 72 -- -- 44,485 506 242 100%
Salmon 69 43 43 13 41 5,094 Individual 30,727 349 167 69.1%
Non-Salmon Fish 70 62 60 15 36 2,074 Pounds 2,074 24 11 4.7%
Black Bear 2 2 2 0 0 1 Individual 80 1 0 0.2%
Brown Bear 5 2 2 0 3 1 Individual 194 2 1 0.4%
Caribou 42 31 10 8 34 11 Individual 1,430 16 8 3.2%
Elk 8 0 0 0 8 0 Individual 0 0 0 0%
Goat 8 0 0 0 8 0 Individual 0 0 0 0%
Moose 44 27 18 8 28 16 Individual 7,792 89 42 17.5%
Dall Sheep 10 10 2 0 8 3 Individual 179 2 1 0.4%
Furbearers/Small Land Mammals 6 6 6 2 3 199 Individual 254 3 1 0.6%
Birds and Eggs 37 37 37 5 5 726 Individual 517 6 3 1.2%
Marine Invertebrates 0 16 0 0 0 0 Individual 0 0 0 0%
Berries 89 89 89 26 15 1,203 Quarts 1,203 14 7 2.7%
Plants/Greens/Mushrooms 16 16 16 2 0 37 Quarts 37 0 0 0.1%
Source: ADF&G 2011.

Alaska S
tand Alone G
as Pipeline
5.15-44
F
inal EIS
TABLE 5.15-19 Cantwell Harvest and Participation Rates, 1982, 1999 and 2000
Percentage of Households Estimated Harvest
ADF&G Study Year
Resource Use Try to Harvest
Harvest Give Receive Number Unit Total Pounds
Mean HH Pounds
Per Capita Pounds
Percentage of Total Harvest (by Weight)
1982 All Resources 100 n/a 98 n/a n/a -- -- 15,241 324 112 100%
Salmon 23 n/a 23 n/a n/a 113 Individual 975 21 7 6.4%
Non-Salmon Fish 84 n/a 84 n/a n/a 3,065 Pounds 3,350 71 25 22.0%
Black Bear 2 n/a 2 n/a n/a 1 Individual 63 1 0 0.4%
Caribou 33 n/a 28 n/a n/a 21 Individual 2,984 63 22 19.6%
Moose 61 n/a 23 n/a n/a 11 Individual 6,012 128 44 39.4%
Furbearers/Small Land Mammals 49 n/a 49 n/a n/a 453 Individual 738 16 5 4.8%
Birds and Eggs 72 n/a 72 n/a n/a 875 Individual 508 11 4 3.3%
Berries 67 n/a 67 n/a n/a 497 Pounds 543 12 4 3.6%
Plants/Greens/Mushrooms 16 n/a 16 n/a n/a 62 Pounds 68 1 1 0.4%
1999 All Resources 97 97 97 62 91 -- -- 27,599 294 135 100%
Salmon 70 47 38 17 50 899 Individual 4,630 49 23 16.8%
Non-Salmon Fish 83 72 70 20 59 2081 Pounds 2,081 22 10 7.5%
Bison 0 1 0 0 0 0 Individual 0 0 0 0%
Black Bear 12 21 5 5 5 4 Individual 286 3 1 1.0%
Brown Bear 9 26 4 4 4 3 Individual 742 8 4 2.7%
Caribou 55 49 22 20 40 28 Individual 3,698 39 18 13.4%
Deer 1 1 1 0 0 2 Individual 105 1 1 0.4%
Moose 84 53 26 32 71 24 Individual 12,368 132 61 44.8%
Dall Sheep 13 16 3 8 11 2 Individual 160 2 1 0.6%
Furbearers/Small Land Mammals 40 36 32 11 13 853 Individual 970 10 5 3.5%

Alaska S
tand Alone G
as Pipeline
5.15-45
F
inal EIS
TABLE 5.15-19 Cantwell Harvest and Participation Rates, 1982, 1999 and 2000
Percentage of Households Estimated Harvest
ADF&G Study Year
Resource Use Try to Harvest
Harvest Give Receive Number Unit Total Pounds
Mean HH Pounds
Per Capita Pounds
Percentage of Total Harvest (by Weight)
Marine Mammals 3 1 0 0 3 0 Individual 0 0 0 0%
Birds and Eggs 59 58 54 8 11 1137 Individual 801 9 4 3.9%
Marine Invertebrates 12 5 5 1 11 125 Pounds 125 1 1 0.5%
Berries 93 92 92 33 17 359 Individual 1,439 15 7 5.2%
Plants/Greens/Mushrooms 28 25 24 13 7 47 Gallons 188 2 1 0.7%
2000 Unknown Ducks 5 0 0 0 5 0 Individual 0 0 0 n/a
Spruce Grouse 16 32 5 5 5 1 Individual 1 0 0 n/a
Rock Ptarmigan 42 42 16 16 21 29 Individual 29 2 <1 n/a
Willow Ptarmigan 16 21 11 5 0 6 Individual 6 0 <1 n/a
Source: ADF&G 2011.

Alaska Stand Alone Gas Pipeline 5.15-46 Final EIS
Healy, Anderson, Trapper Creek, and McKinley Park
Subsistence harvest data for the communities of Healy, Anderson, Trapper Creek, and
McKinley Park show similar patterns. As shown in Tables 5.15-15 through 5.15-18, these data
are reported for the year 1987, with the exception of Trapper Creek data, which were reported
for the year 1985. For each community, the majority of households (ranging from 85 percent in
Anderson and 100 percent in both Trapper Creek and McKinley Park) used subsistence
resources. Fish species (salmon and non-salmon) comprised the greatest percentage of total
harvest by weight for these communities. As discussed under the subheading Food and
Nutrition below, subsistence fish species are an important source of omega-3 fatty acids, which
are protective against heart disease and other chronic diseases. Moose - an important source
of protein, vitamin B12, and iron - was the second largest contributor to subsistence harvest,
ranging from 12.7 percent of the total harvested weight for Trapper Creek to more than a fifth
(22.7 percent) of total harvested weight for Healy. Other subsistence resources harvested by
these communities include other large land mammals, small land mammals, birds and eggs,
marine invertebrates, berries, and plants/greens/mushrooms (ADF&G 2011).
Cantwell
For the study years 1982 and 1999, the community of Cantwell relied on large land mammals
for between 58 and 59 percent of its harvest (see Table 5.15-19). The number of moose
harvested in 1982 (6,012) was less than half the number harvested in 1999 (12,368), while the
number of caribou harvested fell from 63 individuals in 1982 to 39 individuals in 1999. Per
capita consumption of moose ranged from more than double that of caribou in 1982 to more
than triple the amount in 1999. Salmon and non-salmon fish species comprised around a
quarter of the total harvested weight for both study years. Other large land mammals were
reportedly harvested, along with small land mammals, birds and eggs, berries, and
plants/greens/mushrooms. Marine invertebrates were also reportedly harvested in 1999.
For the year 2000, subsistence harvest data only include information on the number of birds
harvested. Rock ptarmigan (29 individuals), willow ptarmigan (1 individual), and spruce grouse
(1 individual) were harvested during the study year. (ADF&G 2011)
Food and Nutrition
The Alaska Native Health Board and Alaska Native Epidemiology Center (2004) Alaska Native
Epidemiology Center of the Alaska Native Health Board, in collaboration with organizations and
interested individuals throughout Alaska, developed the Alaska Traditional Diet Project (ATDP).
The objective of the ATDP, conducted over a two-year period and completed in 2004, was to
quantify the intake of subsistence foods among residents of villages in rural Alaska through the
use of an interviewer-administered Food Frequency Questionnaire. Results were reported by
the participating villages from five regional Tribal Health Corporations. The results reported by
the Tanana Chiefs Conference (TCC) are applicable to the villages of Interior Alaska for which
subsistence resources may be affected by the proposed Project (see Section 5.14). No data
were reported for the villages located within the boundaries of the Arctic Slope Regional

Alaska Stand Alone Gas Pipeline 5.15-47 Final EIS
Corporation, Athena Regional Corporation, or Cook Inlet Region Inc. that could be affected by
the proposed Project.
The amount of the top 50 foods consumed (as measured by weight) was reported for the TCC
region. Of the approximately 47,218 pounds of food reportedly consumed by the 33 survey
participants in the region, only approximately 2,522 pounds (5.3 percent) were derived from
subsistence foods, with the remainder (94.7 percent) consisting of store-bought foods.
Altogether, sugary drinks such as Hi-C, Tang, and sugared soda pop comprised 31.1 percent of
foods consumed by respondents. Of the six subsistence foods reportedly consumed within the
top 50 foods, moose muscle and organs (1,145 pounds; 2.4 percent), king salmon (583 pounds;
1.2 percent), moose fat and marrow (380 pounds; 0.8 percent), silver salmon (243 pounds;
0.5 percent), blueberries (117 pounds; 0.2 percent), and cranberries (54 pounds; 0.1 percent)
comprise a total of 5.3 percent. The ATDP reports that 97 percent of the respondents eat
salmon, 94 percent eat moose, and 88 percent eat blueberries and cranberries (Alaska Native
Health Board, Alaska Native Epidemiology Center 2004).
According to ATDP findings, subsistence foods contributed substantial amounts of protein,
vitamin B12, iron, and omega-3 fatty acids to the diets of respondents in the TCC region.
Subsistence foods also contributed to total fat and saturated fat intake, and were not substantial
sources of folate, fiber, calcium, or Vitamin C. For the TCC region, moose, caribou, and salmon
together provided 18 percent of respondents‘ total energy consumed, as well as 74 percent of
vitamin B12, 40 percent of the protein, and 7 percent of Vitamin A consumed. Salmon provided
94 percent of the omega-3 fatty acids consumed by respondents, with another 3 percent
contributed by other subsistence fish species. Moose, caribou, and salmon also provided
30 percent of total fat and 28 percent of saturated fat intake, and were also the source of
28 percent of iron consumed.
For those respondents in the TCC region who indicated a decrease in the consumption of
traditional foods compared to five years prior, the most common reason reported was a lack of
transportation to gather and hunt. Only one respondent indicated that decreased consumption
of subsistence foods was due to decreased availability of subsistence resources (Alaska Native
Health Board, Alaska Native Epidemiology Center 2004).
5.15.3.4 Health Indicators
Data regarding the health status of individual communities along the proposed alignment are
limited; however, some health status indicators are available at the state and borough/census
area level.
Morbidity and Mortality
Statistics about the morbidity (illness) and mortality (death) rates of a population inform decision
makers about ―at risk‖ populations. Where data are available, mortality and incidence rates for
diseases common to the study area are presented below.
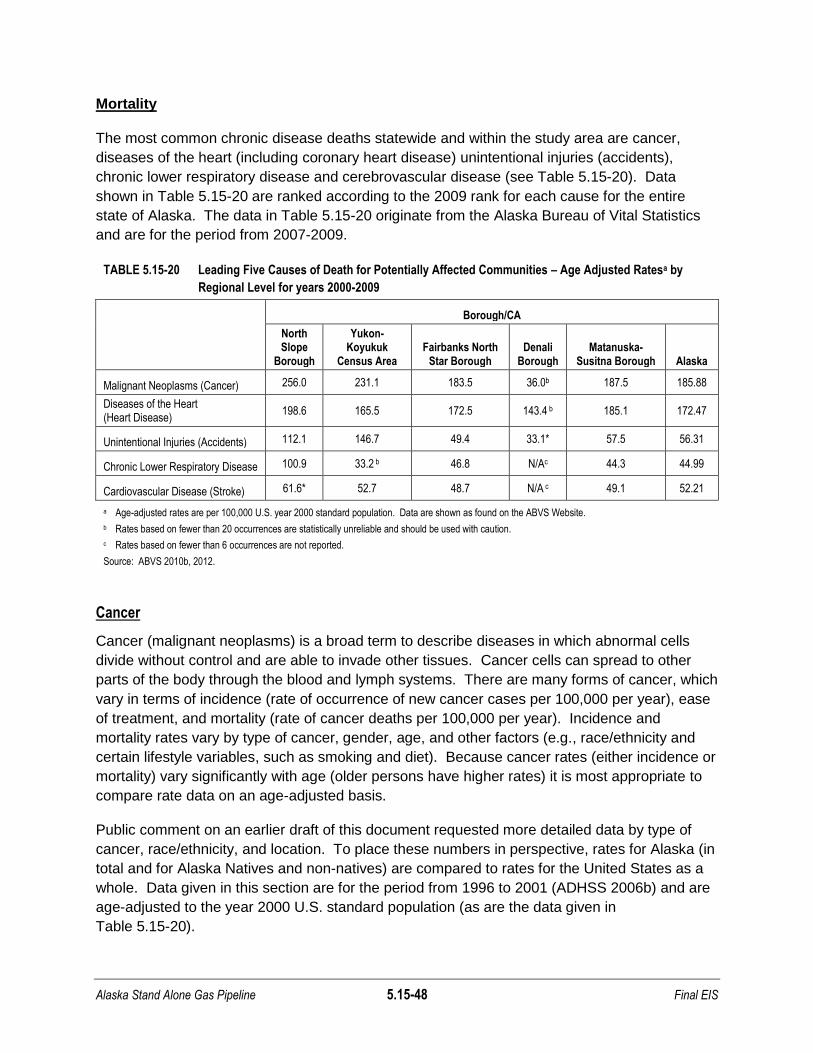
Alaska Stand Alone Gas Pipeline 5.15-48 Final EIS
Mortality
The most common chronic disease deaths statewide and within the study area are cancer,
diseases of the heart (including coronary heart disease) unintentional injuries (accidents),
chronic lower respiratory disease and cerebrovascular disease (see Table 5.15-20). Data
shown in Table 5.15-20 are ranked according to the 2009 rank for each cause for the entire
state of Alaska. The data in Table 5.15-20 originate from the Alaska Bureau of Vital Statistics
and are for the period from 2007-2009.
TABLE 5.15-20 Leading Five Causes of Death for Potentially Affected Communities – Age Adjusted Ratesa by
Regional Level for years 2000-2009
Borough/CA
North Slope
Borough
Yukon-Koyukuk
Census Area Fairbanks North
Star Borough Denali
Borough Matanuska-
Susitna Borough Alaska
Malignant Neoplasms (Cancer) 256.0 231.1 183.5 36.0b 187.5 185.88
Diseases of the Heart (Heart Disease)
198.6 165.5 172.5 143.4 b 185.1 172.47
Unintentional Injuries (Accidents) 112.1 146.7 49.4 33.1* 57.5 56.31
Chronic Lower Respiratory Disease 100.9 33.2 b 46.8 N/Ac 44.3 44.99
Cardiovascular Disease (Stroke) 61.6* 52.7 48.7 N/A c 49.1 52.21
a Age-adjusted rates are per 100,000 U.S. year 2000 standard population. Data are shown as found on the ABVS Website.
b Rates based on fewer than 20 occurrences are statistically unreliable and should be used with caution.
c Rates based on fewer than 6 occurrences are not reported.
Source: ABVS 2010b, 2012.
Cancer
Cancer (malignant neoplasms) is a broad term to describe diseases in which abnormal cells
divide without control and are able to invade other tissues. Cancer cells can spread to other
parts of the body through the blood and lymph systems. There are many forms of cancer, which
vary in terms of incidence (rate of occurrence of new cancer cases per 100,000 per year), ease
of treatment, and mortality (rate of cancer deaths per 100,000 per year). Incidence and
mortality rates vary by type of cancer, gender, age, and other factors (e.g., race/ethnicity and
certain lifestyle variables, such as smoking and diet). Because cancer rates (either incidence or
mortality) vary significantly with age (older persons have higher rates) it is most appropriate to
compare rate data on an age-adjusted basis.
Public comment on an earlier draft of this document requested more detailed data by type of
cancer, race/ethnicity, and location. To place these numbers in perspective, rates for Alaska (in
total and for Alaska Natives and non-natives) are compared to rates for the United States as a
whole. Data given in this section are for the period from 1996 to 2001 (ADHSS 2006b) and are
age-adjusted to the year 2000 U.S. standard population (as are the data given in
Table 5.15-20).
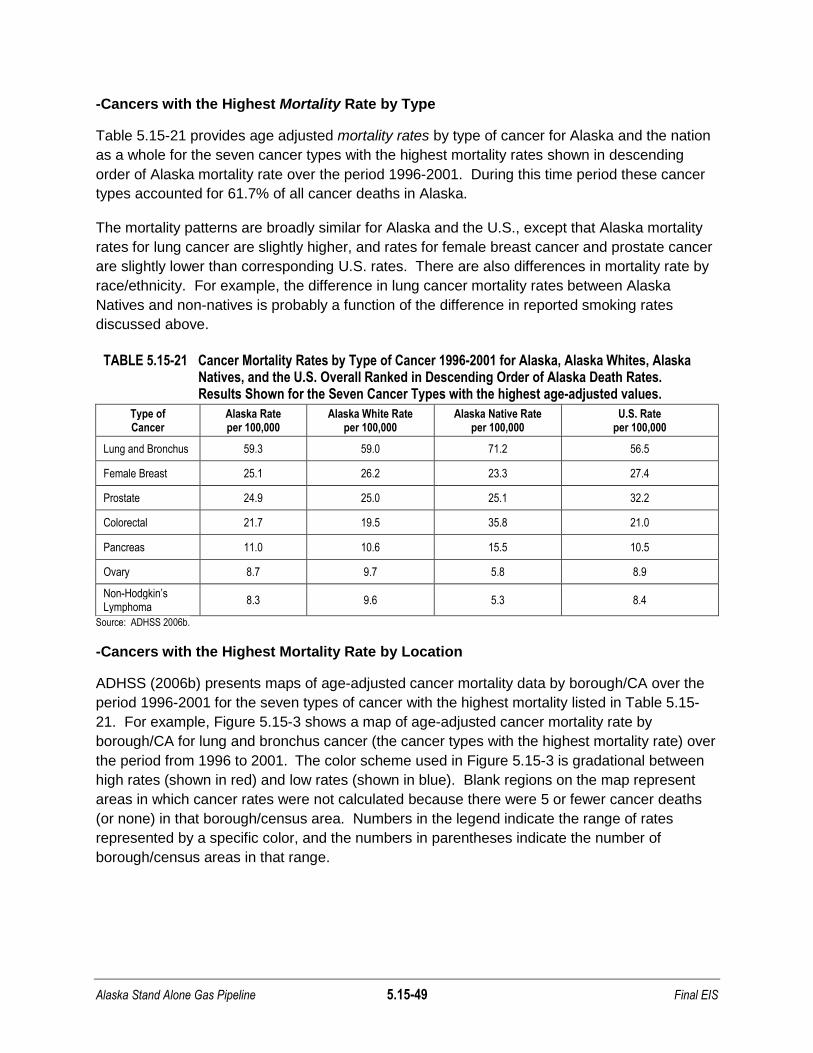
Alaska Stand Alone Gas Pipeline 5.15-49 Final EIS
-Cancers with the Highest Mortality Rate by Type
Table 5.15-21 provides age adjusted mortality rates by type of cancer for Alaska and the nation
as a whole for the seven cancer types with the highest mortality rates shown in descending
order of Alaska mortality rate over the period 1996-2001. During this time period these cancer
types accounted for 61.7% of all cancer deaths in Alaska.
The mortality patterns are broadly similar for Alaska and the U.S., except that Alaska mortality
rates for lung cancer are slightly higher, and rates for female breast cancer and prostate cancer
are slightly lower than corresponding U.S. rates. There are also differences in mortality rate by
race/ethnicity. For example, the difference in lung cancer mortality rates between Alaska
Natives and non-natives is probably a function of the difference in reported smoking rates
discussed above.
TABLE 5.15-21 Cancer Mortality Rates by Type of Cancer 1996-2001 for Alaska, Alaska Whites, Alaska Natives, and the U.S. Overall Ranked in Descending Order of Alaska Death Rates. Results Shown for the Seven Cancer Types with the highest age-adjusted values.
Type of Cancer
Alaska Rate per 100,000
Alaska White Rate per 100,000
Alaska Native Rate per 100,000
U.S. Rate per 100,000
Lung and Bronchus 59.3 59.0 71.2 56.5
Female Breast 25.1 26.2 23.3 27.4
Prostate 24.9 25.0 25.1 32.2
Colorectal 21.7 19.5 35.8 21.0
Pancreas 11.0 10.6 15.5 10.5
Ovary 8.7 9.7 5.8 8.9
Non-Hodgkin’s Lymphoma
8.3 9.6 5.3 8.4
Source: ADHSS 2006b.
-Cancers with the Highest Mortality Rate by Location
ADHSS (2006b) presents maps of age-adjusted cancer mortality data by borough/CA over the
period 1996-2001 for the seven types of cancer with the highest mortality listed in Table 5.15-
21. For example, Figure 5.15-3 shows a map of age-adjusted cancer mortality rate by
borough/CA for lung and bronchus cancer (the cancer types with the highest mortality rate) over
the period from 1996 to 2001. The color scheme used in Figure 5.15-3 is gradational between
high rates (shown in red) and low rates (shown in blue). Blank regions on the map represent
areas in which cancer rates were not calculated because there were 5 or fewer cancer deaths
(or none) in that borough/census area. Numbers in the legend indicate the range of rates
represented by a specific color, and the numbers in parentheses indicate the number of
borough/census areas in that range.

Alaska Stand Alone Gas Pipeline 5.15-50 Final EIS
Source: ADHSS (2006b).
FIGURE 5.15-3 Lung and bronchus cancer mortality rates by Borough/CA, 1996-2001
As can be seen in this illustration, North Slope Borough, Yukon-Koyukuk, and the Kenai
Peninsula had age-adjusted lung and bronchus cancer mortality rates between 78 and 88.3 per
100,000, whereas Matanuska-Susitna had an age-adjusted rate between 47.4 and 57.6 over the
period from 1996-2001. ADHSS (2006b) provides similar cancer rate maps for the other leading
causes of cancer mortality.
-Cancers with the Highest Incidence Rate by Type
Cancer incidence rates are significantly higher than the cancer mortality rates shown in Table
5.15-21 because not all types of cancer are fatal and the pattern of relative incidence varies
because the probability of survival varies by cancer type. Table 5.15-22 provides data on
cancer incidence rates for Alaska overall, Alaska Whites, Alaska Natives, and the U.S. overall
ranked in descending order of overall Alaska incidence rates for the leading cancer types in
terms of incidence for the years 1996 through 2001. During this time period, these cancer types
accounted for 66.0% of all cancers diagnosed in Alaska.
Rate per 100,000
• 78 to 88.3 (5)D 67.8 to 78 (2)D 57.6 to 67.8 (4).47.4 to 57.6 (6)• 37.2 to 47.4 (3)

Alaska Stand Alone Gas Pipeline 5.15-51 Final EIS
As can be seen, there are material differences in the pattern of incidence rates by race/ethnicity.
For example, Alaska Natives have substantially lower incidence rates of prostate, female breast,
bladder, uterine, and non-Hodgkin‘s Lymphoma cancer than whites, but a higher incidence rate
for colorectal cancer.
TABLE 5.15-22 Cancer Incidence Rates by Type of Cancer 1996-2001
Type of cancer
Alaska rate per 100,000
Alaska white rate per 100,000
Alaska Native rate per 100,000
U.S. rate per 100,000
Prostate 165.1 177.7 80.3 172.4
Female Breast 140.1 148.6 129.5 134.9
Lung and Bronchus
77.5 76.2 92.5 62.5
Colorectal 60.9 52.9 109.6 53.9
Bladder 24.2 27.6 12.4 20.4
Uterus 21.6 24.3 13.0 24.5
Non-Hodgkin’s Lymphoma
20.3 22.7 12.2 19.3
Source: ADHSS 2006b. See also ADHSS 2011b
-Cancers with the Highest Incidence Rate by Location
ADHSS (2006b) presents maps of age adjusted cancer incidence data by borough/CA over the
period 1996-2001 for the seven types of cancer with the highest incidence listed in Table 5.15-
22. For example, Figure 5.15-4 shows a map of age-adjusted cancer incidence rate by
borough/CA for prostate cancer (the cancer types with the highest incidence rate) over the
period from 1996 to 2001. The color scheme used in Figure 5.15-4 is gradational between high
rates (shown in red) and low rates (shown in blue). Blank regions on the map represent areas in
which cancer rates were not calculated because there were 5 or fewer cancer cases (or none)
in that borough/census area. Numbers in the legend indicate the range of rates represented by
a specific color, and the numbers in parentheses indicate the number of borough/census areas
in that range.
Figure 5.15-4 has more ‗white space‘ because of several CA/boroughs with only a few cases.
ADHSS (2006b) provides similar cancer incidence rate maps for the other cancer types with
high incidence rates.
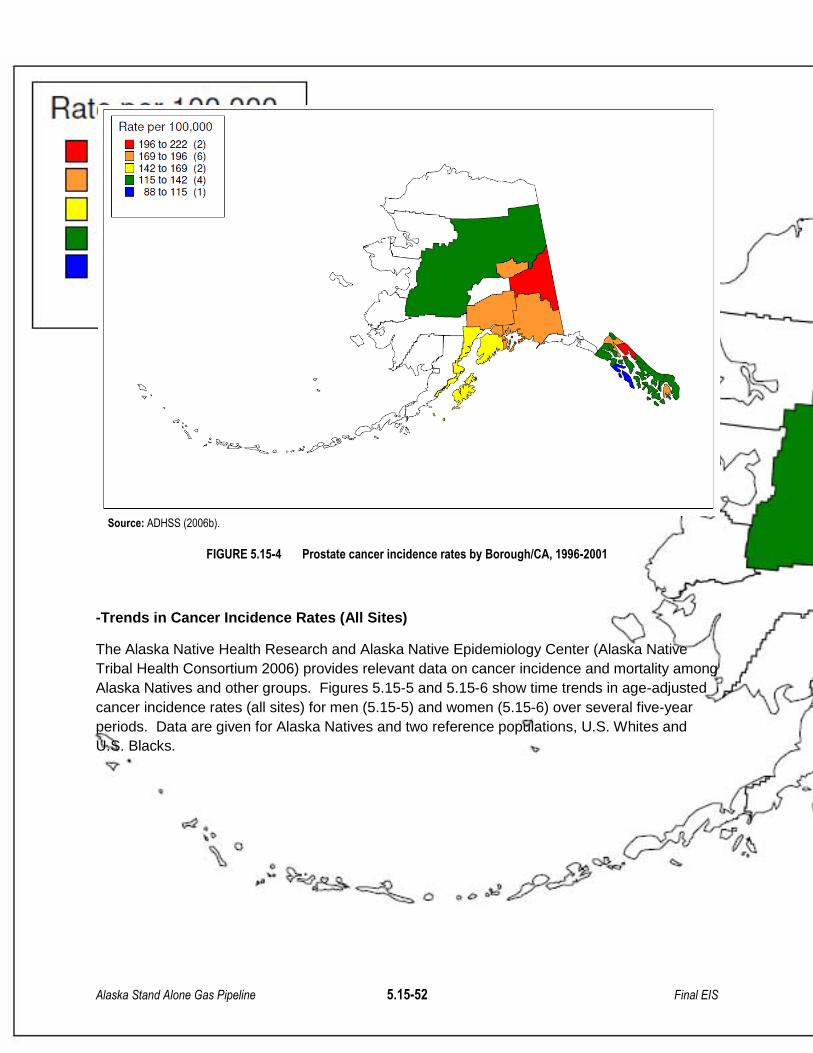
Alaska Stand Alone Gas Pipeline 5.15-52 Final EIS
Source: ADHSS (2006b).
FIGURE 5.15-4 Prostate cancer incidence rates by Borough/CA, 1996-2001
-Trends in Cancer Incidence Rates (All Sites)
The Alaska Native Health Research and Alaska Native Epidemiology Center (Alaska Native
Tribal Health Consortium 2006) provides relevant data on cancer incidence and mortality among
Alaska Natives and other groups. Figures 5.15-5 and 5.15-6 show time trends in age-adjusted
cancer incidence rates (all sites) for men (5.15-5) and women (5.15-6) over several five-year
periods. Data are given for Alaska Natives and two reference populations, U.S. Whites and
U.S. Blacks.
Rate per 100,000
• 196 to 222 (2)D 169 to 196 (6)D 142 to 169 (2).115to142 (4)• BBto 115 (1)
•
-
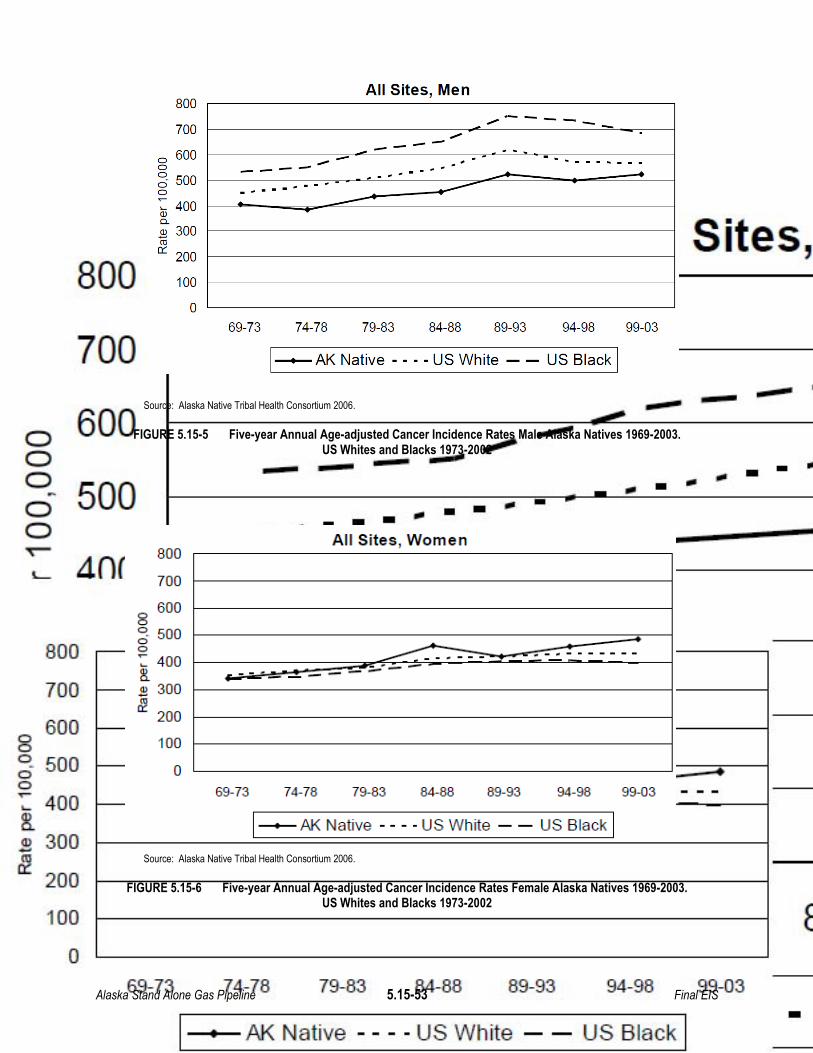
Alaska Stand Alone Gas Pipeline 5.15-53 Final EIS
Source: Alaska Native Tribal Health Consortium 2006.
FIGURE 5.15-5 Five-year Annual Age-adjusted Cancer Incidence Rates Male Alaska Natives 1969-2003. US Whites and Blacks 1973-2002
Source: Alaska Native Tribal Health Consortium 2006.
FIGURE 5.15-6 Five-year Annual Age-adjusted Cancer Incidence Rates Female Alaska Natives 1969-2003. US Whites and Blacks 1973-2002
800All Sites,
--- -- -'--ooooo
700
600
500 --. . --.. --.
- ........ -- .
I-N< Native - - - - US While - - US Black I
'- ----
-
.---------
89-93
All Sites, Women
-_.---
74-7869-73
BOO
700
8 600
q 500g:: 400•£ 300
~ 200
100
o

Alaska Stand Alone Gas Pipeline 5.15-54 Final EIS
According to these data:
Male Alaska Natives have substantially lower age-adjusted cancer incidence rates (all
sites) than either the U.S. White or U.S. Black populations. There is an upward trend for
all three populations.
Female Alaska Natives have similar age-adjusted cancer incidence rates (all sites)
compared to those found in the U.S. White or U.S. Black populations. There is a slight
upward trend in age-adjusted incidence rates in each of these populations.
Throughout most of this time period Alaska Native males have had slightly higher age-
adjusted cancer (all sites) incidence rates than Alaska Native females, though this gap
has narrowed in recent years.
Heart Disease and Cerebrovascular Disease (Stroke)
Many Alaskans are currently at risk for developing
cardiovascular disease due to such risk factors as
smoking, overweight, poor diet, sedentary lifestyle,
high blood pressure and cholesterol, and lack of
preventive health screening. Heart disease and
stroke are major causes of mortality in the Alaska
population (State of Alaska Epidemiology 1997).
According to the publication Healthy Alaskans
2010, heart disease is the second leading cause of
death in Alaska, and cerebrovascular disease
(most commonly referred to as stroke) is the fourth
leading cause of death in Alaska. In 1998, heart
disease was the leading cause of death for men
and the second leading cause of death for women
in Alaska. Coronary disease mortality rates in
Alaska are higher for men than women and higher
for Alaska Whites than Alaska Natives (see data in
Healthy Alaskans). In 1998 Alaskans had a lower
age-adjusted death rate (2000 population) for heart
disease than the overall United States rate.
In 1998, stroke was the second leading cause of death among women and the fifth leading
cause of death among men in Alaska (ADHHS 2002b). Mortality rates for stroke in Alaska in
1998 were higher for females than males and higher for Alaska Natives than Alaska Whites. In
contrast to mortality rates for heart disease, the mortality rate for stroke in 1998 was higher
among Alaskans than the overall U.S. population.
Alaska Stand Alone Gas Pipeline 5.15-55 Final EIS
Heart disease is an important public health issue in terms of morbidity as well as mortality. A
substantial portion of outpatient medical visits, pharmacy dispensing, and rehabilitation services
in the State are a direct result of heart disease and stroke experienced by Alaskans
(ADHSS 2009b). While the number of deaths attributable to heart disease and stroke is
reported by the ABVS for the boroughs/census areas (see below), it is difficult to measure the
full impact of non-fatal heart disease and stroke in the study area, as few population-based
morbidity data sources are currently available for analysis (ADHSS 2009c). As reported by the
BRFSS, the percentage of year 2010 survey respondents that had ever been told they had a
heart attack was 2.6 percent, with the same percentage reporting having ever been told they
had angina or coronary heart disease. The percentage of respondents reporting having ever
being diagnosed with a stroke was 2.9 percent (CDC 2011a).
Chronic Lower Respiratory Disease
COPD, or chronic obstructive pulmonary disease, is a progressive disease that makes it hard to
breathe. Cigarette smoking is the leading cause of COPD. Long-term exposure to other lung
irritants, such as air pollution, chemical fumes, or dust, also may contribute to COPD (National
Heart Lung and Blood Institute 2010).
The Alaska Native Tribal Health Consortium [ANTHC] (2009) has summarized relevant data on
mortality rates for COPD by race and region. Figure 5.15-7 shows average annual age-
adjusted COPD mortality rates per 100,000 by region for Alaska Natives (2004-2007) and also
comparisons between all Alaska Natives, Alaska Whites and U.S. Whites.
ANTHC (2009) summarized relevant data as follows:
Although there appears to be variations between regions for COPD death rates, only
Arctic Slope‘s death rate is significantly higher (p<.05) than the rate for all other regions.
The Alaska Native COPD death rate has increased 92% since 1980 (p<.05). The rate
peaked in 1994-1998 and appears to be decreasing.
During 2004-2007, the Alaska Native COPD death rate was 40% higher than for Alaska Whites
(p<.05) but not significantly different than for U.S. Whites.

Alaska S
tand Alone G
as Pipeline
5.15-56
F
inal EIS
FIGURE 5.15-7 Average Annual Age-Adjusted COPD Mortality Rates per 100,000 by Region, Alaska Natives, 2004-2007 (Alaska Native Tribal Health Consortium 2009)
All Alaska Nalives: 56.1
AI< Whites (2004-2005): 40.8
US \oVhrtes (2004-2005): 44.3
•
_<61 1
_61-90
.'''''_ IlO rate, <5 ~alhs
1meets l-1ealthy People otljecme
9oJ>per RiverlPrince W~1iam Soood
~39.1~.JIr...'•
HNlthy People 2010, Objective 24.10:Reduce the COPD death rate to 60 per 100,000.
HNlthy Alaskans 2010, Objective 24.4: Reduce the COPD death rate to 21.7 per 100,000.

Alaska Stand Alone Gas Pipeline 5.15-57 Final EIS
Diabetes
Diabetes mellitus, commonly referred to as diabetes, is a metabolic disease characterized by
high blood sugar levels, which result from defects in insulin secretion, insulin action, or both.
There are three major types of diabetes. The causes and risk factors are different for each type:
Type 1 diabetes can occur at any age, but it is most often diagnosed in children, teens,
or young adults. In this disease, the body makes little or no insulin. Daily injections of
insulin are needed. The exact cause is unknown.
Type 2 diabetes accounts for a majority5 of diabetes cases. It most often occurs in
adulthood, but teens and young adults are now being diagnosed with it because of
high obesity rates. Many people with type 2 diabetes do not know they have it.
Gestational diabetes is high blood sugar that develops at any time during pregnancy in
a woman who does not have diabetes.
Because of the relative prevalence of various diabetes types, the focus of this document is on
type 2 diabetes. Diabetes is a major cause of heart
disease and stroke and a leading cause of kidney
failure, nontraumatic lower-limb amputations, and new
cases of blindness among adults in the U.S. (CDC
2011b), reasons why Alaska has devised a strategic
plan for its management.
The percentage of the population of each borough
within the State of Alaska diagnosed with diabetes in
2008 ranged from 5.6 to 8.1 percent (age-adjusted),
with the North Slope Borough reporting the highest
percentage. Within the study area, the lowest
percentages were reported in Denali Borough (6.1
percent), Matanuska-Susitna Borough (6.3 percent),
and the Fairbanks North Star Borough (6.4 percent).
The Yukon-Koyukuk Census Area reported a level of 7
percent (CDC 2011b).
5 According to the National Diabetes Information Clearinghouse (2011) type 2 diabetes accounts for about 90 to 95
percent of all diagnosed cases of diabetes among adults.
Alaska Stand Alone Gas Pipeline 5.15-58 Final EIS
Other Fatalities
In 1998, the average life expectancy in Alaska was 74.7 years, slightly below the national
average of 76.7 years. At 69.4 years the life expectancy for Alaska Natives is substantially
lower than for non-Alaska Natives, demonstrating a broad public health discrepancy between
Native and non-Native populations (ANTHC 2002; Indian Health Service 2011).
Intentional and Unintentional Injuries
Intentional (e.g., suicide, homicide) and unintentional deaths (e.g., poisoning, falls, and
drowning) are important causes of fatalities. Table 5.15-23 below shows the total the number
and age-adjusted rates of intentional (suicide and homicide) and unintentional fatalities for the
potentially affected communities and Alaska as a whole.
TABLE 5.15-23 Intentional and Unintentional Fatal Injuries for Potentially Affected Communities – Number and
Age Adjusted Ratesa by Regional Level for years 2007-2009
Borough/CA
Suicide Homicide Unintentional Deaths
Number Ratea Number Ratea Number Ratea
North Slope Borough 9 43.6* 1 N/A** 16 129.1*
Yukon-Koyukuk Census Are 9 60.2* 3 N/A** 20 138.4
Fairbanks North Star Borough 57 21.7 11 4.3* 106 48.0
Denali Borough 1 N/A** 0 N/A** 1 N/A**
Matanuska-Susitna Borough 53 23.2 13 5.0* 117 47.4
Alaska 456 22.7 104 5.2 1025 55.3
a Age-adjusted rates are per 100,000 U.S. year 2000 standard population.
b Rates based on fewer than 20 occurrences are statistically unreliable and should be used with caution.
c Rates based on fewer than 6 occurrences are not reported.
Source: ABVS 2012.
Reference to Table 5.15-23 shows that unintentional age-adjusted death rates are typically
much higher than suicide and homicide rates for the various boroughs/CAs and Alaska as a
whole. Table 5.15-24 provides a breakdown of unintentional death rates (2007-2009) for all of
Alaska and Table 5.15-25 shows these various causes ranked in descending order of age-
adjusted rate. Broadly, non-transport age-adjusted rates are higher than for transport accidents
and, among non-transport accidents, poisoning rates are relatively high compared to the other
categories given. It should be noted that many poisoning fatalities are alcohol related. (As
noted below, this is not the only fatality rate linked to alcohol.)
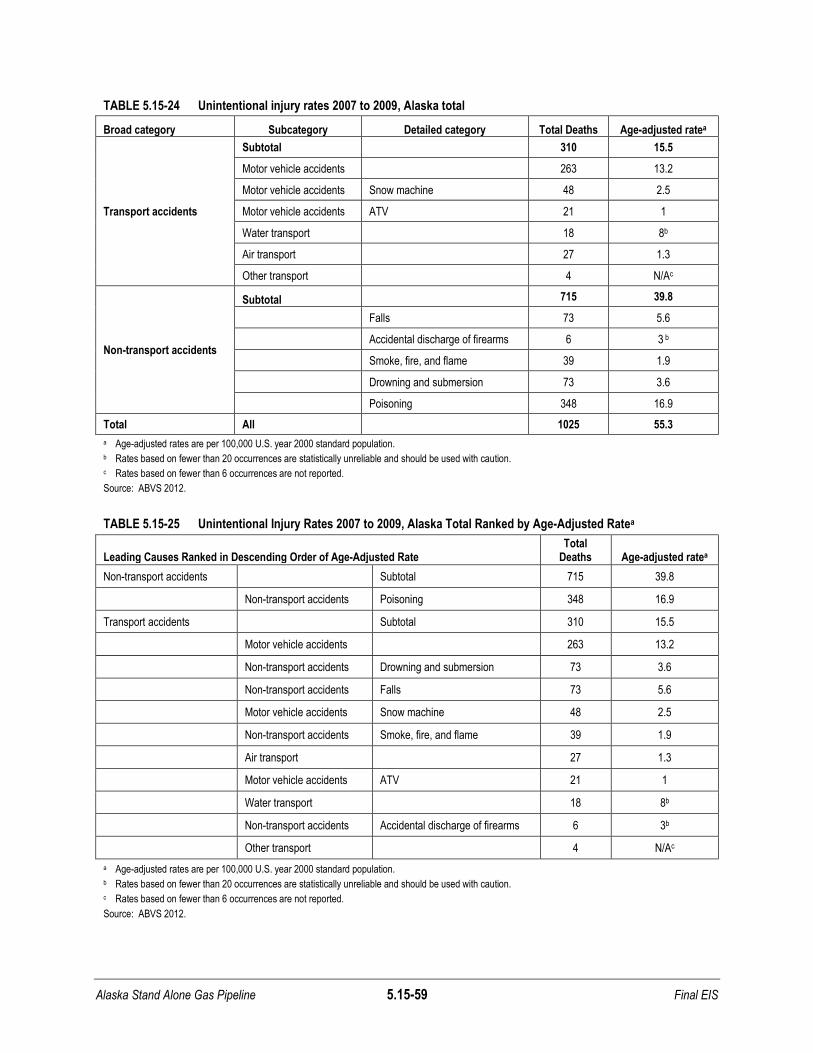
Alaska Stand Alone Gas Pipeline 5.15-59 Final EIS
TABLE 5.15-24 Unintentional injury rates 2007 to 2009, Alaska total
Broad category Subcategory Detailed category Total Deaths Age-adjusted ratea
Transport accidents
Subtotal 310 15.5
Motor vehicle accidents 263 13.2
Motor vehicle accidents Snow machine 48 2.5
Motor vehicle accidents ATV 21 1
Water transport 18 8b
Air transport 27 1.3
Other transport 4 N/Ac
Non-transport accidents
Subtotal 715 39.8
Falls 73 5.6
Accidental discharge of firearms 6 3 b
Smoke, fire, and flame 39 1.9
Drowning and submersion 73 3.6
Poisoning 348 16.9
Total All 1025 55.3
a Age-adjusted rates are per 100,000 U.S. year 2000 standard population.
b Rates based on fewer than 20 occurrences are statistically unreliable and should be used with caution. c Rates based on fewer than 6 occurrences are not reported.
Source: ABVS 2012.
TABLE 5.15-25 Unintentional Injury Rates 2007 to 2009, Alaska Total Ranked by Age-Adjusted Ratea
Leading Causes Ranked in Descending Order of Age-Adjusted Rate Total
Deaths Age-adjusted ratea
Non-transport accidents Subtotal 715 39.8
Non-transport accidents Poisoning 348 16.9
Transport accidents Subtotal 310 15.5
Motor vehicle accidents 263 13.2
Non-transport accidents Drowning and submersion 73 3.6
Non-transport accidents Falls 73 5.6
Motor vehicle accidents Snow machine 48 2.5
Non-transport accidents Smoke, fire, and flame 39 1.9
Air transport 27 1.3
Motor vehicle accidents ATV 21 1
Water transport 18 8b
Non-transport accidents Accidental discharge of firearms 6 3b
Other transport 4 N/Ac
a Age-adjusted rates are per 100,000 U.S. year 2000 standard population.
b Rates based on fewer than 20 occurrences are statistically unreliable and should be used with caution. c Rates based on fewer than 6 occurrences are not reported.
Source: ABVS 2012.
Alaska Stand Alone Gas Pipeline 5.15-60 Final EIS
Intentional Injuries
Intentional fatal injuries include those that are self-inflicted (suicide) and inflicted by others
(homicide). These are discussed in more detail in the following subsections.
-Suicide
Suicide is rightly viewed as a major health problem throughout the US, but particularly in Alaska
and several other Western states. Figure 5.15-8 shows age-adjusted suicide rates by state for
the 25 states with the largest suicide rates for 2007 ranked in descending order together with
the overall US rate (CDC 2010g). Alaska had the highest age-adjusted rate (22.1 per 100,000)
among the states, roughly twice the rate for the US as a whole (11.3 per 100,000). The year
2007 was not atypical in this regard. Suicide rates in Alaska have been significantly higher than
those for the US as a whole for many years.
The State of Alaska Epidemiology Bulletin (2010) presented an analysis of suicide data for the
period from 2004 to 2008 and concluded (among other things) that:
81% of completed suicides were male;
The AIAN rate was 2.2 times greater than the White rate (40.9 vs. 18.5 per 100,000
persons, respectively);
The highest rates by race, sex, and age were among AIAN males aged 20-29 years
(150.2 per 100,000 persons) and females aged 15-19 and 35-39 years (50.0 per
100,000 persons for both groups);
The most commonly documented life stressors were physical health problems (19%)
and recent criminal legal problems (15%);
The most commonly documented event characteristics included proven or suspected
alcohol intoxication (43%) and current depressed mood (41%);
25% of the decedents had a documented current medical health problem of which 77%
had a diagnosis of depression without bipolar disorder; and
Firearms were the most common suicide method among males, whereas poisonings
were the most common suicide method among females.
More useful demographic facts can be found in annual reports by the Statewide Suicide
Prevention Council (e.g., Statewide Suicide Prevention Council 2010).
Suicide is a major cause of intentional death statewide and within the study area. The highest
rates of suicide over the period from 2007-2009 in the study area are reported by the North
Slope Borough (44.5 deaths per 100,000 population) and the Yukon-Koyukuk Census Area
(52.9 deaths per 100,000 population). Both areas exceed the statewide average of 22.2 deaths
per 100,000 population; however, with fewer than 20 occurrences reported by both the North
Slope Borough and the Yukon-Koyukuk Census Area, these rates are statistically unreliable and
should be used with caution (see footnotes to Table 5.15-23 for sources). Figure 5.15-9

Alaska Stand Alone Gas Pipeline 5.15-61 Final EIS
presents a map of age-adjusted suicide death rates for Alaska by borough or CA for the period
2000-2009 (ABVS 2010b).
-Homicide
In the years from 1990 to 2010 Alaska‘s homicide rates per 100,000 have been declining and
broadly comparable to nationwide rates as shown in Figure 5.15-10. In 2010 Alaska ranked 25th
in homicide rate. In the period from 2007 through 2009 for which data are given in Table 5.15-
23, homicide rates in the study area were similar to the state average (5.2 homicides per
100,000 population), with a rate of 4.3 homicides per 100,000 population reported for the
Fairbanks North Star and a rate of 5.0 for the Matanuska-Susitna Borough and fewer than 6
total homicides for the each of the remaining boroughs in the study area (Denali Borough,
Yukon-Koyokuk Census Area, and North Slope Borough). It should be noted that rates based
on fewer than 20 occurrences are statistically unreliable and should be used with caution (ABVS
2012).
The State of Alaska Epidemiology Bulletin (2010) reviewed homicide data for the period 2003
through 2008 and concluded (among other things):
That 67% of victims were male; the rate for men was 1.9 times higher than the rate for
women (8.0 vs. 4.1 per 100,000 population, respectively);
The median age was 32 years (range: 0–85);
That 46% of victims were White and 29% were AIAN;
The rate among AIANs was 2.6 times greater than that of Whites (10.0 vs. 3.9 per
100,000 population, respectively);
The highest rates by race, sex, and age were among AIAN males aged 30–34 years
(103.7 per 100,000 population) and AI/AN females aged 40–44 years (48.1 per 100,000
population);
Rates varied by region of homicide occurrence;
The most commonly documented event characteristics were another precipitating crime
(22%) and intimate partner violence (15%);
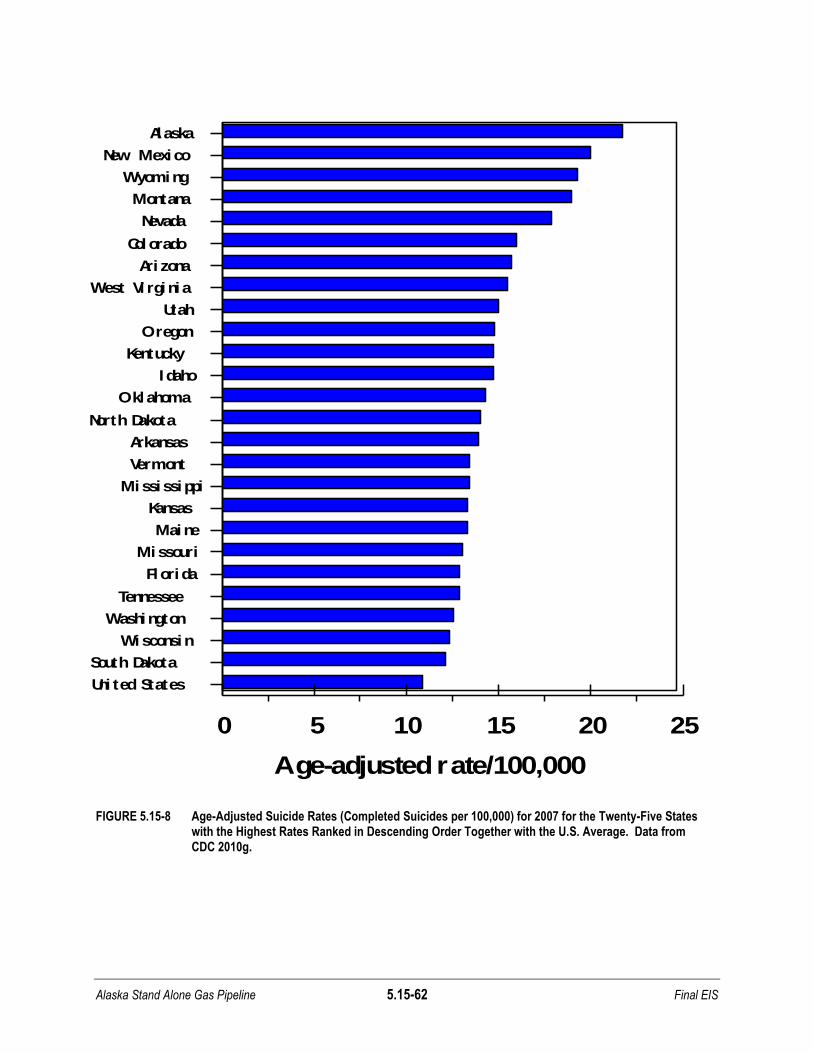
Alaska Stand Alone Gas Pipeline 5.15-62 Final EIS
FIGURE 5.15-8 Age-Adjusted Suicide Rates (Completed Suicides per 100,000) for 2007 for the Twenty-Five States
with the Highest Rates Ranked in Descending Order Together with the U.S. Average. Data from CDC 2010g.
Alaska
New Mexico
Wyoming
Montana
Nevada
Colorado
Ari zona
West Vi rginia
Utah
Oregon
Kentucky
Idaho
Oklahoma
North Dakota
Arkansas
Vermont
Mississippi
Kansas
Maine
Missouri
Florida
Tennessee
Washington
Wisconsin
South Dakota
Uni ted States
0 5 10 15 20 25
Age-adjusted rate/100,000
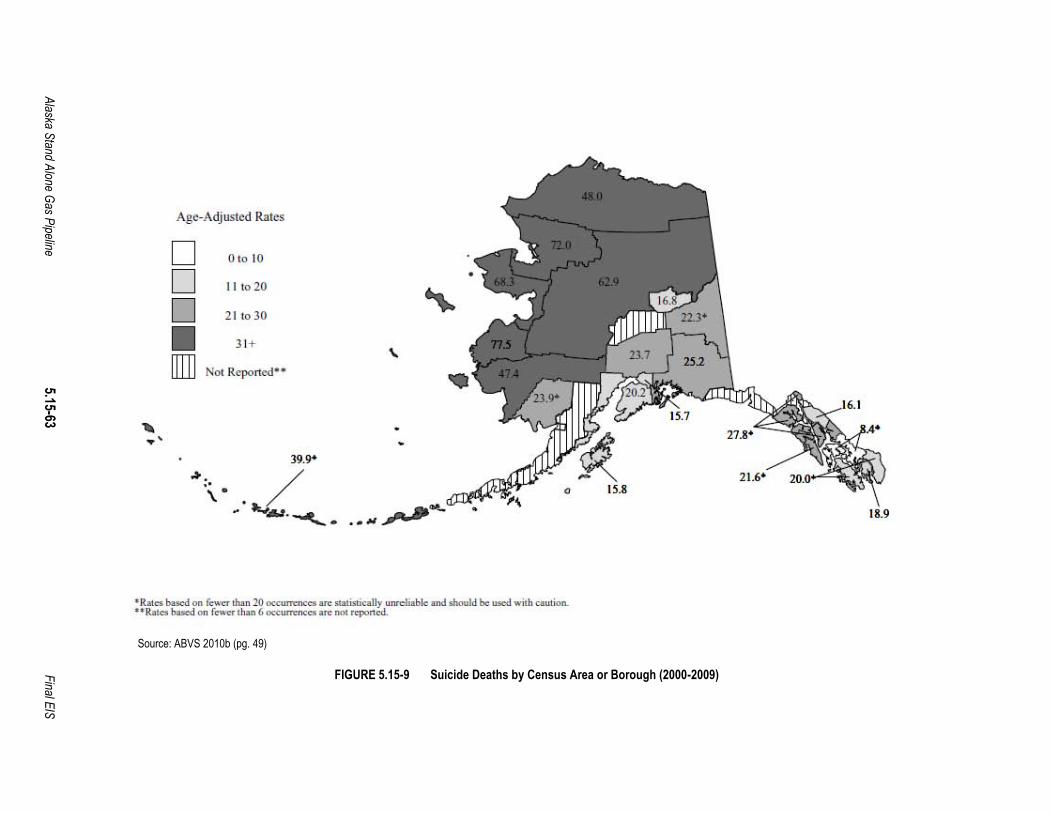
Alaska S
tand Alone G
as Pipeline
5.15-63
F
inal EIS
Source: ABVS 2010b (pg. 49)
FIGURE 5.15-9 Suicide Deaths by Census Area or Borough (2000-2009)
Age-Adjusled Rales
D 0'010
D II '020 .,.D 21'030
• ;H
[]]]] NOI R'l"'ncd"
39.9"
'\... /~ ~.~ ...~~""-
'R... 0-.1 ... "'"""""'"" 20"",........,.. or< "'ally ...dioIH< ............. "" -.I "oj, ooobooL"RaI.. _ 00 fo--.'lwo 6""'......,.. or< N
18.9
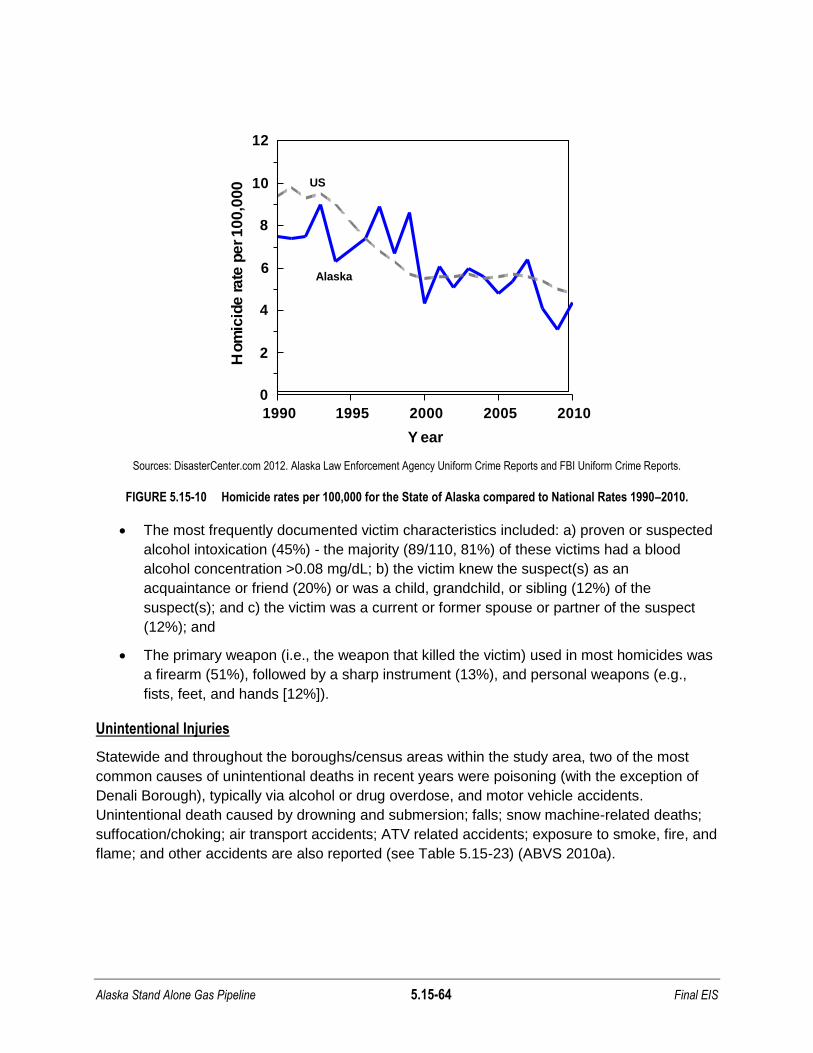
Alaska Stand Alone Gas Pipeline 5.15-64 Final EIS
Sources: DisasterCenter.com 2012. Alaska Law Enforcement Agency Uniform Crime Reports and FBI Uniform Crime Reports.
FIGURE 5.15-10 Homicide rates per 100,000 for the State of Alaska compared to National Rates 1990–2010.
The most frequently documented victim characteristics included: a) proven or suspected
alcohol intoxication (45%) - the majority (89/110, 81%) of these victims had a blood
alcohol concentration >0.08 mg/dL; b) the victim knew the suspect(s) as an
acquaintance or friend (20%) or was a child, grandchild, or sibling (12%) of the
suspect(s); and c) the victim was a current or former spouse or partner of the suspect
(12%); and
The primary weapon (i.e., the weapon that killed the victim) used in most homicides was
a firearm (51%), followed by a sharp instrument (13%), and personal weapons (e.g.,
fists, feet, and hands [12%]).
Unintentional Injuries
Statewide and throughout the boroughs/census areas within the study area, two of the most
common causes of unintentional deaths in recent years were poisoning (with the exception of
Denali Borough), typically via alcohol or drug overdose, and motor vehicle accidents.
Unintentional death caused by drowning and submersion; falls; snow machine-related deaths;
suffocation/choking; air transport accidents; ATV related accidents; exposure to smoke, fire, and
flame; and other accidents are also reported (see Table 5.15-23) (ABVS 2010a).
1990 1995 2000 2005 2010
Y ear
0
2
4
6
8
10
12
Hom
icid
e rate
per 100,0
00 US
Alaska
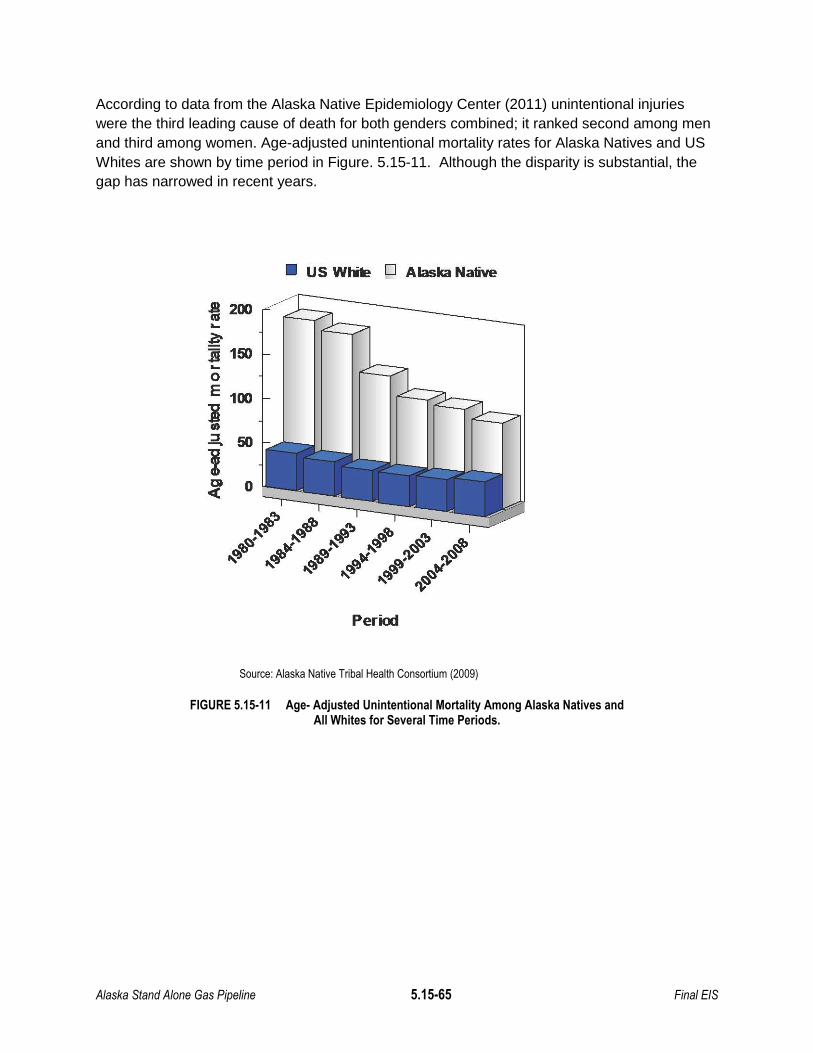
Alaska Stand Alone Gas Pipeline 5.15-65 Final EIS
According to data from the Alaska Native Epidemiology Center (2011) unintentional injuries
were the third leading cause of death for both genders combined; it ranked second among men
and third among women. Age-adjusted unintentional mortality rates for Alaska Natives and US
Whites are shown by time period in Figure. 5.15-11. Although the disparity is substantial, the
gap has narrowed in recent years.
Source: Alaska Native Tribal Health Consortium (2009)
FIGURE 5.15-11 Age- Adjusted Unintentional Mortality Among Alaska Natives and All Whites for Several Time Periods.
o
100
oE
l!2.50
Z~
• US While D Alaska Native
Period

Alaska Stand Alone Gas Pipeline 5.15-66 Final EIS
Traffic Fatalities
On average, 80 persons were killed per year on Alaska
roads since 1994. (See Figure 5.15-12 for year to year
data.)
Use of alcohol is a cause or contributing factor of many
crashes in Alaska. Among the fatal accidents, 43 percent
involve alcohol. Most fatalities occurred in July for the
years 2005-2009. The crash statistics from 2010 showed
a 12 percent decrease in fatal crashes from 2009. For
2011 (as of November 30, 2011) 56 fatal crashes have
occurred in which 65 people were killed (ADOT&PF 2011a). Vehicle-vehicle collisions account
for the majority of crashes, while collisions with fixed objects, moose, or other wildlife account
for a substantially smaller portion of accidents (ADOT&PF 2008).
Failure to wear seatbelts is another contributing factor to vehicle fatalities. Figure 5.15-12
shows the number of vehicle fatalities by year from 1994 through 2010 and the number of
fatalities not wearing seatbelts.
Source: Alaska Highway Safety Office, Transportation & Public Facilities 2012
FIGURE 5.15-12 Annual vehicle fatalities and those not wearing seatbelts in Alaska, 1994-2010.
1995 2000 2005 2010
Y ear
0
20
40
60
80
100
120
Annual fa
tali
ties
AK Annual Vehicle Fatalities
Not Wearing Seatbelts
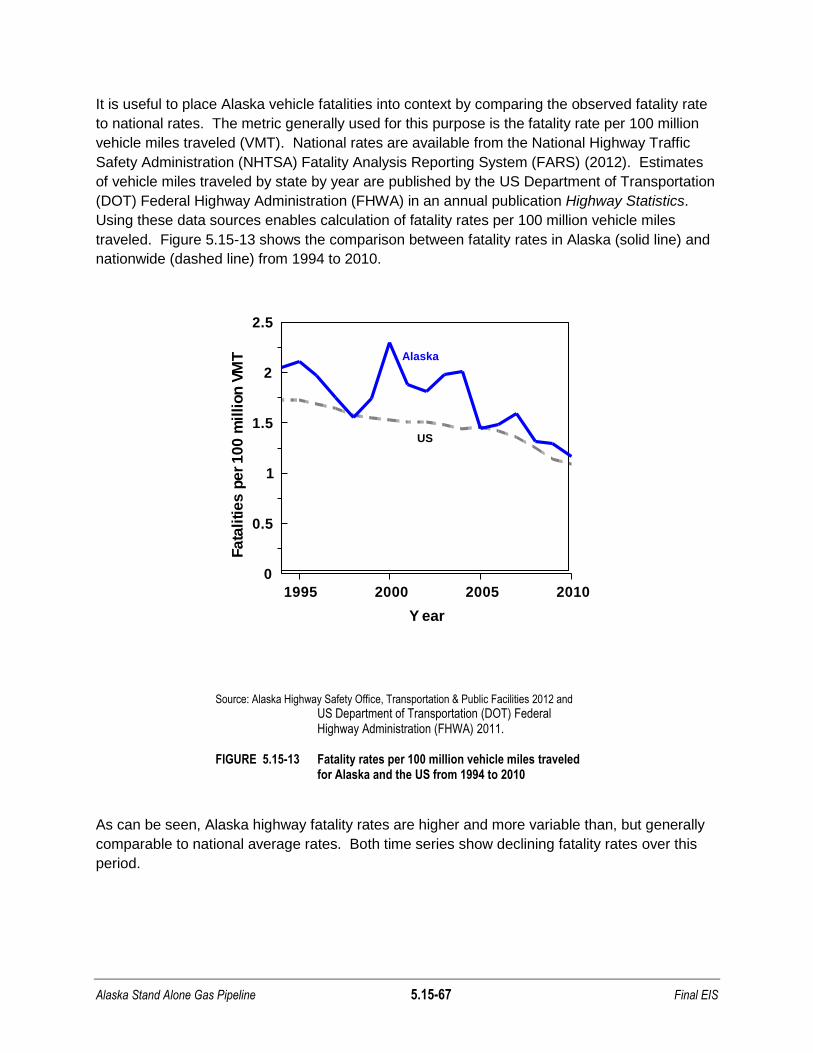
Alaska Stand Alone Gas Pipeline 5.15-67 Final EIS
It is useful to place Alaska vehicle fatalities into context by comparing the observed fatality rate
to national rates. The metric generally used for this purpose is the fatality rate per 100 million
vehicle miles traveled (VMT). National rates are available from the National Highway Traffic
Safety Administration (NHTSA) Fatality Analysis Reporting System (FARS) (2012). Estimates
of vehicle miles traveled by state by year are published by the US Department of Transportation
(DOT) Federal Highway Administration (FHWA) in an annual publication Highway Statistics.
Using these data sources enables calculation of fatality rates per 100 million vehicle miles
traveled. Figure 5.15-13 shows the comparison between fatality rates in Alaska (solid line) and
nationwide (dashed line) from 1994 to 2010.
Source: Alaska Highway Safety Office, Transportation & Public Facilities 2012 and
US Department of Transportation (DOT) Federal Highway Administration (FHWA) 2011.
FIGURE 5.15-13 Fatality rates per 100 million vehicle miles traveled for Alaska and the US from 1994 to 2010
As can be seen, Alaska highway fatality rates are higher and more variable than, but generally
comparable to national average rates. Both time series show declining fatality rates over this
period.
1995 2000 2005 2010
Y ear
0
0.5
1
1.5
2
2.5
Fata
lities p
er
100 m
illion V
MT Alaska
US

Alaska Stand Alone Gas Pipeline 5.15-68 Final EIS
-Alaska highways
The Dalton Highway is a rough, industrial road that begins 84 miles north of Fairbanks and ends
414 miles later in Deadhorse near Prudhoe Bay. Between 1997 and 2006, there were 111
crashes and seven fatalities reported on Dalton Highway (BLM 2011). In 2011 one fatality,
which occurred in Yukon-Koyukuk Borough, has been reported for Dalton Highway (ADOT&PF
2008).
The Parks Highway runs the 358 miles between Anchorage and Fairbanks and is the principal
access road to Denali National Park; thus, this stretch of highway is heavily traveled
(ADOT&PF 2006). In 2006, for example, 113 vehicle crashes were reported to ADOT&PF
(2 fatalities). In 2010, 12 fatalities were reported (one in Nenana; two in Wasilla; one in Willow;
three in Ester; one in Healy; and four outside of city boundaries). In 2011, four fatalities have
occurred on Parks Highway (one in Big Lake; one in Trapper Creek; one in Healy; and one in
Fairbanks) (ADOT&PF 2008).
-Role of alcohol
As noted above, in examining the above data it is important to note that alcohol plays an
important role in both intentional (e.g., suicide [CDC 2009e] and homicide [State of Alaska
Epidemiology 2010]) and unintentional (e.g., motor vehicle accidents [Rarig and Hull-Jilly 2011])
injuries and fatalities in Alaska (see also Hull-Jilly and Casto 2008). Moreover, alcohol-induced
deaths (including fatalities from causes such as degeneration of the nervous system due to
alcohol, alcoholic liver disease, gastritis, myopathy, pancreatitis, poisoning, and more) in Alaska
are higher than those in the national overall. For example, between 2006 and 2008, Alaska‘s
rate of alcohol-induced deaths was approximately 3 times the U.S. rate (ADHSS 2012b). The
alcohol-induced death rate is significantly higher for Alaska Natives than for non-Natives. As
noted by Segal (1998):
For example, 25 percent of all deaths in Alaska are alcohol-related (Alaska Department of Health and Social Services [ADHSS] 1994). More recently, of the 192 Native deaths (from any cause) that occurred in rural Alaska between 1990 and 1993, 128 (66.6 percent) were found to be alcohol related (i.e., the deceased had a blood alcohol concentration [BAC] of 0.08 or higher) (Demer 1997).
In 1981 the State of Alaska Legislature changed alcohol laws to give residents broad powers to
regulate how alcohol came into their communities by a local option referendum. Following this
decision, some communities opted for various types of alcohol controls. This action enabled
researchers to analyze the effects of various alcohol-related policies on injury deaths among
Alaska Natives living in small communities (see e.g., Berman and Hull 2000). Investigators
Berman, Hull, and May (2000) concluded:

Alaska Stand Alone Gas Pipeline 5.15-69 Final EIS
Injury death rates were generally lower during periods when alcohol sales, importation or possession were restricted than when no restrictions were in place (wet). More restrictive controls (dry) significantly reduced homicides; less restrictive control options (damp) reduced suicides. Accident and homicide death rates fell, on average by 74 and 66 per 100,000, respectively, for the 89 communities that banned sale and importation or possession. A control group of 61 small communities that did not change control status under the law showed no significant changes over time in accident or homicide death rates.
Maternal and Child Care
As noted in a 2005 publication by the State of Alaska Division of Public Health Bureau of Vital
Statistics (ABVS 2005):
Infant mortality is considered to be an important and comprehensive measure of
the overall health of a community. Improvements in sanitation, nutrition, patient
education, and the adequacy of prenatal care have drastically lowered infant
mortality rates in most countries over the last century.
One key indicator of the quality and availability of maternal and child care is the infant mortality
rate. This rate is the sum of the neonatal (under 28 days) and postneonatal (deaths to infants
28 days to 1 year old) mortality rates, measured in units of infant deaths per 1,000 live births.
Figure 5.15-14 shows a plot of the infant mortality rate for Alaska (solid line) compared to the
national average (dashed line) over the period from 1994 to 2010. The year-to-year variability
of Alaska mortality rates is greater, probably an artifact of the sample size, but the overall rates
are comparable to the national averages. Both series have a slight downward trend (indicating
improvement) over this period. State by state data are available in several reports (see e.g.,
Congressional Research Service [CRS] 2012).
The average rates shown in Figure 5.15-14 are relevant, but conceal some important
differences among population subgroups. Specifically there are important differences in infant
mortality rates (including both neonatal and postneonatal mortality) for Alaska Natives
compared to non-natives (see e.g., Toffolon-Weiss et al. 2008, State of Alaska Epidemiology
2006, or CDC 2012). Historically, Alaska Natives have experienced higher infant mortality rates
than non-natives, though the gap has apparently narrowed over the years (Toffolon-Weiss et al.
2008). Comparing risk ratios (RR) between Alaska Native and non-native infant mortality rates
over the period from 1992-2001 the Alaska Maternal-Infant Mortality Review researchers (State
of Alaska Epidemiology 2006) concluded that there were several cause specific rate differences
that were statistically significant, including SIDS or asphyxia, preterm birth, congenital
anomalies, infections, and neglect or abuse (sub-optimal medical care had an elevated RR, but
was not statistically significant in this study).
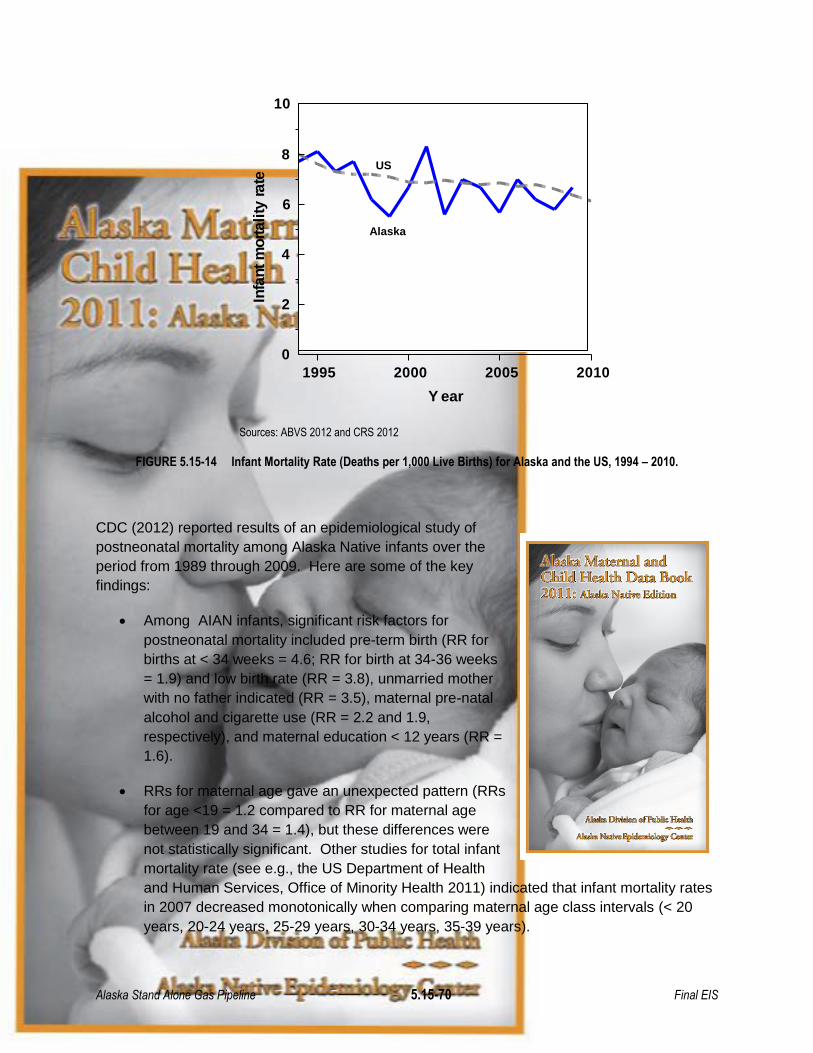
Alaska Stand Alone Gas Pipeline 5.15-70 Final EIS
Sources: ABVS 2012 and CRS 2012
FIGURE 5.15-14 Infant Mortality Rate (Deaths per 1,000 Live Births) for Alaska and the US, 1994 – 2010.
CDC (2012) reported results of an epidemiological study of
postneonatal mortality among Alaska Native infants over the
period from 1989 through 2009. Here are some of the key
findings:
Among AIAN infants, significant risk factors for
postneonatal mortality included pre-term birth (RR for
births at < 34 weeks = 4.6; RR for birth at 34-36 weeks
= 1.9) and low birth rate (RR = 3.8), unmarried mother
with no father indicated (RR = 3.5), maternal pre-natal
alcohol and cigarette use (RR = 2.2 and 1.9,
respectively), and maternal education < 12 years (RR =
1.6).
RRs for maternal age gave an unexpected pattern (RRs
for age <19 = 1.2 compared to RR for maternal age
between 19 and 34 = 1.4), but these differences were
not statistically significant. Other studies for total infant
mortality rate (see e.g., the US Department of Health
and Human Services, Office of Minority Health 2011) indicated that infant mortality rates
in 2007 decreased monotonically when comparing maternal age class intervals (< 20
years, 20-24 years, 25-29 years, 30-34 years, 35-39 years).
1995 2000 2005 2010
Y ear
0
2
4
6
8
10
Infa
nt
mortali
ty rate
Alaska
US
Matemalandauld Health Data Book2011: Alaab Nod.. EdiIioIl
---AWaNllitc'\:' .""0.-
Alaska Stand Alone Gas Pipeline 5.15-71 Final EIS
The State of Alaska (H&SS) publishes an Alaska Maternal and Child Health Data Book (MCH)
that contains relevant data on demographics, reproductive health, prenatal health, prenatal
substance abuse, maternal health, infant health, child health, and childhood home environment.
The data presented in the MCH Data Book (Young et al. 2011) help to ‗explain‘ some of the
differences between Alaska Native and non-native infant mortality rates. For example:
There are differences in the distribution of maternal ages between Alaska Natives and
non-natives. More Alaska Native than non-Native births were to mothers ages 15-19
years (17.3% vs. 7.5%, respectively), while a higher percentage of non-Native mothers
were 35 years or older (13.3% vs. 7.8%);%).
There are differences in the level of education and marital status of mothers between
Alaska Natives and non-natives. Compared to non-Native mothers, Alaska Native
mothers were more likely to have less than 12 years of education (28.2% vs. 9.8%) and
were less likely to be married (31.8% vs. 72.8%);%).
Non-Native women were more likely than Alaska Native women to receive prenatal care
in the first trimester during the entire eight year period 2000-2008;.
For Alaskan births that occurred during 2007-2008, reported prenatal use of all
substances except for alcohol was higher among Alaska Native women compared to
non-Native women. Reported alcohol use was nearly twice as high among non-Native
women as among Alaska; and Native women (6.3% vs. 3.5%, respectively).
The reported prevalence of cigarette use among Alaska Native women was three times
higher than for non-Native women (30.5% vs. 10.2%, respectively).
Differences in demographic (among other factors) factors give rise to differences in infant
mortality rates among various boroughs/CAs in Alaska. Table 5.15-26 shows the latest
available data on infant mortality for boroughs/CAs containing potentially affected communities.

Alaska Stand Alone Gas Pipeline 5.15-72 Final EIS
TABLE 5.15-26 Neonatala, Postneonatalb, and Total Infant Mortality Ratesc for Potentially affected
Boroughs/CAs and the State of Alaska
Yukon-Koyukuk
Census Area North Slope
Borough Denali
Borough State of Alaska
Period Reported
Neo- natal
Post- neo-natal Total
Neo-natal
Post- neo-natal
Total
Neo-natal
Post- neo-natal Total
Neo-natal
Post neo-natal Total
2005-2009 ** 13.4 15.6 ** ** 8.9 0.0 0.0 0.0 2.9 3.4 6.3
2004-2008 ** 14.3 23.9 6.7 ** 10.1 0.0 0.0 0.0 3.1 3.2 6.3
2003-2007 ** 15.0 25.0 9.3 ** 10.5 0.0 ** ** 3.3 3.2 6.5
2002-2006 ** ** 18.7 8.2 ** 9.3 0.0 ** ** 3.1 3.3 6.4
2001-2005 ** ** 17.0 7.2 ** 10.8 0.0 ** ** 3.1 3.6 6.7
2000-2004 ** ** 13.2 7.3 ** 12.2 0.0 ** ** 3.2 3.7 6.9
1999-2003 0.0 ** ** ** ** 10.1 0.0 ** ** 3.0 3.6 6.6
1998-2002 0.0 ** ** ** ** 7.8 0.0 0.0 0.0 3.0 3.5 6.5
1997-2001 0.0 ** ** ** ** ** 0.0 0.0 0.0 3.4 3.6 6.9
1996-2000 ** 0.0 ** ** ** ** 0.0 0.0 0.0 3.3 3.4 6.7
1995-1999 ** ** ** ** ** 8.5 0.0 0.0 0.0 3.6 3.4 7.0
1994-1998 ** ** 11.7 ** ** 11.6 0.0 0.0 0.0 3.8 3.7 7.4
1993-1997 ** ** 15.9 ** 8.6 11.5 0.0 0.0 0.0 4.0 3.8 7.8
1992-1996 ** ** 14.5 ** 8.6 12.8 0.0 0.0 0.0 4.1 3.9 8.0
1991-1995 ** 9.8 13.1 ** ** 9.5 0.0 0.0 0.0 4.0 4.3 8.3
1990-1994 ** 8.9 10.4 ** ** 10.9 ** 0.0 ** 4.1 4.7 8.8
Fairbanks North Star
Borough Matanuska-Susitna
Borough State of Alaska
Period Reported
Neo- natal
Post- neo-natal Total Neo-natal
Post- neo-natal Total
Neo-natal
Post- neo-natal Total
2007-2009 1.7 1.7 3.5 1.6 3.9 5.5 2.6 3.6 6.2
2006-2008 1.5 1.9 3.5 ** 2.9 4.2 3.0 3.4 6.3
2005-2007 2.1 1.4 3.5 2.5 3.3 5.7 3.3 3.1 6.3
2004-2006 2.1 2.3 4.5 2.7 1.8 4.4 3.4 3.1 6.5
2003-2005 3.6 2.8 6.4 4.0 ** 5.6 3.2 3.2 6.5
2002-2004 3.0 3.6 6.6 3.6 ** 5.1 2.9 3.5 6.5
2001-2003 2.8 3.3 6.1 4.3 2.7 7.0 3.0 4.0 7.0
2000-2002 2.2 3.3 5.5 3.2 4.0 7.2 3.1 3.8 6.9
1999-2001 3.6 2.7 6.3 2.9 4.2 7.2 3.3 3.6 6.8
1998-2000 3.2 2.3 5.5 ** 3.5 5.3 3.1 3.0 6.2
1997-1999 3.5 2.1 5.6 ** 3.8 6.2 3.1 3.3 6.5
1996-1998 3.2 2.3 5.5 2.8 3.8 6.8 3.5 3.6 7.1
1995-1997 4.8 3.4 8.2 4.1 4.1 8.3 4.1 3.6 7.7
1994-1996 3.3 3.1 6.5 3.2 3.7 6.9 3.9 3.7 7.7
1993-1995 3.2 3.0 6.2 4.2 3.3 7.5 4.3 3.7 8.0
1992-1994 2.4 2.6 5.1 3.8 5.2 9.1 3.9 4.2 8.1 a Neonatal rates are deaths to infants less than 28 days of age per 1,000 live births. b Postneonatal rates are deaths to infants 28 days to 1 year of age per 1,000 live births. c Total infant mortality rates are the sum of neonatal and postneonatal rates per 1,000 live births. ** Too few data for reliable rates to be calculated. Source: ABVS 2011 Note: ABVS does not report data for the same time periods for each census area or borough. Using the available data from AKDHHS, this table lists the Yukon-Koyukuk Census Area, the North Slope Borough and the Denali Borough with one set of time periods and the Fairbanks North Star Borough and Matanuska-Susitna Borough with another.

Alaska Stand Alone Gas Pipeline 5.15-73 Final EIS
Morbidity
This section addresses various infectious diseases including sexually transmitted diseases
(STDs, including Chlamydia, gonorrhea, and HIV/AIDs) and infectious respiratory bacterial or
viral illnesses. STDs pose a continuing concern to health authorities and are addressed in
Health Alaskans 2010.
Chlamydia Infections
Chlamydia is a common sexually transmitted disease (STD) caused by the bacterium,
Chlamydia trachomatis, which (among other things) can damage a woman's reproductive
organs. Even though symptoms of Chlamydia are usually mild or absent, serious complications
that cause irreversible damage, including infertility, can occur "silently" before a woman ever
recognizes a problem.
Rates of Chlamydia infection are disproportionately high
for women, certain ethnic/racial minorities, and young
adults. And rates are substantially higher for Alaska
than the US as a whole. For example:
Alaska had the highest Chlamydia infection rate
in the nation in 2010. It ranked second among
all states in rates of Chlamydia infection in 2009
with a rate of 752.7 per 100,000 persons,
compared to 409.2 for the US as a whole (see
CDC 2010f).. Figure 5.15-15 shows a map of
the US with Chlamydia rates shown for each
state.
Chlamydia rates for Alaskan women are much
higher than for men with 66 percent of 2010
cases diagnosed in women (ADHSS 2011c).
Chlamydia rates reported for AIAN people are greater than for whites (CDC 2011d) and
Chlamydia rates are higher for younger persons. Eighty-six percent of 2010 cases in
Alaska occurred in people 30 years old or younger (ADHSS 2011c).
Geographically, the Northern Region has the highest rates of Chlamydia (22,250 per 100,000
people). The community of Prudhoe Bay (North Slope Borough) is a PAC which falls within the
Northern Region. The second highest Chlamydia rates occur in the Southwest Region (1,803
per 100,000 people) but no PACs are located within this region. The third highest rates occur in
the Interior Region (816 per 100,000 people), which contains the PACs of Ester and Fairbanks
(Fairbanks North Star Borough); Nenana (Yukon-Koyukuk Census Area); and Anderson,
Cantwell and Healy (Denali Borough). The Anchorage/Matanuska-Susitna (Southcentral
Alaska) Region had the fourth highest rates of Chlamydia (601 per 100,000 people)
(ADHSS 2011c). The PACs of Big Lake, Talkeetna, Trapper Creek, Wasilla, Willow, and Y are
located within Southcentral Alaska.
•
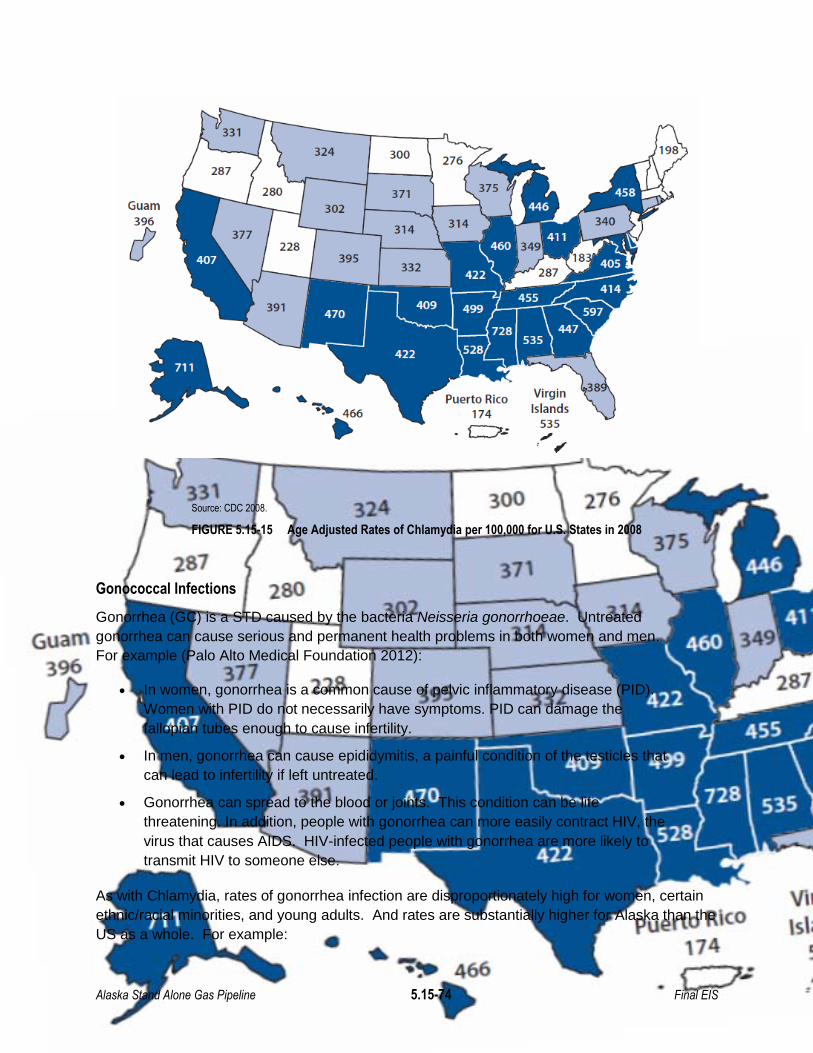
Alaska Stand Alone Gas Pipeline 5.15-74 Final EIS
Source: CDC 2008.
FIGURE 5.15-15 Age Adjusted Rates of Chlamydia per 100,000 for U.S. States in 2008
Gonococcal Infections
Gonorrhea (GC) is a STD caused by the bacteria Neisseria gonorrhoeae. Untreated
gonorrhea can cause serious and permanent health problems in both women and men.
For example (Palo Alto Medical Foundation 2012):
In women, gonorrhea is a common cause of pelvic inflammatory disease (PID).
Women with PID do not necessarily have symptoms. PID can damage the
fallopian tubes enough to cause infertility.
In men, gonorrhea can cause epididymitis, a painful condition of the testicles that
can lead to infertility if left untreated.
Gonorrhea can spread to the blood or joints. This condition can be life
threatening. In addition, people with gonorrhea can more easily contract HIV, the
virus that causes AIDS. HIV-infected people with gonorrhea are more likely to
transmit HIV to someone else.
As with Chlamydia, rates of gonorrhea infection are disproportionately high for women, certain
ethnic/racial minorities, and young adults. And rates are substantially higher for Alaska than the
US as a whole. For example:
..~ 466••
GualTl
;y ,71228
•
,14
,.,
,00
,71
".
erto Rl(OPU \14
cY
VIrgInIslands
53':',
Alaska Stand Alone Gas Pipeline 5.15-75 Final EIS
Alaska had the ninth highest gonorrhea infection rate in the nation in 2009 with a rate of
144.3 per 100,000 population compared to 99.1 for the US as a whole (CDC 2010f). By
2010 Alaska‘s rate was the second highest in the country (ADHSS 2011d). Rates came
down in 2011, but remain higher than national averages (ADHSS 2011d).
GC rates for Alaskan women are much higher than those for men. In 2009, the rates
were 157 and 132 cases per 100,000 for women and men in Alaska (CDC 2010f).
GC rates reported for AIAN people are greater than for whites (ADHSS 2011d).
GC rates are typically higher for younger persons. National data for 2009 indicate that
young adults 20 to 24 had the highest rates of GC infections (CDC 2010f).
The CDC reports gonorrhea rates by borough. The PAC of Prudhoe Bay falls within the North
Slope Borough, which is categorized as the borough with the highest rates of gonorrhea
(greater than 600 per 100,000 people). The PACs of Coldfoot, Four Mile Road, Nenana,
Livengood, and Wiseman fall within the Yukon-Koyukuk Borough which report moderate rates of
gonorrhea in young people (between 300 and 600 cases per 100,000 people). The remaining
PACs fall within Fairbanks North Star, Denali, or Matanuska-Susitna Boroughs, all of which
report low gonorrhea rates of less than or equal to 300 per 100,000 people (CDC 2009d).
HIV Infections
HIV is the human immunodeficiency virus. It is the virus that can lead to acquired immune
deficiency syndrome, or AIDS. As noted in a recent State of Alaska Epidemiology Bulletin:
Over 1 million persons in the United States are estimated to be living with human
immunodeficiency virus (HIV) infection, and >50% of those infected persons are
men who have sex with men (MSM). Human Immunodeficiency Virus (HIV) is
transmitted through unprotected sexual activity, the sharing of injection
equipment for intravenous drug use, and from mother to child during childbirth
and breastfeeding. Both HIV and acquired immune deficiency syndrome (AIDS)
are reportable conditions in Alaska. Persons at greatest risk for acquiring HIV in
Alaska are MSM, high risk heterosexuals, and injection drug users (IDU).
HIV and AIDS cases are routinely identified in the State of Alaska; however, the prevalence of
HIV/AIDS in the Alaskan population is low (ADHSS 2010b). Since 1982, 1,394 cases of HIV
were reported to the Alaska SOE. In 2010, 77 cases were reported. In 2010 and for years
previous, males represented the majority of infected individuals. Overall, 44 percent of 2010
cases were diagnosed in white people, 17 percent in AIAN people, and 13 percent in black
people. The majority of diagnoses for the entire time span (1982-2010) occurred in the
Anchorage/Matanuska-Susitna area. Approximately 80 percent of all HIV/AIDS diagnoses
occurred in what the Alaska State HIV/STD Program refers to as ―Urban Centers‖, which include
the Municipality of Anchorage, Fairbanks North Star Borough, and the Juneau Borough (ADHSS
2010c). The PACs of College, Ester, and Fairbanks occur within these more high-risk Urban
Centers. The remaining PACs lie within ―Urban Satellites‖, ―Rural Hubs‖, or ―Rural Areas‖ which
individually account for less than 10 percent of the total HIV/AIDS diagnoses in Alaska.
Alaska Stand Alone Gas Pipeline 5.15-76 Final EIS
A recent State of Alaska Epidemiology Bulletin (ADHSS 2012a) provides information on an HIV
outbreak in Fairbanks over the period 2011-2012.
The CDC has developed a High-Impact prevention approach for reducing new cases of HIV in
the United States (CDC 2011c). This approach has the potential to positively impact prevention
efforts by targeting high-risk populations in appropriate geographic locations. Strategies with
proven effectiveness include: access to testing and care for HIV-infected individuals;
antiretroviral therapy; access to condoms and sterile syringes; prevention programs for HIV-
infected individuals and their partners, and those at high risk; and sexually transmitted disease
(STD) screening and treatment. Some STDs can increase the risk of HIV infection. The CDC
aims to educate the U.S. population about HIV/AIDs and effective prevention measures. Cost-
effectiveness is a critical component of the High-Impact prevention approach, so that the
greatest amount of prevention can be extracted from each federal dollar allocated to this cause.
The Division of Sexually Transmitted Diseases Prevention has provided funding to evaluate the
reduction of barriers to individuals seeking healthcare and to increase STD screening
opportunities in rural and urban areas of Alaska (CDC 2010a).
Infectious Respiratory Bacterial or Viral Illnesses in Alaska
Influenza rates in Alaska tend to mirror those throughout the U.S. Influenza surveillance is
based on reporting of positive influenza antigen ―rapid‖ tests by health care providers and
laboratories, positive influenza cultures, outbreaks in schools and nursing homes, outbreaks
following vaccination, and incidences of pediatric influenza deaths (ADHSS 2007a). The peak
influenza activity in Alaska for the 2008-09 season occurred in February and March 2009. The
three most common strains were influenza A (H1), A (H3), and B. The first case of H1N1 in
Alaska was reported in May 2009. Statistics indicate that the 2009-10 season levels of H1N1
were less than the previous year (ADHSS 2010d).
Influenza rates are updated weekly by the Alaska State Virology Laboratory. Incidences of
infectious viral diseases do not appear to be above normal for 2011. In recent reports
(September 24 -29, 2011), four cases of influenza A (H3) were isolated and originated in the
Anchorage/Matanuska-Susitna Region or the Interior Region. One case of influenza B was also
diagnosed in the Interior as was one case of Respiratory Syncytial Virus (RSV). The RSV
season lasts longer in Alaska than in other states. During the 2006-07 season, an outbreak of
RSV occurred in the North Slope Region (ADHSS 2007b). RSV was also identified in nine other
Alaska communities that year, including Anchorage and Fairbanks. Several strains of
adenovirus were identified (Type 1,2,3,14) in the Interior Region and the Northern Region (Bond
2011). In 2011, 48 infants in a neonatal intensive care unit in an Anchorage hospital were
infected with mild Methicillin-resistant Staphylococcus aureus (MRSA) causing respiratory or
gastrointestinal illness (ADHSS 2011e). In previous years, MRSA infections have occurred at
rates similar to those seen elsewhere in the U.S.; however, Alaska Natives are more likely to
experience MRSA infection than other groups (ADHSS 2009d).
Alaska experienced higher rates of tuberculosis (TB) in 2010 (8 per 100,000 population)
compared to the United States average (3.6 per 100,000 population). The TB rate in Alaska in
Alaska Stand Alone Gas Pipeline 5.15-77 Final EIS
2010 was 50 percent higher than in 2009. Alaska Native people bear a disproportionate burden
of TB in Alaska as 65 percent of 2010 TB cases occurred in this population even though this
group only represents 15 percent of the general population. The incidence of TB in Alaska is
not evenly distributed throughout the state. The highest rates are found in the Northern and
Southwest Regions. The Northern Region usually reports the greatest numbers of TB cases in
the state. In 2010, the incidence of TB in the Northern Region was 46.5 per 100,000 population,
almost six times greater than the statewide incidence (ADHSS 2010e). The city of Anchorage
reports a large proportion of outbreaks occurring in homeless people.
Other Baseline health data
Oral Health
A 2008 CDC survey indicated that 65.3 percent of Alaska residents visited a dental clinic in the
previous 12 months compared to 68.5 percent of persons nationally (CDC 2010b). Oral health
problems are pronounced among low-income and Alaska Native populations, and a 1999 Indian
Health Service Oral Health Survey found that visitors to Alaska Native dental clinics
experienced twice the number of decayed or filled teeth compared to non-Natives on average
(Indian Health Service 1999).
Gender-Based Violence and Child Abuse
Domestic violence is a major public health problem in Alaska that disproportionately affects
vulnerable populations such as Alaska Natives and those in poor general health. Alaska has
among the highest rates of domestic violence in the nation. At 73.3 cases per 100,000, Alaska
has the highest rate of forcible rape of any state in the U.S., nearly 2.5 times the national
average of 31.8 cases per 100,000 (Council on Domestic Violence & Sexual Assault 2010).
Alaska also has the highest homicide rate for females killed by a male perpetrator, with a rate of
2.87 per 100,000 in 2003. Alaskan children are frequently victims of sexual abuse in a cycle
that perpetuates high overall domestic violence rates: the sexual assault rate for Alaskan
children is six times the national average. The prevalence of domestic violence and sexual
assault in Alaska is accompanied by a shortage of victim services. The Alaska Network on
Domestic Violence and Sexual Assault estimates that in 2006, almost 30 percent of Alaskans
were unable to access victim services or encourage others to do so because of a shortage of
services in their area at the time (National Coalition Against Domestic Violence 2010), and a
study by the ADHSS further documented that those in fair-to-poor general health or lacking
social and emotional support are disproportionately vulnerable to domestic violence (Utermohle
and Wells n.d.).
Sexual violence is similarly elevated within the Alaska Native population. In 2006, 31 percent of
Alaska Natives experienced intimate partner violence in their lifetime, compared to 20.2 percent
among Caucasians (Utermohle and Wells n.d.).

Alaska Stand Alone Gas Pipeline 5.15-78 Final EIS
5.15.4 Environmental Consequences
This section describes the health impacts related to construction, operations and maintenance
of the proposed action and alternatives. Before addressing the consequences of the action
proposed by the AGDC, it is useful to provide some perspective on the scale of this proposed
Project. Because the consequences of construction and operation of the Trans Alaska Pipeline
System (TAPS) are relatively fresh in the memory of many Alaskans and much has been written
about TAPS, both favorably and unfavorably (see e.g., Coates 1991; Cole 1997; Fears 1978;
McGrath 1977; Mead 1978; Roderick 1997; Rogers 1970; Roscow 1977; and Strohmeyer 1993)
over the years, it is relevant to draw some comparisons with this benchmark. It is not within the
scope of this document to attempt to assess the impacts of TAPS; the literature cited above
provides a spectrum of viewpoints. Some such as David Brower of the Friends of the Earth
(quoted in Coates 1991) denounced TAPS as ‗the greatest environmental disaster of our time‘,
whereas others, such as the poet William R. Wood (quoted in Coates 1991) described the
pipeline as modest, benign, romantic, and certainly beautiful with the phrase, ‗A silken thread,
half hidden across the palace carpet.‘
It is useful to contrast the scale of the ASAP with that of TAPS. Doubtless TAPS has had some
negative impacts on the health of Alaskans. But it has also conferred many benefits including
providing revenue to the state for many programs that provide health benefits. As economist
Scott Goldsmith (2011) observes, the State of Alaska has received a substantial economic
windfall from Alaskan oil:
Extra spending for services and unique programs. About 44%—$70 billion—of oil
revenues went for, among many other things, new and expanded operating
programs; construction of schools, community facilities, and other infrastructure;
loans to students, fishermen, and others; and aid to municipalities and schools.
Some revenues funded the start-up of special corporations that make home
mortgage loans and promote economic development. Most famously, in 1982 the
state began sending annual checks (Permanent Fund dividends) to every
resident, from the earnings of the Permanent Fund.
A more recent article by Goldsmith (Goldsmith 2012) notes that over the period from 1977 to
2012, spending by the State of Alaska totaled $177 billion (in 2011 $). Of this total,
approximately 90 percent ($159 billion) was funded by oil revenues.
At the time that TAPS was constructed it was described by the New York Times as ―the largest
single private construction Project and private capital investment in history.‖ The costs of
completion of TAPS (completed in 1977) were estimated at approximately $8 billion in dollars of
the day—or in terms of today‘s dollars (using the reported purchasing power of the dollar in
terms of producer prices) slightly more than $22 billion (Alyeska 2009; U.S. Census Bureau
2011a). The estimated cost for the Alaska Stand Alone Gas Pipeline (ASAP) (see 5.12.3.2) is
$8.4 billion, slightly more than one-third as much.

Alaska Stand Alone Gas Pipeline 5.15-79 Final EIS
Oil company personnel (and contractors) were on scene in appreciable numbers in the late
1960s and actual TAPS pipeline construction began in 1974. Thus people-related impacts were
felt prior to and during construction from the late 1960s through 1977. The schedule for the
proposed ASAP Project is to have construction activity over a two and one-half year period from
2017 through 2019, so the duration of construction-related impacts is less for ASAP than TAPS.
Construction labor provides another benchmark for comparison—in part because construction
labor is one of the determinants of short-term impacts. Peak TAPS construction employment
(including contractors) was 28,072 in October 1975 (Alyeska 2009). Over the period from 1969
through 1977 an estimated 70,000 persons worked on TAPS (Alyeska 2009). This proposed
gas pipeline is estimated to have up to 6,400 workers (5,500 on the pipeline and 900 on the
facilities) at peak construction (see Section 2.2.5), approximately 23 percent as that of TAPS.
Operating labor for TAPS varied over time. Alyeska employment at the present is reported to
be 811, 13 times greater than the estimate, ranging from 50 to 75 employees, for the proposed
Project during the operations and maintenance phase (Alyeska 2008; AGDC 2011d).
In considering the possible impact of the construction workforce, it is useful to note that the
6,400 worker figure quoted above is a peak value. As shown in Figure 5.15-16, the estimated
size of the workforce varies with season and year, reaching the peak value in the Summer of
2017. Averaged over all periods, the workforce (mainline and other facilities) totals
approximately 3,140 persons.
The design and construction of TAPS presented many significant challenges. In fact, TAPS
was given the Outstanding Civil Engineering Achievement (OCEA) award by the American
Society of Civil Engineers (this point underscores the significant difficulties faced and the fact
that design and construction solutions were found) (Thomas 2005). In the intervening 40 years,
many lessons have been learned about the construction and operation of pipelines in the harsh
arctic environment. In principle, this should mean that construction and operations of the new
pipeline should be more efficient and safer.
The Alaska population and infrastructure have changed significantly between 1970 and the
present. Alaska‘s population was approximately 302,000 in 1970 (SSDAN 2011). The
population in 2010 was slightly more than 710,000, 2.4 times greater (U.S. Census Bureau
2011b). And the transportation and other infrastructure of Alaska are more developed now than
in the late 1960s. Fueled by petroleum development (Goldsmith 2009), the Alaskan economy
has grown substantially and petroleum-related tax and other revenues have provided revenues
to improve public health. The above comments are not intended to minimize the impacts of the
proposed Project, rather to provide some rough benchmarks for comparison with Alaska‘s
experience with TAPS.

Alaska Stand Alone Gas Pipeline 5.15-80 Final EIS
Source: Dave Norton, ASAP.
FIGURE 5.15-16 Estimated Construction Employment for the Mainline (Dark Bars) and Other Facilities (Light Bars) for the Proposed Project by Time Period
Thus, the Alaska experience with TAPS might provide some qualitative indication of the types of
impacts that might be expected from construction and operation of the proposed Project. But
there are important quantitative differences in the scale of these two pipelines in both absolute
and relative terms.
5.15.4.1 No Action
Selection of the No Action alternative means that the proposed gas pipeline will not be
constructed and operated. The short- and long-term impacts of the proposed pipeline will not
occur and 500 million standard cubic feet per day (MM scfd) of North Slope natural gas and
natural gas liquids (NGLs) will not be transported and made available to Fairbanks, Anchorage,
and the Cook Inlet Area. The No Action alternative avoids the negative impacts of proposed
2 ,5 0 0
2 0 0
1 ,1 5 0
4 0 0
3 ,2 0 0
8 0 0
5 ,5 0 0
9 0 0
2 ,2 0 0
6 0 0
3 ,8 0 0
4 5 0
2 ,2 0 0
8 5 0
1 0 0 2 5 0
Summ
er 2016
Fall 2016
Win
ter 2
017
Summ
er 2017
Fall 2017
Win
ter 2
018
Summ
er 2018
Fall 2018
Time period
0
1,000
2,000
3,000
4,000
5,000
6,000
Per
sons
Alaska Stand Alone Gas Pipeline 5.15-81 Final EIS
Project construction and operation of ASAP but also foregoes the economic and public health
benefits.
Construction
No Project-related construction impacts will occur if the No Action alternative is selected.
Operations & Maintenance
No Project-related operation and maintenance impacts will occur if the No Action alternative is
selected. As noted previously, this also means that no beneficial health-related (e.g., those
related to the provision of clean natural gas to Fairbanks and other destinations) or
socioeconomic benefits will result.
Cumulative Effects
It is unclear whether or not construction and operation of the proposed Project would impact the
likelihood of other energy related developments in Alaska. According to the ASAP Project Plan
―ASAP is an intrastate Project independent of proposed interstate natural gas pipeline Projects.‖
(AGDC 2011c). Over time there have been several proposed approaches for delivering North
Slope gas to consuming regions in Alaska and elsewhere.6 Although numerous studies have
been done, to date no Project has been implemented. Several statements have been made to
the effect that construction and operation of the proposed Project does not foreclose the
possibility of other gas pipeline Projects going forward. Nonetheless the cumulative effects
section (see 5.20) identifies several possible Projects under consideration.
Whether or not the proposed Project is constructed and operated, there are significant
cumulative effects of other present and proposed oil and gas Projects and state and federal
activities. Cumulative effects are discussed in Section 5.20 and health-related impacts are
discussed in Section 5.15.4.2 below.
5.15.4.2 Proposed Action
This extended section examines the consequences of
the proposed action (building and operating the
proposed Project), including construction, operations
and maintenance, and cumulative effects. The
impacts considered include HECs identified in the
Alaska Toolkit (see above), public input during the
scoping process, and comments received on earlier
drafts of this document.
6 According to one source, natural gas projects for Alaska were studied or proposed as far back as 1960, see
Galbraith (2009) for an excellent history. See also Seaton (2008).

Alaska Stand Alone Gas Pipeline 5.15-82 Final EIS
The construction activities are scheduled to take place over approximately a three year period.
The proposed Project is expected to be in operation for the productive life of the natural gas
field(s) supply. The estimated useful life of the pipeline is the economic life (which is the
controlling factor) and is estimated to extend past the maximum duration of the lease, which is
30 years (AGDC 2011b). Pipeline impacts (positive and negative) would occur during both the
construction and operations phases but (see below) the negative impacts are likely to be greater
during the construction period than the operations period. During the pipeline construction
phase negative effects on HECs are likely to be associated with the Accidents and Injuries HEC.
This is because of the disruptions that are associated with construction and the influx of a
relative large number of workers during this period. The expected large and very positive
impacts on air quality and public health in and around the Fairbanks area associated with the
cumulative effects of the proposed action (see below) likely outweigh the negative short term
impacts.
Relatively few workers are required to
operate and maintain the system and
potentially negative impacts,
discussed below, range from low to
medium. HECs that are judged to
have medium impacts are the
Accidents and Injuries; Food, Nutrition
and Subsistence; Infectious Diseases;
and Social Determinants of Health
HECs and are discussed below.
During the operations phase most of
the impacts are likely to be positive
(e.g., improved air quality in certain
areas resulting from the substitution of
natural gas for other fossil fuels and resulting health benefits to residents of Fairbanks),
substantial, enduring, and of direct benefit to the health of Alaska residents. The construction
impacts then can be likened to an ―investment‖ which provides ―dividends or returns‖ of various
types during the operations phase.
There would be material positive health and economic impacts resulting from operation of the
proposed Project. These result from reduced emissions of fine particulate matter in Fairbanks
(already a non-attainment area for fine particulates) as combustion of natural gas results in
lower emissions rates of fine particulates (and other pollutants) than oil, coal, or wood, which
are presently used in Fairbanks. Providing natural gas to Fairbanks would require the
expansion of the present limited distribution system in Fairbanks. Because this is technically a
separate Project, the impacts are discussed under the subheading Cumulative Effects.
There are details of the proposed Project that have not been fully developed or documented.
What are believed reasonable assumptions are made for this analysis of impacts. The reader
should remember that various lease stipulations have been established (AGDC 2011a). Among
these is 1.4.3.1 ―The Lessee shall submit for approval the following plans, each of which shall
Alaska Stand Alone Gas Pipeline 5.15-83 Final EIS
cover Construction, Operation, Maintenance, and Termination activities.‖ Subheadings under
this address 22 activities. Moreover, Section 1.4.3.2 requires that ―These plans shall provide
sufficient detail and scope to allow the Pipeline Coordinator to determine if they are consistent
with the requirements of this Lease. All applicable State and federal requirements shall be
incorporated into the plans and programs of this Lease.‖ Thus, there is further regulatory review
of life-cycle activities.
Construction
This section addresses the likely impacts associated with the construction of the proposed
Project. These impacts arise from the direct physical effects of construction activities and those
associated with the presence of construction personnel necessary to complete the job over the
three-year construction period.
Conceptual site model It is convenient to use a conceptual site model to address possible impacts of construction and
operation activities of ASAP. According to an ADEC (2005) guidance document:
A conceptual site model (CSM) is a way to describe and evaluate how people, animals, and plants might come in contact with contaminants at a location. It shows the current and possible future spread of contamination in the environment. Developing a CSM is a critical step in evaluating a contaminated site, and must be prepared during the initial stage of the cleanup process, the site characterization phase. The CSM identifies all:
Present and future ways people or animals may be exposed (exposure pathways),
Routes the contaminants may take as they move through soil, groundwater, and/or
Surface water, (migration routes), and
Possible types of people who could be exposed (potential receptors) for further analysis at a site.
More generally, a CSM is a written and/or pictorial representation of an environmental system
and the various processes that determine the transport and fate of contaminants through
various environmental media to environmental receptors and their most likely exposure modes.
Environmental media could include air, surface and groundwater, subsurface area (vadose zone) soil, sediment, and food chain.
Components of a CSM include:
o sources of contaminants,
o pathways of environmental transport,
o identification of proposed barriers (countermeasures) and
o pathways to ecological and human receptors.
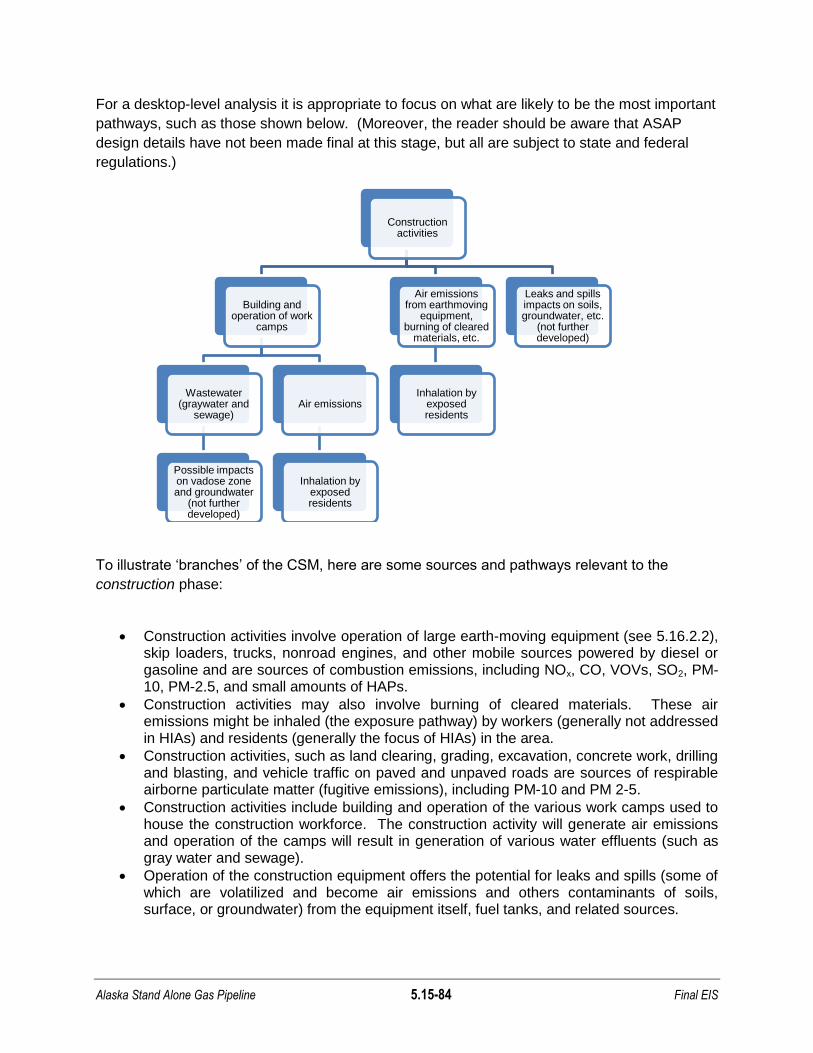
Alaska Stand Alone Gas Pipeline 5.15-84 Final EIS
For a desktop-level analysis it is appropriate to focus on what are likely to be the most important
pathways, such as those shown below. (Moreover, the reader should be aware that ASAP
design details have not been made final at this stage, but all are subject to state and federal
regulations.)
To illustrate ‗branches‘ of the CSM, here are some sources and pathways relevant to the
construction phase:
Construction activities involve operation of large earth-moving equipment (see 5.16.2.2), skip loaders, trucks, nonroad engines, and other mobile sources powered by diesel or gasoline and are sources of combustion emissions, including NOx, CO, VOVs, SO2, PM-10, PM-2.5, and small amounts of HAPs.
Construction activities may also involve burning of cleared materials. These air emissions might be inhaled (the exposure pathway) by workers (generally not addressed in HIAs) and residents (generally the focus of HIAs) in the area.
Construction activities, such as land clearing, grading, excavation, concrete work, drilling and blasting, and vehicle traffic on paved and unpaved roads are sources of respirable airborne particulate matter (fugitive emissions), including PM-10 and PM 2-5.
Construction activities include building and operation of the various work camps used to house the construction workforce. The construction activity will generate air emissions and operation of the camps will result in generation of various water effluents (such as gray water and sewage).
Operation of the construction equipment offers the potential for leaks and spills (some of which are volatilized and become air emissions and others contaminants of soils, surface, or groundwater) from the equipment itself, fuel tanks, and related sources.
Construction activities
Building and operation of work
camps
Wastewater (graywater and
sewage)
Possible impacts on vadose zone and groundwater
(not further developed)
Air emissions
Inhalation by exposed residents
Air emissions from earthmoving
equipment, burning of cleared
materials, etc.
Inhalation by exposed residents
Leaks and spills impacts on soils, groundwater, etc.
(not further developed)

Alaska Stand Alone Gas Pipeline 5.15-85 Final EIS
Each of these branches terminates with a possible human exposure pathway (inhalation, dermal
contact, ingestion). And each of the exposure pathways are subject to various engineering and
work practice controls.
For example, leaks and spills from construction equipment (see POD 7.11.2) would be subject
to a Spill Prevention and Control Plan (SPCP):
The SPCP should include:
Performance of maintenance, including refueling, of construction vehicles to prevent spills
Storage of fuels and other hazardous materials containment requirements
Identify individuals responsible for implementing the SPCP
Define measures for storage and disposal of each kind of waste
Specify spill response and cleanup procedures
Describe spill response equipment to be used, including personal protective equipment
Reporting requirements
Periodic inspection and documentation requirements
The SPCP will be developed in accordance with all pertinent regulations and will follow BMPs. It will address specific requirements, such as:
o Refueling of vehicles will not be performed within 100 feet of a wetland, stream, or other water body.
o Fuel storage areas will be lined and bermed to contain 110 percent of the volume of fuel stored.
o Vehicle maintenance trucks will contain small spill response kits. o Drip trays will be used under vehicles when parked to capture fuel, oil,
and grease from vehicle leaks. o All personnel will be trained in the notification and spill response
requirements of the SPCP. o Personnel will be trained in proper use of freeze depressant during
hydrostatic testing.
A Spill Prevention and Control and Countermeasure Plan (SPCC) must be developed for each storage facility (e.g., tank) with a capacity to store in excess of 1,320 gallons of fuel. SPCCs are preventative measures to assure that a spill is contained and countermeasures are established to prevent petroleum spills from reaching navigable waters. The SPCC must be maintained on site.
As a second example (see POD 7.11.1) relates to waste handling:
Proper waste management is necessary to provide for human safety and environmental protection. A Comprehensive Waste Management Plan will be developed and followed so that hazardous and nonhazardous wastes generated by ASAP construction activities are minimized, identified, handled, stored,

Alaska Stand Alone Gas Pipeline 5.15-86 Final EIS
transported, and disposed of in a safe and environmentally responsible manner, and in full compliance with applicable state, federal, and local laws and regulations.
Each worker, contractor, and vendor working on ASAP is individually responsible for performing daily work tasks in a manner that conserves resources, limits impacts to the environment, and minimizes the generation of wastes. Details of how wastes are to be handled will be provided in the Comprehensive Waste Management Plan, including the following:
Waste accumulation areas, including satellite accumulation areas, central accumulation areas,
recyclable accumulation areas, and universal waste accumulation areas
Management of recyclable metals, burnable wastes, and oily wastes
Waste transport and disposal, including sampling (as necessary), profiling, and manifesting
Wastewater treatment, including disposal of domestic wastewater and hydrostatic testing water
Municipal waste treatment
Waste fluid handling, including fuels and lubricants for equipment
It is anticipated that, where possible, materials will be reused or recycled. Burnable and oily wastes may be burned for heat recovery and to reduce waste volume. Domestic wastewater from camps and hydrostatic testing water will be treated and discharged in accordance with applicable permit stipulations, where possible. Hazardous and toxic wastes will be accumulated and transported offsite for appropriate disposal at a licensed disposal facility. Other wastes will likely be disposed of in an appropriate landfill.
Waste disposal sites, including landfills, or monofills may be permitted for this Project; however, requirements and potential locations have not yet been identified.
Finally a CSM needs to address the exposed population. (It is worth noting here that most of
the area in the vicinity of the ASAP footprint is sparsely populated.)
Water and Sanitation
Water and sanitation need to be considered in terms of operation of the 14 stationary
construction camps (see Plan of Development [POD] Section 7.2.3). Potentially relevant
impacts include those related to:
Change in potable water access;
Change in water quantity;
Change in water quality; and
Change in demand on water and sanitation infrastructure due to the influx of non-
resident workers.

Alaska Stand Alone Gas Pipeline 5.15-87 Final EIS
As described under the subheading Exposure to Hazardous Materials (following), construction
of the proposed Project should not materially increase exposure of the PACs to toxic and
hazardous substances. Therefore, effects on water quality due to the use of hazardous
materials in the proposed Project are not anticipated. As noted above, Under the
Comprehensive Waste Management Plan (CWMP), which would be developed for the proposed
Project, solid waste would be reused, recycled, burned, or disposed of in accordance with
applicable regulations. In addition, domestic wastewater produced from work camps would be
treated and discharged in accordance with applicable permits. Construction of the proposed
Project would therefore have negligible effects on water quality.
The proposed Project is estimated to require a total of approximately 1,088 million gallons of
surface water (see Table 7.4-5 of the POD) for construction activities and hydrotesting7, with
additional water required for horizontal directional drilling (HDD). The AGDC has not yet
determined from which surface water bodies it would obtain the necessary water supplies so it
is not possible to examine impacts in detail. However, the AGDC would need to obtain (and
comply with provisions of) the necessary permits prior to water withdrawal, thereby minimizing
any potential adverse effects to potable water supplies.
Work (construction) camps would require food service, drinking water, wastewater treatment,
and solid waste management. The AGDC would need to obtain the necessary permits and
comply with relevant regulations (e.g. 40 CFR 122; 18 AAC 31.020; 18 AAC 72.010, 200, and
215; AAC 80.200; 18 AAC 60 and others, see POD pp. 22-30), and would manage waste
according to the CWMP.8 Therefore, an increased demand on water and sanitation
infrastructure due to the work camps would be managed and mitigated according to the CWMP,
permits obtained from the Alaska Department of Environmental Conservation (ADEC), and
contracts with local service providers.
As described above, it is estimated that approximately 6,400 workers would be required (peak
value) to construct the proposed pipeline. The majority of these construction workers would be
housed in the 15 work camps. In the areas where construction workers would be required to
provide their own housing, such as the construction of the final 29 miles of the proposed Project,
the construction of the natural gas liquids extraction plant (NGLEP) facility, and construction of
the Fairbanks Lateral, it is expected that construction workers would reside in the numerous
motels, RV parks, and other short-term lodging facilities available in the greater Wasilla and
Fairbanks areas.
Approximately 545 construction employees would reside in local lodging in Wasilla during the
construction of the final 29 miles of mainline construction, while an additional 100 construction
workers would reside in the community due to construction of the NGLEP. Further, a maximum
of 800 construction workers would reside in Fairbanks during construction of the Fairbanks
7 Upon completion of construction activities, water will be needed for hydrostatic testing, to confirm that the pipeline
meets design criteria and is leak-free. 8 Additionally, the ADEC publishes guidance documents on best management practices for temporary camps, which
contain useful information (ADEC 2011a).

Alaska Stand Alone Gas Pipeline 5.15-88 Final EIS
Lateral. As described under the Affected Environment subheading, water and sewer systems
are operated by private companies in the City of Fairbanks. The City of Wasilla operates a
sewer and piped water system; however, the majority of households use individual wells and
septic systems.
Scoring
Scores shown below are developed using the risk assessment matrix given in Tables 5.15-3
and 5.15-4. Scoring is based on the following judgments:
Health effect score: Low, 0 unlikely to be perceptible;
Duration: High, 2, medium-term, 2.5 years;
Magnitude: Low, 0, minor intensity;
Extent: Low, 0, limited to individual cases;
Severity rating equals sum of scores: 2;
Likelihood rating: Very unlikely 1 – 10 percent; and
Impact rating from Table 5.15-4 = low (-).
In summary, the negative impact of the construction phase of the proposed Project
within the Water and Sanitation HEC is estimated to be low.
Accidents and Injuries
Construction of the proposed Project has the potential to affect the Accidents and Injuries and
Health Infrastructure and Delivery health effect categories (HECs) if it caused the following to
occur:
Change in unintentional injury (e.g., drowning, falls, snow machine, ATV injury) rates;
Change in roadway incidents and injuries: This is addressed below relative to possible
injuries related to operation of trucks and buses associated with construction activities;
and
Changes to safety during subsistence activities: There are no data to support the
hypothesis that safety of participants engaged in subsistence activities would be
positively or negatively impacted9.
9 Snowmachine and ATV accidents are a common occurrence in areas where subsistence users harvest resources
(see Table 5.15-25). Alteration of access routes to subsistence areas might impact accident rates in the event that required harvest trip distances were substantially increased. The average annual number of ATV/snomachine fatalities in the potentially affected Boroughs/CAs was 9.33 persons over the years 2007-2009 (ABVS, 2012) If average trip distances were to increase by 10% for example, and all ATV/snowmachine trips were for harvesting purposes, then the average incremental number of fatalities would be less than one person per year.

Alaska Stand Alone Gas Pipeline 5.15-89 Final EIS
Construction of the proposed gas pipeline would result in the possibility of accidents and injuries
(fatal and nonfatal). Accidents/injuries could occur to two populations: those who construct (and
later operate) the proposed Project (occupational injuries) and the general population (non-
occupational injuries). It is conventional practice to address only non-occupational health
effects in an HIA. However, occupational injuries (fatal and nonfatal) are considered here
because these could place demands on existing health care facilities (see next section) and,
moreover, some data (such as for highway fatalities) do not distinguish between those
occupationally injured and ‗bystanders.‘ These are addressed separately in this analysis.
Occupational injuries include those for proposed Project construction workers and those for
workers that support the construction activity, such as those that could occur to employees of
the ARR or trucking companies, who transport pipe sections from Seward to Fairbanks and later
from Fairbanks to storage locations.
Direct Construction Workers
One basis for estimating construction worker fatalities is to scale this from experience with
TAPS. Because the construction period for TAPS was longer than that Projected for the
proposed Project and the number of workers expected to be employed by the proposed Project
is fewer than that for TAPS, such an estimate is likely to overstate possible fatalities. Moreover,
it is likely that some of the lessons learned in TAPS and other construction activities would
make fatality rates lower.
According to the Alyeska Factbook (2009) there were a total of 32 fatalities directly related to
TAPS construction activities (including employees of Alyeska, contractors and subcontractors,
but excluding those employed by common carriers). As noted previously, the peak TAPS
employment was 28,072, whereas the peak proposed Project construction employment is
estimated to be 6,400. Thus, an order of magnitude estimate of possible construction fatalities
would be 32 x (6,400/28,072) ≈ 7.3 persons. This calculation does not take into account the
longer construction period for TAPS (hence greater exposure duration) or any possible
improvements in safety performance since TAPS was completed in 1977. As a check on this
estimate, Schnitzer and Bender (1992) estimated the fatality rate for construction workers in
Alaska over the period 1980 to 1985 and estimated a fatality rate of 49.1 per 100,000 workers
per year. The corresponding estimate for the proposed Project would be a maximum of
49.1/100,000 workers annually x 6,400 workers x 2.5 years or ≈ 7.9 workers, which is virtually
identical with the above estimate.
Husberg et al. (2005) from the National Institute for Occupational Safety and Health (NIOSH)
analyzed data from the Alaska Trauma Registry on hospitalized nonfatal injuries to Alaska
construction workers over the period from 1991-1999. On average over this period the injury
rate was 0.39 injuries/100 workers annually. Assuming this rate is representative, an upper
bound to the estimated injury rate for the proposed Project construction workers would be 6,400
workers (peak) x 2.5 years (construction period) x 0.39/100 workers ≈ 62 hospitalized injuries.
This probably overstates the expected number because the peak labor force is used rather than
an average.
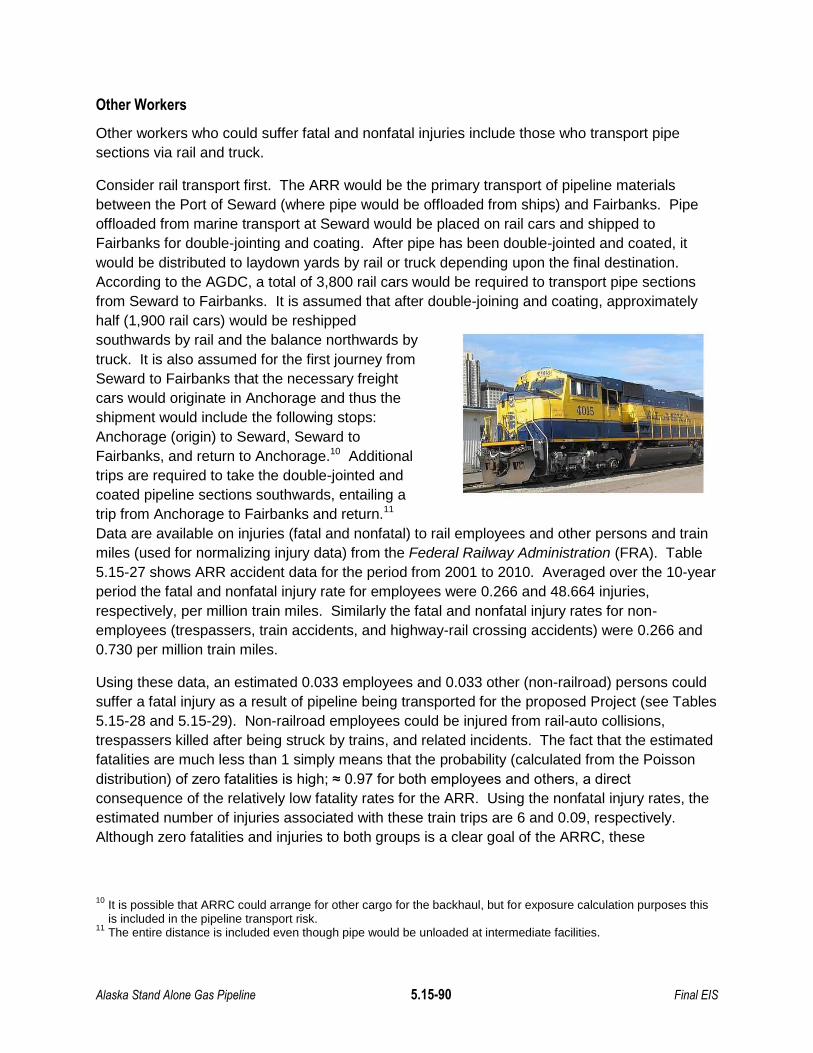
Alaska Stand Alone Gas Pipeline 5.15-90 Final EIS
Other Workers
Other workers who could suffer fatal and nonfatal injuries include those who transport pipe
sections via rail and truck.
Consider rail transport first. The ARR would be the primary transport of pipeline materials
between the Port of Seward (where pipe would be offloaded from ships) and Fairbanks. Pipe
offloaded from marine transport at Seward would be placed on rail cars and shipped to
Fairbanks for double-jointing and coating. After pipe has been double-jointed and coated, it
would be distributed to laydown yards by rail or truck depending upon the final destination.
According to the AGDC, a total of 3,800 rail cars would be required to transport pipe sections
from Seward to Fairbanks. It is assumed that after double-joining and coating, approximately
half (1,900 rail cars) would be reshipped
southwards by rail and the balance northwards by
truck. It is also assumed for the first journey from
Seward to Fairbanks that the necessary freight
cars would originate in Anchorage and thus the
shipment would include the following stops:
Anchorage (origin) to Seward, Seward to
Fairbanks, and return to Anchorage.10 Additional
trips are required to take the double-jointed and
coated pipeline sections southwards, entailing a
trip from Anchorage to Fairbanks and return.11
Data are available on injuries (fatal and nonfatal) to rail employees and other persons and train
miles (used for normalizing injury data) from the Federal Railway Administration (FRA). Table
5.15-27 shows ARR accident data for the period from 2001 to 2010. Averaged over the 10-year
period the fatal and nonfatal injury rate for employees were 0.266 and 48.664 injuries,
respectively, per million train miles. Similarly the fatal and nonfatal injury rates for non-
employees (trespassers, train accidents, and highway-rail crossing accidents) were 0.266 and
0.730 per million train miles.
Using these data, an estimated 0.033 employees and 0.033 other (non-railroad) persons could
suffer a fatal injury as a result of pipeline being transported for the proposed Project (see Tables
5.15-28 and 5.15-29). Non-railroad employees could be injured from rail-auto collisions,
trespassers killed after being struck by trains, and related incidents. The fact that the estimated
fatalities are much less than 1 simply means that the probability (calculated from the Poisson
distribution) of zero fatalities is high; ≈ 0.97 for both employees and others, a direct
consequence of the relatively low fatality rates for the ARR. Using the nonfatal injury rates, the
estimated number of injuries associated with these train trips are 6 and 0.09, respectively.
Although zero fatalities and injuries to both groups is a clear goal of the ARRC, these
10
It is possible that ARRC could arrange for other cargo for the backhaul, but for exposure calculation purposes this is included in the pipeline transport risk.
11 The entire distance is included even though pipe would be unloaded at intermediate facilities.
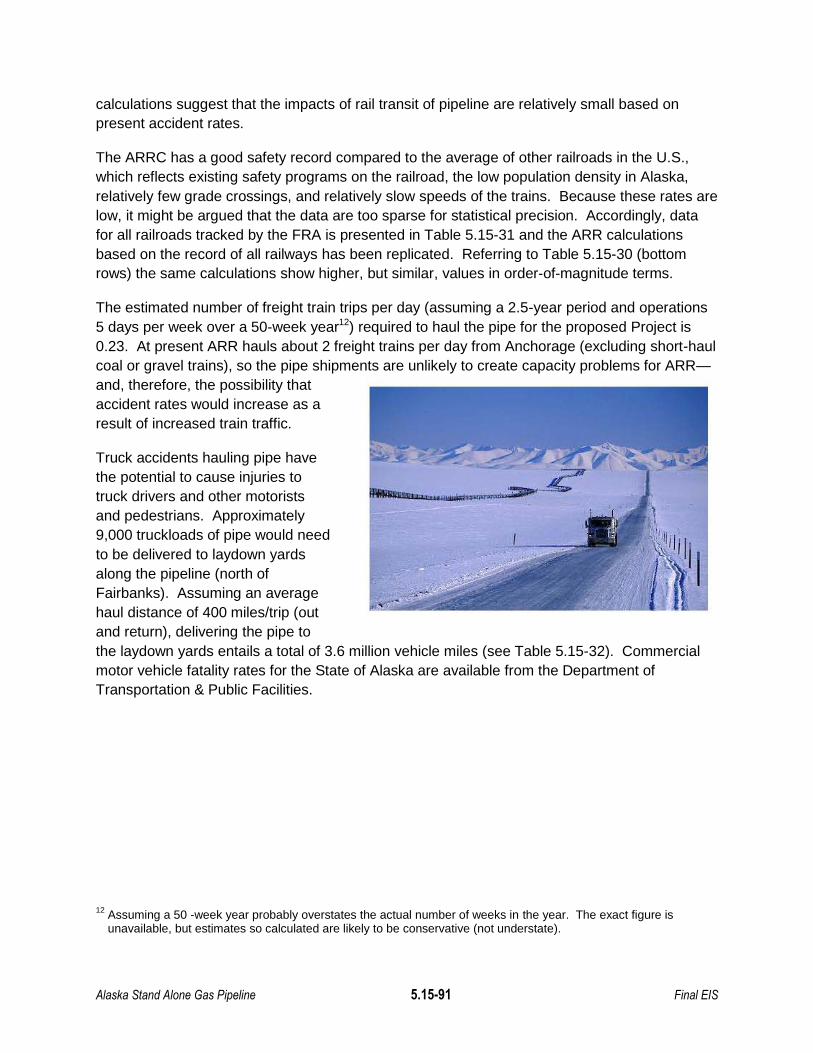
Alaska Stand Alone Gas Pipeline 5.15-91 Final EIS
calculations suggest that the impacts of rail transit of pipeline are relatively small based on
present accident rates.
The ARRC has a good safety record compared to the average of other railroads in the U.S.,
which reflects existing safety programs on the railroad, the low population density in Alaska,
relatively few grade crossings, and relatively slow speeds of the trains. Because these rates are
low, it might be argued that the data are too sparse for statistical precision. Accordingly, data
for all railroads tracked by the FRA is presented in Table 5.15-31 and the ARR calculations
based on the record of all railways has been replicated. Referring to Table 5.15-30 (bottom
rows) the same calculations show higher, but similar, values in order-of-magnitude terms.
The estimated number of freight train trips per day (assuming a 2.5-year period and operations
5 days per week over a 50-week year12) required to haul the pipe for the proposed Project is
0.23. At present ARR hauls about 2 freight trains per day from Anchorage (excluding short-haul
coal or gravel trains), so the pipe shipments are unlikely to create capacity problems for ARR—
and, therefore, the possibility that
accident rates would increase as a
result of increased train traffic.
Truck accidents hauling pipe have
the potential to cause injuries to
truck drivers and other motorists
and pedestrians. Approximately
9,000 truckloads of pipe would need
to be delivered to laydown yards
along the pipeline (north of
Fairbanks). Assuming an average
haul distance of 400 miles/trip (out
and return), delivering the pipe to
the laydown yards entails a total of 3.6 million vehicle miles (see Table 5.15-32). Commercial
motor vehicle fatality rates for the State of Alaska are available from the Department of
Transportation & Public Facilities.
12
Assuming a 50 -week year probably overstates the actual number of weeks in the year. The exact figure is unavailable, but estimates so calculated are likely to be conservative (not understate).

Alaska S
tand Alone G
as Pipeline
5.15-92
F
inal EIS
TABLE 5.15-27 Annual Accident Data for Alaska Railroad Road Corporation, 2001-2010
Category 2001 2002 2003 2004 2005 2006 2007 2008 2009 2010
10-year
Average
Employees on duty:
Deaths 0 0 0 0 0 0 0 0 0 0 0.000
Injuries 49 28 26 28 29 22 30 40 35 32 31.900
Employees, other accidentsa
Deaths 0 0 0 0 1 0 0 1 2 0 0.400
Injuries 56 27 28 28 29 23 31 73 81 38 41.400
Subtotal - Railroad employees
Deaths 0 0 0 0 1 0 0 1 2 0 0.400
Injuries 105 55 54 56 58 45 61 113 116 70 73.300
Trespasser (not located at highway-rail crossings)
Deaths 0 0 0 0 1 0 0 0 2 0 0.300
Injuries 1 0 1 0 0 0 1 0 0 1 0.400
Train accidents
Deaths 0 0 0 0 0 0 0 0 0 0 0.000
Injuries 0 2 0 0 0 0 0 0 0 1 0.300
Highway-rail crossing accidents
Deaths 0 0 0 0 0 0 0 0 1 0 0.100
Injuries 1 1 1 0 0 0 0 0 0 1 0.400
Subtotal - non-railroad employees
Deaths 0 0 0 0 1 0 0 0 3 0 0.400
Injuries 2 3 2 0 0 0 1 0 0 3 1.100
Total train miles 1,423,898 1,444,912 1,575,403 1,629,170 1,738,641 1,528,291 1,512,545 1,433,823 1,418,848 1,357,035 1,506,257
Employee death rateb 0.0 0.0 0.0 0.0 0.6 0.0 0.0 0.7 1.4 0.0 0.266
Employee injury rateb 73.7 38.1 34.3 34.4 33.4 29.4 40.3 78.8 81.8 51.6 48.664
Non-employee death rateb 0.0 0.0 0.0 0.0 0.6 0.0 0.0 0.0 2.1 0.0 0.266
Non-employee injury rateb 1.4 2.1 1.3 0.0 0.0 0.0 0.7 0.0 0.0 2.2 0.730
a Other accidents/incidents are events other than train accidents or crossing incidents that cause physical harm to persons b Rates are incidents per million train miles per year.
Source: Federal Railroad Administration 2011
.
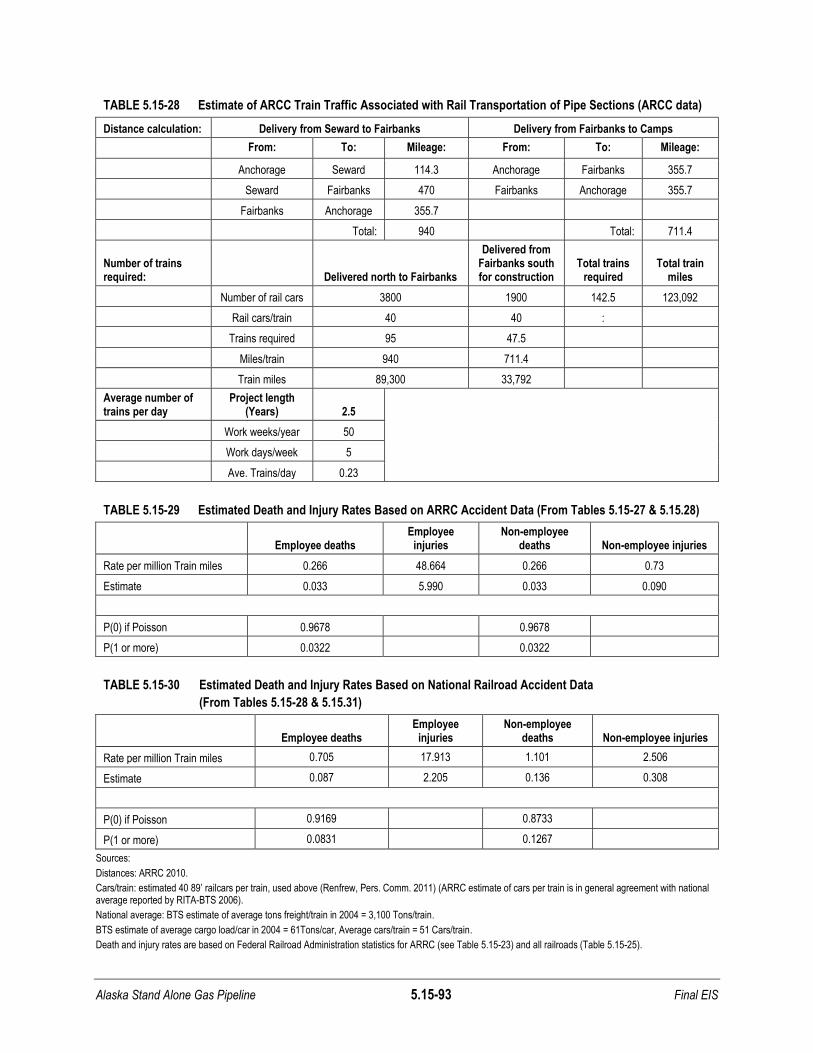
Alaska Stand Alone Gas Pipeline 5.15-93 Final EIS
TABLE 5.15-28 Estimate of ARCC Train Traffic Associated with Rail Transportation of Pipe Sections (ARCC data)
Distance calculation: Delivery from Seward to Fairbanks Delivery from Fairbanks to Camps
From: To: Mileage: From: To: Mileage:
Anchorage Seward 114.3 Anchorage Fairbanks 355.7
Seward Fairbanks 470 Fairbanks Anchorage 355.7
Fairbanks Anchorage 355.7
Total: 940
Total: 711.4
Number of trains required:
Delivered north to Fairbanks
Delivered from Fairbanks south for construction
Total trains required
Total train miles
Number of rail cars 3800 1900 142.5 123,092
Rail cars/train 40 40 :
Trains required 95 47.5
Miles/train 940 711.4
Train miles 89,300 33,792
Average number of trains per day
Project length (Years) 2.5
Work weeks/year 50
Work days/week 5
Ave. Trains/day 0.23
TABLE 5.15-29 Estimated Death and Injury Rates Based on ARRC Accident Data (From Tables 5.15-27 & 5.15.28)
Employee deaths
Employee injuries
Non-employee deaths Non-employee injuries
Rate per million Train miles 0.266 48.664 0.266 0.73
Estimate 0.033 5.990 0.033 0.090
P(0) if Poisson 0.9678
0.9678
P(1 or more) 0.0322
0.0322
TABLE 5.15-30 Estimated Death and Injury Rates Based on National Railroad Accident Data
(From Tables 5.15-28 & 5.15.31)
Employee deaths
Employee injuries
Non-employee deaths Non-employee injuries
Rate per million Train miles 0.705 17.913 1.101 2.506
Estimate 0.087 2.205 0.136 0.308
P(0) if Poisson 0.9169
0.8733
P(1 or more) 0.0831
0.1267
Sources:
Distances: ARRC 2010.
Cars/train: estimated 40 89’ railcars per train, used above (Renfrew, Pers. Comm. 2011) (ARRC estimate of cars per train is in general agreement with national average reported by RITA-BTS 2006).
National average: BTS estimate of average tons freight/train in 2004 = 3,100 Tons/train.
BTS estimate of average cargo load/car in 2004 = 61Tons/car, Average cars/train = 51 Cars/train.
Death and injury rates are based on Federal Railroad Administration statistics for ARRC (see Table 5.15-23) and all railroads (Table 5.15-25).

Alaska S
tand Alone G
as Pipeline
5.15-94
F
inal EIS
TABLE 5.15-31 Annual Accident Data for All Federal Railroad Administration Railroads, 2001-2010
Category 2001 2002 2003 2004 2005 2006 2007 2008 2009 2010 10-year
Average
Employees on duty:
Deaths 22 20 19 25 25 16 17 25 16 20 20.500
Injuries 7,648 6,524 6,076 5,769 5,535 4,999 5,222 4,722 4,253 4,190 5,493.800
Employees, other accidentsa
Deaths 544 579 527 507 492 528 503 486 444 462 507.200
Injuries 9,518 8,220 7,997 7,754 7,710 7,505 8,274 7,713 7,111 7,297 7,909.900
Subtotal - Railroad employees
Deaths 566 599 546 532 517 544 520 511 460 482 527.700
Injuries 17,166 14,744 14,073 13,523 13,245 12,504 13,496 12,435 11,364 11,487 13,403.700
Trespasser (not located at highway-rail crossings)
Deaths 511 540 498 472 458 511 470 457 417 435 476.900
Injuries 404 395 398 406 420 481 407 433 345 388 407.700
Train accidents
Deaths 6 15 4 13 33 6 9 27 4 8 12.500
Injuries 310 1,884 232 346 787 220 309 324 120 102 463.400
Highway-rail crossing accidents
Deaths 421 357 334 371 359 369 339 290 247 257 334.400
Injuries 1,157 999 1,035 1,094 1,053 1,070 1,058 990 741 847 1,004.400
Subtotal - non-railroad employees
Deaths 938 912 836 856 850 886 818 774 668 700 823.800
Injuries 1,871 3,278 1,665 1,846 2,260 1,771 1,774 1,747 1,206 1,337 1,875.500
Total train miles 711,549,906 728,674,146 743,330,718 770,152,268 789,033,596 809,222,612 789,173,803 769,640,705 663,638,682 708,258,563 748,267,500
Employee death rateb 0.8 0.8 0.7 0.7 0.7 0.7 0.7 0.7 0.7 0.7 0.705
Employee injury rateb 24.1 20.2 18.9 17.6 16.8 15.5 17.1 16.2 17.1 16.2 17.913
Non-employee death rateb 1.3 1.3 1.1 1.1 1.1 1.1 1.0 1.0 1.0 1.0 1.101
Non-employee injury rateb 2.6 4.5 2.2 2.4 2.9 2.2 2.2 2.3 1.8 1.9 2.506
a Other accidents/incidents are events other than train accidents or crossing incidents that cause physical harm to persons
b Rates are incidents per million train miles per year.
Source: Federal Railroad Administration 2011.
.
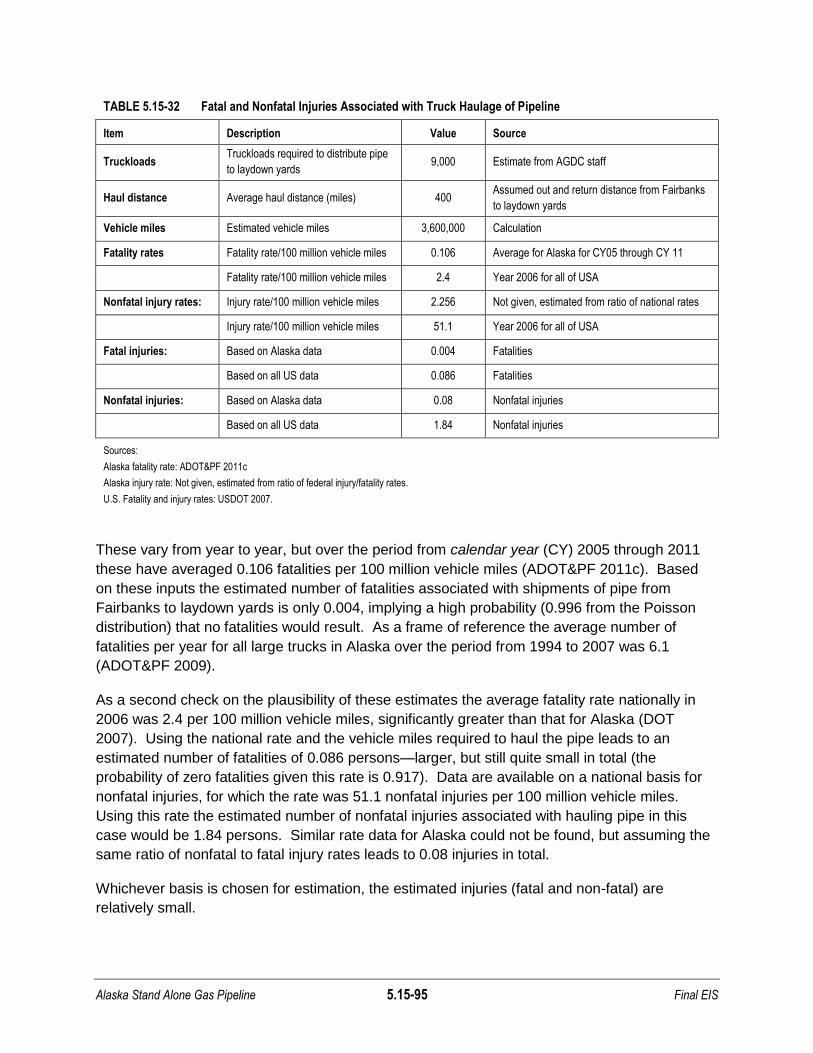
Alaska Stand Alone Gas Pipeline 5.15-95 Final EIS
TABLE 5.15-32 Fatal and Nonfatal Injuries Associated with Truck Haulage of Pipeline
Item Description Value Source
Truckloads Truckloads required to distribute pipe
to laydown yards 9,000 Estimate from AGDC staff
Haul distance Average haul distance (miles) 400 Assumed out and return distance from Fairbanks
to laydown yards
Vehicle miles Estimated vehicle miles 3,600,000 Calculation
Fatality rates Fatality rate/100 million vehicle miles 0.106 Average for Alaska for CY05 through CY 11
Fatality rate/100 million vehicle miles 2.4 Year 2006 for all of USA
Nonfatal injury rates: Injury rate/100 million vehicle miles 2.256 Not given, estimated from ratio of national rates
Injury rate/100 million vehicle miles 51.1 Year 2006 for all of USA
Fatal injuries: Based on Alaska data 0.004 Fatalities
Based on all US data 0.086 Fatalities
Nonfatal injuries: Based on Alaska data 0.08 Nonfatal injuries
Based on all US data 1.84 Nonfatal injuries
Sources:
Alaska fatality rate: ADOT&PF 2011c
Alaska injury rate: Not given, estimated from ratio of federal injury/fatality rates.
U.S. Fatality and injury rates: USDOT 2007.
These vary from year to year, but over the period from calendar year (CY) 2005 through 2011
these have averaged 0.106 fatalities per 100 million vehicle miles (ADOT&PF 2011c). Based
on these inputs the estimated number of fatalities associated with shipments of pipe from
Fairbanks to laydown yards is only 0.004, implying a high probability (0.996 from the Poisson
distribution) that no fatalities would result. As a frame of reference the average number of
fatalities per year for all large trucks in Alaska over the period from 1994 to 2007 was 6.1
(ADOT&PF 2009).
As a second check on the plausibility of these estimates the average fatality rate nationally in
2006 was 2.4 per 100 million vehicle miles, significantly greater than that for Alaska (DOT
2007). Using the national rate and the vehicle miles required to haul the pipe leads to an
estimated number of fatalities of 0.086 persons—larger, but still quite small in total (the
probability of zero fatalities given this rate is 0.917). Data are available on a national basis for
nonfatal injuries, for which the rate was 51.1 nonfatal injuries per 100 million vehicle miles.
Using this rate the estimated number of nonfatal injuries associated with hauling pipe in this
case would be 1.84 persons. Similar rate data for Alaska could not be found, but assuming the
same ratio of nonfatal to fatal injury rates leads to 0.08 injuries in total.
Whichever basis is chosen for estimation, the estimated injuries (fatal and non-fatal) are
relatively small.

Alaska Stand Alone Gas Pipeline 5.15-96 Final EIS
Other components of the proposed Project need to be transported. For example, elements of
the gas conditioning facility (GCF) need to be transported to the North Slope. According to the
POD:
Module sections of the GCF will be transported to the facility site via barge to West
Dock, then transported on existing roads and assembled on site. A barge lift of nine
barges is expected to be required. No modification to the existing West Dock
infrastructure will be required. Additional details regarding the size and
assembly/construction of the GCF will be developed as the Project progresses.
Injuries from seaborne transit are not addressed in this document. The haul distance from West
Dock to the site is so short that no calculation is made.
Workers will be transported to work camps using
a mixture of aircraft and bus transportation, the
exact mix to be determined. In the following, it is
assumed that all bus transportation is used.
Table 5.15-33 contains estimates of the number of
fatalities and injuries associated with bussing
construction workers to work camps. This
calculation as well indicates that there are likely to
be relatively few fatalities (0.003) and nonfatal
injuries (0.15) associated with bus transportation.
TABLE 5.15-33 Fatal and Nonfatal Injuries Associated with Transporting Construction Workers to and
from Work Camps
Item Description Value Source
Number of workers to be
transported weekly Peak workers 6,400 Estimate from AGDC staff
Average occupancy Persons per bus 30 Estimate
Number of buses Buses per week 213 Calculation
Weeks per year 50 Weeks
Construction duration 2.5 Years
Bus trips required 53,333 Assumes 2 trips required per worker per week (out and back)
Miles per trip 400 Assuming 200 mile distance and 2 ―out and back‖ trips.
Total distance Vehicle miles 21,333,333 Calculation
Alaska commercial vehicle
fatality rate
Fatalities per 100 million
vehicle miles 0.016 Average for Alaska for CY05 through CY 09
Alaska Injury rate Non-fatal injuries per 100
million vehicle miles 0.712 Average for Alaska for CY 05 through CY09
Estimated total fatalities 0.003 Calculation
Estimated total injuries 0.15 Calculation
Source: Jeffers Pers. Comm. 2011.
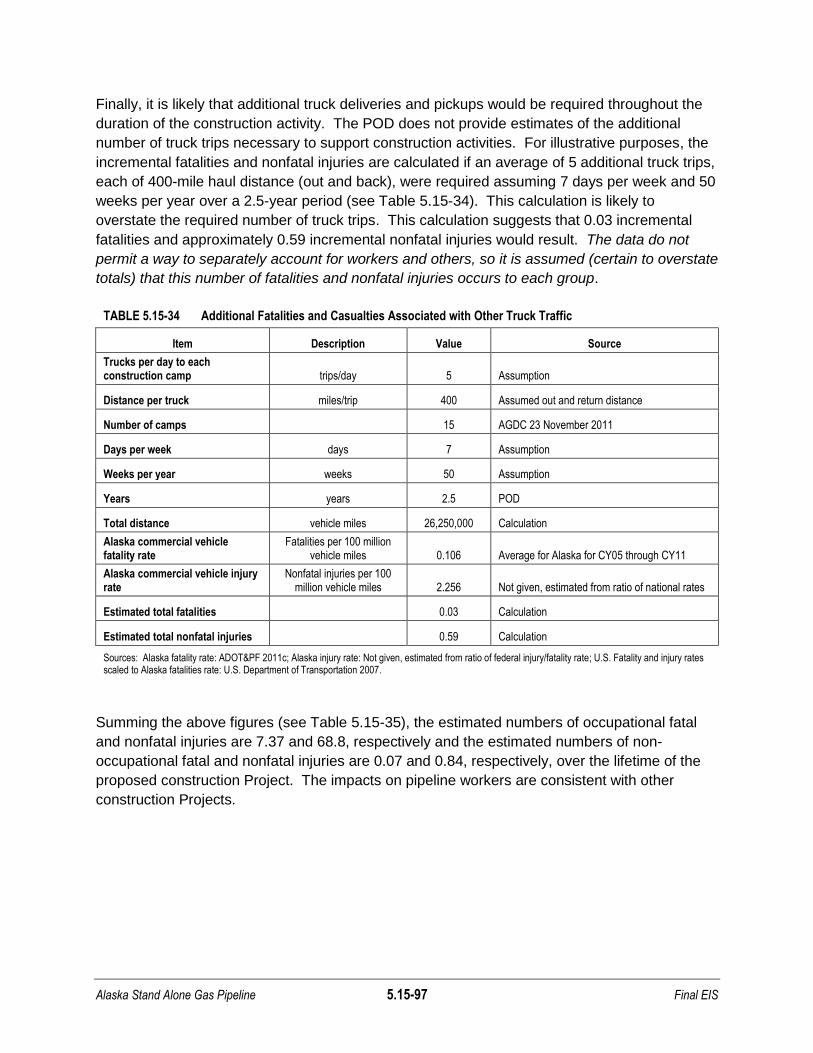
Alaska Stand Alone Gas Pipeline 5.15-97 Final EIS
Finally, it is likely that additional truck deliveries and pickups would be required throughout the
duration of the construction activity. The POD does not provide estimates of the additional
number of truck trips necessary to support construction activities. For illustrative purposes, the
incremental fatalities and nonfatal injuries are calculated if an average of 5 additional truck trips,
each of 400-mile haul distance (out and back), were required assuming 7 days per week and 50
weeks per year over a 2.5-year period (see Table 5.15-34). This calculation is likely to
overstate the required number of truck trips. This calculation suggests that 0.03 incremental
fatalities and approximately 0.59 incremental nonfatal injuries would result. The data do not
permit a way to separately account for workers and others, so it is assumed (certain to overstate
totals) that this number of fatalities and nonfatal injuries occurs to each group.
TABLE 5.15-34 Additional Fatalities and Casualties Associated with Other Truck Traffic
Item Description Value Source
Trucks per day to each construction camp trips/day 5 Assumption
Distance per truck miles/trip 400 Assumed out and return distance
Number of camps
15 AGDC 23 November 2011
Days per week days 7 Assumption
Weeks per year weeks 50 Assumption
Years years 2.5 POD
Total distance vehicle miles 26,250,000 Calculation
Alaska commercial vehicle fatality rate
Fatalities per 100 million vehicle miles 0.106 Average for Alaska for CY05 through CY11
Alaska commercial vehicle injury rate
Nonfatal injuries per 100 million vehicle miles 2.256 Not given, estimated from ratio of national rates
Estimated total fatalities
0.03 Calculation
Estimated total nonfatal injuries
0.59 Calculation
Sources: Alaska fatality rate: ADOT&PF 2011c; Alaska injury rate: Not given, estimated from ratio of federal injury/fatality rate; U.S. Fatality and injury rates scaled to Alaska fatalities rate: U.S. Department of Transportation 2007.
Summing the above figures (see Table 5.15-35), the estimated numbers of occupational fatal
and nonfatal injuries are 7.37 and 68.8, respectively and the estimated numbers of non-
occupational fatal and nonfatal injuries are 0.07 and 0.84, respectively, over the lifetime of the
proposed construction Project. The impacts on pipeline workers are consistent with other
construction Projects.
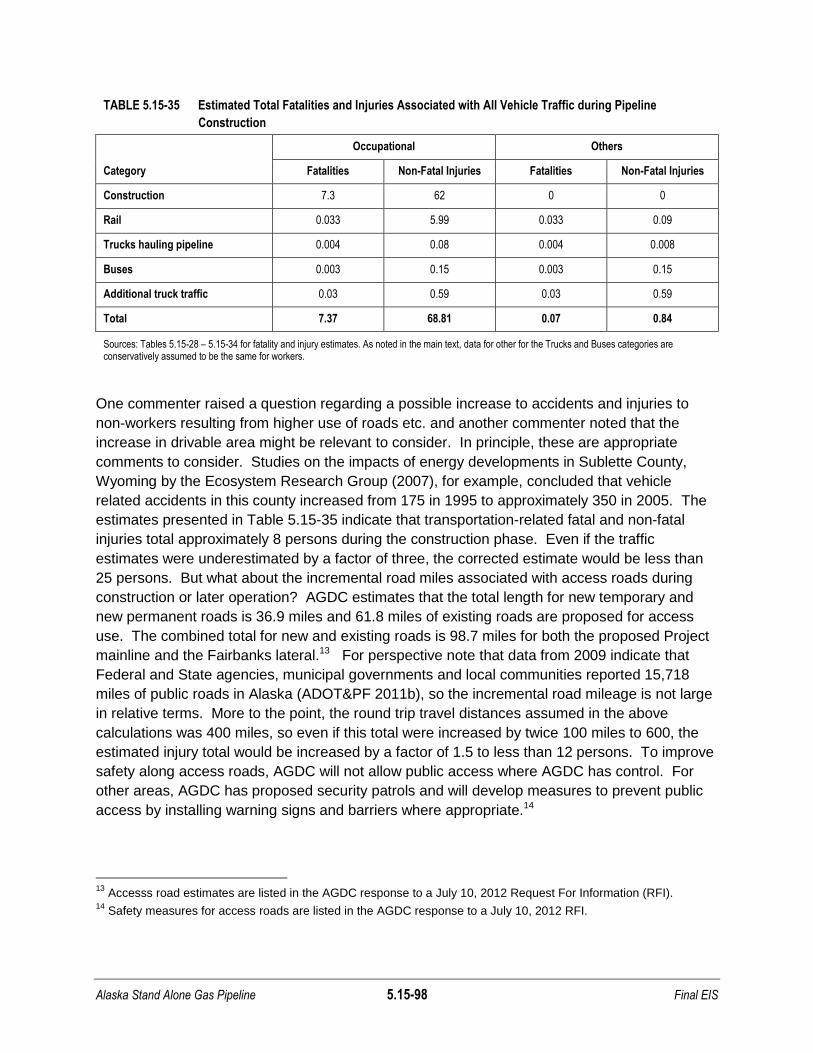
Alaska Stand Alone Gas Pipeline 5.15-98 Final EIS
TABLE 5.15-35 Estimated Total Fatalities and Injuries Associated with All Vehicle Traffic during Pipeline
Construction
Occupational Others
Category Fatalities Non-Fatal Injuries Fatalities Non-Fatal Injuries
Construction 7.3 62 0 0
Rail 0.033 5.99 0.033 0.09
Trucks hauling pipeline 0.004 0.08 0.004 0.008
Buses 0.003 0.15 0.003 0.15
Additional truck traffic 0.03 0.59 0.03 0.59
Total 7.37 68.81 0.07 0.84
Sources: Tables 5.15-28 – 5.15-34 for fatality and injury estimates. As noted in the main text, data for other for the Trucks and Buses categories are conservatively assumed to be the same for workers.
One commenter raised a question regarding a possible increase to accidents and injuries to
non-workers resulting from higher use of roads etc. and another commenter noted that the
increase in drivable area might be relevant to consider. In principle, these are appropriate
comments to consider. Studies on the impacts of energy developments in Sublette County,
Wyoming by the Ecosystem Research Group (2007), for example, concluded that vehicle
related accidents in this county increased from 175 in 1995 to approximately 350 in 2005. The
estimates presented in Table 5.15-35 indicate that transportation-related fatal and non-fatal
injuries total approximately 8 persons during the construction phase. Even if the traffic
estimates were underestimated by a factor of three, the corrected estimate would be less than
25 persons. But what about the incremental road miles associated with access roads during
construction or later operation? AGDC estimates that the total length for new temporary and
new permanent roads is 36.9 miles and 61.8 miles of existing roads are proposed for access
use. The combined total for new and existing roads is 98.7 miles for both the proposed Project
mainline and the Fairbanks lateral.13 For perspective note that data from 2009 indicate that
Federal and State agencies, municipal governments and local communities reported 15,718
miles of public roads in Alaska (ADOT&PF 2011b), so the incremental road mileage is not large
in relative terms. More to the point, the round trip travel distances assumed in the above
calculations was 400 miles, so even if this total were increased by twice 100 miles to 600, the
estimated injury total would be increased by a factor of 1.5 to less than 12 persons. To improve
safety along access roads, AGDC will not allow public access where AGDC has control. For
other areas, AGDC has proposed security patrols and will develop measures to prevent public
access by installing warning signs and barriers where appropriate.14
13
Accesss road estimates are listed in the AGDC response to a July 10, 2012 Request For Information (RFI). 14
Safety measures for access roads are listed in the AGDC response to a July 10, 2012 RFI.
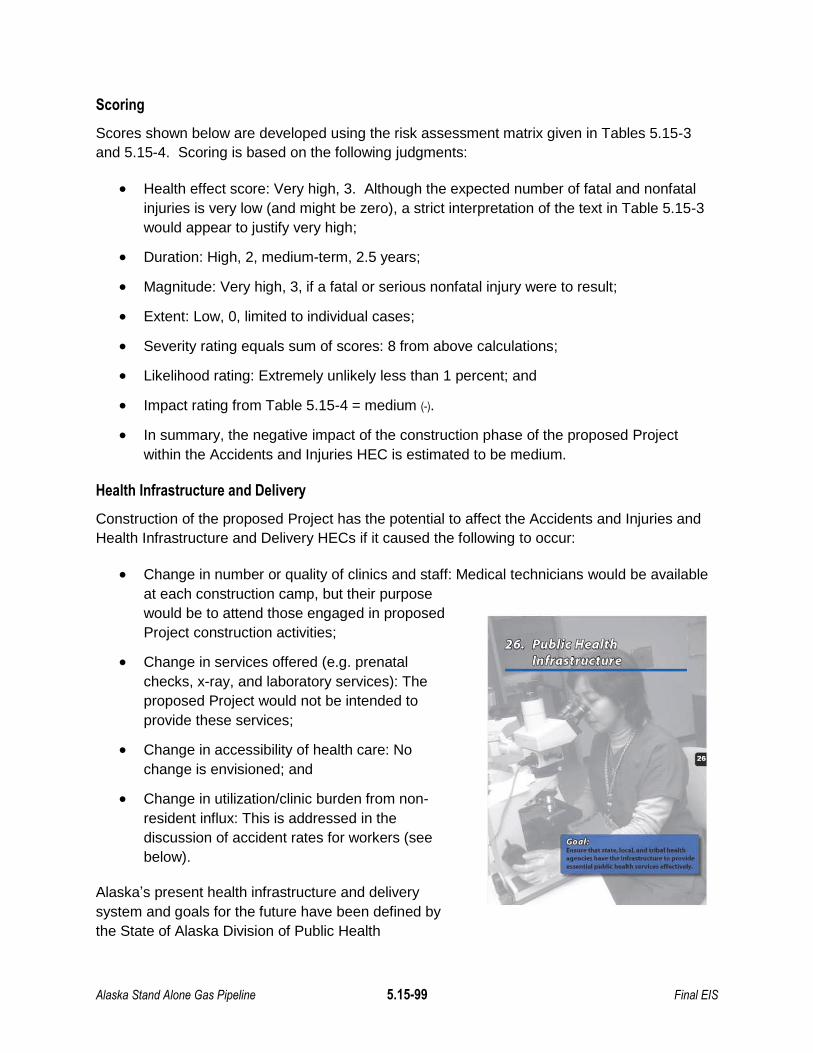
Alaska Stand Alone Gas Pipeline 5.15-99 Final EIS
Scoring
Scores shown below are developed using the risk assessment matrix given in Tables 5.15-3
and 5.15-4. Scoring is based on the following judgments:
Health effect score: Very high, 3. Although the expected number of fatal and nonfatal
injuries is very low (and might be zero), a strict interpretation of the text in Table 5.15-3
would appear to justify very high;
Duration: High, 2, medium-term, 2.5 years;
Magnitude: Very high, 3, if a fatal or serious nonfatal injury were to result;
Extent: Low, 0, limited to individual cases;
Severity rating equals sum of scores: 8 from above calculations;
Likelihood rating: Extremely unlikely less than 1 percent; and
Impact rating from Table 5.15-4 = medium (-).
In summary, the negative impact of the construction phase of the proposed Project
within the Accidents and Injuries HEC is estimated to be medium.
Health Infrastructure and Delivery
Construction of the proposed Project has the potential to affect the Accidents and Injuries and
Health Infrastructure and Delivery HECs if it caused the following to occur:
Change in number or quality of clinics and staff: Medical technicians would be available
at each construction camp, but their purpose
would be to attend those engaged in proposed
Project construction activities;
Change in services offered (e.g. prenatal
checks, x-ray, and laboratory services): The
proposed Project would not be intended to
provide these services;
Change in accessibility of health care: No
change is envisioned; and
Change in utilization/clinic burden from non-
resident influx: This is addressed in the
discussion of accident rates for workers (see
below).
Alaska‘s present health infrastructure and delivery
system and goals for the future have been defined by
the State of Alaska Division of Public Health

Alaska Stand Alone Gas Pipeline 5.15-100 Final EIS
(ADHSS 2001a). Proposed Project construction activities would have little, if any, impacts on
the present system or goals. Injuries (fatal and nonfatal) to residents not affiliated with the
proposed Project are reviewed above. Few injuries would be expected for workers and
residents alike. The number of occupational injuries (see estimates in Table 5.15-35) would be
unlikely to be large enough to overwhelm present trauma or health care resources. It would
also be possible that construction workers could experience acute cardiovascular or respiratory
symptoms most likely as a result of exacerbation of a pre-existing or possibly a new disease
while working at construction camps. Although the relatively low estimated number of fatalities
and accidents will likely not impact the availability of health care, each borough and census area
intersected by the proposed ROW is either characterized as an MUP or contains MUAs within
its boundaries (see Section 5.15.3.3). These classified, underserved areas are unlikely to
experience pressure on the local infrastructure because seriously sick or injured workers would
be flown out to either Fairbanks or Anchorage and would not materially impact local medical
facilities. With regard to routine care for construction workers, in-state workers are already part
of the health care demand, and out-of-state workers would probably address their routine health
needs when they are back home due to the relatively high cost of health services provided in
Alaska15.
Additional impacts discussed below would also be unlikely to have any negative impacts the
present health status or future plans for Alaskans. When the proposed Project is completed
(see discussion of cumulative effects below) there would likely be positive impacts as a result of
substituting natural gas for other fossil fuels or wood in parts of the area (e.g., Fairbanks).
Construction workers who become ill or injured would be evacuated to larger metropolitan areas
(e.g., Anchorage or Fairbanks) where adequate medical facilities are available.
Epidemiological studies have consistently shown that employed workers are healthier than
those in the general population, something termed the healthy worker effect (HWE) (Carpenter
1987; Li and Sung 1999; Thygesen et al. 2011). As noted by Li and Sung (1999)
…the HWE reflects that an individual must be relatively healthy in order to be employable in a workforce, and both morbidity and mortality rates within the workforce are usually lower than in the general population.
The HWE is regarded as a methodological challenge for epidemiologists seeking to quantify the
effects of occupational exposure to toxic substances, for example, but is potentially a beneficial
effect in this context. In practical terms this means that employed construction personnel are
more likely to have lower mortality and morbidity than the overall Alaskan population, meaning
that they are less likely to require medical attention (other than to deal with injuries).16 This
statement does not mean that workers will be either disease or injury free. For perspective, it is
15
See Alaska Health Care Commission 2009; Foster and Goldsmith 2006; Foster and Goldsmith 2011. This said, Alaskans spend about the same percentage of their incomes on health care as the rest of the US (see Fried and Shanks 2011).
16 Burns et al. (2011) found that standard mortality ratios for workers in the US Chemical industry were 79 (compared to a reference population of 100) for all causes, 81 for heart diseases, and 70 for non-malignant respiratory disease. Tsai et al. (2003) measured an SMR of 74 for all-cause mortality in a cohort of refinery workers.
Alaska Stand Alone Gas Pipeline 5.15-101 Final EIS
useful to note that the estimated peak construction force in the Summer of 2017 totals 6,400
workers across all areas, whereas the combined population of Fairbanks and Anchorage is
nearly 330,000. Thus, the incremental population (and possibly demand for health services) is
at most 1.6%.17 For most of the construction period the number of workers will be substantially
lower than this 6,400 figure.
One of the public comments on the draft EIS asked if there were any data on hospitalizations or
medical evacuations of transient workers engaged in petroleum Projects. Only limited data are
available and whether or not these data can be meaningfully extrapolated to the ASAP is
questionable. For example, Jobin (2003) provides such data for the Chad Oil Export Project. In
this Project the number of hospitalizations among Project workers varied by quarter from 11 to
43 (average rate 2.5 per 1,000) and the number of evacuations ranged from 3 to 14 (average
rate 0.88 per 1,000) among a construction workforce ranging in size from approximately 3,500
to 12,500 workers. If these rates are at all representative, the increased burden on external
health care providers is likely to be modest.
Scoring
Scores shown below are developed using the risk assessment matrix given in Tables 5.15-3
and 5.15-4. Scoring is based on the following judgments:
Health effect score: Low, 0, effects unlikely to be perceptible;
Duration: High, 2, medium-term, 2.5 years;
Magnitude: Low, 0, minor intensity;
Extent: Low, 0, limited to individual cases;
Severity rating equals sum of scores: 2 from above calculations;
Likelihood rating: Very unlikely 1-10 percent; and
Impact rating from Table 5.15-4 = low (-).
In summary, the negative impact of the construction phase of the proposed Project
within the Health Infrastructure and Delivery HEC is estimated to be low.
17
This figure does not take onto account the fact that workers will be relatively young. Older people (particularly those aged 65 and older) require more frequent admission to hospitals and their average length of stay is longer on average. According to 2006 data from the National Hospital Discharge survey (DeFrances et al. 2008), ―In 2006, those aged 65 years and older made up 38% of all hospital discharges and used 43% of the days of care.‖
Alaska Stand Alone Gas Pipeline 5.15-102 Final EIS
Exposure to Hazardous Materials
Construction activities have the potential to result in exposure to hazardous materials from:
Changes in physiologic contaminant levels such as fugitive dust, criteria pollutants,
persistent organic pollutants, and volatile organic compounds, and
Changed levels of the same
substances in subsistence resources.
Of these two possibilities the key exposure
pathway for humans are air emissions
associated with construction activities (see
discussion of CSM above).
The POD comments as follows:
―The proposed Project will have a
localized effect on air quality during
the Project construction phase
primarily due to diesel-powered
mobile construction equipment and
perhaps some windblown dust during the summer construction season. These potential
particulate matter impacts in the Fairbanks nonattainment area for particulate matter
(PM) 2.5 [see below] from construction of the Fairbanks Lateral will be mitigated by BMP
[best management practices] measures for fugitive dust control and the use of ultra-low-
sulfur diesel fuel by construction equipment. Since much of the proposed pipeline will
parallel or share existing transportation corridors, including the Parks Highway and the
ARRC railroad, fugitive dust emissions will be managed as a public safety factor to
people traveling on the highway and railroad. Some open burning may be conducted
during construction and will be subject to applicable Alaska Department of
Environmental Conservation (ADEC) air quality regulations.‖ [Material in square brackets
added for clarity.]
Section 5.16 describes the fugitive dust, criteria pollutants,18 and volatile organic compounds
(VOCs) that would be generated by the proposed Project. As described therein, emissions from
construction equipment combustion, fugitive dust, and open burning would be controlled to the
extent required by the ADEC. As a result, if the AGDC complies with applicable regulations, the
emissions from proposed Project construction-related activities would not significantly affect
local or regional air quality. Therefore, construction of the proposed Project should not
significantly increase exposure of the PACs to these substances.
18
There are six criteria pollutants for which National Ambient Air Quality Standards (NAAQS) have been established by the EPA. These include carbon monoxide, ozone, particulate matter, nitrogen oxides, sulfur dioxide, and lead (see http://www.epa.gov/air/urbanair/).

Alaska Stand Alone Gas Pipeline 5.15-103 Final EIS
Fugitive dust,19 for example, is one of the materials that would be generated as part of
construction activities. Fugitive dust results from vehicle traffic on unpaved roads and
construction activities.20 The EPA estimates that 40 percent of fugitive dust emissions come
from unpaved roads.21 Excessive fugitive dust and particulate matter emissions can have
significant impacts on human health and mortality (Brook et al. 2002, 2010; Fairbanks North
Star Borough 2009; Koenig et al. 1993; Pope III et al. 2002, 2006a, b, 2009a, b; Schwartz and
Neas 2000; EPA Integrated Science Assessment 2009; Verbrugge 2009 and contained
references). People most at risk from breathing particulate pollution are children, the elderly,
and people with respiratory or heart disease (see the corresponding section addressing impacts
during the operations phase for an extensive discussion of this topic). Healthy people can be
affected as well, especially outdoor exercisers. Fugitive dust and particulate matter emissions
have been linked to asthma, emphysema, chronic bronchitis, chronic obstructive pulmonary
disease, and cardiovascular disease. The EPA has developed National Ambient Air Quality
Standards (NAAQS) applicable to particulate material. For example, standards for all particles
less than 10 microns (µm) in diameter, PM10, mandate a 24-hour maximum concentration of
150 micrograms per cubic meter (µg/m3). Additionally, there are concentration standards for
fine particles less than 2.5 µm (PM 2.5); these are 35 µg/m3 (24-hour limit) and 15 µg/m3
(annual limit).22 These primary standards were established to protect public health, including
the health of ―sensitive‖ populations such as asthmatics, children, and the elderly—these
standards, in general, do not consider costs. The ADEC currently relies on two regulations that
were based on the Federal Clean Air Act:
18 AAC 50.045(d) an industrial activity or construction Project shall take ―reasonable
precautions‖ to prevent particulate matter from being emitted into the ambient air; and
18 AAC 50.220 Air Pollution Prohibited. No person may permit any emission which is
injurious to human health or welfare, animal or plant life, or property, or which would
unreasonably interfere with the enjoyment of life or property.
The ADEC is currently reviewing the situation and could issue additional fugitive dust
regulations in the future. In any event, the ADEC has the authority to take regulatory action
against any operator who violates ambient air quality standards. It should be noted that the
proposed Project originated and is managed by a state agency and compliance with applicable
regulations would be expected.
19
The EPA defines fugitive dust as ―particulate matter that is generated or emitted from open air operations (emissions that do not pass through a stack or a vent)‖. The most common forms of particulate matter (PM) are known as PM10 (particulate matter with a diameter of 10 microns or less) and PM2.5 (particulate matter with a diameter of 2.5 microns or less). The ADEC (2011b) cites the EPA definition in: http://www.dec.state.ak.us/air/ap/docs/Fugitive%20Dust%20FAQs%203-31-11.pdf.
20 There are several methods that can be used to reduce fugitive dust emissions on roads, such as wetting.
21 See Turner and Nipataruedi 2011. The percentage is likely to be even higher in Alaska, which has approximately
31% of all roads paved (ADOT&PF 2011b). 22
These standards are reviewed every five years and some have argued that these are too stringent, but the EPA believes these are appropriate, based on a careful review of the health effects literature. Moreover there is
increased mortality with short-term exposure to PM2.5 at concentrations that are less than 20 g/m3, which is
beneath the health-based 24-hour standard of 35 g/m3
(see Fairbanks North Star Borough 2009).
Alaska Stand Alone Gas Pipeline 5.15-104 Final EIS
Other toxic and hazardous substances that could be used during construction of the proposed
Project include some pesticides, paints, solvents, petroleum products, and fertilizers. The
proposed Project would be subject to the following regulations regarding the use of toxic and
hazardous materials:
Pipeline Safety Regulations (49 CFR Parts 190-199);
Resource Conservation and Recovery Act (42 USC 3251 et seq.);
Comprehensive Environmental Response, Compensation and Liability Act and the
Superfund Amendments and Reauthorization Act (42 USC 9601);
Emergency Planning and Community Right-to-Know Act (42 USC 9601; 40 CFR 255,
370, and 372);
Toxic Substances Control Act (15 USC 2601);
Hazardous Materials Transportation Act (49 USC 1801-1819); and
Occupational Safety and Health Administration (29 USC §§651-678).
In addition to complying with these regulations, the proposed Project would also follow several
plans intended to ensure the proper handling and disposal of hazardous and nonhazardous
wastes. As noted above, these plans include a comprehensive waste management plan
(CWMP), Spill Prevention and Control Plan (SPCP), and a Spill Prevention Control and
Countermeasure Plan (SPCCP). Therefore, construction of the proposed Project should not
lead to significant exposure of the PACs to these substances.
Scoring
Scores shown below are developed using the risk assessment matrix given in Tables 5.15-3
and 5.15-4. Scoring is based on the following judgments:
Health effect score: Low, 0, effects unlikely to be perceptible;
Duration: High, 2, medium-term, 2.5 years;
Magnitude: Low, 0, minor intensity;
Extent: Low, 0, limited to individual cases;
Severity rating equals sum of scores: 2 from above calculations;
Likelihood rating: Unlikely 10-33 percent; and
Impact rating from Table 5.15-4 = low (-).
In summary, the negative impact of the construction phase of the proposed Project
within the Exposure to Hazardous Substances HEC is estimated to be low.

Alaska Stand Alone Gas Pipeline 5.15-105 Final EIS
Food, Nutrition, and Subsistence
Construction of the proposed Project would have
the potential to affect the Food, Nutrition, and
Subsistence HEC if it caused the following to
occur:
Change in amount of dietary consumption
of subsistence resources;
Change in composition of diet; and
Change in food security.
Subsistence is discussed in detail in Section 5.14. Section 5.14 examines both direct (physical)
and indirect (socioeconomic) impacts of proposed Project construction activities. Some key
conclusions relative to subsistence include:
Impacts to subsistence during the construction phase are expected to be temporary in
duration.23 The timing of pre-construction and construction activities would have direct
effects on subsistence activities. Subsistence impacts would be most acute in the area
around Minto Flats which is largely undeveloped, whereas other areas of the proposed
Project already experience impacts associated with the TAPS and Parks Highway
corridors.
The introduction of invasive species (both fish and/or
aquatic plants) could impact fish habitat and/or
productivity and impact fish availability to subsistence
users. Unlike the other construction impacts which are
expected to be short-term, the introduction of invasive
species could become a long-term impact if their
spread is uncontrolled, thus potentially signaling a long
term reduced fish availability for subsistence users
along the proposed Project and users downstream of
the impacted areas. Reduced fish availability could
potentially occur and affect subsistence uses in all
three study regions and have the greatest effect on
communities in the Interior (where fish account for over
70 percent of harvest) and Southcentral (where fish
account for over 50 percent of harvest) with less impact
on communities in the North Slope (where fish account
for less than 20 percent of the harvest).
23
One commenter noted that, even if the construction period were brief, it was possible that some of the effects on the diet of certain residents would be longer-term. This possibility cannot be categorically dismissed, but there are no data to estimate the delayed effects of any possible change in diet.

Alaska Stand Alone Gas Pipeline 5.15-106 Final EIS
Large-scale impacts on fish are not indicated.
User access to subsistence areas could be temporarily reduced due to both physical and
regulatory barriers related to the use of explosives, water extraction efforts, pipe
laydown, noise, traffic, and other construction activities. Short-term decreased user
access and increased competition for subsistence resources would have the greatest
effect in the undeveloped Minto Flats vicinity and for subsistence users in communities
that lie directly along the proposed Project, in particular the communities of Anderson,
Cantwell, Coldfoot, Healy, McKinley Park, Minto, Nenana, Trapper Creek, Willow, and
Wiseman.
Section 5.14.3.2 also notes that subsistence users might decrease consumption of a
subsistence resource if there is fear over the possible effects of contamination. Such
concerns with respect to oil and gas developments have been reported (see e.g., Moses
et al. 2009 and contained references, EPA 1995, Alaska Native Health Board and
Alaska Native Epidemiology Center 2004, and the Alaska HIA Toolkit). According to
5.14.3.2, contamination concerns regarding ASAP would be ―most present among
subsistence users in communities that lie directly along the [proposed] Project.‖ It is
relevant to note that the Environmental Public Health Program is engaged in an ongoing
effort to characterize the safety of subsistence foods in Alaska. This process involves an
assessment of the health benefits and risks of subsistence food consumption (State of
Alaska Epidemiology 2012 and more specifically Egeland et al. 1998).
Certain effects would be mixed. Some residents of potentially affected communities
could find employment in the proposed Project. Employed subsistence users could have
less time available for subsistence activities due to employment commitments and could
travel less to traditional places. Furthermore, a decline in the consumption of traditional
foods means an increased cost for obtaining substitute foods. Employment would
however provide the benefit of increased income which residents could in turn use to
participate in subsistence activities.
Section 5.14 concludes that there would be no major impact on the availability of
subsistence resources. However, this section also notes that the compressor station
located near the Minto Flats Game Refuge could introduce additional noise, emissions,
and activity in an area of the Project and disrupt subsistence users and resources.
One additional issue of potential concern related to subsistence resources during construction is
the possibility that workers might compete with subsistence users resulting in either diminished
harvests or greater subsistence effort. (There is anecdotal evidence for this hypothesis in the
case of TAPS.)
Within the limits of present law, the proposed Project could reduce the possibility for competition
for subsistence resources between traditional users and construction workers by following the
standard practice of prohibiting workers from hunting or fishing while on the job or when
company transportation has been used to bring them to a remote site. Nonetheless under

Alaska Stand Alone Gas Pipeline 5.15-107 Final EIS
present Alaska laws workers (both Alaska residents and non-residents) could legally obtain
hunting and fishing licenses and exercise their rights when not on the leasehold. Additionally,
there are a set of stipulations discussed in more detail below in Section 5.15-5 (Mitigation) that
specifically are relevant to hunting, fishing, trapping, and camping (AGDC 2011a). These
include:
1.21 Hunting, Fishing, Trapping, and Camping
1.21.1 With respect to Lessee’s agents, employees, Contractors, and the employees of
each of them, the Lessee shall prohibit hunting, fishing, trapping, shooting, and camping
within the Leasehold.
1.21.2 The Lessee’s agents, employees, Contractors, and the employees of each of
them shall not use Project equipment, including transportation to and from the job site,
for the purpose of hunting, fishing, shooting, and trapping.
Workers would be provided food when at construction camps. This food would be trucked or
flown in and should not impact the existing markets used by area residents. From a public
health perspective, if subsistence resources were significantly and negatively impacted, the
concern would be related to dietary shifts in the short- and long-term. As noted in the technical
guidance for health impact assessments in Alaska (ADHSS 2011f):
Subsistence diets that consist of fish and other seafood, terrestrial (moose and caribou)
and marine mammals (whale and seal), and local flora (berries) are sources of lean
protein, rich in nutrients, and are considered highly nutritious. These subsistence
resources are critical to basic food security in many Alaskan communities, where market
foods are of limited availability, lower quality, and are prohibitively expensive. In rural
Alaska, a gradual shift towards a Westernized diet has been associated with a decline in
nutritional status, and associated with an increasing incidence of nutritionally-related
conditions such as diabetes, obesity, heart disease, and dental caries.
Based on the available information presented in Section 5.14, the impacts of the proposed
Project during the construction phase would not be large or long lasting.
Another relevant document addressing subsistence impacts is contained in Appendix L
(ANILCA Section 810 Analysis of Subsistence Impacts) prepared by Merben R. Cebrian,
Wildlife Biologist, BLM Central Yukon Field Office. With regard to the direct effects this analysis
concludes:
Under Alternative B (Proposed Action), access to subsistence resources will not
be significantly hampered by the proposed activity. The proposed activity would
not significantly restrict subsistence uses and needs in or near the proposed
activity area. The impacts to subsistence resources and access discussed
above would be minimal. There is no reasonably foreseeable significant
decrease in the abundance of harvestable resources, and in the distribution of
harvestable resources due to the proposed action.
Alaska Stand Alone Gas Pipeline 5.15-108 Final EIS
This analysis reaches different conclusions with regard to cumulative effects (see below).
Scoring
Scores shown below are developed using the risk assessment matrix given in Tables 5.15-3
and 5.15-4. Scoring is based on the following judgments:
Health effect score: Medium, 1, effect results in annoyance, minor injuries, or illnesses
that do not require intervention;
Duration: High, 2 medium-term, 2.5 years;
Magnitude: High, 2, Those impacted will be able to adapt to the health impact with some
difficulty and will maintain pre-impact level of health with support;
Extent: High, 2, might affect certain PACs, such as Minto;
Severity rating equals sum of scores: 77 from above calculations;
Likelihood rating: Unlikely 10-33 percent; and
Impact rating from Table 5.15-4 = medium (-).
In summary, the negative impact of the construction phase of the proposed Project
within the Food, Nutrition, and Subsistence HEC is estimated to be medium.
Infectious Diseases
Construction of the proposed Project would have the potential to affect the Infectious Disease
HEC, for example, if it caused the following to occur:
Change in transmission of pediatric acute respiratory disease rates;
Change in acute adult respiratory disease rates (TB, bronchitis, influenza);
Change in STD rates (e.g., Chlamydia, gonorrhea, HIV);
Change in gastro intestinal outbreaks; and
Change in antibiotic-resistant staph skin infections.
Experience with other pipelines and published texts on the state-of-the-art on social and
environmental impacts on pipelines (Goodland 2005; van Hinte et al. 2007; ADHSS 2011g;
Parfomak 2008) suggest that the potential for infectious diseases (particularly STDs) is one of
the relevant impacts associated with pipeline construction and operation in other parts of the
world.24 Medically, infectious diseases (also called communicable diseases) can be defined as
24
It may even have implications for protection of critical infrastructure. As one report states: ―Epidemics and pandemics of infectious diseases such as Severe Acute Respiratory Syndrome (SARS) and avian influenza (bird flu) have the potential to disrupt critical infrastructure by infecting critical workers or restricting their movement‖ (Parfomak 2008). The Bush Administration‘s National Strategy for Pandemic Influenza states that ―while a pandemic will not damage power lines, banks or computer networks, it will ultimately threaten all critical

Alaska Stand Alone Gas Pipeline 5.15-109 Final EIS
clinically evident illnesses (i.e., those with characteristic medical signs or symptoms) resulting
from the infection, presence and growth of pathogenic biological agents in an individual host
organism. The transmission of pathogen can occur in various ways including physical contact,
contaminated food, body fluids, objects, airborne inhalation, or through vector organisms (e.g.,
animals, insects). The State of Alaska includes 56 such infectious diseases ranging
(alphabetically) from AIDS to Yersiniosis25 that are required to be reported by health care
providers (ADHSS 2011h). Many can be prevented by immunizations (ADHSS 2001b), others
by improved personal hygiene, food selection and preparation, and yet others (e.g., STDs) by
the use of condoms. Many can be successfully treated by antibiotics.
The public health concern with respect to evaluating proposed development Projects is that
these diseases can be transmitted by infected construction workers (potentially from outside the
area). In the Alaska context the diseases of particular concern include infectious respiratory
diseases (e.g., pneumonia, influenza) and STDs (AIDS, syphilis, gonorrhea, and Chlamydia).
The interest in STDs in connection with proposed pipeline development Projects partially
reflects experience and/or concerns with similar Projects in Canada (see e.g., Goldenberg et al.
2008a, b, c; Shandro et al. 2011; Wernham, n.d.), anecdotal reports from gas developments in
the ‗lower 48‘ (AP 2011; Farnham 2012; Kulesza 2011; Schechter 2011), and less developed
countries and partially because of concerns related to TAPS impacts (CEE Bankwatch Network,
Gender Action 2006; Jobin 2003; Pacific Environment 2011; Sakhalin Environmental Watch
2011; for TAPS see e.g., anecdotal information presented in Cole 1997). A recent HIA on oil
and gas development on Alaska‘s North Slope concluded that contact between oil workers and
previously isolated Inupiat villages could result in increased rates of HIV and syphilis (Wernham
2007b).
Moreover, as noted earlier is this section the rates of STDs in Alaska are relatively high,
particularly for Chlamydia, but also for gonorrhea. Regions with particularly high rates within
Alaska include (in descending order of 2010 age-adjusted rates) Norton Sound, Yukon-
Kuskokwim, Northwest Arctic, Arctic Slope, and Bristol Bay, all with age-adjusted rates greater
than or equal to 1,000/100,000 (ADHSS 2010f). Rates vary with gender (females higher than
males), age (young adults have the highest incidence, 68 percent of cases among those less
than 25 years old), and race/ethnicity (AIAN greater than average) (ADHSS 2011c).
The State of Alaska has an active HIV/STD program (ADHSS 2011i). Although there are
effective tests for STDs, known methods for reducing the likelihood of transmission, and
effective cures (if diagnosed), STDs are a valid public health concern (ADHSS 2010f). The
State of Alaska now provides free at-home testing kits available from www.iwantthekit.org.
infrastructure by removing essential personnel from the workplace for weeks or months.‖ An outbreak of infectious disease may sicken critical workers or force them into quarantine. It may also restrict their access to critical facilities where the disease may be present. As one federal government report states, during such an event ―operations become disrupted, exposed people and facilities undergo extensive testing ... and buildings and equipment require decontamination.‖
25 Yersiniosis is a relatively uncommon infection contracted through the consumption of undercooked meat products, unpasteurized milk, or water contaminated by the bacteria.
Alaska Stand Alone Gas Pipeline 5.15-110 Final EIS
Other Infectious Diseases
Other infectious diseases that could affect the worker
population and potentially affect other persons include
hepatitis (A, B, and C) and bacterial pneumonia (each of
these conditions is reportable to public health authorities in
Alaska). These diseases differ in the how they are spread,
whether or not vaccination is possible, types of treatment
required, and seriousness. Hepatitis A, B, and C, for
example, can be spread by sexual activity, eating food or
drinking contaminated water (hepatitis A only), sharing
needles among drug users (hepatitis B and C). There are
vaccines for hepatitis A and B, but not C. There is no
treatment for hepatitis A beyond supportive care, but there
are treatments of varying efficiency for hepatitis B and C
(Immunization Action Coalition 2007). Bacterial
pneumonia can be transmitted via inhalation of bacteria (contact with others) or by aspiration of
the secretions from the throat, mouth, or nose. Bacterial pneumonia is treated using antibiotics.
Because these diseases are contagious, isolation or removal of infected workers from the
camps would be required.
Perspectives
As noted in the POD (AGDC 2011b):
Personnel housing and support services will be provided by mobile construction camps,
stationary construction camps, and existing commercially available lodging. Fifteen
construction camps are planned for the Project. All the temporary construction camps
planned for this Project will be located on previously disturbed sites, most of which were
developed during TAPS construction. The two proposed camps that will not be located
on previously developed campsites are Chulitna Butte and Sunshine. However, both of
these camps are planned for development on previously disturbed sites. Chulitna Butte
is located on the existing ARRC Hurricane rail siding and the Sunshine is located at the
site of the Talkeetna Bluegrass festival.
It is anticipated that a rotational scheme would be employed wherein workers are transported by
aircraft or bus from selected locations (e.g., Prudhoe, Fairbanks, and Anchorage) to the work
camps. There they would work for a defined period (e.g., one week) and, upon shift completion,
be transported back to their starting points. A work shift would typically be 12 hours, so the
worker would have to use the remaining 12 hours for attending to personal chores, eating, and
sleeping. While at the camps, there would be little opportunity for interaction (e.g., sexual
contact) with other persons. This is a policy designed (among other things) to lower
opportunities to transmit STDs, particularly with persons living in the general area of the camps.
HEPATITIS BVACCINE
Medical Dictionary
Bibliography &
Annotated Researdl Guide
TO INWINlI RfHlIf..cf.S

Alaska Stand Alone Gas Pipeline 5.15-111 Final EIS
Some anecdotal accounts of life in work camps in the ‗lower 48‘ (see e.g., Irvine 2011)
suggest that the work schedules ―leaves little time for the rowdiness that you might
expect at a place like this. The quiet is most often broken by the sound of footsteps on
the gravel that fills the camp walkways…these men might watch a little TV, shoot some
pool or hang out for a chat and a smoke. They use computers next to the laundry room
or Wi-Fi on their own laptops to communicate with the outside world, and cell phones,
when they work.‖
Other anecdotal reports paint a different picture. Ward Koeser, the Mayor of Williston,
ND was quoted (see Farnham 2012) as referring to the 5,000 to 6,000 workers living in
work camps a few miles outside of town: ―When they come in to go to the bar, they don‘t
always behave themselves.‖ According to Dr. Andre Corriveau (Chief Medical Officer
Alberta): "There is a high number of young men [with STI's] who work in the oilsands
area‖ (Driedger 2012).
Operators of work camps in the ‗lower 48‘ have instituted a variety of measures that would limit
opportunities to transmit STDs such as a prohibition of alcohol or drugs, women in rooms,
visitors after a certain hour, or unauthorized visitors (see e.g., Carrns 2012; Irvine 2011; Kramer
2012; Snyder 2012; Sulzberger 2011).
In areas where construction workers would be required to provide their own housing (with 460 to
690 residing in the Wasilla area, and a maximum of 500 to 1,000 residing in the Fairbanks
area), the likelihood of interaction between workers and local residents would be greater.
The possible impact of a transient workforce on STD rates and possible ways of mitigating this
impact has been examined in several studies of development Projects (particularly in newly
industrializing or less developed countries such as Botswana, Brazil, Cameroon, Chad,
Malaysia, Papua New Guinea, Uganda, Yemen).26 The assumption in these analyses is that
the construction workforce would be largely male (who would typically be well paid relative to
the local population) and (even if married) unaccompanied by their spouses, which might lead to
an influx of sex workers and/or greater sexual contact with members of the local population.
Cole (1997) recounts stories of prostitution in Fairbanks and Valdez when TAPS was
constructed. One commenter asked if there were data available on STDs rates associated with
construction of mineral development Projects. Jobin (2003) examined the rates of STDs among
workers in a Chad Oil Export Project. He reported that the number of STDs varied by quarter
from 109 to 595 cases among a workforce ranging in size from approximately 3,500 to 12,500
workers. On an overall basis these data average approximately 39 cases per 1,000 workers, a
figure higher than the present incidence in Alaska, but lower than reported by the World Health
Organization (WHO 2001) for Sub-Saharan Africa. However, by the third and fourth quarters of
2011, the incidence rate of STDs on this Project decreased to 5.12 cases per 1,000 workers
(Esso Exploration and Production Chad, Inc. 2012). (It should be noted that only 6.95% of the
26
See e.g., Jobin 2003; Dangote Group 2004; Bell et al. 2004; Yemen LNG Company Ltd. 2006; ERM 2008; Skansa 2008; Papual New Guinea Liquefied Natural Gas project 2009; Mengwe 2010; and Sinoh Environmental Sdn. Bhd. 2012.
Alaska Stand Alone Gas Pipeline 5.15-112 Final EIS
workforce were expatriates in 2011.) Whether or not these data are representative of what might
be found with ASAP is questionable.
In most cases the mitigation strategies proposed or implemented for dealing with STDs on
mineral development Projects have included attempting to minimize the size of the transient
workforce (generally determined to be infeasible) and provision of a health education and
outreach program. Table 5.15-36 lists a number of possible measures that might be considered
in developing a mitigation strategy for ASAP listed in increasing order of stringency. As a
practical matter, feasible mitigation measures are limited to an education and outreach program,
which might also include providing condoms and test kits for STDs. More stringent alternatives
(such as mandatory STD testing, or certain access restrictions27) are unlikely to be feasible, or
even legal in the United States.
Each camp would have a medical technician on-staff. Camp facilities would include a private
examination room and a reception and service area. Equipment would include refrigeration
facilities for storage of perishable medicines, sterilization equipment, and storage for medical
supplies. Workers who contract other infectious diseases would be evacuated to treatment
facilities away from the camps in much the same say as occupational injuries would be treated.
As discussed in the mitigation section, a reasonable precaution would be to offer free (but
voluntary) vaccines to workers. Although it does not appear feasible at present to make
vaccination mandatory for construction workers,28 it is feasible to have a health outreach
program that provides literature and aggressively promotes voluntary immunizations for several
infectious diseases (e.g., influenza and hepatitis A and B).
For the present, it is necessary to address the possible impact of transmission of infectious
diseases in qualitative terms. The possibility of impacts cannot be dismissed out of hand, but
the relative isolation of construction workers into work camps and the availability of free
immunizations for certain infectious diseases as well as an outreach program that provides
relevant health information to workers would likely reduce possible impacts. This assessment is
consistent with findings of the Health Impact Assessment prepared by the State of Alaska HIA
Program, Department of Health and Social Services for the Point Thomson EIS29 with regard to
the potential concern that construction workers might exacerbate the STD problem in noting
(ADHSS 2011j):
27
Presumably there would be a sign-in sign-out system at the camp and visitor restrictions. 28
The CDC has failed to ensure such a policy, even for health care workers, even though the Society for Healthcare Epidemiology, the Infectious diseases Society of America, and the American Academy of Pediatrics have endorsed this policy for health care workers. For guidance on Prevention Strategies in health care settings see CDC 2010d and Federal Register 2010. Certain hospitals have imposed mandatory requirements and been supported by some legislators. The American Academy of Pediatrics (2010) has published guidance for the mandatory requirements.
29 One commenter on an earlier draft noted that the Point Thomson project is located on the North Slope and may have limited applicability to other potentially affected communities. This comment is acknowledged and should be considered by the reader.
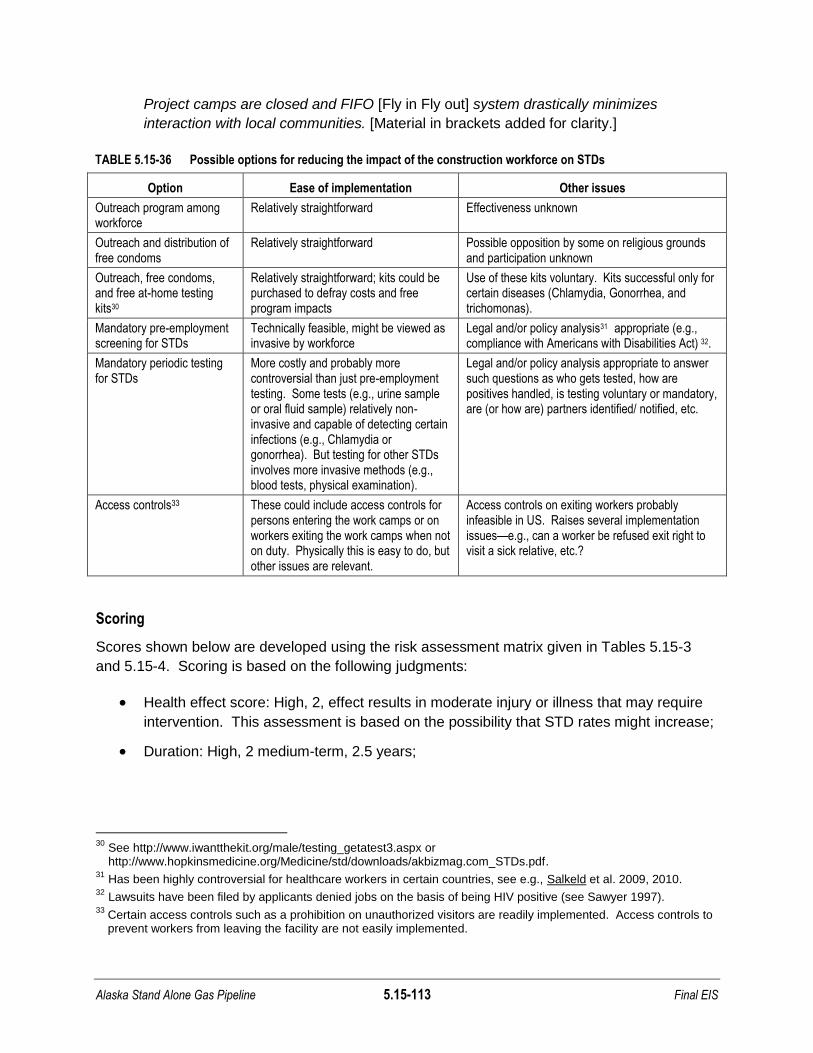
Alaska Stand Alone Gas Pipeline 5.15-113 Final EIS
Project camps are closed and FIFO [Fly in Fly out] system drastically minimizes
interaction with local communities. [Material in brackets added for clarity.]
TABLE 5.15-36 Possible options for reducing the impact of the construction workforce on STDs
Option Ease of implementation Other issues
Outreach program among workforce
Relatively straightforward Effectiveness unknown
Outreach and distribution of free condoms
Relatively straightforward Possible opposition by some on religious grounds and participation unknown
Outreach, free condoms, and free at-home testing kits30
Relatively straightforward; kits could be purchased to defray costs and free program impacts
Use of these kits voluntary. Kits successful only for certain diseases (Chlamydia, Gonorrhea, and trichomonas).
Mandatory pre-employment screening for STDs
Technically feasible, might be viewed as invasive by workforce
Legal and/or policy analysis31 appropriate (e.g., compliance with Americans with Disabilities Act) 32.
Mandatory periodic testing for STDs
More costly and probably more controversial than just pre-employment testing. Some tests (e.g., urine sample or oral fluid sample) relatively non-invasive and capable of detecting certain infections (e.g., Chlamydia or gonorrhea). But testing for other STDs involves more invasive methods (e.g., blood tests, physical examination).
Legal and/or policy analysis appropriate to answer such questions as who gets tested, how are positives handled, is testing voluntary or mandatory, are (or how are) partners identified/ notified, etc.
Access controls33 These could include access controls for persons entering the work camps or on workers exiting the work camps when not on duty. Physically this is easy to do, but other issues are relevant.
Access controls on exiting workers probably infeasible in US. Raises several implementation issues—e.g., can a worker be refused exit right to visit a sick relative, etc.?
Scoring
Scores shown below are developed using the risk assessment matrix given in Tables 5.15-3
and 5.15-4. Scoring is based on the following judgments:
Health effect score: High, 2, effect results in moderate injury or illness that may require
intervention. This assessment is based on the possibility that STD rates might increase;
Duration: High, 2 medium-term, 2.5 years;
30
See http://www.iwantthekit.org/male/testing_getatest3.aspx or http://www.hopkinsmedicine.org/Medicine/std/downloads/akbizmag.com_STDs.pdf.
31 Has been highly controversial for healthcare workers in certain countries, see e.g., Salkeld et al. 2009, 2010.
32 Lawsuits have been filed by applicants denied jobs on the basis of being HIV positive (see Sawyer 1997).
33 Certain access controls such as a prohibition on unauthorized visitors are readily implemented. Access controls to prevent workers from leaving the facility are not easily implemented.

Alaska Stand Alone Gas Pipeline 5.15-114 Final EIS
Magnitude: High, 2, those impacted will be able to adapt to the health impact with some
difficulty (e.g., requiring testing and treatment for STDs) and will maintain pre-impact
level of health and support;
Extent: High, 2 Entire PACs; village level;
Severity rating equals sum of scores: 88 from above calculations;
Likelihood rating: Unlikely 10-33 percent; and
Impact rating from Table 5.15-4 = Medium (-).
In summary, the negative impact of the construction phase of the proposed Project
within the Infectious Diseases HEC is estimated to be medium.
Non-communicable and Chronic Disease
Construction of the proposed Project would have the potential to affect the Non-communicable
and Chronic Disease HEC, for example, if it caused the following to occur:
Change in cardiovascular disease rates;
Change in type 2 Diabetes Mellitus (DM) rates;
Change in chronic lower respiratory disease rates; and
Change in cancer rates.
As discussed under the Affected Environment subheading, the leading causes of death
attributable to non-communicable chronic diseases in the proposed Project area are cancers,
heart disease, and chronic obstructive pulmonary disease (COPD).34 Following cancer,35 the
most common chronic diseases statewide and within the proposed Project area are chronic
obstructive pulmonary disease, cardiac disease, vascular disease, and type-2 (adult onset)
diabetes. Asthma36 should be included in the list of chronic respiratory diseases of concern
because, although fatality rates are lower than for many of the other diseases included here,
asthma results in a large number of hospitalizations and emergency department visits (ADHSS
2001c). Asthma rates are similar for Alaska Natives and non-natives (ADHSS 2006a; Stout et
al. 1999). These diseases differ in terms of risk factors but there are several similarities. For
34
Chronic lower respiratory diseases are diseases that affect the lungs. The most deadly of these is chronic obstructive pulmonary disease (COPD), which makes it more difficult to breathe. COPD includes two main
illnesses: 1) emphysema: With emphysema, some of the walls of the air sacs (alveoli) in the lungs are damaged, increasing the work of breathing and making it more difficult to get necessary oxygen; and 2) chronic bronchitis: With chronic bronchitis, the lining of the lungs‘ airways are red and swollen. Over time, the airways become narrow and partly clogged with mucus that cannot be cleared, which makes it more difficult to get necessary oxygen.
35 There are numerous useful reports on cancer in Alaska, see Alaska Native Tribal Health Consortium 2006; ADHSS 2002a; and ADHSS 2011g.
36 As noted in Healthy Alaskans 2010, ―Asthma is a common, chronic respiratory disorder that may include wheezing, shortness of breath, cough, and pain or tightness in the chest. Asthma can be prevented and controlled by avoiding triggers (tobacco smoke, allergens, pollutants, and infections) and the use of appropriate medications.‖ (ADHSS 2002b).
Alaska Stand Alone Gas Pipeline 5.15-115 Final EIS
example, sedentary lifestyles, diet, obesity, smoking, second hand smoke and exposure to
criteria pollutants are risk factors for asthma and cardiovascular disease (BLM 2007; ADHSS
1997). Lifestyle, diet, obesity, and age are risk factors for diabetes (Islam-Zwart and Cawston
2008; ADHSS 2005). Risk factors for cancer depend upon the type of cancer. Ranked in terms
of mortality in Alaska the four leading types of cancer are lung and bronchus, female breast,
prostate, and colorectal (ADHSS 2006b):
Lung cancer risk factors are primarily related to smoking (including secondhand smoke),
but also include medical conditions (fibrotic lung diseases), age, and exposure to certain
toxic substances, such as asbestos and possibly particulate matter (EPA 2010a; Wood
2011);
Reported risk factors for breast cancer include: age; number of first-degree relatives with
breast cancer; ages at menarche (first menstrual cycle), first birth, and menopause; and
prior breast biopsy for benign breast disease (Chlebowski et al. 2005);
Reported risk factors for prostate cancer include age, race/ethnicity (African Americans
have higher rates), high fat diet, lack of exercise, and family history (Zangwill 2011);
Reported risk factors for colorectal cancers include age, heredity, race/ethnicity (Alaska
Natives have lower incidence rate compared to most other ethnicities (in particular
Caucasians) diet, obesity, being a long-time smoker, alcohol use, and having type-2
diabetes (CDC 2010c; American Cancer Society 2011); and
Reported risk factors for diabetes include weight, fat distribution, inactivity, family history,
race, and age (ADHSS 2003; Mayo Clinic 2011).
Exposure to criteria pollutants can exacerbate and perhaps even cause several of the important
chronic diseases, including asthma, COPD, and cardiovascular diseases. Thus, if the
concentrations of criteria pollutants, particularly fine particulates (PM 2.5), were to exceed the
NAAQS, adverse health effects would result.37 As noted previously, proposed Project
construction activity has the potential to emit particulate matter. However, these emission levels
are unlikely to lead to exceedances of NAAQS. Although the potential exists for a negative
effect, it would be limited and unlikely.
Changes in diet that might result from loss of subsistence resources have the potential to
increase obesity, one of the risk factors for diabetes.
Scoring
Scores shown below are developed using the risk assessment matrix given in Tables 5.15-3
and 5.15-4. Scoring is based on the following judgments:
37
Some would make a stronger statement. The NPR-A EIS notes that substantial health effects might accrue even at levels lower than the NAAQS.

Alaska Stand Alone Gas Pipeline 5.15-116 Final EIS
Health effect score: Low, 0, while increases in prevalence of the chronic diseases listed
here could result in loss of life (from certain chronic illnesses) severe injuries, or chronic
illness that requires intervention, the linkages between these and construction of the
proposed Project are weak. Note that this assessment is consistent with results of the
HIA for Pt. Thomson, which rated this ―low‖ reflecting the possibility that a change in diet
due to possible subsistence losses might lead to increased obesity (ADHSS 2011j);
Duration: High, 2, medium-term, 2.5 years;
Magnitude: Low, 0, those impacted will not be able to adapt to the health impact or to
maintain pre-impact level of health, which would justify a high rating, but the linkage
between proposed Project construction and increases in chronic diseases is weak;
Extent: Low, 0, limited to individual cases;
Severity rating equals sum of scores: 2 from above calculations;
Likelihood rating: Very unlikely 1-10 percent; and
Impact rating from Table 5.15-4 = low (-).
In summary, the negative impact of the construction phase of the proposed Project
within the Non-communicable and
Chronic Disease HEC is estimated to be
low.
Social Determinants of Health
The Northeast NPR-A Supplemental Integrated
Activity Plan / Environmental Impact Statement
(IAP/EIS) contains a useful description of what
is meant by the Social Determinants of Health
(SDH) [BLM 2007; Wernham 2007a]:
An impressive body of data has
demonstrated a direct association
between measurable societal factors
which have been collectively termed the
―social determinants of health‖ (SDH)
and disparate incidence, prevalence,
and mortality rates for most diseases.
The effects of the SDH on disparate
rates of disease often persist even after
controlling for standard risk factors such as smoking rates, cholesterol and blood
pressure levels, and overall poverty. The SDH include factors such as income inequity
within a society, the ―social gradient‖ (or disparities of social class), stress, social
exclusion, decreasing social capital (the social support networks which provide for needs
within a group or community), unemployment, cultural integrity, and environmental

Alaska Stand Alone Gas Pipeline 5.15-117 Final EIS
quality. The World Health Organization provides an excellent review of the data
regarding the importance of the SDH to the health status of populations (Wilkinson and
Marmot, 2003), and much of the current focus within the U.S. Centers for Disease
Control is on addressing health disparities through the determinants of health framework
(see U.S. CDC Social Determinants of Health Working Group, online at
http://www.cdc.gov/socialdeterminants/).
The determinants of health status in North Slope Inupiat communities are complex, and
reflect a wide array of considerations, including genetic susceptibility, behavioral change,
environmental factors, diet, and socio-cultural inputs. The identification of potential
influences on, or ―determinants,‖ of health status is an essential step for public health
programs seeking to address health disparities. With regard to oil and gas development,
state, regional, and village-specific influences on health and health behavior can be
identified.
Although focused on the North Slope, this discussion provides a useful framework to structure
the proposed Project analysis. And, indeed, this framework is used for discussion of possible
impacts associated with the operations phase of the analysis. In evaluating the effects of
construction, however, the operative question is what effects on health (related to SDH) would
result from the 2.5 years of construction activity?
Construction of the proposed Project would have the potential to impact the Social Determinants
of Health HEC if it caused the following to occur:
Change in maternal and child health status (e.g., infant mortality, initiation of prenatal
care, low birth weight, smoking during pregnancy, child abuse, or alcohol use during
pregnancy);
Change in depression/anxiety prevalence;
Change in the substance abuse rate;
Change in the suicide rate;
Change in teen pregnancy rates;
Change in domestic violence and family stress; and
Change in economy and employment.
Adverse changes in any of these variables would certainly be important if they were to occur.
However, as discussed below, these changes are not judged to be likely.

Alaska Stand Alone Gas Pipeline 5.15-118 Final EIS
Maternal Status
Changes to maternal and child health status would have
the potential to occur if women and children in the PACs
experienced a change in nutrition, incidence of non-
communicable disease, access to health care, clean
water and sanitation, or exposure to contaminants or
infectious disease as a result of proposed Project
construction.
Infant Mortality
Consider infant mortality, for example. Figure 5.15-17
below shows the trends in infant mortality for Alaska
Natives, Alaska White, and U.S. White groups from 1981
(a few years after oil began flowing through TAPS)
through 2005 (Toffolon-Weiss et al. 2008). As can be
seen all three trends show a substantial decrease
(improvement) over this time period. Infant mortality rates were substantially higher for Alaska
Natives in the early years, but the gap has decreased over time. It is possible, but unlikely, that
rates for Alaska Natives would have improved even more had there been no oil development.
This is because there has been a significant improvement in health care delivery systems and
outreach activities over this period. There is little reason to believe that proposed Project
construction activities would reverse this progress. A plot of neonatal mortality rates also shows
improvement and a lower gap between Alaska Natives and
Whites in Alaska (Toffolon-Weiss et al. 2008). The trends are
less pronounced for post-neonatal mortality rates and the gap
between Alaska Natives and Whites slightly greater, but even
for this index, rates have decreased for Alaska Natives.
Maternal Smoking
Data are available for the period from 1990 through 1999 for
smoking during pregnancy (ADHSS 2001d). Rates were
higher for Alaskans than those for the U.S. as a whole
throughout this period. Nonetheless, both trends show
decreasing rates of smoking among pregnant mothers. Thus,
existing oil production activities over this period did not lead to
increasing smoking rates and it is difficult to imagine that a
material change in this trend would result from the construction
phase of the proposed Project.
\Child Health Data Book2011: AIaaka Native Edition
AIab Di,j,;.., ofPablic HaIth---

Alaska Stand Alone Gas Pipeline 5.15-119 Final EIS
Source: Toffolon-Weiss et al. 2008.
FIGURE 5.15-17 Infant Mortality (deaths per 1000 live births) for Alaska Natives, Alaska Whites, and the U.S. as a whole from 1981 to 2005.
Alcohol Use during Pregnancy
Data are also available on alcohol use during pregnancy among Alaskans (Alaska Native Tribal
Health Consortium 2008). Figure 5.15-18 (note log scale on Y axis) shows data for Alaska
Natives and Whites over the period from 1996 through 2005. Rates were materially greater for
Alaska Natives over this time period, but the rate of improvement was also greater. As with the
other indices, this trend is encouraging.38
38
One commenter noted that this period was relatively stable in terms of oil and gas in Alaska with no large scale development. This commenter requested that data on alcohol use during pregnancy be reported for earlier years, such as those during the period when TAPS was being constructed. Unfortunately, such data are not available [personal communication Dr. Ellen Provost (Director, Alaska Native Epidemiology Center of Alaska Native Tribal Health Consortium (907) 729-1900 and Dr. Peter Holck (907) 729-4561)]. Maternal alcohol use only started being recorded on birth certificates in 1988 and data are available only as far back as 1991 (Alaska Maternal and Child Health Data Books). There are some discrepancies between these two sources, but both indicate a declining trend over the period covered in Figure 5.15-18. Drs. Provost and Holck also noted that the data on maternal alcohol use is self-reported and that social stigma over maternal alcohol use may have increased over the years, which may bias the data.
20,-----------
18
'" 16..c:
:'=14'"~12
-' 10ooo 8~
~
'" 6"'-
2 4<U
0::: 2
o-!-----,----,--r----r---r-----,-
1981 1983 1985 1987 1989 1991 1993
I---+-AlaSka Native _ Aiasl
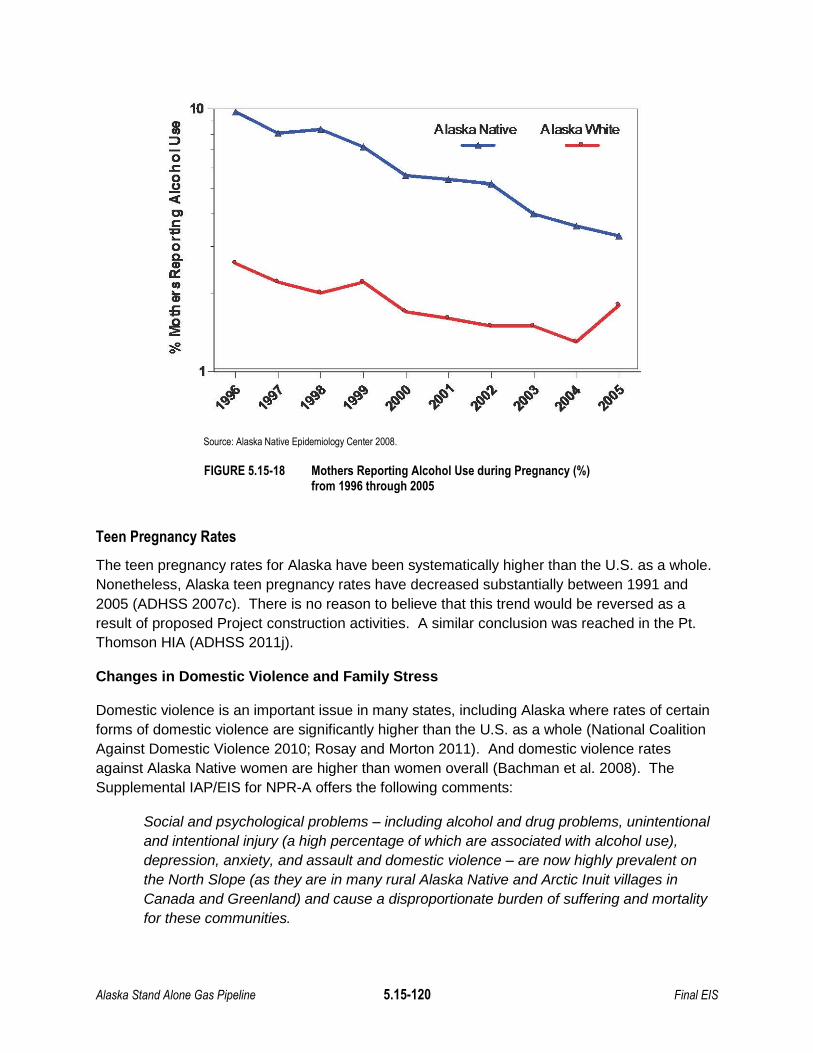
Alaska Stand Alone Gas Pipeline 5.15-120 Final EIS
Source: Alaska Native Epidemiology Center 2008.
FIGURE 5.15-18 Mothers Reporting Alcohol Use during Pregnancy (%) from 1996 through 2005
Teen Pregnancy Rates
The teen pregnancy rates for Alaska have been systematically higher than the U.S. as a whole.
Nonetheless, Alaska teen pregnancy rates have decreased substantially between 1991 and
2005 (ADHSS 2007c). There is no reason to believe that this trend would be reversed as a
result of proposed Project construction activities. A similar conclusion was reached in the Pt.
Thomson HIA (ADHSS 2011j).
Changes in Domestic Violence and Family Stress Domestic violence is an important issue in many states, including Alaska where rates of certain
forms of domestic violence are significantly higher than the U.S. as a whole (National Coalition
Against Domestic Violence 2010; Rosay and Morton 2011). And domestic violence rates
against Alaska Native women are higher than women overall (Bachman et al. 2008). The
Supplemental IAP/EIS for NPR-A offers the following comments:
Social and psychological problems – including alcohol and drug problems, unintentional
and intentional injury (a high percentage of which are associated with alcohol use),
depression, anxiety, and assault and domestic violence – are now highly prevalent on
the North Slope (as they are in many rural Alaska Native and Arctic Inuit villages in
Canada and Greenland) and cause a disproportionate burden of suffering and mortality
for these communities.
10
III A laska Native Alaska White:::> - -0.<:0.Qc(
01I:
""~0a...0::
'"~..:Ii~~0
1

Alaska Stand Alone Gas Pipeline 5.15-121 Final EIS
The NPR-A document also notes:
Research in circumpolar Inuit societies suggests that social pathology and related health
problems, which are common across the Arctic, relate directly to the rapid socio-cultural
changes that have occurred over the same time period.
Social change, both positive and negative is ongoing in Alaska. The relevant question in
connection with the direct effects of this action is whether construction of the proposed Project
would cause or materially exacerbate problems. The size and scope of this proposed Project is
not expected to lead to material adverse impacts, but it is possible that some effects will occur
for families of Alaska residents employed by this Project.
Suicide Rates
Suicide rates are consistently higher for Alaska than the U.S. overall and higher for Alaska
Natives than Alaska Non-Natives (ADHSS 2011k). Year-to-year data are highly variable and
there are no obvious time trends in the data over the period from 1996 to 2005.
Construction of the proposed Project would have the potential to affect depression and anxiety
rates if residents of the PACs located near the proposed Project experienced fear of a
catastrophic incident from development of the proposed Project and/or perceptions that the
proposed Project threatened a way of life. While catastrophic events produce anxiety for local
residents, scoping comments reveal that the most acute anxiety is produced by a perceived loss
of a way of life: loss of cultural identity, loss of historic lands, loss of cultural practices (Alaska
Natives) and general alterations to a rural lifestyle through progressive (cumulative)
development of rural areas of the state.
Researchers have identified and explored the link between losing one‘s way of life and
depression and suicide. As reported by the Substance Abuse and Mental Health Services
Administration (2010):
Drs. Chandler and Lalonde, researchers at the University of British Columbia,
have found a distinct, positive relationship between some particular aspects of
what they refer to as ―cultural continuity‖ and reduced suicide and suicidal
behavior among Native youth. Based on their studies, ―First Nations communities
that succeed in taking steps to preserve their heritage culture and work to control
their own destinies are dramatically more successful in insulating their youth
against the risks of suicide.‖ Their theory is that, when youth have a secure
sense of the past, present, and future of their culture, it is easier for them to
develop and maintain a sense of connectedness to their own future (i.e., self-
continuity).
Chandler and Lalonde have written extensively about self-continuity and the need for a personal
narrative in understanding one‘s place in life, which they contend is closely tied to cultural
continuity and suicide prevention among Native communities. A detailed discussion of this topic
Alaska Stand Alone Gas Pipeline 5.15-122 Final EIS
is beyond the scope of this document but can be found in a series of articles by the researchers
and available online at http://web.uvic.ca/~lalonde/manuscripts.
As an alternative viewpoint, some contend that employment opportunities associated with ASAP
might have a beneficial impact (Statewide Suicide Prevention Council 2010):
The availability of jobs and economic opportunities has a lot to do with personal
feelings of self-worth and the health of a community. Research has documented
a connection between unemployment, poverty and other social determinants and
low self-esteem, anxiety, and isolation.26 Unemployment and economic distress
are factors that can increase the risk of suicide.27 Review of Alaska’s
unemployment data shows a weak connection between unemployment and
suicide rates.
Changes in Economy or Employment
These are discussed in the section on socioeconomics (Section 5.12). Construction of the
proposed Project would create employment opportunities for construction workers, Alaskans
and non-Alaskans alike. The POD notes:
The Project could provide employment opportunities for isolated communities that
currently have high unemployment rates. In addition, first-class cities and first-class
boroughs with taxing authority may have the opportunity to generate tax revenue.
Clearly domestic violence, family stress, and suicide rates are potentially important and should
not be dismissed out of hand. Construction activities on the proposed Project will provide jobs
for Alaskans and others, probably including some from the PACs--a benefit. But these jobs
involve work schedules that have the potential to disrupt family life. (For references on the
effects of rotating shift work see studies by Bianchi 2011; Davis et al. 2008; Leupp et al. 2010;
Perry-Jenkins et al. 2007; Kalil et al. 2010; Tausig and Fenwick 2011 as well as numerous
anecdotal sources. For references specifically related to Fly In Fly Out [FIFO] work schedules
and lifestyle and family issues see Beach and Cliff 2003; Carson and Taylor 2012; Clifford 2009;
Gallegos n.d.; Storey 2010; Taylor and Simmonds, 2009 and contained references.) And
families of non-workers might be affected without enjoying the benefits of employment. The
relevant issue is the extent to which the construction phase of this proposed Project is likely to
have material adverse health effects. Based on the overall size and timeline of the proposed
Project these effects are judged to be medium, as shown in the detailed scoring results given
below.
Scoring
Scores shown below are developed using the risk assessment matrix given in Tables 5.15-3
and 5.15-4. Scoring is based on the following judgments:
Health effect score: High, 2.This score is judged appropriate because present trends in
most indicators (see above) are encouraging. Increases in suicide rates or domestic
violence would certainly be significant if they were to occur. Nonetheless, there is not

Alaska Stand Alone Gas Pipeline 5.15-123 Final EIS
expected to be a direct linkage between the construction of the proposed Project (alone)
and increased suicide or domestic violence rates. As possible points of reference, the
HIA prepared for the Pt. Thomson EIA concluded (depending upon the alternative
selected) that there would be no impact or a low impact, whereas the Wernham (2007b)
HIA also on North Slope development concluded that the Project ―carried a high risk of
adverse impacts on rates of social pathology because of planned development in a
region of great cultural and practical importance to the surrounding communities‖;
Duration: High, 2, medium-term, 2.5 years;
Magnitude: Very high, 3, those impacted (however few) will not be able to adapt to the
health impact or to maintain pre-impact level of health;
Extent: Medium, 1, limited to households;
Severity rating equals sum of scores: 8 from above calculations;
Likelihood rating: Unlikely 10-33 percent; and
Impact rating from Table 5.15-4 = medium (-).
In summary, the negative impact of the construction phase of the proposed Project
within the Social Determinants of Health HEC is estimated to be medium.
Operations and Maintenance
Each of the specific headings shown below have HECs that correspond to those discussed in
the assessment of construction impacts and are not duplicated here.
This section addresses post-construction impacts of the proposed Project during the operations
phase. Negative impacts are not expected to be material (see below) and positive impacts very
significant, particularly for residents of Fairbanks (see the cumulative effects discussion). These
benefits would result from reduced PM 2.5 emissions from household heating units because
clean burning natural gas would be substituted for other fossil fuels and wood in many cases. In
addition, Fairbanks residents would save money because of lower heating costs.
Compared to the construction phase where the peak number of workers was 6,400, the number
of workers required for day-to-day operations (50) is almost negligible.
As stated in the POD, the O&M facilities include:
Three O&M facilities are planned for the ASAP, one at the GCF in Prudhoe Bay, one in
Fairbanks, and one at the Cook Inlet NGL Facility in Wasilla. Each location will include
office facilities, a maintenance garage, and both warm and cold warehouse space. The
Wasilla O&M facility will also house the pipeline control systems. Each O&M facility will
be accessible via road and will have sufficient parking for staff, visitors, and maintenance
vehicles.
Alaska Stand Alone Gas Pipeline 5.15-124 Final EIS
In contrast to the exposure pathways associated with the construction phase identified in the CSM, fugitive
dust emissions would be much smaller (no earthmoving and much lower truck traffic) during the operations
phase. There would be no construction camps and associated wastewater discharges etc.
Water and Sanitation
As described under the subheading Exposure to Hazardous Materials, operation of the
proposed Project would probably not increase exposure of the PACs to toxic and hazardous
substances. Therefore, effects to water quality due to the use of hazardous materials in the
proposed Project are not anticipated. Under the CWMP, which would be developed for the
proposed Project, solid waste would be reused, recycled, burnt, or disposed of in accordance
with applicable regulations. Operation of the proposed Project would therefore have negligible
effects on water quality.
The AGDC has indicated that it would require the use of water for operations and maintenance;
however, estimates of the amount of water required or potential sources for that water have not
been provided. The AGDC would need to obtain the necessary permits prior to water
withdrawal, thereby minimizing any potential effects to potable water supplies. It is anticipated
that the operations and maintenance of the facilities and infrastructure planned for development
of the proposed Project would require only 58 workers, with most workers concentrated at the
facilities near Prudhoe Bay, Fairbanks, and Cook Inlet. The increased demand on existing
water and sanitation infrastructure would be negligible.
Scoring
Scores shown below are developed using the risk assessment matrix given in Tables 5.15-3
and 5.15-4. Scoring is based on the following judgments:
Health effect score: Medium, 1. The effect might result in annoyance, minor injuries, or
illnesses that do not require intervention;
Duration: Very high, 3, long-term, 30 years;
Magnitude: Low, 0, effect is judged to have minor intensity;
Extent: Low, 0, limited to individual cases;
Severity rating equals sum of scores: 4 from above calculations;
Likelihood rating: Unlikely 10-33 percent; and
Impact rating from Table 5.15-4 = low (-).
In summary, the negative impact of the operations and maintenance phase of the
proposed Project within the Water and Sanitation HEC is estimated to be low.
Alaska Stand Alone Gas Pipeline 5.15-125 Final EIS
Accidents and Injuries
Accidents and injuries include occupational injuries (those suffered by proposed Project
personnel) and those that could be incurred by non-employees. Considering the relative
number of proposed Project employees and contractors that would be involved in this phase
compared to the number during construction, the occupational injuries Projected for the
construction activity are unlikely to be material.
Accidents/injuries to members of the general public would likewise likely be few in number.
Accidents/injuries resulting from leaks, fires, or explosions would be minimized as a result of the
proposed Project safety program. According to the POD, this includes:
The ASAP will be designed, constructed, operated, and maintained in accordance the
requirements of the Pipeline and Hazardous Materials Safety Administration (PHMSA)
within the U.S. Department of Transportation. These requirements are included in 49
CFR Subtitle B and are intended to ensure adequate protection for the public from
natural gas pipeline failures. The ASAP will meet or exceed these requirements. These
requirements address:
o Pipeline safety programs and rulemaking procedures (49 CFR Part 190) o Annual reports, incident reports, and safety-related condition reports for
natural gas pipelines (49 CFR Part 191) o Minimum federal safety standards for transportation of natural gas by
pipeline (49 CFR Part 192)
An O&M Plan will be developed as discussed in Section 10.1 and a Safety Plan will be
developed as discussed in Section 7.10. O&M will be performed in a manner that is
protective of personal health, safety, and is protective of the environment.
Damage Prevention
A Damage Prevention Program as identified in 49 CFR 192.614 will be implemented to
prevent damage from excavation activities, including excavation, blasting, boring,
tunneling, backfilling, the removal of aboveground structures by either explosive or
mechanical means, and other earthmoving operations. As part of the Damage
Prevention Program, the pipeline operator would participate in the state one-call system
for excavators to call for excavation activities (utility locates) as required by 49 CFR
192.614. Participation in the one-call system may not be necessary if access to the
pipeline is physically controlled by the operator.
Public Awareness
The operator of ASAP will develop a public education program that follows the American
Petroleum Institute’s (API) Recommended Practice 1162. The education program will
include provisions on the one-call notification system (utility locate), hazards associated
with an unintended release and indications that a release has occurred, and reporting
procedures and steps to be taken if a release occurs.
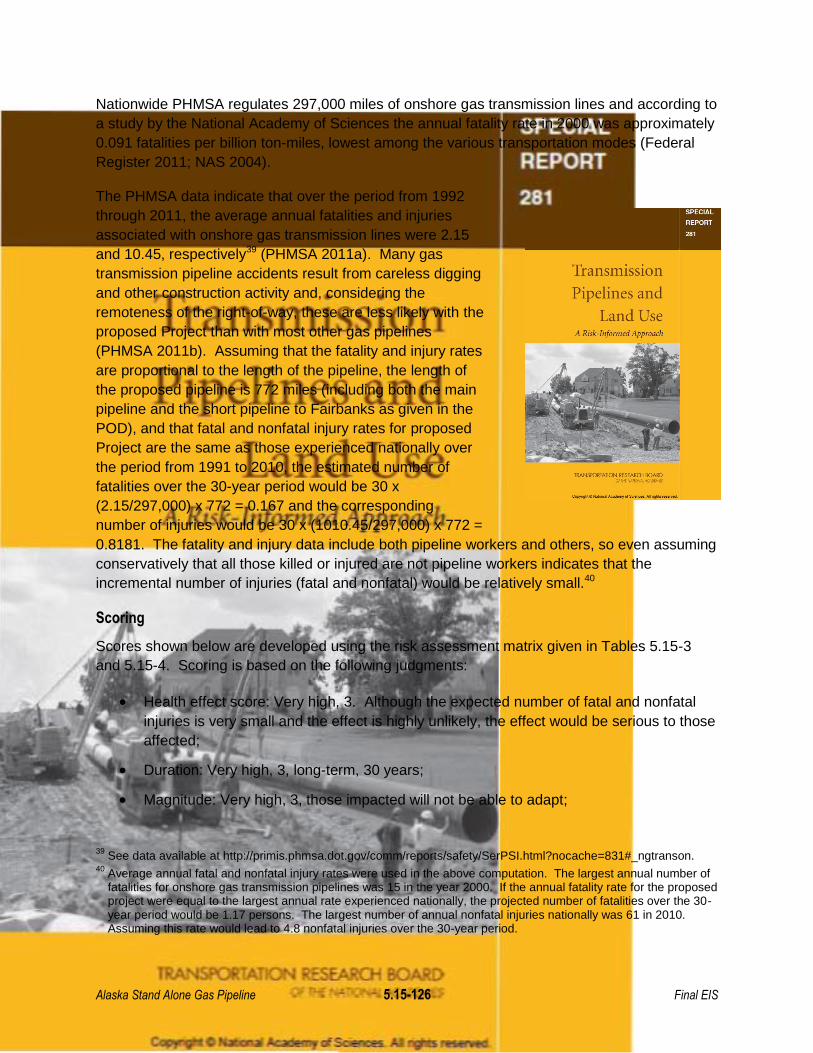
Alaska Stand Alone Gas Pipeline 5.15-126 Final EIS
Nationwide PHMSA regulates 297,000 miles of onshore gas transmission lines and according to
a study by the National Academy of Sciences the annual fatality rate in 2000 was approximately
0.091 fatalities per billion ton-miles, lowest among the various transportation modes (Federal
Register 2011; NAS 2004).
The PHMSA data indicate that over the period from 1992
through 2011, the average annual fatalities and injuries
associated with onshore gas transmission lines were 2.15
and 10.45, respectively39 (PHMSA 2011a). Many gas
transmission pipeline accidents result from careless digging
and other construction activity and, considering the
remoteness of the right-of-way, these are less likely with the
proposed Project than with most other gas pipelines
(PHMSA 2011b). Assuming that the fatality and injury rates
are proportional to the length of the pipeline, the length of
the proposed pipeline is 772 miles (including both the main
pipeline and the short pipeline to Fairbanks as given in the
POD), and that fatal and nonfatal injury rates for proposed
Project are the same as those experienced nationally over
the period from 1991 to 2010, the estimated number of
fatalities over the 30-year period would be 30 x
(2.15/297,000) x 772 = 0.167 and the corresponding
number of injuries would be 30 x (1010.45/297,000) x 772 =
0.8181. The fatality and injury data include both pipeline workers and others, so even assuming
conservatively that all those killed or injured are not pipeline workers indicates that the
incremental number of injuries (fatal and nonfatal) would be relatively small.40
Scoring
Scores shown below are developed using the risk assessment matrix given in Tables 5.15-3
and 5.15-4. Scoring is based on the following judgments:
Health effect score: Very high, 3. Although the expected number of fatal and nonfatal
injuries is very small and the effect is highly unlikely, the effect would be serious to those
affected;
Duration: Very high, 3, long-term, 30 years;
Magnitude: Very high, 3, those impacted will not be able to adapt;
39
See data available at http://primis.phmsa.dot.gov/comm/reports/safety/SerPSI.html?nocache=831#_ngtranson. 40
Average annual fatal and nonfatal injury rates were used in the above computation. The largest annual number of fatalities for onshore gas transmission pipelines was 15 in the year 2000. If the annual fatality rate for the proposed project were equal to the largest annual rate experienced nationally, the projected number of fatalities over the 30-year period would be 1.17 persons. The largest number of annual nonfatal injuries nationally was 61 in 2010. Assuming this rate would lead to 4.8 nonfatal injuries over the 30-year period.
Transmission
Pipelines and
Land UseA Risk-/"Jomled Approach
_______""-M ---'

Alaska Stand Alone Gas Pipeline 5.15-127 Final EIS
Extent: Low, 0, limited to individual cases;
Severity rating equals sum of scores: 9 from above calculations;
Likelihood rating: Extremely unlikely < 1 percent; and
Impact rating from Table 5.15-4 = medium (-).
In summary, the negative impact of the operations and maintenance phase of the
proposed Project within the Accidents and Injuries HEC is estimated to be medium.
Health Infrastructure and Delivery
Adverse impacts on health infrastructure
and delivery systems would be expected
only if proposed Project operations were
to result in increased injuries from
pipeline accidents or increased need for
medical services. The above
calculations indicate that injuries from
pipeline accidents are expected to be
relatively few in number. Moreover (see
discussions of exposure to hazardous
materials and non-communicable and
chronic disease below) the operation of the pipeline has the potential to reduce demand for
medical services in Fairbanks, which would be a beneficial impact.
The HIA prepared for the Pt. Thomson Project concluded that there would be positive impacts
on health infrastructure and delivery, an indirect consequence of incremental revenues from that
Project, which would also be true for the proposed Project.
Scoring
Scores shown below are developed using the risk assessment matrix given in Tables 5.15-3
and 5.15-4. Scoring is based on the following judgments:
Health effect score: Low, 0;
Duration: Very high, 3, long-term, 30 years;
Magnitude: Low, 0, effects are of minor intensity;
Extent: Low, 0, limited to individual cases;
Severity rating equals sum of scores: 3 from above calculations;
Likelihood rating: Extremely unlikely < 1 percent; and
Impact rating from Table 5.15-4 = low (-).
III.
Alaska Stand Alone Gas Pipeline 5.15-128 Final EIS
In summary, the negative impact of the operations and maintenance phase of the proposed
Project within the Health Infrastructure and Delivery HEC is estimated to be low.
Exposure to Hazardous Materials
Section 5.16 (Air Quality) describes the fugitive dust, criteria pollutants, and VOCs that would be
generated by the proposed Project. With respect to natural gas pipeline operations, the pipeline
alone generally does not have any significant air emissions associated with its operation. There
could be fugitive emissions from pipeline connections (i.e., valves). Such emissions would be
generally very minor in nature and typically would not be subject to the requirement to obtain a
permit.
Operation of the GCF and compressor stations would emit combustion-related pollutants such
as NOx, CO, PM, VOCs, and SO2. Preliminary emission estimates trigger the need for those
facilities to obtain prevention of significant deterioration (PSD) and Title V operating permits. As
discussed in Section 5.16 (Air Quality), upon meeting the permit requirements, the proposed
Project as permitted by the ADEC would not cause or contribute to a violation of any federal,
state, or local air quality standards. Therefore, operation of the proposed Project should not
significantly increase exposure of the PACs to these substances.
Other toxic and hazardous substances that would be generated by proposed Project operations
include some components of natural gas and NGLs (isobutene, pentanes, hexanes, hydrogen
sulfide, butane, and ethane), as well as pesticides, paints, solvents, petroleum products, and
fertilizers. As described under the Construction subheading, the proposed Project would be
subject to numerous regulations regarding the use of toxic and hazardous materials. In addition
to complying with these regulations, proposed Project operations would also follow a CWMP,
SPCP, and a SPCCP. Therefore, operation of the proposed Project should not lead to
exposure of the PACs to these substances.
Finally, operation of ASAP would result in various emissions when the natural gas was
ultimately consumed in Fairbanks, Anchorage, and other cities. Compared to present emission
levels, these emissions are expected to be much smaller. The benefits are discussed in the
cumulative effects section.
Scoring
Scores shown below are developed using the risk assessment matrix given in Tables 5.15-3
and 5.15-4. Scoring is based on the following judgments:
Health effect score: Low, 0, the effect is unlikely to be perceptible. This assumes
compliance with NAAQS;
Duration: Very high, 3, long-term, 30 years;
Magnitude: Low, 0, effects are of minor intensity;
Extent: Low, 0, limited to individual cases;

Alaska Stand Alone Gas Pipeline 5.15-129 Final EIS
Severity rating equals sum of scores: 3 from above calculations;
Likelihood rating: Extremely unlikely < 1 percent; and
Impact rating from Table 5.15-4 = low (-).
In summary, the negative impact of the operations and maintenance phase of the
proposed Project within the Exposure to Hazardous Materials HEC is estimated to be
low.
Food, Nutrition, and Subsistence
These are potentially important for both health and lifestyle reasons. However, even during the
construction phase these were not determined to be significant. During the operations phase
far fewer people are required, which would lead to even lower impacts.
A cleared ROW and the construction of new access roads could attract additional harvesters
who use off highway vehicles (OHVs) to the proposed Project area. Increased access in areas
that do not follow existing transportation or utility corridors, particularly between the TAPS
corridor and Parks Highway in the Minto Flats vicinity could have an impact on subsistence
uses. These impacts would have the greatest potential effect on the nearby communities of
Minto and Nenana that have documented use of this area. Due to their proximity, Livengood
subsistence users might also be affected. However, as during the construction phase, within
the limits of present law, the proposed Project could reduce the possibility for competition for
subsistence resources between traditional users and pipeline workers by following the standard
practice of prohibiting workers from hunting or fishing while on the job or when company
transportation has been used to bring them to a remote site. Workers could obtain licenses for
hunting as do any other visitors to Alaska but must provide/obtain their own transportation (see
the discussion of applicable hunting and fishing stipulations in the discussion of construction
impacts).
New access roads and increased traffic and noise from aerial and ground-based pipeline
inspections have the potential to displace and reduce the availability of terrestrial wildlife for
subsistence uses. Indeed, such activity is required as part of stipulation 1.8 in the stipulations
document associated with the proposed Project (ADCG 2011a):
1.8 Surveillance and Monitoring
1.8.1 A Surveillance and Monitoring Program for the Pipeline shall be approved by the
Pipeline Coordinator prior to start-up of the Pipeline. The program shall be designed to
at a minimum:
(a) Provide for and protect public health and safety;
(b) Prevent and mitigate damage to natural resources;
(c) Prevent and mitigate erosion;

Alaska Stand Alone Gas Pipeline 5.15-130 Final EIS
(d) Maintain Pipeline integrity and monitor any Pipeline movement that may affect
integrity (Stipulation 3.11); and
(e) Protect public and private property.
A detailed surveillance program has not yet been established, but such a program could include
aerial overflights and other physical inspections.
Fish availability could also be affected during O&M from the chilled pipeline, which could reduce
the water temperature at stream crossings and affect fish behavior or cause direct effects on
fish habitat. In addition, resource availability would also be reduced in the unlikely event that a
leak in the pipeline led to a forest fire. As noted previously, gas transmission accidents are
relatively rare.
Concern of contamination, risk of fires, decreased resource availability, and increased
competition along certain parts of the proposed ROW near Minto Flats would have potential
indirect implications for hunters‘ efforts, costs, and risks associated with having to travel to other
places in search of resources or obtaining substitute foods. Therefore, O&M of the proposed
Project could lead to a decrease in the amount of dietary consumption of subsistence
resources, resulting in a change in the composition of diet and a decrease in food security.
These effects would be negligible for most subsistence users given that the proposed Project
ROW generally follows existing or officially designated transportation and utility corridors.
Effects would be greater in the area around Minto Flats (primarily affecting subsistence users in
Minto, Nenana, and Livengood), which is largely undeveloped.
The above conclusions are consistent with the findings of the ANILCA Section 810 Analysis of
Subsistence Impacts discussed above in the section dealing with construction impacts and in
Appendix L. Specifically, as noted above Appendix L offers the following conclusion regarding
effects of ASAP:
The proposed activity would not significantly restrict subsistence uses and needs
in or near the proposed activity area.
Scoring
Scores shown below are developed using the risk assessment matrix given in Tables 5.15-3
and 5.15-4. Scoring is based on the following judgments:
Health effect score: Medium, 1;
Duration: Very high, 3, long-term, 30 years;
Magnitude: High, 2, Those impacted will be able to adapt to the health impact with some
difficulty and will maintain pre-impact level of health with support;
Extent: High, 2, as some communities (e.g., Minto) might be impacted;
Severity rating equals sum of scores: 8 from above calculations;

Alaska Stand Alone Gas Pipeline 5.15-131 Final EIS
Likelihood rating: Unlikely 10-33 percent; and
Impact rating from Table 5.15-4 = medium (-).
In summary, the negative impact of the operations and maintenance phase of the
proposed Project within the Food, Nutrition, and Subsistence HEC is estimated to be
medium.
Infectious Diseases
Possible impacts of infectious diseases are discussed in some detail in the corresponding
section on construction impacts. For the O&M phase the number of workers is very much
smaller and so too would be the possible impacts. Moreover, unlike the case with the
construction phase, where workers might include those from out of state, it is likely that all or
nearly all of the workers would be Alaska residents.
Scoring
Scores shown below are developed using the risk assessment matrix given in Tables 5.15-3
and 5.15-4. Scoring is based on the following judgments:
Health effect score: High, 2, because those affected may require medical treatment in
the event they develop an infectious disease;
Duration: Very high, 3, long-term, 30 years;
Magnitude: High, 2, affected individuals should be able to adapt, but may require
medical intervention;
Extent: Low, 0, as this would be limited to individual cases;
Severity rating equals sum of scores: 7 from above calculations;
Likelihood rating: Very unlikely 1-10 percent, because the number of workers involved in
operations is very much smaller than the number of construction workers; and
Impact rating from Table 5.15-4 = medium (-).
In summary, the negative impact of the operations and maintenance phase of the
proposed Project within the Infectious Diseases HEC is estimated to be medium.
Non-communicable and Chronic Disease
It is likely that any impacts of operation of the proposed Project on non-communicable diseases
would be positive, chiefly because of improvements in air quality in Fairbanks resulting from
probable decreases in the frequency of exceedances of the PM 2.5 NAAQS. However,
realization of these benefits would require expansion of the gas distribution network in
Fairbanks. Therefore, this topic is presented in the cumulative effects section. The scoring
given immediately following addresses impacts on non-communicable and chronic diseases

Alaska Stand Alone Gas Pipeline 5.15-132 Final EIS
associated with the proposed Project only and does not address the impacts if the gas
distribution system in either Fairbanks or Anchorage is expanded.
Scoring
Scores shown below are developed using the risk assessment matrix given in Tables 5.15-3
and 5.15-4. Scoring is based on the following judgments:
Health effect score: Low, 0, while increases in prevalence of the chronic diseases listed
here could result in loss of life (from certain chronic illnesses), severe injuries, or chronic
illness that requires intervention, the linkage between these and operations and
maintenance of the proposed Project is weak;
Duration: Very High, 3, long-term, 30 years;
Magnitude: Low, 0, those impacted will not be able to adapt to the health impact or to
maintain pre-impact level of health, which would justify a high rating, but the linkage
between proposed Project operations and increases in chronic diseases is weak;
Extent: Low, 0, limited to individual cases;
Severity rating equals sum of scores: 3 from above calculations;
Likelihood rating: Very unlikely 1-10 percent; and
Impact rating from Table 5.15-4 = low (-).
In summary, the negative impact of the operations and maintenance phase of the
proposed Project within the Non-communicable and Chronic Disease HEC is estimated
to be low.
Note that this assessment changes when the benefits associated with the expansion of the gas
distribution system are included.
Social Determinants of Health
The possible impacts of the proposed Project on social determinants of health during the
construction phase are discussed above. During that 2.5-year period as many as 6,400 workers
would be engaged in construction activities. During the 30-year operations and maintenance
phase 50 – 75 workers are planned. So effects related to the presence of workers are not at
issue.
Perhaps of greatest potential concern would be possible impacts on subsistence arising in
selected PACs (e.g., Minto, Nenana, and Livengood, see Section 5.14). Subsistence is
important in several contexts including health and sociocultural impacts. Section 5.14 also
notes:
After construction, increased user access along the proposed Project ROW in the Minto
Flats will be a long-term concern and could affect subsistence uses. A cleared ROW
may attract additional harvesters to an area who use off road vehicles (e.g.,

Alaska Stand Alone Gas Pipeline 5.15-133 Final EIS
snowmachines and ATVs) to travel along the ROW. Because the proposed Project
ROW generally follows existing or officially designated transportation and utility corridors
including the TAPS corridor and Parks Highway, an increase in user access and in
additional harvesters would not be expected in these areas. However, increased access
in areas that do not follow existing transportation or utility corridors, particularly between
the TAPS corridor and Parks Highway in the Minto Flats vicinity, could have an impact
on subsistence uses. These impacts would have the greatest effect on the nearby
communities of Minto and Nenana who have documented use of this area. Due to their
proximity, Livengood subsistence users would also likely be affected. Preventative
access measures such as boulders, berms, or fencing will be used to limit access to the
Proposed Project ROW…These preventative measures would help lessen the impact of
increased use along the ROW although would not likely eliminate the impact.
Section 5.14 raises the possibility that pipeline leaks could become ignited and increase the
severity of forest fires, which could adversely affect subsistence resources. Whether or not this
is likely, the possibility could increase anxiety among residents of PACs. This problem would be
greatest in the summer, when wildfires are more frequent.
One relevant aspect of the potential for leaks is the system(s) that will be used to detect and
respond to leaks. The POD (see pg. 93) offers the following comments on leak detection and
response:
A Supervisory Control and Data Acquisition (SCADA) system will be implemented to
collect measurements and data along the pipeline, including flow rate through the
pipeline, operational status, pressure, and temperature readings. This information may
all be used to assess the status of the pipeline.
The SCADA system will provide pipeline personnel with real-time information about
equipment malfunctions, leaks, or any other unusual activity along the pipeline.
The pipeline operator will develop and implement an Emergency Response Plan in
accordance with 49 CFR 192.615 to minimize the hazards resulting from a pipeline
emergency, including a leak. The Emergency Response Plan will at a minimum
include:
o Procedures for receiving, identifying, and classifying notices of events
which require immediate response by the operator;
o Procedures for notifying fire, police, and other public officials as
necessary; establishing and maintaining adequate means of
communication with appropriate officials; and coordinating responses in
the event of an emergency;
o Procedures for the prompt and effective response to a notice of
emergency events, including gas detection inside or near a building, fire
near or involving the pipeline or related facilities, explosions near or
involving the pipeline or related facilities, or a natural disaster;
Alaska Stand Alone Gas Pipeline 5.15-134 Final EIS
o Availability of personnel, equipment, tools, and materials needed at the
scene of an emergency;
o Procedures for emergency shutdown and pressure reduction in any
section of the pipeline system as necessary to minimize hazards to life or
property; and
o Procedures for protecting life and property in the event of an emergency.
A second relevant aspect is the probable frequency of gas leaks. Data are available from
PHMSA on the frequency of ―significant pipeline incidents‖, which includes pipeline leaks. Over
the 20-year period from 1992 through 2011, the number of significant pipeline incidents on the
297,000 miles41 of onshore gas transmission lines averaged 45.2 per year (PHMSA 2011a). If
the proposed Project experienced a comparable rate the expected number of significant
incidents per year would be (45.2/297,000) x 772 = 0.12. This estimate might overstate the
potential for leaks because many are related to corrosion (at least in the initial years) or
disturbance by digging activities and these would be expected to be less of an issue for a new
pipeline located in a remote area. Moreover, not all leaks would become ignited.
Scoring
Scores shown below are developed using the risk assessment matrix given in Tables 5.15-3
and 5.15-4. Scoring is based on the following judgments:
Health effect score: Medium, 1 because of the possibility of an increase in prevalence of
depression and anxiety;
Duration: Very high, 3, long-term, 30 years;
Magnitude: High, 2, affected individuals should be able to adapt, but may require
medical intervention. This is a conservative estimate;
Extent: High, 2, as this might affect entire PACs;
Severity rating equals sum of scores: 8 from above calculations;
Likelihood rating: Judged to be Very unlikely 1-10 percent; and
Impact rating from Table 5.15-4 = medium (-).
In summary, the negative impact of the operations and maintenance phase of the
proposed Project within the Social Determinants of Health HEC is estimated to be
medium.
41
See Advance Notice of Proposed Rulemaking by the PHSMA published on Thursday August 25, 2011 in the Federal Register (76 FR 53086).

Alaska Stand Alone Gas Pipeline 5.15-135 Final EIS
Summary and Discussion
Table 5.15-37 summarizes the impact ratings for effects on public health associated with the
proposed Project. Technically, the impact ratings for non-communicable and chronic diseases
for operation of the proposed Project belong in the discussion of cumulative effects—and are
placed there (see below), because expansion of the gas distribution system in Fairbanks is
required. Nonetheless a major purpose of the proposed Project is to provide low cost and clean
burning natural gas to Fairbanks (and other communities). Therefore, the health impacts of the
proposed Project are included in the operation section.
TABLE 5.15-37 Summary of Impact Rankings for Effects on Public Health Associated with the Proposed Project
Category HEC considered
Project Phase
Construction
Operations and
Maintenance
Water and
sanitation
Change in potable water access,
Change in water quantity,
Change in water quality, and
Change in demand on water and sanitation infrastructure due to the influx
of non-resident workers.
Low (-) Low (-)
Accidents and
Injuries
Change in unintentional injury (e.g., drowning, falls, snow machine injury)
rates: Construction activities will not impact injury rates in the PACs.
Change in roadway incidents and injuries: This is addressed below
related to possible injuries related to operation of trucks and buses
associated with construction activities.
Changes to safety during subsistence activities: There are no data to
support the hypothesis that safety of participants engaged in subsistence
activities would be positively or negatively impacted.
Medium (-) Medium (-)
Health
Infrastructure and
Delivery
Change in number or quality of clinics and staff: Medical technicians will
be available at each construction camp, but their purpose is to attend
those engaged in proposed Project construction activities.
Change in services offered (e.g. prenatal checks, x-ray, and lab services):
The ASAP program is not intended to provide these services.
Change in accessibility of health care.
Change in utilization/clinic burden from non-resident influx: This is
addressed in the discussion of accident rates for workers (see below).
Low (-) Low (-)
Exposure to
Hazardous
Materials
Changes in physiologic contaminant levels such as fugitive dust, criteria
pollutants, persistent organic pollutants, and volatile organic compounds,
and
Changed levels of the same substances in subsistence resources.
Low (-) Low (-)
Food, Nutrition,
and Subsistence
Change in amount of dietary consumption of subsistence resources,
Change in composition of diet, and
Change in food security,
Medium (-) Medium (-)
Infectious
Diseases
Change in transmission of pediatric acute respiratory disease rates,
Change in acute adult respiratory disease rates (TB, Bronchitis, Influenza),
Change in sexually transmitted diseases (STD) rates (e.g. Chlamydia,
gonorrhea, HIV),
Change in GID outbreaks, and
Change in antibiotic-resistant staph skin infections.
Medium (-) Medium (-)
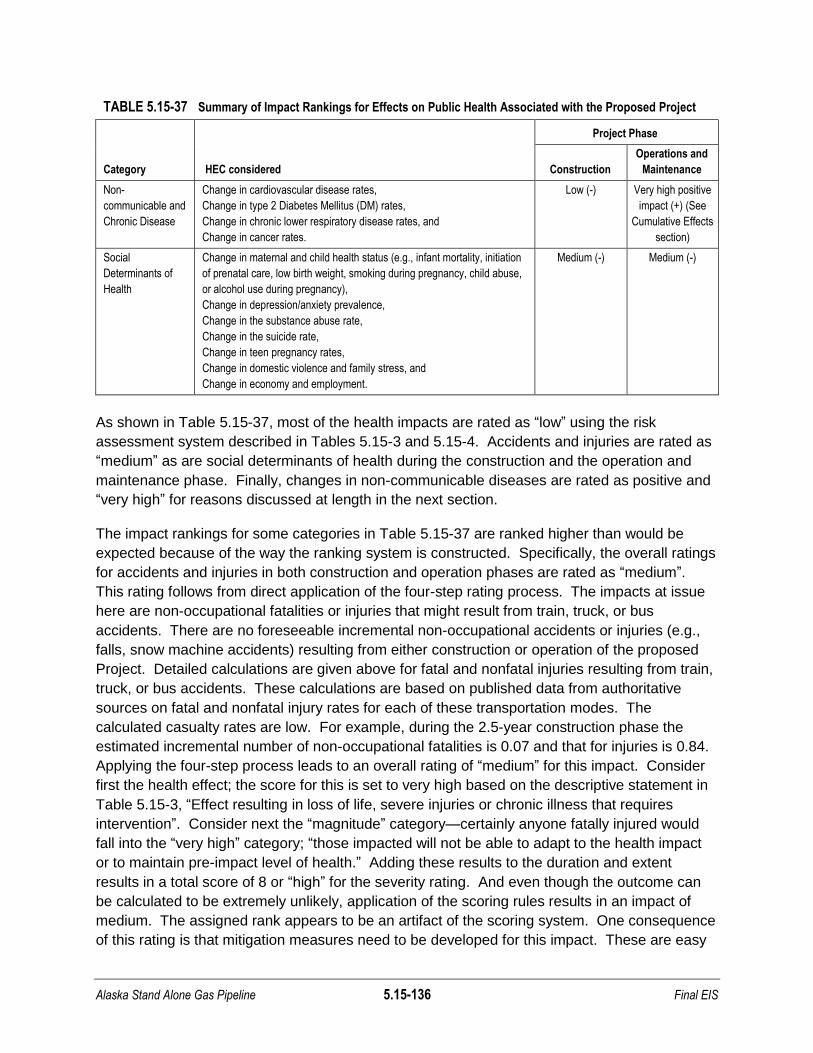
Alaska Stand Alone Gas Pipeline 5.15-136 Final EIS
TABLE 5.15-37 Summary of Impact Rankings for Effects on Public Health Associated with the Proposed Project
Category HEC considered
Project Phase
Construction
Operations and
Maintenance
Non-
communicable and
Chronic Disease
Change in cardiovascular disease rates,
Change in type 2 Diabetes Mellitus (DM) rates,
Change in chronic lower respiratory disease rates, and
Change in cancer rates.
Low (-) Very high positive
impact (+) (See
Cumulative Effects
section)
Social
Determinants of
Health
Change in maternal and child health status (e.g., infant mortality, initiation
of prenatal care, low birth weight, smoking during pregnancy, child abuse,
or alcohol use during pregnancy),
Change in depression/anxiety prevalence,
Change in the substance abuse rate,
Change in the suicide rate,
Change in teen pregnancy rates,
Change in domestic violence and family stress, and
Change in economy and employment.
Medium (-) Medium (-)
As shown in Table 5.15-37, most of the health impacts are rated as ―low‖ using the risk
assessment system described in Tables 5.15-3 and 5.15-4. Accidents and injuries are rated as
―medium‖ as are social determinants of health during the construction and the operation and
maintenance phase. Finally, changes in non-communicable diseases are rated as positive and
―very high‖ for reasons discussed at length in the next section.
The impact rankings for some categories in Table 5.15-37 are ranked higher than would be
expected because of the way the ranking system is constructed. Specifically, the overall ratings
for accidents and injuries in both construction and operation phases are rated as ―medium‖.
This rating follows from direct application of the four-step rating process. The impacts at issue
here are non-occupational fatalities or injuries that might result from train, truck, or bus
accidents. There are no foreseeable incremental non-occupational accidents or injuries (e.g.,
falls, snow machine accidents) resulting from either construction or operation of the proposed
Project. Detailed calculations are given above for fatal and nonfatal injuries resulting from train,
truck, or bus accidents. These calculations are based on published data from authoritative
sources on fatal and nonfatal injury rates for each of these transportation modes. The
calculated casualty rates are low. For example, during the 2.5-year construction phase the
estimated incremental number of non-occupational fatalities is 0.07 and that for injuries is 0.84.
Applying the four-step process leads to an overall rating of ―medium‖ for this impact. Consider
first the health effect; the score for this is set to very high based on the descriptive statement in
Table 5.15-3, ―Effect resulting in loss of life, severe injuries or chronic illness that requires
intervention‖. Consider next the ―magnitude‖ category—certainly anyone fatally injured would
fall into the ―very high‖ category; ―those impacted will not be able to adapt to the health impact
or to maintain pre-impact level of health.‖ Adding these results to the duration and extent
results in a total score of 8 or ―high‖ for the severity rating. And even though the outcome can
be calculated to be extremely unlikely, application of the scoring rules results in an impact of
medium. The assigned rank appears to be an artifact of the scoring system. One consequence
of this rating is that mitigation measures need to be developed for this impact. These are easy

Alaska Stand Alone Gas Pipeline 5.15-137 Final EIS
enough to devise (as shown in Section 5.15-5) and having a road safety program is not unduly
burdensome.
Now consider ―infectious disease‖ impacts. Applying the same scoring rules leads to an overall
rating of ―medium‖ for this impact during both construction and operations phases. Based on
the extensive discussion above, this rating is plausible. Providing free vaccinations and a health
outreach program on STDs for construction workers is recommended above—and the expected
outcomes would fully justify mitigation efforts. The reader should ponder the following
question; ―At the margin, which program is likely to provide greater benefits, an immunization
program for such diseases as influenza and hepatitis A and B, or a road safety program?‖ Both
programs are recommended.
Application of the scoring system to effects on subsistence resources leads to impacts of
medium during both the construction and operations and maintenance phases. This comes
about because of possible impacts on subsistence resources as a result of the compressor
station near the Minto Flats Game Refuge.
The strongest conclusion of this analysis is that greater use of natural gas is likely to have a
significant and positive impact on public health of residents of Fairbanks. Burning natural gas
for home heating would result in lower fine particulate emissions. Fine particulate
concentrations (even at levels beneath the NAAQS) are harmful to health (mortality and
morbidity) and Fairbanks is located in a non-attainment area for fine particulates. Though it
would require expansion of gas distribution system to implement (and is thus discussed in
cumulative effects below), this benefit could only be achieved with the proposed Project (or a
similar pipeline).
Cumulative Effects
The impact on the environment which results from the incremental impact of the action when
added to other past, present, and reasonably foreseeable future actions regardless of what
agency (federal or non-federal) or person undertakes such actions is addressed in Section 5.20
of this EIS. This section addresses the cumulative effects on health-related measures.
Measured against all the cumulative health effects from state and federal programs, other oil
and gas activities, and other industrial developments, the incremental impacts of the proposed
Project are unlikely to be large. Nonetheless, they are positive and material for residents of
Fairbanks and Anchorage. These are discussed first.
Potential Health Effect Benefits to Fairbanks
When fully operational, the proposed Project would provide access to relatively low cost natural
gas for inhabitants of Fairbanks. This would require expansion of the present gas distribution
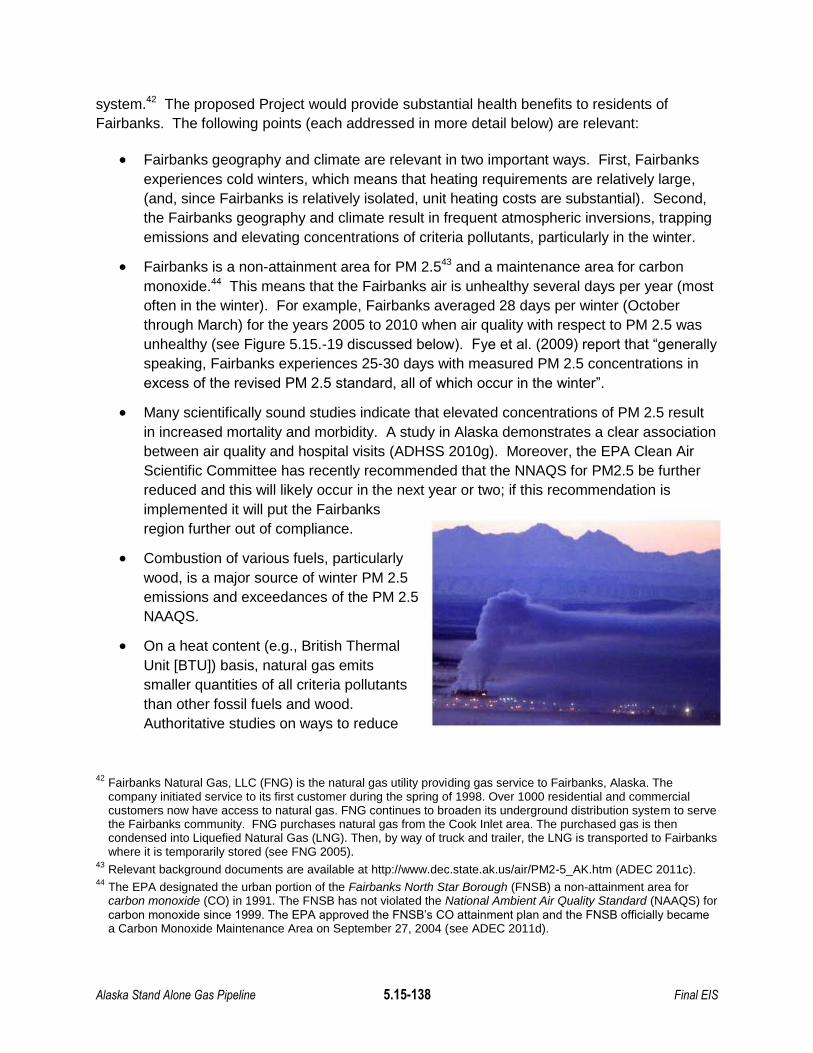
Alaska Stand Alone Gas Pipeline 5.15-138 Final EIS
system.42 The proposed Project would provide substantial health benefits to residents of
Fairbanks. The following points (each addressed in more detail below) are relevant:
Fairbanks geography and climate are relevant in two important ways. First, Fairbanks
experiences cold winters, which means that heating requirements are relatively large,
(and, since Fairbanks is relatively isolated, unit heating costs are substantial). Second,
the Fairbanks geography and climate result in frequent atmospheric inversions, trapping
emissions and elevating concentrations of criteria pollutants, particularly in the winter.
Fairbanks is a non-attainment area for PM 2.543 and a maintenance area for carbon
monoxide.44 This means that the Fairbanks air is unhealthy several days per year (most
often in the winter). For example, Fairbanks averaged 28 days per winter (October
through March) for the years 2005 to 2010 when air quality with respect to PM 2.5 was
unhealthy (see Figure 5.15.-19 discussed below). Fye et al. (2009) report that ―generally
speaking, Fairbanks experiences 25-30 days with measured PM 2.5 concentrations in
excess of the revised PM 2.5 standard, all of which occur in the winter‖.
Many scientifically sound studies indicate that elevated concentrations of PM 2.5 result
in increased mortality and morbidity. A study in Alaska demonstrates a clear association
between air quality and hospital visits (ADHSS 2010g). Moreover, the EPA Clean Air
Scientific Committee has recently recommended that the NNAQS for PM2.5 be further
reduced and this will likely occur in the next year or two; if this recommendation is
implemented it will put the Fairbanks
region further out of compliance.
Combustion of various fuels, particularly
wood, is a major source of winter PM 2.5
emissions and exceedances of the PM 2.5
NAAQS.
On a heat content (e.g., British Thermal
Unit [BTU]) basis, natural gas emits
smaller quantities of all criteria pollutants
than other fossil fuels and wood.
Authoritative studies on ways to reduce
42
Fairbanks Natural Gas, LLC (FNG) is the natural gas utility providing gas service to Fairbanks, Alaska. The company initiated service to its first customer during the spring of 1998. Over 1000 residential and commercial customers now have access to natural gas. FNG continues to broaden its underground distribution system to serve the Fairbanks community. FNG purchases natural gas from the Cook Inlet area. The purchased gas is then condensed into Liquefied Natural Gas (LNG). Then, by way of truck and trailer, the LNG is transported to Fairbanks where it is temporarily stored (see FNG 2005).
43 Relevant background documents are available at http://www.dec.state.ak.us/air/PM2-5_AK.htm (ADEC 2011c).
44 The EPA designated the urban portion of the Fairbanks North Star Borough (FNSB) a non-attainment area for carbon monoxide (CO) in 1991. The FNSB has not violated the National Ambient Air Quality Standard (NAAQS) for
carbon monoxide since 1999. The EPA approved the FNSB‘s CO attainment plan and the FNSB officially became a Carbon Monoxide Maintenance Area on September 27, 2004 (see ADEC 2011d).

Alaska Stand Alone Gas Pipeline 5.15-139 Final EIS
PM 2.5 emissions recommend that burning of wood be eliminated or reduced. Switching
to natural gas would reduce winter emissions appreciably.
Although natural gas is now
available in Fairbanks, in
percentage terms relatively few
households use natural gas. The
Fairbanks Natural gas company45
notes that over 1,000 residential
and commercial customers
currently use natural gas. Sierra
Research (2010) estimated that
there were 1,370 natural gas
heaters operating within the
Fairbanks nonattainment area
which is about 3.5 percent of the total number of heaters operating in the non-attainment
area. Northern Economics (2012) notes that there are approximately 23,465 residential
and 1,794 commercial structures in the Fairbanks region that are candidates for
conversion to natural gas heating. Assuming that the distribution system was expanded,
the natural gas from the proposed Project could substitute for a large fraction of home
heating fuels. These reduced emissions should result in improved public health and
reduced hospital visits.
The availability of lower-cost natural gas would result in a net economic benefit to
Fairbanks residents.
More detail on each of these points is provided below.
Fairbanks Geography and Climate
Fairbanks is Alaska‘s second largest city (U.S. Census Bureau 2011c). The combination of
geography, temperature, and wind patterns results in frequent temperature inversions that can
trap atmospheric pollutants. As noted in a National Academy of Sciences study (2002) of
carbon monoxide in Fairbanks:
Ground-based inversions of considerable strength (typically a few degrees Celsius per
100m but sometimes much stronger) topped by weaker inversions reaching as high as
about 1–2 km are normal in winter and can occur anytime during the year. A surface
inversion due to net energy loss from the surface occurs in the few meters closest to the
ground, although the weaker inversion topping it may be caused by subsidence or
transport of warmer air aloft. The combination of high albedo (reflection of sunlight due
to snow cover) and the low solar elevation (failure of the sun to rise high in the sky)
characteristic of northern latitudes in winter creates little heating of the ground and weak
45
The Fairbanks Natural Gas Website: (FNG 2005).
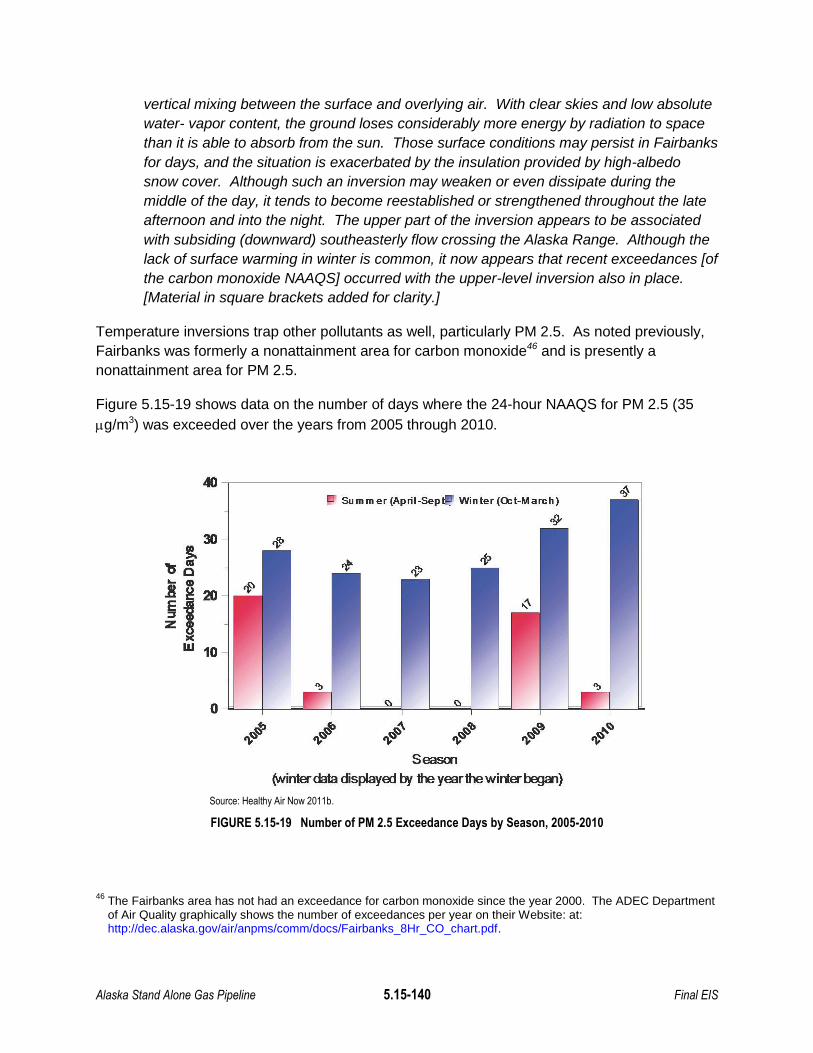
Alaska Stand Alone Gas Pipeline 5.15-140 Final EIS
vertical mixing between the surface and overlying air. With clear skies and low absolute
water- vapor content, the ground loses considerably more energy by radiation to space
than it is able to absorb from the sun. Those surface conditions may persist in Fairbanks
for days, and the situation is exacerbated by the insulation provided by high-albedo
snow cover. Although such an inversion may weaken or even dissipate during the
middle of the day, it tends to become reestablished or strengthened throughout the late
afternoon and into the night. The upper part of the inversion appears to be associated
with subsiding (downward) southeasterly flow crossing the Alaska Range. Although the
lack of surface warming in winter is common, it now appears that recent exceedances [of
the carbon monoxide NAAQS] occurred with the upper-level inversion also in place.
[Material in square brackets added for clarity.]
Temperature inversions trap other pollutants as well, particularly PM 2.5. As noted previously,
Fairbanks was formerly a nonattainment area for carbon monoxide46 and is presently a
nonattainment area for PM 2.5.
Figure 5.15-19 shows data on the number of days where the 24-hour NAAQS for PM 2.5 (35
g/m3) was exceeded over the years from 2005 through 2010.
Source: Healthy Air Now 2011b.
FIGURE 5.15-19 Number of PM 2.5 Exceedance Days by Season, 2005-2010
46
The Fairbanks area has not had an exceedance for carbon monoxide since the year 2000. The ADEC Department of Air Quality graphically shows the number of exceedances per year on their Website: at: http://dec.alaska.gov/air/anpms/comm/docs/Fairbanks_8Hr_CO_chart.pdf.
Summ er (April-sep~ Winter (Oct-March)
40,------------------------;,---,~
30~
't5~~ ..11820!itz 8
>C
W 10
~ ~ ~ ~ ~ ~~ ~ ~ ~ ~ ~
Season
(winterdata displayed by the year the winter began)

Alaska Stand Alone Gas Pipeline 5.15-141 Final EIS
The second key point about the weather in Fairbanks is that it is cold in the winter—perhaps
obvious but important nonetheless. A commonly used measure that is proportional to energy
requirements for heating is the heating degree day According to the National Weather Service
(2011):
Degree day is a quantitative index demonstrated
to reflect demand for energy to heat or cool
houses and businesses. This index is derived
from daily temperature observations at nearly 200
major weather stations in the contiguous United
States. The ―heating year‖ during which heating
degree days are accumulated extends from July
1st to June 30th and the ―cooling year‖ during
which cooling degree data are accumulated
extends from January 1st to December 31st. A
mean daily temperature (average of the daily
maximum and minimum temperatures) of 65°F is
the base for both heating and cooling degree day
computations. Heating degree days are
summations of negative differences between the
mean daily temperature and the 65°F base;
cooling degree days are summations of positive
differences from the same base.
Data on heating degree days over a 30-year period are available for many locations in the
United States (NOAA 2011). For Fairbanks, the 30-year annual average is 13,980 heating
degree days. Here are corresponding average annual heating degree days for a sample of
other cities in the United States: Anchorage, AK, 10,470; Juneau, AK, 8,574; San Francisco,
CA, 2,862; San Diego, CA, 1,063; Washington, DC, 3,999; New York, NY, 4,744; and Miami,
FL, 155. Heating degree days can be added over periods of time to provide a rough estimate of
seasonal heating requirements. In the course of a heating season based on the foregoing data,
for example, the number of heating degree days for San Francisco is 2,862 whereas that
for Fairbanks is 13,980. Thus, one can say that, for a given home of similar structure and
insulation, around five (13,980/2,862 = 4.88) times the energy would be required to heat the
home in Fairbanks than in San Francisco. Comparing the energy needed to heat a home In
Fairbanks and Anchorage (13,980/10,470 = 1.33), about 33 percent more energy is needed for
heating in Fairbanks than in Anchorage.47 Compared to most U.S. cities the annual heating
requirement, typically measured in British Thermal Units (BTUs), is substantially greater in
Fairbanks. Homes in Fairbanks need to be heated for eight months of the year and the costs
for various heating fuels are high (Fye et al. 2009).
47
This assumes that the houses in Fairbanks and Anchorage are the same size and have the same insulation. In fact (see Information Insights, 2009) although the number of BTUs per ft
2 for space heating in Fairbanks is greater
than that for homes in Anchorage, the actual energy consumption is higher in Anchorage because the average house in Anchorage is about 15 percent larger in area than the average house in Fairbanks.
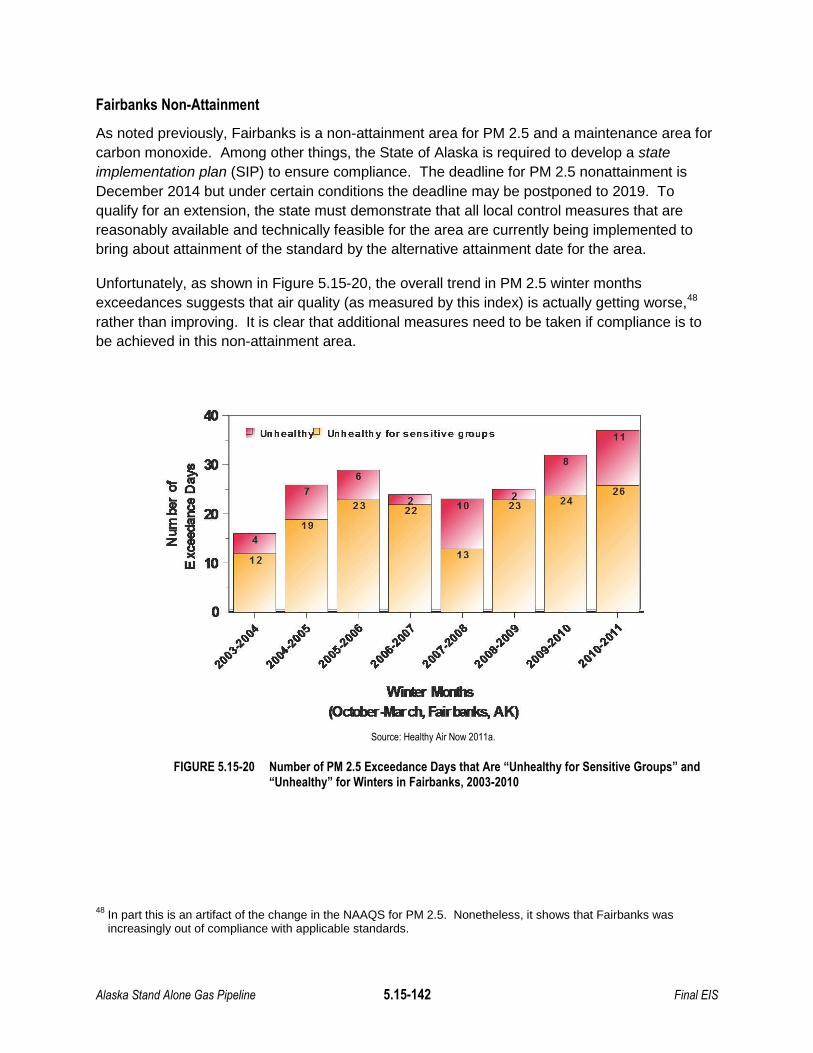
Alaska Stand Alone Gas Pipeline 5.15-142 Final EIS
Fairbanks Non-Attainment
As noted previously, Fairbanks is a non-attainment area for PM 2.5 and a maintenance area for
carbon monoxide. Among other things, the State of Alaska is required to develop a state
implementation plan (SIP) to ensure compliance. The deadline for PM 2.5 nonattainment is
December 2014 but under certain conditions the deadline may be postponed to 2019. To
qualify for an extension, the state must demonstrate that all local control measures that are
reasonably available and technically feasible for the area are currently being implemented to
bring about attainment of the standard by the alternative attainment date for the area.
Unfortunately, as shown in Figure 5.15-20, the overall trend in PM 2.5 winter months
exceedances suggests that air quality (as measured by this index) is actually getting worse,48
rather than improving. It is clear that additional measures need to be taken if compliance is to
be achieved in this non-attainment area.
Source: Healthy Air Now 2011a.
FIGURE 5.15-20 Number of PM 2.5 Exceedance Days that Are “Unhealthy for Sensitive Groups” and “Unhealthy” for Winters in Fairbanks, 2003-2010
48
In part this is an artifact of the change in the NAAQS for PM 2.5. Nonetheless, it shows that Fairbanks was increasingly out of compliance with applicable standards.
40pi UnhealthYJ Unhealthy for sensitive groups
~30
o~ 26
1i ~ 23 23 2420 22
E III 19
~1>C
10 12 13W
0
""~ "".t'",,'0 ~ ",,'" ",,'" ,,"" ,,'"
'),"S l:i l:i l:i '),"" """,,-? !¥~""otJ
df~ ~? !/? ",,"6 "'~~ '),"S '),"S ",," ",,"S
~",,"
~ ~ ~ ~
WirEr" NkDhs(OcldIer"-Mar"ch, FairllDcs, AK)

Alaska Stand Alone Gas Pipeline 5.15-143 Final EIS
Health Effects of Elevated PM 2.5 Concentrations
As discussed in the section on chronic health effects associated with construction, there is
extensive literature supporting the proposition that elevated levels of fine particulates are
unhealthy (see Brook et al. 2002, 2010; Chow et al. 2006; Dockery and Stone 2007; Dominici et
al. 2006; Fairbanks North Star Borough 2009; Koenig et al. 1993; Laden et al. 2000, 2006; Pope
III 2000; Pope III and Fulton 2011; Pope III et al. 2002, 2006a, b, 2009a, b; Samet et al. 2000;
Schwartz and Neas 2000; Slaughter et al. 2005; EPA 2009; Verbrugge 2009 and numerous
references included at the end of this section) and lead to increased mortality and morbidity.
Table 5.15-38 (from Brook et al. 2010) summarizes the assessment of the available evidence
for both short- and long-term effects of PM 2.5 on cardiovascular mortality, cardiovascular
hospitalizations, ischemic heart disease,49 heart failure, vascular diseases, and cardiac
arrhythmia50/cardiac arrest.
TABLE 5.15-38 Summary of Epidemiological Evidence of the Cardiovascular Effects of PM2.5, Traffic-related, or
Combustion-related Air Pollution Exposure at Ambient Levels
Health outcomes
(Clinical cardiovascular end points from epidemiological studies at ambient
pollution concentrations)
Short-Term Exposure
(Days)
Longer-Term Exposure
(Months to Years)
Cardiovascular mortality
Cardiovascular hospitalizations
Ischemic heart diseasea
Heart failurea
Ischemic strokea
Vascular diseases†
Cardiac arrhythmia/cardiac arrest
Notes:
The arrows are not indicators of the relative size of the association but represent a qualitative assessment based on the consensus of the writing group of the strength of the epidemiological evidence based on the number and/or quality, as well as the consistency, of the relevant epidemiological studies.
Subclinical cardiovascular end points (such as blood pressure, systemic inflammation, and arrhythmias) are also addressed in the source material.
- Indicates strong overall epidemiological evidence.
- Indicates moderate overall epidemiological evidence.
- Indicates some but limited or weak available epidemiological evidence.
† Deep venous thrombosis only.
a Categories include fatal and nonfatal events.
Source: Adapted from Table 6 in Brook et al. 2010.
49
Ischemic heart disease (IHD), or myocardial ischaemia, is a disease characterized by ischaemia (reduced blood supply) of the heart muscle.
50 An arrhythmia is a problem with the rate or rhythm of the heartbeat. During an arrhythmia, the heart can beat too fast, too slow, or with an irregular rhythm.

Alaska Stand Alone Gas Pipeline 5.15-144 Final EIS
Adverse effects of exposure to PM 2.5 can occur at concentrations beneath the NAAQS.
Dr. Lori Verbrugge (see Fairbanks North Star Borough 2009; Verbrugge 2009) of the Alaska
Division of Public Health was quoted as:
Dr. Verbrugge said the literature was very clear and consistent about the health effects
of PM2.5 and cited over 20 separate studies that consistently showed an increase in
mortality associated with long-term particulate exposure. Collectively, the studies
showed a 6–17% increase in relative mortality with each 10 μg/m3 of PM2.5 exposure.
She said the available data showed there is increased mortality with short-term exposure
to PM2.5 concentrations that are less than 20 μg/m3, which is considerably below the
new ―health-based‖ 24-hour standard of 35 μg/m3.
The State of Alaska, Department of Health and Social Services, Division of Public Health
performed a study (2010a) of the association between air quality and hospital visits over the
period from 2003 to 2008. Many studies have larger sample sizes, but this is of interest
because it is so specific to Fairbanks. Key study results included:
A total of 5,718 hospital visits consisting of 1,596 emergency room visits and 4,122
hospitalizations were analyzed (Table); the mean 24-hr PM2.5 level was 20.1 μg/m3
(range: 0.2–673.8 μg/m3).
Hospitalizations for the following health conditions were statistically associated with
increased mean 24-hr PM2.5 levels: for each 10 μg/m3 increase in the mean 24-hr
PM2.5 level 1 day prior to a hospital visit, there was a 7% increased risk for a
cerebrovascular disease-coded visit in persons aged <65 years (P<0.05; 95%
confidence interval [CI]: 1%–12%); a 6% increased risk for a cerebrovascular disease-
coded visit in persons aged >65 years (P<0.05; 95% CI: 1%–12%); and a 6% increased
risk for a respiratory tract infection-coded visit in persons aged <65 years (P<0.05; 95%
CI: 1%–11%).
Thus, it is clear that increased concentrations of ambient PM 2.5 levels in FNSB are associated
with increased risk of hospitalizations due to cerebrovascular in all persons and respiratory tract
infections in persons aged less than 65 years during the study period.
Reducing PM 2.5 emissions would have specific benefits for children as well as adults.
Specifically:
Respiratory health problems in children: asthma incidence and prevalence would be
reduced;
Exacerbation of symptoms in children with asthma and health-care utilization for
respiratory problems would be reduced;
The decrease in lung growth and development would be reversed; and
The increase in middle ear infections (otitis media) attributable specifically to wood
smoke would be reversed.

Alaska Stand Alone Gas Pipeline 5.15-145 Final EIS
Major Sources of PM 2.5 Emissions in Fairbanks
Fye et al. (2009) provides data on the major sources of PM 2.5 emissions in Fairbanks. On a
year round basis, wildfires account for the majority of PM 2.5 emissions. But wildfires occur in
the summer months and do not impact the winter PM 2.5 concentrations that contribute to the
Borough‘s non-attainment status.
Figure 5.15-21 (data for 2008) show that wood stoves from residential heating account for the
largest percentage of FNSB winter PM 2.5 emissions. For this reason, studies on possibilities
for air quality improvement in Fairbanks (see e.g., Davies et al. 2009; Fye et al. 2009) have
examined options to replace wood stoves as part of a program designed to ensure NAAQS
compliance. As part of the effort to replace wood stoves, consumers have been urged to
improve air quality by choosing to burn dry, seasoned wood over green, unseasoned wood.
Burning green wood is likely to generate more PM 2.5 material because it does not burn as
completely or as hot as seasoned wood and users need to burn more to provide the same level
of heating. The efficiency loss associated with burning green wood is described in a New York
State Environmental Protection Bureau document (2008) as follows:
Burning wet, damp, or green wood reduces the efficiency and heat output of any wood
combustion device and increases particulate emissions. The energy that could be
released in the form of heat is instead used to boil off the water content of the wood,
which in freshly cut, green wood can be as much as fifty percent of the total weight.
Thus, to generate the same amount of heat, more wood must be burned, increasing
emissions of carbon dioxide – the most important pollutant responsible for global
warming. In addition, when energy is expended to change water into steam, the
temperature of the fire is decreased leading to incomplete combustion of the wood fuel.
When that happens, increased amounts of unburned particulates will be emitted with the
steam and combustion gases.

Alaska Stand Alone Gas Pipeline 5.15-146 Final EIS
Source: Healthy Air Now 2011c.
FIGURE 5.15-21 Fairbanks Winter PM 2.5 Pollution Source Contribution, Oct 2007-March
2008 (FNSB data)
Natural Gas Has Lower Emissions per Million BTUs
Studies on combustion emissions that contrast natural gas with other fuels show two clear
results. First, natural gas emits lower amounts of nearly all pollutants than other fuels per unit of
energy delivered. Table 5.15-39 provides data from the EPA and the Energy Information
Administration (EIA) on the pounds of various air pollutants emitted per billion BTU of energy.
TABLE 5.15-39 Pounds of Air Pollutants Produced per Billion BTU of Energy
Pollutant Natural gas Oil Coal
Carbon dioxide 117,000 164,000 208,000
Carbon monoxide 40 33 208
Nitrogen oxides 92 448 457
Sulfur dioxide 0.6 1,122 2,591
Particulates 7.0 84 2,744
Formaldehyde 0.750 .220 0.221
Mercury 0.000 0.007 0.016
Notes:
No post combustion removal of pollutants. Bituminous coal burned in a spreader stoker is compared with No. 6 fuel oil burned in an oil-fires utility boiler and natural gas burned in uncontrolled residential gas burners. Conversion factors are: bituminous coal at 12,027 BTU per pound and 1.64 percent sulfur content; and No. 6 fuel oil at 6.287 million BTU per barrel and 1.03 percent sulfur content—derived from Energy Information Administration, Cost and Quality of Fuel for Electric Utility Plants (1996).
Source: DOE 1999 (Table 2, in EIA 1998).
Pointscu<:es
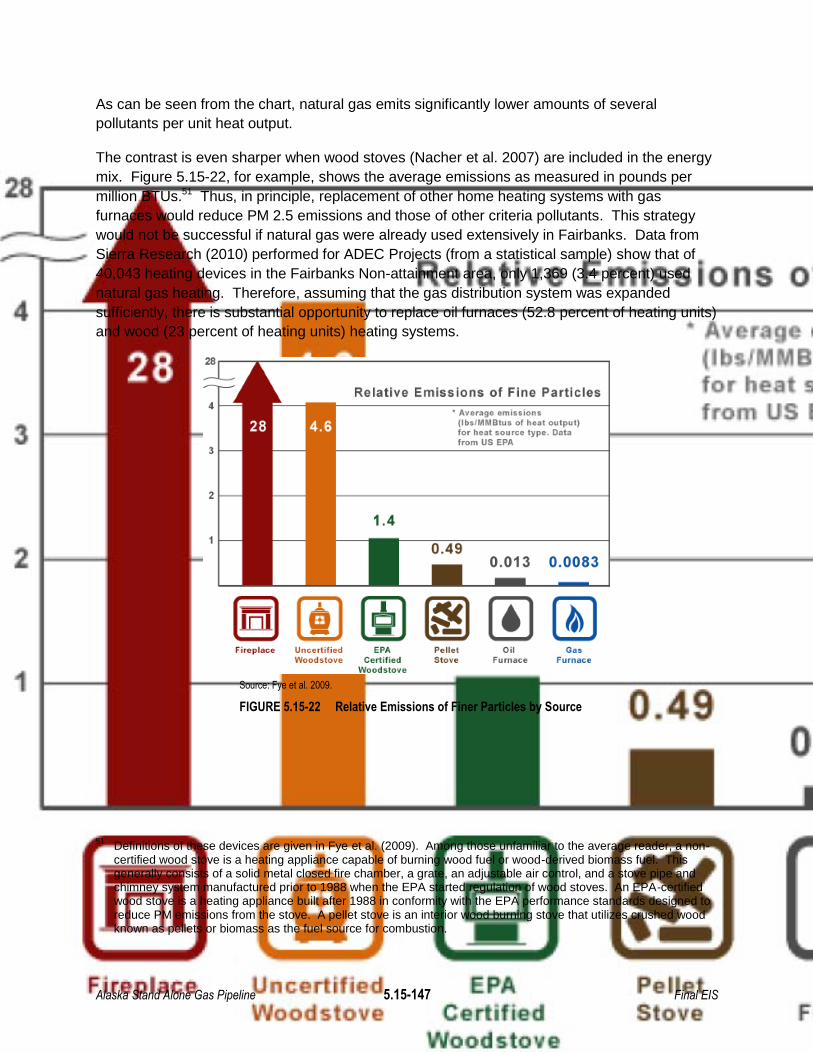
Alaska Stand Alone Gas Pipeline 5.15-147 Final EIS
As can be seen from the chart, natural gas emits significantly lower amounts of several
pollutants per unit heat output.
The contrast is even sharper when wood stoves (Nacher et al. 2007) are included in the energy
mix. Figure 5.15-22, for example, shows the average emissions as measured in pounds per
million BTUs.51 Thus, in principle, replacement of other home heating systems with gas
furnaces would reduce PM 2.5 emissions and those of other criteria pollutants. This strategy
would not be successful if natural gas were already used extensively in Fairbanks. Data from
Sierra Research (2010) performed for ADEC Projects (from a statistical sample) show that of
40,043 heating devices in the Fairbanks Non-attainment area, only 1,369 (3.4 percent) used
natural gas heating. Therefore, assuming that the gas distribution system was expanded
sufficiently, there is substantial opportunity to replace oil furnaces (52.8 percent of heating units)
and wood (23 percent of heating units) heating systems.
Source: Fye et al. 2009.
FIGURE 5.15-22 Relative Emissions of Finer Particles by Source
51
Definitions of these devices are given in Fye et al. (2009). Among those unfamiliar to the average reader, a non-certified wood stove is a heating appliance capable of burning wood fuel or wood-derived biomass fuel. This generally consists of a solid metal closed fire chamber, a grate, an adjustable air control, and a stove pipe and chimney system manufactured prior to 1988 when the EPA started regulation of wood stoves. An EPA-certified wood stove is a heating appliance built after 1988 in conformity with the EPA performance standards designed to reduce PM emissions from the stove. A pellet stove is an interior wood burning stove that utilizes crushed wood known as pellets or biomass as the fuel source for combustion.
1.4
Relative Emissions 0
F
o
• Average,(lbs/MMBfor heat 5
from US I
PelletStove
0.49
iUncertified ePAWood stave Certified
Woodstove
2f---
41-=
Fireplace
1Dl
31--
1 f---
28r--
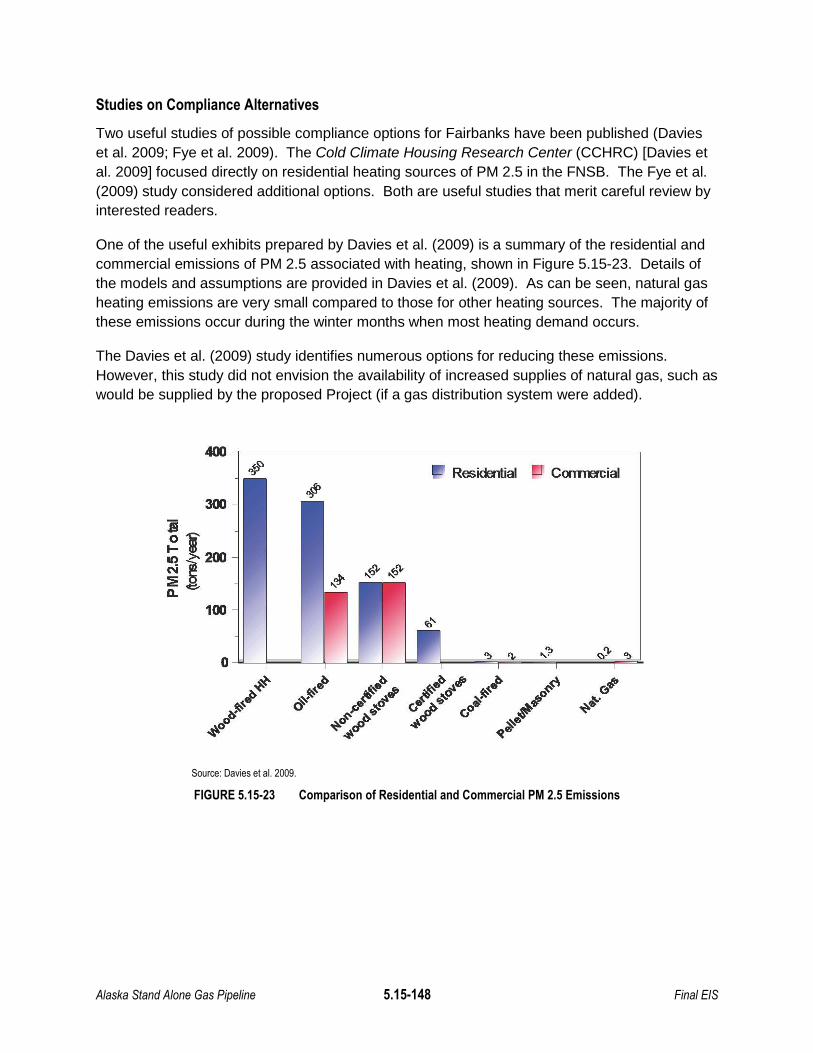
Alaska Stand Alone Gas Pipeline 5.15-148 Final EIS
Studies on Compliance Alternatives
Two useful studies of possible compliance options for Fairbanks have been published (Davies
et al. 2009; Fye et al. 2009). The Cold Climate Housing Research Center (CCHRC) [Davies et
al. 2009] focused directly on residential heating sources of PM 2.5 in the FNSB. The Fye et al.
(2009) study considered additional options. Both are useful studies that merit careful review by
interested readers.
One of the useful exhibits prepared by Davies et al. (2009) is a summary of the residential and
commercial emissions of PM 2.5 associated with heating, shown in Figure 5.15-23. Details of
the models and assumptions are provided in Davies et al. (2009). As can be seen, natural gas
heating emissions are very small compared to those for other heating sources. The majority of
these emissions occur during the winter months when most heating demand occurs.
The Davies et al. (2009) study identifies numerous options for reducing these emissions.
However, this study did not envision the availability of increased supplies of natural gas, such as
would be supplied by the proposed Project (if a gas distribution system were added).
Source: Davies et al. 2009.
FIGURE 5.15-23 Comparison of Residential and Commercial PM 2.5 Emissions
CQlllecialResidential
40lI$'
30lI
J!I
~ i 20lI
~i:!:"",n.
100
Alaska Stand Alone Gas Pipeline 5.15-149 Final EIS
These are not the only anthropogenic sources of PM 2.5 emissions. There are other point
sources, such as power plants and mobile sources to be considered. Fye et al. (2009)
considered these and other possible sources in another analysis of PM 2.5 compliance options.
These investigators focused on options for regulating residential wood burning stoves and
heavy-duty diesel emissions from trucks, buses, and heavy equipment.
Fye et al. (2009) offered the following rationale for excluding other PM 2.5 sources in their
analysis:
There are other potentially high sources of PM2.5 content in the Fairbanks area that
could be targeted for reduction of emissions, but the necessary investment would not be
justified based on the amount of PM2.5 removed and the timing of those emissions. For
example: large producers, like local power plants, seem like they would be big
contributors, but they already have strict EPA and federal guidelines on the waste they
produce. Additionally, the majority of the waste output from the power plants is in the
form of gas elements, such as NOx and SOx. Only 460 tons/year (TPY) of PM10
particulate matter is produced by local power plants out of a total of 27,299 TPY in the
Fairbanks monitoring area. This equates to only 1.7% of the total PM10 output.
Assuming a similar level of PM2.5 generation, it would not seem cost effective to enforce
a regulation requiring retrofit of power plant equipment.
Wildfire is another high contributor to poor air quality, but this only occurs in the summer
and does not impact the winter PM 2.5 level that contribute to the Boroughs [sic] non-
attainment status.
Another area that was briefly evaluated was 2-stroke snowmobile PM 2.5 emissions and
what could be done with these to improve the output from the engines. At only a third
the total TPY that are produced by diesel engines, the 2-stroke recreational
snowmobiles produced more PM 2.5 output than all heavy and light gasoline vehicles
(11 TPY). Studies have been done using additives to the gasoline and oil mixture
without much success. Some reduced emissions output results were identified with
specially designed clean 2-stroke engines using both atomizing carburetors and catalytic
converters, although this is an extremely pricey modification to retrofit on a snowmobile
and these have not been widely implemented in new models being sold. Additional
consideration [sic] that most people do not tend to ride or use recreational snowmobiles
during extremely cold weather conditions indicated this line of research was not worth
pursuing as a possible solution for 24-hour PM 2.5 emission levels when an inversion
occurs.
Fye et al. (2009) identified several options related to home heating including a public awareness
program and voluntary burn ban, mandatory compliance during non-burn days during periods of
extreme cold or stagnant air, change out programs, voluntary replacement tax credits, retrofit,
decommissioning at time of sale of property as well as options to reduce PM 2.5 emissions form
heavy-duty diesels. FNSB has implemented some options for home heating devices, including
a removal, replacement, and repair program (DeHaven and Miller 2011).

Alaska Stand Alone Gas Pipeline 5.15-150 Final EIS
Fye et al. (2009) did not consider any alternatives related to the substitution of natural gas for
other fuels as the proposed Project was not a concrete proposal at that time.
Northern Economics (2012) recent analysis on the Fairbanks North Star Borough Gas
Distribution System also estimates the decrease in criteria pollutants associated with converting
from the status quo to natural gas (and propane). If conversion to natural gas for heating takes
place in most of the Fairbanks North Star Borough the region will see PM2.5 emissions
decrease from approximately 2,200 tons per year to less than 200 tons per year and lead to a
significant reduction in NOx and SO2 emissions and would help to bring the region into
attainment with ambient PM2.5 standards for air quality.
Fuel Cost Issues
Cost is one of the relevant issues to be considered in connection with attempts to shift the mix
of fuels used for residential and commercial space heating. Whether heating units are retrofit to
reduce emissions or replaced by units that burn another fuel, the homeowner or business has to
pay for these change outs. Current residential estimates for converting to natural gas are as
low as $1,000 to $1,500 to convert from oil to gas and as high as $12,000 to $20,000 for a boiler
replacement, chimney upgrade (or replacement) and other hydronic (or forced air) connections
(Northern Economics 2012). Various incentives, such as the Home Energy Rebate Program
establined by the Alaska legislature, have been proposed or enacted, but costs are still involved
and, at present, lower cost gas has not been an option.
At present, the cost per million BTUs for various energy sources ranges from $12.32/MM BTU
for white birch to $57.76 for electricity. Natural gas ($23.00/MM BTU) is more expensive than
wood, coal ($16.67/MM BTU), or wood pellets ($21.16/MM BTU), but less costly than #2 fuel oil
($29.54) and HD5 propane ($44.38/MM BTU) (FNG 2011). So, provided the home or business
has access to natural gas, it would be less costly than #2 fuel oil, propane, or electricity, but
more expensive than wood, coal, or wood pellets. Furthermore, many homes or businesses do
not have access to natural gas at present.
In contrast, the cost for natural gas in Anchorage is $8.85/MM BTU (this includes the cost of the
natural gas and ENSTAR charges [ENSTAR 2011]). Indeed, ENSTAR estimates of the average
monthly costs to heat a home in the Anchorage area are $127.37 for natural gas, $361.41 for #1
fuel oil, $523.02 for electricity, and $616.30 for propane. It is not surprising that natural gas is
the choice for all housing units with access. Provided that customers in Fairbanks could be
supplied natural gas at prices (even allowing for delivery and capital recovery charges for a
distribution network) approaching those in Anchorage, there would be an economic incentive for
Fairbanks residents and businesses to switch. Such an estimate is plausible. According to the
ASAP Project Plan the estimated natural gas cost at Fairbanks would be $10.45/MM BTU,
substantially less than the cost of energy from wood (AGDC 2011c).
The cost benefits could be substantial for many Fairbanks residents if the proposed Project
were constructed and operated. For example, Sierra Research (2010) estimated that for all
households equipped with central oil, the average annual oil consumption was 1,135 gallons. At
an average price of $3.90/gallon the annual cost per equipped household would be 1,135

Alaska Stand Alone Gas Pipeline 5.15-151 Final EIS
gallons x $3.90/gallon = $4,426 per year (FNG 2011). Even at present natural gas prices of
$23/MM BTU, the average annual price for households equipped with natural gas the annual
cost (Sierra Research 2010) was $2,159. At a price of $10.45/MM BTU (Project Plan) the
annual cost would be ($10.45/$23) x $2,159 = $980. Thus, households presently equipped with
natural gas would save approximately $1,179/year (after taxes) and those equipped with oil
would have an incentive of $4,426 - $980 = $3,446 (after taxes) annually to switch. Payback
times for converting from oil to gas heat would be short.
A recent analysis on the costs associated with implementing a natural gas distribution network
throughout the Fairbanks North Star Borough indicates that the system will represent a
significant overall savings in annual fuel cost in the region as compared to the status quo.
Northern Economics (2012) concludes that in 2021, the first full year of operations, the savings
are approximately $315 million or a savings from the status quo of about 60 percent. The
analysis concludes that the net present 2012 dollar value savings of converting is estimated at
approximately 5.36 billion over a 50 year study period (2015-2065).
Benefits Revisited
Operation of the proposed Project (assuming a distribution system were constructed) would
enable Fairbanks residents to switch fuels to natural gas from wood, coal, and oil and reduce
PM 2.5 emissions and probably (depending upon Project transmission charges and local
distribution charges) save money as well. Reduced PM 2.5 emissions would ease the problem
of compliance with NAAQS and reduce costs associated with mortality and morbidity. And
perhaps most importantly, it would impact the health of young children both in terms of acute
health outcomes and potential risks for development of life threatening lung and heart diseases,
plus reduce health care costs . Thus, operation of the proposed Project would result in
substantial public health benefits as well as economic benefits to Fairbanks residents.
Substitution of natural gas for other fossil fuels and wood would also reduce emissions of other
criteria pollutants, a collateral benefit.
The purpose and need section of the ASAP POD outlines other benefits of the system as well.
These have not been quantified in this analysis.
Before presenting scores for reductions in PM 2.5 emissions (below) it is worthwhile mentioning
one other relevant study. Although the EPA does not generally consider cost in setting NAAQS,
it does periodically estimate the costs and benefits of EPA standards. One EPA study (2010b),
The Benefits and Costs of the Clean Air Act, 1990 – 2020, is particularly noteworthy. This study
compares the benefits and costs associated with the imposition of NAAQS. The costs of control
and the benefits, chiefly those related to improvements in public health, are quantified in
economic terms. The study notes that implementation of federal and regional control programs
to meet the national particulate matter and ozone standards accounts for the majority of the
compliance costs for those sources considered. But it also noted:
Alaska Stand Alone Gas Pipeline 5.15-152 Final EIS
The most significant known human health effects from exposure to air pollution are
associated with exposures to fine particulate matter and ground-level ozone pollution.
[Emphasis added.]
Elsewhere this report states:
The particulate matter differences [with and without Clean Air Act standards] are worth
emphasizing because reductions in fine particle exposures are responsible for the vast
majority of the benefits which could be evaluated in economic terms for this study.
[Material in brackets added for clarity.]
Thus, the EPA was most certain about the estimates of benefits and the magnitude of these
benefits were largest for reductions in particulate matter reductions—a worthwhile perspective
to keep in mind when reviewing the findings of this assessment.
The analysis presented above does not consider possible benefits that might result as a result
of converting vehicles to natural gas.
Scoring
In interpreting the following the reader should bear in mind that the overall impact is positive.
The methodology recommended for health impact analysis does not appear to be tailored with
this in mind. Nonetheless, for consistency the risk assessment matrix given in Tables 5.15-3
and 5.15-4 is utilized. Scoring is based on the following judgments:
Health effect score: Very high, 3 because the benefits would avoid mortality or morbidity;
Duration: Very high, 3, long-term, 30 years;
Magnitude: Very high, 3;
Extent: High, 2, as the benefit would accrue to at least the residents of Fairbanks;
Severity rating equals sum of scores: 11 from above
calculations; and
Likelihood rating: Very likely (+) 90-99%. Impact rating
from Table 5.15-4 = Very high and positive impact on
health and wellbeing in the Fairbanks area.
Cumulative effects on subsistence
Appendix L presents the ANILCA Section 810 Analysis of
Subsistence Impacts. This analysis concludes that the direct
effects of construction and operation of ASAP on subsistence
would be minimal and that there is no foreseeable significant
decrease in the abundance of harvestable resources and in the
distribution of harvestable resources.
1-...• ..---
Alaska Stand Alone Gas Pipeline 5.15-153 Final EIS
However, the analysis of cumulative effects results in a difference conclusion:
The BLM has found in this ANILCA 810 Evaluation that the cumulative case in this EIS may significantly restrict subsistence uses.
Based on this finding BLM will take the following steps:
Therefore, the BLM will undertake the notice and hearing procedures required by the ANILCA Sec. 810 (a)(1) and (2) in conjunction with release of the Draft EIS in order to solicit public comment from the potentially affected communities and subsistence users.
Should the proposed action have a positive finding, the determination that the requirements of ANILCA §810 (a)(3)(A), (B), and (C) have been met will be analyzed in the Final ANILCA §819 Evaluation, and will be presented in the FEIS, and will include testimony and input from the communities in which subsistence hearings will be held.
Additional Perspectives on Cumulative Effects
As noted at the beginning of Section 5.15.1.2, cumulative effects include impacts from all past,
present, and foreseeable future activities. Cumulative impacts are discussed in detail in Section
5.20 and a list of the past, present, and foreseeable future activities are provided in Table 5.20-
1. Even if limited to health impacts alone discussion of the impacts associated with the activities
in Table 5. 20-1 could be very long indeed. Rather than provide an encyclopedic description of
all these impacts, a short summary of the key points is provided.
First, as noted previously, measured against all the cumulative health effects from state and
federal programs, other oil and gas activities, and other industrial developments, the
incremental impacts of the proposed Project on public health would not likely be large. Put
another way, whether or not this proposed Project goes forward would not materially affect the
cumulative impacts of all other state, federal, and industrial developments. Further, residents of
Fairbanks and Anchorage would benefit economically and in health terms as a result of this
proposed Project. Moreover, various possible mitigation strategies for the proposed Project
would have beneficial effects at the margin, but would not eliminate or materially reduce all
cumulative impacts.
In the case that some proposed oil and gas or infrastructure improvement activities are
concurrent with the construction phase of the Project, there would be the potential for the
increased negative effects on public health from an influx of workers in localized areas. As
shown in this section, these types of Projects require a public review process and permits
through various agencies who would require mitigation of negative impacts and the Projects
would be unlikely to have large impacts on public health.52
52
A public comment suggested that the Foothills West Transportation Access Project as an example of another
project that would bring a large number of workers into an area already being used for the proposed project. The
Foothills project would create a permanent, all season road and pipeline corridor from the Dalton Highway near
Alaska Stand Alone Gas Pipeline 5.15-154 Final EIS
Second, Alaska Native health issues, impacts, and status are very important to consider.
Although very important, this is not a new issue or one solely associated with oil and gas
developments. Kraus and Buffler (1979), for example, address issues such as sociocultural
stress, alcohol abuse, and suicide among Alaska Natives before significant oil developments or
other activities included in the cumulative effects analysis.
Third, despite excellent programs by various agencies, the overall public health situation in
Alaska can fairly be described as improving but mixed. The Report to Congress to the
Interagency Access to Health Care in Alaska Task Force (Federal Task Force 2010) noted:
The overall health status of Alaskans does not vary greatly from all Americans when one
considers its younger age demographic. Alaskans annually report that they are in good
or excellent health at a higher rate than the national average. The non‐Native all‐causes
death rate is similar to the national average. There are significant differences, however.
The 2005 life expectancy of 78.5 years is slightly more than the U.S. rate of 75.0. The
health status of Alaskans is, however, characterized by high rates of unintentional
causes of deaths (violent deaths due to injuries and homicide), rates of tobacco and
alcohol use that are higher than the national average, a relatively high incidence of
infectious diseases, and dramatic disparities in health between Alaska Natives and other
Alaskans.
Nonetheless, Alaska does well on some traditional measures of health status. Alaska
consistently has one of the lowest rates of low‐birth‐weight deliveries in the nation as
well as an infant mortality rate and teen birth rate lower than the national rate. Mortality
due to coronary heart disease is also lower than the U.S. rate. It is important to keep in
mind Alaska’s unique demographics when comparing health status of Alaskans to those
in other states. With its younger population and large Alaska Native population, the
averages may conceal more than they explain.
Direct comparisons between Alaska Natives and non‐Natives highlight troubling
differences. For example, a 2009 report showed that significantly more non‐Natives than
Alaska Natives rated their health as very good or excellent. One uncommon difference
between the two groups is that non‐Natives have a higher rate of diabetes than Natives,
the reverse of the pattern in every other state with sizable AIAN populations. However,
the rate of the increase in the prevalence of diabetes among Alaska Natives is among
the highest in the nation, for example, exceeding 200% between 1997 and 2007 in
Norton Sound and Bristol Bay.
Galbraith Lake to Umiat. Details about the employment and construction seasons are unpublished. Public
meetings have taken place, but no formal documents describing the employment related to the project are
available from the Foothills EIS Website: (http://www.foothillswesteis.com/). Without this information it is difficult to
make assumptions about how the proposed Project and the Foothills project would impact public health.
Alaska Stand Alone Gas Pipeline 5.15-155 Final EIS
Some of the risk factors for poor health highlight lifestyle differences as well. For
example, Alaska Natives are twice as likely to be current smokers (41%). Although
Alaskans are less likely to report inactivity than the national average, obesity has
increased by 64% for Alaska Natives from 1991‐1992 figures.
There have been vast improvements over the past 30 years in the health of Alaskans,
including Alaska Natives. Much of the improvement is in public health, with sanitation
and clean drinking water being the most notable. However, there still remain over 100
villages without adequate drinking water and sanitation despite decades of leadership
from the IHS (now provided through a tribal self‐governance compact with the Alaska
Native Tribal Health Consortium) and other state and Federal partners, and over a
decade of service from the Denali Commission.
Although heart disease is the second leading cause of death for Alaska Native people,
the Alaska Native heart disease death rate decreased by 43% between 1980 and 2007.
Infant mortality is down by 50% for both groups since 1980 through 1983, but the Native
rate is still double that of non‐Natives. Mental health service is the second most
common service offered after respiratory illness services at Alaska Native outpatient
clinics.
Suicide has also received special attention in Alaska. Suicide is the 4th leading cause of
death for Alaska Native people and the 10th leading cause of death for non‐Natives.
The suicide rate for Alaskan men is about 3 times that of women. Men aged 20‐29 years
had the highest suicide rate of any age group, male or female. During 2004‐2007, the
Alaska Native suicide death rate was 3.6 times greater than for U.S. non‐Natives and 2.5
times greater than for Alaska non‐Natives.
The state and the Alaska Native Health System have addressed the suicide issue with
grant-funded programs as well as behavioral health programming. Unfortunately, as
discussed elsewhere in this report, shortages across every level of the system leave
large gaps in providers and programs.
Fourth, provision of health services in Alaska is quite expensive because of the relatively high
cost of living, low population density, shortages of medical personnel, lack of infrastructure, and
other factors (Federal Task Force 2010). At present, more than 50 percent of the state‘s
residents receive health care paid primarily by the Federal Government (Federal Task Force
2010). The Federal Government is very active in Alaska with large military installations and its
support of health and social services to Alaska Natives. Federal government expenses are
largely supported by taxpayers in other states, and Alaska ranks near the top annually in the
ratio of federal expenditures in the state compared to federal taxes paid by state residents
(Federal Task Force 2010). Health care is dependent on government and resource industries,
since it provides service to residents whose jobs are created by government or the resource
industry.
Alaska Stand Alone Gas Pipeline 5.15-156 Final EIS
Fifth, the oil and gas industry (past, present, and future) has been a major driving force in
Alaska‘s economy since TAPS became operational (see e.g., Goldsmith 2009 for an
assessment of Alaska‘s economy if the oil & gas industry did not exist). Revenues from the oil
and gas industry accrue to the State of Alaska, Native Corporations, and local government as
well as firms in the oil industry. In turn, these revenues are used to fund public health and other
government programs. A 2003 study of the Cumulative Effects of Alaska Oil Development by
the National Academy of Sciences (NRC 2003) offered the following comments in connection
with the Alaska North Slope:
The North Slope Borough, the Alaska Native Claims Settlement Act, and hence the
Arctic Slope Regional Corporation were created as a result of the discovery and
development of North Slope oil. Without it, they would not exist or, if they did, would
bear little resemblance to their current form. Modern western culture, including oil
development and the revenue stream it created, has resulted in major, important, and
probably irreversible changes to the way of life in North Slope communities. The
changes include improvements in schools, health care, housing, and other community
services as well as increased rates of alcoholism, diabetes, and circulatory disease.
There have been large changes in culture, diet, and the economic system. Many North
Slope residents view many of these changes as positive. However, social and cultural
shifts of this magnitude inevitably bear costs in social and individual pathology. These
effects accumulate because they arise from several causes, and they interact. As
adaptation occurs, the communities and the people who make them up interact in new
and different ways with the causes of social change. The largest changes have
occurred since the discovery of oil at Prudhoe Bay in 1968.
This study also noted that links between North Slope oil and gas activities and health impacts
were not well understood (a situation that still exists today):
Human-health effects of oil and gas activities have not been well documented. Although
some problems on the North Slope—increased use of alcohol and drugs, increased
obesity, and other societal ills—are evident, it is not possible to say with the limited data
available to what degree they are the direct result of oil and gas activities. Other
concerns are widespread among Native residents of the North Slope. The degree to
which increased financial resources related to oil have balanced adverse effects by
improving the quality and accessibility of local medical care is unknown. These
questions are in great need of additional reliable information.
The NPR-A Supplemental IAP/EIS quotes George Ahmaogak, former Mayor of the North Slope
Borough as follows:
The benefits of oil development are clear — I don’t deny that for a moment. The
negative impacts are more subtle. They’re also more widespread and more costly than
most people realize. We know the human impacts of development are significant and
long-term. So far, we’ve been left to deal with them on our own. They show up in our

Alaska Stand Alone Gas Pipeline 5.15-157 Final EIS
health statistics, alcohol treatment programs, emergency service needs, police
responses —— you name it.
Although as NRC notes, establishing links between oil and gas activities and cumulative
impacts on health is difficult to do and many questions remain, it is fair to state that the impacts
appear mixed. Having said this, it is relevant to consider what might happen to Alaska‘s future if
additional oil and gas development as envisioned in the Cumulative Effects Section 5.20 were
not to occur. Presumably the federal contribution to the public health of Alaskans would
continue as before, but with no new oil and gas Projects, revenues to the state and local
governments as well as Native Corporations would decrease substantially over time. It is
beyond the scope of this EIS to attempt to forecast how either state of local agencies would
alter budgets allocated to public health initiatives, but it seems likely that these budgets would
be adversely impacted by revenue shortfalls. Under these circumstances it is hard to imagine
that things would revert to the status quo ante or that adverse health impacts would be
lessened.
5.15.4.3 Denali National Park Route Variation
Under the Denali National Park Route Variation, the following PAC would be located in closer
proximity to the proposed pipeline than under the proposed action: McKinley Park. The Denali
National Park Route Variation would be located along the Parks Highway east of the McKinley
Village area. This alternative is expected to result in similar effects to the HECs as the
proposed action. The most substantial difference between the Denali National Park Route
Variation and the mainline pipeline between MP 540 and MP 555 of the proposed action would
be effects to the Food, Nutrition, and Subsistence HEC. As described in Section 5.14, types of
potential construction (e.g., resource disturbance due to noise) and operation-related
subsistence impacts would be similar as those described for the mainline. Subsistence-related
impacts from the Denali National Park Route Variation would likely be less than the
corresponding mainline route between MP 540 and MP 555 because the Denali National Park
Route Variation would be immediately adjacent to the Parks Highway where noise and
disturbance are already occurring. Any potential subsistence impacts from either the Denali
National Park Route Variation or the mainline between MP 540 and MP 555 would be negligible
to overall community subsistence use patterns in the area.
Because tourists frequent some of these areas during the summer, it is appropriate to adjust
construction schedules to minimize conflicts.
5.15.5 Monitoring and Evaluation
Stipulation 1.8 addresses Surveillance and Monitoring which, among other things is designed to
(a) Provide for and protect public health and safety and (b) Prevent and mitigate damage to
natural resources. A conscientious program, including specifically air quality monitoring during
both construction and operations phases is recommended.
Alaska Stand Alone Gas Pipeline 5.15-158 Final EIS
5.15.6 References
ABVS. See Alaska Bureau of Vital Statistics.
ADCCED. See Alaska Department of Commerce, Community, and Economic Development.
ADEC. See Alaska Department of Environmental Conservation.
ADF&G. See Alaska Department of Fish and Game.
ADHSS. See Alaska Department of Health and Social Services.
ADOT&PF. See Alaska Department of Transportation & Public Facilities.
AGDC. See Alaska Gasline Development Corporation.
Alaska Bureau of Vital Statistics (ABVS). 2005. Infant Mortality, 1993-2002. Website:
(http://www.hss.state.ak.us/dph/bvs/PDFs/vitalsigns/Infant_Mortality_2002.pdf)
accessed April 23, 2012.
Alaska Bureau of Vital Statistics (ABVS). 2010a. Data and Statistics. Website:
(http://www.hss.state.ak.us/dph/bvs/data/default.htm) accessed January 21, 2011.
Alaska Bureau of Vital Statistics (ABVS). 2010b. Deaths in 2009. ABVS 2009 Annual Report.
Website: (http://www.hss.state.ak.us/dph/bvs/PDFs/2009/2009_Annual_Report.pdf)
accessed January 21, 2011.
Alaska Bureau of Vital Statistics (ABVS). 2010b. Deaths in 2009. ABVS 2009 Annual Report.
Website: (http://www.hss.state.ak.us/dph/bvs/PDFs/2009/2009_Annual_Report.pdf)
accessed January 21, 2011.
Alaska Bureau of Vital Statistics (ABVS). 2011. Infant Mortality by Census Area. Website:
(http://www.hss.state.ak.us/dph/bvs/death_statistics/Infant_Mortality_Census/default.htm)
accessed November 17, 2011.
Alaska Bureau of Vital Statistics (ABVS). 2012. Data and Statistics, Death Data. Website:
(http://www.hss.state.ak.us/dph/bvs/data/default.htm) accessed April 24, 2012.
Alaska Department of Commerce, Community, and Economic Development (ADCCED). 2011.
Community Database Community Information Summaries (CIS). Website:
(http://www.commerce.state.ak.us/dca/commdb/CF_CIS.htm) accessed
January 20, 2011.
Alaska Department of Education and Early Development. 2011a. District Dropout Rates. June.
Website: (http://www.eed.state.ak.us/stats/DropoutRates/DropoutRatesByDistrict.pdf)
accessed November 8, 2011.
Alaska Stand Alone Gas Pipeline 5.15-159 Final EIS
Alaska Department of Education and Early Development. 2011b. Assessment and
Accountability. March. Website: (http://www.eed.state.ak.us/stats/DistrictEnrollment/
2011DistrictEnrollment.pdf) accessed December 23, 2011.
Alaska Department of Environmental Conservation (ADEC). 2005. Policy guidance on
developing conceptual site models. November 30, 2005. Website:
(http://dec.alaska.gov/spar/csp/guidance/csm05_draft.pdf) accessed July 23, 2012.
Alaska Department of Environmental Conservation (ADEC). 2011a. Temporary Camp
Practices, Consolidated Application and Worksheet. August 2011. Website:
(http://www.dec.state.ak.us/eh/fss/Food/Docs/Temp_Camp_Application%20_Worksheet
_2011.pdf) accessed November 22, 2011.
Alaska Department of Environmental Conservation (ADEC). 2011b. Fugitive Dust – Frequently
Asked Questions. Department of Environmental Conservation. March 2011. Website:
(http://www.dec.state.ak.us/air/ap/docs/Fugitive%20Dust%20FAQs%203-31-11.pdf)
accessed November 24, 2011.
Alaska Department of Environmental Conservation (ADEC). 2011c. PM2.5 Non-Attainment
Documents for Alaska. Division of Air Quality. Website: (http://www.dec.state.ak.us/
air/PM2-5_AK.htm) accessed November 25, 2011.
Alaska Department of Environmental Conservation (ADEC). 2011d. Fairbanks – Carbon
Monoxide. Division of Air Quality. Website: (http://www.dec.state.ak.us/air/anpms/
comm/fbks1_co.htm) accessed November 25, 2011.
Alaska Department of Fish and Game (ADF&G). 2011. Community Subsistence Information
System.
Alaska Department of Health and Social Services (ADHSS). 1997. Cardiovascular Disease in
Alaska. Bulletin No. 3. January 13, 1997. Department of Epidemiology. Website:
(http://www.epi.alaska.gov/bulletins/docs/b1997_03.htm) accessed November 23, 2011.
Alaska Department of Health and Social Services (ADHSS). 2001a. Publication - 26. Public
Health Infrastructure. Department of Health & Social Services. Website:
(http://hss.state.ak.us/dph/targets/ha2010/PDFs/26_Infrastructure.pdf) accessed
November 21, 2011.
Alaska Department of Health and Social Services (ADHSS). 2001b. Publication - 18.
Immunizations & Infectious Diseases. Department of Health & Social Services.
Website: (http://www.hss.state.ak.us/dph/targets/ha2010/pdfs/18_immunizations.pdf)
accessed November 21, 2011.
Alaska Department of Health and Social Services (ADHSS). 2001c. Publication - 24.
Respiratory Disease. Department of Health & Social Services. Website:
(http://hss.state.ak.us/dph/targets/ha2010/PDFs/24_Respiratory_Disease.pdf) accessed
November 23, 2011.
Alaska Stand Alone Gas Pipeline 5.15-160 Final EIS
Alaska Department of Health and Social Services (ADHSS). 2001d. Smoking During
Pregnancy in the 1990s: Alaska and U.S. Alaska Vital Signs – Fact Sheet. October
2001. Department of Health & Social Services. Website: (http://hss.state.ak.us/
dph/bvs/PDFs/vitalsigns/OCT_2001_Maternal_Smoking.pdf) accessed November 23,
2011.
Alaska Department of Health and Social Services (ADHSS). 2002a. 1998 Cancer in Alaska –
Cancer Incidence and Mortality. March 2002. Department of Health & Social Services.
Website: (http://www.epi.alaska.gov/pubs/cancer98.pdf) accessed November 23, 2011.
Alaska Department of Health and Social Services (ADHSS). 2002b. Healthy Alaskans 2010.
Targets and Strategies for Improved Health. December. Website:
(http://hss.state.ak.us/dph/targets/ha2010/volume_1.htm) accessed April 24, 2012.
Alaska Department of Health and Social Services (ADHSS). 2003. The Burden of Overweight
& Obesity in Alaska. April 2003. Department of Health & Social Services. Website:
(http://www.epi.alaska.gov/pubs/obesityburden/obesityburden.pdf) accessed
November 29, 2011.
Alaska Department of Health and Social Services (ADHSS). 2005. Alaska Diabetes Strategic
Plan. May 2005. Department of Epidemiology. Website: (http://www.epi.alaska.gov/
pubs/diabetes.pdf) accessed November 23, 2011.
Alaska Department of Health and Social Services (ADHSS). 2006a. Asthma in Alaska: 2006
Report. Department of Health & Social Services. Website: (http://www.hss.alaska.gov/
publications/asthmaInAlaska.PDF) accessed November 23, 2011.
Alaska Department of Health and Social Services (ADHSS). 2006b. Cancer Incidence and
Mortality in Alaska, 1996-2001. Section of Chronic Disease Prevention and Health
Promotion – Alaska Cancer Registry. February 2006. Department of Health & Social
Services. Website: (http://hss.state.ak.us/dph/chronic/cancer/assets/cancerRegistry
1996-2001.pdf) accessed November 23, 2011.
Alaska Department of Health and Social Services (ADHSS). 2007a. Division of Public Health,
Section of Epidemiology. October 10, 2007. State of Alaska Epidemiology Bulletin No.
27. Alaska Influenza Activity, 2006-2007 Season.
Alaska Department of Health and Social Services (ADHSS). 2007b. Division of Public Health,
Section of Epidemiology. April 13, 2007. State of Alaska Epidemiology Bulletin No. 13.
Respiratory Syncytial Virus – Alaska, Winter 2006-07.
Alaska Department of Health and Social Services (ADHSS). 2007c. Teen Pregnancy and
Sexual Behavior in Alaska. Women‘s, Children‘s, & Family Health – Title V Fact Sheet:
Needs Assessment Update. Vol. 2(22). April 2007. Website:
(http://www.hss.state.ak.us/dph/wcfh/adolescent/assets/Teen_Preg2007.pdf) accessed
November 24, 2011.

Alaska Stand Alone Gas Pipeline 5.15-161 Final EIS
Alaska Department of Health and Social Services (ADHSS). 2009a. Health Professional
Shortage Area (HPSA) and Medically Underserved Areas and Populations (MUA/MUP)
Listing 3/2009. Website: (http://www.hss.state.ak.us/dph/healthplanning/
primarycare/assets/HPSA_MUA.pdf) accessed April 24, 2012.
Alaska Department of Health and Social Services (ADHSS). 2009b. Health Planning and
Systems Development Section, Health Care Services. March19, 2009.
Alaska Department of Health and Social Services (ADHSS). 2009c. December 2009 update.
The Burden of Heart Disease and Stroke in Alaska: Mortality, Morbidity, and Risk
Factors. Website: (http://www.hss.state.ak.us/dph/chronic/chp/pubs/burden_Dec09.pdf)
accessed April 24, 2012
Alaska Department of Health and Social Services (ADHSS). 2009d. Division of Public Health,
Section of Epidemiology. January 26, 2009. State of Alaska Epidemiology Bulletin No.
7. Hospitalizations associated with Staphylococcus aureus infection – Alaska, 2001-
2006.
Alaska Department of Health and Social Services (ADHSS). 2010a. Behavioral Risk Factor
Surveillance System (BRFSS) Highlights 2009. Website: (http://www.hss.state.ak.us/
dph/chronic/hsl/brfss/pubs/BRFSSsum09.pdf) accessed April 24, 2012.
Alaska Department of Health and Social Services (ADHSS). 2010b. 2010-2012 Alaska HIV
Prevention Plan. Website (http://www.epi.alaska.gov/hivstd/hppg/HIVPrevPlan10.pdf)
accessed April 24, 2012.
Alaska Department of Health and Social Services (ADHSS). 2010c. Division of Public Health,
Section of Epidemiology. March 10, 2010. State of Alaska Epidemiology Bulletin No. 4.
Summary of HIV infection – Alaska, 1982-2010.
Alaska Department of Health and Social Services (ADHSS). 2010d. Division of Public Health,
Section of Epidemiology. March 12, 2010. State of Alaska Epidemiology Bulletin No. 7.
Influenza Surveillance Update and New Laboratory Guidelines.
Alaska Department of Health and Social Services (ADHSS). 2010e. Division of Public Health,
Section of Epidemiology. Tuberculosis in Alaska 2010 Annual Report.
Alaska Department of Health and Social Services (ADHSS). 2010f. Chlamydia and Gonorrhea
Rates, by Alaska Native Health Corporation Service Region – Alaska, 2001-2010.
Department of Epidemiology. Website: (http://www.epi.alaska.gov/hivstd/std2010/
atlas.html) accessed November 21, 2011.
Alaska Department of Health and Social Services (ADHSS). 2010g. Association between Air
Quality and Hospital Visits – Fairbanks, 2003-2008. Bulletin No. 26. August 30, 2010.
Department of Epidemiology. Website: (http://www.epi.alaska.gov/bulletins/docs/
b2010_26.pdf) accessed November 24, 2011.
Alaska Stand Alone Gas Pipeline 5.15-162 Final EIS
Alaska Department of Health and Social Services (ADHSS). 2011a. Technical Guidance for
Health Impact Assessment (HIA) in Alaska. Version 1.0. July 2011. Department of
Health & Social Services. Website: (http://www.epi.alaska.gov/hia/AlaskaHIAToolkit.pdf)
accessed November 21, 2011.
Alaska Department of Health and Social Services (ADHSS). 2011b. Malignant Cancer Cases
in Alaska, Diagnosis Years 1996 to 2009. February 9, 2011. Website:
(http://www.hss.state.ak.us/dph/chronic/cancer/data/incidence/default.htm) accessed
April 24, 2012.
Alaska Department of Health and Social Services (ADHSS). 2011c. Division of Public Health,
Section of Epidemiology. May 3, 2011. State of Alaska Epidemiology Bulletin No. 10.
Chlamydia infection update – Alaska, 2010. Website:
(http://www.epi.hss.state.ak.us/bulletins/docs/b2011_10.pdf) accessed April 24, 2012.
Alaska Department of Health and Social Services (ADHSS). 2011d. Division of Public Health,
Section of Epidemiology. May 3, 2011. State of Alaska Epidemiology Bulletin No. 11.
Gonococcal infection update – Alaska, 2010. Website: (http://www.epi.hss.state.ak.us/
bulletins/docs/b2011_11.pdf) accessed April 24, 2012.
Alaska Department of Health and Social Services (ADHSS). 2011e. Division of Public Health,
Section of Epidemiology. November 2, 2011. State of Alaska Epidemiology Bulletin No.
29. Outbreak of methicillin-resistant Staphylococcus aureus in a newborn intensive care
unit.
Alaska Department of Health and Social Services (ADHSS). 2011f. Technical Guidance for
Health Impact Assessment (HIA) in Alaska. Version 1.0. Section 6. Department of
Health & Social Services. Website: (http://www.epi.hss.state.ak.us/hia/AlaskaHIAToolkit
_Sec06.pdf) accessed November 22, 2011.
Alaska Department of Health and Social Services (ADHSS). 2011g. Technical Guidance for
Health Impact Assessment (HIA) in Alaska. Version 1.0. July 2011. Department of
Health & Social Services. Website: (http://www.epi.alaska.gov/hia/AlaskaHIAToolkit.pdf)
accessed November 21, 2011.
Alaska Department of Health and Social Services (ADHSS). 2011h. Conditions Reportable to
Public Health in Alaska: What Must Be Reported in Alaska. Department of Health &
Social Services. Website: (http://www.epi.alaska.gov/pubs/conditions/crWhat.htm
#infect) accessed November 21, 2011.
Alaska Department of Health and Social Services (ADHSS). 2011i. HIV/STD Program.
Department of Epidemiology. Website: (http://www.epi.alaska.gov/hivstd/default.stm)
accessed November 21, 2011.
Alaska Department of Health and Social Services (ADHSS). 2011j. Health Impact Assessment
– Point Thomson Project. Appendix R. State of Alaska HIA Program. Department of

Alaska Stand Alone Gas Pipeline 5.15-163 Final EIS
Health and Social Services. June 2011. Website: (http://www.pointthomson
Projecteis.com/documents/DEIS11_2011/Appendices/Appendix%20R%20-
%20Health%20Impact%20Assessment%20web.pdf) accessed November 28, 2011.
Alaska Department of Health and Social Services (ADHSS). 2011k. Alaska, Alaska Native and
National Suicide Rates. Department of Health & Social Services. Suicide Prevention
Council. Website: (http://www.hss.state.ak.us/suicideprevention/statistics_pages_sspc/
AKsuiciderate_nativenonnative96-05.htm) accessed November 25, 2011.
Alaska Department of Health and Social Services (ADHSS). 2012a. Bulletin No. 3,
February 21, 2012. HIV Outbreak – Fairbanks, 2011-2012. Website:
(http://www.epi.hss.state.ak.us/bulletins/docs/b2012_03.pdf) accessed April 24, 2012.
Alaska Department of Health and Social Services (ADHSS). 2012b. Moving Forward, comprehensive integrated mental health plan: 2006-2011. Health Goals. Website: (http://www.hss.state.ak.us/dph/healthplanning/movingforward/areas/health.htm) accessed July 7, 2012.
Alaska Department of Labor & Workforce Development (DOLWD). 2009a. Resident Hire
Information, Website: (http://labor.alaska.gov/research/reshire/reshire.htm) accessed
November 17, 2011.
Alaska Department of Labor & Workforce Development (DOLWD). 2009b. ―The U.S. Economy
and Alaska Migration‖ in Alaska Economic Trends. June 2009. Website:
(http://labor.alaska.gov/trends/jun09.pdf) accessed November 17, 2011.
Alaska Department of Labor & Workforce Development (DOLWD). 2010. 2009 Resident Hire
Information. Website: (http://labor.alaska.gov/research/reshire/reshire.htm) accessed
November 17, 2011.
Alaska Department of Transportation & Public Facilities (ADOT&PF). 2006. The George Parks
Highway Scenic Byway Corridor Partnership Plan. Website: (http://dnr.alaska.gov/
parks/plans/georgeparkshwyscenicbyway.pdf) accessed November 11, 2011.
Alaska Department of Transportation & Public Facilities (ADOT&PF). 2008. Alaska Traffic
Crashes: Crash Data 2008.
Alaska Department of Transportation & Public Facilities (ADOT&PF). 2009. Index. Department
of Transportation. Alaska Highway Safety Office. Website: (http://www.dot.state.ak.us/
stwdplng/hwysafety/assets/pdf/MV_Fatals_Large_Trucks_94-07.pdf) accessed
November 21, 2011.
Alaska Department of Transportation & Public Facilities (ADOT&PF). 2011a. Alaska Highway
Safety Office. Highway Safety Statistics. Website: (http://www.dot.state.ak.us/
stwdplng/hwysafety/stats.shtml) accessed November 11, 2011.

Alaska Stand Alone Gas Pipeline 5.15-164 Final EIS
Alaska Department of Transportation & Public Facilities (ADOT&PF). 2011b. DOT&PF
Frequently Asked Questions. Department of Transportation & Public Facilities.
Website: (http://www.dot.state.ak.us/FAQ.shtml#g) accessed November 21, 2011.
Alaska Department of Transportation & Public Facilities (ADOT&PF). 2011c. Motor Carrier
Safety Assistance Program Commercial Vehicle Safety Plan – Federal Fiscal Year 2012.
Website: (http://www.dot.state.ak.us/mscve/webdocs/2012CVSP.pdf) accessed
November 21, 2011.
Alaska Gasline Development Corporation (AGDC). 2011a. Alaska Stand Alone Gas
Pipeline/ASAP – ADL 418997 – Right-of-Way Lease. Exhibit A – Stipulations. Website:
(http://dnr.alaska.gov/commis/pco/documents/ASAP/ROW%20lease%20docs%20FINAL
/final_exhibit_a.pdf) accessed November 28, 2011.
Alaska Gasline Development Corporation (AGDC). 2011b. Alaska Stand Alone Gas
Pipeline/ASAP – Plan of Development – Revision 1. March 2011. Website:
(http://www.asapeis.com/Documents/10-078A%20Plan%20of%20Development%20Rev
%201%203_1_11.pdf) accessed November 21, 2011.
Alaska Gasline Development Corporation (AGDC). 2011c. Alaska Stand Alone Gas
Pipeline/ASAP – Project Plan. July 1, 2011. Website: (http://www.gasline.us.com/wp-
content/uploads/2011/07/ASAP-Project-Plan_1July2011_WEB1.pdf) accessed
November 21, 2011.
Alaska Gasline Development Corporation (AGDC). 2011d. AGDC response to questions on
November 23, 2011.
Alaska Health Care Commission. 2009. Transforming Health Care in Alaska. 2009 Report/
2010-2014 Strategic Plan. Website: (http://hss.state.ak.us/healthcommission/docs/
report.pdf) accessed April 24, 2012.
Alaska Highway Safety Office, Transportation & Public Facilities. 2012. Alaska Fatal Statistics.
Website: (http://www.dot.state.ak.us/highwaysafety/fars.shtml) accessed April 23, 2012.
Alaska Native Epidemiology Center. 2008. Alaska Native Maternal and Child Health: Trends
and Data. Website: (http://www.anthc.org/chs/epicenter/upload/anmchdatabook.pdf)
accessed April 24, 2012.
Alaska Native Epidemiology Center. 2011. Alaska Native Mortality Update 2004-2008.
Website: (http://www.anthctoday.org/epicenter/assets/mortality/Alaska
NativeMortalityUpdate2004_2008_17_jan_2012.pdf) accessed April 23, 2012.
Alaska Native Health Board, Alaska Native Epidemiology Center. 2004. Final Report on the
Alaska Traditional Diet. Anchorage, Alaska. March 2004.
Alaska Native Tribal Health Consortium (ANTHC). 2002. Alaska Natives: Key Facts. Website:
(http://www.anthc.org/ref/hs/docs/upload/KEYFACTS_I.PDF) accessed April 24, 2012.

Alaska Stand Alone Gas Pipeline 5.15-165 Final EIS
Alaska Native Tribal Health Consortium (ANTHC). 2006. Cancer in Alaska Natives 1969 –
2003. 35 Year Report. Office of Alaska Native Health Research and Alaska Native
Epidemiology Center, Alaska Native Tribal Health Consortium. January. Website
(http://www.anthc.org/chs/epicenter/upload/Cancer_Incidence_35-Year_Report.pdf)
accessed April 24, 2012.
Alaska Native Tribal Health Consortium (ANTHC). 2008. Alaska Native Maternal and Child
Health: Trends and Data. September 2008. Alaska Native EpiCenter. Website:
(http://www.anthc.org/chs/epicenter/upload/anmchdatabook.pdf) accessed
November 23, 2011.
Alaska Native Tribal Health Consortium (ANTHC). 2009. Alaska Native Health Status Report.
Website: (http://www.anthc.org/chs/epicenter/upload/ANHSR.pdf) accessed
April 18th, 2012.
Alaska Natural Gas Development Authority (ANDGA). 2010. Beluga to Fairbanks
Environmental Impact Statement Status Report. Prepared by URS. September.
Alaska Railroad Corporation (ARRC). 2010. Alaska Railroad Railway Miles. Website:
(http://alaskarailroad.com/Corporate/FreightServices/AlaskaRailwayMiles/tabid/401/Defa
ault.aspx) accessed April 24, 2012.
Alyeska Pipeline Service Company. 2008. Trans Alaska Pipeline System: The Facts.
Website: (http://www.alyeska-pipe.com/employment/employment.asp) accessed
November 21, 2011.
Alyeska Pipeline Service Company. 2009. Trans Alaska Pipeline System: The Facts.
Website: (http://www.alyeska-pipe.com/Pipelinefacts/FACT-BOOK.pdf) accessed
November 21, 2011.
American Academy of Pediatrics. 2010. Implementation Guidance – Mandatory Influenza
Immunization for Healthcare Workers. Updated September 20, 2010. Website:
(http://www.aap.org/immunization/illnesses/flu/HCPMandatoryFluGuidance.pdf)
accessed November 21, 2011.
American Cancer Society. 2011. Circle of LifeSM: Cancer Education and Wellness for
American Indian and Alaska Native Communities. Colorectal Cancer Overview.
Website: (http://www.cancer.org/acs/groups/cid/documents/document/acsd-007302.pdf)
accessed November 23, 2011.
ANGDA. See Alaska Natural Gas Development Authority.
ANTHC. See Alaska Native Tribal Health Consortium.
Andrews, E. 1988. The Harvest of Fish and Wildlife for Subsistence by Residents of Minto,
Alaska. Juneau, AK. Alaska Department of Fish and Game, Technical Paper No. 137,
Alaska Stand Alone Gas Pipeline 5.15-166 Final EIS
334 pp. Website: (http://www.nativeknowledge.org/db/files/tp137.htm) accessed
April 24, 2012.
ARRC. See Alaska Railroad Corporation.
Associated Press (AP). 2011. ―Small towns see increase in crime amid gas drilling boom.‖ Post-
Standard (Syracuse, NY), posted October 26, 2011. Website:
(http://www.syracuse.com/news/index.ssf/2011/10/small_towns_see_increase_in_cr.html)
accessed July 5, 2012.
Bachman, J., Wallace Jr., J., O‘Malley, P., Johnston, L., Kurth, C., and Neighbors, H. 1991.
Racial/Ethnic Differences in Smoking, Drinking, and Illicit Drug Use Among American
High School Seniors, 1976-89. Am. J. Public Health, 81(3):372-377. Website:
(http://www.ncbi.nlm.nih.gov/pmc/articles/PMC1405013/pdf/amjph00203-0102.pdf)
accessed April 18, 2012
Bachman, R., Zaykowski, H., Kallmyer, R., Poteyeva, M., and Lanier, C. 2008. Violence
Against American Indian and Alaska Native Women and the Criminal Justice Response:
What is Known. August 2008. Website: (https://www.ncjrs.gov/pdffiles1/nij/grants/
223691.pdf) accessed November 29, 2011.
Beach, R, and Cliff, D. 2003. Turnover and FIFO operations: Some facts, opinions and
theories. AusIMM Bulletin 2003, Sept/Oct (5): 64-65.
Bell, E., Choi, H., Nguyen, C., Nouri, A., Redddy, R., Tobey, R., Vinichenko, T., and Wilson, A.
2004. Big Oil and Health: Lessons from the Chad-Cameroon Pipeline Project. Princeton
University, Woodrow Wilson School of Public and International Affairs. April 2004.
Website: (http://wws.princeton.edu/research/final_reports/wws591b_f03.pdf) accessed
April 23, 2012.
Berman, M. and Hull, T. 2000. Alcohol control by referendum in northern native communities: The Alaska local option law. Institute of Social and Economic Research, University of Alaska, Anchorage. Website: (http://www.iser.uaa.alaska.edu/Publications/ Alcohol_Arctic.pdf) accessed July 7, 2012.
Berman, M., Hull, T., and May, P. 2000. Alcohol control and injury death in Alaska native communities: Wet, damp and dry under Alaska‘s local option law. J Stud Alcohol, 6(2):311-319. Website: for abstract (http://www.ncbi.nlm.nih.gov/pubmed/10757142) accessed July 7, 2012.
Bianchi, S. M. 2011. Changing families, changing workplaces. Work and Family, 21(2):15-36.
BLM. See U.S. Bureau of Land Management.
Bond, B. 2011. Alaska State Virology Laboratory (ASVL) Week Report October 22-29, 2011.

Alaska Stand Alone Gas Pipeline 5.15-167 Final EIS
Brook, R., Brook, J., Urch, B., Vincent, R., Rajagopalan, S., and Silverman, F. 2002. Inhalation
of Fine Particulate Air Pollution and Ozone Causes Acute Arterial Vasoconstriction in
Health Adults. Circulation, 105:1534-1536.
Brook, R., Rajagopalan, S., Pope III, A., Brook, J., Bhatnagar, A., Diez-Roux, A., Holguin, F.,
Hong, Y., Luepker, R., Mittleman, M., Peters, A., Siscovick, D., Smith Jr., S., Whitsel, L.,
and Kaufman, J. 2010. Particulate Matter Air Pollution and Cardiovascular Disease: An
Update to the Scientific Statement fromfrom the American Heart Association.
Circulation, 121:2331-2378.
Burns, C. J., Bodner, K. M., Jammer, B. L., Collins, J. J., and Swaen G. M .H. 2011. The
healthy worker effects in US chemical industry workers. Occupational Medicine, 61: 40-
44. Website: (http://occmed.oxfordjournals.org/content/early/2010/11/15/occmed.kqq1
68.full.pdf+html) accessed July 16, 2012.
Carpenter, L. 1987. Editorial – Some Observations on the Healthy Worker Effect. Brit J of Ind
Med, 44:289-291. Website: (http://www.ncbi.nlm.nih.gov/pmc/articles/PMC1007826/pdf/
brjindmed00157-0001.pdf) accessed November 21, 2011.
Carrns, A. 2012. ―How far would you go for a comeback?‖ The New York Times, March 21,
2012. Website: (http://www.nytimes.com/2012/03/22/your-money/family-men-go-it-
alone-in-north-dakotas-oil-fields.html?pagewanted=all) accessed July 5, 2012.
Carson, D. and Taylor, A. 2012. The Northern Territory‘s non-resident workforce. Charles
Darwin University and Flinderns University, March 2012. Website:
(http://www.cdu.edu.au/sites/default/files/Brief201204%20NonResidentWorkers_FINAL-
1.pdf) accessed July 16, 2012.
CDC. See Centers for Disease Control and Prevention.
CEE Bankwatch Network, Gender Action. 2006. Boom Time Blues, Big Oil‘s Gender Impacts
in Azerbaijan, Georgia, and Sakhalin. Czech Republic, 52 pp. Website:
(http://bankwatch.org/publications/boom-time-blues-big-oils-gender-impacts-azerbaijan-
georgia-and-sakhalin) accessed April 25, 2012.
Centers for Disease Control and Prevention (CDC). 2008. National Profile. Website:
(http://www.cdc.gov/std/stats08/surv2008-NationalProfile.pdf) accessed
November 21, 2011.
Centers for Disease Control and Prevention (CDC). 2009a. Health Impact Assessment.
Website: (http://www.cdc.gov/healthyplaces/hia.htm) accessed April 24, 2012 (page last
updated October 15, 2009).
Centers for Disease Control and Prevention (CDC). 2009b. Behavioral Risk Factor
Surveillance System (BRFSS).
Alaska Stand Alone Gas Pipeline 5.15-168 Final EIS
Centers for Disease Control and Prevention (CDC). 2009c. Youth Risk Behavior Surveillance
System (YRBSS).
Centers for Disease Control and Prevention (CDC). 2009d. Rates of Reportable STDs among
Young People 15-24 Years of Age Alaska, 2009. Website: (http://www.cdc.gov/std/stats/
by-age/15-24-all-STDs/state/2009/AK09.pdf) accessed November 10, 2011.
Centers for Disease Control and Prevention (CDC). 2009e. Alcohol and suicide among racial/ethnic populations – 17 states, 2005-2006. JAMA, 302(7): 733-734. Website: (http://jama.jamanetwork.com/article.aspx?articleid=184436) accessed July 7, 2012
Centers for Disease Control and Prevention (CDC). 2010a. Behavioral Risk Factor
Surveillance System. Prevalence and Trends Data – Alaska 2010. Database accessed
November 22, 2011.
Centers for Disease Control and Prevention (CDC). 2010b. ―Dental Visits‖. National Center for
Chronic Disease Prevention and Health Promotion Oral Health Resources. Website:
(http://apps.nccd.cdc.gov/nohss/CompareV.asp?DataSet=2&qkey=5&nkey1=10448&nke
y2=9978&Submit3=Go) accessed November 17, 2011.
Centers for Disease Control and Prevention (CDC). 2010c. Colorectal (Colon) Cancer -
Colorectal Cancer Rates by Rates and Ethnicity – Incidence Rates by Race/Ethnicity
and Sex. Website: (http://www.cdc.gov/cancer/colorectal/statistics/race.htm) accessed
November 23, 2011.
Centers for Disease Control and Prevention (CDC). 2010d. Prevention Strategies for Seasonal
Influenza in Healthcare Settings. Website: (http://www.cdc.gov/flu/professionals/
infectioncontrol/healthcaresettings.htm) accessed November 21, 2011.
Centers for Disease Control and Prevention (CDC). 2010e. National Survey on Drug Use and
Health, Table 61. Use of selected substances in the past month among persons 12
years of age and over, by age, sex, race, and Hispanic origin: United States, selected
years 2002-2009. Website: (http://www.cdc.gov/nchs/data/hus/2010/061.pdf) accessed
April 18, 2012.
Centers for Disease Control and Prevention (CDC). 2010f. Sexually Transmitted Disease
Surveillance 2009. Division of STD Prevention November 2010. Website:
(http://www.cdc.gov/std/stats09/surv2009-Complete.pdf) accessed April 23, 2012.
Centers for Disease Control and Prevention (CDC). 2010g. Deaths: Final Data for 2007.
National Vital Statistics Reports, Vol. 58, No. 19, May 20, 2010. Website:
(http://www.cdc.gov/nchs/data/nvsr/nvsr58/nvsr58_19.pdf) accessed April 23, 2012.
Centers for Disease Control and Prevention (CDC). 2011a. National Diabetes Surveillance
System. Website: (http://apps.nccd.cdc.gov/brfss/page.asp?cat=CV&yr=2010&state
=AK#CV) accessed November 21, 2011.

Alaska Stand Alone Gas Pipeline 5.15-169 Final EIS
Centers for Disease Control and Prevention (CDC). 2011b. National diabetes fact sheet:
national estimates and general information on diabetes and prediabetes in the United
States, 2011. Atlanta, GA: U.S. Department of Health and Human Services, Centers for
Disease Control and Prevention, 2011.
Centers for Disease Control and Prevention (CDC). 2011c. High-impact HIV prevention –
CDC‘s approach to reducing HIV infections in the United States. Center for Disease
Control and Prevention, National Center for HIV/AIDS, Viral Hepatitis, STD, and TB
Prevention, Division of HIV/AIDS Prevention, Atlanta, Georgia. August. Website:
(http://www.cdc.gov/hiv/strategy/dhap/pdf/nhas_booklet.pdf) accessed April 23, 2012.
Centers for Disease Control and Prevention (CDC). 2011d. STDs in Racial and Ethnic
Minorities. Website: (http://www.cdc.gov/std/stats10/minorities.htm) accessed
April 23, 2012.
Centers for Disease Control and Prevention (CDC). 2012. Morbidity and Mortality Weekly
Report, Postneonatal Mortality Among Alaska Native Infants — Alaska, 1989–2009
Weekly, January 13, 2012 / 61(01);1-5. Website: (http://www.cdc.gov/mmwr/preview/
mmwrhtml/mm6101a1.htm?s_cid=mm6101a1_w) accessed Aril 23, 2012.
Chlebowski, R., Chen, Z., Anderson, G., Rohan, T., Aragaki, A., Lane, D., Dolan, N., Paskett,
E., McTiernan, A., Hubbell, F., Adams-Campbell, L., and Prentice, R. 2005. Ethnicity
and Breast Cancer: Factors Influencing Differences in Incidence and Outcome. JNCI J
Natl Cancer Inst, 97(6): 439-448. Website: (http://jnci.oxfordjournals.org/content/97/6/
439.full.pdf+html) accessed November 23, 2011.
Chow, J, Watson, J., Mauderly, J., Costa, D., Wyzga, R., Vedal, S., Hidy, G., Altshuler, S.,
Marrack, D., Heuss, J., Wolff, G., Pope III, C., and Dockery, D. 2006. Health Effects of
Fine Particulate Air Pollution: Lines that Connect. Air & Waste Manage. Assoc.
56:1368-1380.
Clifford, S, 2009. The effects of fly-in/fly-out commute arrangements and extended working
hours on the stress, lifestyle, relationship and health characteristics of Western
Australian mining employees and ther partners: Report of research findings. August,
2009. School of Anatomy and Human Biology, The University of Western Australia.
Coates, P. 1991. The Trans-Alaska Pipeline Controversy: Technology, Conservation, and the
Frontier. Associated University Presses, Bethlehem, PA, Second edition in 1993,
University of Alaska, Anchorage, AK.
Cole, D. 1997. Amazing Pipeline Stories: How Building the Trans-Alaska Pipeline Transformed
Life in America‘s Last Frontier. Epicenter Press, Fairbanks, AK.
Congressional Research Service (CRS). 2012. The U.S. Infant Mortality Rate: International
Comparisons, Underlying Factors, and Federal Programs. Congressional Research

Alaska Stand Alone Gas Pipeline 5.15-170 Final EIS
Service 7-5700 www.crs.gov R41378. Website: (http://www.fas.org/sgp/crs/misc/
R41378.pdf) accessed April 24, 2012.
Council on Domestic Violence & Sexual Assault. 2010. 2010 Annual Report. Website:
(http://dps.alaska.gov/CDVSA/docs/CDVSAAnnualReport2010.pdf) accessed April 24,
2012.
Dangote Group. 2004. Environmental Impact Assessment (EIA) of the Ajaokuta – Obajana
Gas Pipeline Project. Final Report, February, 2004. Website: (http://www.eib.org/
attachments/pipeline/1191_eia_en.pdf) accessed on April 23, 2012.
Davies, J., Misiuk, D., Colgan, R., and Wiltse, N. 2009. Reducing PM2.5 Emissions from
Residential Heating Sources in the Fairbanks North Star Borough: Emission Estimates,
Policy Options, and Recommendations. Cold Climate Housing Research Center.
February 23.
Davis, K. D., Goodman, W. B., Pirretti, E., and Almeida, D. M. 2008. Nonstandard work schedules, perceived family well being, and daily stressors. J Marriage Fam, 70(4): 991-1003.
DeFrances, C.J., Lucas, C. A., Buie, V.C., and Golosinskiy, A. 2008. 2006 National Hospital
Discharge Survey. National Health Statistics Reports, Number 5, July 30, 2008.
Website: (http://www.cdc.gov/nchs/data/nhsr/nhsr005.pdf) accessed April 22, 2012.
DeHaven, C., and Miller, G. 2011. EPA/Westar Residential Wood Smoke Workshop. Salt
Lake City, Utah. March 2, 2011. Website: (www.AQFairbanks.com) accessed
November 23, 2011.
DisasterCenter.com. 2012. Alaska Law Enforcement Agency Uniform Crime Reports. Data
presented as sourced from the FBI Uniform Crime Reports. Website:
(http://www.disastercenter.com/crime/akcrime.htm) accessed April 23, 2012.
Dockery, D., and Stone, P. 2007. Cardiovascular Risks from Fine Particulate Air Pollution.
February 1, 2007. New England J Med, 356(5):511-513.
DOE. See U.S. Department of Energy.
DOLWD. See Alaska Department of Labor & Workforce Development.
Dominici, F., Peng, R., Bell, M., Pham, L., McDermott, A., Zeger, S., and Samet, J. 2006. Fine
Particulate Air Pollution and Hospital Admission for Cardiovascular and Respiratory
Diseases. March 8, 2006. JAMA, 295:1127-1134.
Driedger, B. 2012. Number of STI‘s going down in Alberta. www.iNews880.com January 30, 2012. Website: (http://www.inews880.com/Channels/Reg/LocalNews/story.aspx?ID= 1646876) accessed July 7, 2012.
Alaska Stand Alone Gas Pipeline 5.15-171 Final EIS
Ecosystem Research Group. 2007. Sublette County socioeconomic impact study, draft report.
Prepared by Ecosystems Research Group for Sublette County Commissioners,
November 2007. Website: (http://www.sublettewyo.com/DocumentCenter/Home/
View/363) accessed July 5, 2012.
Egeland, G. M., Feyk, L. A., Middaugh, J. P. 1998. The use of traditional foods in a healthy diet in Alaska: Risks in perspective. Section of Epidemiology, Alaska Division of Public Health, Department of Health and Social Services, State of Alaska. January 15, 1998. Website: (http://www.epi.hss.state.ak.us/bulletins/docs/rr1998_01.pdf) accessed July 7, 2012.
ENSTAR Natural Gas Company. 2011. Rates & Regulatory. Website:
(http://www.enstarnaturalgas.com/RatesRegulatory.aspx) accessed November 27, 2011.
EPA. See U.S. Environmental Protection Agency.
ERM. 2008. Environmental Impact Assessment for the Proposed Early Production System,
Kaiso-Tonya Area, Block 2, Lake Albert, Uganda. March 2008. Website:
(http://www.elaw.org/system/files/Final+Report.pdf) accessed on April 23, 2012.
Esso Exploration and Production Chad Inc. 2012. Chad/Cameroon Development Project.
Project Update No. 31, Year End Report 2011. Website: (http://www.essochad.com/
Chad-English/PA/Files/31_allchapters_eng.pdf) accessed April 27, 2012.
Fairbanks Natural Gas, LLC (FNG). 2005. aboutabout Us. Website:
(http://www.fngas.com/about.html) accessed November 27, 2011.
Fairbanks Natural Gas, LLC (FNG). 2011. Your Utility Bill – Calculate Your Bill. Website:
(http://www.fngas.com/calculate.html) accessed November 27, 2011.
Fairbanks North Star Borough. 2009. 2009 Fairbanks Air Quality Symposium Summary.
Website: (http://co.fairbanks.ak.us/airquality/Docs/Symposium_Summary.pdf) accessed
April 24, 2012.
Farnham, A. 2012. ―North Dakota oil boom: The dark side‖. ABCNews.com, posted
February 2, 2012. Website: (http://abcnews.go.com/Business/north-dakotas-oil-boom-
dark-side/story?id=15458362) accessed July 5, 2012.
Fears, J. 1978. Boom, Cash, and Balderdash: A Different Look at Fairbanks during Pipeline
Construction. That New Pub. Co. Fairbanks, AK.
Federal Railroad Administration. 2011. Ten-Year Accident Data for Alaska Railroad
Corporation and all other Railroads, 2001-2010. Office of Safety Analysis. Website:
(http://safetydata.fra.dot.gov/OfficeofSafety/publicsite/Query/tenyr1a.aspx) accessed
November 21, 2011.
Federal Register. 2010. Updated Guidance: Prevention Strategies for Seasonal Influenza in
Healthcare Settings. June 22, 2010. From the Federal Register Online via GPO Access
Alaska Stand Alone Gas Pipeline 5.15-172 Final EIS
[wais.access.gpo.gov]. 75(119):35497-35503. Website: (http://edocket.access.gpo.gov/
2010/2010-15015.htm) accessed November 21, 2011.
Federal Register. 2011. Pipeline Safety: Safety of Gas Transmission Pipelines. August 25,
2011. 76 FR:53086-53102. Website: (http://www.federalregister.gov/articles/2011/08/
25/2011-21753/pipeline-safety-safety-of-gas-transmission-pipelines) accessed
November 25, 2011.
Federal Task Force. 2010. Report to Congress of the Interagency Access to Health Care in
Alaska Task Force.
FNG. See Fairbanks Natural Gas, LLC.
Foster, M. and S. Goldsmith. 2006. Alaska‘s $5 Billion Health Care Bill – Who‘s Paying? UA
Research Summary, March. Website: (http://www.hss.state.ak.us/hspc/files/
RS6_06.pdf) accessed April 24, 2012.
Foster, M. and S. Goldsmith. 2011. Alaska‘s Health Care Bill: $7.5 Billion and Climbing. UA
Research Summary No. 18. Website: (http://www.iser.uaa.alaska.edu/Publications/
RevisedHealthcare.pdf) accessed July 24, 2012.
Fried, N. and A. Shanks. 2011. The Cost of Living in Alaska. Alaska Economic Trends, May.
Website: (http://laborstats.alaska.gov/col/col.pdf) accessed July 24, 2012.
Fye, M., Havel, B., Havel, H., and Putnam, J. 2009. Opportunities for Air Quality Improvement
in the Fairbanks North Star Borough. University of Alaska Fairbanks – Engineering
Science Management Final Project. April 16, 2009.
Galbraith, B. 2009. Alaska Natural Gas Pipeline Proposals (North Slope to Market) Chronology
of Events: 1959-1976. July 15, 2009. Website: (http://library.state.ak.us/pdf/gasline/
ANGTS_1959-76.pdf) accessed November 21, 2011.
Gallegos D. n.d. Fly-in fly-out employment: Managing the parenting transitions. Centre for
Social and Community Research, Murdoch University. Website:
(http://www.cscr.murdoch.edu.au/_docs/aeroplanes.pdf) accessed July 16, 2012.
Goldenberg, S., Shoveller, J., Koehoorn, M., and Ostry, A. 2008a. Barriers to STI testing
among youth in a Canadian oil and gas community. Health & Place, 14: 718-729.
Goldenberg, S., Shoveller, J., Ostry, A, and Koehoorn, M. 2008b. Youth sexual behavior in a
boomtown: implications for the control of sexually transmitted infections. Sex. Transm.
Infect., 84: 220-223.
Goldenberg, S., Shoveller, J., Ostry, A, and Koehoorn, M. 2008c. Sexually transmitted
infection (STI) testing among young oil and gas workers, the need for innovative, place-
based approaches to STI control. Revue Canadienne de Santé Publique, 99(4):
350-354.
Alaska Stand Alone Gas Pipeline 5.15-173 Final EIS
Goldsmith, S. 2009. The Importance of Petroleum to the Alaska Economy: A Gedanken
Experiment. ISER. November, 2009. Website: (http://www.iser.uaa.alaska.edu/
Publications/SF_NARSA_Regional_Science-v6.pdf) accessed November 23, 2011.
Goldsmith, S. 2011. Oil Pumps Alaska‘s Economy To Twice The Size – But What‘s Ahead?
Understand Alaska Research Summary No. 17, February 2011. Institute of Social and
Economic Research, University of Alaska Anchorage. Website:
(http://iser.uaa.alaska.edu/Publications/oiltransformfinal.pdf) accessed April 18, 2012.
Goldsmith, S. 2012. TAPS at 35: Accounting for the oil revenues. Institute of Social and
Economic Research, University of Alaska Anchorage, Web Note No. 12, July 2012.
Website: (http://www.iser.uaa.alaska.edu/Publications/webnote/2012_07_11-
WebNote12.pdf) accessed July 16, 2012.
Goodland, R. 2005. Oil and Gas Pipelines – Social and Environmental Impact Assessment:
State of the Art. May 2005. Website: (http://goodlandrobert.com/PipelinesBK.pdf)
accessed November 21, 2011.
Healthy Air Now. 2011a. Number of PM 2.5 exceedance days that are ‗unhealthy for sensitive
groups‘ and ‗unhealthy‘ for winters in Fairbanks, AK, 2003-2010. Website:
(http://www.healthyairnow.org/wp-content/uploads/2011/08/Graph-Winter-PM-2.5-
Exceedance-Days-2003-2011.jpg) accessed November 25, 2011.
Healthy Air Now. 2011b. Number of PM 2.5 exceedance days by season, 2005-2010.
Website: (http://www.healthyairnow.org/wp-content/uploads/2011/09/Graph-PM2.5-
Exceedance-Days-by-Season.gif) accessed November 25, 2011.
Healthy Air Now. 2011c. Fairbanks Winter PM 2.5 pollution source contribution, Oct. 2007-
March 2008 (FNSB data). Website: (http://www.healthyairnow.org/wp-
content/uploads/2011/09/Pie-Chart-PM-2.5-Source-Contributions_reduced.gif) accessed
November 25, 2011.
Hull-Jilly, D. and Casto, L.D. 2008. State epidemiologic profile on substance use, abuse and dependency. Juneau, AK: Section of Prevention and Early Intervention Services, Division of Behavioral Health, Alaska Department of Health and Social Services, April 2008 (Revised). Website: (http://www.hss.state.ak.us/dph/chronic/injury_prevention/ Assets/SEOW-2001-2005.pdf) accessed July 7, 2012.
Husberg, B., Fosbroke, D., Conway, G., and Mode, N. 2005. Hospitalized Nonfatal Injuries in
the Alaskan Construction Industry. Am J of Ind Med, 47: 428-433.
Immunization Action Coalition. 2007. Hepatitis A, B, and C: Learn the Differences. January
2007. Website: (http://www.immunize.org/catg.d/p4075abc.pdf) accessed
November 23, 2011.

Alaska Stand Alone Gas Pipeline 5.15-174 Final EIS
Indian Health Service. 1999. Indian Health Service. 1999. An Oral Health Survey of American
Indian and Alaska Native Dental Patients: Findings, Regional Differences, and National
Comparisons.
Indian Health Service. 2011 Special Reports: Key Facts – Alaska Natives. Alaska Area
Division of Planning, Evaluation and Health Statistics. Website:
(http://www.ihs.gov/PublicAffairs/IHSBrochure/Disparities.asp) accessed
November 17, 2011.
Information Insights, Inc. 2009. 2009 Alaska Housing Assessment – Part I and Part II. Cold
Climate Housing Research Center – Technical Report Number TR 2009-02. August.
Irvine, M. 2011. ―North Dakota Oil Field ‗Man Camp‘‖. www.HuffingtonPost.com posted
September 2, 2011. Website: (http://www.huffingtonpost.com/2011/09/02/north-dakota-
oil-field-housing_n_946349.html) accessed July 5, 2012.
Islam-Zwart, K., and Cawston, A. 2008. Investigation of factors contributing to diabetes risk in
AmericanAmerican Indian/Alaska native youth. Am Indian Alsk Native Ment Health Res,
14(3):49-58. Website: (http://www.ucdenver.edu/academics/colleges/PublicHealth/
research/centers/CAIANH/journal/Documents/Volume%2014/14(3)_Islam-
Zwart_Investigation_of_Factors_new.pdf) accessed November 23, 2011.
Jobin, W. 2003. Health and Equity Impacts of a Large Oil Project in Africa. Special Theme –
Health Impact Assessment. Bulletin of the World Health Organization 81(6):420-426.
Website: (http://www.who.int/bulletin/volumes/81/6/jobin.pdf) accessed
November 21, 2011.
Kalil, A., Ziol-Guest, K. M. and Levin-Epstein, J. 2010. Nonstandard work and marital
instability: Evidence from the national longitudinal survey of youth. Journal of Marriage
and Family, 72: 1289–1300. Website: (http://paa2009.princeton.edu/download.aspx?
submissionId=90288) accessed July 6, 2012.
Koenig, J., Larson, T., Hanley, Q., Rebolledo, V., Dumler, K., Checkoway, H., Wang, S.-Z., Lin,
D., and Pierson, W. 1993. Pulmonary Function Changes in Children Associated with
Fine Particulate Matter. Env Res., 63:26-38.
Kramer, B. 2012. ―Oil industry man camps offer no-stress living.‖ April 29, 2012. Website:
(http://www.spokesman.com/stories/2012/apr/29/oil-industry-man-cs-offer-no-stress-
living/) accessed July 5, 2012.
Kraus, R., and Buffler, P. 1979. Sociocultural Stress and the American Native in Alaska: An
Analysis of Changing Patterns of Psychiatric Illness and Alcohol Abuse Among Alaska
Natives. Culture, Medicine and Psychiatry 3:111-151.
Kulesza, A. 2011. ―Natural disaster: How did the gas industry get so fracked up?‖ Philadelphia
Weekly, September 14, 2011. Website: (http://www.philadelphiaweekly.com/news-and-

Alaska Stand Alone Gas Pipeline 5.15-175 Final EIS
opinion/cover-story/Natural-Gas-Drilling-in-PA-Goes-From-Gold-Mine-to-Land-
Mine.html) accessed July 5, 2012.
Laden, F., Neas, L., Dockery, D., and Schwartz, J. 2000. Association of Fine Particulate Matter
from Different Sources with Daily Mortality in Six U.S. Cities. Environ Health Perspect,
108:941-947.
Laden, F., Schwartz, J., Speizer, F., and Dockery, D. 2006. Reduction in fine particulate air
pollution and mortality: extended follow-up of the Harvard Six Cities Study. Am J of
Resp and Crit Care Med, 173:667-672.
Leupp, K., Kornrich, S., and Brines, J. 2010. Nine to five no more? The persistence of nonstandard work schedules within families. Manuscript prepared for presentation at the annual meeting of the Population Association of America, 2010. Website: (http://paa2010.princeton.edu/download.aspx?submissionId=100647) accessed July 6, 2012.
Li, C., and Sung, E. 1999. A Review of the Healthy Worker Effect in Occupational
Epidemiology. Occup Med, 49(4): 225-229. Website: (http://occmed.oxfordjournals.org/
content/49/4/225.full.pdf) accessed November 21, 2011.
Mayo Clinic. 2011. Type 2 diabetes. Risk factors. August 2. Website:
(http://www.mayoclinic.com/health/type-2-diabetes/DS00585/DSECTION=risk-factors)
accessed November 29, 2011.
McGrath, E. 1977. Inside The Alaska Pipeline. Celestial Arts, Millbrae, California.
Mead, R. 1978. Journeys Down The Line: Building The Trans-Alaska Pipeline. Doubleday &
Company, Inc., Garden City, New York.
Mengwe, M.S. 2010. Towards Social Impact Assessment of Copper-Nickel Mining in
Botswana. Submitted in fulfillment of the requirements for the degree of Doctor
Philosophy In the Faculty of Science, Nelson Mandela Metropolitan University, May
2010. Website: (http://www.nmmu.ac.za/documents/theses/FINAL.pdf) accessed
April 24, 2012.
Moses, S. K., Whiting, A. V., Bratton, G. R., Taylor, R. J., and O‘Hara, T. M. 2009. Inorganic nutrients and contaminants in subsistence species of Alaska: linking wildlife and human health. International Journal of Circumpolar Health 68(1): 53-74. Website: (http://www.fakr.noaa.gov/protectedresources/seals/ice/moses_%202009_inorg_nutr_contaminants.pdf) accessed July 7, 2012.
Nacher, L., Brauer, M., Lipsett, M., Zelikoff, J., Simpson, D., Koenig, J., and Smith, K. 2007.
Woodsmoke Health Effects: A Review. Inh Tox, 19:67-106.
NAS. See National Academy of Sciences.
Alaska Stand Alone Gas Pipeline 5.15-176 Final EIS
National Academy of Sciences (NAS). 2002. The Ongoing Challenge of Managing Carbon
Monoxide Pollution in Fairbanks, Alaska. Website:
(http://www.nap.edu/openbook.php?isbn=0309084849) accessed November 25, 2011.
National Academy of Sciences (NAS). 2004. Transmission Pipelines and Land Use, A Risk-
Informed Approach, Special Report. Transportation Research Board. Washington, DC.
National Coalition Against Domestic Violence (NCADV). 2010. Domestic Violence Facts:
Alaska. Website: (http://www.ncadv.org/files/Alaska.pdf) accessed November 29, 2011.
National Diabetes Information Clearinghouse. 2011. National Diabetes Statistics, 2011.
Website: (http://diabetes.niddk.nih.gov/dm/pubs/statistics/#Types) accessed April 23,
2012.
National Heart Lung and Blood Institute. 2010. What is COPD? June 1. Website:
(http://www.nhlbi.nih.gov/health/health-topics/topics/copd/) accessed
November 21, 2011.
National Highway Traffic Safety Administration (NHTSA) Fatality Analysis Reporting System
(FARS). 2012. National Statistics. Website: (http://www.fars.nhtsa.dot.gov/Main/
index.aspx) accessed April 23, 2012.
National Oceanic and Atmospheric Administration (NOAA). 2011. Comparative Climatic Data.
National Climatic Data Center. Website: (http://lwf.ncdc.noaa.gov/oa/climate/online/
ccd/nrmhdd.html) accessed November 25, 2011.
National Research Council (NRC). 2003. Cumulative Environmental Effects of Oil and Gas
Activities on Alaska‘s North Slope. Washington, D.C. Website: (www.nap.edu/catalog/
10639.html) accessed November 29, 2011.
National Weather Service. 2011. Explanation. Climate Prediction Center. Website:
(http://www.cpc.ncep.noaa.gov/products/analysis_monitoring/cdus/degree_days/ddayex
p.shtml) accessed November 25, 2011.
NCADV. See National Coalition Against Domestic Violence.
New York State Environmental Protection Bureau. 2008. Smoke gets in your lungs: Outdoor
wood boilers in New York State. Website: (http://www.vtwoodsmoke.org/pdf/NY-OWB8-
05.pdf) accessed December 26, 2011.
NOAA. See National Oceanic and Atmospheric Administration.
Northern Economics, Inc. 2012. Fairbanks North Star Borough Gas Distribution System
Analysis. Prepared for the Fairbanks North Star Borough, June 29, 2012. FNSB Project
number: 11-PWDPRJ-02. Website: (http://www.co.fairbanks.ak.us/hottopics/GasSystem
DistributionAnalysis/FNSBGasDistributionSystemAnalysis-FinalReport-June2012-
Reduced.pdf) accessed August 29, 2012.

Alaska Stand Alone Gas Pipeline 5.15-177 Final EIS
NRC. See National Research Council.
Pacific Environment. 2011. Impacts on Sakhalin Island‘s Society and Infrastructure. Website:
(http://pacificenvironment.org/article.php?id=251) accessed November 21, 2011.
Palo Alto Medical Foundation. 2012. Types of STDs, Gonorrhea. Website:
(http://www.pamf.org/teen/sex/std/std/gonorrhea.html) accessed April 23, 2012.
Papua New Guinea Liquefied Natural Gas Project. 2009. Papua New Guinea Liquefied Natural
Gas Project. Environmental Impact Statement. Website: (http://pnglng.com/
commitment/environmental_impact_statement_exsum_english.htm) accessed on
April 24, 2012.
Parfomak, P. 2008. CRS Report for Congress – Vulnerability of Concentrated Critical
Infrastructure: Background and Policy Options. Updated September 12, 2008.
Website: (http://www.fas.org/sgp/crs/homesec/RL33206.pdf) accessed
November 21, 2011.
Perry-Jenkins, M., Goldberg, A. E., Pierce, C. P., and Sayer, A. G. 2007. Shift work, role overload, and the transition to parenthood. J. Marriage Fam, 69(1): 123-138.
PHMSA. 2011a. Significant Pipeline Incidents Through 2010 Only. Stakeholder
Communications. November 3, 2011. Website: (http://primis.phmsa.dot.gov/comm/
reports/safety/SigPSI.html?nocache=9517#_ngtranson) accessed November 25, 2011.
PHMSA. 2011b. Damage Prevention. Stakeholder Communications. November 3, 2011.
Website: (http://primis.phmsa.dot.gov/comm/DamagePrevention.htm?nocache=9767)
accessed November 25, 2011.
Pope III, C. 2000. Epidemiology of Fine Particulate Air Pollution and Human Health: Biologic
Mechanisms and Who‘s at Risk? Environ Health Perspect, 108(4):713-723.
Pope III, C., Burnett, R., Thun, M., Calle, E., Krewski, D., Ito, K., and Thurston, G. 2002. Lung
Cancer, Cardiopulmonary Mortality, and Long-term Exposure to Fine Particulate Air
Pollution. JAMA, 287:1132-1141.
Pope III, C., and Dockery, D. 2006a. Health Effects of Fine Particulate Air Pollution: Lines that
Connect. Air & Waste Manage. Assoc., 56:709-742.
Pope III, C., Muhlestein, J., May, H., Renlund, D., Anderson, J., and Horne, B. 2006b.
Ischemic Heart Disease Events Triggered by Short-Term Exposure to Fine Particulate
Air Pollution. Circulation, 114:2443-2448.
Pope III, C., Burnett, R., Krewski, D., Jerrett, M., Shi, Y., Calle, E., and Thun, M. 2009a.
Cardiovascular Mortality and Exposure to Airborne Fine Particulate Matter and Cigarette
Smoke: Shape of the Exposure-Response Relationship. Circulation, 120:941-948.

Alaska Stand Alone Gas Pipeline 5.15-178 Final EIS
Pope III, C., Ezzati, M., and Dockery, D. 2009b. Fine-Particulate Air Pollution and Life
Expectancy in the United States. January 22, 2009. N Engl J Med, 360:376-386.
Pope III, C., and Fulton, M. 2011. Health Effects of Particulate Matter Air Pollution. Presented
at EPA Wood Smoke Health Effects Webinar – Brigham Young University. July 28,
2011. Website: ((http://www.epa.gov/apti/broadcast.html#WoodSmoke072811)
accessed November 23, 2011.
Rarig, A., and Hull-Jilly, D. 2011. Alaska injury surveillance report 2011 injury deaths and hospitalizations, 2005-2009, special topic: motor vehicle crash injuries. November 2011. Website: (http://www.dot.state.ak.us/stwdplng/hwysafety/assets/pdf/Inj_Surv_ Report_2011.pdf) accessed July 7, 2012.
Research and Innovative Technology Administration, Bureau of Transportation Statistics (RITA-
BTS). 2006. Publication – Freight in America. January 2006. Website:
(http://www.bts.gov/publications/freight_in_america/html/nations_freight.html) accessed
November 22, 2011.
Rivera, M. and J. Baker. 2010. Measuring and fighting meth use in Alaska and the U.S.
Alaska Justice Forum 27:2-3. University of Alaska Anchorage.
Roderick, J. 1997. Crude Dreams: A Personal History Of Oil & Politics in Alaska. Epicenter
Press, Fairbanks, AK.
Rogers, G. (ed.). 1970. Change in Alaska, People, Petroleum, and Politics. University Of
Alaska Press, Anchorage, AK.
Rosay, A., and L. Morton. 2011. 2010 Alaska Victimization Survey. Report to the Alaska State
Legislature – 1/24/11. Website: (http://justice.uaa.alaska.edu/research/2010/
1004.victimization/1004.02.avs_leg.pdf) accessed on November 29, 2011.
Roscow, J. 1977. 800 Miles to Valdez: The Building of the Alaska Pipeline. Prentice-Hall, Inc.,
Englewood Cliffs, NJ.
Sakhalin Environment Watch. 2011. Sakhalin II Oil and Gas Project – Economic problems.
Website: (http://www.sakhalin.environment.ru/en/index.php?section=economicproblems)
accessed November 21, 2011.
Salkeld, L. McGeehan, S., Chaudhuri, E, and Kerslake, I. 2009. HIV testing of junior doctors:
exploring their experiences, perspectives and accounts. J Med Ethics 35(7): 402-406.
Website: (http://www.ncbi.nlm.nih.gov/pubmed/19567686) accessed on April 24, 2012.
Salkeld, L. and McGeehan, S. 2010. HIV testing of health care workers in England – a flawed
policy. J Health Serv Res Policy 15(S2): 62-67. Website: (http://www.ncbi.nlm.nih.gov/
pubmed/20147426) accessed April 23, 2012.

Alaska Stand Alone Gas Pipeline 5.15-179 Final EIS
Samet, J., Dominici, F., Curriero, F., Coursac, I., and Zeger, S. 2000. Fine Particulate Air
Pollution and Mortality in 20 U.S. Cities, 1987-1994. December 14, 2000. N Engl J
Med, 343(24):1742-1749.
Sawyer, H. 1997. Lambda Fights Illegal, Widespread Practice: Mandatory HIV Testing and
Disclosure. The Body, Spring/Summer 1997. Website: (http://www.thebody.com/
content/art6946.html?ic=2004) accessed on April 24, 2012.
Schecter, D. 2011. ―Oil boom in North Dakota overwhelming rural towns.‖ WFAA.com, posted
November 9th, 2011. Website: (http://www.wfaa.com/news/business/Oil-boom-in-North-
Dakota-overwhelms-rural-towns-133493403.html) accessed July 5, 2012.
Schnitzer, P., and Bender, T. 1992. Surveillance of traumatic occupational fatalities in
Alaska—implications for prevention. Pub Health Rep, 107(1):70-73.
Schwartz, J., and Neas, L. 2000. Fine Particles Are More Strongly Associated than Coarse
Particles with Acute Respiratory Health Effects in Schoolchildren. January 2000.
Epidemiology 11(1):6-10.
Seaton, P. 2008. Alaska Gasline Options and Challenges. June 26, 2008. Website:
(http://www.housemajority.org/seaton/pdfs/25/seaton_ak_gasline_presentation_2008062
6.pdf) accessed November 28, 2011.
Segal, B. 1998. Drinking and drinking-related problems among Alaska Natives. Alcohol Health
& Research World, 22(4): 276-280.
Shandro, J. A., Veiga, M. M., Shoveller, J, Scoble, M., and Koehoorn, M. 2011. Perspectives
on community health issues and the mining boom-bust cycle. Resources Policy, 36(2):
178-186.
Sierra Research, Inc. 2010. 2010 Fairbanks Home Heating Survey. Report No. SR2010-06-
01. June 21, 2010.
Sinoh Environmental Sdn. Bhd. 2012. Proposed Oil Palm Plantation (OPP) and Industrial Tree
Plantation (ITP) Development At Benta Wawasan I and Benta Wawasan IIC, Yayasan
Sabah Forest Management Area, Kalabakan and Gunung Rara Forest Reserves, Tawau
District, Sabah. Chapter 5 Recommended Mitigation Measures. Website::
(http://www.sabah.gov.my/jpas/Assessment/eia/sp-eias/Benta/eia/Chp5/Ch5.pdf)
accessed April 24, 2012.
Skansa. 2008. Urucu-Manaus, Brazil, Case Study 26, Aspects of Sustainability. Website:
(http://www.skanska.com/global/Projects/Files/Urucu,%20LA.pdf) accessed
April 24, 2012.
Slaughter, J., Kim, E., Sheppard, L., Sullivan, J., Larson, T., and Claiborn, C. 2005.
Association between particulate matter and emergency room visits, hospital admissions
and mortality in Spokane, Washington. J of Exp Analysis and Env Epid, 15:153-159.
Alaska Stand Alone Gas Pipeline 5.15-180 Final EIS
Snyder, C. 2012. ―Man camps create temporary housing solution, but their future is unclear.‖
www.OilPatchDispatch.com, posted May 6, 2012. Website:
(http://oilpatchdispatch.areavoices.com/2012/05/06/man-camps-create-temporary-
housing-solution-but-their-future-is-unclear/) accessed July 5, 2012.
Social Science Data Analysis Network (SSDAN). 2011. Alaska Population Growth –
Population, 1960-2000. Website: (http://www.censusscope.org/us/s2/chart_popl.html)
accessed November 21, 2011.
SSDAN. See Social Science Data Analysis Network.
State of Alaska Epidemiology. 1997. Alcohol and Drug Use Among Alaska Adolescents.
Website: (http://www.epi.hss.state.ak.us/bulletins/docs/b1997_08.pdf) accessed
April 18, 2012.
State of Alaska Epidemiology. 2006. Bulletin No. 14, July 5, 2006, Findings of the Alaska
Maternal-Infant Mortality Review, 1992-2001. Website: (http://www.childdeathreview.org/
reports/Alaskaepi06.pdf) accessed April 23, 2012.
State of Alaska Epidemiology. 2010. Bulletin No. 32, December 2, 2010, Homicide
Epidemiology Update – Alaska, 2003-2008. Website:
(http://www.epi.hss.state.ak.us/bulletins/docs/b2010_32.pdf) accessed April 23, 2012
State of Alaska Epidemiology. 2012. Subsistence food safety – Assessing the risks and benefits. Website: (http://www.epi.hss.state.ak.us/eh/subsistence.htm) accessed July 7, 2012.
Statewide Suicide Prevention Council. 2010. Mending The Net: Suicide Prevention In Alaska.
Website: (http://www.hss.state.ak.us/suicideprevention/pdfs_sspc/
2010SSPCAnnualReport.pdf) accessed April 22, 2012.
Storey, K. 2010. Fly-in / fly-out: Implications for community sustainability. Sustainability, 2:
1161-1181. Website: (http://www.mdpi.com/2071-1050/2/5/1161) accessed
July 16, 2012.
Stout, J., Sullivan, M., Liu, L., and Grossman, D. 1999. Asthma Prevalence among American
Indian and Alaska Native Children. Pub Health Rep, 114:257-261. Website:
(http://www.ncbi.nlm.nih.gov/pmc/articles/PMC1308477/pdf/pubhealthrep00027-
0059.pdf) accessed November 22, 2011.
Strohmeyer, J. 1993. Extreme Conditions: Big Oil and the Transformation of Alaska. Simon &
Schuster, New York, NY.
Alaska Stand Alone Gas Pipeline 5.15-181 Final EIS
Substance Abuse and Mental Health Services Administration, Center for Behavioral Health
Statistics and Quality. 2011. The NSDUH Report: Substance Use Among American
Indian of Alaska Native Adolescents. October 4, 2011, Rockville, MD. Website:
(http://www.samhsa.gov/data/2k11/WEB_SR_005/SubsUse_Among_AmInd_NatAlsk_A
dlscnt.pdf) accessed April 18, 2012.
Substance Abuse and Mental Health Services Administration. 2004. Results from the 2003
National Survey on Drug Use and Health: Detailed Tables Prevalence Estimates,
Standard Errors, P-Values, and Sample Sizes. Website:
(http://www.samhsa.gov/data/Nhsda/2k3tabs/Sect1peTabs67to132.htm#tab1.78a)
accessed April 23, 2012.
Sulzberger, A. G. 2011. ―Oil rigs bring camps of men to the prairie.‖ The New York Times,
November 25, 2011. Website: (http://www.nytimes.com/2011/11/26/us/north-dakota-oil-
boom-creates-camps-of-men.html?pagewanted=all) accessed July 5, 2012.
Tausig, M. and Fenwick, R. 2001. Unbinding time: Alternate work schedules and work-life balance. J Fam Econ Issues, 2(2):101-119.
Taylor J. and Simmonds J. 2009. Family stress and coping in the fly-in fly-out workforce. The
Australian Community Psychologist, 21(2): 23-36.
Thomas, H. 2005. Trans-Alaska Pipeline System - Impacts of Global Climate Change -
Proceedings of World Water and Environmental Resources Congress 2005. American
Society of Civil Engineers (ASCE). Website: (http://cedb.asce.org/cgi/WWWdisplay.cgi?
147006) accessed April 24, 2012.
Thygesen, L., Hvidtfeldt, U., Mikkelsen, S., and Brønnum-Hansen, H. 2011. Quantification of
the Healthy Worker Effect: a Nationwide Cohort Study Among Electricians in Denmark.
BMC Pub Health, 11:571. July 18, 2011. Website: (http://www.biomedcentral.com/
1471-2458/11/571) accessed November 21, 2011.
Toffolon-Weiss, M., Blabey, M., Parrish, J., and Pierce-Bulger, M. 2008. The State of Alaska
Native Infant Mortality. September 23, 2008. Website: (http://www.anthc.org/chs/
epicenter/upload/10B-The-State-of-AK-Native-Infant-Mortality-MTW.pdf) accessed
November 23, 2011.
Tsai, S. P., Wendt, J. K., Cardarelli, K. M., and Fraser, A. E. 2003. A mortality and morbidity
study of refinery and petrochemical employees in Louisiana. Occupational and
Environmental Medicine, 60: 627-633. Website: (http://www.ncbi.nlm.nih.gov/
pmc/articles/PMC1740632/pdf/v060p00627.pdf) accessed July 16, 2012.
Turner, T., and Nipataruedi, N. 2011. Fugitive Dust – What Is It? Why Should I Care? March
2011. Department of Environmental Conservation, Air Quality. Website:
(http://dec.alaska.gov/air/ap/docs/Fugitive%20Dust_3-31-11Final2.pdf) accessed
November 21, 2011.
Alaska Stand Alone Gas Pipeline 5.15-182 Final EIS
U.S. Army Corps of Engineers (USACE). 2011. Point Thomson Project Draft Environmental
Impact Statement. Section 5.23- Human Health.
U.S. Bureau of Land Management (BLM). 2007. Northeast NPR-A Draft Supplemental
IAP/EIS, Vols. 1-3. Website: (http://www.blm.gov/ak/st/en/prog/planning/
npra_general/ne_npra/northeast_npr-a_draft.html) accessed November 21, 2011.
U.S. Bureau of Land Management (BLM). 2011. Dalton Highway Visitor‘s Guide Summer
2011. Website: (http://www.alaskageographic.org/uploads/pdf/dalton-vg2011.pdf)
accessed November 11, 2011.
U.S. Census Bureau. 2000. Table DP1. Profile of General Demographic Characteristics: 2000.
U.S. Census Bureau. 2010. Table QT-PL. Race, Hispanic or Latino, Age, and Housing
Occupancy: 2010.
U.S. Census Bureau. 2009a. A Compass for Understanding and Using American Community
Survey Data: What Researchers Need to Know, May 2009. Website:
(http://www.census.gov/acs/www/Downloads/handbooks/ACSResearch.pdf) accessed
April 24, 2012.
U.S. Census Bureau. 2009b. 2005-2009 American Community Survey. 5-Year Estimates, Sex
by Age by Educational Attainment for the Population 18 years and over. Website:
(http://factfinder.census.gov/servlet/DatasetMainPageServlet?_program=ACS&_submen
uId=datasets_2) accessed November 8, 2011.
U.S. Census Bureau. 2009c. 2005-2009 American Community Survey. 5-Year Estimates,
Poverty Status in the Past 12 Months by Sex by Age. Website:
(http://factfinder.census.gov/servlet/DatasetMainPageServlet?_program=ACS&_submen
uId=datasets_2) accessed November 8, 2011.
U.S. Census Bureau. 2009d. 2005-2009 American Community Survey. 5-Year Estimates,
Median Household Income in the Past 12 Months. Website:
(http://factfinder.census.gov/servlet/DatasetMainPageServlet?_program=ACS&_submen
uId=datasets_2) accessed November 8, 2011.
U.S. Census Bureau. 2009e. 2005-2009 American Community Survey. 5-Year Estimates,
Table B23001: Sex by Age Employment Status for the Population 16 Years and Over.
Website: (http://factfinder.census.gov/home/saff/main.html?_lang=en&_ts=) accessed
November 8, 2011.
U.S. Census Bureau. 2011a. Statistical Abstract of the United States, Table 724 Purchasing
Power of the Dollar: 1950 to 2010. Website: (http://www.census.gov/prod/2011pubs/
12statab/prices.pdf) accessed November 21, 2011.
U.S. Census Bureau. 2011b. State and County Quickfacts - Alaska. October 13, 2011.
Website: (http://quickfacts.census.gov/qfd/states/02000.html) accessed
November 21, 2011.
Alaska Stand Alone Gas Pipeline 5.15-183 Final EIS
U.S. Census Bureau. 2011c. U.S. Census Bureau Delivers Alaska‘s 2010 Census Population
Totals, Including First Look at Race and Hispanic Origin Data for Legislative
Redistricting. March 16, 2011. Website: (http://2010.census.gov/news/releases/
operations/cb11-cn83.html) accessed November 25, 2011.
U.S. Census Bureau. 2011d. US Census 2010, Summary File 1. Alaska. Website:
(http://www.census.gov/newsroom/releases/archives/2010_census/cb11-cn159.html)
accessed April 24, 2011.
U.S. Department of Energy (DOE). 1999. Natural Gas 1998 – Issues and Trends. April 1999.
Energy Information Administration. Website: (ftp://ftp.eia.doe.gov/pub/oil_gas/
natural_gas/analysis_publications/natural_gas_1998_issues_trends/pdf/it98.pdf)
accessed November 25, 2011.
U.S. Department of Energy (DOE). 2009. Alaska North Slope Oil and Gas, A Promising Future
or an Area in Decline? Addendum Report, DOE/NETL-2009/1385. Website:
(http://www.netl.doe.gov/technologies/oil-gas/publications/AEO/ANS_Potential.pdf)
accessed April 24, 2012.
U.S. Department of Energy (DOE). 2012. Petroleum & Other Liquids, Crude Oil Production
Data Table. 3/19/2012. Website: (www.eia.gov/dnav/pet/pet_crd_crpdn_adc_
mbbl_a.htm) accessed April 25, 2012.
U.S. Department of Health and Human Services, The Office of Minority Health. 2011. Infant
Mortality and American Indians/Alaska Natives. Website:
(http://minorityhealth.hhs.gov/templates/content.aspx?lvl=2&lvlID=52&ID=3038)
accessed April 23, 2012.
U.S. Department of Health and Human Services, Health Resources and Services Administration
(HRSA). 2011. ―Shortage Designation: Medically Underserved Areas & Populations.‖
Website: (http://bhpr.hrsa.gov/shortage/muaguide.htm) accessed January 19, 2011.
U.S. Department of Transportation (DOT) Federal Highway Administration (FHWA). 2011.
Highway Statistics 2010. Website:
(http://www.fhwa.dot.gov/policyinformation/statistics/2010/) accessed April 24, 2012.
U.S. Department of Transportation (DOT). 2007. Federal Motor Carrier Safety Administration.
2006 Police Reported Motor Vehicle Traffic Crashes. November 2007. Website:
(http://www.fmcsa.dot.gov/facts-research/facts-figures/analysis-statistics/cmvfacts.htm)
accessed November 21, 2011.
U.S. Environmental Protection Agency (EPA). 1999. Environmental impacts on subsistence foods. Environmental Voices, Fall Winter 1999-2000. Published by the Office of Pesticides Prevention and Toxic Substances and Tribal Environmental News Excchange. EPA 745-N-00-001. Website: (http://www.epa.gov/oppt/tribal/ pubs/tribal05.pdf) accessed July 7, 2012.

Alaska Stand Alone Gas Pipeline 5.15-184 Final EIS
U.S. Environmental Protection Agency (EPA). 2009. Integrated Science Assessment for
Particulate Matter, EPA/600/R-08/139F. Website: (http://www.epa.gov/ncea/pdfs/
partmatt/Dec2009/PM_ISA_full.pdf) accessed November 24, 2011.
U.S. Environmental Protection Agency (EPA). 2010a. Effects of Air Pollutants – Health Effects.
Air Pollution Control Orientation Course. January 29, 2010. Website:
(http://www.epa.gov/apti/course422/ap7a.html) accessed November 23, 2011.
U.S. Environmental Protection Agency (EPA). 2010b. The Benefits and Costs of the Clean Air
Act: 1990 to 2020 – Summary Report. Office of Air and Radiation. August 16, 2010.
Website: (http://www.epa.gov/air/sect812/aug10/summaryreport.pdf) accessed
November 27, 2011.
USACE. See U.S. Army Corps of Engineers.
Utermohle, C. J., Wells, R. S. Sexual Violence/Intimate Partner Violence: Socioeconomic and
Mental Health Correlates of High Prevalence. Prepared for the State of Alaska
Department of Health and Social Services, Division of Public health, Section of Chronic
Disease Prevention and Health Promotion.
van Hinte, T., Gunton, T., and Day, J. 2007. Evaluation of the Assessment Process for Major
Projects: A Case Study of Oil and Gas Pipelines in Canada. Impact Assessment of
Project Appraisal 25(2):123-137. June 2007. Website: (www.commdev.org/files/
1710_file_s5.pdfIII.pdf) accessed November 21, 2011.
Verbrugge, L. 2009. Particulate Matter 2.5 – Human Health Effects. Fairbanks North Star
Borough – Air Quality Symposiums. Website: (ftp://ftp.co.fairbanks.ak.us/AQ-
Symposium/Symposium_Presentations_ftp/Lori_Verbrugge_Health_Effects.pdf)
accessed November 24, 2011.
Walters, K., Simoni, J., and Evans-Campbell, T. 2002. Substance Use Among American
Indians and Alaska Native: Incorporating Culture In An ―Indigenist‖ Stress-Coping
Paradigm. Public Health Reports 117(S1): S104-S117. Website:
(http://www.ncbi.nlm.nih.gov/pmc/articles/PMC1913706/pdf/pubhealthrep00207-
0109.pdf) accessed April 18, 2012.
Wernham, A. 2007a. Integrating Health Impact Assessment into the U.S. EIS process:
Examples from Alaskan Oil Development and Implications for U.S. Policy. APHA 2007 –
SESSION 3314.0. February 1, 2007. Website: (http://apha.confex.com/apha/135am/
recordingredirect.cgi/id/15490) accessed November 21, 2011.
Wernham, A. 2007b. Inupiat Health and Proposed Alaskan Oil Development: Results of the
First Integrated Health Impact Assessment/Environmental Impact Statement for
Proposed Oil Development on Alaska‘s North Slope. EcoHealth, 4:500-513.
Alaska Stand Alone Gas Pipeline 5.15-185 Final EIS
Wernham, A. n.d. HIA in the energy and natural resource development sectors. Website:
(http://www.healthimpactProject.org/resources/body/Wernham-Energy-and-Natural-
Resources.pdf) accessed July 5, 2012.
WHO. See World Health Organization.
Wilkinson, R., and Marmot, M. (eds.). 2003. Social Determinants of Health: The Solid Facts –
Second Edition. World Health Organization. Website: (http://www.euro.who.int/
__data/assets/pdf_file/0005/98438/e81384.pdf) accessed November 21, 2011.
Winkler, Mirko S. Mark J. Divall, Gary R. Krieger, Marci Z. Balge, Burton H. Singer, Jürg
Utzinger. 2010. Assessing health impacts in complex eco-epidemiological settings in
the humid tropics: Advancing tools and methods. Environmental Impact Assessment
Review. Vol 30: issue 1 (pp. 52-61). January.
Wood, D. 2011. Risk Factors for Lung Cancer. Alaska Surgery Center. Website:
(http://www.aksurgery.com/apps/HealthGate/Article.aspx?chunkiid=19772) accessed
November 23, 2011.
World Health Organization (WHO). 1999. Health Impact Assessment: Main concepts and
suggested approach. Brussels, Belgium. December 1999.
World Health Organization (WHO). 2001. Global Prevalence and Incidence of Selected
Curable Sexually Transmitted Infections. Geneva, Switzerland. Website:
(http://www.who.int/hiv/pub/sti/who_hiv_aids_2001.02.pdf) accessed April 25, 2012.
World Health Organization (WHO). 2011. Health Impact Assessment (HIA): Glossary of terms
used. Website: (http://www.who.int/hia/about/glos/en/index.html) accessed April 24,
2012, (page last updated in 2011).
Yellow Pages. Website: (http://www.yellowpages.com/) accessed November 15, 2011.
Yemen LNG Company Ltd. 2006. Yemen LNG Project, Environmental and Social Impact
Assessment. Revision 1, 10 February, 2006. Section 5.2 Balhaf LNG Plant:
Environmental Impacts and Mitigation Measures. Website: (http://www.yemenlng.com/
ws/uploads/14_766-AUR-06-0001_A_ESIA_Yemen_Section_5_Revision_1_Part2.pdf)
accessed April 24, 2012.
Young, M.B., Perham-Hester, K.A., and Kemberling, M.M. 2011. Alaska Maternal and Child
Health Data Book 2011: Alaska Native Edition. Anchorage, AK: A collaboration of the
Alaska Department of Health and Social Services, Division of Public Health, and the
Alaska Native Tribal Health Consortium, Alaska Native Epidemiology Center. October
2011. Website: (http://www.epi.alaska.gov/mchepi/mchdatabook/default.htm) accessed
April 23, 2012.
Alaska Stand Alone Gas Pipeline 5.15-186 Final EIS
Zangwill, M. 2011. Risk Factors for Prostate Cancer. Alaska Surgery Center. Website:
(http://www.aksurgery.com/apps/HealthGate/Article.aspx?chunkiid=20050) accessed
November 23, 2011.
5.15.6.1 Personal Communications
Jeffers, J. 2011. Statewide Traffic & Safety Coordinator, (907) 465-8962. Personal
communication. November 22, 2011.
Renfrew, M. 2011. Freight Services Coordinator, Alaska Railroad Corporation.
(907) 265--2258. Personal communication. November 18, 2011.

Alaska Stand Alana Gas Pipa/ina
5.16 AIR QUALITY
Final EIS

Alaska Stand Alone Gas Pipeline 5.16-1 Final EIS
5.16 AIR QUALITY
5.16.1 Affected Environment
Regional climate and meteorological conditions can influence the transport and dispersion of air
pollutants that affect air quality. The existing climate and ambient air quality in the proposed
Project area are described below.
5.16.1.1 Climate
The proposed Project would be constructed in Alaska from the North Slope to Cook Inlet. The
proposed Project area would be located within three of the five major climate zones of Alaska:
(1) transition zone that includes the area between the maritime and continental zones in the
southern portion of the Copper River and Cook Inlet, and northern extremes of the south coast;
(2) continental zone that includes the remainders of the Copper River, west-central divisions,
and the interior basin; and (3) arctic zone or the arctic drainage division.
The arctic zone is characterized by average annual precipitation of less than 20 inches and an
average annual temperature of 20 degrees Fahrenheit (20°F) or less; seasonal variation in
temperature is small in this zone. The continental zone extends over about two-thirds of the
state and is characterized by about 20 inches of average annual precipitation and an average
temperature of about 22°F. Temperature extremes are greater in the continental zone than in
the other climatic zones. Average annual precipitation in the narrow transitional zone is about
30 inches, and temperatures average about 27°F annually (USGS 2010).
Representative climate data near the proposed Project area are presented in Table 5.16-1.
5.16.1.2 Climate Change
The American Meteorological Society (AMS) refers to climate change as any systematic change
in the long-term statistics of climate elements (such as temperature, pressure, or winds)
sustained over several decades or longer. The AMS also indicates climate change may be due
to natural external forcings, such as changes in solar emission or slow changes in the Earth's
orbital elements, natural internal processes of the climate system, or anthropogenic forcing.
The climate system can be influenced by changes in the concentration of various greenhouse
gases (GHG) in the atmosphere that affect the Earth’s absorption of radiation (AMS 2009).
In its Inventory of U.S. Greenhouse Gas Emissions and Sinks: 1990 – 2008, the Environmental
Protection Agency (EPA 2010a) provides summary information on the work of the United
Nations Framework Convention on Climate Change (UNFCCC) and the Intergovernmental
Panel on Climate Change (IPCC 1990-2007). Key information from the report is summarized
below.

Alaska Stand Alone Gas Pipeline 5.16-2 Final EIS
TABLE 5.16-1 Representative Climate Data in the Vicinity of the Proposed Project Areaa
Location/Measurement Jan Feb Mar Apr May Jun Jul Aug Sep Oct Nov Dec
Prudhoe Bay, AK
Mean maximum temperature (°F) -11 -13 -10 7 27 44 54 50 38 19 1 -8
Mean minimum temperature (°F) -23 -27 -25 -10 16 33 39 37 28 9 -10 -20
Mean precipitation (in.) 0.07 0.11 0.04 0.03 0.05 0.17 0.50 0.73 0.84 0.32 0.08 0.10
Mean snowfall (in.) 1.42 2.09 0.98 0.79 2.21 0.79 NA 0.12 3.11 8.12 2.01 2.09
Mean wind speed (mph) 14 14 13 13 14 13 13 13 14 14 13 14
Mean wind direction NE NE NE N N N N N N N N N
Mean morning relative humidity (%)
74 72 73 75 72 84 84 90 89 86 75 73
Mean afternoon relative humidity (%)
74 72 72 74 78 75 72 79 83 85 75 73
Days with fog 20 19 21 20 22 16 15 19 20 19 17 17
Days with thunderstorms 0 0 0 0 0 0 NA 0 0 0 0 0
Wiseman, AK
Mean maximum temperature (°F) -4 0 14 32 53 68 69 62 48 25 6 -1
Mean minimum temperature (°F) -20 -18 -8 9 33 47 49 44 32 12 -7 -17
Mean precipitation (in.) 0.70 0.60 0.70 0.60 0.60 1.40 1.90 2.40 1.70 1.10 0.90 0.90
Mean snowfall (in.) 12.02 8.98 10.01 8.00 0.98 NA 0.00 NA 2.01 12.02 13.00 15.01
Mean wind speed (mph) 7 8 8 9 9 8 7 7 8 8 7 7
Mean wind direction N N N N N N S N N N N N
Mean morning relative humidity (%)
69 68 69 74 74 75 83 89 85 80 74 71
Mean afternoon relative humidity (%)
68 66 63 61 50 48 55 62 65 77 73 71
Days with fog 9 9 9 7 0 2 6 10 8 11 9 11
Days with thunderstorms 0 0 0 0 NA 2 2 NA NA 0 NA 0
Fairbanks, AK
Mean maximum temperature (°F) -1 7 24 41 59 70 72 66 54 32 11 1
Mean minimum temperature (°F) -18 -14 -1 19 37 49 52 46 36 18 -4 -15
Mean precipitation (in.) 0.50 0.40 0.30 0.30 0.60 1.40 2.00 1.90 1.00 0.80 0.70 0.80
Mean snowfall (in.) 10.01 8.98 5.99 2.99 0.98 0.00 0.00 NA 0.98 10.99 13.00 13.99
Mean wind speed (mph) 5 6 7 8 8 10 9 9 6 7 6 6
Mean wind direction N N N N N SW SW SW N N N N
Mean morning relative humidity (%)
69 68 69 70 64 72 80 87 85 81 74 72
Mean afternoon relative humidity (%)
69 64 54 46 39 44 51 55 57 69 73 72

Alaska Stand Alone Gas Pipeline 5.16-3 Final EIS
TABLE 5.16-1 Representative Climate Data in the Vicinity of the Proposed Project Areaa
Location/Measurement Jan Feb Mar Apr May Jun Jul Aug Sep Oct Nov Dec
Days with fog 13 9 4 2 2 2 5 7 6 7 9 12
Days with thunderstorms NA NA 0 NA NA 3 3 1 NA NA NA NA
Healy, AK
Mean maximum temperature (°F) -1 7 24 41 59 70 72 66 54 32 11 1
Mean minimum temperature (°F) -18 -14 -2 19 37 49 52 46 36 18 -4 -15
Mean precipitation (in.) 0.50 0.40 0.30 0.30 0.60 1.40 2.00 1.90 1.00 0.80 0.70 0-80
Mean snowfall (in.) 10.01 8.98 5.99 2.99 0.98 0.00 0.00 NA 0.98 10.99 13.00 13.99
Mean wind speed (mph) 5 6 7 8 8 10 9 9 6 7 6 6
Mean wind direction N N N N N SW SW SW N N N N
Mean morning relative humidity (%)
69 68 69 70 64 72 80 87 85 81 74 72
Mean afternoon relative humidity (%)
69 64 54 46 39 44 51 55 57 69 73 72
Days with fog 13 9 4 2 2 2 5 7 6 7 9 12
Days with thunderstorms NA NA 0 NA NA 3 3 1 NA NA NA NA
Talkeetna, AK
Mean maximum temperature (°F) 19 25 33 44 56 65 68 64 55 40 26 19
Mean minimum temperature (°F) 1 3 9 22 34 44 49 45 36 24 9 2
Mean precipitation (in.) 1.60 1.50 1.40 1.20 1.40 2.30 3.400 4.40 4.20 2.90 1.80 1.80
Mean snowfall (in.) 20.01 20.01 18.01 10.01 0.98 NA 0.00 0.00 NA 12.02 18.01 23.99
Mean wind speed (mph) 10 9 8 7 8 8 8 7 6 7 8 8
Mean wind direction NE N N N S S S S N N N N
Mean morning relative humidity (%)
74 75 75 80 79 83 88 94 94 86 78 76
Mean afternoon relative humidity (%)
72 66 58 52 50 53 62 65 66 70 73 75
Days with fog 7 7 7 6 3 4 8 10 9 9 7 7
Days with thunderstorms 0 0 0 0 NA 1 1 1 NA 0 0 0
Willow, AK
Mean maximum temperature (°F) 20 25 32 43 54 62 65 63 55 40 27 20
Mean minimum temperature (°F) 6 9 16 28 39 47 52 50 42 28 14 8
Mean precipitation (in.) 0.91 0.87 0.78 0.59 0.56 1.13 2.02 2.41 2.58 1.73 1.12 1.32
Mean snowfall (in.) 10.80 11.50 9.10 5.20 0.32 0.00 0.00 NA 0.20 7.80 11.78 15.68
Mean wind speed (mph) 3 3 3 3 5 5 3 3 5 3 3 3
Mean wind direction N NE N N N N N N N N N N
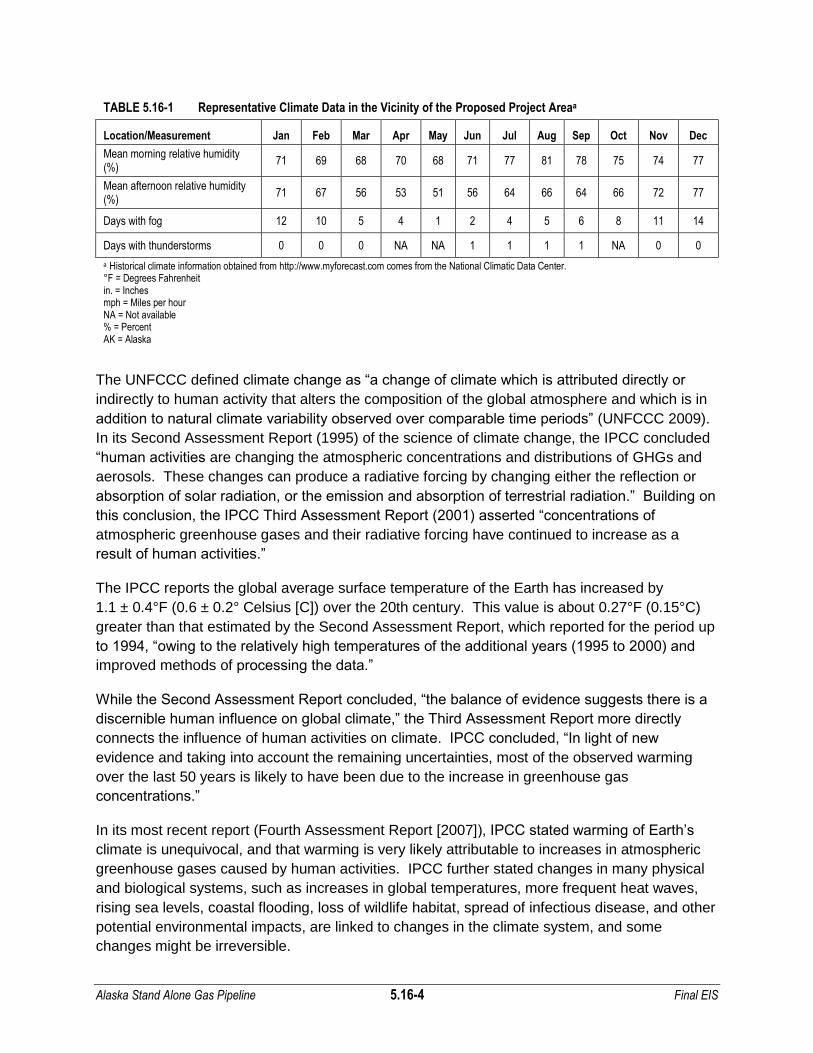
Alaska Stand Alone Gas Pipeline 5.16-4 Final EIS
TABLE 5.16-1 Representative Climate Data in the Vicinity of the Proposed Project Areaa
Location/Measurement Jan Feb Mar Apr May Jun Jul Aug Sep Oct Nov Dec
Mean morning relative humidity (%)
71 69 68 70 68 71 77 81 78 75 74 77
Mean afternoon relative humidity (%)
71 67 56 53 51 56 64 66 64 66 72 77
Days with fog 12 10 5 4 1 2 4 5 6 8 11 14
Days with thunderstorms 0 0 0 NA NA 1 1 1 1 NA 0 0
a Historical climate information obtained from http://www.myforecast.com comes from the National Climatic Data Center. °F = Degrees Fahrenheit in. = Inches mph = Miles per hour NA = Not available % = Percent AK = Alaska
The UNFCCC defined climate change as ―a change of climate which is attributed directly or
indirectly to human activity that alters the composition of the global atmosphere and which is in
addition to natural climate variability observed over comparable time periods‖ (UNFCCC 2009).
In its Second Assessment Report (1995) of the science of climate change, the IPCC concluded
―human activities are changing the atmospheric concentrations and distributions of GHGs and
aerosols. These changes can produce a radiative forcing by changing either the reflection or
absorption of solar radiation, or the emission and absorption of terrestrial radiation.‖ Building on
this conclusion, the IPCC Third Assessment Report (2001) asserted ―concentrations of
atmospheric greenhouse gases and their radiative forcing have continued to increase as a
result of human activities.‖
The IPCC reports the global average surface temperature of the Earth has increased by
1.1 ± 0.4°F (0.6 ± 0.2° Celsius [C]) over the 20th century. This value is about 0.27°F (0.15°C)
greater than that estimated by the Second Assessment Report, which reported for the period up
to 1994, ―owing to the relatively high temperatures of the additional years (1995 to 2000) and
improved methods of processing the data.‖
While the Second Assessment Report concluded, ―the balance of evidence suggests there is a
discernible human influence on global climate,‖ the Third Assessment Report more directly
connects the influence of human activities on climate. IPCC concluded, ―In light of new
evidence and taking into account the remaining uncertainties, most of the observed warming
over the last 50 years is likely to have been due to the increase in greenhouse gas
concentrations.‖
In its most recent report (Fourth Assessment Report [2007]), IPCC stated warming of Earth’s
climate is unequivocal, and that warming is very likely attributable to increases in atmospheric
greenhouse gases caused by human activities. IPCC further stated changes in many physical
and biological systems, such as increases in global temperatures, more frequent heat waves,
rising sea levels, coastal flooding, loss of wildlife habitat, spread of infectious disease, and other
potential environmental impacts, are linked to changes in the climate system, and some
changes might be irreversible.

Alaska Stand Alone Gas Pipeline 5.16-5 Final EIS
The principal GHGs are carbon dioxide (CO2), methane (CH4), nitrous oxide (N2O), and
fluorinated gases. Because CO2 is the reference gas for climate change, measures of non-CO2
GHGs are converted into CO2-equivalent (CO2-e) values based on their potential to absorb heat
in the atmosphere. GHGs occur naturally because of volcanoes, forest fires, and biological
processes (such as breathing), and they are also produced by burning fossil fuels in power
plants and automobiles, and from industrial and agricultural processes, waste management, and
land use changes.
Nationally, CO2 emissions from fossil fuel combustion represented the largest source
(approximately 80 percent) of total weighted GHG emissions from all emission sources in 2007
(EPA 2010a). The four major fuel consuming end-use sectors contributing to CO2 emissions
from fossil fuel combustion are transportation, industrial, residential, and commercial
(i.e., combustion-related emissions from electricity generation are allocated based on aggregate
national electricity consumption by each end-use sector).
Table 5.16-2 shows aggregated U.S. and Alaska emissions of CO2-e for all fossil fuel
combustion from these four end-use sectors. Alaska emission estimates were calculated using
fuel consumption data from the U.S. Energy Information Administration (EIA), the statistical and
analytical agency within the U.S. Department of Energy. Emissions were based on energy
consumption using data from existing surveys of energy suppliers that report consumption,
sales, or distribution of energy, and conversion factors for each fossil fuel type. U.S. emissions
were calculated by the EPA based on energy consumption reports from the EIA.
As demonstrated, Alaska accounts for less than 1 percent of fossil fuel CO2-e emissions in the
U.S. annually.
TABLE 5.16-2 Estimated GHG Emissions from Fuel Combustion
Summary Year CO2 Equivalents – Alaska (million tons) CO2 Equivalents – U.S. (million tons)
1990 38 5,296
1995 45 5,631
2000 48 6,251
2005 52 6,409
2006 50 6,294
2007 48 6,405
Sources: EPA 2010a; EPA 2010b.
5.16.1.3 Air Quality Standards
Ambient air quality is regulated by federal, state, and local agencies. The EPA has established
National Ambient Air Quality Standards (NAAQS) for six criteria pollutants: particulate matter
(PM-10 particulates and PM-2.5 particulates), sulfur dioxide (SO2), carbon monoxide (CO),
nitrogen dioxide (NO2), ozone (O3), and lead (Pb). The NAAQS were developed to protect
human health (primary standards) and human welfare (secondary standards). State air quality

Alaska Stand Alone Gas Pipeline 5.16-6 Final EIS
standards cannot be less stringent than the NAAQS. Alaska has adopted and/or proposed
ambient air quality standards, Alaska Ambient Air Quality Standards (AAAQS), that are the
same as the NAAQS for all criteria pollutants. Alaska also has standards for two additional
pollutants: ammonia and reduced sulfur compounds. Table 5.16-3 lists the NAAQS and AAAQS
for the six criteria pollutants.
TABLE 5.16-3 National and Alaska Ambient Air Quality Standards
Pollutant Time Frame Primary Secondary
PM-10 Annuala Revoked Revoked
24-hourb 150 μg/m3 150 μg/m3
PM-2.5 Annualc 15 μg/m3 15 μg/m3
24-hourd 35 μg/m3 35 μg/m3
SO2
Annual 0.030 ppm (80 μg/m3) NA
24-hourb 0.14 ppm (365 μg/m3) NA
3-hourb NA 0.5 ppm (1,300 μg/m3)
1-hour e 75 ppb (196 μg/m3) NA
CO 8-hourb 9 ppm (10,000 μg/m3) NA
1-hourb 35 ppm (40,000 μg/m3) NA
NO2
Annual 0.053 ppm (100 μg/m3) 0.053 ppm (100 μg/m3)
1-hourf 0.100 ppm NA
O3
8-hourg 0.075 ppm (147 μg/m3) 0.075 ppm (147 μg/m3)
1-hourh Revoked Revoked
Pb 3-month rollingi 0.15 μg/m3 0.15 μg/m3
Quarterly 1.5 μg/m3 1.5 μg/m3
Notes a Due to a lack of evidence linking health problems to long-term exposure to coarse particle pollution, the United States Environmental Protection Agency
revoked the annual PM-10 standard of 50 μg/m3 in 2006 (effective December 17, 2006). b Not to be exceeded more than once per year. c To attain this standard, the 3-year average of the weighted annual mean particulate matter less than 2.5 microns in diameter concentrations from single- or
multiple community-oriented monitors must not exceed 15.0 µg/m3. d To attain this standard, the 3-year average of the 98th percentile of 24-hour concentrations at each population-oriented monitor within an area must not exceed
35 µg/m3 (effective December 17, 2006). e To attain this standard, the 3-year average of the 99th percentile of the daily maximum 1-hour average at each monitor within an area must not exceed 75 ppb
(effective June 2, 2010). f To attain this standard, the 3-year average of the 98th percentile of the daily maximum 1-hour average at each monitor within an area must not exceed 0.100
ppm (effective January 22, 2010). g To attain this standard, the 3-year average of the fourth-highest daily maximum 8-hour average ozone concentrations, measured at each monitor within an area
over each year, must not exceed 0.075 ppm (effective May 27, 2008). h The standard is attained when the expected number of days per calendar year with maximum hourly average concentrations above 0.12 ppm is < 1. As of
June 15, 2005, EPA revoked the 1-hour ozone standard of 0.12 ppm in all areas, except the fourteen 8-hour ozone nonattainment Early Action Compact Areas.
i Final rule signed October 15, 2008. mg = Milligram(s) μg = Microgram(s) m3 = Cubic meter(s) NA = Not applicable ppm = Part(s) per million ppb = Part(s) per billion Sources: EPA 2010c; ADEC 2011.
Alaska Stand Alone Gas Pipeline 5.16-7 Final EIS
5.16.1.4 Air Quality Attainment Status
Areas that violate federal and/or state air quality standards are designated as nonattainment
areas for the relevant pollutants. This contrasts with areas which do comply with federal and/or
state air quality standards, and hence are designated as attainment areas (i.e., areas that have
attained compliance) for the relevant pollutants. Areas with insufficient data are designated as
attainment/unclassified areas, and are treated as attainment areas under the Clean Air Act
(CAA). Areas that were previously designated nonattainment and have demonstrated
compliance with a NAAQS are designated ―maintenance‖ for 20 years after the effective date of
attainment, assuming they remain in compliance with the standard.
Alaska has established a State Implementation Plan (SIP), which describes how the state will
comply with the CAA and achieve attainment with federal and/or state air quality standards. It
consists of narrative, rules, technical documentation, and agreements the state uses to maintain
acceptable air quality and to improve air quality in areas with unacceptable levels of
atmospheric contaminants.
Federal funding actions or other approvals in nonattainment and maintenance areas are subject
to either Transportation Conformity Rule requirements, which apply to certain types of
transportation projects, or to General Conformity Rule requirements, which can apply to other
types of federal actions. A General Conformity Determination is required for federally
sponsored or funded actions in nonattainment areas, or in certain maintenance areas, when the
total direct and indirect net emissions of nonattainment pollutants (or their precursors) exceed
specified thresholds (Section 176(c) of the CAA Amendments of 1990). This regulation ensures
federal actions conform to the SIP and agency NAAQS attainment plans.
The only nonattainment areas in Alaska are Fairbanks for PM-2.5 and Mendenhall Valley
(Juneau) and Eagle River for PM-10. The air quality attainment status for the proposed Project
area is either attainment or unclassifiable/attainment for each of the criteria pollutants, with the
following exception: the proposed Project’s Fairbanks Lateral route would cross into the
Fairbanks North Star Borough (FNSB) nonattainment boundary and would require a General
Conformity Determination (EPA 2011). See Sections 5.16.1.5 and 5.16.2 for further discussion.
5.16.1.5 Ambient Air Quality
Site specific ambient air quality monitoring data are not available in the proposed Project area.
Consequently, to characterize the background air quality, the following representative data has
been used:
Ambient NO2, SO2, O3, and PM-10 data were collected for the Prudhoe Bay Ambient Air
Monitoring Program located at the Central Compressor Plant (approximately 0.4 mile
from the proposed Project’s gas conditioning facility [GCF] and mainline route) from
January 2007 through December 2007 (ENSR 2008). The O3 data collected was for
compliance with the 1-hour standard, which has since been revoked.
Alaska Stand Alone Gas Pipeline 5.16-8 Final EIS
Ambient PM-10, PM-2.5, and CO data were collected at 3000 East 16th Street in
Anchorage (approximately 6.9 miles from one of the proposed Project’s material sites
and 17.5 miles from the proposed Project’s mainline route) from January 2008 through
December 2008 (EPA 2010d).
Ambient PM-10 and PM-2.5 data were collected on Harrison Court in the Matanuska-
Susitna Borough [Mat-Su or MSB] (approximately 7.7 miles from one of the proposed
Project’s material sites and 35.6 miles from the proposed Project’s mainline route) from
January 2008 through December 2008 (EPA 2010d)
Ambient PM-2.5 data were collected on 675 7th Avenue in the FNSB (approximately
1.2 miles from one of the proposed Project’s construction camp and laydown locations
and 4.6 miles from the proposed Project’s Fairbanks Lateral route) from January 2008
through December 2008 (EPA 2010d).
Ambient O3 data were collected at Denali National Park and Preserve (NPP) in the
Yukon-Koyukuk Census Area (approximately 2.1 miles from the proposed Project’s
mainline route) from January 2008 through December 2008 (EPA 2010d).
A summary of the available regional background air quality concentrations is presented in
Table 5.16-4. The available data confirms pollutant concentrations in the proposed Project area
are in compliance with the respective NAAQS and AAAQS.
5.16.1.6 Regulatory Requirements
The CAA and its implementing regulations (42 USC 7401 et seq., as amended in 1977 and
1990) are the basic federal statutes and regulations governing air pollution in the United States.
The following requirements have been reviewed for applicability to the proposed Project:
Regional Haze;
Title I New Source Review (NSR) / Prevention of Significant Deterioration (PSD)
Permits;
Title I Minor Permits;
Title V Operating Permits;
New Source Performance Standards (NSPS);
National Emission Standards for Hazardous Air Pollutants (NESHAPs) / Maximum
Achievable Control Technology (MACT);
Mobile Source Regulations;
Alternative Low-Sulfur Diesel Fuel Transition Program for Alaska;
Chemical Accident Prevention Provisions;
Compliance Assurance Monitoring (CAM);

Alaska Stand Alone Gas Pipeline 5.16-9 Final EIS
General Conformity Rule; and
Greenhouse Gases (GHGs).
TABLE 5.16-4 Regional Background Air Quality Concentrations for the proposed Project Area
Prudhoe Bay (Central
Compressor Plant) Anchorage
(3000 E 16th)
Matanuska-Susitna Borough
(Harrison Court)
Fairbanks North Star Borough (675 7th Ave)
Yukon-Koyukuk Census Area
(Denali National Park)
PM-10
24-hour 52.8 µg/m3
(35.2% of NAAQS)a 49 µg/m3
(32.7% of NAAQS)b 87 µg/m3
(58.0% of NAAQS)b -- --
PM-2.5
Annual -- 4.86 µg/m3
(32.5% of NAAQS) 6.54 µg/m3
(43.6% of NAAQS) 8.65 µg/m3
(57.7% of NAAQS) --
24-hour -- 17.3 µg/m3
(49.4% of NAAQS)c 33.0 µg/m3
(94.3% of NAAQS)c 25.9 µg/m3
(74.0% of NAAQS)c --
SO2
Annual 0.001 ppm
(3.3% of NAAQS) -- -- -- --
24-hour 0.009 ppm
(6.4% of NAAQS)a -- -- -- --
3-hour 0.011 ppm
(2.2% of NAAQS)a -- -- -- --
CO
8-hour -- 3.8 ppm
(42.2% of NAAQS)b -- -- --
1-hour -- 6.0 ppm
(17.1% of NAAQS)b -- -- --
NO2
Annual 0.010 ppm
(18.9% of NAAQS) -- -- -- --
O3
8-hour -- -- -- -- 0.068 ppm
(90.7% of NAAQS)d
a Available data represents the first-highest daily maximum concentration. b Data represents the second-highest concentration. c Data represents the 98th percentile of 24-hour concentration. d Data represents the fourth-highest 8-hour concentration. µg = Microgram(s) m3 = Cubic meter(s) ppm = Part(s) per million NAAQS = National Ambient Air Quality Standard Sources: ENSR 2008; EPA 2010d.
The proposed Project would include construction and operation of a gas conditioning facility,
one or two natural gas-fired compressor stations, a straddle and off-take facility, and a natural
gas liquid (NGL) extraction plant facility. In addition, during construction, mobile and stationary
construction camps would be used.
Regional Haze
Alaska Stand Alone Gas Pipeline 5.16-10 Final EIS
The federal CAA contains requirements to protect and improve visibility in national parks and
wilderness area in the country. In 1977 Congress designated certain national parks and
wilderness areas as Class I areas, where visibility was identified as an important value.
Currently there are 156 Class I areas in the country. Alaska has four Class I areas, including
Denali National Park, Tuxedni Wilderness Area, Simeonof Wilderness Area, and Bering Sea
Wilderness Area.
The Regional Haze Rule establishes specific SIP requirements and strategies to adopt when
implementing a plan. States must develop long-term plans for reducing pollutant emissions that
contribute to visibility degradation and within the plans establish goals aimed at improving
visibility in Class I areas. The SIP must address haze caused by all sources of pollutants that
impair visibility including haze resulting from smoke, vehicles, electric utility and industrial fuel
burning, and other activities that generate pollution. Among the required elements of the SIPs,
states must include determinations of Best Available Retrofit Technology (BART) to improve
visibility in specially protected areas. The BART requirements apply to facilities built between
1962 and 1977 that have the potential to emit more than 250 tons per year of a visibility-
impairing pollutant.
The proposed Project would not be subject to the Regional Haze Rule or BART since the
source was not built between 1962 and 1977. However, the EPA and Federal Land Managers
responsible for managing Class I areas generally require visibility impact analysis during the
NSR/PSD permitting process for new, large emissions sources potentially impacting these
areas (see below as well as discussion of Class I areas under PSD).
Title I New Source Review (NSR) / Prevention of Significant Deterioration (PSD) Permits
The NSR permitting program was established as part of the 1977 Clean Air Act Amendments
(CAAA). NSR is a preconstruction permitting program that ensures air quality is not significantly
degraded from the addition of new or modified major emissions sources. In poor air quality
areas, NSR ensures new emissions do not inhibit progress toward cleaner air. In addition, the
NSR program ensures any large, new, or modified industrial source would be as clean as
possible, and use the best available pollution control. The NSR permit establishes what
construction is allowed, how the emission source is operated, and which emission limits must be
met. The three types of NSR permitting include:
PSD permits, which are required for major sources that are either new or are being
significantly modified in an attainment area:
- For a new major source, the PSD threshold level is 100 tons per year (TPY) for
sources classified in one of the 28 named source categories listed in Section 169 of
the CAA, and 250 TPY for any other type of source, and/or
- For a source that is major for at least one regulated pollutant (i.e., is subject to PSD
review), all pollutants that are emitted in amounts equal to or greater than the
significant emission rates are also subject to PSD review (i.e., 40 TPY nitrogen

Alaska Stand Alone Gas Pipeline 5.16-11 Final EIS
oxides [NOx], 100 TPY CO, 40 TPY SO2, 15 TPY PM-10, 10 TPY PM-2.5, 40 TPY
volatile organic compounds [VOCs]).
Nonattainment NSR permits, which are required for major sources that are either new or
being significantly modified in a nonattainment area:
- For a new major source, the nonattainment NSR threshold level is 100 TPY; and/or
- For a source that is major for at least one regulated pollutant (i.e., is subject to
nonattainment NSR review), all pollutants that are emitted in amounts equal to or
greater than the significant emission rates are also subject to nonattainment NSR
review (i.e., the significant emission rates vary depending on the severity of the
nonattainment area and specific pollutant).
Minor permits for pollutants from stationary sources that do not require PSD or
nonattainment NSR permits. States are able to customize the requirements of the minor
NSR program under a fully-approved SIP.
Under PSD permitting rules, attainment areas are categorized as Class I, Class II, or Class III.
Each classification has a defined level of pollutant concentrations (SO2, NO2, and PM) that can
be added after a baseline date. Class I areas were established primarily as certain national
parks and wilderness areas (those above a certain size), and receive special protections under
the CAA to help maintain pristine air quality. If a new source or major modification to an existing
source is subject to the PSD program requirements and is within 62 miles (100 kilometers) of a
Class I area, the facility is required to notify the appropriate federal officials and assess the
impacts of the proposed Project on the Class I area. If a major source proposing to locate at a
distance greater than 62 miles (100 kilometers) is of such size that the reviewing agency is
concerned about potential emission impacts on a Class I area, the reviewing agency can ask
the applicant to perform an analysis of the source's potential emissions impacts on the Class I
area.
Class II areas allow higher levels of added pollution. Class III designations, allowing even
higher level of added pollutants and intended for heavily industrialized zones, can be made only
on request and must meet all requirements outlined in 40 CFR Part 51.166. There are currently
no Class III areas in the U.S. Regardless of Class I/II/III status, all areas must attain the
NAAQS, or the delegated agency must plan to attain the NAAQS.
The proposed Project is as described in the last paragraph of the Regulatory Requirements
section above. If emissions from any of these stationary sources result in emissions greater
than the PSD major source threshold, which would be 250 TPY as long as the source is not in a
listed category, then PSD permitting would be required. In that instance, a federal Class I area
impact assessment may also be required based on the distance of the PSD major source to the
nearest Class I area (Denali NPP). See Section 5.16.2 for further analysis and applicability.

Alaska Stand Alone Gas Pipeline 5.16-12 Final EIS
Title I Minor Permits
The State of Alaska requires minor permits under the Alaska Administrative Code, Title 18,
Chapter 50, Article 5. The regulations provide procedures to ensure construction or
modification of a stationary source will not cause a violation of a NAAQS or any applicable
portions of the control strategy. Alaska's minor NSR program was originally approved into the
SIP by the EPA on July 5, 1983, and has been revised several times. Under the current minor
permit program, the Alaska Department of Environmental Conservation (ADEC) specifies
source categories and size thresholds that need a permit, assuming a major/PSD permit is not
needed. A minor permit is required to construct a new stationary source with a potential to emit
greater than the following size thresholds: 15 TPY of PM-10; 40 TPY of NOx; 40 TPY of SO2;
0.6 TPY of lead; or 100 TPY of CO within 10 kilometers of a nonattainment area. The ADEC
has also established thresholds for determining when a source needs a minor permit before a
modification: 10 TPY of PM-10; 10 TPY of NOx 10 TPY of SO2; or 100 TPY of CO within
10 kilometers of a nonattainment area.
The proposed Project would include construction and operation of a gas conditioning facility,
one or two natural gas-fired compressor stations, a straddle and off-take facility, and a NGL
extraction plant facility. In addition, during construction, stationary construction camps would be
used. If emissions from any of these stationary sources result in emissions greater than the
minor permit thresholds, then minor permitting would be required. See Section 5.16.2 for further
analysis and applicability.
Title V Operating Permits
Title V of the federal CAA requires individual states to establish an air operating permit program.
The requirements of Title V are outlined in 40 CFR Parts 70 and 71, and the permits required by
these regulations are often referred to as Part 70 or 71 permits. The permit includes all air
pollution requirements that apply to the source, including emissions limits and monitoring,
record keeping, and reporting requirements. It also requires that the source annually report its
compliance status with respect to permit conditions to the permitting authority. Operating
permits (also known as Title V permits) are required for all major stationary sources. What
constitutes a major source varies according to what pollutants are being emitted and the
attainment designation of the area where the source is located. In general, a source is
considered major for Title V if it emits or has the potential to emit 100 TPY or more of any
criteria air pollutant, 10 TPY or more of any hazardous air pollutant (HAP), or 25 TPY or more
total HAPs.
The proposed Project is as described in the last paragraph of the Regulatory Requirements
section above. If emissions from any of these stationary sources result in emissions greater
than the Title V operating permit thresholds, then Title V permitting would be required.
Subsequently, a complete Title V permit application would be required no later than 12 months
after the date on which the stationary source became subject to AS 46.14.120(b) (i.e., within
12 months after construction of a major source). See Section 5.16.2 for further analysis and
applicability.
Alaska Stand Alone Gas Pipeline 5.16-13 Final EIS
New Source Performance Standards (NSPS)
The NSPS, codified at 40 CFR Part 60, established requirements for new, modified, or
reconstructed units in specific source categories. NSPS requirements include emission limits,
monitoring, reporting, and record keeping.
The proposed Project is as described in the last paragraph of the Regulatory Requirements
section above. Typical NSPS applicability for similar source categories includes, but is not
limited to the following:
40 CFR 60 Subpart Dc – Standards of performance for small industrial-commercial-
institutional steam generating units for which construction, modification, or reconstruction
is commenced after June 9, 1989 and that has a maximum design heat input capacity of
29 megawatts (MW) (100 million British thermal units per hour [MMBtu/hr]) or less, but
greater than or equal to 2.9 MW (10 MMBtu/hr).
40 CFR 60 Subpart Db – Standards of performance for industrial-commercial-
institutional steam generating units for which construction, modification, or reconstruction
is commenced after June 19, 1984 and that has a maximum design heat input capacity
of greater than 29 MW (100 million MMBtu/hr).
40 CFR 60 Subpart KKK – Standards of performance for equipment leaks of VOC from
onshore natural gas processing plants for which construction is commenced after
January 20, 1984.
40 CFR 60 Subpart CCCC – Standards of performance for commercial and industrial
solid waste incineration units for which construction is commenced after
November 30, 1999 or for which modification or reconstruction is commenced on or after
June 1, 2001.
40 CFR 60 Subpart IIII – Standards of performance for stationary compression ignition
internal combustion engines.
40 CFR 60 Subpart JJJJ – Standards of performance for stationary spark ignition
internal combustion engines.
40 CFR 60 Subpart KKKK – Standards of performance for stationary gas turbines with a
heat input at peak load equal to or greater than 10.7 gigajoules (10 MMBtu) per hour,
based on the higher heating value of the fuel fired, which commenced construction,
modification, or reconstruction after February 18, 2005.
The Alaska Gasline Development Corporation (AGDC) would need to conduct an emission unit-
specific applicability determination after all equipment is selected to ensure compliance with the
limits, monitoring, record keeping, and reporting of the NSPS in 40 CFR Part 60.
National Emission Standards for Hazardous Air Pollutants (NESHAPs) / Maximum
Achievable Control Technology (MACT)

Alaska Stand Alone Gas Pipeline 5.16-14 Final EIS
NESHAPs, codified in 40 CFR Parts 61 and 63, regulate HAP emissions. Part 61 was
promulgated prior to the 1990 CAAA and regulates only eight types of hazardous substances
(asbestos, benzene, beryllium, coke oven emissions, inorganic arsenic, mercury, radionuclides,
and vinyl chloride). The proposed Project does not appear to include facilities that fall under
any one of the source categories regulated by Part 61; therefore, the requirements of Part 61
would not be applicable.
The 1990 CAAA established a list of 189 additional HAPs, resulting in the promulgation of
Part 63. Also known as the MACT standards, Part 63 regulates HAP emissions from major
sources of HAPs and specific source categories that emit HAPs, as well as certain minor or
―area‖ sources of HAPs. Part 63 considers any source with the potential to emit 10 TPY of any
single HAP or 25 TPY of HAPs in aggregate as a major source of HAPs. The proposed Project
would include construction and operation of a gas conditioning facility, one or two natural gas-
fired compressor stations, a straddle and off-take facility, and a NGL extraction plant facility. In
addition, during construction, stationary construction camps would be used. Typical NESHAP
applicability for similar source categories includes, but is not limited to the following:
40 CFR 63 Subpart HHH – National emission standards for hazardous air pollutants
from natural gas transmission and storage facilities.
40 CFR 63 Subpart ZZZZ – National emission standards for hazardous air pollutants for
stationary reciprocating internal combustion engines.
40 CFR 63 Subpart DDDDD – National emission standards for hazardous air pollutants
for major sources: industrial, commercial, and institutional boilers and process heaters.
The AGDC would need to conduct an applicability determination for each emission unit after all
equipment is selected to ensure compliance with the limits, monitoring, record keeping, and
reporting of the NESHAPs in 40 CFR Parts 61 and 63.
Mobile Source Regulations
Gasoline and diesel engines must comply with the EPA mobile source regulations in
40 CFR Part 86 for on-road engines and 40 CFR Part 89 and 90 for non-road engines; these
regulations are designed to minimize emissions.
The proposed Project would use both on-road and non-road engines that would have to comply
with the mobile source regulations. These requirements are imposed on the manufacturers of
the engines.
Alternative Low-Sulfur Diesel Fuel Transition Program for Alaska
The EPA’s Highway and Non-road Diesel Rules implement more stringent standards for new
diesel engines and fuels set out in 40 CFR Part 80. The rules mandate the use of lower sulfur
fuels in diesel engines beginning in 2006 for highway diesel fuel, and 2007 for non-road diesel
fuel. Because Alaska has unique geographical, meteorological, air quality, and economic

Alaska Stand Alone Gas Pipeline 5.16-15 Final EIS
characteristics, the EPA granted an alternative implementation schedule for the rural areas
(those not served by the Federal Aid Highway System) of Alaska as follows:
Rural areas (those areas not served by the Federal Aid Highway System) of Alaska
began transitioning all highway, non-road, locomotive, and marine diesel fuel to 15 parts
per million (ppm) sulfur content diesel fuel on June 1, 2010.
Retail facilities began exclusively selling 15 ppm sulfur content diesel fuel in the rural
areas on December 1, 2010.
All diesel fuel in Alaska remains exempt from the dyeing requirements in the highway
and non-road final rules; and
Fuel distributors in urban Alaska will be given the same transition schedule as
distributors in the rest of the country for highway diesel fuel.
The proposed Project would be located in parts of urban and rural Alaska and would be required
to comply with the ultra low sulfur diesel requirements.
Chemical Accident Prevention Provisions
The chemical accident prevention provisions, codified in 40 CFR Part 68, are federal regulations
designed to prevent the release of hazardous materials in the event of an accident and to
minimize potential impacts if a release did occur. The regulations contain a list of substances
and threshold quantities for determining applicability to stationary sources. If a stationary
source stores, handles, or processes one or more substances on this list in a quantity equal to
or greater than specified in the regulation, the facility must prepare and submit a Risk
Management Plan. If a facility does not have a listed substance onsite, or if the quantity of a
listed substance is below the applicability threshold, the facility does not need to prepare a Risk
Management Plan.
The Chemical Accident Prevention Provision/Risk Management Plan (40 CFR Part 68) would
apply if listed substances at threshold quantities are included in the proposed Project.
Consequently, upon further design implementation, the AGDC would need to conduct stationary
source applicability determinations with the Chemical Accident Prevention Provision/Risk
Management Plan regulations in 40 CFR Part 68 to ensure compliance.
Compliance Assurance Monitoring (CAM)
The EPA developed 40 CFR Part 64 (CAM) in order to provide reasonable assurance that
facilities comply with emissions limitations by monitoring the operation and maintenance of their
control devices. CAM requirements apply to emission units that are equipped with post-process
pollutant control devices, have pre-control device emissions equal to or greater than 100
percent of the major source threshold for a pollutant as defined in 40 CFR Part 70 and Part 71,
and are subject to the Title V permit program. To comply with these requirements, a CAM Plan
must be developed for each affected pollutant emitted from each affected emission unit. The
Alaska Stand Alone Gas Pipeline 5.16-16 Final EIS
focus of each CAM Plan would be to ensure and document proper operation of the control
device — thereby assuring compliance with the applicable emission limit.
If the proposed Project has an emission unit that meets the three listed criteria, then CAM
requirements would apply. Consequently, upon further design implementation, the AGDC
would need to conduct an applicability determination for each emission unit with the CAM
regulations in 40 CFR Part 64 to ensure compliance.
General Conformity
The General Conformity Rule was designed to require federal agencies to ensure federally-
funded or federally-approved projects conform to the applicable SIP. Section 176(c) of the CAA
prohibits federal actions in nonattainment or PSD maintenance areas that do not conform to the
SIP for the attainment and maintenance of NAAQS. General Conformity regulations apply to
project-wide emissions of pollutants for which the project areas are designated as
nonattainment (or, for ozone, its precursors NOx and VOC) that are not subject to NSR and that
are greater than the significance thresholds established in the General Conformity regulations or
10 percent of the total emissions budget for the entire nonattainment area. Federal agencies
are able to make a positive conformity determination for a proposed project if any of several
criteria in the General Conformity Rule are met. These criteria include:
Emissions from the project that are specifically identified and accounted for in the SIP
attainment or maintenance demonstration; or
Emissions from the action that are fully offset within the same area through a revision to
the SIP, or a similarly enforceable measure that creates emissions reductions so there is
no net increase in emissions of that pollutant.
The Fairbanks Lateral route would cross into the FNSB nonattainment boundary for PM-2.5 and
would require a General Conformity determination. See Section 5.16.3 for further analysis.
Greenhouse Gases (GHGs)
On October 30, 2009, the EPA promulgated 40 CFR 98, the first comprehensive national
system for reporting emissions of CO2 and other GHGs produced by major sources in the
United States. Through this new reporting, the EPA will collect comprehensive and accurate
data about the production of GHGs in order to confront climate change. Approximately
13,000 facilities, accounting for about 85 percent to 90 percent of GHGs emitted in the United
States, are covered under the rule. The reporting requirements apply to suppliers of fossil fuel
and industrial chemicals, manufacturers of certain motor vehicles and engines (not including
light and medium duty on-road vehicles), as well as large direct emitters of GHGs with
emissions equal to or greater than a threshold of 25,000 metric TPY. This threshold is
equivalent to the annual GHG emissions from just over 4,500 passenger vehicles.
The direct emission sources covered under the reporting requirement include energy intensive
sectors such as cement production, iron and steel production, and electricity generation, among

Alaska Stand Alone Gas Pipeline 5.16-17 Final EIS
others. The gases covered by the rule are CO2, CH4, N2O, hydrofluorocarbons (HFC),
perfluorocarbons (PFC), sulfur hexafluoride (SF6), and other fluorinated gases, including
nitrogen trifluoride (NF3) and hydrofluorinated ethers (HFE). Because CO2 is the reference gas
for climate change, measures of non-CO2 GHGs are converted into CO2-e based on their
potential to absorb heat in the atmosphere.
The EPA subsequently promulgated additional GHG reporting rules to cover three sectors that
were excluded from the 2009 rule – petroleum and natural gas systems, injection and geologic
sequestration of CO2, and fluorinated GHGs. The rules became effective in December 2010,
and required facilities to begin monitoring, recording, and reporting the GHG emissions annually
beginning January 1, 2011. The final petroleum and natural gas reporting rule includes the
following industry segments: offshore petroleum and natural gas production, onshore petroleum
and natural gas production, onshore natural gas processing, onshore natural gas transmission
compression, underground natural gas storage, liquefied natural gas (LNG) storage and its
import and export, and natural gas distribution. If the proposed Project has emissions of CO2-e
greater than the applicable threshold or is considered an applicable petroleum and natural gas
facility, it would be subject to the federal GHG reporting rule. See Section 5.16.2 for further
analysis and applicability.
On June 2, 2010, the EPA issued a final rule which establishes an approach to addressing GHG
emissions from stationary sources under the CAA permitting programs. These facilities would
be required to obtain permits that would demonstrate they are using the best practices and
technologies to minimize GHG emissions. The rule sets thresholds for GHG emissions that
define when the CAA permits under the NSR, PSD, and Title V Operating Permits programs are
required for new or existing industrial facilities. The rule ―tailors‖ the requirements to limit which
facilities will be required to obtain NSR, PSD, and Title V permits and covers nearly 70 percent
of the national GHG emissions that come from stationary sources, including those from the
nation’s largest emitters: power plants, refineries, and cement production facilities.
For sources permitted between January 2 and June 30, 2011, the rule requires GHG permitting
for only sources currently subject to the PSD permitting program (i.e., those that are newly-
constructed or modified in a way that significantly increases emissions of a pollutant other than
GHGs) and that emit GHG emissions of at least 75,000 TPY. Additionally, only sources
required to have Title V permits for non-GHG pollutants will be required to address GHGs as
part of their Title V permitting; the 75,000 TPY CO2-e limit does not apply to Title V. For sources
constructed between July 1, 2011 to June 30, 2013, the rule requires PSD permitting for first
time new construction projects that emit GHG emissions of at least 100,000 TPY even if they do
not exceed the permitting thresholds for any other pollutant. In addition, sources that emit or
have the potential to emit at least 100,000 TPY CO2-e and that undertake a modification that
increases net emissions of GHGs by at least 75,000 TPY CO2-e will also be subject to PSD
requirements. Under this scenario, operating permit requirements would, for the first time, apply
to sources based on their GHG emissions even if they would not apply based on emissions of
any other pollutant. Facilities that emit at least 100,000 TPY CO2-e would be subject to Title V
permitting requirements. The EPA plans further rulemaking which would possibly reduce the
permitting thresholds for new and modified sources making changes after June 30, 2013. If the
Alaska Stand Alone Gas Pipeline 5.16-18 Final EIS
proposed Project has emissions of CO2-e greater than the applicable thresholds, then it would
be subject to the federal GHG permitting rule. See Sections 5.16.2 for further analysis and
applicability.
5.16.2 Environmental Consequences
The air quality environmental consequences for the proposed Project and alternatives are
described below.
5.16.2.1 No Action Alternative
Under the No Action Alternative, the proposed Project would not be constructed or operational.
Consequently, no effects to air quality would occur as far as resulting from emissions associated
with the proposed Project. However, it is known that natural gas combustion has fewer air
quality impacts than from combustion of the more commonly (and currently) used fuel oil.
Therefore, on a long-term basis and with the growing population both in urban and rural areas,
the No Action Alternative would most likely result in increased air pollution due to the general
population’s continuous use of other higher pollutant-emitting fuels if natural gas was not
available as an energy alternative.
5.16.2.2 Proposed Action
Air effects for the proposed Project fall into two categories: temporary impacts resulting from
construction, and long-term or permanent impacts resulting from operation of the facilities. The
proposed action alternative includes the following variations: three Yukon River crossing options
and the Denali National Park Route Variation. Emission calculations for both construction and
operation of the proposed Project are included as Appendix O.
Pipeline Facilities
Mainline
Construction
Air quality effects associated with construction of the proposed Project mainline would include
emissions from fossil-fuel fired construction equipment, fugitive dust, and open burning.
Fossil-Fueled Construction Equipment
Large earth-moving equipment, skip loaders, trucks, non-road engines, and other mobile
sources may be powered by diesel or gasoline and are sources of combustion emissions,
including NOx, CO, VOCs, SO2, PM-10, PM-2.5, and small amounts of HAPs. Diesel engines
must comply with the EPA mobile source regulations in 40 CFR Part 86 for on-road engines and
40 CFR Part 89 and 90 for non-road engines; these regulations are designed to minimize
emissions. Furthermore, to implement the CAA, the EPA has established rules in
40 CFR Part 80 requiring that sulfur content in on-road and off-road diesel fuel be significantly
reduced. By December 1, 2010, the EPA required all on and off-road (non-road) diesel fuel

Alaska Stand Alone Gas Pipeline 5.16-19 Final EIS
meet a limit of 15 ppm sulfur (i.e., ultra low sulfur fuel). The AGDC would operate all fossil-
fueled construction equipment in accordance with manufacturer’s recommendations to minimize
construction-related emissions resulting from incomplete combustion.
The AGDC proposes to use the construction equipment listed in Table 5.16-5 in a typical
construction spread. The mainline would be constructed in four construction spreads or
completed lengths. Simultaneous activity would occur on all four spreads.
TABLE 5.16-5 Construction Equipment per Spread
Construction Equipment No. of Units Construction Equipment No. of Units
4 Wheel Vehicle 1 Ice Trimmer 1
Air Compressor, 1600 CFM 4 Pump Shelter 12
Air Compressor, 185 CFM 2 Painting Shelter 8
Air Compressor, 375 CFM 8 Pick-Up/Crewcab, 4x4 90
Backhoe/Loader 1 Sideboom, 572 8
Soft Sided Bldg, 55' x 60' 1 Sideboom, 583 20
Portable Building, 40' x 80' 1 Sideboom, 594 2
Bending Machine, 24" Pipe 2 Sideboom, 572 w/ Auto Welding Equip 8
Bending Shoe, 24" Pipe 2 Snow Blower - Self Propelled 2
Base Radio Unit 1 Snow Blower Attachment 2
Bridge Sections, 12' x 40' 15 Sandblast Pot w/ Hose 8
Boring Machine, 24" w/ 100' Auger 1 Gravel Screening Plant 1
Bus, 26 Passenger 22 Snow Machine 3
Bus, 45 Passenger 8 Farm Tractor w/ Spreader 2
Carryall, 4x4 8 Survey Equipment 4
Internal Line-Up Clamps (24") Auto Weld 2 Tack Rig w/ Air & Power 2
Towed Drum Compactor 2 Propane Gas Tank 1
Gravel Conveyor, 24" x 40' 2 5th Wheel Tractor - Lowboy 10
Crushing Plant, 300 Hp 1 5th Wheel Tractor - String 4
Hydraulic Crane, 50 Ton 2 LGP Tractor Unit 1
Dozer Tractor, D4 2 Boom Truck, 8 Ton 1
Dozer Tractor, D6 LGP 6 End Dump, 25 Ton 4
Dozer Tractor, D7 w/ Winch 11 End Dump, 35 Ton 15
Dozer Tractor, D8 8 End Dump, 50 Ton 3
Dozer Tractor, D8 w/ Ripper 7 Foam Truck 1
Dozer Tractor, D8 w/ Winch 7 Fuel Truck, 4,000 Gal 2
Dozer Tractor, D9 w/ Ripper 5 Lube Truck 3

Alaska Stand Alone Gas Pipeline 5.16-20 Final EIS
TABLE 5.16-5 Construction Equipment per Spread
Construction Equipment No. of Units Construction Equipment No. of Units
Dragline w/ Clam Bucket, 4 CY 1 Mechanic Truck 13
Drill - John Henry EX320 9 Powder Truck 4
Envirovac Unit, 8' x 30' 3 Pre-Heat Truck 2
Excavator, 320 (1.5 CY) 6 Skid Truck 3
Excavator, 325 (1.5 CY) 10 Tire Truck 2
Excavator, 330 (2.0 CY) 14 Water Truck, 4,000 Gal 1
Flatbed, 2 Ton 13 Water Truck, 6,000 Gal 8
Flatbed, 4 Ton 10 Welding Truck w/ 1 Mach 14
FBE Coating Equip - 24" 6 Heavy Duty Wrecker 1
Generator, 15 kW 4 Chain Trencher - (D8-1000 HP) 3
Generator, 40 kW 4 Farm Tractor w/ Harrow 2
Motor Grader, 16G 7 Ditch Witch 3500 1
Indirect Heater, 1000K Btu 3 Tanker - Fuel 10,000 Gal -
Indirect Heater, 500K Btu 12 Hydrotest Instrument Trailer 2
Excavator, 325 w/ Hammer 3 Lowboy Trailer, 60 Ton 3
Wheel Loader, 966 14 Lowboy Trailer, 100 Ton 1
Wheel Loader, 980 1 High Deck Trailer, 40' 4
Wheel Loader, 988 2 Tracked Trailer - LGP 1
Light Plant, 4 Lights 50 Office Trailer, 10' x 50' -
Powder Magazine 4 Pipe Trailer, 40' to 60' 4
Blasting Mats 30 Hydrotest Pump Trailer 2
Nodwell Tracked Vehicle 3 Tanker - Water 12,000 Gal 6
Ozzie Pad Master 3 Warehouse Facility 2
Dewatering Pump, 4" 4 Winch, 60 Ton 1
Dewatering Pump, 6" 18 Composite Mats, 7' x 13' 750
Hydrotest Fill Pump, 6" 4 Wood Mats, 4' x 20' 30
Fuel Dispensing Pump 1 Welding Shelter 13
Van Trailer - Auto Welding Support 2
Btu = British thermal unit(s) CFM = Cubic feet per minute CY = Cubic yard(s) Gal = Gallon Hp = Horsepower K = Thousand kW = Kilowatt(s) Source: AGDC 2011a.
Alaska Stand Alone Gas Pipeline 5.16-21 Final EIS
Fugitive Dust
Fugitive dust is a source of respirable airborne particulate matter, including PM-10 and PM-2.5.
Fugitive dust results from land clearing, grading, excavation, concrete work, blasting and
dynamiting, and vehicle traffic on paved and unpaved roads. The amount of dust generated is a
function of construction activities, silt, moisture content of the soil, wind speed, frequency of
precipitation, vehicle traffic, vehicle types, and roadway characteristics. Emissions would be
greater during drier summer and autumn months, and in fine-textured soils. Emissions of
particulate matter arising from fugitive dust are regulated by the ADEC. Specifically,
18 AAC 50.110 states, ―No person may permit any emission which is injurious to human health
or welfare, animal or plant life, or property, or which would unreasonably interfere with the
enjoyment of life or property.‖ The AGDC would implement best management practices during
construction activities to mitigate fugitive dust and reduce particulate matter emissions.
Open Burning
Burning cleared materials may be required in the proposed Project area and is fairly typical
during pipeline construction. Open burning of cleared materials from construction activities has
the potential to affect air quality. Open burning is regulated by the ADEC. Specifically,
18 AAC 50.065 requires the following: (1) the material is kept as dry as possible through the
use of a cover or dry storage; (2) before igniting the burn, non-combustibles are separated to
the greatest extent practicable; (3) natural or artificially induced draft is present; (4) to the
greatest extent practicable, combustibles are separated from grass or peat layer; and (5)
combustibles are not allowed to smolder. The regulation also identifies other open burn
requirements, including when an open burn approval may be needed.
Prior to construction, it is difficult to determine how much open burning would occur and in what
quantities and locations, as excess materials may be burned, chipped, or hauled for disposal in
a suitable landfill. Nonetheless, AGDC estimated the worst-case emission levels for open
burning based on the expected number of acres that would likely be burned for each mile of
pipeline construction. It is expected that most open burning would occur in the first construction
year during right-of-way clearing activities. Consequently, total construction open burning
emissions in tons per year represent maximum values.
Emissions from construction equipment combustion, fugitive dust, and open burning would be
controlled to the extent required by the ADEC. Emissions for the proposed Project from
construction of each mainline spread are provided in Table 5.16-6. These emissions were
calculated to represent a worst-case (most conservative) scenario of operating all construction
equipment 24 hours per day for 6 winter months and 12 hours per day for 4 summer months.
Construction would occur simultaneously on all four spreads lasting a total of 2 years but would
only last about 90 to 120 days (3 to 4 months) at any single point along the mainline. The
AGDC would need to modify the emissions calculations upon refinement of the equipment
selection and construction schedule. For permitting applicability, emissions from mobile
sources (on-road and non-road), fugitive dust, and open burning are not included. Non-road
engines are portable and transportable engines that remain at any single location for 12 months
or less and otherwise meet the non-road engine criteria in 40 CFR 89.2. Consequently,

Alaska Stand Alone Gas Pipeline 5.16-22 Final EIS
stationary source emissions from construction activities would not trigger the requirements for a
PSD, minor, or Title V permit as long as all mobile construction sources qualify as on-road or
non-road. Because pipeline construction moves through an area relatively quickly, air
emissions typically would be localized, intermittent, and short term. As a result, if the AGDC
complies with applicable regulations, the proposed Project emissions from mainline
construction-related activities would not significantly affect local or regional air quality.
TABLE 5.16-6 Mainline Construction Emissionsa
Emission Source NOx
(TPY) CO
(TPY) VOC (TPY)
SO2 (TPY)
PM (TPY)
PM-10 (TPY)
PM-2.5 (TPY)
HAPs (TPY)
CO2-eg
(TPY)
Mobile Sourcesb, c 5,429 2,001 575 12 399 399 399 TBD 263,596
Non-Mobile Sourcesd 6 1 1 0.01 0.42 0.42 0.41 0.005 1,179
Fugitive Duste -- -- -- -- 43,737 43,737 4,374 -- --
Open Burningf 62.75 2,235.5 119 21- 367.75 367.75 271.5 140 32,780h
Total construction emissions per spreadi
5,597.75 4,237.5 695 433.01 44,504.17 44,504.15 5,044.91 140.005 297,555
Total construction emissions for all four spreadsi
22,391 16,950 2,780 132.04 178,016.68 178,016.68 20,179.64 560.02 1,190,220
a All emissions calculations used conservative assumptions of 5,760 hours per year of operation (i.e., 24 hours per day for 6 winter months and 12 hours per day for 4 summer months); 139,000 Btu per gallon heat rate; 7.1 lb per gallon fuel density; and 7,000 Btu per Hp-hr maximum diesel fuel rating for generator engines, compressors, heaters, and other support utilities. For mobile and non-mobile sources, all particulate matter emissions are considered to be 2.5 micrometers or less in size due to a lack of specific emission factors for differing sized particulates.
b Emission factors for mobile vehicles are based on the California Air Resources Board’s (CARB’s) emission factor model (EMFAC 2007 version 2.30 [2006]) for on-road passenger vehicles and delivery trucks for year 2012 scenario and conservative assumption of 30 miles per hour per vehicle speed rate.
c Emission factors for mobile heavy equipment are based on Santa Barbara County Air Pollution Control District (SBCAPCD) Table 1 - Construction Emission Factors (1997) for NOx, CO, VOC, PM, PM-10, and PM-2.5. Emissions of SO2 were calculated using mass balance computations at 15 ppm sulfur content (ultra low sulfur fuel) for diesel fuel. Emission factors used in air quality analyses are determined by the guidance provided by regulating air districts. In this case, the ADEC does not provide guidance. In the absence of this guidance, as is typical throughout the U.S., both California state and local emission factors are used based on their conservatism.
d Emission factors for non-mobile sources are based on EPA AP-42 Tables 3.3-1, 1.3-1, 1.3-3 and 1.3-6 for NOx, CO, VOC, PM, PM-10, and PM-2.5 and Table 3.3-2 for HAPs. Emissions of SO2 were calculated using mass balance computations at 15 ppm sulfur content (ultra low sulfur fuel) for diesel fuel.
e Calculations for fugitive dust (PM, PM-10 and PM-2.5) assumed 10,878.7 acres of land disturbance for mainline pipeline construction and 514.3 acres of land disturbance for mainline access roads used during construction; a controlled emission factor based on 1.2 tons per acre per month (ref. EPA AP-42, Vol. 1, 1993, Section 13.2.3.3) times 0.5 (controlled factor assumes 50 percent credit for watering) times 0.64 (ref. CARB 1988; Profile 391 - Road and Building Construction Dust) and 220 hours per month for 10 months per year. Total PM fugitive dust is assumed equal to PM-10 fugitive dust. PM-2.5 fugitive dust is estimated at 10 percent of PM-10, based on the study conducted by Midwest Research Institute in 2006 (Background Document for Revisions to Fine Fraction Ratios Used for AP-42 Fugitive Dust Emission Factors) for the Western Governors Association to better characterize the PM-2.5/PM-10 ratio in fugitive dust. This report has been accepted by the EPA as an approved adjustment to the emission factors in EPA AP-42, Section 13.2.
f Worst-case emissions from open burning were provided by AGDC 2012 using emission factors from Andreae and Merlet (2001) Open burning activities would occur during the first year only.
g GHG emissions (CO2-e) for all emission sources, except for mobile vehicles (see note b), and open burning (see note h), are based on emission factors in 40 CFR 98 Tables A-1, C-1, and C-2. Applicability to the GHG reporting rule is dependent upon actual emissions from the stationary (non-mobile) source (i.e., CO2-e actual emissions equal to or greater than a threshold of 25,000 metric TPY).
h Values for open burning in CO2 rather than CO2-e. i Total in tons per year represents maximum values since open burning would occur only during the first year.
Yukon River Crossing Options
There are three options being considered for the proposed gas pipeline Project to cross the
Yukon River (see construction details of these options in Section 2):
The Preferred Option would be to cross the Yukon River via a new standalone pipeline
suspension bridge.
Option 2 would be to hang the pipeline below the surface of the existing E.L. Patton
Bridge on the Dalton Highway.

Alaska Stand Alone Gas Pipeline 5.16-23 Final EIS
Option 3 would be to utilize horizontal directional drilling (HDD) to cross under the Yukon
River. The feasibility of HDD is unknown at this time due to limited soils information. If
feasible, HDD would be at the same location as the proposed suspension bridge.
There would be fewer air emissions from construction equipment if the existing bridge was
utilized and construction of a new pipeline suspension bridge or using HDD were not required.
However, the difference would be negligible.
Operations and Maintenance
With respect to natural gas pipeline operations, a pipeline itself generally does not have any
significant air emissions associated with its operation. While there may be fugitive emissions
from pipeline connections (i.e., valves), such emissions are generally very minor in nature and
typically are not subject to the requirement to obtain a permit.
Fairbanks Lateral
Construction
Air quality impacts associated with construction of the proposed Project’s Fairbanks Lateral
would be similar to the air quality impacts associated with construction of the mainline, including
emissions from fossil-fuel fired construction equipment, fugitive dust, and open burning (see
Table 5.16-7). It should be noted that AGDC will not conduct open burning within the FNSB
Nonattainment Area or in the vicinity of Denali NPP. Emissions were calculated to represent a
worst-case (most conservative) scenario of operating all construction equipment 12 hours per
day for 4 summer months. Construction on one spread would be completed in one summer
season, lasting a total of 4 months. The AGDC would need to refine the emissions calculations
upon refinement of the equipment selection and construction schedule. For permitting
applicability, stationary source emissions from construction activities would not trigger the
requirements for a PSD, minor, or Title V permit as long as all mobile construction sources
qualify as on-road or non-road. Because pipeline construction moves through an area relatively
quickly, air emissions typically would be localized, intermittent, and short term. Emissions from
construction equipment combustion, fugitive dust, and open burning would be controlled to the
extent required by the ADEC. As a result, if the AGDC complies with applicable regulations, the
proposed Project emissions from the Fairbanks Lateral construction-related activities would not
significantly affect local or regional air quality.
Operations and Maintenance
As explained previously, with respect to natural gas pipeline operations, a pipeline itself
generally does not have any significant air emissions associated with its operation; while there
may be fugitive emissions from pipeline connections (e.g., valves) such emissions are generally
very minor in nature and typically are not subject to the requirement to obtain a permit.
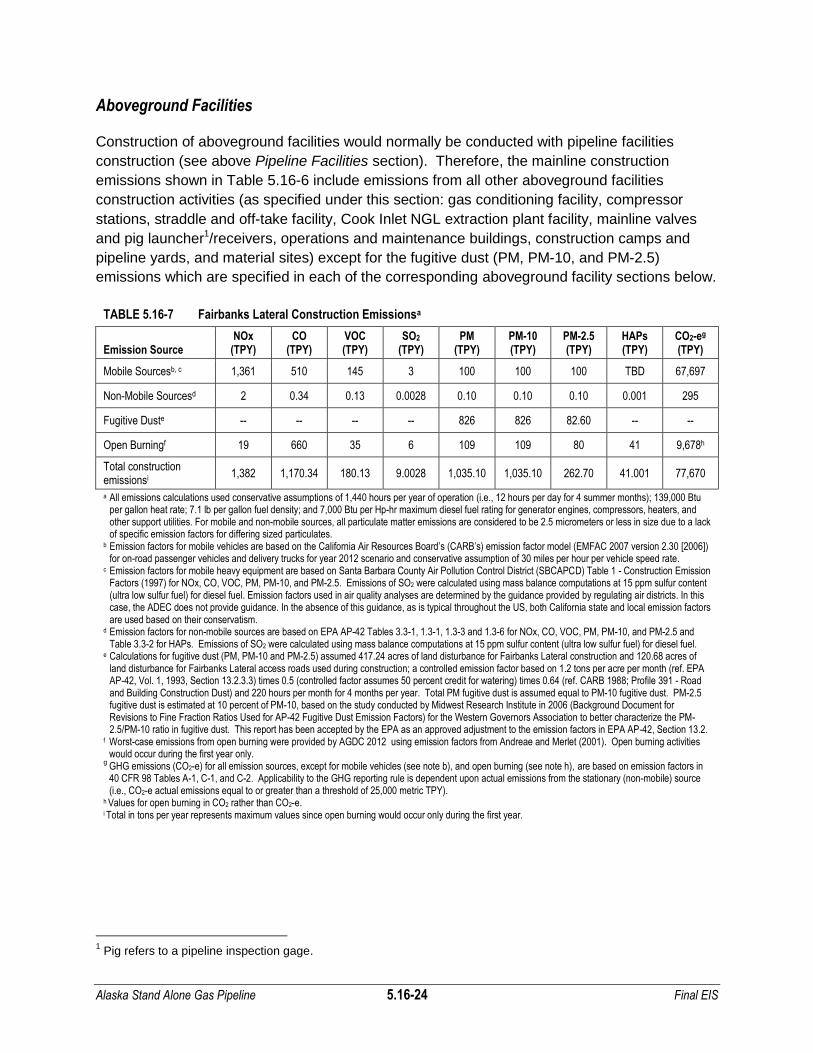
Alaska Stand Alone Gas Pipeline 5.16-24 Final EIS
Aboveground Facilities
Construction of aboveground facilities would normally be conducted with pipeline facilities
construction (see above Pipeline Facilities section). Therefore, the mainline construction
emissions shown in Table 5.16-6 include emissions from all other aboveground facilities
construction activities (as specified under this section: gas conditioning facility, compressor
stations, straddle and off-take facility, Cook Inlet NGL extraction plant facility, mainline valves
and pig launcher1/receivers, operations and maintenance buildings, construction camps and
pipeline yards, and material sites) except for the fugitive dust (PM, PM-10, and PM-2.5)
emissions which are specified in each of the corresponding aboveground facility sections below.
TABLE 5.16-7 Fairbanks Lateral Construction Emissionsa
Emission Source NOx
(TPY) CO
(TPY) VOC (TPY)
SO2 (TPY)
PM (TPY)
PM-10 (TPY)
PM-2.5 (TPY)
HAPs (TPY)
CO2-eg
(TPY)
Mobile Sourcesb, c 1,361 510 145 3 100 100 100 TBD 67,697
Non-Mobile Sourcesd 2 0.34 0.13 0.0028 0.10 0.10 0.10 0.001 295
Fugitive Duste -- -- -- -- 826 826 82.60 -- --
Open Burningf 19 660 35 6 109 109 80 41 9,678h
Total construction emissionsi
1,382 1,170.34 180.13 9.0028 1,035.10 1,035.10 262.70 41.001 77,670
a All emissions calculations used conservative assumptions of 1,440 hours per year of operation (i.e., 12 hours per day for 4 summer months); 139,000 Btu per gallon heat rate; 7.1 lb per gallon fuel density; and 7,000 Btu per Hp-hr maximum diesel fuel rating for generator engines, compressors, heaters, and other support utilities. For mobile and non-mobile sources, all particulate matter emissions are considered to be 2.5 micrometers or less in size due to a lack of specific emission factors for differing sized particulates.
b Emission factors for mobile vehicles are based on the California Air Resources Board’s (CARB’s) emission factor model (EMFAC 2007 version 2.30 [2006]) for on-road passenger vehicles and delivery trucks for year 2012 scenario and conservative assumption of 30 miles per hour per vehicle speed rate.
c Emission factors for mobile heavy equipment are based on Santa Barbara County Air Pollution Control District (SBCAPCD) Table 1 - Construction Emission Factors (1997) for NOx, CO, VOC, PM, PM-10, and PM-2.5. Emissions of SO2 were calculated using mass balance computations at 15 ppm sulfur content (ultra low sulfur fuel) for diesel fuel. Emission factors used in air quality analyses are determined by the guidance provided by regulating air districts. In this case, the ADEC does not provide guidance. In the absence of this guidance, as is typical throughout the US, both California state and local emission factors are used based on their conservatism.
d Emission factors for non-mobile sources are based on EPA AP-42 Tables 3.3-1, 1.3-1, 1.3-3 and 1.3-6 for NOx, CO, VOC, PM, PM-10, and PM-2.5 and Table 3.3-2 for HAPs. Emissions of SO2 were calculated using mass balance computations at 15 ppm sulfur content (ultra low sulfur fuel) for diesel fuel.
e Calculations for fugitive dust (PM, PM-10 and PM-2.5) assumed 417.24 acres of land disturbance for Fairbanks Lateral construction and 120.68 acres of land disturbance for Fairbanks Lateral access roads used during construction; a controlled emission factor based on 1.2 tons per acre per month (ref. EPA AP-42, Vol. 1, 1993, Section 13.2.3.3) times 0.5 (controlled factor assumes 50 percent credit for watering) times 0.64 (ref. CARB 1988; Profile 391 - Road and Building Construction Dust) and 220 hours per month for 4 months per year. Total PM fugitive dust is assumed equal to PM-10 fugitive dust. PM-2.5 fugitive dust is estimated at 10 percent of PM-10, based on the study conducted by Midwest Research Institute in 2006 (Background Document for Revisions to Fine Fraction Ratios Used for AP-42 Fugitive Dust Emission Factors) for the Western Governors Association to better characterize the PM-2.5/PM-10 ratio in fugitive dust. This report has been accepted by the EPA as an approved adjustment to the emission factors in EPA AP-42, Section 13.2.
f Worst-case emissions from open burning were provided by AGDC 2012 using emission factors from Andreae and Merlet (2001). Open burning activities would occur during the first year only.
g GHG emissions (CO2-e) for all emission sources, except for mobile vehicles (see note b), and open burning (see note h), are based on emission factors in 40 CFR 98 Tables A-1, C-1, and C-2. Applicability to the GHG reporting rule is dependent upon actual emissions from the stationary (non-mobile) source (i.e., CO2-e actual emissions equal to or greater than a threshold of 25,000 metric TPY).
h Values for open burning in CO2 rather than CO2-e. i Total in tons per year represents maximum values since open burning would occur only during the first year.
1 Pig refers to a pipeline inspection gage.
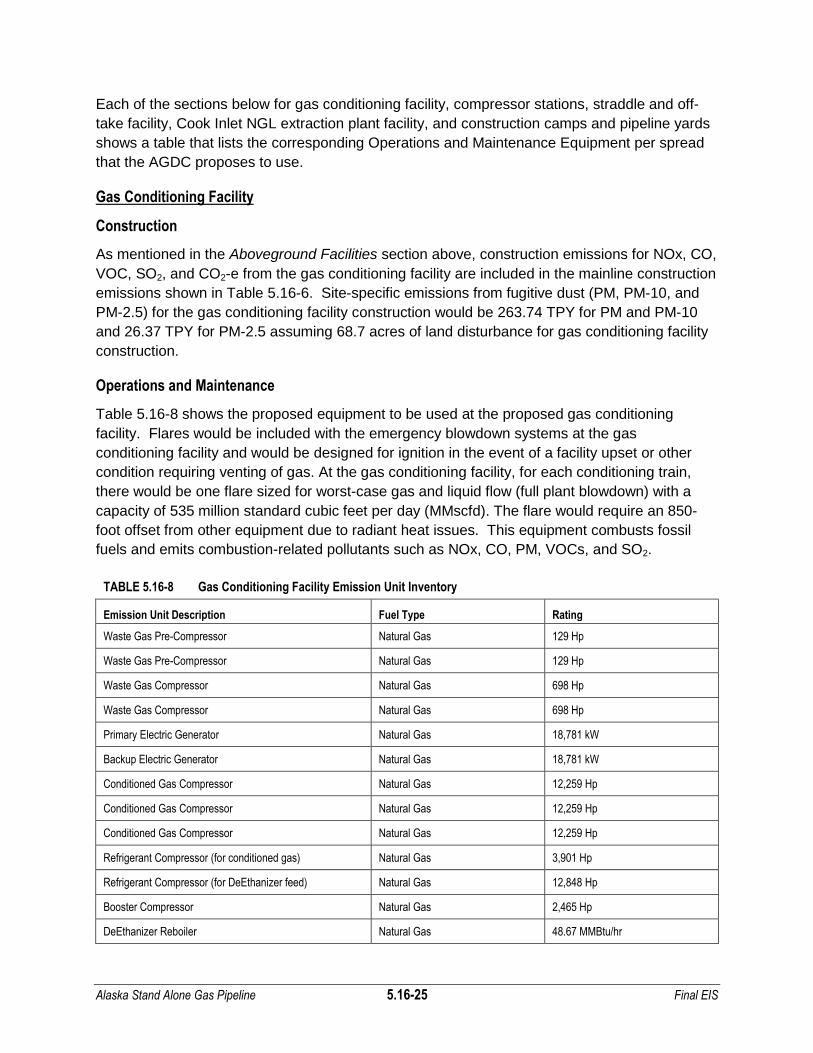
Alaska Stand Alone Gas Pipeline 5.16-25 Final EIS
Each of the sections below for gas conditioning facility, compressor stations, straddle and off-
take facility, Cook Inlet NGL extraction plant facility, and construction camps and pipeline yards
shows a table that lists the corresponding Operations and Maintenance Equipment per spread
that the AGDC proposes to use.
Gas Conditioning Facility
Construction
As mentioned in the Aboveground Facilities section above, construction emissions for NOx, CO,
VOC, SO2, and CO2-e from the gas conditioning facility are included in the mainline construction
emissions shown in Table 5.16-6. Site-specific emissions from fugitive dust (PM, PM-10, and
PM-2.5) for the gas conditioning facility construction would be 263.74 TPY for PM and PM-10
and 26.37 TPY for PM-2.5 assuming 68.7 acres of land disturbance for gas conditioning facility
construction.
Operations and Maintenance
Table 5.16-8 shows the proposed equipment to be used at the proposed gas conditioning
facility. Flares would be included with the emergency blowdown systems at the gas
conditioning facility and would be designed for ignition in the event of a facility upset or other
condition requiring venting of gas. At the gas conditioning facility, for each conditioning train,
there would be one flare sized for worst-case gas and liquid flow (full plant blowdown) with a
capacity of 535 million standard cubic feet per day (MMscfd). The flare would require an 850-
foot offset from other equipment due to radiant heat issues. This equipment combusts fossil
fuels and emits combustion-related pollutants such as NOx, CO, PM, VOCs, and SO2.
TABLE 5.16-8 Gas Conditioning Facility Emission Unit Inventory
Emission Unit Description Fuel Type Rating
Waste Gas Pre-Compressor Natural Gas 129 Hp
Waste Gas Pre-Compressor Natural Gas 129 Hp
Waste Gas Compressor Natural Gas 698 Hp
Waste Gas Compressor Natural Gas 698 Hp
Primary Electric Generator Natural Gas 18,781 kW
Backup Electric Generator Natural Gas 18,781 kW
Conditioned Gas Compressor Natural Gas 12,259 Hp
Conditioned Gas Compressor Natural Gas 12,259 Hp
Conditioned Gas Compressor Natural Gas 12,259 Hp
Refrigerant Compressor (for conditioned gas) Natural Gas 3,901 Hp
Refrigerant Compressor (for DeEthanizer feed) Natural Gas 12,848 Hp
Booster Compressor Natural Gas 2,465 Hp
DeEthanizer Reboiler Natural Gas 48.67 MMBtu/hr
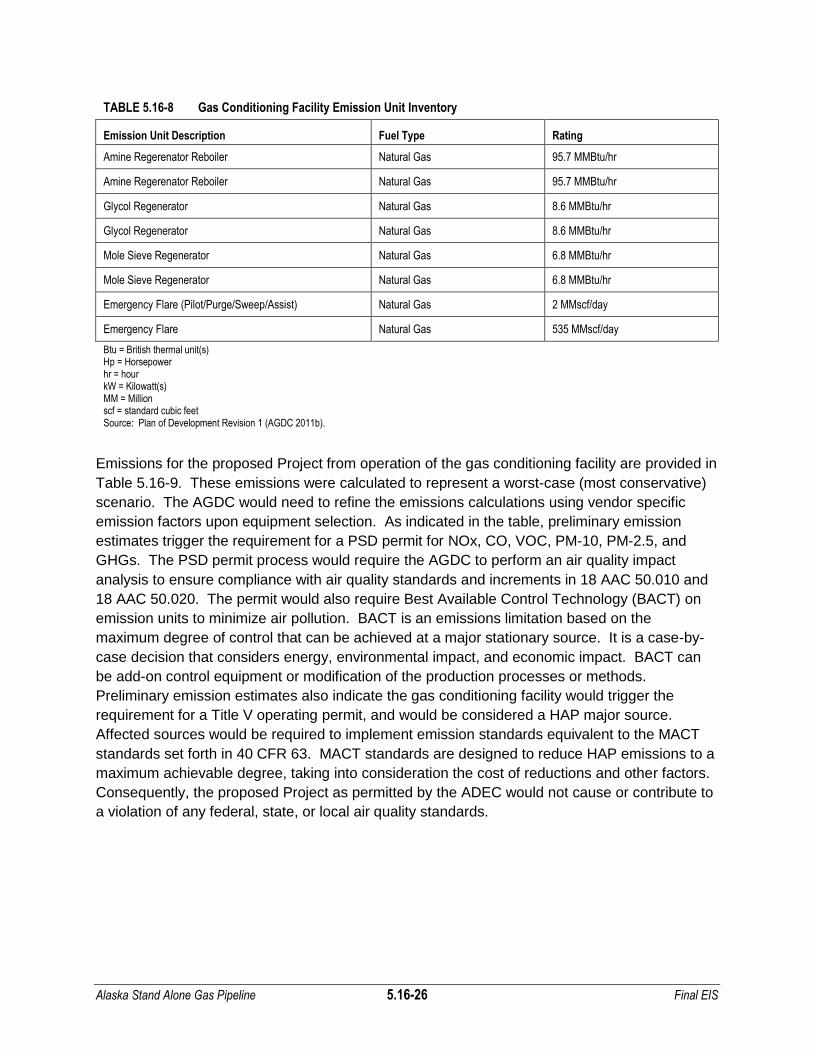
Alaska Stand Alone Gas Pipeline 5.16-26 Final EIS
TABLE 5.16-8 Gas Conditioning Facility Emission Unit Inventory
Emission Unit Description Fuel Type Rating
Amine Regerenator Reboiler Natural Gas 95.7 MMBtu/hr
Amine Regerenator Reboiler Natural Gas 95.7 MMBtu/hr
Glycol Regenerator Natural Gas 8.6 MMBtu/hr
Glycol Regenerator Natural Gas 8.6 MMBtu/hr
Mole Sieve Regenerator Natural Gas 6.8 MMBtu/hr
Mole Sieve Regenerator Natural Gas 6.8 MMBtu/hr
Emergency Flare (Pilot/Purge/Sweep/Assist) Natural Gas 2 MMscf/day
Emergency Flare Natural Gas 535 MMscf/day
Btu = British thermal unit(s) Hp = Horsepower hr = hour kW = Kilowatt(s) MM = Million scf = standard cubic feet Source: Plan of Development Revision 1 (AGDC 2011b).
Emissions for the proposed Project from operation of the gas conditioning facility are provided in
Table 5.16-9. These emissions were calculated to represent a worst-case (most conservative)
scenario. The AGDC would need to refine the emissions calculations using vendor specific
emission factors upon equipment selection. As indicated in the table, preliminary emission
estimates trigger the requirement for a PSD permit for NOx, CO, VOC, PM-10, PM-2.5, and
GHGs. The PSD permit process would require the AGDC to perform an air quality impact
analysis to ensure compliance with air quality standards and increments in 18 AAC 50.010 and
18 AAC 50.020. The permit would also require Best Available Control Technology (BACT) on
emission units to minimize air pollution. BACT is an emissions limitation based on the
maximum degree of control that can be achieved at a major stationary source. It is a case-by-
case decision that considers energy, environmental impact, and economic impact. BACT can
be add-on control equipment or modification of the production processes or methods.
Preliminary emission estimates also indicate the gas conditioning facility would trigger the
requirement for a Title V operating permit, and would be considered a HAP major source.
Affected sources would be required to implement emission standards equivalent to the MACT
standards set forth in 40 CFR 63. MACT standards are designed to reduce HAP emissions to a
maximum achievable degree, taking into consideration the cost of reductions and other factors.
Consequently, the proposed Project as permitted by the ADEC would not cause or contribute to
a violation of any federal, state, or local air quality standards.

Alaska Stand Alone Gas Pipeline 5.16-27 Final EIS
TABLE 5.16-9 Gas Conditioning Facility Operations Emissionsa, b, c, d
Emission Source NOx
(TPY) CO
(TPY) VOC (TPY)
SO2d
(TPY) PM
(TPY) PM-10 (TPY)
PM-2.5
(TPY) HAPs (TPY)
CO2-ef (TPY)
Gas Conditioning Facility 4,442 913 170 4 49 49 49 68 519,695
Total operating emissions 4,442 913 170 4 49 49 49 68 519,695
a Emissions were calculated for stationary emission units listed in Table 5.16.2-4. Mobile sources (on-road and non-road) used during facility operations and maintenance were not included in the estimate and have yet to be determined.
b EPA's AP-42 Tables 3.1-1, 3.1-2a, 3.1-3, & 3.2-2, and Tables 1.4-1 & 1.4-2 emission factors were used for calculations of NOx, CO, VOC, PM, PM-10, PM-2.5, and HAPs for natural gas-fired combustion units.
c The most conservative AP-42 emission factor was used for internal combustion engines (i.e., uncontrolled 4 stroke lean burn engines) in AP-42 Table 3.2-2.
d All emissions calculations used conservative assumptions of 8,760 hours per year of operation; 7,000 Btu per Hp-hr maximum fuel rating for generator engines; and 10,000 Btu per Hp-hr maximum fuel ratings for gas compressors. All particulate matter emissions are considered to be 2.5 micrometers or less in size due to a lack of specific emission factors for differing sized particulates.
e Emissions of SO2 were calculated using mass balance computations at 4 ppm H2S concentration in natural gas. f GHG emissions (CO2-e) are based on emission factors in 40 CFR 98 Tables A-1, C-1, and C-2. Applicability to the GHG reporting rule is dependent upon
actual emissions from the stationary source (i.e., CO2-e actual emissions equal to or greater than a threshold of 25,000 metric TPY) unless the facility is considered an applicable petroleum and natural gas facility.
Compressor Stations
Construction
As mentioned in the Aboveground Facilities section above, construction emissions for NOx, CO,
VOC, SO2, and CO2-e from compressor stations are included in the mainline construction
emissions shown in Table 5.16-6. Site-specific emissions from fugitive dust (PM, PM-10, and
PM-2.5) for compressor station construction would be 5.37 TPY for PM and PM-10 and
0.54 TPY for PM-2.5 assuming 1.4 acres of land disturbance for compressor station
construction.
Operations and Maintenance
Table 5.16-10 shows the proposed equipment to be used at each of the compressor stations.
Flares would be included with the emergency blowdown systems at the compressor stations
and would be designed for ignition in the event of a facility upset or other condition requiring
venting of gas. At the compressor station the flare would be sized for 500 MMscfd with a
required offset of 865 feet from other equipment. This equipment combusts fossil fuels and
emits combustion-related pollutants such as NOx, CO, PM, VOCs, and SO2.

Alaska Stand Alone Gas Pipeline 5.16-28 Final EIS
TABLE 5.16-10 Compressor Station Emission Unit Inventory
Emission Unit Description Fuel Type Rating
Gas Compressor Natural Gas 11,714 Hp
Primary Electric Generator Natural Gas 663 kW
Refrigerant Compressor Natural Gas 3,977 Hp
Emergency Flare (Pilot/Purge/Sweep/Assist) Natural Gas 2 MMscf/day
Emergency Flare Natural Gas 500 MMscf/day
Hp = Horsepower kW = Kilowatt(s) MM = Million scf = standard cubic feet Source: Plan of Development Revision 1 (AGDC 2011b).
Emissions for the proposed Project from operation of each compressor station are provided in
Table 5.16-11. These emissions were calculated to represent a worst-case (most conservative)
scenario. The AGDC would need to refine the emissions calculations using vendor specific
emission factors upon equipment selection. As indicated in the table, preliminary emission
estimates trigger the requirement for a PSD permit for NOx. The PSD permit process would
require the AGDC to perform an air quality impact analysis to ensure compliance with air quality
standards and increments in 18 AAC 50.010 and 18 AAC 50.020. The permit would also
require BACT on emission units to minimize air pollution. Preliminary emission estimates also
indicate each compressor station would trigger the requirement for a Title V operating permit.
Consequently, the proposed Project as permitted by the ADEC would not cause or contribute to
a violation of any federal, state, or local air quality standards.
TABLE 5.16-11 Compressor Station Operations Emissionsa, b, c, d
Emission Source NOx
(TPY) CO
(TPY) VOC (TPY)
SO2e
(TPY) PM
(TPY) PM-10 (TPY)
PM-2.5
(TPY) HAPs (TPY)
CO2-ef (TPY)
Compressor Station 319 269 39 0.8 19 19 19 2 82,161
Total operating emissions 319 269 39 0.8 19 19 19 2 82,161
a Emissions were calculated for stationary emission units listed in Table 5.16.2-4. Mobile sources (on-road and non-road) used during facility operations and maintenance were not included in the estimate and have yet to be determined.
b EPA's AP-42 Tables 3.1-1, 3.1-2a, 3.1-3, & 3.2-2 emission factors were used for calculations of NOx, CO, VOC, PM, PM-10, PM-2.5, and HAPs for natural gas-fired combustion units.
c The most conservative AP-42 emission factor was used for internal combustion engines (i.e., uncontrolled 4 stroke lean burn engines) in AP-42 Table 3.2-2.
d All emissions calculations used conservative assumptions of 8,760 hours per year of operation; 7,000 Btu per Hp-hr maximum fuel rating for generator engines; and 10,000 Btu per Hp-hr maximum fuel ratings for gas compressors. All particulate matter emissions are considered to be 2.5 micrometers or less in size due to a lack of specific emission factors for differing sized particulates.
e Emissions of SO2 were calculated using mass balance computations at 4 ppm H2S concentration in natural gas. f GHG emissions (CO2-e) are based on emission factors in 40 CFR 98 Tables A-1, C-1, and C-2. Applicability to the GHG reporting rule is dependent upon
actual emissions from the stationary source (i.e., CO2-e actual emissions equal to or greater than a threshold of 25,000 metric TPY) unless the facility is considered an applicable petroleum and natural gas facility.
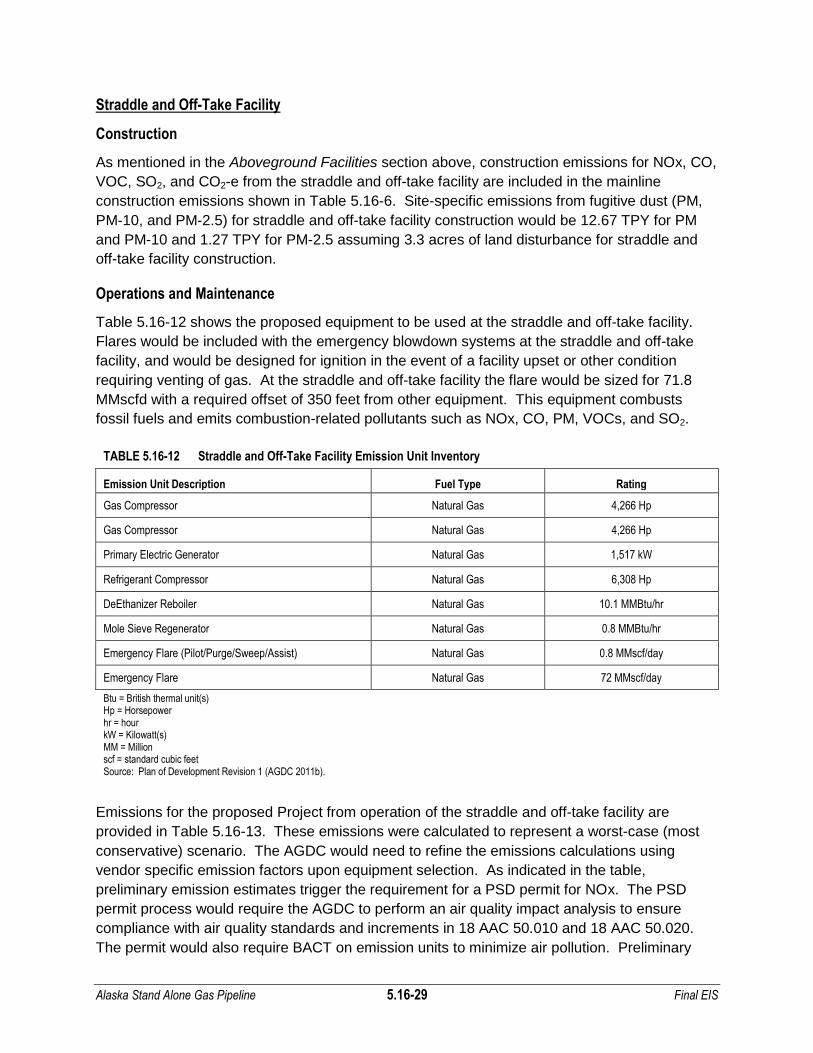
Alaska Stand Alone Gas Pipeline 5.16-29 Final EIS
Straddle and Off-Take Facility
Construction
As mentioned in the Aboveground Facilities section above, construction emissions for NOx, CO,
VOC, SO2, and CO2-e from the straddle and off-take facility are included in the mainline
construction emissions shown in Table 5.16-6. Site-specific emissions from fugitive dust (PM,
PM-10, and PM-2.5) for straddle and off-take facility construction would be 12.67 TPY for PM
and PM-10 and 1.27 TPY for PM-2.5 assuming 3.3 acres of land disturbance for straddle and
off-take facility construction.
Operations and Maintenance
Table 5.16-12 shows the proposed equipment to be used at the straddle and off-take facility.
Flares would be included with the emergency blowdown systems at the straddle and off-take
facility, and would be designed for ignition in the event of a facility upset or other condition
requiring venting of gas. At the straddle and off-take facility the flare would be sized for 71.8
MMscfd with a required offset of 350 feet from other equipment. This equipment combusts
fossil fuels and emits combustion-related pollutants such as NOx, CO, PM, VOCs, and SO2.
TABLE 5.16-12 Straddle and Off-Take Facility Emission Unit Inventory
Emission Unit Description Fuel Type Rating
Gas Compressor Natural Gas 4,266 Hp
Gas Compressor Natural Gas 4,266 Hp
Primary Electric Generator Natural Gas 1,517 kW
Refrigerant Compressor Natural Gas 6,308 Hp
DeEthanizer Reboiler Natural Gas 10.1 MMBtu/hr
Mole Sieve Regenerator Natural Gas 0.8 MMBtu/hr
Emergency Flare (Pilot/Purge/Sweep/Assist) Natural Gas 0.8 MMscf/day
Emergency Flare Natural Gas 72 MMscf/day
Btu = British thermal unit(s) Hp = Horsepower hr = hour kW = Kilowatt(s) MM = Million scf = standard cubic feet Source: Plan of Development Revision 1 (AGDC 2011b).
Emissions for the proposed Project from operation of the straddle and off-take facility are
provided in Table 5.16-13. These emissions were calculated to represent a worst-case (most
conservative) scenario. The AGDC would need to refine the emissions calculations using
vendor specific emission factors upon equipment selection. As indicated in the table,
preliminary emission estimates trigger the requirement for a PSD permit for NOx. The PSD
permit process would require the AGDC to perform an air quality impact analysis to ensure
compliance with air quality standards and increments in 18 AAC 50.010 and 18 AAC 50.020.
The permit would also require BACT on emission units to minimize air pollution. Preliminary

Alaska Stand Alone Gas Pipeline 5.16-30 Final EIS
emission estimates also indicate the straddle and off-take facility would trigger the requirement
for a Title V operating permit. Consequently, the proposed Project as permitted by the ADEC
would not cause or contribute to a violation of any federal, state, or local air quality standards.
TABLE 5.16-13 Straddle and Off-Take Facility Operations Emissionsa, b, c, d
Emission Source NOx
(TPY) CO
(TPY) VOC (TPY)
SO2e
(TPY) PM
(TPY) PM-10 (TPY)
PM-2.5
(TPY) HAPs (TPY)
CO2-ef (TPY)
Straddle and Off-Take Facility 367 147 19 0.6 10 10 10 3 85,639
Total operating emissions 367 147 19 0.6 10 10 10 3 85,639
a Emissions were calculated for stationary emission units listed in Table 5.16.2-4. Mobile sources (on-road and non-road) used during facility operations and maintenance were not included in the estimate and have yet to be determined.
b EPA's AP-42 Tables 3.1-1, 3.1-2a, 3.1-3, & 3.2-2, and Tables 1.4-1 & 1.4-2 emission factors were used for calculations of NOx, CO, VOC, PM, PM-10, PM-2.5, and HAPs for natural gas-fired combustion units.
c The most conservative AP-42 emission factor was used for internal combustion engines (i.e., uncontrolled 4 stroke lean burn engines) in AP-42 Table 3.2-2.
d All emissions calculations used conservative assumptions of 8,760 hours per year of operation; 7,000 Btu per Hp-hr maximum fuel rating for generator engines; and 10,000 Btu per Hp-hr maximum fuel ratings for gas compressors. All particulate matter emissions are considered to be 2.5 micrometers or less in size due to a lack of specific emission factors for differing sized particulates.
e Emissions of SO2 were calculated using mass balance computations at 4 ppm H2S concentration in natural gas. f GHG emissions (CO2-e) are based on emission factors in 40 CFR 98 Tables A-1, C-1, and C-2. Applicability to the GHG reporting rule is dependent upon
actual emissions from the stationary source (i.e., CO2-e actual emissions equal to or greater than a threshold of 25,000 metric TPY) unless the facility is considered an applicable petroleum and natural gas facility.
Cook Inlet Natural Gas Liquids (NGL) Extraction Plant Facility
Construction
As mentioned in the Aboveground Facilities section above, construction emissions for NOx, CO,
VOC, SO2, and CO2-e from the NGL extraction plant facility are included in the mainline
construction emissions shown in Table 5.16-6. Site-specific emissions from fugitive dust (PM,
PM-10, and PM-2.5) for NGL extraction plant facility construction would be 19.96 TPY for PM
and PM-10 and 2.00 TPY for PM-2.5 assuming 5.2 acres of land disturbance for NGL extraction
plant facility construction.
Operations and Maintenance
Table 5.16-14 shows the proposed equipment to be used at the NGL extraction plant facility.
Flares would be included with the emergency blowdown systems at the NGL extraction facility
and would be designed for ignition in the event of a facility upset or other condition requiring
venting of gas. At the NGL extraction plant facility the flare would be sized for a feed rate of
402,000 pounds per hour, with a required offset of 870 feet from other equipment. This
equipment combusts fossil fuels and emits combustion-related pollutants such as NOx, CO, PM,
VOCs, and SO2.

Alaska Stand Alone Gas Pipeline 5.16-31 Final EIS
TABLE 5.16-14 NGL Extraction Plant Facility Emission Unit Inventory
Emission Unit Description Fuel Type Rating
Gas Compressor Natural Gas 11,729 Hp
Gas Compressor Natural Gas 11,729 Hp
Main Facility Generator Natural Gas 1,223 kW
Refrigerant Compressor Natural Gas 13,810 Hp
DeEthanizer Reboiler Natural Gas 49.11 MMBtu/hr
Mole Sieve Regenerator Natural Gas 27.3 MMBtu/hr
Mole Sieve Regenerator Natural Gas 27.3 MMBtu/hr
Emergency Flare (Pilot/Purge/Sweep/Assist) Natural Gas 2 MMscf/day
Emergency Flare Natural Gas 113 MMscf/day
Btu = British thermal unit(s) Hp = Horsepower hr = hour kW = Kilowatt(s) MM = Million scf = standard cubic feet Source: Plan of Development Revision 1. (AGDC 2011b)
Emissions for the proposed Project from operation of the NGL extraction plant facility are
provided in Table 5.16-15. These emissions were calculated to represent a worst-case (most
conservative) scenario. The AGDC would need to refine the emissions calculations using
vendor specific emission factors upon equipment selection. As indicated in the table,
preliminary emission estimates trigger the requirement for a PSD permit for NOx, CO, PM-2.5,
and GHGs. The PSD permit process would require the AGDC to perform an air quality impact
analysis to ensure compliance with air quality standards and increments in 18 AAC 50.010 and
18 AAC 50.020. The permit would also require BACT on emission units to minimize air
pollution. Preliminary emission estimates also indicate the NGL extraction plant facility would
trigger the requirement for a Title V operating permit. Consequently, the proposed Project as
permitted by the ADEC would not cause or contribute to a violation of any federal, state, or local
air quality standards.

Alaska Stand Alone Gas Pipeline 5.16-32 Final EIS
TABLE 5.16-15 NGL Extraction Plant Facility Operations Emissionsa, b, c, d
Emission Source NOx
(TPY) CO
(TPY) VOC (TPY)
SO2e
(TPY) PM
(TPY) PM-10 (TPY)
PM-2.5
(TPY) HAPs (TPY)
CO2-ef (TPY)
NGL Extraction Plant Facility 713 360 40 1.7 27 27 27 5 247,364
Total operating emissions 713 360 40 1.7 27 27 27 5 247,364
a Emissions were calculated for stationary emission units listed in Table 5.16.2-4. Mobile sources (on-road and non-road) used during facility operations and maintenance were not included in the estimate and have yet to be determined.
b EPA's AP-42 Tables 3.1-1, 3.1-2a, 3.1-3, & 3.2-2, and Tables 1.4-1 & 1.4-2 emission factors were used for calculations of NOx, CO, VOC, PM, PM-10, PM-2.5, and HAPs for natural gas-fired combustion units.
c The most conservative AP-42 emission factor was used for internal combustion engines (i.e., uncontrolled 4 stroke lean burn engines) in AP-42 Table 3.2-2.
d All emissions calculations used conservative assumptions of 8,760 hours per year of operation; 7,000 Btu per Hp-hr maximum fuel rating for generator engines; and 10,000 Btu per Hp-hr maximum fuel ratings for gas compressors. All particulate matter emissions are considered to be 2.5 micrometers or less in size due to a lack of specific emission factors for differing sized particulates.
e Emissions of SO2 were calculated using mass balance computations at 4 ppm H2S concentration in natural gas. f GHG emissions (CO2-e) are based on emission factors in 40 CFR 98 Tables A-1, C-1, and C-2. Applicability to the GHG reporting rule is dependent upon
actual emissions from the stationary source (i.e., CO2-e actual emissions equal to or greater than a threshold of 25,000 metric TPY) unless the facility is considered an applicable petroleum and natural gas facility.
Mainline Valves and Pig Launcher/Receivers
Construction
As mentioned in the Aboveground Facilities section above, construction emissions for NOx, CO,
VOC, SO2, and CO2-e from mainline valves and pig launchers/receivers are included in the
mainline construction emissions shown in Table 5.16-6. Site-specific emissions from fugitive
dust (PM, PM-10, and PM-2.5) would be 3.07 TPY for PM and PM-10 and 0.31 TPY for PM-2.5
assuming 0.8 acres of land disturbance for mainline valve construction located outside of other
aboveground facilities. Pig launchers/receivers are collocated with the aboveground facilities
(i.e., gas conditioning facility, compressor stations, straddle and off-take facility, NGL extraction
plant facility, and support facilities).
Operations and Maintenance
With respect to natural gas pipeline operations, a the valves and pigging generally do not have
any significant air emissions associated with their operation; while there may be fugitive
emissions, such emissions are generally very minor in nature and typically are not subject to the
requirement to obtain a permit.
Operations and Maintenance Buildings
Construction
As mentioned in the Aboveground Facilities section above, construction emissions for NOx, CO,
VOC, SO2, and CO2-e from the proposed Project’s operations and maintenance buildings are
included in the mainline construction emissions shown in Table 5.16-6. Site-specific emissions
of fugitive dust for construction of only the operations and maintenance buildings have yet to be
determined based on disturbed land acreage.

Alaska Stand Alone Gas Pipeline 5.16-33 Final EIS
Operations and Maintenance
The AGDC did not propose any operational emission units at the operations and maintenance
buildings. Consequently, no operational impacts would occur other than those insignificant
impacts from mobile sources used during facility operations and maintenance.
Construction Camps and Pipeline Yards
Construction
As mentioned in the Aboveground Facilities section above, construction emissions for NOx, CO,
VOC, SO2, and CO2-e from construction camps and pipeline yards are included in the mainline
construction emissions shown in Table 5.16-6. Site-specific emissions from fugitive dust (PM,
PM-10, and PM-2.5) would be 485.63 TPY for PM and PM-10 and 48.56 TPY for PM-2.5
assuming 126.5 acres of land disturbance for each camp and pipeline yard construction.
The AGDC would operate mobile construction camps in locations along the proposed mainline
pipeline where construction and facility crews would require temporary housing during proposed
Project construction. Mobile construction camps would typically be small and exist for a short
duration during activities that would support the preparation of the right-of-way for construction
activities (i.e., they would be primarily limited to the construction preparation phase prior to the
establishment of stationary construction camps). Stationary construction camps which would
remain at the site for 12 months or more would be used for proposed Project personnel, fuel
and equipment storage, and as laydown yards. The AGDC has proposed the use of
14 stationary camps.
The camps would have equipment which combusts fossil fuels and emits combustion-related
pollutants such as NOx, CO, PM, VOCs, and SO2. The camp engines would be considered
non-road engines under 40 CFR 89.2 if they meet the definitions of portable or transportable,
and are at a location for less than 12 consecutive months. Non-road engine emissions would
be excluded from the determination of ―potential to emit‖ for permit applicability purposes in
accordance with the CAA.
Emissions for the proposed Project from operation of construction camps are provided in Table
5.16-16. The AGDC did not identify any equipment ratings for the camps, therefore, emissions
were calculated based on several potential camps at a worst-case (most conservative)
operating scenario. The AGDC would need to refine the emissions calculations using vendor
specific emission factors upon equipment selection. As indicated in the table, preliminary
emission estimates trigger the requirement for a minor permit for NOx for all stationary camps
(excluding temporary camps that qualify as non-road). The minor permit process would require
the AGDC to perform an air quality impact analysis to ensure compliance with the NOx air
quality standards in 18 AAC 50.010. Consequently, the proposed Project as permitted by the
ADEC would not cause or contribute to a violation of any federal, state, or local air quality
standards.

Alaska Stand Alone Gas Pipeline 5.16-34 Final EIS
TABLE 5.16-16 Potential Camp Operations Emissionsa, b, c
Emission Source NOx
(TPY) CO
(TPY) VOC (TPY)
SO2d
(TPY) PM
(TPY) PM-10 (TPY)
PM-2.5
(TPY) HAPs (TPY)
CO2-ee (TPY)
Camp (80 man; 500 kW) 44 17 6 0.03 1 1 1 0.09 3,363
Camp (100 man; 570 kW) 51 63 7 0.04 1 1 1 0.10 3,834
Camp (150 man; 700 kW) 62 77 9 0.04 1 1 1 0.12 4,709
Camp (200 man; 800 kW) 71 88 10 0.05 2 2 2 0.14 5,381
Camp (250 man; 975 kW) 87 107 12 0.06 2 2 2 0.17 6,558
Camp (500 man; 1850 kW) 164 204 23 0.12 4 4 4 0.33 12,444
a Mobile sources (on-road and non-road) used during facility operations and maintenance were not included in the estimate and have yet to be determined. b EPA's AP-42 Tables 3.4-3 & 3.4-4 emission factors were used for calculations of HAPs; 40 CFR 60 NSPS Subpart IIII (Tier 2) emission limits were used for
calculations of NOx, CO, VOC, PM, PM-10, and PM-2.5 for diesel-fired internal combustion units. c All emissions calculations used conservative assumptions of 8,760 hours per year of operation; 7,000 Btu per Hp-hr maximum fuel rating for generator
engines; and 7.1 lb per gallon fuel density. All particulate matter emissions are considered to be 2.5 micrometers or less in size due to a lack of specific emission factors for differing sized particulates.
d Emissions of SO2 were calculated using mass balance computations at 15 ppm sulfur content (ultra low sulfur fuel) for diesel fuel. e GHG emissions (CO2-e) are based on emission factors in 40 CFR 98 Tables A-1, C-1, and C-2. Applicability to the GHG reporting rule is dependent upon
actual emissions from the stationary source (i.e., CO2-e actual emissions equal to or greater than a threshold of 25,000 metric TPY).
Operations and Maintenance
Construction camps and pipeline yards would no longer be used during the operations phase of
the proposed Project. Consequently, no air quality impacts would occur.
Material Sites
Construction
As mentioned in the Aboveground Facilities section above, construction emissions for NOx, CO,
VOC, SO2, and CO2-e from material sites are included in the mainline construction emissions
shown in Table 5.16-6. Site-specific emissions of fugitive dust for use of the material sites have
yet to be determined based on disturbed land acreage.
Operations and Maintenance
Material sites would no longer be used during the operations phase of the proposed Project.
Consequently, no air quality impacts would occur.
5.16.2.3 Denali National Park Route Variation
Construction
Air quality impacts associated with construction of the proposed Project’s Denali National Park
Route Variation would be similar to the air quality impacts associated with construction of the
mainline, including emissions from fossil-fuel fired construction equipment, fugitive dust, and
open burning (see Table 5.16-17). Emissions were calculated to represent a worst-case (most
conservative) scenario of operating all construction equipment 12 hours per day for 4 summer
months. Construction on the alternative spread would be completed in one summer season,
lasting a total of 4 months. The AGDC would need to refine the emissions calculations upon
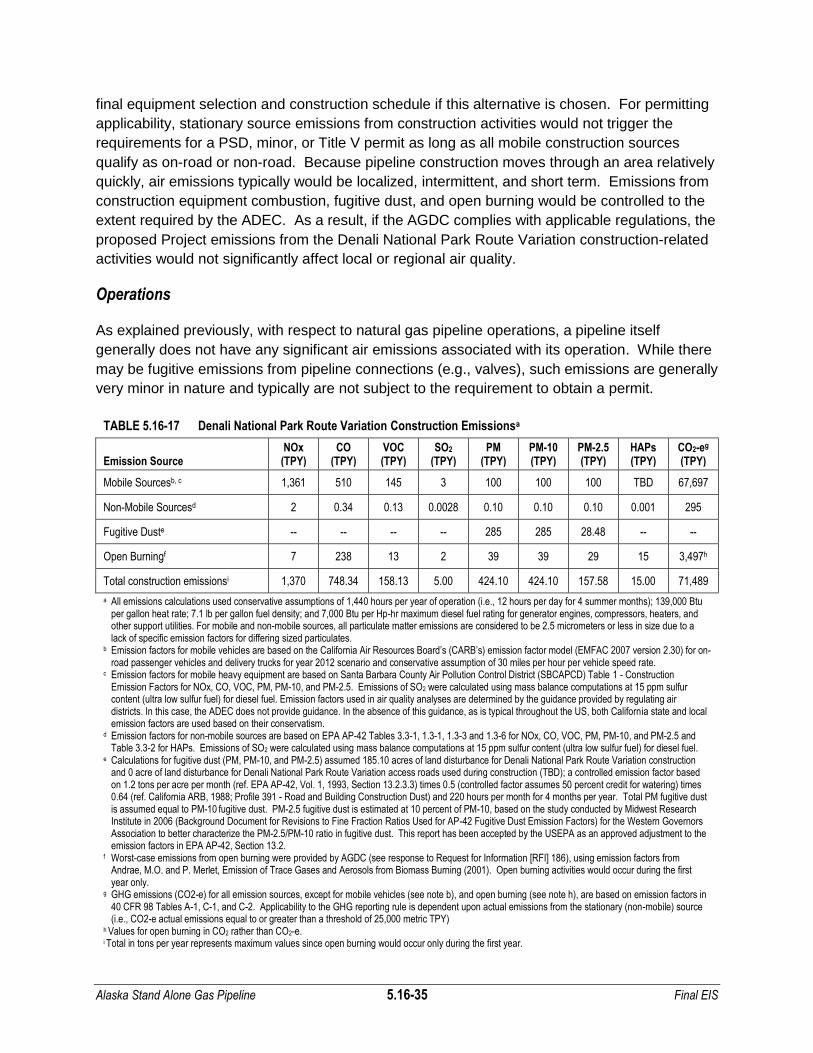
Alaska Stand Alone Gas Pipeline 5.16-35 Final EIS
final equipment selection and construction schedule if this alternative is chosen. For permitting
applicability, stationary source emissions from construction activities would not trigger the
requirements for a PSD, minor, or Title V permit as long as all mobile construction sources
qualify as on-road or non-road. Because pipeline construction moves through an area relatively
quickly, air emissions typically would be localized, intermittent, and short term. Emissions from
construction equipment combustion, fugitive dust, and open burning would be controlled to the
extent required by the ADEC. As a result, if the AGDC complies with applicable regulations, the
proposed Project emissions from the Denali National Park Route Variation construction-related
activities would not significantly affect local or regional air quality.
Operations
As explained previously, with respect to natural gas pipeline operations, a pipeline itself
generally does not have any significant air emissions associated with its operation. While there
may be fugitive emissions from pipeline connections (e.g., valves), such emissions are generally
very minor in nature and typically are not subject to the requirement to obtain a permit.
TABLE 5.16-17 Denali National Park Route Variation Construction Emissionsa
Emission Source NOx (TPY)
CO (TPY)
VOC (TPY)
SO2 (TPY)
PM (TPY)
PM-10 (TPY)
PM-2.5 (TPY)
HAPs (TPY)
CO2-eg
(TPY)
Mobile Sourcesb, c 1,361 510 145 3 100 100 100 TBD 67,697
Non-Mobile Sourcesd 2 0.34 0.13 0.0028 0.10 0.10 0.10 0.001 295
Fugitive Duste -- -- -- -- 285 285 28.48 -- --
Open Burningf 7 238 13 2 39 39 29 15 3,497h
Total construction emissionsi 1,370 748.34 158.13 5.00 424.10 424.10 157.58 15.00 71,489
a All emissions calculations used conservative assumptions of 1,440 hours per year of operation (i.e., 12 hours per day for 4 summer months); 139,000 Btu per gallon heat rate; 7.1 lb per gallon fuel density; and 7,000 Btu per Hp-hr maximum diesel fuel rating for generator engines, compressors, heaters, and other support utilities. For mobile and non-mobile sources, all particulate matter emissions are considered to be 2.5 micrometers or less in size due to a lack of specific emission factors for differing sized particulates.
b Emission factors for mobile vehicles are based on the California Air Resources Board’s (CARB’s) emission factor model (EMFAC 2007 version 2.30) for on-road passenger vehicles and delivery trucks for year 2012 scenario and conservative assumption of 30 miles per hour per vehicle speed rate.
c Emission factors for mobile heavy equipment are based on Santa Barbara County Air Pollution Control District (SBCAPCD) Table 1 - Construction Emission Factors for NOx, CO, VOC, PM, PM-10, and PM-2.5. Emissions of SO2 were calculated using mass balance computations at 15 ppm sulfur content (ultra low sulfur fuel) for diesel fuel. Emission factors used in air quality analyses are determined by the guidance provided by regulating air districts. In this case, the ADEC does not provide guidance. In the absence of this guidance, as is typical throughout the US, both California state and local emission factors are used based on their conservatism.
d Emission factors for non-mobile sources are based on EPA AP-42 Tables 3.3-1, 1.3-1, 1.3-3 and 1.3-6 for NOx, CO, VOC, PM, PM-10, and PM-2.5 and Table 3.3-2 for HAPs. Emissions of SO2 were calculated using mass balance computations at 15 ppm sulfur content (ultra low sulfur fuel) for diesel fuel.
e Calculations for fugitive dust (PM, PM-10, and PM-2.5) assumed 185.10 acres of land disturbance for Denali National Park Route Variation construction and 0 acre of land disturbance for Denali National Park Route Variation access roads used during construction (TBD); a controlled emission factor based on 1.2 tons per acre per month (ref. EPA AP-42, Vol. 1, 1993, Section 13.2.3.3) times 0.5 (controlled factor assumes 50 percent credit for watering) times 0.64 (ref. California ARB, 1988; Profile 391 - Road and Building Construction Dust) and 220 hours per month for 4 months per year. Total PM fugitive dust is assumed equal to PM-10 fugitive dust. PM-2.5 fugitive dust is estimated at 10 percent of PM-10, based on the study conducted by Midwest Research Institute in 2006 (Background Document for Revisions to Fine Fraction Ratios Used for AP-42 Fugitive Dust Emission Factors) for the Western Governors Association to better characterize the PM-2.5/PM-10 ratio in fugitive dust. This report has been accepted by the USEPA as an approved adjustment to the emission factors in EPA AP-42, Section 13.2.
f Worst-case emissions from open burning were provided by AGDC (see response to Request for Information [RFI] 186), using emission factors from Andrae, M.O. and P. Merlet, Emission of Trace Gases and Aerosols from Biomass Burning (2001). Open burning activities would occur during the first year only.
g GHG emissions (CO2-e) for all emission sources, except for mobile vehicles (see note b), and open burning (see note h), are based on emission factors in 40 CFR 98 Tables A-1, C-1, and C-2. Applicability to the GHG reporting rule is dependent upon actual emissions from the stationary (non-mobile) source (i.e., CO2-e actual emissions equal to or greater than a threshold of 25,000 metric TPY)
h Values for open burning in CO2 rather than CO2-e. i Total in tons per year represents maximum values since open burning would occur only during the first year.
Alaska Stand Alone Gas Pipeline 5.16-36 Final EIS
5.16.3 General Conformity
Section 176(c) of the CAA prohibits federal actions in nonattainment or PSD maintenance areas
that do not conform to the SIP for the attainment and maintenance of NAAQS. Therefore, the
purpose of the General Conformity Determination is to ensure: (1) federal activities do not
interfere with the budgets in the SIPs; (2) actions do not cause or contribute to new violations;
and (3) attainment and maintenance of the NAAQS. Conformity can be demonstrated by
showing: (1) emission increases are allowed in the SIP; (2) the state agrees to include emission
increases in the SIP; (3) no new violations of NAAQS, or no increase in the frequency or
severity of violations would occur; (4) offsets; and (5) mitigation. Actions that are excluded from
the General Conformity Determination include those already subject to NSR and those covered
by the Comprehensive Environmental Response, Compensation, and Liability Act (CERCLA) or
other environmental laws.
The Fairbanks Lateral would cross into the FNSB nonattainment boundary for PM-2.5 (see
Figure 5.16-1). Consequently, construction and operation emissions would occur from the
nonattainment portion of the Fairbanks Lateral construction and operation as well as use of four
material sites and one construction camp and pipeline yard. Emissions of PM-2.5 and each of
the precursors that form it (SO2, NOx, VOCs, and ammonia) would be evaluated against the
General Conformity applicability threshold levels of 100 TPY each and nonattainment area
emissions budget. Written approval of conformance with the SIP would be necessary for the
proposed Project if estimated emissions are above the General Conformity applicability
threshold levels.
The detailed information needed to complete the General Conformity analysis has not been
provided for this proposed Project. Information required to complete the analysis would include
transportation equipment lists and emissions, maintenance equipment lists and emissions,
construction schedules and refined emissions, and other similar details necessary for
calculation of construction and operation emissions estimates for the nonattainment portion of
the Fairbanks Lateral. If emissions are greater than the applicability threshold levels, the AGDC
would need to contact the ADEC to determine if the emissions are accounted for in the SIP
emissions budget such that the proposed activities would not cause new violations of the
standards and/or cause an increase in the frequency or severity of previous violations. The
analysis can be completed after the NEPA process, as long as a determination of General
Conformity is conducted within the permitting process.
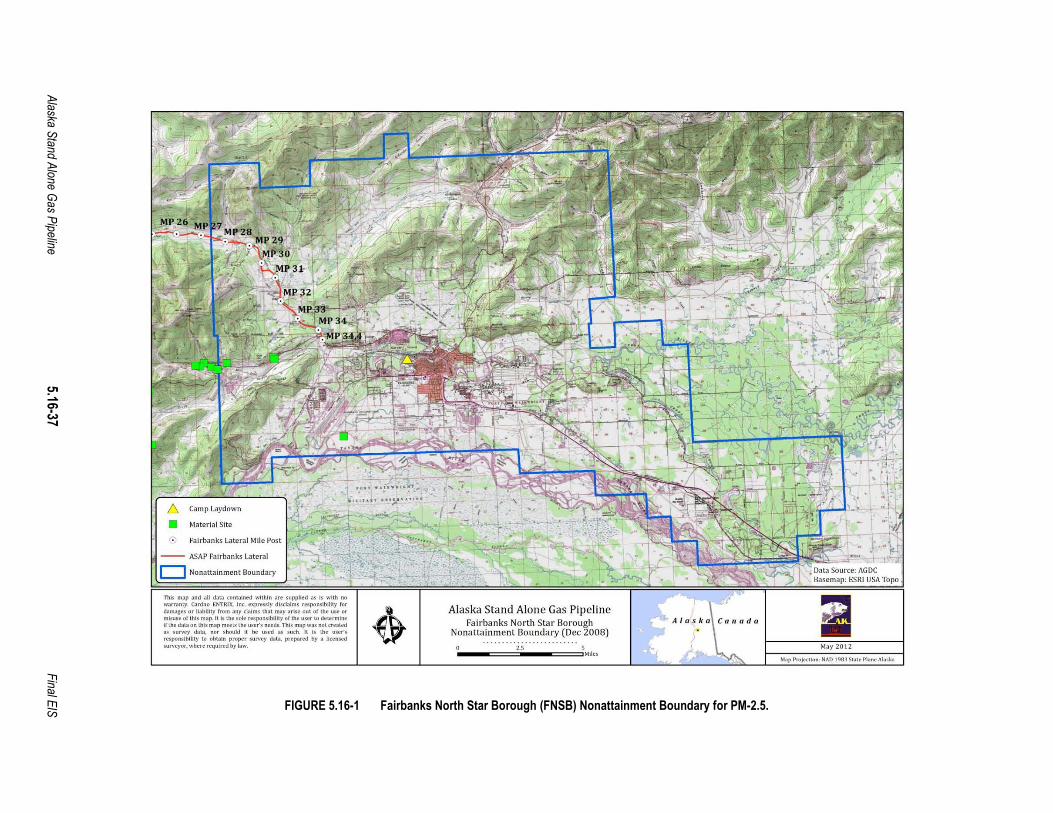
Alaska S
tand Alone G
as Pipeline
5.16-37
F
inal EIS
FIGURE 5.16-1 Fairbanks North Star Borough (FNSB) Nonattainment Boundary for PM-2.5.
T~I, map and all dab conlalned wlt~ln are s\lppl~d ... Is whh nowarranty. Cardno ENTRIJ(. Inc. expressly dlscl.lms responsibility ford.m'8~s or lI.blllty from any claims that m.y arise oul of lh~ uSC ormlsus~ of this map. Ills th~ s,,~ r.... ponslbility ortll~ uscr to d~termln~
1(lh~ d.ta"n tllis map me<.'ts th~ user', n..-eds. This m.pwas not cr~'ledas survey data, nor s""uld II be used as such. 1\ Is tll~ uscr'sresponslbllhy 10 obtaIn proper survey data, pr~pll ..d by • lI.ensedsUn''')'or, wh~T~ require<! by law
~ Camp Laydown
• Material Site
o Fairbanks Lateral Mile Post
-- ASAP Fairbanks Lateral
o Nonattainment Boundary".:'" -
Alaska Stand Alone Gas PipelineFairbanks North Star Borough
Nonattainment Boundary (Dec 2008),
Mil••
iMay20t2
Map Prot",.. lon: NAD I9SJ Sta,. PI.neAI.,ka

Alaska Stand Alone Gas Pipeline 5.16-38 Final EIS
5.16.4 References
ADEC. See Alaska Department of Environmental Conservation.
AGDC. See Alaska Gasline Development Corporation.
Alaska Department of Environmental Conservation (ADEC). 2011. Air Quality Control
Regulations. Website: (http://www.dec.state.ak.us/air/ap/regulati.htm) accessed on
May 6, 2011.
Alaska Gasline Development Corporation (AGDC). 2011a. Response to ASAP Project
Description Data Request. February 14, 2011.
Alaska Gasline Development Corporation (AGDC). 2011b. Plan of Development Revision 1.
Alaska Gasline Development Corporation (AGDC). 2012. Response to ASAP Project Open
Burning Air Emissions Data Request (Request for Information Number 186). September
4, 2012.
American Meteorological Society (AMS). 2009. Glossary of Meteorology. Website:
(http://amsglossary.allenpress.com/glossary/search?id=climate-change1) accessed on
April 11, 2011.
AMS. See American Meteorological Society.
Andreae, M.O. and P. Merlet, 2001. Emission of Trace Gases and Aerosols from Biomass
Burning. Website: (http://www.nifc.gov/smoke/documents/Emissions_Trace_Gas_
from_Biomass_Burning.pdf) accessed on September 4, 2012.
California Air Resources Board (CARB). 1988. Method Used to Develop a Size-Segregated
Particulate Matter Inventory Profile 391 - Road and Building Construction Dust.
California Air Resources Board (CARB). 2006. EMFAC 2007 Version 2.30 Calculating Emission
Inventories for Vehicles in California.
ENSR. 2008. Prudhoe Bay Unit Ambient Air Quality Monitoring Network Final Data Report
January through December 2007.
EPA. See U.S. Environmental Protection Agency.
Intergovernmental Panel on Climate Control (IPCC). 1990-2007. IPCC Assessment Reports,
Climate Change 1990, 1995, 2001, 2007 (Reports 1-4). Website: (http://www.ipcc.ch/
publications_and_data/publications_and_data_reports.htm) accessed on April 11, 2011.
IPCC. See Intergovernmental Panel on Climate Control.

Alaska Stand Alone Gas Pipeline 5.16-39 Final EIS
Midwest Research Institute (MRI). 2006. Background Document for Revisions to Fine Fraction
Ratios Used for AP-42 Fugitive Dust Emission Factors. Website:
(http://www.epa.gov/ttnchie1/ap42/ch13/bgdocs/b13s02.pdf).
Santa Barbara Air Pollution Control District (SBAPCD). 1997. Table 1 - Construction
Equipment Uncontrolled Emission Factors. Website:
(http://www.sbcapcd.org/eng/tech/apcd-24.pdf).
United Nations Framework Convention on Climate Change (UNFCCC). 1995. IPCC Second
Assessment. Climate Change 1995.
United Nations Framework Convention on Climate Change (UNFCCC). 2001. IPCC Third
Assessment. Climate Change 2001.
United Nations Framework Convention on Climate Change (UNFCCC). 2007. IPCC Fourth
Assessment. Climate Change 2007.
United Nations Framework Convention on Climate Change (UNFCCC). 2009. Glossary of
Climate Change Acronyms. Website: (http://unfccc.int/essential_background/glossary/
items/3666.php#G) accessed on April 11, 2011.
UNFCCC. See United Nations Framework Convention on Climate Change.
U.S. Environmental Protection Agency (EPA). 1993. Compilation of Air Pollutant Emission
Factors (AP-42), Section 13.2.3.3. Website: (http://www.epa.gov/ttnchie1/ap42/ch13/
final/c13s02-3.pdf).
U.S. Environmental Protection Agency (EPA). 2010a. Inventory of U.S. Greenhouse Gas
Emissions and Sinks: 1990-2008. Website: (http://epa.gov/climatechange/emissions
/usinventoryreport.html) accessed on April 11, 2011.
U.S. Environmental Protection Agency (EPA). 2010b. State CO2 Emissions from Fossil Fuel
Combustion, 1990-2010. Website (http://www.epa.gov/statelocalclimate/resources
/state_energyco2inv.html) accessed on April 12, 2011 and September 6, 2012.
U.S. Environmental Protection Agency (EPA). 2010c. National Ambient Air Quality Standards.
Website: (http://www.epa.gov/air/criteria.html) accessed on May 6, 2011.
U.S. Environmental Protection Agency (EPA). 2010d. Air Data. Website:
(http://www.epa.gov/air/data/reports.html) accessed on April 15, 2011.
U.S. Environmental Protection Agency (EPA). 2011. Section 107 Attainment Status
Designation. Website: (http://ecfr.gpoaccess.gov/cgi/t/text/text-
idx?c=ecfr&sid=6af585ba943f0b18c5184d7429d77e19&rgn=div8&view=text&node=40:1
7.0.1.1.1.3.1.3&idno=40) accessed on May 6, 2011.
Alaska Stand Alone Gas Pipeline 5.16-40 Final EIS
U.S. Geological Survey (USGS). 2010. Ground Water Atlas of the United States. Alaska.
Hawaii, Puerto Rico and the U.S. Virgin Islands. HA 730-N. Website:
(http://pubs.usgs.gov/ha/ha730/ch_n/N-AKtext1.html) accessed on April 11, 2011.
USGS. See U.S. Geological Survey.

Alaska Stand Alone Gas Pipeline
5.17 NOISE
Final EIS
Alaska Stand Alone Gas Pipeline 5.17-1 Final EIS
5.17 NOISE
5.17.1 Affected Environment
The ambient sound level of a region is defined by the total noise generated within the specific
environment and is usually comprised of sound emanating from natural and artificial sources.
At any location, both the magnitude and frequency of environmental noise may vary
considerably over the course of the day and throughout the week. This variation is caused in
part by changing weather conditions and the effects of seasonal vegetative cover. The existing
noise levels in the proposed Project area are described below.
5.17.1.1 Acoustics Principles
Sound is mechanical energy transmitted by pressure waves in a compressible or
incompressible medium such as air or water, respectively. When sound becomes excessive,
annoying, or unwanted, it is referred to as noise. Noise may be continuous (constant noise with
a steady decibel level), steady (constant noise with a fluctuating decibel level), impulsive
(having a high peak of short duration), stationary (occurring from a fixed source), intermittent
(occurring at the same rate), or transient (occurring at different rates). Noise levels are
quantified using units of decibels (dB). The decibel is defined as ten times the base 10
logarithm of the ratio between the two quantities of sound pressure level (SPL) squared, or:
SPL = 10 log (p2/po2) = 20 log (p/po) dB
Where p is the sound pressure being measured and po is the reference sound pressure (in air
0.0002 microbar (µbar) or 2x10⁻⁵ Newtons per square meter (N/m2), in water 0.00001 µbar or
1x10⁻⁶ N/m2). Sound pressure level (SPL, µbar, 0.1 N/m2) attenuates with respect to the inverse
distance law, where sound pressure is inversely proportional to the distance from the noise
source (EPA 1974, Plog 1988).
Two measurements used by local, state, and federal agencies which relate the time-varying
quality of environmental noise to its known effect on people are: (1) the 24-hour equivalent
sound level (LEQ(24)); and (2) the day-night sound level (LDN). The LEQ(24) quantifier is the
level of steady sound with the same total (equivalent) energy as the time-varying sound of
interest, averaged over a 24-hour period. The LDN quantifier is the LEQ(24) with 10 decibels on
the A-weighted decibel scale (dBA) added to nighttime sound levels between the hours of 10
p.m. and 7 a.m. to account for people’s greater sensitivity to sound during nighttime hours. The
10th percentile-exceeded sound level, L10 (L50, L90 can be used also), is the A-weighted sound
level which happens 10 percent or more of the time of the measurement (or 50 percent, 90
percent in case of L50, L90, respectively [EPA 1974]).
In 1974, the Environmental Protection Agency (EPA) published Information on Levels of
Environmental Noise Requisite to Protect Public Health and Welfare with an Adequate Margin of
Safety. This document provides information for state and local agencies to use in developing

Alaska Stand Alone Gas Pipeline 5.17-2 Final EIS
their ambient noise standards. However, the state of Alaska and cities in which the proposed
Project is located have yet to establish any noise or vibration regulations that specify acceptable
community levels.
The EPA document identified outdoor and indoor noise levels to protect public health and
welfare. A LEQ(24) of 70 dBA was identified as the level of environmental noise that would not
result in any measurable hearing loss over a lifetime. A LDN of 55 dBA outdoors and a LDN of
45 dBA indoors was identified as noise thresholds that would prevent activity interference or
annoyance. These levels are not “peak” levels but are 24-hour averages over several years.
Occasional high levels of noise may occur. A LDN of 55 dBA is equivalent to a continuous noise
level of 48.6 dBA. Examples of typical noise levels measured at a typical distance from the
source are as follows (EPA 1974):
Quiet room: 28–33 dBA
Computer: 37–45 dBA
Refrigerator: 40–43 dBA
Forced hot air heating system: 42–52 dBA
Microwave: 55–59 dBA
Clothes dryer: 56–58 dBA
Clothes washer: 65–70 dBA
Phone: 66–75 dBA
Garbage disposal: 76–83 dBA
Hair dryer: 80-95 dBA
Weed whacker: 94–96 dBA
The following relationships occur with regard to increases in noise measured on the A-weighted
decibel scale (EPA 1974):
A change of 1 dBA cannot be perceived by humans, except in carefully controlled
laboratory environments;
Outside of the laboratory, a 3 dBA change is considered a just-perceivable difference by
humans;
A change in level of at least 5 dBA is required before any noticeable change in human
response would be expected; and
A 10 dBA change is subjectively heard as approximately a doubling in loudness and can
cause an adverse response.
According to the National Institutes of Health, National Institute on Deafness and
Communication Disorder (NIDCD), Noise-Induced Hearing Loss (NIHL) can occur when one is
Alaska Stand Alone Gas Pipeline 5.17-3 Final EIS
exposed to harmful noise. Exposure to sounds that are too loud or loud sounds that last a long
time can cause damage to sensitive structures, called hair cells, in the inner ear. Once
damaged, the hair cells cannot grow back (NIDCD 2008).
Sources of noise that can cause NIHL include motorcycles, firecrackers, and small firearms, all
emitting sounds from 120 to 150 dBA. In addition, long or repeated exposure to sounds at or
above 85 dBA can cause hearing loss. The louder the sound, the shorter the time period before
NIHL can occur. Sounds of less than 75 dBA, even after long exposure, are unlikely to cause
hearing loss. Although being aware of decibel levels is an important factor in protecting one’s
hearing, distance from the source of the sound and duration of exposure to the sound are
equally important (NIDCD 2008).
5.17.1.2 Ground Vibration
Ground-borne vibration consists of rapidly fluctuating motions within the ground that have an
average motion of zero. The effects of ground-borne vibrations typically cause a nuisance only
to people, but at extreme vibration levels, damage to buildings may occur. Although ground-
borne vibration can be felt outdoors, it is typically an annoyance only to people indoors, where
the associated effects of the shaking of a building can be notable and because people are
moving around less indoors (e.g., seated). Induced ground-borne noise is an effect of ground-
borne vibration and only exists indoors, since it is produced from noise radiated from the motion
of the walls and floors of a room and may consist of the rattling of windows or dishes on
shelves. Although the perceptibility threshold is about 65 VdB (vibration decibels), human
response to vibration is not usually significant unless the vibration exceeds 70 VdB with the
threshold of potential architectural damage to fragile structures at about 100 VdB. Human
response to different levels of ground-borne noise and vibration is as follows (FTA 2006):
65 VdB produces a noise level between 25 (low frequency) and 40 dBA (high
frequency). Approximate threshold of perception for many humans. Low-frequency
sound usually inaudible, mid-frequency sound excessive for quiet sleeping areas;
75 VdB produces a noise level between 35 (low frequency) and 50 dBA (high
frequency). Approximate dividing line between barely perceptible and distinctly
perceptible. Many people find transit vibration at this level annoying. Low-frequency
noise acceptable for sleeping areas, mid-frequency noise annoying in most quiet
occupied areas; and
85 VdB produces a noise level between 45 (low frequency) and 60 dBA (high
frequency). Vibration acceptable only if there are an infrequent number of events per
day. Low-frequency noise annoying for sleeping areas, mid-frequency noise annoying
even for infrequent events with institutional land uses such as schools and churches.

Alaska Stand Alone Gas Pipeline 5.17-4 Final EIS
5.17.1.3 Existing Noise Environment
The proposed Project would be constructed in Alaska from the North Slope to Cook Inlet. Most
of the area adjacent to the proposed Project pipeline is undeveloped and sparsely populated
and, therefore, ambient noise levels are generally low. However, other areas of the pipeline
would be located in more urban and industrial areas with higher ambient noise levels.
Consequently, it is estimated that the existing ambient noise level in the proposed Project area
is in the range of 35 dBA (wilderness areas) to 51 dBA (wooded residential) and 59 dBA (urban
residential) (EPA 1978). These are assumed noise levels. Furthermore, the background
vibration velocity level is estimated to be less than 50 VdB (FTA 2006).
Sensitive receptors are those populations that are more susceptible to the effects of noise than
the population at large and those located in close proximity to localized sources of noise. More
than 95 percent of the proposed Project is located out of range of any sensitive receptor.
Sensitive noise receptors within 5 miles of the proposed Project’s pipeline facilities are shown in
Table 5.17-1.
TABLE 5.17-1 Sensitive Noise Receptors within 5 Miles of Proposed Project Pipeline Facilitiesa
Town Population
Mainline
(miles)
Fairbanks Lateral
(miles)
Denali National Park
Route Variation
(miles)
Wiseman 19 0.7 181.5 257.1
Livengood 27 4.4 43.5 124.0
Nenana 379 0.2 16.1 57.5
Ester 1931 20.3 3.9 80.9
College 12717 26.3 1.7 83.9
Anderson 319 0.9 30.9 42.9
Fairbanks 31053 29.3 4.8 83.8
Ferry 28 1.0 58.3 15.1
Healy 960 1.1 63.0 8.2
McKinley Park 136 3.5 73.6 2.3
Cantwell 213 0.9 94.9 12.0
Talkeetna 1112 4.1 174.0 94.9
Willow 2375 1.3 212.6 131.5
Prudhoe Bay 5 3.8 371.4 453.7
a Distances derived from spatial near analysis of cities/towns (ESRI 2000) located within 5 miles of the proposed pipeline.
Sensitive noise receptors within 5 miles of the proposed Project’s aboveground facilities are
shown in Table 5.17-2.
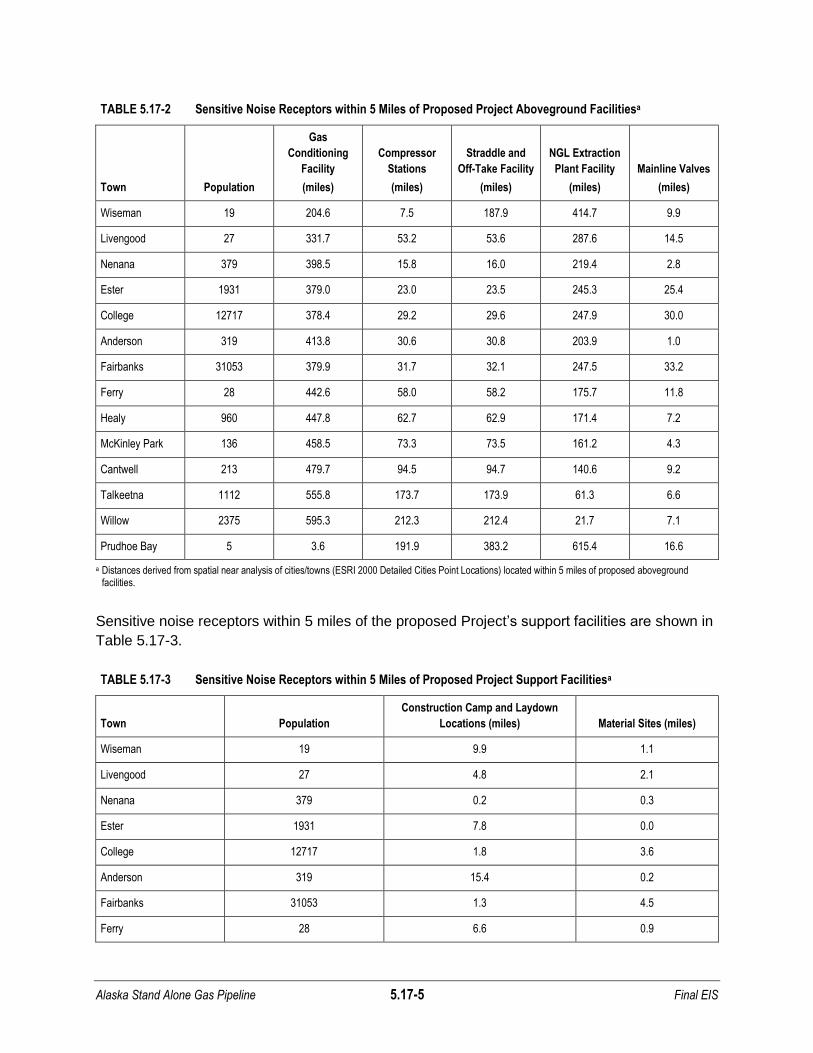
Alaska Stand Alone Gas Pipeline 5.17-5 Final EIS
TABLE 5.17-2 Sensitive Noise Receptors within 5 Miles of Proposed Project Aboveground Facilitiesa
Town Population
Gas
Conditioning
Facility
(miles)
Compressor
Stations
(miles)
Straddle and
Off-Take Facility
(miles)
NGL Extraction
Plant Facility
(miles)
Mainline Valves
(miles)
Wiseman 19 204.6 7.5 187.9 414.7 9.9
Livengood 27 331.7 53.2 53.6 287.6 14.5
Nenana 379 398.5 15.8 16.0 219.4 2.8
Ester 1931 379.0 23.0 23.5 245.3 25.4
College 12717 378.4 29.2 29.6 247.9 30.0
Anderson 319 413.8 30.6 30.8 203.9 1.0
Fairbanks 31053 379.9 31.7 32.1 247.5 33.2
Ferry 28 442.6 58.0 58.2 175.7 11.8
Healy 960 447.8 62.7 62.9 171.4 7.2
McKinley Park 136 458.5 73.3 73.5 161.2 4.3
Cantwell 213 479.7 94.5 94.7 140.6 9.2
Talkeetna 1112 555.8 173.7 173.9 61.3 6.6
Willow 2375 595.3 212.3 212.4 21.7 7.1
Prudhoe Bay 5 3.6 191.9 383.2 615.4 16.6
a Distances derived from spatial near analysis of cities/towns (ESRI 2000 Detailed Cities Point Locations) located within 5 miles of proposed aboveground facilities.
Sensitive noise receptors within 5 miles of the proposed Project’s support facilities are shown in
Table 5.17-3.
TABLE 5.17-3 Sensitive Noise Receptors within 5 Miles of Proposed Project Support Facilitiesa
Town Population
Construction Camp and Laydown
Locations (miles) Material Sites (miles)
Wiseman 19 9.9 1.1
Livengood 27 4.8 2.1
Nenana 379 0.2 0.3
Ester 1931 7.8 0.0
College 12717 1.8 3.6
Anderson 319 15.4 0.2
Fairbanks 31053 1.3 4.5
Ferry 28 6.6 0.9

Alaska Stand Alone Gas Pipeline 5.17-6 Final EIS
TABLE 5.17-3 Sensitive Noise Receptors within 5 Miles of Proposed Project Support Facilitiesa
Town Population
Construction Camp and Laydown
Locations (miles) Material Sites (miles)
Healy 960 0.9 0.8
McKinley Park 136 10.8 3.6
Cantwell 213 0.1 0.8
Talkeetna 1112 10.7 0.8
Willow 2375 0.7 0.5
Prudhoe Bay 5 5.2 8.0
a Distances derived from spatial near analysis of cities/towns (ESRI 2000 Detailed Cities Point Locations) located within 5 miles of proposed support facilities.
5.17.2 Environmental Consequences
The environmental consequences for noise for the proposed Project and alternatives are
described below.
5.17.2.1 No Action Alternative
Under the No Action Alternative, the proposed Project would not be constructed or operational.
Consequently, no effects to noise would occur.
5.17.2.2 Proposed Action
Noise effects for the proposed Project fall into two categories: temporary impacts resulting from
construction, and long-term or permanent impacts resulting from operation of the facilities. The
proposed action includes the following route variations: Yukon River and Denali National Park
Route.
Pipeline Facilities
Mainline
Construction
Construction of the proposed Project would be similar to other pipeline projects in terms of
schedule, equipment used, and types of activities. Construction would increase noise levels in
the vicinity of proposed Project activities, and the noise levels would vary during the
construction period, depending on the construction phase. Construction noise levels are rarely
steady in nature but instead fluctuate depending on the number and type of equipment in use at
any given time. There would be times when no large equipment is operating and noise would
be at or near ambient levels. In addition, construction-related sound levels experienced by a
noise sensitive receptor in the vicinity of construction activity would be a function of distance.

Alaska Stand Alone Gas Pipeline 5.17-7 Final EIS
Table 5.17-4 lists noise levels produced by typical construction machinery at 50 feet in units of
the A-weighted decibel scale (dBA).
TABLE 5.17-4 Estimated Maximum Noise Levels for Construction Equipment (dBA)
Equipment 50 feet
Pickup truck 55
Welding (or cutting) torch 73
Pump (dewatering) 77
Backhoe (with loader) 80
Compactor (ground) 80
Compressor (air) 80
Concrete pump truck 82
Generator (general purpose utility) 82
Excavator (hydraulic) 85
Dozer (crawler tractor) 85
Grader 85
Scraper 85
Concrete mixer truck 85
Crane 85
Pneumatic tool 85
Jackhammer 85
Rock drill 85
Paver (asphalt) 85
Pile driver (impact) 95
dBA = sound level from A-weighted decibel scale.
Source: DOT FHWA 2006.
Ground-borne vibration would also occur in the immediate vicinity of construction activities,
particularly if rock drilling, pile driving, or blasting is required. Table 5.17-5 lists vibration levels
produced by typical construction machinery and activities at 25 feet in units of vibration decibels
(VdB).
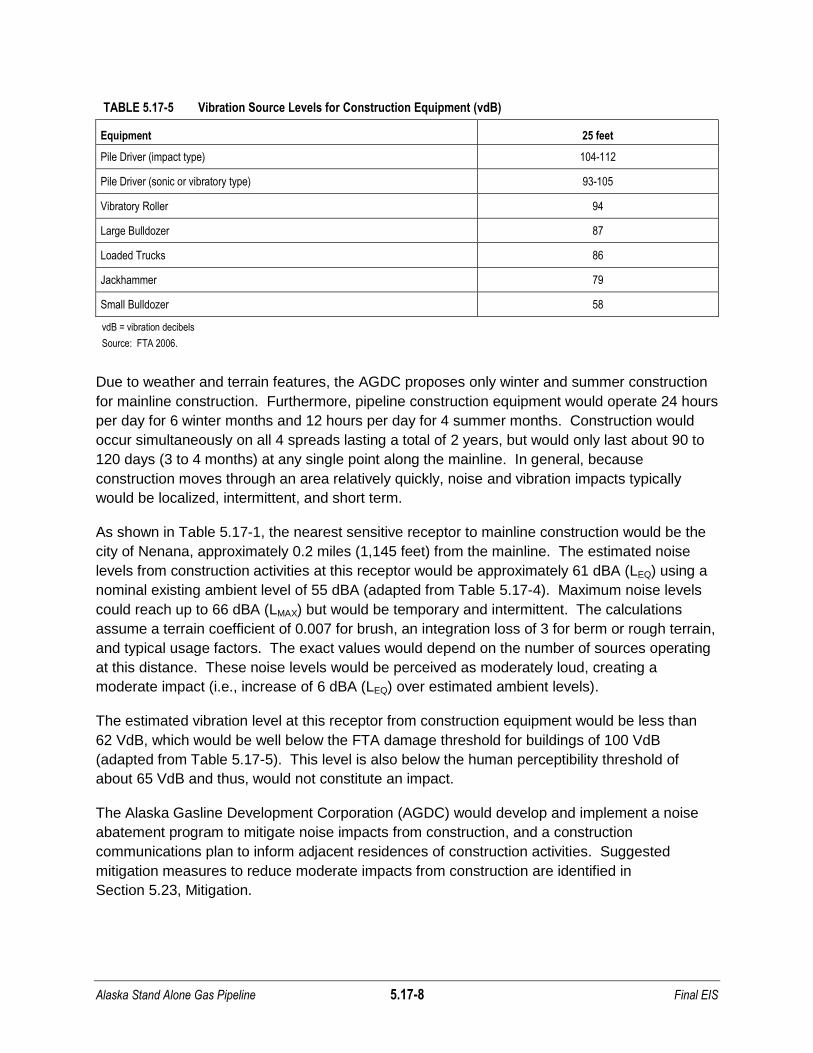
Alaska Stand Alone Gas Pipeline 5.17-8 Final EIS
TABLE 5.17-5 Vibration Source Levels for Construction Equipment (vdB)
Equipment 25 feet
Pile Driver (impact type) 104-112
Pile Driver (sonic or vibratory type) 93-105
Vibratory Roller 94
Large Bulldozer 87
Loaded Trucks 86
Jackhammer 79
Small Bulldozer 58
vdB = vibration decibels
Source: FTA 2006.
Due to weather and terrain features, the AGDC proposes only winter and summer construction
for mainline construction. Furthermore, pipeline construction equipment would operate 24 hours
per day for 6 winter months and 12 hours per day for 4 summer months. Construction would
occur simultaneously on all 4 spreads lasting a total of 2 years, but would only last about 90 to
120 days (3 to 4 months) at any single point along the mainline. In general, because
construction moves through an area relatively quickly, noise and vibration impacts typically
would be localized, intermittent, and short term.
As shown in Table 5.17-1, the nearest sensitive receptor to mainline construction would be the
city of Nenana, approximately 0.2 miles (1,145 feet) from the mainline. The estimated noise
levels from construction activities at this receptor would be approximately 61 dBA (LEQ) using a
nominal existing ambient level of 55 dBA (adapted from Table 5.17-4). Maximum noise levels
could reach up to 66 dBA (LMAX) but would be temporary and intermittent. The calculations
assume a terrain coefficient of 0.007 for brush, an integration loss of 3 for berm or rough terrain,
and typical usage factors. The exact values would depend on the number of sources operating
at this distance. These noise levels would be perceived as moderately loud, creating a
moderate impact (i.e., increase of 6 dBA (LEQ) over estimated ambient levels).
The estimated vibration level at this receptor from construction equipment would be less than
62 VdB, which would be well below the FTA damage threshold for buildings of 100 VdB
(adapted from Table 5.17-5). This level is also below the human perceptibility threshold of
about 65 VdB and thus, would not constitute an impact.
The Alaska Gasline Development Corporation (AGDC) would develop and implement a noise
abatement program to mitigate noise impacts from construction, and a construction
communications plan to inform adjacent residences of construction activities. Suggested
mitigation measures to reduce moderate impacts from construction are identified in
Section 5.23, Mitigation.

Alaska Stand Alone Gas Pipeline 5.17-9 Final EIS
Yukon River Crossing Options
There are three options being considered for the proposed Project to cross the Yukon River
(see construction details of these options in Section 2, Project Description):
The Applicant’s Preferred Option would be to cross the Yukon River via a new
standalone pipeline suspension bridge.
Option 2 would be to hang the pipeline below the surface of the existing E.L. Patton
Bridge on the Dalton Highway.
Option 3 would be to utilize a horizontal directional drill (HDD) crossing method to cross
underneath the Yukon River. The feasibility of a HDD crossing is unknown at this time
due to limited soils information. If feasible, the HDD crossing would be at the same
location as the proposed suspension bridge.
There would potentially be reduced sources and duration of noise related to construction
equipment if the existing bridge was utilized and construction of a new pipeline suspension
bridge or HDD crossing method were not required. However, the differences would be
negligible.
Operations and Maintenance
With respect to natural gas pipeline operations, gas traveling through a buried pipeline would
not emit audible noise above the surface or a perceptible level of vibration. In addition, noise
levels from routine inspection and maintenance activities associated with the proposed mainline
would not result in perceptible noise or vibration level increases at the nearest sensitive
receptor. Consequently, no impacts would occur.
Fairbanks Lateral
Construction
Pipeline construction equipment would operate 12 hours per day for 4 summer months on the
Fairbanks Lateral construction. In general, because construction moves through an area
relatively quickly, noise impacts typically would be localized, intermittent, and short term.
According to Table 5.17-1, the nearest sensitive receptor to Fairbanks Lateral construction
would be the city of College, approximately 1.7 miles (8,769 feet) from the Fairbanks Lateral.
The estimated noise levels from construction activities at this receptor would be approximately
55 dBA (LEQ) using a nominal existing ambient level of 55 dBA (adapted from Table 5.17-4).
The calculation assumes a terrain coefficient of 0.007 for brush, an integration loss of 3 for berm
or rough terrain, and typical usage factors. The exact value would depend on the number of
sources operating at this distance. This noise level would be perceived as insignificant, thus
creating no noise impact (i.e., increase of 0 dBA over estimated ambient levels).
The estimated vibration level at this receptor from construction equipment would be less than
36 VdB, which would be well below the FTA damage threshold for buildings of 100 VdB

Alaska Stand Alone Gas Pipeline 5.17-10 Final EIS
(adapted from Table 5.17-5). This level is also below the human perceptibility threshold of
about 65 VdB and thus, would not constitute an impact.
Operations and Maintenance
With respect to natural gas pipeline operations, gas traveling through a buried pipeline would
not emit audible noise above the surface or a perceptible level of vibration. In addition, noise
levels from routine inspection and maintenance activities associated with the proposed
Fairbanks Lateral would not result in perceptible noise or vibration level increases at the nearest
sensitive receptor. Consequently, no impacts would occur.
Aboveground Facilities
Aboveground facilities consist of the following: gas conditioning facility (GCF), compressor
stations, straddle and off-take facility, Cook Inlet natural gas liquids (NGL) extraction plant
facility, and mainline valves and pig1 launcher/receivers. In general, noise impacts from
construction activities at these facilities would be localized, intermittent, and short term.
Once the aboveground facilities are commissioned and operating normally, the new ambient
sound level at the sites would be measured as a logarithmic sum of background and proposed
Project noise. Although noise levels from the industrial equipment at the aboveground facilities
are currently unknown, it is estimated at approximately 85 to 95 dBA at 50 feet. Consequently,
the estimated noise levels from operations at the nearest sensitive receptor from each of the
aboveground facilities would be approximately 55 dBA (LEQ) using a nominal existing ambient
level of 55 dBA (adapted from Table 5.17-1), except as noted in the Mainline Valves and Pig
Launcher section below. The calculation assumes a terrain coefficient of 0.007 for brush, an
integration loss of 3 for berm or rough terrain, and typical usage factors. The exact value would
depend on the number of sources operating at the facility’s respective distance. This noise level
would be perceived as insignificant, thus creating no noise impact (i.e., increase of 0 to 1 dBA
over estimated ambient levels). Furthermore, vibration levels from operation at this distance
would be insignificant.
Gas Conditioning Facility (GCF)
Construction
According to Table 5.17-2, the nearest sensitive receptor to the GCF construction would be the
Prudhoe Bay Oil Field Complex (including the community of Deadhorse), approximately
3.6 miles (18,981 feet) from the facility. The estimated noise levels from construction activities
at this receptor would be approximately 55 dBA (LEQ) using a nominal existing ambient level of
55 dBA (adapted from Table 5.17-4). The calculation assumes a terrain coefficient of 0.007 for
brush, an integration loss of 3 for berm or rough terrain, and typical usage factors. The exact
value would depend on the number of sources operating at this distance. This noise level would
be perceived as insignificant, thus creating no noise impact (i.e., increase of 0 dBA over
estimated ambient levels).
1 Pig refers to a pipeline inspection gage.

Alaska Stand Alone Gas Pipeline 5.17-11 Final EIS
The estimated vibration level at this receptor from construction equipment would be less than
26 VdB, which would be well below the FTA damage threshold for buildings of 100 VdB
(adapted from Table 5.17-5). This level is also below the human perceptibility threshold of
about 65 VdB and, thus, would not constitute an impact.
Operations and Maintenance
The GCF would be installed on approximately 70 acres and would contain several modular
buildings that would house equipment, utilities, workspaces, and personnel. Primary and
backup power generation, natural gas compressors, and heating and refrigerant equipment in
addition to other ancillary facilities would be located at this facility to drive the natural gas
conditioning process. Noise and vibration levels from operations would be perceived as
insignificant, as explained in the Aboveground Facilities section above.
Compressor Stations
Construction
According to Table 5.17-2, the nearest sensitive receptor to compressor station construction
would be the city of Wiseman, approximately 7.5 miles (39,511 feet) from the station. The
estimated noise levels from construction activities at this receptor would be approximately
55 dBA (LEQ) using a nominal existing ambient level of 55 dBA (adapted from Table 5.17-4).
The calculation assumes a terrain coefficient of 0.007 for brush, an integration loss of 3 for berm
or rough terrain, and typical usage factors. The exact value would depend on the number of
sources operating at this distance. This noise level would be perceived as insignificant, thus
creating no noise impact (i.e., increase of 0 dBA over estimated ambient levels).
The estimated vibration level at this receptor from construction equipment would be less than
16 VdB, which would be well below the FTA damage threshold for buildings of 100 VdB
(adapted from Table 5.17-5). This level is also below the human perceptibility threshold of
about 65 VdB and, thus, would not constitute an impact.
Operations and Maintenance
Compressor stations are used to increase the pressure and keep the flow of natural gas moving
through the pipeline at an appropriate rate and typically contain gas turbine-driven centrifugal
compressors. Additional facilities would include gas and utility piping, a filter
separator/scrubber, refrigerant condensers, a helicopter port, communication tower, tank farm,
power generators, and various control and compressor buildings. Noise and vibration levels
from operations would be perceived as insignificant, as explained in the Aboveground Facilities
section above.
Straddle and Off-Take Facility
Construction
The nearest sensitive receptor to straddle and off-take facility construction would be the city of
Nenana, approximately 16.0 miles (84,454 feet) from the facility (see Table 5.17-2). The
Alaska Stand Alone Gas Pipeline 5.17-12 Final EIS
estimated noise levels from construction activities at this receptor would be approximately 55
dBA (LEQ) using a nominal existing ambient level of 55 dBA (see Table 5.17-4). The calculation
assumes a terrain coefficient of 0.007 for brush, an integration loss of 3 for berm or rough
terrain, and typical usage factors. The exact value would depend on the number of sources
operating at this distance. This noise level would be perceived as insignificant, thus creating no
noise impact (i.e., increase of 0 dBA over estimated ambient levels).
The estimated vibration level at this receptor from construction equipment would be less than 6
VdB, which would be well below the FTA damage threshold for buildings of 100 VdB (see Table
5.17-5). This level is also below the human perceptibility threshold of about 65 VdB and, thus,
would not constitute an impact.
Operations and Maintenance
The straddle and off-take facility would be installed at the proposed Fairbanks Lateral tie-in to
provide utility grade natural gas, primarily through the removal of NGLs, prior to sending natural
gas into the Fairbanks Lateral. Noise and vibration levels from operations would be perceived
as insignificant, as explained in the Aboveground Facilities section above.
Cook Inlet Natural Gas Liquids (NGL) Extraction Plant Facility
Construction
According to Table 5.17-2, the nearest sensitive receptor to NGL extraction plant facility
construction would be the city of Willow, approximately 21.7 miles (114,354 feet) from the
facility. The estimated noise levels from construction activities at this receptor would be
approximately 55 dBA (LEQ) using a nominal existing ambient level of 55 dBA (adapted from
Table 5.17-4). The calculation assumes a terrain coefficient of 0.007 for brush, an integration
loss of 3 for berm or rough terrain, and typical usage factors. The exact value would depend on
the number of sources operating at this distance. This noise level would be perceived as
insignificant, thus creating no noise impact (i.e., increase of 0 dBA over estimated ambient
levels).
The estimated vibration level at this receptor from construction equipment would be less than 2
VdB, which would be well below the FTA damage threshold for buildings of 100 VdB (adapted
from Table 5.17-5). This level is also below the human perceptibility threshold of about 65 VdB
and, thus, would not constitute an impact.
Operations and Maintenance
A NGL extraction plant facility would remove propane, ethane, butane, and pentane NGLs using
an inlet and liquid separators, glycol dehydrator, and potentially a storage facility. Noise and
vibration levels from operations would be perceived as insignificant, as explained in the
Aboveground Facilities section above.

Alaska Stand Alone Gas Pipeline 5.17-13 Final EIS
Mainline Valves and Pig Launcher/Receivers
Construction
As shown in Table 5.17-2, the nearest sensitive receptor to mainline valve construction would
be the city of Anderson, approximately 1.0 mile (5,055 feet) from the valve. Pig
launcher/receivers would be installed at all aboveground facilities; therefore, impacts associated
with construction would already be accounted for. The estimated noise levels from construction
activities at this receptor would be approximately 55 dBA (LEQ) using a nominal existing ambient
level of 55 dBA (see Table 5.17-4). The calculation assumes a terrain coefficient of 0.007 for
brush, an integration loss of 3 for berm or rough terrain, and typical usage factors. The exact
value would depend on the number of sources operating at this distance. This noise level would
be perceived as insignificant, thus creating no noise impact (i.e., increase of 0 dBA over
estimated ambient levels).
The estimated vibration level at this receptor from construction equipment would be less than
42 VdB, which would be well below the FTA damage threshold for buildings of 100 VdB (see
Table 5.17-5). This level is also below the human perceptibility threshold of about 65 VdB and,
thus, would not constitute an impact.
Operations and Maintenance
The AGDC did not propose any noise or vibration producing stationary equipment for operation
of the mainline valves. In addition, mobile sources used during facility operations and
maintenance would not result in perceptible noise or vibration level increases at the nearest
sensitive receptor. However, noise impacts would result from pressure relief valves and
pipeline blowdowns. These activities can produce a noise level of over 120 dBA at 50 feet from
the source each time the valve releases. Pressure relief valves are located at the aboveground
facilities and are activated when pressure goes above a set limit. These are emergency relief
valves and their operation would be in a “rare event” scenario (i.e., emergency). Pipeline
blowdowns would be used in the “rare event” that a major repair needs to take place. A
blowdown would occur in a segment of the pipe that would need the repair. Both of these
scenarios are “rare events” that would not occur routinely as part of operations and
management procedures.
The estimated noise level at the nearest sensitive receptor would be approximately 56 dBA
(LEQ) using a nominal existing ambient level of 55 dBA. Maximum noise levels could reach up
to 66 dBA (LMAX) but would be temporary and intermittent. The calculations assume a terrain
coefficient of 0.007 for brush, an integration loss of 3 for berm or rough terrain, and typical
usage factors. These noise levels would be perceived as insignificant, thus creating no noise
impact (i.e., increase of 1 dBA (LEQ) over estimated ambient levels). Mitigation measures to
reduce peak noise levels are identified in Section 5.23, Mitigation.

Alaska Stand Alone Gas Pipeline 5.17-14 Final EIS
Support Facilities
Operations and Maintenance Buildings
Construction
Operations and maintenance buildings would be installed at aboveground facilities; therefore,
impacts associated with construction would already be accounted for.
Operations and Maintenance
Operations and maintenance buildings would be installed at aboveground facilities; therefore,
impacts associated with operations would already be accounted for.
Construction Camps and Pipeline Yards
Construction
As shown in Table 5.17-3, the nearest sensitive receptor to construction camp and pipeline yard
construction would be the city of Cantwell, approximately 0.1 mile (552 feet) from the
camp/yard. The estimated noise levels from construction activities at this receptor would be
approximately 68 dBA (LEQ) using a nominal existing ambient level of 55 dBA (adapted from
Table 5.17-1). Maximum noise levels could reach up to 73 dBA (LMAX) but would be temporary
and intermittent. The calculations assume a terrain coefficient of 0.007 for brush, an integration
loss of 3 for berm or rough terrain, and typical usage factors. The exact values would depend
on the number of sources operating at this distance. These noise levels would be perceived as
significantly loud, creating a significant impact (i.e., increase of 13 dBA (LEQ) over estimated
ambient levels).
The estimated noise levels from camp operation at this receptor would be approximately 57 dBA
(LEQ) using a nominal existing ambient level of 55 dBA (adapted from Table 5.17-4). Maximum
noise levels could reach up to 59 dBA (LMAX) but would be temporary and intermittent. The
calculations assume a terrain coefficient of 0.007 for brush, an integration loss of 3 for berm or
rough terrain, and typical usage factors. The exact values would depend on the number of
sources operating at this distance. These noise levels would be perceived as insignificant (i.e.,
increase of 2 dBA (LEQ) over estimated ambient levels).
The estimated vibration level at this receptor from construction and camp operations equipment
would be less than 72 VdB, which would be well below the FTA damage threshold for buildings
of 100 VdB (adapted from Table 5.17-5). People may feel minor ground movement, but
because the construction activities would be temporary and there would be negligible potential
for damage to fragile structures, this would not constitute an effect.
The AGDC would develop and implement a noise abatement program to mitigate construction
noise impacts and a construction communications plan to inform adjacent residences of
construction activities. Additional mitigation measures to reduce significant impacts from
construction are identified in Section 5.23, Mitigation.

Alaska Stand Alone Gas Pipeline 5.17-15 Final EIS
Operations and Maintenance
Construction camps and pipeline yards would no longer be used during the operations phase of
the proposed Project. Consequently, no noise or vibration impacts would occur.
Material Sites
Construction
According to Table 5.17-3, the nearest sensitive receptor to material site construction would be
the city of Ester, approximately 0.04 mile (232 feet) from the site. The estimated noise levels
from construction activities at this receptor would be approximately 76 dBA (LEQ) using a
nominal existing ambient level of 55 dBA (see Table 5.17-4). Maximum noise levels could
reach up to 82 dBA (LMAX) but would be temporary and intermittent. The calculations assume a
terrain coefficient of 0.007 for brush, an integration loss of 3 for berm or rough terrain, and
typical usage factors. The exact values would depend on the number of sources operating at
this distance. These noise levels would be perceived as significantly loud, creating a significant
impact (i.e., increase of 21 dBA (LEQ) over estimated ambient levels).
The estimated vibration level at this receptor from construction equipment would be less than
83 VdB, which would be well below the FTA damage threshold for buildings of 100 VdB
(adapted from Table 5.17-5). People may feel minor ground movement, but because the
construction activities would be temporary and there would be negligible potential for damage to
fragile structures; this would not constitute an effect.
The AGDC would develop and implement a noise abatement program to mitigate noise impacts,
and construction communications plan to inform adjacent residences of construction activities.
Additional mitigation measures that would reduce significant impacts are identified in
Section 5.23, Mitigation.
Operations and Maintenance
Material sites would no longer be used during the operations phase of the proposed Project.
Consequently, no noise or vibration impacts would occur.
5.17.2.3 Denali National Park Route Variation
Construction
Pipeline construction equipment would operate 12 hours per day for 4 winter months for Denali
National Park Route Variation construction. In general, because construction moves through an
area relatively quickly, noise impacts typically would be localized, intermittent, and short term.
According to Table 5.17-1, the nearest sensitive receptor to Denali National Park Route
Variation construction would be McKinley Park Village, approximately 2.3 miles (12,403 feet)
from the route. The estimated noise levels from construction activities at this receptor would be
approximately 55 dBA (LEQ) using a nominal existing ambient level of 55 dBA (adapted from
Table 5.17-4). The calculation assumes a terrain coefficient of 0.007 for brush, an integration
loss of 3 for berm or rough terrain, and typical usage factors. The exact value would depend on
Alaska Stand Alone Gas Pipeline 5.17-16 Final EIS
the number of sources operating at this distance. During winter months, the McKinley Park
Village is virtually shutdown; therefore, noise impact on humans would not be anticipated.
These noise levels could be perceived as insignificant, thus creating no noise impact (i.e.,
increase of 0 dBA over estimated ambient levels).
The estimated vibration level at this receptor from construction equipment would be less than
31 VdB, which would be well below the FTA damage threshold for buildings of 100 VdB (see
Table 5.17-5). This level is also below the human perceptibility threshold of about 65 VdB and,
thus, would not constitute an impact.
Operations
With respect to natural gas pipeline operations, gas traveling through a buried pipeline would
not emit audible noise above the surface or a perceptible level of vibration. In addition, noise
levels from routine inspection and maintenance activities associated with the Denali National
Park Route Variation would not result in perceptible noise or vibration level increases at the
nearest sensitive receptor. Consequently, no impacts would occur.
5.17.3 References
DOT FHWA. See U.S. Department of Transportation, Federal Highway Administration.
EPA. See U.S. Environmental Protection Agency.
ESRI. 2010. Detailed Cities Points Locations (cities_dtl.sdc). U.S. National Atlas Cities.
Federal Transit Administration (FTA). 2006. Transit Noise and Vibration Impact Assessment
(FTA-VA-90-1003-06). Website: (http://www.fta.dot.gov/documents/FTA_Noise_
and_Vibration_Manual.pdf) accessed on April 15, 2011.
FTA. See Federal Transit Administration.
National Institute on Deafness and Communication Disorder (NIDCD). 2008. Noise-Induced
Hearing Loss, NIH Pub. No. 97-4233, updated October 2008. Website:
(http://www.nidcd.nih.gov/health/hearing/pages/noise.aspx) accessed December 1, 2011
NIDCD. See National Institute on Deafness and Communication Disorder.
Plog, B. A., Ed. 1988. Fundamentals of Industrial Hygiene 3rd Edition. National Safety
Council, Table 9-b, Page 168.
U.S. Department of Transportation, Federal Highway Administration (DOT FHWA). 2006.
Roadway Construction Noise Model User’s Guide. DOT John A. Volpe National
Transportation Systems Center for FHWA Office of Natural and Human Environment,
Washington, DC.

Alaska Stand Alone Gas Pipeline 5.17-17 Final EIS
U.S. Environmental Protection Agency (EPA). 1974. Information on Levels of Environmental
Noise Requisite to Protect Public Health and Welfare with an Adequate Margin of Safety.
(USEPA 550/9-74-004). Websites: (http://www.nonoise.org/library/levels74/
\levels74.htm; http://www.nonoise.org/library/household/index.htm) accessed
April 15, 2011
U.S. Environmental Protection Agency (EPA). 1978. Protective Noise Levels. (USEPA 550/9-
79-100). Website: (http://nepis.epa.gov) accessed April 15, 2011.

Alaska Stand Alone Gas Pipeline 5.17-18 Final EIS
This page intentionally left blank.

5.18 NAVIGATION RESOURCES
Alaska Stand Alone Gas Pipeline Final EIS
Alaska Stand Alone Gas Pipeline 5.18-1 Final EIS
5.18 NAVIGATION RESOURCES
This section describes navigation resources and navigable waterways that could be affected by
construction and operation of the proposed action and alternatives. Navigable waters are
defined by: waters that provide a channel for commerce and transportation of people and
goods. Sections 5.2, Water Resources, and 5.6, Fish, identify and assess additional potential
impacts to navigable rivers and streams within the proposed Project area.
5.18.1 Regulatory Setting
Federal, state, and local agencies regulate project activities that have a potential to impact
navigable waterways. The jurisdiction over navigable waters belongs to the federal government
rather than states or municipalities. Federal agencies have made navigability determinations
regarding waterways throughout the proposed Project area. Navigability determinations are
implemented through laws and regulations, as described below.
5.18.1.1 Federal Regulations
United States Coast Guard
The United States Coast Guard (USCG) authorizes and issues permits for construction of
bridges and causeways across navigable waterways in accordance with the General Bridge Act
of 1946 (33 United States Code [U.S.C.] 525 et seq.) and Section 9 of the Rivers and Harbors
Act (33 U.S.C. 401). U.S. navigable waterways, as they pertain to the USCG permitting
process, are defined in 33 Code of Federal Regulations (CFR) Part 2.05-25, and include:
Territorial seas of the United States;
Internal waterways of the United States that are subject to tidal influence; and
Internal waterways of the United States not subject to tidal influence that:
Are or have been used, or are or have been susceptible for use, by themselves or in connection with other waterways, as highways for substantial interstate or foreign commerce, notwithstanding natural or man-made obstructions that require portage, or
A governmental or non-governmental body, having expertise in waterway improvement, determines to be capable of improvement at a reasonable cost (a favorable balance between cost and need) to provide, by themselves or in connection with other waterways, highways for substantial interstate or foreign commerce.
This regulatory definition of navigability has been expanded by legal precedent to include
historic and modern use for recreation and tourism (e.g., fishing or sightseeing) or by inflatable
rafts (Alaska v. United States, 662 F.Supp.455 [D. Alaska 1986]; Alaska v. Ahtna, Inc., 892 F.2d
1401 [9th Cir. 1989]).
Alaska Stand Alone Gas Pipeline 5.18-2 Final EIS
Bridges and causeways over waterways meeting the definition of navigable cannot legally be
constructed without prior USCG approval of the plans for and locations of such structures. The
USCG has stated that certain crossings of waterways and their side channels discussed in this
chapter would require individual bridge permits pursuant to Section 9 of the Rivers and Harbors
Act. The USCG anticipates permits would be required for aerial pipeline crossings, permanent
access road vehicle bridges, and temporary construction/detour bridges. Pipelines under the
waterways, although not requiring permits, would still need to be reviewed by the USCG to
ensure impacts to navigation are reduced during construction. The final determination of new
USCG navigable waterways has not yet been completed.
United States Army Corps of Engineers
The United States Army Corps of Engineers (USACE) issues Department of the Army (DA)
permits to authorize certain structures or work in or affecting navigable waters of the United
States pursuant to Section 10 of the Rivers and Harbors Act of 1899 (33 U.S.C. 403)
(hereinafter referred to as Section 10). Certain structures or work in or affecting navigable
waters of the United States are also regulated under other authorities of the DA. These include
discharges of dredged or fill material into waters of the United States, including the territorial
seas, pursuant to Section 404 of the Clean Water Act (CWA [33 U.S.C. 1344; see 33 CFR part
323]) and the transportation of dredged material by vessel for purposes of dumping in ocean
waters, including the territorial seas, pursuant to Section 103 of the Marine Protection, Research
and Sanctuaries Act of 1972, as amended (33 U.S.C. 1413; see 33 CFR part 324). USACE
regulations define navigable waters for the purpose of regulating the discharge of dredge or fill
material into these waterways, the USACE definition of navigability is similar to that of the
USCG, pursuant to 33 CFR Part 329.4, as follows:
Navigable waterways of the United States are those waterways that are subject to
the ebb and flow of the tide and/or are presently used, or have been used in the
past, or may be susceptible for use to transport interstate or foreign commerce. A
determination of navigability, once made, applies laterally over the entire surface of
the waterbody, and is not extinguished by later actions or events which impede or
destroy navigable capacity.
Section 10 requires approval prior to the accomplishment of any work in, over, or under
navigable waters of the United States, or which affects the course, location, condition or
capacity of such waters (USACE 1995).
Environmental Protection Agency
The Environmental Protection Agency (EPA) and the USACE in “Clean Water Act Jurisdiction
Following the U.S. Supreme Court’s Decision in Rapanos v. United States and Carabell v.
United States” guidance (Rapanos guidance) affirm that the EPA and USACE will continue to
assert jurisdiction over “[a]ll waters which are currently used, or were used in the past, or may
be susceptible to use in interstate or foreign commerce, including all waters which are subject to
the ebb and flow of the tide.” 33 C.F.R. § 328.3(a)(1); 40 C.F.R. § 230.3(s)(1). The guidance

Alaska Stand Alone Gas Pipeline 5.18-3 Final EIS
also states that, for purposes of the guidance, these “(a)(1) waters” are the “traditional navigable
waters.” These (a)(1) waters include all of the “navigable waters of the United States,” defined in
33 C.F.R. Part 329 and by numerous decisions of the federal courts, plus all other waters that
are navigable-in-fact (e.g., the Great Salt Lake, UT and Lake Minnetonka, MN).
Section 312 of the CWA sets out the principal framework for domestically regulating sewage
discharges from vessels, and is implemented jointly by the EPA and the USCG. “Sewage” is
defined under the CWA as “human body wastes and the waste from toilets and other
receptacles intended to receive or retain body wastes”, and includes graywater discharges from
commercial vessels (as defined at 33 U.S.C. 1322[a][10]) operating on the Great Lakes. Under
Section 312 of the CWA, vessel sewage is generally controlled by regulating the equipment that
treats or holds the sewage (marine sanitation devices), and through the establishment of areas
in which the discharge of sewage from vessels is not allowed1
Under Section 312 of the CWA, the USCG and the State of Alaska may enforce NDZ
requirements 33 U.S.C. 1322(k). There are currently no NDZ established in EPA Region 10,
which includes the state of Alaska (EPA 2011).
Bureau of Land Management
Since 1978, Bureau of Land Management (BLM) Alaska has prepared administrative
navigability determinations mostly in support of land transfer actions under the Alaska
Statehood Act, the Alaska Native Claims Settlement Act, and the Native Allotment Act (BLM
2010). The States’ ownership right to the beds of navigable waters was confirmed by Congress
in the Submerged Lands Act of 1953. Since statehood in 1959, the federal courts have
determined navigability of less than a dozen unreserved rivers, streams, and lakes in Alaska.
The BLM is applying the recordable disclaimers of interest (RDI) process on a systematic basis
to navigable waterbodies within Alaska. The State of Alaska is using the RDI process to help
confirm the State’s ownership of navigable rivers and lakes, which provides an effective and
efficient tool to confirm the State’s ownership of navigable waterbodies (BLM 2010).
5.18.1.2 State Regulations
The Alaska Constitution contains numerous provisions embracing principles of the Public Trust
Doctrine that require the state to exercise authority to ensure that the right of the public to use
navigable waters for navigation, commerce, recreation, and related purposes is protected. In
Alaska, the Public Trust Doctrine extends beyond those submerged lands to which the state
holds title to include all navigable waters. The State’s waters are themselves reserved to the
people for common use (ADNR 1996).
The Alaska Constitution (Article VIII, Sections 1, 2, 3, 6, 13, and 14) and Alaska Statutes (AS)
38.05.127 and 38.05.128 contain some of the provisions that are the legal basis for applying the
Public Trust Doctrine in Alaska. In Alaska, this doctrine guarantees the public’s right to engage
1 Designated as “No Discharge Zones (NDZs).
Alaska Stand Alone Gas Pipeline 5.18-4 Final EIS
in activities such as commerce, navigation, fishing, hunting, trapping, and swimming, while also
providing for the protection of areas for ecological study (ADNR 2008).
The Alaska Constitution provides that “free access to the navigable or public waters of the state,
as defined by the legislature, shall not be denied to any citizen of the United States or resident
of the state, except that the legislature may by general law regulate and limit such access for
other beneficial uses or public purposes.” The Alaska Supreme Court has concluded “the
provisions in Article VIII [of the Constitution] were intended to permit the broadest possible
access to and use of state waters by the general public” (Wernberg v. State, 516 P. 2d 1191,
1198-9). The Alaska legislature has broadly defined the navigable and public waters available
for public use in AS 38.05.965. Moreover, the legislature has endorsed a broad interpretation of
the Public Trust Doctrine in Article VIII of Alaska’s Constitution in finding that:
Ownership of land bordering navigable or public waters does not grant an
exclusive right to the use of the water and any rights of title to the land below
the ordinary high water mark are subject to the rights of the people of the
state to use and have access to the water for recreational purposes or any
other public purposes for which the water is used or capable of being used
consistent with the public trust (Sec. 1, Ch. 82, SLA 1985).
Alaska Department of Natural Resources
Navigable water is defined by Alaska Department of Natural Resources (ADNR) as: water that,
at the time the state achieved statehood, was used, or was susceptible of being used, in its
ordinary condition as a highway for commerce over which trade and travel were or could have
been conducted in the customary modes of trade and travel on water; the use or potential use
does not need to have been without difficulty, extensive, or long and continuous.
[AS 38.04.062 (g)(1)] (ADNR 2010).
The ADNR issues permits and authorizations governing construction and other activities in or
associated with navigable and public waterways pursuant to Alaska law (AS 38.05.128), which
mandates:
A person may not obstruct or interfere with the free passage or use by a
person of any navigable water unless the obstruction or interference is:
authorized by a federal agency and a state agency; authorized under a
federal or state law or permit; exempt under 33 U.S.C. 1344(f) (CWA);
caused by the normal operation of freight barging that is otherwise consistent
with law; or authorized by the commissioner after reasonable public notice.
The ADNR is also responsible for determining the need for and reviewing the designs of
bridges, culverts, and other drainage structures. The ADNR issues determinations regarding
the navigability of waterways as set out in Alaska law (AS 38.05.965), defining navigable water
as:
Alaska Stand Alone Gas Pipeline 5.18-5 Final EIS
Any water of the state forming a river, stream, lake, pond, slough, creek, bay,
sound, estuary, inlet, strait, passage, canal, sea or ocean, or any other body
of water or waterway within the territorial limits of the state or subject to its
jurisdiction, that is navigable in fact for any useful public purpose, including
but not limited to water suitable for commercial navigation, floating of logs,
landing and takeoff of aircraft, and public boating, trapping, hunting waterfowl
and aquatic animals, fishing, or other public recreational purposes.
Alaska law (AS 38.05.127) also mandates the circumstances under which navigability will be
determined and safeguards public access to navigable waterways:
Before the sale, lease, grant, or other disposal of any interest in state land
adjacent to a body of water or waterway, the commissioner [of natural
resources] shall determine if the body of water or waterway is navigable
water or public water. Upon finding that the body of water or waterway is
navigable or public water, provide for the specific easements or rights-of-way
necessary to ensure free access to and along the body of water, unless the
commissioner finds that regulating or limiting access is necessary for other
beneficial uses or public purposes.
ADNR planning documents for the proposed Project area also include guidance regarding
bridge clearance on navigable waterways for boats, wildlife, and riders on horseback, and along
the banks of navigable rivers and lakes.
Under Alaska Statutes Section 30.50.020: Discharging Ballast Into Navigable Waters:
A person, whether or not an officer of a vessel, who discharges the ballast of
a vessel into the navigable portion or channel of a bay, harbor, or river of the
state, or within the jurisdiction of the state, so as to injuriously affect the
navigable portion or channel, or to obstruct the navigation of the navigable
portion or channel, upon conviction, is punishable by imprisonment in jail.
At present, the ADNR does not have a complete list of navigable waterways for the State of
Alaska (W. Steinberger, Pers. Comm. 2011). A Navigable Waters Web Map was developed
under AS 38.04.062; however, it does not identify all navigable waters due to scale and/or data
limitations (ADNR 2010. Many streams have not been evaluated, and the streams that have
been identified as navigable, may be navigable substantially farther upstream than what is
depicted (W. Steinberger, Pers. Comm. 2011). Water not included is not considered either
navigable or non-navigable until the commissioner has made a determination as to its
navigability at the time the state achieved statehood. In addition, the commissioner may make
corrections and alterations of the map to maintain accuracy [AS 38.08.062 (d)] (ADNR 2010).

Alaska Stand Alone Gas Pipeline 5.18-6 Final EIS
5.18.1.3 Local Agencies
Alaskan boroughs and cities have the authority to provide for planning, platting, and land use
regulations defined by Alaska laws (AS 29.35 and 29.40). For the proposed Project and
alternatives, the North Slope, Yukon-Koyukuk, Fairbanks North Star, Denali, and Matanuska-
Susitna (Mat-Su) Boroughs as second class boroughs, are required to provide for area-wide
planning, platting, and land use regulations. Boroughs may have provisions for local issues
related to navigation. The Boroughs may delegate these powers to a city within the Borough
(AS 29.40.010).
5.18.2 Affected Environment
5.18.2.1 Project Area
The navigation resources included within the proposed Project area would extend from Prudhoe
Bay in the North Slope Borough, south to the Mat-Su Borough near Cook Inlet. The Fairbanks
Lateral would diverge from the proposed mainline at approximate Mile Post (MP) 458
(MP FL 0.0) and extend through Yukon-Koyukuk and Fairbanks North Star Boroughs. Major
drainages that would be crossed include the Sagavanirktok, Yukon, Tanana, and Susitna. The
proposed Project would make 11 freshwater crossings over navigable waterways as determined
by the USACE (Table 5.18-1). The Denali National Park and Preserve (NPP) Route Variation
would include two crossings within the navigable reach of the Nenana River: an existing
pedestrian/bike bridge south of the Canyon commercial area and a buried crossing in the
Nenana River south of the McKinley Village.
The proposed Project area also includes the temporary use of three Alaska port sites for the
construction period (2 years) of the proposed Project to transport materials and equipment
required for proposed Project development. The primary ports include the West Dock at
Prudhoe Bay, and the Port of Seward (POS) in Resurrection Bay in Southcentral Alaska. The
Port of Anchorage (POA) in Cook Inlet may be used to supplement vessel traffic with the POS.
Typically, the USCG and the ADNR provide a determination of navigability on streams when the
design of crossings is complete for review prior to permit approvals. As required by the General
Bridge Act of 1946, the AGDC would submit final designs for all stream crossings and crossing
locations to the USCG for review prior to the start of construction. Based on this information,
the USCG would make a final determination regarding its jurisdiction for particular crossings.

Alaska Stand Alone Gas Pipeline 5.18-7 Final EIS
TABLE 5.18-1 USACE Navigable Waterways within the Proposed Project Area
Stream Crossing GNIS Name
Stream Crossing Method
Construction Season USACE Navigability Determination
ST_57 Kuparuk River HDD Winter 2 Navigable – 52.2 miles to Toolik River
ST_266 Yukon River New bridge,
existing bridge, or HDD
Winter 2 Navigable
ST_286 Tolovana River Open-Cut Winter 1 Navigable – 135 miles (Entire Length)
ST_314 Chatanika River HDD Winter 1 Navigable – 139 miles to Long Creek
ST_329 Tanana River HDD Winter 2 Navigable
ST_336 Nenana River Open-Cut Winter 2 Navigable – 80 miles to Parks Highway Bridge
ST_352 Nenana River Open-Cut Summer 1 Navigable – 80 miles to Parks Highway Bridge
ST_374 Nenana River Open-Cut Summer 1 Navigable – 80 miles to Parks Highway Bridge
ST_428 Susitna River HDD Winter 2 N/A
ST_444 Willow Creek HDD Winter 2 Navigable – 4 miles to Parks Highway Bridge
ST_454 Little Susitna River HDD Winter 2 Navigable – 84 miles to the Schrock Rd Bridge
HDD=Horizontal Directional Drilling
5.18.3 Environmental Consequences
5.18.3.1 No Action Alternative
Under the No Action Alternative, the proposed Project would not be developed and there would
be no affects to navigation resources.
5.18.3.2 Proposed Action
Preconstruction Activities
The POS is located at the north end of Resurrection Bay in Prince William Sound in
Southcentral, Alaska (Figure 5.7-1). The West Dock Port is located approximately 2.7 miles
offshore from Prudhoe Bay in the Beaufort Sea (Figure 1.0-1). West Dock is used regularly to
support oil development in the Prudhoe Bay area. The POA is located in Upper Cook Inlet,
north of Ship Creek at the mouth of the Knik Arm in Southcentral Alaska (Figure 1.0-1). The
2 year construction period would be the only time that port activity would be required for the
proposed action. The proposed action would also be further limited to port use during the open
water season for West Dock in the Beaufort Sea. Shipping would not occur during periods of
sea ice development in the Arctic. The POS would be the planned port of entry for pipe and
equipment delivery due to Alaska Railroad Corporation (ARRC) access, available storage, and
year round accessibility.
Alaska Stand Alone Gas Pipeline 5.18-8 Final EIS
Navigation Resource Use by Action Area
Port of Seward
Thirty-five shipments would be required during the construction phase of the proposed Project
to fulfill pipe delivery to the POS (AGDC 2011). The 2010 port calls at the ARRC freight dock at
the POS was 200 consisting of 146 freight vessels and 54 cruise ships (ARRC 2011). The
expected increase in navigation resource use at the POS ARRC freight dock from proposed
Project construction would be approximately 17 percent.
West Dock
Nine shipments would be required to complete delivery of all materials and equipment to West
Dock for right-of-way (ROW) and gas conditioning facility (GCF) development at Prudhoe Bay
(AGDC 2011). The 2010 port calls for commercial barges at West Dock was 182 vessels (W.
Nash, Pers. Comm. 2011). This vessel count does not include barges that land at the beach
heads or hovercraft usage to Northstar Island. Navigation resource activity for the proposed
Project construction period would increase at the West Dock Port by approximately 5 percent or
less compared to 2010 navigation use noted above.
Port of Anchorage
The POA receives approximately 500 port calls annually (POA 2011). These vessels primarily
include container ships, dredges, oil barges, tugs, and oil tankers. It is undetermined what
navigation resource activity would occur at the POA from the proposed Project. The POA could
be used as an additional port site to supplement the 35 vessel shipments expected for the POS.
Pollution
Potential impacts from increased navigation resource use for supply shipments could increase
pollution in Alaskan waters from wastewater discharge. Impacts from increased navigational
activity on Alaskan waterways would not be expected to adversely affect marine water quality in
the port areas noted above. Vessel activity on navigable waterways would be required to
comply with federal and state regulations and standards for discharging wastewater.
Non-native Invasive Species
Ballast is water taken onboard ships to add weight to maintain the stability of the vessel when
cargo is loaded and discharged when cargo is offloaded at the destination port. Ballast water is
a major source for introducing non-native species into aquatic ecosystems where they would not
otherwise be present. Non-native species can adversely impact the economy, the environment,
or cause harm to human health. Impacts include a reduction in biodiversity of species inhabiting
coastal waters from non-native species out-competing native species for food and space. The
USCG is the primary federal agency for regulating ballast water discharge; expected adverse
impacts on navigable waterways in Alaska would be unlikely.

Alaska Stand Alone Gas Pipeline 5.18-9 Final EIS
Pipeline Facilities
Mainline
The proposed Project ROW extends 737 miles which would include a buried pipeline
approximately 5 feet underground for the majority of its length. Six river crossings of the
navigable rivers noted above would be installed via HDD and four river crossings would be
installed via open cut methods, with three options available for the Yukon River (Table 5.18-1).
Impacts to navigation resources from stream crossing methods are discussed below.
Construction
Open-Cut Stream Crossing Method
Open-cut methods would be used for 4 of the 11 stream crossings determined to be navigable
by the USACE (Table 5.18-1). Pipeline construction using open-cut methods across waterways
would be completed in one to three days from initiation and are expected to result in short-term
disturbance to navigability along the proposed ROW. Navigability along waterways using open-
cut methods would be temporarily impeded by construction materials and equipment during the
pipeline construction process. The construction zone would exclude the public for safety and
trespass reasons. These impediments would affect navigability along public waterways for all
types of water transportation, including boats, float planes, winter dog sleds, motorized vehicles
(such as automobiles, all-terrain vehicles, snow machines), and others. During post-
construction of the ROW, existing surface hydrology would be maintained to the maximum
extent practicable (AGDC 2011). Navigability impacts at these stream crossings would exist
only during the construction phase of the proposed Project.
Horizontal Directional Drill Crossing Method
The HDD method would be used to cross 6 of the 11 streams determined to be navigable by the
USACE (Table 5.18-1). Successful HDD crossings would avoid direct disturbance to aquatic
habitat and stream banks and thus would not affect navigation during construction. Impacts to
navigation could occur if there is unintended release of drilling fluids due to site geological
conditions (a frac-out) or a problem with containment or disposal of drilling muds where in-
stream work may be necessary. A contingency plan for HDD would be mandatory and
implemented during proposed Project development. The contingency plan should include
downstream monitoring for drilling fluid during drilling operations for both open water and ice
conditions. It would also include a response plan and mitigation in the event that a release of
drilling fluids occurred during both open water and ice conditions.
Yukon River Crossing Options
The AGDC has proposed three options for crossing the Yukon River, a waterway determined to
be navigable by the USACE. The AGDC would either construct a new aerial suspension bridge
across the Yukon River (the Applicant’s Preferred Option); cross the Yukon River by attaching
the pipeline to the existing E.L. Patton Bridge (Option 2); or utilize HDD to cross underneath the
Yukon River (Option 3).

Alaska Stand Alone Gas Pipeline 5.18-10 Final EIS
New Bridge
A new pipeline suspension bridge would be built across the Yukon River without permanent
structures such as footings installed below ordinary high water. Large vessels would likely be
required in the Yukon River during the construction season until the bridge is fully built. These
vessels would likely impede other local vessel traffic during the construction phase of the
proposed Project. Permanent structures placed across navigable waters would have to be
designed and constructed in compliance with federal and state regulations, standards, and
specifications for crossings of navigable waterways. The potential impacts to navigation
resulting from the proposed pipeline suspension bridge would be temporary and negligible.
Existing Bridge
This option includes utilizing the existing E.L. Patton Bridge on the Dalton Highway. The
pipeline would hang below the existing bridge deck on a hanger pipe and no work or placement
of structures would occur in the river. Structures crossing navigable waterways would have to
be designed and constructed in compliance with federal and state regulations, standards, and
specifications for crossings of navigable waterways. The impacts to navigation resulting from
use of the existing bridge would be negligible.
HDD Crossing
Another option to cross the Yukon River would be to cross the river via HDD. If feasible, the
HDD crossing would be at the same location as the proposed suspension bridge. The feasibility
of a HDD crossing is unknown at this time due to limited soil information. Successful HDD
crossing would not affect navigation during construction. All activities would occur on land, on
either side of the Yukon River. Impacts to navigation could occur as noted above under HDD
Crossing Method if there is unintended release of drilling fluids (a frac-out) where in-stream
work may be necessary for containment.
Impacts by Segment
GCF to MP 540
The proposed Project ROW from MP 0 to MP 540 would have seven stream crossings that have
been determined to be navigable by the USACE (Table 5.18-1). The HDD crossing methods
would be used for the Kuparuk River, the Chatanika River and the Tanana River. The AGDC
has proposed three options for crossing the Yukon River noted above. Additionally, two stream
crossings would be required at the Nenana River, and one at the Tolovana River which would
use open-cut methods (Table 5.18-1). Construction for all the crossings in this segment would
occur during the winter construction season except for one stream crossing at the Nenana River
(ST_352).
Fairbanks Lateral
No USACE listed navigable waters would be crossed by the proposed Project in this segment.

Alaska Stand Alone Gas Pipeline 5.18-11 Final EIS
Operations and Maintenance
Impacts to navigation are not expected from operation and maintenance of the proposed Project
in any section. The pipeline would meet or exceed the USDOT standards at 49 CFR 192.327
and would be buried below the ground surface at the depth required for safe crossing of
waterbodies or on bridges. Bridges would be designed and constructed in compliance with
federal and state regulations, standards, and specifications for crossings of navigable
waterways.
MP 540 to MP 555
No USACE listed navigable waters would be crossed by the proposed Project in this segment.
MP 555 to End
The proposed Project from MP 555 to the Cook Inlet Natural Gas Liquid Extraction Plant
(NGLEP) Facility would have four stream crossings that have been determined to be navigable
by the USACE. In this segment, open-cut crossing methods would be used to cross the
Nenana River (ST_374) during the summer. Impacts to navigability from open cut crossings are
described in detail above. Navigability along waterways using open-cut methods would be
temporarily impeded by construction materials and equipment during the pipeline construction
process. Once construction is complete, no impacts to navigability of streams are expected
from stream crossings by the proposed Project.
All other stream crossings in this segment would use HDD methods during the winter.
Successful HDD crossings would avoid direct disturbance to aquatic habitat and stream banks
and thus HDD would not affect navigation during construction. Impacts to navigation could
occur if there is unintended release of drilling fluids due to site geological conditions (a frac-out)
or a problem with containment or disposal of drilling muds where in-stream work could be
necessary for containment. A contingency plan for HDD operations is not yet available
(AGDC 2011).
Aboveground Facilities
Aboveground facilities would not be built over waterbodies; therefore, no impacts to navigation
are expected from aboveground facilities.
Support Facilities
Support facilities would not be built over waterbodies; therefore, no impacts to navigation are
expected from support facilities.
5.18.3.3 Denali National Park Route Variation
The Denali NPP Route Variation would have two stream crossings at the Nenana River that
have been determined to be navigable by the USACE. One crossing of the Nenana River would
utilize an existing pedestrian bridge. The pipeline infrastructure would hang below the bridge
surface and no work or placement of structures would occur in the river. Structures crossing
Alaska Stand Alone Gas Pipeline 5.18-12 Final EIS
navigable streams would have to be designed and constructed in compliance with federal and
state regulations, standards, and specifications for crossings of navigable waterways. The
impacts to navigation resulting from use of the existing bridge would be negligible.
The construction method for the other crossing of the Nenana River would be HDD, which
would not be expected to impact navigability of the Nenana River as noted above under HDD
crossing Method. All construction activity would be conducted on the banks of the river.
Impacts to Navigation would be similar to those described in Section 5.18.3.1 for open-cut,
HDD, and bridge crossings.
5.18.4 References
ADNR. See Alaska Department of Natural Resources.
AGDC. See Alaska Gasline Development Corporation.
ARRC. See Alaska Railroad Corporation.
Alaska Department of Natural Resources (ADNR). 1996. State Policy on Navigability. Public
Trust Doctrine. Website: (http://dnr.alaska.gov/mlw/nav/nav_policy.htm).
Alaska Department of Natural Resources (ADNR). 2008. State Navigable Waters. Division of
Mining, Land & Water. http://www.navmaps.alaska.gov/navwatersmap/
Alaska Department of Natural Resources (ADNR). 2010. State Navigable Waters. Division of
Mining, Land & Water. Website: (http://dnr.alaska.gov/mlw/nav/map_disclaimer.htm).
Alaska Gasline Development Corporation (AGDC). 2011. Alaska Stand Alone Gas
Pipeline/ASAP. Plan of Development Revision 1. March 2011.
Alaska Railroad (ARRC). 2011. Freight Dock Port Calls. Vessel arrival summary data 2010.
Information obtained from the Alaska Railroad Corporation, Seward, Alaska.
BLM. See Bureau of Land Management.
Bureau of Land Management (BLM). 2010. Recordable Disclaimer of Interest. Website:
(http://www.blm.gov/ak/st/en/prog/rdi/generalinfo.html).
EPA. See U.S. Environmental Protection Agency.
POA. See Port of Anchorage.
Port of Anchorage (POA). 2011. Vessel arrival summary data, 2010. Information obtained
from Municipality of Anchorage, Alaska.
USACE. See U.S. Army Corps of Engineers.

Alaska Stand Alone Gas Pipeline 5.18-13 Final EIS
U.S. Army Corps of Engineers (USACE). 1995. Navigable Waters (in addition to all tidal
waters). Alaska District, Regulatory. Website: (http://www.poa.usace.army.mil/reg/
NavWat.htm).
U.S. Environmental Protection Agency (EPA). 2011. No Discharge Zones. Website:
(http://water.epa.gov/polwaste/vwd/ndz.cfm).
5.18.4.1 Personal Communications
Nash, W. 2011. M. Cunningham, Wild North Resources LLC, personal communications with
BP Financial JV Analyst on October, 28, 2011.
Steinberger, W. 2010. Alaska Department of Natural Resources. November 16, 2010.

Alaska Stand Alone Gas Pipeline 5.18-14 Final EIS
This page intentionally left blank.
5.19 RELIABILITY AND SAFETY
Alaska Stand Alone Gas PifJl1line Final £IS
Alaska Stand Alone Gas Pipeline 5.19-1 Final EIS
5.19 RELIABILITY AND SAFETY
The transportation of natural gas by pipeline involves some risk to the public in the event of an
accident and subsequent release of gas. The greatest hazard is a fire or explosion following a
major pipeline rupture.
Methane, the primary component of natural gas, is colorless, odorless, and tasteless. It is not
toxic but is classified as a simple asphyxiate, possessing a slight inhalation hazard. If breathed
in high concentration, oxygen deficiency can result in serious injury or death. Methane has an
ignition temperature of 1,000 degrees Fahrenheit (°F) and is flammable at concentrations
between 5 and 15 percent in air. Unconfined mixtures of methane in air are not explosive.
However, a flammable concentration within an enclosed space in the presence of an ignition
source can explode. It is buoyant at atmospheric temperatures and disperses rapidly in air. If
constructed, this proposed Project will be the first major large-diameter natural gas pipeline in
the United States with a maximum allowable operating pressure (MAOP) of 2,500 pounds per
square inch gauge (psig).
5.19.1 Safety Standards
The United States Department of Transportation (USDOT) is mandated to provide pipeline
safety under Title 49, U.S.C. Chapter 601. The USDOT’s Pipeline and Hazardous Materials
Safety Administration (PHMSA) oversees the national regulatory program to ensure the safe
transportation of natural gas and other hazardous materials by pipeline. It develops safety
regulations and other approaches to risk management that ensure safety in the design,
construction, testing, operation, maintenance, and emergency response of pipeline facilities.
Many of the regulations are written as performance standards which set the level of safety to be
attained and allow the pipeline operator to use various technologies to achieve safety. The
PHMSA ensures that people and the environment are adequately protected from the risk of
pipeline incidents. This work is shared with state agency partners and others at the federal,
state, and local level. The Natural Gas Pipeline Safety Act at 49 U.S.C. 60105 provides for a
state agency to assume all aspects of the safety program for intrastate facilities by adopting and
enforcing the federal standards, while 49 U.S.C. 60106 permits a state agency that does not
qualify under 49 U.S.C. 60105 to perform certain inspection and monitoring functions. A state
may also act as the USDOT’s agent to inspect interstate facilities within its boundaries;
however, the USDOT is responsible for enforcement actions. The majority of the states have
either certifications or agreements with USDOT under the Natural Gas Pipeline Safety Act, while
nine states act as interstate agents. The State of Alaska does not have a either a certification or
an agreement with USDOT under the Natural Gas Pipeline Safety Act.
However, the Alaska Department of Natural Resources (ADNR), Division of Oil and Gas
currently operates the Petroleum Systems Integrity Office (PSIO) whose mission is “to maximize
the safe and stable flow of oil and gas resources to market by ensuring appropriate oversight
and maintenance of oil and gas equipment, facilities, and infrastructure” (ADNR 2011a). At this
time, the State of Alaska, through the PSIO and the PHMSA have agreed “…to coordinate and
Alaska Stand Alone Gas Pipeline 5.19-2 Final EIS
cooperate in the regulation and oversight of oil and gas production and transportation in the
State of Alaska…” through a letter of intent signed by the PHMSA and State of Alaska
representatives in May 2007. The letter of intent agreed to the development of a plan to
coordinate oversight of facilities and activities related to oil and natural gas production and
transportation; development of risk assessment procedures; coordination of inspections of oil
and gas production and transportation facilities; infrastructure integrity data sharing; and joint
public outreach programs (ADNR 2011b).
Further, the AGDC was issued a right-of-way (ROW) lease by the State of Alaska for the
proposed Project on July 25, 2011, (ADNR 2011c) which is included as Appendix M. The ROW
lease not only grants the AGDC a gas pipeline corridor for construction of the proposed Project,
but also contains a comprehensive sequence of stipulations that will direct all aspects of the
pipeline design, construction, and operation in conjunction with applicable PHMSA regulations.
The USDOT pipeline standards are published in 49 Code of Federal Regulations (CFR) 190 to
199. 49 CFR 192 specifically addresses natural gas pipeline safety issues. The pipeline and
aboveground facilities associated with the proposed Project must be designed, constructed,
operated, and maintained in accordance with the USDOT Minimum Federal Safety Standards in
49 CFR 192. The regulations are intended to ensure adequate protection for the public and to
prevent natural gas facility incidents and failures. 49 CFR 192 prescribes minimum
requirements for: the selection and qualification of pipe and components; design of pipe; design
and installation of pipeline components and facilities; welding; constructing; and protection from
external, internal, and atmospheric corrosion; the minimum leak-test and strength-test
requirements for pipelines; minimum requirements for operation; minimum requirements for
maintenance; minimum requirements for operator qualification; and minimum requirements for
an integrity management program.
49 CFR 192 also defines area classifications, based on population density in the vicinity of the
pipeline, and specifies more rigorous safety requirements for populated areas. The class
location unit is an area that extends 220 yards (660 feet) on either side of the centerline of any
continuous 1-mile length of pipeline. The four area classifications are defined as follows:
Class 1 – Location with 10 or fewer buildings intended for human occupancy;
Class 2 – Location with more than 10 but less than 46 buildings intended for human
occupancy;
Class 3 – Location with 46 or more buildings intended for human occupancy or where the
pipeline lies within 100 yards of any building, or small well-defined outside area occupied by
20 or more people on at least 5 days a week for 10 weeks in any 12-month period; and
Class 4 – Location where buildings with four or more stories aboveground are prevalent.
Class locations representing more populated areas require higher safety factors in pipeline
design, testing, and operation. Pipelines constructed on land in Class 1 locations must be
installed with a minimum depth cover of 30 inches in normal soil and 18 inches in consolidated
rock. Class 2, 3, and 4 locations, as well as drainage ditches of public roads and railroad
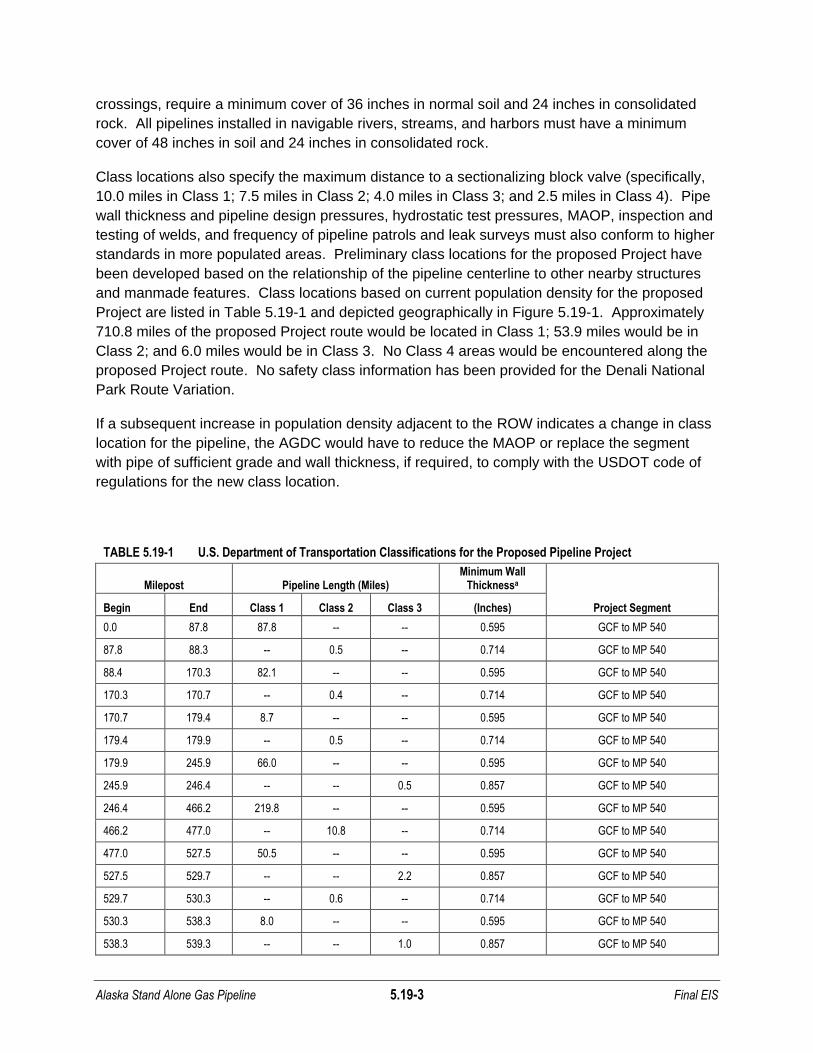
Alaska Stand Alone Gas Pipeline 5.19-3 Final EIS
crossings, require a minimum cover of 36 inches in normal soil and 24 inches in consolidated
rock. All pipelines installed in navigable rivers, streams, and harbors must have a minimum
cover of 48 inches in soil and 24 inches in consolidated rock.
Class locations also specify the maximum distance to a sectionalizing block valve (specifically,
10.0 miles in Class 1; 7.5 miles in Class 2; 4.0 miles in Class 3; and 2.5 miles in Class 4). Pipe
wall thickness and pipeline design pressures, hydrostatic test pressures, MAOP, inspection and
testing of welds, and frequency of pipeline patrols and leak surveys must also conform to higher
standards in more populated areas. Preliminary class locations for the proposed Project have
been developed based on the relationship of the pipeline centerline to other nearby structures
and manmade features. Class locations based on current population density for the proposed
Project are listed in Table 5.19-1 and depicted geographically in Figure 5.19-1. Approximately
710.8 miles of the proposed Project route would be located in Class 1; 53.9 miles would be in
Class 2; and 6.0 miles would be in Class 3. No Class 4 areas would be encountered along the
proposed Project route. No safety class information has been provided for the Denali National
Park Route Variation.
If a subsequent increase in population density adjacent to the ROW indicates a change in class
location for the pipeline, the AGDC would have to reduce the MAOP or replace the segment
with pipe of sufficient grade and wall thickness, if required, to comply with the USDOT code of
regulations for the new class location.
TABLE 5.19-1 U.S. Department of Transportation Classifications for the Proposed Pipeline Project
Milepost Pipeline Length (Miles) Minimum Wall
Thicknessa
Project Segment Begin End Class 1 Class 2 Class 3 (Inches)
0.0 87.8 87.8 -- -- 0.595 GCF to MP 540
87.8 88.3 -- 0.5 -- 0.714 GCF to MP 540
88.4 170.3 82.1 -- -- 0.595 GCF to MP 540
170.3 170.7 -- 0.4 -- 0.714 GCF to MP 540
170.7 179.4 8.7 -- -- 0.595 GCF to MP 540
179.4 179.9 -- 0.5 -- 0.714 GCF to MP 540
179.9 245.9 66.0 -- -- 0.595 GCF to MP 540
245.9 246.4 -- -- 0.5 0.857 GCF to MP 540
246.4 466.2 219.8 -- -- 0.595 GCF to MP 540
466.2 477.0 -- 10.8 -- 0.714 GCF to MP 540
477.0 527.5 50.5 -- -- 0.595 GCF to MP 540
527.5 529.7 -- -- 2.2 0.857 GCF to MP 540
529.7 530.3 -- 0.6 -- 0.714 GCF to MP 540
530.3 538.3 8.0 -- -- 0.595 GCF to MP 540
538.3 539.3 -- -- 1.0 0.857 GCF to MP 540
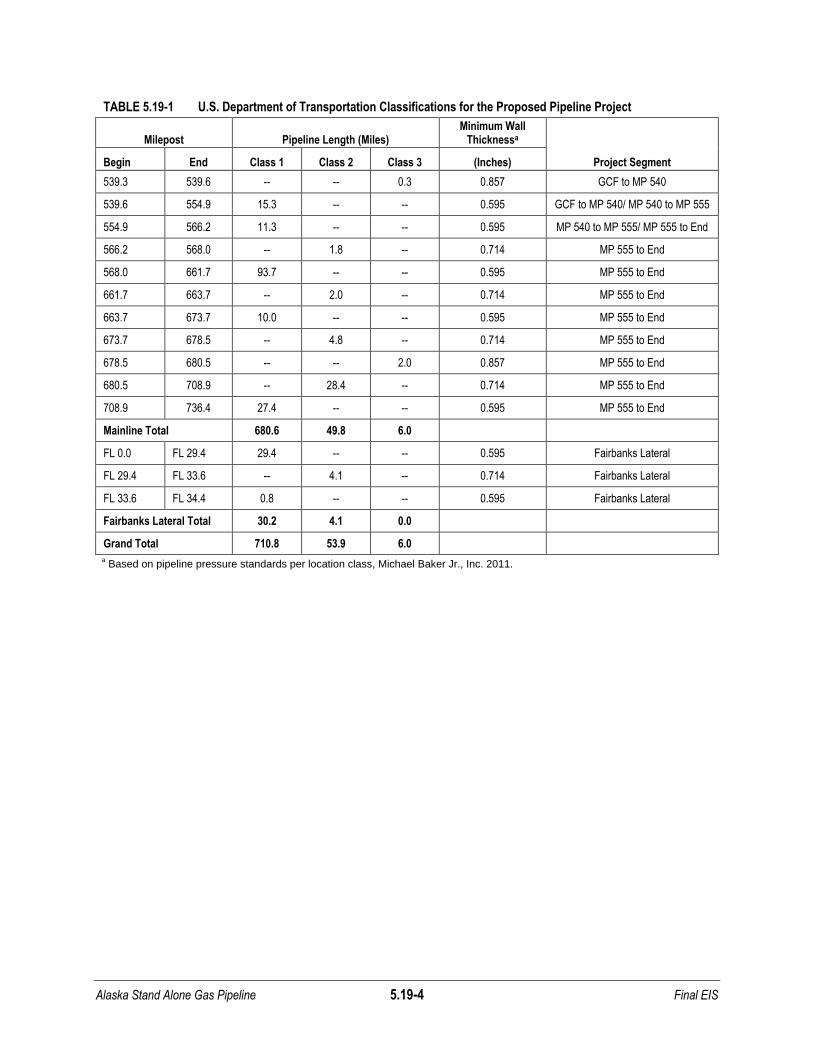
Alaska Stand Alone Gas Pipeline 5.19-4 Final EIS
TABLE 5.19-1 U.S. Department of Transportation Classifications for the Proposed Pipeline Project
Milepost Pipeline Length (Miles) Minimum Wall
Thicknessa
Project Segment Begin End Class 1 Class 2 Class 3 (Inches)
539.3 539.6 -- -- 0.3 0.857 GCF to MP 540
539.6 554.9 15.3 -- -- 0.595 GCF to MP 540/ MP 540 to MP 555
554.9 566.2 11.3 -- -- 0.595 MP 540 to MP 555/ MP 555 to End
566.2 568.0 -- 1.8 -- 0.714 MP 555 to End
568.0 661.7 93.7 -- -- 0.595 MP 555 to End
661.7 663.7 -- 2.0 -- 0.714 MP 555 to End
663.7 673.7 10.0 -- -- 0.595 MP 555 to End
673.7 678.5 -- 4.8 -- 0.714 MP 555 to End
678.5 680.5 -- -- 2.0 0.857 MP 555 to End
680.5 708.9 -- 28.4 -- 0.714 MP 555 to End
708.9 736.4 27.4 -- -- 0.595 MP 555 to End
Mainline Total 680.6 49.8 6.0
FL 0.0 FL 29.4 29.4 -- -- 0.595 Fairbanks Lateral
FL 29.4 FL 33.6 -- 4.1 -- 0.714 Fairbanks Lateral
FL 33.6 FL 34.4 0.8 -- -- 0.595 Fairbanks Lateral
Fairbanks Lateral Total 30.2 4.1 0.0
Grand Total 710.8 53.9 6.0
a Based on pipeline pressure standards per location class, Michael Baker Jr., Inc. 2011.
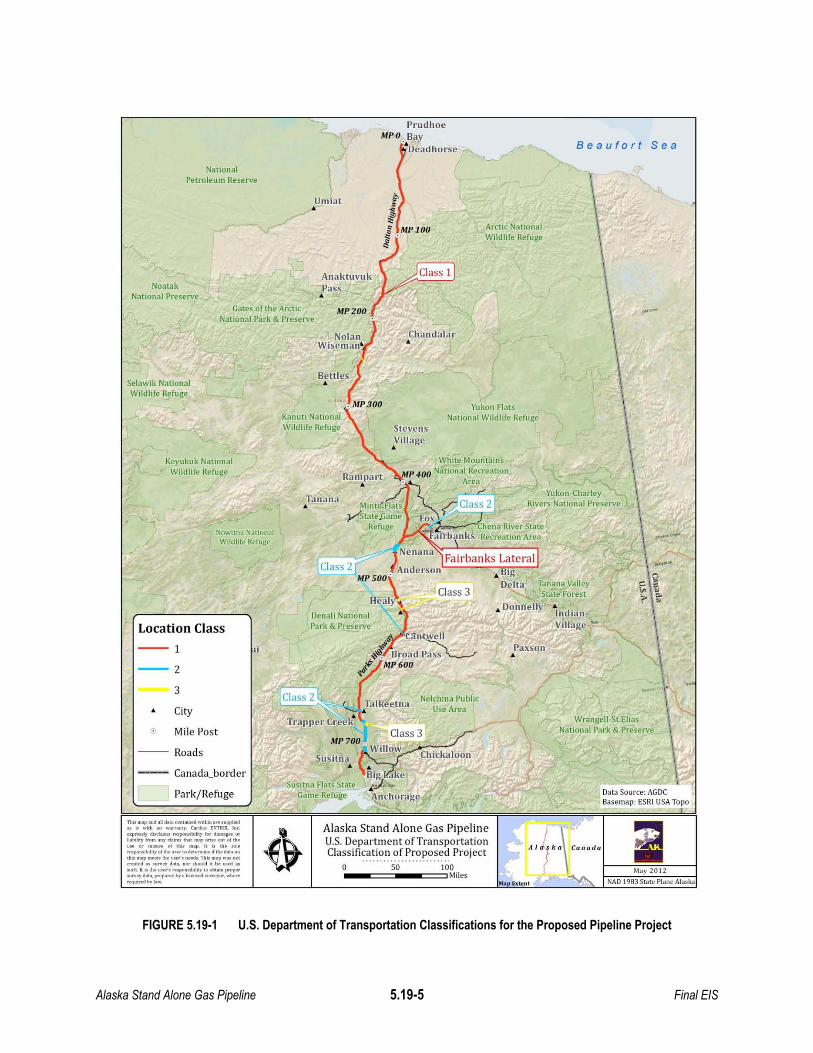
Alaska Stand Alone Gas Pipeline 5.19-5 Final EIS
FIGURE 5.19-1 U.S. Department of Transportation Classifications for the Proposed Pipeline Project
r.
Beaufort Sea
\
\\
\\\
\\
\\,\\\i\\
\\\\
f \(" \ 1'.......
\<;)~ ~~,.
?i~
\\\\\
\\Wrangell-St.EfiasN,';o03I P"k & P,.,.,v, \
•IndianVlllage ~...
Tanana ValleyState Forest
Yukon-CharleyRivers National Preserve
Paxson•
... Donnelly
Arctic NationalWildlife Refuge
Yukon FlatsNational Wildlife Refuge
Class 3
Nelchina PublicUse Area
Chandalar.
StevensVillage•
PrudhoeMPO .•Bay
Deadhorse
Alaska Stand Alone Gas PipelineU.S. Department of TransportationClassification of Proposed Project
a 50 100·Miles
AnaktuvukPass•
Umiat•
Susitna Flats State.t Game Refuge
Gates of the ArcticNational Park & Preserve
Nowitna NationalWildlife Refuge
City
Roads
2
3
Canada_border
Park/Refuge
Tanana•
NationalPetroleum Reserve
Koyukuk NationalWildlife Refuge
e Mile Post
Location Class
1
NoatakNational Preserve
Selawik NationalWildlife Refuge
Thlo .......o>d.U ....... """t-.dwl<li.......,,!'P10Id.. "' willi "" wo"""',, l:ordrIo [N11llX, In<."'lI.......,. d,sct """",bibty lor do 01"
~.bthtyln".. on, , ,.... ....,. _ of 'h~
.... or mi..... of <hi< "'"l' It .. th. 001.
.... """.ib\lity 04 th••_ '0 ....._in. ifth.d•• on
'h ......... n><ets''''".....r•..- Th"m.pw ",................."l' do .- ."""ld "b od ••.ld. h .. the """ability to obuin proper......."l'd..... prep.-l by.li<'enood.~.""...CO<l';~byl.o...,
Alaska Stand Alone Gas Pipeline 5.19-6 Final EIS
The Pipeline Safety Improvement Act of 2002 requires operators to develop and follow a written
integrity management program that contains all the elements described in 49 CFR 192.911 and
addresses the risks on each transmission pipeline segment. Specifically, the law establishes an
integrity management program which applies to all high consequence areas (HCA). The
integrity management program is an additional layer of regulatory requirements, beyond the
operations, maintenance, and other 49 CFR 192 requirements, for pipelines in HCA.
The USDOT has published rules that define HCAs as locations where a gas pipeline accident
could do considerable harm to people and their property and requires an integrity management
program to minimize the potential for an accident. This definition satisfies, in part, the
Congressional mandate for the USDOT to prescribe standards that establish criteria for
identifying each gas pipeline facility in a high density population area.
The HCAs may be classified in one of two ways. In the first method, an HCA includes:
Current Class 3 and 4 locations;
Any area in Class 1 or 2 where the potential impact radius1 is greater than 660 feet and
there are 20 or more buildings intended for human occupancy within the potential impact
circle2; or
Any area in Class 1 or 2 where the potential impact circle includes an identified site.
An identified site is an outside area or open structure that is occupied by 20 or more persons on
at least 50 days in any 12-month period; a building that is occupied by 20 or more persons on at
least 5 days a week for any 10 weeks in any 12-month period; or a facility that is occupied by
persons who are confined, are of impaired mobility, or would be difficult to evacuate.
In the second method, an HCA includes any area within a potential impact circle which contains:
Twenty or more buildings intended for human occupancy: or
An identified site.
Once a pipeline operator has determined the HCAs along its pipeline, it must apply the
elements of its integrity management program to those segments of the pipeline within HCAs.
USDOT regulations specify the requirements for the integrity management plan at 49 CFR
192.911. The HCAs have been determined based on the relationship of the pipeline centerline
to other nearby structures and identified sites.
The AGDC has identified approximately 15 miles containing HCAs along the proposed Project
route. The AGDC did not specify if any HCAs would be located along the Denali National Park
Route Variation. In addition, to maintain compliance with the pipeline classification and pipeline
integrity management regulations in 49 CFR 192, the AGDC would continue to monitor for
1 The potential impact radius (in feet) is calculated as the product of 0.69 and the square root of the MAOP of the
pipeline in psig multiplied by the square of the pipeline diameter in inches. 2 The potential impact circle is a circle of radius equal to the potential impact radius.
Alaska Stand Alone Gas Pipeline 5.19-7 Final EIS
potential class location changes and HCAs throughout the life of the proposed Project.
Monitoring would include the AGDC’s aerial and ground inspections, review of aerial
photography of the route, and surveillance during activities associated with operation. The
pipeline integrity management rule for HCAs requires inspection of the entire pipeline for HCAs
every 7 years.
The USDOT prescribes the minimum standards for operating and maintaining pipeline facilities,
including the requirement to establish a written plan governing these activities. Each pipeline
operator is required to establish an emergency plan that includes procedures to minimize the
hazards in a natural gas pipeline emergency. Key elements of the plan include procedures for:
Receiving, identifying, and classifying emergency events, gas leakage, fires, explosions,
and natural disasters;
Establishing and maintaining communications with local fire, police, and public officials and
coordinating emergency response;
Emergency system shutdown and safe restoration of service;
Making personnel, equipment, tools, and materials available at the scene of an emergency;
and
Protecting people first and then property and making them safe from actual or potential
hazards.
The USDOT requires that each operator establish and maintain liaison with appropriate fire,
police, and public officials to learn the resources and responsibilities of each organization that
may respond to a natural gas pipeline emergency and to coordinate mutual assistance.
In accordance with 49 CFR 192, the AGDC would develop an Operations and Maintenance
(O&M), Emergency Response, and other plans that would outline safety measures that would
be implemented during normal and abnormal operation. The AGDC would conduct a public
education program that would include information regarding participation in the “One-Call”
program, hazards associated with the unintended release of natural gas, unintended release
indicators, and reporting procedures.
5.19.2 Pipeline Accident Data
The USDOT requires all operators of natural gas transmission pipelines to notify the USDOT of
any significant incident and to submit a report within 20 days. Significant incidents are defined
as any leaks that:
Caused a death or personal injury requiring hospitalization;
Involve property damage of more than $50,000, in 1984 dollars3;
3 $50,000 in 1984 dollars is approximately $106,000 as of January 2010 (U.S. Department Of Labor 2010).

Alaska Stand Alone Gas Pipeline 5.19-8 Final EIS
Result in highly volatile liquid releases of 5 barrels or more or other liquid releases of 50
barrels or more; or
Result in liquid releases resulting in an unintentional fire or explosion.
During the 20 year period from 1991 through 2010, a total of 1,137 significant incidents were
reported to PHMSA on the more than 300,000 total miles of natural gas transmission pipelines
nationwide.
Additional insight into the nature of significant incidents may be found by examining the primary
factors that caused the failures. Table 5.19-2 provides a distribution of the causal factors as
well as the number of each incident by cause.
TABLE 5.19-2 Natural Gas Transmission Pipeline Significant Incidents by Cause 1991-2010
Cause Number of Incidents Percentage
Corrosion 259 22.8
Excavationa 209 18.4
Pipeline Material, Weld or Equipment Failure 21 1.8
Natural Force Damage 236 20.8
Outside Forceb 134 11.8
Incorrect Operation 57 5.0
All Other Causesc 221 19.4
TOTAL 1,137 100.0
a Includes third party damage.
b Fire, explosion, vehicle damage, previous damage, intentional damage.
c miscellaneous causes or unknown causes.
Source: PHMSA 2011.
The dominant incident cause is corrosion constituting 22.8 percent of all significant incidents.
The pipelines included in the data set in Table 5.19-2 vary widely in terms of age, pipe diameter,
and level of corrosion control. Each variable influences the incident frequency that may be
expected for a specific segment of pipeline.
The frequency of significant incidents is strongly dependent on pipeline age. Older pipelines
have a higher frequency of corrosion incidents, since corrosion is a time-dependent process.
The use of both an external protective coating and a cathodic protection system4, required on all
pipelines installed after July 1971, significantly reduces the corrosion rate compared to
unprotected or partially protected pipe.
4
Cathodic protection is a technique to reduce corrosion (rust) of the natural gas pipeline that includes the use of an induced current or a sacrificial anode (like zinc) that corrodes at faster rate to reduce corrosion. A description
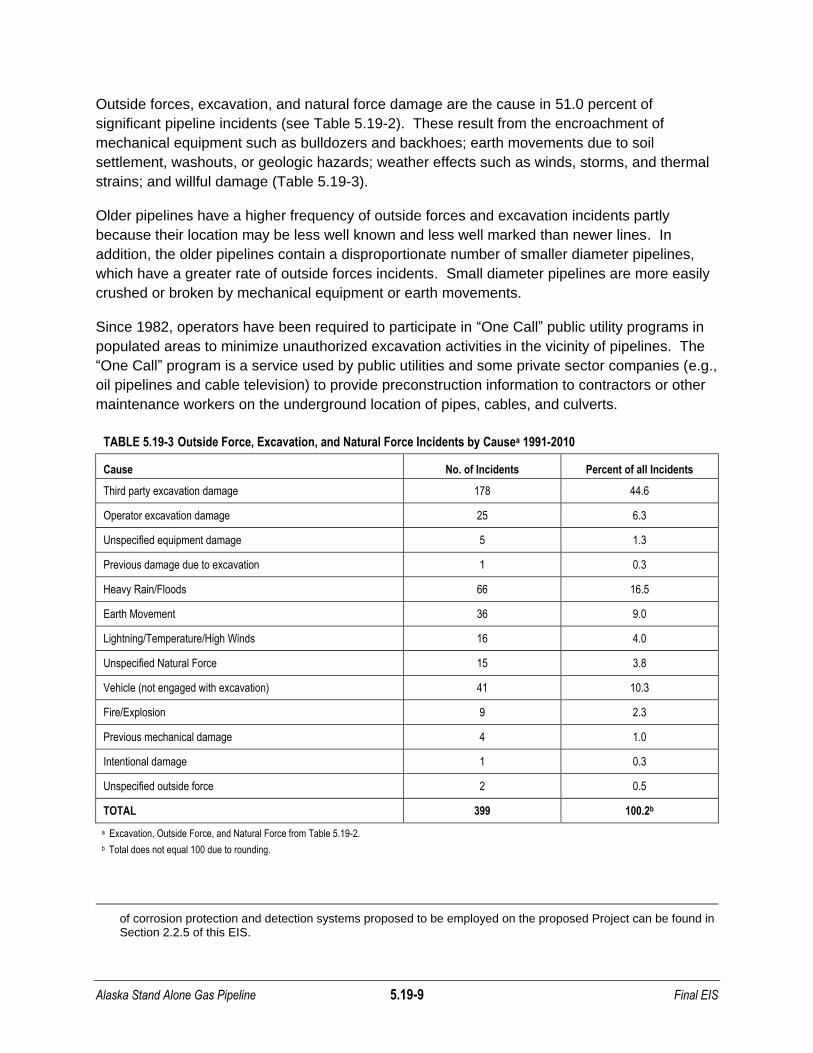
Alaska Stand Alone Gas Pipeline 5.19-9 Final EIS
Outside forces, excavation, and natural force damage are the cause in 51.0 percent of
significant pipeline incidents (see Table 5.19-2). These result from the encroachment of
mechanical equipment such as bulldozers and backhoes; earth movements due to soil
settlement, washouts, or geologic hazards; weather effects such as winds, storms, and thermal
strains; and willful damage (Table 5.19-3).
Older pipelines have a higher frequency of outside forces and excavation incidents partly
because their location may be less well known and less well marked than newer lines. In
addition, the older pipelines contain a disproportionate number of smaller diameter pipelines,
which have a greater rate of outside forces incidents. Small diameter pipelines are more easily
crushed or broken by mechanical equipment or earth movements.
Since 1982, operators have been required to participate in “One Call” public utility programs in
populated areas to minimize unauthorized excavation activities in the vicinity of pipelines. The
“One Call” program is a service used by public utilities and some private sector companies (e.g.,
oil pipelines and cable television) to provide preconstruction information to contractors or other
maintenance workers on the underground location of pipes, cables, and culverts.
TABLE 5.19-3 Outside Force, Excavation, and Natural Force Incidents by Causea 1991-2010
Cause No. of Incidents Percent of all Incidents
Third party excavation damage 178 44.6
Operator excavation damage 25 6.3
Unspecified equipment damage 5 1.3
Previous damage due to excavation 1 0.3
Heavy Rain/Floods 66 16.5
Earth Movement 36 9.0
Lightning/Temperature/High Winds 16 4.0
Unspecified Natural Force 15 3.8
Vehicle (not engaged with excavation) 41 10.3
Fire/Explosion 9 2.3
Previous mechanical damage 4 1.0
Intentional damage 1 0.3
Unspecified outside force 2 0.5
TOTAL 399 100.2b
a Excavation, Outside Force, and Natural Force from Table 5.19-2.
b Total does not equal 100 due to rounding.
of corrosion protection and detection systems proposed to be employed on the proposed Project can be found in Section 2.2.5 of this EIS.
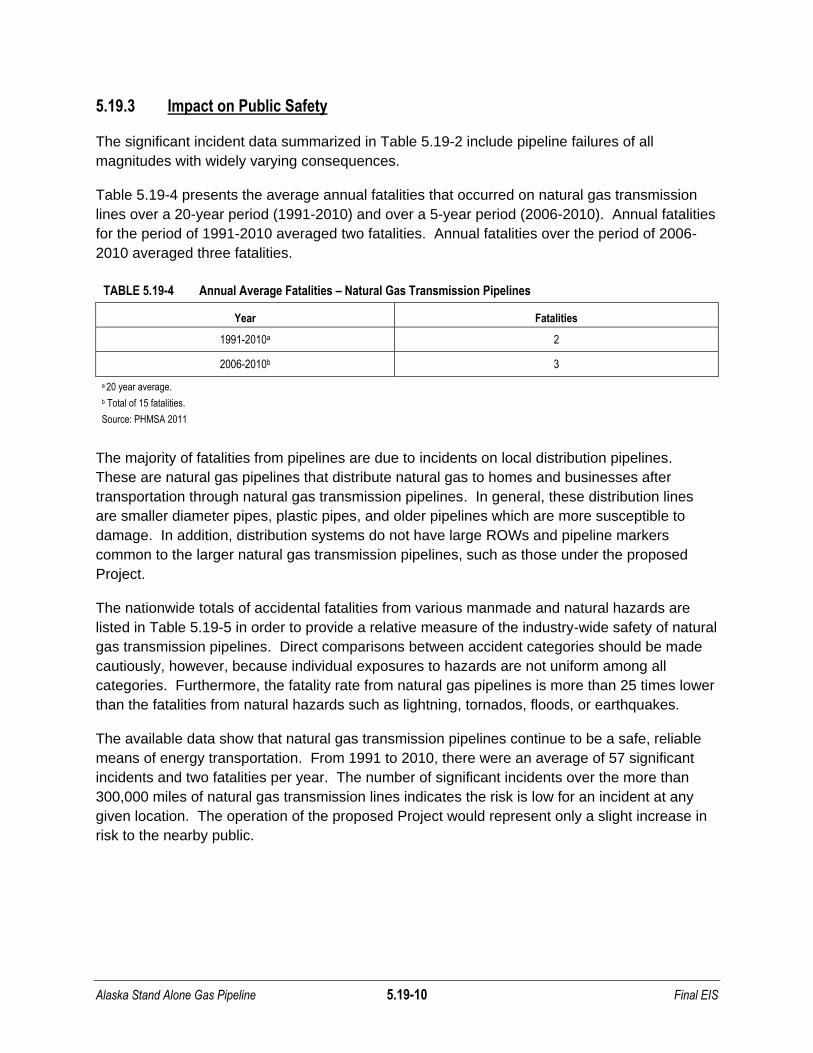
Alaska Stand Alone Gas Pipeline 5.19-10 Final EIS
5.19.3 Impact on Public Safety
The significant incident data summarized in Table 5.19-2 include pipeline failures of all
magnitudes with widely varying consequences.
Table 5.19-4 presents the average annual fatalities that occurred on natural gas transmission
lines over a 20-year period (1991-2010) and over a 5-year period (2006-2010). Annual fatalities
for the period of 1991-2010 averaged two fatalities. Annual fatalities over the period of 2006-
2010 averaged three fatalities.
TABLE 5.19-4 Annual Average Fatalities – Natural Gas Transmission Pipelines
Year Fatalities
1991-2010a 2
2006-2010b 3
a 20 year average.
b Total of 15 fatalities.
Source: PHMSA 2011
The majority of fatalities from pipelines are due to incidents on local distribution pipelines.
These are natural gas pipelines that distribute natural gas to homes and businesses after
transportation through natural gas transmission pipelines. In general, these distribution lines
are smaller diameter pipes, plastic pipes, and older pipelines which are more susceptible to
damage. In addition, distribution systems do not have large ROWs and pipeline markers
common to the larger natural gas transmission pipelines, such as those under the proposed
Project.
The nationwide totals of accidental fatalities from various manmade and natural hazards are
listed in Table 5.19-5 in order to provide a relative measure of the industry-wide safety of natural
gas transmission pipelines. Direct comparisons between accident categories should be made
cautiously, however, because individual exposures to hazards are not uniform among all
categories. Furthermore, the fatality rate from natural gas pipelines is more than 25 times lower
than the fatalities from natural hazards such as lightning, tornados, floods, or earthquakes.
The available data show that natural gas transmission pipelines continue to be a safe, reliable
means of energy transportation. From 1991 to 2010, there were an average of 57 significant
incidents and two fatalities per year. The number of significant incidents over the more than
300,000 miles of natural gas transmission lines indicates the risk is low for an incident at any
given location. The operation of the proposed Project would represent only a slight increase in
risk to the nearby public.
Alaska Stand Alone Gas Pipeline 5.19-11 Final EIS
TABLE 5.19-5 Nationwide Accidental Deaths
Type of Accident Annual No. of Deaths
All accidents 123,706
Motor Vehicle 43,945
Poisoning 29,846
Falls 22,631
Injury at work 5,025
Drowning 3,443
Fire, smoke inhalation, burns 3,286
Floodsa 93
Lightninga 57
Tornadoa 57
Natural gas transmission pipelinesb 2
a NOAA 2009.
b PHMSA 2011
Source: U.S. Census Bureau 2007 (unless otherwise noted).
5.19.3.1 Terrorism and Security Issues
Following the terrorist attacks of September 11, 2001, terrorism has become a safety and
security concern for energy facilities and is an important consideration for the design,
construction, and operation of energy facilities. Both international and domestic terrorism have
changed the way pipeline operators as well as regulators must consider pipeline security, both
in approving new projects and in operating existing facilities. The likelihood of future attacks of
terrorism or sabotage occurring along the proposed Project is unpredictable and the continuing
need to construct facilities to support the development of the natural gas industry in Alaska is
not lessened by the threat of any potential future acts. Moreover, the arbitrary risk of such acts
does not support a finding that this particular Project should not be constructed.
Design, construction, and operations elements already integrated into the proposed Project
provide a level of security from such a threat including buried construction of the pipeline; locked
security fencing surrounding aboveground facilities; regular air and ground inspection of the
pipeline route; and regular visitation to aboveground facilities by O&M crews. Additionally,
specialized training in pipeline security awareness for pipeline employees is recommended by
the Transportation Security Administration. Further, specific information including pipeline
design and integrity; security risks; and HCAs are frequently kept confidential from the public in
order to maintain a higher level of security.

Alaska Stand Alone Gas Pipeline 5.19-12 Final EIS
5.19.3.2 ASAP Design Approach
According to 49 CFR 192.317: “The operator must take all practicable steps to protect each
transmission line or main from washouts, floods, unstable soil, landslides, or other hazards that
may cause the pipeline to move or to sustain abnormal loads.” The AGDC would complete
route investigations to ensure pipeline integrity is maintained for potential arctic hazards caused
by thermal interaction of the buried pipeline with the subsurface conditions. When the buried
pipeline operates above the freeze point temperature in initially frozen soil, the soil could thaw,
with subsequent loss of support and settlement of the pipeline. When the buried pipeline
operates below the freezing temperature in initially thawed soil, frost heave could occur, with
subsequent vertical upward movement of the pipeline. In both cases, the pipeline could
experience stress due to the differential movement of the pipeline.
To keep stress within acceptable limits and compliant with 49 CFR 192 requirements and
related industry standards, the AGDC is employing a design approach to develop limiting
curvatures which can be monitored through state-of-art pipeline pigging technology. The
limiting curvature criterion is derived from consideration of limiting tensile and compressive
strains capacities of the pipe material. The limiting curvature of the pipe is used for design
screening of the route terrain units and for developing operational monitoring using pipeline in-
line inspection (ILI) tools that detect pipeline movement (e.g., high-resolution geometry pigs).
The criteria are used to screen pipe route segments which do not exceed the criteria limits, after
evaluation of the interaction of the pipe material, its operating characteristics, and the segment
route subsurface behavior. Those segments that are determined to potentially exceed the
curvature criteria limits are subject to mitigative actions to reduce the pipe response to within
acceptable bounds.
The approach would be validated through Project-specific data collection and testing that
considers the proposed Project materials, route alignment and soils, and operational conditions.
The AGDC will address specific design details such as pipe wall thicknesses, grade, and design
factors for: road crossings, river crossings, bridge crossings, railroad crossings, Trans Alaska
Pipeline System (TAPS) crossings, populated areas, and major geologic fault locations during
detailed design. The AGDC plans to employ a stress-based design and to also include
provisions to prevent and mitigate an excessive bending strain. For a discussion of the
proposed Project design approach, see Alaska Stand Alone Gas Pipeline/ASAP Design
Methodology to Address Frost Heave Potential (prepared for the AGDC by Michael Baker Jr.,
Inc., 6/9/2011) located in Appendix N.
The integrity of this design approach is ensured through the proposed Project quality assurance
plans and operational safety and integrity management plans. Probabilities and consequences
of pipeline failure will be addressed during detailed design and will result in emergency
response plans and other proposed Project mitigation features. As with all other aspects of the
proposed Project, all plans and features will be reviewed and approved in accordance with the
State ROW Lease Stipulations found in Appendix M.

Alaska Stand Alone Gas Pipeline 5.19-13 Final EIS
Further, the AGDC will comply with all Federal and state pipeline safety regulations in the
design, construction, and operation of the pipeline, and in particular, those specified in
49 CFR Parts 191, 192, and 199. If necessary, the AGDC will apply for a special permit from
the PHMSA, as governed by 49 CFR 190.341. The AGDC will continue to work with the
PHMSA as the proposed Project develops.
The proposed Project will be constructed in areas that have historically experienced forest fires.
PHMSA safety standards relating to responding to emergencies and natural disasters, including
fires, will be considered for design and construction of the proposed Project. The pipeline will
be buried with at least 3 feet of cover for over 99 percent of the alignment. Due to the depth of
cover, a forest fire would have no safety impact on the buried portions of the proposed Project.
Block valves, other above ground appurtenances, and facility locations would be maintained to
provide adequate buffers and defensible space from potential fires.
Forest fires are not considered an instantaneous threat. Should a facility or valve location be
threatened, there would be sufficient time to muster resources to protect the proposed Project
and/or shut down the transportation of gas until the fire risk has passed. The great majority of
the proposed Project is located near a highway for access to the buried and aboveground
facilities. As a comparison, over 23,000 kilometers (14,200 miles) of gas transmission pipelines
in Alberta are constructed in areas, like Alaska, which experience numerous forest fires each
summer. Further, TAPS is constructed in areas which experience annual forest fires as it
transects Alaska and is above ground for a significant portion of its length.
5.19.4 NGL Spill Scenario
If there were a pipeline rupture, the leak detection system would close the pipeline isolation
valves, which are spaced at a maximum of 20 miles apart. In a 20-mile section of the pipeline at
operating conditions, the gas would contain the equivalent of approximately 1,745 barrels (bbls)
of propane and 164 bbls of butane 80 percent / pentane 20 percent. In the case of a rupture,
any release would be nearly all NGL vapor. The boiling point of propane at atmospheric
pressure is -43.8°F while the boiling points of butane and pentane are 31.1°F and 97°F
respectively. Winter temperatures could likely cause the butane and pentane components to
initially remain in a liquid state. However, if any liquids formed, much of the volume would
quickly evaporate due to the volatile nature of NGLs. The consequences of an accidental spill
of NGLs as a result of a pipeline rupture could include fire and/or explosion of NGL vapors.
Potential spill impacts are likely to be short-term and low magnitude due to the volatility of NGL
components. However, a small portion of the NGLs may not easily vaporize but may remain to
potentially migrate through soils and enter the groundwater if spill cleanup procedures were not
implemented.
Alaska Stand Alone Gas Pipeline 5.19-14 Final EIS
5.19.5 References
ADNR. See Alaska Department of Natural Resources.
Alaska Department of Natural Resources (ADNR). 2011a. Division of Oil and Gas, Petroleum
Systems Integrity Office (PSIO). Website: (http://dog.dnr.alaska.gov/PSIO/
PSIOHome.htm) accessed October 25, 2011.
Alaska Department of Natural Resources (ADNR). 2011b. Division of Oil and Gas, Petroleum
Systems Integrity Office (PSIO). Letter of Intent between PHMSA and the State of
Alaska. May 14, 2007. Website: (http://dog.dnr.alaska.gov/PSIO/Documents/
letter_of_intent_PHMSA.pdf).
Alaska Department of Natural Resources (ADNR). 2011c. ADL 418997 Right-of-Way Lease for
The Alaska Stand Alone Gas Pipeline/ASAP By and Between the State of Alaska and
The Alaska Gasline Development Corporation. July 25, 2011.
Michael Baker Jr., Inc. 2011. Alaska Stand Alone Gas Pipeline/ASAP Design Methodology to
Address Frost Heave Potential. Prepared for AGDC. June 9, 2011.
National Oceanic and Atmospheric Administration (NOAA). 2009. National Weather Service,
Office of Climate, Water and Weather Services, 30 year average (1980-2009). Website:
(http://www.weather.gov/om/hazstats.shtml).
NOAA. See National Oceanic and Atmospheric Administration.
PHMSA. See Pipeline and Hazardous Materials Safety Administration.
Pipeline and Hazardous Materials Safety Administration (PHMSA). 2011. PHMSA Significant
Incident Files, February 18, 2011. Website: (http://primis.phmsa.dot.gov/comm/reports/
safety/).
Transportation Security Administration. 2011. Pipeline Security Guidelines Publication.
April 2011. Website: (http://www.tsa.gov/assets/pdf/guidelines_final_apr2011.pdf).
U.S. Census Bureau. 2010. Statistical Abstract of the United States: 2011 (130th Edition)
Washington, DC, 2010. Website: (http://www.census.gov/statab).
U.S. Department Of Labor. 2010. Bureau of Labor Statistics, Consumer Price Index. Website:
(ftp://ftp.bls.gov/pub/special.requests/cpi/cpiai.txt) updated August 13, 2010.

Alaska Stand Alone Gas Pipeline
5.20 CUMULATIVE EFFECTS
FinalE'S

Alaska Stand Alone Gas Pipeline 5.20-1 Final EIS
5.20 CUMULATIVE EFFECTS
5.20.1 Introduction
This cumulative effects analysis includes the proposed Project and its components as described
in Section 2.0, Project Description, the connected actions discussed in Section 3.0 and the past,
present, and reasonably foreseeable future actions described below in Section 5.20.3.3. The
previous sections of Section 5, Environmental Analysis describe and evaluate the direct and
indirect environmental, social, and economic consequences of the proposed Project. The
following discussion evaluates the cumulative environmental, social, and economic effects of
the proposed 737-mile long pipeline system and the 35-mile long Fairbanks Lateral. Also
considered are the cumulative effects associated with the optional routing for crossing the
Yukon River, and a route variation through Denali National Park.
The purpose of the cumulative effects analysis is to identify any proposed Project effects that,
when combined with other effects to resources in the region, may cumulatively through
incremental impacts become significant. The analysis of cumulative effects in this EIS employs
the definition of cumulative effects found in the Council on Environmental Quality’s (CEQ)
regulations implementing the National Environmental Policy Act (NEPA). Please note that for
the purposes of this cumulative effects analysis, the terms ―effects‖ and ―impacts‖ are
synonymous as described in 40 CFR 1508.8(b):
The impact on the environment which results from the incremental impact of the action
when added to other past, present, and reasonably foreseeable future actions
regardless of what agency (federal or non-federal) or person undertakes such actions
(40 CFR 1508.7).
Not all actions identified in this section would have cumulative effects in all resource areas.
Potential effects for such actions are discussed in terms of the potentially affected resources.
When the effects of a reasonably foreseeable action cannot be quantified, qualitative
assessments are provided.
5.20.2 Key Assumptions of the Cumulative Effects Analysis
Key assumptions used for this cumulative effects analysis include:
There would be purchasers for the estimated quantities of utility grade natural gas for the
Fairbanks and Cook Inlet areas served by Fairbanks Natural Gas LLC (FNG), Golden
Valley Electric Association (GVEA), Flint Hills Refinery, ENSTAR, Matanuska Electric
Association (MEA), Chugach Electric Association (CEA), Homer Electric Association
(HEA), Municipal Light & Power (ML&P), and Seward Electrical Association (SES);
There would be purchasers for the propane, liquefied natural gas (LNG) and natural gas
liquids (NGLs) shipped to Southcentral Alaska by the proposed Project, and those
purchasers would have secured the necessary compliance with NEPA, permits issued,
Alaska Stand Alone Gas Pipeline 5.20-2 Final EIS
and facilities constructed to process and ship these products before the proposed
Project is operational;
Existing North Slope natural gas reserves would be adequate to support proposed
Project operations as proposed. No new mining or extraction operations would be
necessary for the proposed Project to proceed, and overall North Slope oil and gas
operations would be limited to transportation activities for purposes of this cumulative
effects analysis;
Past federal, state, and local authorizations to construct and operate the Trans Alaska
Pipeline System (TAPS) and its recent 30-year right-of-way (ROW) renewal are effective
in avoiding and minimizing adverse cumulative impacts from that project. These permit
requirements cover a wide range of resource protections including restoring vegetative
cover, preventing soil erosion, and maintaining water quality, timing windows for
crossing of fish-bearing streams, water withdrawal limits from lakes with fish, work in
sensitive habitat areas, employee training, public safety, and minimizing impacts to
subsistence users. Prior permit requirements will be updated to meet current standards
and applied to the location, design, construction and operation of this proposed Project;
The U.S. Department of Transportation Pipeline and Hazardous Materials Safety
Administration (PHMSA), the State Pipeline Coordinator Office (SPCO) and the operator
of the proposed Project will use a risk based compliance monitoring program that
emphasizes public safety and health, protection of the environment, and pipeline
integrity (BLM 2002);1
An LNG facility would be constructed on the North Slope and product from that facility
would be trucked to the Fairbanks area for use by FNG and GVEA/Flint Hills Refinery.
Final decisions for constructing the proposed Project will precede final decisions for
constructing the Alaska Pipeline Project (APP) under the Alaska Gas Inducement Act
(AGIA);
The interconnected electrical generation and transmission systems serving the Railbelt
(defined as the cities, towns, villages, and region served by the Alaska Railroad
Corporation [ARR] and also typically includes the Kenai Peninsula south of Seward to
Homer, Alaska) will continue to rely on a combination of energy sources including
natural gas, diesel, hydropower and coal as a source of fuel;
Wind farms will provide a viable, long-term contribution to electrical generation for the
Railbelt area and for some remote Alaska communities;
Electricity will not be an economical energy source for home and business heating;
Using depleted natural gas reservoirs for temporary storage of natural gas from existing
or new Cook Inlet gasfields for use during winter peak demand, discontinuing LNG
exports from Nikiski, Alaska, and increasing energy conservation measures will provide
short-term relief from the projected shortfall of proven natural gas reserves in Cook Inlet;
1 See Section 4.1.1.3, and 4.1.1.4 for the context of the compliance monitoring program for TAPS.

Alaska Stand Alone Gas Pipeline 5.20-3 Final EIS
Construction of a large hydroelectric project will provide a source of electricity that is now
dependent upon natural gas from Cook Inlet as the primary energy source;
Existing ROWs for major electrical transmission lines may be widened to accommodate
new parallel transmission lines required to meet existing and projected electrical
demands in the Railbelt area;
A large hydroelectric project will require new electrical transmission lines to connect the
Intertie system;
Discovery of economic natural gas reserves from one or more large natural gas fields in
the Cook Inlet area capable of meeting existing and future demand for natural gas is
uncertain;
It is unlikely the new electrical generation facilities will use coal as a primary source of
fuel;
Propane for heating and cooking in remote Alaskan communities is likely restricted to
coastal communities with regular, year around barge service and would be more
economical than fuel oil;
The relative cost of energy to Railbelt consumers produced by new and/or developing
technologies, such as the use of municipal waste to generate power, or the generation of
power from tidal or geothermal sources are beyond the scope of this evaluation and are
noted as ―speculative‖ projects during the next 60 years considered in the Cumulative
Effects Analysis; and
Renewal of the proposed Project ROW for a second 30-year period would likely require
a separate EIS as renewal of the TAPS ROW did.
5.20.3 Regulatory Framework
The actions considered in a cumulative effects analysis may vary from the proposed Project in
nature, magnitude, and duration. These actions are included in the analysis based on their
likelihood of occurrence, and only projects with either ongoing or reasonably foreseeable effects
are identified. Cumulative effects are assessed by combining the potential environmental
effects of the proposed Project and its connected actions with the ongoing effects of other
projects that have occurred in the past, as well as projects that are currently occurring, or are
proposed in the future in the vicinity of the proposed pipeline route.
Alaska Stand Alone Gas Pipeline 5.20-4 Final EIS
The CEQ has issued guidance on Considering Cumulative Effects under the National
Environmental Policy Act (DIRS 103162-CEQ 1997, et seq.). Although no universally accepted
framework for cumulative effects analysis exists, the following principles are provided by CEQ:
Cumulative effects are caused by the aggregate of past, present, and reasonably
foreseeable future actions;
Cumulative effects are the total effect, including both direct and indirect effects on a
given resource, ecosystem, and human community of all actions taken, no matter who
(federal, nonfederal, or private) has taken the actions;
Cumulative effects need to be analyzed in terms of the specific resource, ecosystem,
and human community being affected;
It is not practical to analyze the cumulative effects of an action on the universe; the list of
environmental effects must focus on those that are truly meaningful;
Cumulative effects on a given resource, ecosystem, and human community are rarely
aligned with political or administrative boundaries;
Cumulative effects may result from the accumulation of similar effects or the synergistic
interaction of different effects;
Cumulative effects may last for many years beyond the life of the action that caused the
effects; and
Each affected resource, ecosystem, and human community must be analyzed in terms
of its capacity to accommodate additional effect, based on its own time and space
parameters.
5.20.4 Methodology
In order to evaluate the potential cumulative effects from the proposed Project and ongoing and
reasonably foreseeable future actions, the affected environment must first be defined. Two
factors are considered when establishing the affected environment for a cumulative effects
analysis – the spatial/geographical environment and the temporal range of relevant past,
ongoing, and future projects. The spatial and temporal parameters for this cumulative effects
analysis were developed from the construction and operations information provided in
Section 2, Project Description; Section 3, Connected Actions; Section 4, Alternatives; and from
the results of direct effects analysis presented in Section 5, Environmental Analysis.
Also considered are the cumulative effects analyses contained in the 1988 BLM/USACE EIS
“Trans-Alaska Gas System (TAGS) Final Environmental Impact Statement” which evaluated the
cumulative effects of the previously authorized Alaska Natural Gas Transportation System
(ANGST) (a large diameter gas pipeline system between the North Slope and domestic markets
in the conterminous States generally following the highway systems through Alaska and
Canada) and a subsequently federal- and State-authorized large diameter gas pipeline system
between the North Slope and a LNG facility near Valdez to transport LNG to Pacific Rim
Countries. That EIS evaluated the relationship between the two large diameter pipeline

Alaska Stand Alone Gas Pipeline 5.20-5 Final EIS
systems and to the TAPS, and to existing transportation and utility infrastructure systems in
Alaska. The 1988 FEIS also evaluated an alternative pipeline alignment that essentially follows
the alignment of the proposed 737-mile Project ROW before continuing along the north side of
Cook Inlet and crossing Cook Inlet to a new LNG facility in the vicinity of Nikiski. More recently,
the Final Environmental Impact Statement - Renewal of the Federal Grant for the Trans-Alaska
Pipeline System Right-of-Way (BLM 2002) included ―Alaska North Slope Natural Gas
Commercialization‖, e.g., construction of a large diameter natural gas pipeline system following
the Alaska and Canada highways to the conterminous 48 states (now APP) or as large pipeline
for a LNG export project from Valdez (TAGS). The TAPS ROW renewal EIS provides
substantial data relative to the cumulative effects of the project where the two pipeline systems
and highways are in the same transportation corridor.
Based on the proposed Project’s affected environment, ongoing and reasonably foreseeable
future actions were selected and evaluated based on their spatial and temporal relationship to
the proposed Project. This includes continued operation and upgrading of existing electrical
generation facilities in the Railbelt. Which future projects would go into operation is a function of
the cost to produce and deliver a unit of electricity to the end consumer. The cost to the
consumer for electricity produced by natural gas, hydroelectric facilities, wind, diesel, coal, or
some other source likely would continue to be determined by the Alaska Regulatory
Commission (ARC) based on the actual costs of constructing the facility and the transportation
costs of that electricity. These types of economic comparison are beyond the scope of this EIS.
In accordance with CEQ guidelines, the overall objectives of this cumulative effects analysis are
to:
Focus on the effects and resources within the context of the proposed Project and its
connected actions;
Present a concise list of issues that have relevance to the anticipated effects of the
proposed Project and its connected actions or decision to be made;
Reach conclusions based on the best available data at the time of the analysis;
Rely on information from other agencies and organizations on reasonably foreseeable
projects or activities that are beyond the scope of participating agencies’ purview;
Relate to the geographic scope of the proposed Project and its connected actions; and
Relate to the temporal scope of the proposed Project and its connected actions.
5.20.5 Issues Relative to the Cumulative Effects Analysis
Issues that have overarching relevance and that are truly meaningful are the cumulative
relationship of the proposed Project to:
Proximity with TAPS and the Dalton, Elliott, and Parks Highways, and the ARR;
Proximity with two previously authorized ROWs for ANGTS and TAGS that are being
considered for the APP route. Note that as of October 27, 2011, the BLM has
terminated the ROW grant for TAGS;
Alaska Stand Alone Gas Pipeline 5.20-6 Final EIS
Connected actions necessary to achieve a design throughput of 500 million standard
cubic feet per day (MMscfd); and
Reasonably foreseeable energy projects serving the residents and businesses served by
the integrated Railbelt electrical generation and transmission system.
Other relevant issues considered are the cumulative relationship of the proposed Project to the:
Availability of gravel to construct both the proposed Project and the APP and for
continued maintenance of the Dalton, Elliott, and Parks Highways and the ARR;
Availability of water for construction; and
Proximity with areas having special designations such as Areas with Critical
Environmental Concern (ACECs), CSUs, State Parks, and State Game Refuges.
Cumulative effect issues were identified during the NEPA scoping process. Comments on
cumulative effects included requests to evaluate potential consequences outside of the
immediate proposed Project area boundaries, including effects to fish and wildlife habitat and
future development of oil and petroleum products (see Appendix B, Scoping Comments
Report).2 Requests were made to develop mitigation measures that protect wildlife and habitat,
address spill prevention and response, and wastewater management. Additional topics
included: light and air pollution; drilling, construction, and operations wastes; and subsistence
and cultural values. Also considered are the cumulative effects of the proposed Project with the
APP, TAPS, utility and communication systems and highways.
The cumulative effects discussion considers:
Geographic and Temporal Scope (Section 5.20.5.1);
Speculative Actions Not Brought Forward for Analysis (Section 5.20.5.2);
Actions Considered under the Cumulative Case (Section 5.20.5.3) – the proposed
Project and its connected actions described in Sections 2.0 and 3.0;
Past, Present, and Reasonably Foreseeable Future Actions (Section 5.20.5.4) –
including oil and gas and non-oil and gas activities); and
Projects that are Foreseeable if the proposed Project is Built (Section 5.20.5.5).
5.20.5.1 Geographic And Temporal Scope
The AGDC has defined the geographic extent of the affected environment as generally the
737-mile long pipeline corridor that reaches from Prudhoe Bay to a junction with the existing
ENSTAR pipeline system at MP 39 near Willow, Alaska. Also included is a 35-mile long lateral
pipeline that would connect to the natural gas distribution system in Fairbanks, known as the
2 The Scoping Report for the Alaska Stand Alone Pipeline EIS is available on the Project website at:
http://www.asapeis.com.
Alaska Stand Alone Gas Pipeline 5.20-7 Final EIS
Fairbanks Lateral (see Figure 1.0-1, Project Overview). The majority of the proposed Project
route parallels the Dalton Highway (State Highway 11) corridor from Prudhoe Bay to Livengood
for approximately 405 miles. From Livengood to the Parks Highway at MP 485 the ROW would
cross an undeveloped portion of the Minto Flats State Game Refuge; from MP 485 to MP 709 in
the vicinity of Willow, the proposed route would closely follow the Parks Highway (State
Highway 3). From MP 709 to 737 the ROW would cross an area that is largely undeveloped.
The 35 mile-long Fairbanks Lateral would primarily parallel the ARR to the north of the Parks
Highway.
Considering that the majority of the proposed pipeline would exist within the Dalton and Parks
Highway corridors, the existing corridors and the communities in the Railbelt that would use the
utility grade gas delivered by the proposed Project will constitute the primary area of analysis for
the cumulative effects of the pipeline and associated facilities.
The proposed pipeline would be engineered to a 30-year standard, but operation of this facility
could extend beyond its engineered lifespan. Furthermore, the BLM is considering a 30-year
ROW grant for the pipeline with a right-of-renewal of up to an additional 30 years. Therefore,
the temporal range for this cumulative effects analysis is from the present (2012) to 2071, which
is 30 years beyond the projected initial 30-year federal ROW for the proposed Project. Past
projects are considered back to the time of first oil development on the North Slope (1960s) and
the increase of transportation and facilities in the Railbelt at about the same time. For
consideration of impacts from the past and existing projects, it is assumed that the affected
environment as described for each resource in previous sections of Section 5, Environmental
Analysis, provide a baseline for affects analysis and incorporate the influences of these past
projects.
5.20.5.2 Speculative Actions Not Brought Forward for Analysis
Energy developments for which no formal proposal has been submitted or which seem unlikely
to occur within the foreseeable future are considered speculative. These may include projects
that are discussed in the public arena, but which propose technologies that are not yet proven to
be cost effective in the Alaskan environment, or are prohibited by law or for which there is no
current proposal before an authorizing land management agency. Speculative developments
are not considered reasonably foreseeable and are not analyzed as part of the cumulative
effects assessment. Speculative projects related to the proposed Project include:
The long-range potential to produce an additional 1,200 MW from tidal action in
Turnagain Arm;
It is assumed there will be continuing exploration and development of oil and gas
resources on the North Slope and adjacent marine waters and there would be continued
expansion of existing infrastructure connecting to the Prudhoe Bay area as new
discoveries lead to production. However, it speculative to assume where, when, and
which undiscovered oil and gas resources would result in an expansion of the existing
infrastructure;

Alaska Stand Alone Gas Pipeline 5.20-8 Final EIS
For the purposes of this cumulative effects analysis the potential production of electrical
energy from geothermal resources on the slopes of Mt. Spurr is considered to be
speculative;
It is likewise uncertain when municipal solid waste in the Anchorage and Fairbanks
areas would contribute to meeting a portion of the long-term demand for energy;
Further, it is recognized that a natural gas delivery system connected to consumers in
Alaska and, potentially for export, would have a positive effect on natural gas reserves
that have been stranded on the North Slope. Which of these potential future natural gas
resources on the North Slope would or would not have improved economics due to the
proposed Project remains speculative. This includes the Gubik gas field and the Umiat
oil field. While there has been recent drilling activity at the Gubik gas field, there is no
public documentation to indicate the commercial viability of development of the resource.
Leases for the Umiat oil field were purchased by Linc Energy in 2011 and there is
preliminary planning to drill in the winter of 2012-2013, but the commercial development
of that resource is not reasonably forseeable at this time.
Also considered are potential natural gas resources in the Nenana Basin and prospective oil
and gas resources in the Yukon Flats National Wildlife Refuge recently considered in the EIS for
the Proposed Land Exchange, Yukon Flats National Wildlife Refuge (USFWS 2010), as well as
the discovery and production of new commercial deposits of natural gas from the Cook Inlet
Area or the Alaskan North Slope.
Although information on two recent discoveries of natural gas in the Cook Inlet basin are not
publically available, it is likely the proven reserves of natural gas would meet projected demand
beyond the currently projected date when there would be a substantial short-fall of natural gas
supplies from Cook Inlet. These include the Shadura prospect in the Kenai National Wildlife
Refuge and the discovery announced by Escopeta Oil Co within the Kitchen Lights Unit north of
Nikiski.
The Shadura prospect is expected to "produce up to 50 million cubic feet" of natural gas starting
in February 2013. Applications to construct and operate the production of natural gas from the
Shadura prospect have been filed with the U.S. Fish and Wildlife Service (USFWS), the
USACE, and the State of Alaska (Anchorage Daily News 2011a). The Escopeta discovery as
announced is one that "could be the largest natural gas find in Cook Inlet in at least 25 years‖
(Peninsula Clarion 2011). Work at the discovery well has been suspended until the spring of
2012. Until firm data are available from the discovery well and likely from several more wells
the true potential of the discovery is not known (McClatchy 2011). Figure 5.20-1 presents a
map showing the existing gas fields and pipelines near Cook Inlet.
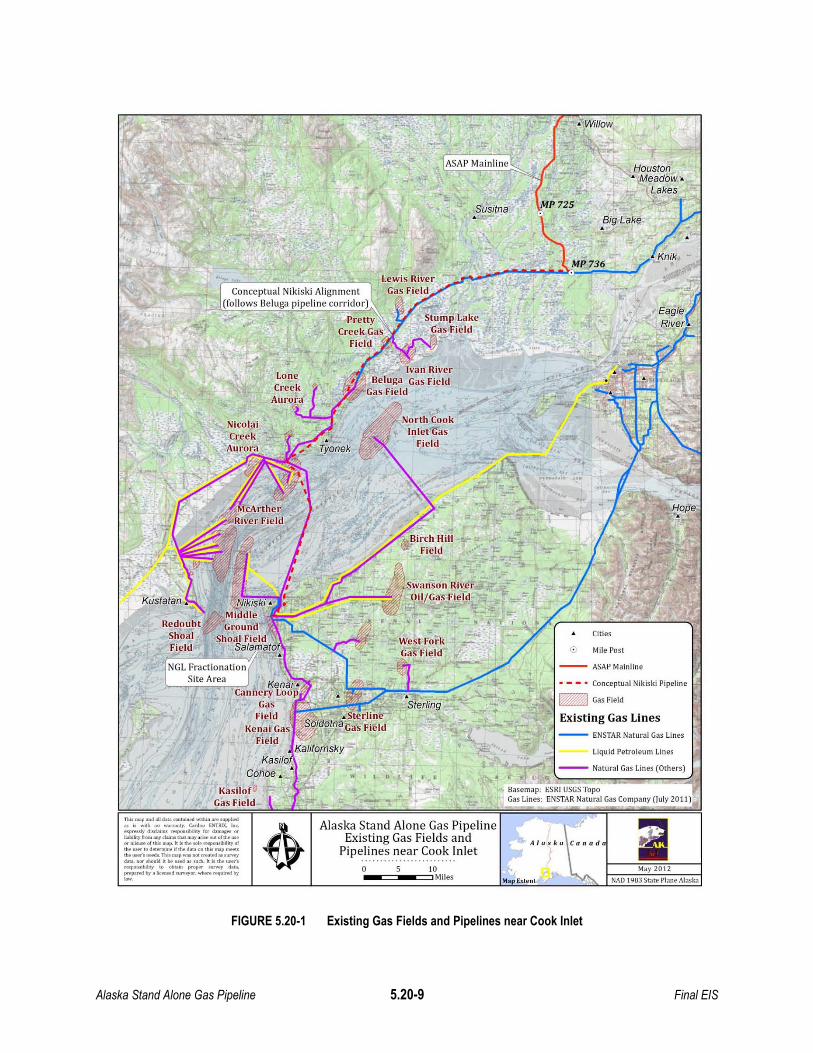
Alaska Stand Alone Gas Pipeline 5.20-9 Final EIS
FIGURE 5.20-1 Existing Gas Fields and Pipelines near Cook Inlet
May2012
isNAD 1963 State Plane Alaska
Cities
ASAP Mainline
Conceptual Nikiski Pipeline
Gas Field
Liquid Petroleum Lines
o Mile Post
Canada
Existing Gas Lines--- ENSTAR Natural Gas Lines
--- Natural Gas Lines (Others)
}
Basemap: ESRI USGS TopeGas Lines: ENSTAR Natural Gas Company (July 20 11)
10'Miles-o
Alaska Stand Alone Gas PipelineExisting Gas Fields and
Pipelines near Cook Inlet
nw mop and alIdau .-",h\od ..... '0 ..."""hod'" ;, ...h no _"""",. Conlno El'ITR1X, I"c._,....jy dl>d.l,nu~..b~lty r <1.1_ orli...,""'r ..., tUlno.,"," m>j' _01''''' ...... "' ",,!>is map. II .. til rnpon'ibililJ'oI'th< '.d...,.,.,...... ' .. d ""'h.. nup..-t.'ho 'Ill.. __ DOl =-'od ...."""<bu. oor ld ~"'.ood., ..d!. 11 .. tbo os""•....-.U>il.y 10 ob..ln p_ --, d_p~"".~... ,.",,,<>t. wI>et'o m,an.! loy"w.
•
Alaska Stand Alone Gas Pipeline 5.20-10 Final EIS
5.20.5.3 Actions Considered under the Cumulative Case
Actions Connected to the Proposed Project (Connected Actions)
The impacts of the connected actions as defined in Section 3.0 that are directly attributable to
the proposed Project at design throughput of 500 MMscfd are also considered in the cumulative
effects analysis. These connected actions include the construction and operation of four
pipelines connecting Prudhoe Bay Central Gas Facility (CGF) to the proposed Project’s Gas
Conditioning Facility (GCF).
Four primary pipelines would be constructed to bring natural gas from the CGF to the proposed
Project’s GCF for introduction to the proposed ASAP pipeline. A skid mounted connection
constructed by BP would be used to connect the four pipelines to the CGF. The pipelines would
then run less than a mile south and connect to the proposed Project’s GCF. The pipelines
would be used for the raw gas supply, the miscible injectant supply, the CO2 return line, and the
ethane return line. Sizing of the pipelines would be completed during the next phase of
engineering.
5.20.5.4 Past, Present, and Reasonably Foreseeable Future Actions
The purpose of this analysis is to determine the overall potential effect to each resource as
result of the proposed Project and its connected actions in combination with ongoing and
reasonably foreseeable future actions. These actions include projects/activities that may occur
in a broader geographic area than the proposed Project area (i.e., Parks and Dalton Highway
corridors) and include projects that may be in any one of a number of stages of development.
The following criteria were considered:
Past Development includes activities that were associated with past actions and may
involve present operations. This involves infrastructure development and non-oil related
actions, and oil industry facilities and present transportation of product from those
facilities. Past projects are considered part of the existing environment and reflected as
part of the No Action Alternative.
Present Development and Transport includes oil and gas transportation projects and
related activities that may just have come on-line, are currently under way, or are
planned for the near future. This may also include other non-oil-related development
that is presently under development.
Reasonably Foreseeable Future Development: Oil and gas transport or other projects
that are clearly identified and are expected to initiate transport-related activities (site
surveys, permitting, or construction) within the next 60 years. In addition to oil and gas
transport, other reasonably foreseeable future actions were identified. They include
continued human activities such as sport and subsistence hunting and fishing,
commercial fishing, sport harvest, tourism, recreational activities, land use planning, and
military projects.

Alaska Stand Alone Gas Pipeline 5.20-11 Final EIS
Table 5.20-1 provides an overview of the potential actions and projects that may result in a
cumulative effect and are considered herein. Figures 5.20-2 and 5.20-3 show the general
locations of many but not all of the activities considered. The following subsections provide
information of the specific geographic areas and types of projects to be considered in the
cumulative effects analysis. The following sections provide brief descriptions of the major
actions to be considered in the cumulative effects analysis.
Oil and Gas and Energy Generation Activities
Oil and gas activities include construction and ongoing maintenance of present infrastructure
facilities and transportation systems, activities that are currently under construction or currently
undergoing agency approval, and reasonably foreseeable future oil/gas transportation
components.
It is widely documented that the North Slope contains vast natural gas reserves (DOE 2009). In
2005, the U.S. Geological Service (USGS) estimated that approximately 37.5 trillion cubic feet
of natural gas and 478 million barrels of natural gas liquids were in reserve at the North Slope
(USGS 2005). Current oil extraction operations on the North Slope utilize the byproduct of
natural gas to pressurize the resource basin so that oil flows to gathering facilities at the
surface. Therefore, there are readily available natural gas resources on the North Slope, but
there are presently no natural gas transportation facilities. The proposed Project would be the
first to capitalize on these vast resources.
Trans Alaska Pipeline System
Initial construction of TAPS began in 1974 and concluded in 1977. In 2002, the oil pipeline
ROW was renewed for 30 years. The proposed Project parallels the TAPS route between
Prudhoe Bay and Livengood. Actions associated with the operations and maintenance of TAPS
facilities are considered reasonably foreseeable. For a detailed discussion of the relationship of
TAPS to the proposed Project, APP and Dalton/Elliott Highways see Section 5.20.6.5.
Point Thomson Gas Pipeline
In July of 2012, the USACE completed a Final EIS for a proposed exploration, production and
pipeline system at Point Thomson on the North Slope. The proposed Point Thompson facility
would include a central gravel pad for wells and facilities, two satellite gravel pads for wells, an
airstrip, a service dock, a sealift facility and barge mooring dolphins (dredging of around 1500
cubic yards may be required), a gravel mine site, infield gravel roads, and infield gathering
pipelines. A 23-mile-long export pipeline would also be constructed to transport hydrocarbon
liquids from Point Thomson to existing common carrier pipelines at the Badami Development.
The Point Thompson facility would also include infrastructure such as a waste injection well,
communications towers and staging facilities at Badami, Prudhoe Bay, and/or Deadhorse
(USACE 2011). The Point Thomson facilities would occur within or near the northern portion of
the proposed Project.
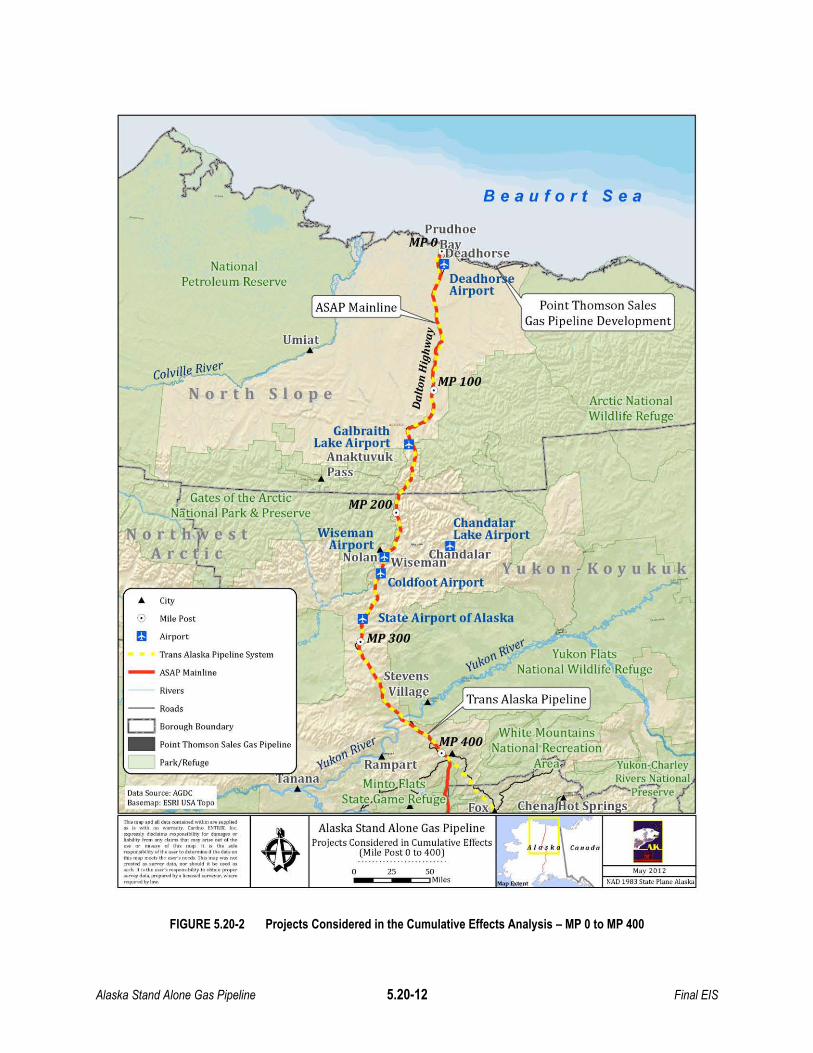
Alaska Stand Alone Gas Pipeline 5.20-12 Final EIS
FIGURE 5.20-2 Projects Considered in the Cumulative Effects Analysis – MP 0 to MP 400
Sea
Koyuku<k"..-
Beaufort
NationalPetroleum Reserve
Park/Refuge
Rivers
Mile Post
Trans Alaska Pipeline System
Airport
City..
- ASAP Mainline
Data Source: AGDCBasemap: ESRI USA Tapo
-- Roadso Borough Boundary
.. Point Thomson Sales Gas Pipeline
/~~~,/ ...-//\)1 )
~-J "L- ~_./'-"""- 'vI :j)
.c(~~_..""2.... ~-7 j'<-",-,?f-.. Prudhoe
'. ~ M~~ay
rJ ,.1JeadhOrse~ --.", ref»
Deadho ~~~r( Airport '\v-----------,---
[ASAP Mainline L : Point Thomson Sales~ Gas Pipeline Development
umiaJ fi--,," .~)
ColvillJ;~ ,./' ~ ,~ " § "MP-IOO
North Slope ~.,~ _ Arctic National
Galbraith ~' r-----~~~~~~~~-Lake Airport !\~
_~A~n-+aktuvuk OJ! \--L: ~ + .. pasft : I \~
rc:;;;;;.;;rth~rctic-----MP200 ·----------,-·~f -I National Park & Preserve ~
i ., Chanttalar1'j 0 r t b w est W.s.eman ~ Lake Airl10rtro. Airport , o. D
".A ret 1 C Nolanbw' Chandalar'--I (d Iseman y U k 0 n
,. -'--_~.LI ---.., r Coldfoot Airport~,
•, Staje Airport of Alaska
(JMP300 .~e(, ,,0(\ It' Yukon Flats\ Stevens ~\l National Wildlife Refuge
t Village T AI k p' I'"" ... fans as a Ipe me
"'~~ ~..... White Mountains
It,~e( ~P400 NatIOnal RecreatIOn~\l"0(\ Rat;;part il lre,,'!
.... ...,.~)\. R' N t' Ianana Minto Elats -,,,- -_>- ...~el~_;'lOna... a.;.;.:;-- ....... ~'- -~ ......../' ·Preserve ,J
State..Game Refuge Ft..\ ~h H t S~· ?)r" ox c -..ena 0 rm s
May 2012
NAD 1983 $t:Jte Plane Alask:!5.
Miles25•
Alaska Stand Alone Gas PipelineProjects Considered in Cumulative Effects
(Mile Post 0 to 400)
no. m... >no!" doLo """'...... ""liN. _ .......;0.1
.... .nth "" -,- c..Ino ENT1l1X. '00<,_ ...~, <loKi ...,...;bo~.,. 100' ""'- '"__,,""'"_"" _ ........... _01 ....
_ 0< ....... 01 II ""'I'- h .. "'._
_<I"'I"'oI"'."_"'d............~"'.""."""",mop_,!I<_,"_Tb.. ,.,." ..... "'"...-... __ dotL .... -.Id;,bo __
...,.... ,..... ..."....,.,.."" 'Y .._._
.....'l'd..~__~ ...;OU'W)'O<.""'....
.......... ..,. .....
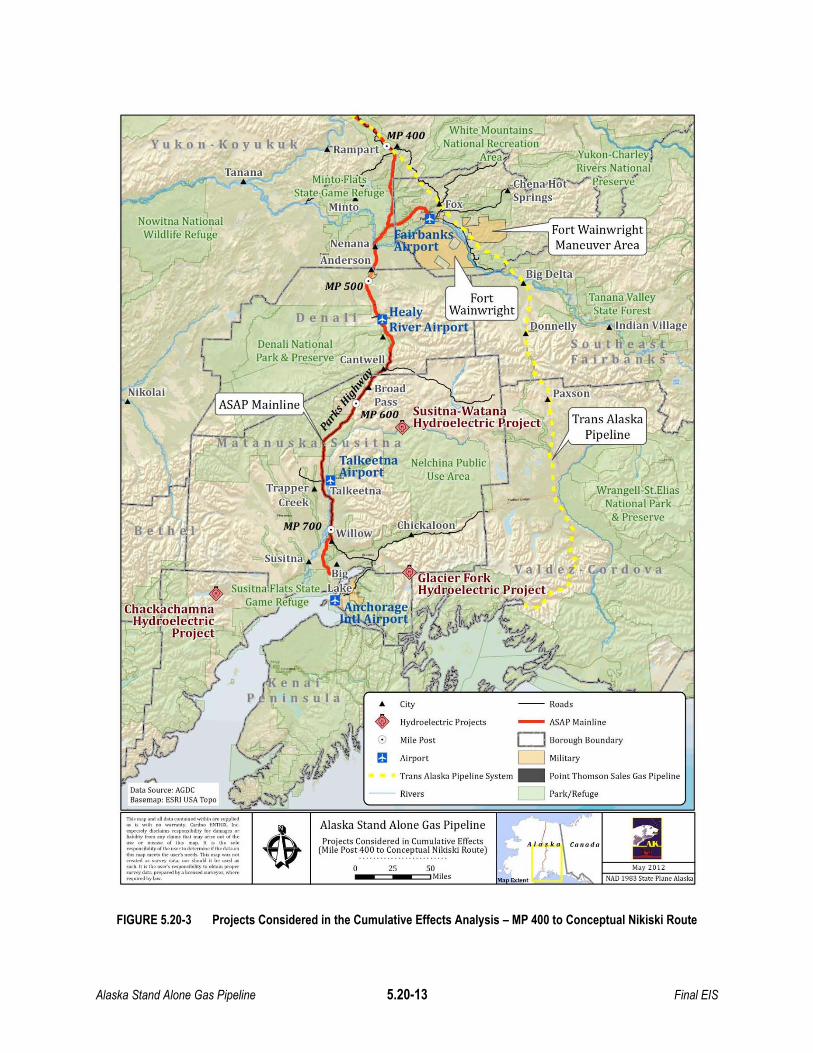
Alaska Stand Alone Gas Pipeline 5.20-13 Final EIS
FIGURE 5.20-3 Projects Considered in the Cumulative Effects Analysis – MP 400 to Conceptual Nikiski Route
May 2012
NAD 1983 Srate Plane Alaska
Wrangell.St.Elias <J
N~tionalPark "-J
&Preserve
Tanana ValleyState Forest
• Indian Village
Park/Refuge
-- RoadsCity
Rivers
Hydroelectric Projects - ASAP Mainline
Mile Post 0 Borough Boundary
Airport 0 Military
Trans Alaska Pipeline System _ Point Thomson Sales Gas Pipeline
""'='--, Fort Wainwright,',~-~ Maneuver Area
o 25 50__ •Mlles
... v'L MP 400 White Mountains
~~R .~, National Recreationampart ,) (' tre~';/ *' Xukon-Charley,
,~_../JI \. Rivers Nationaj'-.J"" -.. _"I---~- r Gl.\.w3.HOr·-"....- ~reserve
I '" I Springs I (I Fox ! .,)
Alaska Stand Alone Gas PipelineProjects Considered in Cumulative Effects
(Mile Post 400 to Conceptual Nikiski Route)
Tanana•
/------
/r-I -',./
,-..1
r-JI1LL..,
I
,/
Yukon-Koyukuk
Nowitna NationalWildlife Refuge
This .... _ all oI>lJI "OO"oIn<dwitlol......~pplood
.. is with "" ,.,..",y. Card... ElmllX. 1.<-""' .....Iy d,rdoo p_,,_y 10< cI.l...., orhoblloly from '"1 i !ho' ....y.no. ..... of "'~.- or ...i..... of this 'lUI' II iI tho 001._.-.lbll.yof .... ,,_'.d'..ntIio.U"'.d ""tln p -. 'be """' n .. m,p ~..cr t«! .,. dot>. kI it be od ••........ k ia <ibUi'y .. obul. p_"'''''1' d.~ IlftP b,._......ul'VO)'OI"........
~",r«Ibyb....
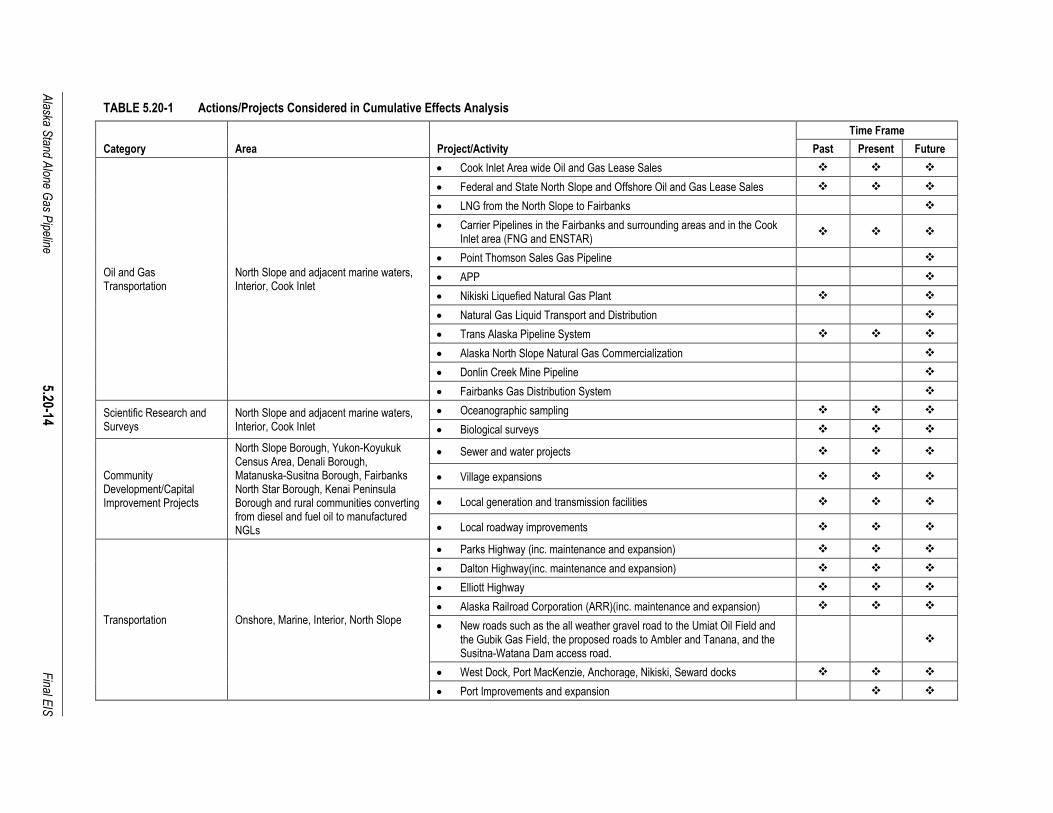
Alaska S
tand Alone G
as Pipeline
5.20-14
F
inal EIS
TABLE 5.20-1 Actions/Projects Considered in Cumulative Effects Analysis
Time Frame
Category Area Project/Activity Past Present Future
Oil and Gas Transportation
North Slope and adjacent marine waters, Interior, Cook Inlet
Cook Inlet Area wide Oil and Gas Lease Sales
Federal and State North Slope and Offshore Oil and Gas Lease Sales
LNG from the North Slope to Fairbanks
Carrier Pipelines in the Fairbanks and surrounding areas and in the Cook Inlet area (FNG and ENSTAR)
Point Thomson Sales Gas Pipeline
APP
Nikiski Liquefied Natural Gas Plant
Natural Gas Liquid Transport and Distribution
Trans Alaska Pipeline System
Alaska North Slope Natural Gas Commercialization
Donlin Creek Mine Pipeline
Fairbanks Gas Distribution System
Scientific Research and Surveys
North Slope and adjacent marine waters, Interior, Cook Inlet
Oceanographic sampling
Biological surveys
Community Development/Capital Improvement Projects
North Slope Borough, Yukon-Koyukuk Census Area, Denali Borough, Matanuska-Susitna Borough, Fairbanks North Star Borough, Kenai Peninsula Borough and rural communities converting from diesel and fuel oil to manufactured NGLs
Sewer and water projects
Village expansions
Local generation and transmission facilities
Local roadway improvements
Transportation Onshore, Marine, Interior, North Slope
Parks Highway (inc. maintenance and expansion)
Dalton Highway(inc. maintenance and expansion)
Elliott Highway
Alaska Railroad Corporation (ARR)(inc. maintenance and expansion)
New roads such as the all weather gravel road to the Umiat Oil Field and the Gubik Gas Field, the proposed roads to Ambler and Tanana, and the Susitna-Watana Dam access road.
West Dock, Port MacKenzie, Anchorage, Nikiski, Seward docks
Port Improvements and expansion

Alaska S
tand Alone G
as Pipeline
5.20-15
F
inal EIS
TABLE 5.20-1 Actions/Projects Considered in Cumulative Effects Analysis
Time Frame
Category Area Project/Activity Past Present Future
Land Use and Planning
North Slope Borough, Yukon-Koyukuk Census Areas, Denali Borough, Matanuska-Susitna Borough, Fairbanks North Star Borough, Kenai Peninsula Borough, Denali National Park and Preserve, Denali State Park, Minto Flats and BLM land use plans incorporating the PLO 5150 withdrawal to the extent ASAP and associated facilities are included in a BLM right-of-way
Comprehensive Plans
Resource Management Plans
Area, Master Plans
Minto Flats State Game Refuge Management Plan
Denali State Park Master Plan
Denali National Park and Preserve Entrance Area and Road Corridor Development Plan
Access to and Use of Subsistence Resources
Interior-Yukon River, Cook Inlet, North Slope villages and adjacent marine waters
Foraging (plant gathering, berry picking)
Hunting
Trapping
Fishing
Whaling
Sealing
Traveling
Tourism, Recreation, Sport Hunting and Fishing
State Recreation Areas and Parks (i.e., Nancy Lakes, Willow Creek, Denali State Park), Brooks Range, Denali National Park and Preserve, White Mountains National Recreation Area, TRAAK Areas, Dalton Highway Recreation Management Area
Denali National Park and Preserve Pedestrian and Bike Paths/Bridge adjacent to the Parks Highway·
Boat Launches and River Access
Trail system improvements/installation
Flight Seeing
Floating
Camping
Hunting, Fishing
Iditarod National Historic Trail
Commercial Fishing Colville River, Yukon River, Tanana River, Cook Inlet
Seasonal fishing activities for Arctic Cisco
Salmon and halibut
Military Fort Wainright, Fort Greely, Joint Base Elmendorf-Richardson, Clear Air Force Station
Infrastructure improvements
Potential conversion of diesel electrical generation to natural gas
Base Upkeep

Alaska S
tand Alone G
as Pipeline
5.20-16
F
inal EIS
TABLE 5.20-1 Actions/Projects Considered in Cumulative Effects Analysis
Time Frame
Category Area Project/Activity Past Present Future
Energy & Utilities
Population Centers (i.e., Boroughs, Cities), Cook Inlet, Interior, Regulated energy utilities (HEA, SES, CEA, ML&P, MEA, GVEA, FNG, ENSTAR)
Buried Utilities (fiber optic cable, sewer/wastewater infrastructure, etc.)
Renewable Energy Project Development Wind Power Hydroelectric Power
Population Growth, Energy Consumption/Demand Long-term supply of natural gas for heating and electrical generation
meeting future demand
Transmission Line and Facility Upgrades and Maintenance
Mining State and private land-holdings
Donlin Gold
Chuitna Coal
Usibelli
Future Gas Use Scenarios
LNG Export
Anchor Industrial Users Donlin Creek Mine Accelergy
Others
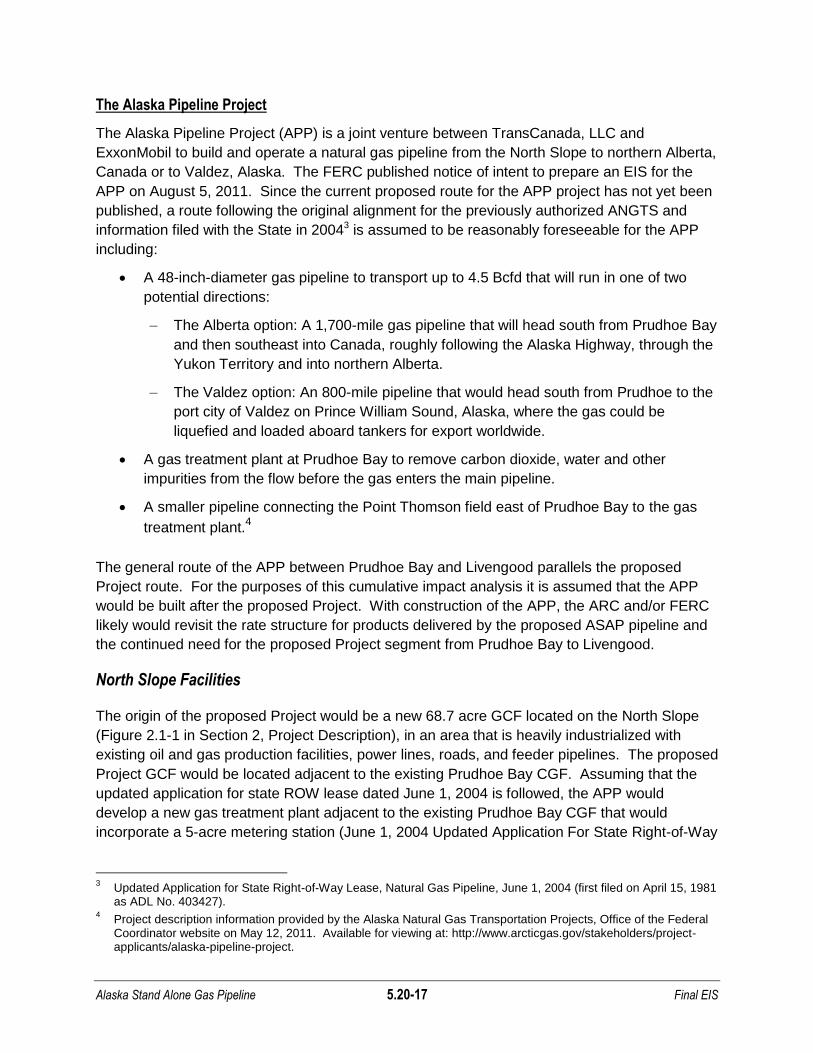
Alaska Stand Alone Gas Pipeline 5.20-17 Final EIS
The Alaska Pipeline Project
The Alaska Pipeline Project (APP) is a joint venture between TransCanada, LLC and
ExxonMobil to build and operate a natural gas pipeline from the North Slope to northern Alberta,
Canada or to Valdez, Alaska. The FERC published notice of intent to prepare an EIS for the
APP on August 5, 2011. Since the current proposed route for the APP project has not yet been
published, a route following the original alignment for the previously authorized ANGTS and
information filed with the State in 20043 is assumed to be reasonably foreseeable for the APP
including:
A 48-inch-diameter gas pipeline to transport up to 4.5 Bcfd that will run in one of two
potential directions:
The Alberta option: A 1,700-mile gas pipeline that will head south from Prudhoe Bay
and then southeast into Canada, roughly following the Alaska Highway, through the
Yukon Territory and into northern Alberta.
The Valdez option: An 800-mile pipeline that would head south from Prudhoe to the
port city of Valdez on Prince William Sound, Alaska, where the gas could be
liquefied and loaded aboard tankers for export worldwide.
A gas treatment plant at Prudhoe Bay to remove carbon dioxide, water and other
impurities from the flow before the gas enters the main pipeline.
A smaller pipeline connecting the Point Thomson field east of Prudhoe Bay to the gas
treatment plant.4
The general route of the APP between Prudhoe Bay and Livengood parallels the proposed
Project route. For the purposes of this cumulative impact analysis it is assumed that the APP
would be built after the proposed Project. With construction of the APP, the ARC and/or FERC
likely would revisit the rate structure for products delivered by the proposed ASAP pipeline and
the continued need for the proposed Project segment from Prudhoe Bay to Livengood.
North Slope Facilities
The origin of the proposed Project would be a new 68.7 acre GCF located on the North Slope
(Figure 2.1-1 in Section 2, Project Description), in an area that is heavily industrialized with
existing oil and gas production facilities, power lines, roads, and feeder pipelines. The proposed
Project GCF would be located adjacent to the existing Prudhoe Bay CGF. Assuming that the
updated application for state ROW lease dated June 1, 2004 is followed, the APP would
develop a new gas treatment plant adjacent to the existing Prudhoe Bay CGF that would
incorporate a 5-acre metering station (June 1, 2004 Updated Application For State Right-of-Way
3 Updated Application for State Right-of-Way Lease, Natural Gas Pipeline, June 1, 2004 (first filed on April 15, 1981
as ADL No. 403427). 4 Project description information provided by the Alaska Natural Gas Transportation Projects, Office of the Federal
Coordinator website on May 12, 2011. Available for viewing at: http://www.arcticgas.gov/stakeholders/project-applicants/alaska-pipeline-project.

Alaska Stand Alone Gas Pipeline 5.20-18 Final EIS
Lease, Natural Gas Pipeline)5. The extent, if any, that the existing Prudhoe Bay CGF would be
modified to accommodate the APP is subject to FERC and other agency evaluations that have
not been completed.
Other reasonably foreseeable construction in this area would involve the construction of a
facility to produce LNG for delivery to Fairbanks by truck. This cumulative effects analysis
assumes there would be one LNG facility on the North Slope, and the footprint would be similar
to ENSTARs existing LNG production facility at MP 39 of the Beluga Pipeline (less than
10 acres).
The proposed Point Thomson Project would produce natural gas condensate products and
possibly oil that would be delivered by pipeline to the existing Badami pipeline system that now
transports products to the Prudhoe Bay industrial area.
Energy for Utilities
The majority of natural gas that would be transported by the proposed Project from the North
Slope would be consumed in population centers (i.e., Fairbanks, Anchorage, Matanuska-
Susitna and Kenai Peninsula Boroughs) and would be used to generate electricity and provide
building heating. However, there are other energy generation projects that could have a
cumulative effect on energy supply and consumption in the region. This cumulative effects
analysis assumes that natural gas for heating would not be replaced by electrical energy for
heating during the time the proposed Project would be operational. The estimated volumes of
product would be expected to change as renewable energy generation supplements the long-
term demand for electrical generation using natural gas. New discovery of economic natural
gas resources in the Cook Inlet area in excess of demand would reasonably be used to produce
NGLs for export.
Gas for Electrical Power Generation
The proposed Project would provide utility grade natural gas to ENSTAR, displacing or
supplementing natural gas supplies currently obtained from Cook Inlet gas fields. Figure 5.20-1
above shows the area presently served by ENSTAR including the mainline pipeline systems
that presently transport natural gas produced from Cook Inlet. The ENSTAR distribution
system, including its sister company, Alaska Pipeline Company, is approximately 3,650-miles
long and serves 350,000 direct customers. ENSTAR also supplies natural gas for electrical
generation in the southern Railbelt area (ENSTAR 2011). The ENSTAR pipeline system
delivers natural gas to Chugach Electric Association, Inc. (CEA), Municipal Light and Power
(ML&P), Homer Electric Association (HEA), and Matanuska Electric Association (MEA). The
electrical generation facilities of these associations are summarized below.
5
APP has indicated a new conditioning facility may not or may not be owned by APP.

Alaska Stand Alone Gas Pipeline 5.20-19 Final EIS
There are five regional electrical service areas that would benefit from the natural gas supplied
to ENSTAR by the proposed Project:
CEA Service Area: CEA provides service to 81,047 metered retail locations that extend
from Anchorage to the Kenai Peninsula to Whittier, Alaska on Prince William Sound, to
Tyonek on the west side of Cook Inlet via several production facilities with a 530.1 MW
of installed capacity from a variety of power sources for electrical generation. In 2009,
90 percent of the total generation of electricity by CEA was from facilities using natural
gas; the remaining 10 percent was produced from hydroelectric facilities. CEA operates
2,218 miles of energized line that includes 533 miles of jointly owned line, 916 miles of
overhead lines, and 769 miles of buried lines. Concurrently, electrical power produced
by CEA is connected to an integrated system that connects an area from Homer to the
GVEA system described above and through economy energy sales to HEA, the City of
Seward, MEA, and GVEA with occasional purchase or sale of energy produced by
ML&P (Chugach 2011).
HEA Service Area: HEA is connected to the Railbelt generation and transmission
(G&T) system and serves 21,793 customers with a system totaling 2,361 miles of
transmission line. The Nikiski power plant generates about 14 MW of electrical energy
that serves its customers and the 16.9 MW Bernice Lake Generation Plant which is in
the process of being purchased from CEA (Homer Electric Association Inc. 2011).
MEA Service Area: MEA purchases the electricity distributed over more than
4,000 miles of transmission line to its more than 55,000 customers in the
Matanuska-Susitna Borough. This will change when MEA receives electricity generated
by the new Eklutna 180 MW plant. Electricity will be produced with natural gas from
Cook Inlet (Matanuska Electric Association 2011).
ML&P Service Area: In 2009 ML&P served an average of 24,139 residential customers
and 6,264 commercial customers in the Anchorage area. ML&P also provides all
requirements for power to the Joint Base Elmendorf-Richardson with 83 percent of its
revenue from the electrical energy provided to the military. ML&P owns two power
plants with a total of 8 turbines (two can use No. 2 fuel oil as an alternate and one
operates on waste heat, otherwise the plants run on natural gas). ML&P also has a
53.33 percent interest in the Eklutna Lake hydroelectric facility and is required to
purchase 25.9 percent of the electricity produced at the Bradley Lake Hydroelectric
Project near Homer. Total generating capacity is 333.2 MW with electricity distributed
over 410 miles of transmission lines (ML&P 2011).
SES: Seward Electrical Services is owned by the City of Seward. It does not directly
use ENSTAR gas but purchases power from CEA and has six diesel-powered backup
generators.
Alaska Stand Alone Gas Pipeline 5.20-20 Final EIS
Wind Power and Clean Coal
Section 4, Alternatives, identifies the potential to produce electrical generation by wind farms
that would connect to the existing electrical transmission systems. These are the Eva Creek
Wind Farm near Healy (24.6 MW), the Fire Island Wind Farm at Anchorage (54 MW), and a
wind farm at Nikiski (15 MW). The Healy Clean Coal Project would contribute 50 MW of
electrical energy to the utilities connected to the Railbelt transmission system. These projects
could reduce, but not eliminate, the demand for natural gas, and would contribute to the State’s
energy goal of providing 50 percent of Railbelt power from renewable resources by 2025.
Hydroelectric Power
If a large hydroelectric project such as the downsized Susitna Hydropower Project (600 MW)
(Watana Project) (Office of Governor Sean Parnell 2011) or the Chackachamna hydroelectric
project were to displace electricity currently generated by natural gas, up to approximately
50 MMscfd of natural gas would be conserved. Therefore, the Susitna Hydropower Project
could reduce natural gas demand by approximately 10 percent, but would not supplant the
500 MMscfd that would be transported by the proposed Project. Energy conservation projects
such as home and business weatherization and upgrading current electrical generating facilities
has the potential to reduce demand for natural gas now used to generate electricity and for
heating. None of the renewable energy projects as well as energy conservation measures are
deemed to replace the Purpose and Need for the proposed Project described in Section 1,
Purpose and Need. The mix of projected demand for products that would be transported by the
proposed Project would change as other energy projects are developed, but the overall
throughput of 500 MMscfd would not change since the proposed Project throughput for energy
production in excess of in-state use could be used to manufacture NGLs, LNG, and CNG for
export.
Transmission Line Upgrades
The Knik-Willow Line as well as other high voltage transmission lines throughout the Railbelt
would be upgraded and additional parallel lines constructed to enhance the long-term reliability
of the entire system to deliver the quantities of electricity where and when needed. The Alaska
Energy Authority (AEA) proposes to upgrade the existing Anchorage-to-Fairbanks Intertie
(Intertie) with a 25-mile 230 kV transmission line running from the Teeland substation to the
Willow substation. Other new, as yet conceptual transmission lines would be required when
new energy projects, such as the Watana hydroelectric project, or wind farms are added to the
mix of energy supplied to the Railbelt transmission systems.
Long-term Planning
In February 2010, a Regional Integrated Resource Plan (RIRP) set out a 50-year plan that
identified combinations of G&T facilities in the Railbelt. RIRP was funded by the Alaska
Legislature and led by the AEA. It addressed the energy needs in the combined service areas
of the ML&P, CEA, SES, GVEA, HEA and MEA. The plan was not considered a State or
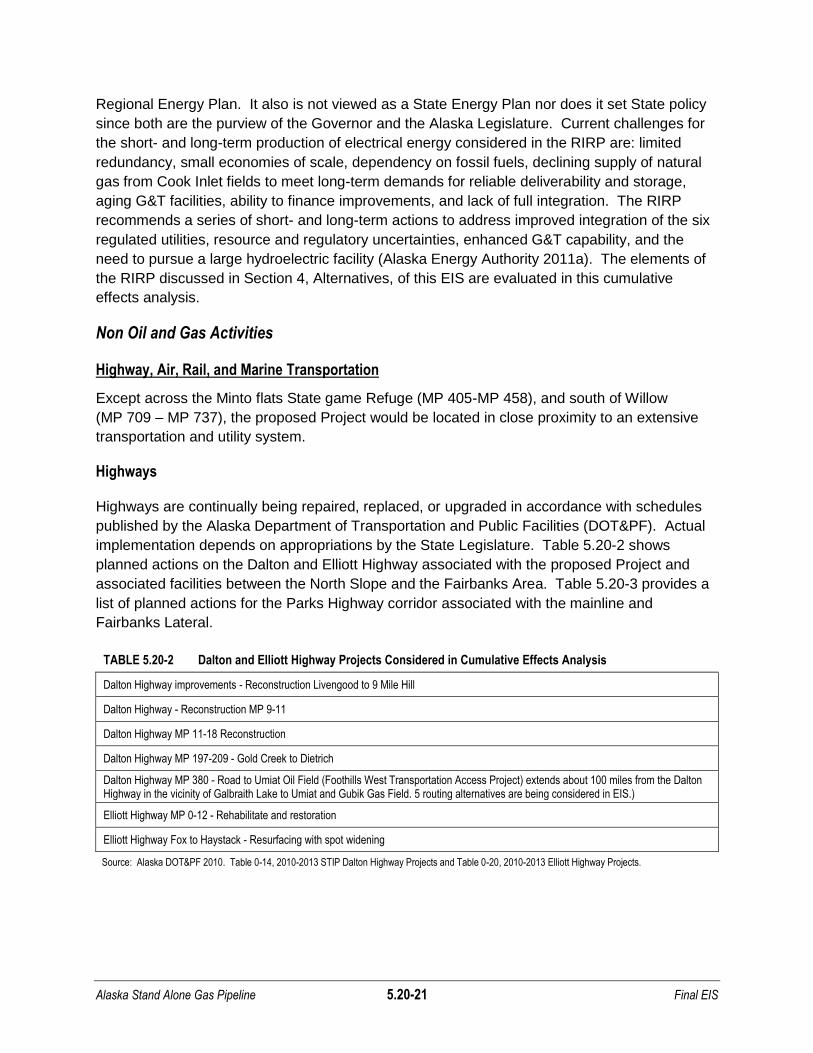
Alaska Stand Alone Gas Pipeline 5.20-21 Final EIS
Regional Energy Plan. It also is not viewed as a State Energy Plan nor does it set State policy
since both are the purview of the Governor and the Alaska Legislature. Current challenges for
the short- and long-term production of electrical energy considered in the RIRP are: limited
redundancy, small economies of scale, dependency on fossil fuels, declining supply of natural
gas from Cook Inlet fields to meet long-term demands for reliable deliverability and storage,
aging G&T facilities, ability to finance improvements, and lack of full integration. The RIRP
recommends a series of short- and long-term actions to address improved integration of the six
regulated utilities, resource and regulatory uncertainties, enhanced G&T capability, and the
need to pursue a large hydroelectric facility (Alaska Energy Authority 2011a). The elements of
the RIRP discussed in Section 4, Alternatives, of this EIS are evaluated in this cumulative
effects analysis.
Non Oil and Gas Activities
Highway, Air, Rail, and Marine Transportation
Except across the Minto flats State game Refuge (MP 405-MP 458), and south of Willow
(MP 709 – MP 737), the proposed Project would be located in close proximity to an extensive
transportation and utility system.
Highways
Highways are continually being repaired, replaced, or upgraded in accordance with schedules
published by the Alaska Department of Transportation and Public Facilities (DOT&PF). Actual
implementation depends on appropriations by the State Legislature. Table 5.20-2 shows
planned actions on the Dalton and Elliott Highway associated with the proposed Project and
associated facilities between the North Slope and the Fairbanks Area. Table 5.20-3 provides a
list of planned actions for the Parks Highway corridor associated with the mainline and
Fairbanks Lateral.
TABLE 5.20-2 Dalton and Elliott Highway Projects Considered in Cumulative Effects Analysis
Dalton Highway improvements - Reconstruction Livengood to 9 Mile Hill
Dalton Highway - Reconstruction MP 9-11
Dalton Highway MP 11-18 Reconstruction
Dalton Highway MP 197-209 - Gold Creek to Dietrich
Dalton Highway MP 380 - Road to Umiat Oil Field (Foothills West Transportation Access Project) extends about 100 miles from the Dalton Highway in the vicinity of Galbraith Lake to Umiat and Gubik Gas Field. 5 routing alternatives are being considered in EIS.)
Elliott Highway MP 0-12 - Rehabilitate and restoration
Elliott Highway Fox to Haystack - Resurfacing with spot widening
Source: Alaska DOT&PF 2010. Table 0-14, 2010-2013 STIP Dalton Highway Projects and Table 0-20, 2010-2013 Elliott Highway Projects.
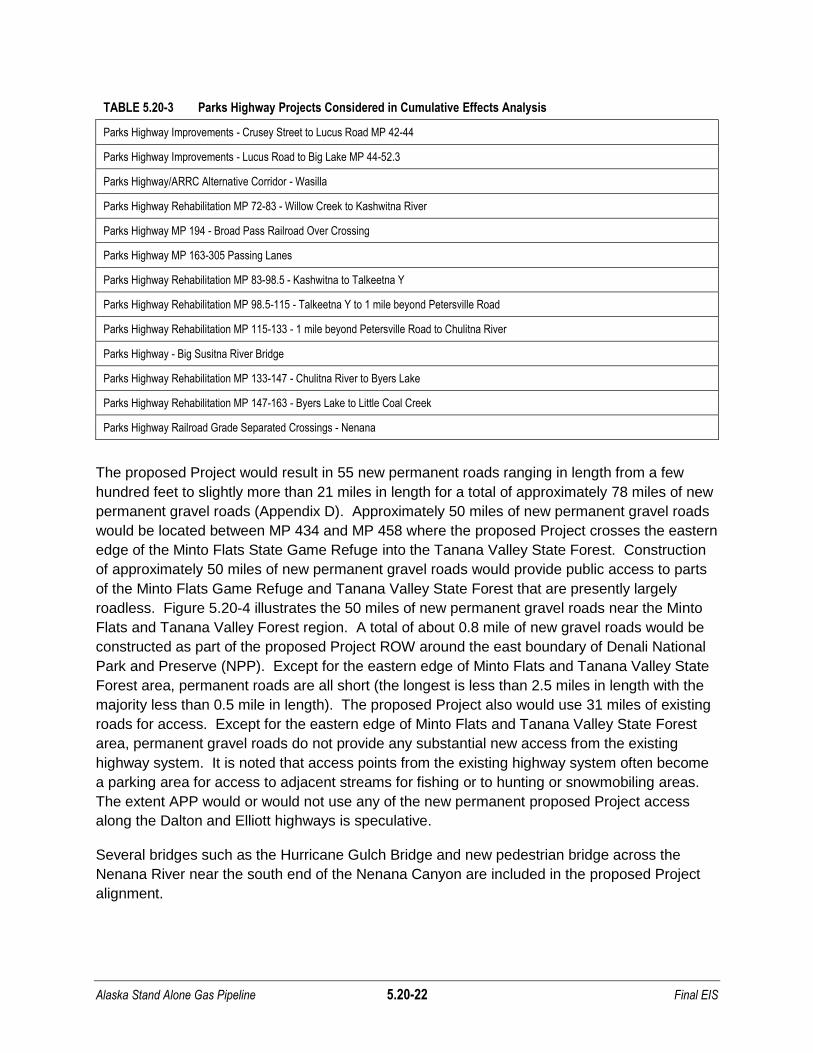
Alaska Stand Alone Gas Pipeline 5.20-22 Final EIS
TABLE 5.20-3 Parks Highway Projects Considered in Cumulative Effects Analysis
Parks Highway Improvements - Crusey Street to Lucus Road MP 42-44
Parks Highway Improvements - Lucus Road to Big Lake MP 44-52.3
Parks Highway/ARRC Alternative Corridor - Wasilla
Parks Highway Rehabilitation MP 72-83 - Willow Creek to Kashwitna River
Parks Highway MP 194 - Broad Pass Railroad Over Crossing
Parks Highway MP 163-305 Passing Lanes
Parks Highway Rehabilitation MP 83-98.5 - Kashwitna to Talkeetna Y
Parks Highway Rehabilitation MP 98.5-115 - Talkeetna Y to 1 mile beyond Petersville Road
Parks Highway Rehabilitation MP 115-133 - 1 mile beyond Petersville Road to Chulitna River
Parks Highway - Big Susitna River Bridge
Parks Highway Rehabilitation MP 133-147 - Chulitna River to Byers Lake
Parks Highway Rehabilitation MP 147-163 - Byers Lake to Little Coal Creek
Parks Highway Railroad Grade Separated Crossings - Nenana
The proposed Project would result in 55 new permanent roads ranging in length from a few
hundred feet to slightly more than 21 miles in length for a total of approximately 78 miles of new
permanent gravel roads (Appendix D). Approximately 50 miles of new permanent gravel roads
would be located between MP 434 and MP 458 where the proposed Project crosses the eastern
edge of the Minto Flats State Game Refuge into the Tanana Valley State Forest. Construction
of approximately 50 miles of new permanent gravel roads would provide public access to parts
of the Minto Flats Game Refuge and Tanana Valley State Forest that are presently largely
roadless. Figure 5.20-4 illustrates the 50 miles of new permanent gravel roads near the Minto
Flats and Tanana Valley Forest region. A total of about 0.8 mile of new gravel roads would be
constructed as part of the proposed Project ROW around the east boundary of Denali National
Park and Preserve (NPP). Except for the eastern edge of Minto Flats and Tanana Valley State
Forest area, permanent roads are all short (the longest is less than 2.5 miles in length with the
majority less than 0.5 mile in length). The proposed Project also would use 31 miles of existing
roads for access. Except for the eastern edge of Minto Flats and Tanana Valley State Forest
area, permanent gravel roads do not provide any substantial new access from the existing
highway system. It is noted that access points from the existing highway system often become
a parking area for access to adjacent streams for fishing or to hunting or snowmobiling areas.
The extent APP would or would not use any of the new permanent proposed Project access
along the Dalton and Elliott highways is speculative.
Several bridges such as the Hurricane Gulch Bridge and new pedestrian bridge across the
Nenana River near the south end of the Nenana Canyon are included in the proposed Project
alignment.
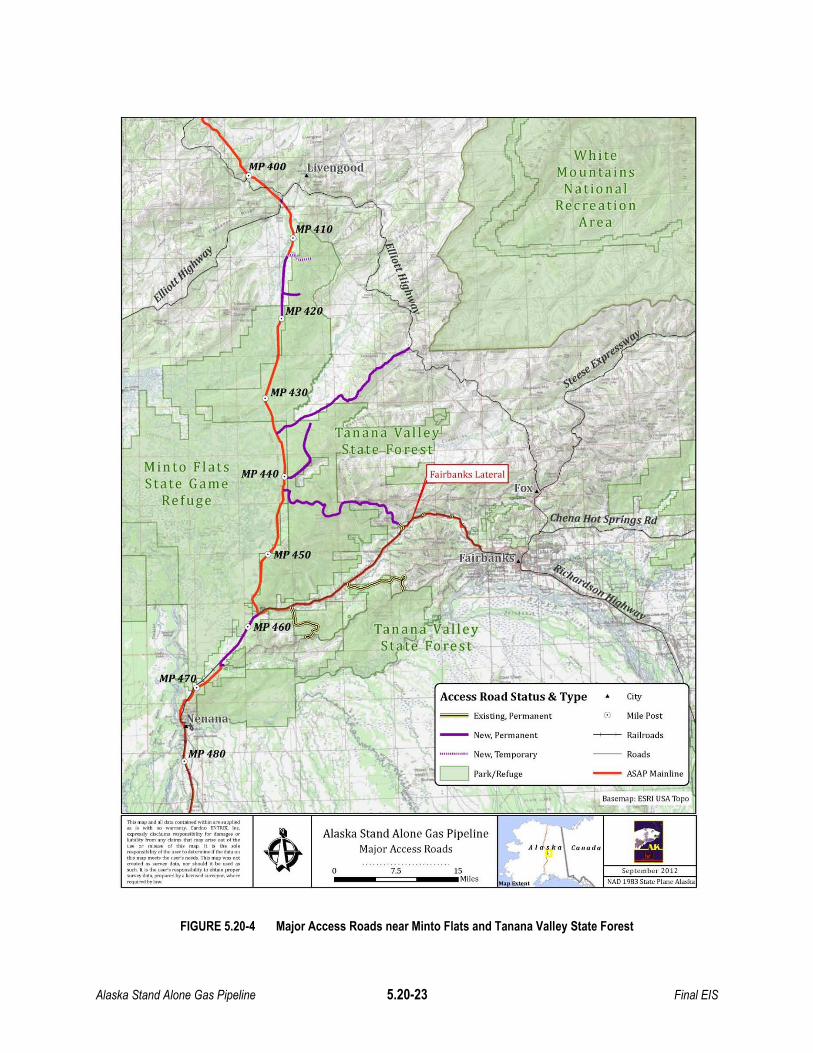
Alaska Stand Alone Gas Pipeline 5.20-23 Final EIS
FIGURE 5.20-4 Major Access Roads near Minto Flats and Tanana Valley State Forest
Access Road Status & Type City
"
Railroads
o Mile Post
- ASAP Mainline
-- Roads
WhiteMountainsNational
RecreationArea
New, Permanent
...
15Miles
New, Temporary
o Park/Refuge
7.5o
Alaska Stand Alone Gas PipelineMajor Access Roads
Minto FlatsState Game
Refuge
n.;. h'"", • .,01 .11 dna coo"....-I wid"" ue"UI>pIiod.. ;,; wllh no "",~,y, (_0 ENlltlX. tnc."""......, d,II<l<........pon>ib<hty for d !!"1' or~.bohty 1n>nI."y<lo;.. 1M _ 01 '~e
""" or mj ..... of ,I ". It ill tho ooI~
_oi"')"Yofllo."_'o """;..llt~.d•• ""'hll .....- tt..."..... n_ n".mapw.. hOI
<r'M<od "",oydll ".".."""ld ;'be"""" •••uch It i.,h~"""', p""'jbo~ty toolJuin proper<uNOj'd.U.~by."""',ood.~._
""l....... byl....,

Alaska Stand Alone Gas Pipeline 5.20-24 Final EIS
Airports
The applicant has identified 14 existing airports and airstrips that would be used to support
construction. The Anchorage, Deadhorse, and Fairbanks airports would be hubs while
Galbraith Lake, Healy River Strip, Prospect Creek and Talkeetna would be primary airports.
The state owns 11 of the 14 airports; the exceptions are Cantwell (private), Five Mile (BLM), and
Nenana Municipal (Nenana). As with highways, the State schedules airport improvements to
meet existing and projected demand. The applicant believes the selected 14 airports generally
are adequate but some may require upgrades to improve runways, lighting, communications, or
navigational aids. Airport improvements are subject to the availability of federal and state
funding and state priorities. The hub and primary airports provide scheduled passenger and
freight service as well as serving private and charter air operations. Nine of the airports
(Anchorage, Deadhorse, Fairbanks, Galbraith Lake, Prospect Creek, Chandalar Shelf, Coldfoot,
Five Mile, and Livengood Camp) also would likely be used for the APP. Upgrades to airport
facilities at Anchorage, Talkeetna, and Deadhorse are in the current State of Alaska Airport
Improvement Plan schedule. These airport improvements are independent of the proposed
Project.
Rail
The ARR is state-owned but operates as a private enterprise that is funded by the services
provided and from leases of its real estate holdings. The proposed Project would not require
improvement to the ARR. The ARR provides both passenger and freight service between
Seward, Whittier, Anchorage, Fairbanks, and freight only services to Fort Wainright, Flint Hills in
North Pole, and Eielson Air force Base. Passenger service between Anchorage and Fairbanks
is scheduled year-around. During the summer, there is daily service between Seward, Whittier,
Anchorage and Fairbanks, with flag-stop service to rural residents and recreationists along the
rail system in areas not readily accessible by road. The ARR is in the process of extending rail
service to Fort Greely southwest of Delta Junction and is acquiring a right-of-way to extend rail
service to Port MacKenzie. There is regular freight service transporting refined fuel products
and gravel. Coal from the mine at Healy was previously shipped to the Port of Seward for
export, prior to the shut-down of the Healy Clean Coal Project in 2000. Other freight is
scheduled on an as need basis. Both Seward and Whittier are designed to receive freight by
hydrotrain (barges equipped to transport large items on rail cars).
The applicant selected Seward as the primary delivery point for all pipe and most construction
equipment and bulk supplies due to the existing ARR facilities. The ARR would transport the
pipe to Fairbanks for pipe coating and double jointing. Coated, double jointed pipe would be
transported south of Fairbanks primarily by rail to laydown/construction camps adjacent to ARR.
Construction equipment and bulk supplies also would be delivered by rail to Fairbanks and the
laydown/construction camps.

Alaska Stand Alone Gas Pipeline 5.20-25 Final EIS
Marine
Ports that are capable of receiving large vessels are located at Seward, Whittier, Homer, and
Anchorage. Docks capable of receiving ocean going vessels are located at Nikiski, Port
MacKenzie, and West Dock Causeway on the North Slope. Dock facilities at Seward and West
Dock Causeway would be used for the proposed Project and neither would require modification
of docking facilities or receiving areas. Seward would be the primary point for marine deliveries
for the proposed Project, while the West Dock Causeway would be the point of delivery for the
GCF facility modules.
Vessel traffic at Seward includes a range of large passenger ships during the summer, vessels
transporting coal for export and a variety of private boats, commercial fishing vessels and
charter vessels for sightseeing and fishing. Seward also is the homeport for the USCG cutter
Mustang. The West Dock Causeway serves industrial users associated with oil and gas
exploration and development radiating from Prudhoe Bay. Delivery of pipe, construction
equipment, and bulk supplies to Seward for the proposed Project would be linked to mobilization
and construction activities that would not exceed a three to four year period starting with the
delivery of the pipe. The West Dock Causeway would be used only for a single open water
season to receive modules for the proposed Project GCF. It is noted that some modules for
TAPS and oil field operations have been constructed in Anchorage and then shipped by barge
to the North Slope or by truck via the Parks, Elliott, and Dalton highways.
The Alaska Marine Highway System (AMHS) provides daily scheduled passenger and vehicle
transportation in the Southcentral part of Alaska by ferries between Whittier, Valdez and
Cordova during the summer and weekly service during the winter. Seward is not a port of call
for AMHS; therefore there would be no nexus for cumulative effects on ferry service related to
the proposed Project.
Land Use and Planning
The proposed Project would cross lands under the jurisdiction of numerous authorities, including
the North Slope Borough, Yukon-Koyukuk Census Area, Denali Borough, Matanuska-Susitna
Borough, Fairbanks North Star Borough; state areas managed by the ADNR, ADF&G, ARR,
Alaska DOT&PF; and, federal lands managed by the Military, BLM and NPS. Any reasonably
foreseeable or ongoing plans within these planning areas constitute reasonably foreseeable
future actions considered in this cumulative effects analysis. The Eastern Interior Proposed
Regional Management Plan (RMP) is currently in development to replace the White Mountain
National Recreation Area RMP (ADNR 1986a), and Steese National Conservation Area RMP
(ADNR 1986b). The proposed Project is proximate to Doyon Ltd ownerships with oil and gas
potential. Development of these private ownerships may require a modification of the Yukon
Flats National Wildlife Refuge comprehensive land use plan. Likewise, discovery of commercial
gas resources on Doyon Ltd land in the Minto Flats State Game Refuge could result in a
revision of the existing refuge plan.
Alaska Stand Alone Gas Pipeline 5.20-26 Final EIS
Subsistence
Access to and use of subsistence resources (i.e., hunting, fishing, foraging, trapping, whaling,
sealing, traveling) occur within the general area of the proposed Project including those
potentially affected by the connected actions. Cumulative impacts on subsistence resources
are discussed in Section 5.20.6.3.
Tourism & Recreation
The proposed Project either crosses or occurs in proximity to State recreation areas and parks
(i.e., Nancy Lakes, Willow Creek, Denali State Park), National Parks or wildlife refuges
(Denali NPP, Arctic National Wildlife Refuge, Gates of the Arctic National Park and Preserve,
Yukon Flats National Wildlife Refuge, White Mountains National Recreation Area), and trails
and recreation access points such as the Iditarod Trail and the Dalton Highway Recreation
Area. Numerous recreational and tourism activities are offered within these areas (with lodging
to support them ranging from small bed and breakfast businesses to the large complex at the
entrance to Denali NPP), boating, hiking, flight seeing, camping, fishing and hunting. The
Alaska Railroad also provides service to tourists travelling to Denali NPP. These recreational
opportunities are therefore considered in the cumulative effects analysis (see Section 5.20.6.3).
Military Projects
The proposed Project would be constructed near Fort Wainwright, Joint Base Elmendorf-
Richardson, and Clear Air Force Base. These military bases are currently proposing to perform
infrastructure improvements (i.e., infrastructure upgrades, facility improvements) and base
upkeep activities that could coincide with construction of the proposed Project.
Mining
The proposed Project will be constructed in the vicinity of Usibelli’s coal mining operations in
Healy, but should have no direct impact upon the mine. Both Donlin Gold and the Chuitna coal
projects are in very early stages of development at this point in time, geographically distant from
the proposed location for the project and will not be directly impacted by the proposed Project.
Cumulative impacts may result due to competition for infrastructure improvements, gravel, and
skilled labor.
5.20.5.5 Projects that are Foreseeable if the Proposed Project is Built
Fairbanks Natural Gas Distribution System
The proposed Project would provide a long-term reliable supply of utility grade natural gas in the
Fairbanks area as a fuel source for electrical power generation; home and institutional heating;
and use of compressed natural gas as a substitute for gasoline and diesel fuel to power
vehicles. Distribution from the terminus of the Fairbanks Lateral would most likely involve a
pipeline distribution system and possibly new facilities that compress natural gas for distribution
by storage tanks. Conversion or retrofit of power generation and heating facilities could also

Alaska Stand Alone Gas Pipeline 5.20-27 Final EIS
take place to allow for burning of natural gas. FNG estimates the cost of converting a resident
to use natural gas would be $1,000 to $1,500 (Fairbanks Natural Gas, LLC. 2011). According to
ENSTAR it would cost about $1,000 for the initial hookup to mainline pipeline and $17 a foot for
each section of pipe between the home or business and the mainline system
(Web Center 11.com 2011). More recent analysis (Northern Economics 2012) indicates that the
cost to convert a residence to natural gas ranges from the low estimate provided by FNG
($1,000 to $1,500) to as high as $12,000 to $20,000 for a boiler replacement, chimney upgrade
(or replacement) and other hydronic (or forced air) connections and there are options in
between that range of prices for conversion. Northern Economics (2012) also estimates that the
annual cost savings on fuel by switching to natural gas is significant for the region at
approximately $315 million dollars saved during the first full year of operation in 2021, a savings
of 60% over the status quo. This distribution system and any additional facilities are considered
reasonably foreseeable actions related to the proposed Project.
Northern Economics (2012) further stated that construction and operation of a piped natural gas
distribution system in the mid- and high-density areas of the Fairbanks North Star Borough and
a propane distribution system in the lower-density areas of the Borough have the potential to
significantly reduce fuel costs for heating of residential and commercial buildings. For the year
2012, the estimated first full year of operation, the proposed distribution system has the
potential to reduce heating costs by approximately 60 percent. This cost reduction was derived
by estimating heating costs from the use of wood and fuel oil in 2021 at approximately
$524 million and costs from the use of the natural gas and propane distribution system of
approximately $210 million. Additionally, the conversion of heating systems to natural gas has
the potential to significantly reduce the emission of PM-2.5, NOx, and SO2. The combined
reduction in these compounds would decrease the overall PM-2.5 emissions from
―approximately 2,200 tons per year to less than 200 tons per year‖ which would bring Fairbanks
into attainment with EPA’s ambient PM-2.5 air quality standard (Northern Economics 2012).
FNG currently owns and operates a 70 plus mile long pipeline distribution system delivering
natural gas to over 1100 homes and businesses for heating, cooking and other applications.
FNG presently produces LNG from Cook Inlet natural gas transported by the ENSTAR pipeline
system to a FNG facility adjacent to the MP 39of the Beluga Pipeline (Figure 5.20-1 above) and
trucked via the Parks Highway to a FNG 91,200 gallon facility in Fairbanks where it is stored
until distribution; FNG also transports LNG from Cook Inlet to the Talkeetna Alaskan Lodge
owned by the Cook Inlet Regional Corporation (CIRI).
GVEA operates and maintains 3,099 miles of transmission and distribution lines and
35 substations. The GVEA system is interconnected with electrical generation facilities at Fort
Wainwright, Eielson AFB, Fort Greeley, the University of Alaska-Fairbanks and all electrical
utilities in the Railbelt that extend from Homer to Fairbanks. Peak load in 2009 was
200.5 megawatts with a peak of 223 MW in December 2007. GVEA serves nearly
100,000 customers in Fairbanks, Delta Junction, Nenana, Healy, and Cantwell. Six GVEA
owned generating facilities have a combined capacity of 298 MW with 188 MW produced from
diesel fuel, 50 MW from coal, 60 MW from naphtha. In the planning process is a 24.6 MW wind
farm at Eva Creek near Healy (GVEA 2011).

Alaska Stand Alone Gas Pipeline 5.20-28 Final EIS
Because of the projected shortfall of natural gas from Cook Inlet, FNG is considering alternative
sources of natural gas to convert to LNG. In 2008, FNG signed a 10-year gas supply
agreement with Exxon Mobil for up to 17 BCF. The FNG LNG facility on the North Slope would
be constructed by Polar LNG, LCC an affiliate of FNG and the LNG produced there would be
trucked 500 miles to Fairbanks. The LNG plant is scheduled to be completed in 2013. In
addition, GVEA and Flint Hills Resources Alaska (Flint Hills) have signed a memorandum of
understanding to exclusively negotiate an agreement to construct and operate an LNG
production facility on the North Slope for truck transport to the Fairbanks-North Pole area by
2014. The LNG would be used by GVEA to replace naphtha that currently fuels its new turbine
at the North Pole Power Plant. Flint Hills has a 220,000 bbl/day capacity to refine North Slope
crude oil into gasoline, jet fuel, heating oil, diesel, gasoline, and asphalt for in-state use. The
LNG would replace refined crude oil used to process the crude oil.
For the cumulative effects analysis it is assumed that only one of these LNG plants would be
developed on the North Slope. The proposed Project’s Fairbanks Lateral segment would
eliminate the need to produce LNG at Prudhoe Bay and truck it to Fairbanks, or to continue
production of LNG at the existing plant near Mile Post 39 of the Beluga Pipeline and truck that
product to Fairbanks.
Future Gas Development Scenarios
LNG Export Scenario
One reasonable foreseeable conceptual usage for future natural gas and NGLs from the
proposed Project is development of an LNG export terminal. Based upon existing information,
the most probable location for such a facility would be on the Cook Inlet at the existing LNG
terminal within the Nikiski Industrial Area. This facility has been in operation since 1969 and is
currently operated by ConocoPhillips. It had been temporarily shuttered, but is expected to
resume operations in 2012. Existing pipelines and pipeline capacity are adequate to service
this facility with the proposed Project’s natural gas. The Nikiski LNG terminal has a storage
capacity of 105,000 cubic meters of LNG and an annual throughput capacity of approximately
6.8 million cubic meters of LNG. Under the most probable existing concept, the existing
liquefaction facility and terminal facilities would be used to their capacity. If additional capacity
is required, there is sufficient land available at the existing site for construction of a second LNG
liquefaction train.
In addition, based upon throughput, the existing pier at Nikiski might require reinforcement or
the pier and cargo handling system would be expanded to berth 135,000 cubic meter LNG
cargo ships (the most common LNG cargo ship size today) or larger vessels. The current dock
face (ship’s berth) at the Nikiski LNG terminal is approximately 320 meters long. To accept
larger LNG cargo ships the berth would need to be extended to either 394 meters (for a Q-flex
LNG cargo ship) or 431 meters (for a Qmax vessel). Current analysis indicates the optimal
market destinations for Alaska LNG cargos are the East Asian ports of Japan and South Korea.
The optimal size of tankers for minimal shipping costs are the 210,000-220,000 cubic meter

Alaska Stand Alone Gas Pipeline 5.20-29 Final EIS
Q-flex LNG vessels. One or two vessels, depending on the size of the LNG facility, docking in
Cook Inlet one to three times per month would be needed for export.
Anchor Industrial Users
Another potential future gas use scenario is the transport and sale of substantial quantities of
natural gas to an anchor industrial user located in Southcentral Alaska. The proposed
Accelergy/Tyonek Coal to Liquids (CTL) Project is a potential future anchor industrial user.
Such a facility could utilize up to 200 MMscfd of natural gas from the proposed Project. In
October 2010, the Tyonek Native Corporation (TNC) announced that they had signed an
agreement with Accelergy, a technology company, to develop a CTL plant on Tyonek land. This
facility would produce 60,000 bpd of aviation fuel, as well as gasoline and diesel for military and
industrial use, and would generate 200 MW to 400 MW of electricity with waste heat. This early
planning stage project would use a new technology called ―integrated coal biomass-to-liquids‖
(ICBTL), which captures some of the carbon dioxide for use in the plant itself, and uses the rest
to grow algae which is then combusted in the plant for energy generation. The combination of
recycling carbon dioxide and the use of biomass could improve the efficiency of the CTL
process while simultaneously reducing greenhouse gas (GHG) emissions. Accelergy has
stated that 90% of the energy present in the coal is used in final products. Feedstock for the
operation could either be from the nearby proposed Chuitna coal mine or from other coal
resources in the region.
In order to transport up to 200 MMscfd of natural gas from the proposed Project to Tyonek for
use in the CTL process, the existing pipelines in the area would likely need to be supplemented
with a new pipeline. A 12-inch-diameter 320-mile long buried steel pipeline from the end of the
proposed Project pipeline at MP 39 of the Beluga Pipeline (ASAP MP 736.4), to the Tyonek
area would be required and is depicted in Figure 3.1-2. A compressor station would also likely
be required for the 58-mile-long pipeline (AGDC 2011a).
Other potential future industrial gas users include the Donlin Creek Mine Project which plans to
draw an additional 25 MMscfd of natural gas from unspecified sources at Cook Inlet by 2017
(AGDC 2010), and a natural gas to liquids facility in the Cook Inlet area that would produce
synthetic diesel and gasoline fuels from natural gas.
NGL Transportation, Processing, and Distribution
In order to deliver utility grade natural gas to Fairbanks and to South-central Alaska utilities,
NGLs must be extracted at the ASAP straddle plant near Fairbanks and again at the ASAP
pipeline terminus.
Transportation, processing and distribution of NGLs from the Cook Inlet NGLEP Facility located
at the end of the mainline could be accomplished by pipeline, fractionation facility, and storage
and tanker vehicles. The AGDC evaluated the feasibility of several options for transportation,
processing, and distribution of NGLs (Beck 2011). The AGDC concluded that a facility located
at Nikiski would be the most favorable option based upon consideration of impact on the
environment, infrastructure needs, compatibility with existing plans, safety and security, and

Alaska Stand Alone Gas Pipeline 5.20-30 Final EIS
complexity (AGDC 2011a). The Nikiski option would include installation of an 80-mile long
pipeline to transport NGLs from the Cook Inlet NGLEP Facility to Nikiski for fractionation,
storage and subsequent In-State and export distribution by ship. Transport of NGLs from
Nikiski for in-state use by tanker trucks would also be possible.
Export Pipeline
As indicated above, the export pipeline would be approximately 80-miles long, 6 to 8 inches in
diameter, buried, and would begin at the Cook Inlet NGLEP Facility (ASAP MP 736.4 and
Beluga Pipeline MP 39) (AGDC 2011c). The pipeline would then be routed south and
southwest, generally approaching and paralleling the north and northwest coast of Cook Inlet,
passing by Tyonek at about MP 50, and reaching Cook Inlet at about MP 58. This route would
follow the route of the existing Beluga Pipeline. It would then cross north-south under Cook
Inlet until about MP 77, and then traverse land again until reaching the NGL fractionation facility
at about MP 80.
NGL Fractionation Facility, and Marine Terminal
The NGL fractionation facility and the marine terminal facility associated with export of NGLs
would likely consist of: a fractionation plant (described below); pier facilities sufficient to dock
very large gas carriers (VLGCs), which typically carry 44,000 metric tons (MT) of NGLs in four
segregated butane and propane tanks of 11,000 MT capacity each; and storage facilities,
warehouse buildings, and a storage yard.
To produce propane, butane, and natural gasoline for use as fuel in Alaska or for export, the
conditioned residue gas from the end of the pipeline would require processing. Initial
processing would include the use of a turbo-expander refrigeration process for NGL extraction
and a de-ethanizer stripping column for fractionation of the NGLs. The following approximate
volumes are anticipated to be produced:
Liquefied Petroleum Gas (LPG; 88 percent propane/12 percent butane blend):
30,200 barrels per day (bpd);
Propane for In-State use: 3,200 bpd; and
Natural Gas Liquids (NGL): 343 bpd
The estimated storage capacity at the NGL fractionation facility includes: storage tanks for
12,000 barrels of gasoline, three 120,000-gallon propane tanks, one 90,000-gallon propane
tank, and two 375,000-barrel LPG tanks. These storage facilities would be constructed and
operated to meet ADEC and EPA regulations for spill prevention and contingency planning.
There would be no storage of NGLs associated with the marine terminal.
Tanker traffic at the marine terminal would occur year round at the rate of 1.4 to 2 tankers per
month, assuming use of VLGCs. Depending upon the location of NGL fractionation facilities,
storage facilities equal or similar in size to those identified for the NGLEP facility would also be

Alaska Stand Alone Gas Pipeline 5.20-31 Final EIS
necessary. Foreseeable markets for export of NGLs loaded at a marine terminal would be
Japan, South Korea, and southern or eastern China.
The NGL fractionation facility and a marine terminal could be located in the existing Nikiski
Industrial Area. Currently, there are three marine facilities at the Nikiski Industrial Area (the
Agrium pier south [closed]), the existing LNG terminal operated by ConocoPhillips (idle6), and a
petroleum receiving terminal that services the Tesoro Refinery (north), each of which has a long
pier capable of handling ocean going tank ships. The Nikiski Industrial Area, which includes
four major petrochemical processing facilities, is one of the largest existing industrial complexes
in Alaska. The Kenai Peninsula Borough Comprehensive Plan designates the area as an
industrial site and requires use of existing industrial facilities, areas and pipeline routes where
feasible. There is sufficient land on the existing LNG facility that is not in use, and the closed
Agrium facility also likely has sufficient land on which future NGL facilities could be located. No
dredging has been necessary at the Nikiski terminals to date and none is anticipated for NGL
facilities to be located there.
In-State Distribution of Propane and Butane
Fuel products would be supplied to customers along the highway system in the form of propane
and butane (LPG). Fuel products could be transported by truck from the NGL fractionation
facility. Typical truck/trailer transport would be accomplished by use of 44-foot long,
13,000 gallon gross capacity trailers. The propane available for in-state distribution would
require 10 trailers per day for transport from the fractionation facility to markets along the
highway network.
6 The plant is currently in winterization mode but is scheduled to resume exports in 2012 (Anchorage Daily
News 2011b).
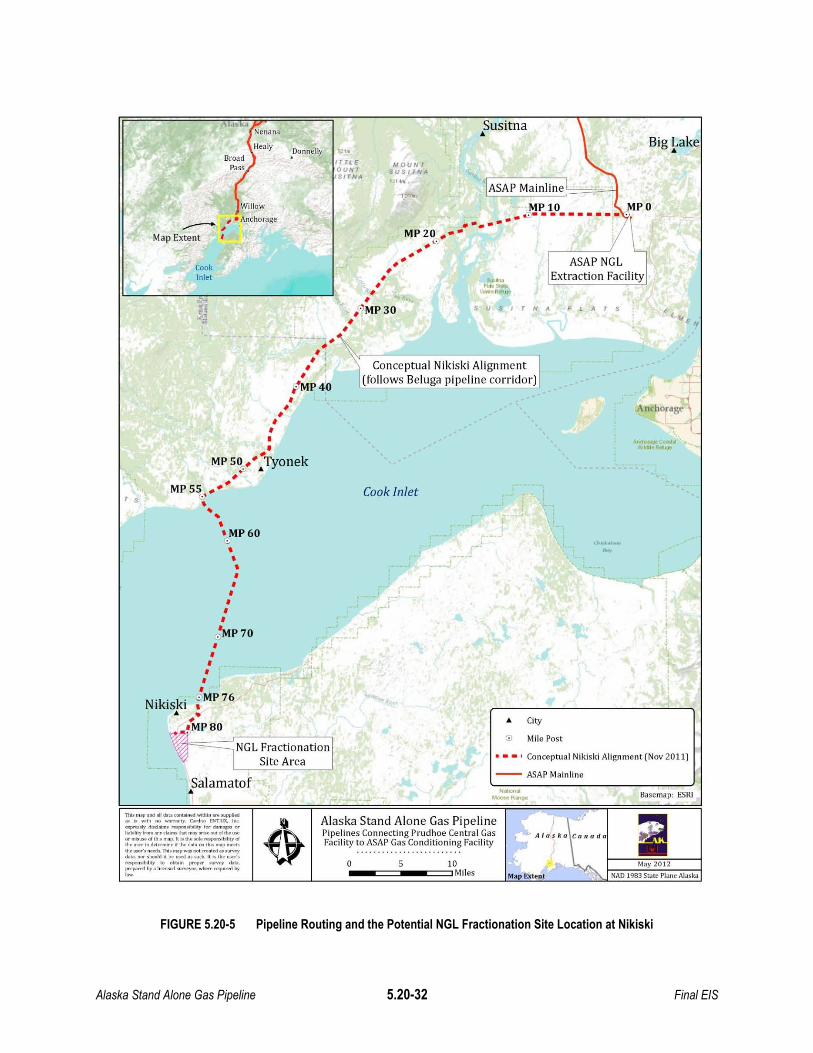
Alaska Stand Alone Gas Pipeline 5.20-32 Final EIS
FIGURE 5.20-5 Pipeline Routing and the Potential NGL Fractionation Site Location at Nikiski
Big Lake•
Basemap: ESRI
M:Jy 2012
IINAD 1983 Stlle Plane Alaska
F ( A. T S
ASAP NGLExtraction Facility
Conceptual Nikiski Alignment (Nov 20 11)
Mile Post
An('horag~
• City
'"--- ASAP Mainline
ASAP Mainline
Susitna•
10'Miles
5
AI 00 N TSUSITNA.
13' ......
Cook Inlet
Conceptual Nikiski Alignment(follows Beluga pipeline corridor)
o
MPIO....... ~_ •....••..MP2~... •
##
###
##
##
#
i'MP30#
#
Alaska Stand Alone Gas PipelinePipelines Connecting Prudhoe Central GasFacility to ASAP Gas Conditioning Facility
.Donnelly VI.IT TLEOt/NT
ISITNA.
NGL FractionationSite Area
Nenana
, • Anchorage
-ICookInlet
.••e~~
-Map Extent
;.... - - '"#
# •# '# •
#
~MP40
•##•••#.
MP 50 # # Tyonek'" .#
MP5S ###
o•~~
•'MP60o•••••••••~MP70
••••••Nikiski ;'M!76
• #.MP80
Salamatof•Thi. mop.nd .. data coo,a;n<!d withi" .... ouppliod• " ...,," no _<y, Conlno El<UIX. ,....""l''''''''1 d...b,,,,,, ,"p"r",,\O~<y f...-~ ...-hbob<yfr<>manycla,mo'hoo moy out of""' ......- .... LIM of thill ""1'-11 ioth ponoiboh'yol""'~_ "'d.."""",.'ftho data '"" 'his map n-',h<_._.. Th, ....p ....,n"'~,,<d .. ,."'"Tdato. oor,llooId. b< """" .....cb. It .. 'he .-"_"bOliIy .. """'in __ ,Ina
~rodby.Ii""'ood~..........~..rodby
Alaska Stand Alone Gas Pipeline 5.20-33 Final EIS
5.20.6 Cumulative Effects Analysis
5.20.6.1 Cumulative Effects Associated with No Action
Under the No Action Alternative, energy demand for natural gas in the Railbelt would not be met
with known natural gas resources from the Cook Inlet area. Without an additional source of
natural gas, the state and local jurisdictions and local utilities would need to be aggressive in
finding ways to meet existing and future energy demands. The measures currently being
considered include: energy conservation, using depleted natural gas reservoirs for temporary
storage to meet short falls of natural gas during extended cold snaps, importing LNG,
constructing wind farms and new hydroelectric projects, and providing additional economic
incentives to discover and develop commercially viable natural gas resources in the Cook Inlet
area. The FNG and GVEA/Flint Hills Refinery are separately exploring the opportunity to
produce and truck LNG from Prudhoe Bay to Fairbanks. Restarting the Healy Clean Coal
electrical generating facility is being considered and ADEC recently issued a permit for the
restart of that project. All of these options are in the active consideration and/or planning
stages. In the longer range picture, there is potential that electrical generation could be
economically produced by tidal currents, by geothermal potential on the flanks of Mount Spurr,
and by converting municipal solid waste to heat and electrical energy. Currently these later
activities are considered to be speculative, until such time that they can be shown to be
economically feasible, and are not discussed further.
An estimated peak of 6,400 temporary construction jobs and 50-75 permanent jobs associated
with the proposed Project would not materialize. An additional unknown number of jobs
associated with constructing and operating the flow lines on the North Slope and the
fractionating facilities, tank farm, and marine terminal at Nikiski would also not occur.
The potential property tax and land lease revenues from the estimated $8.4 billion Project plus
the property value of a conceptual fractionating facility/tank farm/marine loading facility at Nikiski
would not be realized. Additional revenues would not occur from the products manufactured at
the fractionating facility. Expanded use of North Slope gas resources for in-state use and for
potential export would also not occur.
Under the No Action Alternative it is recognized the APP would be proceeding through the EIS
and FERC permitting processes and that there would remain the potential to construct a lateral
pipeline system from APP to Cook Inlet. This spur line could follow the general proposed
Project alignment from the Fairbanks area. However, it is unlikely that the APP would be
operational before there would be a significant short fall of natural gas in the Railbelt area.
Energia Cura on behalf of the Fairbanks Pipeline Company (FPC) in August 2010 published a
"Non-Binding Open Season-Basic Package" describing a proposal to construct the "Arctic Fox
Natural Gas Pipeline system‖. The Arctic Fox project conceptually involves a market based
514-mile-long, 12- to 18-inch buried pipeline system from the North Slope to Fairbanks.
Potential customers would be GVEA, FNG, Flint Hills Refinery and local military bases. FPC
announced its intention to start negotiations with gas producers for the acquisition of natural gas
Alaska Stand Alone Gas Pipeline 5.20-34 Final EIS
for the Arctic Fox project. Details of those negotiations, which were expected to be completed
by March 2011, have not been announced (Fairbanks Pipeline Company 2011). No
applications for construction of the Arctic Fox project have been filed. The initial projected start-
up date was 2014. Under the No Action Alternative, it is reasonably foreseeable that Energia
Cura/FPC would re-evaluate the Arctic Fox project and its relationship to the APP and then
determine whether to proceed with developing the detailed information necessary to permit and
construct the conceptual pipeline system.
The No Action Alternative would eliminate one set of proximity issues with TAPS, Highways,
APP and the Intertie. It also would reduce long-term competition for use of existing gravel
sources needed for maintenance of TAPS, highways, and ARR and for construction and
maintenance of APP between the North Slope and MP 405. A linear modification for 737 miles
of vegetation and wetlands would reduce the cumulative effects within the PLO 510
Transportation Corridor between the North Slope and MP 405, and the transportation and utility
corridors occupied by the Parks Highway, ARR and Intertie. New disturbances across the Minto
Flats State Game Refuge and from MP 709 to 737 would be eliminated as would proximity
issues to Denali State Park, Nancy Lake State Park and other smaller units of the state park
and state recreation and rivers systems. The existing viewshed on state land associated with
the entrance area to Denali NPP would be retained, but extending the pedestrian/bike path to
McKinley Village would not occur. Overall, negative cumulative impacts of the No Action
Alternative are likely to be mostly economic. Air quality and public health benefits in the
Fairbanks area that would result from the proposed Project and a Fairbanks gas distribution
system (as described in Section 5.15, Public Health) would not be realized.
5.20.6.2 Cumulative Effects of the Proposed and Connected Actions
The previous sub-sections of Section 5, Environmental Analysis, characterize the existing
environment, which includes the current condition of physical, biological, and social resources,
including the effects from past actions and the direct and indirect effects of the proposed
Project.
The potential cumulative effects associated with the proposed Project, its connected actions,
and reasonably foreseeable future actions are discussed by resource below. The specific
geographic scale of the cumulative effect analyses varies depending on the resource under
consideration, but in general, the region of influence (ROI) for cumulative effects analysis is
defined as the Dalton, Elliott, and Parks Highway and ARR transportation corridors. The
connected actions are considered in this analysis of cumulative effects to be connected to the
proposed Project as opposed to reasonably foreseeable actions that are speculative and less
certain.
Federal, state, and local agencies must review most of the future projects included in
Table 5.20-1 for compliance with requirements for construction of facilities in areas where a
governmental license or permit may be required. The expansion or construction of inter- or
intra-state pipelines, highways, and major water development projects would require state or
federal permits and approvals to ensure compliance with Section 7 of the Endangered Species
Alaska Stand Alone Gas Pipeline 5.20-35 Final EIS
Act (ESA); Sections 401, 402, and 404 of the Clean Water Act (CWA); the Clean Air Act (CAA);
and Section 106 of the National Historic Preservation Act (NHPA). Issuance of the necessary
permits and approvals with their conditions would reduce or avoid significant effects from these
projects to wetlands and waterbodies, vegetation and wildlife (including threatened and
endangered species), cultural resources, and air quality and noise. These decisions would also
consider design, location, and operational/maintenance/repair elements of the proposed Project
and its connected actions to assure these elements would be compatible with the proposed
APP and as well as existing highways, utility and communication systems, and TAPS.
Soils and Geology
Topography and Erosion
Potential Project-related effects to soils and geology would include alterations to topography
due to grading and excavation associated with the installation of proposed Project pipelines,
access roads, and aboveground facilities; effects to permafrost; mass wasting, fault crossings,
and soil erosion. These factors were carefully considered in the design, construction, and
operation of TAPS in 1972, as well as the Alaska Highway system. In the evaluations preceding
authorization of ANGTS in 1976, the BLM and USACE gave specific consideration to the
potential effects of a large diameter gas pipeline system on the Dalton and Elliott Highways in
the area that also would be crossed by the proposed Project. The 1988 evaluations leading to
the federal and state ROWs for TAGS took a fresh look at the impacts of two large buried gas
pipeline systems on soils and geology. Also considered were the likely cumulative effects to
soils and geology from TAPS, Dalton and Elliott Highways. The federal and state authorizing
entities concluded that the cumulative effect on the geologic environment of TAGS with
ANGTS, TAPS and highways would be minor.
Standard mitigation measures used for existing road construction and maintenance and for
TAPS include minimizing the footprint during construction, preventing soil erosion, and re-
establishing vegetative cover on disturbed areas. The reasonably foreseeable action of
providing utility grade natural gas to the Fairbanks area would result in the expansion of natural
gas for residential and commercial uses. Expansion of the FNG natural gas or GVEA
distribution systems are deemed to have only localized, small cumulative effects to soils and
geology. Consequently, the potential for substantial cumulative erosion effects caused by one
or more of these projects in combination with effects from the proposed Project is low because
of consistent erosion control.
The conceptual locations of flow lines on the North Slope and NGL facilities in the industrial
complex at Nikiski involve potential use of existing facilities, modification of existing facilities, or
construction of new facilities. Given the uncertainties of where theses connected actions would
be located it is speculative to address their potential cumulative effects in detail. However,
given that there have been a number of studies as well as the actual construction and operation
of similar facilities in both areas, it is likely that the location and design of the conceptual flow
lines, NGL facilities and dock could be developed to avoid adverse cumulative effects to the
geological environment.

Alaska Stand Alone Gas Pipeline 5.20-36 Final EIS
The NGL facilities also require the construction of a conceptual 80-mile long pipeline system
including 19 miles of submarine pipeline across Cook Inlet to a NGL fractionation facility at
Nikiski. The pipeline would cross a number of rivers and streams and potentially unstable
geologic conditions which are presently crossed by similar pipeline systems (Figure 5-20-1
above). Consistent erosion control practices would also be used in construction of this pipeline,
thereby minimizing cumulative effects. Based on the operation of other pipeline systems in
similar conditions, the upland portions of the conceptual pipelines needed to bring natural gas to
the proposed Project start and to the Nikiski NGL facility could be designed and operated in a
manner to avoid cumulative effects to the geological environment. The submarine pipeline
system across Cook Inlet is also in an area where there are existing petroleum product pipelines
have been designed and installed to resolve the special conditions created by the strong
currents in Cook Inlet.
Borrow Materials
A potential cumulative effect on the availability of borrow material has been identified. Borrow
material can be scarce in the proposed Project area, especially on the North Slope. However,
the amount of gravel, riprap, and bedding material required for the proposed Project would be
small (approximately 13.1 million cubic yards)7 compared to other previously proposed and
analyzed projects such as TAGS (approximately 33.0 million cubic yards) (BLM and
USACE 1987), and the AGDC has identified the total available borrow material from existing
sources to be at least 194.1 million cubic yards. The cumulative impact of using 13.1 million
cubic yards of borrow materials would be a long-term loss for other potential projects in the
vicinity of the proposed Project that also need barrow material (such as the APP).
Since each of the borrow pits proposed for use by the proposed Project were developed for
other uses (highway, community, or ARR), there is an existing or implied future need for
material from each pit. During the design phase it is expected that the proposed Project would
negotiate with the entities that developed and/or now use each pit to determine the actual
amount of material available to the proposed Project. Until total quantities required and actual
availability of borrow material is known, it must be assumed that there will be adverse
cumulative impacts to continued operation and maintenance of the Dalton Highway and TAPS
and for future construction, operation, and maintenance of the APP between the North Slope
and Livengood and potentially for the Parks Highway and ARR.
For example the TAPS ROW Renewal EIS noted that TAPS uses about 100,000 cubic yards of
sand, gravel, and quarry stone, annually for the entire 800 mile TAPS system. This would total
3.0 million cubic yards over the 30 year period the ROW is in effect (BLM and USACE 1987).
The TAPS renewal evaluation did not indicate specific locations where the 100,000 cubic yards
would be used. Although gravel and related materials are generally more important in the
northern sections of TAPS, it is noted that there is a parallel gravel work pad for most of the
800 miles that requires periodic maintenance. Accordingly, the overall future need on the basis
7 ASAP has not identified the quantities and sources existing borrow sources required to build and maintain the
lateral pipeline to Fairbanks.

Alaska Stand Alone Gas Pipeline 5.20-37 Final EIS
of average pipeline miles (100,000 cubic yards divided by 800 miles, equals an average annual
need for 125 cubic yards per mile for 30 years) is estimated to be approximately 1.5 million
cubic yards of materials for TAPS maintenance north of Livengood.
Similarly, there will be an estimated annual need of materials to maintain the Dalton, Elliott and
Parks Highways and ARR over the next 60 years. Therefore, it is expected that some gravel
sources will not be adequate to meet proposed Project requirements and the requirements for
the other reasonably foreseeable projects along the proposed Project corridor and on the North
Slope. One example is the fact that almost all ballast rock for road and pipeline maintenance on
the North Slope comes from a single source (Spilt Mountain located north of Coldfoot). Several
options could be used to meet a potential localized shortage of borrow material from an existing
pit. These could include: using snow/ice roads for pipeline construction access, use of
geofabrics increasing the haul distance from another existing source with adequate gravel or
riprap; opening a new borrow source; reclaiming gravel at abandoned source sites or extracting
and crushing bedrock.
These options would increase the cost of construction and maintenance for the proposed
Project if a local borrow source is exhausted or unavailable. Likewise, a shortage of material
from a pit the Project proposes to use could increase the future cost for APP, or highway, or
ARR, or TAPS construction and/or maintenance. The AGDC has not proposed to open new
sources of borrow material. Substantial expansion of existing approved borrow sources or
development of new borrow sources would require further analysis.
The amounts and sources of gravel needed to construct and maintain connected actions on the
North Slope are unknown at this time.
Paleontological Resources
Excavating for VSM installations and the pipe trench for the proposed Project and connected
actions, construction of the above-ground facilities, and continued excavation at existing
material sites could result in the discovery of paleontological resources. Given the scale of past
construction activity near land that would be crossed by the proposed Project and its connected
actions, it would be unlikely rare or unique fossils would be found. If unknown paleontological
resources are found, the federal and state right-of-way permits and sales of barrow material
typically contains provisions for notification of the appropriate entity for guidance on the course
of action to protect the fossil(s). No negative cumulative effects of the proposed Project to
potential paleontological resources are expected.
Water Resources
Water Use
The proposed Project would use an estimated 974 million gallons (MMg) of water for direct
construction activities (approximately 849.3 MMg for ice work pad and ice access road, 44.7
MMg for earthwork, and 80.5 MMg for hydrotesting) (Table 5.2-22). Construction camps would
also require potable water for camp personnel and for normal camp operations for waste water
Alaska Stand Alone Gas Pipeline 5.20-38 Final EIS
treatment at each camp (9 construction camps each with capacity for 500 people and 1
construction camp for 250 people). It is expected that most water needs for construction will be
met by water withdrawal from nearby lakes and streams; water sources for use at the 10
construction camps have not been identified. The ADNR and ADF&G have developed a set of
standards that are applied to each temporary water use authorization. These state standards
are site-specific and require information such as the size of mesh on water intakes when
withdrawing water from lakes, streams and rivers that support fish populations. Likewise, water
permits contain conditions governing the amount of water that can be withdrawn from ice
covered lakes to assure there is an adequate supply of water that can support overwintering fish
if necessary. Cumulative impacts associated with temporary water use permits for construction
would be neutral given the ability of the ADNR and ADF&G to provide adequate protection to
fish habitats and populations.
The quantities and sources of water to construct and operate the North Slope flow lines, NGL
pipeline fractionation facility and the treatment of any discharges at Nikiski have not been
identified. The direct, indirect, and cumulative effects on water resources associated with the
conceptual NGL fractionating facility at Nikiski are expected to be minimal based on its planned
location within an industrial complex.
Surface and Ground Water Impacts
In addition to the temporary water withdrawals from lakes, streams, and rivers for construction,
the proposed Project and its connected actions would cross surface drainages and would occur
near ground water sources. The ROW stipulations would require the AGDC to develop
site-specific measures to avoid any substantial diversion of surface drainages either across the
backfill or by capturing surface water in the pipe trench fill material. Both the BLM and the
ADNR have reviewed and approved designs for other buried pipelines, roads, and TAPS that
are effective in minimizing a negative long-term cumulative effect to surface water drainage
patterns. It is expected the backfill will require monitoring for one or two years to assure that the
expected settlement of fill materials is neither too much nor too little thereby minimizing the
potential for negative cumulative effect on surface water or near surface ground water
movement. Conversely, the operating temperature of the pipeline has the potential to have a
cumulative negative effect on both surface and ground water movement. Where chilled, the
pipe could reduce the seasonal thaw depth and in small stream crossings have a potential to
increase ice dams. These issues were successfully addressed in the design of both ANGTS
and TAGS which were both chilled. Accordingly, no long-term cumulative negative effect to
water flows would be expected.
Water Body Crossings
The AGDC has identified how each waterbody would be crossed (HDD, bridges, or dry-open
cut) to minimize proposed Project-related effects on water resources. As with water withdrawal
permits, all waterbody crossings would be required to meet site specific permit requirements,
including spill contingency plans, that take into account the width and depth of the water body,
gradient, depth of scour, and how the transition from upland to riparian to the waterbody would
be treated. Cumulative effects of the proposed Project from construction and operation in
Alaska Stand Alone Gas Pipeline 5.20-39 Final EIS
combination with other projects in the vicinity would primarily be short-term and neutral. These
short-term effects would include disturbance of riparian soils that may enter into waterbodies;
disturbance to the waterbody substrates; increased risk of the inadvertent introduction of
contaminants via spills from construction equipment; and discharge of surface waters from the
pipe ditch before construction is completed and for hydrostatic testing of pipeline segments.
These effects would be expected to dissipate within weeks after construction.
Most waterbodies in the proposed Project area are already crossed by a variety of Off Road
Vehicle (ORV) trails, as well as access roads to adjacent resource areas, highways, and utility
and communication systems. Between the North Slope and Livengood, these same streams
are also crossed by TAPS and likely would be crossed by the APP. South of the straddle and
off-take facility, the mainline (and the lateral pipeline to Fairbanks) involves waterbodies also
crossed by the Parks Highway, access roads, utility and communication systems and the ARR.
No long-term adverse cumulative impacts to waterbodies, surface drainage or near surface
groundwater are expected from the proposed Project and its connected actions even though
many crossings could be close to other existing crossings and potential and proposed crossings
by APP. Mitigation measures and permits would ensure that any impacts would be short term
and would not overlap.
Water Quality
The AGDC would assure that all water quality standards are fully met during construction and
during operations and maintenance of the pipeline. Because most of the projects listed in
Table 5.20-1 above are located within the same major watersheds that would be crossed by the
proposed Project, and because some of these projects would likely involve direct and indirect
waterbody effects, it is possible that there would be site specific, short-term cumulative effects
to water quality.
Vegetation
The proposed Project would have a variety of cumulative effects upon vegetation due to the
proposed Project and its connected actions in combination with other reasonably foreseeable
projects. These cumulative impacts would be associated the width of the construction zone for
these linear projects vs. the width of the permanent ROW, the vegetative associations crossed,
and the extent of permanent facilities associated with each project.
The proposed Project permanent ROW for the mainline pipeline and Fairbanks Lateral would
have a footprint of about 3,176 acres (Table 5.3-3). Permanent aboveground facilities would
remove approximately 84 acres of vegetation (Table 5.3-4).8 Since the cumulative effects
evaluation includes a 60 year time span, the exterior boundary of each permanent aboveground
facility has been used for the footprint to account for vehicle parking, equipment storage,
security measures, fire prevention and potential future work to maintain and update operations
at each facility. The construction zone for the permanent access roads for the Fairbanks Lateral
8 Includes footprints for the GCF, Compressor Stations, Straddle-Off Take Facility, NGLEP Facility, and Mainline
Vales. The acreages are based on the exterior boundaries of the facility.
Alaska Stand Alone Gas Pipeline 5.20-40 Final EIS
and the mainline pipeline would result in the removal of approximately 435.7 acres;
approximately 11 acres of forest cover would be reestablished over time (Table 5.3-5).
The construction ROW and Temporary Extra Workspaces (TEWs) would result in the clearing of
approximately 9,987 acres of vegetation. The construction ROW would be 100-feet wide, and
temporary work camps and laydown sites for pipe and construction materials would have a
temporary footprint generally ranging from 8 to 16 acres in size for a total footprint of about
265 acres. It is expected that temporary work camps would be located on previously disturbed
areas to the extent practicable. Based on the actual reclamation of TAPS temporary work
camps and airstrips such as Prospect Camp, it is reasonably expected that most disturbance to
vegetation at temporary work camps can be successfully restored. Expansion of existing gravel
and riprap sources for the proposed Project would add an unknown increment of vegetation loss
that would be evaluated as part of a site specific basis by the required mining plan. As noted in
Section 5.20.6.2, some existing pits may not be able to provide a source of material for the
proposed Project and for the existing and reasonably foreseeable projects that might also rely
on that source. This could cause an additional increment of vegetation loss at new or expanded
pits.
The experience of TAPS in the north and ENSTAR in the south show native vegetation is re-
established in several years following initial restoration activities, especially when construction
does not require a permanent work pad or there are no other permanent above ground facilities.
An exception to restoring native vegetation would be where the mainline crosses evergreen,
deciduous, or mixed forests that, for access, fire protection, or other design factors, are not
allowed to re-establish. The construction zone for the mainline (including TEWs) would likely
result in the removal of approximately 4,500 acres of forest; approximately 3,161 acres of forest
cover would be reestablished over time.
The proposed Project would not cause an appreciable modification of the footprint of existing
highways, TAPS, and the ARR. For the purposes of the cumulative effects of APP it has been
assumed APP would have a similar effect on vegetation as described for the proposed Project
between the North Slope and MP 405 where the proposed Project would move south across
Minto Flats. It is likely that a parallel Intertie transmission line would be located within the
cleared area for the existing transmission line; the additional permanent removal of forest for
that line cover could be substantially less however.
The Susitna - Watana Hydroelectric Project would result in a permanent loss of habitat for the
area situated under the 20,000 acre impoundment. Access roads, construction camps, material
sites, and transmission lines between the dam and the Intertie would modify existing vegetation.
The aerial extent of the loss of forest cover and other disturbance to existing vegetation is not
known.
Wind farms would require access roads and footprints for the towers and support buildings.
These are expected to have a small but unknown effect on forest vegetation since the principal
construction activity would be placing towers and electrical transmission lines between the

Alaska Stand Alone Gas Pipeline 5.20-41 Final EIS
facility and the nearest existing electrical transmission line. There would not be large,
permanent losses of vegetation.
Table 5.3-2 in Section 5.3, Terrestrial Vegetation, indicates that there a number of rare and
sensitive plants that could be adversely affected by the proposed Project. The APP would also
have a similar potential effect on rare and sensitive plants. It is expected that both the proposed
Project and the APP would obtain detailed information about the presence, if any, of rare and
sensitive plants prior to construction and would take appropriate measures to avoid or minimize
adverse effects. Construction activities associated with adding new electrical transmission lines
paralleling the existing Intertie generally do not require extensive ground disturbance.
Accordingly, it is unlikely there would be adverse cumulative effects on rare and sensitive plants
due to adding additional electrical transmission lines between Anchorage and Fairbanks.
Surface disturbance by the proposed Project and APP activities can provide habitat that favors
the establishment of invasive plant species. It is assumed the potential for invasive plants
becoming established in areas would be a negative cumulative effect on reestablishment of
native communities. The extent one or more invasive plant species could negatively affect
reestablishment of native vegetation is speculative, and mitigation measures to reduce the
spread of these species would minimize overall effects.
The reasonably foreseeable future action of providing utility natural gas to the Fairbanks area
would involve expanding natural gas transportation systems to domestic and commercial users.
Additions to the existing FNG distribution system would generally be located within existing
developed areas. Although there would be local disturbances, the overall vegetative cover or
distribution of any to rare or sensitive plants would not likely change. There would be
opportunity for the expansion of invasive plants. The amount, if any, that invasive plants would
become established is speculative. Distribution system natural gas pipelines are generally
small (expected to be less than the 12-inch diameter Project Fairbanks Lateral), and incorporate
even smaller 1 or 0.5 inch diameter lines to residents and businesses. Extension of the utility
grade natural gas to the North Pole and Delta Junction areas could require a high pressure line
and a compressor station at Fairbanks. There would be short-term and temporary
environmental impacts to existing vegetation and waterways to the extent that new distribution
pipelines are used that also extend beyond the existing footprints of roads and utility systems to
expand the delivery of 60 MMscfd of utility gas provided by the proposed Project at full design
capacity.
The reasonably foreseeable future action of developing an 80 mile-long NGL pipeline would
require about 61 miles of the pipeline on land and could impact as much as 730 acres of
terrestrial vegetations or wetlands. The fractionation facility for NGLs, which would be located
at an industrial complex at Nikiski involves a conceptual footprint of about 60 acres for the
facility and about 10 acres for a tank farm to store the product pending transportation for in-state
use and potentially for export. There could be additional disturbances for yet to be identified
borrow sites, access roads and construction camps or laydown areas. The majority of
permanent facilities would occur in the already developed Nikiski industrial area and cumulative
effects regarding loss of vegetation would be minor.
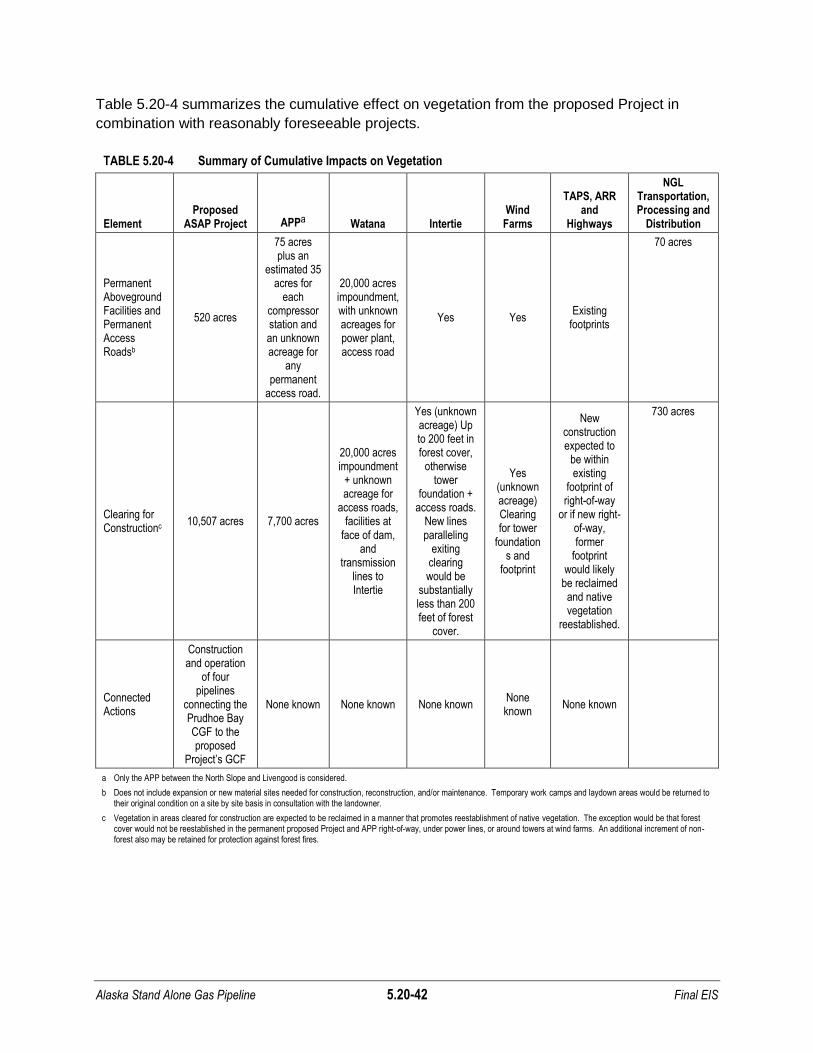
Alaska Stand Alone Gas Pipeline 5.20-42 Final EIS
Table 5.20-4 summarizes the cumulative effect on vegetation from the proposed Project in
combination with reasonably foreseeable projects.
TABLE 5.20-4 Summary of Cumulative Impacts on Vegetation
Element Proposed
ASAP Project APPa Watana Intertie Wind Farms
TAPS, ARR and
Highways
NGL Transportation, Processing and
Distribution
Permanent Aboveground Facilities and Permanent Access Roadsb
520 acres
75 acres plus an
estimated 35 acres for
each compressor station and an unknown acreage for
any permanent
access road.
20,000 acres impoundment, with unknown acreages for power plant, access road
Yes Yes Existing
footprints
70 acres
Clearing for Constructionc
10,507 acres 7,700 acres
20,000 acres impoundment
+ unknown acreage for
access roads, facilities at
face of dam, and
transmission lines to Intertie
Yes (unknown acreage) Up to 200 feet in forest cover,
otherwise tower
foundation + access roads.
New lines paralleling
exiting clearing would be
substantially less than 200 feet of forest
cover.
Yes (unknown acreage) Clearing for tower
foundations and
footprint
New construction expected to
be within existing
footprint of right-of-way
or if new right-of-way, former
footprint would likely
be reclaimed and native vegetation
reestablished.
730 acres
Connected Actions
Construction and operation
of four pipelines
connecting the Prudhoe Bay CGF to the proposed
Project’s GCF
None known None known None known None known
None known
a Only the APP between the North Slope and Livengood is considered.
b Does not include expansion or new material sites needed for construction, reconstruction, and/or maintenance. Temporary work camps and laydown areas would be returned to their original condition on a site by site basis in consultation with the landowner.
c Vegetation in areas cleared for construction are expected to be reclaimed in a manner that promotes reestablishment of native vegetation. The exception would be that forest cover would not be reestablished in the permanent proposed Project and APP right-of-way, under power lines, or around towers at wind farms. An additional increment of non-forest also may be retained for protection against forest fires.

Alaska Stand Alone Gas Pipeline 5.20-43 Final EIS
Wetlands and Floodplains
Wetlands
The proposed Project would result in the temporary disturbance of an estimated 4,826 acres of
wetlands within the construction ROW, with an additional 1,033 acres of wetlands disturbed by
the TEWs. These figures include all spreads of the Mainline ROW and the Fairbanks Lateral
but do not include the Denali National Park Route Variation. Approximately 1,862 acres of
permanent disturbance would occur to wetlands for this same area9 (Table 5.4-2 in Section 5.4,
Wetlands). Effects to the Minto Flats State Game Refuge are accounted for in these totals, and
include wetland impacts of 145.1 acres within the construction ROW, 17.9 acres within the
TEWs, and 43.6 acres within the permanent ROW.
The Denali National Park Route Variation is not proposed for development, but if implemented
the route variation would result in fewer acres of wetlands disturbance than the segment of the
proposed Mainline (MP 540-MP 555) that it would replace. The Denali National Park Route
Variation would affect approximately 4.4 acres of wetlands during construction and 0.9 acres
during operations, compared to the 177.3 acres of wetlands that would be affected during
construction and 22.5 acres of wetlands that would be affected during operation if the
corresponding MP 540 to MP 555 segment were developed instead.
The aboveground facilities would eliminate approximately 73.3 acres of wetlands with the
majority in the footprint of the GCF and lesser amounts at the two compressor stations, the
straddle and off-take facility and the NGL facility at Nikiski. It is expected that permanent
access roads would be designed to avoid and minimize negative effects to wetlands. It is
estimated that new permanent access roads would permanently affect 164 acres of wetlands
(Table 5.4-7 of Section 5.4, Wetlands). Of the 164 acres of wetlands that would be affected by
the new permanent access roads, 6.8 of these acres would be located within the Minto Flats
State Game Refuge. Best Management Practices (BMPs) for the location of construction
camps, laydown areas, and material sites require that these types of activities be located in
upland, non-wetland habitats, to the greatest extent possible.
Wetland habitat would be restored following construction; however, forested wetland habitat in
the permanent ROW would be permanently maintained as emergent or scrub-shrub wetland
habitat. Revegetation of forested wetlands in the unmaintained portion of the construction ROW
may take decades to recover following construction. Furthermore, minor quantities of wetlands
may be filled for the construction and operation of aboveground facilities.
The extent of any long-term degradation of wetlands would be directly related to the type of
wetland and the amount of any soil compaction. A key practice to minimize long-term
degradation would be to assure the general pattern of surface and surface water flows are
retained, e.g., the pipeline or other facilities neither impound upslope and downslope drainage
patterns. The acreages of wetlands associated with the NGL transportation, processing and
9 See Tables 5.4-3, 5.4-4, 5.4-5, and 5.4-6 in Section 5.4, Wetlands, for a breakdown of wetlands on a
hydrogeomorphic class and type,

Alaska Stand Alone Gas Pipeline 5.20-44 Final EIS
distribution are unknown. Disturbance to wetlands would be anticipated in the construction
zone for about 61 miles of a reasonably foreseeable pipeline from the NGLEP to Nikiski.
Wetlands associated with the APP between the North Slope and Livengood are expected to be
similar to those described for the proposed Project. Permanent facilities such as the APP Gas
Treatment Plant on the North Slope is assumed to have a footprint similar to the proposed
Project GCF, with a 235 acre loss of wetlands and an additional 5 acres of wetland impacted for
the metering station. The extent that permanent roads would be required for APP or acreage of
wetlands in the ROW footprint for roads or compressor stations is unknown at this time.
Potential degradation of wetlands in the APP construction area would have the same causes
and mitigations as described for the proposed Project.
The extent of wetland losses associated with the construction of the Watana Hydroelectric
proposed Project impoundment, access roads and permanent facilities at the face of the dam
are unknown at this time. The basic footprints for TAPS, ARR, and highways are not expected
to change. The cumulative impacts of these projects in conjunction with the proposed Project
are not expected to increase. All of the projects identified in Table 5.20-1 would be required to
follow mitigation measures to avoid and minimize negative effects to wetlands. All effects to
jurisdictional wetlands associated with permitted projects, including the proposed Project, are
subject to a USACE Section 404 permit, which would require compensatory mitigation intended
to ensure no net loss of wetland habitat.
In 2003, the National Academies Board of Environmental Studies and Toxicology and the Polar
Research Board published a report on the cumulative environmental effects of oil and gas
activities on the North Slope (NRC 2003). Although the proposed Project is not likely to have a
measureable effect on the continued exploration and development of oil resources on the North
Slope, it has been assumed the placement of the proposed GCF facility on the North Slope for
the proposed Project would have cumulative effects similar to those identified in the Academies’
report. It is also assumed that technologies for exploration and development of oil and gas
resources will continue to improve, thereby producing smaller cumulative effects for future
projects than would have been expected by similar actions in the 1970s, 1980s and 1990s. The
cumulative adverse effect on North Slope wetlands would therefore be minor.
Table 5.20-5 summarizes the cumulative effect on wetlands from the proposed Project in
combination with reasonably foreseeable projects.
Floodplains
The proposed Project would cross an estimated 518 streams. Wetlands associated with these
crossings are incorporated in the discussion of wetlands above. The size of the floodplain at a
specific crossing is dependent upon the topographic relief at the crossing. For example, the
crossing of the Yukon River would be at a point where the flood plain is completely avoided.
Conversely, where the proposed alignment would be parallel to the crossing, in an area of low
topographic relief, and/or in close proximity to a stream, it would be likely that the flood plain
crossing could be hundreds of feet in length. Almost all of the flood plain crossings associated
Alaska Stand Alone Gas Pipeline 5.20-45 Final EIS
with the proposed Project have previously been crossed by TAPS, highways and the ARR. This
provides a historic data base on the hydrological conditions, frequency, and volumes of water
flow during flooding that are relevant to the design of the proposed Project system. The effects
of these crossings are summarized in the existing environment and are incorporated in the
baseline condition.
The conceptual 80-mile long pipeline system between the NGLEP facility at MP 39 of the
Beluga Pipeline and a conceptual fractionating facility and marine terminal in the Nikiski
industrial complex would cross a number of streams originating on an active volcano (Mount
Spurr) that have a unique set of flood plains not encountered elsewhere in the proposed Project.
These flood plains are presently crossed by a number of pipelines that may provide hydrologic
information relevant to designing a new pipeline system when crossing flood plains.
Wildlife
Habitats crossed by the proposed Project support a diversity of wildlife, including big game
animals, small game animals and furbearers, waterfowl and game birds, and many other
nongame animals10. Wildlife habitats along the proposed Project alignment include arctic
tundra, alpine tundra, boreal forests, and coastal forests. Much of the proposed Project route
crosses through wetland and riparian habitats. Vegetation communities provide forage, cover,
and breeding habitats for wildlife. This section addresses common big game animals, small and
unclassified game animals and fur animals, waterfowl and game birds, and other common
nongame animals in the proposed Project area. Wildlife that are considered eligible for or listed
under the Endangered Species Act, Marine Mammal Protection Act, Bald Eagle Protection Act
and species identified as having conservation concerns are discussed in Section 5.8,
Threatened and Endangered Species.
Past actions between the North Slope and MP 540 associated with the construction, operation,
and maintenance of TAPS and the Dalton, Elliott and Parks Highways, and the ARR have
resulted in extensive studies providing inventories of the various wildlife habitats, wildlife
populations, and sensitive periods in their life cycles in the region. The proposed Project will
create a linear habitat modification in the area, which can produce localized habitat
fragmentation. A set of mitigation measures and BMPs have been tested and reevaluated in
the EISs and authorizations for ANGTS and for TAGS. These practices were more recently
examined as part of the TAPS ROW Renewal EIS. These BMPs would be applied during the
permitting phase of the proposed Project and, therefore, are not expected to produce long-term
cumulative impacts for the proposed Project, TAPS and the Dalton or Elliott Highways. For the
same reasons, no long-term, extensive cumulative impacts to wildlife would be expected due to
construction, operation and maintenance of the APP between the North Slope and MP 540.
10
Common names of animals are used in this section. Common and scientific names follow nomenclature in MacDonald and Cook (2009), the American Ornithologists’ Union (2009), or NatureServe (2009) for most animals discussed in this section are listed in Table 5.5-3. Where animals discussed in this section are not included in Table 5.5-3, common names are followed by the scientific name.
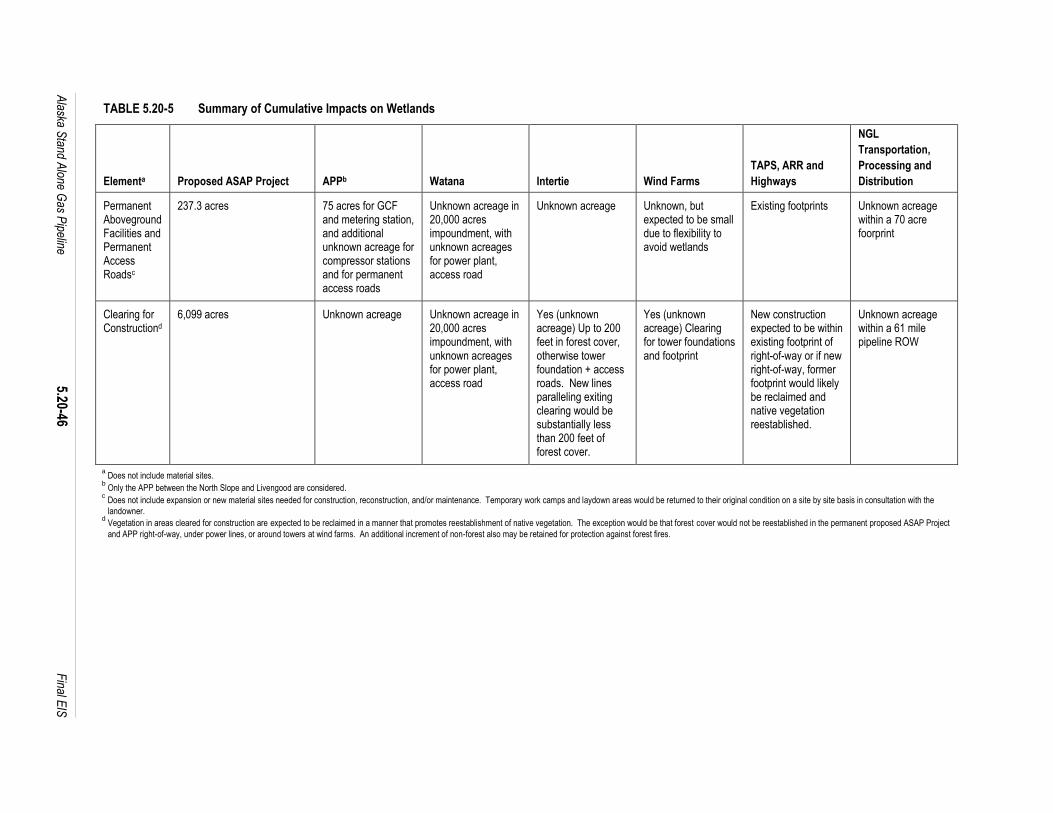
Alaska S
tand Alone G
as Pipeline
5.20-46
F
inal EIS
TABLE 5.20-5 Summary of Cumulative Impacts on Wetlands
Elementa Proposed ASAP Project APPb Watana Intertie Wind Farms
TAPS, ARR and
Highways
NGL
Transportation,
Processing and
Distribution
Permanent Aboveground Facilities and Permanent Access Roadsc
237.3 acres 75 acres for GCF and metering station, and additional unknown acreage for compressor stations and for permanent access roads
Unknown acreage in 20,000 acres impoundment, with unknown acreages for power plant, access road
Unknown acreage Unknown, but expected to be small due to flexibility to avoid wetlands
Existing footprints Unknown acreage within a 70 acre foorprint
Clearing for Constructiond
6,099 acres Unknown acreage Unknown acreage in 20,000 acres impoundment, with unknown acreages for power plant, access road
Yes (unknown acreage) Up to 200 feet in forest cover, otherwise tower foundation + access roads. New lines paralleling exiting clearing would be substantially less than 200 feet of forest cover.
Yes (unknown acreage) Clearing for tower foundations and footprint
New construction expected to be within existing footprint of right-of-way or if new right-of-way, former footprint would likely be reclaimed and native vegetation reestablished.
Unknown acreage within a 61 mile pipeline ROW
a Does not include material sites.
b Only the APP between the North Slope and Livengood are considered.
c Does not include expansion or new material sites needed for construction, reconstruction, and/or maintenance. Temporary work camps and laydown areas would be returned to their original condition on a site by site basis in consultation with the
landowner. d Vegetation in areas cleared for construction are expected to be reclaimed in a manner that promotes reestablishment of native vegetation. The exception would be that forest cover would not be reestablished in the permanent proposed ASAP Project
and APP right-of-way, under power lines, or around towers at wind farms. An additional increment of non-forest also may be retained for protection against forest fires.

Alaska Stand Alone Gas Pipeline 5.20-47 Final EIS
Habitat areas that would receive special attention during the final location of pipeline facilities
and associated construction and maintenance schedules include raptor nesting concentration
areas such as at the Yukon River crossing and water fowl concentrated nesting areas such as
the Kahiltna Flats and Susitna Flats. Previous studies by the BLM, USACE, FERC and the
State of Alaska have concluded that construction of both TAGS and ANGTS in close proximity
to TAPS and highways would have minor cumulative impacts to wildlife11. The mitigation
measures developed for the TAPS to MP 540 also apply, as appropriate, to the remainder of the
proposed Project system. The two largest cumulative impacts to wildlife in the general
proposed Project area would be the future expansion of the Intertie system and its associate
forest removal, and the creation of the reservoir associated with the Watana Hydroelectric
Project.
The reasonably foreseeable action of expanding the FNG service area would be to provide
natural gas to residential and commercial users in or adjacent to already developed areas. It is
unlikely there would be short-term cumulative impact to wildlife habitats or populations and no
long-term cumulative impacts to wildlife or their habitats would be expected.
Fish Resources
The proposed Project would cross 518 streams.12 An estimated 84 stream crossings involve
anadromous fish habitat; 18 involve streams designated by the State to contain habitat for fish
of conservation concern.13 The applicant has identified the preferred method for crossing each
stream (open cut 470, HDD 41, or bridge 4). Anadromous fish habitats have been initially
identified at 102 crossings (84 with anadromous fish habitat, 9 with fish of conservation concern
and 9 with both anadromous and conservation concern fish habitats). Crossings involving
anadromous fish habitat or known species of concern would be scheduled for winter
construction to minimize impacts (see Table 5.6-4).
In addition to habitats for anadromous and/or species of conservation concern, the potential
effect of the proposed Project on fish are considered when applying for permits required for
work in fish habitat (ADF&G) and for temporary water use permits (ADNR). During the site
specific-stream crossing permitting process, the applicant’s preferred method for crossing can
be changed (e.g., from open cut to a bridge or HDD), to provide additional protection for fish
habitats associated with the crossing. Likewise, the proposed timing for construction may be
changed to provide enhanced fish habitat protection. Other factors that would be considered
during the final design of the proposed Project include examining the time that equipment would
need to be operated within the stream, maintaining minimum flows and structure designs
11
Minor was defined as localized change in species abundance, distribution, habitat availability or habitat quality during the period of construction (BLM and USACE 1987).
12 Most streams that would be crossed by the proposed Project have site specific stream character (depth, width,
stream bottom structure, as well as normal and flood flows) and the presence or absence of fish as a result of previous construction/maintenance activities on the ARR, TAPS or highways. These data are useful in the evaluating the conceptual stream crossing design for ASAP but are not a substitute for site specific information required for final design and permitting at each stream crossing and for each lake where water would be withdrawn for construction.
13 Only streams that have been studied are listed as having a fish species of conservation concern (ADF&G 2006).
Alaska Stand Alone Gas Pipeline 5.20-48 Final EIS
providing for fish passage, blasting, potential for degraded water quality, change to the water
temperature regime, disposal of water used for hydrostatistic testing, procedures for fueling
construction equipment, and proximity of fuel storage to a water body. Past and current
construction and routine maintenance of the ARR, TAPS and highways show that incorporating
these factors avoids direct, indirect, and cumulative negative impacts to fish habitats and fish
populations in the areas that would be crossed by the proposed Project. In addition to avoiding
negative impacts to fish habitats, project elements can be designed to improve fish habitats.
Examples include the development of permanent water supply sources for the Prudhoe Bay
area that also provide overwinter fish habitat, creation of grayling habitat in the Atigun River
valley, and removal of impediments to fish passage. Opportunities to enhance fish habitats
would be considered during final design and permitting.
The AGDC has identified the need to withdraw water from fresh water lakes during construction.
The specific lakes that would be impacted are not yet known. Applications to the ADF&G under
Title 16 (fish habitat) and to the ADNR for temporary water use permits typically require that
data on the volume of water in the lake to be used and the bottom profile of the lake be known
in order to estimate the likely effects of the proposed water withdrawal on fish habitats. This is
especially true for any lakes that provide habitat for overwintering fish. It is unlikely that both the
ADF&G and ADNR would approve water withdrawals that would adversely impact any fish
populations in the lake proposed for water withdrawal.
Between the GCF and MP 540, the proposed Project would cross about 400 streams; 29 have
anadromous fish habitats and 13 with habitats for fish of conservation concern. The proposed
Project and the APP are generally in close proximity to each other between the GCF and
MP 40514 with both projects following alignments previously approved for ANGTS and TAGS.
Accordingly, no negative cumulative impacts to fish habitats from the proposed Project, APP, or
the Dalton, Parks, and Elliott Highways would be realized.
From MP 540 to MP 737 there would be 118 stream crossings. Approximately 55 of the
crossings would involve anadromous fish habitat; 4 with habits for species of conservation
concern (Table 5.6-4). The proposed Project from about MP 485 to about MP 709 and the
Fairbanks Lateral would generally follow the ARR and Parks Highway. There are existing data
sources from existing crossings that would be relevant to the final design and permitting of the
proposed Project. For the same reasons discussed above for crossings between the GCF and
MP 540, no negative cumulative impacts to fish habitats would be reasonably expected for this
portion of the proposed Project.
The area between MP 709 (Willow) to MP 737 would not parallel or be near any existing or
reasonably foreseeable projects that would potentially cause negative cumulative impacts to fish
habitat or fish populations. This segment would intersect several high voltage transmission
lines that likely do not have fish habitat data relevant to the proposed Project. It is recognized
some of the streams in this segment are crossed by the ARR and Parks Highway and local
roads but at a distance upstream from the proposed Project, thereby reducing the usefulness of
14
The ASAP alignment also would remain in close proximity to TAPs and the previously authorized rights-of-way for ANGTS and TAPS to the vicinity of Fairbanks under the Minto-Fairbanks Route Option.

Alaska Stand Alone Gas Pipeline 5.20-49 Final EIS
the data for the proposed Project. Overall, the segment between MP 709 and MP 737 would
have potential cumulative impacts as a result of ARR, Parks Highway and other road crossings;
the remainder would have only direct and indirect effects to fish habitats and fish populations.
No negative cumulative impact to fish habitats or fish populations are reasonably foreseen for
stream crossings between MP 709 and MP 737.
Expansion of the FNG service area could require crossing streams with fish habitats. The
cumulative effects of these potential crossings on fish habitat or population is speculative, but
because permits would be obtained prior to construction, and the extent of the crossing would
be minimal, they would not be expected to have a negative cumulative impact.
The conceptual 61 mile of pipeline from the NGLEP to Cook Inlet cross or impact an unknown
number of streams. Construction work would also occur in the marine waters of Cook Inlet for
the 19 mile portion of pipeline and for the marine terminal facility at Nikiski. The existing upland
and marine pipeline systems near the conceptual alignment for this Connected Action likely
would provide data on fish habitats and populations relevant to the location and design. The
overall impacts of the Connected Action of developing facilities to produce and transport NGLs
from the NGLEP at MP 39 of the Beluga Pipeline to Nikiski on fresh water and marine fish
habitats and populations are currently unknown and would need to be addressed prior to
permitting and construction.
Marine Mammals
The proposed Project would not construct any facilities on marine waters or on marine
shorelines. Direct impacts on marine mammals are not expected. However, all pipe and most,
if not all, construction equipment and supplies for the proposed Project would be delivered by
ocean going ships to the Port of Seward and modules and other construction equipment for
proposed Project facilities on the north Slope would be sent by sealift to West Dock at Prudhoe
Bay. The number of landings at the Port of Seward would depend on the size of the vessels
used and the total tonnage and volume of pipe, equipment and supplies needed to construct the
proposed Project. It is likely that existing hydrotrain service would also be used since supplies
would already be loaded on rail cars eliminating the offloading/reloading operation from a
conventional ocean going cargo vessel. The shipping routes for pipe, equipment, and supplies
could involve pipe delivered from manufacturing sites in Asia.
Threats to marine mammals from ocean going vessels could involve: vessel strikes, pollution in
the event of a sinking or collision with another vessel, or by providing a vector for the
establishment of invasive marine species. The waters of Resurrection Bay and outer coast of
Alaska on the approaches to the Port at Seward seasonally host humpback, grey, and minke
whales and orcas. One species of dolphin, three species of porpoise, and one species of seal
are year around residents (Table 5.7-1).
One or more ocean going barges would be used to deliver modules for the proposed Project
GCF to West Dock at Prudhoe Bay during the summer open water season. Humpback,
bowhead, grey, and beluga whales are associated with the marine waters near West Dock.

Alaska Stand Alone Gas Pipeline 5.20-50 Final EIS
Threats to marine mammals from ocean going vessels along the North Slope would have the
same general potential impacts as described for Seward. An important difference is that marine
mammal observers are generally required to be on board commercial vessels during sealift
operations to reduce the risk of a vessel striking a marine mammal or creating stress when
transiting the waters also used by Alaskan Natives for subsistence whaling. Negative
cumulative impacts to marine mammals would not be expected from shipping modules to West
Dock from the Port of Seward or elsewhere under normal conditions and established marine
mammal protection measures.
The Connected Action associated with expansion of the FNG service area likely would not
require any marine shipments to the ports at Seward, Anchorage, Whittier, or Valdez outside the
normal annual variation in the quantities delivered by ocean going ships. Therefore, no new
direct, indirect, or cumulative impact on marine mammals at one of these ports would be
expected.
The construction of the conceptual 80 mile-long pipeline system between the NGLEP at MP 39
and a fractionation facility at Nikiski involves constructing of a marine pipeline system across
Cook Inlet. There would be potential cumulative negative impact to marine mammals in lower
Cook Inlet during construction of the marine pipeline system as well as any modifications to an
existing or new marine terminal at Nikiski. Recent construction of a fiber optics cable across
Cook Inlet should provide relevant information on potential direct, indirect, and cumulative
impacts to marine mammals in lower Cook Inlet. Transportation of products from the
conceptual Nikiski facility would likely involve both highway and marine transportation. Potential
direct, indirect and cumulative effects on marine mammals from vessel traffic in the lower Cook
Inlet as well as other waters along and within Alaska and the potentially export of produced
products elsewhere could be expected.
Threatened and Endangered and Other Federally or State Designated Species
The ESA provides a formal method to designate species that should be protected. A species
can be designated as Endangered or Threatened, Candidate or Proposed. Other federal laws
giving special designation for species include the Bald Eagle Protection Act, Marine Mammal
Protection Act, and Migratory Bird Treaty Act. The ADF&G also has a mechanism to designate
species for special attention under Alaska Law. Finally, federal, state, and local land use plans
may establish habitat areas with special conditions designed to protect a species such as for
peregrine falcon nesting, sheep lambing, spring and fall bird migration concentration areas, and
trumpeter swan nesting areas. See Tables 5.3-2, 5.5-5, 5.6-1, 5.8-1 and 5.8-2 for plants, fish,
birds, and mammals with federal or state designations.
Potential negative impacts to a species with federal or state designations would occur from a
variety of actions that range from changing the normal behavior of a designated species by
proximity or noise, death as a result of a vehicle or vessel collision, or loss of habitat.
Mitigations include avoiding location of proposed Project facilities in habitats important to a
federally or state designated species. Another important mitigation would be the period when
construction or maintenance activities would be scheduled. For example, scheduling an activity

Alaska Stand Alone Gas Pipeline 5.20-51 Final EIS
during the winter avoids disturbing nesting birds. Overall, determining the best time for a site
specific construction or maintenance activity is a balancing act; e.g., avoiding the bird
nesting/rearing periods on the North Slope by scheduling activity during the winter could have
potential cumulative negative effects on Polar Bear.
Cumulative impacts to designated species could occur from marine transportation to the Port of
Seward and to West Dock, from pre-construction activity such as on-the-ground site specific
activity including use of helicopter and fixed wing transportation and setting up construction
camps and equipment/pipe storage sites. These activities could occur in conjunction with
impacts from other existing and future projects including biological surveys and research on the
North Slope.
The proposed Project and its connected actions could have potential cumulative effects on a
wide range of plant species. Table 5.3-2 lists 57 plants species that may be associated with the
proposed Project. Federal or state designations have been made for 28 plant species; the
remainder of designations is based on literature research describing the expected distribution of
that plant. One plant, the Aleutian shield-fern, is listed as endangered under ESA but is not
likely to be located within the area the proposed Project area (to date it has only been found in
the Aleutian Islands). There have not been any surveys done to date by the AGDC to
determine the absence or present of the plants listed in Table 5.3-2. Intensive plant inventories
have been done for TAPS and for the construction access road now known as the Dalton
Highway. Likewise intensive plant and other surveys were conducted for ANGTS and for TAGS
ROWs. These inventories may be proprietary, but to the extent available should provide
relevant information for the proposed Project.
Ten Pacific salmon stocks have been designated as Endangered (Section 5.8.5.16). These ten
species are associated with spawning and migration habitats in Puget Sound and in the
Columbia and Snake River drainages. During their life cycle in marine waters some of these
fish populations may reach Alaskan waters that would be transited by vessels bringing pipe and
supplies to the Port of Seward or GCF modules to West Dock. Federal and state designation
include nine species of fish for special attention. Since each stream crossing requires site
specific data and permits, no cumulative negative impacts from the proposed Project with
TAPS, ARR, Highways or Intertie upgrades to the populations, distributions, or habitats of these
nine species of fish would be expected. The extent any of these ten species of fish that could
be affected by the Watana Hydroelectric Project is not known.
The Spectacled and Steller’s eiders, are designated as Threatened. The Eskimo Curlew is
designated as Endangered, but is thought to be an extinct species. The Yellow-billed loon is
designated as a Candidate. Both the Bald and Golden Eagles are protected under the Bald
Eagle Protection Act. Although Delisted, the American and Arctic Peregrine Falcons still receive
special consideration through BLM land use designations. Other federal and state designations
include eight bird species for special consideration (Table 5.5-5). The general location of the
habitats used by these birds and the seasons of use for proposed Project activities are well
understood. It is expected the location, design and construction seasons for the GCF and
mainline pipeline and associated facilities would be selected to avoid negative impacts to the

Alaska Stand Alone Gas Pipeline 5.20-52 Final EIS
designated species of birds. Since each activity potentially involving a designated species
requires site specific data and permits, no long-term cumulative negative impacts would be
expected from the proposed Project with TAPS, ARR, Highways or Intertie upgrades to the
populations, distributions, or habitats of two species of eiders, yellow-billed loons, bald and
golden eagles and the other federal and state designated species of birds. Marine
transportation of pipe and construction materials to the Port of Seward or West Dock would not
likely cause adverse cumulative effect on federal or state designated birds. The extent any of
the designated species of birds that could be effected by the Watana Hydroelectric Project is not
known.
Marine vessel traffic needed to support the proposed Project would cross habitats used by nine
marine mammals listed under ESA: Endangered fin whale and humpback whale; Threatened
Polar Bear, sea otter, and Steller sea lion; Proposed bearded seal, bowhead whale, and ringed
seal; and Candidate Pacific walrus (see Table 5.8.1). A tenth species, the Cook Inlet population
of beluga whales is a Candidate species and would be potentially impacted should vessel traffic
involving the GCF include shipments from the Port of Anchorage.
Polar Bear potentially could experience negative cumulative impacts from on-shore construction
and operation activities for the proposed Project, TAPS, and Dalton Highway, and off and on
shore oil exploration and development. On-shore designated Critical Habitat for maternal
denning sites extends inland to approximately MP 8, with the potential for denning extending
inland to about MP 15 (Figure 5.8-1). Operations during the winter are required to identify
topography that would be favorable to forming snow drifts that could be used for polar bear
denning when an activity would occur and work would either avoid those areas or an on-the-
ground survey to determine if there are any dens would be required. Generally, the topographic
settings for the proposed Project are not favorable for denning habitat. In addition to denning,
adult Polar Bear may be killed when threatening people. The operating companies have
developed an approved management process that details how they would address Polar
Bear/human encounters on the North Slope.
Although polar bear tend to be associated with the coastal area, single individuals have been
reported as far inland as TAPS Pump Station 4 and more recently near Fort Yukon, south of the
Brooks Range. It is expected that the proposed Project and other non-related oil and gas
activities would incorporate USFWS-approved management measures during construction and
operations.
The state is considering reintroduction of the wood bison to habitats that may be crossed or
near the mainline. It is not certain when or where the reintroductions may or may not occur as
the Secretary of the Interior has been requested to clarify the status of an introduced listed
species that is also planned to be harvested when the population reaches a pre-determined
size. Other federal and state designations list two other mammals (Alaska tiny shrew and
Osgoods Arctic Ground Squirrel) that would need to be consideration as more detailed
information on the location, design, and construction of the proposed Project are developed
(see Table 5.5-5).

Alaska Stand Alone Gas Pipeline 5.20-53 Final EIS
Based on the measures incorporated for the location, design, and construction of TAPS and
subsequently included in the initial authorizations to construct ANGTS and TAGS, and vessel
traffic along the North Slope to and from West Dock, the proposed Project is not expected to
create long-term negative cumulative impacts to federally or state designated species. There
could be short-term negative direct and indirect impacts to a designated species that could also
have cumulative negative effects as a result of the frequency of disturbance, or the extent that
other nearby activities such as a maintenance activity on TAPS, ARR, or highway would occur
during the same general period. Concurrent construction of APP is not expected, but pre-
construction activities for APP may occur in the proposed Project area. Concurrent, nearby
activity associated with the Watana Hydroelectric Project or the Intertie would not be expected.
Coordinating the period of activity for the proposed Project with other reasonably foreseeable
projects could minimize the level of cumulative disturbances to designated species.
The reasonably foreseeable action of expanding the FNG service area likely would not involve a
direct, indirect, or cumulative negative effect on federal or state designated species. If a habitat
for a designated species is identified during the planning process for this activity, then
procedures would need to be established to avoid negative effects.
The reasonably foreseeable development of an 80-mile-long pipeline system including an
estimated 19 mile-long submarine pipeline, across Cook Inlet, fractionation facility, tank farm
and marine terminal at Nikiski could have a cumulative effect on the Cook Inlet population of
beluga whale to the extent that marine transportation is used to deliver supplies to the Port of
Anchorage and/or Port MacKenzie. Cumulative effects to other federal and state designated
species would also be possible. The extent of any negative cumulative impacts to beluga
whales and other designated species would need to consider the shipping activities related to
the other reasonably foreseeable projects and limitations that could be put into place regarding
Critical Habitat determinations. Existing data for activities at Nikiski, a new submarine
telecommunication cable, evaluations associated with continued and possibly increased oil and
gas leasing in and around Cook Inlet, and the existing gas pipeline system on the north side of
Cook Inlet may be relevant to these determinations.
Reasonably foreseeable distribution of NGLs from Nikiski likely would also involve the need for
incremental additional vessel traffic along the coast of Alaska and on inland Alaskan waters.
These incremental increases could cause cumulative effect to designated species, in
conjunction with the activities needed for the other existing and reasonably foreseeable projects.
Land Use and Ownership
Table 5.9-13 (Summary of Applicable Land Use Plans and Documents) provides information on
land use plans associated with the proposed Project. Table 5.20-6 summarizes generalized
land ownerships for the proposed Project.

Alaska Stand Alone Gas Pipeline 5.20-54 Final EIS
TABLE 5.20-6 Generalized Ownerships that would be Crossed by the Proposed Project
Land Ownership Percentage of Land Crossed by the Proposed Project a
State 72%
Federal 17%
Native/Native Allotment 4%
Other Private 2%
Borough and Municipal 5%
a Percentages may not equal 100% due to rounding.
Some existing parcels are pending ownership transfer from the BLM to the State of Alaska
under the provisions of the Statehood Act and from the BLM to Native Corporations under
provisions of the Alaska Native Claims Settlement Act (ANCSA). Some state-owned parcels
also may be transferred to Boroughs/Communities under State law. Where final land ownership
due to a land transfer has not been completed the proposed Project would consider the BLM as
the current owner and the State as the prospective owner. A variety of laws and regulations
apply to State owned lands, but lands owned by the ARR and the Mental Health Trust (MHT)
have exclusive jurisdiction, including the final decision on location, width, and compensation for
a ROW or other use of ARR or MHT land. Native Corporation/Native Allotment ownerships are
private land where the proposed Project would negotiate the terms of use with the owners.
Overall, it is unlikely the proposed Project would result in any appreciable cumulative change of
the existing or prospective ownerships because most proposed Project facilities, in combination
with the other feasible actions, would be placed on ROWs or easements purchased from the
land owner rather than a fee title purchase.
State Lands
State lands on the North Slope that would be crossed by the proposed Project are generally
designated for industrial uses. Proposed Project facilities would occupy lands that have
previously been considered acceptable for construction and operation of the Prudhoe Field,
TAPS and two large diameter gas pipeline systems (ANGTS and TAGS), and Dalton and Elliott
Highways. Accordingly, the proposed Project would not be inconsistent with existing and
previous decisions by the State of Alaska for transportation and to promote the responsible
development and transportation of oil and gas resources on the North Slope. No adverse
cumulative effects on land use on State land between the North Slope and Livengood is
reasonably expected due to the proposed Project in combination with these other existing and
reasonably foreseeable projects.
South of Livengood, the proposed Project crosses a variety of State land with different land use
plans including Highways, State Game Refuges, State Parks and lands owned by the ARR.
Proposed Project facilities between Mile Posts 408-458 would be located within or near State
designated transportation corridors (RS 2477 rights-of-way) across the eastern edge of the
Minto Flats State Game Refuge. These RS 2477 designations generally involve overland

Alaska Stand Alone Gas Pipeline 5.20-55 Final EIS
routes for winter travel when the ground is frozen and snow covered. These primitive trails tend
to follow the easiest terrain, are devoid of bridges and culverts, and are not maintained as public
roads. This general alignment across the Minto Flats was also considered for the location of the
TAGS system as part of the Cook Inlet Alternative (BLM and USACE 1988). The proposed
Project would create a widened clearing paralleling the RS 2477 trails and would involve the
construction of approximately 57 miles of new permanent gravel road extending northward from
the Parks Highway. There are no other linear projects in the immediate vicinity to contribute to
cumulative effects.
From Mile Post 458 both the Fairbanks Lateral and mainline southward generally would be
within or adjacent to the Parks Highway and ARR. The Parks Highway and ARR also cross a
number of state lands that have been given special designations as a park or recreation area.
Since the proposed Project is within or adjacent to an existing transportation system through
these areas, the cumulative effects of the construction and operation of the proposed Project
are expected to be minimal.
At approximately ASAP MP 710 (near Willow) the proposed Project would generally follow a
winter trail crossing undeveloped State land to the west of the Nancy Lake State Recreation
Area and the northeastern corner of the Susitna Flats State Game Range. It would cross the
Little Susitna State Recreation River and the Iditarod National Historic Trail site (MP 735). The
proposed Project would create a cumulative impact on undeveloped state land use to the extent
it provided new public access for recreationists, and hunters. The ARR Port MacKenzie Rail
Extension would create a new transportation corridor from the vicinity of Houston to the Port;
which is several miles to the east of the proposed Project. The ―Willow‖ ARR alternative rail
alignment generally follows the same alignment proposed for the proposed Project and would
constitute an additional linear project providing additional access though the area.
Federal Lands
The proposed Project ROW would cross federal lands administered by the BLM and the Air
Force. BLM lands that would be crossed by the proposed Project are within a Transportation
and Utility Corridor (TUC) that has been withdrawn by P.L.O. 5150 (December 31, 1971) by the
Secretary of the Interior to protect the route subsequently occupied by the Dalton Highway,
TAPS and its associated facilities, and buried and surface communication facilities.
The BLM has also issued approvals to construct and operate two large diameter natural gas
pipeline systems (ANGTS and TAGS15
) in the TUC. Construction and operation of the
proposed Project would not be inconsistent with the purposes for which the TUC were
established. Accordingly, no cumulative impacts to land use on BLM lands in the TUC are
reasonably expected.
The Elliott Highway would be used to transport construction equipment, pipe, and other
construction materials from Fairbanks for proposed Project construction. A portion of BLM
lands crossed by the Elliott Highway are within the TUC which adjoins the White Mountains
15
Note that BLM has terminated Yukon Pacific Corporation’s ROW for TAGS as of October 27, 2011

Alaska Stand Alone Gas Pipeline 5.20-56 Final EIS
National Recreation Area. This public access point within the White Mountains National
Recreation Area is about 25 miles distant from the proposed Project ROW at Livengood. BLM
lands within the TUC have been incorporated into larger Resource Management Plans that
address public access to adjacent public lands from the Dalton and Elliott Highway. These
access points often contain parking, information, and camping facilities. The BLM has also
designated a number of ACECs16
that would be crossed by the proposed Project. Overall, the
proposed Project would not create cumulative impacts to BLM land uses not previously
considered in the preparation of existing and ongoing BLM land use plans for the proposed
Project alignment and for the White Mountains National Recreation Area.
The proposed Project would cross or be in close proximity to the Clear Air Force Station
between MP 490-500. About 6 miles of the proposed Project alignment would be located
between the main military facilities and the east bank of the Nenana River. The ARR and Parks
Highway now cross or are in close proximity to the eastern edge of the Station. Following the
existing highway or ARR alignments around Clear would add approximately 1.5 miles of
mainline pipe. Minor cumulative impacts could occur should construction coincide with military
activities.
Native Corporation and Other Private Lands
The bulk of Native Corporation-owned land in the proposed Project area is located south of
Denali State Park. Other private lands are concentrated in areas such as Wiseman, Dalton
Highway south of the Yukon River, Livengood, Elliott Highway, Fairbanks and along the Parks
Highway. These private lands would be restricted to a few hundred feet of the proposed Project
mainline ROW. Land uses on Native or other private land likely would not change appreciably
since the ROW would be in close proximity to the existing highway system and the pipeline
would be buried. The proposed Project has not proposed to locate permanent facilities on
Native or other private land.
The proximity of the proposed Project to Doyon Ltd. ownerships with oil and gas potential would
enhance economic feasibility if commercial reserves of gas are discovered. Development of
these private lands may cause a modification of the Yukon Flats National Wildlife Refuge
comprehensive land use plan. Likewise, discovery of commercial gas resources on Doyon Ltd.
land in the Minto Flats State Game Refuge could result in a revision of the existing State land
use plan.
Borough/Municipal Lands
No adverse cumulative effects to Borough or Municipal land use or ownership are likely given
the fact the proposed Project would be within or immediately adjacent to existing transportation
16
See Environmental Atlas of the Trans Alaska Pipeline System prepared by the Alyeska Pipeline Service Company June 1993 for the general relationship of TAPS and Dalton Highway to designated ACECs, and special land use designations for sensitive fish and wildlife habitat, as well as recreation, scenic, subsistence and cultural resources that have been considered in the previous BLM authorizations for the construction and operation of TAPS and Dalton and Elliott Highways and the two large diameter ANGTS and TAGS pipeline systems.
Alaska Stand Alone Gas Pipeline 5.20-57 Final EIS
or utility corridors. Some adjustment may be required in the Fairbanks area to accommodate
the location and operation of the proposed Project pipe preparation activities (double-jointing
and pipe coating).
The reasonably foreseeable action of expanding the FNG natural gas distribution system would
be consistent with the ongoing expansion of natural gas for domestic and commercial use.
Extension of the FNG service area appears consistent with ongoing expansion in the area. The
majority of the expansion would be by underground pipe, but purchase or lease of land parcels
for some above-ground facilities may be needed.
The reasonably foreseeable action of locating the fractionation facility, tank farm, and marine
terminal in the Nikiski industrial area would be consistent with land use and ownership
designations set by the Kenai Peninsula Borough. The 80 mile-long pipeline system connecting
the NGLEP at MP 39 to Nikiski would cross the Susitna Flats State Game Refuge and the
Trading Bay State Game Refuge. A pipeline system presently crosses both of these State
administered wildlife habitat areas, hence there appears to be no unsolvable issues with
another pipeline system. Because the pipe would be buried as are the other pipelines, there
would be minimal cumulative effects on land use.
Tourism Travel
Tourist and general recreation travel in Alaska primarily involves air, rail and highway modes,
with additional marine connections by the AMHS at many ports and large cruise ship dockings
at Anchorage, Seward, and Whittier. Cumulative impacts to tourists for scheduled air
transportation would result in increased competition among tourists, construction workers
(associated with the proposed Project) and current air travel by oil industry workers on the North
Slope and TAPS. Transportation issues associated with the APP would likely occur at a later
date. These impacts would be observed the most at Anchorage and Fairbanks airports.
Charter air services also could be impacted to the extent that these carriers would be contracted
for proposed Project construction and, eventually, for APP construction activities. Overall, the
cumulative impact to general recreation and tourist travel would be short-term and minimal as
both scheduled air and charter air service likely would expand to accommodate travel needs.
Tourists also use ARR services for travel within the Railbelt, and particularly as a means to get
to Denali NPP from both Anchorage and Fairbanks. The ARR also would potentially be
transporting pipe, construction materials and equipment to Fairbanks for the proposed Project
and to laydown and construction camps located between Anchorage and Fairbanks.
Competition for rail services for the proposed Project and, later, for APP construction activities,
is not expected to be an adverse cumulative effect because the ARR can schedule construction-
related service and tourist-related service such that overlap is minimized. However, the
proposed Project, and potentially APP, laydown sites/construction camps along the ARR
corridor would change the general character of the rail experience for ARR passengers. This
effect could last for a time prior to construction as materials are mobilized to sites and then for
the several years duration of construction.

Alaska Stand Alone Gas Pipeline 5.20-58 Final EIS
Tourists often travel Alaska highways by busses provided by the cruise ship companies, in
private vehicles, and to a lesser extent by rental vehicles. Proposed Project summer
construction activities would be limited to several summers with scheduled summer construction
at Atigun Pass (MP 263-183, 2 summers), north of the Yukon River (MP 289-346), Yukon River
to Livengood (MP 360-405), Healy (MP 528-536) and north of Honolulu Creek (MP541-602).
The 35 mile-long Fairbanks lateral also is scheduled for summer construction, but this activity
would be along the ARR which is not adjacent to the Parks Highway. Highway work that could
coincide with proposed Project-related construction use of the highways (with the exception of
the Denali National Park area) would also be scheduled for the summer season, and would add
to the impacts from proposed Project construction. To the extent practicable, the proposed
Project construction schedule should consider the opportunity to schedule pre-construction and
construction activities that could affect traffic on the Park Highway to the shoulder months to
reduce combined negative effects to tourist travel during the peak of the summer season.
Although there are no major highway work projects currently scheduled for the sections where
the proposed Project would be near the Dalton, Elliott, or Parks Highways, there would be the
need for highway work on all three highways that has the potential to create short-term delays
and detours that could have a cumulative effect on the length of travel time.
During expansion of the FNG distribution system, there also would be short-term and temporary
impacts to traffic flow where new buried pipelines are constructed in or near a roadway or
across highways. Traffic delays would be expected to last from a few minutes to a few hours.
These could add to cumulative proposed Project effects on travel, but they would be short-term
and localized.
Cumulative impacts to traffic flow would not be expected due to construction of the NGL pipeline
to Nikiski and the related facilities at the industrial facility. The construction of these facilities
would not be near or adjacent to any of the main highways generally used by tourists.
General Recreation
There will be increased competition between construction workers, tourists, and Alaskan
residents for activities such as sport fishing, hunting, sightseeing, and lodging in back-country
lodges, small public campgrounds and hotels along the Dalton, Elliott and Parks Highways, and
charter air services due to the personnel involved in construction of the proposed Project and
the other existing and reasonably foreseeable actions. The effect of increased competition for
services will be cumulative, negative, and short-term. In locations with limited recreation
facilities/resources the competition likely could be locally severe as construction workers would
have more disposable income to spend in Alaska and more time to participate in these activities
if they work a typical 2-week on/2-week off schedule. This competition would be repeated when
APP or other large projects such as a major hydroelectric project or other reasonably
foreseeable action results in an influx of construction workers and other support personnel.
Except for in the eastern edge of Minto Flats and Tanana Valley State Forest area, permanent
gravel roads would not provide any substantial new access for recreationists from the existing
highway system and no negative cumulative impacts are expected. It is noted that access
Alaska Stand Alone Gas Pipeline 5.20-59 Final EIS
points from the existing highway system often become a parking area for access to adjacent
streams for fishing or to hunting or snowmobiling areas. The extent APP would or would not
use any of the new permanent proposed Projects access along the Dalton and Elliott highways
is not known. Construction of the submarine pipeline across Cook Inlet and modification to an
existing or a new dock at Nikiski could have a short-term negative effect on local tourist-related
business.
Wilderness and Primitive Resources17
Wilderness character is a land use classification that in Alaska is restricted to federal lands.
None of the federal lands directly crossed or in close proximity to the proposed Project have
been designated as Wilderness to be managed under the requirements of the Wilderness Act of
1964 as modified by the Alaska National Interest Lands Conservation Act (ANILCA) and
subsequent federal court decisions dealing with both Forest Service and BLM lands. In addition,
none of the federal lands that would be crossed by, or be in close proximity to the proposed
Project have been identified as lands having potential to be added to the National Wilderness
System (Figure 5.20-4).
The Tuxedni Wilderness Area within the Alaska Maritime NWR is located on the western shores
of Cook Inlet about 50 miles south of the submarine pipeline that would cross to Nikiski. A
negative impact to the wilderness area is not expected from that Connected Action.
Even though none of the federal lands associated with the proposed Project have wilderness
character due to the prior designation as a transportation and utility corridor that are now
occupied by TAPS, highway and utility/communication systems, the cumulative effects analysis
considers the cumulative impact to State lands that are remote from a developed transportation
or utility corridor system (e.g., the proposed Project alignment across the Minto Flats State
Game Range and the approximately 25 miles between the Willow area and MP 737 and its
proximity to the Nancy Lake State Recreation Area and the Susitna State Game Refuge). The
proposed Project would have a direct negative impact to the primitive and aesthetic resources of
the Tanana Valley State Forest, primarily for the construction of slightly more than 26 miles of
permanent gravel access road through the forest that is largely inaccessible except by dog sled,
snowmobile, ATV and float plane. Although the proposed Project would have no new
permanent access roads south of Willow, this area also is remote and accessible by dog sled,
snow machine, ATV, and float plane. The cumulative impact to primitive and aesthetic
resources from a largely unaltered landscape would be negative. There are viable, but with a
greater economic cost to the consumer of the products that would be transported by the
proposed Project.
17
Primitive Character is used in this cumulative effects analysis to encompass relative large tracts of without a developed transportation system such as a gravel road or a pioneer road with bridges and culverts that require public access by plane or ATV and lacks one or more concentrations of homes, recreation cabins, or businesses.
Alaska Stand Alone Gas Pipeline 5.20-60 Final EIS
Visual Resources
Except for the crossing of Minto Flats and from Willow to the NGLEP the proposed Project
would be near existing transportation and utility systems. From the air, the proposed Project’s
narrow18 ROW would be slightly visible as would short lateral roads to existing gravel pits,
temporary construction camps and laydown areas, and the permanent facilities at the CGF, two
compressor stations, straddle and take-off and NGLEP. Other than the areas noted above, the
overall cumulative effect of the proposed Project with the TAPS, APP, Highways, and ARR on
the visual resources of a traveler in an aircraft would be minimal since the proposed Project
would be located within an existing developed transportation and utility corridor.
Although the proposed Project route across Minto Flats would be near vegetation changes
reflected in an existing winding winter trail designed by the state as a state highway, the linear
change in vegetation for the buried pipeline and adjacent permanent gravel road would have a
pronounced effect on the visual resources when viewed from the air.
The remainder of this section considers the cumulative effect of scenic resources from the
viewpoint of a person on the ground; primarily from travelers using the Dalton and Parks Scenic
Byways19 or ARR. The proposed Project between the CGF and MP 540 would involve several
very different set of scenic resources: ranging from a treeless landscape with low relief to the
Brook Range with nearby rising hills and mountains to forest with rolling terrain buried pipeline
system. The pipeline would be buried to MP 405, but until vegetation regrows would be visible
to a traveler on the Dalton Highway crossing the Arctic Coastal Plain and Brook Range. The
CGF would be located in an existing industrial complex with extensive modification to the
viewshed and the cumulative effect on the visual resources of the Prudhoe Bay area would be
minimal. Conversely, the two proposed compressor stations would create a new development
in the existing viewshed from the Dalton Highway. Existing above ground facilities (highway
and TAPS Pump Stations and TAPS pipeline) have a pronounced effect on the existing
viewshed from the Dalton Highway. The proposed Project would have only an incremental
additional effect. The buried pipeline system would be parallel to the highway and, except for
valves and pipeline markers, not visible to a highway traveler.
The topography relief through the Brooks Range would provide regular views of the proposed
Project ROW in close proximity to TAPS, Dalton Highway and APP. Whether the cumulative
effects of these actions in combination to the viewshed of the developed transportation and
utility corridor by a traveler on the Dalton Highway would be negative or positive strictly depends
upon the perceptions of the viewer.
From approximately MP 405 to approximately MP 458 the proposed Project ROW would cause
a substantial change to the existing natural viewshed of Minto Flats as seen from the ground. A
similar negative cumulative effect to the existing natural viewshed on the east side of the
Nenana River would occur at Denali NPP. A separate Visual Report located in Appendix K was
18
Up to the 100-foot-wide construction right-of-way. 19
The entire length of the Dalton Highway was designated a State Scenic Byway in 1998.

Alaska Stand Alone Gas Pipeline 5.20-61 Final EIS
prepared by the AGDC to address the views from six Key Observation Points (KOPs) (AGDC
2011b). The report found that the visual impacts of the proposed Project would primarily be
between MP 538.5 and 540, and that the visual impacts could be greatly reduced or eliminated
with mitigation measures. The minimal impacts on the viewshed in the area would be observed
in combination with the visual impacts of the developed area at the Denali NPP entrance. The
area to the north of MP 540 is heavily developed with hotels and related facilities used by
visitors to the Park.
The reasonably foreseeable future action of extending the FNG distribution system in the
Fairbanks area would involve a short-term cumulative effect to the viewshed due to the
construction for modifications to road, homes, and powerlines. Because the viewshed is
already developed, no negative cumulative effect to the existing viewshed would be expected.
The Connected Action of developing the conceptual fractionation facility, tank farm and
modification to an existing or new dock at Nikiski would be located in an area that is designated
for industrial development. The 80 mile-long pipeline from the NGLEP at MP 39 of the Beluga
Pipeline would create a new linear modification of existing vegetation in the Susitna Flats State
Game Refuge and the Trading Bay State Game Refuge on the west side of Cook Inlet in an
area with existing linear modifications to the vegetation. The incremental addition of the
Connected Action would also be minimal in light of the existing modifications.
Socioeconomics
Existing natural gas resources in the Cook Inlet are not adequate to meet projected demands in
the Cook Inlet area or for continued production of LNG now used by FNG. A number of steps
can shift the mix of energy currently used for residential and commercial heating,
manufacturing, and production of electrical energy. Between 2000 and 2010 the population of
Alaska increased from 626,900 to 710,200 people, for an overall increase of 20 percent. The
number of people living in local jurisdictions crossed by the proposed ASAP Project increased
from 158,000 to 203,400 or almost 78 percent (Table 5.12-1). By 2030, the projected
population of Alaska is expected to be almost 853,000 with approximately 32 percent living in
local jurisdictions crossed by the proposed Project. The population of Alaska and the
percentage of people living in jurisdictions crossed by the proposed Project in 60 years is
speculative, due to its proximity to rail and highway corridors it is expected that an increasing
percentage of the state-wide population could be living in the areas directly influenced by the
proposed Project.
The Kenai Peninsula Borough would receive utility grade natural gas that would be delivered by
the proposed ASAP Project via ENSTAR and electrical energy via the Railbelt Utilities. With the
addition of the Kenai Peninsula Borough population (55,400), the number of people directly
affected by the proposed Project would increase to 36 percent of the state population in 2030.
The proposed Project would have a total estimated value of $8.4 billion (Table 5.12-19), would
provide increased tax revenues (Table 5.12-19) and would create a peak of approximately
6,400 temporary jobs in Alaska, while permanent employment (exclusive of the NGL processing

Alaska Stand Alone Gas Pipeline 5.20-62 Final EIS
and distribution facilities at Nikiski) would total between 50 and 75 jobs. Potential
socioeconomic effects resulting from the proposed Project include a secure long-term source of
energy for the people living in the service areas of Railbelt utilities, temporary population growth
in rural areas; an increase in both temporary and permanent employment opportunities; a
temporary increase in demand for public services; long-term increases to public tax revenues at
both the local and the state levels; and the short-term degradation to overall quality of life from
adverse environmental effects from increased traffic, noise, and competition for scarce
resources during construction of the proposed Project and its connected actions.
In combination with potential future projects or ongoing projects, these effects would be
amplified. Potentially beneficial effects (i.e., jobs, tax revenues) resulting from the proposed
Project would also be expanded when coupled with reasonably foreseeable future actions.
Potential adverse effects to quality of life are expected to be less than minimal given their
temporary nature during construction phases for the proposed Project and future actions.
The proposed Project would provide approximately 6,750 beds in construction camps. During
construction, additional accommodations could include Alaskan residents residing in their own
home that would drive to the nearby construction site and construction workers that choose to
use local campground facilities as a temporary home. Construction workers needed for either
the Nikiski facility and for expansion of the foreseeable FNG distribution system at Fairbanks
likely would use existing local accommodations or use existing commercial housing. It is likely
that conceptual development of the 80 mile-long pipeline system between the NGLEP and
Nikiski would require one or more temporary construction camps and associated laydown sites.
Where one or more construction camps would be located on the west side of Cook Inlet is
unknown at this time. Accordingly, there would be more jobs, more tax revenue to the State
and to local jurisdictions than discussed in Section 5.12, Socioeconomics. The socioeconomic
effects of related reasonably foreseeable actions would be realized in the Fairbanks area and at
Nikiski and their respective adjacent areas.
The proposed Project in combination with other existing and reasonably foreseeable actions
would provide a short-term positive cumulative effect on ARR income from payment for freight
services during mobilization and construction as well as revenue from reality leases. Overall,
the cumulative effect of the proposed Project, connected actions and reasonably foreseeable
actions on revenue to the ARR would be positive. As discussed previously, scheduling freight
services with ongoing and other projects in addition to the proposed Project should be possible.
The proposed Project would have a positive, short-term cumulative effect of revenue to the Port
of Seward. APP would also use the Port of Seward and the West Dock Causeway for delivery
of construction equipment and supplies. It is assumed the proposed Project’s mobilization and
construction phases would be completed prior to delivery of pipe, construction equipment and
supplies to Alaska for the APP. The recently announced FERC EIS for the APP would examine
the schedule and delivery points for the APP and its cumulative impacts to marine
transportation. Overall, the cumulative impact to existing vessel traffic at Seward or West Dock
Causeway are expected to be short-term and without adverse effects. Additionally, it is
Alaska Stand Alone Gas Pipeline 5.20-63 Final EIS
expected that the Port at Valdez also would be used as an entry point for APP with or without an
LNG component near Valdez.
A long-term reliable source of natural gas to fuel electrical generation provided by the proposed
Project would have a cumulative positive socioeconomic effect to CEA, HEA, MEA, HL&P
residential and commercial customers by contributing to reliable and cost effective electrical
power. The cumulative effects of the reasonably foreseeable action to provide utility grade
natural gas to the Fairbanks-North Pole area for heating would be positive to the extent the cost
of utility grade natural gas is less expensive that the existing use of LNG from Cook Inlet or as
proposed by LNG from the North Slope. A recent study has estimated that the potential cost
savings for the heating of residential and commercial structures in the Fairbanks North Star
Borough could start at $315 million annually if customers switched from oil and wood heat
generation to natural gas or propane (Northern Economics 2012). The ARC would make that
determination at such time as FNG applies to purchase and distribute the natural gas delivered
by the proposed Project’s Fairbanks Lateral. Likewise, the ARC will determine whether the
utility grade natural gas from the proposed Project lateral can be substituted for diesel, coal,
LNG, and/or wind. For the purposes of this analysis it is assumed the proposed Project could
deliver utility grade natural gas at a unit price that is competitive with existing home heating,
electrical generation, and the operation of the Flint Hills Refinery. There should be an overall
economic benefit to the existing FNG customers and the users of electricity residing in the
Fairbanks, Delta Junction, Nenana, Healy, and Cantwell areas. There also is a potential for the
substitution of natural gas for diesel fueled electrical plants at the military bases in Fairbanks
(Fort Wainwright), North Pole (Eielson Airforce Base), and Delta Junction (Fort Greely) areas.
In addition to the actual cost of the natural gas delivered to the Fairbanks area, there are other
direct costs that future users would have for connecting to an existing or expanded pipeline or
other natural gas transportation system and additional costs for converting existing heating
systems using wood or fuel oil. It is expected there would also be positive long term cumulative
economic impact to home owners, local businesses, and military bases to the extent natural gas
supplied to FNG and GVEA will produce heat and electricity at or below the present cost of
energy for heating and electricity production. The proposed Project would not be expected to
have an adverse cumulative impact on the economic viability of the proposed Eva Creek Wind
farm.
Environmental Justice
Although the proposed Project would traverse minority and low-income areas, it is expected to
have a beneficial effect on the minority populations that exist within the proposed Project area.
The proposed Project would provide permanent and temporary employment opportunities, as
well as offer positive effects to public tax revenues and personal incomes for the affected
populations. Furthermore, as discussed in Section 5.12.3.3, the creation of an Economic
Opportunity Plan would mitigate for potential permanent adverse effects resulting from the
proposed Project.
It is not expected that any future project will be constructed in these low-income or minority
population areas at the same time as the proposed Project. However, in the event that another
Alaska Stand Alone Gas Pipeline 5.20-64 Final EIS
project is initiated while the proposed Project is in construction phase, there may be the
potential for minor to moderate temporary adverse effects. Potential temporary effects include
dust, noise, and increased traffic.
Cultural and Historic Resources
The anticipated cumulative effects of the proposed Project in combination with the existing and
reasonably foreseeable projects on cultural resources would primarily be related to soil
disturbance from construction of the proposed Project and other future projects. The effects of
other projects would be similar to those of the proposed Project in that additional soil
disturbance could cause adverse effects to known and undiscovered historic properties. As with
the proposed Project, other large-scale projects would likely have a level of state and federal
government involvement that requires compliance with Section 106 of the NHPA. The lead
federal agencies for those projects have been or would be required to consult with the SHPO,
Indian tribes, and other applicable consulting parties; identify and evaluate cultural resources;
and avoid, minimize, or mitigate any effects upon historic properties. For any non-federal
actions in the ROI, project proponents would be required to comply with any identification and
evaluation procedures and mitigation measures required by the state. Such regulations could
address inadvertent discoveries of cultural resources, the disposition of discovered human
remains, and other resource protection laws.
The AGDC and the USACE would undergo appropriate Section 106 consultation for the
proposed Project and the AGDC would mitigate possible effects on potentially eligible cultural
and historic properties through avoidance wherever possible. Because of collocation with
existing disturbed ROWs for substantial distances along the proposed Project ROW and
avoidance of potentially eligible properties wherever possible, the incremental effect of the
proposed Project to cultural resources in the ROI would be expected to be small since the
responsible state and federal agencies working with the applicant would require adjustment in
the location of the activity that could adversely affect a historical or historic resource or other
appropriate measure to minimize or eliminate potential negative effects.
When the proposed Project is in close proximity to TAPS, Dalton, Elliott, and Parks Highways
and ARR there is an existing data base of known cultural resources that may be relevant to the
final location and design of the proposed Project. As a general rule, an applicant would be
required to conduct an on-the-ground inventory to minimize the inadvertent negative effect on
undiscovered cultural or historic resources. Should an undiscovered cultural or historic
resource be found during construction of any project, federal, state and local permits approving
a construction activity typically include provisions that require work to be suspended and the
appropriate officials notified. Construction work would be restarted only after a method to
protect the new resource or salvage the resource is approved.
The reasonably foreseeable action of expanding the FNG service area in Fairbanks would be in
a developed area where cultural and historic resources tend to be well known. No negative
cumulative effects in the Fairbanks area would be expected.

Alaska Stand Alone Gas Pipeline 5.20-65 Final EIS
The Connection Action of developing conceptual facilities at Nikiski would be in an area where
there is substantial industrial development. Conversely, the 80 mile-long pipeline connecting
the NGLEP at MP 39 of the Beluga Pipeline to Nikiski would cross areas with only limited
development. The extent of cultural and historic resources associated with the Nikiski
Connected Action are unknown at this time but would need to be determined prior to
construction as part of a Section 106 consultation process.
Subsistence Resources
Access to and use of subsistence resources (i.e., hunting, fishing, foraging, trapping, whaling,
sealing, traveling) occurring within the general area of the proposed Project would have short-
term negative effects during construction due to limitations to access across active construction
areas, and deflection of a wildlife species due to construction activity. Other reasonably
foreseeable projects in conjunction with the proposed Project within subsistence areas would
result in cumulative temporary and permanent disruption of subsistence activities and the
potential decrease in available harvest associated with temporary disturbance to wildlife,
fisheries, and their habitat. Future small scale projects, due to their small footprint and temporal
scale, when considered with the proposed Project could have a minor negative cumulative
effect on subsistence resources. If occurring during the same time frame, future large-scale
projects, such as other oil and gas transportation projects, would have a more pronounced
cumulative effect on subsistence users due to the cumulative influx of revenue into the
economy, increases in traffic, disturbance to fish and wildlife habitats and harvest, and
traditional uses of the lands in which these projects would be located. The largest negative
impact to subsistence users would be from increased competition for the same resource by non-
local users that gain additional access to sport hunt and fish in the same areas as the
subsistence user. Limiting access to the pipeline corridor and the access roads will limit the
number of people who may be able to enter into areas where competition for subsistence
resources could be a concern. The proposed roads to Umiat, Ambler and Tanana all have the
potential to open up additional areas for both sport hunters as well as subsistence users. The
proposed Susitna-Watana Dam will also require an access road, however that road will have
limited public access. Additional impacts to migration patterns may be an initial result of
construction of these roads. However, overall, a negligible long-term cumulative impact to
access to or use of subsistence resources would be expected from the proposed Project in
combination with other reasonably foreseeable energy projects.
The TAPS Right-of-Way Renewal EIS (BLM 2002) evaluated the cumulative effects of
continued operation and maintenance of TAPS for an additional 30 years. The cumulative
effects evaluation considered a large diameter gas pipeline would be constructed within or near
the general alignment of the ANGTS or TAGS federal and state right-of-ways and continued
traffic on the Dalton and Elliott Highways that are applicable to the proposed Project. The BLM
concluded the cumulative effects to subsistence ―...would be low...except on the North Slope
where impacts would be moderate.‖ The BLM also found the cumulative impacts to subsistence
fishing and hunting would be negatively impacted to the extent TAPS and the large diameter
gas pipeline system resulted in restriction to the access to subsistence resources with some
possible disruptions to wildlife movements, but that neither effect would be ―severe.‖
Alaska Stand Alone Gas Pipeline 5.20-66 Final EIS
(BLM 2002). For the purposes of this cumulative effects analysis on access to and use of
subsistence resources associated with the proposed Project, a large diameter gas pipeline, and
highways/ARR would be similar to the more recent TAPS Renewal FEIS which incorporated a
longer span of subsistence data about the actual effects of TAPS to subsistence uses in Alaska.
The reasonably foreseeable action of extending the FNG service area in Fairbanks would likely
be done with existing contractors in the Fairbanks area and would not have a cumulative effect
for access to or use of subsistence resources associated with the proposed Project.
The Connected Action for constructing NGL facilities at Nikiski would increase any negative
effect for access to and use of subsistence resources by residents of Tyonek. The extent of
likely adverse direct, indirect, and cumulative effects on access to and use of subsistence
resources due to construction of the 80 mile-long pipeline system and facilities at Nikiski are
unknown at this time.
Public Health
Measured against all the cumulative health effects from state and federal programs, other oil
and gas activities, and other industrial developments, the incremental impacts of the proposed
Project on public health would not likely be large. Put another way, whether or not the proposed
Project goes forward would not materially negatively affect the cumulative impacts of all other
state, federal, and industrial developments.
Further, residents of the Fairbanks area would benefit in health terms as a result of improved air
quality resulting from the proposed Project and a Fairbanks gas distribution system. An
available and reliable source of natural gas would provide for a reduction in the reliance on
wood, fuel oil and other energy sources that have greater adverse effect on air quality than
natural gas. These benefits were described in the Summary of Public Health effects for the
proposed Project, and are described in detail in Section 5.15, Public Health.
Air Quality, Greenhouse Gases, and Global Climate Change
Air Quality
The proposed Project would generally meet air quality standards during construction (see
Section 5.16, Air Quality, for detailed discussions). The major exception to meeting air quality
standards could be for construction related activities in the Fairbanks North Star Borough
nonattainment area. The applicant would need to provide site specific data on the emissions
associated with pipe storage areas, construction camps, material sites, and the pipe coating-
pipe jointing operation as well as construction equipment for the nonattainment area of the
Fairbanks Lateral to assure these actions have strict controls for PM-2.5 and for precursors that
could form SO2, NOx, VOCs and ammonia. Also construction camps would require minor
permits for NOx (Table 5.16-6).
Preliminary calculations for operations of the proposed ASAP Project indicate Title V operating
permits would be required for the GCF, compressor stations, straddle/take-off facility and

Alaska Stand Alone Gas Pipeline 5.20-67 Final EIS
NGLEP. Operations at the GCF would trigger a PSD for NOx, CO, VOCs, PM-10, PM-2.5 and
GHG emissions (Table 5.16-9). Also of concern would be the extent of hazardous air pollutants
(HAPs). The two compressor stations and straddle/take-off facility each would require a PSD
permit for NOx (Tables 5.16-11 and 5.16-13, respectively). The NGLEP would require a PSD
permit for NOx, CO, PM-2.5 and GHGs (Table 5.16-15).
The cumulative effect on air quality due to operation of the GCF, compressor stations,
straddle/take-off facility and NGLEP for the proposed Project, in combination with existing air
quality emissions, involves site specific data that would be developed during the PSD and Title
V operating permit processes. The GCF would be located in a heavily industrialized area of
Prudhoe Bay that could have a new gas treatment plant for the APP as well as a small LNG
plant for FNG, GVEA and the Flint Hills Refinery. There may be potential interactions between
the emissions from proposed Project compressor stations and compressor stations for the APP,
depending on proximity of the APP stations to proposed Project stations. Emissions from the
straddle/take-off facility would not interact with other existing or reasonably foreseen projects.
Emissions from new proposed Project construction located within the Fairbanks North Star
Borough Nonattainment area would be strictly regulated.
The most important cumulative issues for proposed Project operations are air quality and
compatibility of new facilities with each other and with existing facilities needed for the continued
operation of the North Slope operations required to process oil for TAPS and to maintain field
pressures for the long-term operation of the production of oil and gas. Table 5.16-4 describes
the regional background ambient air quality in the proposed Project area, Tables 5.16-8 and -9
list the equipment and emissions for both construction and operation of the proposed Project’s
GCF. The analysis of these air quality emissions from the GCF under ADEC permit
requirements concluded that the facility would not cause or contribute to a violation of any
federal, state, or local air quality standards. Because of the expected general size and
horsepower of a new LNG facility and associated facilities in the same general area, no
appreciable adverse cumulative air quality emissions are expected as long as air quality
standards are met. Any modification of the existing Prudhoe Bay CGF to accommodate the
production of natural gas to meet the requirements for the APP system are subject to detailed
permitting. Neither the proposed Project nor the new LNG facilities on the North Slope are
expected to have an adverse impact on the ability of the APP to meet required air quality
standards. Point Thomson is not expected to require additional facilities or development in the
Prudhoe Bay area. As such, there would be no cumulative air quality impacts associated with
that project.
The reasonably foreseeable action of providing utility grade natural gas to FNG, GVEA, and
Flint Hills Refinery could have positive cumulative effect on eliminating the existing Fairbanks
North Star Borough nonattainment area. Recent analysis by Northern Economics (2012)
indicates that converting the bulk of Fairbanks structures from wood and fuel oil to natural gas
or propane for heat generation has the potential to reduce PM-2.5 emissions from
approximately 2,200 tons per year to less than 200 tons per year, thereby bringing Fairbanks
into attainment with the EPA PM-2.5 air quality standard. The extent of this beneficial effect to
air quality would be dependent upon the extent existing sources of air emissions would be

Alaska Stand Alone Gas Pipeline 5.20-68 Final EIS
converted from wood, fuel oil, or coal to natural gas. Increasing the amount of natural gas used
in the Fairbanks nonattainment area would depend on the unit cost of natural gas and costs to
convert or upgrade existing equipment to use natural gas. The air quality would be improved to
the extent utility grade natural gas is substituted for emissions produced by coal, diesel, heating
oil, and wood in homes and businesses and for electrical GVEA owned and military base
generating facilities. There would be long-term positive improvement of air quality to the extent
natural gas is substituted for wood or fuel oil as a source of heating. Likewise, the air quality
would be further improved to the extent GVEA electrical generation and the Flint Hills Refinery
could be economically converted from naphtha, diesel and coal to natural gas.
The Connected Action of operating a conceptual fractionating facility, tank farm and marine
terminal at Nikiski would have cumulative effect on air quality. The extent and components of
the cumulative air emissions would depend primarily on the site specific equipment and
emission controls at the fractionation facility.
Greenhouse Gases and Climate Change
Perspectives on Air Emissions, GHGs and Increased Use of Natural Gas
The effects of GHG emissions and global warming are a legitimate concern relative to the arctic
environment. The effects of global warming are particularly likely to be felt in localized areas,
including Alaska. Although the effects of global warming may be localized, the causes relate to
the worldwide emissions of GHGs. A major source of GHGs is the combustion of fossil fuels for
electricity generation and home heating.
Because natural gas combustion results in GHG emissions it is reasonable to examine all
natural gas proposals critically. However, it is important to place these emissions in perspective
relative to those of alternatives. Not all fuels are equivalent in terms of total emissions. On a
pound of emissions per BTU basis, natural gas has substantially lower emissions of carbon
dioxide, nitrogen oxides, sulfur dioxide, particulates and mercury than for oil or coal.20
The
same is also true when comparing natural gas for wood.
Global warming, or the 'greenhouse effect' is an environmental issue that deals with the
potential for global climate change due to increased levels of atmospheric 'GHGs'. There are
several gases in the atmosphere that serve to regulate the amount of heat that is kept close to
the earth's surface. According to the Natural Gas Supply Association:21
One of the principal greenhouse gases is carbon dioxide. Although carbon dioxide does
not trap heat as effectively as other greenhouse gases (making it a less potent
greenhouse gas), the sheer volume of carbon dioxide emissions into the atmosphere is
very high, particularly from the burning of fossil fuels. In fact, according to the Energy
Information Administration in its December 2009 report 'Emissions of Greenhouse
Gases’ in the United States, 81.3 percent of greenhouse gas emissions in the United
States in 2008 came from energy-related carbon dioxide.
20
See EIA data quoted in http://www.naturalgas.org/environment/naturalgas.asp. 21
See http://www.naturalgas.org/environment/naturalgas.asp.
Alaska Stand Alone Gas Pipeline 5.20-69 Final EIS
Because carbon dioxide makes up such a high proportion of U.S. GHG emissions, reducing
carbon dioxide emissions can play a pivotal role in combating the greenhouse effect and global
warming. The combustion of natural gas emits almost 30 percent less carbon dioxide than oil,
and just under 45 percent less carbon dioxide than coal.
Certainly, at the margin, the GHG emissions produced by use of ASAP gas are de minimis
relative to the total US GHG emissions. Some of the natural gas produced by ASAP will be
used within Alaska where natural gas will displace use of oil, coal, and wood for home heating.
As discussed in the section on health impacts in the EIS this is likely to lead to a net benefit.
PM-2.5 emissions will be reduced in Fairbanks in direct proportion to the use of oil, coal, or
wood.
It is possible that some of the gas produced by ASAP will be exported. If so, some of this gas
will displace other sources of natural gas for various purposes, which include use in power
plants to generate electricity and some of the gas will be used to displace other fossil fuels for
home heating. As in Alaska the home heating uses are likely to result in net benefits from
reduction of PM-2.5 emissions.
Production, transmission, and distribution of natural gas may also emit methane, a gas with
higher GHG potential than carbon dioxide and some have asked whether methane emissions
from natural gas might (on a GHG equivalent basis) outweigh the reduced carbon dioxide
emissions. Some authors have claimed that, when methane emissions are included, the GHG
emission advantage for natural gas is nullified.22 But recent studies (at Carnegie Mellon
University23, WorldWatch Institute and Deutsche Bank Climate Change Advisors,24 MIT,25 and
Cornell University26), however, refute this contention. Regarding the substitution of natural gas
for coal in electricity generation: ―Despite a substantial increase in the methane assumed to be
emitted during natural gas production, we found that U.S. natural gas-fired electricity generation
still released 47 percent fewer GHGs than coal from source to use‖ said Saya Kitasei, a
Worldwatch Institute Sustainable Energy Fellow and one of the contributing writers of the
Worldwatch report.27
The natural gas produced from ASAP will be used for several purposes. One major benefit of
the ASAP natural gas will be reduced emissions of various pollutants (e.g., particulates) in the
Fairbanks area and related favorable effects on public health. But along with reduced
particulate emissions, there will be reduced GHG emissions as well. So, to the extent that
ASAP natural gas substitutes for other energy sources (e.g., oil, coal, or wood) there will be a
net reduction of GHG emissions. Even if it is argued that some of the ASAP natural gas is used
22
See http://www.sustainablefuture.cornell.edu/news/attachments/Howarth-EtAl-2011.pdf. 23
See http://iopscience.iop.org/1748-9326/6/3/034014/pdf/1748-9326_6_3_034014.pdf. 24
See http://www.worldwatch.org/despite-methane-emissions-upstream-natural-gas-cleaner-coal-life-cycle-basis. 25
See http://web.mit.edu/mitei/research/studies/documents/natural-gas-2011/NaturalGas_ExecutiveSummary.pdf. 26
See http://www.geo.cornell.edu/eas/PeoplePlaces/Faculty/cathles/Natural%20Gas/Cathles-%20Assessing%20GH%20Impact%20Natural%20Gas.pdf. See also http://energy.wilkes.edu/pages/216.asp and http://www.agu.org/pubs/crossref/pip/2012GC004032.shtml.
27 See http://www.worldwatch.org/despite-methane-emissions-upstream-natural-gas-cleaner-coal-life-cycle-basis.
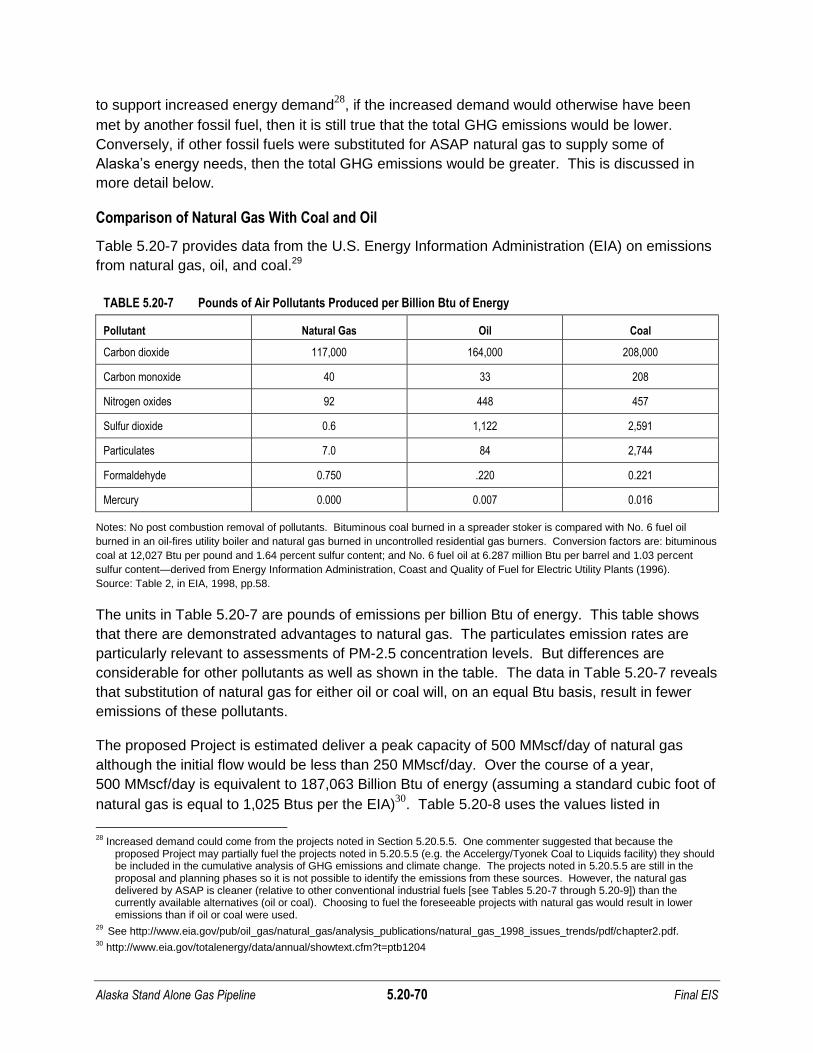
Alaska Stand Alone Gas Pipeline 5.20-70 Final EIS
to support increased energy demand28
, if the increased demand would otherwise have been
met by another fossil fuel, then it is still true that the total GHG emissions would be lower.
Conversely, if other fossil fuels were substituted for ASAP natural gas to supply some of
Alaska’s energy needs, then the total GHG emissions would be greater. This is discussed in
more detail below.
Comparison of Natural Gas With Coal and Oil
Table 5.20-7 provides data from the U.S. Energy Information Administration (EIA) on emissions
from natural gas, oil, and coal.29
TABLE 5.20-7 Pounds of Air Pollutants Produced per Billion Btu of Energy
Pollutant Natural Gas Oil Coal
Carbon dioxide 117,000 164,000 208,000
Carbon monoxide 40 33 208
Nitrogen oxides 92 448 457
Sulfur dioxide 0.6 1,122 2,591
Particulates 7.0 84 2,744
Formaldehyde 0.750 .220 0.221
Mercury 0.000 0.007 0.016
Notes: No post combustion removal of pollutants. Bituminous coal burned in a spreader stoker is compared with No. 6 fuel oil
burned in an oil-fires utility boiler and natural gas burned in uncontrolled residential gas burners. Conversion factors are: bituminous
coal at 12,027 Btu per pound and 1.64 percent sulfur content; and No. 6 fuel oil at 6.287 million Btu per barrel and 1.03 percent
sulfur content—derived from Energy Information Administration, Coast and Quality of Fuel for Electric Utility Plants (1996).
Source: Table 2, in EIA, 1998, pp.58.
The units in Table 5.20-7 are pounds of emissions per billion Btu of energy. This table shows
that there are demonstrated advantages to natural gas. The particulates emission rates are
particularly relevant to assessments of PM-2.5 concentration levels. But differences are
considerable for other pollutants as well as shown in the table. The data in Table 5.20-7 reveals
that substitution of natural gas for either oil or coal will, on an equal Btu basis, result in fewer
emissions of these pollutants.
The proposed Project is estimated deliver a peak capacity of 500 MMscf/day of natural gas
although the initial flow would be less than 250 MMscf/day. Over the course of a year,
500 MMscf/day is equivalent to 187,063 Billion Btu of energy (assuming a standard cubic foot of
natural gas is equal to 1,025 Btus per the EIA)30
. Table 5.20-8 uses the values listed in
28
Increased demand could come from the projects noted in Section 5.20.5.5. One commenter suggested that because the proposed Project may partially fuel the projects noted in 5.20.5.5 (e.g. the Accelergy/Tyonek Coal to Liquids facility) they should be included in the cumulative analysis of GHG emissions and climate change. The projects noted in 5.20.5.5 are still in the proposal and planning phases so it is not possible to identify the emissions from these sources. However, the natural gas delivered by ASAP is cleaner (relative to other conventional industrial fuels [see Tables 5.20-7 through 5.20-9]) than the currently available alternatives (oil or coal). Choosing to fuel the foreseeable projects with natural gas would result in lower emissions than if oil or coal were used.
29 See http://www.eia.gov/pub/oil_gas/natural_gas/analysis_publications/natural_gas_1998_issues_trends/pdf/chapter2.pdf.
30 http://www.eia.gov/totalenergy/data/annual/showtext.cfm?t=ptb1204

Alaska Stand Alone Gas Pipeline 5.20-71 Final EIS
Table 5.20-7 to compare the pounds of pollutants generated with consuming 187,063 billion
Btus of energy over the course of a year by burning natural gas, oil and coal. When compared
to natural gas, burning oil for electricity generates approximately 1.4 times the amount of GHG
emissions while burning coal generates approximately 1.8 times time more GHG emissions.
This simple analysis does not take into account carbon dioxide equivalents or the relative
importance of each GHG.
Based on calculations available from the EIA, consumption of the predicted amount of natural
gas (500 MMscfd) in Alaska will generate 9.4 million metric tons of carbon dioxide equivalent
each year31
. To put this in perspective the annual amount of GHGs generated in the U.S. in
2009 was approximately 5,500 million metric of carbon dioxide equivalent32,33
. As noted above,
the ASAP natural gas would be used as a substitute for burning oil, coal, and wood in the
Fairbanks area. and because combustion of natural gas emits fewer greenhouse gases than the
other fuels (Table 5.20-8), the use of ASAP gas would represent an overall reduction in U.S.
greenhouse gas emissions. Table 5.20-9 provides emission factors for greenhouse gases for a
variety of fuel sources, including natural gas, oil, coal, and wood as well as renewable
resources. With the exception of biogas fuel, natural gas has the lowest emissions factors for
the greenhouse gases listed.
TABLE 5.20-8 Millions of Pounds of Air Pollutants Produced During the Consumption of One Years’ Worth of
ASAP Throughput at Peak Capacity (187,063 billion Btu)
Pollutant
Natural gas
(MMlbs)
Oil
(MMlbs)
Coal
(MMlbs)
Carbon dioxide 21,886 30,678 38,909
Carbon monoxide 7.5 6.2 38.9
Nitrogen oxides 17.2 83.8 85.5
Sulfur dioxide 0.1 209.9 484.7
Particulates 1.3 15.7 513.3
Formaldehyde 0.14 0.04 0.04
Mercury 0.000 0.001 0.003
Total 21,913 30,994 40,031
Notes: Millions of pounds of pollutants calculated by multiplying the pounds of pollutant produced per Billion Btu shown in Table
5.20-7 by the annual amount of energy associated with operating the ASAP pipeline at peak capacity for a year (187,063 billion
Btu).
31
See calculator at http://www.epa.gov/cleanenergy/energy-resources/calculator.html. 32
See http://www.eia.gov/totalenergy/data/annual/pdf/aer.pdf. 33
See http://www.eia.gov/oiaf/1605/ggccebro/chapter1.html.
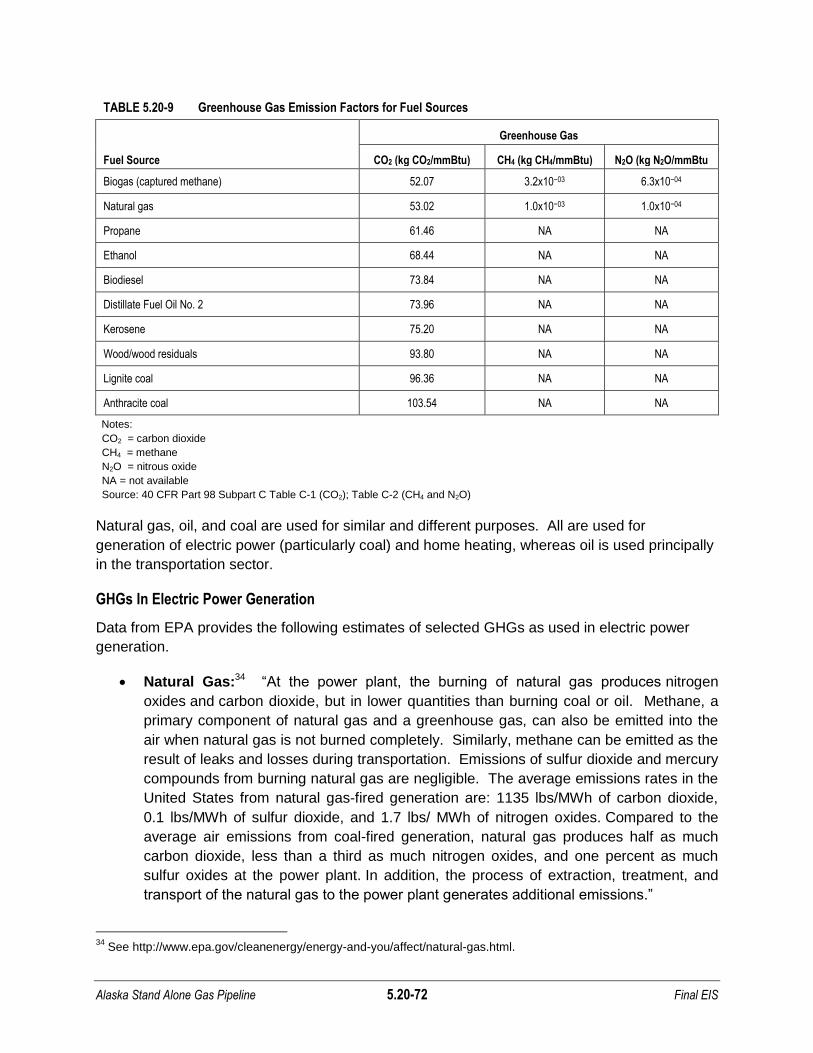
Alaska Stand Alone Gas Pipeline 5.20-72 Final EIS
TABLE 5.20-9 Greenhouse Gas Emission Factors for Fuel Sources
Fuel Source
Greenhouse Gas
CO2 (kg CO2/mmBtu) CH4 (kg CH4/mmBtu) N2O (kg N2O/mmBtu
Biogas (captured methane) 52.07 3.2x10−03 6.3x10−04
Natural gas 53.02 1.0x10−03 1.0x10−04
Propane 61.46 NA NA
Ethanol 68.44 NA NA
Biodiesel 73.84 NA NA
Distillate Fuel Oil No. 2 73.96 NA NA
Kerosene 75.20 NA NA
Wood/wood residuals 93.80 NA NA
Lignite coal 96.36 NA NA
Anthracite coal 103.54 NA NA
Notes:
CO2 = carbon dioxide
CH4 = methane
N2O = nitrous oxide
NA = not available
Source: 40 CFR Part 98 Subpart C Table C-1 (CO2); Table C-2 (CH4 and N2O)
Natural gas, oil, and coal are used for similar and different purposes. All are used for
generation of electric power (particularly coal) and home heating, whereas oil is used principally
in the transportation sector.
GHGs In Electric Power Generation
Data from EPA provides the following estimates of selected GHGs as used in electric power
generation.
Natural Gas:34 ―At the power plant, the burning of natural gas produces nitrogen
oxides and carbon dioxide, but in lower quantities than burning coal or oil. Methane, a
primary component of natural gas and a greenhouse gas, can also be emitted into the
air when natural gas is not burned completely. Similarly, methane can be emitted as the
result of leaks and losses during transportation. Emissions of sulfur dioxide and mercury
compounds from burning natural gas are negligible. The average emissions rates in the
United States from natural gas-fired generation are: 1135 lbs/MWh of carbon dioxide,
0.1 lbs/MWh of sulfur dioxide, and 1.7 lbs/ MWh of nitrogen oxides. Compared to the
average air emissions from coal-fired generation, natural gas produces half as much
carbon dioxide, less than a third as much nitrogen oxides, and one percent as much
sulfur oxides at the power plant. In addition, the process of extraction, treatment, and
transport of the natural gas to the power plant generates additional emissions.‖
34
See http://www.epa.gov/cleanenergy/energy-and-you/affect/natural-gas.html.

Alaska Stand Alone Gas Pipeline 5.20-73 Final EIS
Oil:35 ―Burning oil at power plants produces nitrogen oxides, sulfur dioxide, carbon
dioxide, methane, and mercury compounds. The amount of sulfur dioxide and mercury
compounds can vary greatly depending on the sulfur and mercury content of the oil that
is burned. The average emissions rates in the United States from oil-fired generation
are: 1672 lbs/MWh of carbon dioxide, 12 lbs/MWh of sulfur dioxide, and 4 lbs/MWh of
nitrogen oxides. In addition, oil wells and oil collection equipment are a source of
emissions of methane, a potent greenhouse gas. The large engines that are used in the
oil drilling, production, and transportation processes burn natural gas or diesel that also
produce emissions.‖
Coal:36 ―When coal is burned, carbon dioxide, sulfur dioxide, nitrogen oxides,
and mercury compounds are released. For that reason, coal-fired boilers are required to
have control devices to reduce the amount of emissions that are released. The average
emission rates in the United States from coal-fired generation are: 2,249 lbs/MWh of
carbon dioxide, 13 lbs/MWh of sulfur dioxide, and 6 lbs/MWh of nitrogen oxides. Mining,
cleaning, and transporting coal to the power plant generate additional emissions. For
example, methane, a potent greenhouse gas that is trapped in the coal, is often vented
during these processes to increase safety.‖
Life Cycle Analysis of GHGs
More complex analyses of global warming include all GHGs,37 recognize that different GHGs
have a different contribution to global warming, and include a life cycle analysis (i.e.,
considering emissions of GHGs at all stages of the production and use cycle) for various fuels.
The Global Warming Potential (GWP) of a gas is defined as the cumulative radioactive forcing
effects of a gas over a specified time horizon resulting from the emission of a unit mass of gas
relative to a reference gas. The GWP-weighted emissions of direct GHGs in the U.S. Inventory
are typically presented in terms of equivalent emissions of carbon dioxide (CO2).
Life cycle analyses using CO2 equivalents do not substantially alter the conclusions that would
be reached based on the above emissions factors. For example:
Jaramillo, Griffen and Matthews, (2007) conducted a life cycle analysis of coal,
domestic natural gas, liquefied natural gas (LNG), and synthetic natural gas (SNG)38
for electric power generation. They concluded that a mix of natural gas, LNG, and
SNG would have lower GHG emissions than coal.
A recent study by investigators at the Worldwatch Institute re-estimated GHG
emissions in comparing natural gas and coal based on revised estimates by EPA on
estimating methane gas emissions from natural gas systems.39 They concluded:
35
See http://www.epa.gov/cleanenergy/energy-and-you/affect/oil.html. 36
See http://www.epa.gov/cleanenergy/energy-and-you/affect/coal.html. 37
GHG - any gas that absorbs infrared radiation in the atmosphere. GHGs include, but are not limited to, water vapor, carbon dioxide (CO2), methane (CH4), nitrous oxide (N2O), chlorofluorocarbons (CFCs), hydrochlorofluorocarbons (HCFCs), ozone (O3), hydrofluorocarbons (HFCs), perfluorocarbons (PFCs), and sulfur hexafluoride (SF6).
38 From coal gasification-methanation.
39 See http://www.worldwatch.org/system/files/pdf/Natural_Gas_LCA_Update_082511.pdf.
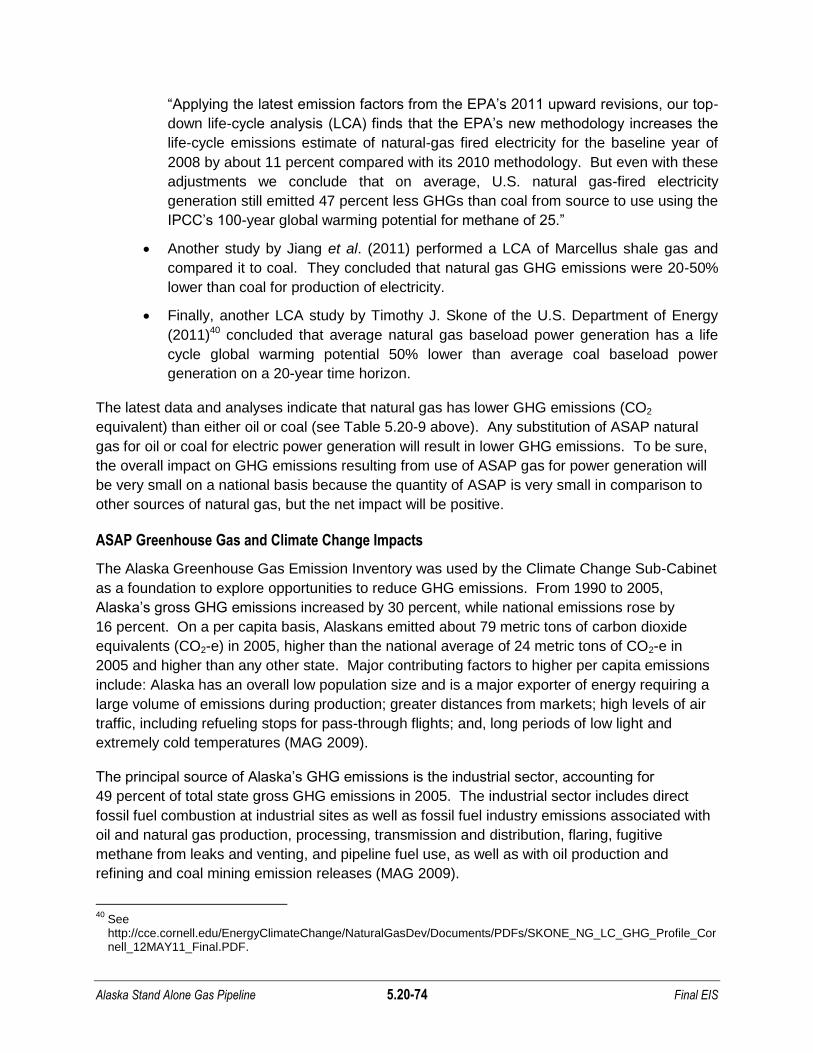
Alaska Stand Alone Gas Pipeline 5.20-74 Final EIS
―Applying the latest emission factors from the EPA’s 2011 upward revisions, our top-
down life-cycle analysis (LCA) finds that the EPA’s new methodology increases the
life-cycle emissions estimate of natural-gas fired electricity for the baseline year of
2008 by about 11 percent compared with its 2010 methodology. But even with these
adjustments we conclude that on average, U.S. natural gas-fired electricity
generation still emitted 47 percent less GHGs than coal from source to use using the
IPCC’s 100-year global warming potential for methane of 25.‖
Another study by Jiang et al. (2011) performed a LCA of Marcellus shale gas and
compared it to coal. They concluded that natural gas GHG emissions were 20-50%
lower than coal for production of electricity.
Finally, another LCA study by Timothy J. Skone of the U.S. Department of Energy
(2011)40 concluded that average natural gas baseload power generation has a life
cycle global warming potential 50% lower than average coal baseload power
generation on a 20-year time horizon.
The latest data and analyses indicate that natural gas has lower GHG emissions (CO2
equivalent) than either oil or coal (see Table 5.20-9 above). Any substitution of ASAP natural
gas for oil or coal for electric power generation will result in lower GHG emissions. To be sure,
the overall impact on GHG emissions resulting from use of ASAP gas for power generation will
be very small on a national basis because the quantity of ASAP is very small in comparison to
other sources of natural gas, but the net impact will be positive.
ASAP Greenhouse Gas and Climate Change Impacts
The Alaska Greenhouse Gas Emission Inventory was used by the Climate Change Sub-Cabinet
as a foundation to explore opportunities to reduce GHG emissions. From 1990 to 2005,
Alaska’s gross GHG emissions increased by 30 percent, while national emissions rose by
16 percent. On a per capita basis, Alaskans emitted about 79 metric tons of carbon dioxide
equivalents (CO2-e) in 2005, higher than the national average of 24 metric tons of CO2-e in
2005 and higher than any other state. Major contributing factors to higher per capita emissions
include: Alaska has an overall low population size and is a major exporter of energy requiring a
large volume of emissions during production; greater distances from markets; high levels of air
traffic, including refueling stops for pass-through flights; and, long periods of low light and
extremely cold temperatures (MAG 2009).
The principal source of Alaska’s GHG emissions is the industrial sector, accounting for
49 percent of total state gross GHG emissions in 2005. The industrial sector includes direct
fossil fuel combustion at industrial sites as well as fossil fuel industry emissions associated with
oil and natural gas production, processing, transmission and distribution, flaring, fugitive
methane from leaks and venting, and pipeline fuel use, as well as with oil production and
refining and coal mining emission releases (MAG 2009).
40
See http://cce.cornell.edu/EnergyClimateChange/NaturalGasDev/Documents/PDFs/SKONE_NG_LC_GHG_Profile_Cornell_12MAY11_Final.PDF.
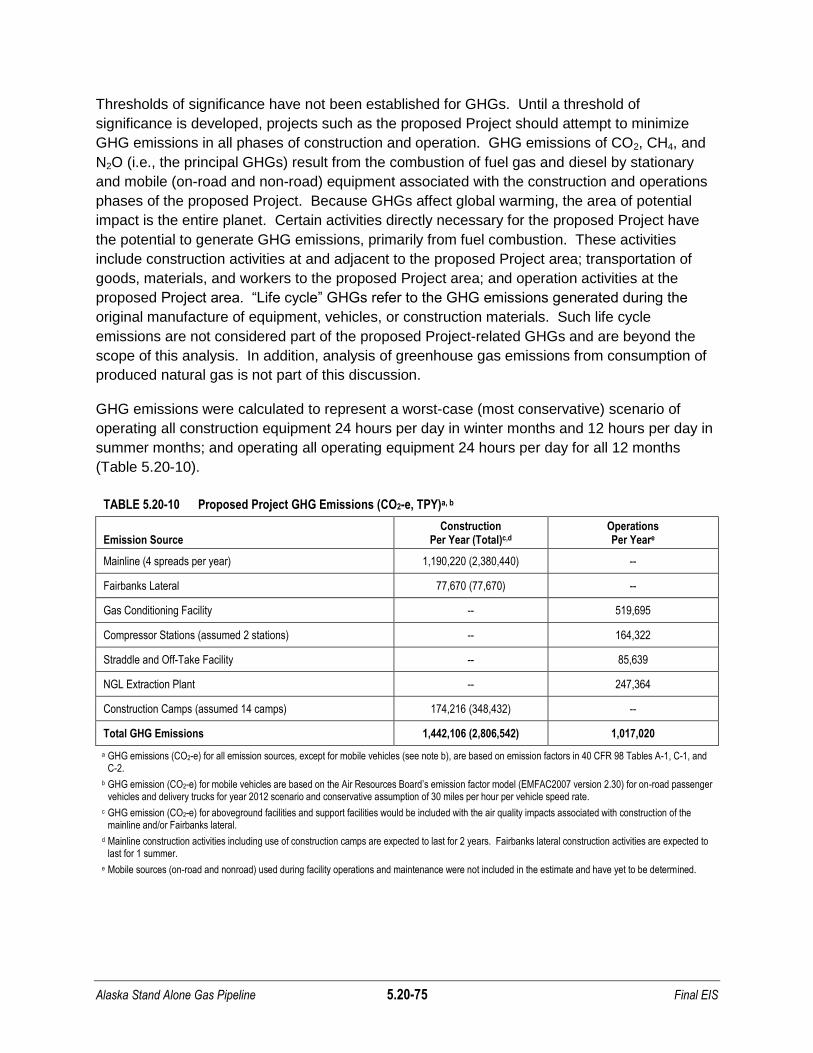
Alaska Stand Alone Gas Pipeline 5.20-75 Final EIS
Thresholds of significance have not been established for GHGs. Until a threshold of
significance is developed, projects such as the proposed Project should attempt to minimize
GHG emissions in all phases of construction and operation. GHG emissions of CO2, CH4, and
N2O (i.e., the principal GHGs) result from the combustion of fuel gas and diesel by stationary
and mobile (on-road and non-road) equipment associated with the construction and operations
phases of the proposed Project. Because GHGs affect global warming, the area of potential
impact is the entire planet. Certain activities directly necessary for the proposed Project have
the potential to generate GHG emissions, primarily from fuel combustion. These activities
include construction activities at and adjacent to the proposed Project area; transportation of
goods, materials, and workers to the proposed Project area; and operation activities at the
proposed Project area. ―Life cycle‖ GHGs refer to the GHG emissions generated during the
original manufacture of equipment, vehicles, or construction materials. Such life cycle
emissions are not considered part of the proposed Project-related GHGs and are beyond the
scope of this analysis. In addition, analysis of greenhouse gas emissions from consumption of
produced natural gas is not part of this discussion.
GHG emissions were calculated to represent a worst-case (most conservative) scenario of
operating all construction equipment 24 hours per day in winter months and 12 hours per day in
summer months; and operating all operating equipment 24 hours per day for all 12 months
(Table 5.20-10).
TABLE 5.20-10 Proposed Project GHG Emissions (CO2-e, TPY)a, b
Emission Source Construction
Per Year (Total)c,d Operations Per Yeare
Mainline (4 spreads per year) 1,190,220 (2,380,440) --
Fairbanks Lateral 77,670 (77,670) --
Gas Conditioning Facility -- 519,695
Compressor Stations (assumed 2 stations) -- 164,322
Straddle and Off-Take Facility -- 85,639
NGL Extraction Plant -- 247,364
Construction Camps (assumed 14 camps) 174,216 (348,432) --
Total GHG Emissions 1,442,106 (2,806,542) 1,017,020
a GHG emissions (CO2-e) for all emission sources, except for mobile vehicles (see note b), are based on emission factors in 40 CFR 98 Tables A-1, C-1, and C-2.
b GHG emission (CO2-e) for mobile vehicles are based on the Air Resources Board’s emission factor model (EMFAC2007 version 2.30) for on-road passenger vehicles and delivery trucks for year 2012 scenario and conservative assumption of 30 miles per hour per vehicle speed rate.
c GHG emission (CO2-e) for aboveground facilities and support facilities would be included with the air quality impacts associated with construction of the mainline and/or Fairbanks lateral.
d Mainline construction activities including use of construction camps are expected to last for 2 years. Fairbanks lateral construction activities are expected to last for 1 summer.
e Mobile sources (on-road and nonroad) used during facility operations and maintenance were not included in the estimate and have yet to be determined.

Alaska Stand Alone Gas Pipeline 5.20-76 Final EIS
Preliminary results indicate that approximately 1.4 million metric tons per year (TPY) of CO2-e
would be emitted annually during construction, and 1.0 million metric TPY of CO2-e would be
emitted annually during operations. Consequently, the GHG emissions associated with the
proposed Project would be greater than the CEQ threshold of 25,000 metric TPY of CO2-e that
is suggested as a ―useful, presumptive, threshold for discussion and disclosure‖ under the
NEPA.
Compared to the U.S. and Alaska emissions of CO2-e for all fossil fuel combustion (see
Table 5.16-2), annual construction emissions would comprise about 0.023 and 2.3 percent of
the U.S. and Alaska inventories, respectively. These emissions would be temporary and would
permanently cease upon proposed Project completion of construction. During operation of the
completed facilities, annual CO2-e emissions would comprise about 0.016 and 2.1 percent of the
U.S. and Alaska inventories, respectively. Note these numbers are calculated based full
capacity operations 24 hours a day, 7 days a week and are likely to be worst-case.
Emissions from the proposed project are not expected to contribute in any discernable way to
climate change, to climate change effects within Alaska, or to effects upon listed species or
critical habitat. Construction and operation of project facilities, and transiting vessel traffic in
support of the proposed activities, is expected to contribute an extremely small amount of the
overall GHG emissions into the planet’s atmosphere and may, in some respects, ameliorate or
reduce GHG emissions and climate effects that might otherwise result from the use of energy
sources that produce larger amounts of GHGs than natural gas.
Scientific consensus is that global climate change will increase the frequency of heat extremes,
heat waves, and heavy precipitation events. Currently accepted models predict that continued
GHG emissions at or above current rates will induce more extreme climate changes during the
21st century than were observed during the 20th century. A warming of about 0.2°C per decade
is projected. Even if the concentrations of all GHGs and aerosols are kept constant at year
2000 levels, a further warming of about 0.1°C per decade would be expected. A faster
temperature increase will lead to more dramatic, and more unpredictable, localized climate
extremes. Other likely direct effects of global warming include an increase in the areas affected
by drought, an increase in tropical cyclone activity and higher sea level, and the continued
recession of polar ice caps. Already some identifiable signs exist that global warming is taking
place. In Alaska, reported adverse impacts resulting from global warming include (ADEC 2008):
Increased coastal erosion and displacement of coastal communities;
Melting of arctic tundra and taiga resulting in the damage of Alaska’s infrastructure;
Warmer summers resulting in insect infestations, more frequent and larger forest fires,
and the alteration of Alaska’s boreal forests;
Decrease in arctic ice cover resulting in loss of habitat and prey species for marine
mammals; and
Changes in terrestrial and oceanic species abundance and diversity resulting in the
disruption of the subsistence way of life, among other adverse impacts.
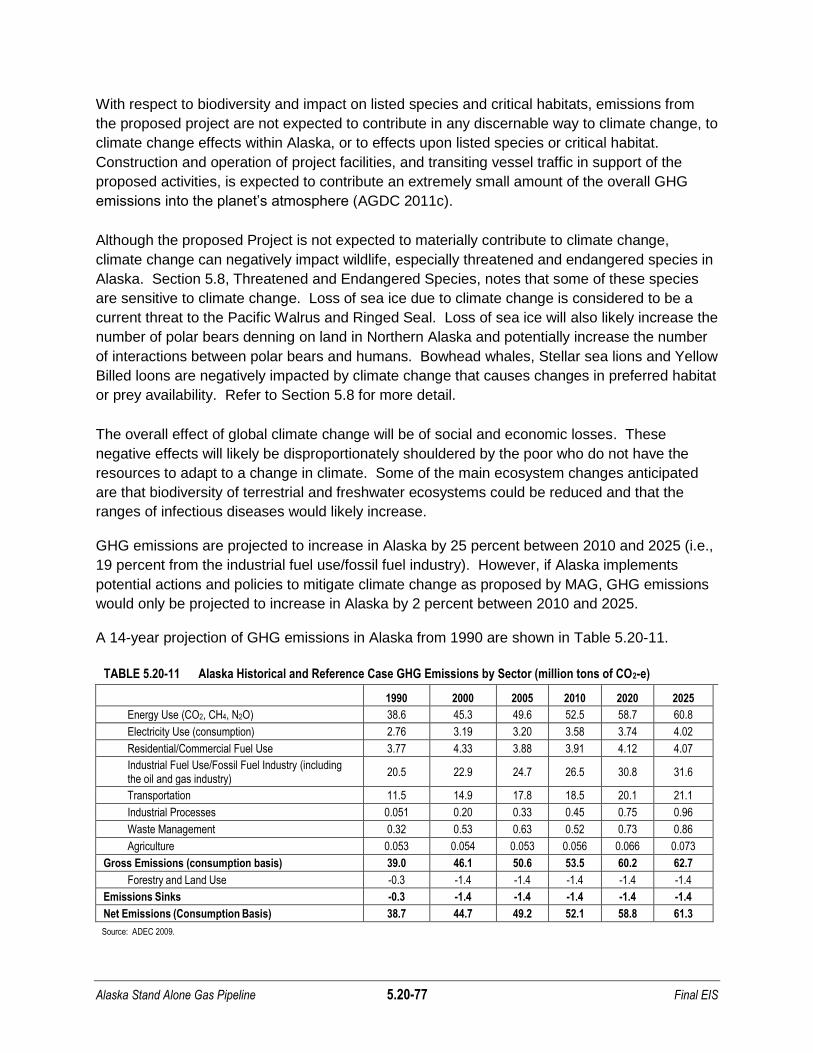
Alaska Stand Alone Gas Pipeline 5.20-77 Final EIS
With respect to biodiversity and impact on listed species and critical habitats, emissions from
the proposed project are not expected to contribute in any discernable way to climate change, to
climate change effects within Alaska, or to effects upon listed species or critical habitat.
Construction and operation of project facilities, and transiting vessel traffic in support of the
proposed activities, is expected to contribute an extremely small amount of the overall GHG
emissions into the planet’s atmosphere (AGDC 2011c).
Although the proposed Project is not expected to materially contribute to climate change,
climate change can negatively impact wildlife, especially threatened and endangered species in
Alaska. Section 5.8, Threatened and Endangered Species, notes that some of these species
are sensitive to climate change. Loss of sea ice due to climate change is considered to be a
current threat to the Pacific Walrus and Ringed Seal. Loss of sea ice will also likely increase the
number of polar bears denning on land in Northern Alaska and potentially increase the number
of interactions between polar bears and humans. Bowhead whales, Stellar sea lions and Yellow
Billed loons are negatively impacted by climate change that causes changes in preferred habitat
or prey availability. Refer to Section 5.8 for more detail.
The overall effect of global climate change will be of social and economic losses. These
negative effects will likely be disproportionately shouldered by the poor who do not have the
resources to adapt to a change in climate. Some of the main ecosystem changes anticipated
are that biodiversity of terrestrial and freshwater ecosystems could be reduced and that the
ranges of infectious diseases would likely increase.
GHG emissions are projected to increase in Alaska by 25 percent between 2010 and 2025 (i.e.,
19 percent from the industrial fuel use/fossil fuel industry). However, if Alaska implements
potential actions and policies to mitigate climate change as proposed by MAG, GHG emissions
would only be projected to increase in Alaska by 2 percent between 2010 and 2025.
A 14-year projection of GHG emissions in Alaska from 1990 are shown in Table 5.20-11.
TABLE 5.20-11 Alaska Historical and Reference Case GHG Emissions by Sector (million tons of CO2-e)
1990 2000 2005 2010 2020 2025
Energy Use (CO2, CH4, N2O) 38.6 45.3 49.6 52.5 58.7 60.8
Electricity Use (consumption) 2.76 3.19 3.20 3.58 3.74 4.02
Residential/Commercial Fuel Use 3.77 4.33 3.88 3.91 4.12 4.07
Industrial Fuel Use/Fossil Fuel Industry (including the oil and gas industry)
20.5 22.9 24.7 26.5 30.8 31.6
Transportation 11.5 14.9 17.8 18.5 20.1 21.1
Industrial Processes 0.051 0.20 0.33 0.45 0.75 0.96
Waste Management 0.32 0.53 0.63 0.52 0.73 0.86
Agriculture 0.053 0.054 0.053 0.056 0.066 0.073
Gross Emissions (consumption basis) 39.0 46.1 50.6 53.5 60.2 62.7
Forestry and Land Use -0.3 -1.4 -1.4 -1.4 -1.4 -1.4
Emissions Sinks -0.3 -1.4 -1.4 -1.4 -1.4 -1.4
Net Emissions (Consumption Basis) 38.7 44.7 49.2 52.1 58.8 61.3
Source: ADEC 2009.
Alaska Stand Alone Gas Pipeline 5.20-78 Final EIS
Even with mitigation, the proposed Project and its connected actions would generate GHG
emissions and incrementally contribute to climate change. However, when proposed Project
emissions are viewed in combination with global emissions levels that are contributing to the
existing cumulative impact on global climate change, the incremental contribution of GHG
emissions would be cumulatively minor.
Noise and Sensitive Receptors
Sensitive receptors for humans include residences, businesses, schools, hospitals, and
developed areas such as a campground and extensive use outdoor recreation areas like Denali
State Park. There are five communities with a combined population of approximately 3,600
residents located within 1.5 miles of the proposed Project with another 3,200 people living in
four communities within 1.5 to 5 miles. There would be five constructions camps within 1.5
miles of 5 communities with a combined population of 35,000 residents and two camps within
1.5 miles and 5 miles of communities with a combined population of 12,800 residents. Eight
material sites would be within 1.5 miles of communities with a combined population of 6,200;
and an additional four between 1.5 and 5 miles of communities with a total population of 44,000
residents. It is recognized that some of the residents living within 5 miles of the proposed
Project would experience an increase in noise and that there is duplications in the number of
communities that would experience an increase in proposed Project-related noise (see
Tables 5.17-1 through 5.17-3). It is also recognized there would be an unquantified increase in
noise from the ARR during the time period that pipe, construction equipment and supplies are
moved between the Port of Seward and Fairbanks and from Fairbanks to Willow for the
construction camps and laydown areas. There also would be an unquantified increase in
aircraft noise at existing airports.
Observations on the effects of noise from the construction and operation of TAPS and highways
provides data relevant to the cumulative effect of noise on humans and on wildlife.
Pre-construction and construction activities along the proposed Project would be transitory,
short-term, and localized. Pre-construction and construction related noise would be created by
equipment operations along the pipeline system, vehicle and aircraft access to and from
construction camps, laydown areas, and operations at material sites. Construction related noise
at construction camps, material sites, and permanent facility sites would be of a longer duration,
and stationary, but temporary noise, would occur in proximity to the sites.
Sensitive receptors for wildlife would include noise generating activities in close proximity to
important habitats such as to sheep lambing areas and concentrated water fowl nesting and
rearing areas. To the extent pre-construction and construction activities are scheduled to avoid
sensitive periods for wildlife that use nearby habitats, there should be little adverse cumulative
effect to wildlife.
Noise from construction activities for the proposed Project would not have a cumulative effect
with the APP, upgrading the Intertie, or Watana since these reasonably foreseeable projects
would be constructed in different years. There would be cumulative effects of noise from
Alaska Stand Alone Gas Pipeline 5.20-79 Final EIS
Project construction when concurrent with and located within a 1-mile radius of maintenance
activity at TAPS, nearby highways or the ARR.
Noise from operation of proposed Project permanent facilities would be modified to the extent
the operations would occur inside a building designed to minimize noise to any nearby sensitive
human or wildlife sensitive receptors. These cumulative noise impacts would be temporary, site
specific, and short-term.
The reasonably foreseeable action of expanding the FNG distribution system would create
noise that would be local, short-term and temporary. The cumulative effect of construction
noise would be in developed areas and likely minor.
The Connected Action of operating a conceptual fractionating facility, tank farm and marine
terminal at Nikiski would have a cumulative effect on noise. The extent and sensitive receptors
associated with the cumulative noise impacts would depend primarily on the site specific
equipment and noise controls developed for the fractionation facility and marine terminal.
Navigation Resources
Navigable waters have three distinct definitions: for navigation of vessels, for ownership of
submerged land, and for regulatory authority for water quality purposes. This section addresses
the waters used for navigational purposes as defined by the USACE. The proposed Project
would have ten crossings of six streams the USACE considers navigable under Section 10 of
the Rivers and Harbors Act (Table 5.18-1). The proposed Project crossings of these six water
bodies would not cause a negative cumulative effect to the vessel travel.
Ocean going vessels arriving at the Port of Seward would not require modifications to existing
docking facilities or vessel traffic. The action of extending the FNG distribution system would
not be likely to affect vessel traffic on navigable waters.
The Connected Action of constructing a conceptual submarine pipeline system and use or
modification of an existing dock or a new dock at Nikiski have not been evaluated at this time.
Safety and Reliability
The transportation of natural gas by pipeline involves some risk to the public in the event of an
accident and subsequent release of gas. The greatest hazard is a fire or explosion following a
major pipeline rupture. See Section 5.19, Reliability and Safety, for a discussion of the safety
standards required for a natural gas pipeline system.
Tables 5.18-2, 5.18-3, and 15.18-5 summarize data concerning the number of significant
incidents for the period 1991 to 2010. These data indicate the frequency of the incident was
related to pipeline age, with excavations over or next to a pipeline being the dominant factor
(52 percent) with 42 percent caused by natural forces (earth movement, heavy rain/ flooding/
lightening/ high temperature/ high wind and unspecified causes). The operation of the proposed
Project would represent only a slight increase in risk to the nearby public.
Alaska Stand Alone Gas Pipeline 5.20-80 Final EIS
There would be a potential cumulative effect to safety and reliability among the proposed
Project, TAPS, highway use and maintenance, and the ARR. It would be expected that final
design for the proposed Project would include written agreements that the proposed
construction activities, operating conditions, and maintenance requirements would not cause
undue risk to existing transportation and utility systems. Accordingly, no negative cumulative
effects to TAPS, Highways, or ARR would be expected. Although the APP would likely be
slightly different than the original ANGTS project, it is noted that there were mutual agreements
covering how ANGTS, TAGS, TAPS, and highways would be crossed as well as site specific
distances for separation when there were topographic or other constraints on pipeline locations.
5.20.6.3 Cumulative Effects Associated with Yukon River Crossing Options
Three route options have been identified for the Yukon River crossing, and a route variation
through Denali NPP has also been identified (see Section 4). The options and variation do not
appreciably change the overall length of the proposed Project ROW.
Three methods for crossing the Yukon River have been identified:
The Applicant Preferred Option: Construct a new suspension bridge downstream from
the existing bridge.
Option 2: Utilize the existing E.L. Patton Bridge. The existing bridge was designed to
support two large diameter pipeline systems and is used by TAPS.
Option 3: Utilize Horizontal Directional Drilling methods under the River in an area with
difficult and not completely understood geology, possibly involving a fault.
The AGDC proposes to construct a new suspension bridge approximately one mile downstream
from the existing bridge. The approaches to this site would involve less than 0.3 mile of new
permanent gravel road. Cumulative impacts associated with the Yukon River crossing are:
commercial and subsistence fishing sites, creating a new disturbance in an area with raptor
nesting, APP crossing, and the BLM designation of an area along the north bank of the river as
a Development Node to protect existing commercial services on the north side of the river, a
public water supply and campground and for future commercial services that provide access to
the Dalton Highway and, commercial and recreational boat traffic on the river.
If approved by DOT, PHMSA, and USCG, then the proposed Project pipeline could be located
on the E.L. Patton Bridge without new or additional cumulative impacts. Reliability and safety
could be a concern however, related to the presence of a high pressure gas line in close
proximity above ground to a large diameter oil pipeline. PHMSA approval of the collocation of
the pipelines would need to take into account potential risks and cumulative impacts of a break
or explosion to one pipe, thereby impacting the other. Whether APP proposes to, or would be
approved to, use the E.L. Patton Bridge is unknown and would be addressed as part of a risk
assessment for the APP project conducted by FERC during the NEPA and licensing processes.
Alaska Stand Alone Gas Pipeline 5.20-81 Final EIS
During construction activities, the proposed Project in conjunction with nearby existing and
future activities would create temporary, short term cumulative impacts to public access to the
Yukon River for hunting and fishing and potentially to some commercial and subsistence fishing
activities. Cumulative negative effects to raptor nesting could occur during mobilization and
construction activities in the immediate vicinity of the new suspension bridge. Experience
elsewhere along TAPS demonstrates that there likely would be no long-term adverse impacts to
raptor nesting providing nesting habitat was not lost and that coincident maintenance and
inspection activities were scheduled in a manner that avoided undue stress to raptors. Wetland
disturbance at the Yukon River crossing would probably be in the range of 4 to 13 acres for the
proposed Project and likely a similar amount for APP. The proposed Project crossing is situated
on bluffs and constructing the suspension bridge would not require in-water work or structures.
Horizontal directional drilling of the Yukon crossing would involve the same cumulative effects
described for the proposed Project suspension bridge, although the unknown geologic
conditions may create substantial design issues that in turn could adversely affect the
construction schedule.
5.20.6.4 Cumulative Effects Associated with Denali National Park Route Variation
A route variation for the proposed Project includes crossing lands administered by the NPS as
part of the Denali NPP. If authorized by Congress, the proposed Project would follow the
existing and former lands occupied by what is now the Parks Highway. The proposed Project
route variation would be within or adjacent to land used for transportation corridors, as well as
for buried and above ground communication and utility systems. However, the NPS lacks
statutory authority to allow construction and operation of a pipeline system such as the
proposed Project. If Congress approves the proposed ROW across NPS land, the existing land
use plan for the area would require modification to incorporate changes in public access as a
result of potential co-location of a new bike-hiking trail with the proposed Project ROW. If
Congress denies the route along the Parks Highway as it crosses NPS lands, the route would
revert to the proposed Project route located east of the Denali NPP on private and state land.
The Alaska Congressional delegation has introduced federal legislation that would provide NPS
authority to approve a pipeline route following the Parks Highway through about 7 miles of
Denali NPP if the NPS concluded the Denali National Park Route Variation would have a
smaller impact to Park resources than would the proposed Project’s proposed alignment.
Direct and cumulative impacts of the proposed Project route to the Parks Highway are
discussed as part of the overall proposed Project impacts in previous sections of Section 5,
Environmental Analysis, and subsections of Section 5.20, Cumulative Effects. Potential
cumulative impacts of the Denali National Park Route Variation include:
Impacts to tourism and recreation if the construction of the proposed Project were to
occur simultaneously with other Park improvements in the vicinity of the ROW.
Impacts to transportation and travel along the Parks Highway should construction
coincide with highway improvements or mobilization activities for other reasonably
foresee able projects.

Alaska Stand Alone Gas Pipeline 5.20-82 Final EIS
During pipeline operations, there would be minimal to no cumulative impacts of the
presence of the ROW other than the possibility for enhancement of other Denali NPP
features.
5.20.6.5 Cumulative Effects from the Proximity of the Project to APP, TAPS, Utility and
Communication Facilities, ARR, and Highways
The 1988 grant of ROW from the BLM and the State of Alaska required a nominal separation of
TAGS from TAPS and from ANGTS. When crossing, or closer than 200 feet, TAGS was
required to work out the specific design, construction method, and operational procedures with
both TAPS and with ANGTS. Written communications were required by the Authorized Officer
stating that there were mutually agreeable solutions to a given situation. For example, at a
major pinch point at Atigun Pass, TAGS had to work out not only how close it would be located
to TAPS, the Dalton Highway, and the authorized but unconstructed ANGTS, but the depth of
burial, e.g., which pipeline would be above and which one below when there was insufficient
room to have a parallel location for both TAGS and ANGTS. It is expected that BLM and the
State would include similar provisions in the proposed Project’s grant of ROW through Atigun
Pass and other locations where proximity to an existing or pending system is a potential issue.
It is expected that all pipe for the proposed Project would be delivered to the Port of Seward and
then transported by the ARR to a facility in Fairbanks where double-jointing and pipe coating
would be done. From Fairbanks, the double-jointed and coated pipe would be transported north
via the Elliott and Dalton Highways to laydown sites along the proposed Project route.
Transport south from Fairbanks would primarily be by the ARR, but some pipe would be hauled
by trucks using the Parks Highway.
The proposed ARR Port MacKenzie Rail Extension would add approximately 35 miles of new
track from near Houston, south to Port MacKenzie. The Final EIS for the project was completed
in March, 2011. The ARR is currently acquiring the funding and permits necessary for
construction. Therefore, the rail extension project is considered reasonably foreseeable and is
considered in the cumulative effects analysis. However, the cumulative effects evaluation
assumes that the Port MacKenzie ARR extension would not be completed in time for proposed
Project materials deliveries for the pipeline terminus.
The proposed Project ROW between Prudhoe Bay and Livengood would be in close proximity
to TAPS and existing communication systems and highways and the proposed APP system. In
1988, the Department of the Interior evaluated the relationships of an authorized large diameter
natural gas pipeline systems (ANGTS), a similar large diameter gas pipeline system for export
of LNG near Valdez (TAGS), TAPS, and the Dalton and Elliott Highways. The BLM
subsequently determined that proximity issues could be resolved among the proposed pipeline
systems, the Dalton and Elliott Highways, and TAPS. The proposed Project ROW generally
follows one of the previously approved alignments (TAGS an ANGTS) for one of the large
diameter pipeline while the APP has filed an application with the State in June 2004 that
generally follows the ANGTS alignment. Accordingly, there are no proximity issues between the

Alaska Stand Alone Gas Pipeline 5.20-83 Final EIS
proposed Project, APP, TAPS, and Dalton and Elliott Highway that have not been successfully
resolved previously.
A new buried communication system has been constructed north of Livengood and generally
follows the Dalton and Elliott Highways. Although a buried fiber optics communication system
was not considered in the 1988 evaluations, there are accepted standards to avoid serious
compatibility issues. Accordingly, no reasonably foreseeable cumulative effects would be
expected for the construction of the proposed Project in combination with TAPS, Dalton
Highway, and buried communication systems.
There could be cumulative effects on noise, habitat disturbance, and air quality between the
proposed Project and APP that had not been previously addressed when both ANGTS and
TAGS were issued BLM ROW approvals. The proposed Project has identified a potential 13.8
acre compressor station site at MP 225.1 and another at MP 285.6 (Figures 2.1-2 and 2.1-3,
respectively). Proposed Project compressor station 2 would be located approximately 1.5 miles
south and upslope from TAPS Pump Station 5. Neither proposed Project compressor station
appears to be situated near possible compressor station locations for the APP system as
identified in the 2004 updated application to the State. In addition, neither proposed Project
compressor station location would appear to create cumulative impacts in combination with
existing and proposed pipelines and the Dalton Highway.
South of Livengood, the proposed Project follows the TAGS alternative alignment through the
eastern part of the Minto Flats State Game Refuge and then generally parallels the Parks
Highway to the Willow area and then southwestward to the proposed Project terminus at Mile
Post 736.4. There are no proximity issues with transportation or utility systems within the Minto
Flats route. South of MP 454 where the proposed Project intersects the ARR the proposed
Project ROW would be near or adjacent to the Parks Highway, electrical and communication
systems and ARR tracks. The AGDC has recognized these relationships and no unsolvable
proximity issues are reasonably expected with transportation and utility systems.
A straddle plant and off-take facility is required for the proposed Project at MP 458.1
(Figure 2.1-4) and the 35-mile long Fairbanks Lateral would be built generally following the ARR
ROW to deliver utility grade natural gas to the Fairbanks area. Proximity issues involve the
Parks Highway and connecting roads to adjacent areas as well as for local businesses and
homes along the highway. There would be no unusual cumulative proximity issues associated
with the Fairbanks Lateral that would not be satisfactorily resolved by standard pipeline location,
design, and operation procedures.
The 1988 EIS considering the cumulative effects of TAGS with ANGTA, TAPS and the Dalton
Highway noted that large amounts of borrow material would be required for construction,
operation and repair of the two large diameter pipeline systems as well as the continued
maintenance and repair for the Dalton Highway and for TAPS and that these resources were
greatly depleted, especially on the North Slope. The Project proposes to extract borrow only
from existing sites. The quantities and locations of the existing borrow sites that would be used
is unknown at this time. See Section 5.20.6.2 for a discussion of the cumulative effects on use
Alaska Stand Alone Gas Pipeline 5.20-84 Final EIS
of limited borrow material sources and long-term estimated needs for maintaining TAPS, and
Dalton, Elliott, and Parks Highways and the ARR.
The Connected Action of a conceptual 80-mile long pipeline system from the NGLEP to Nikiski
would involve proximity issues associated with the ENSTAR pipeline system, on shore oil and
gas production facilities and submarine oil and gas pipelines in cook Inlet (see Figure 5.20-1).
These issues would be resolved as part of the final design and permitting process for the
pipeline. Based on previous decisions regarding such proximity, no unresolveable effects are
expected. Likewise no unresolveable proximity issues are expected with the production and
marine facilities at Nikiski.
5.20.6.6 Cumulative Effects of Other Energy Resource Projects
The following discussion summarizes other non-oil and gas energy projects that are reasonably
foreseeable and have the potential to affect the combination of instate use verses export of the
products that would be transported from the North Slope by the proposed Project.
Bradley Lake Hydroelectric Facility
Bradley Lake Hydroelectric Facility is a key component of the Railbelt G&T providing a long-
term renewable supply ranging between 5 and 10 percent of the total annual Railbelt electrical
demand. Located near Homer, this facility has a 126 MW installed capacity that is normally
scheduled to produce 90 MW to minimize losses. Under a Power Sales Agreement, all of the
power has been sold as follows: CEA (30.4 percent), GVEA (16.9 percent), HEA (25.8 percent),
MEA (13.8 percent), ML&P (13.8 percent), and SES (1.0 percent) (AEA 2011b).
Proposed Watana Hydroelectric Project
The State has resumed planning for a large hydroelectric project (Low Watana, non
expandable) (AEA 2010). The Watana hydroelectric potential was originally evaluated as a
higher dam with an impoundment of about 38,000 acres that was evaluated in1984 by FERC as
a component of a large scale two dam scenario (FERC 1984). The Low Watana concept would
involve an impoundment that would be approximately 39 miles long and 2 miles wide with a
surface area of about 20,000 acres. Permanent road access would be constructed to the dam
site as would an electrical transmission line westward to join the Intertie system. The reservoir
would remove about 40 miles of main stem fish habitat and about 15 miles of tributaries to the
Susitna River. Water quality parameters downstream would be impacted due to water
temperature and flow regime changes. The overall cumulative impact would be a loss of about
20,000 acres of wildlife habitat and would modify wildlife movement resulting in negative effect
to fish and wildlife while having a large positive cumulative effect on a reliable long-term source
of electrical energy for the Railbelt. The proposed Project and a large hydroelectric project
would be independent of each other. Electrical energy produced by a hydro project could
reduce the reliance on natural gas as a base load fuel source, which would have a positive
cumulative effect on the proposed Project to the extent the additional increment of natural gas
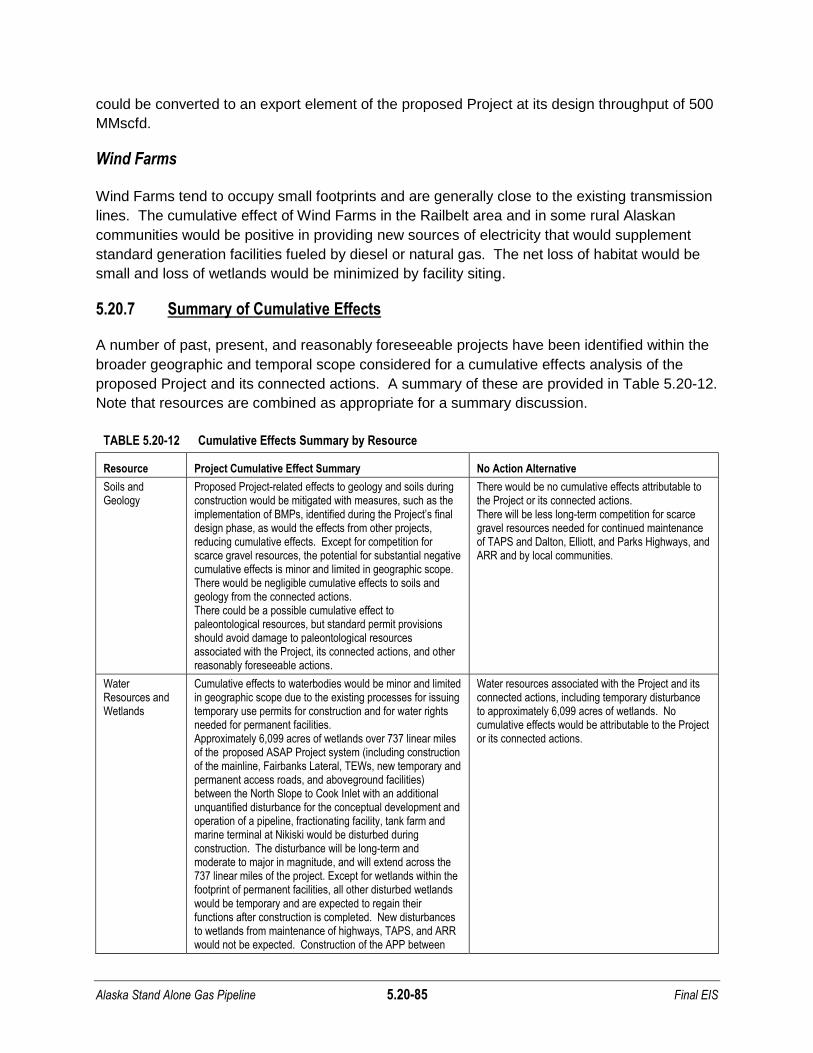
Alaska Stand Alone Gas Pipeline 5.20-85 Final EIS
could be converted to an export element of the proposed Project at its design throughput of 500
MMscfd.
Wind Farms
Wind Farms tend to occupy small footprints and are generally close to the existing transmission
lines. The cumulative effect of Wind Farms in the Railbelt area and in some rural Alaskan
communities would be positive in providing new sources of electricity that would supplement
standard generation facilities fueled by diesel or natural gas. The net loss of habitat would be
small and loss of wetlands would be minimized by facility siting.
5.20.7 Summary of Cumulative Effects
A number of past, present, and reasonably foreseeable projects have been identified within the
broader geographic and temporal scope considered for a cumulative effects analysis of the
proposed Project and its connected actions. A summary of these are provided in Table 5.20-12.
Note that resources are combined as appropriate for a summary discussion.
TABLE 5.20-12 Cumulative Effects Summary by Resource
Resource Project Cumulative Effect Summary No Action Alternative
Soils and Geology
Proposed Project-related effects to geology and soils during construction would be mitigated with measures, such as the implementation of BMPs, identified during the Project’s final design phase, as would the effects from other projects, reducing cumulative effects. Except for competition for scarce gravel resources, the potential for substantial negative cumulative effects is minor and limited in geographic scope. There would be negligible cumulative effects to soils and geology from the connected actions. There could be a possible cumulative effect to paleontological resources, but standard permit provisions should avoid damage to paleontological resources associated with the Project, its connected actions, and other reasonably foreseeable actions.
There would be no cumulative effects attributable to the Project or its connected actions. There will be less long-term competition for scarce gravel resources needed for continued maintenance of TAPS and Dalton, Elliott, and Parks Highways, and ARR and by local communities.
Water Resources and Wetlands
Cumulative effects to waterbodies would be minor and limited in geographic scope due to the existing processes for issuing temporary use permits for construction and for water rights needed for permanent facilities. Approximately 6,099 acres of wetlands over 737 linear miles of the proposed ASAP Project system (including construction of the mainline, Fairbanks Lateral, TEWs, new temporary and permanent access roads, and aboveground facilities) between the North Slope to Cook Inlet with an additional unquantified disturbance for the conceptual development and operation of a pipeline, fractionating facility, tank farm and marine terminal at Nikiski would be disturbed during construction. The disturbance will be long-term and moderate to major in magnitude, and will extend across the 737 linear miles of the project. Except for wetlands within the footprint of permanent facilities, all other disturbed wetlands would be temporary and are expected to regain their functions after construction is completed. New disturbances to wetlands from maintenance of highways, TAPS, and ARR would not be expected. Construction of the APP between
Water resources associated with the Project and its connected actions, including temporary disturbance to approximately 6,099 acres of wetlands. No cumulative effects would be attributable to the Project or its connected actions.

Alaska Stand Alone Gas Pipeline 5.20-86 Final EIS
TABLE 5.20-12 Cumulative Effects Summary by Resource
Resource Project Cumulative Effect Summary No Action Alternative
the North Slope and MP 405 could double the cumulative effect to wetlands.
Biological Resources (vegetation, fish, wildlife, marine mammals, and threatened and endangered species)
Due to the largely temporary site specific nature of the direct and indirect effects of the proposed Project on vegetation and wildlife and fish habitats, negative long-term cumulative effects on vegetation or wildlife habitats are expected to be local and minor in extent and magnitude. If activities for reasonably foreseeable projects were to occur during a similar time period as the proposed Project, there may be a cumulative mortality of aquatic and terrestrial species individuals of a moderate, short-term, and local nature. But overall, a negative cumulative population-level effect is unlikely. Increased vessel traffic could cause a cumulative temporary impact, primarily on aquatic and marine resources including marine mammals due to marine activities during construction. Cumulative negative effects to federal or state designated species would not be expected.
Cumulative effect of the Project and its connected actions on existing natural distribution of vegetation and wildlife and fish habitats would be eliminated, as would impacts to marine mammals and threatened and endangered species.
Land Use Reasonably foreseeable future projects that would be constructed within existing transportation and utility corridors generally would be consistent with existing land use planning. There could be a short-term cumulative minor negative effect on recreational opportunity and activity in the Project area due to construction activity and from increased competition for recreation resources from construction workers assigned to the reasonably foreseeable projects in conjunction with the proposed Project. Long-term negative effects to the Minto Flats State Gamer Refuge and to the existing natural
character of state land east of Denali NPP are unlikely.
New roads and the cleared right-of-way through forested areas could increase unauthorized Off Road Vehicle (ORV) use and result in ground disturbance, damage to vegetation, and increase the potential for soil erosion. These impacts could be long-term and of a moderate magnitude. Roadway improvement and maintenance projects are not expected to result in an adverse effect even when combined with the proposed pipeline. It is unlikely but possible that coinciding construction or maintenance schedules could prevent traffic flow on the Parks or Dalton Highways. Impacts to traffic flow are projected to be minor, temporary and local in nature.
Existing land uses would not be modified. No cumulative effects would occur.
Visual Resources
The overall cumulative effect of the Project with the TAPS, APP, Highways, and ARR on the visual resources in the Project area would be minor and limited since the Project would be located within an existing developed transportation and utility corridor.
There would be no additional impacts to visual resources under the no action alternative.
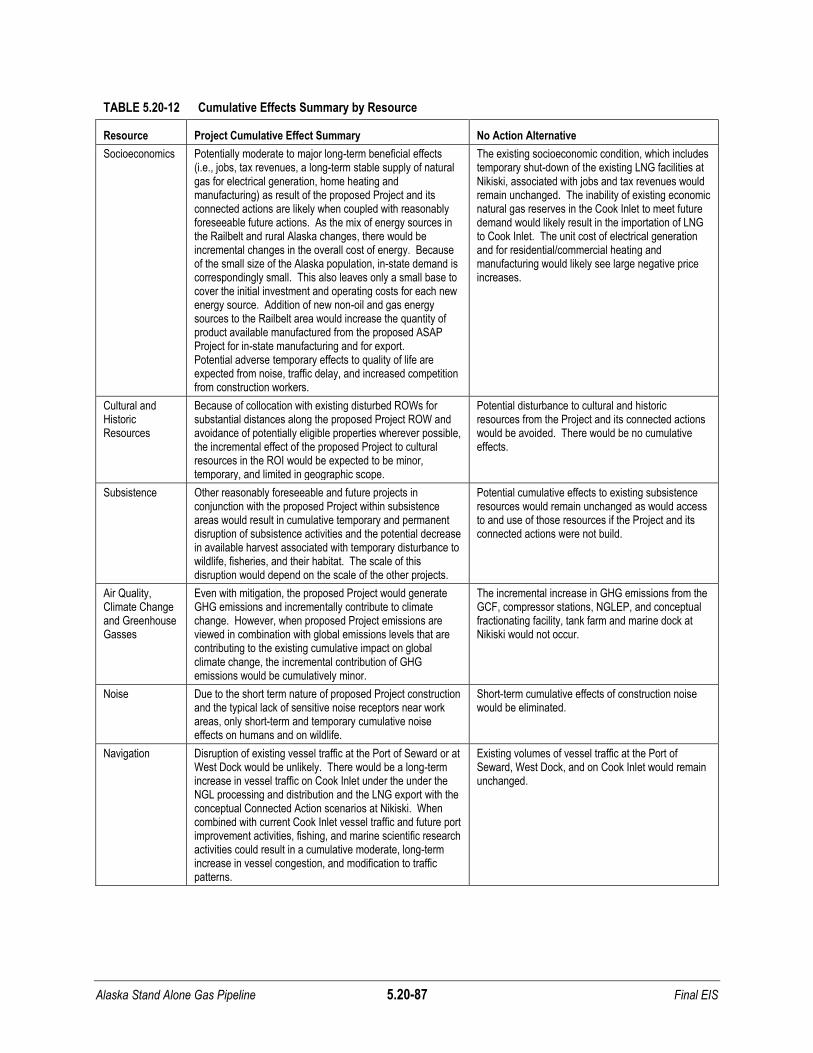
Alaska Stand Alone Gas Pipeline 5.20-87 Final EIS
TABLE 5.20-12 Cumulative Effects Summary by Resource
Resource Project Cumulative Effect Summary No Action Alternative
Socioeconomics Potentially moderate to major long-term beneficial effects (i.e., jobs, tax revenues, a long-term stable supply of natural gas for electrical generation, home heating and manufacturing) as result of the proposed Project and its connected actions are likely when coupled with reasonably foreseeable future actions. As the mix of energy sources in the Railbelt and rural Alaska changes, there would be incremental changes in the overall cost of energy. Because of the small size of the Alaska population, in-state demand is correspondingly small. This also leaves only a small base to cover the initial investment and operating costs for each new energy source. Addition of new non-oil and gas energy sources to the Railbelt area would increase the quantity of product available manufactured from the proposed ASAP Project for in-state manufacturing and for export. Potential adverse temporary effects to quality of life are expected from noise, traffic delay, and increased competition from construction workers.
The existing socioeconomic condition, which includes temporary shut-down of the existing LNG facilities at Nikiski, associated with jobs and tax revenues would remain unchanged. The inability of existing economic natural gas reserves in the Cook Inlet to meet future demand would likely result in the importation of LNG to Cook Inlet. The unit cost of electrical generation and for residential/commercial heating and manufacturing would likely see large negative price increases.
Cultural and Historic Resources
Because of collocation with existing disturbed ROWs for substantial distances along the proposed Project ROW and avoidance of potentially eligible properties wherever possible, the incremental effect of the proposed Project to cultural resources in the ROI would be expected to be minor, temporary, and limited in geographic scope.
Potential disturbance to cultural and historic resources from the Project and its connected actions would be avoided. There would be no cumulative effects.
Subsistence Other reasonably foreseeable and future projects in conjunction with the proposed Project within subsistence areas would result in cumulative temporary and permanent disruption of subsistence activities and the potential decrease in available harvest associated with temporary disturbance to wildlife, fisheries, and their habitat. The scale of this disruption would depend on the scale of the other projects.
Potential cumulative effects to existing subsistence resources would remain unchanged as would access to and use of those resources if the Project and its connected actions were not build.
Air Quality, Climate Change and Greenhouse Gasses
Even with mitigation, the proposed Project would generate GHG emissions and incrementally contribute to climate change. However, when proposed Project emissions are viewed in combination with global emissions levels that are contributing to the existing cumulative impact on global climate change, the incremental contribution of GHG emissions would be cumulatively minor.
The incremental increase in GHG emissions from the GCF, compressor stations, NGLEP, and conceptual fractionating facility, tank farm and marine dock at Nikiski would not occur.
Noise Due to the short term nature of proposed Project construction and the typical lack of sensitive noise receptors near work areas, only short-term and temporary cumulative noise effects on humans and on wildlife.
Short-term cumulative effects of construction noise would be eliminated.
Navigation Disruption of existing vessel traffic at the Port of Seward or at West Dock would be unlikely. There would be a long-term increase in vessel traffic on Cook Inlet under the under the NGL processing and distribution and the LNG export with the conceptual Connected Action scenarios at Nikiski. When combined with current Cook Inlet vessel traffic and future port improvement activities, fishing, and marine scientific research activities could result in a cumulative moderate, long-term increase in vessel congestion, and modification to traffic patterns.
Existing volumes of vessel traffic at the Port of Seward, West Dock, and on Cook Inlet would remain unchanged.

Alaska Stand Alone Gas Pipeline 5.20-88 Final EIS
TABLE 5.20-12 Cumulative Effects Summary by Resource
Resource Project Cumulative Effect Summary No Action Alternative
Safety and Reliability
There would be a potential cumulative effect to safety and reliability among the Project, TAPS, highway use and maintenance, and the ARR. Is would be expected that final design for the Project would include written agreements that the proposed construction activities, operating conditions, and maintenance requirements would not cause undue risk to existing transportation and utility systems. Accordingly, no negative cumulative effects to TAPS, Highways, or ARR would be expected. Although the APP would likely be slightly different than the original ANGTS project, it is noted that there were mutual agreements covering how ANGTS, TAGS, TAPS, and highways would be crossed as well as site specific distances for separation when there were topographic or other constraints on pipeline locations.
There would be no additional cumulative impacts on safety and reliability expected if the Project and its connected actions are not built.
5.20.8 References
ADEC. See Alaska Department of Environmental Conservation.
ADF&G. See Alaska Department of Fish and Game.
ADNR. See Alaska Department of Natural Resources.
AEA. See Alaska Energy Authority.
AGDC. See Alaska Gasline Development Corporation.
Alaska Department of Environmental Conservation (ADEC). 2008. Summary Report of
Improvements to the Alaska Greenhouse Gas Emission Inventory. January 2008.
Alaska Department of Environmental Conservation (ADEC). 2009. DRAFT Alaska Greenhouse
Gas Inventory and Reference Case Projections, 1990-2025 Center for Climate
Strategies. May 2009.
Alaska Department of Fish and Game (ADF&G). 2006. Our Wealth Maintained: A Strategy for
Conserving Alaska’s Diverse Wildlife and Fish Resources. Website:
(http://www.adfg.alaska.gov/static/species/wildlife_action_plan/cwcs_main_text_combine
d.pdf).
Alaska Department of Natural Resources (ADNR). 1986a. White Mountain National Recreation
Area RMP.
Alaska Department of Natural Resources (ADNR). 1986b. Steese National Conservation Area
RMP.
Alaska Department of Natural Resources (ADNR). 1996. State Policy on Navigability. Public
Trust Doctrine. Website: (http://dnr.alaska.gov/mlw/nav/nav_policy.htm).

Alaska Stand Alone Gas Pipeline 5.20-89 Final EIS
Alaska Department of Natural Resources (ADNR). 2008. State Navigable Waters. Division of
Mining, Land & Water. Website: (http://www.navmaps.alaska.gov/navwatersmap/).
Alaska Department of Natural Resources (ADNR). 2010. State Navigable Waters. Division of
Mining, Land & Water. Website: (http://dnr.alaska.gov/mlw/nav/map_disclaimer.htm).
Alaska Department of Transportation (DOT&PF). 2010. Interior Alaska Transportation Plan.
Table 0-14, 2010-2013 STIP Dalton Highway Projects and Table 0-20 2010-213 Elliott
Highway Projects. Website: (http://dot.alaska.gov/nreg/studies/iatp/files/full-iatp.pdf)
accessed August 19, 2011.
Alaska DOT&PF. See Alaska Department of Transportation & Public Facilities.
Alaska Energy Authority (AEA). 2010. Railbelt Large Hydro Evaluation Preliminary Decision
Document. November 23, 2010. Website: (http://susitna-watanahydro.org/
Docs/AEA%202010_PrelimDecDoc.pdf) accessed August 29, 2011.
Alaska Energy Authority (AEA). 2011a. Website: (http://www.aidea.org/aea/
regionalintegratedresourceplan.html) accessed August 13, 2011.
Alaska Energy Authority (AEA). 2011b. Factsheet; Bradley Lake Hydroelectric Project.
Website: (http://www.akenergyauthority.org/FactSheets/AEA_PFS_Bradley.pdf)
accessed August 13, 2011. Revised: July 7, 2011.
Alaska Gasline Development Corporation (AGDC). 2010. Letter to the U.S Army Corps of
Engineers. December 27, 2010
Alaska Gasline Development Corporation (AGDC). 2011a. Letter to the U.S. Army Corps of
Engineers, Subject: Proposed NGL Scenario for NEPA Connected Action Analysis,
November 8, 2011.
Alaska Gasline Development Corporation (AGDC). 2011b. A Visual Impact Analysis of the
Alaska Stand Alone Gas Pipeline Project in the Area of Denali National Park and
Preserve. Prepared by Design Alaska. September 2011.
Alaska Gasline Development Corporation (AGDC). 2011c. Conceptual Scenario for NGL
Fractionation at Nikiski, November 7, 2011.
Alaska Gasline Development Corporation (AGDC). 2011c. Biological Assessment. Prepared
by AGDC. May 2011.
Alaska Natural Gas Transportation Projects, Office of the Federal Coordinator. 2011. Alaska
Pipeline Project. Website: (http://www.arcticgas.gov/stakeholders/project-
applicants/alaska-pipeline-project) accessed May 12, 2011.
American Ornithologists’ Union. 2009. Fiftieth Supplement to the American Ornithologist’s
Union Check-list of North American Birds. August 7, 2009.
Alaska Stand Alone Gas Pipeline 5.20-90 Final EIS
Anchorage Daily News. 2011a. Kay Cashman. NordAq to develop Shadura gas prospect in
Kenai refuge. November 13, 2011, Section B, page 1.
Anchorage Daily News. 2011b. Borough welcomes news of reopened LNG plant. December
17, 2011. Website: (http://www.adn.com/2011/12/17/v-printer/2222192/borough-
welcomes-news-of-reopened.htmI).
Beck, R.W. 2011. Economic Feasibility Study of the Transportation and Sale of Natural Gas
Liquids/LP Gas for the Alaska Gasline Development Corporation. June 22, 2011.
BLM. See U.S. Bureau of Land Management.
Chugach. 2011. The Company. Website: (http://www.chugachelectric.com/inside/
company.html) accessed August 13, 2011.
DOE. See U.S. Department of Energy.
Electronic Code of Federal Regulations. 2012a. Title 40, Part 98, Subpart C, Table C-1 Default
CO2 Emission Factors and High Heat Values for Various Types of Fuel. Website:
(http://ecfr.gpoaccess.gov/cgi/t/text/text-idx?c=ecfr&sid=1f6eff5231ebad03e1f73c23d3
3a0dac&rgn=div9&view=text&node=40:22.0.1.1.3.3.1.10.18&idno=40) accessed
August 7, 2012.
Electronic Code of Federal Regulations. 2012b. Title 40, Part 98, Subpart C, Table C-2 Default
CH4 and N2O Emission Factors for Various Types of Fuel. Website:
(http://ecfr.gpoaccess.gov/cgi/t/text/text-idx?c=ecfr&sid=1f6eff5231ebad03e1f73c23d3
3a0dac&rgn=div9&view=text&node=40:22.0.1.1.3.3.1.10.19&idno=40) accessed
August 7, 2012.
ENSTAR. 2011. Website: (http://www.enstargas.com/AboutENSTAR.aspx) accessed
August 13, 2011.
Fairbanks Natural Gas, LLC. 2011. Customer Service. Website: (http://www.fngas.com/
service.html) accessed August 13, 2011.
Fairbanks Pipeline Company. 2011. Website: (http://www.fairbankspipelinecompany.com/
technical.html) accessed November 14, 2011.
Federal Energy Regulatory Commission (FERC). 1984. Draft Environmental Impact Statement
Sustina Hydroelectric Project. FERC No. 7114 - Alaska. Website: (http://susitna-
watanahydro.org/Docs/FERC_1984_DEIS%20V1%20Main%20Text_DOC_1653.pdf)
accessed August 29, 2011.
FERC. See Federal Energy Regulatory Commission.
Golden Valley Electric Association (GVEA). 2011. Website: (http://www.gvea.com/) accessed
August 13, 2011.
Alaska Stand Alone Gas Pipeline 5.20-91 Final EIS
GVEA. See Golden Valley Electric Association.
Homer Electric Association Inc. 2011. Website: (http://www.homerelectric.com/) accessed
August 13, 2011.
Jaramillo, P., W.M. Griffin, and H. S. Matthews. 2007. Comparative life-cycle air emissions of
coal, domestic natural gas, LNG, and SNG for electricity generation. Environ. Sci.
Technol. 2007, 41, 6290-6296.
Jiang, M., W.M. Griffin, C. Hendrickson, P. Jaramillo, J. VanBriesen, and A. Venkatesh. 2011.
Life Cycle Greenhouse Gas Emissions of Marcellus Shale Gas. Environ. Res. Lett., 6,
9pp. Website: (http://www.anga.us/media/229762/life%20cycle%20greenhouse%20gas
%20emissions%20of%20marcellus%20shale%20gas%20-%20carnegie%20mellon.pdf).
LNG World News. 2011. Alaska: Construction of North Slope LNG Plant Scheduled for 2013,
FNG Says. Website: (http://www.lngworldnews.com/alaska-construction-of-north-slope-
lng-plant-scheduled-for-2013-fng-says/) accessed August 13, 2011.
MacDonald, S. O. and J. A. Cook. 2009. Recent Mammals of Alaska. University of Alaska
Press. 387 pp.
MAG. See Mitigation Advisory Group.
Mitigation Advisory Group (MAG). 2009. Greenhouse Gas Inventory and Forecast and Policy
Recommendations Addressing Greenhouse Gas Reduction in Alaska. Website:
(http://www.akclimatechange.us/Mitigation.cfm) accessed on May 20, 2011.
Matanuska Electric Association. 2011. Website: (http://www.mea.coop/index.php/my-co-
op/new-generation/planned-eklutna-natural-gas-plant) accessed August 13, 2011.
McClatchy. 2011. Alaska official skeptical of Escopeta Oil's gas discovery at Cook Inlet.
Website: (http://www.mcclatchydc.com/2011/11/08/129626/alaska-official-skeptical-of-
escopeta.html) accessed November 14, 2011.
McCracken. 2007. Alaska’s Comprehensive Wildlife Conservation Strategy. Alaska
Department of Fish and Game. Anchorage.
ML&P. 2011. Website: (http://www.mlandp.com/) accessed August 13, 2011.
National Research Council (NRC). 2003. Cumulative Environmental Effects of Oil and Gas
Activitties on Alaska’s North Slope. Committee on Cumulative Environmental Effects of
Oil and Gas Activitties on Alaska’s North Slope, Board on Environmental Studies and
Toxicology. The National Academies Press. Website: (http://www.nap.edu/openboo
k.php?record_id=10639&page=6) accessed August 29, 2011.
NatureServ. 2009. Website: (http://www.natureserve.org/).

Alaska Stand Alone Gas Pipeline 5.20-92 Final EIS
Northern Economics, Inc. 2012. Fairbanks North Star Borough Gas Distribution System
Analysis. Prepared for the Fairbanks North Star Borough, June 29, 2012. FNSB Project
number: 11-PWDPRJ-02. Website: (http://www.co.fairbanks.ak.us/hottopics/
GasSystemDistributionAnalysis/FNSBGasDistributionSystemAnalysis-FinalReport-
June2012-Reduced.pdf) accessed August 29, 2012.
NRC. See National Research Council.
Office of Governor Sean Parnell. 2011. Susitna-Watana Hydro Project Gets Traction. Website
(http://gov.alaska.gov/parnell/press-room/full-press-release.html?pr=5853) accessed
August 18, 2011.
Peninsula Clarion. 2011. Escopeta announces significant natural gas discovery. Website:
(http://peninsulaclarion.com/news/2011-11-04/escopeta-announces-significant-natural-
gas-discovery) accessed November 14, 2011.
USACE. See U.S. Army Corps of Engineers.
USFWS. See U.S. Fish and Wildlife Service.
U.S. Army Corps of Engineers (USACE). 2011. Point Thomson Project EIS. Website:
(http://www.pointthomsonprojecteis.com/overview.htm) accessed May 12, 2011.
U.S. Bureau of Land Management (BLM) and U.S. Army Corps of Engineers (USACE). 1987.
Trans-Alaska Gas System (TAGS) Draft Environmental Impact Statement.
U.S. Bureau of Land Management (BLM) and U.S. Army Corps of Engineers (USACE). 1988.
Trans-Alaska Gas System (TAGS) Final Environmental Impact Statement. Website:
(http://www.tapseis.anl.gov).
U.S. Bureau of Land Management (BLM). 2002. Final Environmental Impact Statement -
Renewal of the Federal Grant for the Trans-Alaska Pipeline System Right-of-Way.
November.
U.S. Department of Energy (DOE). 2009. Alaska North Slope Oil & Gas Report. Website:
(http://www.netl.doe.gov/technologies/oil-gas/publications/AEO/ANS_Potential.pdf)
accessed March 21, 2011.
U.S. Fish and Wildlife Service (USFWS). 2010. EIS for the Proposed Land Exchange, Yukon
Flats National Wildlife Refuge (DOI FES 09-36, February 2010).
USGS. See U.S. Geological Survey.
U.S. Geological Survey (USGS). 2005. Oil and Gas Assessment of Central North Slope,
Alaska, 2005. Website: (http://pubs.usgs.gov/fs/2005/3043/) accessed March 21, 2011.
Web Center 11.com. 2011. Website: (http://www.webcenter11.com/news/local/story/Enstar-
Report/8THdBBnCR0ihsjuGbgxXOw.cspx) accessed August 13, 2011.

5.21 SHORT-TERM USE VERSUS LONG-TERM PRODUCTIVITY
Alaska Stand Alona Gas Pipalina FinalEIS
Alaska Stand Alone Gas Pipeline 5.21-1 Final EIS
5.21 SHORT-TERM USE VERSUS LONG-TERM PRODUCTIVITY OF THE
ENVIRONMENT
Proposed gas pipeline construction and operation would require short-term and long-term uses
of land and other resources. Short-term would be considered for the duration of the
construction period, and long-term would be for the life of the proposed Project (30 years). This
section examines and compares the proposed Project’s potential short-term uses of the
environment to the maintenance and enhancement of long-term environmental productivity.
5.21.1 Applicable Regulations
The National Environmental Policy Act (NEPA) states in Section 102 (42 United States Code
[U.S.C.] § 4332) that all agencies of the Federal Government shall:
(C) include in every recommendation or report on proposals for legislation and
other major Federal actions significantly affecting the quality of the human
environment, a detailed statement by the responsible official on –
(iv) the relationship between local short-term uses of man's environment and the
maintenance and enhancement of long-term productivity, and…
This portion of the NEPA recognizes that short-term uses and long-term productivity of the
environment are linked and that opportunities acted upon have corollary opportunity costs in
relation to foregone options and productivity that could have continuing effects well into the
future. This section examines short-term uses and long-term productivity together, according to
resource area. Sections 5.1 through 5.18 describe specific impacts to resource areas.
5.21.2 Short-Term Uses and Long-Term Productivity
The relationship between short-term uses and long-term productivity would not be appreciably
different for the proposed Project and Denali National Park Route Variation. There would be no
effect on short-term uses and long-term productivity under the No Action Alternative. However,
opportunities to include multi-use paths in the proposed Project design, to address issues raised
during public scoping, would not occur as a benefit to recreation under the No Action
Alternative.
5.21.2.1 Land Use
Construction of the proposed gas pipeline would convert undeveloped land and land used or
planned for public recreation, wildlife habitat, low-density residential development, light industrial
uses, agriculture, timber harvesting, and mining to a pipeline right-of-way (ROW). As allowable
land uses generally permitted within the permanent ROW would include agriculture, including
the use of farming equipment and the cultivation of row crops, and pastureland, impacts to

Alaska Stand Alone Gas Pipeline 5.21-2 Final EIS
these agricultural lands would generally be limited to the duration of proposed Project
construction and would not be expected to result in any long-term changes to land productivity.
The proposed Project has the potential to affect developed land by exposing residences or
commercial/industrial buildings located near the proposed Project ROW to dust and noise
primarily during construction. Sections 5.15 and 5.16 discuss effects related to dust and noise,
respectively. In addition to noise and dust effects, the proposed Project has the potential to
affect developed areas by hindering short- or long-term land uses on lands within or in near
proximity to the ROW. Some current land uses would be converted to long-term utility use for
the life of the proposed Project; this could alter productivity depending on the current land use.
For example, long-term conversion would put permanent constraints on development of private
land. To facilitate pipeline integrity management and safety inspection activities, the Alaska
Gasline Development Corporation (AGDC) would not permit permanent structures that are not
easily removed to remain on the permanent ROW. No dwellings could be placed within the
permanent ROW (52 feet on federal lands and 30 feet on state/private lands), which would be
maintained in an open condition for the life of the pipeline.
As described in Section 5.9, Land Use, timber acreage would be affected by the proposed
Project within the federal and state planning areas intersected by the ROW. After proposed
Project construction, those timber areas outside of the proposed Project permanent facilities
(i.e., permanent ROW, new access roads, and aboveground facility footprints) would be allowed
to revert to pre-project condition. Timber resources would not be restored within the proposed
Project’s permanent footprint; therefore, there would be a long-term loss or alteration of forest
land use to herbaceous areas or grasslands in these areas. The volume of commercial timber
within areas that would be cleared for the proposed Project ROW has not been quantified by a
timber survey.
As described in Section 5.11, Visual Resources, construction of the proposed Project could
result in short-term adverse effects on tourism and recreation, primarily attributed to a general
decline in recreation quality and restricted access in proximity to the pipeline route. These
impacts are of particular concern during the peak recreation seasons, including salmon fishing
in the spring and early summer and big game and waterfowl hunting in the fall. However, such
impacts would be localized along the pipeline route and would only last as long as the duration
of construction in any one area. A permanent ROW would be required (i.e., 52-foot ROW on
federal lands and 30-foot ROW on all other lands); however, because the pipeline would be
located underground, there would be no impacts on access to recreation features located along
the pipeline corridor and all existing public access points would be retained. No new public
vehicular access routes would be required for proposed Project operations, although there could
be opportunities to include multi-use paths in the proposed Project design to address issues
raised during public scoping. This would be a recreation benefit to the region.

Alaska Stand Alone Gas Pipeline 5.21-3 Final EIS
5.21.2.2 Water Resources
As described in Section 5.2, Water Resources, construction of the proposed Project would
result in short-term disturbances to surface water and floodplains. The proposed Project would
require a total of 1.09 billion gallons of surface water for construction ice workpads, ice access
road construction, ice armoring of snow roads, earthwork (dust control and compaction),
hydrostatic testing of the pipeline, and HDD crossing operations. Additional water will be
needed for cleanup of equipment at camps and material sites, and construction camp usage.
Use of surface water may result in alteration of surface water hydraulics or a new groundwater
recharge area. Any altered hydraulics due to use of surface water for construction purposes
would disappear after construction is complete.
Wetlands and surface waters that would be disturbed during construction would not recover in
the short-term, and long-term productivity related to those resources could be lost. After
construction has been completed, the temporary construction ROW would, over time, revert to
wetlands similar in type and function to those that existed prior to construction. Forested
wetlands would require more time to reestablish than shrub or herbaceous wetlands. The
permanent ROW would also support wetland vegetation and characteristics, but would be
altered in the long-term by maintenance and inspection activities. Vegetation height and density
would be limited, and forested wetlands would be converted to shrub wetlands within the
permanent maintained ROW. These changes would be long-term, lasting for the life of the
proposed Project and beyond. The acres of wetlands for each pipeline segment that would be
impacted within the temporary construction ROW and permanent ROW are identified by
hydrogeomorphic composition in Section 5.4, Wetlands.
Excavation in a waterbody during pipeline installation, permanent facility construction, or access
road construction might result in erosion within a streambed, causing a short-term increase in
sediment loading of surface water, or contamination of surface water due to excavation
equipment refueling leaks. After construction has been completed, it is assumed the streambed
would revert to pre-construction conditions. Features of the proposed Project would result in
other minor and short-term impacts to surface water, floodplains, and groundwater, as
described in Section 5.2, Water Resources. However, the addition of new bridges may result in
increased scour and erosion over the long-term due to altered hydraulics, leading to a long-term
increase in sediment loading in surface water.
Placement of fill for pipeline or aboveground facility installation may result in a reduction in flood
storage capacity (if within a floodplain). This could cause increased upstream stages due to
backwater effects. Short-term disturbance would be limited to construction impacts.
Construction of the proposed Project is not expected to cause long-term effects on stream flow,
stream profile, or structural components of streams or waterbodies, as described in Section 5.2,
Water Resources.

Alaska Stand Alone Gas Pipeline 5.21-4 Final EIS
5.21.2.3 Biological Resources
Proposed Project construction would result in some short- and long-term impacts to plant
communities and fish and wildlife resources. Several federally protected species under the
jurisdiction of the U.S. Fish and Wildlife Service (USFWS) and National Marine Fisheries
Service (NMFS) were identified that could be potentially affected by the proposed Project. No
species listed by the Endangered Species Act (ESA) under jurisdiction of the NMFS were found
to be potentially affected by the proposed Project; however one species protected by the Marine
Mammal Protection Act, the polar bear, occurs within the proposed Project area.
During construction, vegetation would be removed in the footprint of the proposed pipeline,
which includes the construction ROW, access roads, and associated aboveground facilities, and
potentially in some staging areas. Plant communities in those areas would be considerably
altered. Vegetation loss and/or changes would be short-term in some areas and long-term in
others, depending on the type of vegetative cover. As described under Water Resources,
vegetation in the permanent ROW would be permanently altered by maintenance and
inspection activities. Natural recovery and assisted restoration of vegetation would take place
outside the permanent ROW after construction activities ceased. However, some vegetation,
such as forests, would require from 25 to 150 years to regenerate, which would be considered a
permanent conversion and long-term habitat loss even with restoration. The largest potential
impacts along the route would include clearing of up to approximately 10,507 acres of
vegetation within the construction ROW and for aboveground facilities and access roads.
As described in Section 5.5, Wildlife, most of the proposed Project (85 percent) falls within four
game management units (GMUs): 20, 26, 24, and 13. Habitats crossed by the proposed Project
support a diversity of wildlife, including big game animals, small game animals and furbearers,
waterfowl and game birds, and many other nongame animals. In general, construction-related
impacts to wildlife would include long-term habitat loss; long- and short-term habitat alteration
and fragmentation; direct mortality during construction and operation; altered hunting mortality
patterns due to altered human access; indirect mortality because of stress or avoidance of
feeding due to exposure to construction and operations noise, low-level helicopter or airplane
monitoring over flights, and from increased human activity; reduced breeding success from
exposure to construction and operations noise; reduced survival or reproduction due to
decreased abundance of forage species or reduced cover; and altered survival, mortality, or
reproduction due to exposure to equipment fuel or lubricants spilled during construction or
maintenance. Construction would occur mostly during the winter months or along existing and
disturbed corridors. Timing windows for construction would also be required to further mitigate
any short- and long-term impacts.
Construction within the mainline and Fairbanks Lateral ROW (including TEWs) would result in
removal or modification of about 8,575 acres of wildlife habitats; vegetation cover would be
reestablished within the ROW after construction. Trees would not be allowed to reestablish
over the pipeline, and because of the time required for regrowth of mature forests, conversion of
forested habitats to herbaceous or scrub shrub would be considered a permanent habitat
impact, and could result in resource productivity alternations. Forest nesting and burrow
Alaska Stand Alone Gas Pipeline 5.21-5 Final EIS
habitats for red squirrels and birds would be lost. However, clearing forest in some areas would
allow for establishment of shrubs and forbs that could provide forage for moose and bears; this
would be a change in productivity. Construction of the segment from Willow to the extraction
plant would result in fragmentation of forested habitats and would open a travel corridor that
would likely facilitate hunter access in this area, leading to additional changes in productivity.
As described in Section 5.8, Threatened and Endangered (T&E) Species, federally protected
threatened or endangered species and federal candidate species with the potential to occur in
the proposed Project area include nine marine mammals (bearded seal, bowhead whale, Cook
Inlet beluga whale, fin whale, humpback whale, Pacific walrus, ringed seal, polar bear, and
Steller sea lion), one terrestrial mammal (wood bison), four birds (Eskimo curlew, Spectacled
eider, Steller’s eider, and yellow-billed loon) and two fish species (Chinook salmon and
Steelhead trout ESUs). The analysis presented in Section 5.8, T&E Species concluded that
short-term disturbance could occur to several of these species, but effects would not be long-
term adverse.
Primary direct effects to fisheries from proposed Project construction and operation would
include increased erosion and sedimentation from removal of riparian vegetation, loss or
alteration of stream and riparian habitats due to placement of structures, alteration of stream
and wetland hydrology, and blockage of movements. Placement of the buried pipeline across
specific fish-bearing streams during construction is likely to have the greatest potential effect to
the fishery resources of the proposed Project area. Pipeline construction would most likely
cause short-term disturbances to fishery resources. The extent of impacts would depend on the
alternative and type of crossing. Long-term impacts resulting in changes to productivity are not
expected.
5.21.2.4 Air Quality
Section 5.16, Air Quality, describes estimated emissions that would result from construction and
operation of the proposed Project. Air quality effects associated with construction of the
proposed Project mainline would include emissions from fossil-fuel fired construction equipment,
fugitive dust, and open burning. Because pipeline construction moves through an area
relatively quickly, air emissions typically would be localized, intermittent, and short-term.
Emissions from construction equipment combustion, fugitive dust, and open burning would be
controlled to the extent required by the Alaska Department of Environmental Conservation
(ADEC). The proposed Project emissions from mainline construction-related activities would
not significantly affect local or regional air quality over the long-term.
Over the long-term, the proposed Project would have a beneficial effect on air quality in the
Fairbanks area, which currently is in non-attainment status for particulates due to the use of oil,
coal, and wood for home heating. The Fairbanks Lateral (a component of the proposed Project)
would deliver 60MMscfd of natural gas for use in the Fairbanks area. A pipeline distribution
system and possibly new facilities that compress natural gas for distribution by storage tanks
would be required. Conversion or retrofit of power generation and heating facilities could also
Alaska Stand Alone Gas Pipeline 5.21-6 Final EIS
take place to allow for burning of natural gas. Replacement of existing fuels with cleaner
burning natural gas could improve overall air quality in the Fairbanks area.
5.21.3 Conclusion
The short-term use of a resource versus the preservation of its long-term use or productivity
considers converting the renewable nature of a resource (e.g., land, water, habitat, air) to a
developed use that can have relatively short economic life. Generally, short-term refers to the
useful life of the project. Long-term refers to the time beyond the lifetime of the project. Impacts
that narrow the range of beneficial uses of the renewable resources are usually of primary
concern as discussed in the above sections. For a complete discussion on the direct and
indirect impacts of the proposed Project on all resources, please see Sections 5.1 through 5.20
of this document.

5.22 IRREVERSIBLE AND IRRETRIEVABLE COMMITMENT OFRESOURCES
'S Alaska Stand Alone Gas Pipeline Final lOIS

Alaska Stand Alone Gas Pipeline 5.22-1 Final EIS
5.22 IRREVERSIBLE AND IRRETRIEVABLE COMMITMENT OF RESOURCES
To facilitate comparison of project alternatives, the National Environmental Policy Act (NEPA)
requires a consolidated discussion of environmental consequences to focus on any irreversible
and irretrievable commitments of resources. This section describes the effects of the proposed
Project in relation to such irreversible and irretrievable commitments of resources. An
irreversible commitment of resources represents a loss of future options and applies primarily to
the use of nonrenewable resources, such as cultural resources or fossil fuels, and to resources
renewable only over a long period of time. An irretrievable commitment of resources represents
opportunities foregone for the period of the proposed action and relates to the use of renewable
resources, such as timber or human effort, and to other utilization opportunities foregone in
favor of the proposed action.
5.22.1 Applicable Regulations
NEPA section 102 (42 United States Code [U.S.C.] § 4332) and Council on Environmental
Quality regulations (40 Code of Federal Regulations [C.F.R.] § 1502.16) require that all
agencies of the Federal Government shall:
(C) include in every recommendation or report on proposals for legislation and
other major Federal actions significantly affecting the quality of the human
environment, a detailed statement by the responsible official on –
(v) any irreversible and irretrievable commitments of resources which would be
involved in the proposed action should it be implemented.
5.22.2 Resource Commitments
Implementation of the proposed action would result in the commitment of natural and man-made
resources for a gas pipeline and support facilities construction and operation. Sections 5.1
though 5.17 describe the potential impacts on physical, biological, and human resources by
specific resource area. The commitment of resources would be generally similar for the
proposed action and the action with the Denali National Park Route Variation or Yukon River
Crossing Option. This section does not address the No Action Alternative because there would
be no irreversible and irretrievable commitment of resources related to the proposed Project
under that alternative.
5.22.2.1 Construction Materials and Labor
If the proposed Project is implemented, it would require the commitment of large amounts of
construction materials. Sands, gravels, rip rap, and other materials would be required at various
locations for infrastructure, pad construction, and production and ancillary facilities along the
proposed Project right-of-way (ROW). The Alaska Gasline Development Corporation (AGDC)
has estimated that approximately 13.1 million cubic yards of material could be required for total

Alaska Stand Alone Gas Pipeline 5.22-2 Final EIS
construction of the proposed Project. These sand and gravel resources would likely be
irretrievable for the lifetime of the proposed Project. However, should the proposed Project be
decommissioned at some future date, some amount of these materials could likely be salvaged
for reuse. Sand and gravel sites along the proposed Project ROW would provide needed
borrow material. Geotechnical data regarding material availability is in development; however, a
total of 546 existing material sites along the main alignment have been identified using existing
Alaska Department of Transportation & Public Facilities (DOT&PF) material site information
sources. As identified in Table 5.1-3, approximately 93.7 million cubic yards of material
(36.7 million of which are from open active sites) are available to provide the total of 13.1 million
cubic yards that would be needed for the mainline construction. Prior to excavation of needed
sand and gravel resources from borrow sites, selected based on geotechnical investigations
that would occur later in the proposed Project design process, assessments of the site-specific
impacts of borrow excavation would occur as part of the permitting process with Alaska
Department of Natural Resources (ADNR) and other agencies. Prior to site development,
during detailed construction and permitting efforts, Material Site Mining Plans and Reclamation
Plans would be developed specific to each material site and submitted for agency approval.
These plans would include information describing habitat types, access locations, temporary
stockpile areas, excavation limits and depths, archaeological and environmental information,
and site restoration planning. Reclamation Plans specific to each material site that would detail
the actions necessary to return the site to a stable condition would be developed and submitted
for agency approval. At this time, material sites are not under consideration for waste disposal
sites. Human effort would be irretrievably committed during the proposed Project planning,
construction, and operation phases. The commitment of time and available labor to design,
construct, and maintain the proposed Project would represent an irretrievable commitment of
resources.
5.22.2.2 Physical Setting
Irreversible impacts to the physical setting would be associated with maintenance of access in
the ROW, various landform changes including earthwork and rock formation alteration, pipeline
markers, and new aboveground structures located along the route such as compressor stations,
mainline valves, pig launchers/receivers, and a straddle and off-take facility. Operations
structures would also be located at the northern and southern end points of the route: at the
northern starting point there would be a gas conditioning facility, and at the southern terminus
there would be a NGL extraction facility.
Nearly the entire proposed Project would follow existing utility rights-of-way and roads. Many of
the new structures and landform and vegetation changes during construction and operation
would occur along the major transportation corridors in the vicinity of the proposed Project,
including the Dalton Highway and the Parks Highway as well as railroad and river corridors.
During the final stages of construction, backfilling and grading would restore the construction
ROW to its approximate previous contours, and reclamation and re-vegetation would ultimately
return the ROW to its approximate previous condition, except in currently forested areas.

Alaska Stand Alone Gas Pipeline 5.22-3 Final EIS
Material sites would cease to be operated by the AGDC during the operations and maintenance
phase of the proposed Project. Prior to development, the AGDC would develop a Material Site
Reclamation Plan. Following reclamation, the visual impact of material sites would be reduced
by restoration of the area with native vegetation and re-grading construction disturbances to a
condition that blends with the surrounding terrain and surface drainage patterns.
5.22.2.3 Water Resources
The proposed Project would require a total of 1.09 billion gallons of surface water for
construction ice workpads, ice access road construction, ice armoring of snow roads, earthwork
(dust control and compaction), hydrostatic testing of the pipeline, and horizontal directional
drilling (HDD) operations. Additional water would be needed for cleanup of equipment at camps
and material sites, and construction camp usage. During operations, minimal water use would
be required for compressor station operation.
5.22.2.4 Biological Resources
Vegetation and habitats in the permanent pipeline ROW would be altered due to the
requirements of maintenance and inspection activities. The presence of aboveground facilities
would alter vegetation and habitats, resulting in changes to use patterns for wildlife. In addition,
disturbance of areas for temporary construction activities could result in changes to habitats that
would be irreversible over the long term. The permanent alteration of vegetation resources and
wildlife habitat along the ROW and at associated facilities could represent an irreversible
commitment of biological resources for the life of the proposed Project and beyond if areas are
not restored, or if former vegetation cover and composition did not recover. Losses of wildlife
during pipeline construction and operation would represent an irretrievable commitment of
biological resources. Potential impacts to wetlands and riparian habitats due to proposed
Project construction would represent an irreversible rather than irretrievable commitment of
resources if these resources were not restored following abandonment.
As described in Section 5.9, Land Use, approximately 4,500 acres of forested lands that could
contain timber resources would be affected by construction of the mainline and Fairbanks
Lateral ROW, including Temporary Extra Workspaces (TEWs). After proposed Project
construction, those timber areas outside of the proposed Project’s permanent facilities (i.e.,
permanent right-of-way, new access roads, and aboveground facility footprints) would be
allowed to revert to pre-project condition. Timber resources would not be restored within the
proposed Project’s permanent footprint; therefore, there would be a long-term conversion and
irretrievable loss of approximately 1,339 acres of forested land within the permanent ROW that
could contain timber in these areas. The volume of commercial timber within areas that would
be cleared for the proposed Project ROW has not been quantified by a timber survey.

Alaska Stand Alone Gas Pipeline 5.22-4 Final EIS
5.22.2.5 Cultural Resources
As described in Section 5.13, cultural resources (archaeological sites, historic trails, structures
and sites, cultural landscapes, and traditional cultural properties) are nonrenewable resources,
and any loss of such resources would be irreversible and irretrievable.
If cultural resources in the area of potential effects were found to meet National Register of
Historic Places inclusion criteria, compliance with Section 106 regulations also would include an
application of the criteria of adverse effect (36 C.F.R. § 800.5). The U.S. Army Corps of
Engineers (USACE) is currently consulting with 22 federally recognized tribes in the vicinity of
the proposed Project to assist with evaluation of potential cultural resources to determine their
eligibility for inclusion on the National Register of Historic Places, to assess potential effects to
eligible cultural resources from the proposed Project and to minimize impacts to cultural
resources in the area of potential effects. The proposed Project would intersect and affect
historic trails, and known cultural resources within the ROW. The proposed Project ROW and
aboveground permanent facilities would potentially directly impact 37 known cultural resources
and potentially impact an additional 693 sites outside the ROW, but within 1 mile of the ROW
centerline. The proposed Project ROW would cross 23 historic trails, and there would be 13
additional trails within 1 mile of the ROW. The Denali National Park Route Variation would not
directly impact any reported sites, and 12 sites would fall within the area of indirect effects. No
historic trails would be crossed within this segment. An option to cross the Yukon River would
be to utilize the existing E. L. Patton Bridge on the Dalton Highway. The pipeline infrastructure
would hang below the bridge surface and would not result in additional impacts to cultural
resources or historic trails.
5.22.2.6 Land Use and Ownership
Proposed pipeline construction and operation would require permanent commitment of land for
the ROW, access roads, and associated aboveground facilities. Land owners in the study area
include the federal, state, and municipal governments, private citizens, and Native Corporations
established under the Alaska Native Claims Settlement Act of 1971, 43 U.S.C. § 1601, and land
given to an authorized individual Indian, Aleut, or Eskimo in Alaska under the Native Allotment
Act of 1906, 43 U.S.C. § 270. Table 5.22-1 identifies, by land owner type, the maximum amount
of acreage within the 100 foot proposed construction ROW. As described in Section 5.21,
Long-Term Versus Short-Term Productivity of the Environment, construction of the proposed
Project would convert undeveloped land and land used or planned for public recreation, wildlife
habitat, low-density residential development, light industrial uses, agriculture, timber harvesting,
and mining to a pipeline ROW. As allowable land uses generally permitted within the
permanent ROW would include agriculture, including the use of farming equipment and the
cultivation of row crops, and pastureland, impacts to these agricultural lands would generally be
limited to the duration of proposed Project construction. However, some current land uses
would be converted to long-term utility use for the life of the proposed Project. The long-term
conversion would put permanent constraints on development of private land. To facilitate
pipeline integrity management and safety inspection activities, it is assumed that the AGDC
would not permit permanent structures that are not easily removed to remain on the permanent

Alaska Stand Alone Gas Pipeline 5.22-5 Final EIS
ROW. No dwellings could be placed within the permanent ROW, which would be maintained in
an open condition for the life of the pipeline.
TABLE 5.22-1 Land Ownership Affected by the Construction ROW (Acres)
Segment Federal State Private Municipal/ Borough
Native Allotments
Native Corporation Water
Construction ROW
GCF to MP 540 1515.1 4957.9 49.1 234.2 24.7 57.6 20.5
Fairbanks Lateral 0 232.5 86.0 98.7 0 0.0 0
MP 540 to MP 555 0 233.3 7.6 0 0 208.1 0
MP 555 to End 3.7 1951.3 44.2 112.2 8.9 58.2 20.4
Temporary Extra Workspaces
TEW GCF to MP 540 323.8 311.7 10.1 21.1 5.9 12.0 0.8
TEW MP 540 to MP 555 0 19.5 0 0 0 9.9 0
TEW MP 555 to END 2.2 187.9 16.9 28.4 3.6 21.7 3.1
Proposed Action Total 1844.7 7894.0 213.9 494.6 43.1 367.0 44.6
Denali National Park Route Variationa
95.3 67.8 0 0 22.4 0 0
a Denali National Park Route Variation source Alaska General Land Status (Alaska State Geo-spatial Data Clearinghouse DNR July 2011)
Note: Totals may not sum due to rounding.
Source: Landownership provided by AGDC, June 2012.
If the AGDC selects the Yukon River Existing Bridge Option, which would use the existing
bridge to cross state waters, the construction ROW would affect less land than under the
suspension bridge option or the HDD method.
5.22.2.7 Energy Resources
All proposed Project construction activities would consume fuel, mostly in the form of diesel.
This would be an irreversible use of nonrenewable fossil fuels.

Alaska Stand Alone Gas Pipeline 5.22-6 Final EIS
This page intentionally left blank.
Alaska Stand Alone Gas Pipeline
5.23 MITIGATION MEASURES
FinalEIS
Alaska Stand Alone Gas Pipeline 5. 23-1 Final EIS
5. 23 MITIGATION
This section summarizes the mitigation measures proposed by the AGDC to reduce the risk of environmental degradation, injury or harassment of animals, and the risk of negative effects on people during construction and operation of the proposed Project.
5.23.1 Introduction
The proposed Project is currently in the conceptual stage of analysis to determine the feasibility of the proposed Action. The details of each Mitigation Measure and Plans implemented for each resource have not been fully developed at this time. This document briefly describes the regulatory environment under NEPA, the stipulations and plans required under the Right-of-Way Lease by the State of Alaska, and a list of federal, state, and borough permits. Consultations between the AGDC and the appropriate agency staff would occur regularly to produce site and resource-specific mitigation plans to reduce impacts as much as practicable. These mitigation plans would define the process used to reduce impacts to resources and identify criteria to be able to rank the level of success of the mitigation efforts.
The AGDC has committed to the following mitigation measures included under each resource, to reduce potential impacts to the human and natural environments from construction and operation of the proposed Project. Each mitigation measure has been analyzed to describe its purpose or scope, in addition to its effectiveness.
5.23.1.1 Regulatory Environment
NEPA Analysis
Under NEPA, mitigation measures must be analyzed “even for impacts that by themselves would not be considered significant” (CEQ 1981). Mitigation measures must be analyzed for effectiveness for proposed impacts of the proposed Project.
Mitigation, as defined by CEQ (43 FR 56003), includes any of the following:
a) Avoiding the impact altogether by not taking a certain action or parts of an action;
b) Minimizing impacts by limiting the degree or magnitude of the action and its implementation;
c) Rectifying the impact by repairing, rehabilitating, or restoring the affected environment;

Alaska Stand Alone Gas Pipeline 5. 23-2 Final EIS
d) Reducing or eliminating the impact over time by preservation and maintenance operations during the life of the action; and
e) Compensation for the impact, by replacing or providing substitute resources or environments.
Right-of-Way-Lease
The AGDC entered into the Right-of-Way (ROW) Lease with the State of Alaska on July 25, 2011 (Appendix M). The ROW Lease requires AGDC to comply with extensive stipulations (Exhibit A) of the Right-of-Way Lease under the provisions of AS 38.35 the Alaska Right of Way Leasing Act. These stipulations (Exhibit A, 1.4.3) include a list of 22 plans that AGDC must submit for approval for construction, operation, maintenance, and termination of the proposed Project. An example of some of the plans required includes:
• Erosion and Sedimentation Control;
• Timber Clearing, Salvage and Utilization;
• Stream, River, and Floodplain Crossings (Stipulation 3.13);
• Restoration and Revegetation of Disturbed Areas;
• Control, Cleanup, and Disposal of Hazardous Substances; and
• Construction in Wetlands.
In addition to the 22 plans, a Design Basis and Criteria document, Corrosion Plan, Engineering Analysis and Report on the Seismic Design of the Pipeline, and a Seismic Analysis of Pipeline Communication Systems are required. An approved Quality Assurance Program (QAP) (Exhibit A, 1. 4. 4) is also required and would be in effect during all phases of construction, operation, maintenance, and termination activities. The QAP must be comprehensive and comply with all stipulations, to assure the safety and integrity of the pipeline.
Federal, state, and borough permits or authorizations for each proposed activity would be issued to the AGDC prior to each activity and must be held in good standing for so long as the permits are required for activities pursuant to rights granted under the ROW lease during the term of the lease.
Federal, State and Borough Permit Requirements
The AGDC is required to apply for, be approved, and maintain in good standing, more than 50 permits for design and construction of the proposed Project (Table 5.23-1; list of permits provided at the end of this chapter). Additional permits may be identified as the planning and design phase continues. Federal, state, and borough permits compiled by the AGDC for the proposed Project are summarized in Table 5.23-1. The list of federal, state, and

Alaska Stand Alone Gas Pipeline 5. 23-3 Final EIS
borough permits was compiled from the Alaska Gas Pipeline Project Office and the Office of the Federal Coordinator for Alaska Natural Gas Transportation Projects.
The AGDC has created a tracking database (Permit Management System Database) which tracks the status of permits and is updated regularly and maintained on the AGDC intranet site. The permit tracking system would be used to track implementation and success of imposed mitigation measures. The ASAP database includes:
• Information on all permit applications, final permits, and permit requirements;
• Scheduling and tracking information to manage permits;
• Information about the status of permit applications;
• Items that need to be completed as part of permit applications, including information needed in permit applications or submittals;
• Items that must be included as part of permit application submittals;
• Requests for additional information from agencies;
• Agency contact information; and
• Record of all contacts with agencies regarding permits.
The AGDC has also developed a Permit Acquisition and Management Plan to:
• Identify the regulatory framework for the proposed Project, including the permits and authorizations needed;
• Present an overall strategy for permitting, including the following:
o Determine the information necessary to complete permit applications;
o Provide a strategy for coordinating with regulatory agencies;
o Provide a tracking system for permit applications and requirements; and
• Establish procedures for assuring compliance with all proposed Project permits.

Alaska Stand Alone Gas Pipeline 5. 23-4 Final EIS
5.23.2 Affected Resources
In the following section, for each environmental resource category previously analyzed, the potential environmental impacts from the proposed Project are summarized, followed by (i) a detailed description of each of the associated mitigation measures proposed by the AGDC, (ii) an analysis of how the proposed mitigation would address potential adverse impacts, and (iii) an assessment of the effectiveness of the proposed mitigation. The draft ElS (DEIS) provided a list of applicant-proposed mitigation measures and other mitigation identified as additional recommended mitigation (ARMs) at the end of each resource impact subsection. However, comments were received that the discussion of mitigation was hard to understand because it was split into multiple sections. Some of the ARMs were duplicative of regulatory requirements or mitigation proposed by AGDC and it was determined the proper forum for additional mitigation or recommended conditions to be considered would be during the permitting process. Therefore, only applicant proposed mitigation measures are analyzed in the final EIS (FEIS). Additionally there was no accompanying analysis or effectiveness assessment provided within the DEIS. Section 5.23 responds to these comments received on the DEIS, by consolidating consideration of mitigation into a single section, by eliminating duplication and redundancy, and by providing analysis and assessment of effectiveness with respect to proposed mitigation measures.
5.23.2.1 Soils and Geologic Resources
The following geomorphic processes and features would be encountered in the proposed Project area: mass wasting (gravity-driven actions such as avalanches, rock falls, slides, and slumps, as well as solifluction in cold regions); permafrost degradation/aggradation and frost action; and seismicity. Geomorphic processes such as these must be considered in pipeline engineering, design, siting and construction because these processes have the potential to impact pipeline stability and operations.
AGDC Proposed Mitigation Measures
Mitigation measures that would be implemented by the AGDC during construction and operations of the proposed Project include:
1. Design Considerations: a) Special installation techniques and foundations;
b) Earthquake mitigation measures and special design considerations at fault crossings;
c) Special design considerations at river crossings;
d) Erosion control measures, to include an Erosion Control Plan; and
e) Development of a Storm Water Pollution Plan.
Alaska Stand Alone Gas Pipeline 5. 23-5 Final EIS
Analysis a) Foundation systems may include standard spread footings, reinforced concrete
slabs, drilled shafts, and piers according to structure, location, and soil conditions.
b) The AGDC is working with the Alaska Division of Geological and Geophysical Surveys (DGGS) to identify active fault crossings and determine expected lateral and vertical displacements in the event of a seismic event. Typically, the pipeline would be above ground at active fault crossings and placed on sleepers (concrete or steel supports laid on the ground surface) that would allow the pipeline to move during an earthquake.
c) The open cut method was designated for all stream crossings where engineering, environmental, or economic constraints were not prohibitive. Primary factors used to determine whether methods other than open cut method would be used include:
o Engineering: Stream depth, flow, and surrounding terrain;
o Environmental: Presence of anadromous and resident fish and guidance from the Alaska Department of Fish and Game (ADF&G) and the U. S. Fish and Wildlife Service (USFWS); and
o Economic: At several locations, such as Hurricane Gulch, localized terrain prohibits all but an aerial crossing mode for the current alignment, and rerouting the alignment would not be cost-effective.
d) Probable erosion control measures include the following:
o Flow control/diversion: Culverts, fords, swales, hardened or fabric-lined channels, bypass pumps, and settling basins for pumped effluents;
o Sediment control: Silt fencing, silt bags, straw bales and/or logs, and silt ditches and check dams;
o Impervious dikes: Sand bags, prefabricated dams, sheet piles, riprap with impervious fabric; and
o Ground stabilization: Seeding and mulching, erosion control blankets, jute matting or other rolled products, synthetic turn protection, and riprap.
e) The AGDC would develop a Storm Water Pollution Prevention (SWPP) Plan (SWPP) in accordance with the Alaska Pollutant Discharge Elimination System (APDES). The Alaska Department of Environmental Conservation (ADEC) publishes a template that provides guidance on the content of a SWPP Plan1.
1 Available at http://dec. alaska. gov/water/wnpspc/stormwater/sw_construction. htm.
Alaska Stand Alone Gas Pipeline 5. 23-6 Final EIS
o In addition to a detailed project description and general administrative information, the SWPP Plan usually includes the following:
i. Description of construction activities;
ii. Pollutant discharge information;
iii. Description of best management practices (BMPs), including:
iv. Minimizing exposed soil during construction activity;
v. Maintaining natural buffer areas;
vi. Controlling storm water discharges and flow rates, and protecting storm drain inlets;
vii. Stabilizing construction vehicle access and exit points;
viii. Using sediment basins;
ix. Implementing good housekeeping measures;
x. Inspection schedules;
xi. Monitoring plan;
xii. Plan maintenance; and
xiii. Appendices that include the proposed Project schedule, site/route maps, BMP detail drawings/figures, grading and stabilization records, and inspection records.
Effectiveness a) The AGDC would install certified and structurally sound foundations appropriate for
the soils and environmental conditions of the area. Engineers would be on site as foundations are installed for quality control purposes and approval. The latest and best technology for reducing impacts to and preventing soil erosion when installing structures would be conducted to the extent most practicable.
b) Experts in designing the pipeline crossings over fault locations would be employed to install the most technologically sound support structures available at these locations. All structures would be tested and approved for all situations for earthquake activity in these areas.
c) Stream crossings would be constructed as per agency permit requirements implemented later in the process. Each stream crossing would be constructed during a time and method that ADF&G determines, to the extent most practicable, would be have the least impact to fish and their habitat in consultation with the AGDC.

Alaska Stand Alone Gas Pipeline 5. 23-7 Final EIS
d) Appropriate erosion control measures would be installed dependent on the environmental conditions of the area. An Erosion and Sedimentation Control Plan is included as Stipulation 1.4.3 (f) under the ROW Lease (Appendix M, Exhibit A).
e) The AGDC would produce a thorough SWPPP from the ADEC guidance document noted above. Development of a plan that follows EPA guidance would manage and reduce impacts as much as possible from storm water discharge, as it would occur in the construction areas.
2. Operational Considerations: a) Slope stability monitoring;
b) Seismic/earthquake monitoring;
c) River hydrology monitoring;
d) O&M Manuals;
e) Quality Assurance Manual;
f) Inspection Services Manual;
g) Design Basis Updates;
h) Surveillance Manual;
i) Environmental Management System Compliance Manual; and
j) Other controls to be determined.
Analysis a) Cut/fill slopes would be monitored by construction inspectors and field engineers on
the ground, primarily through visual observation, and would not require the use of specialized equipment. Specific frequency and longevity of inspections would be developed in the project quality documentation, as described below under “Quality Assurance Manual” (e). This would likely vary depending on soil conditions and on the severity and sensitivity of the slopes. Inspections would become less frequent over time.
b) The AGDC’s seismic design provisions would include an earthquake monitoring system that would be integrated into the University of Alaska statewide seismic monitoring system and would include the following elements:
o A network of ground-motion detectors to continuously detect and instantaneously report events near the pipeline approaching the level of the design contingency earthquake (DCE);
o An automatic programmed shutdown of the pipeline when an event near the pipeline approaches the level of the DCE;

Alaska Stand Alone Gas Pipeline 5. 23-8 Final EIS
o An automatic generation of a post-event inspection checklist targeting the facilities most affected by the location of the event; and
o Monitoring would be continuous for the life of the proposed Project.
c) The pipe would be inspected according to the requirements of the Operations and Maintenance (O&M) Manual required by the U.S. Department of Transportation (DOT) as described below under “O&M Manual.” This would include checking the crossings to ensure pipe integrity and maintenance of streambed morphology. Field checks of river crossings would be more frequent directly after construction to ensure stabilization of the crossings. Visual surveillance of river crossings would occur during regular pipeline surveillance, and the frequency of inspections would be determined during detailed design.
d) The AGDC would develop an O&M Manual in accordance with U.S. DOT regulations contained in 49 CFR 192. Specific requirements are contained in §192.605, “Procedural manual for operations, maintenance, and emergencies,” which requires that O&M manuals cover the following:
o Maintenance and normal operations:
i. Operating, maintaining, and repairing the pipeline in accordance with DOT regulations.
ii. Making construction records, maps, and the operating history available to appropriate operating personnel.
iii. Gathering of data needed for reporting.
iv. Startup and shutdown procedures to assure operations within the maximum allowable operating pressure.
v. Maintaining compressor stations.
vi. Starting, operating, and shutting down gas compressor units.
vii. Procedures for protecting personnel in trenches for unsafe accumulations of vapor or gas, including rescue equipment.
viii. Systematic and routine testing and inspection of pipe-type or bottle-type holders.
ix. Prompt response to report gas odors in a building.
x. Implementing applicable control room management procedures.
o Abnormal operation.
o Safety-related condition reports.
o Surveillance, emergency response, and accident investigation.

Alaska Stand Alone Gas Pipeline 5. 23-9 Final EIS
e) The Quality Assurance (QA) Manual would define the following:
o Authority, roles, and responsibilities;
o Standards of quality for the proposed Project;
o Procedures for implementing quality standards;
o Codes, standards, and regulations;
o Training requirements;
o Inspection requirements;
o Preventative and corrective actions;
o Document control and record keeping; and
o Management review and internal auditing.
f) This is a sub-part of the O&M Manual described above that detail how and when inspections are to be carried out.
g) The Design Basis for the project would be updated as needed.
h) As part of the O&M Manual described above, each operator would have a procedure for continuing surveillance of their facilities to determine and take appropriate action concerning changes in class location, failures, leakage history, corrosion, substantial changes in cathodic protection requirements, and other unusual operating and maintenance conditions.
i) The AGDC would develop an Environmental Management System (EMS) for construction and operation. The framework for the EMS would be the one developed by the International Organization for Standardization (ISO) for the ISO 14001 standard. The AGDC’s EMS would cover subjects such as the following:
o Environmental policies, objectives, and targets to reduce environmental impacts and comply with legal requirements.
o Compilation of legal and other requirements, along with compliance tracking procedures.
o Organizational structure and responsibilities.
o Programs to meet the objectives and targets, including training, communication procedures and information to employees and contractors, documentation of written plans and procedures, document control, operational programs, and emergency preparedness.

Alaska Stand Alone Gas Pipeline 5. 23-10 Final EIS
o Steps to monitor and measure progress in achieving the objectives, including audits and inspections.
o Incident investigation and corrective action.
o Review of the EMS and implementation of improvements.
Effectiveness Inspectors and engineers would monitor the stability of the slopes over time, and follow a quality assurance plan developed by the AGDC. Monitoring would occur as frequently as needed to confirm that the developed slopes are stable, to reduce the likelihood of sloughing of soils or erosion. This mitigation measure would reduce the likelihood of sloughing and erosion of sloped banks. Regular monitoring would reduce impacts to soils from erosion prone areas not being detected or maintained properly. Impacts from soil erosion would be reduced substantially from following regular monitoring controls.
5.23.2.2 Water Resources
The proposed Project would intersect and withdraw water from numerous waterbodies found throughout the proposed Project corridor for construction activities. Potential impacts to water could include sedimentation, changes to water quality, and temporary or permanent changes to fluvial geomorphology. The AGDC has committed to the following measures for mitigating potential impacts to surface and groundwater resources from construction and operation of the proposed Project.
AGDC Proposed Mitigation Measures
1. Minimize the Number of River and Stream Crossings: a) Use existing bridges where feasible; and
b) Use horizontal directional drilling (HDD) or other trenchless technology to minimize disturbance to waterbodies.
Analysis Existing bridges would be used as noted in Section 5.2, Water Resources, with the potential for development of a new bridge across the Yukon River. Trenchless technology would be considered for crossing a stream that has defined banks, contains resident or anadromous fish, is important for spawning, and where an isolated open cut is not feasible.
Effectiveness The AGDC would reduce impacts to water resources by minimizing the number of rivers and streams to be crossed. No structures would be placed below the ordinary high water mark in any bridge crossing. This would reduce impacts from scouring and turbidity, and therefore impacts to fish resources.

Alaska Stand Alone Gas Pipeline 5. 23-11 Final EIS
2. Maintain, to the Maximum Extent Practicable, the Existing Surface Water Hydrology at all Waterbody Crossings:
a) Prevent discharges that have the potential to adversely affect waterbodies;
b) Stabilize cut slopes immediately when the designed grade is obtained;
c) Initiate reclamation of disturbed areas as soon as practicable; and
d) Ensure water withdrawals meet federal and state standards and guidelines.
Analysis The following stormwater discharge, stabilization/reclamation, and water withdrawal measures would be implemented to maintain surface water hydrology:
a) Storm water discharges would be managed in accordance with the SWPP Plan discussed above under Soils and Geology. In addition, fuel storage, equipment fueling, and equipment maintenance operations would be located at least 100 feet from surface waters. Hydrostatic test water containing freeze depressants would not be discharged into waterways. Other discharges to streams would not occur unless authorized by permit.
b) Stabilizing cut slopes would involve the placement of erosion control measures in accordance with the AGDC Erosion Control Plan. Such measures would include temporary seedings, erosion control mats, grading, etc. See the discussion of the plan under Soils and Geology mitigation measure #1 above.
c) Disturbed areas would be stabilized during construction to prevent wind or water erosion. Stabilization practices, as determined by the needs for specific sites, would include placement of mat binders, soil binders, rock, or gravel blankets or structures. Reclamation of disturbed sites would begin as soon as practicable once the site was no longer needed for construction. The timing would be determined in consultation with state and federal agencies.
d) Water withdrawal limits would follow federal and state permits based on water volumes and fish presence for each lake.
Effectiveness Implementing the above measures would reduce chemical pollution and sedimentation, and improve water quality by:
a) Maintaining a minimum of a 100-foot buffer between waterbodies and fuel and storage and hazardous chemicals would reduce the likelihood of polluting the waterways, and altering water quality.
b) Installing erosion control measures to stabilize disturbed areas would reduce the potential for increased sedimentation in waterbodies.

Alaska Stand Alone Gas Pipeline 5. 23-12 Final EIS
c) Reclaiming the area directly after construction is complete would reduce impacts to water quality such as compaction of soils that could increase sedimentation from erosion.
d) Water limits would be determined to reduce any potential impact to water quality, which could in turn affect fish resources.
3. Keep Construction Activities Within the Footprint of the Pipeline ROW and the Disturbed Area of the Adjacent Construction Zone to the Maximum Extent Practicable.
Analysis The AGDC would limit disturbance to the construction areas to the extent possible. These areas would be surveyed and marked ahead of time to identify the boundaries for construction workspace.
Effectiveness Maintaining the smallest footprint possible during the construction of the proposed Project would reduce impacts on water quality from compaction of soils, altered wetlands, riparian vegetation removal, and equipment working in streams and other waterbodies for water withdrawal or pipeline installation.
4. Minimize the Construction of New Permanent Access Roads by Emphasizing Winter Construction Using Snow-Ice Roads.
Analysis The AGDC would construct during the winter as much as practicable and use ice roads to avoid constructing permanent access roads. Ice roads would melt in the spring and leave a negligible trace on the ground, if at all.
Effectiveness Minimizing the number and length of permanent access roads would substantially reduce impacts to surface water by reducing the number or extent of bridges, culverts, wetland impacts, dust, erosion, and altered water quality from runoff from roads into waterbodies. Ice roads would melt and would not permanently affect surrounding resources (water or vegetation).
5. Perform Water Crossings in a Manner that Minimizes Effects on Water Quality.
a) Use materials for dam construction that do not introduce sediment or other harmful substances into waters when using the open-cut isolation method;
b) Use materials for flume pipe systems that do not introduce sediment or other harmful substances into waters when using the open-cut isolation method; and
c) Position flume pipe system discharges to prevent erosion or scouring.
Alaska Stand Alone Gas Pipeline 5. 23-13 Final EIS
Analysis The following water crossing measures would be implemented to mitigate their effects on water quality:
a) Where practicable, water crossings would be constructed during periods of low flow to minimize siltation. In addition, flow would be diverted or blocked while the trench was open; flumes would be used to direct flow around the trench. To prevent siltation of the stream from activities on the stream bank, measures such as the following would be used: silt fences, stabilization of stream-bank cuts, settling ponds for runoff from disturbed areas, etc. Also, see Soils and Geologic mitigation measure # 1(e) above.
b) Dams would likely be constructed using sandbags. The stream would be dammed upstream and downstream of the trench location, and once the pipe was installed, the dams would be removed. Erosion control BMPs would be used to control sediment from construction at approach and exit sides of the streams (see discussion of Erosion Control Plan under Soils and Geology above).
c) Flumes would be constructed of plastic or corrugated metal pipes. The outfall area on the downstream end of the flume would be protected from scour/erosion by placement of erosion control measures, likely riprap.
Effectiveness Implementing the above measures would reduce water quality impacts by:
a) The AGDC would only use structures that would be free from silt, or foreign substances to avoid altering the water quality. Minimizing disturbance in the waterbody as much as possible during construction would reduce impacts from turbidity, sedimentation, water quality and fluvial morphology.
b) This mitigation measure would have the same effect as 5 (a) above. A flume would be used instead of a dam.
c) Erosion control measures to prevent scour from the outfall location would reduce the likelihood of disturbance to sediment downstream of the construction location. It would also reduce impacts to turbidity and sedimentation resulting in altered water quality.
6. Minimize the Effect of the Pipeline on the Existing Thermal Regime:
a) Design the pipeline and components to take into account the thermal regime, including placement and size of compressor stations and chillers;
b) Use engineering controls such as insulation and non-frost susceptible fill to control the thermal signature of the pipeline.
Analysis
Alaska Stand Alone Gas Pipeline 5. 23-14 Final EIS
The following pipeline construction measures would be implemented to mitigate the effects on the soil and water thermal regimes:
a) The thermal signature of the pipeline would vary depending on the arrangement of the pipeline system, which is not yet established. Once it is, the thermal signature of the pipeline can be determined and appropriate engineering controls selected. Where change to the thermal regime of soil or water has been determined to be a concern, additional actions may include deeper burial, backfill with non-frost-susceptible soil, and use of board insulation or insulated pipe.
b) The same response as noted above in (a). Additional actions may include deeper burial, backfill with non-frost-susceptible soil, and use of board insulation or insulated pipe.
Effectiveness Implementing the above measures would reduce thermal impacts to soils and water by:
a) Maintaining the thermal regime of the pipeline under the stream would prevent the likelihood of ice damming during the winter; which could in turn cause flooding. Flooding could alter the stream channels and stream banks, increasing sedimentation and reducing water quality.
b) The use of non-frost susceptible fill would prevent the likelihood of ice damming during the winter; which could in turn cause flooding. Flooding could alter the stream channel and stream banks, increasing sedimentation and reducing water quality.
7. Implement Dewatering Practices that Avoid Adverse Effects to Vegetation and to Existing Quality of Surface Waters, Including Erosion and Scouring.
Analysis The AGDC would likely dewater with a pump and dam method with the inlet and outlet velocity regulated to prevent scour or heavy suction of the sediment. As the water drops, the hose would have to be rearranged continually to prevent suction of sediment and aquatic vegetation.
Effectiveness Monitoring the water level and velocity of the pump would reduce impacts to the water quality, sedimentation, and scour of the streambed.

Alaska Stand Alone Gas Pipeline 5. 23-15 Final EIS
8. Locate Fuel Storage, Equipment Refueling, and Equipment Maintenance Operations at Least 100 Feet from Surface Waters.
Analysis Fuel storage, equipment fueling, and equipment maintenance operations would be located at least 100 feet from surface waters.
Effectiveness Maintaining a minimum of a 100-foot buffer between waterbodies and fuel storage, fueling, and hazardous chemicals would reduce the likelihood of polluting the waterways, and altering water quality. This measure would further reduce impacts to water quality by providing a disturbance buffer between proposed Project features and operations and waterbodies.
9. Avoid Contaminated Sites.
Analysis The AGDC would avoid constructing the proposed Project through areas known to contain contaminated materials.
Effectiveness This measure would protect water quality by avoiding disturbances and runoff from contaminated sites.
10. Use Temporary Bridges for Transportation of Construction Equipment and Materials.
Analysis Temporary bridges would be used to cross streams for construction of the proposed Project. These may include ice bridges and multi-plate structures.
Effectiveness This measure would further reduce impacts to water quality by minimizing runoff, erosion, and sedimentation resulting from land disturbances.

Alaska Stand Alone Gas Pipeline 5. 23-16 Final EIS
5.23.2.3 Terrestrial Vegetation Resources
Terrestrial vegetation would be primarily impacted through land clearing for temporary and permanent uses for the proposed Project. As noted in Section 5.3, Terrestrial Vegetation, the permanent ROW would be maintained in a non-forested state. Vegetation would reestablish over time, but forested vegetation would be permanently removed.
AGDC Proposed Mitigation Measures
The AGDC would implement the following mitigation measures to minimize Project-related impacts to terrestrial vegetation resources:
1. Develop and Implement a Stabilization, Rehabilitation, and Restoration (SRR) Plan following ADNR’s Plant Materials Center Revegetation Manual for Alaska (Wright 2009) in Consultation with the BLM.
Analysis The ADNR’s Revegetation Manual for Alaska includes information to assist with revegetation efforts, which includes selecting the appropriate seed mixes, erosion control, and temporary versus long-term seeding, native species, cultivars, and fertilizers appropriate for Alaska’s conditions for revegetation success. Guidance from this document and consultations between the AGDC, ADNR, BLM and other appropriate agency staff would develop a SRR Plan that would be based on site-specific conditions along the proposed ROW route. See Appendix M, Exhibit A, Stipulation 2.6.
Effectiveness The Revegetation Manual for Alaska is a document that was developed by experts at ADNR who have tested and developed the appropriate techniques for revegetating and restoring vegetation in all eco-regions of Alaska. Consultation with agency experts to develop and implement the SRR Plan would be the most effective approach to reduce temporary and permanent impacts to terrestrial vegetation along the proposed Project ROW.
2. Implement BMPs During Construction to Reduce Fugitive Dust, Which Would Minimize Dust Deposition on Vegetation Adjacent to Construction Work Areas.
Analysis Several fugitive dust control measures (BMPs) would be implemented into a dust control plan. These include wetting dirt/gravel roads with water, wetting gravel roads with calcium chloride or magnesium chloride, imposing speed limits, the use of mulch and vegetative cover to protect disturbed areas, and creating windbreaks. The measures implemented would be dependent on the conditions specific to the area. Arctic areas would not likely have mulch to reduce dust production, but spraying water along the gravel and dirt roads used for construction activities would be a likely solution.

Alaska Stand Alone Gas Pipeline 5. 23-17 Final EIS
Effectiveness The BMPs listed above are the most common and approved methods to reduce fugitive dust along gravel and dirt roads. These measures would be highly effective in reducing or eliminating dust from landing on surrounding vegetation along new or existing access roads for the proposed Project. Impacts to terrestrial vegetation would be reduced substantially. See Section 5.3.2.2, Dust Deposition, for impacts on vegetation from fugitive dust.
3. Develop and Implement a Storm Water Pollution Prevention Plan.
Analysis A Storm Water Pollution Prevention Plan (SWPPP) would be developed by the AGDC for construction activities of the proposed Project to include site-specific information that would identify potential erosion prone areas. The SWPPP would include practices and procedures to stabilize the disturbed areas by seeding to comply with the terms of the permit. Mitigation measure #1 above - Develop and implement a Stabilization, Rehabilitation, and Restoration (SRR) Plan would have similar attributes to this measure to reseed the area to stabilize and prevent erosion.
Effectiveness A SWPPP is required for compliance with a NPDES permit for storm water discharge granted through the EPA. The SWPPP would be kept up to date to reflect changes at the construction site to reduce potential impacts to the proposed Project area from erosion. A SWPPP would reduce impacts to vegetation by preventing erosion to recently seeded areas.
4. Develop a Non-native Invasive Plant (NIP) Plan to Limit the Establishment and Spread of Invasive Species at Proposed Project Locations such as Airports, Gravel Airstrips, Material Sites, and Temporary Use Areas.
Analysis The NIP Plan would include guidelines and BMPs to avoid and minimize the establishment of prohibited, noxious plant species. The NIP Plan would be developed later in the process, and would include measures to: retain native vegetation, minimize soil disturbance, manage movement of equipment from weed-infested areas, inspect and clean construction equipment before moving to a new work area, and establish native Alaskan plants for revegetation promptly after disturbance. The NIP Plan would be developed after consultation with the ADNR and ADOA.
Effectiveness The NIP Plan would prevent the spread and establishment of noxious plant species to the extent most practicable in the disturbed areas of the proposed Project area. Contractors on site would implement the NIP Plan during all phases of development of the proposed Project.
Alaska Stand Alone Gas Pipeline 5. 23-18 Final EIS
5. Reestablish Vegetation that is Typical of the General Area, Where Practicable:
a) Segregate topsoil and use as top trench fill to the greatest extent practicable; and
b) Reseed and revegetate affected areas upon completion of construction activities.
Analysis The following soil and reseeding measures would be implemented to mitigate the effects on revegetation:
a) During excavation of the trench for preparation and placement of the pipeline, the upper top soil layer would be segregated from the subsurface material to maintain the natural strata of the soil layers. Heavy equipment would separate the organic top soil layer, which would be placed on top of the trench as the last layer prior to rehabilitation.
b) All disturbed areas would be stabilized so that erosion in excess of natural rates would be minimized until the practicable restoration and revegetation can be accomplished. Revegetation of disturbed areas would be conducted as soon as practicable and, if necessary, would be repeated until revegetation is successful. Areas to be seeded would be prepared by various methods, including grading, scarifying, and application of soil amendments such as fertilizers. Application of seed may be hand or by a hydro-seeded process. ADNR approved seed mixes and fertilizer ratios specific to the area would be used to successfully re-establish vegetation over the disturbed construction areas. Plantings of native shrubs and trees would be considered where necessary to improve soil stability and for screening purposes in visually sensitive areas.
The AGDC would also comply with the stabilization requirements of the Alaska Pollutant Discharge Elimination System General Permit for Discharges from Large and Small Construction Activities.
Effectiveness Segregating the top soil layer from the rest of the subsoil during excavation of the pipeline trench would allow the organic soil layer to be added as the last layer over the trench. The organic top soil layer has the nutrients and consistency required for efficient establishment of seeds and native plant species after rehabilitation is complete. Seeds, native vegetation, and cultivars would establish and grow in the top soil layer much more efficiently than if subsurface material (potentially clays and gravels) were spread over the trench. Reseeding and revegetating affected areas directly after construction would aid in reestablishing vegetation quickly in the ROW for efficient rehabilitation of the area.

Alaska Stand Alone Gas Pipeline 5. 23-19 Final EIS
6. Contain Fuel and Lubricant Spills During Construction.
Analysis During the construction phase of the proposed Project, fuel and lubricants would be stored in double-walled tanks or lined containment areas at specific locations including camps and at refueling areas. Refueling of equipment would occur only at disturbed construction areas, and drip pans and/or sorbent pads would be used under fueling connections where practicable. Refueling areas would be located as stated under Appendix M, Exhibit A - Stipulation 2.11.1 to 2.11.3 (Contingency Plans).
Effectiveness Specific and approved containment units and materials would be used at restricted locations to reduce the likelihood of a spill. Limiting the locations to store fuel and lubricants and for refueling equipment would reduce the likelihood of a spill occurring in multiple areas. Containing fuel and lubricant spill in specific areas would prevent further contamination to other vegetation areas.
5.23.2.4 Wetland Resources
Maintaining the physical, chemical and biological integrity of the Nation’s waters is the objective of the Clean Water Act (CWA). In order for the discharge of dredged or fill material into the Nations waters of the U.S. to be authorized by the USACE, the adverse impacts to wetlands, streams and other aquatic resources must be avoided and minimized to the extent practicable. For unavoidable impacts, compensatory mitigation would be required to replace the loss of wetland and aquatic resource functions in the watershed. Compensatory mitigation refers to the restoration, establishment, enhancement, or in certain circumstances preservation of wetlands, streams or other aquatic resources for offsetting unavoidable adverse impacts.
A comprehensive mitigation plan would be developed by the AGDC to include mitigation of all wetland types and functions affected. The plan would include wetland function, restoration, schedule, performance standards and monitoring. This plan would be determined from collaboration between the USACE, AGDC and other appropriate regulatory authorities upon their review of the complete Preliminary Jurisdictional Determination (PJD).
Compensatory Mitigation
Compensatory mitigation is required to offset unavoidable adverse impacts to wetlands under the Clean Water Act Section 404. After all appropriate steps have been taken to avoid and minimize adversely impacting wetlands pursuant to 40 CFR Part 230; compensatory mitigation would be required to meet the “no net loss” of wetland acreage and function.

Alaska Stand Alone Gas Pipeline 5. 23-20 Final EIS
The “Compensatory Mitigation for Losses of Aquatic Resources; Final Rule” lists three types of compensatory mitigation:
1. Mitigation Banks;
2. In Lieu Fee Mitigation; and
3. Permittee-Responsible Mitigation:
a) Restoration of a previously-existing wetland or other aquatic site;
b) Enhancement of an existing aquatic site’s function;
c) Establishment of a new aquatic site; and
d) Preservation of an existing aquatic site.
As defined by the EPA, a mitigation bank is a wetland, stream, or other aquatic resource area that has been restored, established, enhanced, or (in certain circumstances) preserved for the purpose of providing compensation for unavoidable impacts to aquatic resources permitted under Section 404 or a similar state or local wetland regulation (EPA 2012). Mitigation banks have four distinct components:
• The bank site: the physical acreage restored, established, enhanced, or preserved;
• The bank instrument: the formal agreement between the bank owners and regulators establishing liability, performance standards, management and monitoring requirements, and the terms of bank credit approval;
• The Interagency Review Team (IRT): the interagency team that provides regulatory review, approval, and oversight of the bank; and
• The service area: the geographic area in which permitted impacts can be compensated for at a given bank.
Best Management Practices Guide
The AGDC would implement all reasonable Best Management Practices (BMPs) imposed by the USACE under Section 404 of the CWA to minimize Project-related impacts to waters of the U. S. , including wetlands. Standard BMPs are specified in the USACE Alaska District’s Nationwide Permits General BMP Guide (USACE 2007b) and could include the following:
a) Contain sediment and turbidity at the work site by installing diversion or containment structures.
b) Disposing of dredge spoils or unusable excavated material not used as backfill at upland disposal sites in a manner that minimizes impacts to wetlands.
c) Revegetating wetlands as soon as possible, preferably in the same growing season, by systematically removing vegetation, storing it in a manner to retain viability, and replacing it after construction to restore the site.
Alaska Stand Alone Gas Pipeline 5. 23-21 Final EIS
d) Using fill materials that are free from fine material.
e) Stockpiling topsoil and organic surface material such as root mats separately from overburden and returning it to the surface of the restored site.
f) Dispersing the load of heavy equipment such that the bearing strength of the soil (the maximum load the soil can sustain) would not be exceeded. Suitable methods could include, but are not limited to, working in frozen or dry ground conditions, employing mats when working in wetlands or mudflats, and using tracked rather than wheeled vehicles.
g) Using techniques such as brush layering, brush mattressing, live siltation (a revegetation technique used to trap sediment), jute matting, and coir logs to stabilize soil and reestablish native vegetation.
h) The AGDC would implement the type of compensatory mitigation that would be utilized to comply with the Compensatory Mitigation Final Rule, in consultation with the USACE.
i) The Compensatory Mitigation Plan would evaluate the appropriate level of compensation based on the functional and condition assessment of unavoidable wetland impact.
j) Restore wetlands by removal of abandoned drill pads and airstrips on the North Slope (North Slope Mitigation Bank).
k) Create wetlands where necessary to compensate for the loss of “in kind” wetlands.
AGDC Proposed Mitigation Measures
The AGDC would determine site-specific mitigation after collaborations with the USACE to develop a comprehensive mitigation plan. Mitigation measures would be site specific and geographically dependent based on the eco-region and landscape where the wetlands are located. The AGDC has committed to the list of traditional mitigation measures included below.
1. Schedule Pipeline Construction Across Wetlands During the Winter to the Maximum Extent Practicable.
Analysis Wetlands would be constructed during the winter to the greatest extent practicable. Temporary ice roads and pads would be developed in the winter to access wetland areas. Ice roads would be constructed appropriately to tolerate the weight of heavy equipment and would melt in the summer leaving a negligible trace on the underlying wetland.

Alaska Stand Alone Gas Pipeline 5. 23-22 Final EIS
Effectiveness Constructing through wetlands (saturated soils) when the soils are frozen and stable would reduce disturbance to aquatic vegetation and surface hydrology from heavy equipment use. Winter construction would effectively allow excavation of a narrower pipe trench through the wetland than during the summer season. Ice roads and pads would also reduce impacts from erosion and soil compaction. Winter construction would reduce fugitive dust dispersal and deposition in surrounding wetlands due to working on gravel roads bound with ice and snow. NIP dispersal and establishment would be reduced from construction through wetlands in the winter. NIP seeds that may incidentally be transferred from one site to the next via personnel or equipment would likely not establish in recently disturbed soils in the winter versus summer construction season. Winter construction through wetlands would reduce impacts substantially by minimizing the footprint, and thus impacts to the hydrologic connectivity and vegetative composition.
2. Avoid and Minimize Ground Disturbing Activities in Wetland Habitats By:
a) Limit grading except for trenching, to the maximum extent practicable to preserve root systems;
b) Maintain slope stability;
c) Use mats of other types of mitigation during non-winter construction to prevent rutting;
d) When possible, locate permanent facilities including compressor stations, access roads, and work pads outside of wetlands; and
e) Reduce construction ROW widths across wetlands as practical.
Analysis Construction through wetlands would be limited to reduce disturbance as much as practicable by grading directly over the centerline. This effort would be effective particularly during the winter construction season when soils are frozen and stable, as noted above. When wetland areas are located in sloped areas, cut and fill embankments would be regularly monitored and inspected. If signs of slope instability were present, the area would be repaired accordingly. Slope stabilization and erosion control measures may be installed where embankment slopes are severe.
During the summer construction season, rig mats would be placed where construction traffic and heavy equipment maneuvering are required. The mats would be relocated as needed across wetlands in the construction ROW. All permanent facilities would be located in upland areas as much as feasible. When positioning the exact location of compressor stations and access roads, avoiding wetlands would be the priority in addition to cost, material needs and maintaining the construction schedule. If an upland location is suitable and is not cost or time prohibitive, wetlands would be avoided to the extent most practicable. The width of the ROW would be reduced as much as possible to reduce

Alaska Stand Alone Gas Pipeline 5. 23-23 Final EIS
impacts to wetlands. This could be in a situation where TEWS are proposed along the ROW, but would be relocated to an upland location instead if feasible.
Effectiveness The rootstock from the vegetative mat would be preserved by reducing and limiting disturbance over the centerline as much as possible. The efficacy of wetland rehabilitation and success would largely be dependent on preservation of the root system. Regular monitoring of cut/fill embankments would reduce erosion and sedimentation impacts in wetland areas substantially. Repairing embankment issues when they occur from regular monitoring would limit disturbance to a temporary impact.
Matting would be used during the open water season to reduce the potential for rutting, by dispersing the weight of heavy equipment across the wetland area. Impacts to wetlands from rutting would be reduced substantially from the use of mats. This includes reduced erosion, soil compaction and inhibited seed germination for vegetation establishment. Placing permanent facilities in upland areas away from wetlands would reduce the likelihood of dust deposition, NIP exposure and establishment, fragmentation, and changes to the chemical and physical properties of wetland habitat (see potential impacts listed under Section 5.4.3.2, Support Facilities. Reducing wetland impacts also has indirect beneficial effects for preserving wildlife habitat and surface water quality. Minimizing the ROW width in wetland areas would substantially reduce the potential impacts noted above.
3. Maintain the Existing Hydrologic Systems.
Analysis During the construction phase of the proposed Project, construction workers would take caution to prevent interfering with wetland connections. A wetland connection could include streams/tributaries, surrounding wetlands, and drainage paths that are seasonally wet areas. Marking wetland areas could be completed by staking lath or flagging along wetland boundaries prior to construction activity. Matting would be used in the summer construction season to prevent creating ruts in wetlands. Ice roads and pads used during the winter construction period would melt during spring break up.
Effectiveness Marking wetland areas in the construction footprint would identify to the construction workers where the wetland boundaries are, to avoid altering connectivity. Maintaining the connectivity of hydrologic systems would prevent wetland impacts noted above under wetland mitigation measure #2. Erosion, the development of impoundments or excess drainage from wetlands could occur if connectivity is not maintained. Rutting from heavy equipment or improper culvert placement for temporary or permanent access roads could alter the connectivity to other wetlands or streams. As noted above under wetland mitigation measure #1, construction in wetlands would occur in the winter as much as practicable, thus reducing the likelihood of rutting and soil compaction. All new roads would be engineered to have appropriately sized and frequency of placed culverts.

Alaska Stand Alone Gas Pipeline 5. 23-24 Final EIS
4. Reestablish Revegetation that is Typical of the General Area Where Practicable:
a) Segregate topsoil and use top trench fill to the greatest extent practicable; and
b) Reseed and revegetate affected areas upon completion of construction activities.
Analysis Please see details on under Terrestrial Vegetation mitigation measure #5 noted above.
Effectiveness Please see details on the effectiveness under Terrestrial Vegetation mitigation measure #5 noted above. Impacts to wetlands would be reduced substantially by maintaining the vegetative composition and maintaining the natural strata of the trench fill.
5. Minimize the Number of Stream Crossings.
Analysis The number of stream crossings would be minimized to the extent most practicable by feasibly planning the route with the least number of crossings possible. Under Appendix M, Exhibit A, 1.4.3.1 (h), the AGDC would have to develop a Stream, River, and Floodplain Crossings Plan. Mitigation measures included in this Plan would require approval by the State Pipeline Coordinator’s Office when disturbance occurs to natural waters. Each stream crossing would require permit approval to comply with State of Alaska State regulations.
Effectiveness The ROW Lease stipulations (3.13) require a Stream, River, and Floodplain Crossings Plan to construct through drainages. State regulations require the list of permits (Table 5. 23-1) for construction in a waterbody. The AGDC is required to comply with the ROW Lease and all state, federal and local regulations. Minimizing the number of stream crossings would reduce hydrologic impacts between streams and wetlands for hydrologic connectivity.
6. Use Existing Bridges or HDD or Other Trenchless Technology When Feasible.
Analysis The AGDC has proposed the use of one new and up to three existing bridges for the proposed Project. Surface water impacts would not occur with the use of existing bridges or construction of a new bridge. The HDD method would have little to no impact on any surface body, but would require a large exit (100 by 200 feet) and entry box (200 by 300 feet) area. HDD methods are used primarily in areas where a large area is to be traversed with minimal impacts to the wetland or waterbody.
Alaska Stand Alone Gas Pipeline 5. 23-25 Final EIS
Effectiveness The use of existing bridges would have minimal to no impacts to surrounding wetlands. Construction of a bridge or HDD at the Yukon River would have similar impacts as noted in the Section 5.4.3.2. The use of HDD methods would reduce substantial impacts to wetlands by placing the pipeline under the wetland, not through the wetland via open-cut and open-cut push pull methods where feasible.
7. Contain Fuel and Lubricant Spills During Construction.
Analysis Please see analysis details under Terrestrial Vegetation mitigation measure #6 noted above.
Effectiveness Please see details on the effectiveness under Terrestrial Vegetation mitigation measure #6 noted above. Containing fuel and lubricants in specific contained areas would reduce the likelihood of dispersal into neighboring wetlands.
8. Remove the Top Vegetative Layer of the Wetland with a Backhoe or Similar Equipment and Set Aside Separately from the Subsoil Spoils. The Vegetative Mat Would be Placed on Top of the Ditch as the Last Layer.
Analysis Specific heavy equipment (backhoe) would be used to separate (peel back) the wetland vegetative mat from the subsurface materials during excavation. The analysis for this technique in wetlands is similar to the analysis noted above under Terrestrial Vegetation mitigation measure #5.a.
Effectiveness The effectiveness of this technique is the same as noted above under Terrestrial Vegetation mitigation measure 5. By segregating the organic top vegetative layer from subsurface soils and placing it on top as the last layer prior to contouring, success of rehabilitation would be improved substantially.
9. Develop a NIP Prevention Plan, Which Would Address Procedures to Reduce and Eliminate the Spread of NIP.
This Plan would provide the details of the measures to be used to control invasive species through appropriate site preparation, monitoring, revegetation of disturbed areas within native species and performance standards.

Alaska Stand Alone Gas Pipeline 5. 23-26 Final EIS
Analysis Please see details on analysis under Terrestrial Vegetation mitigation measure #4 noted above.
Effectiveness Please see details on the effectiveness under Terrestrial Vegetation mitigation measure #4 noted above. The NIP plan would reduce the likelihood of spread and establishment of NIP species, which would outcompete and displace native species.
5.23.2.5 Wildlife Resources
The primary potential impacts to wildlife from construction of the proposed Project would be temporary visual and noise disturbance, and alteration of habitat. Operational impacts could include permanent alteration of habitat from vegetation removal and some noise disturbance would occur at permanent aboveground facilities.
AGDC Proposed Mitigation Measures
The AGDC has developed the following mitigation measures to avoid and minimize potential Project-related impacts to wildlife:
1. Avoid Locating Pipeline Facilities in Sensitive Wildlife Habitats to the Maximum Extent Practicable.
Analysis The AGDC would align the pipeline and position the proposed aboveground facilities outside of sensitive wildlife habitats as much as practicable. Sensitive habitats include mineral lick and lambing areas for Dall sheep, raptor nesting areas, moose rutting, and caribou calving and migration areas. Construction activities would comply with regulations of the Migratory Bird Treaty Act (MBTA), Bald, and Golden Eagle Protection Act (BGEPA). Permit requirements would include timing vegetation clearing noted in Table 5.5-2, Section 5.5, Wildlife. During detailed design of the proposed Project, the AGDC would consult with the appropriate resource agencies and adjust siting and the construction schedule if necessary to avoid disturbance of sensitive wildlife habitats. This effort may include conducting surveys of potential sensitive wildlife areas prior to construction activities.
Effectiveness Avoiding sensitive wildlife habitat or scheduling construction activities to occur when wildlife are not present to the greatest extent practicable, would reduce impacts substantially. It would prevent disturbances to Dall sheep ewes and newborn lambs, nest abandonment or chick mortality of breeding raptors, and disturbance to traditional moose rutting areas, which could potentially reduce the reproductive success of the local moose population. Caribou calving areas would be avoided during the calving season to reduce the likelihood
Alaska Stand Alone Gas Pipeline 5. 23-27 Final EIS
of displacing cows and calves from traditional calving grounds and potentially increasing calf mortality or reducing productivity of a population from displacement into poor quality habitat. The construction activity would occur by segment periodically along the length of the proposed ROW over a two-year period. Because of collaborations with agency staff and permit compliance, negligible impacts would result to sensitive wildlife habitat along the proposed Project.
2. Schedule Construction Activities to Avoid Effects During Sensitive Periods for Wildlife to the Extent Practicable,
This includes scheduling excavation activities during times of the year when major movements across the ROW do not occur (e.g., migrations).
Analysis As noted above under analysis for mitigation measure #1, regulatory compliance and collaborations between the AGDC and agency staff would occur as the final stages of the proposed Project design are accomplished. Construction in documented sensitive wildlife habitat areas would occur at a time when wildlife is not present, or the areas would be avoided. Additional aerial or ground-based surveys would be completed as needed, based on agency consultation and permit requirements. Traditional knowledge from local residents may be included to supplement published literature and identify potential changes to wildlife habitat use and movements.
Effectiveness The AGDC would gather available literature and local knowledge, and obtain approval by agency staff to prevent disturbance to wildlife during sensitive life stages and areas along the proposed route as much as practicable. As noted above under mitigation #1, the construction activity would be temporary and occur by segment, which would produce short-term disturbance at each specific location along the pipeline. The AGDC would be required to follow Stipulation 2.8.4, Exhibit A of the ROW Lease requirements in Appendix M in addition to other state, federal and local permits. Scheduling blasting outside of sensitive periods would reduce disturbance such as potentially displacing wildlife into less optimal habitats. This measure would reduce the likelihood of stress to wildlife resulting in lower productivity of wildlife in the immediate area of the proposed Project.
3. Minimize the Duration of Open-Ditch Construction Activities to Mitigate the Risk of Animal Entrapment in an Open Ditch.
Analysis The trench/ditch would be excavated using a chain excavator or track hoe. The length of time that the trench would be open (trenching to backfill) at any one location would be one to three days. The conventional method of construction would be trenching, and construction would progress as a moving assembly line of continuous operation. See Section 2.2.3 for details on trenching.

Alaska Stand Alone Gas Pipeline 5. 23-28 Final EIS
Effectiveness As noted above under wildlife mitigation measure #2, construction activities would avoid working in sensitive wildlife habitat and during sensitive life stages to the extent most practicable. Thus, avoiding areas of heavy wildlife use and minimizing the time between trenching and backfilling over the centerline would minimize animal entrapment substantially. Animals would likely move away from the center of the construction area during heavy equipment use when noise and visual disturbance would occur, reducing the likelihood of entrapment.
4. Develop Systems or Mechanisms to Facilitate the Escape of Wildlife from the Pipeline Trench in the Event that Wildlife Becomes Trapped (e. g., Escape Ramps).
Analysis Trenching depth would range from 5-6 feet, with 30 to 36 inches of material laid over the pipe to meet USDOT standards as noted in Section 2.2.2.3. Large animals (e.g., caribou, moose, and wolf) would be able to escape the trench on their own, by climbing out or jumping across the trench. Smaller animals (lemming, mice) would be able to scale the trench walls to escape.
Effectiveness The trench would be relatively shallow and opened for a brief period of time (one to three days), which would substantially reduce the timing of impacts to wildlife. Animals would be unlikely to approach (be attracted to) the construction site and become entrapped in the trench. Wildlife would likely avoid the area of construction due to noise produced by heavy equipment. Few animals if any would likely cross the open trench, but would also be able to escape by their own means.
5. Develop a Blasting Control Plan in Accordance with ADF&G Blasting Standards to Protect Wildlife.
Analysis A Blasting Control Plan is particularly necessary if blasting is required in sensitive areas or during sensitive life stages for wildlife. A typical Blasting Control Plan would address the following:
• Scope of blasting and blasting types/methods proposed.
• Shot locations and proximity to existing facilities.
• Types of explosives / initiation system to be used.
• Drill and blast pattern.
• Flyrock control plan.
• Ground cracking and displacement control, monitoring, and reporting.
Alaska Stand Alone Gas Pipeline 5. 23-29 Final EIS
• Explosives storage and transportation procedures.
• Fire prevention and similar emergency plans.
• Proximity to protected wildlife species.
Site-specific Blasting Control Plans would be based on the general Blasting and Use of Explosives Plan that AGDC would prepare under the ROW Lease Stipulation 1.4.3.1 (b).
Effectiveness Development of a detailed blasting plan is a requirement for compliance with the ROW Lease. The AGDC would have a contract with an appropriate blasting contractor to implement the list of items above in the Blasting Control Plan. This plan would reduce impacts to nesting birds, sensitive wildlife habitats and periods (e.g., calving, denning, and lambing) to the extent most practicable. Reducing blasting activities to periods when wildlife are absent, or during sensitive life stages, would reduce the likelihood of wildlife getting displaced into less optimal habitat, which could potentially cause increased mortality, or stress resulting in a decline in productivity.
6. Ensure Construction Camp Operations and Pipeline Facility Construction Activities Comply with Measures that Avoid Attracting Wildlife.
Analysis A Comprehensive Waste Management Plan would be developed prior to construction activities, and would include procedures for storage and disposal of food wastes and scraps in animal-resistant containers. In addition, a Stipulation in Exhibit A, 1.4.3 (v) includes a Managing Human/Carnivore Interaction Plan under the ROW Lease (Appendix M). See mitigation measure #12 below for more details on a) Wildlife Interaction and Habitat Protection Plan, and c) Bear Avoidance and Human Encounter/Interaction Plan.
Effectiveness All plans are required to provide enough detail to comply with the ROW lease stipulations, which must be approved by the State Pipeline Coordinator. These plans would reduce the likelihood of attracting wildlife (e.g., bears, fox, and ravens) to the facilities. Properly containing odors and potential food sources for wildlife would reduce mortalities from defense of life or property (DLP) killings or vehicle collisions from the proposed Project activities. Disease or illness could occur to wildlife from feeding on human foods or materials, but would be negligible if appropriate plans are developed. The waste management plan would reduce the likelihood of attracting wildlife from odors.
Alaska Stand Alone Gas Pipeline 5. 23-30 Final EIS
7. Adopt Motor Vehicle and Aircraft Procedures that Minimize Disturbances to Wildlife.
Analysis Construction traffic in and around the right-of-way would be limited to designated areas, such as camps, laydown yards, and access roads. Aircraft procedures would be developed for each airstrip and would vary by location. Aircraft procedures may include consideration for migratory patterns of birds and/or other wildlife thus restricting aircraft traffic during migration periods. Consultation with agency staff, such as USFWS and ADF&G, would be able to identify periods to avoid and flight patterns to follow to reduce disturbances to wildlife.
Effectiveness Motor vehicle and aircraft procedures would reduce impacts to wildlife due to disturbance of the proposed Project. Reducing and minimizing vehicle and aircraft use could reduce potential mortality impacts that could occur from a collision with wildlife. It could reduce impacts that could reduce feeding, breeding, resting efficiency and therefore productivity. It would reduce potential displacing of animals from optimal habitat into less optimal habitat important for survival.
8. Identify and then Avoid or Minimize Situations where Wildlife May Be Killed in Defense of Life or Property (DLP).
Analysis Identification and avoidance of these situations would be accomplished by using environmental monitors. Monitors would educate the construction personnel on local wildlife, sensitive areas, and potential threats. Environmental briefings for construction workers would increase their awareness of necessary steps to avoid problems with wildlife. Reducing scents (e.g., food and petroleum products) that may attract species such as bears would reduce the chances for encounters. Understanding the general biology of species such as bears would also minimize risk. The mitigation measure #6 noted above would have similar attributes to mitigating potential DLP situations.
Effectiveness Avoiding areas and at specific periods when wildlife is in a vulnerable state (with young of the year) would reduce the potential for DLP killings substantially. Understanding where and when specific wildlife species occur in their habitat in addition to reproductive status could reduce impacts from reduced survival substantially. Reducing the likelihood of an encounter on the construction site or at camp would reduce impacts to the local wildlife population. Direct or indirect mortality caused by a DLP killing, disease, illness, or forcing wildlife into poor quality habitat (denning, feeding, and raising young) would be substantially reduced.

Alaska Stand Alone Gas Pipeline 5. 23-31 Final EIS
9. Avoid or Minimize Construction and Operational Activities During Sensitive Periods in Life Cycles Such as Moose and Caribou Calving, Bear Denning, Raptor Nesting, and Nesting Migratory Birds.
Analysis Sensitive areas and their periods of sensitivity would be identified prior to proposed Project activities. To the extent feasible, proposed Project activities would be minimized accordingly. This would be accomplished through consultation with resource agencies and pro-active scheduling. Environmental control/stewardship plans would address this matter in detail, along with specific wildlife monitoring and reporting procedures. The analysis noted above under mitigation measures #1 and #2 would apply to this mitigation measure.
Effectiveness Minimizing disturbance to wildlife during sensitive life stages would reduce the likelihood of habitat displacement, reproductive failure, reduced nutrition, increased mortality and overall lower productivity. The construction season would occur over the short term, in specific locations as each spread is developed. See effectiveness for mitigation measures #1 and #2 above.
10. Limit Public Access to the ROW for Recreation or Hunting by Blocking Entry Areas with Large Boulders, Berms, or Fencing.
Analysis Following construction, access roads and trails not required for operations will be closed. These areas and other points of ingress/egress would be blocked using boulders, berms, fencing, gates, etc. Security and maintenance personnel would monitor these locations, along with the rest of the right-of-way. Specific procedures for controlling access, and for establishing, and maintaining right-of-way security would be developed later in the proposed Project.
Effectiveness Reducing access to previously inaccessible wildlife habitat would reduce the likelihood of increased mortality to wildlife from hunting and recreating through remote areas near the ROW. Effectiveness noted in mitigation measure #9 above would also apply to this mitigation measure.

Alaska Stand Alone Gas Pipeline 5. 23-32 Final EIS
11. Rehabilitate Pipeline Construction Access Roads in a Manner that Allows Public Access and Consistent Safe Operation of the Pipeline System and That Is in Accordance with the Plans of the Landowner/Land Manager.
Analysis Access roads would be maintained during proposed Project construction. Some of the access roads would continue to be maintained throughout the life of the pipeline. These access roads would provide access to the ROW for pipeline security and maintenance crews. In situations where these permanent roads are open to the public, the roads would be left ungated or otherwise controlled. Providing access to the public would require no additional disturbance.
Effectiveness The AGDC would limit access road driving speeds to reduce the potential for vehicle collisions with wildlife. The AGDC would implement dust reduction measures as noted in Terrestrial Vegetation mitigation measure #2 above. Implementing fugitive dust reduction standards would reduce impacts to the surrounding vegetation as noted above, which also would reduce impacts to wildlife habitat for feeding, resting, breeding, and cover.
12. The AGDC Would Develop the Following Plans Prior to Beginning Construction Activities, to be Implemented During Construction and Operations, to Minimize Human Interactions with Wildlife:
a) Wildlife Interaction and Habitat Protection Plan;
b) Blasting Control Plan which follows ADF&G standards protective of wildlife;
c) Bear Avoidance and Human Encounter/Interaction Plan;
d) Comprehensive Waste Management Plan; and
e) Hazardous Materials Emergency Contingency Plan.
Analysis The following wildlife avoidance, habitat protection, blasting, and waste management measures would be implemented to mitigate the effects of interactions of humans with wildlife:
a) The AGDC Wildlife Avoidance and Human Encounter/Interaction Plan would be developed in consultation with ADF&G and USFWS. The plan would include considerations for all terrestrial wildlife. Specific habitat-protection measures that would be incorporated in construction planning would include the following:
o Timing vegetation clearing to avoid nesting birds.
o Scheduling work to avoid important wildlife habitats and seasons (e.g., calving, spawning, etc.).

Alaska Stand Alone Gas Pipeline 5. 23-33 Final EIS
o Avoiding blasting near raptor nests, calving areas, etc., when occupied.
o Scheduling work near buffer zones for important habitats to avoid potential disturbance.
o Implementing erosion control measures to protect downstream habitats.
o Minimizing vegetation clearing to the extent practicable.
o Identifying high-risk areas such as bear denning locations known to ADF&G and USFWS.
o Laying out camps and other facilities to minimize locations where bears and other animals can hide and surprise workers.
o Using armed bear monitors where necessary in remote locations.
o Managing food and wastes to avoid attracting wildlife.
o Educating employees to avoid and report wildlife encounters, and not to feed wildlife.
b) Bears would be a primary topic covered in the AGDC Wildlife Avoidance and Human Encounter/Interaction Plan, which would be developed in consultation with ADF&G and USFWS. The plan would include considerations for all terrestrial wildlife. The plan would include the following considerations:
o Identifying high-risk areas such as bear denning locations known to ADF&G and USFWS.
o Laying out camps and other facilities to minimize locations where bears and other animals can hide and surprise workers.
o Use of armed bear monitors where necessary in remote locations.
o Managing food and wastes to avoid attracting wildlife.
o Educating employees on how to avoid and report wildlife encounters, and not to feed wildlife.
o Coordination with resource agencies before construction begins.
o Notification and reporting requirements for wildlife encounters.
o Posting of warning signs and placards.
o Procedures for handling dead or injured wildlife.
c) Site-specific Blasting Control Plans would be based on the general Blasting and Use of Explosives Plan AGDC would prepare under State ROW Lease Stipulation 1.4.3.1 (b). See measure #5 above. A typical Blasting Control Plan would address the following:
o Scope of blasting and blasting types/methods proposed.
o Shot locations and proximity to existing facilities.
Alaska Stand Alone Gas Pipeline 5. 23-34 Final EIS
o Types of explosives / initiation system to be used.
o Drill and blast pattern.
o Flyrock control plan.
o Ground cracking and displacement control, monitoring, and reporting.
o Explosives storage and transportation procedures.
o Fire prevention and similar emergency plans.
o Proximity to protected wildlife species.
d) AGDC’s Comprehensive Waste Management Plan would include written policies and procedures for the following:
o Identification of waste types.
o Waste accumulation areas, including satellite accumulation areas, central accumulation areas, recyclable accumulation areas, and universal waste accumulation areas. These areas would be arranged, labeled, and inspected in accordance with 40 CFR 260 Subpart B.
o Management of food waste to keep it from wildlife.
o Management of recyclable metals, burnable wastes, and oily wastes.
o Waste transport and disposal, including sampling (as necessary), profiling, and manifesting.
o Wastewater treatment, including disposal of domestic wastewater and hydrostatic testing water.
o Waste fluid handling, including fuels and lubricants for equipment.
o Recordkeeping and audits.
e) The AGDC would develop contingency plans for storage, handling, and use of hazardous materials and substances in accordance with ADEC, U. S. Environmental Protection Agency (EPA), DOT, and other regulations. Specific emergency plans would be developed for hazardous waste storage (40 CFR 260 Subpart D).
Contingency plans would cover the following:
o Notification and reporting requirements.
o Response scenarios.
o Site control and responsibilities for safety.
o Organization of incident command system.
o Arrangements with local emergency agencies.
Alaska Stand Alone Gas Pipeline 5. 23-35 Final EIS
o Containment, recovery, and disposal, including remediation of environmental contamination.
o Wildlife hazing, and capture, stabilization, and treatment of affected wildlife.
o Decontamination of personnel and equipment.
o Plan maintenance.
Effectiveness Implementing the above measures would reduce human interaction impacts to wildlife by:
a) The Wildlife Interaction and Habitat Protection Plan would reduce impacts to sensitive wildlife habitats and periods (e. g. nesting, calving, denning, and lambing). It would reduce the potential for erosion to occur, resulting in reduced sedimentation in nearby streams and rivers. The potential for DLP killings would also be less likely; reducing the potential for increased wildlife (bear) mortality in the proposed Project area.
b) The Wildlife Avoidance and Human Encounter/Interaction Plan would be effective in the same way as mitigation measure a). This plan would primarily focus on bears to avoid and reduce encounters with bears. Reducing disturbances to bears, in particular in denning areas, would reduce displacement of bears into lower quality habitats for denning or feeding. It would also reduce the potential for DLP killings in the proposed Project area.
c) Blasting plans would protect species during sensitive life stages and their habitat from additional disturbance from blasting activities. The effectiveness would be similar to that noted above under wildlife mitigation measure #2 and #5.
d) and e) The Comprehensive Waste Management Plan and contingency plans would have similar effectiveness to wildlife mitigation measures #6 and #8 noted above. It would reduce the likelihood of attracting wildlife (e.g. bears, fox, and ravens) to the facilities. Properly containing odors and potential food sources for wildlife would reduce mortalities from DLP killings or vehicle collisions from the proposed Project activities. Disease or illness could occur to wildlife from feeding on human foods or materials, but would be negligible if appropriate plans are developed.
13. Where VSMs Would Be Used to Elevate the Pipe, a Minimum of 7 Feet of Clearance from Ground Surface to the Bottom of the Pipe would be Maintained for Wildlife Movement.
Analysis The AGDC would elevate the pipeline on VSMs from the GCF for 6 miles across the tundra while the rest of the pipeline would be buried. The 7-foot clearance of the elevated pipeline above the ground has been proven in the North Slope oilfields to be appropriate for wildlife passage year round.
Alaska Stand Alone Gas Pipeline 5. 23-36 Final EIS
Effectiveness Elevating the VSMs to maintain a 7-foot clearance would allow wildlife to pass under the pipeline during the winter when snow accumulation has occurred. This would be particularly important for caribou during their migration. This would allow avoidance of impediments to wildlife movements for feeding, calving, and migration. This also would reduce the potential for caribou to be displaced into areas not optimal for feeding or calving.
5.23.2.6 Fish Resources
The AGDC would develop a Fish and Wildlife Protection Plan under State ROW Lease Stipulation 1.4.3.1 (b) to protect fish resources, based on documented EFH, non-salmonid and resident species presence, and habitat use information. Additional seasonal life history and habitat use information would be required to determine the construction schedule for all proposed stream crossings, to protect fish and their habitat. All crossings of fish-bearing streams would require permit approvals from ADF&G, and consultations with NMFS would occur for streams identified as EFH. Collaborations with these agencies would define applicable and appropriate site-specific construction techniques and other mitigation for proposed Project implementation.
AGDC Proposed Mitigation Measures
The following mitigation measures would be implemented by the AGDC to minimize impacts on fish resources:
1. Follow Mitigation Measures for Water Resources (Section 5.23.3) Identified Above.
Analysis The AGDC has proposed 10 key mitigation measures to reduce impacts to water resources. All measures proposed apply to reducing impacts indirectly to fish resources. See Section 5.23.3.1 above for a list of mitigation proposed (analysis and effectiveness) to reduce impacts to water resources.
Effectiveness Reducing impacts to water resources would reduce impacts to fish habitat and therefore fish. Minimizing the length of time that equipment is in the water would reduce impacts to rearing, spawning, and overwinter habitat substantially. Sedimentation would be reduced which would reduce turbidity from construction activities, minimizing the effects on water quality. Water quality is important for fish and embryo survival. Maintaining the existing thermal regime at stream crossing locations would reduce potential effects from creating ice dams, which could cause flooding and reduce overwinter habitat for fish. Maintaining the temperature of the pipeline to the ambient temperature would reduce the likelihood of affecting fish and their habitat substantially.

Alaska Stand Alone Gas Pipeline 5. 23-37 Final EIS
2. Minimize the Number of Fish Stream Crossings Where Practicable.
Analysis Minimizing the number of stream crossings where practicable was a criterion used to establish the ASAP route and the location of access roads. During detailed design, consultation with agencies on permits may lead to minor route modifications to avoid impacts to fish streams.
Effectiveness Reducing the number of stream crossings as much as practicable would substantially reduce potential impacts to fish resources. Avoiding construction through streams would result in negligible disturbances to fish habitat or fish.
3. Use Open-Cut Isolation Methods for Stream Crossings at Locations Where an Open-Cut is Prevented by Overwintering and Spawning Fish, or Where Stream Flow Conditions Make Open-Cut Impractical.
Analysis The open-cut isolation method is a temporary stream crossing technique that allows trenched pipeline to be used "in-the-dry" while diverting the natural flow around the site during construction using flume or dam and pump techniques. Water would be diverted to maintain natural downstream flows and to reduce the pooling effects upstream. Appropriate size mesh screens would be used to prevent injury to fish. Under the ROW Lease Stipulation 1.4.3.1 (h), AGDC is required to develop a Stream, River, and Floodplain Crossing Plan (Appendix M, Exhibit A). In addition, the AGDC would be required to brief field personnel and representatives on permits requirements listed under Sections 2.8.1 and 2.8.2 (Appendix M, Exhibit A).
Effectiveness The open-cut isolation method would reduce sedimentation dispersal and therefore turbidity in the stream that would affect the ability for fish to filter water through their gills. This method may reduce erosion of the streambanks, and allow restoration of the channel profile and gradient versus other construction methods. Restoring the stream channel as quickly and effectively as possible would reduce impacts to fish such as loss of optimal feeding and resting habitat. Stream flow, cover, substrate and important microhabitat characteristics would be returned to the stream, resulting in reduced impacts to a specific life stage or species.
Alaska Stand Alone Gas Pipeline 5. 23-38 Final EIS
4. A Blasting Control Plan Would be Developed in Accordance with ADF&G Blasting Standards to Protect Adult Fish, Juvenile Fish and Developing Fish Eggs when Blasting Activities Occur In or Near Streams.
Analysis Site-specific Blasting Control Plans would be based on the general Blasting and Use of Explosives Plan AGDC would prepare under State ROW Lease Stipulation 1.4.3 (b). For a typical Blasting Control Plan see Wildlife mitigation measure #5 a above. This plan would address the following:
• Scope of blasting and blasting types/methods proposed.
• Shot locations and proximity to streams and waterbodies.
• Types of explosives / initiation system to be used.
• Drill and blast pattern.
• Flyrock control plan.
• Ground cracking and displacement control, monitoring, and reporting.
• Explosives storage and transportation procedures.
• Fire prevention and similar emergency plans.
The AGDC would follow the ADF&G Blasting Standards (1991) to protect fish and redd (incubating embryos) habitat. A Fish Habitat permit may be required for any blasting operation that occurs either in, or near the banks of, a fish bearing waterbody.
Effectiveness Development of a Blasting Control Plan would reduce fish impacts from sedimentation, noise, vibrations, and/or alteration of channel morphology. Blasting through deflagration techniques would be relatively harmless to fish, thus reducing injury and mortality to both small and large fish. The AGDC would follow the ADF&G Blasting Standards (1991) to protect fish and redd (incubating embryos) habitat.
5. Use Existing Bridges or HDD as Proposed.
Analysis HDD is a trenchless technology of boring the pipeline under the ground where exceptionally vulnerable ecosystems occur. HDD would be used at 41 waterbody crossings throughout the proposed Project corridor. See Section 2.2.3.2 for details on the HDD method.
Alaska Stand Alone Gas Pipeline 5. 23-39 Final EIS
Effectiveness The HDD method reduces impacts to fish and fish habitat because it eliminates construction activities in the stream. Fish would not be impacted from HDD activities with the exception of the potential for drilling fluid to be released into the aquatic environment. This would be unlikely and potentially occur only if the containment materials at the entrance pit and receiving hole fail.
6. Use Pipeline Designs and Construction Scheduling that Minimize Disruption of Fish Passage, Spawning Fish, and the Effects to Fish Habitat.
Analysis The AGDC would be required to comply with state and federal permits to design and construct the stream crossings to minimize disruption to fish and their habitat as much as practicable. This would include construction at times when fish are not spawning or hatching in the reach to be constructed. Specific known spawning areas would be avoided to the extent most practicable. Most construction across waterbodies would occur in the winter and would avoid overwinter habitat. Additional characterization of temporal fish use at proposed stream crossings would be required. Mitigation measures would be implemented for all permitted stream crossings.
Effectiveness Designing the pipeline and if possible scheduling construction to occur when fish are not present would reduce impacts to fish substantially. Fish move to overwinter locations, which often include a pool, or a location with ground water influence. Avoiding these overwinter locations would result in negligible impacts to fish when construction occurs when the waterbodies are frozen. Winter construction would produce minimal sedimentation beyond what would naturally occur when spring break up occurs. Avoiding known spawning areas, which often include upwellings or downwellings, would reduce impacts to the future generations or cohort of fish. Often optimal spawning areas (i.e., appropriate substrate, flow, cover, and depth) are limited; thus by reducing construction through these areas, fish can continue to spawn without reducing productivity.
7. Develop Supplemental Site Specific Fishery Data to Fill in Data Gaps for the Design of Fish Stream Crossings, for Lakes Where Water Would Be Withdrawn During the Winter, and for Snow-Ice Road Construction and Maintenance During Pipeline Construction.
Analysis The AGDC would collect additional information at specific stream crossings to characterize the habitat, to prevent additional impacts to fish and their habitat. This may include confirmation of fish overwinter habitat, identifying upwellings in the substrate, springs, seeps, and important spawning habitat. Lakes may be surveyed further to document springs and seeps, overwinter habitat for fish, and water quality.
Alaska Stand Alone Gas Pipeline 5. 23-40 Final EIS
Effectiveness Obtaining site-specific fish and fish habitat information to determine the least adverse methods of construction by site would substantially reduce impacts to fish. Important life history events and traditional habitats specific for these uses would be preserved. This would result in the reduced likelihood of negatively affecting productivity of the local fish population.
8. Maintain to the Maximum Extent Practicable Existing Stream Hydrologic Regimes and Temperature Regimes at Fish Stream Crossings Throughout the Corridor.
Analysis Measures that may be used to avoid modification of existing stream hydrologic and temperature regimes at fish stream crossings include the following:
• Installation of appropriate erosion control measures.
• Minimizing disturbance in and around the stream during installation of the pipeline.
• Stabilizing and/or restoring areas of stream bed/bank disturbed during construction.
• When appropriate, insulating installed pipe so that it will not influence the temperatures of surrounding soils.
Effectiveness Installing erosion control structures along the stream bank would reduce impacts to fish and their habitat. Erosion control measures would reduce sedimentation, reduce sloughing of the bank, and would allow reestablishment of riparian habitat important for rearing, feeding and spawning. Reducing the time, that heavy equipment is in the water and on the stream banks would reduce the potential for disturbances to habitat, and water quality and for potential contamination of streams from small leaks. Stabilizing and restoring the stream banks would result in regrowth of the riparian habitat, which is required as cover for fish. Restoring the stream banks during construction would produce temporary impacts to fish. Long-term impacts to fish habitat would likely be negligible because the stream banks would be restored immediately during construction. Insulating the pipe would reduce the likelihood of altering the surrounding ambient water and ground temperatures. Altered water or soil temperatures would cause ice damming which would alter fish habitat and potentially cause flooding. Ice dams could reduce available habitat, strand fish, and prevent passage to important habitats.

Alaska Stand Alone Gas Pipeline 5. 23-41 Final EIS
9. Use Construction Methods and Reclamation of Disturbed Areas that Eliminates or Reduces the Potential for Erosion and Sedimentation Reaching Fish Streams.
Analysis See the discussion on the SWPP Plan and Erosion Control Plan above under Soils and Geology mitigation measure #1. Erosion impacts on land have the potential to reach waterbodies, resulting in sedimentation and increased turbidity in streams.
Effectiveness Reducing the potential for sedimentation would reduce impacts to fish survival and health.
10. Minimize Cumulative Effects to Surface Hydrology, Stream Bottom, and Stream Bank Habitats When the Pipeline Crossing of a Fish Stream is Downstream from an Existing Stream Crossing by the Highway, the TAPS, or Other Buried Utility System.
Analysis Stream crossings would be constructed to avoid impacts to the stream morphology and flow characteristics using the measures discussed above. This would assure that construction of stream crossings would not affect upstream highway, TAPS, or buried utility crossings or create cumulative effects to the stream. See Appendix M, Exhibit A, Stipulation 1.4.3.1 (a).
Effectiveness Paying extra attention to the design of stream crossing areas where existing structures occur would reduce impacts to fish by maintaining existing conditions as much as practicable. This would prevent impacts to fish passage, water quality, cover, and substrate.
11. Use Temporary Bridges for Transportation of Construction Equipment and Materials.
Analysis Temporary bridge locations would be determined as the proposed Project develops, and the specifics of their design/construction would vary by location. Assuming any required bridges would be at stream crossings, general considerations would include:
• Install erosion and sedimentation controls prior to bridge installation.
• Avoid placing footings, piers, and other bridge support structures within the stream to the extent possible.
• Stabilize construction disturbances once installation is completed.

Alaska Stand Alone Gas Pipeline 5. 23-42 Final EIS
• Install swales/ditches to prevent surface drainage from entering the stream.
• During installation and removal, avoid operating construction equipment within the stream bed.
Effectiveness See effectiveness of mitigation measure #8 noted above.
12. To the Maximum Extent Practicable, Locate Material Storage, Refueling Activity, Fuel, and Related Liquid Storage at Least 100 Feet from the Bank of a Stream.
Analysis To the maximum extent practicable, a buffer of 100 feet would be maintained throughout the proposed Project to prevent the potential for contamination of petro chemicals (e.g. fuel and oil) into a waterbody. Containment would be placed under each area that houses hazardous materials.
Effectiveness Maintaining a buffer of 100 feet would prevent contaminants from leaching into a waterbody. Contaminants could cause illness, or mortality to fish through their gills or skin. Oil could adhere to aquatic vegetation and stream banks, altering fish habitat. Storing hazardous materials at a distance from a fish stream would prevent the fish stream from becoming contaminated with fuels or lubricants from an incidental spill, or from runoff.
13. Implement Hydrostatic Testing in a Manner that Minimizes the Potential that Freeze Depressants Could be Inadvertently Discharged to Fish Bearing Waters.
Analysis Where freeze depressants are required for hydrostatic testing, the test medium would not be discharged, but would be collected for treatment and proper disposal. Standard operating procedures would be developed for hydrostatic testing, and these procedures would provide for monitoring of the handling and disposal of hydrostatic test fluids.
Effectiveness The freeze depressants would not reach waterbodies because hydrostatic fluids would be collected and disposed of appropriately. Impacts to fish or fish habitat would be prevented due to disposal of hydrostatic testing fluid discharge in contained areas.
Alaska Stand Alone Gas Pipeline 5. 23-43 Final EIS
14. Assure Water Withdrawals Use Appropriately Sized Fish Screens and Other State and Federal Guidelines for Fish Protection.
Analysis The AGDC is required under the ADF&G’s Fish Habitat Permit requirements to use appropriate sized fish screens during water withdrawal. Use of appropriate fish screens would prevent fish from being sucked into a water holding tank, being used to make ice roads and pads and for dust suppression.
Effectiveness The use of appropriate sized mesh screens on pump intake hoses would prevent fish mortality or injury during water withdrawal.
15. The AGDC Would Have an Approved Spill Prevention and Control Plan (SPCP) Prior to Construction.
The SPCP would be developed in accordance with all pertinent regulations and would follow BMPs. The SPCP would identify material handling procedures and storage requirements and outline the actions to reduce spill potential.
Analysis The SPCP would be a regulated document that the AGDC would adhere to for permit compliance.
Effectiveness A SPCP that follows regulations for spill prevention would be designed to prevent a spill from reaching a fish bearing waterbody. Preventing contamination of a fish bearing waterbody would prevent fish illness or mortality, and disturbance to fish habitat.
16. If a New Bridge is Built, No Permanent Structures Associated With the Bridge, Such As Footings, Would Be Installed Within Ordinary High Water of the Yukon River.
Analysis No structures would be placed below the ordinary high water mark in the Yukon River. All structures would be out of the water and located on the riverbanks.
Effectiveness Preventing placement of any structures in the Yukon River would be optimal for fish and their habitat. No impacts should occur to fish by keeping all structures out of the water for development of a suspension bridge.

Alaska Stand Alone Gas Pipeline 5. 23-44 Final EIS
17. In-Stream Pipeline Construction Would Be Completed in One to Three Days from Initiation.
Analysis Temporary construction in the stream to place the pipeline under the waterbody would last from one to three days. The duration would be dependent on the construction season, size and shape of the stream, flow, and other geomorphologic characteristics.
Effectiveness Reducing the duration that heavy equipment is in the steam to construct the pipeline would substantially reduce impacts to fish and their habitat. The longer the duration that the stream is being constructed, the more turbidity and disturbance to instream habitat (e.g., substrate, pool/riffle, and cover). Turbidity can cause irritation to the gills and may cause mortality. In-stream habitat such as pools provides important cover for rearing fish, for refuge, feeding and resting. Impacts to fish would be reduced because of the short duration that equipment would be in the water.
5.23.2.7 Marine Mammal Resources
Vessel use would be the only Project-related activity that would occur in the marine environment, and would occur prior to or during the construction phase of the proposed Project. Vessel use would include the transport of materials and equipment to the West Dock Port and the Port of Seward for proposed Project development. As noted in Section 2.0, vessel use would occur over two seasons during the ice-free period. Disturbances to marine mammals from vessel activity could be in the form of vessel noise, vessel movement, or a potential collision with a marine mammal.
The AGDC would comply with recommendations from the NMFS and USFWS for vessel activity to West Dock, POS and the POA. Mitigation measures would address the species potentially impacted by vessel use. Vessels would operate under strict regulatory laws and standards. Mitigation proposed by the AGDC would reduce potential impacts to marine mammals from auditory damage or mortality from an injury or illness.
5.23.2.8 Threatened & Endangered Species Resources
The proposed Project has the potential to affect species federally listed as endangered, threatened, proposed for listing, candidates for listing, and state listed endangered species. The AGDC would comply with recommendations from the NMFS and USFWS to prevent impacts to Threatened and Endangered (T&E) species to the extent practicable from vessel operations at all proposed port sites and along shipping routes, as outlined in Section 5.23.8. All mitigation measures listed under the Section 5. 23. 6 above would apply to the terrestrial T&E species and the polar bear during breeding, denning, and feeding activities. Mitigation measures would include those identified during Section 7 consultation as part of the NEPA process and as stipulations in permits.

Alaska Stand Alone Gas Pipeline 5. 23-45 Final EIS
5.23.2.9 Land Use Resources
The proposed Project ROW would affect lands owned by the federal government and managed by the BLM, DOD, NPS, and USFWS. The State of Alaska, University of Alaska, AHTNA, Inc., and the Toghotthele Corporation have selected federally owned lands within the proposed Project ROW for their future ownership.
The AGDC has not proposed specific mitigation measures to reduce the effects to land use. However, elements of the proposed Project design would preclude some effects to land use. For example, the proposed pipeline route would generally parallel existing state highway corridors, and existing infrastructure and ROWs would be used for pipeline installation to the extent feasible.
5.23.2.10 Recreation Resources
Although the proposed pipeline alignment was designed to avoid to the greatest extent practicable recreation areas, the mainline pipeline would either cross or be located near (i.e., within less than 1 mile) a number of key recreation features. Proposed Project operations including the mowing and maintenance of vegetation resources along the ROW would likely not affect recreation activities or the quality of recreation opportunities in proximity to the pipeline route. However, while the pipeline would be located underground, there would be restrictions to access in some areas along the proposed ROW, accomplished by the use of large boulders, berms, and/or fencing. Consequently, there could be an adverse impact on general recreation access along the pipeline corridor over the long term, although all existing public access points would be retained. The mitigation measures proposed by the AGDC are listed below.
AGDC Proposed Mitigation Measures
The proposed Project contains a variety of measures intended to avoid or minimize impacts on recreation resources in the proposed Project area during the construction and operations phases of the proposed Project. The AGDC would implement the following mitigation measures that address the effects on tourism and recreations use areas:
1. Retain Existing Public Access Routes and Uses.
Analysis The AGDC would maintain public access to recreational use areas via existing access routes.
Effectiveness The proposed Project would not block public access to recreational areas via existing access roads.

Alaska Stand Alone Gas Pipeline 5. 23-46 Final EIS
2. Minimize Activities in Areas with Tourist-Related Facilities During High Use Periods to the Extent Practicable.
Analysis In establishing the final construction schedule, the AGDC would consult with resource agencies such as the Alaska Division of Tourism and the National Park Service, as well as with owners of potentially affected tourist-related facilities, to identify areas and times of most concern for tourists. To the maximum extent practicable, the AGDC would minimize major construction activities in those areas during times of greatest tourist activities.
Effectiveness Minimizing construction activities during the peak period of recreational use would substantially reduce impacts to local tourism. Obtaining information from tourism agencies would help predict when high use times could occur. Access to parks and other recreational areas and uses associated with the proposed Project would not likely adversely affect tourism due to collaboration with tourism related entities.
3. Minimize Activities in Areas with Public Recreation Facilities During High Use Periods to the Extent Practical.
Analysis See Analysis of mitigation measure #2 above. The AGDC would collaborate with local entities to determine when public use activities are highest. Construction activities would occur outside of these periods and locations as much as practicable.
Effectiveness See Effectiveness of mitigation measure #2 above, but for public recreation facilities.
4. Minimize Creating New Public Vehicular Access to Remote Areas.
Analysis The AGDC would regulate or prohibit access, including vehicular traffic to the extent necessary to facilitate pipeline activities, maintain pipeline integrity, or to protect the public and wildlife from hazards associated with the proposed Project.
The AGDC would build only as many access roads as necessary to the right-of-way to support construction. The AGDC would provide appropriate warnings, flagging, barricades, and other safety measures to regulate public access to the right-of-way during both construction and operations.
Effectiveness Access roads developed for the proposed Project would be regulated, which would minimize creating new public vehicular access to remote areas.

Alaska Stand Alone Gas Pipeline 5. 23-47 Final EIS
5. Minimize Impacts to the Existing Natural Landscape to the Extent Practicable.
Analysis The majority of the ASAP alignment would be located in existing transportation corridors and previously disturbed ground. The ASAP route was selected with the assistance of visual impact experts. The final alignment in areas of the highest visual sensitivity would be designed to minimize the visibility of the pipeline. Measures that may be used include vegetative screening. The AGDC routed access roads to avoid wetlands to the extent feasible.
Effectiveness Collocating the proposed Project route with existing ROWs would substantially reduce impacts to resources. Final design details would reduce visible impacts of the proposed Project. See Wetland mitigation measures (Section 5.23.5) above for details on reducing impacts to the natural landscape as much as practicable.
6. Schedule Preconstruction Work to Minimize Activity During Peak Periods of Tourism and Recreation.
Analysis See Recreation mitigation measures #2 and #3 above.
Effectiveness See Recreation mitigation measures #2 and #3 above.
7. Conduct Early and Continuing Consultation With the Public, Tourism, and Recreation Businesses.
Analysis See Recreation mitigation measures #2 and #3 above.
Effectiveness See Recreation mitigation measures #2 and #3 above.
8. Collocate with Existing and Planned Transportation and Utility System Where Practicable.
Analysis See Recreation mitigation measure #5 above. The AGDC has collocated the proposed Project with existing rights-of-way as much as practicable to reduce impacts to recreational uses.
Alaska Stand Alone Gas Pipeline 5. 23-48 Final EIS
Effectiveness See Recreation mitigation measure #5 above.
5.23.2.11 Visual Resources
Short-term visual impacts associated with construction would occur from clearing and removal of existing vegetation in the ROW, exposure of bare soils, earthwork, trenching, and machinery and pipe storage. Long-term impacts during operations would be associated with the following: maintenance of access along the ROW; various landform changes including earthwork and rock formation alteration; pipeline markers; and new aboveground structures located along the route such as compressor stations, mainline valves, pig launchers/receivers, and a straddle and off-take facility. Short-term visual impacts would be greater during construction and until re-vegetation occurs than during operations and maintenance.
AGDC Proposed Mitigation Measures
The AGDC has proposed a variety of measures to minimize impacts on visual resources in the proposed Project area during the construction and operations phases of the proposed Project. These measures would include:
1. Review the Practicality of Avoiding or Minimizing Significant Adverse Effects on Visual Resources Created by the Construction and Operation of the Proposed Project and Incorporate Proven Mitigation Measures Into the Design and Location of the Project Where Appropriate.
Analysis The ASAP route was selected with the assistance of visual impact experts, and the final alignment in areas of the highest visual sensitivity would be designed with mitigation measures such as vegetative screening to minimize its visibility. In addition, new access roads built for the project would be aligned to minimize the line of sight to the right-of-way.
Effectiveness Vegetative screening would maintain the visual aesthetics of the area as wilderness. Building access roads behind hills or wooded areas would reduce visual impacts substantially.
2. Minimize the Construction of New Permanent Access Roads by Using Snow-Ice Roads During Construction.
Analysis Snow and ice roads would be used as much as possible in the Arctic and Sub Arctic regions to access the ROW to construct the pipeline. Ice roads could be constructed by
Alaska Stand Alone Gas Pipeline 5. 23-49 Final EIS
scraping ice from ponds that freeze to the bottom in the winter. Ice would be placed along the surveyed ice road alignment and water would be sprayed on top of the ice to create a solid foundation for equipment access. Properly constructed ice roads would be maintained to last the winter construction season. Ice roads and pads would melt during the summer leaving a minimal trace.
Effectiveness Snow and ice road development would reduce visual impacts substantially; by reducing the number of permanent gravel roads. Scheduling construction during the winter months when ice roads could be used would maintain the natural condition (aesthetics) of the area with minimal to negligible disturbance to soils, vegetation or wildlife habitat. The ice roads would be built to withstand the heavy equipment use, but would melt in the summer, leaving the area as close to its original conditions as much as possible.
3. Restore the Construction Zone in a Manner that Facilitates Reestablishment of the Adjacent Natural Vegetation.
Analysis All disturbed areas would be left in a stabilized condition; therefore, erosion in excess of natural rates would be minimized until the practicable restoration and revegetation can be accomplished. Revegetation of disturbed areas would be conducted as soon as practicable and, if necessary, would be repeated until revegetation is successful. Where practicable, native seeds and vegetation would be applied; otherwise, seed mixes free of invasive species would be used. Areas to be seeded may be prepared by various methods, including grading, scarifying, and application of soil amendments such as fertilizers. Application of seed would be by hand or a hydro seeding process. Plantings of native shrubs and trees would be considered where necessary to improve soil stability and for screening purposes in sensitive viewsheds.
Effectiveness Restoring construction areas by rehabilitation of vegetation would reduce impacts from erosion processes. Native seed mixes would be optimal for use to sustain the natural vegetation in the area for visual aesthetics as well as for wildlife forage and habitat. Native species are likely to survive the climate and conditions during rehabilitation of the area, which would result in higher success of vegetation establishment in the ROW.
4. Use Root Balls, Salvaged Native Plant Materials, and Topsoil Removed From the Construction Footprint for Redistribution on Disturbed Areas Where Feasible.
Analysis Organic materials would be distributed across disturbed areas, to rehabilitate the area to a more natural state. Excess material such as root balls and soil would be spread to provide a foundation for native plants to establish and rehabilitate the area.

Alaska Stand Alone Gas Pipeline 5. 23-50 Final EIS
Effectiveness Dispersal of excess topsoil and woody material like root balls would provide a foundation for native seed and plants to reestablish over time. These areas would provide cover and habitat for wildlife and would reduce the visual impacts of disturbed areas by rehabilitating them into a more natural condition. Once vegetation is re-established on disturbed sites, visual impacts would be minimal.
5. Maintain a screening of Existing Natural Vegetation When the Pipeline is Offset From a Highway.
Analysis See Visual resources mitigation measure #1 above.
Effectiveness See Visual resources mitigation measure #1 above.
6. Use Existing Disturbed Areas to the Maximum Extent Practicable for Temporary Construction Activities Such as Construction Camps, Material Stockpiling, Pipe Jointing, and Pipe Bending;
Analysis See Visual resources mitigation measure #3 above.
Effectiveness See Visual resources mitigation measure #3 above.
7. Minimize Locating Pipeline Facilities, New Material Sites, and Construction Material Stockpiling in Places With Special Visual Resource Values that Would Be Visible to the Public.
Analysis The ASAP route was selected with the assistance of visual impact experts, and the final alignment in areas of the highest visual sensitivity would be designed with mitigation measures including vegetative screening to minimize its visibility. To the extent most practicable, construction material for the proposed Project would not be stockpiled in areas with special visual resource values that would be visible to the public. The pipeline would be located to provide a buffer of undisturbed land at least 500 feet wide between the pipeline and streams, unless otherwise approved by state and federal land management agencies.
Alaska Stand Alone Gas Pipeline 5. 23-51 Final EIS
Undisturbed vegetative screens at least 500 feet wide would be maintained between material sites and highways unless otherwise approved by state and federal land management agencies.
Effectiveness Avoiding placing project related facilities in places with special visual resource values that would be visible to the public would reduce visual impacts to the public by reducing their visibility of facilities and proposed Project related activities. Maintaining a natural vegetation buffer around these areas should provide minimal visual impact if any to the public in the area. The majority of the ASAP alignment would be located in existing transportation corridors and previously disturbed ground.
8. Blend the Pipeline System into the Natural Setting to the Extent Practicable When Crossing Places with High Visual Resource Value.
Analysis See Visual resources mitigation measure #7.
Effectiveness See Visual resources mitigation measure #7.
9. Use Revegetation Species that are Appropriate for the General Area.
Analysis See Visual resources mitigation measure #3, and Terrestrial Vegetation mitigation measure #5.
Effectiveness See Visual resources mitigation measure #3, and Terrestrial Vegetation mitigation measure #5.
10. Re-Grade Construction Disturbances to a Condition that Blends With the Surrounding Terrain and Surface Drainage Patterns.
Analysis The AGDC would grade the ROW area after construction as close as practicable to its pre-construction condition and rehabilitate it. The AGDC would follow revegetation techniques and mitigate as stated in the Terrestrial Vegetation mitigation measures, #1, #3, and #5.

Alaska Stand Alone Gas Pipeline 5. 23-52 Final EIS
Effectiveness Maintaining the natural grade of the landscape would reduce potential impacts of erosion, encourage vegetation re-establishment, and protect visual resources. See Terrestrial Vegetation mitigation measures for #1, #3, and #5.
11. Monitor Reclaimed, Disturbed Construction Areas and Take Remedial Action Where Expected Revegetation Success is Not Achieved.
Analysis The AGDC would coordinate with experts in reclamation and with state and federal resource agencies to develop a monitoring plan that would stipulate the frequency and duration of monitoring to ensure the success of reclamation of disturbed areas. Monitoring would continue for as long as necessary to achieve this goal.
Effectiveness The monitoring plan would have success criteria, to ensure that reclamation of the disturbed areas would be successful. Visual impacts would be temporary, due to the stipulation that monitoring would be required until full reclamation had been reached.
5.23.2.12 Social and Economic Resources
It is anticipated that the proposed Project-related employment and income would create a positive economic impact in the State of Alaska, particularly in the proposed Project area.
AGDC Proposed Mitigation Measures
The AGDC proposes to implement the following mitigation measures to address the effects on socioeconomics:
1. Time Construction Activities to Minimize Impacts to Subsistence Activities Where Possible.
Analysis In establishing the final construction schedule, the AGDC would consult with resource agencies including the ADF&G and DOI, as well as with subsistence users, to identify areas of most concern for subsistence activities. To the maximum extent practicable, the AGDC would either schedule construction to avoid disturbance of subsistence activities or would provide access for subsistence users to areas near the work sites.
Effectiveness Consultation among the AGDC, regulatory staff, and subsistence users of the area would develop the appropriate schedule to the extent most practicable for construction of the proposed Project. Local knowledge and regulatory input would produce the best result for

Alaska Stand Alone Gas Pipeline 5. 23-53 Final EIS
negotiating subsistence activities with the timeline of the proposed Project. Subsistence activities would not likely be adversely impacted due to collaborations of all entities.
2. Time Construction Activities to Minimize Impacts to High-Use Tourist and Local Recreation Seasons (e.g., Wildlife Viewing, Hunting Snow Machining, and Dogsledding).
Analysis The AGDC would consult with resources agencies including the Alaska Division of Tourism and the National Park Service, as well as with owners of potentially affected tourist-related facilities, to identify areas and times of most concern for tourists. To the maximum extent practicable, AGDC would minimize major construction activities in those areas during times of greatest tourist and local recreational activities. This would be determined when the final construction schedule is developed later in the process. See Recreation Resource mitigation measures #2 and #3 above.
Effectiveness Minimizing construction activities during peak periods of tourist and recreational use would substantially reduce impacts to local tourism. Obtaining information from tourism agencies would help predict when high use times could occur. Access to parks and other recreational areas and uses associated with the proposed Project would not likely adversely affect tourism due to collaboration with tourism related entities. Impacts to high tourist and local recreation uses would be minimal based on coordination and collaborations between the AGDC, state and local representatives.
3. Time Construction Activities to Minimize Impacts to Local Business (i.e., Avoid Summer and Fall Construction in Recreational and Tourist Areas).
Analysis See Social and Economic Resources mitigation measure #2 above.
Effectiveness See Social and Economic Resources mitigation measure #2 above.
4. Develop and Implement Traffic Control Plans to Minimize Negative Impacts to Local Businesses by Blocking Access During Construction.
Analysis Construction activity in highway rights-of-way would be governed by a highway use agreement between the AGDC and the Alaska Department of Transportation and Public Facilities (DOT&PF). The DOT&PF would issue individual permits for various locations, and these permits would include stipulations for maintaining public access.

Alaska Stand Alone Gas Pipeline 5. 23-54 Final EIS
The AGDC would work with affected businesses to ensure that access is provided and appropriate temporary signage is installed. To the extent practicable, the AGDC would schedule major construction activities to avoid peak business times of the day.
Effectiveness The AGDC would adhere to permit requirements of the DOT&PF rights-of-way to maintain public access through the construction area. A traffic control plan would reduce impacts to local business traffic during the period of construction.
5. Identify and Promote Work Opportunities for Local Residents:
a) Prepare an Economic Opportunity Plan to describe how the proposed Project would operate to enhance locally based economic and employment opportunities for Alaska residents and businesses;
b) Coordinate with the local village corporation, tribal government, city government, and other groups to identify qualified individuals that are interested in working on the proposed Project; and
c) Promote use of local businesses to support the proposed Project (e. g. , lodging, food, services, and sundries).
Analysis The Economic Opportunity Plan would describe how the project would operate to enhance locally based economic and employment opportunities for Alaska residents and businesses. The AGDC would coordinate with the local village corporation, tribal government, city government, and other groups to identify qualified individuals who are interested in working on the proposed Project.
Effectiveness The Economic Opportunity Plan would provide opportunities for local businesses and individuals to work on the proposed Project.
6. Develop Training Programs for Local Residents So That They Can Be Employed During Construction and O&M.
Coordinate with Alaska training centers and universities on workforce development and training opportunities, which may include, but are not limited to, future job fairs in the region.
Analysis Training programs would likely provide on-the-job training for a specific trade or skill set needed for construction activities for the proposed Project.
Alaska Stand Alone Gas Pipeline 5. 23-55 Final EIS
Effectiveness Jobs would result from the proposed Project, employing local residents along the proposed route.
5.23.2.13 Cultural Resources
Direct effects to cultural resources within the pipeline ROW and indirect effects to cultural resources within a one-mile of the ROW have the potential to occur because of the proposed Project. Mitigation of adverse effects to cultural resources would be the subject of consultation among the Project proponent, the permitting agency, interested groups, parties, governments and tribes. The intended result of this consultation process would be a programmatic agreement or other agreement satisfactory to the parties and compliant with relevant legislation and law, as described in the Regulatory Environment.
AGDC Proposed Mitigation Measures
The AGDC has proposed the following mitigation measures to address effects on cultural resources:
1. Avoidance of Documented Cultural Resources.
Analysis The construction activities for the proposed Project would be governed by a programmatic agreement for implementation of Section 106 of the Historic Preservation Act (16 U.S.C. 470 et seq.) between the USACE and the Advisory Council on Historic Preservation. Locations of documented sites that could be affected by proposed Project activities would be determined through consultation with the State of Alaska Office of History and Archaeology (OHA) and through surveys by professional archaeologists of the right-of-way, access roads, and camp and facility locations.
The AGDC would take the necessary steps to protect these cultural sites and any confidential information provided by OHA. The AGDC would also take affirmative responsibility to require its agents, employees, contractors, and the employees of each of them to protect cultural resources.
Effectiveness Known and newly discovered cultural resources would not be impacted by the proposed Project under the terms of the programmatic agreement.

Alaska Stand Alone Gas Pipeline 5. 23-56 Final EIS
2. Archaeological Excavation, Analysis, and Documentation of All or Part of the Cultural Resource Site and Development of an Unanticipated Cultural Discoveries Plan.
Analysis If cultural sites or suspected sites are discovered during the course of pipeline activities, the AGDC would cease the activities that may disturb or damage the site, and would immediately notify OHA so that the site could be checked by professional archaeologists. The AGDC would not proceed with the activity at the location without OHA approval. Additional avoidance and mitigation measures would be prescribed in the programmatic agreement for the proposed Project between the USACE and the Advisory Council on Historic Preservation.
Effectiveness Development of an Unanticipated Cultural Discoveries Plan would outline the exact process to follow if an unexpected cultural discovery occurred during construction of the proposed Project. Professional archaeologists would conduct the excavation and analysis of cultural sites to preserve and record all data found. This plan would reduce impacts to cultural resources substantially.
3. Perform Historic American Building Survey/Historic American Engineering Record (HABS/HAER)-Level Documentation for Historic Buildings and Structures.
Analysis HABS/HAER documentation would be completed for historic structures prior to pipeline construction and support activities.
Effectiveness Documentation of HABS/HAER would preserve these historic locations from disturbance of proposed Project development.
4. Perform Archaeological Monitoring of Construction Activities.
Analysis Archaeological monitoring may be conducted during construction activities. Interpretive material may be completed as soon as appropriate, which could occur during or after construction activities. Professional archaeologists would conduct the excavation and analysis of cultural sites to preserve and record all artifacts found.
Effectiveness Archaeological monitoring of construction activities would aid in the preservation of artifacts found during the construction of the proposed Project.
Alaska Stand Alone Gas Pipeline 5. 23-57 Final EIS
5. Provide Interpretation for and Involvement of the Public.
Examples include brochures, signage, or partnering with local schools, museums, and/or heritage preservation groups.
Analysis The AGDC would involve the public as much as possible by posting and updating information in local public facilities. This may include involving the public in educational events held by the AGDC in the community.
Effectiveness Informing the local communities directly associated with construction activities of the proposed Project would reduce impacts through awareness. Making the communities aware of construction schedules and specific events would reduce impacts to cultural activities.
6. Consult with State and Federal Agency Historic Preservation Officers.
Analysis The AGDC would consult with appropriate state and federal staff to work within the boundaries to protect cultural resources to the maximum extent possible. Historic preservation officers would provide the AGDC with guidance as needed.
Effectiveness Consultation between the AGDC and federal and state historic preservation officers would reduce the likelihood of affecting cultural resources. The AGDC would follow regulations to protect cultural resources as per guidance from government staff.
7. Consult with Alaska Native Tribes.
Analysis Communication between the AGDC and local tribes and ANCSA corporations would occur on a regular basis, through meetings and other regular correspondence, in particular if native land would be accessed. Ongoing consultation with Alaska Native Tribes would provide a foundation for communication that would help address issues that arise over construction of the proposed Project.
Effectiveness Maintaining regular correspondence with native tribes and ANCSA corporations along the proposed Project route would provide for knowledge sharing opportunities to protect and respect cultural resources, traditions and their private land.

Alaska Stand Alone Gas Pipeline 5. 23-58 Final EIS
5.23.2.14 Subsistence Resources
Subsistence use impacts common to the proposed Project would include direct and indirect effects on subsistence use areas, user access, resource availability, and competition in those areas.
AGDC Proposed Mitigation Measures
The AGDC has proposed the following mitigation measures that would address effects on subsistence activities:
1. Identify Locations and Times When Subsistence Activities Occur, and Minimize Work During These Times and In These Areas to the Maximum Extent Practicable.
Analysis See Social and Economic Resources mitigation measure #1 above.
Effectiveness See Social and Economic Resources mitigation measure #1 above.
2. Schedule Work (e.g., Blasting) to Avoid Conflict with Subsistence Activities When Possible.
Analysis The AGDC would consult with resource agencies such as the Alaska Department of Fish and Game and the Department of Interior, as well as with subsistence users, to identify areas of most concern for subsistence activities. To the maximum extent practicable, the AGDC would either schedule construction to avoid disturbance of subsistence activities or would provide access for subsistence users to areas near the work sites.
Effectiveness The AGDC would reduce impacts to subsistence users by scheduling blasting activities as much as practicable when subsistence activities are not occurring.
3. Notify Workers That Subsistence Activities are Ongoing in the Area and Direct Them to Avoid Activities that May Affect the Activities (e.g., Not Removing Trap Line Markers).
Analysis The AGDC would notify employees as much as possible by posting and updating subsistence activities information. This may include involving the public in educational events held by the AGDC in the community. Communication between the AGDC and local tribes and ANCSA corporations would occur on a regular basis, through meetings and other regular correspondence, in particular if native land would be accessed. Ongoing
Alaska Stand Alone Gas Pipeline 5. 23-59 Final EIS
consultation with Alaska Native Tribes would provide a foundation for communication that would help address issues that arise over construction of the proposed Project.
Effectiveness Informing workers of the subsistence activities as they occur would reduce impacts to subsistence users and subsistence activities due to disturbance from construction. Informing the workers directly would reduce impacts through awareness. Making the communities aware of construction schedules and specific events would reduce impacts to subsistence activities. Maintaining regular correspondence with native tribes and ANCSA corporations along the proposed Project route would provide for knowledge-sharing opportunities to protect and respect subsistence resources, traditions and their private land.
4. Develop a Wildlife Avoidance and Human Encounter/Interaction Plan to be implemented for the construction and operation of the proposed Project to avoid impacts to subsistence species.
Analysis The AGDC Wildlife Avoidance and Human Encounter/Interaction Plan would be developed in consultation with ADF&G and USFWS. The plan would include considerations for both polar bears on the North Slope and brown and black bears elsewhere, as well as for birds e. g. , (ravens, gulls, etc. ) and terrestrial mammals (e. g. , foxes, squirrels, etc. ). The plan would include such considerations as:
• Identifying high-risk areas such as bear denning locations known to ADF&G and USFWS.
• Laying out camps and other facilities to minimize locations where bears and other animals can hide and surprise workers.
• Use of armed bear monitors where necessary in remote locations.
• Managing food and wastes to avoid attracting wildlife.
• Educating employees on how to avoid and report wildlife encounters, and not to feed wildlife.
• Coordination with resource agencies before construction begins.
• Notification and reporting requirements for wildlife encounters.
• Posting of warning signs and placards.
• Procedures for handling dead or injured wildlife.
Alaska Stand Alone Gas Pipeline 5. 23-60 Final EIS
Effectiveness This plan would reduce encounters between construction activities and wildlife, which would reduce disturbance to subsistence resources and users.
5. Develop a Subsistence Plan of Cooperation to Mitigate Potential Conflicts Between Proposed Project Activities and Subsistence Activities.
Analysis The details of the Subsistence Plan of Cooperation would be determined later in the process. It would generally describe the process to resolve issues where project activities could conflict subsistence activities.
Effectiveness The development of this plan would reduce impacts to subsistence users and activities through collaboration.
5.23.2.15 Public Health Resources
Several public health impacts could occur during both the 2.5-year construction and 30+year operation phases. Impacts could occur to water and sanitation, health infrastructure and delivery, food, nutrition and subsistence, and social determinants of health. Negative impacts could include accidents/injuries, an unhealthy degree of exposure to hazardous materials, outbreak of infectious diseases (perhaps transmitted by pipeline construction workers), and an increase in non-communicable and chronic diseases. Positive impacts are also likely to occur. For example, public health in the Fairbanks area would improve because of improved air quality from the substitution of natural gas for other fuels. The proposed Project and a Fairbanks gas distribution system would provide an available and reliable source of natural gas and reduce reliance on wood, fuel oil and other energy sources that have greater adverse effect on air quality than natural gas. The public health benefits associated with improved air quality are described in detail in Section 5.15, Public Health.
Numerous mitigation measures are discussed in the POD and in the lease stipulations that are relevant to possible health impacts. An outreach program is suggested to raise awareness are about contagious illnesses (such as influenza) and STDs and is described in Section 5.15, Public Health. The AGDC has not proposed specific mitigation measures to reduce effects to public health.
5.23.2.16 Air Resources
Air quality effects associated with construction of the proposed Project would include emissions from fossil-fuel powered construction equipment, fugitive dust, and open burning. Total worst-case emissions that would occur from construction and operations are estimated to be 1,059,100 tpy for CO2, 21,740 tpy for NOx, 8,008 for CO, 2,304 for VOC,

Alaska Stand Alone Gas Pipeline 5. 23-61 Final EIS
and 165,075 tpy for PM-10. Emissions from the pipeline itself would be non-existent. Preliminary emission estimates for the GCF would trigger the requirement for a PSD permit for NOx, CO, VOC, PM-10, PM-2. 5, and GHGs. For the compressor stations and straddle and off-take facility, preliminary estimates would trigger the requirement for a PSD permit for NOx.
AGDC Proposed Mitigation Measures
Air quality impacts associated with the proposed Project would be reduced by the AGDC’s proposed mitigation measures listed below:
1. Implement BMPs During Construction Activities to Mitigate Fugitive Dust and Reduce Particulate Matter Emissions.
Analysis BMPs for dust control would be based on the EPA’s National Menu of BMPs, Construction Site Stormwater Runoff Control, Erosion Control2.
These BMPs include:
• Minimizing the time that disturbed ground is exposed;.
• Using water to prevent windborne dust from leaving the construction site and gravel roads;.
• Limiting the speed of construction equipment to minimize dust creation. ;
• Sweeping paved public roads of dirt left by construction vehicles.
Other potential measures would include installation of wind barriers and use of other approved dust palliatives such as calcium chloride or magnesium chloride.
Effectiveness Development of BMPs would reduce impacts to air quality by reducing particulate matter in the air from construction activities.
2. Use Best Available Control Technology (BACT) for Combustion Equipment to Mitigate NOx and CO Emissions.
Analysis BACT for stationary combustion equipment includes the use of emission units that meet the requirements of the EPA New Source Performance Standards in 40 CFR Part 60, the EPA Maximum Achievable Control Technology (MACT) standards in 40 CFR Parts 61 and 63, and the exclusive use of natural gas fuel in all stationary combustion equipment.
2 http://cfpub2.epa.gov/npdes/stormwater/menuofbmps/index.cfm.

Alaska Stand Alone Gas Pipeline 5. 23-62 Final EIS
BACT for construction equipment includes the use of machinery and vehicles meeting the EPA mobile source regulations in 40 CFR Parts 86, 89 and 90. It also includes the use of ultra-low-sulfur diesel fuel in all diesel engines and the maintenance and operation of all construction machinery and vehicles in accordance with manufacturer’s recommendations to maintain low emissions.
Effectiveness The use of BACT would reduce air emissions substantially for the use of construction equipment for the proposed Project.
3. Use Ultra Low-Sulfur-Diesel Fuel for Construction Equipment and Non-Natural Gas Combustion Equipment (to Mitigate SO2 Emissions), Particulate Matter Emissions and Volatile Organic Compound (VOC) Emissions.
Analysis The AGDC would implement the use of ultra low sulfur diesel fuel for all non-natural gas combustion equipment as much as possible for construction of the proposed Project.
Effectiveness The use of ultra low sulfur diesel fuel for equipment working on the proposed Project would reduce impacts to air quality in the proposed Project area.
4. Operate All Combustion Equipment in Accordance with Manufacturer’s Specifications to Mitigate NOx, CO, VOC, and Particulate Emissions Resulting from Incomplete Combustion.
Analysis The AGDC would implement the use of ultra-low-sulfur diesel fuel in all diesel engines. All equipment used during construction and operation of the proposed Project would be maintained properly under the manufacturer’s specifications.
Effectiveness Maintaining equipment properly at manufacturer’s specifications would reduce the amount of NOx, CO, VOC, and particulate matter emitted into the air from proposed Project activities.
5. Maintain Emissions Control Equipment in Accordance with Manufacturer’s Specifications to Mitigate Emissions and Maintain Emission Control Efficiency.
Analysis The AGDC would implement the use of ultra-low-sulfur diesel fuel in all diesel engines. All equipment used during construction of the proposed Project would be maintained according to the manufacturer’s specifications.
Alaska Stand Alone Gas Pipeline 5. 23-63 Final EIS
Effectiveness Maintaining equipment properly at manufacturer’s specifications would reduce the air emissions from proposed Project activities.
5.23.2.17 Noise Resources
Construction noise levels would fluctuate depending on the number and type of equipment in use at any time. There would be periods when large equipment is not operating and noise would be at or near ambient levels. In addition, construction-related sound levels experienced by a noise sensitive receptor near construction activity would vary by distance. Ground-borne vibration would also occur in the immediate area of construction activities, particularly if rock drilling, pile driving, or blasting is required. Noise levels from the industrial equipment at the proposed gas conditioning facility and compressor stations would be approximately 85 to 95 dBA at 50 feet.
AGDC Proposed Mitigation Measures
Noise and vibration impacts associated with the proposed Project would be reduced by use of the AGDC’s proposed mitigation measures:
1. Development and Implementation of a Noise Abatement Program.
Analysis Areas of concern for loud noise levels would be identified prior to construction. Special work hours and/or special time-of-year considerations would be reviewed and implemented if practicable.
Effectiveness The Noise Abatement Program would reduce impacts to humans and wildlife within hearing range of facilities or activities associated with the proposed Project.
2. Development and Implementation of a Construction Communications Plan to Inform Adjacent Residences of Construction Activities.
Analysis Residences within a specific range of construction operations would be identified and contacted, prior to the commencement of construction activities. Pre-construction public meetings would be held in areas of concern. Other communication methods would include notices in local papers, direct mailing, maintaining a Project website, and periodic updates.
Alaska Stand Alone Gas Pipeline 5. 23-64 Final EIS
Effectiveness The Construction Communications Plan would aid in informing residents of the area about the construction schedule and associated activities, to reduce the impacts from noise produced by the proposed Project.
5.23.2.18 Navigation Resources
Impacts to navigation proposed for each pipeline stream crossing are expected to be minimal and temporary. The proposed Project would have ten stream crossings that have been determined to be navigable by the USACE. One new and up to three existing bridges may also be used to cross a few navigable waterways. Structures crossing navigable streams would be designed and constructed in compliance with federal and state regulations, standards, and specifications for crossings of navigable waterways (see Sections 5.18.1 and 5.18.2). The AGDC has not proposed specific mitigation measures to reduce the effects to Navigation Resources.

Alaska Stand Alone Gas Pipeline 5.23-65
Final EIS
TABLE 5.23-1 Federal, State, and Borough Permits Required for the Proposed Project
Jurisdiction Permit Title Criteria Agency Laws and Regulations Federal Permits &
Approvals Clean Water Act
Section 404, Rivers and Harbors Act
Section 10 Permit
Section 404 of the Clean Water Act allows materials to be placed in wetlands and rivers. Section 10 of the Rivers and Harbors Act ensures that discharges in rivers or offshore areas do not harm the navigability of those waters.
U. S. Army Corps of Engineers Section 404 of the Clean Water Act and Section 10 of the Rivers and Harbors Act: Section 404 of the Clean Water Act requires authorization for placement or discharge of dredged and/or fill material into waters of the United States, including wetlands (33 U. S. C. 1344). Section 10 of the Rivers and Harbors Act of 1899 requires approval prior to the accomplishment of any work in, over, or under navigable waters of the United States, or which affects the course, location, condition or capacity of such waters (33 U. S. C. 403). Other Applicable Laws: • Clean Air Act • Clean Water Act • Coastal Zone Management Act • Endangered Species Act • Executive Order 11988 (Floodplain Management) • Executive Order 11990 (Protection of Wetlands) • Executive Order 12898 (Environmental Justice) • Executive Order 13175 (Government-to-Government Consultation) • Executive Order 13186 (Migratory Birds) • Fish and Wildlife Coordination Act • Magnuson-Stevens Fishery Conservation and Management Act • Marine Mammal Protection Act • Migratory Bird Treaty Act • National Environmental Policy Act • National Historic Preservation Act • Native American Grave Protection and Repatriation Act • Wild and Scenic Rivers Act Applicable Regulations: • 33 CFR Parts 320–332 • 40 CFR Part 230 [contains 404(b)(1) guidelines]

Alaska Stand Alone Gas Pipeline 5.23-66
Final EIS
TABLE 5.23-1 Federal, State, and Borough Permits Required for the Proposed Project
Jurisdiction Permit Title Criteria Agency Laws and Regulations Federal Permits &
Approvals Federal Right-of-Way
Grant Allow long-term use of federal lands for project activities associated with the pipeline and compressor stations.
Bureau of Land Management Mineral Leasing Act: Allows that rights-of-way through any federal lands may be granted by the Secretary of Interior or appropriate agency head for pipeline purposes for the transportation of oil, natural gas, synthetic liquid or gaseous fuels (30 U. S. C. 185). Other Applicable Laws: • Alaska National Interest Lands Conservation Act • Archaeological Resource Protection Act • Bald and Golden Eagle Protection Act • Comprehensive Environmental Response, Compensation and Liability Act • Endangered Species Act • Executive Order 11988 (Floodplain Management) • Executive Order 11990 (Protection of Wetlands) • Executive Order 12898 (Environmental Justice) • Executive Order 13175 (Government-to-Government Consultation) • Executive Order 13186 (Migratory Birds) • Federal Land Policy and Management Act • Magnuson-Stevens Fishery Conservation and Management Act • Marine Mammal Protection Act • Materials Act • Migratory Bird Treaty Act • National Environmental Policy Act • National Historic Preservation Act • Paleontological Resources Preservation Act • Safe Drinking Water Act • Wild and Scenic Rivers Act • Wilderness Act Applicable Regulations: • 43 CFR Parts 2880–2888

Alaska Stand Alone Gas Pipeline 5.23-67
Final EIS
TABLE 5.23-1 Federal, State, and Borough Permits Required for the Proposed Project
Jurisdiction Permit Title Criteria Agency Laws and Regulations Federal Permits &
Approvals Letter of Authorization, U. S. Fish and Wildlife
Service
Preserve integrity of marine mammal populations while allowing isolated incidents of harassment, injuries, or deaths as a result of activity.
U. S. Fish and Wildlife Service Section 101(a)(5) of the Marine Mammal Protection Act: Restricts the taking, possession, transportation, selling, offering for sale and importing of marine mammals (16 U. S. C. 1361–1362, 1371–1389, 1401–1407, 1421, 1423). Other Applicable Laws: • Endangered Species Act • National Environmental Policy Act Applicable Regulations: • 50 CFR Part 18
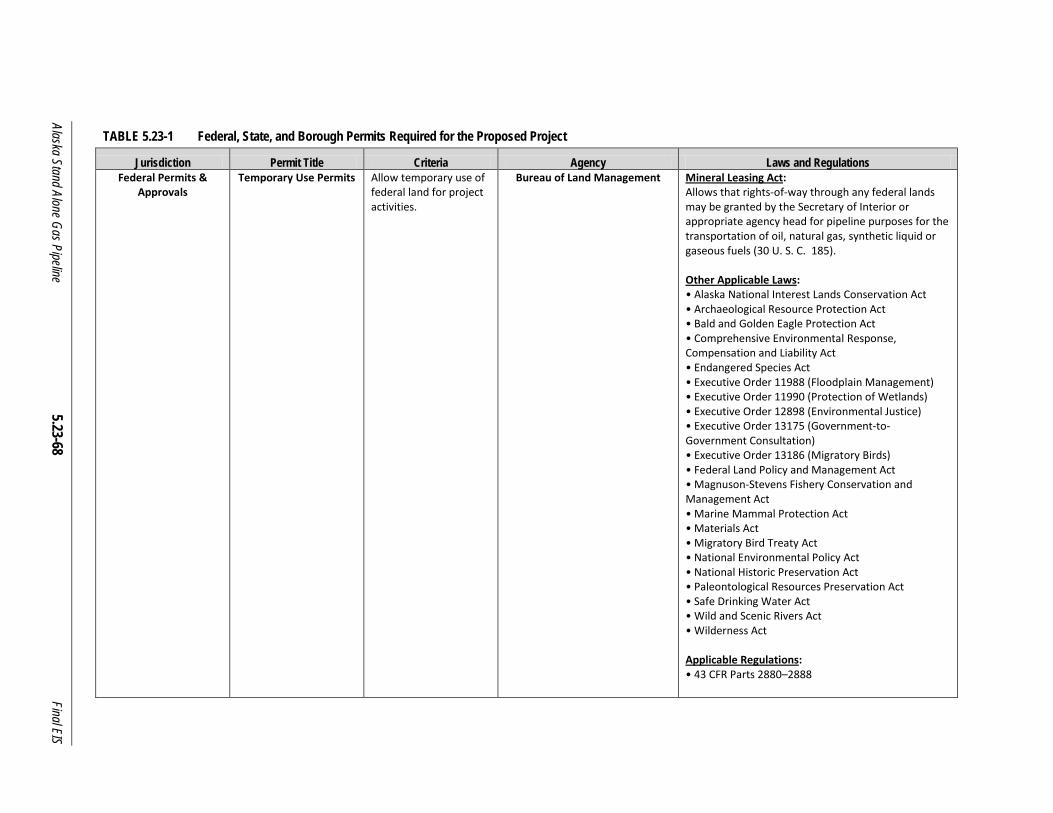
Alaska Stand Alone Gas Pipeline 5.23-68
Final EIS
TABLE 5.23-1 Federal, State, and Borough Permits Required for the Proposed Project
Jurisdiction Permit Title Criteria Agency Laws and Regulations Federal Permits &
Approvals Temporary Use Permits Allow temporary use of
federal land for project activities.
Bureau of Land Management Mineral Leasing Act: Allows that rights-of-way through any federal lands may be granted by the Secretary of Interior or appropriate agency head for pipeline purposes for the transportation of oil, natural gas, synthetic liquid or gaseous fuels (30 U. S. C. 185). Other Applicable Laws: • Alaska National Interest Lands Conservation Act • Archaeological Resource Protection Act • Bald and Golden Eagle Protection Act • Comprehensive Environmental Response, Compensation and Liability Act • Endangered Species Act • Executive Order 11988 (Floodplain Management) • Executive Order 11990 (Protection of Wetlands) • Executive Order 12898 (Environmental Justice) • Executive Order 13175 (Government-to-Government Consultation) • Executive Order 13186 (Migratory Birds) • Federal Land Policy and Management Act • Magnuson-Stevens Fishery Conservation and Management Act • Marine Mammal Protection Act • Materials Act • Migratory Bird Treaty Act • National Environmental Policy Act • National Historic Preservation Act • Paleontological Resources Preservation Act • Safe Drinking Water Act • Wild and Scenic Rivers Act • Wilderness Act Applicable Regulations: • 43 CFR Parts 2880–2888
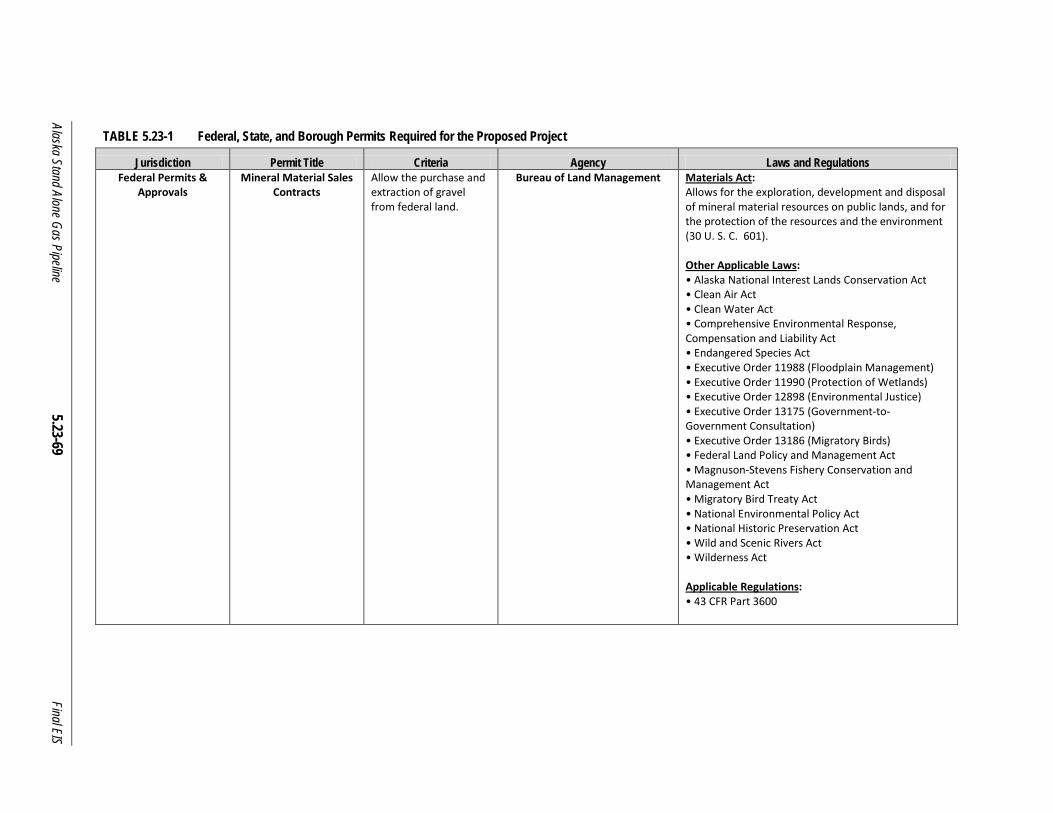
Alaska Stand Alone Gas Pipeline 5.23-69
Final EIS
TABLE 5.23-1 Federal, State, and Borough Permits Required for the Proposed Project
Jurisdiction Permit Title Criteria Agency Laws and Regulations Federal Permits &
Approvals Mineral Material Sales
Contracts Allow the purchase and extraction of gravel from federal land.
Bureau of Land Management Materials Act: Allows for the exploration, development and disposal of mineral material resources on public lands, and for the protection of the resources and the environment (30 U. S. C. 601). Other Applicable Laws: • Alaska National Interest Lands Conservation Act • Clean Air Act • Clean Water Act • Comprehensive Environmental Response, Compensation and Liability Act • Endangered Species Act • Executive Order 11988 (Floodplain Management) • Executive Order 11990 (Protection of Wetlands) • Executive Order 12898 (Environmental Justice) • Executive Order 13175 (Government-to-Government Consultation) • Executive Order 13186 (Migratory Birds) • Federal Land Policy and Management Act • Magnuson-Stevens Fishery Conservation and Management Act • Migratory Bird Treaty Act • National Environmental Policy Act • National Historic Preservation Act • Wild and Scenic Rivers Act • Wilderness Act Applicable Regulations: • 43 CFR Part 3600
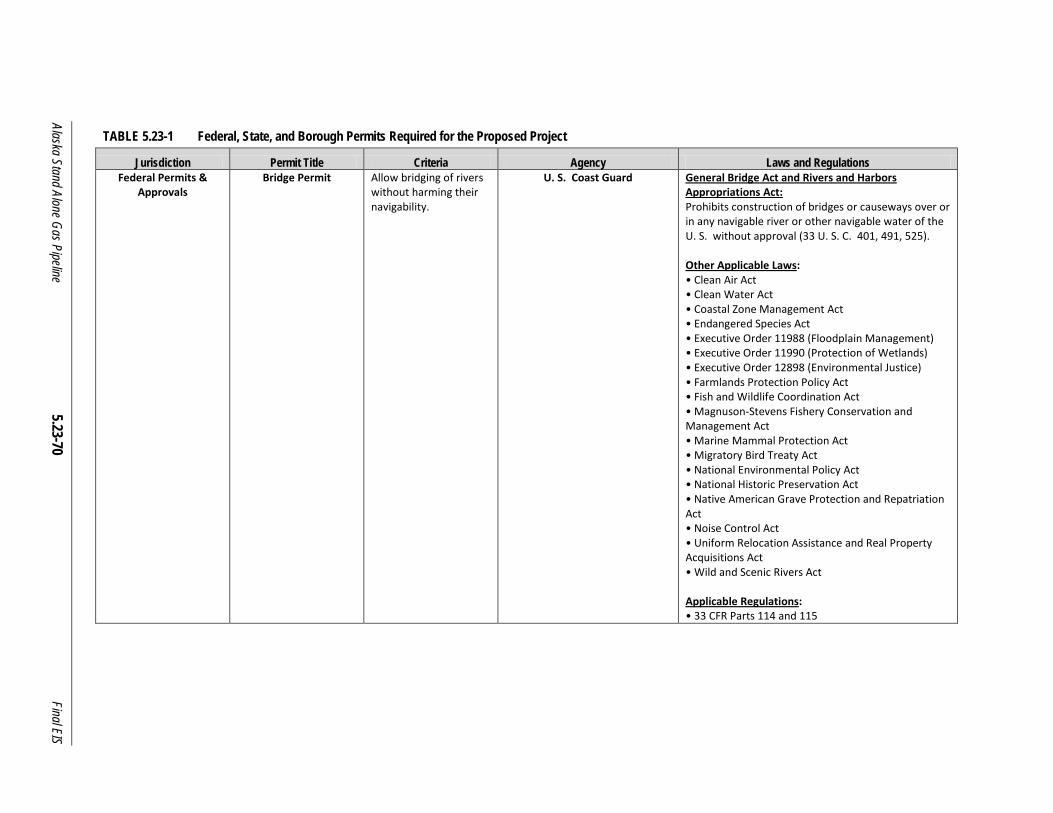
Alaska Stand Alone Gas Pipeline 5.23-70
Final EIS
TABLE 5.23-1 Federal, State, and Borough Permits Required for the Proposed Project
Jurisdiction Permit Title Criteria Agency Laws and Regulations Federal Permits &
Approvals Bridge Permit Allow bridging of rivers
without harming their navigability.
U. S. Coast Guard General Bridge Act and Rivers and Harbors Appropriations Act: Prohibits construction of bridges or causeways over or in any navigable river or other navigable water of the U. S. without approval (33 U. S. C. 401, 491, 525). Other Applicable Laws: • Clean Air Act • Clean Water Act • Coastal Zone Management Act • Endangered Species Act • Executive Order 11988 (Floodplain Management) • Executive Order 11990 (Protection of Wetlands) • Executive Order 12898 (Environmental Justice) • Farmlands Protection Policy Act • Fish and Wildlife Coordination Act • Magnuson-Stevens Fishery Conservation and Management Act • Marine Mammal Protection Act • Migratory Bird Treaty Act • National Environmental Policy Act • National Historic Preservation Act • Native American Grave Protection and Repatriation Act • Noise Control Act • Uniform Relocation Assistance and Real Property Acquisitions Act • Wild and Scenic Rivers Act Applicable Regulations: • 33 CFR Parts 114 and 115
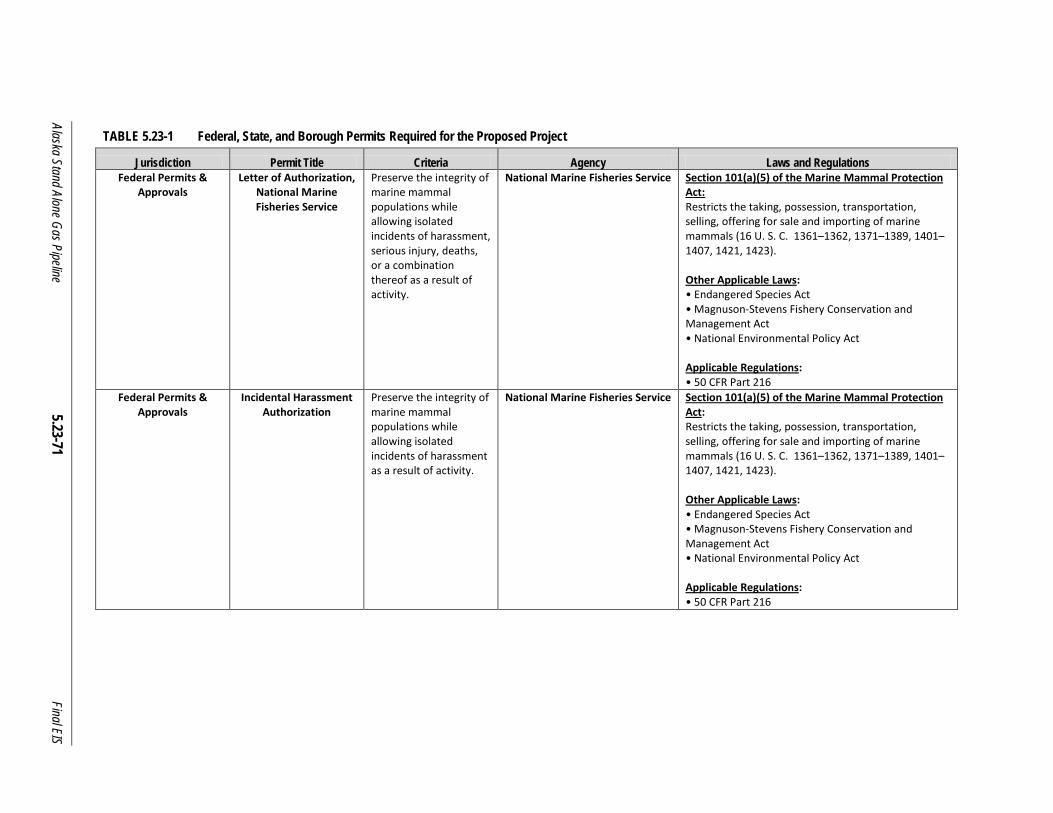
Alaska Stand Alone Gas Pipeline 5.23-71
Final EIS
TABLE 5.23-1 Federal, State, and Borough Permits Required for the Proposed Project
Jurisdiction Permit Title Criteria Agency Laws and Regulations Federal Permits &
Approvals Letter of Authorization,
National Marine Fisheries Service
Preserve the integrity of marine mammal populations while allowing isolated incidents of harassment, serious injury, deaths, or a combination thereof as a result of activity.
National Marine Fisheries Service Section 101(a)(5) of the Marine Mammal Protection Act: Restricts the taking, possession, transportation, selling, offering for sale and importing of marine mammals (16 U. S. C. 1361–1362, 1371–1389, 1401–1407, 1421, 1423). Other Applicable Laws: • Endangered Species Act • Magnuson-Stevens Fishery Conservation and Management Act • National Environmental Policy Act Applicable Regulations: • 50 CFR Part 216
Federal Permits & Approvals
Incidental Harassment Authorization
Preserve the integrity of marine mammal populations while allowing isolated incidents of harassment as a result of activity.
National Marine Fisheries Service Section 101(a)(5) of the Marine Mammal Protection Act: Restricts the taking, possession, transportation, selling, offering for sale and importing of marine mammals (16 U. S. C. 1361–1362, 1371–1389, 1401–1407, 1421, 1423). Other Applicable Laws: • Endangered Species Act • Magnuson-Stevens Fishery Conservation and Management Act • National Environmental Policy Act Applicable Regulations: • 50 CFR Part 216
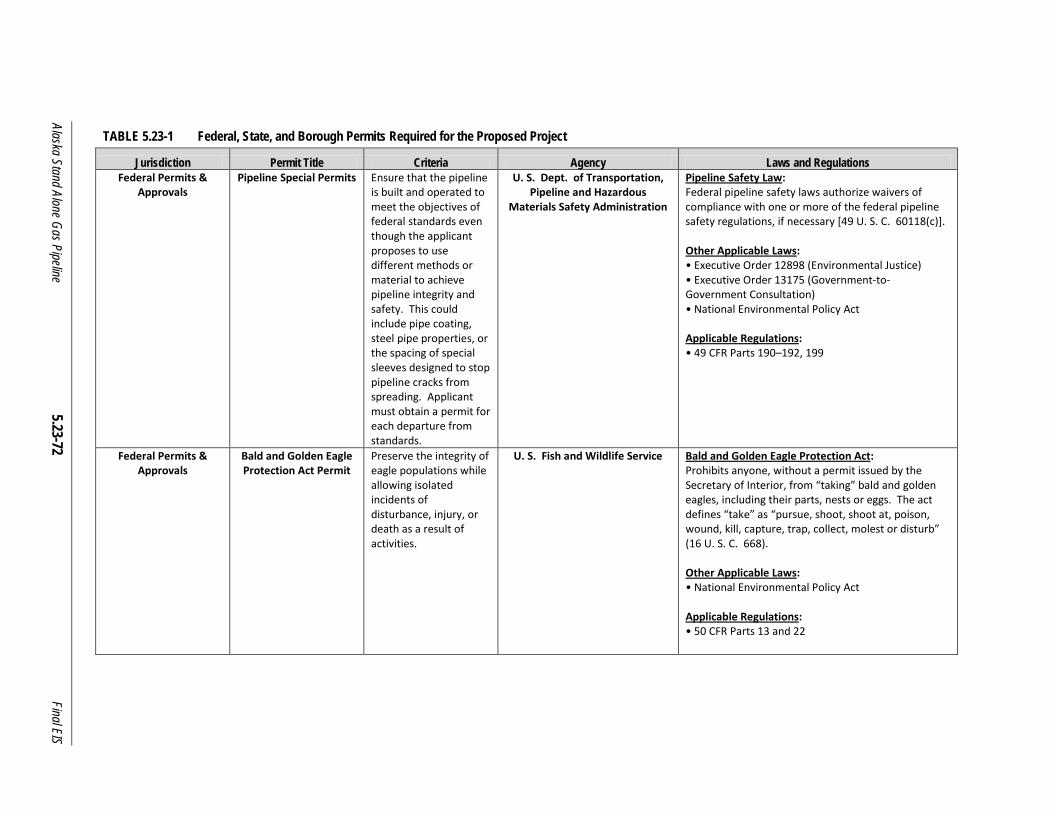
Alaska Stand Alone Gas Pipeline 5.23-72
Final EIS
TABLE 5.23-1 Federal, State, and Borough Permits Required for the Proposed Project
Jurisdiction Permit Title Criteria Agency Laws and Regulations Federal Permits &
Approvals Pipeline Special Permits Ensure that the pipeline
is built and operated to meet the objectives of federal standards even though the applicant proposes to use different methods or material to achieve pipeline integrity and safety. This could include pipe coating, steel pipe properties, or the spacing of special sleeves designed to stop pipeline cracks from spreading. Applicant must obtain a permit for each departure from standards.
U. S. Dept. of Transportation, Pipeline and Hazardous
Materials Safety Administration
Pipeline Safety Law: Federal pipeline safety laws authorize waivers of compliance with one or more of the federal pipeline safety regulations, if necessary [49 U. S. C. 60118(c)]. Other Applicable Laws: • Executive Order 12898 (Environmental Justice) • Executive Order 13175 (Government-to-Government Consultation) • National Environmental Policy Act Applicable Regulations: • 49 CFR Parts 190–192, 199
Federal Permits & Approvals
Bald and Golden Eagle Protection Act Permit
Preserve the integrity of eagle populations while allowing isolated incidents of disturbance, injury, or death as a result of activities.
U. S. Fish and Wildlife Service Bald and Golden Eagle Protection Act: Prohibits anyone, without a permit issued by the Secretary of Interior, from “taking” bald and golden eagles, including their parts, nests or eggs. The act defines “take” as “pursue, shoot, shoot at, poison, wound, kill, capture, trap, collect, molest or disturb” (16 U. S. C. 668). Other Applicable Laws: • National Environmental Policy Act Applicable Regulations: • 50 CFR Parts 13 and 22

Alaska Stand Alone Gas Pipeline 5.23-73
Final EIS
TABLE 5.23-1 Federal, State, and Borough Permits Required for the Proposed Project
Jurisdiction Permit Title Criteria Agency Laws and Regulations Federal Permits &
Approvals Endangered Species Act
Section 7 Biological Opinion and Incidental
Take Statement, U. S. Fish and Wildlife
Service
Ensure that species listed as endangered or threatened, or their habitat, are not adversely affected by activities.
U. S. Fish and Wildlife Service Endangered Species Act: Requires that each federal agency shall ensure that any action authorized by such agency is not likely to jeopardize the continued existence of any endangered species or threatened species or result in the destruction or adverse modification of habitat of such species which is determined to be critical (16 U. S. C. 1531–1544). Other Applicable Laws: • Marine Mammal Protection Act Applicable Regulations: • 50 CFR Parts 17 and 402
Federal Permits & Approvals
Endangered Species Act Section 7 Biological
Opinion and Incidental Take Statement, National Marine Fisheries Service
Ensure that species listed as endangered or threatened, or their habitat, are not adversely affected by activities.
National Marine Fisheries Service Endangered Species Act: Requires that each federal agency shall ensure that any action authorized by such agency is not likely to jeopardize the continued existence of any endangered species or threatened species or result in the destruction or adverse modification of habitat of such species which is determined to be critical (16 U. S. C. 1531–1544). Other Applicable Laws: • Marine Mammal Protection Act Applicable Regulations: • 50 CFR Parts 17 and 402

Alaska Stand Alone Gas Pipeline 5.23-74
Final EIS
TABLE 5.23-1 Federal, State, and Borough Permits Required for the Proposed Project
Jurisdiction Permit Title Criteria Agency Laws and Regulations State Permits &
Approvals Fish Habitat Permit
(Title 16) Required for any work conducted below the ordinary high water mark of an anadromous stream. Required before any action taken to: • Construct a hydraulic project; or • Use, divert, obstruct, pollute, or change the natural flow or bed of a specified river, lake, or stream, or • Use wheeled, tracked; or excavating equipment or log-dragging equipment in the bed of a specified river, lake, or stream.
Dept. of Fish and Game, Division of Habitat
Applicable Laws: • AS 16. 05. 841. Fishway required. • AS 16. 05. 871. Protection of fish and game. States that the commissioner can require: (1) full plans and specifications of the proposed construction or work; (2) complete plans and specifications for the proper protection of fish and game in connection with the construction or work, or in connection with the use; and (3) the approximate date the construction, work, or use will begin. Applicable Regulations: • 5 AAC 95. 700(b). Application procedures. (Details information required on application) • 5 AAC 95. 720(a). Permit conditions and assignment. (Identifies permit conditions that may be applied)
State Permits & Approvals
Collection/Public Safety Permit
Required when interactions with animals and the defense of life or property are expected or possible.
Alaska Dept. of Fish and Game, Division of Wildlife Conservation
Applicable Laws: • AS 16. 05. 050(a)(5). Powers and duties of commissioner. “The commissioner has, but not by way of limitation, the following powers and duties: …(5) to take, capture, propagate, transport, buy, sell, or exchange fish or game or eggs for propagating, scientific, public safety, or stocking purposes. ”
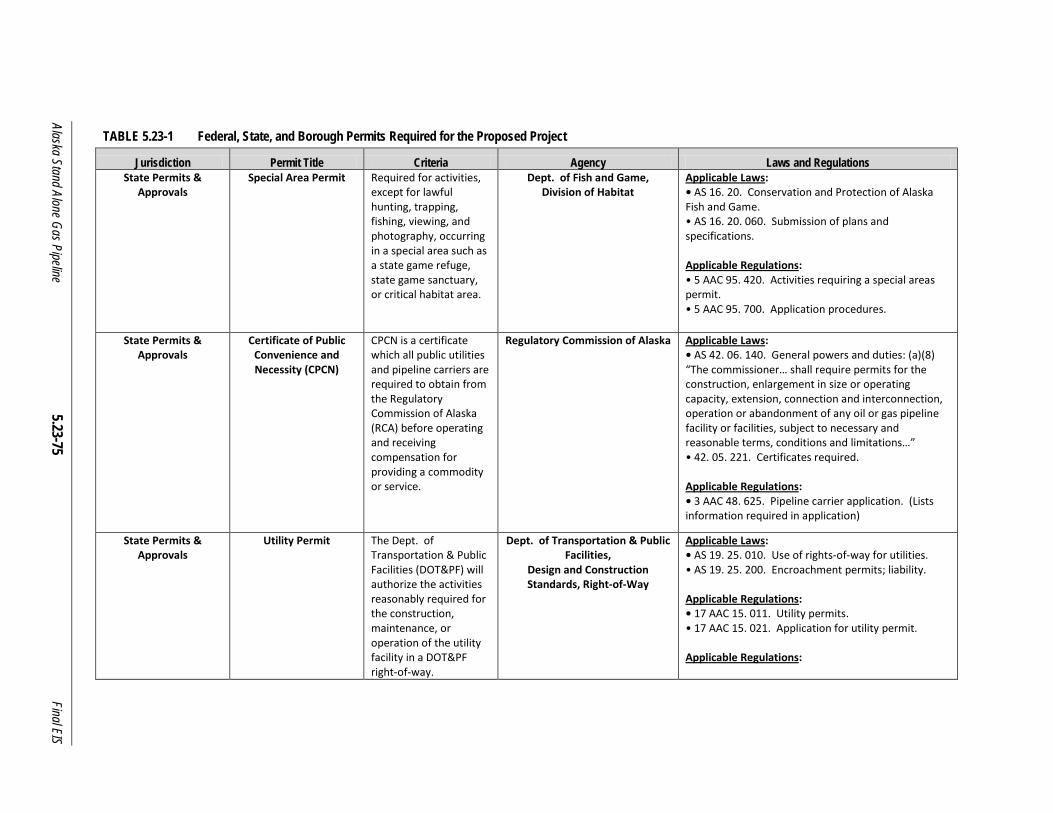
Alaska Stand Alone Gas Pipeline 5.23-75
Final EIS
TABLE 5.23-1 Federal, State, and Borough Permits Required for the Proposed Project
Jurisdiction Permit Title Criteria Agency Laws and Regulations State Permits &
Approvals Special Area Permit Required for activities,
except for lawful hunting, trapping, fishing, viewing, and photography, occurring in a special area such as a state game refuge, state game sanctuary, or critical habitat area.
Dept. of Fish and Game, Division of Habitat
Applicable Laws: • AS 16. 20. Conservation and Protection of Alaska Fish and Game. • AS 16. 20. 060. Submission of plans and specifications. Applicable Regulations: • 5 AAC 95. 420. Activities requiring a special areas permit. • 5 AAC 95. 700. Application procedures.
State Permits & Approvals
Certificate of Public Convenience and Necessity (CPCN)
CPCN is a certificate which all public utilities and pipeline carriers are required to obtain from the Regulatory Commission of Alaska (RCA) before operating and receiving compensation for providing a commodity or service.
Regulatory Commission of Alaska Applicable Laws: • AS 42. 06. 140. General powers and duties: (a)(8) “The commissioner… shall require permits for the construction, enlargement in size or operating capacity, extension, connection and interconnection, operation or abandonment of any oil or gas pipeline facility or facilities, subject to necessary and reasonable terms, conditions and limitations…” • 42. 05. 221. Certificates required. Applicable Regulations: • 3 AAC 48. 625. Pipeline carrier application. (Lists information required in application)
State Permits & Approvals
Utility Permit The Dept. of Transportation & Public Facilities (DOT&PF) will authorize the activities reasonably required for the construction, maintenance, or operation of the utility facility in a DOT&PF right-of-way.
Dept. of Transportation & Public Facilities,
Design and Construction Standards, Right-of-Way
Applicable Laws: • AS 19. 25. 010. Use of rights-of-way for utilities. • AS 19. 25. 200. Encroachment permits; liability. Applicable Regulations: • 17 AAC 15. 011. Utility permits. • 17 AAC 15. 021. Application for utility permit. Applicable Regulations:

Alaska Stand Alone Gas Pipeline 5.23-76
Final EIS
TABLE 5.23-1 Federal, State, and Borough Permits Required for the Proposed Project
Jurisdiction Permit Title Criteria Agency Laws and Regulations State Permits &
Approvals Encroachment Permit Necessary before
placing anything in, on, under, or over a state right-of-way.
Dept. of Transportation & Public Facilities,
Design and Construction Standards, Right-of-Way
Applicable Regulations: • 17 AAC 10. 010. Encroachments. • 17 AAC 10. 011. Types of encroachments authorized.
State Permits & Approvals
Driveway/Approach Road Permit
Required before a driveway/access road can be built that connects with a state roadway.
Dept. of Transportation & Public Facilities,
Design and Construction Standards, Right-of-Way
Applicable Regulations: • 17 AAC 10. 030. Driveway and road approach permits and utilities. • 17 AAC 10. 040. Technical requirements.
State Permits & Approvals
Lane Closure Permit Required for temporary closure of a traffic lane or an entire roadway.
Dept. of Transportation & Public Facilities,
Design and Construction Standards, Right-of-Way
Applicable Regulations: • 17 AAC 20. 017. Lane closure permits.
State Permits & Approvals
Oversize/Overweight Permit
Required when oversize or overweight vehicles will be used on a state roadway.
Dept. of Transportation & Public Facilities,
Measurement Standards and Commercial Vehicle
Enforcement, Commercial Vehicle Customer
Service Center
Applicable Regulations: • 17 AAC 25. 320(b). Permits for oversize or overweight vehicles: “…the department will, as conditions for a permit…establish time limitations for movement, designate routes, limit the number of trips, or otherwise restrict the movement of oversize or overweight vehicles and loads. The movement of permitted oversize or overweight vehicles or loads must comply with…the department’s Administrative Permit Manual: Oversize and Overweight Permits, revised as of December 2009, and adopted by reference. ” • 17 AAC 25. 330(a). Applications for permits.

Alaska Stand Alone Gas Pipeline 5.23-77
Final EIS
TABLE 5.23-1 Federal, State, and Borough Permits Required for the Proposed Project
Jurisdiction Permit Title Criteria Agency Laws and Regulations State Permits &
Approvals Industrial Use Highway
Permit Required to operate vehicles on an industrial use highway if the length and weight meet certain limits.
Dept. of Transportation & Public Facilities
Applicable Regulations: • 17 AAC 35. 020. Industrial use highway permits.
State Permits & Approvals
Application for Fire and Life,
Safety Plan Review
Required prior to the start of construction of any structure regulated by the state fire marshal.
State Fire Marshal’s Office, Division of Fire and Life Safety
Applicable Regulations: • 13 AAC 50. 027. Non-structural plan review and approval; stop-work orders.
State Permits & Approvals
Permit to Drill (Injection Well)
Required for the development of a Class I (municipal and industrial waste) disposal well.
Dept. of Administration, Alaska Oil and Gas Conservation
Commission
Applicable Regulations: • 20 AAC 25. 005 Permit to drill. (Ensures appropriate equipment is used and appropriate practices are followed to maintain well control, protect groundwater, avoid waste of oil or gas, and promote efficient reservoir development)
State Permits & Approvals
Solid Waste Disposal Permit
Required for the operation of a solid waste disposal facility.
Dept. of Environmental Conservation,
Division of Environmental Health
Applicable Regulations: • 18 AAC 60. 210. Permit application. • 18 AAC 60. 245. Prompt closure. • 18 AAC 60. 265, Proof of financial responsibility. • 18 AAC 60. 800 – 18 AAC 60. 860. Monitoring and Corrective Action Requirements.
State Permits & Approvals
Forest Clearing Approval
Required when state-owned/managed forest land will be cleared for project construction and operation.
Dept. of Natural Resources, Division of Forestry
Applicable Laws: • AS 41. 17. Forest Resources and Practices. Applicable Regulations: • 11 AAC 95. 010 – 11 AAC 95. 900. Forest resources and practices. • 11 AAC 95. 190. Applicability. • 11 AAC 95. 220. Detailed plan of operation.
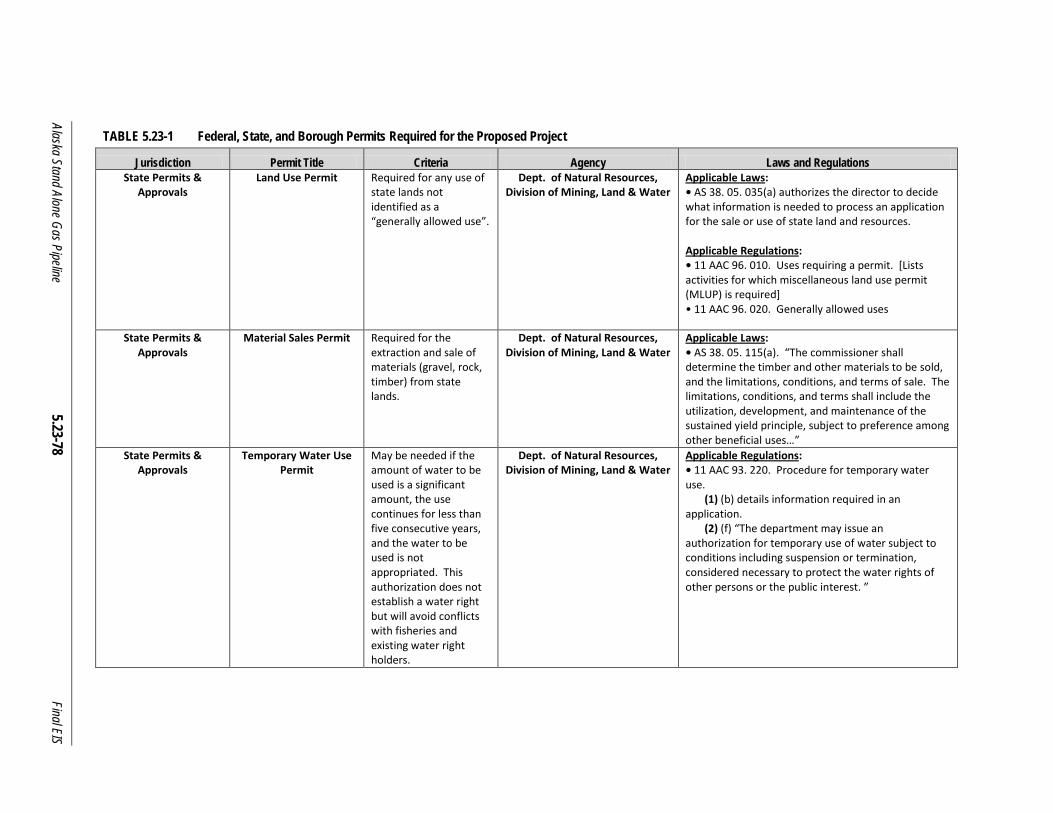
Alaska Stand Alone Gas Pipeline 5.23-78
Final EIS
TABLE 5.23-1 Federal, State, and Borough Permits Required for the Proposed Project
Jurisdiction Permit Title Criteria Agency Laws and Regulations State Permits &
Approvals Land Use Permit Required for any use of
state lands not identified as a “generally allowed use”.
Dept. of Natural Resources, Division of Mining, Land & Water
Applicable Laws: • AS 38. 05. 035(a) authorizes the director to decide what information is needed to process an application for the sale or use of state land and resources. Applicable Regulations: • 11 AAC 96. 010. Uses requiring a permit. [Lists activities for which miscellaneous land use permit (MLUP) is required] • 11 AAC 96. 020. Generally allowed uses
State Permits & Approvals
Material Sales Permit Required for the extraction and sale of materials (gravel, rock, timber) from state lands.
Dept. of Natural Resources, Division of Mining, Land & Water
Applicable Laws: • AS 38. 05. 115(a). “The commissioner shall determine the timber and other materials to be sold, and the limitations, conditions, and terms of sale. The limitations, conditions, and terms shall include the utilization, development, and maintenance of the sustained yield principle, subject to preference among other beneficial uses…”
State Permits & Approvals
Temporary Water Use Permit
May be needed if the amount of water to be used is a significant amount, the use continues for less than five consecutive years, and the water to be used is not appropriated. This authorization does not establish a water right but will avoid conflicts with fisheries and existing water right holders.
Dept. of Natural Resources, Division of Mining, Land & Water
Applicable Regulations: • 11 AAC 93. 220. Procedure for temporary water use. (1) (b) details information required in an application. (2) (f) “The department may issue an authorization for temporary use of water subject to conditions including suspension or termination, considered necessary to protect the water rights of other persons or the public interest. ”
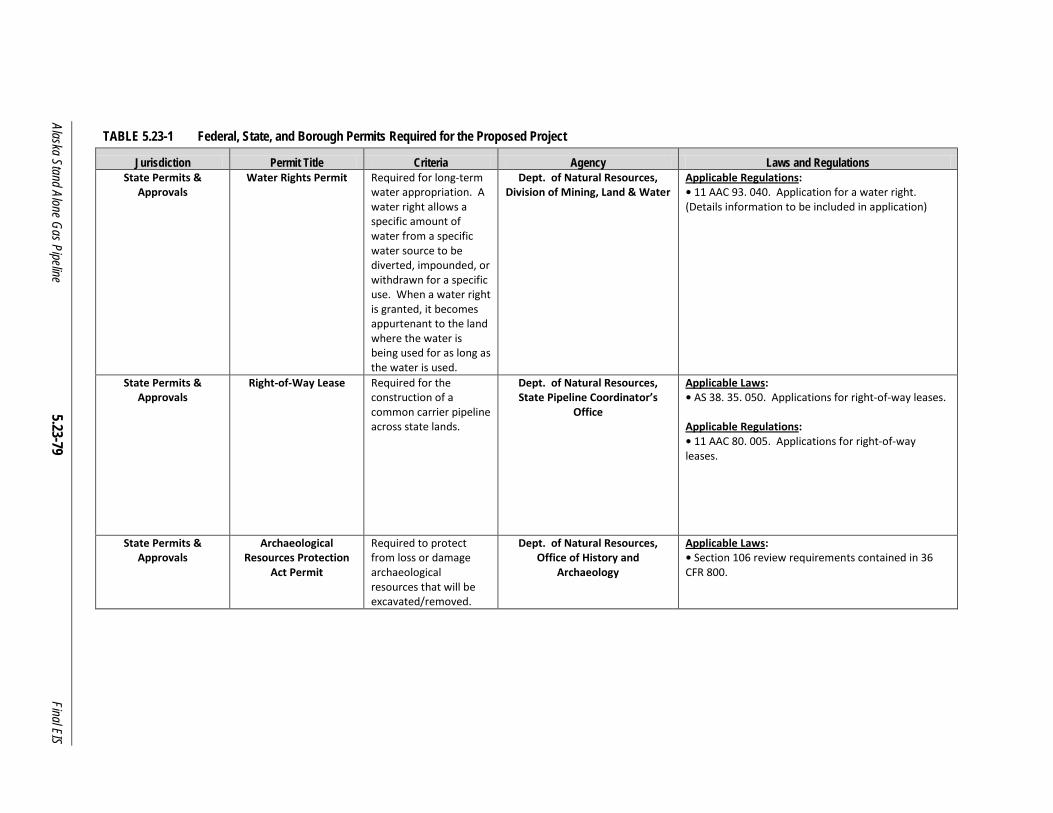
Alaska Stand Alone Gas Pipeline 5.23-79
Final EIS
TABLE 5.23-1 Federal, State, and Borough Permits Required for the Proposed Project
Jurisdiction Permit Title Criteria Agency Laws and Regulations State Permits &
Approvals Water Rights Permit Required for long-term
water appropriation. A water right allows a specific amount of water from a specific water source to be diverted, impounded, or withdrawn for a specific use. When a water right is granted, it becomes appurtenant to the land where the water is being used for as long as the water is used.
Dept. of Natural Resources, Division of Mining, Land & Water
Applicable Regulations: • 11 AAC 93. 040. Application for a water right. (Details information to be included in application)
State Permits & Approvals
Right-of-Way Lease Required for the construction of a common carrier pipeline across state lands.
Dept. of Natural Resources, State Pipeline Coordinator’s
Office
Applicable Laws: • AS 38. 35. 050. Applications for right-of-way leases. Applicable Regulations: • 11 AAC 80. 005. Applications for right-of-way leases.
State Permits & Approvals
Archaeological Resources Protection
Act Permit
Required to protect from loss or damage archaeological resources that will be excavated/removed.
Dept. of Natural Resources, Office of History and
Archaeology
Applicable Laws: • Section 106 review requirements contained in 36 CFR 800.

Alaska Stand Alone Gas Pipeline 5.23-80
Final EIS
TABLE 5.23-1 Federal, State, and Borough Permits Required for the Proposed Project
Jurisdiction Permit Title Criteria Agency Laws and Regulations State Permits &
Approvals Cultural Resource
Permit Required for the investigation, excavation, gathering, or removal from the natural state, of any historic, prehistoric, or archaeological resources of the state.
Dept. of Natural Resources, Office of History and
Archaeology
Applicable Laws: • AS 41. 35. 080. Permits: “The commissioner may issue a permit for the investigation, excavation, gathering, or removal from the natural state, of any historic, prehistoric, or archeological resources of the state. . . ” Applicable Regulations: • 11 AAC 16. 030. Investigation and collection permits: (b) “After consultation with the state archaeologist the director may issue a permit to a qualified person for investigation, excavation, gathering and removal from the natural state of historic, prehistoric or archaeological resources of the state. ”
State Permits & Approvals
Minor General Permit 9 for Rock Crushers
(MG9)
Required from the owner/operator before construction, operation, or relocation of a stationary source containing a rock crusher that has a rated capacity >5 tons per hour and emits <100 tons of a regulated pollutant.
Dept. of Environmental Conservation,
Division of Air Quality
Applicable Regulations: • 18 AAC 50. 345. Construction, minor, and operating permits: standard permit conditions. • 18 AAC 50. 045. Prohibitions: (d) “A person who causes or permits bulk materials to be handled, transported, or stored, or who engages in an industrial activity or construction project shall take reasonable precautions to prevent particulate matter from being emitted into the ambient air. ” • 18 AAC 50. 502(b). Minor permits for air quality protection. • 18 AAC 50. 560. General minor permits.
State Permits & Approvals
Open-Burning Approval Application
Required for open/prescribed burning of ≥40 acres/year.
Dept. of Environmental Conservation,
Division of Air Quality
Applicable Regulations: • 18 AAC 50. 065. Open burning.

Alaska Stand Alone Gas Pipeline 5.23-81
Final EIS
TABLE 5.23-1 Federal, State, and Borough Permits Required for the Proposed Project
Jurisdiction Permit Title Criteria Agency Laws and Regulations State Permits &
Approvals Construction Permit Used for the following
permitting activities: 1. Prevention of Significant Deterioration (PSD) permit (18 AAC 50. 306) 2. Nonattainment area major stationary source permit (18 AAC 50. 311) 3. Construction permit for a major source of hazardous air pollutants (18 AAC 50. 316). Required to authorize construction of a new or modification to a major stationary source of air pollution. The major source is capable of emitting more than 250 tons per year of a criteria pollutant, defined as the following: nitrogen oxides (NOx), carbon monoxide (CO), particulate matter less than 10 micron in size (PM10), sulfur dioxide (SO2), and ozone.
Dept. of Environmental Conservation,
Division of Air Quality
Applicable Laws: • AS 46. 14. 130. Stationary sources requiring permits. (Major stationary source permits) Applicable Regulations: • 18 AAC 50. 300 – 18 AAC 50. 390. Article 3, Major Stationary Source Permits. • 18 AAC 50. 302. Construction permits. • 18 AAC 50. 345. Construction, minor, and operating permits: standard permit conditions. • 18 AAC 50. 346. Construction and operating permits: other permit conditions. • 18 AAC 50. 306. Prevention of significant deterioration (PSD) permits: (d) “In each PSD permit issued under this section, the department will include terms and conditions: - (1) as necessary to ensure that the permittee will construct and operate the proposed stationary source or modification in accordance with this section, including terms and conditions consistent with AS 46. 14. 180 that require the permittee to - (A) install, use, and maintain monitoring equipment; - (B) sample emissions according to the methods prescribed by the department, at locations and, intervals specified by the department, and by procedures specified by the department; - (C) provide source test reports, monitoring data, emissions data, and information from analysis of any test samples; - (D) keep records; and - (E) make periodic reports on process operations and emissions, and reports consistent with 18 AAC 50. 235 - 18 AAC 50. 240”.
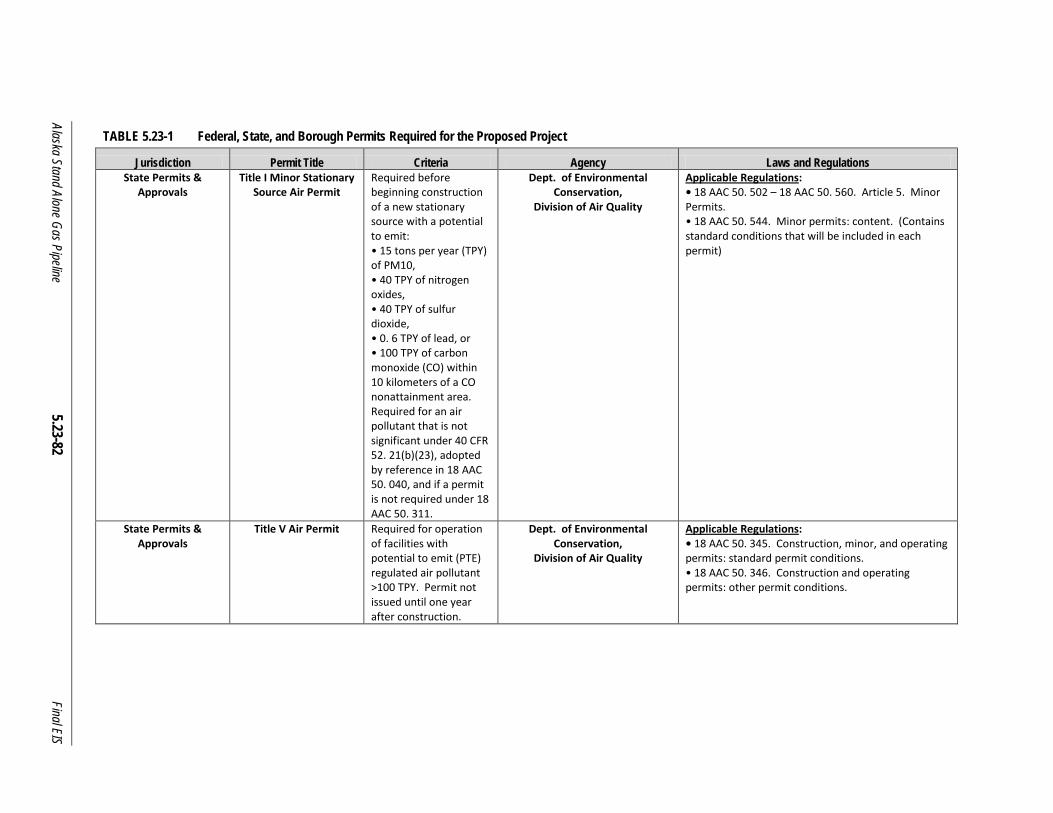
Alaska Stand Alone Gas Pipeline 5.23-82
Final EIS
TABLE 5.23-1 Federal, State, and Borough Permits Required for the Proposed Project
Jurisdiction Permit Title Criteria Agency Laws and Regulations State Permits &
Approvals Title I Minor Stationary
Source Air Permit Required before beginning construction of a new stationary source with a potential to emit: • 15 tons per year (TPY) of PM10, • 40 TPY of nitrogen oxides, • 40 TPY of sulfur dioxide, • 0. 6 TPY of lead, or • 100 TPY of carbon monoxide (CO) within 10 kilometers of a CO nonattainment area. Required for an air pollutant that is not significant under 40 CFR 52. 21(b)(23), adopted by reference in 18 AAC 50. 040, and if a permit is not required under 18 AAC 50. 311.
Dept. of Environmental Conservation,
Division of Air Quality
Applicable Regulations: • 18 AAC 50. 502 – 18 AAC 50. 560. Article 5. Minor Permits. • 18 AAC 50. 544. Minor permits: content. (Contains standard conditions that will be included in each permit)
State Permits & Approvals
Title V Air Permit Required for operation of facilities with potential to emit (PTE) regulated air pollutant >100 TPY. Permit not issued until one year after construction.
Dept. of Environmental Conservation,
Division of Air Quality
Applicable Regulations: • 18 AAC 50. 345. Construction, minor, and operating permits: standard permit conditions. • 18 AAC 50. 346. Construction and operating permits: other permit conditions.
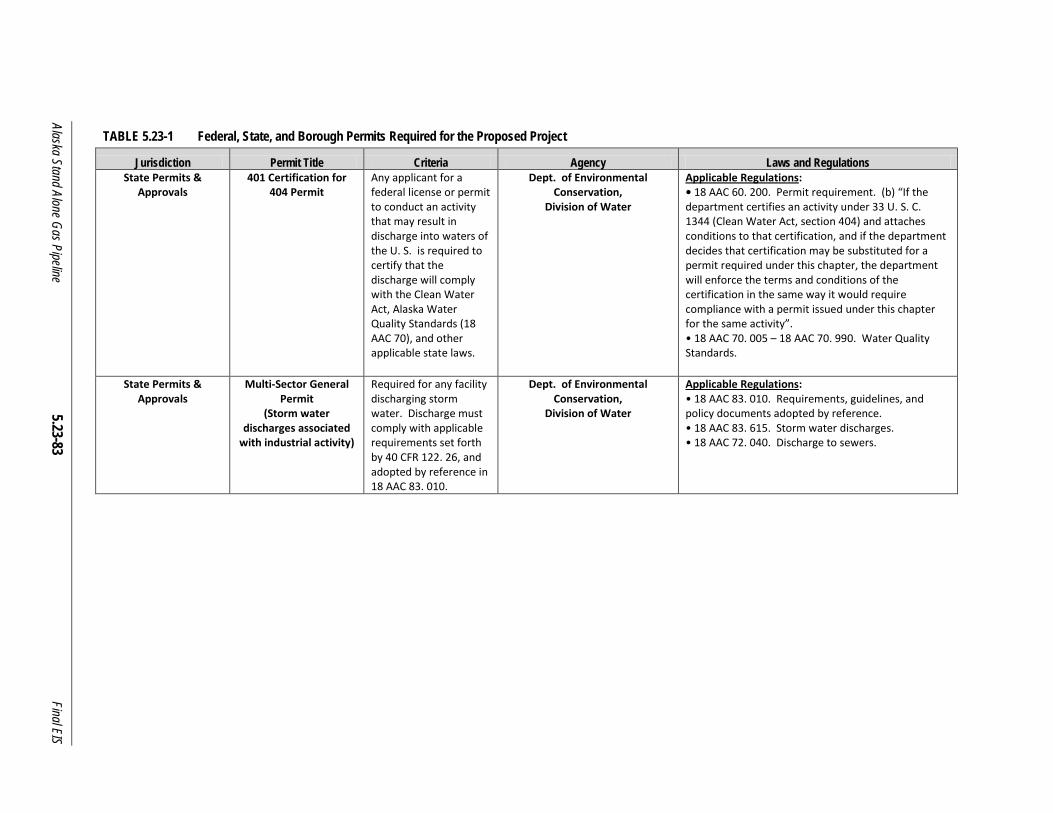
Alaska Stand Alone Gas Pipeline 5.23-83
Final EIS
TABLE 5.23-1 Federal, State, and Borough Permits Required for the Proposed Project
Jurisdiction Permit Title Criteria Agency Laws and Regulations State Permits &
Approvals 401 Certification for
404 Permit Any applicant for a federal license or permit to conduct an activity that may result in discharge into waters of the U. S. is required to certify that the discharge will comply with the Clean Water Act, Alaska Water Quality Standards (18 AAC 70), and other applicable state laws.
Dept. of Environmental Conservation,
Division of Water
Applicable Regulations: • 18 AAC 60. 200. Permit requirement. (b) “If the department certifies an activity under 33 U. S. C. 1344 (Clean Water Act, section 404) and attaches conditions to that certification, and if the department decides that certification may be substituted for a permit required under this chapter, the department will enforce the terms and conditions of the certification in the same way it would require compliance with a permit issued under this chapter for the same activity”. • 18 AAC 70. 005 – 18 AAC 70. 990. Water Quality Standards.
State Permits & Approvals
Multi-Sector General Permit
(Storm water discharges associated
with industrial activity)
Required for any facility discharging storm water. Discharge must comply with applicable requirements set forth by 40 CFR 122. 26, and adopted by reference in 18 AAC 83. 010.
Dept. of Environmental Conservation,
Division of Water
Applicable Regulations: • 18 AAC 83. 010. Requirements, guidelines, and policy documents adopted by reference. • 18 AAC 83. 615. Storm water discharges. • 18 AAC 72. 040. Discharge to sewers.

Alaska Stand Alone Gas Pipeline 5.23-84
Final EIS
TABLE 5.23-1 Federal, State, and Borough Permits Required for the Proposed Project
Jurisdiction Permit Title Criteria Agency Laws and Regulations State Permits &
Approvals Alaska Pollutant
Discharge Elimination System,
General Permit, Contained Water
Required for any discharge of pollutants in storm water associated with construction activities into waters of the U. S.
Dept. of Environmental Conservation,
Division of Water
Applicable Regulations: • 18 AAC 83. 305. Permit application forms and general information requirements. • 18 AAC 83. 315. Permit application requirements for manufacturing, commercial, mining, and silvicultural facilities that discharge only non-process wastewater. • 18 AAC 83. 360. Permit application requirements for new sources and new discharges. • 18 AAC 83. 405 – 18 AAC 83. 560. Article 5, Permit Conditions – General. • 18 AAC 83. 615. Storm water discharges. • Operator may be required to submit information to the Department and/or an operator of a municipal separate storm sewer system for review prior to filing the notice of intent and commencement of construction activities.
State Permits & Approvals
Alaska Pollutant Discharge Elimination
System, Discharge of Non-
process Wastewater
Required for a new or existing industrial facility that discharges only non-process wastewater into waters of the U. S. (Process wastewater is water that comes into direct contact with or results from the production or use of any raw material, intermediate product, finished product, byproduct, waste product, or wastewater. )
Dept. of Environmental Conservation,
Division of Water
Applicable Regulations: • 18 AAC 83. 115. Draft permit, fact sheet, and applicant review. • 18 AAC 83. 120. Public notice and comment; hearing on permit; issuance of final permit. • 18 AAC 83. 125. Permit preparation by third-party contractors or an applicant. • 18 AAC 83. 160. Permit variance. • 18 AAC 83. 205. General permits. • 18 AAC 83. 210. Administration of general permits. • 18 AAC 83. 215. Exceptions to general permit requirement; individual permits. • 18 AAC 83. 305. Permit application forms and general information requirements. • 18 AAC 83. 315. Permit application requirements for manufacturing, commercial, mining, and silvicultural facilities that discharge only non-process wastewater. • 18 AAC 83. 410. Special reporting obligations: (d) Monitoring report.
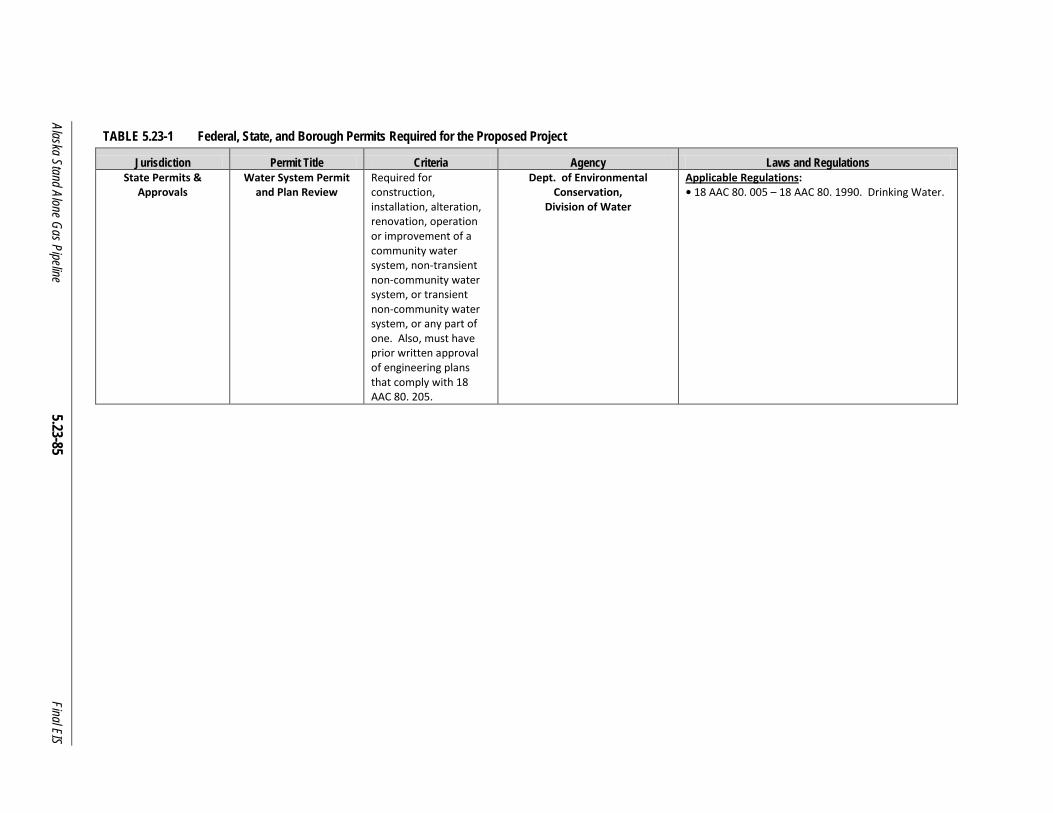
Alaska Stand Alone Gas Pipeline 5.23-85
Final EIS
TABLE 5.23-1 Federal, State, and Borough Permits Required for the Proposed Project
Jurisdiction Permit Title Criteria Agency Laws and Regulations State Permits &
Approvals Water System Permit
and Plan Review Required for construction, installation, alteration, renovation, operation or improvement of a community water system, non-transient non-community water system, or transient non-community water system, or any part of one. Also, must have prior written approval of engineering plans that comply with 18 AAC 80. 205.
Dept. of Environmental Conservation,
Division of Water
Applicable Regulations: • 18 AAC 80. 005 – 18 AAC 80. 1990. Drinking Water.
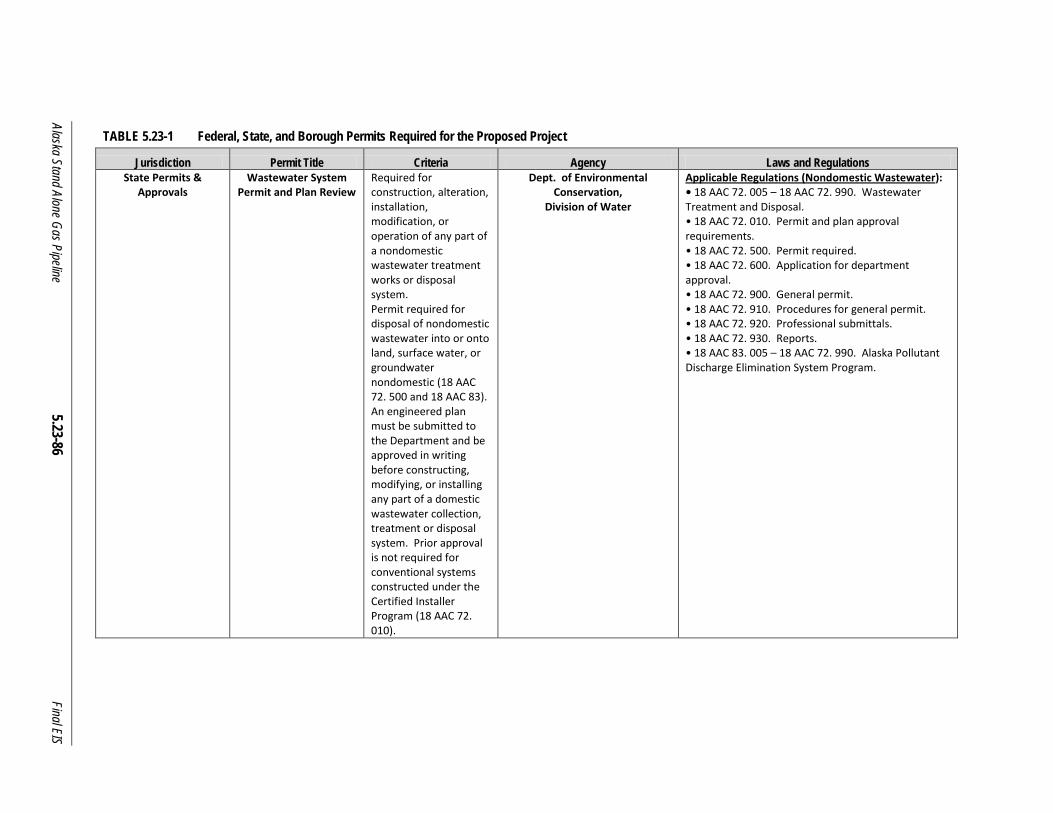
Alaska Stand Alone Gas Pipeline 5.23-86
Final EIS
TABLE 5.23-1 Federal, State, and Borough Permits Required for the Proposed Project
Jurisdiction Permit Title Criteria Agency Laws and Regulations State Permits &
Approvals Wastewater System
Permit and Plan Review Required for construction, alteration, installation, modification, or operation of any part of a nondomestic wastewater treatment works or disposal system. Permit required for disposal of nondomestic wastewater into or onto land, surface water, or groundwater nondomestic (18 AAC 72. 500 and 18 AAC 83). An engineered plan must be submitted to the Department and be approved in writing before constructing, modifying, or installing any part of a domestic wastewater collection, treatment or disposal system. Prior approval is not required for conventional systems constructed under the Certified Installer Program (18 AAC 72. 010).
Dept. of Environmental Conservation,
Division of Water
Applicable Regulations (Nondomestic Wastewater): • 18 AAC 72. 005 – 18 AAC 72. 990. Wastewater Treatment and Disposal. • 18 AAC 72. 010. Permit and plan approval requirements. • 18 AAC 72. 500. Permit required. • 18 AAC 72. 600. Application for department approval. • 18 AAC 72. 900. General permit. • 18 AAC 72. 910. Procedures for general permit. • 18 AAC 72. 920. Professional submittals. • 18 AAC 72. 930. Reports. • 18 AAC 83. 005 – 18 AAC 72. 990. Alaska Pollutant Discharge Elimination System Program.

Alaska Stand Alone Gas Pipeline 5.23-87
Final EIS
TABLE 5.23-1 Federal, State, and Borough Permits Required for the Proposed Project
Jurisdiction Permit Title Criteria Agency Laws and Regulations State Permits &
Approvals Class I Injection Well Wastewater Disposal
General Permit (Permit Number
2010DB0001)
Required for any non-hazardous sanitary wastewater discharge injected into a well for disposal below lowermost underground drinking water source supply. Class I injection wells are used for deep injection of non-hazardous sanitary, domestic, or industrial fluids beneath the lowermost underground source of drinking water.
Dept. of Environmental Conservation,
Division of Water
Applicable Laws: • AS 46. 03. 120. Termination or modification of waste management and disposal. Applicable Regulations (Domestic Wastewater): • 18 AAC 72. 010. Permit and plan approval requirements • 18 AAC 72. 215. Permit required. Applicable Regulations (Nondomestic Wastewater): • 18 AAC 72. 500. Permit required: (a) “In addition to the plan approval required by 18 AAC 72. 600 a person who disposes of nondomestic wastewater into or onto land, surface water, or groundwater in this state must have a permit issued by the department under this chapter or under 18 AAC 83 for that disposal. ” • 18 AAC 72. 600. Application for department approval. • 18 AAC 72. 510. Sludge disposal.
Borough Permits & Approvals
Construction in Right-of-Way Permit
Required prior to any work taking place, including driveway installations, within the right-of-way of a public road.
Fairbanks North Star Borough, Rural Services Division
• Fairbanks North Star Borough Code of Ordinance 14. 03. Excavation and Construction on Public Roads Within Road Service Areas.
Borough Permits & Approvals
Floodplain Permit Application
For any new or substantially improved structure, alteration of a watercourse, or other development within the flood hazard area (Flood Zone A).
Fairbanks North Star Borough, Dept. of Community Planning
• Ordinance 15. 04. 040, Floodplain Permits Required. • Required data and information contained in 15. 04. 050 B. through F.

Alaska Stand Alone Gas Pipeline 5.23-88
Final EIS
TABLE 5.23-1 Federal, State, and Borough Permits Required for the Proposed Project
Jurisdiction Permit Title Criteria Agency Laws and Regulations Borough Permits &
Approvals Land Management Regulations Permit
Application (Development Permit)
Compliance with land management requirements
North Slope Borough • North Slope Borough Ordinance 19. 30. 050. (Ordinance does not contain any requirements for data or information)
Borough Permits & Approvals
Land Use and/or Zoning Permits
Compliance with land use and/or zoning plans
Fairbanks North Star Borough
Denali Borough
Matanuska-Susitna Borough
• Land Use and/or Zoning Plans
Borough Permits & Approvals
Approval from local landfill operators to
deposit non-hazardous solid waste
Disposal of non-hazardous solid waste
North Slope Borough
Fairbanks North Star Borough
Denali Borough
Matanuska-Susitna Borough
• Local Ordinances
Source: The Alaska Gas Pipeline Project Office created the list of state and borough permits. The Office of the Federal Coordinator for Alaska Natural Gas Transportation Projects created the list of federal permits.

Alaska Stand Alone Gas Pipeline 5. 23-89 Final EIS
5.23.3 References
AGDC. See Alaska Gasline Development Corporation.
Alaska Gasline Development Corporation (AGDC). 2011. Applicant Proposed Mitigation Measures. Anchorage, AK.
Alaska Gasline Development Corporation (AGDC). 2012. Request for Information July 9, 2012 Mitigation Measures. Anchorage, AK.
CEQ. See Council on Environmental Quality.
Council on Environmental Quality (CEQ). 1981. Forty Most Asked Questions Concerning National Environmental Policy Act Regulations. 46 Federal Register 18026.
EPA. See U.S. Environmental Protection Agency.
U.S. Environmental Protection Agency (EPA). 2012. Mitigation Banking Fact Sheet. Compensating for Impacts to Wetlands and Streams. Website: (http://water.epa.gov/lawsregs/guidance/wetlands/mitbanking.cfm).
Wright, S. J, 2008. A Revegetation Manual for Alaska. Alaska Plant Materials Center. Division of Agriculture, Alaska Department of Natural Resources. Palmer, AK.

Alaska Stand Alone Gas Pipeline 5. 23-90 Final EIS
This page intentionally left blank.

EIS Alaska Stand Alone Gas Pipeline
6.0 CONCLUSIONS
Final EIS

Alaska Stand Alone Gas Pipeline 6-1 Final EIS
6.0 CONCLUSIONS
This section summarizes the conclusions of the Final EIS for the proposed Alaska Stand Alone
Pipeline (ASAP). The proposed intrastate, 24 inch, 737 mile, 500 million standard cubic feet per
day (MMscfd) capacity pipeline1 is designed to transport presently stranded natural gas and
natural gas liquids (NGLs) from the North Slope gas fields to markets in the Fairbanks and Cook
Inlet areas by 2016. As envisioned, the ASAP is independent of other possible interstate gas
pipeline projects presently under consideration.2
Cook Inlet natural gas production accounts for nearly all of Alaska’s natural gas supply at
present.3 Cook Inlet natural gas production has been declining in recent years and, looking to
the future, both proven developed Cook Inlet reserves and estimates of undeveloped Cook Inlet
reserves are insufficient to match even historical levels of natural gas consumption in Alaska.
Thus, absent construction and operation of this or some alternative gas pipeline system, Alaska
will be in the position of having large natural gas reserves,4 but a shortfall of supply. The
Proposed Action is intended to serve developed and developing markets within Alaska,
including Fairbanks and the Railbelt.
Construction and operation of the ASAP would entail both positive and negative impacts of
various types—identified and discussed in detail in earlier sections of this Final EIS. This
section summarizes these impacts in a series of tables. Table 6.0-1 provides a narrative
summary of the predicted impacts (including physical, biological, socioeconomic and cumulative
impacts5) associated with (i) the Proposed Action, (ii) the Denali National Park Route Variation,
1 The proposed Project also includes a 12-inch diameter, 35-mile length Fairbanks Lateral pipeline to tie-in with the
main pipeline at MP 458, a gas conditioning facility located on the North Slope at Prudhoe Bay, as many as two compressor stations located along the pipeline, a straddle and off-take facility located at the Fairbanks Lateral tie in, and a Cook Inlet NGLEP. Connected actions are described in detail in Section 3.0. 2 ASAP is an intrastate project independent of other proposed interstate natural gas pipeline projects. The Alaska
Pipeline Project (APP), the project sponsored by the Alaska Gasline Inducement Act (AGIA), and Denali–The Alaska Gas Pipeline project have studied the feasibility of exporting Alaska’s North Slope natural gas via a large-diameter pipeline. As these export plans and studies develop, the near-term needs (2013) for additional natural gas supplies to supplement Cook Inlet reserves and to serve developed and developing markets within Alaska remain. 3 Comparatively minor amounts of natural gas are produced on the North Slope for industry consumption on the
slope. Additionally the North Slope Borough constructed Nuiqsut Natural Gas Pipeline to transport natural gas from the ConocoPhillips Alpine production pad to the village of Nuiqsut, located within the Colville River Delta. Natural gas from the North Slope is also used to heat homes and generate electricity in Barrow. 4 According to the Bureau of Ocean Energy Management, Regulation, and Enforcement (see
http://www.alaska.boemre.gov/re/natgas/akngases.htm) Alaska contains 39.88 trillion cubic feet (tcf) of gas remaining in developed and known undeveloped fields. Some of this gas is in fields too small or remote to justify economic development. Of the known gas reserves, 26.92 tcf may be considered available for export at appropriate market prices and pending construction of new gas transportation systems. Most of this gas is in onshore fields and mostly beneath State of Alaska surface or submerged lands. 5 The health impacts associated with this proposed Project are very substantial and are discussed in the narrative
descriptions in Table 6.0-1. However, these effects (discussed at length in Section 5.15) were evaluated using a specific scheme recommended in the Technical Guidance for Health Impact Assessment (HIA) in Alaska, also termed the ‘HIA Toolkit.’
Alaska Stand Alone Gas Pipeline 6-2 Final EIS
(iii) the No Action Alternative, and (iv) the options related to crossing the Yukon River described
under the Proposed Action. Mitigation measures currently committed to by the AGDC are
described in Section 5.23, Mitigation.
Selection of the No Action Alternative means that the negative impacts associated with the
proposed alternative are avoided and so effects can rightly be described simply as having ‘no
impact.’ However, the proposed Project (including the Denali National Park Route Variation, the
preferred option for a Yukon crossing and two other Yukon River crossing options) also offers
substantial benefits (positive impacts), such as providing a reliable, relatively low-cost, supply of
natural gas. This potential supply could enable, for example, the provision of additional natural
gas to residents of Fairbanks thereby displacing other fuel types (e.g., wood, coal, or fuel oil)
with significantly greater air emissions of various types. Displacing fuel types that have greater
air emissions will improve air quality and have a positive impact on public health in the
Fairbanks North Star Borough region (See Section 5.15, Public Health, for more detail).
Selection of the No Action Alternative would forego these benefits.
Tables in Section 6.1 provide more information on the predicted impacts and cumulative effects
of the proposed Project, Alternatives and Options, and ranks the magnitude and probability of
those impacts.
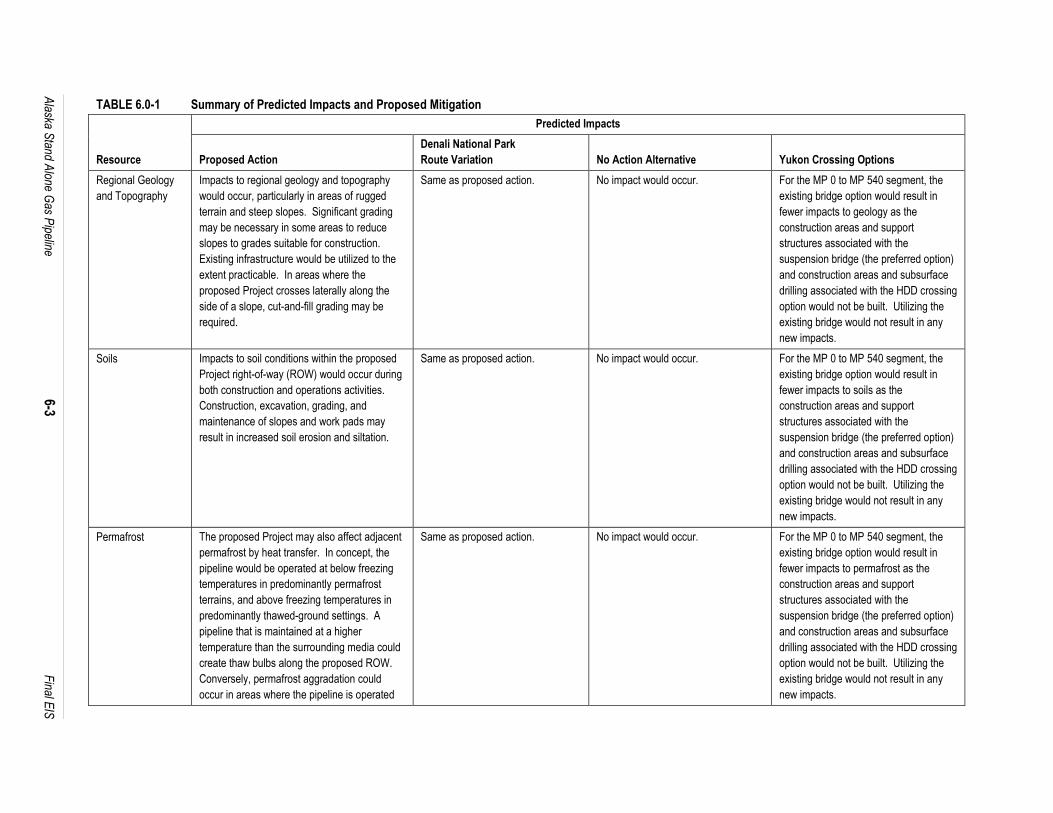
Alaska S
tand Alone G
as Pipeline
6-3
F
inal EIS
TABLE 6.0-1 Summary of Predicted Impacts and Proposed Mitigation
Resource
Predicted Impacts
Proposed Action
Denali National Park
Route Variation No Action Alternative Yukon Crossing Options
Regional Geology
and Topography
Impacts to regional geology and topography
would occur, particularly in areas of rugged
terrain and steep slopes. Significant grading
may be necessary in some areas to reduce
slopes to grades suitable for construction.
Existing infrastructure would be utilized to the
extent practicable. In areas where the
proposed Project crosses laterally along the
side of a slope, cut-and-fill grading may be
required.
Same as proposed action. No impact would occur. For the MP 0 to MP 540 segment, the
existing bridge option would result in
fewer impacts to geology as the
construction areas and support
structures associated with the
suspension bridge (the preferred option)
and construction areas and subsurface
drilling associated with the HDD crossing
option would not be built. Utilizing the
existing bridge would not result in any
new impacts.
Soils Impacts to soil conditions within the proposed
Project right-of-way (ROW) would occur during
both construction and operations activities.
Construction, excavation, grading, and
maintenance of slopes and work pads may
result in increased soil erosion and siltation.
Same as proposed action. No impact would occur. For the MP 0 to MP 540 segment, the
existing bridge option would result in
fewer impacts to soils as the
construction areas and support
structures associated with the
suspension bridge (the preferred option)
and construction areas and subsurface
drilling associated with the HDD crossing
option would not be built. Utilizing the
existing bridge would not result in any
new impacts.
Permafrost The proposed Project may also affect adjacent
permafrost by heat transfer. In concept, the
pipeline would be operated at below freezing
temperatures in predominantly permafrost
terrains, and above freezing temperatures in
predominantly thawed-ground settings. A
pipeline that is maintained at a higher
temperature than the surrounding media could
create thaw bulbs along the proposed ROW.
Conversely, permafrost aggradation could
occur in areas where the pipeline is operated
Same as proposed action. No impact would occur. For the MP 0 to MP 540 segment, the
existing bridge option would result in
fewer impacts to permafrost as the
construction areas and support
structures associated with the
suspension bridge (the preferred option)
and construction areas and subsurface
drilling associated with the HDD crossing
option would not be built. Utilizing the
existing bridge would not result in any
new impacts.
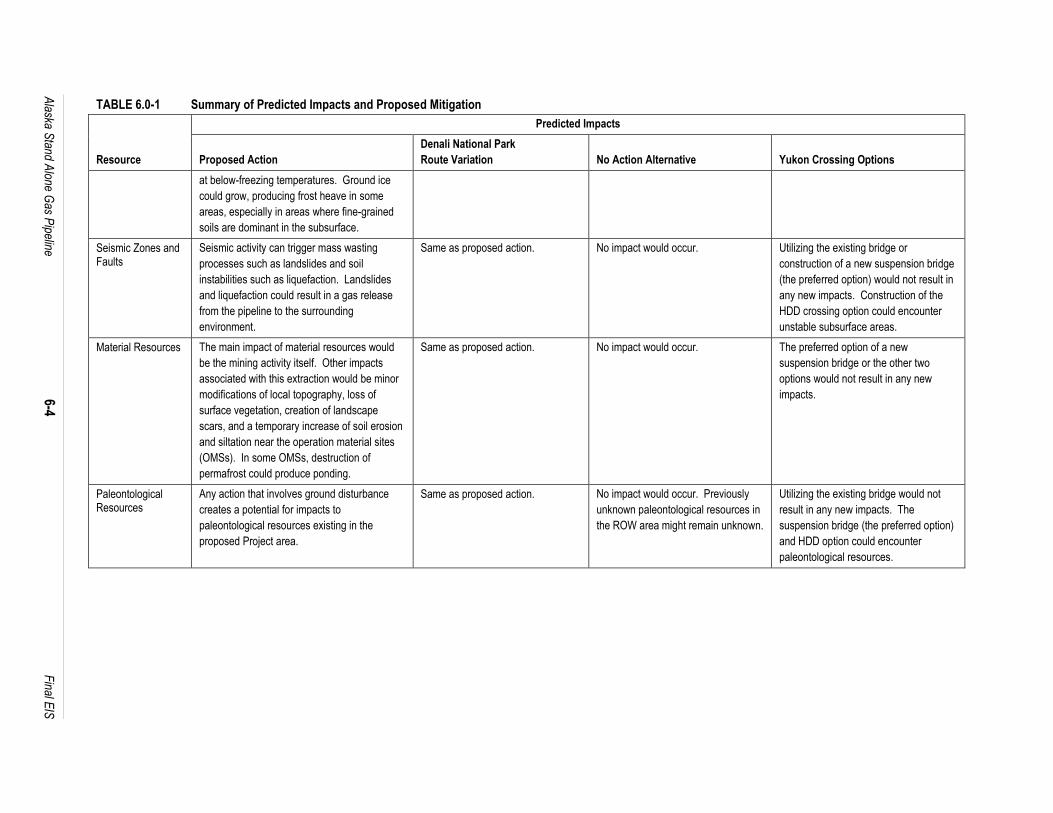
Alaska S
tand Alone G
as Pipeline
6-4
F
inal EIS
TABLE 6.0-1 Summary of Predicted Impacts and Proposed Mitigation
Resource
Predicted Impacts
Proposed Action
Denali National Park
Route Variation No Action Alternative Yukon Crossing Options
at below-freezing temperatures. Ground ice
could grow, producing frost heave in some
areas, especially in areas where fine-grained
soils are dominant in the subsurface.
Seismic Zones and Faults
Seismic activity can trigger mass wasting
processes such as landslides and soil
instabilities such as liquefaction. Landslides
and liquefaction could result in a gas release
from the pipeline to the surrounding
environment.
Same as proposed action. No impact would occur. Utilizing the existing bridge or
construction of a new suspension bridge
(the preferred option) would not result in
any new impacts. Construction of the
HDD crossing option could encounter
unstable subsurface areas.
Material Resources The main impact of material resources would
be the mining activity itself. Other impacts
associated with this extraction would be minor
modifications of local topography, loss of
surface vegetation, creation of landscape
scars, and a temporary increase of soil erosion
and siltation near the operation material sites
(OMSs). In some OMSs, destruction of
permafrost could produce ponding.
Same as proposed action. No impact would occur. The preferred option of a new
suspension bridge or the other two
options would not result in any new
impacts.
Paleontological Resources
Any action that involves ground disturbance
creates a potential for impacts to
paleontological resources existing in the
proposed Project area.
Same as proposed action. No impact would occur. Previously
unknown paleontological resources in
the ROW area might remain unknown.
Utilizing the existing bridge would not
result in any new impacts. The
suspension bridge (the preferred option)
and HDD option could encounter
paleontological resources.
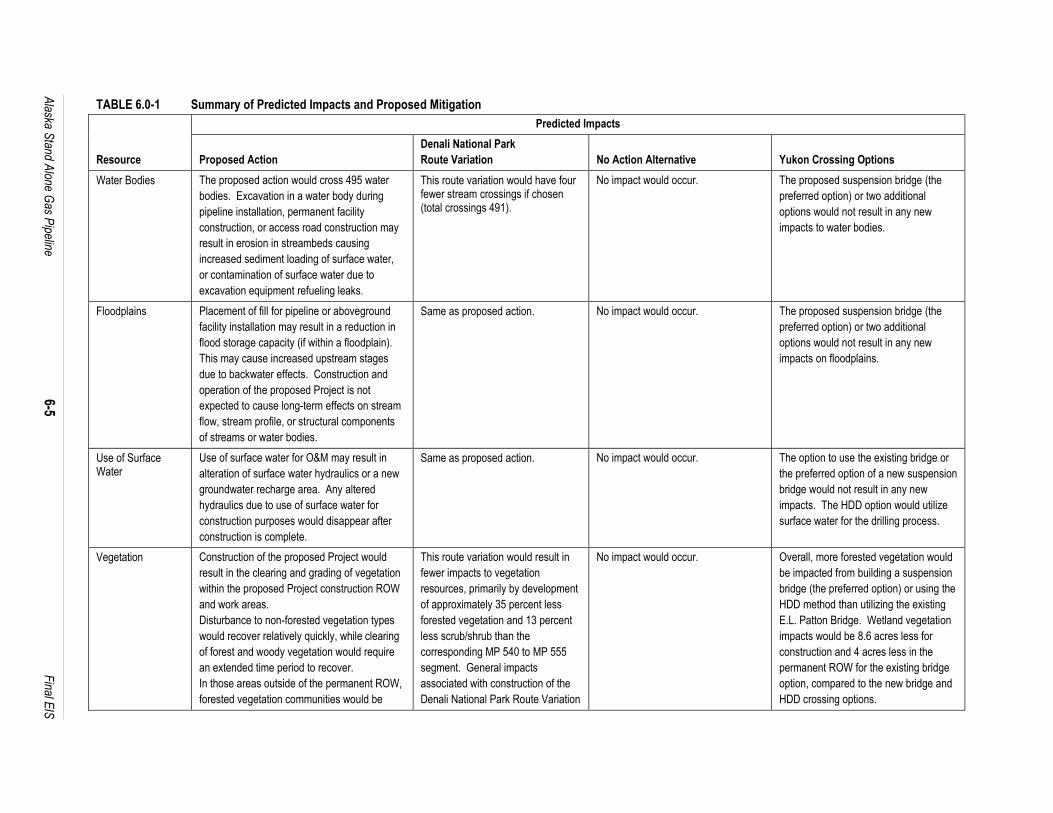
Alaska S
tand Alone G
as Pipeline
6-5
F
inal EIS
TABLE 6.0-1 Summary of Predicted Impacts and Proposed Mitigation
Resource
Predicted Impacts
Proposed Action
Denali National Park
Route Variation No Action Alternative Yukon Crossing Options
Water Bodies The proposed action would cross 495 water
bodies. Excavation in a water body during
pipeline installation, permanent facility
construction, or access road construction may
result in erosion in streambeds causing
increased sediment loading of surface water,
or contamination of surface water due to
excavation equipment refueling leaks.
This route variation would have four fewer stream crossings if chosen (total crossings 491).
No impact would occur. The proposed suspension bridge (the
preferred option) or two additional
options would not result in any new
impacts to water bodies.
Floodplains Placement of fill for pipeline or aboveground
facility installation may result in a reduction in
flood storage capacity (if within a floodplain).
This may cause increased upstream stages
due to backwater effects. Construction and
operation of the proposed Project is not
expected to cause long-term effects on stream
flow, stream profile, or structural components
of streams or water bodies.
Same as proposed action. No impact would occur. The proposed suspension bridge (the
preferred option) or two additional
options would not result in any new
impacts on floodplains.
Use of Surface Water
Use of surface water for O&M may result in
alteration of surface water hydraulics or a new
groundwater recharge area. Any altered
hydraulics due to use of surface water for
construction purposes would disappear after
construction is complete.
Same as proposed action. No impact would occur. The option to use the existing bridge or
the preferred option of a new suspension
bridge would not result in any new
impacts. The HDD option would utilize
surface water for the drilling process.
Vegetation Construction of the proposed Project would
result in the clearing and grading of vegetation
within the proposed Project construction ROW
and work areas.
Disturbance to non-forested vegetation types
would recover relatively quickly, while clearing
of forest and woody vegetation would require
an extended time period to recover.
In those areas outside of the permanent ROW,
forested vegetation communities would be
This route variation would result in
fewer impacts to vegetation
resources, primarily by development
of approximately 35 percent less
forested vegetation and 13 percent
less scrub/shrub than the
corresponding MP 540 to MP 555
segment. General impacts
associated with construction of the
Denali National Park Route Variation
No impact would occur. Overall, more forested vegetation would
be impacted from building a suspension
bridge (the preferred option) or using the
HDD method than utilizing the existing
E.L. Patton Bridge. Wetland vegetation
impacts would be 8.6 acres less for
construction and 4 acres less in the
permanent ROW for the existing bridge
option, compared to the new bridge and
HDD crossing options.
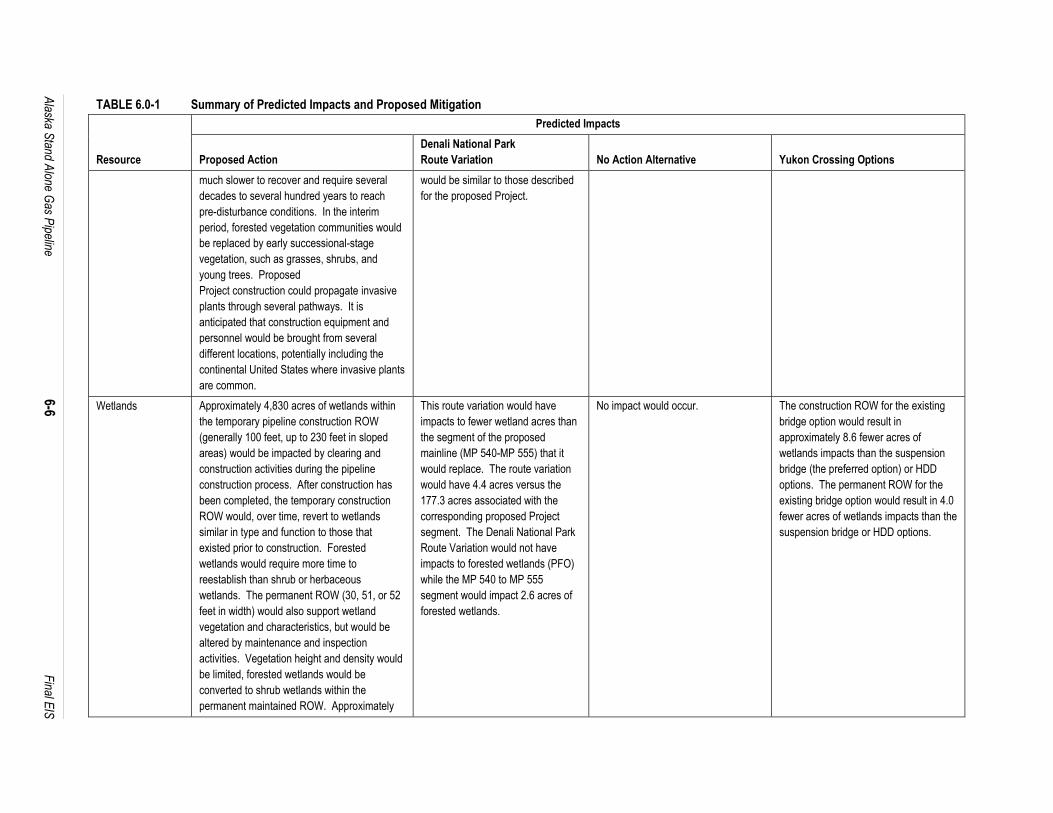
Alaska S
tand Alone G
as Pipeline
6-6
F
inal EIS
TABLE 6.0-1 Summary of Predicted Impacts and Proposed Mitigation
Resource
Predicted Impacts
Proposed Action
Denali National Park
Route Variation No Action Alternative Yukon Crossing Options
much slower to recover and require several
decades to several hundred years to reach
pre-disturbance conditions. In the interim
period, forested vegetation communities would
be replaced by early successional-stage
vegetation, such as grasses, shrubs, and
young trees. Proposed
Project construction could propagate invasive
plants through several pathways. It is
anticipated that construction equipment and
personnel would be brought from several
different locations, potentially including the
continental United States where invasive plants
are common.
would be similar to those described
for the proposed Project.
Wetlands Approximately 4,830 acres of wetlands within
the temporary pipeline construction ROW
(generally 100 feet, up to 230 feet in sloped
areas) would be impacted by clearing and
construction activities during the pipeline
construction process. After construction has
been completed, the temporary construction
ROW would, over time, revert to wetlands
similar in type and function to those that
existed prior to construction. Forested
wetlands would require more time to
reestablish than shrub or herbaceous
wetlands. The permanent ROW (30, 51, or 52
feet in width) would also support wetland
vegetation and characteristics, but would be
altered by maintenance and inspection
activities. Vegetation height and density would
be limited, forested wetlands would be
converted to shrub wetlands within the
permanent maintained ROW. Approximately
This route variation would have
impacts to fewer wetland acres than
the segment of the proposed
mainline (MP 540-MP 555) that it
would replace. The route variation
would have 4.4 acres versus the
177.3 acres associated with the
corresponding proposed Project
segment. The Denali National Park
Route Variation would not have
impacts to forested wetlands (PFO)
while the MP 540 to MP 555
segment would impact 2.6 acres of
forested wetlands.
No impact would occur. The construction ROW for the existing
bridge option would result in
approximately 8.6 fewer acres of
wetlands impacts than the suspension
bridge (the preferred option) or HDD
options. The permanent ROW for the
existing bridge option would result in 4.0
fewer acres of wetlands impacts than the
suspension bridge or HDD options.
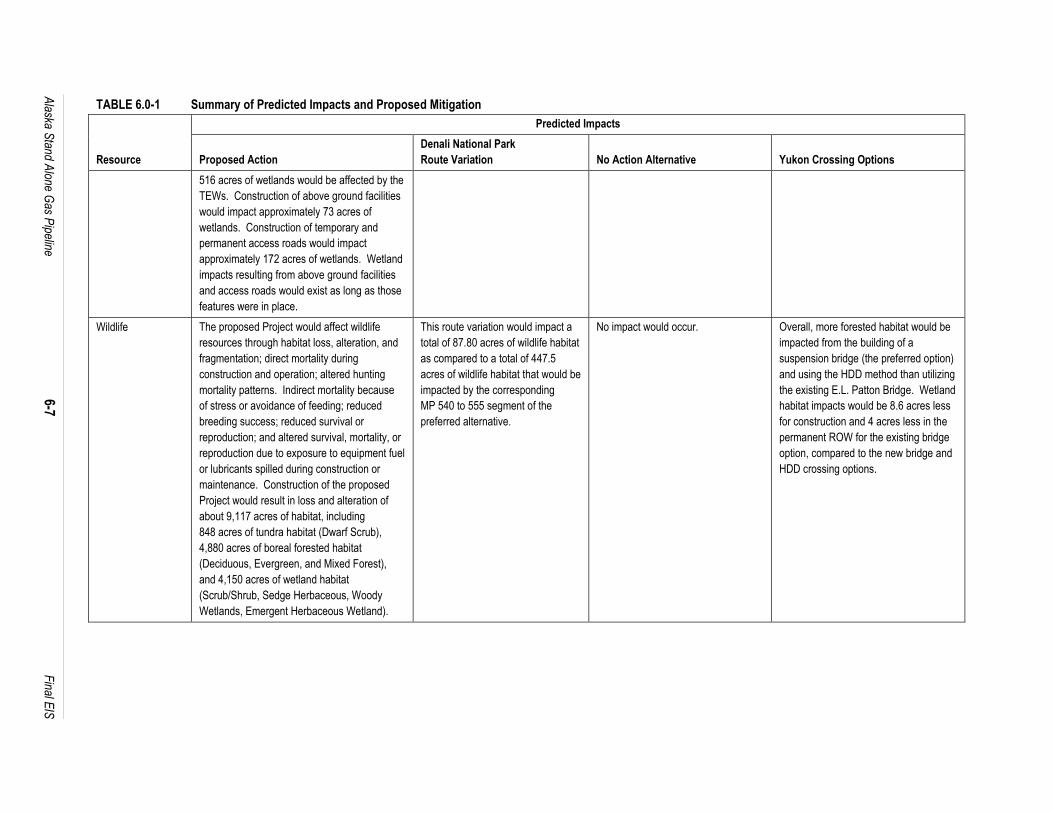
Alaska S
tand Alone G
as Pipeline
6-7
F
inal EIS
TABLE 6.0-1 Summary of Predicted Impacts and Proposed Mitigation
Resource
Predicted Impacts
Proposed Action
Denali National Park
Route Variation No Action Alternative Yukon Crossing Options
516 acres of wetlands would be affected by the
TEWs. Construction of above ground facilities
would impact approximately 73 acres of
wetlands. Construction of temporary and
permanent access roads would impact
approximately 172 acres of wetlands. Wetland
impacts resulting from above ground facilities
and access roads would exist as long as those
features were in place.
Wildlife The proposed Project would affect wildlife
resources through habitat loss, alteration, and
fragmentation; direct mortality during
construction and operation; altered hunting
mortality patterns. Indirect mortality because
of stress or avoidance of feeding; reduced
breeding success; reduced survival or
reproduction; and altered survival, mortality, or
reproduction due to exposure to equipment fuel
or lubricants spilled during construction or
maintenance. Construction of the proposed
Project would result in loss and alteration of
about 9,117 acres of habitat, including
848 acres of tundra habitat (Dwarf Scrub),
4,880 acres of boreal forested habitat
(Deciduous, Evergreen, and Mixed Forest),
and 4,150 acres of wetland habitat
(Scrub/Shrub, Sedge Herbaceous, Woody
Wetlands, Emergent Herbaceous Wetland).
This route variation would impact a
total of 87.80 acres of wildlife habitat
as compared to a total of 447.5
acres of wildlife habitat that would be
impacted by the corresponding
MP 540 to 555 segment of the
preferred alternative.
No impact would occur. Overall, more forested habitat would be
impacted from the building of a
suspension bridge (the preferred option)
and using the HDD method than utilizing
the existing E.L. Patton Bridge. Wetland
habitat impacts would be 8.6 acres less
for construction and 4 acres less in the
permanent ROW for the existing bridge
option, compared to the new bridge and
HDD crossing options.

Alaska S
tand Alone G
as Pipeline
6-8
F
inal EIS
TABLE 6.0-1 Summary of Predicted Impacts and Proposed Mitigation
Resource
Predicted Impacts
Proposed Action
Denali National Park
Route Variation No Action Alternative Yukon Crossing Options
Fish Pipeline construction would most likely cause
short-term disturbances to fishery resources.
Potential impacts to fishery resources that
would occur during construction include
reduced survival and/or productivity and habitat
loss or alteration. The majority of the stream
crossings (400) would occur between the GCF
and MP 540. Eleven stream crossings in this
segment would be conducted using HDD and
there would be a new crossing of the Yukon
River in this segment. Twenty-nine of the
stream crossings contain anadromous fish and
13 stream crossings contain Fish of
Conservation Concern. Six stream crossings
would occur between MP 540 and MP 555.
None of these crossings contain anadromous
fish. One crossing does contain Fish of
Conservation Concern. All crossings are
proposed to be crossed using open cut
methods during the summer months. Ninety
stream crossings would occur between
Mile 555 and the Cook Inlet NGLEP Facility.
The majority of the streams containing
anadromous fish occur in this segment, with 53
water body crossings containing anadromous
fish. Twenty-five of these anadromous fish-
bearing stream crossings would be constructed
using open cut methods, 26 would use HDD
methods, and 2 stream crossings would use
existing bridges.
This route variation would have four
stream crossings. The Nenana
River is considered an anadromous
stream containing chum, coho and
chinook salmon and would be
crossed two more times under this
alternative.
No impact would occur. Neither the proposed suspension bridge
(the preferred option) nor two other
Yukon River crossing options would
result in any new impacts.
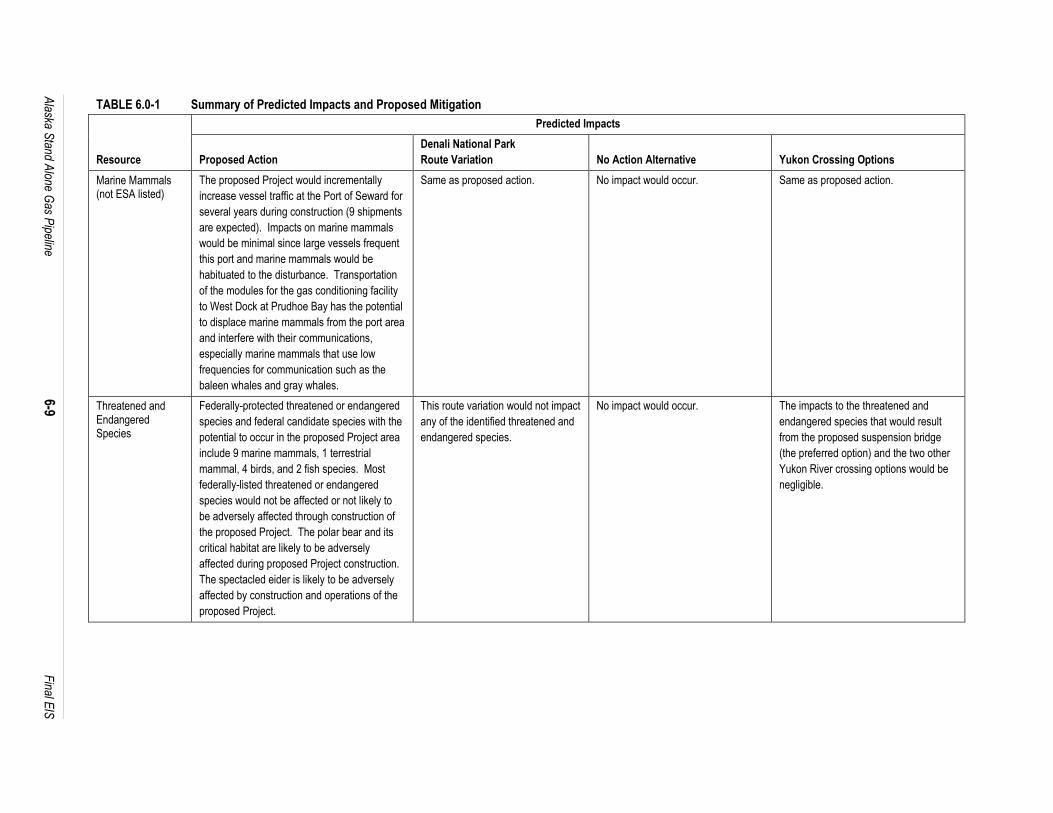
Alaska S
tand Alone G
as Pipeline
6-9
F
inal EIS
TABLE 6.0-1 Summary of Predicted Impacts and Proposed Mitigation
Resource
Predicted Impacts
Proposed Action
Denali National Park
Route Variation No Action Alternative Yukon Crossing Options
Marine Mammals (not ESA listed)
The proposed Project would incrementally
increase vessel traffic at the Port of Seward for
several years during construction (9 shipments
are expected). Impacts on marine mammals
would be minimal since large vessels frequent
this port and marine mammals would be
habituated to the disturbance. Transportation
of the modules for the gas conditioning facility
to West Dock at Prudhoe Bay has the potential
to displace marine mammals from the port area
and interfere with their communications,
especially marine mammals that use low
frequencies for communication such as the
baleen whales and gray whales.
Same as proposed action. No impact would occur. Same as proposed action.
Threatened and Endangered Species
Federally-protected threatened or endangered
species and federal candidate species with the
potential to occur in the proposed Project area
include 9 marine mammals, 1 terrestrial
mammal, 4 birds, and 2 fish species. Most
federally-listed threatened or endangered
species would not be affected or not likely to
be adversely affected through construction of
the proposed Project. The polar bear and its
critical habitat are likely to be adversely
affected during proposed Project construction.
The spectacled eider is likely to be adversely
affected by construction and operations of the
proposed Project.
This route variation would not impact
any of the identified threatened and
endangered species.
No impact would occur. The impacts to the threatened and
endangered species that would result
from the proposed suspension bridge
(the preferred option) and the two other
Yukon River crossing options would be
negligible.

Alaska S
tand Alone G
as Pipeline
6-10
F
inal EIS
TABLE 6.0-1 Summary of Predicted Impacts and Proposed Mitigation
Resource
Predicted Impacts
Proposed Action
Denali National Park
Route Variation No Action Alternative Yukon Crossing Options
Land Use The proposed Project ROW would impact
lands owned by the federal government and
managed by the BLM, DoD, and NPS. The
State of Alaska, University of Alaska, AHTNA,
Inc. and the Toghotthele Corporation have
selected federally-owned lands within the
proposed Project ROW. The state of Alaska
owns the greatest number of parcels within the
proposed ROW. Lands owned by the state of
Alaska are managed by the ADNR. With the
exception of the Denali National Park and
Preserve (DNPP) and 6(f) lands, all other lands
with applicable land use plans or documents
would have provisions for utility crossings;
therefore, the proposed Project would be
compatible with these plans. The Proposed
Action ROW would cross railroads, utilities
(including the TAPS), trails, driveways, and
local and arterial roads. Potential effects
include disruption to traffic flow and utility
service. Effects to agricultural land would be
minimal, with only 0.1 percent of the
construction area affected by the Proposed
Action ROW consisting of agricultural land.
The proposed Project has the potential to
affect developed land by exposing residences
or commercial/industrial buildings located near
the proposed Project ROW and aboveground
facilities to dust and noise primarily during
proposed Project construction.
The Denali National Park Route
Variation would cross mainly federal
(51.3 percent) and state-owned
(36.4 percent) lands. In contrast, the
corresponding MP 540 to 555
segment of the preferred alternative
would cross mostly state-owned
(51.3 percent) and Native
corporation (46.2 percent) lands,
and would not intersect federally-
managed lands. The variation would
be approximately 15.3 miles in
length, and would be within Denali
National Park for approximately 7
miles, parallel to the Parks Highway.
Currently, Federal laws do not allow
construction of this route variation
within Denali NPP. Federal
legislation that would allow the route
variation has been introduced by the
Alaska delegation, and is currently
being considered by the U.S.
Congress. If authorized by
Congress, the NPS would have
authority to authorize a ROW for the
alternate route or mode which would
result in the fewest or least severe
adverse impacts upon the area.
This route would intersect the
railroad ROW twice. It would not
cross roads, trails/driveways,
utilities, or the TAPS. All railroad
crossings would be installed by slick-
boring; therefore, no disruption to
No impact would occur. More land would be impacted from
building a proposed suspension bridge
(the preferred option) and using the HDD
method than utilizing the existing E.L.
Patton Yukon River Bridge The
preferred option and the HDD river
crossing would intersect one or more
Native allotments.
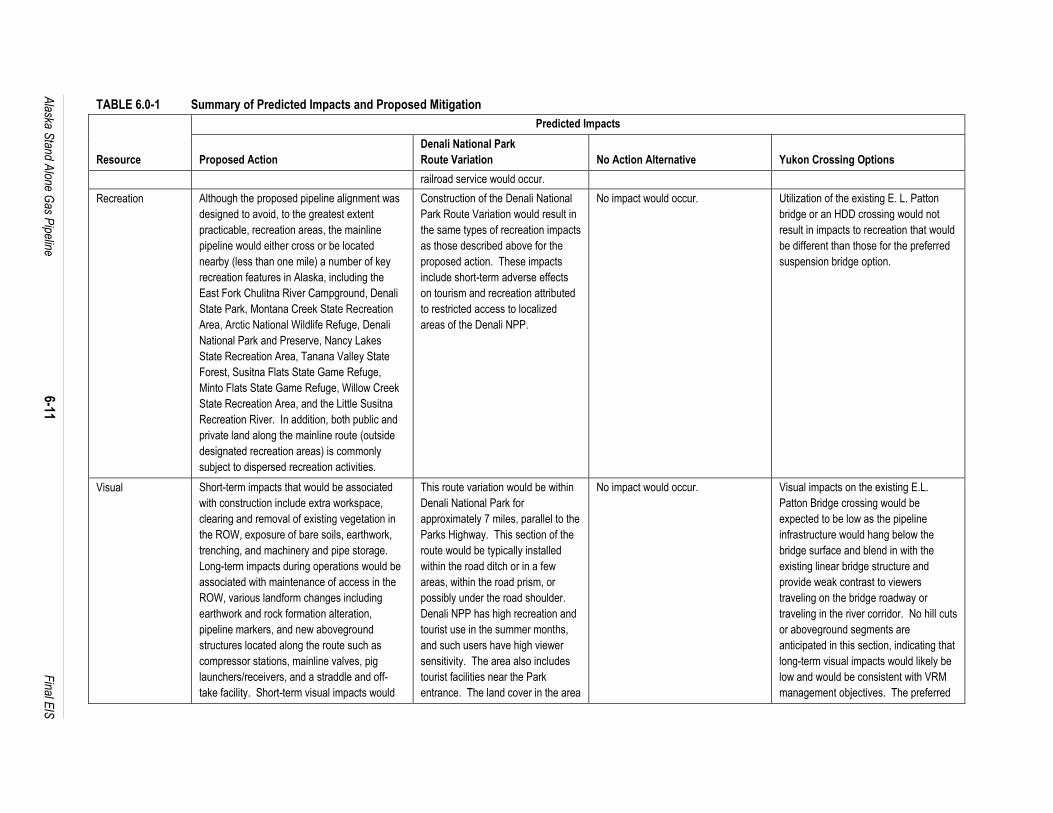
Alaska S
tand Alone G
as Pipeline
6-11
F
inal EIS
TABLE 6.0-1 Summary of Predicted Impacts and Proposed Mitigation
Resource
Predicted Impacts
Proposed Action
Denali National Park
Route Variation No Action Alternative Yukon Crossing Options
railroad service would occur.
Recreation Although the proposed pipeline alignment was
designed to avoid, to the greatest extent
practicable, recreation areas, the mainline
pipeline would either cross or be located
nearby (less than one mile) a number of key
recreation features in Alaska, including the
East Fork Chulitna River Campground, Denali
State Park, Montana Creek State Recreation
Area, Arctic National Wildlife Refuge, Denali
National Park and Preserve, Nancy Lakes
State Recreation Area, Tanana Valley State
Forest, Susitna Flats State Game Refuge,
Minto Flats State Game Refuge, Willow Creek
State Recreation Area, and the Little Susitna
Recreation River. In addition, both public and
private land along the mainline route (outside
designated recreation areas) is commonly
subject to dispersed recreation activities.
Construction of the Denali National
Park Route Variation would result in
the same types of recreation impacts
as those described above for the
proposed action. These impacts
include short-term adverse effects
on tourism and recreation attributed
to restricted access to localized
areas of the Denali NPP.
No impact would occur. Utilization of the existing E. L. Patton
bridge or an HDD crossing would not
result in impacts to recreation that would
be different than those for the preferred
suspension bridge option.
Visual Short-term impacts that would be associated
with construction include extra workspace,
clearing and removal of existing vegetation in
the ROW, exposure of bare soils, earthwork,
trenching, and machinery and pipe storage.
Long-term impacts during operations would be
associated with maintenance of access in the
ROW, various landform changes including
earthwork and rock formation alteration,
pipeline markers, and new aboveground
structures located along the route such as
compressor stations, mainline valves, pig
launchers/receivers, and a straddle and off-
take facility. Short-term visual impacts would
This route variation would be within
Denali National Park for
approximately 7 miles, parallel to the
Parks Highway. This section of the
route would be typically installed
within the road ditch or in a few
areas, within the road prism, or
possibly under the road shoulder.
Denali NPP has high recreation and
tourist use in the summer months,
and such users have high viewer
sensitivity. The area also includes
tourist facilities near the Park
entrance. The land cover in the area
No impact would occur. Visual impacts on the existing E.L.
Patton Bridge crossing would be
expected to be low as the pipeline
infrastructure would hang below the
bridge surface and blend in with the
existing linear bridge structure and
provide weak contrast to viewers
traveling on the bridge roadway or
traveling in the river corridor. No hill cuts
or aboveground segments are
anticipated in this section, indicating that
long-term visual impacts would likely be
low and would be consistent with VRM
management objectives. The preferred
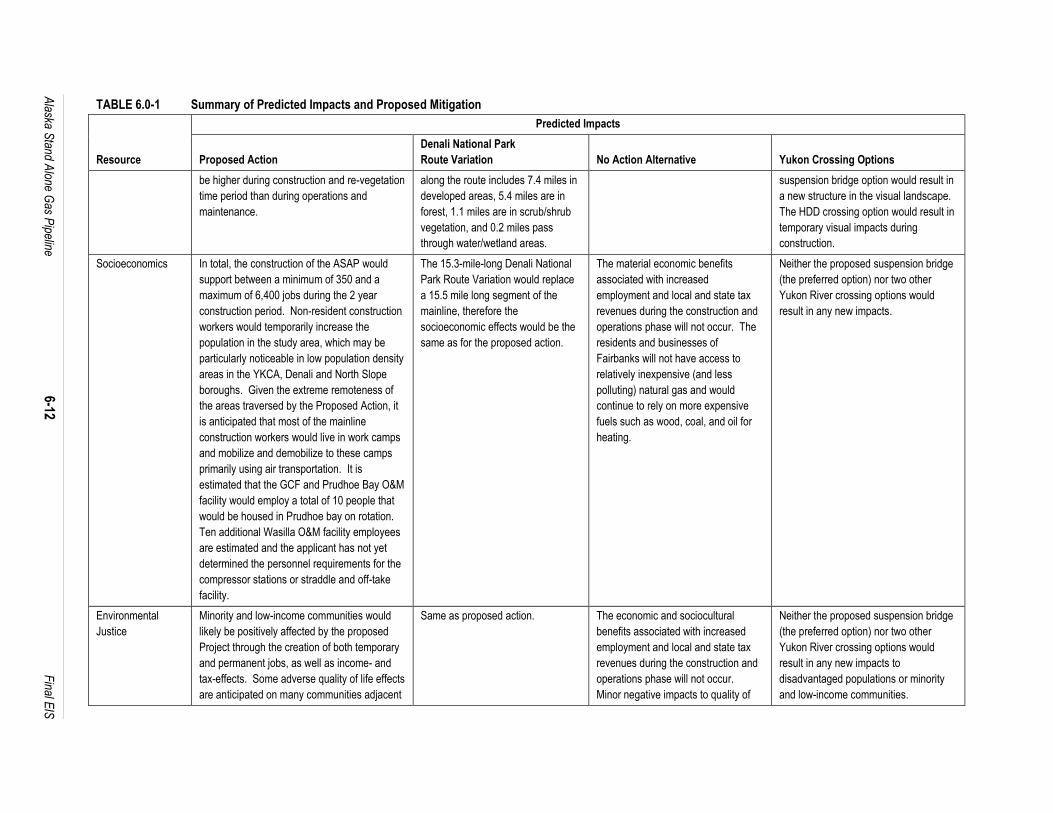
Alaska S
tand Alone G
as Pipeline
6-12
F
inal EIS
TABLE 6.0-1 Summary of Predicted Impacts and Proposed Mitigation
Resource
Predicted Impacts
Proposed Action
Denali National Park
Route Variation No Action Alternative Yukon Crossing Options
be higher during construction and re-vegetation
time period than during operations and
maintenance.
along the route includes 7.4 miles in
developed areas, 5.4 miles are in
forest, 1.1 miles are in scrub/shrub
vegetation, and 0.2 miles pass
through water/wetland areas.
suspension bridge option would result in
a new structure in the visual landscape.
The HDD crossing option would result in
temporary visual impacts during
construction.
Socioeconomics In total, the construction of the ASAP would
support between a minimum of 350 and a
maximum of 6,400 jobs during the 2 year
construction period. Non-resident construction
workers would temporarily increase the
population in the study area, which may be
particularly noticeable in low population density
areas in the YKCA, Denali and North Slope
boroughs. Given the extreme remoteness of
the areas traversed by the Proposed Action, it
is anticipated that most of the mainline
construction workers would live in work camps
and mobilize and demobilize to these camps
primarily using air transportation. It is
estimated that the GCF and Prudhoe Bay O&M
facility would employ a total of 10 people that
would be housed in Prudhoe bay on rotation.
Ten additional Wasilla O&M facility employees
are estimated and the applicant has not yet
determined the personnel requirements for the
compressor stations or straddle and off-take
facility.
The 15.3-mile-long Denali National
Park Route Variation would replace
a 15.5 mile long segment of the
mainline, therefore the
socioeconomic effects would be the
same as for the proposed action.
The material economic benefits
associated with increased
employment and local and state tax
revenues during the construction and
operations phase will not occur. The
residents and businesses of
Fairbanks will not have access to
relatively inexpensive (and less
polluting) natural gas and would
continue to rely on more expensive
fuels such as wood, coal, and oil for
heating.
Neither the proposed suspension bridge
(the preferred option) nor two other
Yukon River crossing options would
result in any new impacts.
Environmental
Justice
Minority and low-income communities would
likely be positively affected by the proposed
Project through the creation of both temporary
and permanent jobs, as well as income- and
tax-effects. Some adverse quality of life effects
are anticipated on many communities adjacent
Same as proposed action. The economic and sociocultural
benefits associated with increased
employment and local and state tax
revenues during the construction and
operations phase will not occur.
Minor negative impacts to quality of
Neither the proposed suspension bridge
(the preferred option) nor two other
Yukon River crossing options would
result in any new impacts to
disadvantaged populations or minority
and low-income communities.
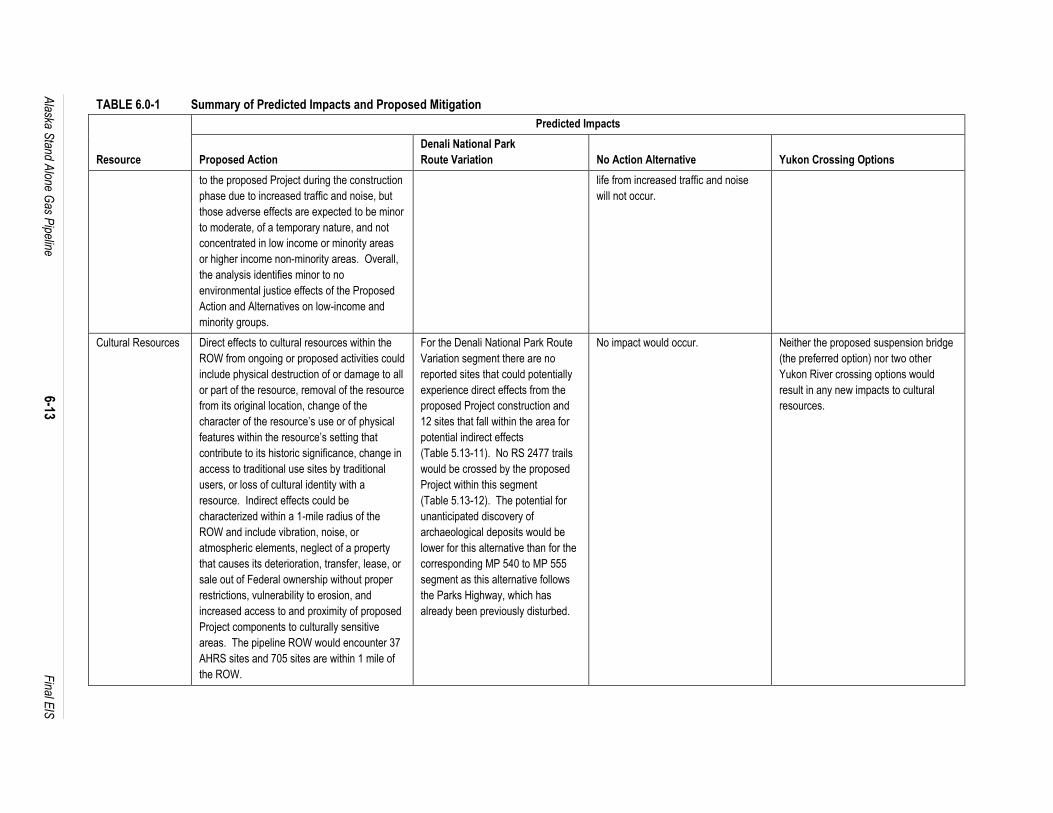
Alaska S
tand Alone G
as Pipeline
6-13
F
inal EIS
TABLE 6.0-1 Summary of Predicted Impacts and Proposed Mitigation
Resource
Predicted Impacts
Proposed Action
Denali National Park
Route Variation No Action Alternative Yukon Crossing Options
to the proposed Project during the construction
phase due to increased traffic and noise, but
those adverse effects are expected to be minor
to moderate, of a temporary nature, and not
concentrated in low income or minority areas
or higher income non-minority areas. Overall,
the analysis identifies minor to no
environmental justice effects of the Proposed
Action and Alternatives on low-income and
minority groups.
life from increased traffic and noise
will not occur.
Cultural Resources Direct effects to cultural resources within the
ROW from ongoing or proposed activities could
include physical destruction of or damage to all
or part of the resource, removal of the resource
from its original location, change of the
character of the resource’s use or of physical
features within the resource’s setting that
contribute to its historic significance, change in
access to traditional use sites by traditional
users, or loss of cultural identity with a
resource. Indirect effects could be
characterized within a 1-mile radius of the
ROW and include vibration, noise, or
atmospheric elements, neglect of a property
that causes its deterioration, transfer, lease, or
sale out of Federal ownership without proper
restrictions, vulnerability to erosion, and
increased access to and proximity of proposed
Project components to culturally sensitive
areas. The pipeline ROW would encounter 37
AHRS sites and 705 sites are within 1 mile of
the ROW.
For the Denali National Park Route
Variation segment there are no
reported sites that could potentially
experience direct effects from the
proposed Project construction and
12 sites that fall within the area for
potential indirect effects
(Table 5.13-11). No RS 2477 trails
would be crossed by the proposed
Project within this segment
(Table 5.13-12). The potential for
unanticipated discovery of
archaeological deposits would be
lower for this alternative than for the
corresponding MP 540 to MP 555
segment as this alternative follows
the Parks Highway, which has
already been previously disturbed.
No impact would occur. Neither the proposed suspension bridge
(the preferred option) nor two other
Yukon River crossing options would
result in any new impacts to cultural
resources.
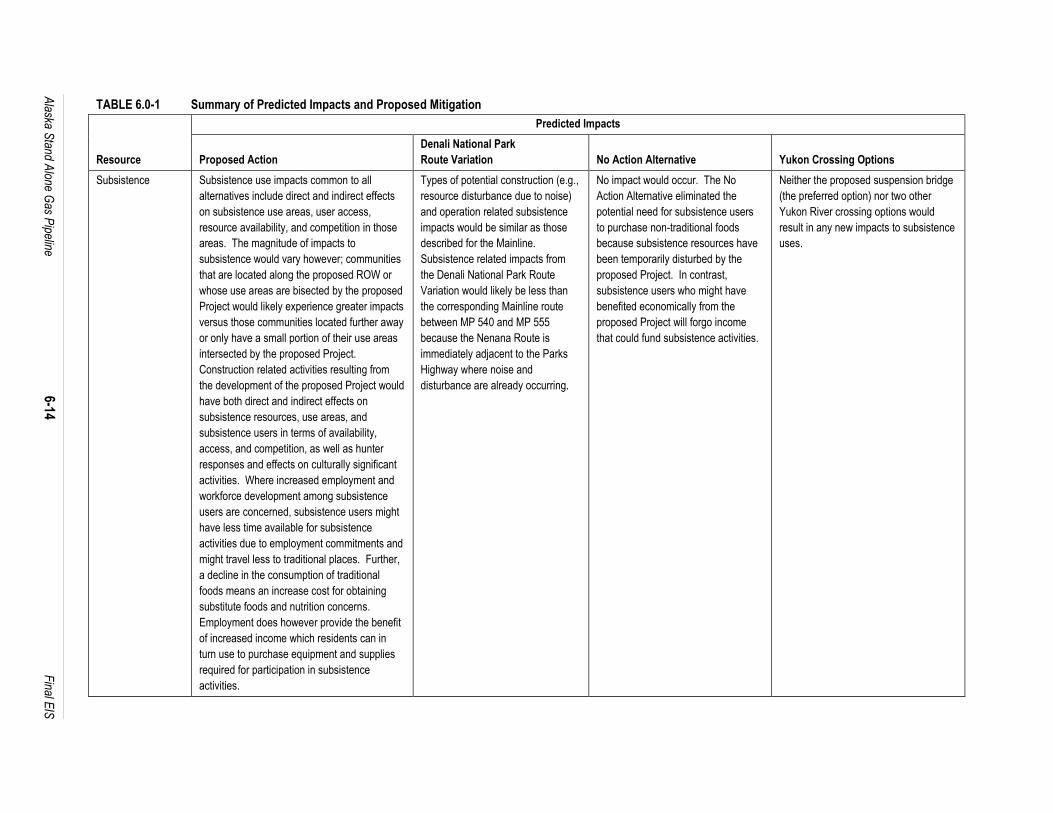
Alaska S
tand Alone G
as Pipeline
6-14
F
inal EIS
TABLE 6.0-1 Summary of Predicted Impacts and Proposed Mitigation
Resource
Predicted Impacts
Proposed Action
Denali National Park
Route Variation No Action Alternative Yukon Crossing Options
Subsistence Subsistence use impacts common to all
alternatives include direct and indirect effects
on subsistence use areas, user access,
resource availability, and competition in those
areas. The magnitude of impacts to
subsistence would vary however; communities
that are located along the proposed ROW or
whose use areas are bisected by the proposed
Project would likely experience greater impacts
versus those communities located further away
or only have a small portion of their use areas
intersected by the proposed Project.
Construction related activities resulting from
the development of the proposed Project would
have both direct and indirect effects on
subsistence resources, use areas, and
subsistence users in terms of availability,
access, and competition, as well as hunter
responses and effects on culturally significant
activities. Where increased employment and
workforce development among subsistence
users are concerned, subsistence users might
have less time available for subsistence
activities due to employment commitments and
might travel less to traditional places. Further,
a decline in the consumption of traditional
foods means an increase cost for obtaining
substitute foods and nutrition concerns.
Employment does however provide the benefit
of increased income which residents can in
turn use to purchase equipment and supplies
required for participation in subsistence
activities.
Types of potential construction (e.g.,
resource disturbance due to noise)
and operation related subsistence
impacts would be similar as those
described for the Mainline.
Subsistence related impacts from
the Denali National Park Route
Variation would likely be less than
the corresponding Mainline route
between MP 540 and MP 555
because the Nenana Route is
immediately adjacent to the Parks
Highway where noise and
disturbance are already occurring.
No impact would occur. The No
Action Alternative eliminated the
potential need for subsistence users
to purchase non-traditional foods
because subsistence resources have
been temporarily disturbed by the
proposed Project. In contrast,
subsistence users who might have
benefited economically from the
proposed Project will forgo income
that could fund subsistence activities.
Neither the proposed suspension bridge
(the preferred option) nor two other
Yukon River crossing options would
result in any new impacts to subsistence
uses.

Alaska S
tand Alone G
as Pipeline
6-15
F
inal EIS
TABLE 6.0-1 Summary of Predicted Impacts and Proposed Mitigation
Resource
Predicted Impacts
Proposed Action
Denali National Park
Route Variation No Action Alternative Yukon Crossing Options
Public Health Possible health impacts considered include
water and sanitation; accidents/injuries; health
infrastructure and delivery; exposure to
hazardous materials; food, nutrition, and
subsistence; infectious diseases (perhaps
transmitted by pipeline construction workers);
non-communicable and chronic diseases; and
social determinants of health. Using the rating
system described in the HIA toolkit, nearly all
these impacts would be described as ‘low.’
The possibility of fatal and nonfatal injuries to
members of the general public from
incremental road and railroad traffic associated
with pipeline construction and operation are
scored medium using the rating scheme.
Although the health effects could be severe for
those impacted, quantitative estimates of the
number of persons injured are quite low.
Adverse impacts on social determinants of
health could arise from anxieties/concerns
related to possible loss or lowering of lifestyle
quality and fears about
accidents/fires/explosions resulting from leaks
from the pipeline during the operations phase.
Estimates of leak frequency are provided. The
largest health impact of the pipeline would
occur during the operations phase (assuming
that the gas distribution network was expanded
in Fairbanks). Natural gas emits fewer pounds
of various pollutants, particularly fine
particulates, than other fossil fuels (coal, oil) or
wood. Substitution of natural gas for other
fuels presently used for heating would reduce
fine particulate emissions in Fairbanks
Same as proposed action. The No Action Alternative foregoes all
of the major health benefits
associated with the availability of
clean burning natural gas in
Fairbanks. Airborne particulate matter
generated by the combustion of wood,
oil, and coal for heating continues to
contribute to increased morbidity and
mortality for Fairbanks residents. In
all parts of the study area there is no
incremental impact associated with
infectious diseases but there are none
of the outreach and health education
plans proposed as a mitigation
measure associated with the
proposed action. With regard to other
health effects, no impact would occur.
Same as proposed action.
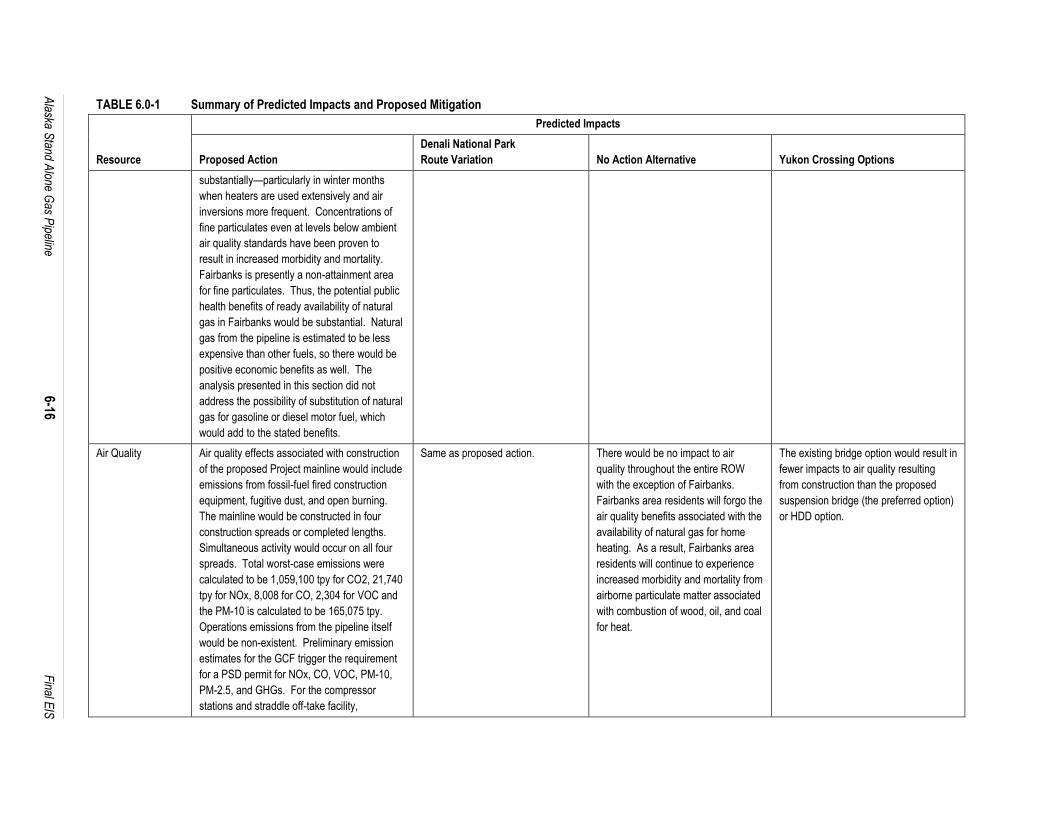
Alaska S
tand Alone G
as Pipeline
6-16
F
inal EIS
TABLE 6.0-1 Summary of Predicted Impacts and Proposed Mitigation
Resource
Predicted Impacts
Proposed Action
Denali National Park
Route Variation No Action Alternative Yukon Crossing Options
substantially—particularly in winter months
when heaters are used extensively and air
inversions more frequent. Concentrations of
fine particulates even at levels below ambient
air quality standards have been proven to
result in increased morbidity and mortality.
Fairbanks is presently a non-attainment area
for fine particulates. Thus, the potential public
health benefits of ready availability of natural
gas in Fairbanks would be substantial. Natural
gas from the pipeline is estimated to be less
expensive than other fuels, so there would be
positive economic benefits as well. The
analysis presented in this section did not
address the possibility of substitution of natural
gas for gasoline or diesel motor fuel, which
would add to the stated benefits.
Air Quality Air quality effects associated with construction
of the proposed Project mainline would include
emissions from fossil-fuel fired construction
equipment, fugitive dust, and open burning.
The mainline would be constructed in four
construction spreads or completed lengths.
Simultaneous activity would occur on all four
spreads. Total worst-case emissions were
calculated to be 1,059,100 tpy for CO2, 21,740
tpy for NOx, 8,008 for CO, 2,304 for VOC and
the PM-10 is calculated to be 165,075 tpy.
Operations emissions from the pipeline itself
would be non-existent. Preliminary emission
estimates for the GCF trigger the requirement
for a PSD permit for NOx, CO, VOC, PM-10,
PM-2.5, and GHGs. For the compressor
stations and straddle off-take facility,
Same as proposed action. There would be no impact to air
quality throughout the entire ROW
with the exception of Fairbanks.
Fairbanks area residents will forgo the
air quality benefits associated with the
availability of natural gas for home
heating. As a result, Fairbanks area
residents will continue to experience
increased morbidity and mortality from
airborne particulate matter associated
with combustion of wood, oil, and coal
for heat.
The existing bridge option would result in
fewer impacts to air quality resulting
from construction than the proposed
suspension bridge (the preferred option)
or HDD option.
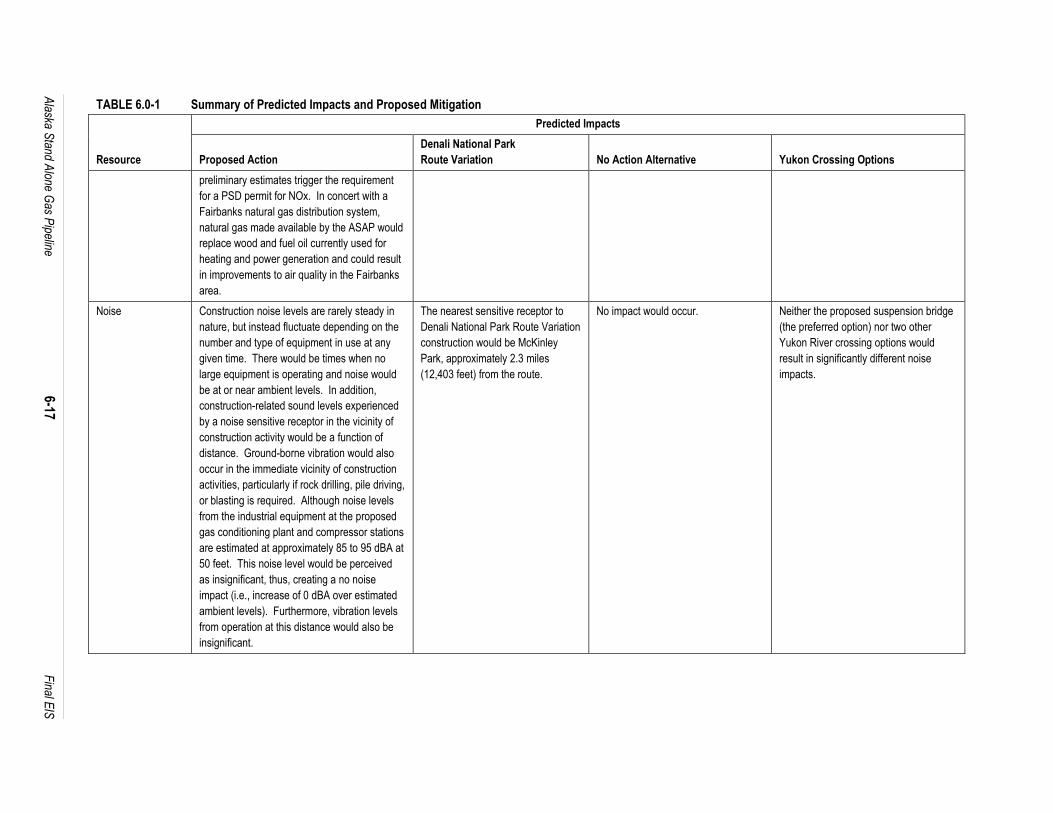
Alaska S
tand Alone G
as Pipeline
6-17
F
inal EIS
TABLE 6.0-1 Summary of Predicted Impacts and Proposed Mitigation
Resource
Predicted Impacts
Proposed Action
Denali National Park
Route Variation No Action Alternative Yukon Crossing Options
preliminary estimates trigger the requirement
for a PSD permit for NOx. In concert with a
Fairbanks natural gas distribution system,
natural gas made available by the ASAP would
replace wood and fuel oil currently used for
heating and power generation and could result
in improvements to air quality in the Fairbanks
area.
Noise Construction noise levels are rarely steady in
nature, but instead fluctuate depending on the
number and type of equipment in use at any
given time. There would be times when no
large equipment is operating and noise would
be at or near ambient levels. In addition,
construction-related sound levels experienced
by a noise sensitive receptor in the vicinity of
construction activity would be a function of
distance. Ground-borne vibration would also
occur in the immediate vicinity of construction
activities, particularly if rock drilling, pile driving,
or blasting is required. Although noise levels
from the industrial equipment at the proposed
gas conditioning plant and compressor stations
are estimated at approximately 85 to 95 dBA at
50 feet. This noise level would be perceived
as insignificant, thus, creating a no noise
impact (i.e., increase of 0 dBA over estimated
ambient levels). Furthermore, vibration levels
from operation at this distance would also be
insignificant.
The nearest sensitive receptor to
Denali National Park Route Variation
construction would be McKinley
Park, approximately 2.3 miles
(12,403 feet) from the route.
No impact would occur. Neither the proposed suspension bridge
(the preferred option) nor two other
Yukon River crossing options would
result in significantly different noise
impacts.
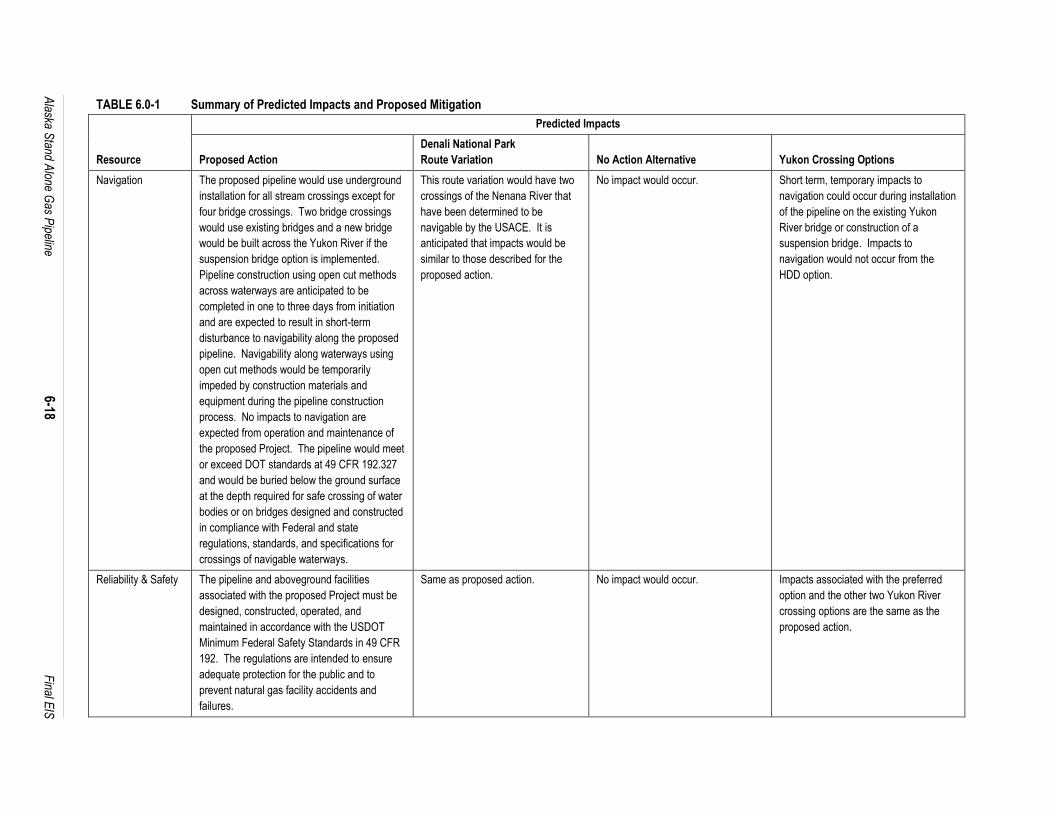
Alaska S
tand Alone G
as Pipeline
6-18
F
inal EIS
TABLE 6.0-1 Summary of Predicted Impacts and Proposed Mitigation
Resource
Predicted Impacts
Proposed Action
Denali National Park
Route Variation No Action Alternative Yukon Crossing Options
Navigation The proposed pipeline would use underground
installation for all stream crossings except for
four bridge crossings. Two bridge crossings
would use existing bridges and a new bridge
would be built across the Yukon River if the
suspension bridge option is implemented.
Pipeline construction using open cut methods
across waterways are anticipated to be
completed in one to three days from initiation
and are expected to result in short-term
disturbance to navigability along the proposed
pipeline. Navigability along waterways using
open cut methods would be temporarily
impeded by construction materials and
equipment during the pipeline construction
process. No impacts to navigation are
expected from operation and maintenance of
the proposed Project. The pipeline would meet
or exceed DOT standards at 49 CFR 192.327
and would be buried below the ground surface
at the depth required for safe crossing of water
bodies or on bridges designed and constructed
in compliance with Federal and state
regulations, standards, and specifications for
crossings of navigable waterways.
This route variation would have two
crossings of the Nenana River that
have been determined to be
navigable by the USACE. It is
anticipated that impacts would be
similar to those described for the
proposed action.
No impact would occur. Short term, temporary impacts to
navigation could occur during installation
of the pipeline on the existing Yukon
River bridge or construction of a
suspension bridge. Impacts to
navigation would not occur from the
HDD option.
Reliability & Safety The pipeline and aboveground facilities
associated with the proposed Project must be
designed, constructed, operated, and
maintained in accordance with the USDOT
Minimum Federal Safety Standards in 49 CFR
192. The regulations are intended to ensure
adequate protection for the public and to
prevent natural gas facility accidents and
failures.
Same as proposed action. No impact would occur. Impacts associated with the preferred
option and the other two Yukon River
crossing options are the same as the
proposed action.
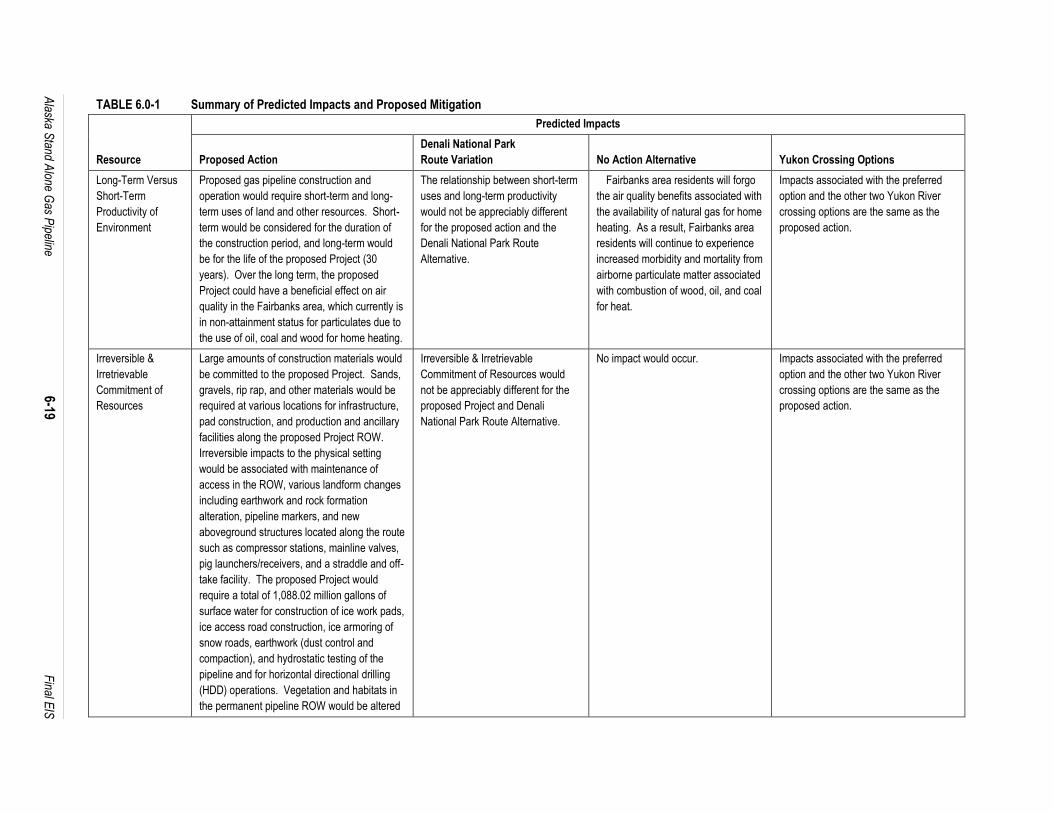
Alaska S
tand Alone G
as Pipeline
6-19
F
inal EIS
TABLE 6.0-1 Summary of Predicted Impacts and Proposed Mitigation
Resource
Predicted Impacts
Proposed Action
Denali National Park
Route Variation No Action Alternative Yukon Crossing Options
Long-Term Versus
Short-Term
Productivity of
Environment
Proposed gas pipeline construction and
operation would require short-term and long-
term uses of land and other resources. Short-
term would be considered for the duration of
the construction period, and long-term would
be for the life of the proposed Project (30
years). Over the long term, the proposed
Project could have a beneficial effect on air
quality in the Fairbanks area, which currently is
in non-attainment status for particulates due to
the use of oil, coal and wood for home heating.
The relationship between short-term
uses and long-term productivity
would not be appreciably different
for the proposed action and the
Denali National Park Route
Alternative.
Fairbanks area residents will forgo
the air quality benefits associated with
the availability of natural gas for home
heating. As a result, Fairbanks area
residents will continue to experience
increased morbidity and mortality from
airborne particulate matter associated
with combustion of wood, oil, and coal
for heat.
Impacts associated with the preferred
option and the other two Yukon River
crossing options are the same as the
proposed action.
Irreversible &
Irretrievable
Commitment of
Resources
Large amounts of construction materials would
be committed to the proposed Project. Sands,
gravels, rip rap, and other materials would be
required at various locations for infrastructure,
pad construction, and production and ancillary
facilities along the proposed Project ROW.
Irreversible impacts to the physical setting
would be associated with maintenance of
access in the ROW, various landform changes
including earthwork and rock formation
alteration, pipeline markers, and new
aboveground structures located along the route
such as compressor stations, mainline valves,
pig launchers/receivers, and a straddle and off-
take facility. The proposed Project would
require a total of 1,088.02 million gallons of
surface water for construction of ice work pads,
ice access road construction, ice armoring of
snow roads, earthwork (dust control and
compaction), and hydrostatic testing of the
pipeline and for horizontal directional drilling
(HDD) operations. Vegetation and habitats in
the permanent pipeline ROW would be altered
Irreversible & Irretrievable
Commitment of Resources would
not be appreciably different for the
proposed Project and Denali
National Park Route Alternative.
No impact would occur. Impacts associated with the preferred
option and the other two Yukon River
crossing options are the same as the
proposed action.

Alaska S
tand Alone G
as Pipeline
6-20
F
inal EIS
TABLE 6.0-1 Summary of Predicted Impacts and Proposed Mitigation
Resource
Predicted Impacts
Proposed Action
Denali National Park
Route Variation No Action Alternative Yukon Crossing Options
due to the requirements of maintenance and
inspection activities. Timber resources would
not be restored within the permanent proposed
Project footprint; therefore, there would be a
long-term conversion and irretrievable loss of
approximately 1,340 acres of forested land that
could contain timber. The proposed Project
would intersect and affect historic trails, and
known cultural resources within the ROW.
Cultural resources (archaeological sites,
historic trails, structures and sites, cultural
landscapes, and traditional cultural properties)
are nonrenewable resources, and any loss of
such resources would be irreversible and
irretrievable. Proposed pipeline construction
and operation would require permanent
commitment of land for the ROW, access
roads, and associated aboveground facilities.
All proposed Project construction activities
would consume fuel, mostly in the form of
diesel. This would be an irreversible use of
nonrenewable fossil fuels.
Alaska Stand Alone Gas Pipeline 6-21 Final EIS
6.1 RANKING OF POTENTIAL EFFECTS / IMPACT TABLES
This section builds on the information presented in Table 6.0-1 and describes the impacts and
effects identified in the analysis throughout Section 5 of this Final EIS. This section presents
tables of data for impacts associated with the Proposed Action and short analysis of the impacts
associated with the No Action Alternative, the Denali National Park Route Variation, and options
for crossing the Yukon River identified in the Proposed Action.
The purpose of the subsequent tables is to explain how direct, indirect and cumulative effects
were ranked for magnitude and probability for each impact associated with the Proposed Action
in the three major resource classes (physical, biological, and socioeconomic). Effects are then
plotted on a magnitude and probability chart.
The tables and plots below are organized by major resource class as found in the rest of the
document. The initial set of tables and figures address the impacts associated with the
Proposed Action. The first set of tables (Table 6.1-1 and Table 6.1-2) and Figure 6.1-1 rank the
predicted impacts to the physical environment. The second set of tables (Table 6.1-3 and Table
6.1-4) and Figure 6.1-2 rank the predicted impacts to the biological environment, and the third
set of tables (Tables 6.1-5 and Table 6.1-6) and Figure 6.1-3 rank the predicted impacts to the
socioeconomic environment. Where appropriate and to aid in referencing rankings, potential
effects associated with specific alternatives or options are listed in the tables. Subsequent
tables list impacts for the other alternatives that are significantly different than the impacts for
the Proposed Action.
For each major resource class, the first table shown describes the definitions used to rank
predicted impacts with respect to magnitude and probability of occurrence. These tables
(Tables 6.1-1, 6.1-3, and 6.1-5) provide the definitions used to characterize magnitude and
probability for each of the major resource classes (physical, biological, and socioeconomic) and
were designed to provide some consistency across the various major resource classes. Thus,
for example, Table 6.1-1 contains the classification criteria for physical effects. As used here
‘magnitude’ is the average of ratings (low, moderate, or high) for intensity, geographic scope,
and frequency/duration, each of which is defined in Table 6.1-1. As used here ‘probability’
classes of low, medium, and high correspond to estimated probabilities of <0.3, 0.3 ≤ 0.6, and
>0.6, respectively.
Following the definitions are longer tables (Tables 6.1-2, 6.1-4, and 6.1-6) listing impacts by
class and number (e.g., Phy10) with a short description of the effect and the results of applying
the ranking criteria. Each individual impact within each broad impact category (such as ‘Phy10:
Contamination of ground or surface water from heavy equipment use’ within the physical effect
category) is classified in terms of both magnitude and probability. The abbreviations used are
‘L’ for Low, ‘M’ for Moderate and ‘H’ for High. The right most columns list the magnitude and
probability rankings for the impact and are shaded to help the reader track the importance of the
relative rankings.

Alaska Stand Alone Gas Pipeline 6-22 Final EIS
Magnitude rankings shown in Tables 6.1-2, 6.1-4, and 6.1-6 are the average of criteria ratings
(low, moderate, or high) for intensity, geographic scope, and frequency/duration. The averaging
process is straightforward and each rating is given equal weight. As an example, if intensity,
geographic scope, and frequency/duration are rated as L, M, and H the average magnitude is
ranked as M for Moderate. Low magnitude rankings result from criteria ratings (in any order) of
L, L, L, or L, L, M. Moderate magnitude rankings result from criteria ratings (in any order) of L,
L, H; L, M, H; H, H, L; L, M, M; M, M, M; or M, M, H. High magnitude rankings result from
criteria ratings (in any order) of M, H, H or H, H, H.
Subsequent to the tables of definitions and rankings is a summary figure for each major
resource class (Figures 6.1-1, 6.1-2, and 6.1-3). These figures are termed ranking matrices and
are included to summarize the various impacts of the proposed Project in terms of two broad
attributes, the magnitude (subdivided into three classes of low, moderate, and high magnitude)
and the probability (also subdivided into three classes of low, moderate, and high) of the effect.
The results of the impact rankings are plotted in the appropriate cell in the ranking matrix. Thus,
to continue the example, referring to Table 6.1-2, which contains the ranking matrix for physical
effects, impact ‘Phy10’ is determined to be of moderate magnitude, but a low probability event.
Inspection of the ranking matrices is an efficient way to understand the pattern of impacts of the
proposed Project and to identify impacts in each class, such as high probability, high magnitude
impacts.
As noted above, impacts are characterized in terms of both probability and magnitude (the
average of ratings [low, moderate, or high] for intensity, geographic scope, and
frequency/duration). Assessments of probability and the components of magnitude were made
by the subject matter experts who drafted the applicable sections of this report on the basis of
their professional judgment. Ratings for each of the three components of magnitude (also
assessed by subject matter experts) were made in accord with criteria they defined. Judgments
of magnitude and probability are, to a degree subjective, but the rating process was designed to
help ensure consistency and transparency. The decision rule to average the ratings of the
various components of magnitude was selected in the interests of simplicity and conservatism
(in order to reduce the likelihood of understating the magnitude of various adverse impacts).
For example, it might be argued that the magnitudes of certain negative impacts during the
operational phase of the Proposed Action (which has a high duration) are overstated for certain
impacts where both the intensity and geographic scope were assessed as ‘low.’ Readers may
disagree with the judgments herein, but the process can fairly be described as organized,
explicit, transparent, and not overly complex.
The USACE has identified three alternatives: the Proposed Action, the No Action Alternative,
and the Denali Route Variation Alternative. Within the Proposed Action, there are two Options
relating to crossing the Yukon River. The impacts of the Proposed Action are identified and
described in Tables 6.1-1 through 6.1-6 and Figures 6.1-1 through 6.1-3. The relevant impacts
associated with the other two alternatives and the three options are discussed below relative to
the impacts associated with the Proposed Action. For convenience, tables describing the
Alternatives and Options in this section only show the potential effects that are impacted by the
choice of a particular alternative or an option. For consistency, figures ranking the relevant
impacts associated with the No Action Alternative and the Denali Route Variation Alternative,
Alaska Stand Alone Gas Pipeline 6-23 Final EIS
the Preferred Option and the other two Options are provided as well (see Figures 6.1-4 through
6.1-8).
6.1.1 The No Action Alternative
Under the No Action Alternative the Proposed Action is not undertaken and all of the impacts
associated with the Proposed Action (numbered Phy1-30, Bio1-74, and Soc1-59 in
Tables 6.1-2, 6.1-4 and 6.1-6, respectively) will not occur. For these impacts, no effect is
anticipated so they cannot be ranked for magnitude or probability. However, while selection of
the no action alternative eliminates the negative impacts, this choice also eliminates the positive
impacts associated with the Proposed Action. Table 6.1-7 lists the differences associated with
the No Action Alternative relative to the Proposed Action with comments on selected impacts.
The selected impacts that would not materialize under the No Action Alternative include
beneficial impacts to air quality (and an improvement in public health related to improved air
quality) in and around Fairbanks (Phy18) and economic opportunities along the proposed route
(Soc31, Soc33, Soc37 and Soc39). These impacts are ranked in the same format used for the
tables describing the Proposed Action. The ranked impacts are plotted in Figure 6.1-4. For all
other identified potential impacts, the No Action Alternative has no effect and therefore effects
are not plotted in Figure 6.1-4.
As noted elsewhere in this Final EIS, under the No Action Alternative, the goal of the Proposed
Action is not achieved. Absent construction and operation of this or some alternative gas
pipeline system, Alaska will continue to be in the position of having large natural gas reserves,
but a shortfall of supply to serve developed and developing markets within Alaska, including
Fairbanks and the Railbelt.
6.1.2 The Denali Route Variation Alternative
The Denali Route Variation Alternative is described in detail in Section 2, Project Description.
The principal difference between the Proposed Action and the alternative is that the alternative
pipeline route is altered slightly to run through Denali National Park. Assuming approval is
granted for such a project (see Section 2 for details on the need for special approval from the
U.S. legislature), the overall pipeline project would be identical to the Proposed Action except
for a route variation of approximately 15.3 miles. The variation route does not materially change
the positive and negative impacts associated with the Proposed Action. Under the Denali Route
Variation Alternative the route would include all of the positive and negative impacts (numbered
Phy1-30, Bio1-74, and Soc1-59 in Tables 6.1-2, 6.1-4 and 6.1-6, respectively) identified with the
Proposed Action with a few minor changes. Table 6.1-8 lists the potential effects relevant to this
alternative. For example, the route variation will have 4 fewer stream crossings (with a total of
491) but this will not impact the overall rankings of stream-related impacts for the proposed
Project (see potential effects Phy8, Bio47 – Bio49 and Soc17 in Table 6.1-8). The route
variation will cross the Nenana River, a navigable waterway, two more times compared to the
Proposed Action (see potential effects Phy22-26 in Table 6.1-8). Potential effects on recreation,
visual resources, and socioeconomics are also referenced in Table 6.1-8
Alaska Stand Alone Gas Pipeline 6-24 Final EIS
Because this alternative involves slightly less forest, wetland, and wildlife habitat between
pipeline MP 540 and 555 compared to the Proposed Action, the direct effects in the area of the
route variation are somewhat less. In principle, subsistence impacts are expected to be
marginally lower near the route variation when compared to the Proposed Action because the
Alternative will place the pipeline alongside the existing Parks Highway where noise and
disturbance are already occurring. However, this Alternative does not materially impact the
rankings associated with these resources when the entire proposed Project is considered.
Figure 6.1-5 plots the potential effects listed in Table 6.1-8. Overall, the physical, biological, and
socioeconomic impacts are expected to be the same as those identified under the Proposed
Action.
6.1.3 Yukon River Crossing Options identified under the Proposed Alternative
The AGDC has proposed three options for crossing the Yukon River: construct a new aerial
suspension bridge across the Yukon River (the Applicant’s Preferred Option); cross the Yukon
River by attaching the pipeline to the existing E.L. Patton Bridge (Option 2); or utilize HDD to
cross underneath the Yukon River at the location of the proposed new suspension bridge
(Option 3). The AGDC has determined that the preferred option is the construction of a new
bridge across the Yukon River. Most impacts associated with the Proposed Action are
unchanged for any of these options. However, the differences associated with each option are
identified below.
6.1.3.1 The Applicant’s Preferred Option – Construction of a New Aerial Suspension
Bridge Across the Yukon River
If a new Yukon River suspension bridge were constructed, no permanent structures, such as
footings, would be installed within the Yukon River and there would be no material impact to
waterways not already identified in the Proposed Action. Essentially this option entails all of the
impacts (both positive and negative) of the Proposed Action as described in Tables 6.1-1
through 6.1-6 and Figures 6.1-1 through 6.1-3. When compared to the other options for
crossing the Yukon, this option uses more construction and support structures. Overall, more
forested habitat would be impacted from this option than Option 2. Wetland habitat impacts
would be 8.6 acres more in the construction ROW and 4 acres more in the permanent ROW for
the Applicant’s Preferred Option than for Option 2. The new suspension bridge adds a new
structure in the visual landscape. Short term impacts associated with construction could have
an impact on navigation of the Yukon River but this effect is expected to be temporary. Effects
that would potentially be different under this option are associated with soils and geology,
navigation resources, vegetation, wetlands, wildlife habitat, and visual resources and are listed
in Table 6.1-9 in the same format as that used for the Proposed Action and are shown in a
matrix in Figure 6.1-6. Because the river crossing is localized, impacts associated with
construction of a new suspension bridge are also localized and will not change the overall
rankings of effects when compared to the Proposed Action.

Alaska Stand Alone Gas Pipeline 6-25 Final EIS
6.1.3.2 Option 2 – Cross the Yukon by Attaching the Pipeline to the Existing E.L. Patton
Bridge
If the pipeline were attached to the existing E.L. Patton Bridge (Option 2), no surface water
disturbance would occur as the proposed pipeline would be installed on a hanger pipe assembly
that would be placed underneath the existing bridge deck. Navigation of the waterway may be
impeded temporarily by construction activities. Utilizing the existing bridge would not result in
any new impacts. Essentially this option entails all of the impacts (both positive and negative) of
the Proposed Action as described in Tables 6.1-1 through 6.1-6 and Figures 6.1-1 through 6.1-
3. Table 6.1-10 lists the same impacts as associated with the Applicant’s Preferred Option and
notes that less land area is used for this option and impacts to visual resources associated with
modification of an existing structure are impacted less than for the Applicant’s Preferred Option.
Overall rankings of the potential effects listed in Table 6.1-10 and plotted in a matrix in Figure
6.1-7. do not change when compared to the Proposed Action.
6.1.3.3 Option 3 – Utilize HDD to cross underneath the Yukon River at the Location of the
Proposed New Suspension Bridge Identified in the Applicant’s Preferred Option
Although the feasibility of this option is not assured because of limited information on soils and
bedrock in the area of the proposed crossing, the HDD crossing would require 1 acre of work
area at each end of the crossing. Overall, more forested habitat would be impacted from this
option than Option 2. Wetland habitat impacts would be 8.6 acres more in the construction
ROW and 4 acres more in the permanent ROW for Option 3 than for Option 2. Local permafrost
near the HDD crossing might be impacted by this option. Unlike the other options, surface
water would be used for HDD construction. Table 6.1-11 lists the same impacts as associated
with the Applicant’s Preferred Option and notes that land area required is less than the
Applicant’s Preferred Option, but more than Option 2 and visual resources would not be
materially impacted by an HDD river crossing. The potential effects associated with this option
are plotted in in a matrix in Fig 6.1-8. When considered as part of the overall proposed Project,
the rankings associated with each of these impacts do not materially change the rankings
associated with the Proposed Action in Tables 6.1-1 through 6.1-6 and Figures 6.1-1 through
6.1-3.
As noted above, tables in this section describing potential effects associated with the No Action
Alternative, the Denali Route Variation Alternative and the three Options identified within the
Proposed Action show only the potential effects that would be different under the chosen
alternative or option.

Alaska Stand Alone Gas Pipeline 6-26 Final EIS
TABLE 6.1-1 Criteria for Ranking Potential Effects on Physical Resources
High Moderate Low
Intensity The effect would alter a physical resource in a way that would degrade its value to the point that it could not be used, or would endanger human health.
The effect would indisputably alter a physical resource, but will allow the resource to be used without endangering human health.
The effect would visibly or measurably alter a physical resource without removing its value and without endangering human health.
Geographic Scope The effect would occur on a statewide or national basis, or throughout the study area.
The effect would occur at a borough or community level, or on a limited portion of the study area.
The effect would be site specific or occur within a few isolated locations.
Frequency and Duration The effect would occur for a duration of greater than 3 years or through operations of the project.
The effect would occur intermittently for a duration of 1 to 3 years.
The effect would occur intermittently for a duration of less than 1 year.
Magnitude Evaluated based on the average of intensity, geographic scope, and frequency/duration as determined above.
Probability Probability greater than 0.6. Probability in the 0.3 to 0.6 range.
Probability of less than 0.3.
TABLE 6.1-2 Physical Resources Effects Summary (Proposed Action)
Potential Effect Proposed Action
Magnitude Factors Ranking
Int. Geo. Freq./Dur. Mag. Prob.
Soils and Geology
Phy1: Impacts to paleontological resources
Ground disturbance during construction could create a potential for impacts to paleontological resources (any physical evidence of past life, including fossilized remains, impressions, and traces of plants and animals).
M M M M H
Phy2: Alterations to drainage patterns causing changes to local soils and geology
Short term localized drainage pattern alterations (e.g., diversions) could occur during construction to accommodate pipeline installation and equipment staging.
L M M M H
Phy3: Impacts to soils or bedrock from excavation and blasting
Excavation (stripping, ditching, or trenching of rock or borrows) for pipeline and bridge construction would alter local topography, temporarily increase erosion, and result a loss of surface vegetation. Blasting could be required to fracture high-density frozen soils or bedrock during trench excavation.
L H M M H
Phy4: Impacts to soils containing permafrost from thaw settlement
Limited impacts to soils containing permafrost would occur from thaw settlement from use of temporary ice/gravel roads, and ice/gravel pads to stage and transport materials and equipment.
L L L L M
Phy5: Impacts to soils and geology from use of material sites during construction
Impacts to soils and geology could occur from use of material sites during construction causing modifications of local topography, loss of surface vegetation, creation of landscape scars, ponding, and a temporary increase of soil erosion and siltation near the operation material sites.
M H M M H
Phy6: Development of frost heaves and thaw bulbs from operations of the buried pipeline
The operating temperature of the buried pipeline could affect the frozen/thawed nature of the surrounding subsurface which, in turn, could affect the pipeline trench support conditions as well as potentially cause surface expression such as local subsidence or heave, or thaw bulbs.
M M H M M
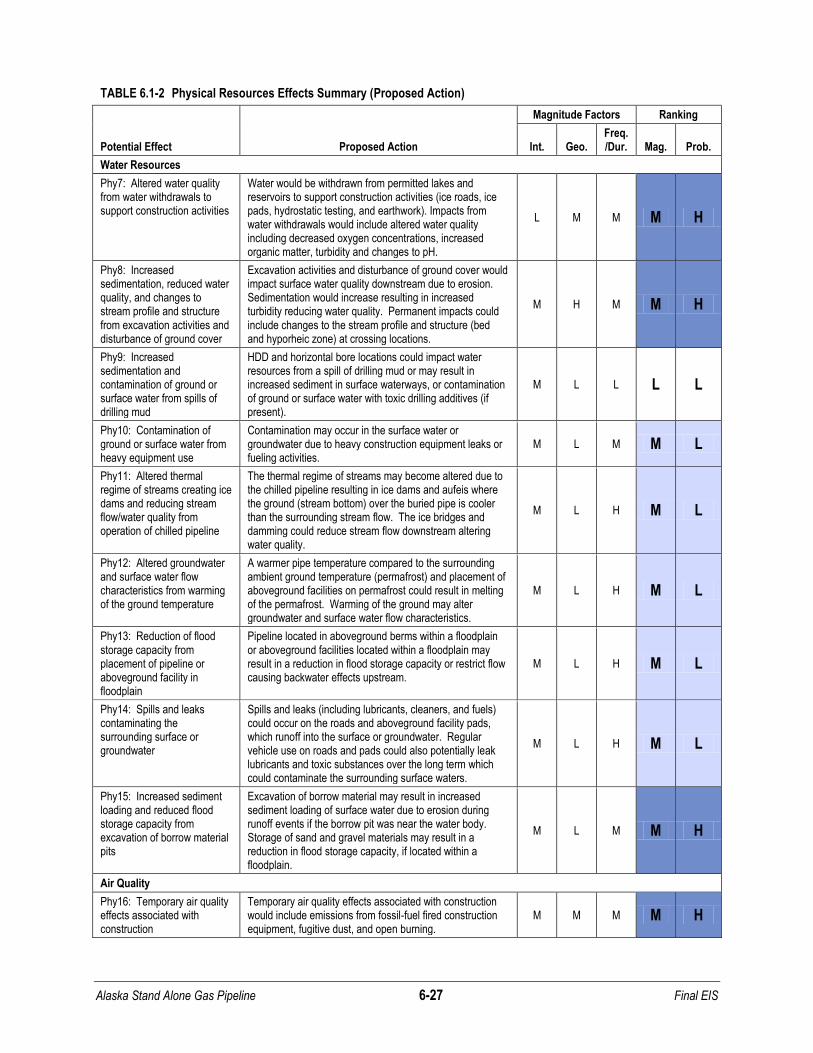
Alaska Stand Alone Gas Pipeline 6-27 Final EIS
TABLE 6.1-2 Physical Resources Effects Summary (Proposed Action)
Potential Effect Proposed Action
Magnitude Factors Ranking
Int. Geo. Freq./Dur. Mag. Prob.
Water Resources
Phy7: Altered water quality from water withdrawals to support construction activities
Water would be withdrawn from permitted lakes and reservoirs to support construction activities (ice roads, ice pads, hydrostatic testing, and earthwork). Impacts from water withdrawals would include altered water quality including decreased oxygen concentrations, increased organic matter, turbidity and changes to pH.
L M M M H
Phy8: Increased sedimentation, reduced water quality, and changes to stream profile and structure from excavation activities and disturbance of ground cover
Excavation activities and disturbance of ground cover would impact surface water quality downstream due to erosion. Sedimentation would increase resulting in increased turbidity reducing water quality. Permanent impacts could include changes to the stream profile and structure (bed and hyporheic zone) at crossing locations.
M H M M H
Phy9: Increased sedimentation and contamination of ground or surface water from spills of drilling mud
HDD and horizontal bore locations could impact water resources from a spill of drilling mud or may result in increased sediment in surface waterways, or contamination of ground or surface water with toxic drilling additives (if present).
M L L L L
Phy10: Contamination of ground or surface water from heavy equipment use
Contamination may occur in the surface water or groundwater due to heavy construction equipment leaks or fueling activities.
M L M M L
Phy11: Altered thermal regime of streams creating ice dams and reducing stream flow/water quality from operation of chilled pipeline
The thermal regime of streams may become altered due to the chilled pipeline resulting in ice dams and aufeis where the ground (stream bottom) over the buried pipe is cooler than the surrounding stream flow. The ice bridges and damming could reduce stream flow downstream altering water quality.
M L H M L
Phy12: Altered groundwater and surface water flow characteristics from warming of the ground temperature
A warmer pipe temperature compared to the surrounding ambient ground temperature (permafrost) and placement of aboveground facilities on permafrost could result in melting of the permafrost. Warming of the ground may alter groundwater and surface water flow characteristics.
M L H M L
Phy13: Reduction of flood storage capacity from placement of pipeline or aboveground facility in floodplain
Pipeline located in aboveground berms within a floodplain or aboveground facilities located within a floodplain may result in a reduction in flood storage capacity or restrict flow causing backwater effects upstream.
M L H M L
Phy14: Spills and leaks contaminating the surrounding surface or groundwater
Spills and leaks (including lubricants, cleaners, and fuels) could occur on the roads and aboveground facility pads, which runoff into the surface or groundwater. Regular vehicle use on roads and pads could also potentially leak lubricants and toxic substances over the long term which could contaminate the surrounding surface waters.
M L H M L
Phy15: Increased sediment loading and reduced flood storage capacity from excavation of borrow material pits
Excavation of borrow material may result in increased sediment loading of surface water due to erosion during runoff events if the borrow pit was near the water body. Storage of sand and gravel materials may result in a reduction in flood storage capacity, if located within a floodplain.
M L M M H
Air Quality
Phy16: Temporary air quality effects associated with construction
Temporary air quality effects associated with construction would include emissions from fossil-fuel fired construction equipment, fugitive dust, and open burning.
M M M M H

Alaska Stand Alone Gas Pipeline 6-28 Final EIS
TABLE 6.1-2 Physical Resources Effects Summary (Proposed Action)
Potential Effect Proposed Action
Magnitude Factors Ranking
Int. Geo. Freq./Dur. Mag. Prob.
Phy17: Long-term or permanent impacts to air quality from operation and maintenance of aboveground facilities
Operation and maintenance of aboveground facilities would result in long-term or permanent impacts to air quality at levels that would not cause or contribute to a violation of any federal, state, or local air quality standards.
L M H M H
Phy18: Impacts to the FNSB nonattainment zone from construction and operations of the Fairbanks Lateral
The Fairbanks Lateral would cross into the FNSB nonattainment boundary for PM-2.5. Emissions would occur from the construction and operation as well as use of four material sites and one construction camp and pipeline yard. Written approval of conformance with the SIP would be necessary.
M L H M H
Noise
Phy19: Temporary noise effects associated with construction
Localized, intermittent, and short term noise effects associated with construction activities would occur. Depending on the distance to the receptor, noise levels could be perceived as moderately loud.
M M M M H
Phy20: Long-term or permanent noise effects from operation and maintenance of pipeline and aboveground facilities
Operation and maintenance of the pipeline and aboveground facilities would result in long-term or permanent noise effects. However, the distance between the facilities and receptors are large enough that noise impacts would be expected to be low.
L M H M H
Phy21: Noise impacts from pressure relief valves and pipeline blowdowns
Noise impacts would result from pressure relief valves and pipeline blowdowns. Depending on the distance to the receptor, noise levels could be perceived as moderately loud. However, these events are emergency scenarios only.
H L L M L
Navigation Resources
Phy22: Increased navigation would increase pollution in Alaska waters from wastewater discharge
Potential impacts from increased navigation resource use for supply shipments could increase pollution in Alaskan waters from wastewater discharge.
M L M M H
Phy23: Introduction of non-native species to aquatic ecosystem from ballast water
Ballast water may introduce non-native species into aquatic ecosystems where they would not otherwise be present. Impacts could include a reduction in biodiversity of species inhabiting coastal waters from non-native species out-competing native species for food and space.
M L M M L
Phy24: Impeding navigability while conducting open-cut stream crossing method during construction
Navigability along waterways using open-cut methods would be temporarily impeded by construction materials and equipment during the pipeline construction process.
H M L M H
Phy25: Unintended release of drilling fluids while conducting HDD stream crossing method during construction
Unintended release of drilling fluids may occur while conducting the HDD stream crossing method during construction. M L L L L
Phy26: Impeding navigability during construction of Yukon River crossing.
For the Yukon River Crossing, if the preferred suspension bridge option is selected, large vessels would likely be required in the Yukon River during the construction season until the new pipeline suspension bridge is fully built. These vessels would likely impede other local vessel traffic during the construction phase of the proposed Project. Construction on the existing bridge may also impact vessel movements. An HDD crossing would likely have no effect on navigation.
H L L M H
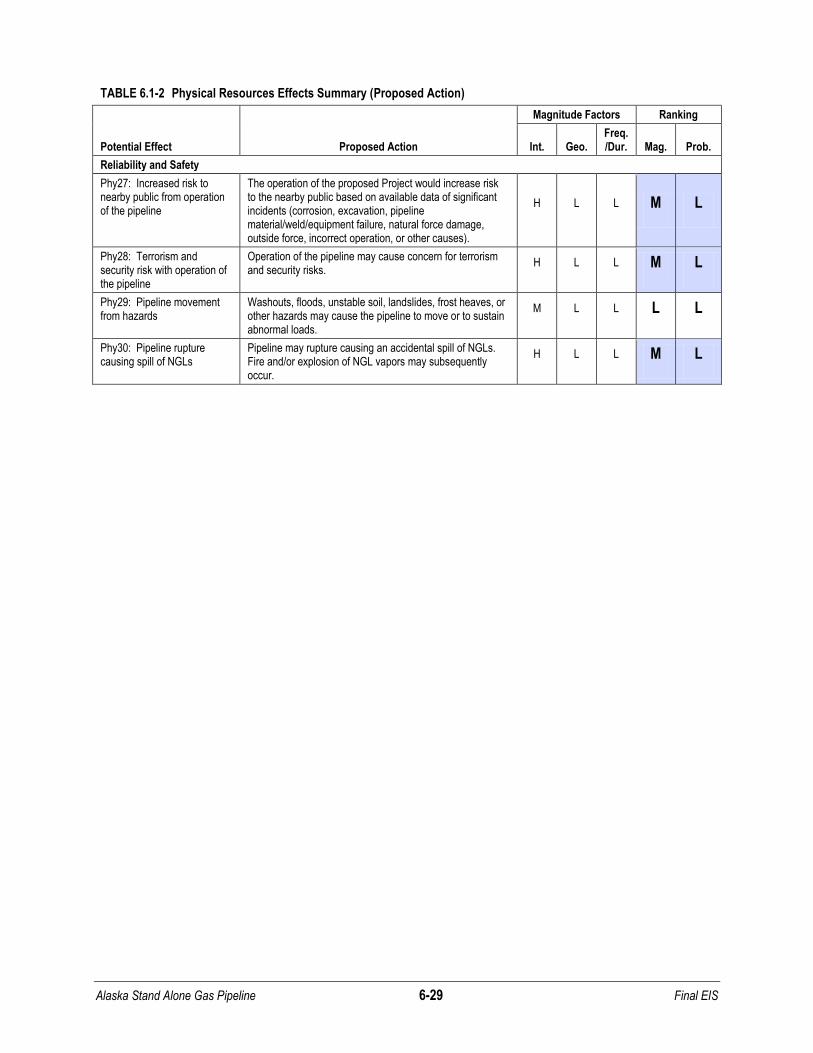
Alaska Stand Alone Gas Pipeline 6-29 Final EIS
TABLE 6.1-2 Physical Resources Effects Summary (Proposed Action)
Potential Effect Proposed Action
Magnitude Factors Ranking
Int. Geo. Freq./Dur. Mag. Prob.
Reliability and Safety
Phy27: Increased risk to nearby public from operation of the pipeline
The operation of the proposed Project would increase risk to the nearby public based on available data of significant incidents (corrosion, excavation, pipeline material/weld/equipment failure, natural force damage, outside force, incorrect operation, or other causes).
H L L M L
Phy28: Terrorism and security risk with operation of the pipeline
Operation of the pipeline may cause concern for terrorism and security risks.
H L L M L
Phy29: Pipeline movement from hazards
Washouts, floods, unstable soil, landslides, frost heaves, or other hazards may cause the pipeline to move or to sustain abnormal loads.
M L L L L
Phy30: Pipeline rupture causing spill of NGLs
Pipeline may rupture causing an accidental spill of NGLs. Fire and/or explosion of NGL vapors may subsequently occur.
H L L M L
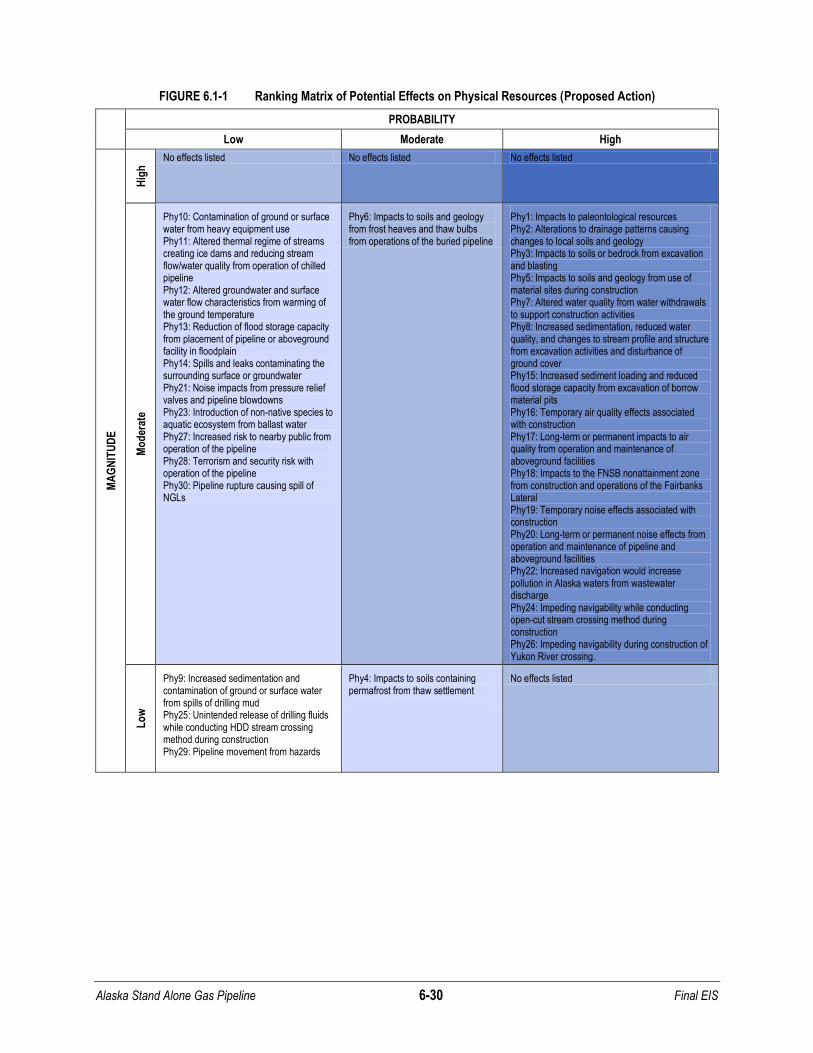
Alaska Stand Alone Gas Pipeline 6-30 Final EIS
FIGURE 6.1-1 Ranking Matrix of Potential Effects on Physical Resources (Proposed Action)
PROBABILITY
Low Moderate High
MA
GN
ITU
DE
Hig
h No effects listed No effects listed No effects listed
Mo
der
ate
Phy10: Contamination of ground or surface water from heavy equipment use Phy11: Altered thermal regime of streams creating ice dams and reducing stream flow/water quality from operation of chilled pipeline Phy12: Altered groundwater and surface water flow characteristics from warming of the ground temperature Phy13: Reduction of flood storage capacity from placement of pipeline or aboveground facility in floodplain Phy14: Spills and leaks contaminating the surrounding surface or groundwater Phy21: Noise impacts from pressure relief valves and pipeline blowdowns Phy23: Introduction of non-native species to aquatic ecosystem from ballast water Phy27: Increased risk to nearby public from operation of the pipeline Phy28: Terrorism and security risk with operation of the pipeline Phy30: Pipeline rupture causing spill of NGLs
Phy6: Impacts to soils and geology from frost heaves and thaw bulbs from operations of the buried pipeline
Phy1: Impacts to paleontological resources Phy2: Alterations to drainage patterns causing changes to local soils and geology Phy3: Impacts to soils or bedrock from excavation and blasting Phy5: Impacts to soils and geology from use of material sites during construction Phy7: Altered water quality from water withdrawals to support construction activities Phy8: Increased sedimentation, reduced water quality, and changes to stream profile and structure from excavation activities and disturbance of ground cover Phy15: Increased sediment loading and reduced flood storage capacity from excavation of borrow material pits Phy16: Temporary air quality effects associated with construction Phy17: Long-term or permanent impacts to air quality from operation and maintenance of aboveground facilities Phy18: Impacts to the FNSB nonattainment zone from construction and operations of the Fairbanks Lateral Phy19: Temporary noise effects associated with construction Phy20: Long-term or permanent noise effects from operation and maintenance of pipeline and aboveground facilities Phy22: Increased navigation would increase pollution in Alaska waters from wastewater discharge Phy24: Impeding navigability while conducting open-cut stream crossing method during construction Phy26: Impeding navigability during construction of Yukon River crossing.
Lo
w
Phy9: Increased sedimentation and contamination of ground or surface water from spills of drilling mud Phy25: Unintended release of drilling fluids while conducting HDD stream crossing method during construction Phy29: Pipeline movement from hazards
Phy4: Impacts to soils containing permafrost from thaw settlement
No effects listed

Alaska Stand Alone Gas Pipeline 6-31 Final EIS
TABLE 6.1-3 Criteria for Ranking Potential Effects on Biological Resources
High Moderate Low
Intensity The effect would substantially change the population size or range of the species, including the distribution of plant communities.
The effect would have a measurable change in the range or size of a population.
The effect would impact a few individuals in a population and would not affect the range or population size of a species or plant community.
Geographic Scope The effect would occur on a statewide or national basis, or throughout the study area.
The effect would occur at a borough or community level, or on a limited portion of the study area.
The effect would be site specific or occur within a few isolated locations.
Frequency and Duration The effect would occur for a duration of greater than 3 years or through operations of the proposed Project.
The effect would occur intermittently for a duration of 1 to 3 years.
The effect would occur intermittently for a duration of less than 1 year.
Magnitude Evaluated based on the average of intensity, geographic scope, and frequency/duration as determined above.
Probability Probability greater than 0.6. Probability in the 0.3 to 0.6 range.
Probability of less than 0.3.
TABLE 6.1-4 Biological Resources Effects Summary (Proposed Action)
Potential Effect Proposed Action
Criteria considered to develop magnitude
ranking Ranking
Int. Geo. Freq. /Dur. Mag. Prob.
Vegetation
Bio1: Impacts from clearing, grubbing, grading in the ROW
Temporary erosion and sedimentation impacts and destruction of plant root stock delaying vegetation recovery.
L M L L H
Bio2: Impacts from equipment use in ROW during construction
Propagation of invasive and non-native plants would outcompete and displace native plants reducing biological diversity and community composition.
L M L L M
Bio3: Impacts from trenching in the ROW
Rehabilitative success of the vegetation would be low if the topsoil and subsoil strata were not preserved.
L M L L H
Bio4: Impacts from blasting in the ROW
Additional disturbance to vegetation. L L L L M
Bio5: Fragmentation of vegetation along the ROW
Long recovery time for vegetation outside of the permanent ROW.
L L M L H
Bio6: Impacts from backfilling in the ROW
Seed germination and root establishment may be inhibited, and reduced water infiltration if natural soil strata are not maintained for vegetation reestablishment.
L M M M M
Bio7: Impacts from dust deposition from road use for construction
Particulate matter from road dust landing on surrounding plants which would interfere with plant photosynthesis and respiration. When compared to Bio19 under Wetlands, this effect includes all vegetation so the magnitude is ranked as Moderate.
M M L M H
Bio8: Impact of TEWS upon vegetation
Additional disturbance to vegetation from temporary extra work space.
L L L L H
Bio9: Impacts from mowing during operations
Mowing forested vegetation regularly in the permanent ROW.
L M H M H
Bio10: Impacts from aboveground facilities development
Permanent loss of vegetation for facility development. M M H M H
Bio11: Impacts from access road development
Vegetation loss, dust deposition, non-native invasive plant dispersal, fragmentation.
M M H M H

Alaska Stand Alone Gas Pipeline 6-32 Final EIS
TABLE 6.1-4 Biological Resources Effects Summary (Proposed Action)
Potential Effect Proposed Action
Criteria considered to develop magnitude
ranking Ranking
Int. Geo. Freq. /Dur. Mag. Prob.
Wetlands
Bio12: Disturbance impacts from grading and trenching over the centerline primarily in frozen soils
Disturbance to subsoil, topsoil and surface hydrology.
L M L L H
Bio13: Fragmentation impacts from grading and trenching over the centerline primarily in frozen soils
Fragmentation has to potential to divide wetland systems, disrupting or altering vegetation, subsoil and hydrology.
L L L L M
Bio14: Disturbance from equipment use in ROW during construction on ice pads and ice roads
Temporary disturbance to subsurface soil, topsoil vegetation, and surface hydrology from heavy equipment use and excavation.
L M L L H
Bio15: Invasive species from equipment used during construction
Propagation of invasive and non-native plants would outcompete and displace native plants reducing biological diversity and community composition.
L M L L M
Bio16: Soil change associated with equipment use in ROW during construction on ice pads and ice roads
Construction activities result in temporary erosion and soil compaction.
L M L L L
Bio17: Impacts from backfilling
Seed germination and root establishment may be inhibited, and reduced water infiltration if natural soil strata are not maintained for vegetation reestablishment.
L M L L L
Bio18: Impacts from rehabilitation of vegetation
Propagation of invasive and non-native plants would outcompete and displace native plants reducing biological diversity and community composition.
L M L L M
Bio19: Impact of dust deposition from road use for construction
Particulate matter from road dust landing on surrounding plants which would interfere with plant photosynthesis and respiration. When compared to Bio7 under Vegetation, there are fewer roads planned in and around wetlands so the magnitude is ranked as Low.
L M L L M
Bio20: Impacts from mowing during operations
Only non-forested wetland classes would exist in the permanent ROW.
L M H M H
Bio21: Impacts from aboveground facilities development
Permanent loss of wetlands for facility development. L L H M H
Bio22: Loss of wetlands from access road development
Permanent loss of wetlands from road development. L L H M H
Bio23: Dust deposition impacts from access road development
Dust deposition into surrounding wetlands altering water and soil chemistry, and hydrologic disturbance. L L H M H
Bio24: Impacts on plants from access road development
Non-native and invasive plant dispersal. L L H M M
Bio25: Wetland fragmentation from access road development
Fragmentation of wetland areas. L L H M H
Bio26: Thermokarst from access road development
Potential for thermokarst development. L L H M M

Alaska Stand Alone Gas Pipeline 6-33 Final EIS
TABLE 6.1-4 Biological Resources Effects Summary (Proposed Action)
Potential Effect Proposed Action
Criteria considered to develop magnitude
ranking Ranking
Int. Geo. Freq. /Dur. Mag. Prob.
Wildlife
Bio27: Impacts from disturbance associated with noise from construction activities
Construction machinery noise disturbs animal activities.
L L M L M
Bio28: Impacts from construction activities on wildlife habitat
Construction activities will create a temporary disturbance to wildlife habitat. L L M L M
Bio29: Impacts from construction activities on wildlife mortality
Increased wildlife mortality due to an increase in vehicle and train traffic during proposed Project construction. L L M L M
Bio30: Impacts from maintenance of the permanent ROW (mowing forested vegetation)
Permanent disturbance to wildlife habitat - leaving the habitat unsuitable for some wildlife species.
L M H M H
Bio31: Impacts related to ease of access from access road development
Access roads facilitate hunter access to remote areas increasing wildlife harvests. L L H M M
Bio32: Impact upon habitat fragmentation from access road development
Access roads will increase fragmentation of habitat. L L H M H
Bio33: Impacts from access road use during operations phase
Increased wildlife mortality due to vehicle and train traffic during the operations phase. L L H M M
Bio34: Impacts from aerial and ground based inspections of the pipeline
ROW surveillance activities will temporarily disturb wildlife. L L H M M
Bio35: Impacts from maintenance of permanent access roads
Maintenance activities include spreading salt on roads in winter and may increase wildlife mortality due to wildlife attraction to salt licking on road.
L L H M L
Bio36: Delayed wildlife movement from development of aboveground facilities
Development of aboveground facilities will delay movement of wildlife during construction. L L M L M
Bio37: Displacement of wildlife from development of aboveground facilities
Development of aboveground facilities will displace wildlife due to noise and human activity during construction. L L M L M
Bio38: Impact on predator/prey relationship from operations of aboveground facilities
Increase subsidized predator populations and may affect prey abundance, distribution, and demography.
L L H M L
Bio39: Dust deposition impact from road use during operations
Fugitive dust landing along roadsides in the winter exposing vegetation faster than non-dusted areas. L L H M H
Bio40: Loss of habitat associated with operations of aboveground facilities
Operations of aboveground facilities will result in loss of nesting habitat, breeding territories and cover. L L H M M
Fisheries
Bio41: Impact on fish habitat from water withdrawal for proposed Project use
Water withdrawal from lakes for road and pad construction and work camp use Lowers dissolved oxygen concentration which may stress or kill fish.
L L L L L
Bio42: Impact on fish behavior from water withdrawal for proposed
Project use
Water withdrawal from lakes for road and pad construction and work camp use causes water level fluctuation which may cause a change in fish behavior, distribution and growth.
L L L L L

Alaska Stand Alone Gas Pipeline 6-34 Final EIS
TABLE 6.1-4 Biological Resources Effects Summary (Proposed Action)
Potential Effect Proposed Action
Criteria considered to develop magnitude
ranking Ranking
Int. Geo. Freq. /Dur. Mag. Prob.
Bio43: Impact on fish mortality from water withdrawal for proposed
Project use
Water withdrawal from lakes for road and pad construction and work camp use may kill or injure fish or invertebrates from mechanical stress, entrainment in withdrawn waters, and impingement on intake structures.
L L L L L
Bio44: Impact on invertebrate population from water withdrawal for proposed
Project use
Water withdrawal from lakes for road and pad construction and work camp use can reduce the invertebrate population due to fluctuating water levels that reduce macrovegetation availability as food, shelter and for egg deposition.
M L L L L
Bio45: Impacts from of delayed melting from ice road development across drainages
Ice bridging across streams could alter fish movement, behavior, and productivity due to delayed melting of the bridged ice.
L L L L M
Bio46: Impacts of flooding from ice road development across drainages
Grounding of ice results in flooding which could alter riparian habitat, stream flow and in stream habitat temporarily which could affect survival, behavior and productivity of fish.
L L L L M
Bio47: Impacts from all identified stream crossing methods
Temporary in stream habitat alteration and channel profile causing gill irritation from increased sedimentation. L L L L M
Bio48: Impact from open cut crossing method
Temporary increase in sedimentation and erosion along the stream bank, loss of riparian vegetation, altered channel morphology.
L L L L M
Bio49: Impact from open cut isolation crossing method
Injury may occur to certain fish species and life stages which may be more susceptible when diverting water around the construction area.
L L L L M
Bio50: Impact of blasting on fish habitat
Blasting causes increased sedimentation, noise, vibration and altered channel morphology adversely impacting fish behavior and health.
L L L L M
Bio51: Impacts of blasting on fish mortality
Blasting may injure or kill fish from rupture of the swim bladder.
L L L L L
Bio52: Impact of blasting and stunning fish
Blasting may temporarily stun fish and increase susceptibility to predation.
L L L L M
Bio53: Impacts from HDD HDD drilling fluids unintentionally released into surface waters inhibit fish and invertebrate respiration due to fouled gills resulting in a lack of oxygen.
L L L L L
Bio54: Impacts from mowing the ROW including riparian areas
Instability of stream banks, reduced water quality, and reduced cover. L M H M M
Bio55: Impacts from aboveground facilities
Contaminants run off into drainages altering water quality fouling gills reducing oxygen absorption.
L L H M M
Bio56: Impacts from access road development
Contaminants run off into drainages altering water quality fouling gills reducing oxygen absorption for fish.
L L H M M
Bio57: Impacts from culvert installation during access road development
Temporary in stream habitat loss to fish from water diversion. L L H M H
Bio58: Impacts from culvert installation
Loss of rearing, foraging and spawning habitat in reach of stream where culvert is placed.
L L H M H
Bio59: Impacts from bridge placement
Loss of riparian habitat at bridge location reducing habitat for fish.
L L H M H
Bio60: Impacts from road use associated with bridge placement
Increased sedimentation in stream from road use (dust and grading) affecting health of fish. L L H M H
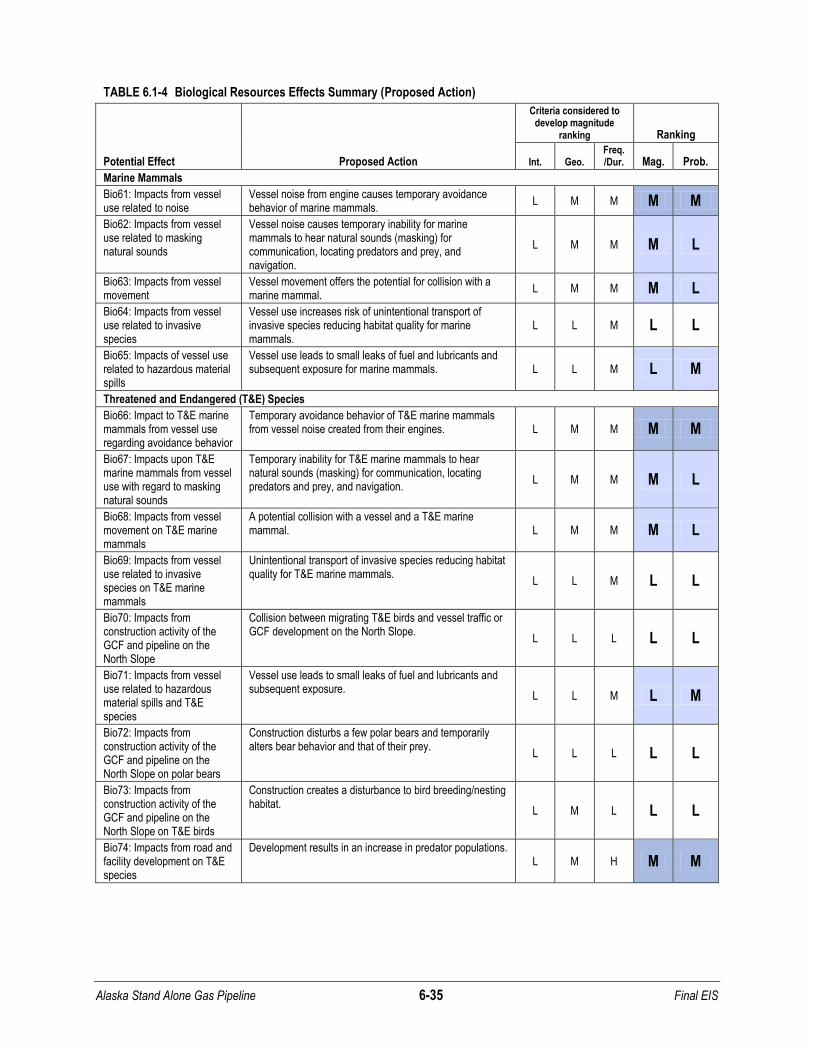
Alaska Stand Alone Gas Pipeline 6-35 Final EIS
TABLE 6.1-4 Biological Resources Effects Summary (Proposed Action)
Potential Effect Proposed Action
Criteria considered to develop magnitude
ranking Ranking
Int. Geo. Freq. /Dur. Mag. Prob.
Marine Mammals
Bio61: Impacts from vessel use related to noise
Vessel noise from engine causes temporary avoidance behavior of marine mammals.
L M M M M
Bio62: Impacts from vessel use related to masking natural sounds
Vessel noise causes temporary inability for marine mammals to hear natural sounds (masking) for communication, locating predators and prey, and navigation.
L M M M L
Bio63: Impacts from vessel movement
Vessel movement offers the potential for collision with a marine mammal.
L M M M L
Bio64: Impacts from vessel use related to invasive species
Vessel use increases risk of unintentional transport of invasive species reducing habitat quality for marine mammals.
L L M L L
Bio65: Impacts of vessel use related to hazardous material spills
Vessel use leads to small leaks of fuel and lubricants and subsequent exposure for marine mammals. L L M L M
Threatened and Endangered (T&E) Species
Bio66: Impact to T&E marine mammals from vessel use regarding avoidance behavior
Temporary avoidance behavior of T&E marine mammals from vessel noise created from their engines. L M M M M
Bio67: Impacts upon T&E marine mammals from vessel use with regard to masking natural sounds
Temporary inability for T&E marine mammals to hear natural sounds (masking) for communication, locating predators and prey, and navigation.
L M M M L
Bio68: Impacts from vessel movement on T&E marine mammals
A potential collision with a vessel and a T&E marine mammal. L M M M L
Bio69: Impacts from vessel use related to invasive species on T&E marine mammals
Unintentional transport of invasive species reducing habitat quality for T&E marine mammals.
L L M L L
Bio70: Impacts from construction activity of the GCF and pipeline on the North Slope
Collision between migrating T&E birds and vessel traffic or GCF development on the North Slope.
L L L L L
Bio71: Impacts from vessel use related to hazardous material spills and T&E species
Vessel use leads to small leaks of fuel and lubricants and subsequent exposure.
L L M L M
Bio72: Impacts from construction activity of the GCF and pipeline on the North Slope on polar bears
Construction disturbs a few polar bears and temporarily alters bear behavior and that of their prey.
L L L L L
Bio73: Impacts from construction activity of the GCF and pipeline on the North Slope on T&E birds
Construction creates a disturbance to bird breeding/nesting habitat.
L M L L L
Bio74: Impacts from road and facility development on T&E species
Development results in an increase in predator populations. L M H M M

Alaska Stand Alone Gas Pipeline 6-36 Final EIS
FIGURE 6.1-2 Ranking Matrix of Potential Effects on Biological Resources (Proposed Action)
PROBABILITY
Low Moderate High
MA
GN
ITU
DE
Hig
h No effects listed No effects listed No effects listed
Mo
der
ate
Bio35: Impacts from maintenance of permanent access roads Bio38: Impact on predator/prey relationship from operations of aboveground facilities Bio62: Impacts from vessel use related to masking natural sounds Bio63: Impacts from vessel movement Bio67: Impacts upon T&E marine mammals from vessel use with regard to masking natural sounds Bio68: Impacts from vessel movement on T&E marine mammals
Bio6: Impacts from backfilling in the ROW Bio24: Impacts on plants from access road development Bio26: Thermokarst from access road development Bio31: Impacts related to ease of access from access road development Bio33: Impacts from access road use during operations phase Bio34: Impacts from aerial and ground based inspections of the pipeline Bio40: Loss of habitat associated with operations of aboveground facilities Bio54: Impacts from mowing the ROW including riparian areas Bio55: Impacts from aboveground facilities Bio56: Impacts from access road development Bio61: Impacts from vessel use related to noise Bio66: Impact to T&E marine mammals from vessel use regarding avoidance behavior Bio74: Impacts from road and facility development on T&E species
Bio7: Impacts from dust deposition from road use for construction Bio9: Impacts from mowing during operations Bio10: Impacts from aboveground facilities development Bio11: Impacts from access road development Bio20: Impacts from mowing during operations Bio21: Impacts from aboveground facilities development Bio22: Loss of wetlands from access road development Bio23: Dust deposition impacts from access road development Bio25: Wetland fragmentation from access road development Bio30: Impacts from maintenance of the permanent ROW (mowing forested vegetation) Bio32: Impact upon habitat fragmentation from access road development Bio39: Dust deposition impact from road use during operations Bio57: Impacts from culvert installation during access road development Bio58: impacts from culvert installation Bio59: Impacts from bridge placement Bio60: Impacts from road use associated with bridge placement
Lo
w
Bio16: Soil change associated with equipment use in ROW during construction on ice pads and ice roads Bio17: Impacts from backfilling Bio41: Impact on fish habitat from water withdrawal for proposed Project use Bio42: Impact on fish behavior from water withdrawal for proposed Project use Bio43: Impact on fish mortality from water withdrawal for proposed Project use Bio44: Impact on invertebrate population from water withdrawal for proposed Project use Bio51: Impacts of blasting on fish mortality Bio53: Impacts from HDD Bio64: Impact of vessel use related to invasive species Bio69: Impacts from vessel use related to invasive species on T&E marine mammals Bio70: Impacts from construction activity of the GCF and pipeline on the North Slope Bio72: Impacts from construction activity of the GCF and pipeline on the North Slope on polar bears Bio73: Impacts from construction activity of the GCF and pipeline on the North Slope on T&E birds
Bio2: Impacts from equipment use in ROW during construction Bio4: Impacts from blasting in the ROW Bio13: Fragmentation impacts from grading and trenching over the centerline primarily in frozen soils Bio15: Invasive species from equipment used during construction Bio18: Impacts from rehabilitation of vegetation Bio19: Impacts of dust deposition from road use for construction Bio27: Impacts from disturbance associated with noise from construction activities Bio28: Impacts from construction activities on wildlife habitat Bio29: Impacts from construction activities on wildlife mortality Bio36: Delayed wildlife movement from development of aboveground facilities Bio37: Displacement of wildlife from development of aboveground facilities Bio45: Impacts from of delayed melting from ice road development across drainages Bio46: Impacts of flooding from ice road development across drainages Bio47: Impacts from all identified stream crossing methods Bio48: Impact from open cut crossing method Bio49: Impact from open cut isolation crossing method Bio50: Impact of blasting on fish habitat Bio52: Impact of blasting and stunning fish Bio65: Impacts of vessel use related to hazardous material spills Bio71: Impacts from vessel use related to hazardous material spills and T&E species
Bio1: Impacts from clearing, grubbing, grading in the ROW Bio3: Impacts from trenching in the ROW Bio5: Fragmentation of vegetation along the ROW Bio8: Impacts from TEWS upon vegetation Bio12: Disturbance impacts from grading and trenching over the centerline primarily in frozen soils Bio14: Disturbance from equipment use in ROW during construction on ice pads and ice roads

Alaska Stand Alone Gas Pipeline 6-37 Final EIS
TABLE 6.1-5 Criteria for Ranking Potential Effects on Socioeconomic Resources
High Moderate Low
Inte
nsi
ty
(by
reso
urc
e g
rou
p)
Land Use Effects on land use are termed high if these entail an irretrievable (or at least long term) commitment of resources inconsistent with other possible uses, require legislative action to permit use, or would adversely impact special use lands.
Effects on land use are termed moderate if these entail an irretrievable (or at least long term) commitment of resources, but are not large in extent or not novel.
Effects on land use are termed low if they do not reach the threshold for moderate.
Recreation & Visual Resources
Recreation & Visual Resource effects are termed high if degraded to a point that resources could no longer be used for recreational purposes and/or the visible landscape(s) were altered for many years.
Recreation & Visual Resource effects are termed moderate if the affected areas could still be used for the intended purposes, albeit with some loss of value(s).
Recreation & Visual Resource effects are termed low if these do not attain the threshold for moderate.
Socioeconomics Effects on socioeconomics are termed high if these entail a long term change in socioeconomic conditions.
Effects on socioeconomics are termed moderate if these entail a long term change in socioeconomic conditions but are not large in extent or not novel.
Effects on socioeconomics are termed low if they do not reach the threshold for moderate.
Subsistence Cause acute or highly observable changes in user access or subsistence harvests of key resources with no viable alternative to engage in these activities or harvest these resources elsewhere.
Cause observable changes in user access or subsistence harvests of key resources with limited alternatives to engage in these activities or harvest these resources elsewhere.
Cause observable changes in user access or subsistence harvests of resources with multiple alternatives to engage in these activities or harvest these resources elsewhere.
Geographic Scope The extent of the effect would occur at the national and/or state level.
The extent of the effect would occur primarily within one of the major study areas (Alaska North Slope, Central, or Anchorage-Cook Inlet area).
The extent would be site-specific at a few locations.
Frequency and Duration The effect would occur for a duration of greater than 3 years or through operations of the project.
The effect would occur intermittently for a duration of less than 3 years.
The effect would occur intermittently for a duration of less than 1 year.
Magnitude Evaluated based on the average of intensity, geographic scope, and frequency/duration as determined above.
Probability Probability greater than 0.6. Probability in the 0.3 to 0.6 range.
Probability of less than 0.3.
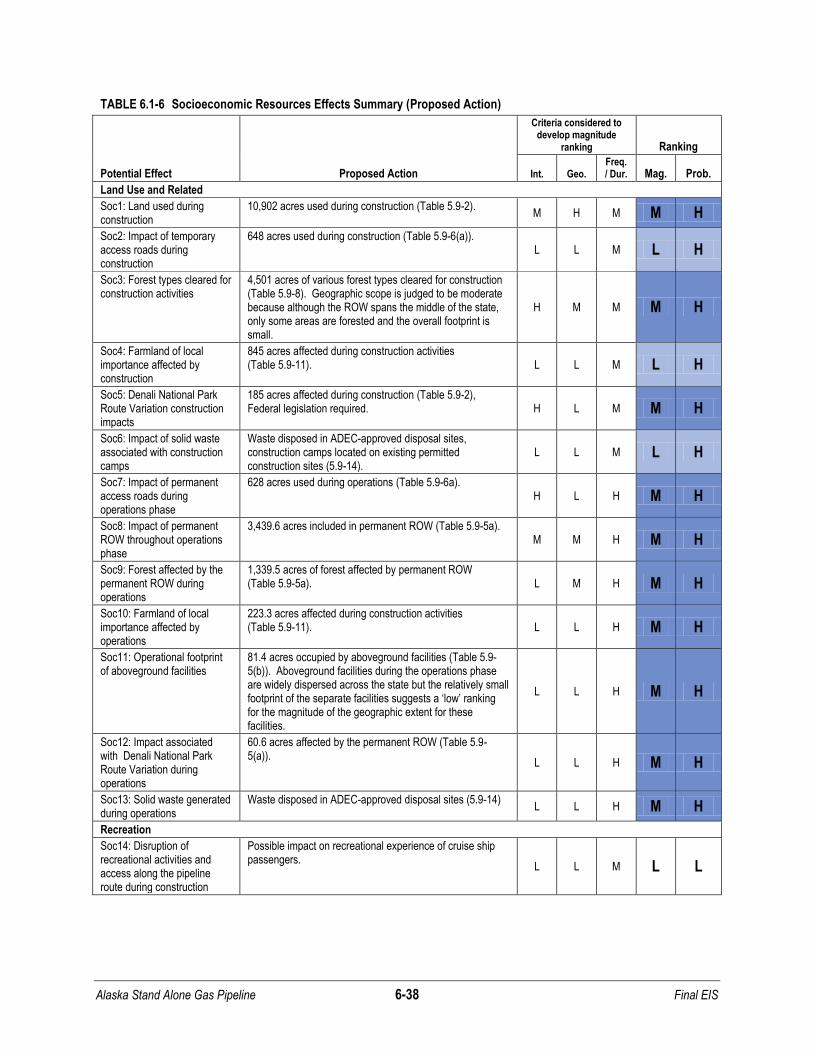
Alaska Stand Alone Gas Pipeline 6-38 Final EIS
TABLE 6.1-6 Socioeconomic Resources Effects Summary (Proposed Action)
Potential Effect Proposed Action
Criteria considered to develop magnitude
ranking Ranking
Int. Geo. Freq. / Dur. Mag. Prob.
Land Use and Related
Soc1: Land used during construction
10,902 acres used during construction (Table 5.9-2). M H M M H
Soc2: Impact of temporary access roads during construction
648 acres used during construction (Table 5.9-6(a)). L L M L H
Soc3: Forest types cleared for construction activities
4,501 acres of various forest types cleared for construction (Table 5.9-8). Geographic scope is judged to be moderate because although the ROW spans the middle of the state, only some areas are forested and the overall footprint is small.
H M M M H
Soc4: Farmland of local importance affected by construction
845 acres affected during construction activities (Table 5.9-11). L L M L H
Soc5: Denali National Park Route Variation construction impacts
185 acres affected during construction (Table 5.9-2), Federal legislation required. H L M M H
Soc6: Impact of solid waste associated with construction camps
Waste disposed in ADEC-approved disposal sites, construction camps located on existing permitted construction sites (5.9-14).
L L M L H
Soc7: Impact of permanent access roads during operations phase
628 acres used during operations (Table 5.9-6a). H L H M H
Soc8: Impact of permanent ROW throughout operations phase
3,439.6 acres included in permanent ROW (Table 5.9-5a). M M H M H
Soc9: Forest affected by the permanent ROW during operations
1,339.5 acres of forest affected by permanent ROW (Table 5.9-5a). L M H M H
Soc10: Farmland of local importance affected by operations
223.3 acres affected during construction activities (Table 5.9-11). L L H M H
Soc11: Operational footprint of aboveground facilities
81.4 acres occupied by aboveground facilities (Table 5.9-5(b)). Aboveground facilities during the operations phase are widely dispersed across the state but the relatively small footprint of the separate facilities suggests a ‘low’ ranking for the magnitude of the geographic extent for these facilities.
L L H M H
Soc12: Impact associated with Denali National Park Route Variation during operations
60.6 acres affected by the permanent ROW (Table 5.9-5(a)).
L L H M H
Soc13: Solid waste generated during operations
Waste disposed in ADEC-approved disposal sites (5.9-14) L L H M H
Recreation
Soc14: Disruption of recreational activities and access along the pipeline route during construction
Possible impact on recreational experience of cruise ship passengers.
L L M L L

Alaska Stand Alone Gas Pipeline 6-39 Final EIS
TABLE 6.1-6 Socioeconomic Resources Effects Summary (Proposed Action)
Potential Effect Proposed Action
Criteria considered to develop magnitude
ranking Ranking
Int. Geo. Freq. / Dur. Mag. Prob.
Soc15: Disruption of recreational activities and access along roads during construction
Use of public roads to transport pipe, heavy equipment, and personnel could result in potential impacts due to traffic congestion.
M M M M M
Soc16: Impacts of construction activity due to construction materials and noise generation
Particular concern with construction near isolated recreation areas, such as designated wilderness areas.
M L M M M
Soc 17: Impacts to water dependent recreation due to stream crossings
Proposed Project construction in and near water bodies could result in water quality impacts, generate noise and visual impacts, and restrict access to water bodies.
M M L M L
Soc18: Impact of influx of construction workers on recreation
Possible competition for recreational facilities (e.g., campgrounds, access to fishing or hunting areas). M L M M M
Soc19: Impact of construction of above ground facilities on recreation
Temporary restrictions and delays accessing nearby recreation sites. L L L L H
Soc20: Impact on recreation from construction camps, pipeline yards, and material sites
Could result in temporary restrictions and delays in accessing nearby recreation sites. There could also be some impact associated with construction noise.
L L L L L
Soc21: Recreation impacts of ROW during operations phase
Minor restrictions to access. Self-contained underground facility minimizes impacts. L L H M L
Soc22: Recreation impact associated with Denali National Park Route Variation during operations
Minor restrictions to access in the Park. Self-contained underground facility minimizes impacts.
M L H M H
Soc23: Impact of operation of facilities associated with the pipeline and recreation.
Long-term operations and maintenance assimilated into industrial character of the region. L L H M H
Visual Resources
Soc24: Visual contrast6 during mainline proposed Project construction
Effects limited in duration because localized construction activity is short. L L L L L
Soc25: Visual contrast during construction of Fairbanks Lateral
Limited impacts. L L L L L
Soc26: Visual impact of construction of aboveground facilities
Limited impacts. L L L L L
Soc27: Impacts of construction on visual resources associated with the Denali National Park Route Variation
Denali NPP has high seasonal recreation and tourist use and such users have high sensitivity. During the visitor season, short-term moderate to high visual impacts are expected.
H L L M H
Soc28: Impact on visual resources during operations
Pipeline buried for most of its length. Right of way visible in several areas—visual contrast greatest in areas requiring hill cuts and new bridge crossings.
L L H M L
6 The effect on visual resources associated with earthwork, exposure of bare soils, and presence of construction
workers and equipment.

Alaska Stand Alone Gas Pipeline 6-40 Final EIS
TABLE 6.1-6 Socioeconomic Resources Effects Summary (Proposed Action)
Potential Effect Proposed Action
Criteria considered to develop magnitude
ranking Ranking
Int. Geo. Freq. / Dur. Mag. Prob.
Soc29: Impacts of operating aboveground facilities on visual resources
Long-term operations and maintenance assimilated into industrial character of the region. L L H M L
Soc30: Impacts of operations on visual resources associated with Denali National Park Route Variation
Long-term impacts limited and weak because most of pipeline is buried and ROW re-vegetated.
L L H M L
Socioeconomics
Soc31: Employment during the construction phase
Increased employment for duration of construction period (Table 5.12-12).
M M M M H
Soc32: Population and housing during construction
Non-resident construction workers would temporarily increase population in study areas (See Table 5.12-13 for AGDC work camp housing estimates).
M M M M H
Soc33:Tax revenues during construction
Expected to increase local tax revenues in the Mat-Su, Denali, and FNS Boroughs.
L M M M H
Soc34: Impact on quality of life during construction
Impacted by changes in traffic density, changes in natural resources or environmental quality, access restrictions, alterations to visual resources, and increased hunter effort, costs, and risks.
L M M M L
Soc35: Environmental Justice during the construction phase
Analysis identifies both positive and negative impacts, but concludes net effects would be minor.
L M L L H
Soc36: Construction of Denali National Park Route Variation
Analysis concludes that impacts to socioeconomics would be negligible.
L L M L H
Soc37: Employment during operations phase
Some long-term jobs created. L L H M H
Socc38: Housing during operations phase
Operations personnel would require housing. L L H M H
Soc39: Tax revenues during operations phase
Estimated $168 million local and state property tax revenues in year 1. (Table 5.12-19) Additionally it is estimated that a total of $358.6 million annually revenues would accrue from royalties, production, and corporate taxes. (Table 5.12-16).
H H H H H
Soc40: Quality of life during operations phase
Overall impact expected to be negligible to minor. L L H M H
Soc41: Environmental Justice during operations phase
Minor or no environmental impacts foreseen. L L H M H
Soc42: Denali National Park Route Variation during operations phase
Analysis concludes that impacts to socioeconomics would be negligible. Some positive impacts arising from production taxes, royalties, and corporate taxes (total $5.2 million annually).
L L H M H
Subsistence
Soc43: Impacts to subsistence resource availability from construction
Construction of the ROW and temporary and permanent access roads impacts local subsistence resources for users. M H L M H
Soc44: Impacts to subsistence user access from construction
Construction of the ROW and temporary and permanent access roads changes access to subsistence resources for users.
M H L M M
Soc45: Impacts to subsistence loss of use area from construction
Construction of the ROW and temporary and permanent access roads removes lands available for subsistence use. M L M M H

Alaska Stand Alone Gas Pipeline 6-41 Final EIS
TABLE 6.1-6 Socioeconomic Resources Effects Summary (Proposed Action)
Potential Effect Proposed Action
Criteria considered to develop magnitude
ranking Ranking
Int. Geo. Freq. / Dur. Mag. Prob.
Soc46: Impacts to subsistence associated with contamination concerns from construction
Construction impacts include concerns regarding resource contamination from dust and smoke, burning wastes, spills and fire.
L H M M L
Soc47: Hunter avoidance of subsistence resources from influx of construction workers
Changes in resource location and availability cause subsistence users to access new areas (hunter avoidance). M L M M M
Soc48: Increased competition for subsistence resources from influx of construction workers
Increased competition for local resource puts pressure on subsistence users to seek other resources.
M H M M M
Soc49: Noise impact on subsistence resource availability during construction
Construction noise can influence subsistence resource availability. M H L M H
Soc50: Noise impact on subsistence resource avoidance behavior during construction
Construction noise can influence subsistence resource users’ choice of hunting grounds (hunter avoidance).
M M L M M
Soc51: Impacts to subsistence resource availability from operations along ROW and roads
Activities associated with operating the pipeline can decrease subsistence resource availability.
L H H M M
Soc52: Impacts to subsistence resource access from operations along ROW and roads
Some areas may have increased access and alter access to subsistence users.
L H H M M
Soc53: Impacts to subsistence resource competition from operations along ROW and roads
New roads could increase competition for subsistence resources.
L H H M M
Soc54: Impacts to subsistence resource availability from maintenance and operations activities
Maintenance and operations along the ROW may impact subsistence resource availability.
L L H M H
Soc55: Impacts on subsistence user avoidance from maintenance and operations activities
Maintenance and operations activities can influence subsistence resource users’ choice of hunting and harvesting grounds.
L L H M M
Soc56: Impacts on subsistence competition from local workforce population
Increase in local workforce can lead to increased competition for subsistence resources. L H H M H
Soc57: Potential for contamination of subsistence resources for pipeline operations
Operations contribute to concerns regarding resource contamination from dust and smoke, burning wastes, spills and fire.
L L H M L
Soc58: Impact of aboveground facilities on subsistence user avoidance
Loss of lands for new facilities will influence subsistence users’ choice of lands for hunting and harvesting. The proposed compressor station near Minto Flats Game Refuge could introduce additional noise, emissions, and activity and disrupt subsistence users and resources.
L L H M M
Soc59: Impact of aboveground facilities on subsistence user access
Permanent facilities and roads may restrict subsistence user access. L L H M M
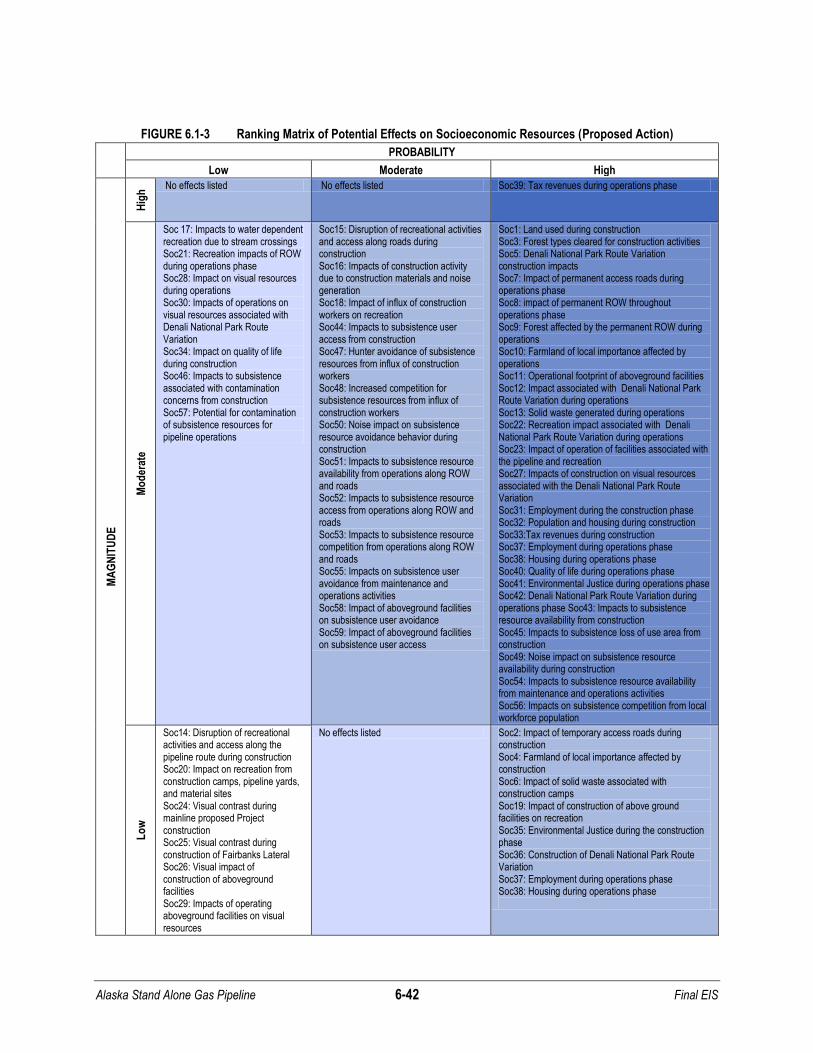
Alaska Stand Alone Gas Pipeline 6-42 Final EIS
FIGURE 6.1-3 Ranking Matrix of Potential Effects on Socioeconomic Resources (Proposed Action)
PROBABILITY
Low Moderate High
MA
GN
ITU
DE
Hig
h No effects listed No effects listed Soc39: Tax revenues during operations phase
Mo
der
ate
Soc 17: Impacts to water dependent recreation due to stream crossings Soc21: Recreation impacts of ROW during operations phase Soc28: Impact on visual resources during operations Soc30: Impacts of operations on visual resources associated with Denali National Park Route Variation Soc34: Impact on quality of life during construction Soc46: Impacts to subsistence associated with contamination concerns from construction Soc57: Potential for contamination of subsistence resources for pipeline operations
Soc15: Disruption of recreational activities and access along roads during construction Soc16: Impacts of construction activity due to construction materials and noise generation Soc18: Impact of influx of construction workers on recreation Soc44: Impacts to subsistence user access from construction Soc47: Hunter avoidance of subsistence resources from influx of construction workers Soc48: Increased competition for subsistence resources from influx of construction workers Soc50: Noise impact on subsistence resource avoidance behavior during construction Soc51: Impacts to subsistence resource availability from operations along ROW and roads Soc52: Impacts to subsistence resource access from operations along ROW and roads Soc53: Impacts to subsistence resource competition from operations along ROW and roads Soc55: Impacts on subsistence user avoidance from maintenance and operations activities Soc58: Impact of aboveground facilities on subsistence user avoidance Soc59: Impact of aboveground facilities on subsistence user access
Soc1: Land used during construction Soc3: Forest types cleared for construction activities Soc5: Denali National Park Route Variation construction impacts Soc7: Impact of permanent access roads during operations phase Soc8: impact of permanent ROW throughout operations phase Soc9: Forest affected by the permanent ROW during operations Soc10: Farmland of local importance affected by operations Soc11: Operational footprint of aboveground facilities Soc12: Impact associated with Denali National Park Route Variation during operations Soc13: Solid waste generated during operations Soc22: Recreation impact associated with Denali National Park Route Variation during operations Soc23: Impact of operation of facilities associated with the pipeline and recreation Soc27: Impacts of construction on visual resources associated with the Denali National Park Route Variation Soc31: Employment during the construction phase Soc32: Population and housing during construction Soc33:Tax revenues during construction Soc37: Employment during operations phase Soc38: Housing during operations phase Soc40: Quality of life during operations phase Soc41: Environmental Justice during operations phase Soc42: Denali National Park Route Variation during operations phase Soc43: Impacts to subsistence resource availability from construction Soc45: Impacts to subsistence loss of use area from construction Soc49: Noise impact on subsistence resource availability during construction Soc54: Impacts to subsistence resource availability from maintenance and operations activities Soc56: Impacts on subsistence competition from local workforce population
Lo
w
Soc14: Disruption of recreational activities and access along the pipeline route during construction Soc20: Impact on recreation from construction camps, pipeline yards, and material sites Soc24: Visual contrast during mainline proposed Project construction Soc25: Visual contrast during construction of Fairbanks Lateral Soc26: Visual impact of construction of aboveground facilities Soc29: Impacts of operating aboveground facilities on visual resources
No effects listed Soc2: Impact of temporary access roads during construction Soc4: Farmland of local importance affected by construction Soc6: Impact of solid waste associated with construction camps Soc19: Impact of construction of above ground facilities on recreation Soc35: Environmental Justice during the construction phase Soc36: Construction of Denali National Park Route Variation Soc37: Employment during operations phase Soc38: Housing during operations phase

Alaska Stand Alone Gas Pipeline 6-43 Final EIS
TABLE 6.1-7 Impacts of the No Action Alternative.
Potential Effect No Action Alternative
Magnitude Factors Ranking
Int. Geo. Freq. /Dur. Mag. Prob.
Physical Resources
Phy1 – 30 (except Phy18 noted below)
These impacts would not occur therefore they cannot by ranked.
- - - - -
Phy18: Impacts to the FNSB nonattainment zone from construction and operations of the Fairbanks Lateral
The No Action Alternative foregoes the expected improvement to air quality in the Fairbanks North Star Borough region. This option also foregoes the effects positive cumulative effects on public associated with improved air quality from the use of cleaner fuels in the Fairbanks North Star Borough region.
M L H M H
Biological Resources
Bio1 - 74 These impacts would not occur therefore they cannot by ranked.
- - - - -
Socioeconomic Resources
Soc 1 – 59 (except Soc31, 33, 37 & 39 noted below)
These impacts would not occur therefore they cannot by ranked.
- - - - -
Soc31: Employment during the construction phase
The No Action Alternative foregoes increased employment for duration of construction period (Table 5.12-12).
M M M M H
Soc33:Tax revenues during construction
Under the No Action Alternative, expected increase in local tax revenues in the Mat-Su, Denali, and FNS Boroughs does not occur.
L M M M H
Soc37: Employment during operations phase
The No Action Alternative foregoes the creation of long-term jobs during the operations and maintenance phase.
L L H M H
Soc39: Tax revenues during operations phase
Under the No Action Alternative, an estimated $168 million local and state property tax revenues in year 1 are not realized (Table 5.12-19). The state would not receive an additional estimated total of $358.6 million annually in revenues from royalties, production, and corporate taxes (Table 5.12-16).
H H H H H

Alaska Stand Alone Gas Pipeline 6-44 Final EIS
FIGURE 6.1-4 Ranking Matrix of Potential Effects on All Resources (No Action Alternative)
PROBABILITY
Low Moderate High
MA
GN
ITU
DE
Hig
h
No effects listed No effects listed Soc39: Tax revenues during operations phase
Mo
der
ate
No effects listed No effects listed Phy18: Impacts to the FNSB nonattainment zone from construction and operations of the Fairbanks Lateral Soc31: Employment during the construction phase Soc33:Tax revenues during construction Soc37: Employment during operations phase
Lo
w
No effects listed No effects listed No effects listed

Alaska Stand Alone Gas Pipeline 6-45 Final EIS
TABLE 6.1-8 Impacts Associated with the Denali Route Variation Alternative that are Different from the Proposed Action
Potential Effect Denali Route Variation Alternative
Magnitude Factors Ranking
Int. Geo. Freq. /Dur. Mag. Prob.
Physical Resources
Phy8: Increased sedimentation, reduced water quality, and changes to stream profile and structure from excavation activities and disturbance of ground cover
Four fewer stream crossings associated with this alternative reduce direct effect overall. Excavation activities and disturbance of ground cover would impact surface water quality downstream due to erosion. Sedimentation would increase resulting in increased turbidity reducing water quality. Permanent impacts could include changes to the stream profile and structure (bed and hyporheic zone) at crossing locations.
M H M M H
Phy24: Impeding navigability while conducting open-cut stream crossing method during construction
The Nenana River is crossed two more times than for the proposed action. Navigability along waterways using open-cut methods would be temporarily impeded by construction materials and equipment during the pipeline construction process.
H M L M H
Phy25: Unintended release of drilling fluids while conducting HDD stream crossing method during construction
With this Alternative, the Nenana River is crossed two more times than for the proposed action. Unintended release of drilling fluids may occur while conducting the HDD stream crossing method during construction.
M L L L L
Biological Resources
Bio47: Impacts from all identified stream crossing methods
Four fewer stream crossings associated with this alternative reduce direct effect overall. Temporary in stream habitat alteration and channel profile causing gill irritation from increased sedimentation.
L L L L M
Bio48: Impact from open cut crossing method
Four fewer stream crossings associated with this alternative reduce direct effect overall. Temporary increase in sedimentation and erosion along the stream bank, loss of riparian vegetation, altered channel morphology.
L L L L M
Bio49: Impact from open cut isolation crossing method
Four fewer stream crossings associated with this alternative reduce direct effect overall. Injury may occur to certain fish species and life stages which may be more susceptible when diverting water around the construction area.
L L L L M
Socioeconomic Resources
Soc 17: Impacts to water dependent recreation due to stream crossings
Four fewer stream crossings associated with this alternative reduce direct effect overall. Proposed Project construction in and near water bodies could result in water quality impacts, generate noise and visual impacts, and restrict access to water bodies.
M M L M L
Soc22: Recreation impact associated with Denali National Park Route Variation during operations
Minor restrictions to access. Self-contained underground facility minimizes impacts.
M L H M H
Soc27: Impacts of construction on visual resources associated with the Denali National Park Route Variation
Denali NPP has high seasonal recreation and tourist use and such users have high sensitivity. During the visitor season, short-term moderate to high visual impacts are expected.
H L L M H
Soc30: Impacts of operations on visual resources associated with Denali National Park Route Variation
Long-term impacts limited and weak because most of pipeline is buried and ROW re-vegetated.
L L H M L
Soc42: Denali National Park Route Variation
Analysis concludes that impacts to socioeconomics would be negligible. Some positive impacts arising from production taxes, royalties, and corporate taxed (total $5.2 million annually).
L L H M H

Alaska Stand Alone Gas Pipeline 6-46 Final EIS
FIGURE 6.1-5 Ranking Matrix of Impacts Associated with the Denali Route Variation Alternative that are Different from the Proposed Action7
PROBABILITY
Low Moderate High
MA
GN
ITU
DE
Hig
h
No effects listed No effects listed No effects listed
Mo
der
ate
Soc 17: Impacts to water dependent recreation due to stream crossings Soc30: Impacts of operations on visual resources associated with Denali National Park Route Variation
No effects listed Phy8: Increased sedimentation, reduced water quality, and changes to stream profile and structure from excavation activities and disturbance of ground cover Phy24: Impeding navigability while conducting open-cut stream crossing method during construction Soc22: Recreation impact associated with Denali National Park Route Variation during operations Soc27: Impacts of construction on visual resources associated with the Denali National Park Route Variation Soc42: Denali National Park Route Variation
Lo
w
Phy25: Unintended release of drilling fluids while conducting HDD stream crossing
Bio47: Impacts from all identified stream crossing methods Bio48: Impact from open cut crossing method Bio49: Impact from open cut isolation crossing method
No effects listed
7 The potential impacts shown in Figure 6.1-5 are ranked the same as they were ranked under the proposed action
because the impacts associated with the Denali Route Variation are not significantly different than those of the entire proposed Project.

Alaska Stand Alone Gas Pipeline 6-47 Final EIS
TABLE 6.1-9 Potential Effects of the Applicant’s Preferred Option that are Different than the Proposed Action
Potential Effect Applicant Preferred Yukon River Crossing Option:
New Suspension Bridge
Magnitude Factors Ranking
Int. Geo. Freq. /Dur. Mag. Prob.
Soils and Geology
Phy1: Impacts to paleontological resources
A new suspension bridge across the Yukon could encounter unknown paleontological resources (any physical evidence of past life, including fossilized remains, impressions, and traces of plants and animals).
M M M M H
Phy3: Impacts to soils or bedrock from excavation and blasting
Construction of the new suspension bridge will have greater impact on soils and bedrock than Option 2. L H M M H
Phy4: Impacts to soils containing permafrost from thaw settlement
The new suspension bridge may impact permafrost in the local area of the crossing when compared with Option 2. Otherwise, for the rest of the pipeline, limited impacts to soils containing permafrost would occur from thaw settlement from use of temporary ice/gravel roads, and ice/gravel pads to stage and transport materials and equipment.
L L L L M
Navigation Resources
Phy26: Impeding navigability during construction of Yukon River crossing.
For the Yukon River Crossing, if the new bridge option is selected (the preferred option), large vessels would likely be required in the Yukon River during the construction season until the new pipeline suspension bridge is fully built. These vessels would likely impede other local vessel traffic during the construction phase of the proposed Project. In addition other pipeline construction activities may impact navigation in other navigable waters.
H L L M H
Vegetation
Bio1: Impacts from clearing, grubbing, grading in the ROW
The Applicant’s Preferred Option involves slightly more land than would be used for Option 2 and could have a slightly larger effect on temporary erosion and sedimentation impacts and destruction of plant root stock delaying vegetation recovery.
L M L L H
Wetlands
Bio12: Disturbance impacts from grading and trenching over the centerline primarily in frozen soils
The Applicant’s Preferred Option involves slightly more land than would be used for Option 2 and could have a slightly larger effect on subsoil, topsoil and surface hydrology.
L M L L H
Wildlife
Bio28: Impacts from construction activities on wildlife habitat
The Applicant’s Preferred Option involves slightly more land than would be used for Option 2 and could have a slightly larger effect on the temporary disturbance to wildlife habitat during construction.
L L M L M
Visual Resources
Soc26: Visual impact of construction of aboveground facilities
The Applicant’s Preferred Option requires construction of a new suspension bridge crossing the Yukon River. Limited impacts overall during the construction phase.
L L L L L
Soc28: Impact on visual resources during operations
The new suspension bridge adds a visual element to the existing scenery. However, the pipeline is buried for most of its length. Pipeline right of way visible in several areas—visual contrast greatest in areas requiring hill cuts and new bridge crossings. Over the entire pipeline ROW, the addition of one bridge crossing does not materially impact visual resources.
L L H M L

Alaska Stand Alone Gas Pipeline 6-48 Final EIS
FIGURE 6.1-6 Ranking Matrix of Impacts of the Applicant’s Preferred Option that are Different than the Proposed Action
PROBABILITY
Low Moderate High
MA
GN
ITU
DE
Hig
h
No effects listed No effects listed No effects listed
Mo
der
ate
Soc28: Impact on visual resources during operations
No effects listed Phy1: Impacts to paleontological resources Phy3: Impacts to soils or bedrock from excavation and blasting Phy26: Impeding navigability during construction of Yukon River crossing.
Lo
w
Soc26: Visual impact of construction of aboveground facilities
Phy4: Impacts to soils containing permafrost from thaw settlement Bio28: Impacts from construction activities on wildlife habitat
Bio1: Impacts from clearing, grubbing, grading in the ROW Bio12: Disturbance impacts from grading and trenching over the centerline primarily in frozen soils
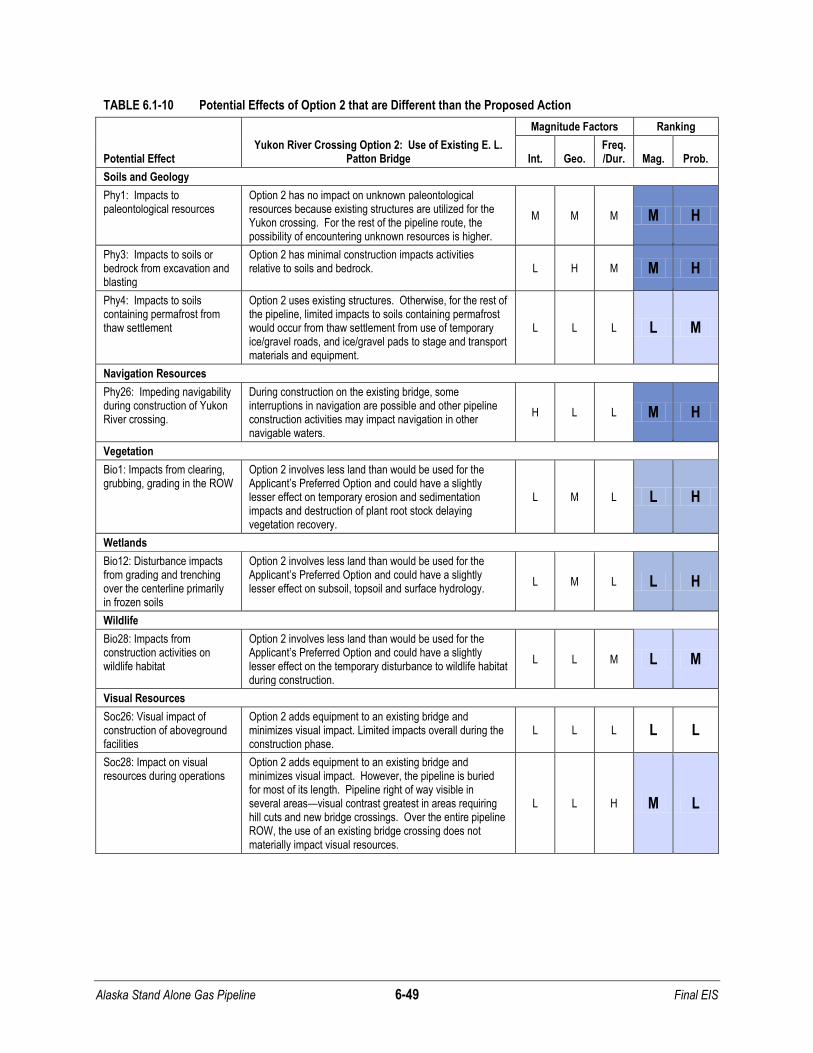
Alaska Stand Alone Gas Pipeline 6-49 Final EIS
TABLE 6.1-10 Potential Effects of Option 2 that are Different than the Proposed Action
Potential Effect Yukon River Crossing Option 2: Use of Existing E. L.
Patton Bridge
Magnitude Factors Ranking
Int. Geo. Freq. /Dur. Mag. Prob.
Soils and Geology
Phy1: Impacts to paleontological resources
Option 2 has no impact on unknown paleontological resources because existing structures are utilized for the Yukon crossing. For the rest of the pipeline route, the possibility of encountering unknown resources is higher.
M M M M H
Phy3: Impacts to soils or bedrock from excavation and blasting
Option 2 has minimal construction impacts activities relative to soils and bedrock. L H M M H
Phy4: Impacts to soils containing permafrost from thaw settlement
Option 2 uses existing structures. Otherwise, for the rest of the pipeline, limited impacts to soils containing permafrost would occur from thaw settlement from use of temporary ice/gravel roads, and ice/gravel pads to stage and transport materials and equipment.
L L L L M
Navigation Resources
Phy26: Impeding navigability during construction of Yukon River crossing.
During construction on the existing bridge, some interruptions in navigation are possible and other pipeline construction activities may impact navigation in other navigable waters.
H L L M H
Vegetation
Bio1: Impacts from clearing, grubbing, grading in the ROW
Option 2 involves less land than would be used for the Applicant’s Preferred Option and could have a slightly lesser effect on temporary erosion and sedimentation impacts and destruction of plant root stock delaying vegetation recovery.
L M L L H
Wetlands
Bio12: Disturbance impacts from grading and trenching over the centerline primarily in frozen soils
Option 2 involves less land than would be used for the Applicant’s Preferred Option and could have a slightly lesser effect on subsoil, topsoil and surface hydrology.
L M L L H
Wildlife
Bio28: Impacts from construction activities on wildlife habitat
Option 2 involves less land than would be used for the Applicant’s Preferred Option and could have a slightly lesser effect on the temporary disturbance to wildlife habitat during construction.
L L M L M
Visual Resources
Soc26: Visual impact of construction of aboveground facilities
Option 2 adds equipment to an existing bridge and minimizes visual impact. Limited impacts overall during the construction phase.
L L L L L
Soc28: Impact on visual resources during operations
Option 2 adds equipment to an existing bridge and minimizes visual impact. However, the pipeline is buried for most of its length. Pipeline right of way visible in several areas—visual contrast greatest in areas requiring hill cuts and new bridge crossings. Over the entire pipeline ROW, the use of an existing bridge crossing does not materially impact visual resources.
L L H M L

Alaska Stand Alone Gas Pipeline 6-50 Final EIS
FIGURE 6.1-7 Ranking Matrix of Impacts of Option 2 that are Different than the Proposed Action
PROBABILITY
Low Moderate High
MA
GN
ITU
DE
Hig
h
No effects listed No effects listed No effects listed
Mo
der
ate
Soc28: Impact on visual resources during operations
No effects listed Phy1: Impacts to paleontological resources Phy3: Impacts to soils or bedrock from excavation and blasting Phy26: Impeding navigability during construction of Yukon River crossing.
Lo
w
Soc26: Visual impact of construction of aboveground facilities
Phy4: Impacts to soils containing permafrost from thaw settlement Bio28: Impacts from construction activities on wildlife habitat
Bio1: Impacts from clearing, grubbing, grading in the ROW Bio12: Disturbance impacts from grading and trenching over the centerline primarily in frozen soils
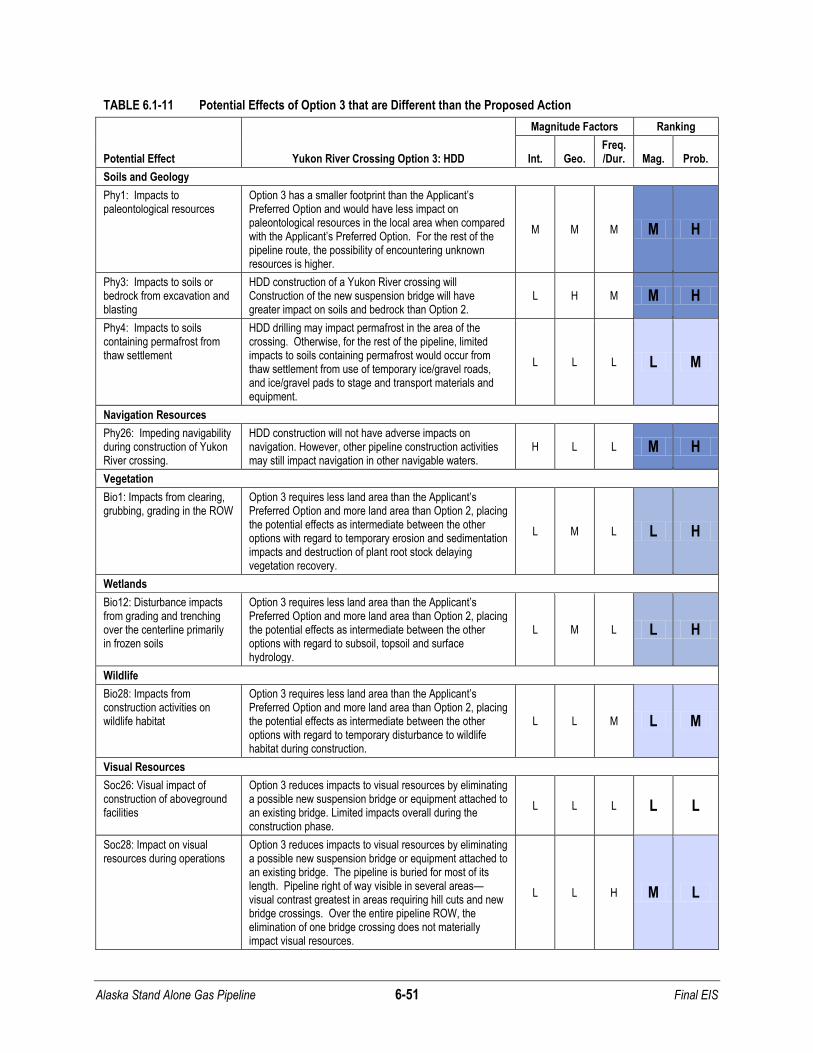
Alaska Stand Alone Gas Pipeline 6-51 Final EIS
TABLE 6.1-11 Potential Effects of Option 3 that are Different than the Proposed Action
Potential Effect Yukon River Crossing Option 3: HDD
Magnitude Factors Ranking
Int. Geo. Freq. /Dur. Mag. Prob.
Soils and Geology
Phy1: Impacts to paleontological resources
Option 3 has a smaller footprint than the Applicant’s Preferred Option and would have less impact on paleontological resources in the local area when compared with the Applicant’s Preferred Option. For the rest of the pipeline route, the possibility of encountering unknown resources is higher.
M M M M H
Phy3: Impacts to soils or bedrock from excavation and blasting
HDD construction of a Yukon River crossing will Construction of the new suspension bridge will have greater impact on soils and bedrock than Option 2.
L H M M H
Phy4: Impacts to soils containing permafrost from thaw settlement
HDD drilling may impact permafrost in the area of the crossing. Otherwise, for the rest of the pipeline, limited impacts to soils containing permafrost would occur from thaw settlement from use of temporary ice/gravel roads, and ice/gravel pads to stage and transport materials and equipment.
L L L L M
Navigation Resources
Phy26: Impeding navigability during construction of Yukon River crossing.
HDD construction will not have adverse impacts on navigation. However, other pipeline construction activities may still impact navigation in other navigable waters.
H L L M H
Vegetation
Bio1: Impacts from clearing, grubbing, grading in the ROW
Option 3 requires less land area than the Applicant’s Preferred Option and more land area than Option 2, placing the potential effects as intermediate between the other options with regard to temporary erosion and sedimentation impacts and destruction of plant root stock delaying vegetation recovery.
L M L L H
Wetlands
Bio12: Disturbance impacts from grading and trenching over the centerline primarily in frozen soils
Option 3 requires less land area than the Applicant’s Preferred Option and more land area than Option 2, placing the potential effects as intermediate between the other options with regard to subsoil, topsoil and surface hydrology.
L M L L H
Wildlife
Bio28: Impacts from construction activities on wildlife habitat
Option 3 requires less land area than the Applicant’s Preferred Option and more land area than Option 2, placing the potential effects as intermediate between the other options with regard to temporary disturbance to wildlife habitat during construction.
L L M L M
Visual Resources
Soc26: Visual impact of construction of aboveground facilities
Option 3 reduces impacts to visual resources by eliminating a possible new suspension bridge or equipment attached to an existing bridge. Limited impacts overall during the construction phase.
L L L L L
Soc28: Impact on visual resources during operations
Option 3 reduces impacts to visual resources by eliminating a possible new suspension bridge or equipment attached to an existing bridge. The pipeline is buried for most of its length. Pipeline right of way visible in several areas—visual contrast greatest in areas requiring hill cuts and new bridge crossings. Over the entire pipeline ROW, the elimination of one bridge crossing does not materially impact visual resources.
L L H M L
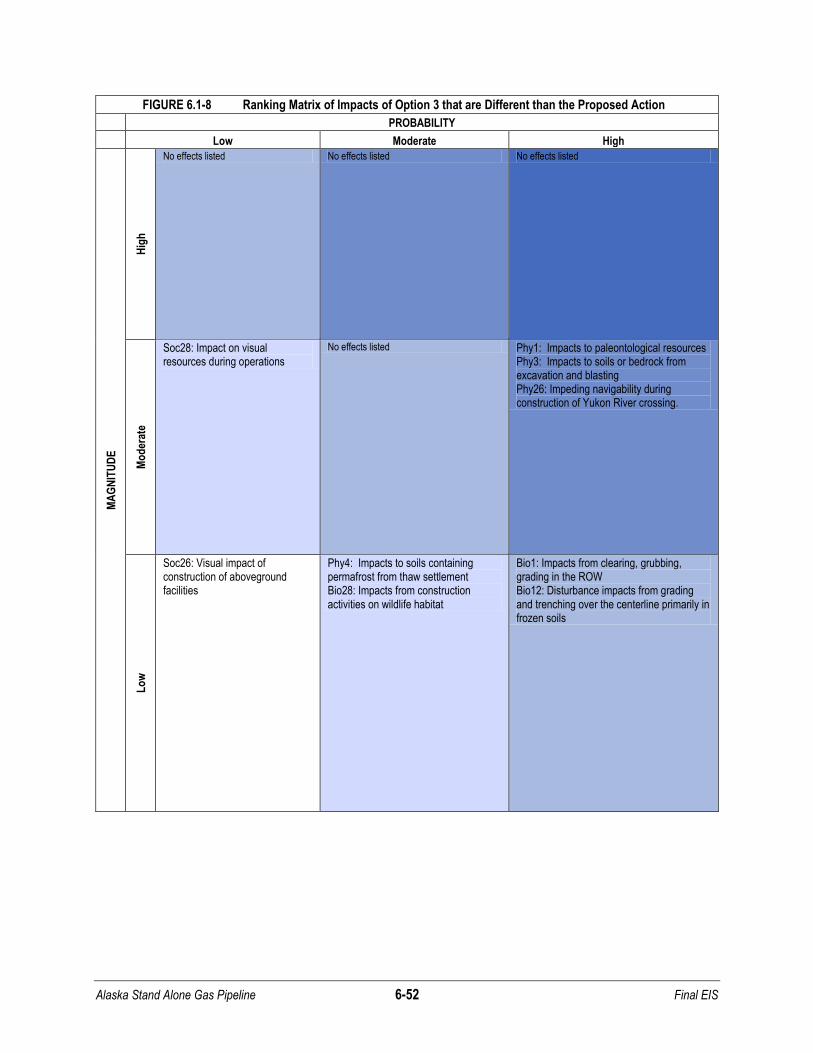
Alaska Stand Alone Gas Pipeline 6-52 Final EIS
FIGURE 6.1-8 Ranking Matrix of Impacts of Option 3 that are Different than the Proposed Action
PROBABILITY
Low Moderate High
MA
GN
ITU
DE
Hig
h
No effects listed No effects listed No effects listed
Mo
der
ate
Soc28: Impact on visual resources during operations
No effects listed Phy1: Impacts to paleontological resources Phy3: Impacts to soils or bedrock from excavation and blasting Phy26: Impeding navigability during construction of Yukon River crossing.
Lo
w
Soc26: Visual impact of construction of aboveground facilities
Phy4: Impacts to soils containing permafrost from thaw settlement Bio28: Impacts from construction activities on wildlife habitat
Bio1: Impacts from clearing, grubbing, grading in the ROW Bio12: Disturbance impacts from grading and trenching over the centerline primarily in frozen soils

Alaska Stand Alone Gas Pipeline
SUBJECT INDEX
Final EIS

Alaska Stand Alone Gas Pipeline i Final EIS
Index
A
abandon, 2-61, 5.2-11, 5.5-21, 5.9-14, 5.13-23, 5.15-17, 5.22-3, 5.23-21, 5.23-26, 5.23-75
abatement, 1-30, 5.17-8, 5.17-14, 5.17-15 accident, ES-21, ES-22, ES-23, 2-19, 2-31, 5.3-
7, 5.4-25, 5.5-15, 5.7-16, 5.15-5, 5.15-6, 5.15-10, 5.15-48, 5.15-59, 5.15-60, 5.15-65, 5.15-67, 5.15-69, 5.15-70, 5.15-89, 5.15-91, 5.15-92, 5.15-93, 5.15-95, 5.15-99, 5.15-100, 5.15-101, 5.15-127, 5.15-128, 5.15-131, 5.15-136, 5.15-137, 5.16-15, 5.19-1, 5.19-6, 5.19-10, 5.19-11, 5.19-13, 5.23-8, 5.23-60, 6-15, 6-18, 6-28
acoustics, 5.7-13, 5.7-14, 5.7-17 adverse effect, ES-19, ES-20, ES-25, ES-26,
5.2-71, 5.6-2, 5.6-18, 5.6-20, 5.6-29, 5.6-32, 5.8-5, 5.9-46, 5.10-29, 5.10-30, 5.10-31, 5.10-37, 5.12-3, 5.12-21, 5.12-47, 5.12-48, 5.12-49, 5.13-2, 5.13-3, 5.13-28, 5.13-29, 5.13-35, 5.13-36, 5.13-37, 5.15-88, 5.15-157, 5.21-2, 5.22-4, 5.23-55, 5.23-60, 6-11, 6-13
affected environment, ES-11, 5-1, 5.1-1, 5.2-1, 5.2-7, 5.2-31, 5.3-1, 5.4-1, 5.4-2, 5.5-1, 5.6-1, 5.7-1, 5.8-1, 5.8-2, 5.8-5, 5.8-6, 5.8-7, 5.8-8, 5.8-9, 5.8-11, 5.8-12, 5.8-16, 5.8-17, 5.8-18, 5.8-20, 5.8-24, 5.8-28, 5.9-1, 5.10-1, 5.10-27, 5.11-1, 5.12-1, 5.12-3, 5.13-3, 5.15-9, 5.15-13, 5.15-88, 5.15-115, 5.16-1, 5.17-1, 5.18-6
agency, ES-1, ES-5, ES-15, ES-17, 1-1, 1-5, 1-6, 1-7, 1-8, 1-12, 1-16, 1-17, 1-21, 1-23, 1-24, 1-25, 1-26, 1-27, 1-28, 1-29, 1-31, 2-26, 2-33, 2-46, 2-61, 4-25, 5-1, 5.1-1, 5.2-11, 5.2-13, 5.2-14, 5.2-76, 5.3-7, 5.3-19, 5.3-24, 5.3-29, 5.3-32, 5.4-19, 5.4-30, 5.5-28, 5.5-35, 5.6-2, 5.8-1, 5.8-24, 5.9-1, 5.9-32, 5.9-38, 5.9-41, 5.9-47, 5.9-52, 5.9-53, 5.10-1, 5.10-2, 5.10-4, 5.10-25, 5.12-18, 5.13-2, 5.13-27, 5.13-28, 5.15-5, 5.15-6, 5.15-7, 5.15-25, 5.15-99, 5.15-104, 5.15-138, 5.15-154, 5.15-155, 5.15-158, 5.16-5, 5.16-7, 5.16-11, 5.16-16, 5.17-1, 5.18-1, 5.18-4, 5.18-8, 5.19-1, 5.21-1, 5.22-1, 5.22-2, 5.23-1, 5.23-3, 5.23-6, 5.23-11, 5.23-16, 5.23-26, 5.23-27, 5.23-30, 5.23-31, 5.23-33, 5.23-34, 5.23-36, 5.23-37, 5.23-46, 5.23-50, 5.23-51, 5.23-52, 5.23-53, 5.23-55, 5.23-58, 5.23-59, 5.23-66, 5.23-68, 5.23-73
aggradation, ES-11, 5.1-1, 5.1-13, 5.1-23, 4, 6-3 agriculture, ES-13, ES-19, 5.2-8, 5.2-18, 5.2-19,
5.2-20, 5.2-21, 5.3-14, 5.5-16, 5.9-13, 5.9-16, 5.9-17, 5.9-18, 5.9-20, 5.9-21, 5.9-27, 5.9-28,
5.9-37, 5.9-38, 5.9-53, 5.9-57, 5.11-28, 5.15-24, 5.16-5, 5.21-1, 5.22-4, 6-10
Air Force Station, ES-18, 1-18, 5.9-5, 5.9-11, 5.9-59, 5.12-6
air quality, ES-6, ES-21, ES-26, 1-5, 1-9, 1-31, 3-6, 4-2, 4-15, 4-17, 5.12-47, 5.15-7, 5.15-11, 5.15-83, 5.15-103, 5.15-104, 5.15-129, 5.15-132, 5.15-139, 5.15-143, 5.15-145, 5.15-146, 5.15-150, 5.15-151, 5.15-158, 5.16-1, 5.16-5, 5.16-7, 5.16-8, 5.16-10, 5.16-11, 5.16-14, 5.16-18, 5.16-21, 5.16-22, 5.16-23, 5.16-24, 5.16-26, 5.16-28, 5.16-29, 5.16-31, 5.16-33, 5.16-34, 5.16-35, 5.21-5, 5.23-60, 5.23-61, 5.23-62, 5.23-80, 6-2, 6-16, 6-17, 6-16, 6-19, 6-23, 6-27, 6-29, 6-42
Aircraft Control and Warning, 5.13-8, 5.13-15, 5.13-42
Alaska Administrative Code, 1-30, 1-31, 1-32, 1-33, 2-19, 5.2-6, 5.2-13, 5.2-16, 5.2-17, 5.2-18, 5.2-21, 5.2-81, 5.3-14, 5.4-19, 5.6-1, 5.9-6, 5.9-7, 5.9-8, 5.9-11, 5.9-42, 5.9-43, 5.9-46, 5.10-2, 5.10-23, 5.15-88, 5.15-104, 5.16-12, 5.16-21, 5.16-26, 5.16-28, 5.16-29, 5.16-31, 5.16-33, 5.23-74, 5.23-75, 5.23-76, 5.23-77, 5.23-78, 5.23-79, 5.23-80, 5.23-81, 5.23-82, 5.23-83, 5.23-84, 5.23-85, 5.23-86, 5.23-87
Alaska Bureau of Vital Statistics, 5.15-48, 5.15-56, 5.15-59, 5.15-60, 5.15-62, 5.15-64, 5.15-65, 5.15-70, 5.15-71, 5.15-73, 5.15-89, 5.15-159
Alaska Department of Environmental Conservation, 1-9, 1-12, 1-25, 1-28, 1-30, 1-31, 2-19, 2-26, 4-5, 5.1-24, 5.2-1, 5.2-5, 5.2-6, 5.2-7, 5.2-8, 5.2-9, 5.2-11, 5.2-13, 5.2-15, 5.2-16, 5.2-17, 5.2-21, 5.2-22, 5.2-26, 5.2-27, 5.2-28, 5.2-31, 5.2-38, 5.2-40, 5.2-41, 5.2-46, 5.2-51, 5.2-54, 5.2-55, 5.2-58, 5.2-81, 5.15-84, 5.15-88, 5.15-103, 5.15-104, 5.15-129, 5.15-139, 5.15-141, 5.15-148, 5.15-159, 5.15-160, 5.16-6, 5.16-12, 5.16-21, 5.16-22, 5.16-23, 5.16-24, 5.16-26, 5.16-28, 5.16-30, 5.16-31, 5.16-33, 5.16-35, 5.16-36, 5.16-38, 5.21-5, 5, 7, 5.23-34, 6-37
Alaska Department of Fish and Game, ES-15, ES-16, 1-12, 1-25, 1-31, 1-32, 2-33, 5.2-82, 5.3-34, 1, 2, 5.5-2, 5.5-3, 5.5-4, 5.5-6, 5.5-8, 5.5-14, 5.5-17, 5.5-33, 5.5-41, 5.5-42, 5.5-43, 5.5-44, 5.5-45, 5.5-46, 5.5-47, 5.5-48, 5.6-2, 5.6-3, 5.6-9, 5.6-10, 5.6-11, 5.6-12, 5.6-14, 5.6-16, 5.6-18, 5.6-20, 5.6-24, 5.6-25, 5.6-27, 5.6-28, 5.6-32, 5.6-35, 5.6-36, 5.6-37, 5.6-38, 5.6-39, 5.6-40, 5.7-24, 5.8-32, 5.9-7, 5.9-36, 5.9-46, 5.9-54, 5.9-57, 5.10-1, 5.10-5, 5.10-21, 5.10-23, 5.10-24, 5.10-25, 5.10-26, 5.10-30, 5.10-37, 5.12-7, 5.12-51, 5.15-37, 5.15-38, 5.15-39, 5.15-40, 5.15-41, 5.15-42, 5.15-
Alaska Stand Alone Gas Pipeline ii Final EIS
43, 5.15-44, 5.15-45, 5.15-46, 5.15-47, 5.15-159, 5.15-160, 5.15-166, 5.23-5, 5.23-6, 5.23-28, 5.23-30, 5.23-32, 5.23-33, 5.23-36, 5.23-38, 5.23-43, 5.23-52, 5.23-58, 5.23-59
Alaska Department of Health and Social Services, 5.15-4, 5.15-6, 5.15-12, 5.15-33, 5.15-34, 5.15-49, 5.15-50, 5.15-51, 5.15-52, 5.15-53, 5.15-56, 5.15-69, 5.15-74, 5.15-76, 5.15-77, 5.15-78, 5.15-101, 5.15-108, 5.15-109, 5.15-110, 5.15-113, 5.15-115, 5.15-116, 5.15-117, 5.15-119, 5.15-121, 5.15-122, 5.15-139, 5.15-159, 5.15-160, 5.15-161, 5.15-162, 5.15-163, 5.15-164, 5.15-174, 5.15-185, 5.15-186
Alaska Department of Natural Resources, ES-14, ES-15, ES-16, ES-18, 1-1, 1-7, 1-8, 1-11, 1-23, 1-32, 2-35, 5.2-3, 5.2-8, 5.2-9, 5.2-24, 5.2-31, 5.2-32, 5.2-44, 5.2-55, 5.2-57, 5.2-81, 5.2-82, 5.3-14, 5.3-29, 5.3-34, 5.4-19, 5.5-27, 5.5-28, 5.6-10, 5.6-14, 5.6-18, 5.6-28, 5.6-35, 5.6-36, 5.9-6, 5.9-7, 5.9-11, 5.9-13, 5.9-15, 5.9-22, 5.9-34, 5.9-35, 5.9-36, 5.9-42, 5.9-42, 5.9-51, 5.9-53, 5.9-54, 5.9-57, 5.9-58, 5.10-1, 5.10-2, 5.10-5, 5.10-6, 5.10-20, 5.10-21, 5.10-22, 5.10-23, 5.10-24, 5.10-25, 5.10-26, 5.10-30, 5.10-37, 5.10-38, 5.11-4, 5.11-7, 5.11-34, 5.13-1, 5.13-4, 5.13-8, 5.13-9, 5.13-11, 5.13-16, 5.13-17, 5.13-18, 5.13-25, 5.13-27, 5.13-30, 5.13-41, 5.18-3, 5.18-4, 5.18-5, 5.18-6, 5.18-12, 5.19-1, 5.19-2, 5.19-14, 5.22-2, 5.23-16, 5.23-17, 5.23-18, 6-10
Alaska Department of Transportation, 1-33, 5.15-67, 5.15-69, 5.15-96, 5.15-98, 5.15-99, 5.15-104, 5.15-159, 5.15-164, 5.15-165
Alaska Department of Transportation and Public Facilities, 1-25, 2-27, 2-28, 5.1-21, 5.3-14, 5.3-35, 5.4-20, 5.9-3, 5.9-8, 5.9-11, 5.9-27, 5.9-36, 5.9-44, 5.9-57, 5.9-58, 5.13-9, 5.13-41, 5.13-44, 5.15-3, 5.15-165, 5.22-2, 5.23-53, 5.23-54, 5.23-75
Alaska Energy Authority, 4-4 Alaska Gas Inducement Act, 6-1 Alaska Gasline Development Corporation, ES-2,
ES-3, ES-11, ES-15, ES-17, ES-20, ES-22, ES-23, 1-1, 1-3, 1-4, 1-5, 1-7, 1-8, 1-9, 1-11, 1-34, 2-1, 2-2, 2-14, 2-15, 2-16, 2-17, 2-18, 2-19, 2-20, 2-22, 2-24, 2-26, 2-27, 2-28, 2-31, 2-33, 2-34, 2-35, 2-36, 2-39, 2-40, 2-42, 2-43, 2-46, 2-54, 2-56, 2-57, 2-58, 2-59, 2-60, 2-61, 3-2, 3-7, 4-5, 4-8, 4-11, 4-13, 4-15, 4-17, 4-19, 4-21, 4-27, 5-1, 5.1-20, 5.1-21, 5.1-23, 5.1-24, 5.2-1, 5.2-11, 5.2-13, 5.2-25, 5.2-27, 5.2-30, 5.2-61, 5.2-62, 5.2-63, 5.2-64, 5.2-65, 5.2-66, 5.2-67, 5.2-70, 5.2-72, 5.2-73, 5.2-74, 5.2-75, 5.2-76, 5.2-77, 5.2-79, 5.2-80, 5.2-81, 5.2-82, 5.3-1, 5.3-20, 5.3-22, 5.3-29, 5.3-30,
5.3-31, 5.3-32, 5.3-33, 5.3-34, 5.4-1, 5.4-2, 5.4-13, 5.4-14, 5.4-15, 5.4-16, 5.4-17, 5.4-19, 5.4-20, 5.4-22, 5.4-23, 5.4-25, 5.4-27, 5.4-28, 5.4-31, 5.4-32, 5.4-33, 5.4-34, 5.5-1, 5.5-15, 5.5-27, 5.5-28, 5.5-29, 5.5-30, 5.5-33, 5.5-34, 5.5-36, 5.5-37, 5.5-38, 5.5-39, 5.5-41, 5.6-1, 5.6-2, 5.6-17, 5.6-18, 5.6-20, 5.6-21, 5.6-23, 5.6-24, 5.6-25, 5.6-26, 5.6-29, 5.6-30, 5.6-32, 5.6-33, 5.6-34, 5.6-35, 5.6-36, 5.7-7, 5.7-14, 5.7-16, 5.7-19, 5.7-22, 5.8-1, 5.8-3, 5.8-4, 5.8-5, 5.8-7, 5.8-8, 5.8-9, 5.8-11, 5.8-12, 5.8-16, 5.8-17, 5.8-18, 5.8-24, 5.8-27, 5.8-30, 5.8-32, 5.9-6, 5.9-13, 5.9-14, 5.9-15, 5.9-18, 5.9-20, 5.9-21, 5.9-25, 5.9-27, 5.9-50, 5.9-54, 5.9-56, 5.9-58, 5.10-10, 5.10-27, 5.10-28, 5.10-31, 5.10-32, 5.11-15, 5.11-21, 5.11-25, 5.11-27, 5.11-30, 5.11-31, 5.11-32, 5.11-34, 5.12-26, 5.12-27, 5.12-28, 5.12-31, 5.12-32, 5.12-33, 5.12-34, 5.12-35, 5.12-36, 5.12-37, 5.12-38, 5.12-39, 5.12-40, 5.12-42, 5.12-43, 5.12-44, 5.12-49, 5.12-51, 5.12-52, 5.13-27, 5.13-29, 5.13-32, 5.15-1, 5.15-2, 5.15-3, 5.15-79, 5.15-80, 5.15-82, 5.15-83, 5.15-88, 5.15-91, 5.15-96, 5.15-97, 5.15-98, 5.15-99, 5.15-103, 5.15-108, 5.15-111, 5.15-125, 5.15-151, 5.15-159, 5.15-165, 5.16-13, 5.16-14, 5.16-15, 5.16-16, 5.16-18, 5.16-19, 5.16-20, 5.16-21, 5.16-22, 5.16-23, 5.16-24, 5.16-25, 5.16-26, 5.16-28, 5.16-29, 5.16-31, 5.16-33, 5.16-34, 5.16-35, 5.16-36, 5.16-38, 5.17-8, 5.17-13, 5.17-14, 5.17-15, 5.18-6, 5.18-8, 5.18-9, 5.18-10, 5.18-11, 5.18-12, 5.19-2, 5.19-3, 5.19-6, 5.19-7, 5.19-12, 5.19-13, 5.19-14, 5.21-2, 5.22-1, 5.22-2, 5.22-4, 5.22-5, 5.23-1, 5.23-2, 5.23-3, 5.23-4, 5.23-5, 5.23-6, 5.23-7, 5.23-8, 5.23-9, 5.23-10, 5.23-11, 5.23-12, 5.23-13, 5.23-14, 5.23-15, 5.23-16, 5.23-17, 5.23-18, 5.23-19, 5.23-20, 5.23-21, 5.23-24, 5.23-26, 5.23-27, 5.23-29, 5.23-32, 5.23-33, 5.23-34, 5.23-35, 5.23-36, 5.23-37, 5.23-38, 5.23-39, 5.23-43, 5.23-44, 5.23-45, 5.23-46, 5.23-47, 5.23-48, 5.23-51, 5.23-52, 5.23-53, 5.23-54, 5.23-55, 5.23-56, 5.23-57, 5.23-58, 5.23-59, 5.23-60, 5.23-61, 5.23-62, 5.23-63, 5.23-64, 5.23-89, 6-2, 6-24, 6-39
Alaska Heritage Resource Survey, 5.13-1, 5.13-8, 5.13-9, 5.13-11, 5.13-15, 5.13-16, 5.13-17, 5.13-18, 5.13-25, 5.13-27, 5.13-29, 5.13-30, 5.13-31, 5.13-32, 5.13-33, 5.13-37, 5.13-38, 5.13-40, 6-13
Alaska National Interest Lands Conservation Act, 1-8, 1-10, 1-25, 5.9-2, 5.9-3, 5.9-5, 5.9-6, 5.9-40, 5.9-56, 5.10-2, 5.10-5, 5.15-108, 5.15-131, 5.15-153, 5.15-154
Alaska Native Claims Settlement Act, 1-27, 5.9-12, 5.23-57, 5.23-58, 5.23-59

Alaska Stand Alone Gas Pipeline iii Final EIS
Alaska Natural Gas Transportation System, 5.15-173
Alaska Natural Heritage Program, 5.3-7, 5.3-14, 5.3-15, 5.3-21, 5.3-32, 5.3-34
Alaska Pipeline Project, ES-7, ES-24, ES-25, 1-6, 1-34, 4-9, 4-10, 4-27, 6-1
Alaska Pollutant Discharge Elimination System, 1-9, 1-28, 1-31, 5.2-15, 5.2-17, 5.6-25, 5
Alaska Power Authority, 4-4, 5.11-3 Alaska Railroad Corporation, 1-25, 1-33, 2-24,
2-26, 2-27, 5.3-6, 5.3-21, 5.8-8, 5.9-7, 5.9-11, 5.9-58, 5.11-15, 5.13-27, ii5.15-91, 5.15-92, 5.15-94, 5.15-103, 5.15-111, 5.15-166, 5.15-167, 5.18-7, 5.18-8, 5.18-12
Alaska Regulatory Commission, 5.5-44 Alaska Stand Alone Gas Project, ES-1, ES-22,
1-1, 1-34, i2-28, 2-57, 2-60, 2-61, 3-1, 3-2, 3-3, 3-4, 3-6, 4-11, 4-17, 4-20, 4-25, ii5.2-62, 5.2-82, 5.4-34, 5.5-41, 5.6-36, 5.7-22, 5.8-3, 5.8-32, 5.9-60, 5.10-38, i5.11-6, 5.11-32, 5.11-33, 5.11-34, i5.12-29, 5.12-30, 5.12-45, 5.12-46, 5.12-47, 5.12-52, 5.13-41, 5.15-79, 5.15-80, 5.15-81, 5.15-82, 5.15-84, 5.15-86, 5.15-87, 5.15-102, 5.15-107, 5.15-113, 5.15-123, 5.15-124, 5.15-126, 5.15-129, 5.15-131, 5.15-136, 5.15-151, 5.15-152, 5.15-153, 5.15-165, 5.16-38, 5.18-12, 5.19-12, 5.19-14, 5.23-3, 5.23-37, 5.23-47, 5.23-48, 5.23-50, 5.23-51, 6-1, 6-12, 6-17
Alaska Statutes, 1-3, 1-7, 1-11, 1-30, 1-31, 1-32, 1-33, 4-20, 5.2-16, 5.6-1, 5.6-11, 5.6-20, 5.8-31, 5.9-6, 5.9-8, 5.9-9, 5.9-10, 5.9-29, 5.9-36, 5.9-37, 5.9-43, 5.9-53, 5.10-22, 5.10-25, 5.12-43, 5.12-45, 5.16-12, 5.18-3, 5.18-4, 5.18-5, 5.18-6, 5.23-2, 5.23-74, 5.23-75, 5.23-77, 5.23-78, 5.23-79, 5.23-80, 5.23-81, 5.23-87
Alaska Traditional Diet Project, 5.15-47 alignment, ES-5, ES-19, 1-16, 2-42, 4-9, 4-14, 4-
17, 5.1-8, 5.1-16, 5.1-21, 5.2-6, 5.3-14, 5.4-4, 5.4-11, 5.9-5, 5.10-28, 5.10-36, 5.11-31, 5.11-32, 5.15-48, 5.19-12, 5.19-13, 5.22-2, 5.23-5, 5.23-45, 5.23-47, 5.23-48, 5.23-49, 5.23-50, 5.23-51, 6-11
alluvial, 5.1-4, 5.1-6, 5.1-7, 5.1-8, 5.1-9, 5.1-10, 5.2-3, 5.2-23, 5.2-24, 5.2-33, 5.3-2, 5.3-3, 5.3-4, 5.3-5, 5.11-8
alluvium, 5.1-6, 5.1-7, 5.1-8, 5.1-9, 5.2-23, 5.3-4 alternative, ES-1, ES-6, ES-7, ES-8, ES-11, 1-1,
1-6, 1-7, 1-15, 1-18, 1-20, 1-23, 1-26, 2-42, 4-1, 4-2, 4-3, 4-6, 4-7, 4-9, 4-10, 4-11, 4-14, 4-17, 4-19, 4-21, 4-23, 4-24, 4-25, 4-26, 5-1, 5.1-19, 5.2-1, 5.2-11, 5.2-14, 5.2-15, 5.3-18, 5.3-28, 5.4-1, 5.4-13, 5.4-21, 5.5-9, 5.5-40, 5.6-34, 5.8-3, 5.9-5, 5.9-11, 5.9-44, 5.9-45, 5.9-47, 5.9-48, 5.9-52, 5.9-56, 5.10-1, 5.10-4, 5.10-6, 5.10-27, 5.10-36, 5.11-31, 5.12-1,
5.12-3, 5.12-21, 5.12-25, 5.12-49, 5.13-40, 5.15-6, 5.15-9, 5.15-14, 5.15-25, 5.15-79, 5.15-81, 5.15-82, 5.15-113, 5.15-123, 5.15-124, 5.15-143, 5.15-151, 5.15-158, 5.16-14, 5.16-18, 5.16-34, 5.17-6, 5.18-1, 5.18-6, 5.21-5, 5.22-1, 6-1, 6-2, 6-7, 6-8, 6-10, 6-13, 6-14, 6-21, 6-22, 6-23, 6-25, 6-36, 6-44
Ambient Air Quality Standards, 5.15-103, 5.15-104, 5.16-6
American Community Survey, 5.12-1, 5.12-10, 5.12-16, 5.12-21, 5.12-54, 5.12-55, 5.15-15, 5.15-23, 5.15-26, 5.15-28, 5.15-30, 5.15-183
American Indian or Alaska Native, 5.12-22, 5.12-24, 5.12-25, 5.12-48, 5.15-13, 5.15-17, 5.15-18, 5.15-19, 5.15-20, 5.15-21, 5.15-22, 5.15-23, 5.15-24, 5.15-35, 5.15-36, 5.15-61, 5.15-62, 5.15-71, 5.15-74, 5.15-76, 5.15-110, 5.15-155
American Indian Religious Freedom Act of 1978, 1-25, 5.13-2
American Meteorological Society, 5.13-42, 5.16-1, 5.16-38
American National Standards Institute, 2-58 American Petroleum Institute, 2-28, 5.15-126 amphidromous, 5.6-1 anadromous, ES-13, ES-16, 1-31, 5.2-19, 5.2-
21, 5.2-63, 5.6-1, 5.6-3, 5.6-7, 5.6-9, 5.6-10, 5.6-13, 5.6-20, 5.6-24, 5.6-26, 5.6-27, 5.6-29, 5.6-30, 5.6-31, 5.6-32, 5.10-29, 5.15-37, 5.23-5, 5.23-10, 5.23-74, 6-8
animals big game, 5.5-14, 5.10-3, 5.10-30, 5.21-2,
5.21-4 game birds, ES-15, 5.5-1, 5.5-2, 5.5-3, 5.5-
17, 5.21-4 non-game, 1-29, 1-31 small game, 5.5-3, 5.5-40, 5.21-4 waterfowl, 3-7, 4-13, 5.4-3, 5.4-24, 5.5-2, 5.5-
3, 5.5-10, 5.5-11, 5.5-17, 5.5-18, 5.5-26, 5.5-31, 5.5-32, 5.5-33, 5.5-38, 5.5-44, 5.5-45, 5.8-35, 5.8-38, 5.9-3, 5.10-3, 5.10-5, 5.10-8, 5.10-20, 5.10-21, 5.10-24, 5.10-25, 5.10-26, 5.10-30, 5.15-18, 5.18-5, 5.21-2, 5.21-4
anode, 2-50, 5.19-8 anthropogenic, 5.3-21, 5.5-38, 5.5-44, 5.7-12,
5.7-20, 5.8-13, 5.8-15, 5.8-16, 5.15-150, 5.16-1
aquatic, ES-25, 1-6, 2-39, 2-40, 5.2-15, 5.2-16, 5.2-18, 5.2-19, 5.2-20, 5.2-21, 5.2-22, 5.2-23, 5.2-79, 5.4-3, 5.4-17, 5.4-24, 5.5-7, 5.5-24, 5.6-18, 5.6-19, 5.6-23, 5.6-24, 5.6-25, 5.6-26, 5.6-34, 5.6-35, 5.7-16, 5.8-17, 5.8-21, 5.9-7, 5.15-106, 5.18-5, 5.18-8, 5.18-9, 5.18-11, 5.23-14, 5.23-19, 5.23-20, 5.23-22, 5.23-39, 5.23-42, 6-28, 6-29

Alaska Stand Alone Gas Pipeline iv Final EIS
aquifer, 5.2-7, 5.2-8, 5.2-14 Archeological Resources Protection Act, 1-32 Arctic National Wildlife Refuge, 5.9-5, 5.9-6, 5.9-
33, 5.9-34, 5.10-5, 5.10-19, 5.10-28, 5.10-34, 5.11-7
Arctic Slope Regional Corporation Energy Services, 2-15, 2-61, 5.4-1, 5.4-4, 5.4-11, 5.4-12, 5.4-14, 5.4-15, 5.4-16, 5.4-22, 5.4-23, 5.4-27, 5.4-28, 5.4-32, 5.4-33, 5.4-34, 5.9-20, 5.9-21, 5.9-58, 5.13-1, 5.13-35, 5.13-41
Arctic Small Tool tradition, 5.13-5 Area of Critical Environmental Concern, 5.3-15,
5.3-35, 5.5-30, 5.5-31, 5.5-32, 5.5-33, 5.5-34, 5.9-32, 5.9-40
Area of Potential Effect, 5.13-1, 5.13-2, 5.13-28, 5.13-29
area of potential effects, 5.13-1, 5.13-2, 5.13-27, 5.13-28, 5.13-29, 5.22-4
Areas where water flows from the stream bed up into the water column, 5.6-7, 5.6-20, 5.6-35
artifact, 5.15-70, 5.15-137, 5.15-143 Atlantic Richfield Company, 5.8-32, 5.13-8, 5.13-
11, 5.13-46 avoidance, ES-26, 2-34, 5.2-16, 5.4-1, 5.5-39,
5.7-15, 5.8-7, 5.8-10, 5.8-13, 5.8-33, 5.12-49, 5.21-4, 5.23-29, 5.23-30, 5.23-32, 5.23-33, 5.23-35, 5.23-36, 5.23-55, 5.23-56, 5.23-59, 6-7, 6-34, 6-35, 6-40, 6-41
B
backfill, 2-31, 2-34, 2-35, 2-39, 2-40, 2-43, 2-46, 2-48, 2-54, 5.3-23, 5.4-19, 5.4-20, 5.6-21, 5.6-23, 5.6-34, 5.11-13, 5.15-2, 5.15-126, 5.22-2, 5.23-14, 5.23-20, 5.23-27, 5.23-28, 6-30, 6-31, 6-35
Bald and Golden Eagle Protection Act, 5.5-1, 5.5-34, 5.8-1, 5.23-26
ballast, 5.6-19, 5.7-16, 5.18-5, 5.18-8, 6-28, 6-29 barrel, 23, 1-31, 5.12-43, 5.12-46, 5.15-147,
5.19-8, 5.19-13 baseline, 5.2-22, 5.8-6, 5.11-30, 5.12-1, 5.12-3,
5.13-1, 5.15-6, 5.15-9, 5.15-25, 5.16-11 bedrock, ES-11, 2-33, 2-43, 5.1-1, 5.1-4, 5.1-8,
5.1-9, 5.1-13, 5.1-14, 5.1-17, 5.1-20, 5.2-23, 5.2-31, 5.3-4, 5.3-22, 6-25, 6-26, 6-29, 6-46, 6-47, 6-48, 6-49, 6-50, 6-51
Behavioral Risk Factor Surveillance System, 5.15-33, 5.15-56, 5.15-162, 5.15-168
benthic, 5.6-24, 5.6-34, 5.7-8, 5.8-5, 5.8-11, 5.8-21
Best Available Control Technology, 5.16-26, 5.16-28, 5.16-29, 5.16-31, 5.23-61, 5.23-62
Best Available Retrofit Technology, 5.16-10
biodiversity, 5.4-25, 5.4-30, 5.5-25, 5.5-43, 5.18-8, 6-28
Biological Assessment, 5.5-42, 5.7-7, 5.7-22, 5.8-1, 5.8-2, 5.8-3, 5.8-32, 5.8-36
biota, 5.6-18, 5.6-25 Birnirk period, 5.13-5 blasting, ES-22, 1-30, 2-33, 2-34, 2-39, 5.1-20,
5.3-22, 5.4-17, 5.6-23, 5.6-24, 5.6-35, 5.12-48, 5.15-85, 5.15-126, 5.16-20, 5.16-21, 5.17-7, 5.23-27, 5.23-28, 5.23-29, 5.23-32, 5.23-33, 5.23-35, 5.23-38, 5.23-58, 5.23-63, 6-17, 6-26, 6-29, 6-30, 6-33, 6-35, 6-46, 6-47, 6-48, 6-49, 6-50, 6-51
blowdown, 2-18, 5.16-25, 5.16-27, 5.16-29, 5.16-30, 5.17-13
borrow site, 2-57, 5.22-2 British Thermal Unit, 5.15-139, 5.15-147, 5.15-
151, 5.15-152 broadband, 5.7-19 Bureau of Indian Affairs, 5.9-12 Bureau of Land Management, ES-1, ES-5, ES-
18, ES-19, 1-1, 1-7, 1-8, 1-9, 1-16, 1-20, 1-21, 1-23, 1-27, 2-22, 2-35, 2-36, 2-61, 4-25, 5.1-4, 5.1-7, 5.1-19, 5.1-25, 5.1-26, 5.1-27, 5.2-3, 5.2-33, 5.2-48, 5.2-82, 5.2-83, 5.3-1, 5.3-2, 5.3-5, 5.3-15, 5.3-16, 5.3-17, 5.3-18, 5.3-29, 5.3-34, 5.3-35, 5.3-36, 5.4-19, 1, 5.5-24, 5.5-26, 5.5-27, 5.5-28, 5.5-30, 5.5-34, 5.5-42, 5.5-48, 5.6-2, 5.6-3, 5.6-7, 5.6-8, 5.6-9, 5.6-27, 5.6-28, 5.6-34, 5.6-36, 5.6-39, 5.6-40, 5.8-2, 5.9-1, 5.9-2, 5.9-4, 5.9-5, 5.9-11, 5.9-14, 5.9-24, 5.9-30, 5.9-31, 5.9-32, 5.9-33, 5.9-40, 5.9-54, 5.9-59, 5.9-60, 5.10-1, 5.10-4, 5.10-11, 5.10-13, 5.10-15, 5.10-17, 5.10-18, 5.10-20, 5.10-25, 5.10-27, 5.10-28, 5.10-38, 5.10-39, 5.11-1, 5.11-2, 5.11-3, 5.11-9, 5.11-11, 5.11-14, 5.11-19, 5.11-21, 5.11-24, 5.11-34, 5.11-35, 5.11-36, 5.13-2, 5.13-9, 5.13-23, 5.13-32, 5.13-42, 5.13-49, 5.13-50, 5.15-17, 5.15-69, 5.15-108, 5.15-116, 5.15-117, 5.15-154, 5.15-167, 5.15-183, 5.18-3, 5.18-12, 5.23-16, 5.23-45, 5.23-66, 5.23-68, 5.23-69, 6-10
Bureau of Ocean Energy Management, 5.8-24, 5.8-27
Bureau of Reclamation, 1-32, 2-27, 5.1-22, 5.11-31, 5.15-3, 5.22-2, 5.22-3, 5.23-11, 5.23-41
C
Canadian Association of Petroleum Producers, 5.5-44
Canadian Wildlife Service, 5.2-6 Carbon Capture and Sequestration, 4-5
Alaska Stand Alone Gas Pipeline v Final EIS
carbon dioxide, 2-15, 2-17, 3-2, 5.4-24, 5.16-5, 5.16-16, 5.16-17, 5.16-22, 5.16-24, 5.16-25, 5.16-27, 5.16-28, 5.16-29, 5.16-30, 5.16-32, 5.16-33, 5.16-34, 5.16-35, 5.16-39, 5.23-60, 6-16
cathodic protection, 2-50, 2-54, 2-58, 2-60, 5.19-8, 5.23-9
Census Area, 5.3-35, 5.5-5, 5.12-1, 5.12-3, 5.12-4, 5.12-5, 5.12-6, 5.12-15, 5.12-17, 5.12-18, 5.12-21, 5.12-22, 5.12-25, 5.12-31, 5.12-45, 5.12-48, 5.15-5, 5.15-48, 5.15-50, 5.15-51, 5.15-52, 5.15-53, 5.15-59, 5.15-62, 5.15-142
Census Tract, 5.12-18, 5.12-19, 5.12-21, 5.12-22, 5.12-25, 5.12-48, 5.12-50, 5.13-45
Census-Designated Place, 5.9-8, 5.11-6 Central Gas Facility, ES-3, 2-1, 3-1, 3-2, 3-3, 3-
4, 4-7, 5.5-37 centrifugal compressors, 2-16, 5.15-8, 5.17-11 Chugach Electric Association, 4-3 clay, 2-40, 5.1-6, 5.1-7, 5.1-14, 5.2-3, 5.2-8, 5.2-
66 Clean Air Act, 1-9, 1-28, 1-30, 5.15-104, 5.15-
152, 5.15-153, 5.15-185, 5.16-7, 5.16-8, 5.16-10, 5.16-11, 5.16-12, 5.16-16, 5.16-17, 5.16-18, 5.16-33, 5.16-36, 5.23-65, 5.23-69, 5.23-70
Clean Air Act Amendments, 5.16-10, 5.16-13, 5.16-14
Clean Water Act, 1-1, 1-6, 1-7, 1-9, 1-27, 1-28, 1-30, 1-31, 4-24, 5.2-15, 5.2-16, 5.2-17, 5.2-22, 5.2-27, 5.2-40, 5.2-54, 5.4-1, 5.4-35, 5.18-2, 5.18-3, 5.18-4, 5.23-19, 5.23-20, 5.23-65, 5.23-69, 5.23-70, 5.23-83
cleanup, ES-23, 2-19, 2-35, 2-43, 2-50, 5.2-11, 5.3-23, 5.4-25, 5.15-84, 5.15-86, 5.19-13, 5.21-3, 5.22-3
clearing, ES-13, ES-14, ES-19, 2-31, 2-36, 2-48, 2-50, 2-54, 2-57, 5.2-63, 5.3-22, 5.3-25, 5.3-29, 5.4-17, 5.4-21, 5.5-1, 5.5-27, 5.5-29, 5.5-37, 5.5-48, 5.6-34, 5.9-53, 5.11-12, 5.11-14, 5.11-32, 5.12-39, 5.15-2, 5.15-85, 5.16-21, 5.21-4, 5.21-5, 5.23-16, 5.23-26, 5.23-32, 5.23-33, 5.23-48, 6-5, 6-6, 6-11, 6-30, 6-35, 6-46, 6-47, 6-48, 6-49, 6-50, 6-51
climate, ES-22, ES-26, 5.1-1, 5.1-13, 5.3-1, 5.3-2, 5.3-3, 5.3-4, 5.3-5, 5.4-24, 5.4-25, 5.4-34, 5.8-5, 5.8-6, 5.8-7, 5.8-11, 5.8-13, 5.8-15, 5.8-17, 5.8-18, 5.8-28, 5.8-33, 5.10-19, 5.13-4, 5.13-5, 5.13-12, 5.13-20, 5.15-7, 5.15-11, 5.15-139, 5.15-177, 5.16-1, 5.16-4, 5.16-5, 5.16-16, 5.16-17, 5.16-38, 5.23-49
climate change, ES-22, ES-26, 5.1-13, 5.2-83, 5.4-24, 5.4-25, 5.4-34, 5.4-35, 5.6-38, 5.8-6, 5.8-7, 5.8-11, 5.8-13, 5.8-15, 5.8-17, 5.8-18, 5.8-28, 5.15-7, 5.15-11, 5.15-182, 5.16-1,
5.16-4, 5.16-5, 5.16-16, 5.16-17, 5.16-38, 5.16-39
Coal to Liquids, ES-24, 4-5 Code of Federal Regulations, ES-22, 1-6, 1-8, 1-
9, 1-10, 1-11, 1-25, 1-27, 1-29, 1-32, 2-18, 2-28, 2-33, 2-35, 2-58, 2-59, 4-25, 4-26, 5.4-1, 5.8-35, 5.9-1, 5.9-22, 5.9-40, 5.10-1, 5.10-2, 5.13-1, 5.13-2, 5.13-27, 5.15-88, 5.15-105, 5.15-126, 5.15-134, 5.16-11, 5.16-12, 5.16-13, 5.16-14, 5.16-15, 5.16-16, 5.16-18, 5.16-21, 5.16-22, 5.16-24, 5.16-26, 5.16-27, 5.16-28, 5.16-30, 5.16-32, 5.16-33, 5.16-34, 5.16-35, 5.18-1, 5.18-2, 5.18-11, 5.19-2, 5.19-6, 5.19-7, 5.19-12, 5.19-13, 5.23-8, 5.23-19, 5.23-34, 5.23-61, 5.23-62, 5.23-65, 5.23-66, 5.23-67, 5.23-68, 5.23-69, 5.23-70, 5.23-71, 5.23-72, 5.23-73, 5.23-79, 5.23-82, 5.23-83, 6-18
colluvium, 5.1-8, 5.1-9, 5.3-4 commercial construction, ES-3, ES-13, ES-19,
ES-24, 1-4, 1-5, 2-59, 4-3, 4-19, 5.1-24, 5.2-4, 5.2-8, 5.2-11, 5.2-80, 5.6-6, 5.6-7, 5.6-10, 5.6-12, 5.6-13, 5.6-14, 5.7-15, 5.7-16, 5.7-19, 5.8-6, 5.8-7, 5.8-9, 5.8-10, 5.8-11, 5.8-18, 5.8-21, 5.8-24, 5.8-28, 5.9-12, 5.9-13, 5.9-32, 5.9-34, 5.9-41, 5.9-43, 5.9-43, 5.9-50, 5.9-53, 5.9-55, 5.9-56, 5.10-19, 5.10-22, 5.10-37, 5.11-7, 5.11-8, 5.11-13, 5.11-14, 5.11-15, 5.12-18, 5.12-31, 5.12-38, 5.13-6, 5.13-7, 5.13-8, 5.15-97, 5.15-98, 5.15-139, 5.15-140, 5.15-149, 5.15-151, 5.16-5, 5.16-13, 5.16-14, 5.18-3, 5.18-5, 5.18-6, 5.18-8, 5.21-2, 5.22-3, 5.23-84, 6-10
Community Information Summaries, 5.15-15, 5.15-159
compensatory mitigation, 5.2-16, 19, 20, 5.23-21 Compliance Assurance Monitoring, 5.16-8, 5.16-
15, 5.16-16 Comprehensive Conservation Plan, 5.9-34, 5.9-
61, 5.10-5 Comprehensive Environmental Response
Compensation and Liability Act, 5.2-11, 5.16-36
Comprehensive Waste Management Plan, 2-26, 5.2-73, 5.2-79, 5.15-88, 5.15-105, 5.15-125, 5.15-129
compressor station, ES-7, ES-11, ES-20, ES-22, 1-3, 2-1, 2-2, 2-14, 2-15, 2-16, 2-17, 2-18, 2-19, 2-22, 2-48, 2-50, 2-54, 2-58, 2-59, 2-61, 4-8, 4-11, 4-21, 5.1-19, 5.2-63, 5.2-72, 5.2-73, 5.2-74, 5.2-75, 5.3-28, 5.4-25, 5.4-26, 5.4-29, 5.5-39, 5.9-20, 5.10-32, 5.10-33, 5.11-12, 5.11-23, 5.11-25, 5.11-26, 5.11-27, 5.12-34, 5.12-35, 5.12-36, 5.12-37, 5.13-35, 5.15-7, 5.15-8, 5.15-107, 5.15-129, 5.15-138, 5.16-9, 5.16-12, 5.16-14, 5.16-24, 5.16-25, 5.16-27,

Alaska Stand Alone Gas Pipeline vi Final EIS
5.16-28, 5.16-32, 5.17-10, 5.17-11, 5.22-2, 5.22-3, 5.23-8, 5.23-14, 5.23-22, 5.23-48, 5.23-61, 5.23-63, 5.23-66, 6-1, 6-11, 6-12, 6-16, 6-17, 6-19, 6-40
conclusion, 5.15-121, 5.15-131, 5.15-138, 5.15-154, 5.16-4
conclusions, ES-1, 4-6, 4-23, 5.8-3, 5.15-10, 5.15-106, 5.15-109, 5.15-131, 5.21-6, 6-1
Conditions imposed by PHMSA, 5.9-10 connected actions, ES-1, ES-3, ES-23, ES-24,
ES-25, 3-1, 3-2, 5.20-1, 6-1 Conservation System Unit, 1-10, 1-25, 5.9-3,
5.9-5, 5.9-40, 5.9-41 construction
schedule, 5.5-30, 5.6-20, 5.15-158, 5.16-21, 5.16-23, 5.16-35, 5.16-36, 5.23-22, 5.23-26, 5.23-36, 5.23-46, 5.23-52, 5.23-53, 5.23-57, 5.23-59, 5.23-64
workforce, ES-19, ES-20, ES-21, 5.10-29, 5.10-32, 5.10-34, 5.10-35, 5.12-46, 5.15-1, 5.15-5, 5.15-7, 5.15-80, 5.15-85, 5.15-101, 5.15-102, 5.15-112, 5.15-113, 5.15-114, 5.15-168, 5.15-182, 54, 6-14, 6-40, 6-41
construction camps, 1-3, 2-19, 2-24, 2-26, 2-54, 2-57, 5.2-75, 5.2-76, 5.4-25, 5.5-40, 5.9-14, 5.10-35, 5.10-36, 5.11-30, 5.12-39, 5.13-3, 5.13-39, 5.15-3, 5.15-7, 5.15-87, 5.15-101, 5.15-108, 5.15-111, 5.15-125, 5.16-9, 5.16-12, 5.16-14, 5.16-24, 5.16-25, 5.16-33, 6-37, 6-38, 6-41
construction impacts, ES-8, 4-11, 5.2-63, 5.2-68, 5.2-69, 5.2-79, 5.2-80, 5.8-8, 5.15-82, 5.15-83, 5.15-106, 5.15-124, 5.15-130, 5.15-131, 5.15-132, 5.21-3, 6-37, 6-40, 6-41, 6-48
Construction Phase, 5.7-14, 5.11-18, 5.11-19, 5.11-33
contingency plans, 2-42, 5.2-11, 5.23-34, 5.23-35
contractor yards, 2-15 Cook Inlet Natural Gas Liquid Extraction Plant,
2-1, 5.9-38, 5.15-15, 5.18-11 Cooperating Agencies, ES-1, 1-1, 1-7, 1-8, 1-12,
1-23, 1-25, 4-25, 5.13-2 corrosion, 2-28, 2-34, 2-50, 2-54, 2-58, 2-59, 2-
60, 5.2-20, 5.15-135, 5.19-2, 5.19-8, 5.23-9, 6-28
Council on Environmental Quality, 1-6, 1-9, 1-10, 1-26, 4-1, 4-28, 5.12-3, 5.12-18, 5.12-21, 5.12-52, 5.22-1, 1, 89
critical habitat, ES-18, 1-29, 1-30, 3-5, 5.4-3, 5.8-1, 5.8-2, 5.8-4, 5.8-5, 5.8-6, 5.8-7, 5.8-8, 5.8-9, 5.8-11, 5.8-12, 5.8-13, 5.8-15, 5.8-16, 5.8-17, 5.8-19, 5.8-20, 5.8-21, 5.8-24, 5.23-75, 6-9
crossings pipeline, 5.9-42, 5.18-2, 5.23-6
railroad, ES-23, 2-22, 2-33, 2-60, 5.4-11, 5.9-51, 5.9-56, 5.11-8, 5.11-23, 5.19-3, 5.19-12, 6-10
river, ES-23, 4-11, 4-19, 5.2-80, 5.6-25, 5.18-9, 5.19-12, 5.23-4, 5.23-8
road, ES-23, 2-22, 5.4-11, 5.6-19, 5.9-51, 5.19-12
stream, ES-16, ES-17, ES-22, 3-4, 4-20, 4-21, 5.2-61, 5.2-63, 5.2-65, 5.2-66, 5.2-67, 5.2-69, 5.2-73, 5.2-80, 5.6-3, 5.6-9, 5.6-10, 5.6-13, 5.6-19, 5.6-21, 5.6-26, 5.6-27, 5.6-29, 5.6-30, 5.6-31, 5.6-32, 5.12-48, 5.13-28, 5.15-131, 5.18-6, 5.18-9, 5.18-10, 5.18-11, 5.23-5, 5.23-24, 5.23-36, 5.23-37, 5.23-39, 5.23-40, 5.23-41, 5.23-64, 6-5, 6-8, 6-18, 6-23, 6-38, 6-41, 6-44, 6-45
utility, ES-18, 5.9-39, 5.9-51, 5.23-41, 6-10 waterbody, 2-22, 2-40, 5.2-63, 5.2-71, 5.2-72,
5.2-74, 5.2-76, 5.4-11, 5.6-24, 5.11-21, 5.11-23, 5.23-38
wetland, 2-22, 5.4-11, 5.4-31 Crude Oil, ES-5.12-55, 5.15-184 cumulative effects, ES-1, ES-23, ES-24, ES-25,
ES-26, 5.15-7, 5.15-11, 5.15-82, 5.15-83, 5.15-101, 5.15-109, 5.15-124, 5.15-129, 5.15-132, 5.15-136, 5.15-138, 5.15-154, 5.15-155, 5.20-1, 5.20-2, 5.20-3, 5.20-4, 5.20-5, 5.20-6, 5.20-7, 5.20-10, 5.20-18, 5.20-21, 5.20-25, 5.20-26, 5.20-28, 5.20-34, 5.20-35, 5.20-36, 5.20-37, 5.20-38, 5.20-39, 5.20-40, 5.20-41, 5.20-42, 5.20-44, 5.20-49, 5.20-50, 5.20-51, 5.20-52, 5.20-53, 5.20-54, 5.23-41, 6-2, 6-21, 6-42
cumulative impacts, ES-11, 1-18, 4-8, 5-1, 5.9-28, 5.15-154, 5.15-158, 6-1
D
decibel, ES-22, 3-6, 5.7-15, 5.15-8, 5.17-1, 5.17-2, 5.17-3, 5.17-4, 5.17-7, 5.17-8, 5.17-9, 5.17-10, 5.17-11, 5.17-12, 5.17-13, 5.17-14, 5.17-15, 5.23-63, 6-17
decommissioning, 5.15-150 degree day, 5.15-142 Demand-Side Management and Energy
Efficiency, 4-6 Denali - The Alaska Gas Pipeline, LLC, ES-8,
ES-11, ES-12, ES-18, ES-19, ES-20, 1-10, 1-17, 1-20, 1-21, 1-25, 1-34, 2-2, 4-17, 4-18, 4-19, 4-20, 4-23, 4-24, 4-25, 4-28, 5.1-3, 5.1-10, 5.1-16, 5.1-24, 5.2-1, 5.2-4, 5.2-8, 5.2-36, 5.2-38, 5.2-45, 5.2-48, 5.2-70, 5.2-80, 5.2-82, 5.3-1, 5.3-2, 5.3-6, 5.3-7, 5.3-14, 5.3-15, 5.3-20, 5.3-24, 5.3-25, 5.3-27, 5.3-28, 5.3-32, 5.3-33, 5.3-35, 5.3-36, 5.4-1, 5.4-2, 5.4-4, 5.4-11,

Alaska Stand Alone Gas Pipeline vii Final EIS
5.4-12, 5.4-14, 5.4-15, 5.4-22, 5.4-23, 5.4-33, 1, 5.5-1, 5.5-15, 5.5-33, 5.5-36, 5.5-40, 5.6-1, 5.6-3, 5.6-32, 5.6-33, 5.7-21, 5.8-1, 5.8-3, 5.8-4, 5.9-1, 5.9-2, 5.9-3, 5.9-5, 5.9-6, 5.9-9, 5.9-11, 5.9-13, 5.9-15, 5.9-16, 5.9-17, 5.9-18, 5.9-19, 5.9-20, 5.9-21, 5.9-23, 5.9-24, 5.9-25, 5.9-26, 5.9-27, 5.9-28, 5.9-29, 5.9-33, 5.9-34, 5.9-36, 5.9-38, 5.9-39, 5.9-40, 5.9-44, 5.9-48, 5.9-49, 5.9-51, 5.9-54, 5.9-56, 5.9-57, 5.9-58, 5.9-59, 5.9-60, 5.10-2, 5.10-5, 5.10-6, 5.10-8, 5.10-11, 5.10-19, 5.10-21, 5.10-22, 5.10-28, 5.10-30, 5.10-31, 5.10-34, 5.10-35, 5.10-36, 5.10-37, 5.10-38, 5.10-39, 5.11-3, 5.11-4, 5.11-6, 5.11-9, 5.11-10, 5.11-14, 5.11-15, 5.11-16, 5.11-20, 5.11-25, 5.11-28, 5.11-30, 5.11-31, 5.11-32, 5.11-33, 5.11-34, 5.11-35, 5.12-1, 5.12-4, 5.12-5, 5.12-6, 5.12-7, 5.12-8, 5.12-9, 5.12-10, 5.12-11, 5.12-12, 5.12-13, 5.12-16, 5.12-17, 5.12-19, 5.12-20, 5.12-21, 5.12-23, 5.12-25, 5.12-27, 5.12-28, 5.12-30, 5.12-40, 5.12-42, 5.12-45, 5.12-46, 5.12-47, 5.12-49, 5.12-50, 5.12-51, 5.12-56, 5.13-12, 5.13-15, 5.13-16, 5.13-25, 5.13-30, 5.13-40, 5.13-41, 5.15-1, 5.15-4, 5.15-14, 5.15-20, 5.15-21, 5.15-22, 5.15-30, 5.15-34, 5.15-35, 5.15-48, 5.15-58, 5.15-59, 5.15-62, 5.15-65, 5.15-69, 5.15-73, 5.15-74, 5.15-76, 5.15-156, 5.15-158, 5.16-8, 5.16-9, 5.16-10, 5.16-11, 5.16-18, 5.16-23, 5.16-34, 5.16-35, 5.17-4, 5.17-6, 5.17-15, 5.17-16, 5.18-6, 5.18-11, 5.19-3, 5.19-6, 5.21-1, 5.22-1, 5.22-4, 5.22-5, 5.23-88, 6-1, 6-2, 6-3, 6-5, 6-6, 6-10, 6-11, 6-12, 6-13, 6-14, 6-17, 6-19, 6-21, 6-22, 6-23, 6-25, 6-37, 6-38, 6-39, 6-41, 6-42, 6-44, 6-45
Denali Borough, 1-34, 5.9-9, 5.9-10, 5.9-29, 5.9-38, 5.9-56, 5.9-59
Department of Labor & Workforce Development, 5.12-5, 5.12-6, 5.12-7, 5.12-10, 5.12-12, 5.12-16, 5.12-29, 5.12-51, 5.12-52, 5.12-53, 5.12-56, 5.15-32, 5.15-33, 5.15-164, 5.15-171
direct impacts, ES-26, 2-40, 5.4-28, 5.6-23, 5.6-24, 5.6-30
discharge, ES-13, 1-6, 1-7, 1-9, 1-27, 1-28, 2-35, 2-57, 4-26, 5.1-4, 5.1-6, 5.1-10, 5.1-17, 5.2-3, 5.2-15, 5.2-16, 5.2-33, 5.2-63, 5.2-76, 5.2-79, 5.4-1, 5.4-3, 5.6-19, 5.6-25, 5.6-26, 5.15-60, 5.18-2, 5.18-3, 5.18-8, 5.23-6, 5.23-7, 5.23-11, 5.23-17, 5.23-19, 5.23-42, 5.23-65, 5.23-83, 5.23-84, 5.23-87, 6-28, 6-29
Distant Early Warning, 5.13-7 Division of Homeland Security & Emergency
Management, 1-33 dust, ES-15, ES-19, 2-56, 5.2-76, 5.3-23, 5.3-29,
5.3-31, 5.3-33, 5.4-17, 5.4-19, 5.4-28, 5.4-29, 5.4-30, 5.5-35, 5.6-32, 5.9-55, 5.10-30, 5.11-26, 5.11-28, 5.11-29, 5.11-31, 5.12-36, 5.12-
48, 5.15-56, 5.15-103, 5.15-104, 5.16-21, 5.16-22, 5.16-23, 5.16-24, 5.16-35, 5.21-2, 5.21-3, 5.21-5, 5.22-3, 5.23-12, 5.23-16, 5.23-17, 5.23-23, 5.23-32, 5.23-43, 5.23-61, 6-10, 6-19, 6-30, 6-31, 6-32, 6-33, 6-35, 6-40
E
easement, ES-14, ES-19, 2-19, 2-24, 2-31, 2-54, 4-14, 5.3-20, 5.3-25, 5.4-13, 5.4-14, 5.4-15, 5.4-25, 5.5-36, 5.9-11, 5.9-18, 5.9-22, 5.9-24, 5.9-25, 5.9-27, 5.9-43, 5.9-50, 5.9-50, 5.9-52, 5.9-54, 5.9-56, 5.9-58, 5.10-2, 5.10-3, 5.10-29, 5.12-28, 5.12-33, 5.18-5
echolocation, 5.7-11, 5.7-16 ecology, 5.3-36, 5.7-9, 5.8-37 Emergency Response Plan, 5.15-134 Endangered Species Act, ES-15, ES-17, ES-18,
1-29, 1-30, 3-4, 5.3-14, 5.3-32, 5.5-1, 5.5-24, 5.5-26, 5.6-19, 5.7-1, 5.7-7, 5.7-12, 5.8-1, 5.8-2, 5.8-1, 5.8-2, 5.8-3, 5.8-4, 5.8-7, 5.8-11, 5.8-19, 5.8-31, 5.8-36, 5.21-4, 5.23-65, 5.23-66, 5.23-67, 5.23-68, 5.23-69, 5.23-70, 5.23-71, 5.23-73, 6-9
Energy Information Administration, 5.12-43, 5.12-55, 5.15-124, 5.15-147, 5.15-171, 5.15-184, 5.16-5
ENSTAR Natural Gas Company, ES-3, ES-24, 2-1, 2-15, 2-17, 2-18, 4-2, 4-11, 4-17, 4-19, 4-28, 5.2-80, 5.2-82, 5.15-151, 5.15-172
entrainment, 2-40, 5.6-19, 5.6-39, 6-32 environment, ES-6, ES-17, ES-18, ES-23, 1-7,
1-26, 1-27, 1-28, 1-29, 1-31, 2-18, 2-39, 4-1, 5-1, 5.1-23, 5.2-11, 5.2-16, 5.4-30, 5.5-6, 5.6-2, 5.6-24, 5.6-30, 5.6-33, 5.7-1, 5.7-14, 5.7-16, 5.7-21, 5.8-3, 5.8-4, 5.8-15, 5.8-25, 5.9-40, 5.9-47, 5.10-1, 5.10-30, 5.11-1, 5.11-3, 5.11-8, 5.11-14, 5.11-26, 5.11-28, 5.11-29, 5.11-30, 5.11-31, 5.11-32, 5.12-18, 5.13-1, 5.13-4, 5.13-8, 5.13-11, 5.13-14, 5.13-16, 5.13-21, 5.13-22, 5.13-30, 5.13-32, 5.13-33, 5.13-40, 5.15-25, 5.15-72, 5.15-80, 5.15-84, 5.15-87, 5.15-126, 5.15-138, 5.15-179, 5.17-1, 5.18-8, 5.19-1, 5.21-1, 5.22-1, 5.23-1, 5.23-39, 5.23-44, 5.23-69, 6-4, 6-21
Environmental Impact Assessment, 5.15-124, 5.15-147, 5.15-171, 5.15-172, 5.15-174, 5.15-186, 5.16-5
Environmental Impact Statement, ES-1, ES-2, ES-5, ES-6, 1-1, 1-6, 1-7, 1-8, 1-9, 1-10, 1-11, 1-12, 1-13, 1-14, 1-15, 1-16, 1-17, 1-18, 1-20, 1-21, 1-22, 1-23, 1-24, 1-25, 1-26, 1-28, 2-1, 2-28, 2-61, 3-2, 4-1, 4-2, 4-21, 4-25, 4-26, 4-28, 5.1-24, 5.2-83, 5.3-36, 5.6-39, 5.8-35, 5.9-32, 5.9-40, 5.9-60, 5.9-61, 5.10-1, 5.10-20,

Alaska Stand Alone Gas Pipeline viii Final EIS
5.10-38, 5.10-39, 5.11-2, 5.11-3, 5.11-35, 5.11-36, 5.12-48, 5.12-49, 5.12-53, 5.13-1, 5.13-50, 5.15-1, 5.15-3, 5.15-4, 5.15-5, 5.15-6, 5.15-7, 5.15-9, 5.15-102, 5.15-113, 5.15-116, 5.15-117, 5.15-121, 5.15-138, 5.15-154, 5.15-154, 5.15-157, 5.15-158, 5.15-166, 5.15-178, 5.15-183, 5.15-185, 5.19-8, 5.23-4, 6-1, 6-21, 6-23
environmental justice, ES-20, 1-18, 1-26, 5.12-1, 5.12-3, 5.12-18, 5.12-25, 5.12-26, 5.12-48, 5.12-49, 5.12-52, 5.15-7, 5.23-65, 5.23-66, 5.23-68, 5.23-69, 5.23-70, 5.23-72, 6-12, 6-13, 6-39, 6-41
Environmental Protection Agency, ES-1, 1-1, 1-7, 1-8, 1-9, 1-10, 1-23, 1-26, 1-27, 1-28, 1-29, 1-31, 2-19, 2-57, 4-1, 4-15, 4-17, 5.2-1, 5.2-5, 5.2-7, 5.2-9, 5.2-13, 5.2-14, 5.2-15, 5.2-17, 5.2-22, 5.2-26, 5.2-31, 5.2-38, 5.2-46, 5.2-51, 5.2-54, 5.2-58, 5.2-82, 5.2-83, 5.4-1, 5.4-29, 5.4-34, 5.4-35, 5.8-1, 5.12-18, 5.12-53, 5.12-56, 5.15-1, 5.15-7, 5.15-103, 5.15-104, 5.15-107, 5.15-116, 5.15-139, 5.15-144, 5.15-147, 5.15-148, 5.15-150, 5.15-152, 5.15-153, 5.15-171, 5.15-172, 5.15-179, 5.15-184, 5.15-185, 5.16-1, 5.16-5, 5.16-6, 5.16-7, 5.16-8, 5.16-9, 5.16-10, 5.16-12, 5.16-14, 5.16-15, 5.16-16, 5.16-17, 5.16-18, 5.16-22, 5.16-24, 5.16-27, 5.16-28, 5.16-30, 5.16-32, 5.16-34, 5.16-35, 5.16-38, 5.16-39, 5.17-1, 5.17-2, 5.17-4, 5.17-16, 5.17-17, 5.18-2, 5.18-3, 5.18-12, 5.18-13, 5.21-1, 5.22-1, 5.23-7, 5.23-17, 5.23-20, 5.23-34, 5.23-61, 5.23-62, 5.23-89
Environmental Systems Research Institute, 5.8-38, 5.10-10, 5.17-4, 5.17-5, 5.17-6, 5.17-16
environmentally sensitive area, 2-33, 4-24, 5.6-24
eolian, 5.1-4, 5.1-7, 5.1-8, 5.1-9, 5.3-2, 5.3-5 ephemeral stream, 5.6-21 epidemic, 5.13-22 erosion, ES-14, ES-17, ES-21, ES-25, 2-28, 2-
33, 2-34, 2-35, 2-39, 2-43, 2-59, 5.1-5, 5.1-18, 5.1-20, 5.1-22, 5.1-23, 5.1-24, 5.2-11, 5.2-33, 5.2-63, 5.2-65, 5.2-66, 5.2-67, 5.2-68, 5.2-71, 5.2-72, 5.2-73, 5.2-74, 5.2-75, 5.2-76, 5.2-77, 5.2-80, 5.3-19, 5.3-23, 5.3-24, 5.3-25, 5.3-37, 5.4-2, 5.4-16, 5.4-17, 5.4-20, 5.4-29, 5.5-27, 5.5-35, 5.6-21, 5.6-23, 5.6-26, 5.6-28, 5.6-29, 5.6-33, 5.6-34, 5.11-7, 5.12-40, 5.13-28, 5.13-38, 5.15-130, 5.21-3, 5.21-5, 5.23-2, 5.23-4, 5.23-5, 5.23-6, 5.23-7, 5.23-10, 5.23-11, 5.23-12, 5.23-13, 5.23-14, 5.23-15, 5.23-16, 5.23-17, 5.23-18, 5.23-22, 5.23-23, 5.23-33, 5.23-35, 5.23-37, 5.23-40, 5.23-41, 5.23-49, 5.23-52, 5.23-61, 6-3, 6-4, 6-5, 6-13, 6-26, 6-27, 6-30, 6-31, 6-33, 6-44, 6-46, 6-48, 6-50
Erosion Sediment Control Plan, 2-33, 2-39, 5.3-19
Essential Fish Habitat, 5.6-2, 5.6-9, 5.6-20, 5.6-38, 5.23-36
ethnographic, 5.13-4, 5.13-7, 5.13-24 evapotranspiration, 5.4-3 Evolutional Significant Units, 5.6-20 Executive Order, 1-10, 1-25, 1-26, 5.2-11, 5.2-
14, 5.3-14, 5.12-3, 5.12-18, 5.12-48, 5.13-2, 5.23-65, 5.23-66, 5.23-68, 5.23-69, 5.23-70, 5.23-72
F
Fairbanks Lateral, ES-8, ES-20, 2-1, 2-2, 2-14, 2-15, 2-16, 2-17, 2-18, 2-20, 2-22, 2-28, 2-55, 3-1, 4-8, 4-13, 4-14, 5.1-3, 5.2-1, 5.2-35, 5.2-69, 5.2-70, 5.2-71, 5.2-72, 5.2-73, 5.2-74, 5.2-75, 5.2-76, 5.3-1, 5.3-2, 5.3-6, 5.3-20, 5.3-25, 5.3-27, 5.3-29, 5.3-30, 5.3-31, 5.4-1, 5.4-4, 5.4-11, 5.4-12, 5.4-13, 5.4-14, 5.4-15, 5.4-21, 5.4-22, 5.4-23, 5.4-26, 5.4-27, 5.5-1, 5.5-3, 5.5-24, 5.5-33, 5.5-36, 5.5-37, 5.5-39, 5.5-40, 5.6-1, 5.6-3, 5.6-27, 5.6-28, 5.6-29, 5.8-1, 5.8-3, 5.8-4, 5.9-9, 5.9-13, 5.9-14, 5.9-15, 5.9-17, 5.9-18, 5.9-19, 5.9-20, 5.9-21, 5.9-22, 5.9-23, 5.9-24, 5.9-25, 5.9-26, 5.9-27, 5.9-29, 5.9-37, 5.9-41, 5.9-44, 5.9-48, 5.9-54, 5.9-55, 5.10-8, 5.10-11, 5.10-26, 5.10-31, 5.11-6, 5.11-8, 5.11-22, 5.11-23, 5.11-25, 5.11-28, 5.11-29, 5.12-31, 5.12-32, 5.12-33, 5.12-37, 5.12-41, 5.12-42, 5.13-3, 5.13-30, 5.13-33, 5.13-34, 5.15-2, 5.15-88, 5.15-103, 5.15-142, 5.16-7, 5.16-8, 5.16-16, 5.16-23, 5.16-24, 5.16-36, 5.17-4, 5.17-9, 5.17-10, 5.17-12, 5.18-6, 5.18-10, 5.19-4, 5.21-4, 5.21-5, 5.22-3, 5.22-5, 6-1, 6-27, 6-29, 6-38, 6-41, 6-42, 6-43
Fairbanks Natural Gas, 1-5, 1-35, 5.15-139, 5.15-140, 5.15-151, 5.15-152, 5.15-172, 5.15-173
Fairbanks North Star Borough, 1-25, 1-33, 2-1, 5.2-17, 5.6-1, 5.9-9, 5.9-12, 5.9-29, 5.9-37, 5.9-48, 5.9-59, 5.12-1, 5.12-4, 5.12-5, 5.12-7, 5.12-8, 5.12-10, 5.12-12, 5.12-13, 5.12-15, 5.12-16, 5.12-17, 5.12-19, 5.12-22, 5.12-25, 5.12-31, 5.12-32, 5.12-33, 5.12-39, 5.12-42, 5.12-47, 5.12-48, 5.15-19, 5.15-20, 5.15-139, 5.15-145, 5.15-146, 5.15-147, 5.15-149, 5.15-150, 5.15-174, 5.15-177, 5.16-7, 5.16-8, 5.16-16, 5.16-23, 5.16-36, 5.16-37, 6-27, 6-29, 6-42, 6-43
Farmland Protection Policy Act, 5.9-55 fault crossings, 2-20, 5.2-63, 5.23-4, 5.23-5 fauna, 5.4-25, 5.8-21, 5.13-4, 5.13-5

Alaska Stand Alone Gas Pipeline ix Final EIS
Federal Emergency Management Agency, 5.2-4, 5.2-11, 5.2-12, 5.2-13, 5.2-16, 5.2-33, 5.2-48, 5.2-60, 5.2-71, 5.2-72, 5.2-73, 5.2-74, 5.2-82
Federal Energy Regulatory Commission, 4-4, 4-9, 4-10
Federal Highway Administration, 5.11-3, 5.11-35, 5.15-68, 5.15-184, 5.17-16
Federal Land Policy and Management Act, 1-8, 1-27, 5.9-1, 5.9-2, 5.9-22, 5.9-30, 5.9-32, 5.10-1, 5.11-1, 5.23-66, 5.23-68, 5.23-69
Federal Railway Administration, 5.15-91, 5.15-92
Federal Register, ES-5, 1-15, 1-20, 1-34, 4-25, 5.6-24, 5.8-5, 5.8-6, 5.8-7, 5.8-8, 5.8-9, 5.8-11, 5.8-12, 5.8-16, 5.8-17, 5.8-19, 5.8-20, 5.8-21, 5.8-24, 5.8-25, 5.8-28, 5.8-35, 5.8-36, 5.13-2, 5.15-113, 5.15-127, 5.15-135, 5.15-172, 5.15-173, 5.23-1, 5.23-89
Federal Transit Administration, 5.15-8, 5.17-3, 5.17-4, 5.17-8, 5.17-9, 5.17-11, 5.17-12, 5.17-13, 5.17-14, 5.17-15, 5.17-16
Fish and Wildlife Coordination Act, 1-29, 1-31, 5.8-1, 5.23-65, 5.23-70
fisheries, ES-26, 1-12, 1-17, 1-25, 1-29, 1-30, 1-31, 5.4-3, 5.5-48, 5.6-7, 5.6-10, 5.6-12, 5.6-13, 5.6-14, 5.6-23, 5.6-26, 5.6-36, 5.6-37, 5.6-38, 5.6-39, 5.6-40, 5.7-7, 5.7-22, 5.7-23, 5.8-18, 5.8-21, 5.8-33, 5.8-34, 5.8-35, 5.8-36, 5.8-38, 5.10-5, 5.10-29, 5.13-49, 5.21-5, 5.23-78, 6-32
floodplains, ES-13, ES-14, 1-26, 5.1-7, 5.1-8, 5.1-10, 5.2-1, 5.2-3, 5.2-11, 5.2-12, 5.2-14, 5.2-16, 5.2-33, 5.2-48, 5.2-60, 5.2-61, 5.2-75, 5.2-77, 5.3-2, 5.3-3, 5.3-4, 5.3-5, 5.4-3, 5.6-38, 5.21-3, 6-5
flora, 5.3-32, 5.3-35, 5.5-27, 5.8-21, 5.15-108 flume, 2-36, 2-39, 2-40, 5.2-65, 5.6-23, 5.23-13,
5.23-37 fluvial systems, 5.2-79, 5.6-26 forests, ES-15, ES-19, 1-31, 4-17, 5.1-1, 5.1-13,
5.2-66, 5.3-3, 5.3-4, 5.3-5, 5.3-6, 5.3-7, 5.3-17, 5.3-20, 5.3-22, 5.3-25, 5.3-26, 5.3-27, 5.3-28, 5.3-29, 5.3-30, 5.3-31, 5.3-33, 5.3-34, 5.3-35, 5.3-36, 5.4-2, 5.4-10, 5.4-14, 5.4-16, 5.4-21, 5.4-22, 5.4-28, 5.4-32, 5.5-3, 5.5-5, 5.5-6, 5.5-7, 5.5-8, 5.5-10, 5.5-11, 5.5-12, 5.5-13, 5.5-16, 5.5-17, 5.5-18, 5.5-21, 5.5-22, 5.5-23, 5.5-24, 5.5-26, 5.5-28, 5.5-29, 5.5-34, 5.5-36, 5.5-38, 5.5-39, 5.5-40, 5.9-6, 5.9-7, 5.9-16, 5.9-17, 5.9-18, 5.9-19, 5.9-20, 5.9-21, 5.9-24, 5.9-25, 5.9-26, 5.9-34, 5.9-41, 5.9-42, 5.9-53, 5.9-54, 5.9-55, 5.9-56, 5.9-58, 5.10-2, 5.10-3, 5.10-6, 5.10-12, 5.10-15, 5.10-21, 5.10-38, 5.11-4, 5.11-6, 5.11-8, 5.11-9, 5.11-14, 5.11-19, 5.11-22, 5.11-24, 5.11-25, 5.11-27, 5.11-28, 5.11-31, 5.11-33, 5.13-13, 5.13-45, 5.13-
46, 5.13-50, 5.15-131, 5.15-134, 5.15-180, 5.16-5, 5.19-13, 5.21-2, 5.21-4, 5.23-77, 6-5, 6-7, 6-11, 6-12, 6-23, 6-37, 6-41
fossil, 21, 22, 5.1-18, 5.1-19, 5.1-20, 5.1-27, 5.15-83, 5.15-101, 5.15-124, 5.15-139, 5.15-152, 5.16-5, 5.16-16, 5.16-18, 5.16-23, 5.16-25, 5.16-27, 5.16-29, 5.16-30, 5.16-33, 5.16-34, 5.21-5, 5.22-1, 5.22-5, 5.23-60, 6-15, 6-16, 6-20, 6-27
fossil fuel resources, ES-21, ES-22, 5.15-83, 5.15-101, 5.15-124, 5.15-139, 5.15-152, 5.16-5, 5.16-16, 5.16-25, 5.16-27, 5.16-29, 5.16-30, 5.16-33, 5.22-1, 5.22-5, 6-15, 6-20
fragmentation, ES-15, ES-16, 5.3-22, 5.3-29, 5.3-33, 5.3-35, 5.3-36, 5.4-19, 5.4-20, 5.4-28, 5.4-30, 5.5-24, 5.5-25, 5.5-27, 5.5-29, 5.5-37, 5.5-39, 5.5-43, 5.5-47, 5.9-46, 5.21-4, 5.21-5, 23, 6-7, 6-30, 6-31, 6-32, 6-35
frost bulb, ES-12, 5.6-33 frost heave, ES-12, 5.1-14, 5.1-22, 5.1-23, 5.6-
33, 5.19-12, 6-4, 6-26, 6-28, 6-29 fugitive dust, ES-15, 5.2-71, 5.3-31, 5.4-17, 5.4-
25, 5.4-26, 5.15-10, 5.15-103, 5.15-104, 5.15-125, 5.15-129, 5.15-136, 5.16-18, 5.16-21, 5.16-22, 5.16-23, 5.16-24, 5.16-25, 5.16-27, 5.16-29, 5.16-30, 5.16-32, 5.16-33, 5.16-34, 5.16-35, 5.21-5, 5.23-16, 5.23-17, 5.23-22, 5.23-32, 5.23-60, 6-16, 6-27
future plans, 5.15-101
G
Game Management Units, 5.5-2, 5.5-5, 5.5-14, 5.5-15, 5.5-16
Gas Conditioning Facility, ES-3, ES-11, ES-18, ES-20, ES-24, 1-3, 2-1, 2-2, 2-3, 2-4, 2-14, 2-15, 2-16, 2-17, 2-18, 2-22, 2-24, 2-48, 2-50, 2-55, 2-56, 2-59, 3-1, 3-2, 3-3, 3-4, 3-6, 4-7, 4-21, 5.1-3, 5.1-21, 5.2-24, 5.2-64, 5.2-67, 5.2-71, 5.2-73, 5.2-74, 5.3-2, 5.3-28, 5.3-30, 5.4-5, 5.4-25, 5.4-27, 5.4-29, 5.5-15, 5.5-37, 5.5-38, 5.6-3, 5.6-17, 5.6-19, 5.6-27, 5.6-28, 5.6-30, 5.7-19, 5.8-3, 5.8-5, 5.8-6, 5.8-11, 5.8-15, 5.8-16, 5.8-17, 5.8-23, 5.8-24, 5.8-27, 5.8-30, 5.9-1, 5.9-2, 5.9-3, 5.9-5, 5.9-7, 5.9-8, 5.9-9, 5.9-13, 5.9-14, 5.9-15, 5.9-17, 5.9-18, 5.9-19, 5.9-20, 5.9-21, 5.9-22, 5.9-23, 5.9-24, 5.9-25, 5.9-26, 5.9-27, 5.9-28, 5.9-29, 5.9-30, 5.9-33, 5.9-34, 5.9-37, 5.9-38, 5.9-40, 5.9-41, 5.9-42, 5.9-44, 5.9-45, 5.9-46, 5.9-48, 5.9-54, 5.9-55, 5.10-8, 5.10-11, 5.10-18, 5.10-26, 5.10-32, 5.11-7, 5.11-12, 5.11-13, 5.11-23, 5.11-24, 5.11-26, 5.12-33, 5.12-34, 5.12-37, 5.12-38, 5.12-41, 5.12-43, 5.12-44, 5.12-45, 5.12-46, 5.12-47, 5.13-3, 5.13-11, 5.13-30,
Alaska Stand Alone Gas Pipeline x Final EIS
5.13-34, 5.13-38, 5.13-39, 5.15-97, 5.15-124, 5.15-129, 5.16-7, 5.16-25, 5.16-27, 5.17-5, 5.17-10, 5.17-11, 5.18-8, 5.18-10, 5.19-3, 5.19-4, 5.22-5, 5.23-35, 5.23-61, 6-8, 6-12, 6-16, 6-34, 6-35
General Management Plan, 5.9-60, 5.10-19, 5.11-35
geo-fabric, 2-43, 5.4-16, 5.4-17, 5.4-19, 5.4-20 Geographic Information System, 5.2-3, 5.2-72,
5.2-74, 5.3-20, 5.4-2, 5.13-41 geology, ES-11, ES-24, 2-48, 3-2, 5.1-1, 5.1-19,
5.1-23, 5.1-24, 5.1-25, 5.1-26, 5.1-27, 5.2-7, 5.2-23, 5.13-7, 5.13-49, 5.23-11, 5.23-13, 5.23-41, 6-3, 6-24, 6-26, 6-29, 6-46, 6-48, 6-50
geotechnical, 2-43, 4-14, 5.1-20, 5.1-21, 5.22-2 geotextile, 2-33 gill net, 5.6-11 glacial, 5.1-4, 5.1-6, 5.1-7, 5.1-9, 5.1-10, 5.1-11,
5.1-13, 5.1-17, 5.1-19, 5.2-23, 5.2-33, 5.3-2, 5.3-3, 5.3-5, 5.5-20, 5.5-21, 5.6-6, 5.6-7, 5.6-12, 5.13-4, 5.13-20, 5.13-31
Golden Valley Electric Association, 4-3, 4-5, 4-6, 4-28
grading, ES-13, ES-14, 2-31, 2-36, 2-48, 2-50, 2-54, 2-57, 5.1-4, 5.2-63, 5.3-19, 5.3-23, 5.4-13, 5.4-19, 5.5-27, 5.5-29, 5.5-37, 5.6-34, 5.11-13, 5.11-31, 5.15-2, 5.15-85, 5.16-21, 5.22-2, 5.22-3, 5.23-6, 5.23-11, 5.23-18, 5.23-22, 5.23-49, 6-3, 6-5, 6-30, 6-31, 6-33, 6-35, 6-46, 6-47, 6-48, 6-49, 6-50, 6-51
grasslands, 5.3-20, 5.3-21, 5.3-26, 5.3-29, 5.3-31, 5.5-5, 5.5-23, 5.5-26, 5.5-36, 5.8-20, 5.21-2
green house gas(es), ES-22, ES-26, 5.16-1, 5.16-5, 5.16-16, 5.16-17, 5.16-22, 5.16-24, 5.16-27, 5.16-28, 5.16-30, 5.16-32, 5.16-34, 5.16-35
Green House Gases, ES-22, ES-26, 5.16-1, 5.16-5, 5.16-16, 5.16-17, 5.16-22, 5.16-24, 5.16-27, 5.16-28, 5.16-30, 5.16-32, 5.16-34, 5.16-35
groundwater, ES-13, ES-14, ES-23, 2-19, 2-34, 5.2-1, 5.2-4, 5.2-5, 5.2-6, 5.2-7, 5.2-8, 5.2-9, 5.2-11, 5.2-14, 5.2-19, 5.2-20, 5.2-22, 5.2-24, 5.2-31, 5.2-33, 5.2-41, 5.2-45, 5.2-46, 5.2-47, 5.2-48, 5.2-55, 5.2-58, 5.2-59, 5.2-61, 5.2-66, 5.2-69, 5.2-71, 5.2-73, 5.2-74, 5.2-75, 5.2-76, 5.2-77, 5.2-78, 5.2-79, 5.2-81, 5.4-3, 5.4-4, 5.6-3, 5.6-35, 5.6-36, 5.15-11, 5.15-84, 5.15-85, 5.19-13, 5.21-3, 5.23-10, 5.23-77, 5.23-86, 5.23-87, 6-5, 6-26, 6-27, 6-29
H
habitat, ES-8, ES-15, ES-16, ES-17, ES-18, ES-26, 1-17, 1-18, 1-26, 1-31, 2-33, 3-4, 3-5, 4-13, 5.2-11, 5.2-22, 5.2-63, 5.2-65, 5.2-66, 5.2-67, 5.2-71, 5.3-15, 5.3-22, 5.3-33, 5.3-35, 5.4-1, 5.4-2, 5.4-3, 5.4-17, 5.4-18, 5.4-25, 5.4-28, 5.4-30, 5.4-34, 5.5-1, 5.5-2, 5.5-3, 5.5-5, 5.5-6, 5.5-7, 5.5-8, 5.5-13, 5.5-14, 5.5-17, 5.5-18, 5.5-24, 5.5-25, 5.5-26, 5.5-27, 5.5-28, 5.5-29, 5.5-30, 5.5-31, 5.5-32, 5.5-34, 5.5-35, 5.5-37, 5.5-38, 5.5-39, 5.5-41, 5.5-42, 5.5-43, 5.6-1, 5.6-2, 5.6-9, 5.6-10, 5.6-13, 5.6-14, 5.6-18, 5.6-19, 5.6-20, 5.6-21, 5.6-23, 5.6-24, 5.6-25, 5.6-26, 5.6-27, 5.6-29, 5.6-30, 5.6-31, 5.6-32, 5.6-33, 5.6-34, 5.6-38, 5.7-7, 5.7-8, 5.7-11, 5.7-13, 5.7-16, 5.7-17, 5.7-19, 5.7-20, 5.8-1, 5.8-2, 5.8-5, 5.8-6, 5.8-7, 5.8-9, 5.8-10, 5.8-11, 5.8-12, 5.8-13, 5.8-15, 5.8-16, 5.8-17, 5.8-18, 5.8-19, 5.8-20, 5.8-21, 5.8-23, 5.8-24, 5.8-27, 5.8-28, 5.8-31, 5.8-33, 5.8-38, 5.9-2, 5.9-3, 5.9-7, 5.9-35, 5.9-41, 5.9-43, 5.9-44, 5.9-45, 5.9-46, 5.10-5, 5.10-22, 5.12-47, 5.12-48, 5.13-13, 5.15-10, 5.15-11, 5.15-106, 5.15-131, 5.16-4, 5.18-9, 5.18-11, 5.21-1, 5.21-4, 5.21-6, 5.22-2, 5.22-3, 5.22-4, 5.23-6, 5.23-23, 5.23-26, 5.23-27, 5.23-28, 5.23-29, 5.23-30, 5.23-31, 5.23-32, 5.23-35, 5.23-36, 5.23-37, 5.23-38, 5.23-39, 5.23-40, 5.23-42, 5.23-43, 5.23-44, 5.23-49, 5.23-50, 5.23-73, 6-7, 6-8, 6-23, 6-24, 6-25, 6-32, 6-33, 6-34, 6-35, 6-44, 6-46, 6-47, 6-48, 6-49, 6-50, 6-51
habituate, 5.5-35, 5.5-39, 5.5-40 haul out, 5.7-6, 5.7-7, 5.7-12, 5.7-16, 5.7-18,
5.7-20, 5.8-11 hazardous air pollutant, 5.16-12, 5.16-13, 5.16-
14, 5.16-26, 5.23-81 Hazardous Air Pollutant, 5.16-12, 5.16-13, 5.16-
14, 5.16-26 hazards, ES-22, ES-23, 1-26, 1-28, 1-31, 5.1-17,
5.1-22, 5.1-24, 5.1-26, 5.2-11, 5.2-13, 5.2-16, 5.2-17, 5.2-21, 5.2-33, 5.2-60, 5.2-82, 5.2-83, 5.8-24, 5.8-30, 5.15-13, 5.15-126, 5.15-134, 5.15-135, 5.19-1, 5.19-7, 5.19-9, 5.19-10, 5.19-12, 5.23-46, 5.23-87, 6-28, 6-29
Health and Human Services, 5.15-34, 5.15-71, 5.15-170, 5.15-184
Health Effects Categories, 5.15-6, 5.15-7, 5.15-9, 5.15-13, 5.15-82, 5.15-83, 5.15-89, 5.15-100, 5.15-124, 5.15-158
Health Impact Analysis, 5.15-4, 5.15-5, 5.15-6, 5.15-9, 5.15-10, 5.15-13, 5.15-25, 5.15-90, 5.15-107, 5.15-110, 5.15-113, 5.15-117, 5.15-121, 5.15-124, 5.15-128, 5.15-163, 5.15-186, 6-1, 6-15
Alaska Stand Alone Gas Pipeline xi Final EIS
Health Professional Shortage Areas, 5.15-34, 5.15-162
Health Resource Services Administration, 5.15-34, 5.15-184
Health Resources and Services Administration, 5.15-34, 5.15-184
Healthy Worker Effect, 5.15-101 high consequence area, ES-22, 5.19-6 High Consequence Areas, ES-22, 5.19-6 Homer Electric Association, 4-3, 5.13-15, 5.13-
16, 5.13-18, 5.13-27, 5.13-30, 5.13-31, 5.13-37
horizontal directional drill, ES-13, ES-15, ES-16, 2-22, 2-24, 2-36, 2-39, 2-40, 2-41, 2-42, 2-43, 5.1-23, 5.1-24, 5.2-64, 5.2-65, 5.2-66, 5.2-67, 5.2-68, 5.2-70, 5.2-71, 5.2-72, 5.2-73, 5.2-74, 5.2-76, 5.2-78, 5.2-80, 5.3-26, 5.3-27, 5.3-33, 5.4-11, 5.4-13, 5.4-16, 5.4-31, 5.6-2, 5.6-21, 5.6-24, 5.6-26, 5.6-27, 5.6-28, 5.6-29, 5.6-30, 5.6-32, 5.6-33, 5.7-21, 5.8-4, 5.9-15, 5.9-16, 5.9-17, 5.9-19, 5.10-31, 5.11-21, 5.11-22, 5.12-30, 5.13-31, 5.15-88, 5.16-23, 5.17-9, 5.18-7, 5.18-9, 5.18-10, 5.18-11, 5.18-12, 5.21-3, 5.22-3, 5.22-5, 5.23-10, 5.23-24, 5.23-25, 5.23-38, 5.23-39, 6-3, 6-4, 6-5, 6-6, 6-7, 6-8, 6-10, 6-11, 6-12, 6-16, 6-18, 6-19, 6-24, 6-25, 6-26, 6-28, 6-29, 6-33, 6-35, 6-44, 6-45, 6-50
Horizontal Directional Drilling, ES-13, ES-15, ES-16, 2-22, 2-24, 2-36, 2-39, 2-40, 2-41, 2-42, 2-43, 5.1-23, 5.1-24, 5.2-64, 5.2-65, 5.2-66, 5.2-67, 5.2-68, 5.2-70, 5.2-71, 5.2-72, 5.2-73, 5.2-74, 5.2-76, 5.2-78, 5.2-80, 5.3-26, 5.3-27, 5.3-33, 5.4-11, 5.4-13, 5.4-16, 5.4-31, 5.6-2, 5.6-21, 5.6-24, 5.6-26, 5.6-27, 5.6-28, 5.6-29, 5.6-30, 5.6-32, 5.6-33, 5.7-21, 5.8-4, 5.9-15, 5.9-16, 5.9-17, 5.9-19, 5.11-21, 5.11-22, 5.12-30, 5.13-31, 5.15-88, 5.16-23, 5.17-9, 5.18-7, 5.18-9, 5.18-10, 5.18-11, 5.18-12, 5.21-3, 5.22-3, 5.22-5, 5.23-10, 5.23-24, 5.23-25, 5.23-38, 5.23-39, 6-3, 6-4, 6-5, 6-6, 6-7, 6-8, 6-10, 6-11, 6-12, 6-16, 6-18, 6-19, 6-24, 6-25, 6-26, 6-28, 6-29, 6-33, 6-35, 6-44, 6-45, 6-50
hovercraft, 5.7-19, 5.18-8 hydrogen sulfide, 2-17, 5.2-71, 5.16-27, 5.16-28,
5.16-30, 5.16-32 Hydrogeomorphic Classification, ES-15, 5.4-2,
5.4-3, 5.4-4, 5.4-11, 5.4-12, 5.4-13, 5.4-15, 5.4-21, 5.4-23, 5.4-31, 5.4-33
Hydrologic Unit Code, 5.2-5, 5.2-24, 5.2-35, 5.2-36, 5.2-48, 5.2-50
hydrology, 5.1-20, 5.4-1, 5.4-2, 5.4-17, 5.4-19, 5.6-23, 5.6-35, 5.18-9, 5.21-5, 5.23-7, 5.23-11, 5.23-22, 6-31, 6-46, 6-48, 6-50
hydrostatic testing, 1-28, 2-35, 2-56, 5.2-63, 5.2-79, 5.6-25, 5.6-29, 5.15-86, 5.15-87, 5.15-88, 5.21-3, 5.22-3, 5.23-34, 5.23-42, 6-19, 6-26
hyporheic zone, ES-13, ES-16, 5.2-65, 5.6-21, 5.6-33, 5.6-35, 6-26, 6-44
I
Iditarod National Historic Trail, 1-8, 1-27, 5.9-30, 5.9-32, 5.13-25
igneous rock, 5.1-7 impact, ES-1, ES-8, ES-11, ES-13, ES-14, ES-
15, ES-16, ES-17, ES-18, ES-19, ES-20, ES-21, ES-22, ES-25, ES-26, 1-12, 1-18, 1-26, 2-15, 2-42, 2-61, 3-1, 3-6, 4-1, 4-6, 4-8, 4-13, 4-20, 4-21, 4-26, 5-1, 5.1-13, 5.1-18, 5.1-20, 5.2-13, 5.2-14, 5.2-61, 5.2-65, 5.2-66, 5.2-67, 5.2-69, 5.2-76, 5.2-79, 5.2-80, 5.3-19, 5.3-25, 5.3-26, 5.3-28, 5.3-31, 5.3-33, 5.4-13, 5.4-16, 5.4-21, 5.4-24, 5.4-26, 5.4-27, 5.4-28, 5.4-29, 5.4-30, 5.4-33, 5.5-29, 5.5-33, 5.5-34, 5.5-39, 5.6-2, 5.6-23, 5.6-28, 5.6-31, 5.6-35, 5.7-14, 5.7-16, 5.8-3, 5.8-4, 5.8-7, 5.8-9, 5.8-10, 5.8-15, 5.9-40, 5.9-46, 5.9-48, 5.10-1, 5.10-27, 5.10-32, 5.11-1, 5.11-12, 5.11-13, 5.11-15, 5.11-19, 5.11-20, 5.11-21, 5.11-23, 5.11-26, 5.11-27, 5.11-28, 5.11-29, 5.11-30, 5.11-31, 5.11-32, 5.11-34, 5.12-29, 5.12-31, 5.12-33, 5.12-34, 5.12-35, 5.12-38, 5.12-40, 5.12-47, 5.13-31, 5.13-35, 5.13-37, 5.15-5, 5.15-8, 5.15-9, 5.15-10, 5.15-12, 5.15-13, 5.15-56, 5.15-77, 5.15-80, 5.15-82, 5.15-89, 5.15-100, 5.15-101, 5.15-102, 5.15-105, 5.15-106, 5.15-107, 5.15-108, 5.15-109, 5.15-112, 5.15-113, 5.15-114, 5.15-115, 5.15-117, 5.15-118, 5.15-123, 5.15-124, 5.15-125, 5.15-128, 5.15-129, 5.15-130, 5.15-131, 5.15-132, 5.15-133, 5.15-134, 5.15-135, 5.15-136, 5.15-137, 5.15-138, 5.15-146, 5.15-150, 5.15-152, 5.15-153, 5.15-154, 5.15-170, 5.15-172, 5.15-178, 5.16-10, 5.16-11, 5.16-26, 5.16-28, 5.16-29, 5.16-31, 5.16-33, 5.17-7, 5.17-8, 5.17-9, 5.17-10, 5.17-11, 5.17-12, 5.17-13, 5.17-14, 5.17-15, 5.17-16, 5.18-1, 5.18-8, 5.18-12, 5.19-6, 5.19-13, 5.21-4, 5.22-3, 5.22-4, 5.23-1, 5.23-2, 5.23-4, 5.23-6, 5.23-21, 5.23-23, 5.23-24, 5.23-45, 5.23-47, 5.23-48, 5.23-50, 5.23-51, 5.23-52, 6-2, 6-3, 6-4, 6-5, 6-7, 6-6, 6-7, 6-8, 6-9, 6-10, 6-11, 6-13, 6-14, 6-15, 6-16, 6-17, 6-18, 6-19, 6-21, 6-22, 6-23, 6-24, 6-26, 6-28, 6-30, 6-32, 6-35, 6-36, 6-37, 6-38, 6-39, 6-40, 6-41, 6-44, 6-45, 6-46, 6-47, 6-48, 6-49, 6-50, 6-51
impacts, ES-1, ES-2, ES-6, ES-7, ES-8, ES-11, ES-12, ES-13, ES-14, ES-15, ES-16, ES-17, ES-18, ES-19, ES-20, ES-21, ES-22, ES-23,

Alaska Stand Alone Gas Pipeline xii Final EIS
ES-25, ES-26, 1-1, 1-5, 1-8, 1-12, 1-17, 1-18, 1-25, 1-26, 1-27, 1-28, 1-32, 2-15, 2-18, 2-19, 2-20, 2-22, 2-34, 2-39, 2-42, 2-43, 2-46, 2-54, 2-61, 3-1, 3-2, 3-4, 3-6, 3-7, 4-1, 4-2, 4-4, 4-6, 4-8, 4-11, 4-13, 4-19, 4-20, 4-21, 4-23, 4-24, 4-25, 4-26, 5-1, 5.1-13, 5.1-18, 5.1-19, 5.1-20, 5.1-21, 5.1-22, 5.1-23, 5.1-24, 5.2-1, 5.2-3, 5.2-11, 5.2-13, 5.2-14, 5.2-16, 5.2-61, 5.2-63, 5.2-65, 5.2-66, 5.2-67, 5.2-68, 5.2-69, 5.2-71, 5.2-73, 5.2-74, 5.2-75, 5.2-76, 5.2-77, 5.2-78, 5.2-79, 5.2-80, 5.2-83, 5.3-1, 5.3-14, 5.3-18, 5.3-19, 5.3-22, 5.3-23, 5.3-25, 5.3-26, 5.3-27, 5.3-28, 5.3-29, 5.3-31, 5.3-32, 5.3-33, 5.3-34, 5.4-1, 5.4-11, 5.4-13, 5.4-16, 5.4-17, 5.4-20, 5.4-21, 5.4-24, 5.4-25, 5.4-26, 5.4-27, 5.4-28, 5.4-29, 5.4-30, 5.4-31, 5.4-33, 5.4-34, 5.4-35, 5.5-1, 5.5-2, 5.5-15, 5.5-24, 5.5-25, 5.5-27, 5.5-28, 5.5-29, 5.5-30, 5.5-33, 5.5-34, 5.5-35, 5.5-36, 5.5-39, 5.5-40, 5.5-41, 5.6-1, 5.6-2, 5.6-9, 5.6-14, 5.6-18, 5.6-20, 5.6-21, 5.6-23, 5.6-24, 5.6-25, 5.6-26, 5.6-28, 5.6-29, 5.6-30, 5.6-31, 5.6-32, 5.6-33, 5.6-34, 5.6-35, 5.7-14, 5.7-16, 5.7-19, 5.8-3, 5.8-4, 5.8-7, 5.8-9, 5.8-10, 5.8-13, 5.8-15, 5.8-24, 5.8-27, 5.8-33, 5.8-37, 5.9-3, 5.9-14, 5.9-15, 5.9-36, 5.9-40, 5.9-45, 5.9-45, 5.9-46, 5.9-47, 5.9-48, 5.9-51, 5.9-53, 5.10-1, 5.10-27, 5.10-28, 5.10-29, 5.10-30, 5.10-31, 5.10-32, 5.10-33, 5.10-34, 5.10-35, 5.10-36, 5.10-37, 5.11-1, 5.11-3, 5.11-12, 5.11-13, 5.11-14, 5.11-15, 5.11-17, 5.11-19, 5.11-21, 5.11-22, 5.11-23, 5.11-24, 5.11-26, 5.11-27, 5.11-28, 5.11-29, 5.11-30, 5.11-31, 5.11-32, 5.11-33, 5.11-34, 5.11-35, 5.12-25, 5.12-26, 5.12-27, 5.12-29, 5.12-30, 5.12-31, 5.12-32, 5.12-33, 5.12-34, 5.12-35, 5.12-36, 5.12-37, 5.12-38, 5.12-39, 5.12-40, 5.12-42, 5.12-47, 5.12-48, 5.12-49, 5.12-53, 5.12-54, 5.13-1, 5.13-28, 5.13-31, 5.13-33, 5.13-35, 5.13-37, 5.13-45, 5.15-1, 5.15-4, 5.15-5, 5.15-6, 5.15-7, 5.15-8, 5.15-9, 5.15-10, 5.15-11, 5.15-12, 5.15-13, 5.15-36, 5.15-56, 5.15-77, 5.15-79, 5.15-80, 5.15-81, 5.15-82, 5.15-83, 5.15-84, 5.15-87, 5.15-88, 5.15-89, 5.15-92, 5.15-98, 5.15-99, 5.15-100, 5.15-101, 5.15-102, 5.15-103, 5.15-104, 5.15-105, 5.15-106, 5.15-107, 5.15-108, 5.15-109, 5.15-110, 5.15-112, 5.15-113, 5.15-114, 5.15-115, 5.15-117, 5.15-118, 5.15-122, 5.15-123, 5.15-124, 5.15-125, 5.15-128, 5.15-129, 5.15-130, 5.15-131, 5.15-132, 5.15-133, 5.15-134, 5.15-135, 5.15-136, 5.15-137, 5.15-138, 5.15-146, 5.15-150, 5.15-152, 5.15-153, 5.15-154, 5.15-155, 5.15-154, 5.15-157, 5.15-158, 5.15-163, 5.15-168, 5.15-170, 5.15-172, 5.15-175, 5.15-176, 5.15-178, 5.15-182, 5.15-184, 5.15-185, 5.15-186, 5.16-4, 5.16-10, 5.16-11, 5.16-18,
5.16-23, 5.16-26, 5.16-28, 5.16-29, 5.16-31, 5.16-33, 5.16-34, 5.17-6, 5.17-7, 5.17-8, 5.17-9, 5.17-10, 5.17-11, 5.17-12, 5.17-13, 5.17-14, 5.17-15, 5.17-16, 5.18-1, 5.18-2, 5.18-8, 5.18-9, 5.18-10, 5.18-11, 5.18-12, 5.19-6, 5.19-10, 5.19-13, 5.21-1, 5.21-2, 5.21-3, 5.21-4, 5.21-5, 5.21-6, 5.22-2, 5.22-3, 5.22-4, 5.23-1, 5.23-2, 5.23-4, 5.23-6, 5.23-7, 5.23-9, 5.23-10, 5.23-12, 5.23-13, 5.23-14, 5.23-15, 5.23-16, 5.23-17, 5.23-19, 5.23-20, 5.23-21, 5.23-22, 5.23-23, 5.23-24, 5.23-25, 5.23-26, 5.23-28, 5.23-29, 5.23-30, 5.23-32, 5.23-35, 5.23-36, 5.23-37, 5.23-38, 5.23-39, 5.23-40, 5.23-41, 5.23-42, 5.23-43, 5.23-44, 5.23-45, 5.23-46, 5.23-47, 5.23-48, 5.23-49, 5.23-50, 5.23-51, 5.23-52, 5.23-53, 5.23-54, 5.23-56, 5.23-57, 5.23-58, 5.23-59, 5.23-60, 5.23-61, 5.23-62, 5.23-63, 5.23-64, 5.23-89, 6-1, 6-2, 6-3, 6-4, 6-5, 6-7, 6-6, 6-7, 6-8, 6-9, 6-10, 6-11, 6-12, 6-13, 6-14, 6-15, 6-16, 6-17, 6-18, 6-19, 6-21, 6-22, 6-23, 6-24, 6-25, 6-26, 6-27, 6-28, 6-29, 6-30, 6-31, 6-32, 6-33, 6-34, 6-35, 6-36, 6-37, 6-38, 6-39, 6-40, 6-41, 6-42, 6-43, 6-44, 6-45, 6-46, 6-47, 6-48, 6-49, 6-50, 6-51
Important Bird Areas, 5.5-18, 5.5-32, 5.5-33, 5.5-34
impoundment, ES-15, 5.2-13, 5.4-29 incidents, ES-23, 2-60, 5.8-23, 5.15-89, 5.15-91,
5.15-93, 5.15-95, 5.15-122, 5.15-126, 5.15-135, 5.15-136, 5.15-178, 5.19-1, 5.19-2, 5.19-7, 5.19-8, 5.19-9, 5.19-10, 5.19-14, 5.23-10, 5.23-34, 5.23-67, 5.23-71, 5.23-72, 6-28
incubation period, 5.6-2 Indian Tribal Consultation, 1-12 Indian Tribe, 1-13 indirect impacts, 5.5-28, 5.8-4, 5.21-6 industry standards, 2-58, 3-7, 5.19-12 infrastructure, ES-14, ES-21, ES-24, 2-17, 2-24,
2-34, 2-54, 3-6, 4-11, 5.1-17, 5.1-21, 5.2-68, 5.2-75, 5.3-19, 5.5-38, 5.8-3, 5.8-15, 5.9-8, 5.9-46, 5.9-47, 5.9-50, 5.10-3, 5.11-4, 5.11-7, 5.11-8, 5.11-9, 5.11-13, 5.11-21, 5.11-22, 5.11-26, 5.11-27, 5.11-30, 5.11-33, 5.12-26, 5.12-31, 5.12-39, 5.12-41, 5.12-42, 5.12-43, 5.12-45, 5.12-46, 5.13-8, 5.13-29, 5.13-31, 5.13-33, 5.15-4, 5.15-6, 5.15-10, 5.15-11, 5.15-13, 5.15-79, 5.15-80, 5.15-87, 5.15-88, 5.15-97, 5.15-100, 5.15-109, 5.15-125, 5.15-128, 5.15-136, 5.15-154, 5.15-156, 5.18-11, 5.19-1, 5.22-1, 5.22-4, 5.23-45, 5.23-60, 6-3, 6-11, 6-15, 6-19
Integrated Gasification Combined Cycle, 4-5, 4-7
Intergovernmental Panel on Climate Change, 5.2-71, 5.2-83, 5.4-24, 5.4-34, 5.4-35, 5.16-1, 5.16-4, 5.16-38, 5.16-39
Alaska Stand Alone Gas Pipeline xiii Final EIS
International Whaling Commission, 5.8-6, 5.8-34 interstitial space, 5.6-35 intertidal, 5.5-11, 5.6-7, 5.8-18 intrastate, 1-3, 1-6, 2-1, 5.15-82, 5.19-1, 6-1 invasive species, 1-26, 5.3-7, 5.3-14, 5.3-21,
5.4-18, 5.4-24, 5.4-28, 5.5-25, 5.5-28, 5.6-5, 5.6-19, 5.6-35, 5.7-16, 5.12-48, 5.15-106, 5.23-25, 5.23-49, 6-31, 6-34, 6-35
J
K
Kansas, 5.8-35 Key Observation Points, 5.11-17, 5.11-18, 5.11-
19, 5.11-20, 5.11-21, 5.11-32, 5.11-33, 5.11-34
L
land agricultural, ES-19, 5.9-16, 5.9-18, 5.9-20, 5.9-
21, 5.9-27, 5.9-28, 5.9-53, 5.9-57, 5.21-2, 5.22-4, 6-10
forest, 1-31, 5.1-1, 5.9-24, 5.9-26, 5.9-41, 5.9-53, 5.9-55, 5.9-56, 5.10-6, 5.21-2, 77
rangeland, 5.1-1, 5.9-55 Land and Water Conservation Fund, 1-10, 1-30,
1-32, 4-20, 5.9-5, 5.10-2, 5.10-31 land owner, 1-1, 1-7, 5.3-25, 5.4-12, 5.9-11, 5.9-
13, 5.9-14, 5.9-15, 5.9-39, 5.9-52, 5.9-58, 5.10-3, 5.11-23, 5.15-14, 5.22-4
land use, ES-18, ES-25, 1-7, 1-17, 1-33, 1-34, 2-22, 2-24, 3-5, 5.2-14, 5.2-26, 5.2-40, 5.3-26, 5.3-27, 5.4-24, 5.8-12, 5.9-1, 5.9-2, 5.9-6, 5.9-8, 5.9-9, 5.9-10, 5.9-11, 5.9-13, 5.9-14, 5.9-15, 5.9-28, 5.9-29, 5.9-30, 5.9-34, 5.9-35, 5.9-36, 5.9-37, 5.9-39, 5.9-40, 5.9-42, 5.9-44, 5.9-48, 5.9-50, 5.9-53, 5.9-54, 5.9-55, 5.9-56, 5.10-6, 5.10-28, 5.11-23, 5.11-29, 5.11-31, 5.12-37, 5.12-39, 5.12-42, 5.13-1, 5.13-6, 5.13-24, 5.15-14, 5.16-5, 5.17-3, 5.18-6, 5.21-1, 5.21-2, 5.22-4, 5.23-45, 5.23-78, 5.23-88, 6-10, 6-36, 6-37, 6-41
leach, 5.6-30, 5.6-31 liquefaction, 1-34, 5.1-14, 5.1-22, 6-4 Liquefied Natural Gas, ES-7, ES-8, ES-24, ES-
26, 1-4, 1-5, 1-6, 1-11, 1-34, 3-1, 4-3, 4-7, 4-9, 4-10, 4-23, 5.15-112, 5.15-139, 5.15-186, 5.16-17
loess, 5.1-4, 5.1-9, 5.1-10
M
macrohabitat, 3-5, 5.8-13, 5.8-15, 5.8-16 Magnuson-Stevens Fishery Conservation and
Management Act, 5.6-2 Mainline block Valve, 2-18, 2-22, 2-50, 5.3-30,
5.11-28 mainline valves, ES-20, 1-3, 2-1, 2-2, 5.3-28,
5.4-20, 5.4-29, 5.10-34, 5.11-12, 5.12-37, 5.13-3, 5.16-24, 5.16-32, 5.17-10, 5.17-13, 5.22-2, 5.23-48, 6-11, 6-19
maintenance, ES-11, ES-13, ES-19, ES-20, ES-22, ES-23, ES-25, ES-26, 1-3, 1-11, 1-33, 2-27, 2-28, 2-35, 2-39, 2-54, 2-56, 2-57, 2-59, 2-60, 3-2, 3-4, 3-5, 3-6, 4-17, 4-20, 4-21, 5-1, 5.1-23, 5.2-61, 5.2-66, 5.2-67, 5.2-68, 5.2-69, 5.2-73, 5.2-74, 5.2-75, 5.2-77, 5.2-79, 5.2-80, 5.3-18, 5.3-25, 5.3-29, 5.3-31, 5.4-13, 5.4-16, 5.4-20, 5.4-21, 5.5-25, 5.5-35, 5.6-23, 5.6-26, 5.6-28, 5.6-29, 5.6-30, 5.6-31, 5.6-33, 5.7-21, 5.8-23, 5.9-6, 5.9-9, 5.9-29, 5.9-40, 5.9-47, 5.9-48, 5.9-48, 5.9-52, 5.10-30, 5.10-31, 5.10-32, 5.10-33, 5.10-34, 5.10-35, 5.11-7, 5.11-12, 5.11-19, 5.11-21, 5.11-23, 5.11-27, 5.11-28, 5.11-29, 5.11-31, 5.12-26, 5.12-31, 5.12-32, 5.12-37, 5.12-38, 5.12-40, 5.12-41, 5.12-42, 5.13-14, 5.13-29, 5.13-34, 5.13-35, 5.13-36, 5.13-37, 5.13-38, 5.13-39, 5.13-40, 5.13-41, 5.15-4, 5.15-8, 5.15-10, 5.15-12, 5.15-79, 5.15-80, 5.15-82, 5.15-86, 5.15-124, 5.15-125, 5.15-128, 5.15-129, 5.15-130, 5.15-132, 5.15-133, 5.15-135, 5.15-137, 5.15-138, 5.15-139, 5.15-143, 5.16-7, 5.16-15, 5.16-16, 5.16-24, 5.16-27, 5.16-28, 5.16-30, 5.16-32, 5.16-33, 5.16-34, 5.16-36, 5.17-9, 5.17-10, 5.17-13, 5.17-14, 5.17-16, 5.18-11, 5.19-1, 5.19-2, 5.19-6, 5.19-9, 5.21-1, 5.21-3, 5.21-4, 5.22-2, 5.22-3, 5.23-2, 5.23-6, 5.23-8, 5.23-9, 5.23-11, 5.23-15, 5.23-31, 5.23-32, 5.23-35, 5.23-45, 5.23-48, 5.23-62, 5.23-75, 5.23-78, 6-3, 6-6, 6-7, 6-11, 6-18, 6-19, 6-27, 6-29, 6-32, 6-35, 6-38, 6-39, 6-40, 6-41, 6-42
Marine Mammal Protection Act, 1-29, 1-30, 5.7-1, 5.7-9, 5.8-1, 5.8-7
masking, 5.7-19, 5.8-8, 6-34, 6-35 Matanuska Electric Association, 4-3 Matanuska-Susitna Borough, 1-34, 5.2-17, 5.9-
10, 5.9-29, 5.11-25, 5.16-8 Maximum Achievable Control Technology, 5.16-
8, 5.16-13, 5.16-14, 5.16-26, 61 maximum allowable operating pressure, 2-15, 2-
35, 5.19-1, 5.19-3, 5.19-6 median, 5.12-16, 5.12-19, 5.15-26, 5.15-28,
5.15-62

Alaska Stand Alone Gas Pipeline xiv Final EIS
Medically Underserved Area, 5.15-15, 5.15-34, 5.15-162
Medically Underserved Populations, 5.15-34 megawatt, 2-19, 4-4, 4-5, 4-6, 5.2-53, 5.16-13 metamorphic rocks, 5.1-6, 5.1-9, 5.3-5 meter station, 2-1, 2-2, 2-18, 2-22, 2-50, 2-54,
5.4-25, 5.4-29 microhabitat, 5.23-37 microns, 5.15-104 migration, 1-29, 1-31, 5.1-13, 5.1-23, 5.4-24,
5.5-1, 5.5-10, 5.5-11, 5.5-12, 5.5-17, 5.5-18, 5.5-20, 5.5-21, 5.5-29, 5.5-30, 5.5-32, 5.5-33, 5.6-1, 5.6-2, 5.6-6, 5.6-10, 5.6-19, 5.6-24, 5.7-19, 5.8-6, 5.8-20, 5.8-21, 5.8-24, 5.8-27, 5.8-30, 5.8-38, 5.9-46, 5.10-33, 5.15-26, 5.15-33, 5.15-84, 5.23-26, 5.23-30, 5.23-36
Migratory Bird Treaty Act, 1-29, 5.5-1, 5.5-17, 5.5-34, 5.5-35, 5.8-1, 5.23-26, 5.23-65, 5.23-66, 5.23-68, 5.23-69, 5.23-70
migratory birds, 1-26, 3-4, 5.3-25, 5.4-17, 5.5-1, 5.5-17, 5.5-28, 5.5-34, 5.9-5, 5.9-6, 5.10-20
Milepost, ES-18, ES-25, 1-17, 2-1, 2-2, 2-14, 2-16, 2-17, 2-18, 2-22, 2-26, 2-36, 2-55, 4-11, 4-14, 4-17, 4-19, 4-20, 5.1-3, 5.1-13, 5.1-21, 5.1-24, 5.2-3, 5.2-53, 5.2-62, 5.2-67, 5.2-68, 5.2-71, 5.2-72, 5.2-73, 5.2-74, 5.2-80, 5.3-2, 5.3-6, 5.3-7, 5.3-20, 5.3-26, 5.3-27, 5.3-28, 5.3-29, 5.3-30, 5.3-32, 5.4-4, 5.4-14, 5.4-15, 5.4-21, 5.4-22, 5.4-23, 5.4-25, 5.4-26, 5.4-27, 5.4-31, 5.4-32, 5.4-33, 5.5-14, 5.5-20, 5.5-24, 5.5-31, 5.5-32, 5.5-33, 5.5-33, 5.5-34, 5.5-36, 5.5-38, 5.5-40, 5.6-1, 5.6-3, 5.6-27, 5.6-28, 5.6-29, 5.6-30, 5.6-32, 5.6-33, 5.7-21, 5.8-30, 5.9-1, 5.9-2, 5.9-3, 5.9-5, 5.9-7, 5.9-8, 5.9-9, 5.9-10, 5.9-13, 5.9-14, 5.9-15, 5.9-16, 5.9-17, 5.9-18, 5.9-19, 5.9-20, 5.9-21, 5.9-22, 5.9-23, 5.9-24, 5.9-25, 5.9-26, 5.9-27, 5.9-28, 5.9-29, 5.9-30, 5.9-32, 5.9-33, 5.9-34, 5.9-36, 5.9-37, 5.9-38, 5.9-39, 5.9-40, 5.9-41, 5.9-42, 5.9-43, 5.9-44, 5.9-45, 5.9-46, 5.9-48, 5.9-49, 5.9-48, 5.9-49, 5.9-51, 5.9-54, 5.9-55, 5.10-12, 5.10-18, 5.10-20, 5.10-21, 5.10-22, 5.10-26, 5.10-28, 5.10-31, 5.10-32, 5.10-33, 5.10-34, 5.10-35, 5.10-36, 5.11-2, 5.11-6, 5.11-7, 5.11-8, 5.11-9, 5.11-14, 5.11-15, 5.11-17, 5.11-19, 5.11-21, 5.11-26, 5.11-27, 5.11-28, 5.11-30, 5.11-31, 5.11-32, 5.11-33, 5.11-34, 5.12-27, 5.12-28, 5.12-34, 5.12-35, 5.12-40, 5.12-42, 5.12-50, 5.13-3, 5.13-9, 5.13-16, 5.13-27, 5.13-30, 5.13-31, 5.13-35, 5.13-40, 5.15-1, 5.15-2, 5.15-158, 5.18-6, 5.18-10, 5.18-11, 5.19-3, 5.19-4, 5.22-5, 6-1, 6-3, 6-5, 6-6, 6-7, 6-8, 6-10, 6-13, 6-14, 6-23
Mineral Leasing Act, 1-1, 1-7, 1-8, 1-9, 1-27, 5.9-1, 5.23-66, 5.23-68
mineral resources, 1-1, 1-18, 1-27, 5.1-1, 5.1-20, 5.2-5, 5.2-21, 5.3-19, 5.4-3, 5.4-4, 5.4-11, 5.4-12, 5.4-15, 5.4-23, 5.4-31, 5.4-33, 5.5-5, 5.5-16, 5.5-30, 5.5-31, 5.8-7, 5.8-9, 5.8-10, 5.8-17, 5.8-35, 5.9-1, 5.9-7, 5.9-11, 5.9-12, 5.9-32, 5.9-37, 5.9-40, 5.9-41, 5.9-59, 5.10-25, 5.12-6, 5.12-26, 5.12-42, 5.13-7, 5.13-8, 5.13-23, 5.13-45, 5.13-49, 5.15-112, 5.15-113, 5.23-26, 5.23-66, 5.23-68, 5.23-69
Minerals Management Service, 5.8-17, 5.8-35, 5.8-36, 5.13-45, 5.13-48, 5.13-49
mitigation, ES-1, ES-11, ES-16, ES-22, ES-23, ES-26, 2-43, 4-21, 4-24, 4-26, 5-1, 5.2-1, 5.2-16, 5.2-61, 5.2-66, 5.2-67, 5.2-76, 5.2-77, 5.2-79, 5.3-1, 5.3-24, 5.3-25, 5.4-1, 5.4-18, 5.4-19, 5.5-1, 5.5-15, 5.5-28, 5.5-35, 5.5-40, 5.6-1, 5.6-2, 5.6-19, 5.6-21, 5.6-24, 5.6-26, 5.6-35, 5.8-8, 5.8-24, 5.9-36, 5.9-47, 5.9-52, 5.10-1, 5.11-13, 5.12-49, 5.15-6, 5.15-12, 5.15-13, 5.15-113, 5.15-137, 5.15-138, 5.15-154, 5.16-36, 5.17-8, 5.17-14, 5.17-15, 5.18-9, 5.19-12, 5.23-1, 5.23-3, 5.23-4, 5.23-10, 5.23-11, 5.23-13, 5.23-16, 5.23-19, 5.23-20, 5.23-21, 5.23-22, 5.23-23, 5.23-24, 5.23-25, 5.23-26, 5.23-27, 5.23-28, 5.23-29, 5.23-30, 5.23-31, 5.23-32, 5.23-35, 5.23-36, 5.23-38, 5.23-41, 5.23-42, 5.23-44, 5.23-45, 5.23-46, 5.23-47, 5.23-48, 5.23-50, 5.23-51, 5.23-52, 5.23-53, 5.23-55, 5.23-56, 5.23-58, 5.23-60, 5.23-61, 5.23-63, 5.23-64, 6-15
module, 2-17, 2-48 molt, 5.7-11, 5.8-21, 5.8-25 monitoring, 1-28, 2-42, 2-60, 5.1-22, 5.2-6, 5.2-
11, 5.2-15, 5.2-31, 5.2-46, 5.2-58, 5.3-24, 5.3-32, 5.3-35, 5.5-24, 5.5-28, 5.5-40, 5.8-6, 5.8-32, 5.9-47, 5.13-3, 5.15-6, 5.15-13, 5.15-150, 5.15-158, 5.15-177, 5.16-7, 5.16-12, 5.16-13, 5.16-14, 5.16-15, 5.16-17, 5.18-9, 5.19-1, 5.19-12, 5.21-4, 5.23-7, 5.23-10, 5.23-19, 5.23-20, 5.23-23, 5.23-25, 5.23-28, 5.23-31, 5.23-34, 5.23-38, 5.23-42, 5.23-52, 5.23-56, 5.23-81
Montana, ES-19, 5.1-25, 5.2-54, 5.2-56, 5.2-57, 5.2-60, 5.2-80, 5.6-13, 5.10-6, 5.10-9, 5.10-23, 5.10-28, 5.10-36, 5.13-27, 5.13-31, 6-11
montioring, 1-28, 2-42, 2-60, 5.1-22, 5.2-6, 5.2-11, 5.2-15, 5.2-31, 5.2-46, 5.2-58, 5.3-24, 5.3-32, 5.3-35, 5.5-24, 5.5-28, 5.5-40, 5.8-6, 5.8-32, 5.9-47, 5.13-3, 5.15-6, 5.15-13, 5.15-150, 5.15-158, 5.15-177, 5.16-7, 5.16-12, 5.16-13, 5.16-14, 5.16-15, 5.16-17, 5.18-9, 5.19-1, 5.19-12, 5.21-4, 5.23-7, 5.23-10, 5.23-19, 5.23-20, 5.23-23, 5.23-25, 5.23-28, 5.23-31, 5.23-34, 5.23-38, 5.23-42, 5.23-52, 5.23-56, 5.23-81
moraine, 5.1-7, 5.3-2

Alaska Stand Alone Gas Pipeline xv Final EIS
morphology, ES-16, 5.6-23, 5.7-9, 5.23-8, 5.23-13, 5.23-38, 5.23-41, 6-33, 6-44
morphs, 5.7-10 mowing, ES-14, ES-15, ES-16, ES-19, 5.2-66,
5.2-68, 5.3-21, 5.3-25, 5.4-16, 5.4-21, 5.5-35, 5.6-26, 5.6-29, 5.6-30, 5.6-33, 5.10-30, 5.23-45, 6-30, 6-31, 6-32, 6-33, 6-35
Municipal Light & Power, 4-3
N
National Ambient Air Quality Standards, 5.15-103, 5.15-104, 5.15-116, 5.15-129, 5.15-132, 5.15-138, 5.15-139, 5.15-141, 5.15-143, 5.15-145, 5.15-146, 5.15-152, 5.16-5, 5.16-7, 5.16-8, 5.16-9, 5.16-11, 5.16-12, 5.16-16, 5.16-36, 5.16-39
National Emission Standards for Hazardous Air Pollutants, 5.16-8, 5.16-13, 5.16-14
National Emissions Standards for Hazardous Air Pollutants, 5.16-14
National Environmental Policy Act, ES-1, ES-2, ES-6, 1-1, 1-6, 1-7, 1-8, 1-9, 1-12, 1-18, 1-23, 1-25, 1-27, 2-42, 3-1, 3-2, 4-1, 4-23, 4-24, 4-25, 4-28, 5.4-1, 5.8-1, 5.9-2, 5.12-18, 5.12-53, 5.13-1, 5.13-28, 5.13-47, 5.15-1, 5.15-25, 5.16-36, 5.21-1, 5.22-1, 5.23-1, 5.23-44, 5.23-65, 5.23-66, 5.23-67, 5.23-68, 5.23-69, 5.23-70, 5.23-71, 5.23-72, 5.23-89
National Flood Insurance Program, 5.2-16 National Historic Preservation Act, 1-27, 1-32,
5.13-1, 5.13-2, 5.13-27, 5.13-28 National Historic Preservation Act of 1986, 1-27,
1-32, 5.13-1, 5.13-2, 5.13-27, 5.13-28 National Hydrography Dataset, 5.2-3, 5.2-84 National Institute for Occupational Safety and
Health, 5.15-90 National Land Cover Database, 5.3-6, 5.3-8,
5.3-9, 5.3-10, 5.3-11, 5.3-12, 5.3-13, 5.3-20, 5.3-30
National Marine Fisheries Service, 1-12, 1-29, 5.3-32, 5.6-2, 5.6-20, 5.6-38, 5.7-1, 5.7-6, 5.7-7, 5.7-16, 5.7-22, 5.7-23, 5.8-1, 5.8-2, 5.8-4, 5.8-5, 5.8-6, 5.8-7, 5.8-8, 5.8-9, 5.8-10, 5.8-11, 5.8-12, 5.8-17, 5.8-18, 5.8-32, 5.8-33, 5.8-34, 5.8-35, 5.8-36, 5.21-4, 5.23-36, 5.23-44, 5.23-71, 5.23-73
National Oceanic and Atmospheric Administration, 1-12, 1-25, 1-29, 1-30, 5.6-9, 5.7-6, 5.7-7, 5.7-8, 5.7-9, 5.7-10, 5.7-11, 5.7-12, 5.7-13, 5.7-22, 5.7-23, 5.8-6, 5.8-8, 5.8-17, 5.8-18, 5.8-36, 5.15-142, 5.15-177, 5.19-11, 5.19-14
National Oceanic and Atmospheric Association, 1-12, 1-25, 1-29, 1-30, 5.6-9, 5.7-6, 5.7-7,
5.7-8, 5.7-9, 5.7-10, 5.7-11, 5.7-12, 5.7-13, 5.7-22, 5.7-23, 5.8-6, 5.8-8, 5.8-17, 5.8-18, 5.8-36, 5.15-142, 5.15-177, 5.19-11, 5.19-14
National Park Service, ES-11, ES-18, 1-1, 1-7, 1-8, 1-10, 1-23, 1-25, 1-30, 4-19, 5.1-1, 5.3-14, 5.3-15, 5.3-16, 5.3-17, 5.3-24, 5.3-36, 5.9-1, 5.9-2, 5.9-3, 5.9-5, 5.9-11, 5.9-33, 5.9-40, 5.9-51, 5.9-52, 5.9-54, 5.9-56, 5.9-60, 5.10-1, 5.10-2, 5.10-5, 5.10-18, 5.10-19, 5.10-21, 5.10-37, 5.10-38, 5.10-39, 5.11-3, 5.11-33, 5.11-35, 5.12-6, 5.13-44, 5.13-45, 5.23-45, 5.23-46, 5.23-53, 6-10
National Petroleum Reserve Alaska, 5.2-3, 5.8-21, 5.8-28
National Pollutant Discharge Elimination System, 1-9, 1-28, 1-30, 1-31, 5.2-15, 5.2-17, 17
National Register of Historic Places, 1-32, 5.13-2, 5.13-8, 5.13-9, 5.13-15, 5.13-25, 5.13-28, 5.13-31, 5.13-50, 5.22-4
National Response Center, 5.1-21, 5.1-26, 5.1-27, 5.15-157, 5.15-158, 5.15-177, 5.15-178
National Wetland Inventory, 15, 5.4-2, 5.4-4, 5.4-11, 5.4-12, 5.4-13, 5.4-14, 5.4-21, 5.4-22, 5.4-28, 5.4-31, 5.4-32
National Wetlands Inventory, ES-15, 5.4-2, 5.4-4, 5.4-11, 5.4-12, 5.4-13, 5.4-14, 5.4-21, 5.4-22, 5.4-28, 5.4-31, 5.4-32
National Wildlife Refuge, ES-19, 5.5-2, 5.9-5, 5.9-6, 5.9-34, 5.9-41, 5.9-61, 5.10-5, 5.10-8, 5.10-9, 5.10-10, 5.10-19, 5.10-20, 5.10-39, 5.11-6, 5.11-7, 5.11-8, 6-11
native plants, ES-14, ES-15, 5.1-23, 5.3-7, 5.3-14, 5.3-21, 5.3-24, 5.3-32, 5.3-35, 5.4-30, 5.5-27, 5.5-28, 5.23-18, 5.23-49, 6-30, 6-31
natural gas, ES-1, ES-2, ES-3, ES-6, ES-7, ES-8, ES-20, ES-21, ES-22, ES-23, ES-24, ES-25, 1-1, 1-3, 1-5, 1-6, 1-7, 1-9, 1-10, 1-11, 1-18, 1-25, 1-31, 2-1, 2-2, 2-15, 2-16, 2-17, 2-18, 2-50, 2-61, 3-1, 3-2, 4-1, 4-2, 4-3, 4-4, 4-5, 4-6, 4-7, 4-9, 4-10, 4-21, 4-23, 4-24, 4-28, 5.1-18, 5.2-5, 5.2-68, 5.3-28, 5.4-25, 5.5-40, 5.5-43, 5.9-1, 5.9-3, 5.9-40, 5.9-48, 5.11-12, 5.11-19, 5.12-25, 5.12-26, 5.12-31, 5.12-33, 5.12-43, 5.12-44, 5.13-3, 5.13-31, 5.15-1, 5.15-2, 5.15-8, 5.15-81, 5.15-82, 5.15-83, 5.15-88, 5.15-101, 5.15-124, 5.15-126, 5.15-129, 5.15-136, 5.15-138, 5.15-139, 5.15-140, 5.15-147, 5.15-148, 5.15-149, 5.15-151, 5.15-152, 5.15-153, 5.16-9, 5.16-12, 5.16-13, 5.16-14, 5.16-17, 5.16-18, 5.16-23, 5.16-27, 5.16-28, 5.16-30, 5.16-32, 5.16-35, 5.17-9, 5.17-10, 5.17-11, 5.17-12, 5.17-16, 5.19-1, 5.19-2, 5.19-7, 5.19-8, 5.19-10, 5.19-11, 5.21-5, 5.23-60, 5.23-61, 5.23-62, 5.23-66, 5.23-68, 6-1, 6-2, 6-12, 6-15, 6-17, 6-16, 6-18, 6-19, 6-23

Alaska Stand Alone Gas Pipeline xvi Final EIS
Natural Gas Liquid Extraction Plant, ES-20, 1-3, 2-1, 2-2, 2-10, 2-11, 2-14, 2-15, 2-16, 2-17, 2-18, 2-19, 2-22, 2-24, 2-48, 2-50, 2-56, 3-1, 4-7, 4-21, 5.2-74, 5.3-28, 5.3-30, 5.4-25, 5.4-26, 5.4-27, 5.5-29, 5.5-38, 5.5-39, 5.6-30, 5.10-8, 5.10-11, 5.10-27, 5.10-33, 5.10-34, 5.11-12, 5.11-13, 5.11-23, 5.11-25, 5.11-28, 5.11-29, 5.12-36, 5.12-37, 5.12-38, 5.12-41, 5.12-42, 5.12-46, 5.13-3, 5.13-36, 5.13-38, 5.13-39, 5.15-88, 5.18-11, 6-1, 6-8
natural gas liquids, ES-1, ES-3, 1-1, 1-3, 2-16, 3-1, 4-1, 5.5-40, 5.11-12, 5.15-1, 5.15-81, 5.15-88, 5.17-10, 6-1
Natural Heritage Program, 5.3-7, 5.3-34, 5.3-35, 5.5-24
Natural Liquified Gas, ES-1, ES-11, 23, 26, 1-5, 1-11, 2-14, 2-17, 2-18, 2-19, 2-56, 2-59, 2-60, 4-7, 4-8, 5.2-64, 5.2-74, 5.5-40, 5.9-14, 5.9-19, 5.15-124, 5.16-9, 5.16-12, 5.16-14, 5.16-24, 5.16-25, 5.16-30, 5.16-31, 5.16-32, 5.17-5, 5.17-10, 5.17-12, 5.19-13, 5.22-2, 6-28
Natural Resources Conservation Service, 5.9-27, 5.9-61
navigable waters, 1-1, 1-7, 1-8, 1-11, 1-27, 1-28, 1-29, 5.2-15, 5.2-16, 5.15-86, 5.18-1, 5.18-2, 5.18-3, 5.18-5, 5.18-10, 5.18-11, 5.23-65, 6-46, 6-48, 6-50
Nebraska, 5.16-2, 5.16-3 New Source Review, 5.16-8, 5.16-10, 5.16-11,
5.16-12, 5.16-16, 5.16-17, 5.16-36 nitrogen dioxide, 5.16-5, 5.16-6, 5.16-7, 5.16-9,
5.16-11 No Action Alternative, ES-1, ES-6, ES-26, 4-1,
4-2, 4-23, 5.1-19, 5.2-61, 5.3-18, 5.4-13, 1, 5.5-28, 5.6-14, 5.7-14, 5.8-1, 5.8-4, 5.9-39, 5.10-27, 5.11-12, 5.12-25, 5.13-29, 5.16-18, 5.17-6, 5.18-7, 5.21-1, 5.22-1, 6-2, 6-3, 6-14, 6-15, 6-21, 6-22, 6-23, 6-25, 6-42, 6-43
noise, ES-15, ES-17, ES-18, ES-19, ES-20, ES-21, ES-22, ES-26, 3-5, 3-6, 5.5-2, 5.5-24, 5.5-27, 5.5-29, 5.5-33, 5.5-39, 5.5-40, 5.6-23, 5.7-14, 5.7-15, 5.7-16, 5.7-17, 5.7-19, 5.7-20, 5.7-21, 5.7-24, 5.8-7, 5.8-8, 5.8-9, 5.8-10, 5.8-16, 5.8-19, 5.8-23, 5.8-24, 5.8-30, 5.8-31, 5.8-32, 5.9-55, 5.10-29, 5.10-30, 5.10-33, 5.10-34, 5.10-35, 5.10-36, 5.10-37, 5.12-25, 5.12-36, 5.12-48, 5.12-49, 5.13-28, 5.13-35, 5.13-36, 5.15-7, 5.15-8, 5.15-107, 5.15-130, 5.15-158, 5.17-1, 5.17-2, 5.17-3, 5.17-4, 5.17-5, 5.17-6, 5.17-7, 5.17-8, 5.17-9, 5.17-10, 5.17-11, 5.17-12, 5.17-13, 5.17-14, 5.17-15, 5.17-16, 5.17-17, 5.21-2, 5.21-4, 5.23-26, 5.23-28, 5.23-38, 5.23-44, 5.23-63, 5.23-64, 5.23-70, 6-10, 6-13, 6-13, 6-14, 6-17, 6-23, 6-27, 6-28, 6-29, 6-31, 6-32, 6-33, 6-34, 6-35, 6-38, 6-40, 6-41, 6-44
Non-native Invasive Plants, ES-14, ES-15, 5.2-66, 5.3-22, 5.3-24, 5.3-25, 5.3-29, 5.3-32, 5.4-18, 5.4-19, 5.4-21, 5.4-25, 5.4-30, 5.5-28, 5.5-40, 5.6-26, 5.23-17, 5.23-22, 5.23-23, 5.23-25, 5.23-26
North Slope, 5.6-15 North Slope Borough, 1-19, 1-25, 1-33, 2-1, 5.2-
17, 5.2-33, 5.2-83, 5.13-1, 5.13-8, 5.13-11 Notice of Intent, 5, 1-1, 1-15, 4-4 noxious weeds, 5.3-14, 5.4-19, 5.5-40
O
Occupational Safety and Health Administration, 5.2-73, 5.15-105
Office of History and Archaeology, 1-32, 5.13-1, 5.13-4, 5.13-8, 5.13-9, 5.13-11, 5.13-16, 5.13-18, 5.13-25, 5.13-27, 5.13-30, 5.13-41, 5.23-55, 5.23-56
Oil Discharge Prevention and Contingency Plan, 2-26
Oklahoma, 5.7-24, 5.13-47 Operation and Maintenance, ES-20, ES-23, 2-
27, 2-54, 2-59, 2-60, 5.10-8, 5.10-11, 5.12-31, 5.12-32, 5.12-34, 5.12-35, 5.12-36, 5.12-37, 5.12-38, 5.12-39, 5.12-41, 5.12-42, 5.12-46, 5.12-50, 5.15-124, 5.15-126, 5.15-131, 5.15-132, 5.19-7, 5.19-11, 5.23-7, 5.23-8, 5.23-9, 5.23-54, 6-5, 6-12
Operation and Material Sites, 5.1-22 operations abnormal, 2-60, 2-61, 5.19-7 normal, 2-60, 5.18-4, 5.23-8 operations impacts, 5-1 Operations Phase, 5.11-20, 5.11-21, 5.11-34 opportunistic, 5.5-38, 5.8-7, 5.15-37 ordinary high water mark, 5.2-67, 5.6-28, 5.6-31,
5.18-4, 10, 43, 74 organic matter, ES-13, 5.1-1, 5.1-8, 5.2-61, 5.4-
4, 5.6-18, 6-26 overburden, 2-35, 5.1-19, 5.23-21
P
Paleo-Arctic tradition, 5.13-4 paleontology, ES-12, ES-13, ES-24, 5.1-1, 5.1-
18, 5.1-19, 5.1-20, 5.1-26, 5.1-27, 5.23-66, 5.23-68, 6-4, 6-26, 6-29, 6-46, 6-47, 6-48, 6-49, 6-50, 6-51
palsas, 5.11-7 palustrine, 5.4-4 palustrine emergent wetland, 5.4-3, 5.4-4, 5.4-
10, 5.4-14, 5.4-22, 5.4-28, 5.4-32
Alaska Stand Alone Gas Pipeline xvii Final EIS
palustrine forested wetland, 5.4-2, 5.4-14, 5.4-22, 5.4-28, 5.4-32, 6-6
palustrine scrub shrub wetland, 5.4-3, 5.4-10, 5.4-14, 5.4-22, 5.4-28, 5.4-32
Particulate Matter, 1-17, 5.15-85, 5.15-103, 5.15-104, 5.15-116, 5.15-124, 5.15-129, 5.15-132, 5.15-139, 5.15-140, 5.15-141, 5.15-143, 5.15-144, 5.15-145, 5.15-146, 5.15-147, 5.15-148, 5.15-149, 5.15-150, 5.15-152, 5.15-174, 5.15-185, 5.16-5, 5.16-6, 5.16-7, 5.16-8, 5.16-9, 5.16-11, 5.16-12, 5.16-16, 5.16-18, 5.16-21, 5.16-22, 5.16-24, 5.16-25, 5.16-26, 5.16-27, 5.16-28, 5.16-29, 5.16-30, 5.16-31, 5.16-32, 5.16-33, 5.16-34, 5.16-35, 5.16-36, 5.16-37, 5.23-61, 6-16, 6-27
pelagic, 5.7-13, 5.8-18 permafrost, ES-11, ES-12, ES-13, 2-36, 3-2, 4-
14, 5.1-1, 5.1-4, 5.1-5, 5.1-6, 5.1-7, 5.1-8, 5.1-9, 5.1-10, 5.1-11, 5.1-13, 5.1-14, 5.1-18, 5.1-19, 5.1-20, 5.1-21, 5.1-22, 5.1-23, 5.1-24, 5.1-25, 5.2-8, 5.2-23, 5.2-24, 5.2-31, 5.2-33, 5.2-34, 5.2-41, 5.2-48, 5.2-55, 5.2-66, 5.2-71, 5.2-77, 5.3-2, 5.3-3, 5.3-4, 5.3-5, 5.3-32, 5.4-3, 5.4-29, 5.5-6, 5.6-33, 5.13-14, 5.23-4, 6-3, 6-4, 6-25, 6-26, 6-27, 6-29, 6-46, 6-47, 6-48, 6-49, 6-50, 6-51
permits, ES-11, ES-16, ES-17, ES-19, ES-24, ES-25, 1-1, 1-7, 1-8, 1-9, 1-10, 1-25, 1-27, 1-28, 1-29, 1-30, 1-31, 1-32, 1-33, 1-34, 2-26, 2-27, 2-35, 2-39, 2-40, 2-43, 2-46, 2-58, 4-5, 4-6, 4-9, 4-10, 4-19, 4-24, 4-25, 4-26, 5-1, 5.2-15, 5.2-16, 5.2-17, 5.2-63, 5.2-73, 5.4-13, 5.5-1, 5.5-2, 5.5-34, 5.5-35, 5.6-2, 5.6-9, 5.6-14, 5.6-18, 5.6-19, 5.6-20, 5.6-24, 5.6-25, 5.6-27, 5.6-30, 5.6-31, 5.8-1, 5.9-3, 5.9-7, 5.9-8, 5.9-9, 5.9-10, 5.9-11, 5.9-12, 5.9-14, 5.9-28, 5.9-29, 5.9-37, 5.9-40, 5.9-41, 5.9-43, 5.9-45, 5.9-46, 5.9-47, 5.9-51, 5.9-52, 5.9-55, 5.10-1, 5.10-3, 5.10-30, 5.10-31, 5.13-2, 5.15-87, 5.15-88, 5.15-98, 5.15-104, 5.15-125, 5.15-129, 5.15-154, 5.16-8, 5.16-10, 5.16-11, 5.16-12, 5.16-15, 5.16-17, 5.16-21, 5.16-22, 5.16-23, 5.16-26, 5.16-28, 5.16-29, 5.16-31, 5.16-32, 5.16-33, 5.16-35, 5.18-1, 5.18-2, 5.18-4, 5.18-6, 5.19-1, 5.19-13, 5.21-2, 5.22-4, 5.23-1, 5.23-2, 5.23-3, 5.23-6, 5.23-11, 5.23-17, 5.23-18, 5.23-20, 5.23-24, 5.23-26, 5.23-27, 5.23-36, 5.23-37, 5.23-38, 5.23-39, 5.23-43, 5.23-44, 5.23-53, 5.23-54, 5.23-61, 5.23-65, 5.23-66, 5.23-67, 5.23-68, 5.23-69, 5.23-70, 5.23-71, 5.23-72, 5.23-73, 5.23-74, 5.23-75, 5.23-76, 5.23-77, 5.23-78, 5.23-79, 5.23-80, 5.23-81, 5.23-82, 5.23-83, 5.23-84, 5.23-85, 5.23-86, 5.23-87, 5.23-88, 6-16, 6-36
petroleum hydrocarbon, 5.2-54
Petroleum Systems Integrity Office, 5.19-1, 5.19-14
photosynthesis, 5.3-23, 5.3-31, 5.4-29, 6-30, 6-31
pig, ES-20, 1-3, 2-1, 2-2, 2-14, 2-15, 2-17, 2-18, 2-22, 2-50, 5.2-74, 5.2-75, 5.4-25, 5.4-31, 5.10-34, 5.11-28, 5.11-29, 5.12-37, 5.12-38, 5.13-3, 5.135.23--37, 5.16-24, 5.16-32, 5.17-10, 5.22-2, 48, 6-11, 6-19
pig launcher, ES-20, 1-3, 2-2, 2-14, 2-15, 2-17, 2-18, 2-22, 2-50, 5.2-74, 5.2-75, 5.4-25, 5.10-34, 5.11-23, 5.11-28, 5.11-29, 5.12-37, 5.12-38, 5.13-3, 5.13-37, 5.16-24, 5.16-32, 5.17-13, 5.22-2, 5.23-48, 6-11, 6-19
pigging facilities, ES-11, 4-21, 5.2-63, 5.12-38 pipe bending, 2-34, 5.19-12 stringing, 2-22, 2-32, 2-34, 2-39, 2-46, 5.4-11,
5.5-27, 5.5-33 welding, 2-32, 2-34, 2-39, 2-46, 5.5-27, 5.19-2 pipe storage sites, ES-11, 4-21 Pipeline and Hazardous Materials Safety
Administration, 1-1, 1-7, 1-8, 1-11, 1-23, 1-29, 2-48, 5.15-126, 5.15-127, 5.15-135, 5.15-178, 5.19-1, 5.19-2, 5.19-8, 5.19-10, 5.19-11, 5.19-13, 5.19-14
Pipeline Hazardous Material Safety Administration, 1-1, 1-7, 1-8, 1-11, 1-23, 1-29, 2-48, 5.15-126, 5.15-127, 5.15-135, 5.15-178, 5.19-1, 5.19-2, 5.19-8, 5.19-10, 5.19-11, 5.19-13, 5.19-14
Pipeline Route Alternatives, ES-6, ES-8, 4-1, 4-11, 4-14, 4-28
polychlorinated biphenyls, 5.2-7 Port of Anchorage, ES-17, ES-18, 5.7-1, 5.7-12,
5.7-13, 5.7-14, 5.7-15, 5.7-20, 5.7-21, 5.7-23, 5.8-3, 5.8-7, 5.8-8, 5.8-10, 5.8-18, 5.8-19, 5.18-6, 5.18-7, 5.18-8, 5.18-12, 5.23-44
Port of Seward, ES-17, ES-18, ES-26, 2-24, 5.6-19, 5.6-20, 5.7-1, 5.7-7, 5.7-13, 5.7-14, 5.7-15, 5.7-16, 5.7-17, 5.7-18, 5.7-20, 5.8-3, 5.8-4, 5.8-8, 5.8-9, 5.8-10, 5.8-18, 5.8-19, 5.18-6, 5.18-7, 5.18-8, 5.23-44
potential impacts, ES-13, ES-14, ES-15, ES-16, ES-17, ES-18, ES-21, ES-23, 1-1, 2-14, 2-42, 2-43, 3-5, 4-2, 4-17, 4-26, 5.1-23, 5.2-7, 5.2-61, 5.2-65, 5.2-66, 5.2-69, 5.2-71, 5.2-72, 5.2-73, 5.2-74, 5.2-75, 5.2-77, 5.3-18, 5.3-23, 5.3-31, 5.4-2, 5.4-13, 5.4-16, 5.4-17, 5.4-24, 5.4-25, 5.4-30, 5.4-34, 5.4-35, 5.5-26, 5.5-30, 5.5-35, 5.6-18, 5.6-19, 5.6-20, 5.6-24, 5.6-29, 5.6-33, 5.7-14, 5.7-23, 5.8-4, 5.8-16, 5.8-31, 5.9-1, 5.9-47, 5.10-27, 5.10-28, 5.10-30, 5.10-37, 5.11-1, 5.12-30, 5.15-8, 5.15-25, 5.16-15, 5.18-1, 5.18-8, 5.18-10, 5.19-6, 5.21-4, 5.22-
Alaska Stand Alone Gas Pipeline xviii Final EIS
1, 5.22-3, 1, 10, 12, 17, 23, 26, 37, 44, 52, 6-8, 6-23, 6-28, 6-38, 6-45
Potentially Affected Communities, 5.15-12, 5.15-13, 5.15-14, 5.15-15, 5.15-25, 5.15-26, 5.15-27, 5.15-28, 5.15-29, 5.15-34, 5.15-35, 5.15-74, 5.15-76, 5.15-87, 5.15-103, 5.15-105, 5.15-109, 5.15-115, 5.15-119, 5.15-122, 5.15-123, 5.15-125, 5.15-129, 5.15-133, 5.15-134, 5.15-135, 5.15-136
prehistory, 5.13-3, 5.13-11 Preliminary Jurisdictional Determination, ES-15,
5.4-1, 5.4-2, 5.4-4, 5.4-33, 5.23-19 Prevention of Significant Deterioration, 1-9, 1-
28, 1-30, 5.15-129, 5.16-8, 5.16-10, 5.16-11, 5.16-12, 5.16-16, 5.16-17, 5.16-22, 5.16-23, 5.16-26, 5.16-28, 5.16-29, 5.16-31, 5.16-35, 5.16-36, 5.23-61, 5.23-81, 6-16
Programmatic Agreement, 5.13-2, 5.13-9, 5.13-41, 5.13-45, 5.15-170, 5.15-172, 5.15-176
Project facilities, ES-3, ES-20, 2-1, 2-20, 2-54, 5.8-16, 5.9-7, 5.9-36, 5.9-53, 5.10-26, 5.10-30
Project Purpose and Need, 1-3, 1-7, 4-7 property value, 5.12-1, 5.12-25, 5.12-26, 5.12-
27, 5.12-31, 5.12-32, 5.12-33, 5.12-34, 5.12-35, 5.12-36, 5.12-37, 5.12-39, 5.12-40, 5.12-41, 5.12-42, 5.12-46
public services, ES-19, 5.9-8, 5.9-38, 5.10-29, 5.10-30
Public Water Systems, 5.2-7, 5.2-9, 5.2-31, 5.2-38, 5.2-46, 5.2-51, 5.2-58
pump stations, 5.9-29, 5.13-18, 5.15-20
Q
R
railroad, ES-19, ES-21, ES-23, 2-22, 2-24, 2-27, 2-33, 2-46, 2-60, 4-11, 4-20, 5.3-27, 5.4-11, 5.5-25, 5.8-8, 5.9-26, 5.9-27, 5.9-45, 5.9-51, 5.9-56, 5.11-4, 5.11-8, 5.11-9, 5.11-13, 5.11-23, 5.13-14, 5.13-15, 5.13-18, 5.13-24, 5.13-37, 5.15-2, 5.15-91, 5.15-92, 5.15-93, 5.15-94, 5.15-95, 5.15-103, 5.19-2, 5.19-12, 5.22-2, 6-10, 6-15
reclamation, 1-32, 5.5-27, 5.9-14, 5.11-31, 5.22-2, 5.22-3, 5.23-11, 5.23-52
Record of Decision, 1-22, 4-25, 4-26, 5.9-40, 5.9-60, 5.9-61, 5.11-2, 5.11-35
Regional Integrated Resource Plan, 4-27 rehabilitation, ES-14, ES-15, ES-17, 5.1-20, 5.3-
19, 5.3-22, 5.3-23, 5.3-24, 5.15-56, 5.23-18, 5.23-23, 5.23-25, 5.23-49, 6-31, 6-35
residential construction, 1-4, 1-5, 4-17, 5.2-6, 5.9-13, 5.9-29, 5.9-38, 5.9-50, 5.9-55, 5.11-8, 5.11-13, 5.11-14, 5.11-31, 5.15-33, 5.15-139, 5.15-140, 5.15-146, 5.15-147, 5.15-149, 5.15-150, 5.15-151, 5.16-5, 5.17-4, 5.21-1, 5.22-4
Resource Management Plans, 5.9-30, 5.10-4, 5.10-26, 5.11-2, 5.11-3
Resources Conservation and Recovery Act, 1-10, 1-28
responses, ES-1, ES-5, ES-6, ES-21, 1-10, 1-11, 1-15, 1-24, 1-28, 1-33, 2-26, 2-61, 3-7, 5.1-6, 5.1-14, 5.1-18, 5.2-7, 5.2-11, 5.2-15, 5.2-82, 5.3-34, 5.4-25, 5.4-26, 5.4-34, 5.5-41, 5.5-48, 5.6-40, 5.7-22, 5.8-32, 5.8-38, 5.12-52, 5.13-2, 5.13-8, 5.13-23, 5.15-5, 5.15-86, 5.15-99, 5.15-105, 5.15-134, 5.15-158, 5.15-165, 5.15-167, 5.15-178, 5.16-35, 5.16-36, 5.16-38, 5.17-2, 5.17-3, 5.18-9, 5.19-1, 5.19-7, 5.19-12, 5.23-8, 5.23-14, 5.23-34, 5.23-66, 5.23-68, 5.23-69, 6-14
restoration, 1-26, 2-35, 2-39, 2-40, 2-43, 5.3-24, 5.4-35, 5.9-47, 5.11-13, 5.11-29, 5.11-31, 5.19-7, 5.21-4, 5.22-2, 5.22-3, 5.23-18, 5.23-19, 5.23-37, 5.23-49
revegetation, ES-16, 2-35, 2-43, 5.1-20, 5.2-77, 5.3-14, 5.3-23, 5.3-24, 5.3-26, 5.3-35, 5.3-37, 5.4-18, 5.4-19, 5.4-35, 5.5-27, 5.5-28, 5.23-2, 5.23-16, 5.23-17, 5.23-18, 5.23-21, 5.23-24, 5.23-25, 5.23-49, 5.23-51, 5.23-52, 5.23-89
Richardson Highway Route Alternative, ES-8, 4-11, 4-13, 4-24
richness, 5.4-30 right-of-way, ES-1, ES-7, ES-8, ES-11, ES-13,
ES-14, ES-15, ES-16, ES-18, ES-19, ES-20, ES-21, ES-22, ES-25, ES-26, 1-1, 1-7, 1-9, 1-10, 1-11, 1-25, 1-27, 1-32, 1-33, 2-15, 2-19, 2-20, 2-22, 2-24, 2-26, 2-28, 2-31, 2-34, 2-35, 2-36, 2-42, 2-48, 2-54, 2-57, 2-59, 2-60, 4-8, 4-11, 4-13, 4-19, 4-20, 4-21, 5.1-20, 5.1-21, 5.1-23, 5.1-24, 5.2-1, 5.2-2, 5.2-3, 5.2-4, 5.2-5, 5.2-9, 5.2-23, 5.2-24, 5.2-26, 5.2-36, 5.2-38, 5.2-40, 5.2-46, 5.2-50, 5.2-51, 5.2-60, 5.2-61, 5.2-63, 5.2-65, 5.2-66, 5.2-67, 5.2-68, 5.2-69, 5.2-71, 5.2-72, 5.2-73, 5.2-74, 5.2-75, 5.2-76, 5.2-80, 5.3-1, 5.3-6, 5.3-18, 5.3-19, 5.3-20, 5.3-21, 5.3-22, 5.3-23, 5.3-24, 5.3-25, 5.3-26, 5.3-27, 5.3-28, 5.3-29, 5.3-31, 5.3-32, 5.3-33, 5.4-1, 5.4-2, 5.4-11, 5.4-12, 5.4-13, 5.4-14, 5.4-15, 5.4-16, 5.4-17, 5.4-18, 5.4-19, 5.4-20, 5.4-21, 5.4-22, 5.4-23, 5.4-25, 5.4-27, 5.4-28, 5.4-29, 5.4-31, 5.4-33, 1, 2, 5.5-1, 5.5-2, 5.5-3, 5.5-4, 5.5-5, 5.5-10, 5.5-14, 5.5-16, 5.5-17, 5.5-19, 5.5-20, 5.5-24, 5.5-25, 5.5-26, 5.5-27, 5.5-28, 5.5-29, 5.5-30, 5.5-31, 5.5-33, 5.5-34, 5.5-35, 5.5-36, 5.5-37, 5.5-40, 5.6-1, 5.6-5, 5.6-9, 5.6-17, 5.6-20, 5.6-26, 5.6-28,
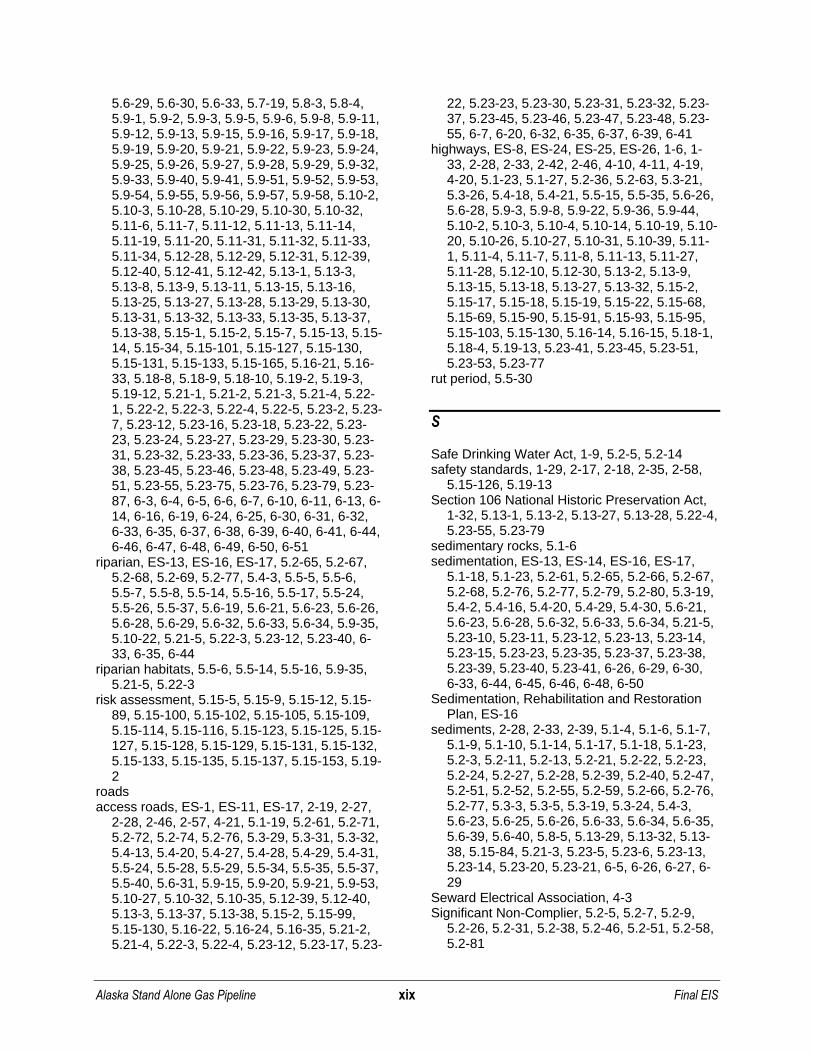
Alaska Stand Alone Gas Pipeline xix Final EIS
5.6-29, 5.6-30, 5.6-33, 5.7-19, 5.8-3, 5.8-4, 5.9-1, 5.9-2, 5.9-3, 5.9-5, 5.9-6, 5.9-8, 5.9-11, 5.9-12, 5.9-13, 5.9-15, 5.9-16, 5.9-17, 5.9-18, 5.9-19, 5.9-20, 5.9-21, 5.9-22, 5.9-23, 5.9-24, 5.9-25, 5.9-26, 5.9-27, 5.9-28, 5.9-29, 5.9-32, 5.9-33, 5.9-40, 5.9-41, 5.9-51, 5.9-52, 5.9-53, 5.9-54, 5.9-55, 5.9-56, 5.9-57, 5.9-58, 5.10-2, 5.10-3, 5.10-28, 5.10-29, 5.10-30, 5.10-32, 5.11-6, 5.11-7, 5.11-12, 5.11-13, 5.11-14, 5.11-19, 5.11-20, 5.11-31, 5.11-32, 5.11-33, 5.11-34, 5.12-28, 5.12-29, 5.12-31, 5.12-39, 5.12-40, 5.12-41, 5.12-42, 5.13-1, 5.13-3, 5.13-8, 5.13-9, 5.13-11, 5.13-15, 5.13-16, 5.13-25, 5.13-27, 5.13-28, 5.13-29, 5.13-30, 5.13-31, 5.13-32, 5.13-33, 5.13-35, 5.13-37, 5.13-38, 5.15-1, 5.15-2, 5.15-7, 5.15-13, 5.15-14, 5.15-34, 5.15-101, 5.15-127, 5.15-130, 5.15-131, 5.15-133, 5.15-165, 5.16-21, 5.16-33, 5.18-8, 5.18-9, 5.18-10, 5.19-2, 5.19-3, 5.19-12, 5.21-1, 5.21-2, 5.21-3, 5.21-4, 5.22-1, 5.22-2, 5.22-3, 5.22-4, 5.22-5, 5.23-2, 5.23-7, 5.23-12, 5.23-16, 5.23-18, 5.23-22, 5.23-23, 5.23-24, 5.23-27, 5.23-29, 5.23-30, 5.23-31, 5.23-32, 5.23-33, 5.23-36, 5.23-37, 5.23-38, 5.23-45, 5.23-46, 5.23-48, 5.23-49, 5.23-51, 5.23-55, 5.23-75, 5.23-76, 5.23-79, 5.23-87, 6-3, 6-4, 6-5, 6-6, 6-7, 6-10, 6-11, 6-13, 6-14, 6-16, 6-19, 6-24, 6-25, 6-30, 6-31, 6-32, 6-33, 6-35, 6-37, 6-38, 6-39, 6-40, 6-41, 6-44, 6-46, 6-47, 6-48, 6-49, 6-50, 6-51
riparian, ES-13, ES-16, ES-17, 5.2-65, 5.2-67, 5.2-68, 5.2-69, 5.2-77, 5.4-3, 5.5-5, 5.5-6, 5.5-7, 5.5-8, 5.5-14, 5.5-16, 5.5-17, 5.5-24, 5.5-26, 5.5-37, 5.6-19, 5.6-21, 5.6-23, 5.6-26, 5.6-28, 5.6-29, 5.6-32, 5.6-33, 5.6-34, 5.9-35, 5.10-22, 5.21-5, 5.22-3, 5.23-12, 5.23-40, 6-33, 6-35, 6-44
riparian habitats, 5.5-6, 5.5-14, 5.5-16, 5.9-35, 5.21-5, 5.22-3
risk assessment, 5.15-5, 5.15-9, 5.15-12, 5.15-89, 5.15-100, 5.15-102, 5.15-105, 5.15-109, 5.15-114, 5.15-116, 5.15-123, 5.15-125, 5.15-127, 5.15-128, 5.15-129, 5.15-131, 5.15-132, 5.15-133, 5.15-135, 5.15-137, 5.15-153, 5.19-2
roads access roads, ES-1, ES-11, ES-17, 2-19, 2-27,
2-28, 2-46, 2-57, 4-21, 5.1-19, 5.2-61, 5.2-71, 5.2-72, 5.2-74, 5.2-76, 5.3-29, 5.3-31, 5.3-32, 5.4-13, 5.4-20, 5.4-27, 5.4-28, 5.4-29, 5.4-31, 5.5-24, 5.5-28, 5.5-29, 5.5-34, 5.5-35, 5.5-37, 5.5-40, 5.6-31, 5.9-15, 5.9-20, 5.9-21, 5.9-53, 5.10-27, 5.10-32, 5.10-35, 5.12-39, 5.12-40, 5.13-3, 5.13-37, 5.13-38, 5.15-2, 5.15-99, 5.15-130, 5.16-22, 5.16-24, 5.16-35, 5.21-2, 5.21-4, 5.22-3, 5.22-4, 5.23-12, 5.23-17, 5.23-
22, 5.23-23, 5.23-30, 5.23-31, 5.23-32, 5.23-37, 5.23-45, 5.23-46, 5.23-47, 5.23-48, 5.23-55, 6-7, 6-20, 6-32, 6-35, 6-37, 6-39, 6-41
highways, ES-8, ES-24, ES-25, ES-26, 1-6, 1-33, 2-28, 2-33, 2-42, 2-46, 4-10, 4-11, 4-19, 4-20, 5.1-23, 5.1-27, 5.2-36, 5.2-63, 5.3-21, 5.3-26, 5.4-18, 5.4-21, 5.5-15, 5.5-35, 5.6-26, 5.6-28, 5.9-3, 5.9-8, 5.9-22, 5.9-36, 5.9-44, 5.10-2, 5.10-3, 5.10-4, 5.10-14, 5.10-19, 5.10-20, 5.10-26, 5.10-27, 5.10-31, 5.10-39, 5.11-1, 5.11-4, 5.11-7, 5.11-8, 5.11-13, 5.11-27, 5.11-28, 5.12-10, 5.12-30, 5.13-2, 5.13-9, 5.13-15, 5.13-18, 5.13-27, 5.13-32, 5.15-2, 5.15-17, 5.15-18, 5.15-19, 5.15-22, 5.15-68, 5.15-69, 5.15-90, 5.15-91, 5.15-93, 5.15-95, 5.15-103, 5.15-130, 5.16-14, 5.16-15, 5.18-1, 5.18-4, 5.19-13, 5.23-41, 5.23-45, 5.23-51, 5.23-53, 5.23-77
rut period, 5.5-30
S
Safe Drinking Water Act, 1-9, 5.2-5, 5.2-14 safety standards, 1-29, 2-17, 2-18, 2-35, 2-58,
5.15-126, 5.19-13 Section 106 National Historic Preservation Act,
1-32, 5.13-1, 5.13-2, 5.13-27, 5.13-28, 5.22-4, 5.23-55, 5.23-79
sedimentary rocks, 5.1-6 sedimentation, ES-13, ES-14, ES-16, ES-17,
5.1-18, 5.1-23, 5.2-61, 5.2-65, 5.2-66, 5.2-67, 5.2-68, 5.2-76, 5.2-77, 5.2-79, 5.2-80, 5.3-19, 5.4-2, 5.4-16, 5.4-20, 5.4-29, 5.4-30, 5.6-21, 5.6-23, 5.6-28, 5.6-32, 5.6-33, 5.6-34, 5.21-5, 5.23-10, 5.23-11, 5.23-12, 5.23-13, 5.23-14, 5.23-15, 5.23-23, 5.23-35, 5.23-37, 5.23-38, 5.23-39, 5.23-40, 5.23-41, 6-26, 6-29, 6-30, 6-33, 6-44, 6-45, 6-46, 6-48, 6-50
Sedimentation, Rehabilitation and Restoration Plan, ES-16
sediments, 2-28, 2-33, 2-39, 5.1-4, 5.1-6, 5.1-7, 5.1-9, 5.1-10, 5.1-14, 5.1-17, 5.1-18, 5.1-23, 5.2-3, 5.2-11, 5.2-13, 5.2-21, 5.2-22, 5.2-23, 5.2-24, 5.2-27, 5.2-28, 5.2-39, 5.2-40, 5.2-47, 5.2-51, 5.2-52, 5.2-55, 5.2-59, 5.2-66, 5.2-76, 5.2-77, 5.3-3, 5.3-5, 5.3-19, 5.3-24, 5.4-3, 5.6-23, 5.6-25, 5.6-26, 5.6-33, 5.6-34, 5.6-35, 5.6-39, 5.6-40, 5.8-5, 5.13-29, 5.13-32, 5.13-38, 5.15-84, 5.21-3, 5.23-5, 5.23-6, 5.23-13, 5.23-14, 5.23-20, 5.23-21, 6-5, 6-26, 6-27, 6-29
Seward Electrical Association, 4-3 Significant Non-Complier, 5.2-5, 5.2-7, 5.2-9,
5.2-26, 5.2-31, 5.2-38, 5.2-46, 5.2-51, 5.2-58, 5.2-81
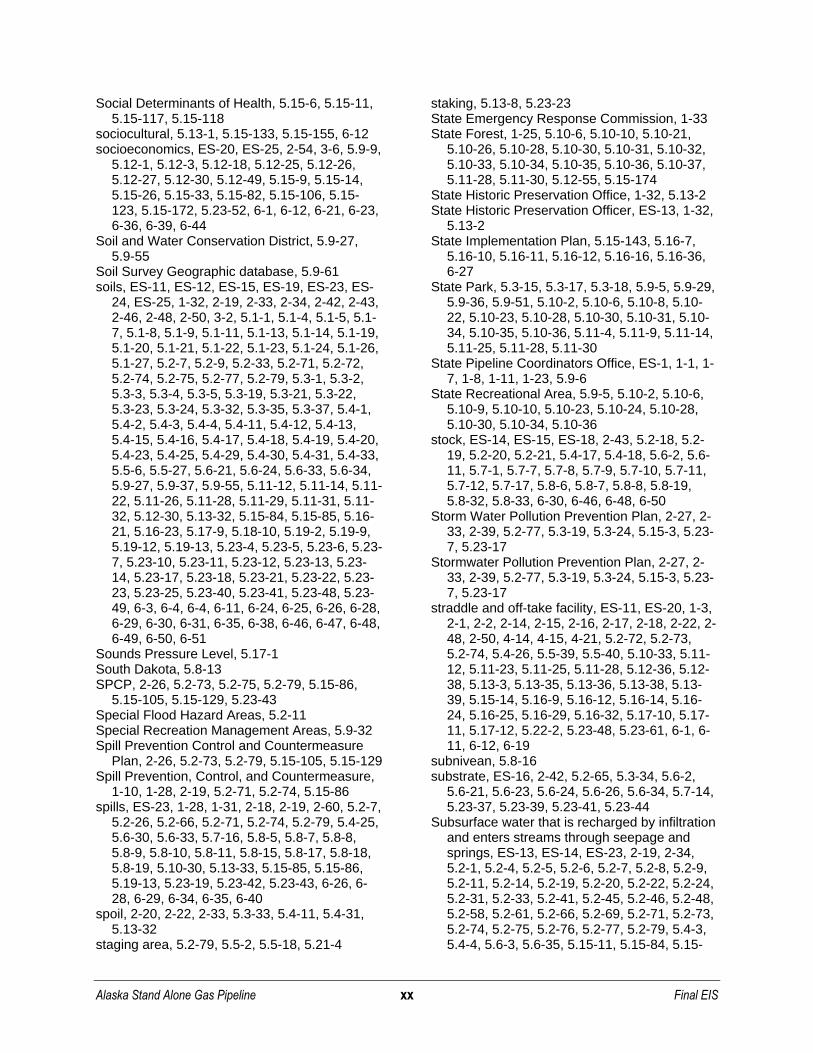
Alaska Stand Alone Gas Pipeline xx Final EIS
Social Determinants of Health, 5.15-6, 5.15-11, 5.15-117, 5.15-118
sociocultural, 5.13-1, 5.15-133, 5.15-155, 6-12 socioeconomics, ES-20, ES-25, 2-54, 3-6, 5.9-9,
5.12-1, 5.12-3, 5.12-18, 5.12-25, 5.12-26, 5.12-27, 5.12-30, 5.12-49, 5.15-9, 5.15-14, 5.15-26, 5.15-33, 5.15-82, 5.15-106, 5.15-123, 5.15-172, 5.23-52, 6-1, 6-12, 6-21, 6-23, 6-36, 6-39, 6-44
Soil and Water Conservation District, 5.9-27, 5.9-55
Soil Survey Geographic database, 5.9-61 soils, ES-11, ES-12, ES-15, ES-19, ES-23, ES-
24, ES-25, 1-32, 2-19, 2-33, 2-34, 2-42, 2-43, 2-46, 2-48, 2-50, 3-2, 5.1-1, 5.1-4, 5.1-5, 5.1-7, 5.1-8, 5.1-9, 5.1-11, 5.1-13, 5.1-14, 5.1-19, 5.1-20, 5.1-21, 5.1-22, 5.1-23, 5.1-24, 5.1-26, 5.1-27, 5.2-7, 5.2-9, 5.2-33, 5.2-71, 5.2-72, 5.2-74, 5.2-75, 5.2-77, 5.2-79, 5.3-1, 5.3-2, 5.3-3, 5.3-4, 5.3-5, 5.3-19, 5.3-21, 5.3-22, 5.3-23, 5.3-24, 5.3-32, 5.3-35, 5.3-37, 5.4-1, 5.4-2, 5.4-3, 5.4-4, 5.4-11, 5.4-12, 5.4-13, 5.4-15, 5.4-16, 5.4-17, 5.4-18, 5.4-19, 5.4-20, 5.4-23, 5.4-25, 5.4-29, 5.4-30, 5.4-31, 5.4-33, 5.5-6, 5.5-27, 5.6-21, 5.6-24, 5.6-33, 5.6-34, 5.9-27, 5.9-37, 5.9-55, 5.11-12, 5.11-14, 5.11-22, 5.11-26, 5.11-28, 5.11-29, 5.11-31, 5.11-32, 5.12-30, 5.13-32, 5.15-84, 5.15-85, 5.16-21, 5.16-23, 5.17-9, 5.18-10, 5.19-2, 5.19-9, 5.19-12, 5.19-13, 5.23-4, 5.23-5, 5.23-6, 5.23-7, 5.23-10, 5.23-11, 5.23-12, 5.23-13, 5.23-14, 5.23-17, 5.23-18, 5.23-21, 5.23-22, 5.23-23, 5.23-25, 5.23-40, 5.23-41, 5.23-48, 5.23-49, 6-3, 6-4, 6-4, 6-11, 6-24, 6-25, 6-26, 6-28, 6-29, 6-30, 6-31, 6-35, 6-38, 6-46, 6-47, 6-48, 6-49, 6-50, 6-51
Sounds Pressure Level, 5.17-1 South Dakota, 5.8-13 SPCP, 2-26, 5.2-73, 5.2-75, 5.2-79, 5.15-86,
5.15-105, 5.15-129, 5.23-43 Special Flood Hazard Areas, 5.2-11 Special Recreation Management Areas, 5.9-32 Spill Prevention Control and Countermeasure
Plan, 2-26, 5.2-73, 5.2-79, 5.15-105, 5.15-129 Spill Prevention, Control, and Countermeasure,
1-10, 1-28, 2-19, 5.2-71, 5.2-74, 5.15-86 spills, ES-23, 1-28, 1-31, 2-18, 2-19, 2-60, 5.2-7,
5.2-26, 5.2-66, 5.2-71, 5.2-74, 5.2-79, 5.4-25, 5.6-30, 5.6-33, 5.7-16, 5.8-5, 5.8-7, 5.8-8, 5.8-9, 5.8-10, 5.8-11, 5.8-15, 5.8-17, 5.8-18, 5.8-19, 5.10-30, 5.13-33, 5.15-85, 5.15-86, 5.19-13, 5.23-19, 5.23-42, 5.23-43, 6-26, 6-28, 6-29, 6-34, 6-35, 6-40
spoil, 2-20, 2-22, 2-33, 5.3-33, 5.4-11, 5.4-31, 5.13-32
staging area, 5.2-79, 5.5-2, 5.5-18, 5.21-4
staking, 5.13-8, 5.23-23 State Emergency Response Commission, 1-33 State Forest, 1-25, 5.10-6, 5.10-10, 5.10-21,
5.10-26, 5.10-28, 5.10-30, 5.10-31, 5.10-32, 5.10-33, 5.10-34, 5.10-35, 5.10-36, 5.10-37, 5.11-28, 5.11-30, 5.12-55, 5.15-174
State Historic Preservation Office, 1-32, 5.13-2 State Historic Preservation Officer, ES-13, 1-32,
5.13-2 State Implementation Plan, 5.15-143, 5.16-7,
5.16-10, 5.16-11, 5.16-12, 5.16-16, 5.16-36, 6-27
State Park, 5.3-15, 5.3-17, 5.3-18, 5.9-5, 5.9-29, 5.9-36, 5.9-51, 5.10-2, 5.10-6, 5.10-8, 5.10-22, 5.10-23, 5.10-28, 5.10-30, 5.10-31, 5.10-34, 5.10-35, 5.10-36, 5.11-4, 5.11-9, 5.11-14, 5.11-25, 5.11-28, 5.11-30
State Pipeline Coordinators Office, ES-1, 1-1, 1-7, 1-8, 1-11, 1-23, 5.9-6
State Recreational Area, 5.9-5, 5.10-2, 5.10-6, 5.10-9, 5.10-10, 5.10-23, 5.10-24, 5.10-28, 5.10-30, 5.10-34, 5.10-36
stock, ES-14, ES-15, ES-18, 2-43, 5.2-18, 5.2-19, 5.2-20, 5.2-21, 5.4-17, 5.4-18, 5.6-2, 5.6-11, 5.7-1, 5.7-7, 5.7-8, 5.7-9, 5.7-10, 5.7-11, 5.7-12, 5.7-17, 5.8-6, 5.8-7, 5.8-8, 5.8-19, 5.8-32, 5.8-33, 6-30, 6-46, 6-48, 6-50
Storm Water Pollution Prevention Plan, 2-27, 2-33, 2-39, 5.2-77, 5.3-19, 5.3-24, 5.15-3, 5.23-7, 5.23-17
Stormwater Pollution Prevention Plan, 2-27, 2-33, 2-39, 5.2-77, 5.3-19, 5.3-24, 5.15-3, 5.23-7, 5.23-17
straddle and off-take facility, ES-11, ES-20, 1-3, 2-1, 2-2, 2-14, 2-15, 2-16, 2-17, 2-18, 2-22, 2-48, 2-50, 4-14, 4-15, 4-21, 5.2-72, 5.2-73, 5.2-74, 5.4-26, 5.5-39, 5.5-40, 5.10-33, 5.11-12, 5.11-23, 5.11-25, 5.11-28, 5.12-36, 5.12-38, 5.13-3, 5.13-35, 5.13-36, 5.13-38, 5.13-39, 5.15-14, 5.16-9, 5.16-12, 5.16-14, 5.16-24, 5.16-25, 5.16-29, 5.16-32, 5.17-10, 5.17-11, 5.17-12, 5.22-2, 5.23-48, 5.23-61, 6-1, 6-11, 6-12, 6-19
subnivean, 5.8-16 substrate, ES-16, 2-42, 5.2-65, 5.3-34, 5.6-2,
5.6-21, 5.6-23, 5.6-24, 5.6-26, 5.6-34, 5.7-14, 5.23-37, 5.23-39, 5.23-41, 5.23-44
Subsurface water that is recharged by infiltration and enters streams through seepage and springs, ES-13, ES-14, ES-23, 2-19, 2-34, 5.2-1, 5.2-4, 5.2-5, 5.2-6, 5.2-7, 5.2-8, 5.2-9, 5.2-11, 5.2-14, 5.2-19, 5.2-20, 5.2-22, 5.2-24, 5.2-31, 5.2-33, 5.2-41, 5.2-45, 5.2-46, 5.2-48, 5.2-58, 5.2-61, 5.2-66, 5.2-69, 5.2-71, 5.2-73, 5.2-74, 5.2-75, 5.2-76, 5.2-77, 5.2-79, 5.4-3, 5.4-4, 5.6-3, 5.6-35, 5.15-11, 5.15-84, 5.15-
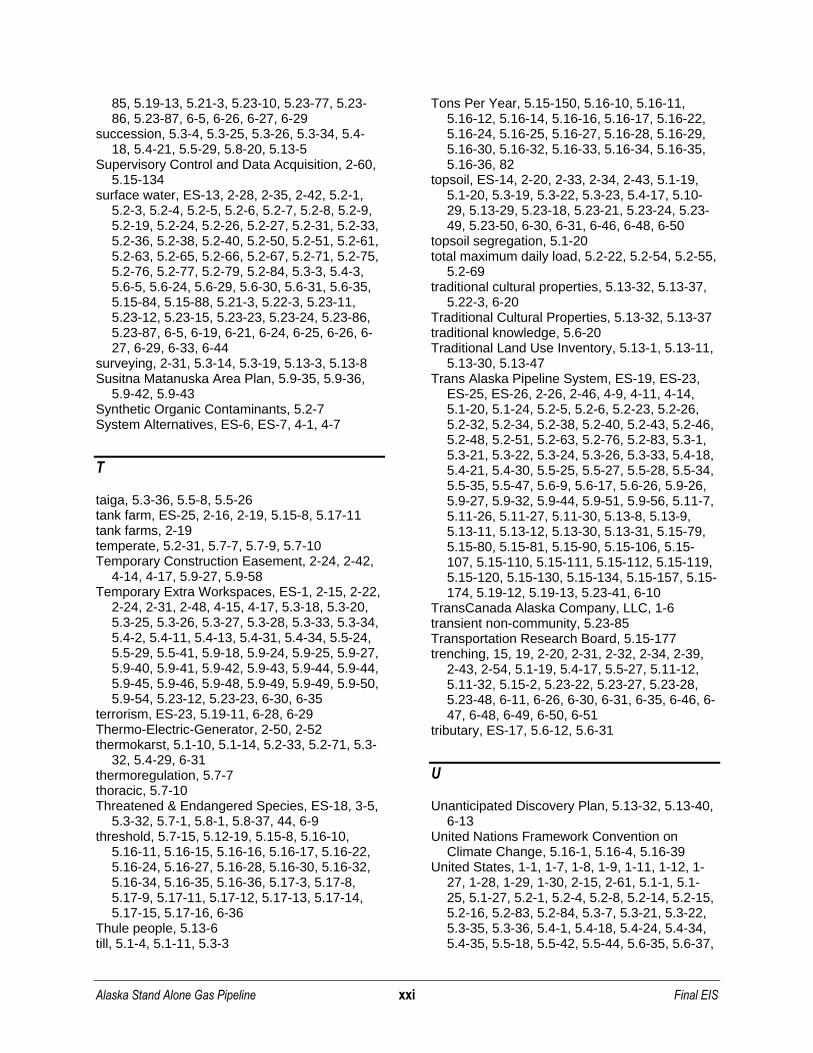
Alaska Stand Alone Gas Pipeline xxi Final EIS
85, 5.19-13, 5.21-3, 5.23-10, 5.23-77, 5.23-86, 5.23-87, 6-5, 6-26, 6-27, 6-29
succession, 5.3-4, 5.3-25, 5.3-26, 5.3-34, 5.4-18, 5.4-21, 5.5-29, 5.8-20, 5.13-5
Supervisory Control and Data Acquisition, 2-60, 5.15-134
surface water, ES-13, 2-28, 2-35, 2-42, 5.2-1, 5.2-3, 5.2-4, 5.2-5, 5.2-6, 5.2-7, 5.2-8, 5.2-9, 5.2-19, 5.2-24, 5.2-26, 5.2-27, 5.2-31, 5.2-33, 5.2-36, 5.2-38, 5.2-40, 5.2-50, 5.2-51, 5.2-61, 5.2-63, 5.2-65, 5.2-66, 5.2-67, 5.2-71, 5.2-75, 5.2-76, 5.2-77, 5.2-79, 5.2-84, 5.3-3, 5.4-3, 5.6-5, 5.6-24, 5.6-29, 5.6-30, 5.6-31, 5.6-35, 5.15-84, 5.15-88, 5.21-3, 5.22-3, 5.23-11, 5.23-12, 5.23-15, 5.23-23, 5.23-24, 5.23-86, 5.23-87, 6-5, 6-19, 6-21, 6-24, 6-25, 6-26, 6-27, 6-29, 6-33, 6-44
surveying, 2-31, 5.3-14, 5.3-19, 5.13-3, 5.13-8 Susitna Matanuska Area Plan, 5.9-35, 5.9-36,
5.9-42, 5.9-43 Synthetic Organic Contaminants, 5.2-7 System Alternatives, ES-6, ES-7, 4-1, 4-7
T
taiga, 5.3-36, 5.5-8, 5.5-26 tank farm, ES-25, 2-16, 2-19, 5.15-8, 5.17-11 tank farms, 2-19 temperate, 5.2-31, 5.7-7, 5.7-9, 5.7-10 Temporary Construction Easement, 2-24, 2-42,
4-14, 4-17, 5.9-27, 5.9-58 Temporary Extra Workspaces, ES-1, 2-15, 2-22,
2-24, 2-31, 2-48, 4-15, 4-17, 5.3-18, 5.3-20, 5.3-25, 5.3-26, 5.3-27, 5.3-28, 5.3-33, 5.3-34, 5.4-2, 5.4-11, 5.4-13, 5.4-31, 5.4-34, 5.5-24, 5.5-29, 5.5-41, 5.9-18, 5.9-24, 5.9-25, 5.9-27, 5.9-40, 5.9-41, 5.9-42, 5.9-43, 5.9-44, 5.9-44, 5.9-45, 5.9-46, 5.9-48, 5.9-49, 5.9-49, 5.9-50, 5.9-54, 5.23-12, 5.23-23, 6-30, 6-35
terrorism, ES-23, 5.19-11, 6-28, 6-29 Thermo-Electric-Generator, 2-50, 2-52 thermokarst, 5.1-10, 5.1-14, 5.2-33, 5.2-71, 5.3-
32, 5.4-29, 6-31 thermoregulation, 5.7-7 thoracic, 5.7-10 Threatened & Endangered Species, ES-18, 3-5,
5.3-32, 5.7-1, 5.8-1, 5.8-37, 44, 6-9 threshold, 5.7-15, 5.12-19, 5.15-8, 5.16-10,
5.16-11, 5.16-15, 5.16-16, 5.16-17, 5.16-22, 5.16-24, 5.16-27, 5.16-28, 5.16-30, 5.16-32, 5.16-34, 5.16-35, 5.16-36, 5.17-3, 5.17-8, 5.17-9, 5.17-11, 5.17-12, 5.17-13, 5.17-14, 5.17-15, 5.17-16, 6-36
Thule people, 5.13-6 till, 5.1-4, 5.1-11, 5.3-3
Tons Per Year, 5.15-150, 5.16-10, 5.16-11, 5.16-12, 5.16-14, 5.16-16, 5.16-17, 5.16-22, 5.16-24, 5.16-25, 5.16-27, 5.16-28, 5.16-29, 5.16-30, 5.16-32, 5.16-33, 5.16-34, 5.16-35, 5.16-36, 82
topsoil, ES-14, 2-20, 2-33, 2-34, 2-43, 5.1-19, 5.1-20, 5.3-19, 5.3-22, 5.3-23, 5.4-17, 5.10-29, 5.13-29, 5.23-18, 5.23-21, 5.23-24, 5.23-49, 5.23-50, 6-30, 6-31, 6-46, 6-48, 6-50
topsoil segregation, 5.1-20 total maximum daily load, 5.2-22, 5.2-54, 5.2-55,
5.2-69 traditional cultural properties, 5.13-32, 5.13-37,
5.22-3, 6-20 Traditional Cultural Properties, 5.13-32, 5.13-37 traditional knowledge, 5.6-20 Traditional Land Use Inventory, 5.13-1, 5.13-11,
5.13-30, 5.13-47 Trans Alaska Pipeline System, ES-19, ES-23,
ES-25, ES-26, 2-26, 2-46, 4-9, 4-11, 4-14, 5.1-20, 5.1-24, 5.2-5, 5.2-6, 5.2-23, 5.2-26, 5.2-32, 5.2-34, 5.2-38, 5.2-40, 5.2-43, 5.2-46, 5.2-48, 5.2-51, 5.2-63, 5.2-76, 5.2-83, 5.3-1, 5.3-21, 5.3-22, 5.3-24, 5.3-26, 5.3-33, 5.4-18, 5.4-21, 5.4-30, 5.5-25, 5.5-27, 5.5-28, 5.5-34, 5.5-35, 5.5-47, 5.6-9, 5.6-17, 5.6-26, 5.9-26, 5.9-27, 5.9-32, 5.9-44, 5.9-51, 5.9-56, 5.11-7, 5.11-26, 5.11-27, 5.11-30, 5.13-8, 5.13-9, 5.13-11, 5.13-12, 5.13-30, 5.13-31, 5.15-79, 5.15-80, 5.15-81, 5.15-90, 5.15-106, 5.15-107, 5.15-110, 5.15-111, 5.15-112, 5.15-119, 5.15-120, 5.15-130, 5.15-134, 5.15-157, 5.15-174, 5.19-12, 5.19-13, 5.23-41, 6-10
TransCanada Alaska Company, LLC, 1-6 transient non-community, 5.23-85 Transportation Research Board, 5.15-177 trenching, 15, 19, 2-20, 2-31, 2-32, 2-34, 2-39,
2-43, 2-54, 5.1-19, 5.4-17, 5.5-27, 5.11-12, 5.11-32, 5.15-2, 5.23-22, 5.23-27, 5.23-28, 5.23-48, 6-11, 6-26, 6-30, 6-31, 6-35, 6-46, 6-47, 6-48, 6-49, 6-50, 6-51
tributary, ES-17, 5.6-12, 5.6-31
U
Unanticipated Discovery Plan, 5.13-32, 5.13-40, 6-13
United Nations Framework Convention on Climate Change, 5.16-1, 5.16-4, 5.16-39
United States, 1-1, 1-7, 1-8, 1-9, 1-11, 1-12, 1-27, 1-28, 1-29, 1-30, 2-15, 2-61, 5.1-1, 5.1-25, 5.1-27, 5.2-1, 5.2-4, 5.2-8, 5.2-14, 5.2-15, 5.2-16, 5.2-83, 5.2-84, 5.3-7, 5.3-21, 5.3-22, 5.3-35, 5.3-36, 5.4-1, 5.4-18, 5.4-24, 5.4-34, 5.4-35, 5.5-18, 5.5-42, 5.5-44, 5.6-35, 5.6-37,

Alaska Stand Alone Gas Pipeline xxii Final EIS
5.6-38, 5.6-39, 5.8-1, 5.8-12, 5.9-5, 5.9-27, 5.9-33, 5.9-34, 5.9-55, 5.10-1, 5.10-3, 5.11-35, 5.12-1, 5.12-3, 5.12-4, 5.12-11, 5.12-15, 5.12-18, 5.12-21, 5.12-29, 5.12-54, 5.13-2, 5.13-12, 5.13-15, 5.13-23, 5.13-24, 5.13-50, 5.13-51, 5.15-34, 5.15-35, 5.15-49, 5.15-54, 5.15-55, 5.15-61, 5.15-66, 5.15-68, 5.15-71, 5.15-74, 5.15-75, 5.15-76, 5.15-77, 5.15-96, 5.15-101, 5.15-113, 5.15-114, 5.15-142, 5.15-168, 5.15-169, 5.15-170, 5.15-179, 5.15-183, 5.15-184, 5.16-6, 5.16-8, 5.16-16, 5.16-24, 5.16-35, 5.16-40, 5.18-1, 5.18-2, 5.18-4, 5.19-1, 5.19-14, 5.21-1, 5.22-1, 5.23-65, 6-6
United States Army Corps of Engineers, ES-1, ES-5, 1-1, 1-6, 1-7, 1-8, 1-9, 1-12, 1-13, 1-14, 1-15, 1-16, 1-18, 1-20, 1-22, 1-23, 1-24, 1-27, 1-32, 1-35, 2-39, 3-7, 4-24, 4-25, 4-26, 4-27, 5.1-27, 5.2-15, 5.2-16, 5.3-32, 5.4-1, 5.4-2, 5.4-35, 5.8-1, 5.8-38, 5.12-49, 5.12-52, 5.13-2, 5.13-8, 5.13-50, 5.15-1, 5.15-4, 5.15-6, 5.15-7, 5.15-13, 5.15-183, 5.15-185, 5.18-2, 5.18-6, 5.18-7, 5.18-9, 5.18-10, 5.18-11, 5.18-12, 5.18-13, 5.22-4, 5.23-19, 5.23-20, 5.23-21, 5.23-55, 5.23-56, 5.23-64, 5.23-6-18, 6-22
United States Coast Guard, 1-1, 1-7, 1-8, 1-11, 1-23, 1-29, 5.2-16, 5.18-1, 5.18-2, 5.18-3, 5.18-6, 5.18-8
United States Code, 1-1, 1-6, 1-7, 1-8, 1-9, 1-10, 1-11, 1-25, 1-27, 1-28, 1-29, 1-30, 1-31, 1-32, 1-33, 4-25, 5.2-14, 5.4-10, 5.5-1, 5.5-17, 5.9-2, 5.13-2, 5.15-105, 5.16-8, 5.18-1, 5.21-1, 5.22-1
United States Department of Agriculture, 5.1-27, 5.3-35, 5.9-27, 5.9-55, 5.9-61
United States Department of Defense, 5.9-1, 5.9-5, 5.9-11
United States Department of the Interior, 5.13-48, 5.13-49
United States Department of Transportation, ES-22, 1-11, 1-23, 1-29, 2-18, 2-28, 2-33, 2-34, 2-35, 2-54, 2-58, 2-60, 5.3-22, 5.15-96, 5.18-11, 5.19-1, 5.19-2, 5.19-3, 5.19-6, 5.19-7, 5.23-28, 6-18
United States Environmental Protection Agency, ES-5, 1-20, 5.16-35, 5.17-17
United States Fish and Wildlife Service, ES-18, 1-12, 1-29, 1-31, 3-5, 3-7, 5.3-32, 5.4-2, 5.4-16, 5.4-35, 5.5-1, 5.5-2, 5.5-3, 5.5-17, 5.5-25, 5.5-48, 5.7-1, 5.8-1, 5.8-2, 5.8-3, 5.8-4, 5.8-5, 5.8-7, 5.8-8, 5.8-9, 5.8-11, 5.8-12, 5.8-15, 5.8-17, 5.8-18, 5.8-19, 5.8-21, 5.8-23, 5.8-24, 5.8-25, 5.8-27, 5.8-30, 5.8-37, 5.8-38, 5.9-1, 5.9-5, 5.9-34, 5.9-61, 5.10-1, 5.10-5, 5.10-19, 5.10-20, 5.10-39, 5.21-4, 5.23-5, 5.23-30, 5.23-32, 5.23-33, 5.23-44, 5.23-45, 5.23-59
United States Geological Survey, 4-3, 5.1-1, 5.1-5, 5.1-15, 5.1-27, 5.2-1, 5.2-2, 5.2-3, 5.2-4, 5.2-5, 5.2-6, 5.2-7, 5.2-8, 5.2-9, 5.2-11, 5.2-13, 5.2-26, 5.2-28, 5.2-31, 5.2-33, 5.2-34, 5.2-37, 5.2-38, 5.2-39, 5.2-45, 5.2-46, 5.2-47, 5.2-48, 5.2-49, 5.2-50, 5.2-51, 5.2-52, 5.2-58, 5.2-59, 5.2-60, 5.2-64, 5.2-70, 5.2-72, 5.2-73, 5.2-74, 5.2-83, 5.2-84, 5.3-35, 5.9-14, 5.9-16, 5.9-17, 5.9-18, 5.9-19, 5.9-21, 5.9-25, 5.9-54, 5.9-61, 5.13-8, 5.13-14, 5.13-50, 5.16-1, 5.16-40
US Army Corps of Engineers, ES-1, ES-5, 1-1, 1-6, 1-7, 1-8, 1-9, 1-12, 1-13, 1-14, 1-15, 1-16, 1-18, 1-20, 1-22, 1-23, 1-24, 1-27, 1-32, 1-35, 2-39, 3-7, 4-24, 4-25, 4-26, 4-27, 5.1-27, 5.2-15, 5.2-16, 5.3-32, 5.4-1, 5.4-2, 5.4-35, 5.8-1, 5.8-38, 5.12-49, 5.12-52, 5.13-2, 5.13-8, 5.13-50, 5.15-1, 5.15-4, 5.15-6, 5.15-7, 5.15-13, 5.15-183, 5.15-185, 5.18-2, 5.18-6, 5.18-7, 5.18-9, 5.18-10, 5.18-11, 5.18-12, 5.18-13, 5.22-4, 5.23-19, 5.23-20, 5.23-21, 5.23-55, 5.23-56, 5.23-64, 6-18, 6-22
US Coast Guard, 1-1, 1-7, 1-8, 1-11, 1-23, 1-29, 5.2-16, 5.18-1, 5.18-2, 5.18-3, 5.18-6, 5.18-8
US Department of Agriculture, 5.1-27, 5.3-35, 5.9-27, 5.9-55, 5.9-61
US Department of Transportation, ES-22, 1-11, 1-23, 1-29, 2-18, 2-28, 2-33, 2-34, 2-35, 2-54, 2-58, 2-60, 5.3-22, 5.15-68, 5.15-96, 5.18-11, 5.19-1, 5.19-2, 5.19-3, 5.19-6, 5.19-7, 5.23-28, 6-18
US Environmental Protection Agency, ES-5, 1-20, 5.16-35, 5.17-17
US Fish and Wildlife Service, ES-18, 1-12, 1-29, 1-31, 3-5, 3-7, 5.3-32, 5.4-2, 5.4-16, 5.4-35, 5.5-1, 5.5-2, 5.5-3, 5.5-17, 5.5-25, 5.5-48, 5.7-1, 5.8-1, 5.8-2, 5.8-3, 5.8-4, 5.8-5, 5.8-7, 5.8-8, 5.8-9, 5.8-11, 5.8-12, 5.8-15, 5.8-17, 5.8-18, 5.8-19, 5.8-21, 5.8-23, 5.8-24, 5.8-25, 5.8-27, 5.8-30, 5.8-37, 5.8-38, 5.9-1, 5.9-5, 5.9-34, 5.9-61, 5.10-1, 5.10-5, 5.10-19, 5.10-20, 5.10-39, 5.21-4, 5.23-5, 5.23-30, 5.23-32, 5.23-33, 5.23-44, 5.23-45, 5.23-59
US Geological Survey, 4-3, 5.1-1, 5.1-5, 5.1-15, 5.1-27, 5.2-1, 5.2-2, 5.2-3, 5.2-4, 5.2-5, 5.2-6, 5.2-7, 5.2-8, 5.2-9, 5.2-11, 5.2-13, 5.2-26, 5.2-28, 5.2-31, 5.2-33, 5.2-34, 5.2-37, 5.2-38, 5.2-39, 5.2-45, 5.2-46, 5.2-47, 5.2-48, 5.2-49, 5.2-50, 5.2-51, 5.2-52, 5.2-58, 5.2-59, 5.2-60, 5.2-64, 5.2-70, 5.2-72, 5.2-73, 5.2-74, 5.2-83, 5.2-84, 5.3-35, 5.9-14, 5.9-16, 5.9-17, 5.9-18, 5.9-19, 5.9-21, 5.9-25, 5.9-54, 5.9-61, 5.13-8, 5.13-14, 5.13-50, 5.16-1, 5.16-40
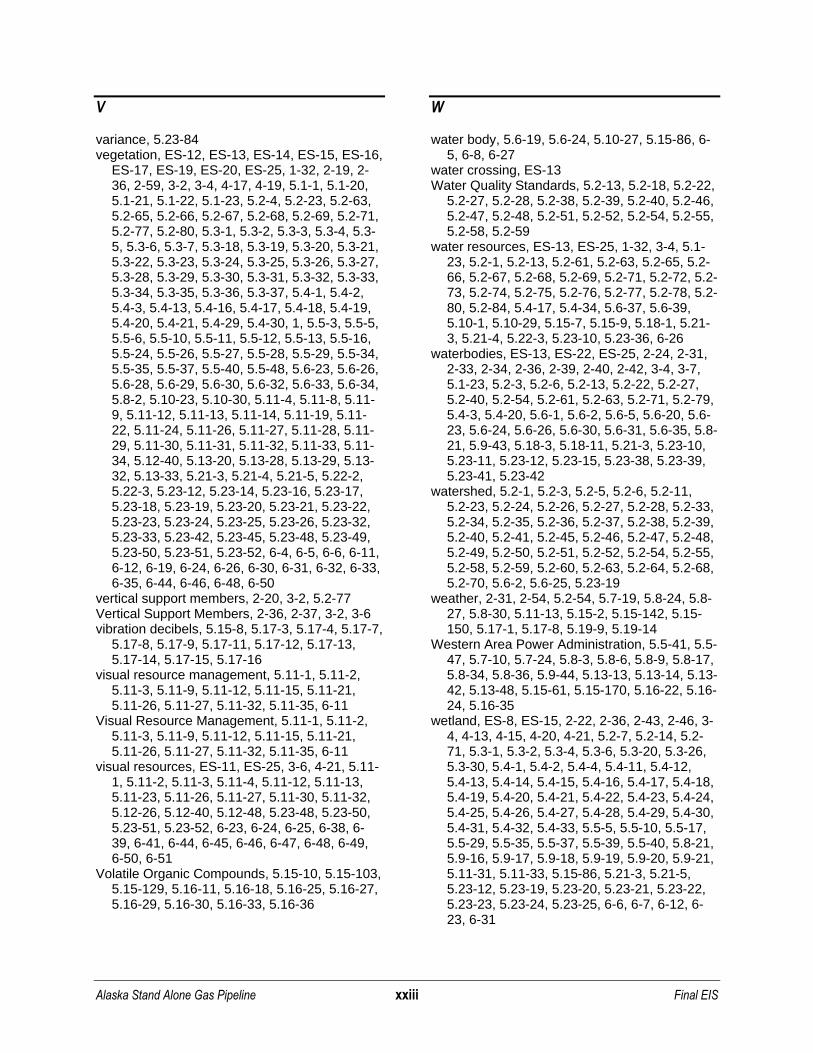
Alaska Stand Alone Gas Pipeline xxiii Final EIS
V
variance, 5.23-84 vegetation, ES-12, ES-13, ES-14, ES-15, ES-16,
ES-17, ES-19, ES-20, ES-25, 1-32, 2-19, 2-36, 2-59, 3-2, 3-4, 4-17, 4-19, 5.1-1, 5.1-20, 5.1-21, 5.1-22, 5.1-23, 5.2-4, 5.2-23, 5.2-63, 5.2-65, 5.2-66, 5.2-67, 5.2-68, 5.2-69, 5.2-71, 5.2-77, 5.2-80, 5.3-1, 5.3-2, 5.3-3, 5.3-4, 5.3-5, 5.3-6, 5.3-7, 5.3-18, 5.3-19, 5.3-20, 5.3-21, 5.3-22, 5.3-23, 5.3-24, 5.3-25, 5.3-26, 5.3-27, 5.3-28, 5.3-29, 5.3-30, 5.3-31, 5.3-32, 5.3-33, 5.3-34, 5.3-35, 5.3-36, 5.3-37, 5.4-1, 5.4-2, 5.4-3, 5.4-13, 5.4-16, 5.4-17, 5.4-18, 5.4-19, 5.4-20, 5.4-21, 5.4-29, 5.4-30, 1, 5.5-3, 5.5-5, 5.5-6, 5.5-10, 5.5-11, 5.5-12, 5.5-13, 5.5-16, 5.5-24, 5.5-26, 5.5-27, 5.5-28, 5.5-29, 5.5-34, 5.5-35, 5.5-37, 5.5-40, 5.5-48, 5.6-23, 5.6-26, 5.6-28, 5.6-29, 5.6-30, 5.6-32, 5.6-33, 5.6-34, 5.8-2, 5.10-23, 5.10-30, 5.11-4, 5.11-8, 5.11-9, 5.11-12, 5.11-13, 5.11-14, 5.11-19, 5.11-22, 5.11-24, 5.11-26, 5.11-27, 5.11-28, 5.11-29, 5.11-30, 5.11-31, 5.11-32, 5.11-33, 5.11-34, 5.12-40, 5.13-20, 5.13-28, 5.13-29, 5.13-32, 5.13-33, 5.21-3, 5.21-4, 5.21-5, 5.22-2, 5.22-3, 5.23-12, 5.23-14, 5.23-16, 5.23-17, 5.23-18, 5.23-19, 5.23-20, 5.23-21, 5.23-22, 5.23-23, 5.23-24, 5.23-25, 5.23-26, 5.23-32, 5.23-33, 5.23-42, 5.23-45, 5.23-48, 5.23-49, 5.23-50, 5.23-51, 5.23-52, 6-4, 6-5, 6-6, 6-11, 6-12, 6-19, 6-24, 6-26, 6-30, 6-31, 6-32, 6-33, 6-35, 6-44, 6-46, 6-48, 6-50
vertical support members, 2-20, 3-2, 5.2-77 Vertical Support Members, 2-36, 2-37, 3-2, 3-6 vibration decibels, 5.15-8, 5.17-3, 5.17-4, 5.17-7,
5.17-8, 5.17-9, 5.17-11, 5.17-12, 5.17-13, 5.17-14, 5.17-15, 5.17-16
visual resource management, 5.11-1, 5.11-2, 5.11-3, 5.11-9, 5.11-12, 5.11-15, 5.11-21, 5.11-26, 5.11-27, 5.11-32, 5.11-35, 6-11
Visual Resource Management, 5.11-1, 5.11-2, 5.11-3, 5.11-9, 5.11-12, 5.11-15, 5.11-21, 5.11-26, 5.11-27, 5.11-32, 5.11-35, 6-11
visual resources, ES-11, ES-25, 3-6, 4-21, 5.11-1, 5.11-2, 5.11-3, 5.11-4, 5.11-12, 5.11-13, 5.11-23, 5.11-26, 5.11-27, 5.11-30, 5.11-32, 5.12-26, 5.12-40, 5.12-48, 5.23-48, 5.23-50, 5.23-51, 5.23-52, 6-23, 6-24, 6-25, 6-38, 6-39, 6-41, 6-44, 6-45, 6-46, 6-47, 6-48, 6-49, 6-50, 6-51
Volatile Organic Compounds, 5.15-10, 5.15-103, 5.15-129, 5.16-11, 5.16-18, 5.16-25, 5.16-27, 5.16-29, 5.16-30, 5.16-33, 5.16-36
W
water body, 5.6-19, 5.6-24, 5.10-27, 5.15-86, 6-5, 6-8, 6-27
water crossing, ES-13 Water Quality Standards, 5.2-13, 5.2-18, 5.2-22,
5.2-27, 5.2-28, 5.2-38, 5.2-39, 5.2-40, 5.2-46, 5.2-47, 5.2-48, 5.2-51, 5.2-52, 5.2-54, 5.2-55, 5.2-58, 5.2-59
water resources, ES-13, ES-25, 1-32, 3-4, 5.1-23, 5.2-1, 5.2-13, 5.2-61, 5.2-63, 5.2-65, 5.2-66, 5.2-67, 5.2-68, 5.2-69, 5.2-71, 5.2-72, 5.2-73, 5.2-74, 5.2-75, 5.2-76, 5.2-77, 5.2-78, 5.2-80, 5.2-84, 5.4-17, 5.4-34, 5.6-37, 5.6-39, 5.10-1, 5.10-29, 5.15-7, 5.15-9, 5.18-1, 5.21-3, 5.21-4, 5.22-3, 5.23-10, 5.23-36, 6-26
waterbodies, ES-13, ES-22, ES-25, 2-24, 2-31, 2-33, 2-34, 2-36, 2-39, 2-40, 2-42, 3-4, 3-7, 5.1-23, 5.2-3, 5.2-6, 5.2-13, 5.2-22, 5.2-27, 5.2-40, 5.2-54, 5.2-61, 5.2-63, 5.2-71, 5.2-79, 5.4-3, 5.4-20, 5.6-1, 5.6-2, 5.6-5, 5.6-20, 5.6-23, 5.6-24, 5.6-26, 5.6-30, 5.6-31, 5.6-35, 5.8-21, 5.9-43, 5.18-3, 5.18-11, 5.21-3, 5.23-10, 5.23-11, 5.23-12, 5.23-15, 5.23-38, 5.23-39, 5.23-41, 5.23-42
watershed, 5.2-1, 5.2-3, 5.2-5, 5.2-6, 5.2-11, 5.2-23, 5.2-24, 5.2-26, 5.2-27, 5.2-28, 5.2-33, 5.2-34, 5.2-35, 5.2-36, 5.2-37, 5.2-38, 5.2-39, 5.2-40, 5.2-41, 5.2-45, 5.2-46, 5.2-47, 5.2-48, 5.2-49, 5.2-50, 5.2-51, 5.2-52, 5.2-54, 5.2-55, 5.2-58, 5.2-59, 5.2-60, 5.2-63, 5.2-64, 5.2-68, 5.2-70, 5.6-2, 5.6-25, 5.23-19
weather, 2-31, 2-54, 5.2-54, 5.7-19, 5.8-24, 5.8-27, 5.8-30, 5.11-13, 5.15-2, 5.15-142, 5.15-150, 5.17-1, 5.17-8, 5.19-9, 5.19-14
Western Area Power Administration, 5.5-41, 5.5-47, 5.7-10, 5.7-24, 5.8-3, 5.8-6, 5.8-9, 5.8-17, 5.8-34, 5.8-36, 5.9-44, 5.13-13, 5.13-14, 5.13-42, 5.13-48, 5.15-61, 5.15-170, 5.16-22, 5.16-24, 5.16-35
wetland, ES-8, ES-15, 2-22, 2-36, 2-43, 2-46, 3-4, 4-13, 4-15, 4-20, 4-21, 5.2-7, 5.2-14, 5.2-71, 5.3-1, 5.3-2, 5.3-4, 5.3-6, 5.3-20, 5.3-26, 5.3-30, 5.4-1, 5.4-2, 5.4-4, 5.4-11, 5.4-12, 5.4-13, 5.4-14, 5.4-15, 5.4-16, 5.4-17, 5.4-18, 5.4-19, 5.4-20, 5.4-21, 5.4-22, 5.4-23, 5.4-24, 5.4-25, 5.4-26, 5.4-27, 5.4-28, 5.4-29, 5.4-30, 5.4-31, 5.4-32, 5.4-33, 5.5-5, 5.5-10, 5.5-17, 5.5-29, 5.5-35, 5.5-37, 5.5-39, 5.5-40, 5.8-21, 5.9-16, 5.9-17, 5.9-18, 5.9-19, 5.9-20, 5.9-21, 5.11-31, 5.11-33, 5.15-86, 5.21-3, 5.21-5, 5.23-12, 5.23-19, 5.23-20, 5.23-21, 5.23-22, 5.23-23, 5.23-24, 5.23-25, 6-6, 6-7, 6-12, 6-23, 6-31

Alaska Stand Alone Gas Pipeline xxiv Final EIS
wetlands, ES-8, ES-11, ES-15, ES-25, 1-1, 1-6, 1-7, 1-26, 1-27, 1-28, 2-20, 2-22, 2-24, 2-31, 2-33, 2-34, 2-36, 2-39, 2-43, 2-46, 2-61, 3-4, 4-11, 4-13, 4-15, 4-17, 4-19, 4-20, 4-21, 4-26, 4-27, 5.1-23, 5.2-1, 5.2-3, 5.2-5, 5.2-7, 5.2-14, 5.2-15, 5.2-61, 5.2-63, 5.2-71, 5.3-1, 5.3-2, 5.3-3, 5.3-4, 5.3-5, 5.3-6, 5.3-7, 5.3-18, 5.3-20, 5.3-26, 5.3-27, 5.3-30, 5.3-34, 5.3-37, 5.4-1, 5.4-2, 5.4-3, 5.4-4, 5.4-5, 5.4-6, 5.4-7, 5.4-8, 5.4-9, 5.4-10, 5.4-11, 5.4-12, 5.4-13, 5.4-14, 5.4-15, 5.4-16, 5.4-17, 5.4-18, 5.4-19, 5.4-20, 5.4-21, 5.4-22, 5.4-23, 5.4-24, 5.4-25, 5.4-26, 5.4-27, 5.4-28, 5.4-29, 5.4-30, 5.4-31, 5.4-32, 5.4-33, 5.4-34, 5.4-35, 5.5-5, 5.5-10, 5.5-17, 5.5-29, 5.5-34, 5.5-35, 5.5-36, 5.5-37, 5.5-38, 5.5-39, 5.5-40, 5.5-41, 5.6-1, 5.6-2, 5.6-24, 5.6-35, 5.8-21, 5.8-25, 5.9-7, 5.9-16, 5.9-17, 5.9-18, 5.9-19, 5.9-20, 5.9-21, 5.9-58, 5.10-25, 5.11-4, 5.11-7, 5.11-24, 5.11-25, 5.11-28, 5.11-31, 5.11-33, 5.15-11, 5.15-86, 5.21-3, 5.21-5, 5.22-3, 5.23-2, 5.23-12, 5.23-19, 5.23-20, 5.23-21, 5.23-22, 5.23-23, 5.23-24, 5.23-25, 5.23-47, 5.23-65, 5.23-66, 5.23-68, 5.23-69, 5.23-70, 5.23-89, 6-5, 6-6, 6-7, 6-12, 6-23, 6-24, 6-25, 6-30, 6-31, 6-35, 6-46, 6-48, 6-50
wintering ground, 5.7-12, 5.8-10, 5.8-25 World Health Organization, 5.15-4, 5.15-25,
5.15-112, 5.15-186
X
Y
Yukon-Koyukuk Census Area, 2-1, 5.9-9, 5.12-1, 5.12-4, 5.12-5, 5.12-7, 5.12-8, 5.12-10, 5.12-12, 5.12-13, 5.12-15, 5.12-16, 5.12-17, 5.12-19, 5.12-21, 5.12-22, 5.12-25, 5.12-27, 5.12-31, 5.12-32, 5.12-33, 5.12-35, 5.12-36, 5.12-42, 5.12-45, 5.12-47, 5.12-48, 6-12