Polyelectrolyte Complexes from Polysaccharides: Formation and Stoichiometry Monitoring

Functional Polysaccharides as Edible Coatings forCheese
MIGUEL A. CERQUEIRA,*,† ALVARO M. LIMA,‡ BARTOLOMEU W. S. SOUZA,†
JOSE A. TEIXEIRA,† RENATO A. MOREIRA,§ AND ANTONIO A. VICENTE†
IBB, Institute for Biotechnology and Bioengineering, Centre of Biological Engineering, Universidadedo Minho, Campus de Gualtar, 4710-057 Braga, Portugal, Departamento de Bioquımica e BiologiaMolecular, Universidade Federal do Ceara, Campus do Pici, 60451-970 Fortaleza (CE), Brazil, and
Centro de Ciencias da Saude, Universidade de Fortaleza, Av. Washington Soares, 1321 Bairro EdsonQueiroz, 60811-905 Fortaleza (CE), Brazil
The objective of the present study was to apply the polysaccharides from different nontraditionalsources for cheese coatings. Chitosan, galactomannan from Gleditsia triacanthos, and agar fromGlacilaria birdiae were tested, with different formulations and with the addition of plasticizer and cornoil. The surface properties of the cheese and the wetting capacity of the coatings on the cheesewere determined. The three best solutions for each polysaccharide were chosen, further films werecast, and permeability to water vapor, oxygen, and carbon dioxide was determined, along with opacity.The solutions of G. triacanthos (formulation: 1.5% of galactomannan, 2.0% of glycerol, and 0.5% ofoil) presented the best properties to coat the cheese: -38.76 mN ·m-1 for wettability; 3.24 × 10⁻¹¹
(g · (m ·s ·Pa)-1) for water vapor permeability; 0.94 × 10⁻¹⁵ and 15.35 × 10⁻¹⁵ (g ·m(Pa ·s ·m2)-1) foroxygen and carbon dioxide permeabilities, respectively; and opacity values of 5.27%. The O2
consumption and CO2 production rates of the cheese with and without coating were evaluated, showinga decrease of the respiration rates when the coating was applied. The uncoated cheese had anextensive mold growth at the surface when compared with the coated cheese. The results show thatthese coatings can be applied as an alternative to synthetic coatings.
KEYWORDS: Edible coatings; galactomannan; agar; chitosan; cheese
INTRODUCTION
Consumers and food and packaging industries have joinedtheir efforts to reduce the amount of food packaging materials,because of environmental protection. As an answer to thatconcern, several issues have to be addressed in order to fosterthe commercial use of biobased primary food packagingmaterials. These issues include degradation rates under variousconditions, changes in mechanical properties during storage,potential for microbial growth, and release of harmful com-pounds into the packaged food product (1). However, consumersaround the world demand for food of high-quality, withoutchemical preservatives, and with an extended shelf life. There-fore, an increased effort has been made to develop new naturalpreservatives and antimicrobials (1).
The future generation of packaging materials will be derivedfrom renewable resources. These materials will ideally bebiodegradable. However, natural polymeric materials vary in
their rate of degradation in the environment, and some proteins,for example, cannot presently be classified as degradable becauseof standard definitions (1). Edible films and coatings canimprove shelf life and food quality by providing good andselective barriers to moisture transfer, oxygen uptake, lipidoxidation, losses of volatile aromas and flavors (2), better visualaspect, and reduction of microbiological contamination (3). Theuse of coatings creates a modified atmosphere surrounding thecommodity similar to that achieved by controlled or modifiedatmospheric storage conditions. The modified atmosphere cre-ated by edible coatings can protect the food from the momentit is applied, through transportation to its final retail destination,and in the home of the consumer (1, 4).
Cheese is a complex food product consisting mainly of casein,fat, and water. Several researchers have recommended that freshcheeses (e.g., cream cheese, decorated cream cheese, soft cheese,and cottage cheese) are packaged in modified atmosphere withN2 and/or CO2 replacing the O2 in the package (5). However,spoilage caused by yeast and especially bacteria may still occureven at very low O2 and elevated CO2 levels (6). Semisoft andhard cheeses (whole, sliced, or shredded) have a relatively highrespiration rate, which require a packaging material somewhatpermeable to CO2 to avoid an expansion of the packaging.
* To whom correspondence should be addressed. Phone: +351.253.604400. Fax: +351 0.253.678986. E-mail: [email protected].
† Universidade do Minho.‡ Universidade Federal do Ceara.§ Universidade de Fortaleza.
1456 J. Agric. Food Chem. 2009, 57, 1456–1462
10.1021/jf802726d CCC: $40.75 2009 American Chemical SocietyPublished on Web 01/26/2009
Meanwhile, O2 must be kept out to avoid fungal spoilage andoxidation of the cheese. Instead, these products require abalanced oxygen and carbon dioxide atmosphere to prolong theirshelf life (7).
In semihard cheeses, the factor that most affects cheesestability is water activity (aw), which depends mainly on moistureand salt contents. During ripening, aw is not constant butdecreases until the cheese surface is in equilibrium with thesurrounding atmosphere, thus influencing the microbiologicaland chemical evolution of the cheese (8). Additional environ-mental factors must be considered in selecting a material forcheese coating (e.g., the light). All of these factors affect notonly the cheese’s physical characteristics but also its flavorduring storage. In fact, many different compounds contributeto cheese flavor, and most of them form during cheese ripening(9).
The cheese studied in this work is a cylindrical, yellow, andsemihard cheese; it is sold unpackaged, covered with a synthetic/antibiotic coating, and under normal storage conditions, it suffersexcessive water loss. The present work evaluates the possibilityof using functional polysaccharides as coatings on semihardcheese. The choice of the best coating is made taking intoconsideration its wettability, permeability, and opacity proper-ties. The coating was applied on a cheese without any previoustreatment or ripening period. Extreme conditions were used(cheese without ripening, nor treatment; ambient temperatureof approximately 22 °C) to evaluate how the coating canimprove respiration, water loss, and surface spoilage of thecheese.
MATERIALS AND METHODS
Materials. Edible coating solutions were prepared with chitosan witha degree of deacetylation of approximately 90% (Aqua Premier Co.,Thailand); galactomannan extracted from Gleditsia triacanthos seeds(collected in the Botanic Garden, in Oporto, Portugal, in 2006); agarextracted from Glacilaria birdiae seaweed (specimens of the redseaweed G. birdiae were collected in 2006 on the Atlantic coast ofBrazil, Fleixeiras, Trairi - Ceara); corn oil (Sovena, Portugal); 87%glycerol (Panreac, Spain) and 97% sorbitol (Acros Organics, Belgium);Tween 80 (Acros Organics, Belgium); lactic acid (Merck, Germany);and distilled water. A commercial semihard cheese was obtained fromQueijo Saloio S.A. (Portugal) without any previous treatment (withoutripening and coating) two days after production, the samples beingstored at 5 °C and 80% RH until further use. Regional Saloio cheese
is a full fat cheese produced with a mixture of caprine, bovine, andovine pasteurized milk, which, after coating with a synthetic coatingand an antibiotic protector, is submitted to a short ripening period atlow temperatures (5 and 12 °C in different stages of the ripeningprocess). It requires conditions of 0-22 °C for sale. The cheese’sphysicochemical composition is as follows: moisture, 46%; fat, 25%;protein, 18.4%; total ash, 3.58%; chlorides, 1.54; pH 4.8; and totalacidity, 1.40 (10).
Polysaccharide Extraction. Galactomannan Extraction (G. tria-canthos). The polysaccharide extraction was performed as describedin Cerqueira et al. (11).
Agar Extraction (G. birdie). The red seaweed was cultivated in thesea using seedlings collected during low tide. The seedlings werecleaned and then tied in a structure made of string, which was placedin the sea, where it was anchored and submerged for two months. Thepolysaccharide extraction was performed with ethanol (purity 99.8%,Riedel-de Haen, Germany) and distilled water as described by Nosedaet al. (12).
Coating and Film Preparation. The coating formulations werebased on a two level factorial design with polysaccharide concentrationsof 0.5% and 1.5% (w/v), plasticizer concentrations of 0.5 and 2.0%(v/v), and oil concentrations of 0 and 0.5% (w/v). The coating solutionswere prepared dissolving the chitosan (0.5 or 1.5% w/v) in a 1.0%(v/v) lactic acid solution with agitation using a magnetic stirrer during2 h at room temperature (20 °C); Tween 80 was also added as asurfactant at concentrations of 0.2% (w/v). Corn oil was added inconcentrations of 0.5% (w/v), with agitation during 20 min at 60 °C.As plasticizers, glycerol and a mixture of glycerol/sorbitol (50:50) wereadded at concentrations between 0.5 and 2.0% (w/v).
The coating solutions from galactomannan of G. triacanthos (GT)were prepared by dissolving the galactomannan (0.5 or 1.5% w/v) indistilled water with agitation using a magnetic stirrer during 2 h atroom temperature (20 °C). As plasticizers, glycerol and a mixture ofglycerol/sorbitol (50:50) were added at concentrations between 0.5-2.0%(w/v). Corn oil was added at concentrations of 0.5% (w/v), withagitation during 20 min at 60 °C.
The coating solutions from agar of G. birdiae (GB) were prepareddissolving the agar (0.5 or 1.5% w/v) in distilled water with agitationusing a magnetic stirrer during 20 min at 60 °C. As plasticizers, glyceroland a mixture of glycerol/sorbitol (50:50) were added at concentrationsbetween 0.5 and 2.0% (w/v). Corn oil was added at a concentration of0.5% (w/v).
In all cases, a constant amount (13 mL) of solution was cast onto a5.7 cm diameter glass plate in order to maintain film thickness. Thefilms were dried in an oven at 35 °C during 16 h. These solutionscorrespond to solutions 1-16, in Table 1.
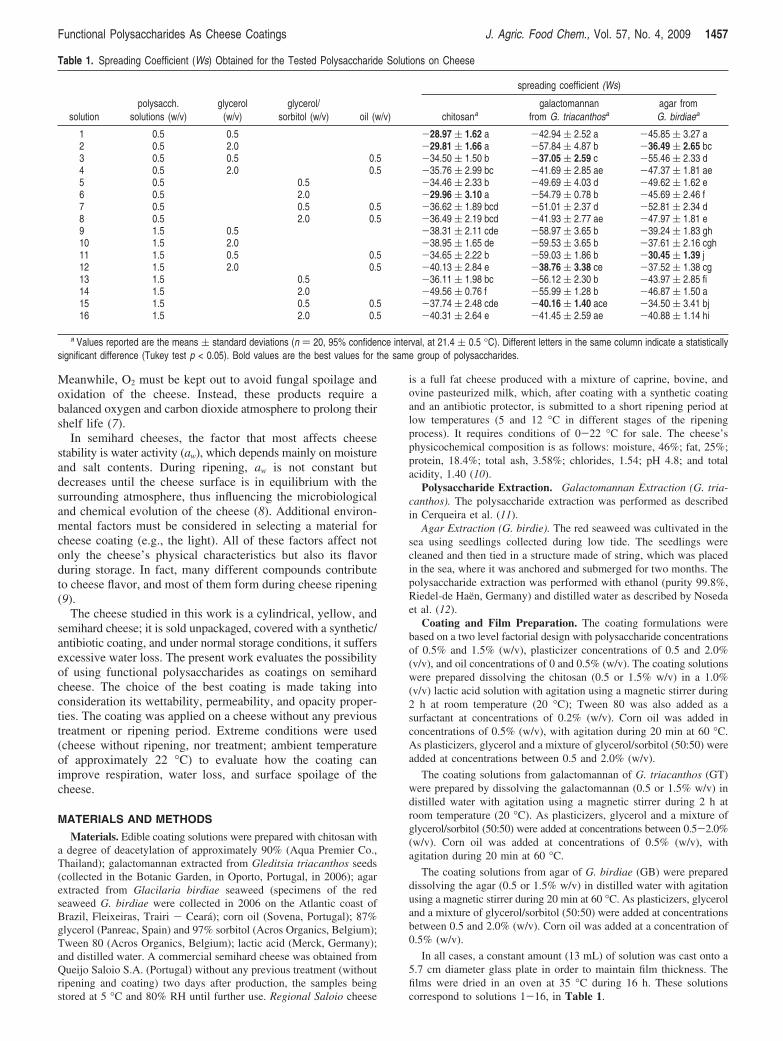
Table 1. Spreading Coefficient (Ws) Obtained for the Tested Polysaccharide Solutions on Cheese
spreading coefficient (Ws)
solutionpolysacch.
solutions (w/v)glycerol
(w/v)glycerol/
sorbitol (w/v) oil (w/v) chitosanagalactomannan
from G. triacanthosaagar fromG. birdiaea
1 0.5 0.5 -28.97 ( 1.62 a -42.94 ( 2.52 a -45.85 ( 3.27 a2 0.5 2.0 -29.81 ( 1.66 a -57.84 ( 4.87 b -36.49 ( 2.65 bc3 0.5 0.5 0.5 -34.50 ( 1.50 b -37.05 ( 2.59 c -55.46 ( 2.33 d4 0.5 2.0 0.5 -35.76 ( 2.99 bc -41.69 ( 2.85 ae -47.37 ( 1.81 ae5 0.5 0.5 -34.46 ( 2.33 b -49.69 ( 4.03 d -49.62 ( 1.62 e6 0.5 2.0 -29.96 ( 3.10 a -54.79 ( 0.78 b -45.69 ( 2.46 f7 0.5 0.5 0.5 -36.62 ( 1.89 bcd -51.01 ( 2.37 d -52.81 ( 2.34 d8 0.5 2.0 0.5 -36.49 ( 2.19 bcd -41.93 ( 2.77 ae -47.97 ( 1.81 e9 1.5 0.5 -38.31 ( 2.11 cde -58.97 ( 3.65 b -39.24 ( 1.83 gh10 1.5 2.0 -38.95 ( 1.65 de -59.53 ( 3.65 b -37.61 ( 2.16 cgh11 1.5 0.5 0.5 -34.65 ( 2.22 b -59.03 ( 1.86 b -30.45 ( 1.39 j12 1.5 2.0 0.5 -40.13 ( 2.84 e -38.76 ( 3.38 ce -37.52 ( 1.38 cg13 1.5 0.5 -36.11 ( 1.98 bc -56.12 ( 2.30 b -43.97 ( 2.85 fi14 1.5 2.0 -49.56 ( 0.76 f -55.99 ( 1.28 b -46.87 ( 1.50 a15 1.5 0.5 0.5 -37.74 ( 2.48 cde -40.16 ( 1.40 ace -34.50 ( 3.41 bj16 1.5 2.0 0.5 -40.31 ( 2.64 e -41.45 ( 2.59 ae -40.88 ( 1.14 hi
a Values reported are the means ( standard deviations (n ) 20, 95% confidence interval, at 21.4 ( 0.5 °C). Different letters in the same column indicate a statisticallysignificant difference (Tukey test p < 0.05). Bold values are the best values for the same group of polysaccharides.
Functional Polysaccharides As Cheese Coatings J. Agric. Food Chem., Vol. 57, No. 4, 2009 1457
Films were maintained at 20 °C and 50% RH before permeabilityand opacity tests. (These were the average conditions at the laboratory,as maintained by the existing temperature and humidity controlsystem).
Film Thickness. The film thickness was measured with a digitalmicrometer (No. 293-561, Mitutoyo, Japan). Five thickness measure-ments were taken on each testing sample at different points, and themean values were used for the calculation of water vapor permeability(WVP), oxygen permeability (O2P), and dioxide carbon permeability(CO2P).
Critical Surface Tension and Surface Tension of Cheese Skin.According to Zisman (13), in systems having a surface tension lowerthan 100 mN ·m-1 (low-energy surfaces), the contact angle formed bya drop of liquid on a solid surface will be a linear function of the surfacetension of the liquid, γLV (where phase V is air saturated with the vaporof liquid, L). The Zisman method, briefly described below, is applicableonly for low energy surfaces; therefore, it is necessary to determinethe surface energy of the cheese.
For a pure liquid, if polar (γLp) and dispersive (γL
d) interactions areknown, and if θ is the contact angle between that liquid and a solid,the interaction can be described in terms of the reversible work ofadhesion, Wa, as follows:
Wa )Wad +Wa
pSWa ) 2(√γsd · γL
d + √γsp · γL
p) (1)
where γSp and γS
d are the polar and dispersive contributions of the surfaceof the studied solid. Rearranging eq 1 yields
1+ cos θ2
·γL
√γLd) √γs
p ·�γLp
γLd+ √γs
d (2)
The contact angle determinations of at least three pure compounds,bromonaphthalene (Merck, Germany), formamide (Merck, Germany),and ultra pure water, on the surface of the cheese (cheese skin)combined with the values presented below will allow the calculationof both the independent variable, (γL
p)/(γLd)1/2, and the dependent variable,
(1 + cosθ)/(2) · (γL)/(γLd)1/2), from eq 2.
The surface tension and the dispersive and the polar component were,respectively, 72.10, 19.90, and 52.20 mN ·m-1 for water, 44.40, 44.40,and 0.00 mN ·m-1 for bromonaphtalene and 56.90, 23.50, and 33.40mN ·m-1 for formamide (14).
The estimation of the critical surface tension (γC) was performedby extrapolation from Zisman plots (13). Zisman plots have long beenused to characterize the wettability of low-energy surfaces. Zisman plotsare obtained by plotting the cosine of the contact angle of pure liquidson a solid surface to be studied against the surface tension of the sameseries of liquids. The intercept of these curves with cos θ ) 1 is knownas the critical surface tension (γC). The critical surface tension is animaginary point of the γsV value, and it is frequently used to describethe wettability of a surface. It represents the value of γLV of a liquidabove which the spreading of this liquid in a solid surface is complete.The critical surface tension (γC) is defined as follows:
γC ) lim γLV as θf 0 (3)
All experiments were performed at 21.3 ( 0.2 °C with 20 replicatesfor each of the compounds used.
Wettability. The wettability was studied by determining the valuesof the spreading coefficient (Ws) and the works of adhesion (Wa) andcohesion (Wc). The adhesive forces promote the liquid spreading on asolid surface and the cohesive forces promote their contraction. Thewetting behavior of the solutions will mainly depend on the balancebetween these forces. The surface tension of the coating solution wasmeasured by the pendant drop method using the Laplace-Youngapproximation (15).
The contact angle (θ) of a liquid drop on a solid surface is definedby the mechanical equilibrium of the drop under the action of threeinterfacial tensions: solid-vapor (γSV), solid-liquid (γSL), andliquid-vapor (γLV). The equilibrium spreading coefficient (Ws) isdefined by eq 4 (16) and can only be negative or zero.
Ws )Wa -Wc ) γSV - γLV - γSL (4)
where Wa and Wc are the works of adhesion and cohesion, defined byeqs 5 and 6, respectively.
Wa ) γLV + γSV - γSL (5)
Wc ) 2 · γLV (6)
Contact angle (θ) and liquid-vapor surface tension (γLV) weremeasured by a face contact angle meter (OCA 20, Dataphysics,Germany). The samples of the coatings were taken with a 500 µLsyringe (Hamilton, Switzerland), with a needle of 0.75 mm diameter.The contact angle at the cheese surface was measured by the sessiledrop method (17). Measurements were made in less than 30 s. Tenreplicates of contact angle and surface tension measurements wereobtained at 21.3 ( 0.5 °C.
Water Vapor Permeability Measurement (WVP). The measure-ment of water vapor permeability (WVP) was determined gravimetri-cally on the basis of the ASTM E96-92 method (18). The film wassealed on the top of a permeation cell containing distilled water (100%RH; 2337 Pa vapor pressure at 20 °C), placed in a desiccator at 20 °Cand 0% RH (0 Pa water vapor pressure) containing silica. The cellswere weighed at intervals of 2 h during 10 h. Steady-state and uniformwater pressure conditions were assumed by keeping the air circulationconstant outside the test cell by using a miniature fan inside thedesiccator. The slope of weight loss versus time was obtained by linearregression. Three replicates were obtained for each film.
Oxygen and Carbon Dioxide Permeability. Oxygen permeability(O2P) and carbon dioxide permeability (CO2P) were determined onthe basis of the ASTM D 3985-02 (2002) method (19). The films weresealed between two chambers, each one having two channels. In thelower chamber, O2 (or CO2) was supplied at a controlled (J & WScientific, ADM 2000, USA) flow rate to keep its pressure constant inthat compartment. The other chamber was purged by a stream ofnitrogen, also at controlled flow. Nitrogen acted as a carrier for the O2
(or the CO2).In the case of the O2P measurement, the flow leaving this chamber
was connected to an O2 sensor (Mettler Toledo, Suisse), which measuredthe O2 concentration in that flow online. In the case of the CO2Pmeasurement, the flow leaving this chamber was collected in a syringefor CO2 quantification. To determine CO2 concentration, 1 mL of samplewas injected in a gas chromatograph (Chrompack 9001, Middelburg,Netherlands) at 110 °C with a column Porapak Q 80/100 mesh 2 m ×1/8′′ × 2 mm SS, using a flame ionization detector (FID) at 110 °C.Helium at 23 mL ·min-1 was used as carrier gas. A standard mixturecontaining 10% CO2, 20% O2, and 70% N2 was used for calibration.
The flows of the two chambers were connected to a manometer toensure the equality of pressures (both at 1 atm) between bothcompartments. As the O2 (and the CO2) was carried continuously bythe nitrogen flow, it was considered that O2 (and the CO2) partialpressure in the upper compartment is null, and therefore, ∆P is equalto 1 atm. Three replicates were obtained for each sample, in each case(O2P and CO2P).
Opacity. The opacity of the samples was determined according tothe Hunter laboratory method, with a Minolta colorimeter (CR 300;Minolta, Japan), as the relationship between the opacity of each sampleon the black standard (Yb) and the opacity of each sample on the whitestandard (Yw).
Cheese Coating. The semihard cheeses, with approximately 270 g,were coated with the selected solution by brushing the surface until allof it was covered, the residual coating being allowed to drip off. Cheeseswere left for 4 h at 4 °C until the coating was dry.
O2 and CO2 Exchange Rates. The closed system method with airas initial atmosphere was used for the measurement of the gas exchangerate of the whole cheese. The whole cheese was placed inside a hermeticjar at a temperature of 21.86 ( 0.76 °C and an initial relative humidityof 70%. The jar was closed, and air circulation was promoted inside itby using a miniature fan. The atmosphere inside the jar was measuredby drawing gas samples with a 1 mL syringe through a septum fittedin the jar lid. The O2 and CO2 contents in the jar were determinedusing a gas chromatograph (Chrompack 9001, Middelburg, Netherlands)
1458 J. Agric. Food Chem., Vol. 57, No. 4, 2009 Cerqueira et al.

at 110 °C with a column molecular sieve 5A 80/100 mesh 1 m × 1/8′′× 2 mm to separate the O2 and a column Porapak Q 80/ 100 mesh 2 m× 1/8′′ × 2 mm SS to separate the CO2 using a flame ionization detector(FID) at 110 °C. Helium at 23 mL ·min-1 was used as carrier gas. Amixture containing 10% CO2, 20% O2, and 70% N2 was used as thestandard for calibration. Two replicates of each condition were measuredduring 48 h.
The O2 consumption and CO2 production rates were determinedapplying eqs 7 and 8 (20), developed for a closed system impermeableto gases.
dyO2)-RO2
wVf
dt (7)
dyCO2)RCO2
wVf
dt (8)
where, RO2 is the O2 consumption rate, mL[O2] ·kg-1 ·h-1, RCO2 is theCO2 production rate, mL[CO2] ·kg-1 ·h-1, w (kg) is the weight of thecheese, and Vf (mL) is the free volume of the container. The free volumeVf of the package is calculated by
Vf )Vp -wFch
(9)
where, Vp (mL) is the total volume of the container, w (kg) is the weightof the cheese, and Fch is the true density of the cheese, in this case1.095 × 10-3 kg ·mL-1, obtained experimentally following the methoddescribed by Owolarafe et al. (21). The graph of O2 consumed versustime or CO2 produced versus time was used to calculate the slopes,which correspond to the derivatives, dyO2
/dt (or dyCO2/dt).
Weight Loss and Relative Humidity. The weight loss and relativehumidity were measured in parallel to the measurements of O2 andCO2 exchange rates. The cheese was weighed at the beginning of theexperiment (IW) and at the end (FW), the results expressed as therelative weight loss (RWL) defined as
RWL) IW-FWIW
· 100 (10)
The change in relative humidity (RH) of the atmosphere of the jar wasfollowed using a sensor (hygrometer HD 8501 H) fitted inside thejar.
Cheese Surface. The surface of the cheese was inspected for theappearance of molds at the end of the O2 and CO2 exchange ratedetermination (22, 23).
Statistical Analyses. Statistical analyses were performed usingAnalysis of Variance (ANOVA) and linear regression analysis. TheTukey test (R ) 0.05) was used to determine any significance ofdifferences between specific means (SigmaStat, trial version, 2003,USA).
RESULTS AND DISCUSSION
Critical Surface Tension and Surface Tension of Cheese.The determination of the surface tension and of the criticalsurface tension of the cheese allows the characterization of thesurface of its skin. According to Zisman (17), in systems havinga surface tension lower than 100 mN ·m-1 (low energy surfaces),the contact angle formed by a drop of liquid on a solid surfacewill be a linear function of the surface tension of the liquid,γLV (where phase V is air saturated with the vapor of liquid, L),which allows the application of the method to determine thewettability.
The surface from the cheese displays values of critical surfaceand surface tension of 18.33 ( 0.10 mN ·m-1 and 37.79 ( 0.76mN ·m-1, respectively. The cheese surface is a low-energysurface (<100 mN ·m-1) and presents a higher dispersivecomponent (29.93 ( 0.41 mN ·m-1), which shows its ability toparticipate in nonpolar interactions, and a low polar component(7.87 ( 0.37 mN ·m-1). A surface with these characteristics
interacts with liquid primarily by dispersion forces, influencingthe effective spreading of the coating on the cheese surface.The compatibility of the polarity (apolar or polar) of the surfaceand of the coating may therefore play an important role in thewettability of the surface. The cheese, being very rich in apolarcomponents (e.g., fat), features a significant apolar influence.
Wettability. The wettability was studied by determining thevalues of the spreading coefficient (Ws). Wettability is one ofthe most important properties when evaluating the capacity ofa solution to coat a designated surface. In practical terms, thecloser the Ws values are to zero, the better a surface will becoated. The results show (Table 1) that depending on the amountof polysaccharide, plasticizer, and oil added, the values of Wsare statistically different. Considering the solutions tested, thebest (higher) value of Ws on the cheese surface was determinedfor each polysaccharide (Tukey test, p < 0.05). The best valuesare shown in bold. (When two or more values are shown inbold for the same polysaccharide, it means that those valuesare statistically equal).
In chitosan coating solutions, the use of Tween 80 wasnecessary to increase the otherwise very low values of Ws(results not shown). The improvement of Ws with the additionof Tween 80 was also shown by Ribeiro et al. (4). Tween 80acts by reducing the superficial tension of the liquid and byincreasing the value of Ws, therefore improving the compatibilitybetween the solution and the cheese surface. The results obtaineddemonstrate that chitosan solutions with lower concentrationof chitosan and without oil present better values of Ws. Solutions1, 2, and 6 do not present a statistically significant difference(Table 1). The higher values of Ws of the solutions with lowerchitosan concentrations can be explained by the high ratiobetween the concentration of Tween 80 (which acts by reducingthe superficial tension of the liquid) and the concentration ofchitosan. The incorporation of oil to the solution of chitosan,in the presence of Tween 80, will form a micellar structure, theinteraction between chitosan and oil made through the hydro-philic and hydrophobic parts of the Tween 80 molecule,respectively; this will contribute to the increase of the superficialtension of the liquid once Tween 80 molecules are occupied inthe micelles and are no longer available to reduce the superficialtension of the liquid.
In the case of G. triacanthos, the solutions with higher valuesof Ws were those containing oil. Solutions 3, 12, and 15 (Table1) do not present a statistically significant difference. Thepresence of oil in G. triacanthos coatings decreased the valuesof Ws. The partly hydrophobic surface of the cheese, asexplained previously, presents a good adhesion to the solutionsof G. triacanthos containing oil, eventually due to the abilityof the solution with oil (more hydrophobic) to interact with thecheese surface (24).
For the solutions made with G. birdiae, solution 11 was thebest, presenting statistically significant differences from the othersamples (Table 1). As in previous cases, the solutions containingoil present the best value of Ws.
When there were no statistically significant differencesbetween polysaccharide solutions, it has been assumed that bothwere equally good in terms of wettability and that theirdifferentiation must be made on the basis of other criteria (suchas water vapor, O2, and CO2 permeability and opacity).
Water Vapor Permeability (WVP). The water vapor perme-ability is the most extensively studied property of edible filmsmainly because of the importance of the water in deteriorativereactions. The three best solutions of chitosan (C) in terms ofwettability were subsequently analyzed for WVP. Table 2 shows
Functional Polysaccharides As Cheese Coatings J. Agric. Food Chem., Vol. 57, No. 4, 2009 1459

that the values of WVP change with the integration of sorbitoland with different concentrations of glycerol. With the additionof sorbitol, the WVP decreases, and this observation is inagreement with the conclusions of Garcia et al. (25) andHernandez-Munoz et al. (26). Table 2 shows that WVP for filmsfrom solution C2 is statistically significant different from thatof the other two (C1 and C6), presenting a higher value of WVP.Although an increase of the mean value of WVP is observabledue to the increase of glycerol concentration (from solution C1to solution C2), the difference is statistically significant.
The same procedure was adopted for G. triacanthos (GT)solutions GT3, GT12, and GT15. Films from solutions GT12and GT15 showed a lower value of WVP without a statisticallysignificant difference, while the value of WVP for the films fromsolution GT15 is significantly different from those obtained withsolution GT3 (Table 2). An increase of the concentration ofGT galactomannan corresponds to a decrease of WVP, presum-ably due to a stronger gel network, where the polysaccharidemolecules are closer together. Furthermore, the solution withsorbitol (GT15) showed the lowest value of WVP; this observa-tion may be explained by the larger size and lower hygroscopic-ity of the sorbitol compared to those of glycerol, reducing itsability to affect hydrogen bonding between polysaccharidechains (27).
Table 2 also shows the values of WVP for the best solutionsof G. birdiae (GB2, GB11, and GB15). The lower WVP valueswere registered for films from solutions GB11 and GB15, whichare not statistically different but have a statistically significant
difference with solution GB2. In parallel to what happened withthe films from solutions of G. triacanthos, increasing theconcentration of G. birdiae led to lower values of WVP.
The addition of oil promoted a decrease of WVP in both G.triacanthos and G. birdiae films. In this line, Hernandez-Munozet al. (26) indicated that WVP occurs through the hydrophilicportion of the film; therefore, depending on the hydrophilic-hydrophobic ratio of the films, Avena-Bustillos et al. (28)showed that WVP decreases with the addition of beeswax tosodium caseinate films. Also, Peroval et al. (29) showed thatarabinoxylan films with hydrogenated palm oil have lower WVPvalues than films without oil. Pranoto et al. (30) showed similarresults with alginate-based films containing garlic oil.
Oxygen Permeability (O2P). Oxygen is the key factor incheese preservation. Films that provide a proper oxygen barriercan help improve food quality and extending food shelf life.Table 2 presents the values of O2P of the analyzed samples. Inthe case of chitosan films, the samples with higher concentrationof plasticizer have statistically higher values of O2P than thesamples with lower concentration, which were also shown byCaner et al. (31). The plasticizer decreases the intermolecularattractions between polymeric chains, facilitating the penetrationof gas molecules (2). However, the partial replacement ofglycerol by sorbitol provoked an increase of the O2P value, ascan be observed when comparing the results for films fromsolutions C2 and C6. As mentioned before, this difference canbe explained by the different molecular size and hygroscopicityof sorbitol and glycerol (27).
Films from solution GT12 show the lower value (significantlydifferent) of O2P, corresponding to the higher concentration ofplasticizer and also to the higher concentration of G. triacanthosgalactomannan. It is known that the increase of galactomannanconcentration contributes to the decrease of permeability, whileit is normally accepted that a higher concentration of glycerolincreases O2P. In the present case, the effect of the galacto-mannan concentration seems to have surpassed the effect ofglycerol concentration, contrary to what has been observed forthe solutions of chitosan. Garcia et al. (25) found similar resultsfor starch-based films and explained their results by stating thatthe addition of plasticizer decreases the presence of pores andcracks, improving dispersion and decreasing gas permeability.There were no statistically significant differences for the filmsfrom solutions of G. birdiae in terms of O2P (Table 2), havinglower values when compared with the films of GT and C.
Carbon Dioxide Permeability (CO2P). Table 2 shows thecomparison of CO2 permeability values for the differentpolysaccharides. The chitosan films displayed lower values ofCO2P, and the different films of C do not present a statistically
Table 2. Values of Water, O2, CO2 Permeability, and Opacity of the Films
solutionWVPa × 10-11
(g · (m · s · Pa)-1)O2Pa × 10-15
(g · m · (Pa · s · m2)-1)CO2Pa × 10-15
(g · m · (Pa · s · m2)-1) opacitya (%)
Chitosan C1 3.22 ( 0.22 ac 2.35 ( 0.17 a 10.35 ( 0.32 a 2.74 ( 0.21 aC2 4.05 ( 0.31 b 1.82 ( 0.19 b 6.85 ( 0.78 b 2.45 ( 0.19 aC6 3.29 ( 0.34 ac 2.26 ( 0.15 a 6.73 ( 0.49 b 2.82 ( 0.03 a
G. triacanthos GT3 3.93 ( 0.17 b 1.61 ( 0.12 b 34.88 ( 2.17 c 5.62 ( 0.68 cGT12 3.24 ( 0.23 ac 0.94 ( 0.15 c 15.35 ( 0.99 d 5.27 ( 0.15 cGT15 2.69 ( 0.23 a 2.43 ( 0.29 a 12.84 ( 0.91 da 8.82 ( 0.40 d
G. birdiae GB2 6.21 ( 0.52 d 0.95 ( 0.08 c 41.71 ( 1.80 e 5.27 ( 0.49 cGB11 3.79 ( 0.40 bc 0.61 ( 0.13 c 5.55 ( 0.53 b 9.89 ( 0.61 dGB15 4.14 ( 0.24 b 0.55 ( 0.14 c 3.66 ( 0.54 f 13.03 ( 0.29 e
a Values reported are the means ( standard deviations (n ) 5, 95% confidence interval). Different letters in the same column indicate a statistically significant difference(Tukey test p < 0.05). Bold values are the best values.
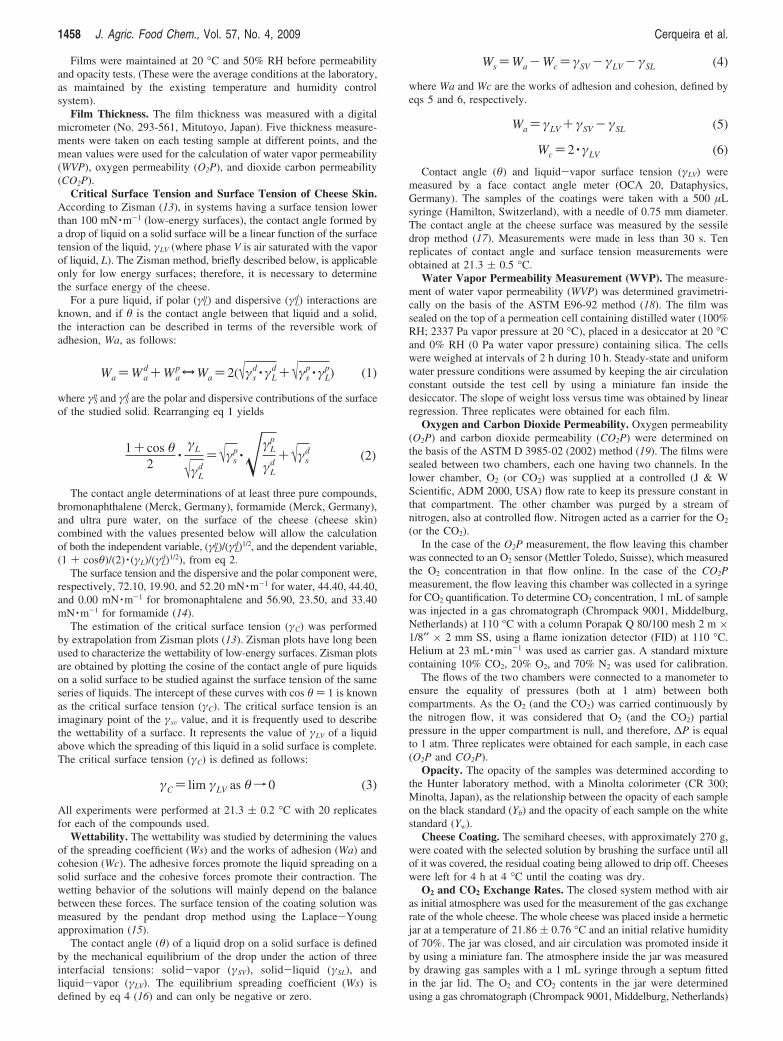
Figure 1. O2 and CO2 transfer rates in cheese at 21.86 ( 0.76 °C (n )2, 95% confidence level).
1460 J. Agric. Food Chem., Vol. 57, No. 4, 2009 Cerqueira et al.

significant difference. The film from solutions C2, however,shows the lower value. These results seem to indicate thatsolutions with a higher concentration of plasticizer produce filmswith a lower value of CO2P. The addition of plasticizerdecreases the presence of pores and cracks, improving thedispersion and decreasing the gas permeability (25).
For G. triacanthos films, the increase of the polysaccharideconcentration and the addition of sorbitol provoked a decreaseof CO2P. Films from solution GT3 show a statisticallysignificant difference from those of solutions GT12 and GT15(Table 2).
G. birdiae films display a very significant decrease of thevalue of CO2P with the increase of polysaccharide concentration.Also here, the addition of sorbitol decreases the value of CO2P,as shown by Garcia et al. (25). The effect of polysaccharideconcentration seems to be, by far, the most important oneaffecting CO2P.
Opacity. The opacity means a smaller transparency, importantto control the incidence of light on the cheese (32). Opacityvalues increase with the concentration in polysaccharide forfilms from solutions of GT and GB, the solutions with sorbitoland oil being those with a higher value of opacity. The additionof lipid caused the films to become whitish. Table 2 showsthat the incorporation of corn oil in the films increased theopacity. Yang et al. (33) demonstrated that gellan film also hasincreased opacity with the increase of lipid concentration.
Criteria for Choosing a Coating. When choosing anadequate coating composition for the cheese under consideration,there are a number of criteria that should be met. Some of those(such as wettability) have already been considered. Others, suchas gas transport properties and opacity, should be met in orderto (i) decrease the water loss of the cheese (i.e, lower WVPvalues); (ii) decrease the O2 permeability (i.e., lower O2Pvalues), once the oxygen in contact with the cheese contributesto the oxidation of fats and to the growth of undesirablemicroorganisms (13); (iii) increase the shelf life of cheese, byincreasing the lag-phase for the growth of coliforms (and otherGram-negative spoilage bacteria), yeasts and molds (9), i.e., highCO2P values; and (iv) decrease the light incidence in the cheese(light promotes fat oxidation) (13), i.e., high values of opacity.Having in mind the criteria explained above, it is possible toselect the best values of the permeability for water vapor, O2,and CO2, and opacity (Table 2).
In Table 2, the variables (WVP, O2P, and CO2P, opacity)were placed by decreasing order of importance, and solutionGT12 was chosen as the best option for coating cheese despitethe fact that its value of CO2P was not the highest among thosedetermined in this work. In fact, previous works have shownthat there are advantages and disadvantages both for low andhigh CO2P values (34), thus justifying the choice for an in-termediate one.
O2 and CO2 Transfer Rates in Cheese. To understand howthe GT coating solution can improve water loss and gasexchange, the whole cheese was coated using a solution withthe formulation of GT12, and O2 and CO2 transfer rates werecompared with those of the cheese without coating.
The concentration of the gases was measured during 48 h,the gas transfer rate was calculated, and the results are presentedin Figure 1. The coated cheese clearly displays a lower gasexchange rate, and it is also clear that the rate of CO2 productionis higher than that of O2 consumption.
The obtained values for the O2 consumption rate rangedbetween 13.65 and 8.33 mL ·kg-1 ·h-1, while the CO2 productionrate ranged between 14.52 and 9.27 mL ·kg-1 ·h-1 for uncoatedand coated cheese, respectively. These values are high whencompared with those of other cheese types. Fedio et al. (35)studied the gas exchange in Swiss cheese, and they found valuesranging from 1 to 2 mL ·kg-1 ·h-1. These values are difficult tocompare, however, because of differences in cheese compositionand in the extent of cheese maturation (e.g., ours was notsubjected to maturation). The presence of molds in the surfaceof the cheese may also be related to the differences found: thecoated cheese with less molds at the surface showed lowervalues of RO2 and RCO2.
Weight Loss and Surface Evaluation. The coated cheesepresents a relative weight loss of 0.11 ( 0.04%, while the cheesewithout coating loses 0.84 ( 0.07%. Therefore, the coatingallows a decrease in weight loss (ca. 8-fold the value in theabsence of coating).
During the experiments, the values of relative humidity insidethe jar increased rapidly, and at the end of the experiment, avalue of 100% was reached. After 48 h from the beginning ofthe experiment, the cheese began to show fungal growth at thesurface, mostly occurring on the uncoated cheese. Visualevaluation confirmed that the uncoated cheese had extensivemold growth with almost the entire surface covered with moldcolonies after only 48 h (Figure 2). The coating solution GT12appears to have inhibited the growth of molds, when comparedwith uncoated cheese. Further work has to be made to confirmthe suitability of this coating to increase the shelf life of cheeseafter ripening and at different storage temperatures.
In conclusion, the cheese with coating has lower gas transferrates as well as a decrease of the relative weight loss (ca. 8-foldless the value in the absence of coating). Visual evaluation alsoconfirmed that the uncoated cheese suffered from an extensivemold growth when compared with the coated cheese.
The present work can serve as a guide for the use of newcoatings for cheese as alternatives to synthetic coatings and mayalso be a guide for the study of future new materials for thispurpose.
Figure 2. Cheese in a jar, with coating (a) and without coating (b).
Functional Polysaccharides As Cheese Coatings J. Agric. Food Chem., Vol. 57, No. 4, 2009 1461

ACKNOWLEDGMENT
We thank Queijo Saloio S.A. for all the support concerningthe supply of the cheese samples.
LITERATURE CITED
(1) Lin, D.; Zhao, Y. Innovations in the development and applicationof edible coatings for fresh and minimally processed fruits andvegetables. CRFSFS 2007, 6, 60–75.
(2) Kester, J. J.; Fennema, O. R. Edible film and coatings: a review.Food Technol. 1986, 40, 47–59.
(3) Nisperos-Carriedo, M. O. Edible Coatings and Films Based onPolysaccharides. In Edible Coatings and Films to ImproVe FoodQuality; Krochta, J. M., Baldiw, E. A., Nisperos-Carriedo, M.,Eds.; Technomic Publishing Company, Inc.: Lancaster, PA, 1994;pp 305-335.
(4) Ribeiro, C.; Vicente, A. A.; Teixeira, J. A.; Miranda, C. Optimiza-tion of edible coating composition to retard strawberry fruitsenescence. PostharVest Biol. Technol. 2007, 44, 63–70.
(5) Mannheim, C. M.; Soffer, T. Shelf-life extension of cottage cheeseby modified atmosphere packaging. Lebensm.-Wiss. Technol.1996, 29, 767–771.
(6) Westall, S.; Filtenborg, O. Spoilage yeasts of decorated soft cheesepacked in modified atmosphere. Food Microbiol. 1998, 15, 243–249.
(7) Haasum, I.; Nielsen, P. V. Physiological characterization ofcommon fungi associated with cheese. J. Food Sci. 1998, 63, 157–161.
(8) Saurel, R.; Pajonk, A.; Andrieu, J. Modelling of French Emmentalcheese water activity during salting and ripening periods. J. FoodEng. 2004, 63, 163–170.
(9) Robertson, G. L. Packaging of Dairy Products. In Food Packaging:Principles and Practice; Robertson, G. L., Ed.; CRC/Taylor &Francis: Boca Raton, FL, 2006; pp 400-415.
(10) Pantaleao, I.; Pintado, M. M. E.; Pocas, M. F. F. Evaluation oftwo packaging systems for regional cheese. Food Chem. 2007,102, 481–487.
(11) Cerqueira, M. A.; Pinheiro, A. C.; Souza, B. W. S.; Lima,A. M. P.; Riberio, C.; Miranda, C.; Teixeira, J. A.; Moreira, R. A.;Coimbra, M. A.; Goncalves, M. P.; Vicente, A. A. Extraction,purification and characterization of galactomannans from non-traditional sources. Carbohydr. Polym. 2009, 77, 408–414.
(12) Noseda, M. D.; Tulio, S.; Duarte, M. E. R. Polysaccharides fromthe red seaweed Bostrychia montagnei: chemical characterization.J. Appl. Phycol. 1999, 11, 35–40.
(13) Zisman, W. A. Contact Angle, Wettability and Adhesion; Fowkes,F. M. Advances in Chemistry Series; American Chemical Society:Washington, DC, 1964. Vol. 43, pp 1-51.
(14) Busscher, H. J.; Van Pelt, A. W.; de Boer, P.; de Jong, H. P.;Arends, J. The effect of surface roughening of polymers onmeasured contact angles of liquids. Colloids Surf. 1984, 9, 319–331.
(15) Song, B.; Springer, J. Determination of interfacial tension fromthe profile of a pendant drop using computer-aided imageprocessing. J. Colloid Interface Sci. 1996, 184, 64–76.
(16) Rulon, J.; Robert, H. Wetting of Low-Energy Surfaces. InWettability; Berg, J. C., Ed.; Marcel Dekker Inc.: New York, 1993;pp 4-73.
(17) Newman, A. W.; Kwok, D. Y. Contact angle measurement andcontact angle interpretation. AdV. Colloid Interface Sci. 1999, 81,167–249.
(18) Guillard, V.; Broyart, B.; Bonazzi, C.; Guilbert, S.; Gontard, N.Preventing moisture transfer in a composite food using ediblefilms: Experimental and mathematical study. J. Food Sci. 2003,68, 2267–2277.
(19) ASTM D 3985-05. Standard test method for oxygen gas transmis-sion rate through plastic film and sheeting using a coulometricsensor. In ASTM Book of Standards; ASTM International: WestConshohocken, PA, 2005.
(20) Salvador, M. L.; Jaime, P.; Oria, R. Modeling of O2 and CO2
exchange dynamics in modified atmosphere packaging of burlatcherries. J. Food Sci. 2002, 67, 231–235.
(21) Owolarafe, O. K.; Olabige, T. M.; Faborode, M. O. Macro-structural characterization of palm fruit at different processingconditions. J. Food Eng. 2007, 79, 31–36.
(22) Di Marzo, S.; Di Monaco, R.; Cavella, S.; Romano, R.; Borriello,I.; Masi, P. Correlation between sensory and instrumental proper-ties of Canestrato Pugliese slices packed in biodegradable films.Trends Food Sci. Technol. 2006, 17, 169–176.
(23) Yildirim, M.; Gulec, F.; Bayram, M.; Yildirim, Z. Properties ofKashar cheese coated with casein as carrier of natamycin. Ital. J.Food Sci. 2006, 18, 127–138.
(24) Van Oss, C. J. Hydrophobicity of biosurfaces: Origin, quantitativedetermination and interactions energies. Colloids Surf., B 1995,5, 91–110.
(25) Garcia, M. A.; Martino, M. N.; Zaritzky, N. E. Lipid addition toimprove barrier properties of edible starch-based films andcoatings. J. Food Sci. 2000, 65, 941–947.
(26) Hernandez-Munoz, P.; Lopez-Rubio, A.; Del-Valle, V.; Almenar,E.; Gavara, R. Mechanical and water barrier properties of gluteninfilms influenced by storage time. J. Agric. Food Chem. 2004, 52,79–83.
(27) Hong, S. I.; Krochta, J. M. Oxygen barrier properties of wheyprotein isolate coatings on polypropylene films. J. Food Sci. 2003,68, 224–228.
(28) Avena-Bustillos, R. J.; Krochta, J. M. Water vapor permeabilityof caseinate-based edible films as affected by pH, calciumcrosslinking and lipid content. J. Food Sci. 1993, 58, 904–907.
(29) Peroval, C.; Debeaufort, F.; Despre, D.; Voilley, A. Ediblearabinoxylan-based films. 1. Effects of lipid type on water vaporpermeability, film structure, and other physical characteristics. J.Agric. Food Chem. 2002, 50, 3977–3983.
(30) Pranoto, Y.; Vilas, M. S.; Rakshit, S. K. Physical and antibacterialproperties of alginate-based edible film incorporated with garlicoil. Food Res. Int. 2005, 38, 267–272.
(31) Caner, C.; Vergano, P. J.; Wiles, J. L. Chitosan film mechanicaland permeation properties as affect by acid, plasticizer, andstorage. J. Food Sci. 1998, 63, 1049–1053.
(32) Cuq, B.; Gontard, N.; Cuq, J. L.; Guilber, S. Functional propertiesof myofibrillar protein-based biopackaging as affected by filmthickness. J. Food Sci. 1996, 61, 580–584.
(33) Yang, L.; Paulson, A. T. Effects of lipids on mechanical andmoisture barrier properties of edible gellan film. Food Res. Int.2000, 33, 571–578.
(34) Papaioannou, G.; Chouliara, I.; Karatapanis, A. E.; Kontominas,M. G.; Savvaidis, I. N. Shelf-like of a Greek whey cheese undermodified atmosphere packaging. Int. Dairy J. 2007, 17, 358–364.
(35) Fedio, W. M.; Ozimek, L.; Wolfe, F. H. Gas production duringstorage of Swiss cheese. Milchwissenschaft 1994, 49, 3–8.
Received for review September 3, 2008. Revised manuscript receivedDecember 19, 2008. Accepted December 20, 2008. M.A.C. is a recipientof a fellowship from Fundacao para a Ciencia e Tecnologia (FCT,SFRH/BD/23897/2005), A.M.L. is the recipient of a fellowship fromrLFA VALNATURA Project of the Europe Aid Cooperation Office,and B.W.S.S. is a recipient of a fellowship from the CoordenacaoAperfeicoamento de Pessoal de Nıvel Superior, Brazil (Capes, Brazil).
JF802726D
1462 J. Agric. Food Chem., Vol. 57, No. 4, 2009 Cerqueira et al.
Copyright © 2022 FDOKUMEN