Functional Effects of Parasites on Food Web Properties during the Spring Diatom Bloom in Lake Pavin:...
14
Functional Effects of Parasites on Food Web Properties during the Spring Diatom Bloom in Lake Pavin: A Linear Inverse Modeling Analysis Boutheina Grami 1. , Serena Rasconi 1,2. , Nathalie Niquil 1 *, Marle ` ne Jobard 2 , Blanche Saint-Be ´at 1 , Te ´ lesphore Sime-Ngando 2 1 Universite ´ de La Rochelle-CNRS, UMR 6250 Littoral Environnement et Socie ´te ´s (LIENSs), La Rochelle, France, 2 LMGE, Laboratoire Microorganismes: Ge ´nome et Environnement, UMR CNRS 6023, Clermont Universite ´, Blaise Pascal, BP 80026, Aubie `re, France Abstract This study is the first assessment of the quantitative impact of parasitic chytrids on a planktonic food web. We used a carbon-based food web model of Lake Pavin (Massif Central, France) to investigate the effects of chytrids during the spring diatom bloom by developing models with and without chytrids. Linear inverse modelling procedures were employed to estimate undetermined flows in the lake. The Monte Carlo Markov chain linear inverse modelling procedure provided estimates of the ranges of model-derived fluxes. Model results support recent theories on the probable impact of parasites on food web function. In the lake, during spring, when ‘inedible’ algae (unexploited by planktonic herbivores) were the dominant primary producers, the epidemic growth of chytrids significantly reduced the sedimentation loss of algal carbon to the detritus pool through the production of grazer-exploitable zoospores. We also review some theories about the potential influence of parasites on ecological network properties and argue that parasitism contributes to longer carbon path lengths, higher levels of activity and specialization, and lower recycling. Considering the ‘‘structural asymmetry’’ hypothesis as a stabilizing pattern, chytrids should contribute to the stability of aquatic food webs. Citation: Grami B, Rasconi S, Niquil N, Jobard M, Saint-Be ´at B, et al. (2011) Functional Effects of Parasites on Food Web Properties during the Spring Diatom Bloom in Lake Pavin: A Linear Inverse Modeling Analysis. PLoS ONE 6(8): e23273. doi:10.1371/journal.pone.0023273 Editor: Jack Anthony Gilbert, Argonne National Laboratory, United States of America Received April 4, 2011; Accepted July 11, 2011; Published August 22, 2011 Copyright: ß 2011 Grami et al. This is an open-access article distributed under the terms of the Creative Commons Attribution License, which permits unrestricted use, distribution, and reproduction in any medium, provided the original author and source are credited. Funding: This study was supported by a grant from the French ANR (Agence Nationale de la Recherche) Programme Blanc ‘DREP: Diversite ´ et Ro ˆ les des Eumyce ` tes dans le Pe ´lagos’; Coordinator TSN. B.G. and S.R. were supported by grants from DREP (T.S.-N., N.N.). B.S.B. was supported by a PhD fellowship from the CNRS and Re ´gion Poitou-Charentes. The funders had no role in study design, data collection and analysis, decision to publish, or preparation of the manuscript. Competing Interests: The authors have declared that no competing interests exist. * E-mail: [email protected] . These authors contributed equally to this work. Introduction Fungal parasitism is common in plankton communities [1–4], especially in the form of parasitic chytrids [5–8]. In freshwater environments, chytrids infect a wide variety of hosts including fish, eggs, zooplankton, and other aquatic fungi but primarily microalgae. Chytrids are also called ‘zoosporic’ fungi [9], since their life cycle includes dispersal forms, uniflagellated zoospores, and host-associated infective sporangia. Microscopic observations have provided evidence for the presence of both forms in the plankton [8,10]. Previous studies have investigated the effects of chytrid parasitism on the growth of algal species and phytoplankton successions [11–13] as well as on the genetic structure of infected populations [14]. A critical finding was that chytrids seem to preferentially infect large algae. In the absence of parasites, large and colonial microalgae species because of their inedibility are unexploited in the planktonic food web and sink from the euphotic to the benthic zone [15,13]. However, infective sporangia not only consume host biomass thereby contributing to nutrient recycling, but also produce zoospores which are potential prey for cladoceran zooplankter [16]. Thus, fungi might increase the growth of phytoplankton through releasing nutrients bound in inedible algae, and increase the growth of zooplankton by converting biomass from inedible algae to edible zoospores. Moreover, zoospores constitute upgraded food source for grazers because of their high nutritional quality [16]. This chytrid pathway was recently conceptualized in the ‘‘Mycoloop theory’’ [13], and in the specific case of large inedible algae, chytrid zoospores can constitute an important trophic link and prevent the loss of energy in the plankton. Thus, parasitic chytrids are potentially important in pelagic environments due to their role as trophic links and in biogeochemical cycling. Given that food webs are central to ecological concepts [17], it is important to establish the role of parasites in the structure and function of food webs. In theory, parasites can have a variety of effects. Lafferty et al. [18–19] suggested that parasites affect food- web properties and topology since they double connectance (defined as the number of observed links divided by the number of possible links) and quadruple the number of links. Others have postulated that parasites drive an increase in species richness, trophic levels, and trophic chain length of the food web [20–21]. These properties may stabilize community structure [22]. However, the potential effects of parasites on food web stability is a complex and unresolved issue [19] since the concept of stability is the centre of a perhaps infinite debate in community PLoS ONE | www.plosone.org 1 August 2011 | Volume 6 | Issue 8 | e23273
Transcript of Functional Effects of Parasites on Food Web Properties during the Spring Diatom Bloom in Lake Pavin:...

Functional Effects of Parasites on Food Web Propertiesduring the Spring Diatom Bloom in Lake Pavin: A LinearInverse Modeling AnalysisBoutheina Grami1., Serena Rasconi1,2., Nathalie Niquil1*, Marlene Jobard2, Blanche Saint-Beat1,
Telesphore Sime-Ngando2
1 Universite de La Rochelle-CNRS, UMR 6250 Littoral Environnement et Societes (LIENSs), La Rochelle, France, 2 LMGE, Laboratoire Microorganismes: Genome et
Environnement, UMR CNRS 6023, Clermont Universite, Blaise Pascal, BP 80026, Aubiere, France
Abstract
This study is the first assessment of the quantitative impact of parasitic chytrids on a planktonic food web. We used acarbon-based food web model of Lake Pavin (Massif Central, France) to investigate the effects of chytrids during the springdiatom bloom by developing models with and without chytrids. Linear inverse modelling procedures were employed toestimate undetermined flows in the lake. The Monte Carlo Markov chain linear inverse modelling procedure providedestimates of the ranges of model-derived fluxes. Model results support recent theories on the probable impact of parasiteson food web function. In the lake, during spring, when ‘inedible’ algae (unexploited by planktonic herbivores) were thedominant primary producers, the epidemic growth of chytrids significantly reduced the sedimentation loss of algal carbonto the detritus pool through the production of grazer-exploitable zoospores. We also review some theories about thepotential influence of parasites on ecological network properties and argue that parasitism contributes to longer carbonpath lengths, higher levels of activity and specialization, and lower recycling. Considering the ‘‘structural asymmetry’’hypothesis as a stabilizing pattern, chytrids should contribute to the stability of aquatic food webs.
Citation: Grami B, Rasconi S, Niquil N, Jobard M, Saint-Beat B, et al. (2011) Functional Effects of Parasites on Food Web Properties during the Spring DiatomBloom in Lake Pavin: A Linear Inverse Modeling Analysis. PLoS ONE 6(8): e23273. doi:10.1371/journal.pone.0023273
Editor: Jack Anthony Gilbert, Argonne National Laboratory, United States of America
Received April 4, 2011; Accepted July 11, 2011; Published August 22, 2011
Copyright: � 2011 Grami et al. This is an open-access article distributed under the terms of the Creative Commons Attribution License, which permitsunrestricted use, distribution, and reproduction in any medium, provided the original author and source are credited.
Funding: This study was supported by a grant from the French ANR (Agence Nationale de la Recherche) Programme Blanc ‘DREP: Diversite et Roles desEumycetes dans le Pelagos’; Coordinator TSN. B.G. and S.R. were supported by grants from DREP (T.S.-N., N.N.). B.S.B. was supported by a PhD fellowship from theCNRS and Region Poitou-Charentes. The funders had no role in study design, data collection and analysis, decision to publish, or preparation of the manuscript.
Competing Interests: The authors have declared that no competing interests exist.
* E-mail: [email protected]
. These authors contributed equally to this work.
Introduction
Fungal parasitism is common in plankton communities [1–4],
especially in the form of parasitic chytrids [5–8]. In freshwater
environments, chytrids infect a wide variety of hosts including fish,
eggs, zooplankton, and other aquatic fungi but primarily
microalgae. Chytrids are also called ‘zoosporic’ fungi [9], since
their life cycle includes dispersal forms, uniflagellated zoospores,
and host-associated infective sporangia. Microscopic observations
have provided evidence for the presence of both forms in the
plankton [8,10].
Previous studies have investigated the effects of chytrid
parasitism on the growth of algal species and phytoplankton
successions [11–13] as well as on the genetic structure of infected
populations [14]. A critical finding was that chytrids seem to
preferentially infect large algae. In the absence of parasites, large
and colonial microalgae species because of their inedibility are
unexploited in the planktonic food web and sink from the euphotic
to the benthic zone [15,13]. However, infective sporangia not only
consume host biomass thereby contributing to nutrient recycling,
but also produce zoospores which are potential prey for
cladoceran zooplankter [16]. Thus, fungi might increase the
growth of phytoplankton through releasing nutrients bound in
inedible algae, and increase the growth of zooplankton by
converting biomass from inedible algae to edible zoospores.
Moreover, zoospores constitute upgraded food source for grazers
because of their high nutritional quality [16]. This chytrid
pathway was recently conceptualized in the ‘‘Mycoloop theory’’
[13], and in the specific case of large inedible algae, chytrid
zoospores can constitute an important trophic link and prevent the
loss of energy in the plankton. Thus, parasitic chytrids are
potentially important in pelagic environments due to their role as
trophic links and in biogeochemical cycling.
Given that food webs are central to ecological concepts [17], it is
important to establish the role of parasites in the structure and
function of food webs. In theory, parasites can have a variety of
effects. Lafferty et al. [18–19] suggested that parasites affect food-
web properties and topology since they double connectance
(defined as the number of observed links divided by the number of
possible links) and quadruple the number of links. Others have
postulated that parasites drive an increase in species richness,
trophic levels, and trophic chain length of the food web [20–21].
These properties may stabilize community structure [22].
However, the potential effects of parasites on food web stability
is a complex and unresolved issue [19] since the concept of
stability is the centre of a perhaps infinite debate in community
PLoS ONE | www.plosone.org 1 August 2011 | Volume 6 | Issue 8 | e23273
ecology [23–28]. Based on the ideas of May [29], parasites should
lead to a destabilized trophic network because they increase
species diversity and the connectance. In addition, adding
parasites to food webs extends the length of trophic chains which
can decrease food-web stability [30]. However, the addition of
long loops of weak interactions, which may be a characteristic of
parasites with complex life cycles, might offset the destabilizing
effects of increased connectance [31].
To investigate ecosystem properties and ecological theories, the
application of mathematical tools, such as models, is useful and
allows trophic network representation through carbon flows. In the
absence of quantification of the flows induced by fungal activity,
simulations were recently realized of their potential role in the
plankton food web of the Lake Biwa [32]. The presence of this
indirect pathway channeling microphytoplankton production to
the consumers via the fungi, leads to an enhancement of the
trophic efficiency index and a decrease of the ratio detritivory/
herbivory [32], when considering the fungi, compared with a
model without fungi. The results suggested that the food web relies
less on the consumption of detritus, and that the transfer of carbon
to higher trophic levels is higher than estimated without taking into
account the parasites. Due to the lack of data quantifying carbon
transfer through parasitism in pelagic ecosystems no attempt was
made to build model based on field estimated flows. Thus, the
roles and ecological implications of chytrid infections of micro-
phytoplankton remain to be fully explored for aquatic microbial
food webs.
In this study our objective was to add parasitic chytrids as a
compartment in a well-studied pelagic food web and quantify their
impact on matter flow through a trophic network. We then
evaluate, for the first time, the impact of chytrid parasitism on the
functioning of a planktonic ecosystem using field data set collected
from the euphotic zone of the oligo-mesotrophic Lake Pavin
(Massif Central, France). To describe the food web, we built a
model representative of carbon flow involved in chytrid parasitism
and quantified the amount of primary production channelled in
food web via chytrid infection. Specifically, we compared carbon
flows between the complete food web including parasitic chytrids
(MWC, Model with Chytrids) with the same model that did not
consider the presence of chytrids and the resulting flows (MWOC,
Model without Chytrid), as traditionally done in previous plankton
food-web analysis [e.g. 33]. Both of them were constructed on the
base of the same data set corresponding to the spring bloom period
in Lake Pavin (i.e. March to June 2007).
These models were built using the Linear Inverse Modeling
procedure (LIM, [34]) recently modified into the LIM-Monte
Carlo Markov Chain (LIM-MCMC, [35]). This method allow
reconstruction of missing flow values and alleviates the problem of
under-sampling using the principle of conservation of mass, i.e. the
quantity of carbon coming into each compartment considered as
equal to the amount leaving it [34]. Thanks to recent development
of the inverse analysis into LIM – MCMC, a probability density
function covering the range of possible values, was generated for
each flow. For each calculated set of flows, there is a set of
calculated indices which allows application of statistical tests. The
flows obtained from the models were used for calculations of
Ecological Network Analysis indices that characterize the structure
of the food web, and help reveal emergent properties [36–38]. The
use of ecological indices moreover, allows an indirect evaluation of
the effects of network properties on the stability of an ecosystem, as
several authors have proposed theoretical links between structural
properties and local stability. For example, Ulanowicz [39] stated
that a stable ecosystem needs sufficient amounts of two mutually
exclusive attributes: ecosystem organization and overheads.
Ecosystem organization is characterized by the Ascendency index
[40]. Overheads represent all those disorganized, inefficient and
incoherent aspects of an ecosystem’s activity [41]. In the absence
of perturbation, ecosystem Ascendency tends to increase at the
expense of the overheads and the ultimate result is a highly
organized, tightly constrained and stable ecosystem [39]. On the
other hand, Rooney et al. [42] proposed as a stabilizing pattern a
high specialisation of the flows (comparable to the high
organisation proposed by Ulanowicz) in the lowest trophic levels
and a low specialisation in the high levels. The sum of these
analyses revealed overlooked trophic links in a planktonic system
in which parasites of microalgae are integrated including (i) the
carbon flows involved in chytrid parasitism pathway, (ii) the
emergent properties of a planktonic food web in which parasites
are integrated, and (iii) the structural and functional properties of a
parasite-containing ecosystem.
Results
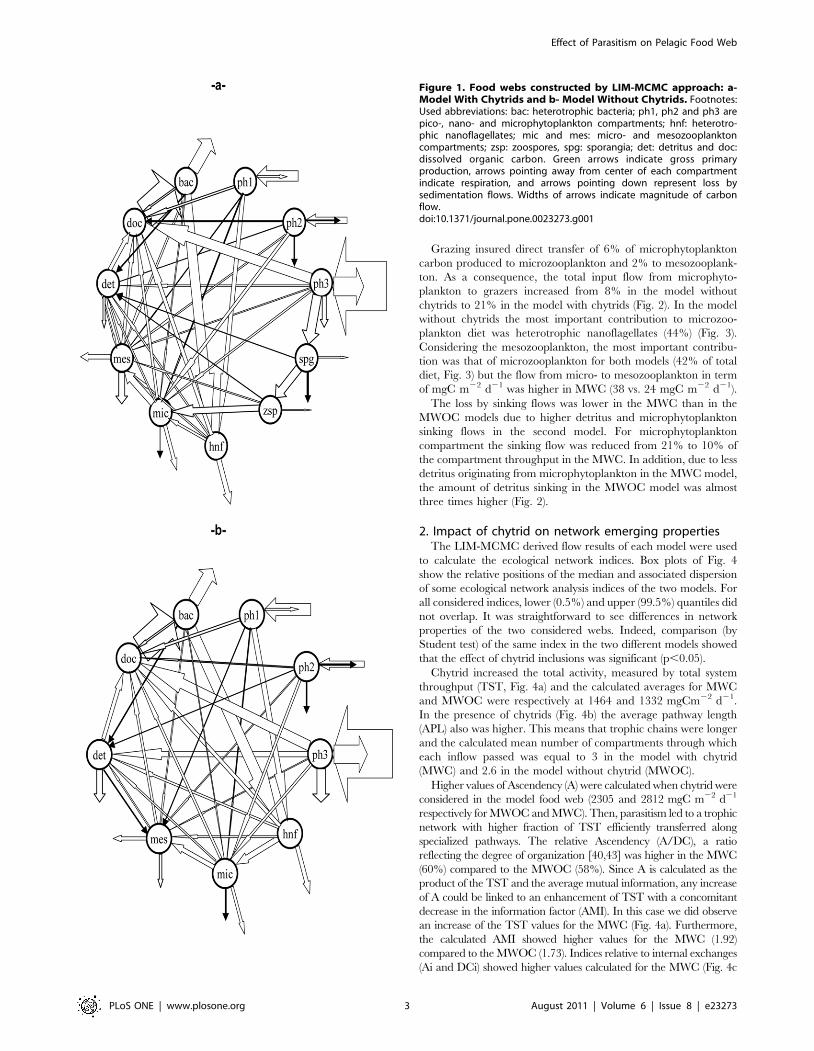
1. Direct and indirect impacts of chytrids on overall flowsCalculated flows (mgCm22 d21) by the LIM–MCMC method,
in food webs with or without fungal compartments (i.e. MWC and
MWOC), are detailed in Fig. 1 and Table 1. Carbon input into the
pelagic system was from the phytoplanktonic primary producers.
No allochtonous input were considered due to the small catchment
area (50 ha) of Lake Pavin, and the absence of inflow river. For the
two models, the major contribution to the gross primary
production was provided by microphytoplankton (74%) while
the nanophytoplankton and the picophytoplankton contribution
were at 16% and 10% respectively. The carbon throughput
calculated for sporangia and zoospores represented 5.2% and
4.2% of the total system throughput, respectively.
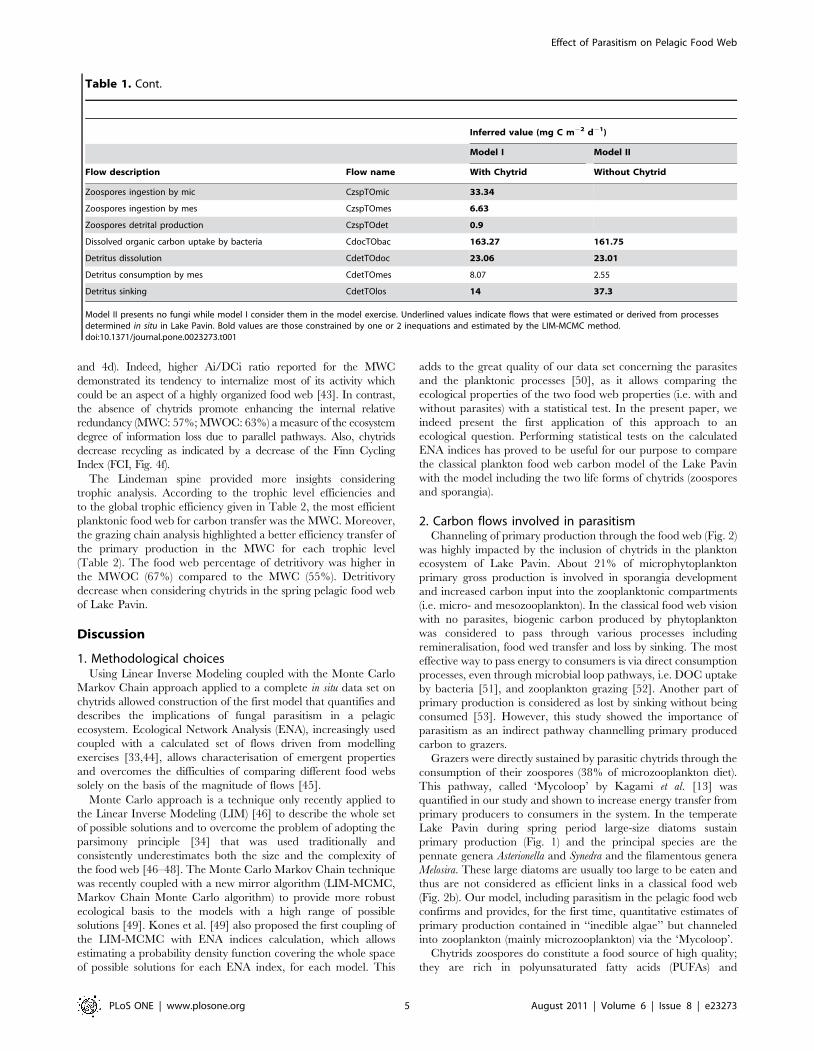
Carbon flowing from the microphytoplankton compartments to
the parasites (i.e. sporangia and zoospores) and through them to
the grazers (i.e. microzooplankton and mesozooplankton) is
detailed in Fig. 2 in order to focus and compare the fate of
microphytoplankton primary production for both models.
Through parasitism, 21.4% of the microphytoplankton through-
put was channelled to sporangia compartment (Fig. 2); 17.4% of
this flow was transferred to zoospores via sporangia production
and 12.5% was then channelled to microzooplankton and 2.5% to
mesozooplankton by grazing on zoospores. Among fungal
compartments, 81.4% of sporangia throughput was channelled
to zoospores and 85% of zoospores throughput was channelled to
micro- and mesozooplankton. Most of this flow was taken up by
microzooplankton (71%) and only 14% by mesozooplankton. In
the presence of chytrids a substantial contribution to microzoo-
plankton diet originated from zoospores (38% of total diet).
Formation of detritus represented 9% of total sporangia
compartment throughput, the losses by respiration and sedimen-
tation were at 12 and 5%, respectively. Detritus formation from
zoospores constituted 1.8% of this compartment throughput, the
carbon loss by respiration was 12.6% and no loss due to sinking
was considered. The total detritus formation decreased in the
presence of chytrids in the food web (29% less of detritus
compartment throughput) due to lower contribution of micro-
phytoplankton (from 11 to 3% ) to detritus input (Fig. 2).
Compared to the model without chytrids, microzooplankton
and mesozooplankton throughput in the model with parasites
exhibited higher throughput rates, 23% and 36%, respectively.
Conversely, heterotrophic nanoflagellates and detritus through-
puts increased (13% and 40%, respectively) when parasites were
not included in the food web construction (i.e. MWOC).
Effect of Parasitism on Pelagic Food Web
PLoS ONE | www.plosone.org 2 August 2011 | Volume 6 | Issue 8 | e23273
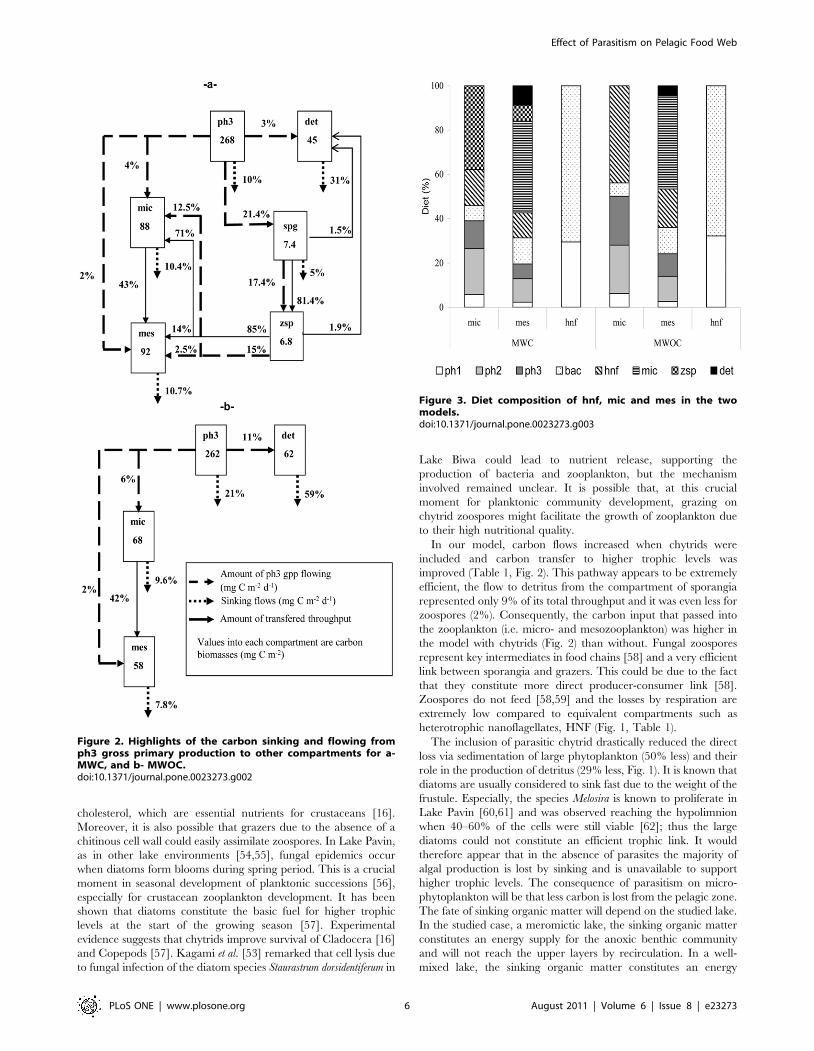
Grazing insured direct transfer of 6% of microphytoplankton
carbon produced to microzooplankton and 2% to mesozooplank-
ton. As a consequence, the total input flow from microphyto-
plankton to grazers increased from 8% in the model without
chytrids to 21% in the model with chytrids (Fig. 2). In the model
without chytrids the most important contribution to microzoo-
plankton diet was heterotrophic nanoflagellates (44%) (Fig. 3).
Considering the mesozooplankton, the most important contribu-
tion was that of microzooplankton for both models (42% of total
diet, Fig. 3) but the flow from micro- to mesozooplankton in term
of mgC m22 d21 was higher in MWC (38 vs. 24 mgC m22 d21).
The loss by sinking flows was lower in the MWC than in the
MWOC models due to higher detritus and microphytoplankton
sinking flows in the second model. For microphytoplankton
compartment the sinking flow was reduced from 21% to 10% of
the compartment throughput in the MWC. In addition, due to less
detritus originating from microphytoplankton in the MWC model,
the amount of detritus sinking in the MWOC model was almost
three times higher (Fig. 2).
2. Impact of chytrid on network emerging propertiesThe LIM-MCMC derived flow results of each model were used
to calculate the ecological network indices. Box plots of Fig. 4
show the relative positions of the median and associated dispersion
of some ecological network analysis indices of the two models. For
all considered indices, lower (0.5%) and upper (99.5%) quantiles did
not overlap. It was straightforward to see differences in network
properties of the two considered webs. Indeed, comparison (by
Student test) of the same index in the two different models showed
that the effect of chytrid inclusions was significant (p,0.05).
Chytrid increased the total activity, measured by total system
throughput (TST, Fig. 4a) and the calculated averages for MWC
and MWOC were respectively at 1464 and 1332 mgCm22 d21.
In the presence of chytrids (Fig. 4b) the average pathway length
(APL) also was higher. This means that trophic chains were longer
and the calculated mean number of compartments through which
each inflow passed was equal to 3 in the model with chytrid
(MWC) and 2.6 in the model without chytrid (MWOC).
Higher values of Ascendency (A) were calculated when chytrid were
considered in the model food web (2305 and 2812 mgC m22 d21
respectively for MWOC and MWC). Then, parasitism led to a trophic
network with higher fraction of TST efficiently transferred along
specialized pathways. The relative Ascendency (A/DC), a ratio
reflecting the degree of organization [40,43] was higher in the MWC
(60%) compared to the MWOC (58%). Since A is calculated as the
product of the TST and the average mutual information, any increase
of A could be linked to an enhancement of TST with a concomitant
decrease in the information factor (AMI). In this case we did observe
an increase of the TST values for the MWC (Fig. 4a). Furthermore,
the calculated AMI showed higher values for the MWC (1.92)
compared to the MWOC (1.73). Indices relative to internal exchanges
(Ai and DCi) showed higher values calculated for the MWC (Fig. 4c
Figure 1. Food webs constructed by LIM-MCMC approach: a-Model With Chytrids and b- Model Without Chytrids. Footnotes:Used abbreviations: bac: heterotrophic bacteria; ph1, ph2 and ph3 arepico-, nano- and microphytoplankton compartments; hnf: heterotro-phic nanoflagellates; mic and mes: micro- and mesozooplanktoncompartments; zsp: zoospores, spg: sporangia; det: detritus and doc:dissolved organic carbon. Green arrows indicate gross primaryproduction, arrows pointing away from center of each compartmentindicate respiration, and arrows pointing down represent loss bysedimentation flows. Widths of arrows indicate magnitude of carbonflow.doi:10.1371/journal.pone.0023273.g001
Effect of Parasitism on Pelagic Food Web
PLoS ONE | www.plosone.org 3 August 2011 | Volume 6 | Issue 8 | e23273
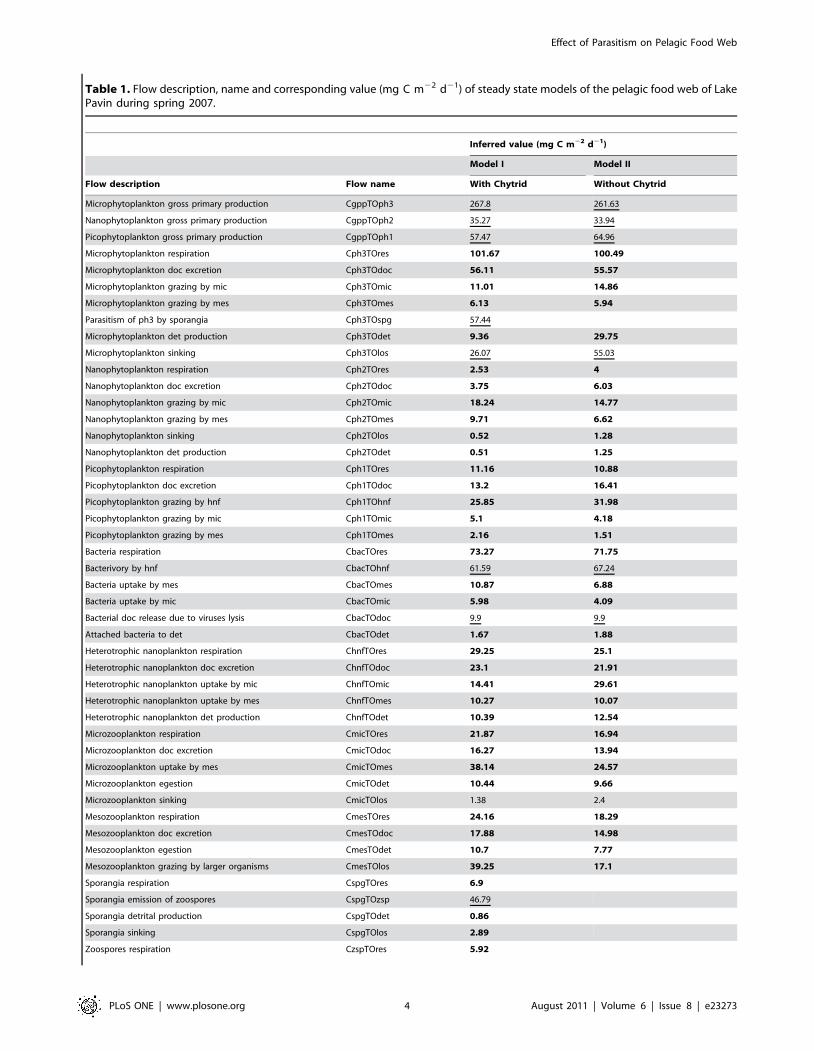
Table 1. Flow description, name and corresponding value (mg C m22 d21) of steady state models of the pelagic food web of LakePavin during spring 2007.
Inferred value (mg C m22 d21)
Model I Model II
Flow description Flow name With Chytrid Without Chytrid
Microphytoplankton gross primary production CgppTOph3 267.8 261.63
Nanophytoplankton gross primary production CgppTOph2 35.27 33.94
Picophytoplankton gross primary production CgppTOph1 57.47 64.96
Microphytoplankton respiration Cph3TOres 101.67 100.49
Microphytoplankton doc excretion Cph3TOdoc 56.11 55.57
Microphytoplankton grazing by mic Cph3TOmic 11.01 14.86
Microphytoplankton grazing by mes Cph3TOmes 6.13 5.94
Parasitism of ph3 by sporangia Cph3TOspg 57.44
Microphytoplankton det production Cph3TOdet 9.36 29.75
Microphytoplankton sinking Cph3TOlos 26.07 55.03
Nanophytoplankton respiration Cph2TOres 2.53 4
Nanophytoplankton doc excretion Cph2TOdoc 3.75 6.03
Nanophytoplankton grazing by mic Cph2TOmic 18.24 14.77
Nanophytoplankton grazing by mes Cph2TOmes 9.71 6.62
Nanophytoplankton sinking Cph2TOlos 0.52 1.28
Nanophytoplankton det production Cph2TOdet 0.51 1.25
Picophytoplankton respiration Cph1TOres 11.16 10.88
Picophytoplankton doc excretion Cph1TOdoc 13.2 16.41
Picophytoplankton grazing by hnf Cph1TOhnf 25.85 31.98
Picophytoplankton grazing by mic Cph1TOmic 5.1 4.18
Picophytoplankton grazing by mes Cph1TOmes 2.16 1.51
Bacteria respiration CbacTOres 73.27 71.75
Bacterivory by hnf CbacTOhnf 61.59 67.24
Bacteria uptake by mes CbacTOmes 10.87 6.88
Bacteria uptake by mic CbacTOmic 5.98 4.09
Bacterial doc release due to viruses lysis CbacTOdoc 9.9 9.9
Attached bacteria to det CbacTOdet 1.67 1.88
Heterotrophic nanoplankton respiration ChnfTOres 29.25 25.1
Heterotrophic nanoplankton doc excretion ChnfTOdoc 23.1 21.91
Heterotrophic nanoplankton uptake by mic ChnfTOmic 14.41 29.61
Heterotrophic nanoplankton uptake by mes ChnfTOmes 10.27 10.07
Heterotrophic nanoplankton det production ChnfTOdet 10.39 12.54
Microzooplankton respiration CmicTOres 21.87 16.94
Microzooplankton doc excretion CmicTOdoc 16.27 13.94
Microzooplankton uptake by mes CmicTOmes 38.14 24.57
Microzooplankton egestion CmicTOdet 10.44 9.66
Microzooplankton sinking CmicTOlos 1.38 2.4
Mesozooplankton respiration CmesTOres 24.16 18.29
Mesozooplankton doc excretion CmesTOdoc 17.88 14.98
Mesozooplankton egestion CmesTOdet 10.7 7.77
Mesozooplankton grazing by larger organisms CmesTOlos 39.25 17.1
Sporangia respiration CspgTOres 6.9
Sporangia emission of zoospores CspgTOzsp 46.79
Sporangia detrital production CspgTOdet 0.86
Sporangia sinking CspgTOlos 2.89
Zoospores respiration CzspTOres 5.92
Effect of Parasitism on Pelagic Food Web
PLoS ONE | www.plosone.org 4 August 2011 | Volume 6 | Issue 8 | e23273
and 4d). Indeed, higher Ai/DCi ratio reported for the MWC
demonstrated its tendency to internalize most of its activity which
could be an aspect of a highly organized food web [43]. In contrast,
the absence of chytrids promote enhancing the internal relative
redundancy (MWC: 57%; MWOC: 63%) a measure of the ecosystem
degree of information loss due to parallel pathways. Also, chytrids
decrease recycling as indicated by a decrease of the Finn Cycling
Index (FCI, Fig. 4f).
The Lindeman spine provided more insights considering
trophic analysis. According to the trophic level efficiencies and
to the global trophic efficiency given in Table 2, the most efficient
planktonic food web for carbon transfer was the MWC. Moreover,
the grazing chain analysis highlighted a better efficiency transfer of
the primary production in the MWC for each trophic level
(Table 2). The food web percentage of detritivory was higher in
the MWOC (67%) compared to the MWC (55%). Detritivory
decrease when considering chytrids in the spring pelagic food web
of Lake Pavin.
Discussion
1. Methodological choicesUsing Linear Inverse Modeling coupled with the Monte Carlo
Markov Chain approach applied to a complete in situ data set on
chytrids allowed construction of the first model that quantifies and
describes the implications of fungal parasitism in a pelagic
ecosystem. Ecological Network Analysis (ENA), increasingly used
coupled with a calculated set of flows driven from modelling
exercises [33,44], allows characterisation of emergent properties
and overcomes the difficulties of comparing different food webs
solely on the basis of the magnitude of flows [45].
Monte Carlo approach is a technique only recently applied to
the Linear Inverse Modeling (LIM) [46] to describe the whole set
of possible solutions and to overcome the problem of adopting the
parsimony principle [34] that was used traditionally and
consistently underestimates both the size and the complexity of
the food web [46–48]. The Monte Carlo Markov Chain technique
was recently coupled with a new mirror algorithm (LIM-MCMC,
Markov Chain Monte Carlo algorithm) to provide more robust
ecological basis to the models with a high range of possible
solutions [49]. Kones et al. [49] also proposed the first coupling of
the LIM-MCMC with ENA indices calculation, which allows
estimating a probability density function covering the whole space
of possible solutions for each ENA index, for each model. This
adds to the great quality of our data set concerning the parasites
and the planktonic processes [50], as it allows comparing the
ecological properties of the two food web properties (i.e. with and
without parasites) with a statistical test. In the present paper, we
indeed present the first application of this approach to an
ecological question. Performing statistical tests on the calculated
ENA indices has proved to be useful for our purpose to compare
the classical plankton food web carbon model of the Lake Pavin
with the model including the two life forms of chytrids (zoospores
and sporangia).
2. Carbon flows involved in parasitismChanneling of primary production through the food web (Fig. 2)
was highly impacted by the inclusion of chytrids in the plankton
ecosystem of Lake Pavin. About 21% of microphytoplankton
primary gross production is involved in sporangia development
and increased carbon input into the zooplanktonic compartments
(i.e. micro- and mesozooplankton). In the classical food web vision
with no parasites, biogenic carbon produced by phytoplankton
was considered to pass through various processes including
remineralisation, food wed transfer and loss by sinking. The most
effective way to pass energy to consumers is via direct consumption
processes, even through microbial loop pathways, i.e. DOC uptake
by bacteria [51], and zooplankton grazing [52]. Another part of
primary production is considered as lost by sinking without being
consumed [53]. However, this study showed the importance of
parasitism as an indirect pathway channelling primary produced
carbon to grazers.
Grazers were directly sustained by parasitic chytrids through the
consumption of their zoospores (38% of microzooplankton diet).
This pathway, called ‘Mycoloop’ by Kagami et al. [13] was
quantified in our study and shown to increase energy transfer from
primary producers to consumers in the system. In the temperate
Lake Pavin during spring period large-size diatoms sustain
primary production (Fig. 1) and the principal species are the
pennate genera Asterionella and Synedra and the filamentous genera
Melosira. These large diatoms are usually too large to be eaten and
thus are not considered as efficient links in a classical food web
(Fig. 2b). Our model, including parasitism in the pelagic food web
confirms and provides, for the first time, quantitative estimates of
primary production contained in ‘‘inedible algae’’ but channeled
into zooplankton (mainly microzooplankton) via the ‘Mycoloop’.
Chytrids zoospores do constitute a food source of high quality;
they are rich in polyunsaturated fatty acids (PUFAs) and
Inferred value (mg C m22 d21)
Model I Model II
Flow description Flow name With Chytrid Without Chytrid
Zoospores ingestion by mic CzspTOmic 33.34
Zoospores ingestion by mes CzspTOmes 6.63
Zoospores detrital production CzspTOdet 0.9
Dissolved organic carbon uptake by bacteria CdocTObac 163.27 161.75
Detritus dissolution CdetTOdoc 23.06 23.01
Detritus consumption by mes CdetTOmes 8.07 2.55
Detritus sinking CdetTOlos 14 37.3
Model II presents no fungi while model I consider them in the model exercise. Underlined values indicate flows that were estimated or derived from processesdetermined in situ in Lake Pavin. Bold values are those constrained by one or 2 inequations and estimated by the LIM-MCMC method.doi:10.1371/journal.pone.0023273.t001
Table 1. Cont.
Effect of Parasitism on Pelagic Food Web
PLoS ONE | www.plosone.org 5 August 2011 | Volume 6 | Issue 8 | e23273
cholesterol, which are essential nutrients for crustaceans [16].
Moreover, it is also possible that grazers due to the absence of a
chitinous cell wall could easily assimilate zoospores. In Lake Pavin,
as in other lake environments [54,55], fungal epidemics occur
when diatoms form blooms during spring period. This is a crucial
moment in seasonal development of planktonic successions [56],
especially for crustacean zooplankton development. It has been
shown that diatoms constitute the basic fuel for higher trophic
levels at the start of the growing season [57]. Experimental
evidence suggests that chytrids improve survival of Cladocera [16]
and Copepods [57]. Kagami et al. [53] remarked that cell lysis due
to fungal infection of the diatom species Staurastrum dorsidentiferum in
Lake Biwa could lead to nutrient release, supporting the
production of bacteria and zooplankton, but the mechanism
involved remained unclear. It is possible that, at this crucial
moment for planktonic community development, grazing on
chytrid zoospores might facilitate the growth of zooplankton due
to their high nutritional quality.
In our model, carbon flows increased when chytrids were
included and carbon transfer to higher trophic levels was
improved (Table 1, Fig. 2). This pathway appears to be extremely
efficient, the flow to detritus from the compartment of sporangia
represented only 9% of its total throughput and it was even less for
zoospores (2%). Consequently, the carbon input that passed into
the zooplankton (i.e. micro- and mesozooplankton) was higher in
the model with chytrids (Fig. 2) than without. Fungal zoospores
represent key intermediates in food chains [58] and a very efficient
link between sporangia and grazers. This could be due to the fact
that they constitute more direct producer-consumer link [58].
Zoospores do not feed [58,59] and the losses by respiration are
extremely low compared to equivalent compartments such as
heterotrophic nanoflagellates, HNF (Fig. 1, Table 1).
The inclusion of parasitic chytrid drastically reduced the direct
loss via sedimentation of large phytoplankton (50% less) and their
role in the production of detritus (29% less, Fig. 1). It is known that
diatoms are usually considered to sink fast due to the weight of the
frustule. Especially, the species Melosira is known to proliferate in
Lake Pavin [60,61] and was observed reaching the hypolimnion
when 40–60% of the cells were still viable [62]; thus the large
diatoms could not constitute an efficient trophic link. It would
therefore appear that in the absence of parasites the majority of
algal production is lost by sinking and is unavailable to support
higher trophic levels. The consequence of parasitism on micro-
phytoplankton will be that less carbon is lost from the pelagic zone.
The fate of sinking organic matter will depend on the studied lake.
In the studied case, a meromictic lake, the sinking organic matter
constitutes an energy supply for the anoxic benthic community
and will not reach the upper layers by recirculation. In a well-
mixed lake, the sinking organic matter constitutes an energy
Figure 2. Highlights of the carbon sinking and flowing fromph3 gross primary production to other compartments for a-MWC, and b- MWOC.doi:10.1371/journal.pone.0023273.g002
Figure 3. Diet composition of hnf, mic and mes in the twomodels.doi:10.1371/journal.pone.0023273.g003
Effect of Parasitism on Pelagic Food Web
PLoS ONE | www.plosone.org 6 August 2011 | Volume 6 | Issue 8 | e23273
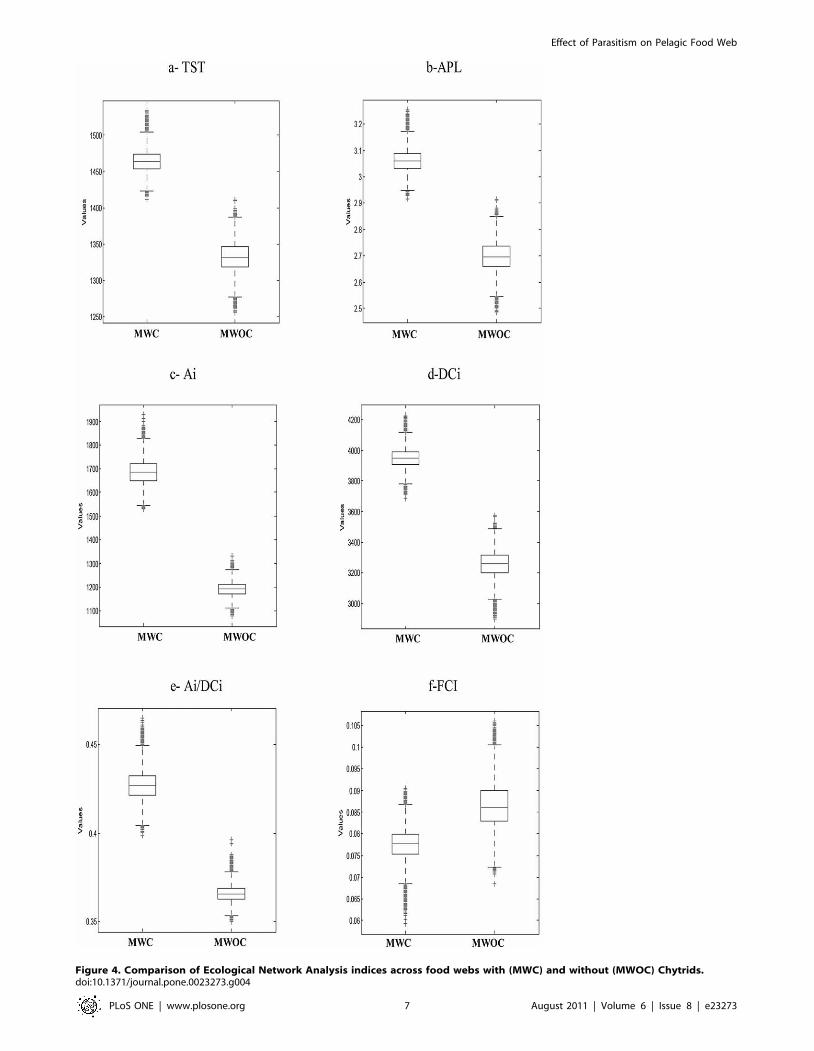
Figure 4. Comparison of Ecological Network Analysis indices across food webs with (MWC) and without (MWOC) Chytrids.doi:10.1371/journal.pone.0023273.g004
Effect of Parasitism on Pelagic Food Web
PLoS ONE | www.plosone.org 7 August 2011 | Volume 6 | Issue 8 | e23273

supply for benthos, and can reach the upper layers by recirculation
only after being processed in benthic food webs. Thus, chytrid
infections can increase the residence time of algal biomass in water
column [50] and decrease the contribution of organic matter to
the benthic community.Our results show that the ‘‘Mycoloop’’
reduces the sinking flows of inedible algae and the carbon
produced by these latter is transferred to consumers via zoospores
of chytrid parasites. Chytrids not only have important role in the
fate of primary production, but also in the trophic upgrading
necessary to boost the seasonal development of planktonic
populations in a pelagic ecosystem.
3. Emergent properties of ecosystem functioningTheoretical studies [18–19] have concluded that emergent
properties of an ecosystem can be affected by parasites. Analyzing
food web models with, and without, parasites was suggested by
parasitologists as a means to confirm theories [21,63]. In our case,
the comparison between the two models, including the range of
possible values for ENA indices, clarifies the effects of parasites on
ecosystem properties.
Number of flows increased in the model with chytrids (Fig. 1,
Table 1) as well as the total system activity (TST, Fig. 4a). Parasites
are known to add links and species to food webs [19] observed in
broad variety of environments, including terrestrial [64], estuarine
[18], marine [21] and freshwaters [55]. Even if this seems logical,
as for the addition of any species to a food web, this is especially
true for parasites that have a free-living stage that can interact with
other compartment and that may be eaten, as the chytrids
zoospores.
Including parasites in food web increases the number of
compartments through which each inflow passes and the APL
(Fig. 4b) expressed higher chain length for the MWC. This
important structural property (i.e. APL) defines the number of
links in food web and energy transfer through its components [65].
Increasing the number of links increases the robustness of
interactions [19] of an ecosystem, a measure of its overall
organization [18]. Robustness indeed is considered as a parameter
linked to the stability of the system [18], and according to this
theory, incorporating parasitic chytrids in pelagic food webs
increases stability. According to Williams and Martinez [30], any
increase in the length of trophic chains should decrease food web
stability.
Parasites help the food web to reach a higher limit of
development, as revealed by the DCi values. The increase of the
relative Ascendency as well as the internal relative Ascendency
(Ai/DCi) (Fig. 4e) point to a higher level of organization following
the theory developed by Ulanowicz [36,37].The action of chytrids
allowed a higher fraction of the total system throughput to pass
along specialized pathways as revealed by the Ascendency values.
However, to conclude on the effect of chytrids on the degree of
specialization, the AMI value provided better information about
the flow specialization. Indeed, this index was higher when
considering the presence of chytrids in the spring food web model.
This means that inclusion of parasites leads to a higher
specialization corresponding to a more direct link (i.e. zoospor-
es.microzooplankton) compared to the classical microbial chain
(i.e. DOC.bacteria.HFN.microzooplankton). In a food web
simulation including chytrids [32], an increase in relative
ascendency was related to an observed increase in trophic
efficiency. Relative to the classical microbial chain, the flows
estimated showed a higher transfer of primary produced organic
matter via parasitism and zoospores grazing. Major ascendency
could be the consequence from this more direct link between
producers and consumers. As the degree of organization and
robustness of the interactions among species into a food web
impacts the degree of stability [19], the presence of chytrids could
be considered as a factor enhancing stability. Robustness
corresponds to a measure of the quantity of perturbation that an
ecosystem can support before changing to another state [66]. The
higher the robustness, the more stable the food web is. Niquil et al.
[32] suggested after simulating the probable impact of chytrids in
Lake Biwa, that high relative ascendency calculated for the low
trophic levels associated with lower specialisation at higher levels
(i.e. structural asymmetry reported by Rooney et al. [42]) should
confer stability to the food web. In this study, higher ascendency
was apparent for the lower trophic levels; and if the compartments
were based on the level of species, incorporating the specificity of
chytrids should enhance the ascendency even more than what we
have observed in this study.
The inclusion of chytrids enhances the overheads of the
ecosystem under study, especially the internal redundancy. The
difference between 1 and the relative Ascendency estimates the
overhead of the system. Overheads represent all those disorga-
nized, inefficient and incoherent aspects of an ecosystem’s activity
[41]. In fact, they correspond to inputs, outputs, dissipation
(respiration) and functional redundancy [67]. The functional
redundancy can be estimated by the difference between Internal
Ascendency and internal capacity of development. A higher
functional redundancy in the presence of chytrids would enhance
the stability. Indeed, as proposed by Ulanowicz [68], organized
(Ascendency) and non-organized (redundancy) parts of ecosystem
should be in equilibrium. This configuration of ecosystem leads to
a better resistance and survival to perturbations. In the case of
perturbations, an ecosystem with a high Ascendency would be less
vulnerable and the consequences of perturbations would be small.
The coupling with a high redundancy enhances such flexibility,
and the dissipation of the effects of flow fluctuation as well [69].
The FCI index was lower in the model with chytrids. FCI is a
measure of the quantity of recycling in the ecosystem and its low
level confirms the tendency of parasites to favour the more direct
links. In terrestrial environments, a theory elaborated for
macroparasites [70] stated that parasites lead to complex long-
loops interactions between species. Neutel et al. [31] stated that the
addition of long loops of weak interactions could be the
Table 2. Indices derived from the Lindeman spine.
Model I -WithChytrid
Model II -WithoutChytrid
Trophic level (TL) efficiency (%)
1st TL 66.4 53.9
2nd TL 48.0 42.3
3rd TL 41.9 30.8
4th TL 30.5 22.9
Global trophic efficiency 44.9 35.6
Grazing chain efficiency (%)
1st TL 37.7 22.1
2nd TL 40.7 28.5
3rd TL 17.1 8.8
4th TL 5.2 2.0
Detritivory (%) 55.7 67.3
Herbivory (%) 44.3 32.7
doi:10.1371/journal.pone.0023273.t002
Effect of Parasitism on Pelagic Food Web
PLoS ONE | www.plosone.org 8 August 2011 | Volume 6 | Issue 8 | e23273
characteristic of parasites with complex life cycles. Here, the
parasites studied had no significant effects on the recycling,
because they only interacted with primary producers. One may
consider that adding the parasites of heterotrophs would have had
a different effect.
The calculated values of global trophic efficiency showed that
carbon is rather efficiently transferred within the MWC. Reasons
behind this high trophic efficiency are a better carbon transfer
efficiency coupled with a higher grazing efficiency at each trophic
level (Table 2). The MWC exhibited also a lower percentage of
detritivory compared to the MWOC (Table 2), stressing the fact
that in the MWC the food web is more efficient in direct use of the
primary production compared with the MWOC food web. This
conclusion is congruent with the conclusion made on the basis of
carbon flows analysis. Moreover, detritivory decrease when
parasites were involved could be related to the seasonal planktonic
successions. Spring period in temperate lakes is a typical
transitional system characterized by recovery of planktonic
populations. Primary production is high and, in general, the
community is dominated by r-strategist populations characterized
by rapid growth and an important role of detritus in nutrient
turnover [71]. This functional characteristic of an ecosystem is
typical of immature community, as described in a previous study
where during spring period detritivory value was high [72].
Including parasites was associated with a decrease in detritus
consumption, enhancing the detritivory and thereby the maturity
of the system. This fact related to low retention of the system (i.e.
low FCI) contradicts the Odum [72] theory which states that
efficient cycling of matter is a fundamental characteristic of a
mature system.
4. ConclusionsThis study is the first attempt to quantify the effective impact of
parasitic chytrids in a pelagic food web. The improved inverse
method coupled with Ecological Network Analysis allowed
estimation of undetermined flows, taking into account the
quantified processes from fungal infections and the emergent
properties of the ecosystem. Methodological improvements
allowed definition of the allowed range of values thus permitting
statistical tests.
The epidemic growth of chytrids reduced the flow of
sedimentation loss of large inedible algae and their contribution
to detritus pool, thus less carbon is lost from the pelagic zone.
Chytrid zoospores, via the Mycoloop pathway, channelled up to
20% of primary production to the higher trophic levels. The better
global trophic efficiency was highlighted by a higher global trophic
efficiency coupled to higher efficiency of carbon transfer through
each trophic level of the grazing chain. Chytrids constituted an
efficient and good quality trophic link and had important role in
the flow of energy for the seasonal development of planktonic
successions.
Parasitism affected also the structural and functional properties
of the ecosystem. It lead to an increase in the number of the
trophic links leading to longer path lengths, which in general are
considered as characteristics of stable ecosystems. The increase in
topological indices (i.e. A/DC, Ai/Dci and AMI) indeed indicated
that parasites contribute to better organization of the ecosystem
and more efficient specialization of pathways corresponding to
links that are more direct. Some structural properties (i.e. FCI,
detritivory) were indicative of a system based on rapid growth and
turnover, thus of planktonic successions not yet mature and typical
of spring period, and parasite seems to accentuate these
characteristics.
Materials and Methods
1. Study site and samplingLake Pavin is a crater freshwater lake situated in the Massif
Central of France (45u 299 410N, 02u 539 120E). It is an oligo-
mesotrophic deep volcanic mountain lake (Zmax = 92 m) with a
permanently anoxic monimolimnion from 60 m depth down-
wards. More details on the characteristics of the lake are available
in Amblard et al. [73]. The data used here correspond to the
recurrent spring bloom of diatom in Lake Pavin, a site that offers a
unique environment with low human influences and high annual
reproducibility of seasonal dynamics in the water column [5–6].
Samples were collected fortnightly in a central location of the lake
from March to June 2007 by simple capillarity as described by
Sime-Ngando and Hartmann [74]. This method allowed collect-
ing integrated samples (21 L) representative of the euphotic layer
(0–20 m). Samples were pre-filtered on 150 mm pore size nylon
filter (except for metazooplankton samples) for the elimination of
metazoan zooplankton and taken to the laboratory for immediate
analysis.
2. Abundance and biomass of planktonic organismsSub-samples were processed for identification and quantifica-
tion of picoplankton, heterotrophic nanoflagellates, phytoplank-
ton, zooplankton and the two life stages of microphytoplankton
fungal parasites (Chytridiales).
Bacteria. Sample aliquots were fixed with glutaraldehyde (1%
final concentration) before counting of heterotrophic and
autotrophic picoplankton by a flow cytometer (BD system)
equipped with a 15-mW, 488 nm, and air-cooled argon ion laser.
Environmental samples were diluted 10 times and simultaneous
measurements of size light scatter (relative size), 90 degree light
scatter, and SYBR green fluorescence emission (wave length
650 nm) were conducted to detect and enumerate heterotrophic
and autotrophic bacteria. Cell numbers were converted to carbon
biomass by adopting mean cell volume (mm3). Carbon conversion
factors of 0.35 pg C mm23 and 0.22 pg C mm23 were used for
conversion of biovolumes to carbon biomasses of heterotrophic
bacteria [75] and picophytoplankton (0.2–2 mm) [76,77],
respectively.
Heterotrophic nanoflagellates (2–20 mm). Sub-samples
(15 ml) were fixed and handled according to Caron [78] for
quantification of heterotrophic nanoflagellates. Counts were
performed using an inverted epifluorescent microscope (Leica
DMIRB) equipped with a 1006 objective lens, a HBO-100 W
mercury lamp, and a set of different optic filters, including filters
(340 to 380 nm) for UV light excitation. Mean cell biovolumes
were estimated for each sample by measuring the linear dimension
of at least 50 cells and equating shapes to standard geometric
forms. Carbon biomass was calculated using a conversion factor of
0.22 pg C mm23 [79].
Nano- and microphytoplankton (2–20 mm and 20–150 mm,
respectively). Sub-samples (200 ml) were fixed with alkaline
Lugol solution (1% v/v) and nano- and microphytoplankton cells
counted and identified using the Utermohl method [80] under an
inverted microscope (WILD - M40). Cell biovolumes were
estimated by measuring the linear dimension of at least 100 cells
and equating shapes to standard geometric forms. The resulting
volumes were transformed into organic carbon values by using the
conversion equation of Menden-Deuer and Lessard [81] (pgC
cell21 = 0.2886Vol(0,811) for diatoms and pgC cell21 = 0.216
6Vol(0,939) for the other autotrophic genera).
Ciliates (20–150 mm). Sub-samples (200 ml) were fixed with
alkaline Lugol solution (5% v/V) and ciliates were counted and
Effect of Parasitism on Pelagic Food Web
PLoS ONE | www.plosone.org 9 August 2011 | Volume 6 | Issue 8 | e23273

identified using the same method as for microphytoplankton. For
carbon biomasses of ciliates, biovolumes were converted into
organic carbon using conversion factors of 0.19 pg C mm23 [82].
Metazooplankton. The metazooplankton was collected by
filtering raw samples from the euphotic layer (0–20 m) through a
50 mm pore-size mesh. Retained animals were preserved in 4%
formalin-sucrose to prevent any release of eggs or physical
deformation [83]. Identification and counting, after addition of
few drops of rose Bengal to improve detection, were conducted
under a binocular microscope (Wild M3Z) using Dolfuss chambers
[84]. The carbon biomass of each metazoan group was estimated
by multiplying the individual carbon contents by the
corresponding abundances. For Copepods the dry weight (DW,
mg) was calculated as 22.5% of wet weight [85,86] and C content
(mg) was estimated as 40% of DW [87]. For Cladocera the length
(L, mm) of each organism was used to determine its carbon
content (Cclad) as: mg C ind21 = 5.246L21.08 [88]. For rotifers,
wet weights were converted to dry weight according to Pace and
Orcutt [89] and McCauley [90]. Dry weights were converted to
carbon biomass using carbon: DW ratio of 0.48 [91].
Chytrid parasites. Sub-samples were handled for chytrid
parasites counting based on a size fraction approach and the use of
the fluorochrome calcofluor white (CFW) for diagnosing, staining
and counting chitinaceous fungal parasites (i.e. sporangia of
chytrids) of microphytoplankton. 20 L of the integrated samples
were passed through a 25 mm pore size nylon filter. Large
phytoplankton cells in the .25 mm size fraction were collected
and fixed with formaldehyde (2% final conc.), before staining and
analysis. Nanoplanktonic cells in the ,25 mm size-fraction were
concentrated by ultrafiltration and 180 ml of the ultrafiltrate
retentate was fixed with formaldehyde (2% final conc.), before
staining and analysis. Aliquots (150 ml) of each fraction were stained
by CFW (1% v/v) and drops (10 ml) of stained samples were
mounted between glass slides and cover slips for observation and
counting under an inverted epifluorescent microscope (more details
are available in [8]). For each sample, microphytoplanktonic cells
were inspected for fungal infection (i.e. the presence of fixed
sporangia). Identification of chytrids was based on phenotypic keys
known from classical manuals, primarily those in Sparrow [9],
Canter [92], and Canter and Lund [93]. The prevalence of
infection was estimated as the percentage of infection in the host
population according to Bush et al. [94], i.e. Pr (%) = [(Ni/N)6100],
where Ni is the number of infected host cells, and N is the total
number of host cells. Carbon biomass of infectious sporangia was
estimated using a conversion factor of 10.7 pg C cell21 [13].
For zoospore counting, sub-samples were processed using the
CARD-FISH method of Not et al. [95], recently modified by
Jobard et al. [10]. Carbon biomass of zoospores was estimated
using a conversion factor of 10.7 pg C cell21 [13].
3. Model constructionData from the field study were used to construct the pelagic food
web model that quantitatively illustrates carbon pathways in Lake
Pavin during spring in the presence of chytrids (sporangia and
zoospore life stages). To estimate the unknown flows, we adopted
the method LIM-MCMC, derived from the LIM of Vezina and
Platt [34] to reconstruct trophic flows through the pelagic food
web. The approach is based on four steps.
Compartments and a priori model. The first step consists
in constructing a conceptual model including all possible flows
between compartments and the outside. Living compartments
included three phytoplankton compartments, three grazer
compartments, one compartment for heterotrophic bacteria and
two compartments for fungal parasites of microphytoplankton,
while non-living compartments included dissolved organic carbon
(doc) and detritus (det). We divided the phytoplankton into
picophytoplankton (ph1: 0.2–2 mm); nanophytoplankton (ph2: 2–
20 mm; principally Cryptophyta as Rhodomonas sp. and Chlorophyta
as Ankistrodesmus sp. and Ankyra sp.) and microphytoplankton (ph3:
20–150 mm; essentially large and filamentous Bacillariophyceae, as
Asterionella sp., Synedra sp. and Melosira sp.). Grazer compartments
included the heterotrophic nanoflagellates (hnf: 2–20 mm),
microzooplankton (mic: 20–150 mm: Ciliates and some Rotifera:
Ascomorpha sp., Keratella quadrata, Polyarthra platyptera and Conochilus
unicornis) and mesozooplankton (mes; .150 mm; Cladocera: Bosmina
coregoni, Daphnia longispina; Copepoda: Acanthodiaptomus denticornis,
Cyclops abyssorum prealpinus and some large Rotifera: Brachionus sp.,
Fillinia terminalis, Kellicottia longispina). Fungal parasites of
microphytoplankton compartments included infectious sporangia
(spg) and free zoospores (zsp).
The food-web model contains 53 carbon flows, which
correspond to the model with Chytrids (MWC). Since our aim
was to highlight the role of chytrids in the pelagic food web and
their impact on ecosystem properties, a second model was built
with the same consideration and data set of the MWC but without
incorporating the chytrids compartments and the involved flows.
The second model had 44 carbon flows and was named model
without chytrids (MWOC). The sole carbon inputs were gross
primary productions by each phytoplankton size fraction. Carbon
output from the network was driven by respiration of all living
compartment and carbon loss by sinking from ph2, ph3, spg, mic,
mes and det compartments. Mesozooplankton contribution to the
carbon output flow considers not only their production of sinking
fecal pellets but also their consumption by a higher trophic level.
All living compartments, except fungal parasites, contribute to
DOC production that was taken up by bacteria. In addition to
ph2, ph3, mic and mes contributions to detritus production, we
considered the existence of a carbon flow from bacteria and
heterotrophic nanoflagellates to detritus. Attached bacteria were
identified on TEP in Lake Pavin during spring [96] which
sediment and create a flow from bacteria to detritus. Attached
bacteria are also known to constitute preferential prey for
heterotrophic nanoflagellates [97]. Detritus production by spo-
rangia was due to chitinaeous wall dissolution or break-up during
zoospore discharge [9]. Moreover, zoospores were considered as
contributing to detritus production by the loss of their flagellum
when they found a host to fix on. The carbon flow from
microphytoplankton to sporangia represented carbon from diatom
cells to infectious sporangia and the carbon flow from sporangia to
zoospores was considered as the production of zoospores by
sporangia. Grazing relationships were defined considering size and
preferential ingestion of each identified grazer. Heterotrophic
flagellates grazed on compartments of bac and ph1, microzoo-
plankton grazed on bac, ph1, ph2, ph3, hnf and zsp, while
mesozooplankton grazed on bac, ph2, ph3, hnf, mic, zsp and det.
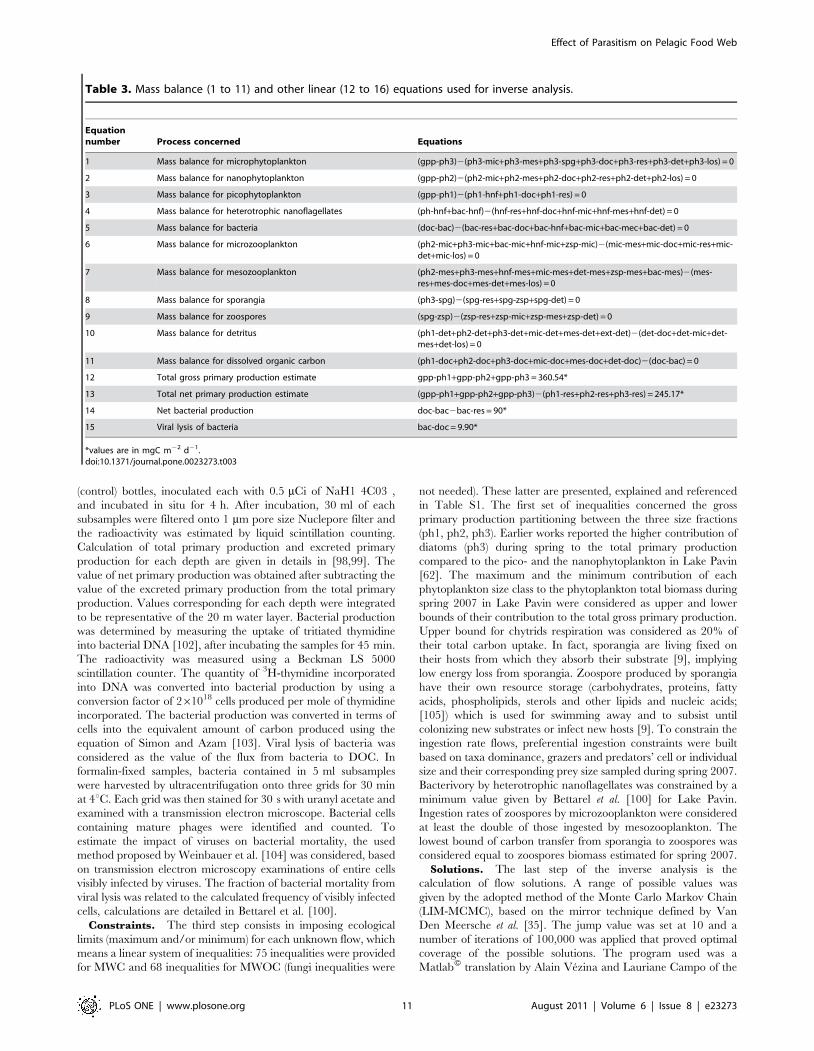
Equalities. The second step is setting equations (equalities) to
constrain the mass balance of the system and to impose measured
flows. The mass balance equations for all compartments are given
in the first 11 lines of Table 3. Some of the estimated flows were
measured during previous studies focused on spring blooms in
Lake Pavin and are introduced as additional equations; these
include values for total gross and net primary production [98,99],
bacterial production [99] and viral lysis of bacteria [100]
considered as the value of the flux from bacteria to DOC (last 4
lines of Table 3).
Primary production was measured from 14C uptake according
to Steemann-Nielsen [101]. Subsamples (100 ml) from each
sampling depth were drawn into two transparent and one dark
Effect of Parasitism on Pelagic Food Web
PLoS ONE | www.plosone.org 10 August 2011 | Volume 6 | Issue 8 | e23273
(control) bottles, inoculated each with 0.5 mCi of NaH1 4C03 ,
and incubated in situ for 4 h. After incubation, 30 ml of each
subsamples were filtered onto 1 mm pore size Nuclepore filter and
the radioactivity was estimated by liquid scintillation counting.
Calculation of total primary production and excreted primary
production for each depth are given in details in [98,99]. The
value of net primary production was obtained after subtracting the
value of the excreted primary production from the total primary
production. Values corresponding for each depth were integrated
to be representative of the 20 m water layer. Bacterial production
was determined by measuring the uptake of tritiated thymidine
into bacterial DNA [102], after incubating the samples for 45 min.
The radioactivity was measured using a Beckman LS 5000
scintillation counter. The quantity of 3H-thymidine incorporated
into DNA was converted into bacterial production by using a
conversion factor of 261018 cells produced per mole of thymidine
incorporated. The bacterial production was converted in terms of
cells into the equivalent amount of carbon produced using the
equation of Simon and Azam [103]. Viral lysis of bacteria was
considered as the value of the flux from bacteria to DOC. In
formalin-fixed samples, bacteria contained in 5 ml subsamples
were harvested by ultracentrifugation onto three grids for 30 min
at 4uC. Each grid was then stained for 30 s with uranyl acetate and
examined with a transmission electron microscope. Bacterial cells
containing mature phages were identified and counted. To
estimate the impact of viruses on bacterial mortality, the used
method proposed by Weinbauer et al. [104] was considered, based
on transmission electron microscopy examinations of entire cells
visibly infected by viruses. The fraction of bacterial mortality from
viral lysis was related to the calculated frequency of visibly infected
cells, calculations are detailed in Bettarel et al. [100].
Constraints. The third step consists in imposing ecological
limits (maximum and/or minimum) for each unknown flow, which
means a linear system of inequalities: 75 inequalities were provided
for MWC and 68 inequalities for MWOC (fungi inequalities were
not needed). These latter are presented, explained and referenced
in Table S1. The first set of inequalities concerned the gross
primary production partitioning between the three size fractions
(ph1, ph2, ph3). Earlier works reported the higher contribution of
diatoms (ph3) during spring to the total primary production
compared to the pico- and the nanophytoplankton in Lake Pavin
[62]. The maximum and the minimum contribution of each
phytoplankton size class to the phytoplankton total biomass during
spring 2007 in Lake Pavin were considered as upper and lower
bounds of their contribution to the total gross primary production.
Upper bound for chytrids respiration was considered as 20% of
their total carbon uptake. In fact, sporangia are living fixed on
their hosts from which they absorb their substrate [9], implying
low energy loss from sporangia. Zoospore produced by sporangia
have their own resource storage (carbohydrates, proteins, fatty
acids, phospholipids, sterols and other lipids and nucleic acids;
[105]) which is used for swimming away and to subsist until
colonizing new substrates or infect new hosts [9]. To constrain the
ingestion rate flows, preferential ingestion constraints were built
based on taxa dominance, grazers and predators’ cell or individual
size and their corresponding prey size sampled during spring 2007.
Bacterivory by heterotrophic nanoflagellates was constrained by a
minimum value given by Bettarel et al. [100] for Lake Pavin.
Ingestion rates of zoospores by microzooplankton were considered
at least the double of those ingested by mesozooplankton. The
lowest bound of carbon transfer from sporangia to zoospores was
considered equal to zoospores biomass estimated for spring 2007.
Solutions. The last step of the inverse analysis is the
calculation of flow solutions. A range of possible values was
given by the adopted method of the Monte Carlo Markov Chain
(LIM-MCMC), based on the mirror technique defined by Van
Den Meersche et al. [35]. The jump value was set at 10 and a
number of iterations of 100,000 was applied that proved optimal
coverage of the possible solutions. The program used was a
Matlab� translation by Alain Vezina and Lauriane Campo of the
Table 3. Mass balance (1 to 11) and other linear (12 to 16) equations used for inverse analysis.
Equationnumber Process concerned Equations
1 Mass balance for microphytoplankton (gpp-ph3)2(ph3-mic+ph3-mes+ph3-spg+ph3-doc+ph3-res+ph3-det+ph3-los) = 0
2 Mass balance for nanophytoplankton (gpp-ph2)2(ph2-mic+ph2-mes+ph2-doc+ph2-res+ph2-det+ph2-los) = 0
3 Mass balance for picophytoplankton (gpp-ph1)2(ph1-hnf+ph1-doc+ph1-res) = 0
4 Mass balance for heterotrophic nanoflagellates (ph-hnf+bac-hnf)2(hnf-res+hnf-doc+hnf-mic+hnf-mes+hnf-det) = 0
5 Mass balance for bacteria (doc-bac)2(bac-res+bac-doc+bac-hnf+bac-mic+bac-mec+bac-det) = 0
6 Mass balance for microzooplankton (ph2-mic+ph3-mic+bac-mic+hnf-mic+zsp-mic)2(mic-mes+mic-doc+mic-res+mic-det+mic-los) = 0
7 Mass balance for mesozooplankton (ph2-mes+ph3-mes+hnf-mes+mic-mes+det-mes+zsp-mes+bac-mes)2(mes-res+mes-doc+mes-det+mes-los) = 0
8 Mass balance for sporangia (ph3-spg)2(spg-res+spg-zsp+spg-det) = 0
9 Mass balance for zoospores (spg-zsp)2(zsp-res+zsp-mic+zsp-mes+zsp-det) = 0
10 Mass balance for detritus (ph1-det+ph2-det+ph3-det+mic-det+mes-det+ext-det)2(det-doc+det-mic+det-mes+det-los) = 0
11 Mass balance for dissolved organic carbon (ph1-doc+ph2-doc+ph3-doc+mic-doc+mes-doc+det-doc)2(doc-bac) = 0
12 Total gross primary production estimate gpp-ph1+gpp-ph2+gpp-ph3 = 360.54*
13 Total net primary production estimate (gpp-ph1+gpp-ph2+gpp-ph3)2(ph1-res+ph2-res+ph3-res) = 245.17*
14 Net bacterial production doc-bac2bac-res = 90*
15 Viral lysis of bacteria bac-doc = 9.90*
*values are in mgC m22 d21.doi:10.1371/journal.pone.0023273.t003
Effect of Parasitism on Pelagic Food Web
PLoS ONE | www.plosone.org 11 August 2011 | Volume 6 | Issue 8 | e23273
R-CRAN project package LIM-Solve [35,104]. More details on
the method are available in Van Den Meersche et al. [35] and
Niquil et al. [45].
4. Ecological Network AnalysisThe resulting flows from inverse analysis were used for
calculating indices from Ecological Network Analysis. We used
an algorithm written for Matlab� by Carole Lebreton and
Markus Schartau to calculate a set of indices that are used for
describing the emergent properties of the ecosystem [36].Total system throughput (TST). TST is a measure of the
total system activity and is the sum of all the flows through all
compartments [97].Average path length (APL). APL is the average number of
compartments crossed by a unit of carbon from its entry to the
system to its living. It represents a measure of the system retention
capacity [106].System Ascendency (A). System Ascendency (A) merges the
quantification of the activity and the degree of specialization
involved into processes [107]. It is the product of the TST and the
average mutual information (AMI: degree of specialization of flows
in the network) [36]. This value is a more informative metric
describing the organization of the system when it is expressed in
relation to development capacity that as its maximum value (A/
DC). High A/DC ratios are in fact, thought to reflect high degrees
of organization [43,108]. The difference between A and its upper
bound (DC) represents the overhead [109], which reflects the
multiplicity of pathways in the network that happen for any of four
reasons: uncertainty on imports (Oi), exports (Oe), dissipations
(Do) and redundancy (R) [41]. The relative redundancy (R/DC,
%) is a measure of the ecosystem degree of information loss due to
parallel pathways.Development capacity (DC). Development capacity (DC) is
calculated as the product of TST and the upper limit of AMI,
corresponding to the maximum potential ascendancy and to a
food web with maximum specialization. The development
capacity is the sum of ascendency, redundancy and information
loss related to external exchanges.
As suggested by Ulanowicz [36], growth and development were
characterized by indices calculated over only internal exchanges.
The internal capacity of ecosystems development (DCi) was
calculated as the sum of internal ascendency (Ai) and internal
redundancy (Ri). Any decrease of Ai/DCi ratio in relation to the
A/DC ratio could point to a strong dependency of an ecosystem
on external inputs [110]. Ai/DCi ratio could also be another
aspect of a highly organized ecosystem with its tendency to
internalize most of its activity [43]. However, Rutledge et al. [111]
and others [108,112] considered the internal redundancy (Ri/
DCi) as a measure of ecosystem stability. Indeed, broken pathways
are more easily re-established when the ecosystem exhibit higher
internal stability or resilience to perturbation [43]. Resilience is the
speed with which a system returns to equilibrium state after a
perturbation [113,114].
Finn Cycling Index (FCI). FCI is the ratio of carbon flowing
in loops to the sum of all carbon flows. It quantifies the fraction of
all flows involved in recycling [115] and can be considered as a
measure of the retentiveness of the system.
Trophic analysis: based on the trophic concept of Lindeman
[116], maps the complex network of trophic transfers as a linear
food chain (called Lindeman spine, [117]). The Lindeman spine
allows calculation of the trophic efficiency for each level, i.e. the
efficiency of transfer from one level to the next [107]. The global
trophic efficiency is computed as the logarithmic mean of all the
trophic level efficiencies. Two others indices were derived from the
Lindeman spine the grazing chain efficiency and the percentage of
detritivory. The mean values of the 100.000 set of flows resulting
from the LIM-MCMC analysis were analyzed using the ecological
network analysis package of Ulanowicz and Kay [118] to build the
Lindeman spine. The program used for these analyses is available
at www.glerl.noaa.gov/EcoNetwrk/.
5. Data analysisBox plots, a widely used graphical tool introduced by Tukey
[119], illustrate the location of the median and associated
dispersion of the data. Box plots of all solutions per index for
the model with chytrids were plotted with the model without
chytrids. This method is useful as it provides visual information
showing the differences in network properties of the two food-web
models. The statistical comparison between the two constructed
models was tested with two-tailed Student (t) tests on the sets of
calculated ecological network indices.
Supporting Information
Table S1 Constraints used on different planktonic food web
processes.
(DOC)
Acknowledgments
Thanks are due to Alain Vezina and Lauriane Campo for making available
their LIM solve translation in Matlab package. We are grateful to Carole
Lebreton and Markus Schartau for making available the ENA translation
in Matlab package. We thank John Dolan for helpful comments and
editing and the two anonymous reviewers for their suggestions.
Author Contributions
Conceived and designed the experiments: BG SR NN MJ TS-N.
Performed the experiments: BG SR NN MJ TS-N. Analyzed the data:
BG SR NN MJ BS-B TS-N. Contributed reagents/materials/analysis
tools: BG SR NN BS-B TS-N. Wrote the paper: BG SR NN BS-B TS-N.
Designed the software used in analysis: BS-B NN.
References
1. Huber-Pestalozzi G (1946) Der Walensee und sein Plankton. In Canter, H. M.
and Lund, J. W., 1948. Studies on plankton parasites. I. Fluctuations in thenumbers of Asterionella Formosa Hass. In relation to fungal epidemics. New
phytol 47: 238–261.
2. Canter HM, Lund JWG (1969) The parasitism of planktonic desmids by Fungi.
Osterr Botan Zeitschrift 116: 351–377.
3. Sigee DC (2005) Freshwater microbiology. John Wiley & Sons LTD,
Chichester, England.
4. Tsui CKM, Hyde KD (2003) Freshwater mycology. Fungal diversity researchseries 10. Fungal diversity Press, The University of Hong Kong, Hong Kong.
5. Lefevre E, Bardot C, Noel C, Carrias J.-F, Viscogliosi E, et al. (2007) Unveilingfungal zooflagellates as members of freshwater picoeukaryotes: evidence from a
molecular diversity study in a deep meromictic lake. Environ Microbiol 9:
61–71.
6. Lefevre E, Roussel B, Amblard C, Sime-Ngando T (2008) The molecular
diversity of freshwater picoeukaryotes reveals high occurrence of putativeparasitoids in the plankton. PloS One 3(6): 2324.
7. Lepere C, Masquelier S, Mangot JF, Debroas D, Domaizon I (2010) Vertical
structure of small eukaryotes in three lakes that differ by their trophic status: a
quantitative approach. ISME 4: 1509–1519.
8. Rasconi S, Jobard M, Jouve L, Sime-Ngando T (2009) Use of Calcofluor White
for Detection, Identification, and Quantification of Phytoplanktonic FungalParasites. Appl Environ Microbiol 75: 2545–2553.
9. Sparrow FK (1960) Aquatic Phycomycetes. University of Michigan Press, Ann
Arbor.
10. Jobard M, Rasconi S, Sime-Ngando T (2010) Fluorescence in situ hybridization of
zoosporic fungi (chytrids) in aquatic environments: testing with clone-FISH and
application to natural samples using CARD-FISH. J Microbiol Meth 83: 236–43.
Effect of Parasitism on Pelagic Food Web
PLoS ONE | www.plosone.org 12 August 2011 | Volume 6 | Issue 8 | e23273

11. Van Donk E (1989) The role of fungal parasites in phytoplankton succession,171–194. In Sommer U, ed. Plankton Ecology: Succession in Plankton
Communities, Springer-Verlag: Berlin.
12. Ibelings BW, de Bruin A, Kagami M, Rijkeboer M, Brehm M, et al. (2004)
Host parasite interactions between freshwater phytoplankton and chytrid fungi(Chytridiomycota). J Phycol 40: 437–453.
13. Kagami M, de Bruin A, Ibelings BW, van Donk E (2007) Parasitic chytrids:their effects on phytoplankton communities and food-web dynamics. Hydro-
biologia 578: 113–129.
14. De Bruin A, Ibelings BW, Kagami M, Mooij WM, van Donk E (2008)
Adaptation of the fungal parasite Zygorhizidium planktonicum during 200
generations of growth on homogeneous and heterogeneous populations of itshost, the diatom Asterionella formosa. J Euk Microb 55: 69–74.
15. Legendre L, Le Fevre J (1991) From individual plankton cells to pelagic marine
ecosystems and to global biogeochemical cycles. In: Demers S, ed. Particle
analysis in Oceanography, Springer, Berlin. pp 261–300.
16. Kagami M, von Elert E, Ibelings BW, de Bruin A, Van Donk E (2007) The
parasitic chytrid, Zygorhizidium facilitates the growth of the cladoceranzooplankter, Daphnia in cultures of the inedible algae Asterionella. Proceed
Royal Soc Biol Sci 274: 1561–1566.
17. Pascual M, Dunne J (2006) Ecological Networks: Linking structure to dynamics
in Food webs. Oxford University Press, USA.
18. Lafferty KD, Hechinger RF, Shaw JC, Whitney K, Kuris AM (2006) Food
webs and parasites in salt marsh ecosystem. Chap. 9, In:, , Collinge S, Ray C(2006) Disease ecology: community structure and pathogen dynamics, Oxford
University Press, Oxford. pp 119–134.
19. Lafferty KD, Allesina S, Arim M, Briggs CJ, Leo G, et al. (2008) Parasites in
food webs: the ultimate missing links. Ecol Lett 11: 533–546.
20. Huxham M, Raffaelli D, Pike A (1995) Parasites and Food Web Patterns.
J Anim Ecol 64: 168–176.
21. Thompson RM, Mouritsen KN, Poulin R (2005) Importance of parasites and
their life cycle characteristics in determining the structure of a large marinefood web. J Anim Ecol 74: 77–85.
22. Hudson PJ, Dobson AP, Lafferty KD (2006) Is a healthy ecosystem one that isrich in parasites? Trends Ecol Evol 21: 381–385.
23. Elton CS (1958) The Ecology of Invasions by Animals and Plants. Methuen,London. Reprinted 2000 by The University of Chicago Press, (Chapman &
Hall, London).
24. May RM (1972) Will a large complex system be stable? Nature 238: 413–414.
25. Pimm SL (1984) The complexity and stability of ecosystems. Nature 307:321–326.
26. McCann KS (2000) The diversity-stability debate. Nature 405: 228–233.
27. O’Gorman EJ, Emmerson MC (2009) Perturbations to trophic interactions and
the stability of complex food webs. Proceed Nat Acad Sci USA 106(32): 13397.
28. Hosack GR, Li HW, Rossignol PA (2009) Sensitivity of system stability to
model structure. Ecol Model 220(8): 1054–1062.
29. May RM (1973) Stability and complexity in model ecosystems Princeton U.P,
Princeton. 265 p.
30. Williams R, Martinez ND (2004) Simple rules yield complex food webs. Nature
404: 180–183.
31. Neutel AM, Heesterbeek JAP, de Ruiter P (2002) Stability in real food webs:
weak links in long loops. Science 296: 1120–1123.
32. Niquil N, Kagami M, Urabe J, Christaki U, Viscogliosi E, et al. (2011) Potential
role of fungi in plankton food web functioning and stability: a simulationanalysis based on Lake Biwa inverse model. Hydrobiologia 659: 65–79.
33. Niquil N, Bartoli G, Urabe J, Jackson GA, Legendre L, et al. (2006) Carbonsteady state model of the planktonic food web of Lake Biwa, Japan. Freshwater
Biol 8: 1570–1585.
34. Vezina AF, Platt T (1988) Food web dynamics in the ocean. I. Best-estimates of
flow networks using inverse methods. Mar Ecol Prog Ser 42: 269–287.
35. Van den Meersche K, Soetaert K, Van Oevelen D (2009) xsample(): An R
Function for Sampling Linear Inverse Problems. J Stat Soft 30: 1–15.
36. Ulanowicz RE (1986) Growth and Development: Ecosystems Phenomenology.
Springer-Verlag, New York. 203 p.
37. Ulanowicz RE (1997) Ecology, the Ascendent Perspective. Columbia
University Press, New York. 201 p.
38. Ulanowicz RE, Goerner SJ, Lietaer B, Gomez R (2009) Quantifying
sustainability: resilience, efficiency and the return to of information theory.Ecol complex 6: 27–36.
39. Ulanowicz RE (2003) Some steps toward a central theory of ecosystemdynamics. Comput Biol Chem 27: 523–530.
40. Ulanowicz RE (1980) An hypothesis on the development of naturalcommunities. J Theor Biol 85: 223–245.
41. Ulanowicz RE (1988) On the importance of higher-level models in ecology.Ecol Model 43: 45–56.
42. Rooney N, McCann K, Gellner G, Moore JC (2006) Structural asymmetry andthe stability of diverse food webs. Nature 442: 265–269.
43. Baird D, Mc Glade JM, Ulanowicz RE (1991) The comparative ecology f sixmarine ecosytems. Phill Tran Roy Soc London Ser B 333: 15–29.
44. Grami B, Niquil N, Sakka Hlaili A, Gosselin M, Hamel D, et al. (2008) Theplankton food web of the Bizerte Lagoon (South-Western Mediterranean): II.
Carbon steady state modeling using inverse analysis. Estuar Coast Shelf S 79:101–113.
45. Niquil N, Soetaert K, Johnson GA, van Oevelen D, Bacher C, et al. (2012)Inverse modelling in modern ecology and application to coastal ecosystem.
Chap. 9 in Vol. 9 Estuarine and coastal ecosystem modelling (D. Baird & A.
Mehta Editors) In: Treatise on coastal and estuarine Science E. Wolanski, DS.Mc LuskyChief, eds. Elsevier, In press.
46. Kones JK, Soetaert K, van Oevelen D, Owino JO, Mavuti K (2006) Gaininginsight into food webs reconstructed by the inverse method. J Marine Syst 60:
153–166.
47. Niquil N, Jackson GA, Legendre L, Delesalle B (1998) Inverse model analysis ofthe planktonic food web of Takapoto Atoll (French Polynesia). Mar Ecol Prog
Ser 165: 17–29.
48. Johnson GA, Niquil N, Asmus H, Bacher C, Asmus R, et al. (2009) The effects
of aggregation on the performance of the inverse method and indicators of
network analysis. Ecol Model 220: 3448–3464.
49. Kones JK, Soetaert K, Van Oevelen D, Owino JO (2009) Are network indices
robust indicators of food web functioning? A Monte Carlo Approach. Ecolmodel 220: 370–382.
50. Rasconi S (2010) Etude des chytrides parasites du phytoplancton dans les
ecosystemes aquatiques. PhD thesis, Blaise Pascal University, Clermont Fd,France.
51. Azam F, Fenchel T, Field JG, Gray JS, Meyer-Reil LA, et al. (1983) TheEcological Role of Water-Column Microbes in the sea. Mar Ecol Prog Ser 10:
257–263.
52. Yoshimizu C, Yoshida T, Nakanishi M, Urabe J (2001) Effects of zooplanktonon the sinking flux of organic carbon in Lake Biwa. Limnology 2: 37–43.
53. Kagami M, Gurung TB, Yoshida T, Urabe J (2006) To sink or to be lysed?
Contrasting fate of two large phytoplankton species in Lake Biwa. LimnolOceanogr 51(6): 2775–2786.
54. Van Donk E, Ringelberg J (1983) The effect of fungal parasitism on thesuccession of diatoms in Lake Maarsseveen-I (The Netherlands). Freshwater
Biol 13: 241–251.
55. Kudoh S, Takahashi M (1990) Fundal control of population changes ofplanktonic diatom Asterionella Formosa in shallow eutrophic lake. J Phycol 26:
239–244.
56. Sommer U, Gliwicz ZM, Lampert W, Duncan A (1986) PEG-model of
Seasonal Succession of Planktonic Events in Fresh Waters. Arch Hydrobiol
106(4): 433–471.
57. Kagami M, Helmsing NR, van Donk E (2010) Parasitic chytrids could promote
copepod survival by mediating material transfer from inedible diatoms.Hydrobiologia 659(1): 49–54.
58. Gleason FH, Kagami M, Marano AV, Sime-Ngando T (2009) Inoculum.
Newsletter Mycol Soc Amer 59: 1–3.
59. Canter HM, Jaworski GHM (1979) The Occurrence of a Hypersensitive
Reaction in the Planktonic Diatom Asterionella formosa Hassall Parasitized by
the Chytrid Rhizophydium planktonicum Canter Emend., in Culture. New Phytol82: 187–206.
60. Devaux J (1976) Dynamique des populations phytoplanctoniques dans deuxlacs du massif central francais. Ann Sta Biol Besse-en-Chandesse 10: 1–185.
61. Amblard C (1978) Application du dosage des adenosines 59-phosphate a l’etude
d’un phytoplancton lacustre (Lac Pavin). PhD thesis, Universite de ClermontFD, France.
62. Amblard C, Bourdier G (1990) The spring bloom of the diatom Melosira italica
subsp. subarctica in Lake Pavin: biochemical, energetic and metabolic aspects
during sedimentation. J Plank Res 12(3): 645–660.
63. Arias-Gonzalez JE, Morand S (2006) Trophic functioning with parasites: a newinsight for ecosystem analysis. Mar Ecol Prog Ser 320: 43–53.
64. Kuris AM, Hechinger RF, Shaw JC, Whitney KL, Aguirre-Macedo L, et al.(2008) Ecosystem energetic implications of parasite and free-living biomass in
three estuaries. Nature 24: 15–18.
65. Jordan F, Sheuring I, Molnar I (2003) Persistence and flow reliability in simplefood webs. Ecol Model 161: 117–124.
66. Loreau M, Downing A, Emmerson M, Gonzalez A, Hughes J, et al. (2002) A
new look at the relationship between diversity and stability., in: Loreau M,Naeem S, Inchausti P, eds. Biodiversity and ecosystem functionning Oxford
University press, Oxford. pp 77–91.
67. Baird D, Ulanowicz RE (1989) The Seasonal Dynamics of The Chesapeake
Bay Ecosystem. Ecol Monographs 59: 329–364.
68. Ulanowicz RE, Goerner SJ, Lietaer B, Gomez R (2009) Quantifyingsustainability: Resilience, efficiency and the return of information theory. Ecol
Complexity 6: 27–36.
69. MacArthur R (1955) Fluctuations of Animal Populations and a Measure of
Community Stability. Ecology 36: 533–536.
70. Dobson AP, Lafferty K, Kuris A (2005) Parasites and food webs. In EcologicalNetworks: Linking Structure to Dynamics in Food webs Dunne JA, Pascual M,
eds. 119–135, Oxford University Press.
71. Odum EP (1969) The strategy of ecosystem development. Science 164:
262–270.
72. Marquis E, Niquil N, Delmas D, Hartmann HJ, Bonnet D, et al. (2007) Inverseanalysis of the planktonic food web dynamics related to phytoplankton bloom
development on the continental shelf of the Bay of Biscay, French coast. EstuarCoast Shelf S 73: 223–235.
73. Amblard C, Rachiq S, Bourdier G (1992) Photolithotrophy, photoheterotrophy
and chemoheterotrophy during spring phytoplankton development (LakePavin). Microbial Ecol 24: 109–123.
Effect of Parasitism on Pelagic Food Web
PLoS ONE | www.plosone.org 13 August 2011 | Volume 6 | Issue 8 | e23273
74. Sime-Ngando T, Hartmann HJ (1991) Short-term variations of the abundance
and biomass of planktonic ciliates in a eutrophic lake. Eur J Protistol 27:249–263.
75. Bjørnsen PK (1986) Automatic determination of bacterioplankton biomass by
image analysis. Appl Environ Microb 51: 1199–1204.76. Søndergaard M, Jensen LM, Ertebrjerg G (1991) Picoalgae in Danish coastal
waters during summer stratification. Mar Ecol Prog Ser 79: 139–149.77. Mullin MM, Sloan PR, Eppley RW (1966) Relationship between carbon
content, cell volume and area in phytoplankton. Limnol Oceanogr 11:
307–311.78. Caron DA (1983) A technique for the enumeration of photosynthetic and
heterotrophic nanoplankton using epifluorescence microscopy, and a compar-ison with other procedures. Appl Environ Microb 46: 491–498.
79. Børsheim KY, Bratbak G (1987) Cell volume to cell carbon conversion factorsfor a bacterivorous Monas sp. enriched from seawater. Mar Ecol Prog Ser 36:
171–175.
80. Utermohl H (1931) Neue wege in der quantitativen erfassung des planktons(mit besonderer berucktingung des ultraplanktons). Verh Int Ver Theor Angew
Limnol 5: 567–596.81. Menden-Deuer S, Lessard EJ (2000) Carbon volume relationships for
dinoflagellates, diatoms and other protest plankton. Limnol Oceanogr 45:
569–579.82. Putt M, Stoecker DK (1989) An experimentally determined carbon: volume
ratio for marine oligotrichous ciliates from estuarine and coastal waters. LimnolOceanogr 34: 1097–1103.
83. Prepas E (1978) Sugar-frosted Daphnia: an improved fixation technique forCladocera. Limnol Oceanogr 23: 557–559.
84. Dussart B (1967) Les Copepodes des eaux continentales d’Europe occidentale.
In: Boubee N, Cie, eds. Calanoides et Harpactoides, Paris 1: 500.85. Riemann F, Ernst W, Ernst R (1990) Acetate uptake from ambient water by the
free-living marine nematode Adoncholaimus thalassophygas. Mar Biol 104:453–457.
86. Gradinger R, Friedrich C, Spindler M (1999) Abundance, Biomass and
composition of the sea ice biota of the Greenland Sea pack ice. Deep-Sea ResPT II 46: 1457–1472.
87. Feller RJ, Warwick RM (1988) Energetics. In: Higgings RP, Thiel H, eds.Introduction to the study of meiofauna, Smithsonian Institution Press,
Washington, DC. pp 181–196.88. Kankaala P, Johansson S (1986) The influence of individual variation on
length-biomass regressions in three crustacean zooplankton species. J Plank Res
8(6): 1027–1038.89. Pace ML, Orcutt D (1981) The relative importance of protozoans, rotifers, and
crustaceans in a freshwater zooplankton community. Limnol Oceanogr 26:822–830.
90. McCauley E (1984) The estimation of the abundance and biomass of
zooplankton in samples. In Downing JA, Rigler FH, eds. A Manual for theAssessment of Secondary Productivity in Fresh Waters, 2nd edn, Blackwell
Scientific Publications, Oxford. pp 228–265.91. Andersen T, Hessen DO (1991) Carbon, nitrogen, and phosphorus content of
freshwater zooplankton. Limnol Oceanogr 36: 807–814.92. Canter HM (1950) Fungal parasites of the phytoplankton .I. Studies on British
chytrids X. Ann Bot 14: 263–289.
93. Canter HM, Lund JWG (1951) Studies on plankton parasites. III. Examples ofthe 399 interaction between parasitism and other factors determining the
growth of diatoms. Ann Bot 15: 359–371.94. Bush AO, Lafferty KD, Lotz JM, Shostak AW (1997) Parasitology meets
ecology on its own terms: Margolis et al. revisited. J Parasit 83: 575–583.
95. Not F, Simon N, BIegala IC, Vaulot D (2002) Application of fluorescent in situhybridization coupled with tyramide signal amplification (FISH-TSA) to assess
eukaryotic picoplankton composition. Aquat Microb Ecol 28: 157–166.
96. Carrias JF, Amblard C, Quiblier-Lloberas C, Bourdier G (1998) Seasonal
dynamics of free and attached heterotrophic nanoflagellates in an oligomeso-trophic lake. Freshwater Biol 39: 91–101.
97. Arnous MB, Courcol N, Carrias JF (2010) The significance of transparent
exopolymeric particles in the vertical distribution of bacteria and heterotrophicnanoflagellates in Lake Pavin. Aquat Sci 72: 245–253.
98. Devaux J (1980) Contribution a l’etude limnologique du lac Pavin (France) I:facteurs abiotiques et phytoplancton. Hydrobiologia 62(2): 67–189.
99. Bettarel Y, Sime-Ngando T, Amblard C, Carrias JF, Sargos D, et al. (2002)
The functional importance of bacteriophages in the microbial loop of anoligomesotrophic lake over a diel cycle. Ann Limnol 38(4): 263–269.
100. Bettarel Y, Amblard C, Sime-Ngando T, Carrias JF, Sargos D, et al. (2003)Viral Lysis, Flagellate Grazing Potential, and Bacterial Production in Lake
Pavin. Microbial Ecol 45: 119–127.101. Steemann-Nielsen E (1952) The use of radio-active carbon (1 4C) for
measuring organic production in the sea. J Cons Explor Mer 18: 117–140.
102. Petit M, Servais P, Lavandier P (1999) Bacterial production measured byleucine and thymidine incorporation rates in French lakes. Freshwater Biol 42:
513–524.103. Simon M, Azam F (1989) Protein content and protein synthesis rates of
planktonic marine bacteria. Mar Ecol Prog Ser 52: 201–213.
104. Weinbauer MG, Winter C, Hofle MG (2002) Reconsidering transmissionelectron microscopy based estimates of viral infection of bacterioplankton using
conversion factors derived from natural communities. Aquat Microb Ecol 27:103–110.
105. Suberkropp KF, Cantino EC (1973) Utilization of endogenous reserves byswimming zoospores of Blastocladiella emersonii. Arch Microbiol 89: 205–221.
106. Kay JJ, Graham LA, Ulanowicz RE (1989) A detailed guide to network
analysis. In Wulff F, Field JG, Mann KH, eds. Network Analysis in MarineEcology: Methods and Applications, Springer-Verlag, Berlin. 284 p.
107. Ulanowicz RE, Wulff F (1991) Comparing ecosystem structures: theChesapeake Bay and the Baltic Sea. In: Cole J, Lovett G, Findlay S, eds.
Comparative analysis of ecosystems, pattern, mechanism, and theories,
Springer-Verlag, New York. pp 140–166.108. Baird D, Luczkovich J, Christian RR (1998) Assessment of spatial and temporal
variability in system attributes of the St. Marks National Wildlife Refuge,Apalachee Bay, Florida. Estuar Coast Shelf S 47: 329–34.
109. Ulanowicz RE, Norden JS (1990) Symmetrical overhead in flow networks.Int J Syst Sci 1: 429–437.
110. Baird D, Heymans JJ (1996) Assessment of ecosystem changes in response to
freshwater inflow of the Kromme River estuary, St. Francis Bay, South Africa:a network analysis approach. Water S A (Pretoria) 22: 307–318.
111. Rutledge RW, Bacore BL, Mulholland RJ (1976) Ecological stability: aninformation theory standpoint. J Theor Biol 57: 355–371.
112. Baird D, Asmus H, Asmus R (2004) Energy flow of a boreal intertidal
ecosystem, the Sylt-Rømø Bight. Mar Ecol Prog Ser 279: 45–61.113. De Angelis DL (1980) Energy Flow, Nutrient Cycling, and Ecosystem
Resilience. Ecology 61: 764–771.114. Pimm SL (1991) The Balance of Nature?: Ecological Issues in the Conservation
of Species and Communities. The University of Chicago Press, Chicago andLondon.
115. Finn JT (1976) Measures of ecosystem structure and function derived from
analysis of flows. J Theor Biol 56(2): 363–380.116. Lindeman RL (1942) The trophic dynamic aspect of ecology. Ecology 23:
399–418.117. Ulanowicz RE, Kemp WM (1979) Toward a canonical trophic aggregation.
Am Nat 114: 871–883.
118. Ulanowicz RE, Kay JJ (1991) A package for the analysis of ecosystem flownetworks. Env Software 6(3): 131–142.
119. Tukey JW (1977) Exploratory Data Analysis. Reading, MA: Addison Wesley.
Effect of Parasitism on Pelagic Food Web
PLoS ONE | www.plosone.org 14 August 2011 | Volume 6 | Issue 8 | e23273