
Function Point Training Booklet
149
-
Upload
independent -
Category
Documents
-
view
2 -
download
0
Transcript of Function Point Training Booklet

www.SoftwareMetrics.Com816-739-4058 tel. Or 816-228-8259 fax.
Page 2 – Revised August 2002

Table of ContentsIntroduction__________________________________________________________________________________8Objective of Section:_______________________________________________8Introduction:_______________________________________________________8Elementary Process:_________________________________________________9Definition:_________________________________________________________9Benefits and Uses:__________________________________________________9When Not to Use Function Points____________________________________10Types of Function Point Counts:____________________________________11What about Lines of Code (LOC)_____________________________________11Understanding Productivity:________________________________________12Understanding Different Costs:_____________________________________13Understanding Software Productivity:_______________________________14Questions:_________________________________________________________14
Function Point Counting Process_________________________________________________________16Objective of Section:______________________________________________16Introduction:______________________________________________________16Definition:________________________________________________________16Types of Function Point Counts:____________________________________17High Level Steps:__________________________________________________17Independence and Dependence:_______________________________________17FPA Steps for Files:_______________________________________________19Questions:_________________________________________________________19
Establishing the Boundary________________________________________________________________20Objective of Section:______________________________________________20Definition:________________________________________________________20Identify the Boundary:_____________________________________________20Standard Documentation:____________________________________________20Establishing the Boundary early in the Life cycle:_________________20

Technology Issues:_________________________________________________21Tabulating:________________________________________________________21Questions:_________________________________________________________21
Identifying RET’s, DET’s and FTR’s________________________________________________________22Objective of Section:______________________________________________22Definition:________________________________________________________22Rating:____________________________________________________________22Transaction DET’s:_________________________________________________23Record Element Types (RET’s):______________________________________23Tips to Identify RET’s and DET’s early in the life cycle:_________23DET’s for GUI______________________________________________________23DET’s For Real Time Systems________________________________________25Skill Builder:_____________________________________________________25
External Inputs_____________________________________________________________________________26Objective of Section:______________________________________________26Definition:________________________________________________________26Rating:____________________________________________________________26Counting Tips:_____________________________________________________27Examples:__________________________________________________________27Data Elements:_____________________________________________________27File Types Referenced (FTR’s):_____________________________________28Uniqueness:________________________________________________________28Understanding Enhancement Function Points:_________________________28Technology Issues:_________________________________________________28Standard Documentation:____________________________________________29Tips to Identify External Inputs early in the life cycle:_________29Typical Vocabulary:________________________________________________30Skill Builder:_____________________________________________________30
External Outputs___________________________________________________________________________32Objective of Section:______________________________________________32Definition:________________________________________________________32
Page 4 – Revised August 2002

Rating:____________________________________________________________32Counting Tips:_____________________________________________________33Terminology:_______________________________________________________33Examples:__________________________________________________________33Data Elements:_____________________________________________________33File Types Referenced (FTR):_______________________________________34Uniqueness:________________________________________________________34Understanding Enhancement Function Points:_________________________34Technology Issues:_________________________________________________35Standard Documentation:____________________________________________35Tips to Identify External Outputs early in the life cycle:________35Typical Vocabulary:________________________________________________35Special Issues and Concerns:_______________________________________36Skill Builder:_____________________________________________________37
External Inquiries__________________________________________________________________________42Objective of Section:______________________________________________42Definition:________________________________________________________42Rating:____________________________________________________________42Examples:__________________________________________________________43Terminology:_______________________________________________________43Data Elements:_____________________________________________________43File Type Referenced (FTR’s):______________________________________44Uniqueness:________________________________________________________44Understanding Enhancement Function Points:_________________________44Technology Issues:_________________________________________________44Standard Documentation:____________________________________________45Tips to Identify EQ’s early in the life cycle:_____________________45Typical Vocabulary:________________________________________________45Special Issues and Concerns:_______________________________________46Skill Builder:_____________________________________________________47
Copyright Longstreet Consulting Inc. Page 5
Transaction Review________________________________________________________________________50Objective of Section:______________________________________________50Multiple Languages_________________________________________________50Display of Graphical Images or Icons_______________________________51Messages___________________________________________________________52Complex Control Inputs_____________________________________________53Hyperlinks on WebPages_____________________________________________53
Internal Logical Files______________________________________________________________________55Objective of Section:______________________________________________55Definition:________________________________________________________55Rating:____________________________________________________________55Counting Tips:_____________________________________________________55Examples:__________________________________________________________56Record Element Types:______________________________________________56Data Element Types:________________________________________________57Technology Issues:_________________________________________________57Standard Documentation:____________________________________________57Tips to Identify ILF’s early in the life cycle:____________________57Understanding Enhancement Function Points:_________________________57Other comments:____________________________________________________58Skill Builder:_____________________________________________________58
External Interface Files___________________________________________________________________61Objective of Section:______________________________________________61Definition:________________________________________________________61Rating:____________________________________________________________61Counting Tips:_____________________________________________________61Examples:__________________________________________________________62Technology Issues:_________________________________________________62Standard Documentation:____________________________________________62Tips to Identify EIF’s early in the life cycle:____________________62Understanding Enhancement Function Points:_________________________63
Page 6 – Revised August 2002
General System Characteristics__________________________________________________________64Objective of Section:______________________________________________64Definition:________________________________________________________64Rating:____________________________________________________________64Standard Documentation:____________________________________________64Rating GSC’s early in the life cycle:______________________________65Tabulating:________________________________________________________66GSC’s at a Glance:_________________________________________________66Considerations for GUI Applications________________________________67Detail GSC’s:______________________________________________________68Skill Builder:_____________________________________________________79General System Characteristics – Notes Page________________________80
History and IFPUG_________________________________________________________________________81Objective of Section:______________________________________________81Brief History:_____________________________________________________81Growth and Acceptance of Function Point Analysis___________________81More Information about IFPUG:______________________________________81
Calculating Adjusted Function Point____________________________________________________83Objective of Section:______________________________________________83Definition:________________________________________________________83Unadjusted Function Point:_________________________________________83Understanding the Equations:_______________________________________83Development Project Function Point Calculation:____________________84Enhancement Project Function Point Calculation:____________________84Application After Enhancement Project:_____________________________85Application Function Point Count (Baseline):_______________________85Skill Builder:_____________________________________________________86
Case Studies________________________________________________________________________________87Objective of Section:______________________________________________87Collection Letter__________________________________________________89
Copyright Longstreet Consulting Inc. Page 7
Control Inputs_____________________________________________________90Graphical Information______________________________________________91Graphs Part II_____________________________________________________92The Weather Application____________________________________________93Adding A New Customer______________________________________________95Enhanced Weather Application_______________________________________98BikeWare___________________________________________________________99Pizza Screen Design_______________________________________________101www.PIZZACLUB.COM_________________________________________________103Control Information_______________________________________________105
Acronyms______________________________________________________109
Page 8 – Revised August 2002

The training booklet is provided complimentary to any company or individual interested in learning more about the function point method. Distribution of this training manual is not only allowedbut also encouraged.
Please respect the author, David Longstreet, and include either his name or his company name on all pages that are copied and distributed.
Longstreet Consulting Inc provides a full range of training including Function Point MultiMedia Training, Onsite Classroom Function Point Training, and Certification Preparation Training.
Longstreet Consulting provides consulting on the Function Point Metrics, Software Metrics and general Software Management.
For more information on training or consulting please contact David Longstreet at [email protected] or visit the website www.SoftwareMetrics.Com.
Copyright Longstreet Consulting Inc. Page 9

INTRODUCTION
Objective of Section:Introduce the basic concepts of Function Point Analysis and tointroduce and reinforce unit cost estimating. The exercises atthe end of the section helps the student demonstrate that theyhave gained the basic knowledge required.
Introduction:Systems continue to grow in size and complexity, becoming increasingly difficult to understand. As improvements in coding tools allow software developers to produce larger amounts of software to meet ever-expanding user requirements, a method to understand and communicate that size must be used. A structured technique of problem solving, function point analysis is a methodto break systems into smaller components, so they can be better understood and analyzed. This book describes function point analysis and industry trends using function points.
Human beings solve problems by breaking them into smaller, understandable pieces. Problems that may initially appear to be difficult are found to be simple when dissected into their components, or classes. When the objects to be classified are thecontents of software systems, a set of definitions and rules, or a scheme of classification, must be used to place these objects into their appropriate categories. Function point analysis is onesuch technique: FPA is a method to break systems into smaller components, so they can be better understood and analyzed. It also provides a structured technique for problem solving. FPA is very similar to completing a functional decomposition.
Function points are a unit measure for software much like an houris to measuring time, miles are to measuring distance or Celsius is to measuring temperature. Function Points are an ordinal
1

Introduction
measure much like other measures such as kilometers, Fahrenheit, hours, so on and so forth.
Function Points measure software by quantifying its functionalityprovided to the user based primarily on the logical design. Frequently the term end user or user is used without specifying what is meant. In this case, the user is a sophisticated user. Someone that would understand the system from a functional perspective --- more than likely someone that would provide requirements or does acceptance testing.
There are a variety of different methods used to count function point, but this book is based upon those rules developed by the Alan Albrecht1 and later revised by the International Function Point User Group (IFPUG). Another method, not discussed here, is Mark II Function Points2 developed by Charles Symon. Featurepoints is another sizing method developed by Capers Jones. Feature points were developed in 1986 to overcome the “sociological” problem of counting function points.
Elementary Process:A software application is in essence a defined set of elementary processes. When these elementary processes are combined they interact to form what we call a software system or software application. An elementary process is not totally independent existing alone, but the elementary processes are woven together becoming interdependent. There are two basic types of elementary processes (data in motion and data at rest) in a software application. Data in motion has the characteristic of moving data inside to outside the application boundary or outsideto inside the application boundary.
1 Albrecht, A.J.: Measuring Applications Development Productivity. Proceedingsof IBM Application Development Joint Share Guide Symposium, Monterey, CA, 1979, pp. 83-92.2 Symons, C. R., 1998, “Function Point Analysis: Difficulties and Improvements”, IEEE Transactions of Software Engineering, Vol. 14 No.1, January, pp 2-11.
Copyright Longstreet Consulting Inc. Page 11

Chapter 1
Definition:Function Point Analysis tries to understand the dynamic relationship between transactions and data stores. On a conceptual level, function point analysis helps define two abstract levels of data - data at rest and data in motion. The primary function of this book (and FPA) is to describe in detail these two states of data.
Data in motionData in motion is handled via transactional function types or transactions. All software applications will have numerous elementary processes or independent processes to move data. Transactions (or elementary processes) that bring data from outside the application domain (or application boundary) to inside that application boundary are referred to as external inputs. Transactions (or elementary processes) that take data from a resting position (normally on a file) to outside the application domain (or application boundary) are referred as either an external outputs or external inquiries (these will be definedlater in this book).
Data at restApplications store information for processing at a later time. Data at rest that is maintained by the application in question isclassified as internal logical files. Data at rest that is maintained by another application are classified as external interface files.
Benefits and Uses:A function point count has many uses. There are three types of function point counts. In the section How are Function Points Useful the benefits of function point counting is discussed in great detail. The article can be found on www.SoftwareMetrics.Com.
Function points can be used to establish an inventory of all transactions and files of a current project or application. This inventory can be used as a means of evaluation of an application. If an inventory is conducted for a development project or enhancement project, then this same inventory could
Page 12 – Revised August 2002
Introduction
be used to help maintain scope creep and to help control project growth. Even more important this inventory helps understand the magnitude of the problem.
Function Points can be used to size software applications. Sizing is an important component in determining productivity (outputs/inputs), predicting effort, understanding unit cost, so on and so forth.
Unlike some other software metrics, different people can countfunction points at different times, to obtain the same measurewithin a reasonable margin of error. That is, the same conclusion will be drawn from the results.
FPA can help organizations understand the unit cost of a software application or project. Once unit cost is understoodtools, languages, platforms can be compared quantitatively instead of subjectively. This type of analysis is much easier to understand than technical information. That is, a non-technical user can easily understand Function Points.
There are several other uses of function points. The following list are some practical applications of Function Points and FPA. The article Using Function Points on the Website www.SoftwareMetrics.Com, in the article section of the Website, provides more detail regarding each of these items. Function Points can be used for:
Defining When and What to Re-Engineer Estimating Test Cases Understanding Wide Productivity Ranges Understanding Scope Creep Calculating the True Cost of Software Estimating Overall Project Costs, Schedule and Effort Understanding Maintenance Costs Help with contract negotiations Understanding the appropriate set of metrics
Copyright Longstreet Consulting Inc. Page 13
Chapter 1
When Not to Use Function PointsFunction points are not a very good measure when sizing maintenance efforts (fixing problems) or when trying to understand performance issues. Much of the effort associated with fixing problems (production fixes) is due to trying to resolve and understand the problem (detective work). Another inherent problem with measuring maintenance work is that much of maintenance programming is done by one or two individuals. Individual skill sets become a major factor when measuring this type of work. The productivity of individual maintenance programmers can very as much as 1,000 percent.
Performance tuning may or may not have anything to do with functionality. Performance tuning is more a result of trying to understand application throughput and processing time. There arebetter metrics to utilize when measuring this type of work.
FPA is not useful to size Web Design. FPA is useful to size webdevelopment, but not web design. FPA is concerned with the dynamic relationship between transactions and files. FPA is not useful in estimating the time it will take to create graphics, images, page layouts, so on and so forth.
Types of Function Point Counts:Function point counts can be associated with either projects or applications. There are three major types of software projects (Development, Enhancements and Maintenance). In accordance with these types of function points there are three different types offunction point counts (Development, Enhancement and Application).
Development Project Function Point Count Function Points can be counted at all phases of a development project from requirements up to and including implementation. This type of count is associated with new development work. Scopecreep can be tracked and monitored by understanding the functional size at all phase of a project. Frequently, this typeof count is called a baseline function point count.
Page 14 – Revised August 2002

Introduction
Enhancement Project Function Point CountIt is common to enhance software after it has been placed into production. This type of function point count tries to size enhancement projects. All production applications evolve over time. By tracking enhancement size and associated costs a historical database for your organization can be built. Additionally, it is important to understand how a Development project has changed over time.
Application Function Point CountApplication counts are done on existing production applications. This “baseline count” can be used with overall application metrics like total maintenance hours. This metric can be used totrack maintenance hours per function point. This is an example of a normalized metric. It is not enough to examine only maintenance, but one must examine the ratio of maintenance hours to size of the application to get a true picture.
Additionally, application counts can assist organizations in understanding the size of the entire corporate portfolio (or inventory). This type of count is analogous to taking an inventory for a store. Like inventory, a dollar value can be associated with any application function point count and for the entire organization portfolio.
What about Lines of Code (LOC)There are several problems with using LOC as a unit of measure for software. Imagine two applications that provide the same exact functionality (screens, reports, databases). One of the applications is written in C++ and the other application written in a language like Clarion. The number of function points would be exactly the same, but aspects of the application would be different. The lines of code needed to develop the application would not be the same. The amount of effort required to develop the application would be different (hours per function point). We are able to compare the productivity of the languages. UnlikeLines of Code, the number of function points will remain constant
Copyright Longstreet Consulting Inc. Page 15
Chapter 1
(should remain constant).
With this in mind;
1. The number of lines of code delivered is dependent upon the skill level of the programmer. In fact, the higher skill level of the programmer the fewer lines of code they will develop to perform the same function.
2. Higher-level languages such as Forte, Dynasty, or other visual languages require far fewer lines of code than Assembler, COBOL, or C to perform the same functionality. That is, there is an inverse relationship between level of language and work output (when work output is LOC).
3. The actual number of LOC is not known until the project is almost completed. Therefore, LOC cannot be used to estimatethe effort or schedule of a project. Function Points can bederived from requirements and analysis documents that are available early in a project life cycle.
4. There is no agreed upon method to count lines of code. The statement and type of statements used in Visual C++, Assembler, COBOL, SQL are completely different. It is common for applications to have a combination of different languages being utilized.
Understanding Productivity:The standard economic definition of productivity is “Goods or services per unit of labor or expenses until 1979, when A.J. Albrecht of IBM published a paper about Function Points, there was no definition of what “goods or services” were the output of software project.
Software productivity and “industrial productivity” have been a subject of interest for many years. One of the first individualsto study productivity was Frederick Taylor (1856-1912). Taylor’s major concern throughout most of his life was to increase efficiency in production. Taylor decided that the problem of
Page 16 – Revised August 2002

Introduction
productivity was a matter of ignorance on the part of management.Taylor believed that application of scientific methods, instead of custom and rules of thumb could yield higher productivity. The idea of FPA and software metrics tries to move software from rules of thumb into scientific methods.
Hawthorne Studies:Several scientists undertook the famous experiments at the Hawthorne plant of the Western Electric Company in 1927 and 1932.They began a study to determine the effect of illumination on workers and their productivity. They found that productivity improved when illumination was either increased or decreased for a test group. They found that when people felt they were being noticed then their productivity increased. They also found that the improvement in productivity was due to such social factors asmorale, satisfactory interrelationships and effective management.They also found that the best managers were those that managed via counseling, leading, and communicating. The phenomenon, arising basically from people being “noticed,” has been known as the Hawthorne effect. The same is true with the software industry. Most software metrics programs will lead to higher productivity just because individuals are being measured.
Productivity:The definition of productivity is the output-input ratio within atime period with due consideration for quality.
Productivity = outputs/inputs (within a time period, quality considered)
The formula indicates that productivity can be improved by (1) byincreasing outputs with the same inputs, (2) by decreasing inputsbut maintaining the same outputs, or (3) by increasing outputs and decreasing inputs change the ratio favorably.
What does a software project deliver – what is it’s output? The output of a software project is functionality or function points.The input is the effort required to develop the functionality.
Copyright Longstreet Consulting Inc. Page 17
Chapter 1
Software Productivity = Function Points / Inputs
Effectiveness v. Efficiency:Productivity implies effectiveness and efficiency is individual and organizational performance. Effectiveness is the achievementof objectives. Efficiency is the achievement of the ends with least amount of resources.
Understanding Different Costs:A fixed cost is a cost that remains constant, in total, regardless of changes in activity. Consequently as the activity rises or falls fixed costs remain constant. The capital expenditure on PC’s for a software project is considered a fixed cost. Salaries paid to software develops can be treated as fixed costs for the organization because the salaries remain constant and must be paid regardless of productivity levels. A variable cost is a cost that varies, in total, in direct proportion to changes in the level of activity. The activity canbe expressed in many ways such as number of hours.3 Software metrics are concerned with project costs and not overall organizational costs. Hence software development has very low fixed costs, but very high variable costs.
Overhead costs are those cost that cannot be directly attributed to a particular software project. For example, the cost to keep the LAN up in running is an overhead cost. Executive salaries would be another example of overhead costs since their salaries cannot be attributed to a specific project.
Average cost is total cost divided by to number of units produced. Total costs for a project divided by the number of function points gives us the dollars per function point. Averagehours are the total number of hours divided by the total number of function points, which yields hours per function point. Marginal cost is the change in total cost attributable to a one-unit change in output.4 Another characteristic is that as software projects become large marginal cost goes up. That means3 Garrison, Ray and Eric Noreen. Managerial Accounting. Irwin McGraw-Hill, 2000.
Page 18 – Revised August 2002
Introduction
that unit costs rises as software projects become larger. There are not many economies of scale with the development of software.
When software projects are estimated all direct and indirect costs need to be included in the cost of the software project. Direct materials are those materials that are directly related tothe development of a software project. Indirect materials are those materials that are not directly related to the cost of the software development project. An example of indirect costs is the cost to run and maintain an internal network. Direct labor is labor costs that can be traced to an individual task associated with the development, maintenance or enhancement of a software product. Indirect labor cannot be traced to a specific task associated with the software project.
Understanding Software Productivity:Function Points are the output of the software development process. Another way to think about this is that Function points are the unit of software. It is very important to understand that Function Points remain constant regardless who develops the software or what language the software is develop in. Unit costs need to be examined very closely. To calculate average unit cost all items (units) are combined and divided by the total cost. On the other hand, to estimate the total cost each item isexamined.
For example, assume you are going to manufacture a computer mousepad. The totalCost to manufacture 1,000 mousepad is $2,660. The unit cost is $2.66 (per pad). The cost break down is:
Artwork is a fixed cost at $500 (or .50 per unit) Set Up costs are $250 (or .25 per unit) Shipping costs are $10 (or .01 per unit) Papers for production will cost $1.50 per unit. Rubber Pads are $ .15 per unit. Application of paper to pad cost is $.25 per unit
Copyright Longstreet Consulting Inc. Page 19

Chapter 1
Notice the variation in the unit cost for each item. One of the biggest problems with estimating software projects is understanding unit cost. Many software managers fail to break down items into similar components or like areas. They assume all units cost the same.
There are different costs for each of the function point components. The unit cost for external inputs is not the same asthe unit cost of external outputs for example. The online external inputs and the batch external inputs do not have the same unit cost (or cost per function point). The cost per unit to build and implement internal logical files is not the same perunit cost as the building and implementing of online reports.
To accurately estimate the cost of an application each component cost needs to be estimated. The same is true for the mousepad problem above.
Questions:
1. How would you estimate the number of hot chocolates being soldat the AFC Championship game in Kansas City (use your imagination, the Chiefs could be there - someday)?
What are the keys factors to consider?
Who would you benchmark against and why?
2. Would the hours per function point to develop a software application that is 100 function points be the same for a software application that is 10,000 function points? What 3 things would impact the difference in unit cost, if any?
Page 20 – Revised August 2002
FUNCTION POINT COUNTING PROCESS
Objective of Section:The objective of this chapter is to introduce the student to thehigh level steps necessary to count function points and toperform function point analysis. Details of each step arediscussed later in this book. The exercises at the end of thesection help the student demonstrate that they have gained thebasic knowledge required.
Introduction:Even though there have been attempts by the National Bureau of Standards (NBS) and IEEE to standardize terms and definitions, there are no industry wide practiced terms and definitions related to software development. IFPUG has developed some standard terms and definitions related to function points, but these terms and definitions need to be applied to a variety of different software environments.
Definition:The overall objective is to determine adjusted function point count. There are several steps necessary to accomplish this. While you may not understand the mechanics of the following steps, they will be discussed in great detail in the remainder ofthe book. The actual sequence or order of steps is not necessary.Many counters will complete step 5 through out the entire count –gathering information as they go;
1. Determine type of function point count2. Determine the application boundary 3. Identify and rate transactional function types to determine
their contribution to the unadjusted function point count.4. Identify and rate data function types to determine their
contribution to the unadjusted function point count.
2

Chapter 2
5. Determine the value adjustment factor (VAF)6. Calculate the adjusted function point count.
The unadjusted function point (UFP) count is determined in steps 3 & 4. Steps 3 & 4 are discussed later in this chapter and discussed in detail later in the book. It is not important if step 3 or step 4 is completed first. In GUI and OO type applications it is easy to begin with step 3.
The final function point count (adjusted function point count) isa combination of both unadjusted function point count (UFP) and the general system characteristics (GSC’s).
Page 22 – Revised August 2002
Function Point Counting Process
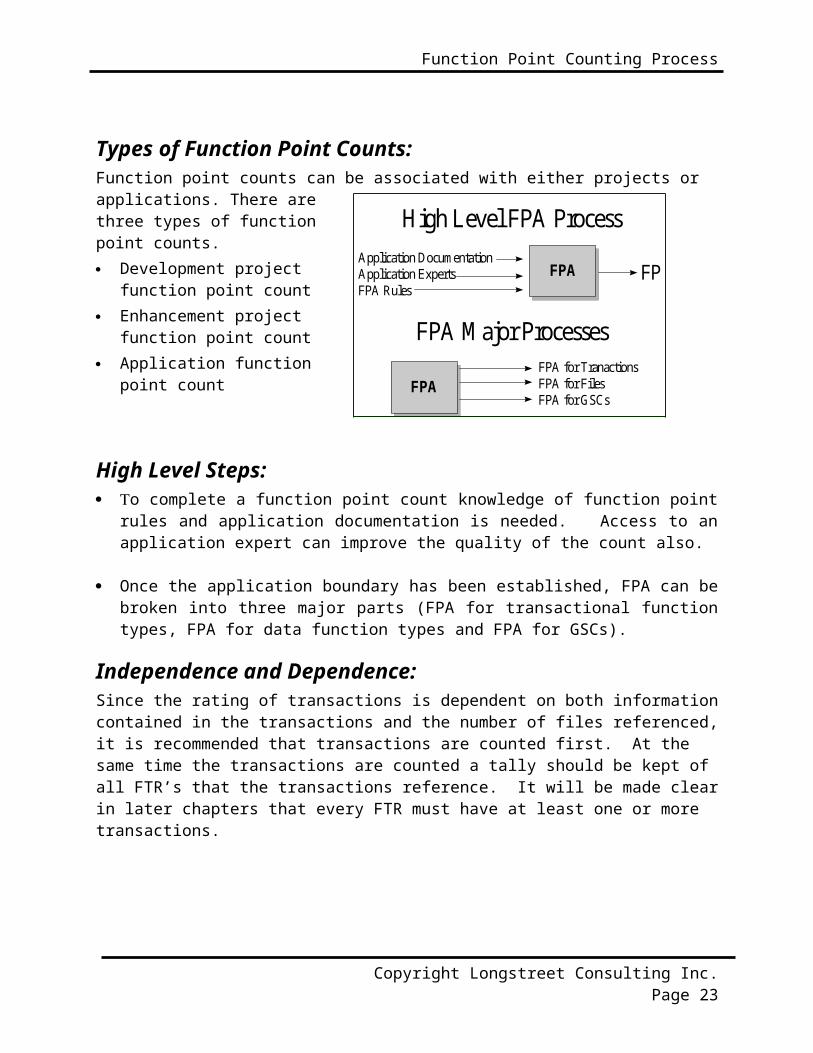
Types of Function Point Counts:Function point counts can be associated with either projects or applications. There arethree types of functionpoint counts. Development project
function point count Enhancement project
function point count Application function
point count
High Level Steps: o complete a function point count knowledge of function point
rules and application documentation is needed. Access to anapplication expert can improve the quality of the count also.
Once the application boundary has been established, FPA can bebroken into three major parts (FPA for transactional functiontypes, FPA for data function types and FPA for GSCs).
Independence and Dependence:Since the rating of transactions is dependent on both informationcontained in the transactions and the number of files referenced,it is recommended that transactions are counted first. At the same time the transactions are counted a tally should be kept of all FTR’s that the transactions reference. It will be made clearin later chapters that every FTR must have at least one or more transactions.
Copyright Longstreet Consulting Inc. Page 23
High Level FPA ProcessApplication DocumentationApplication ExpertsFPA Rules
FPFPA
FPA
FPA M ajor ProcessesFPA for TranactionsFPA for FilesFPA for GSCs

Chapter 2
FPA Steps for Transactional Function Types:Later in this document external inputs, external outputs and external inquiries are discussed in detail. Each transaction mustbe an elementary process. An elementary process is the smallest unit of activity that is meaningful to the end user in the business. It must be self-contained and leave the business in consistent state.
T1. Application documentationand transactionrules are used toidentifytransactions.
T2. The applicationdocumentation andtransaction rulesare used todetermine type oftransaction(external input, external output, or external inquiry).
T3. With the help of application documentation (data model and transaction model) and transaction rules the number data elementsand file type referenced are determined.
T4. Each identified transaction is assigned a value of low, average or high based upon type, data elements, and files referenced.
T5. A distinct numerical value is assigned based upon type and value (low, average, or high).
T6. All transactions are summed to create a transaction unadjusted function point count.
Page 24 – Revised August 2002

Function Point Counting Process
Copyright Longstreet Consulting Inc. Page 25

Chapter 2
FPA Steps for Files:
Later in this document internal logical files and external interface files are discussed in detail.
F1. Applicationdocumentation andfile rules are usedto identify files.
F2. The applicationdocumentation(transaction modeland data model) isused to determinetype of transaction(either external interface file or internal logical file).
F3. With the help of application documentation (data model) and file rules the number data elements and record element types are determined.
F4. Each identified file is assigned a value of low, average or high based upon type, data elements and record types.
F5. A distinct numerical value is assigned based upon type and value (low, average, or high).
F6. All files are summed to create a file unadjusted function point count.
Questions:
Page 26 – Revised August 2002

Function Point Counting Process
Is there any benefit to the sequence or order of counting function points? That is, is there a benefit to counting transactions prior to FTR’s?
Are transactions independent or dependent on FTR’s?
What about FTR’s? Are they counted independent or dependent of Transactions?
Copyright Longstreet Consulting Inc. Page 27

ESTABLISHING THE BOUNDARY
Objective of Section:Describe and define the concepts necessary to establish aboundary between applications.
Definition:Since it is common for computer systems to interact with other computer systems and/or human beings, a boundary must be drawn around each system to be measured prior to classifying components. This boundary must be drawn according to the sophisticated user’s point of view. In short, the boundary indicates the border between the project or application being measured and the external applications or user domain. Once the border has been established, components can be classified, rankedand tallied.
One of the benefits of function point analysis is creating ratioswith other metrics such hours, cost, headcount, duration, and other application metrics. It is important the function point boundary be consistent with other metrics that are being gatheredfor the application and project.
Identify the Boundary: Review the purpose of the function point count. Look at how and which applications maintain data. Identify the business areas that support the applications.
The boundary may need to be adjusted once components have been identified. In practice the boundary may need to be revisited, as the overall application is better understood. Function point counts may need to be adjusted as you learn about the application.
3

Establishing the Boundary
Standard Documentation: General Specification Documents Interface Documents Other metric reports Interviews with the users User Documentation Design Documentation Requirements Data flow diagrams
Establishing the Boundary early in the Life cycle:Boundaries can be established early in the software life cycle. If the application is a replacement project, then the project boundary should be similar (perhaps identical) to the previous application. If the application is a new application, other applications boundaries should be reviewed to establish the correct boundary.
Technology Issues:
Internet/Intranet ApplicationsThe boundary for an Internet/Intranet application is defined in asimilar way for traditional applications. For traditional applications the boundary is not drawn just around the user interface or a group of screens but around the entire application. Frequently, Internet/Intranet applications are justextensions to current and existing applications. There is a tendency to create a "new" application for the Internet/Intranet extension, but this approach is incorrect.
Client/ServerThe boundaries for client/server applications need to be drawn around both the client and server. The reason is that neither the client nor server supports a users (or sophisticated) view. That is, one alone does not represent a total application. As mentioned early, any complete application needs both data at rest(server) and data in motion (client).
Copyright Longstreet Consulting Inc. Page 29
Chapter 3
Tabulating:There is no special tabulating that needs to take place forestablishing the boundary, but the boundary can dramaticallyimpact the number of external inputs and external outputs.
Questions:
In theory, how does making the boundary too large impact a function point count?
What if the boundary is too small?
Page 30 – Revised August 2002
IDENTIFYING RET’S, DET’S ANDFTR’S
Objective of Section:Learn the necessary techniques to identify a RET, a DET and a FTR. Understanding how to identify DET’s and FTR’s is critical to distinguish one transaction from another. While in practice understanding the exact number of DET’s and FTR’s may not impact a function point count, understanding DET’s and FTR’s can help understand how to count function points for enhancement function point counts. The exercises at the end of the section help the student demonstrate that they have gained the basic knowledge required.
Definition:Record Element Type (RET): A RET is user recognizable sub group of data elements within an ILF or an EIF. It is best to look at logical groupings of data to help identify them. The concept of RET will be discussed in detail in the chapters that discuss internal logical file and external interface files. Additionally, a short article, Understanding RET’s can be found at www.SoftwareMetrics.Com/Articles
File Type Referenced (FTR): A FTR is a file type referenced by a transaction. An FTR must also be an Internal Logical File (ILF) or External Interface File (EIF).
Data Element Type (DET): A DET is a unique user recognizable, non-recursive (non-repetitive) field. A DET is information that is dynamic and not static. A dynamic field is read from a file or created from DET’s contained in a FTR. Additionally, a DET can invoke transactions or can be additional information regarding transactions. If a DET is recursive then only the first occurrence of the DET is considered not every occurrence.
4

Chapter 4
Understanding the FTR’s and DET’s helped distinguish one transaction from another transactions. This concept will be discussed in detail later in this book.
Rating:All of the components are rated based upon DET’s, and either RET’s or FTR’s.
Component RET’s FTR’s
DET’s
External Inputs (EI)
External Outputs (EO)
External Inquiries (EQ)
External Interface Files (EIF)
Internal Logical Files(ILF)
Transaction DET’s:External Inputs: Data Input Fields, Error Messages, CalculatedValues, ButtonsExternal Outputs: Data Fields on a Report, Calculated Values, ErrorMessages, and Column Headings that are read from an ILF or EIF.Like an EQ and EO can have an input side and output sides.External Inquiries: Input Side - field used to search by, the click ofthe mouse. Output side - displayed fields on a screen. DET’sfor an EQ must come from either an EIF or ILF.
Page 32 – Revised August 2002

Identifying RET’s, DET’s and FTR’s
Record Element Types (RET’s):Record element types are one of the most difficult concepts in function point analysis. Most record element types are dependenton a parent - child relationship. In this case, the child information is a subset of the parent information. In a parent child relationship there is a one to many relationship. That is,each child piece of information is linked directly to a field on the parent file. More will be discussed about RET’s in the internal logical file and external interface file sections.
Tips to Identify RET’s and DET’s early in the life cycle:RET’s and DET’s may be difficult to evaluate early in the software life cycle. Since RET’s and DET’s are essential to rating components, several techniques can be used to rate components.
Rate all transactional function types and data function typesas Average.
Determine how are transactional function type and datafunction types rated in similar type applications. Are themajority of data function types rated as low in similar typeapplications?
DET’s for GUIUsing the strict definition of a data element provided by IFPUG’sCounting Practices Manual. “A data element is a user recognizable, non recursive field.” Unfortunately this does not provide much guidance when counting GUI applications. In fact, the IFPUG Counting Practices manual does not provide much detail on counting, radio buttons, check boxes, pick list, drop downs, look ups, combo boxes, so on and so forth. In GUI applications,a data element is information that is stored on an internal logical file or that is used to invoke a transaction. A comprehensive article on the application of Function Points to New and Emerging Technologies exist at www.SoftwareMetrics.Com/Articles
Copyright Longstreet Consulting Inc. Page 33
Chapter 4
Radio ButtonsRadio Buttons are treated as data element types. Within a group of, a frame, radio buttons the user has the option of selecting only one radio button; so only one data element type is counted for all the radio buttons contained in the frame.
Check BoxesCheck Boxes differ from radio buttons in that more than one checkbox can be selected at a time. Each check box, within a frame, that can be selected should be treated as a data element.
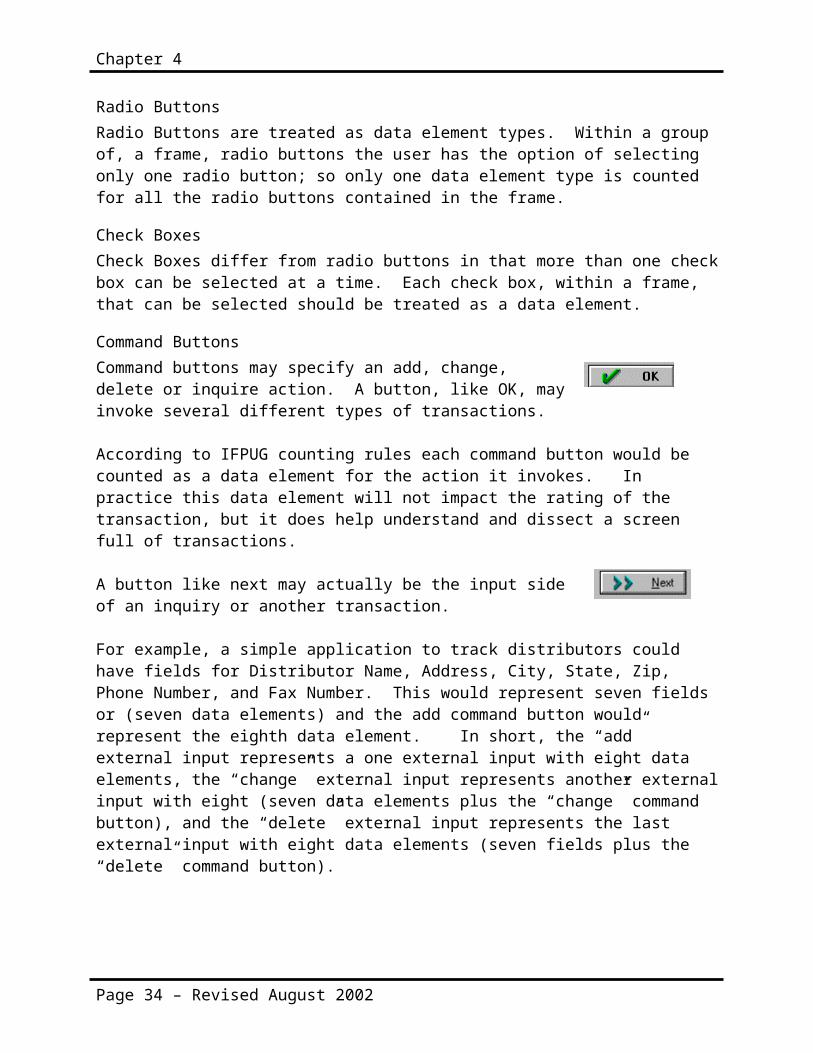
Command ButtonsCommand buttons may specify an add, change,delete or inquire action. A button, like OK, mayinvoke several different types of transactions.
According to IFPUG counting rules each command button would be counted as a data element for the action it invokes. In practice this data element will not impact the rating of the transaction, but it does help understand and dissect a screen full of transactions.
A button like next may actually be the input sideof an inquiry or another transaction.
For example, a simple application to track distributors could have fields for Distributor Name, Address, City, State, Zip, Phone Number, and Fax Number. This would represent seven fields or (seven data elements) and the add command button would represent the eighth data element. In short, the “add” external input represents a one external input with eight data elements, the “change” external input represents another externalinput with eight (seven data elements plus the “change” command button), and the “delete” external input represents the last external input with eight data elements (seven fields plus the “delete” command button).
Page 34 – Revised August 2002
Identifying RET’s, DET’s and FTR’s
Display of Graphical Images or IconsA display of a graphical image is simply another data element. An inventory application, for example, may contain data about parts. It may contain part name, supplier, size, and weight and include a schematic image of the part. This schematic is treatedas a single data element.
Sound BytesMany GUI applications have a sound byte attached. This represents one data element. The number of notes played is simply recursive information. If the length of the sound byte increases, then the data element remains one. For example, you can play the “Star Spangled Banner” for two seconds or four seconds, but you’ll still count the sound bytes as one data element. The longer it is played the more recursive information it has.
Photographic ImagesA photographic image is another data element, and is counted as one. A human resource application may display employee name, start date, etc. and a photograph of the employee. The photograph is treated the same as employee name or employee startdate. The photograph is stored and maintained like any other piece of information about the employee.
MessagesThere are three types of messages that are generated in a GUI application: error messages, confirmation messages and notification messages. Error messages and confirmation messages indicate that an error has occurred or that a process will be or have been completed. They are not an elementary or independent process alone, but they are part of another elementary process. A message that would state, “zip code is required” would be an example of an error message. A message that would state, “are you sure you want to delete customer” is an example of a confirmation message. Neither type of message is treated as a unique external output, but each is treated as a data element forthe appropriate transaction.
Copyright Longstreet Consulting Inc. Page 35

Chapter 4
On the other hand, a notification messages is a business type message. A notification is an elementary process, has some meaning to the business user and is independent of other elementary processes. It is the basis of processing and a conclusion being drawn. For example, you may try to withdraw from an ATM machine more money than you have in your account and you receive the dreaded message, “You have insufficient funds to cover this transaction.” This is the result of information beingread from a file regarding your current balance and a conclusion being drawn. A notification message is treated as an External Output.
DET’s For Real Time SystemsUsing the strict definition of a data element provided by IFPUG’sCounting Practices Manual. “A data element is a user recognizable, non recursive field.” Unfortunately this does not provide much guidance when counting real time or embedded systems. In fact, the IFPUG Counting Practices manual does not provide any detail on counting these types of systems.
Some traditional definitions can be applied directly to real timeand embedded systems. The fields on a diagnostics file: time of diagnostics, hardware state during diagnostics, temperature, voltage, so on and so forth would all be examples of data elements.
Real Time Systems may not have any “traditional user interface.” That is, the stimulus for the Real Time System may be it’s own output – or state. A real time or embedded systems can signal to determine current Hardware State (or location) and determine the appropriate adjustment (input) based on the current state.
Skill Builder:
1. The following information is heard in the Rome Train Station. How many data elements are heard? That is, what information varies from one train arrival to the next?
Page 36 – Revised August 2002
Identifying RET’s, DET’s and FTR’s
The train arriving from Florence will arrive on Track 46 at 8:30 a.m.The train arriving from Naples will arrive on Track 43 at 11:00 a.m.
2. The totals on a particular report change colors depending ifthe amount is above or below $ 500. For example if the amount is -$250 it appears as $250, but if the amount is over 0 then the value appears blue. For example if the amount is $1,000. How many data elements are represented by the number and by the color?
Copyright Longstreet Consulting Inc. Page 37

EXTERNAL INPUTS
Objective of Section:Describe and define the concepts necessary to identify and rateExternal Inputs. The exercises at the end of the section help thestudent demonstrate that they have gained the basic knowledgerequired.
Definition:External Inputs (EI) - is an elementary process in which data crosses the boundary from outside to inside. This data may come from a data input screen or another application. The data may be used to maintain one or more internal logical files. The data can be either control information or business information. If the data is control information it does not have to maintain an internal logical file.
If an external input adds, changes and deletes (maintains) information on an internal logical file, then this represents three external inputs. External inputs (especially change & delete) may be preceded by an external inquiry (see the section on external inquiries). Hence a full function screen is add, change, delete and inquiry (more will be discussed about inquiries later in the book).
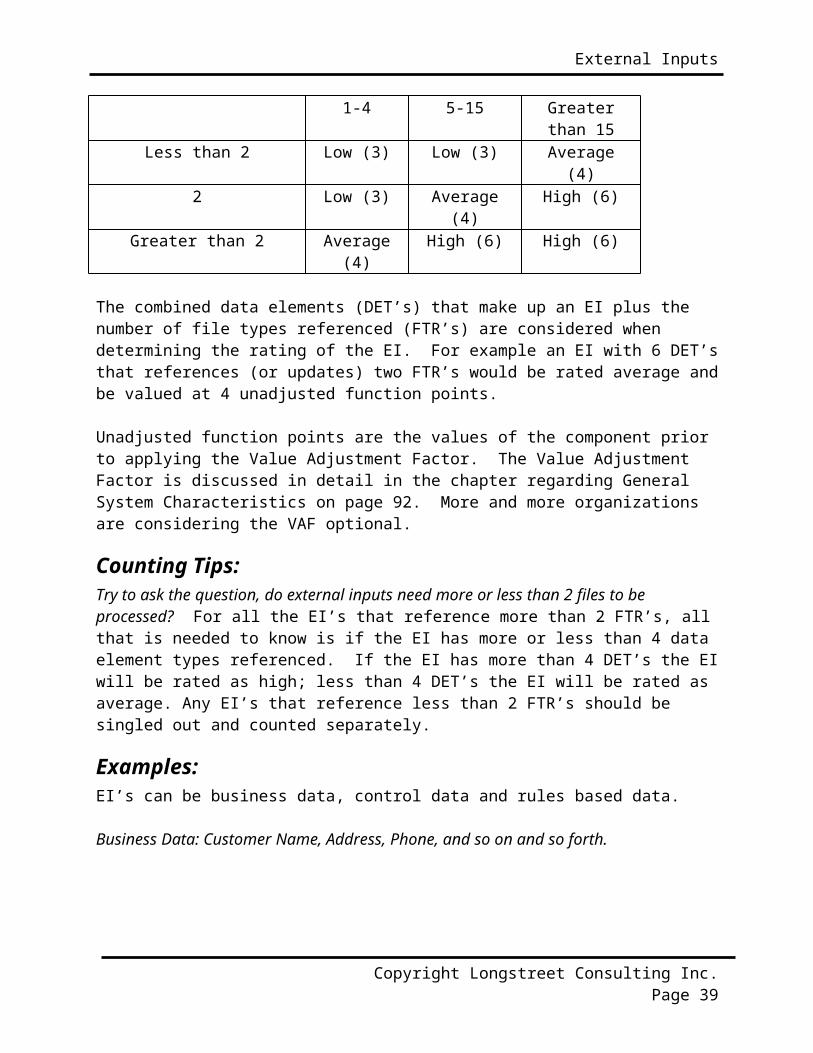
Rating:Like all components, EI’s are rated and valued. The rating is based upon the number of data element types (DET’s) and the file types referenced (FTR’s). DET’s and FTR’s are discussed earlier.The table below lists both the level (low, average or high) and appropriate value (3, 4 or 6 unadjusted function points).
Files Type Referenced(FTR)
Data Elements
5
External Inputs
1-4 5-15 Greaterthan 15
Less than 2 Low (3) Low (3) Average(4)
2 Low (3) Average(4)
High (6)
Greater than 2 Average(4)
High (6) High (6)
The combined data elements (DET’s) that make up an EI plus the number of file types referenced (FTR’s) are considered when determining the rating of the EI. For example an EI with 6 DET’sthat references (or updates) two FTR’s would be rated average andbe valued at 4 unadjusted function points.
Unadjusted function points are the values of the component prior to applying the Value Adjustment Factor. The Value Adjustment Factor is discussed in detail in the chapter regarding General System Characteristics on page 92. More and more organizations are considering the VAF optional.
Counting Tips:Try to ask the question, do external inputs need more or less than 2 files to be processed? For all the EI’s that reference more than 2 FTR’s, allthat is needed to know is if the EI has more or less than 4 data element types referenced. If the EI has more than 4 DET’s the EIwill be rated as high; less than 4 DET’s the EI will be rated as average. Any EI’s that reference less than 2 FTR’s should be singled out and counted separately.
Examples:EI’s can be business data, control data and rules based data.
Business Data: Customer Name, Address, Phone, and so on and so forth.
Copyright Longstreet Consulting Inc. Page 39

Chapter 5
Control Data:
The data elementsare those thatinvoke thetransaction orchange the behaviorof the application. Each check boxrepresents a dataelement.Additionally, thesort employee list radio buttons represents one data element as well as the time format radio buttons.
Control information changes or alters the state (or behavior) of the application. Control information specifies how, what, and when data will be processed.
Data Elements:Unique sets of data elements help distinguish external input fromother external input. It is the set of DET’s combined that create the elementary process called an EI. The following are examples of DET’s.
Data Input Fields Calculated Values that are stored Error Messages Confirmation Messages Recursive fields are only counted as one DET. Action keys (command buttons such as OK, Next, so on and so
forth) Multiple Action Keys that perform the same function are
counted only as one DET.
Page 40 – Revised August 2002
External Inputs
File Types Referenced (FTR’s):Unique FTR’s helps distinguish external input from other externalinput. An FTR must be either an Internal Logical File and/or External Interface File. Each internal logical file that an external input maintains is counted as an FTR. Any internal logical file or external interface file that is referenced by an external input as part of the elementary process of maintaining an internal logical file would be considered an FTR also. For example, an External Input may update an internal logical file, but must also reference a “security file” to make sure that the user has appropriate security levels. This would be an example of two FTR’s.
Uniqueness:A unique set of data elements, and/or a different set of FTR’s, and/or a unique set of calculations make one external input unique or different from other external inputs. That is, one of the following must be true:
Unique or different set of data elements Unique or different set of FTR’s Unique or different calculations
Calculations alone are not an elementary process but part of the elementary process of the external input. A calculation (or derived data) does not make the transaction an external output. External outputs and derived data will be discussed in detail in the external output section of this document.
Understanding Enhancement Function Points:Modification of any of the items, which make an External Input unique from other external inputs, causes the EI to be “enhanced.” If any of the following are true:
DET’s added to an EI DET’s modified on an EI. The DET was included in the last FP
Count. A New FTR
Copyright Longstreet Consulting Inc. Page 41

Chapter 5
Modifications to a calculation that appears on an EI.
Technology Issues:
GUIRadio Buttons - each set of radio buttons is counted as one DET.Only one radio button can be selected at a time.
Pick Lists- The actual pick list (also known as drop downs, lookups)could be an external inquiry, but the result of the inquiry maybe a DET for an external input.
Check Box - Each check box that can be simultaneously checked is aunique DET.
Buttons - Buttons can be DET’s. The OK button above would be a data element. If there was a series of buttons Add, Change and Delete. Each button would be counted as a DET for the associatedtransaction.
A single GUI “screen” may represent several transactional function types. For example, it is common for a GUI “screen” to have a series of external inquiries followed by an external input.
OtherError Messages - error messages are counted as data elements (DET’s), not unique external inquiries. Count one DET for the entire input screen. Multiple Error Messages are similar to recursive values. An error message is part of another elementaryprocess.
The number of error messages on a GUI screen is less than the number of error messages associated with traditional applications. If used correctly, radio buttons and pick lists can force users to select correct information; therefore, eliminating the need to do editing behind the scenes.
Page 42 – Revised August 2002

External Inputs
In practice the number of DET’s do not make much of a difference in evaluating an EI, understanding error or confirmation messageshelp in the understanding of uniqueness.
Real Time and Embedded SystemsIn real time and embedded systems communication between hardware and software is common and should not be overlooked when countingthese types of systems. Other types of inputs for real time and embedded systems are: Operator Controls, Volume Controls, Sensor Readings, Radio Frequencies, Standards and Limit Settings (AlarmsSettings, so on and so forth.
Standard Documentation:A good source of information to determine external inputs is Screen Layouts, Screen Formats & dialogs, and layouts of any input forms. Additional inputs from other applications should beinventoried here. Inputs from other applications must update internal logical files of the application being counted. Screen Layouts Screen Dialogs Design Documentation Functional Specifications User Requirements Any Input Forms Context Diagrams Data Flow Diagrams
Tips to Identify External Inputs early in the life cycle:The following types of documentation can be used to assist incounting EI’s prior to system implementation.
Any refined objectives and constraints for the proposedsystem.
Collected documentation regarding the current system, if sucha system (either automated or manual) exits.
Documentation of the users’ perceived objectives, problems andneeds.
Preliminary Data Flow Diagram.
Copyright Longstreet Consulting Inc. Page 43
Chapter 5
Requirements Documentation.
Typical Vocabulary:The following words are associated with external input or “inputs.” While reading textual document or application description look for these type of words, they may indicate an add, change or delete aspect of an external input.
AddActivateAmend (change and
delete)CancelChangeConvert (change)Create (add)DeleteDeassignDisableDisconnect (change or
delete)EnableEdit (change)Insert ( add and change)Maintain (add, change,
or delete)Memorize (add)
Modify (change)Override (change)Post (add, change and delete)Remove (delete)Reactivate (change)RemitReplace (change)Revise (change and delete)Save (add, change or delete)Store (add)Suspend (change or delete)Submit (add, change or delete)Update (add, change or delete)Voids (change and delete)
Skill Builder:The following questions are used to help build on the conceptsdiscussed in this section. They are designed to encouragethought and discussion.
1. If an EI has one file type referenced and 5 data elements isit rated, low average or high? What about 7 data elements?Or 25 Data elements?
Page 44 – Revised August 2002
External Inputs
2. How many data elements are there on the control input in thebody of the chapter (page 40)?
3. Does every EI have to update an ILF? Why?
4. What is the difference between “complexity” and “value?”
5. What are the criteria for an EI to be rated high?
6. Fill in the “value” of a low ____ average ____ and high ____EI?
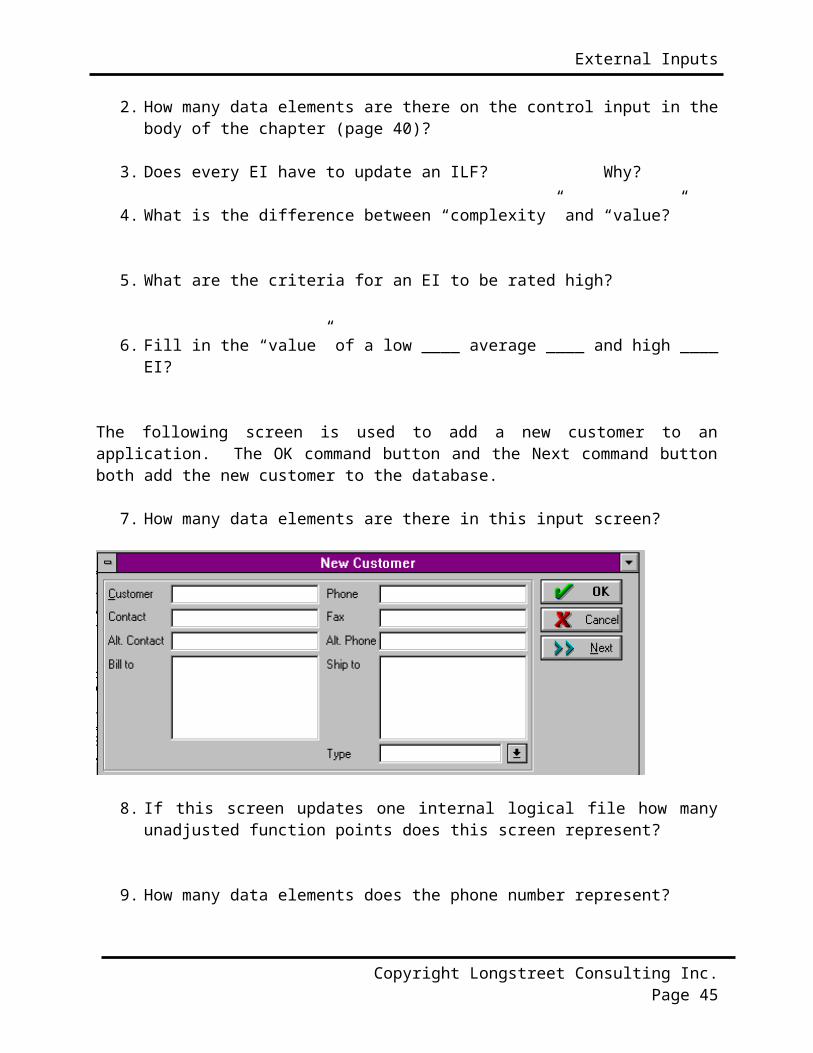
The following screen is used to add a new customer to anapplication. The OK command button and the Next command buttonboth add the new customer to the database.
7. How many data elements are there in this input screen?
8. If this screen updates one internal logical file how manyunadjusted function points does this screen represent?
9. How many data elements does the phone number represent?
Copyright Longstreet Consulting Inc. Page 45

Chapter 5
10. Is the Cancel command button counted as a data element?
Application A has a batch input file. The batch file is one physical file, but contains many different types of records. Thefirst field is a record identifier number. The record identifiernumber can range from 1-75. The second field describes if the record is new and adds to the file, changes a previous batch input or a deletes a previous batch input (add, change and delete). Depending on the record identifier number there are a unique set of data elements, a different set of files are updatedand referenced, and different processing logic is followed. Every single record identifier number updates more than 3 files (has more than 3 FTR’s) and contains more than 5 data elements. How many function points does this one batch input represent?
Page 46 – Revised August 2002

EXTERNAL OUTPUTS
Objective of Section:Describe and define the concepts necessary to identify and rateExternal Outputs. The exercises at the end of the section helpthe student demonstrate that they have gained the basic knowledgerequired.
Definition:External Outputs (EO) - an elementaryprocess in which derived data passesacross the boundary from inside tooutside. Additionally, an EO mayupdate an ILF. The data createsreports or output files sent toother applications. These reportsand files are created from information contained in one or more internal logical files and external interface files.
Derived Data is data that is processed beyond direct retrieval and editing of information from internal logical files or external interface files. Derived data is usually the result of algorithms, or calculations. Derived data occurs when one or more data elements are combined with a formula to generate or derive an additional data element(s). This derived data does not appear in any FTR (internallogical file or external interface file).
An algorithm is defined as a mechanical procedure for performing a given calculation or solving a problem in a series of steps.
A calculation is defined as an equation that has one or more operators. An operator is a mathematical function such as addition, subtraction, multiplication, and division (+, -,x, /).
6
Chapter 6
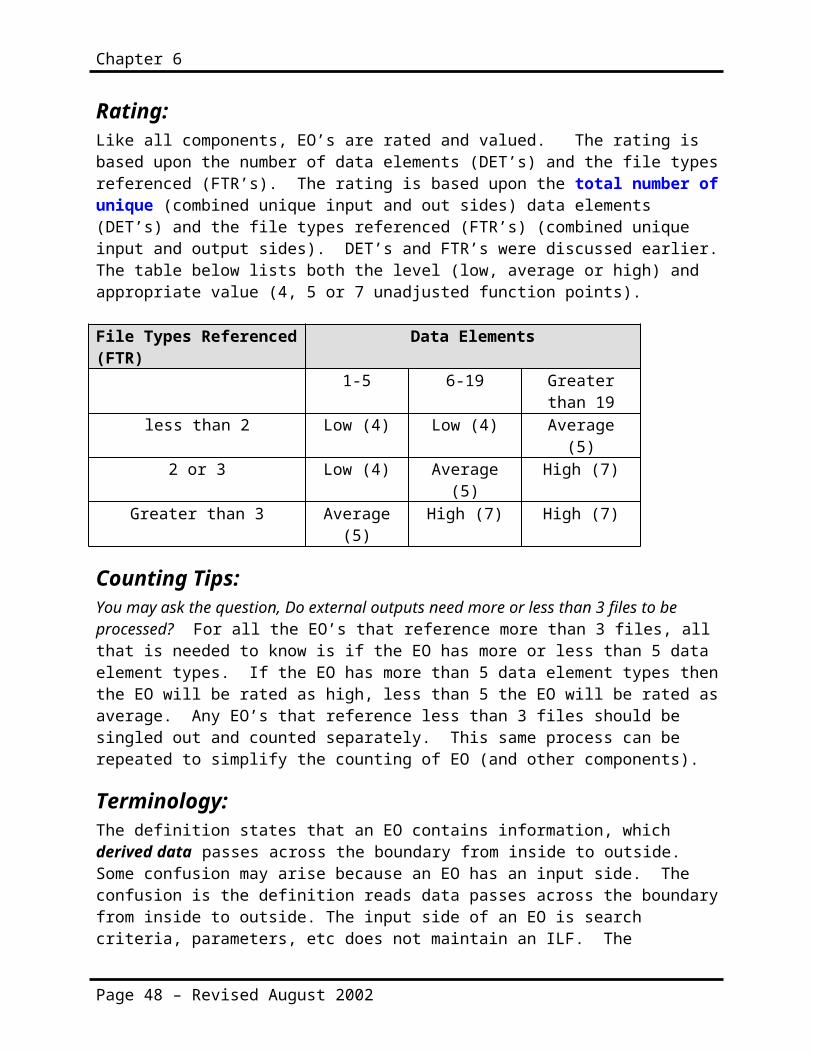
Rating:Like all components, EO’s are rated and valued. The rating is based upon the number of data elements (DET’s) and the file typesreferenced (FTR’s). The rating is based upon the total number ofunique (combined unique input and out sides) data elements (DET’s) and the file types referenced (FTR’s) (combined unique input and output sides). DET’s and FTR’s were discussed earlier.The table below lists both the level (low, average or high) and appropriate value (4, 5 or 7 unadjusted function points).
File Types Referenced(FTR)
Data Elements
1-5 6-19 Greaterthan 19
less than 2 Low (4) Low (4) Average(5)
2 or 3 Low (4) Average(5)
High (7)
Greater than 3 Average(5)
High (7) High (7)
Counting Tips:You may ask the question, Do external outputs need more or less than 3 files to be processed? For all the EO’s that reference more than 3 files, allthat is needed to know is if the EO has more or less than 5 data element types. If the EO has more than 5 data element types thenthe EO will be rated as high, less than 5 the EO will be rated asaverage. Any EO’s that reference less than 3 files should be singled out and counted separately. This same process can be repeated to simplify the counting of EO (and other components).
Terminology:The definition states that an EO contains information, which derived data passes across the boundary from inside to outside. Some confusion may arise because an EO has an input side. The confusion is the definition reads data passes across the boundaryfrom inside to outside. The input side of an EO is search criteria, parameters, etc does not maintain an ILF. The
Page 48 – Revised August 2002
External Outputs
information that a cross from outside to inside (input side) is not permanent data, but it is transient data. The intent of the information coming from outside the application (input side) is not to maintain an ILF.
Examples:Unlike other components EO’s almost always contain business data.Rule base data and control based “outputs” are almost always considered External Inquiries. This is true due to the fact thatrule data and control type data is not derived (or derivable).
Notification Messages are considered EO’s. A notification message differs from an error message. A notification message is an elementary process, while an error message (or confirmation message) is part of an elementary process. A notification message is the result of some business logic processing. For example, a trading application may notify a broker that the customer trying to place an order does not have adequate funds intheir account.
Derived Data displayed in textual fashion (rows and columns) and graphical format is an example of two external outputs.
Data Elements:Unique sets of data elements help distinguish one external outputfrom another. Keep in mind that a DET is something that is dynamic not a static field (A DET is a unique user recognizable, non-recursive (non-repetitive) field). Error Messages Confirmation Messages Calculated Values (derived data) Values on reports that are read from an internal logical file
or external interface file. Recursive values or fields (count only once) Generally, do not count report headings (literals) as data
elements unless they are dynamic. That is, if the report headings are read from files that are maintained they may be DET’s also.
Copyright Longstreet Consulting Inc. Page 49
Chapter 6
System generated dates that are on the tops or reports or are displayed are normally not counted as DET’s. If system generated dates are part of business information of the external output they should be counted as DET’s. For example,the date an invoice is printed or the date a check is printed.
The combined set of DET’s for an External Output is the “elementary process.”
File Types Referenced (FTR):Unique FTR’s help distinguish one external output from another. An FTR must be either an Internal Logical File and/or External Interface File. Each EO must have at least one FTR (either ILF or EIF). If the EO does not reference at least one FTR, then where did the information (DET’s) come from?
The elementary process associated with an external output may update an internal logical file or external interface file. For example, the elementary process that produces a payroll check mayinclude an update to a file to set a flag to indicate that the payroll check was produced. This is not the same as maintainingthe file. Maintained is the process of modifying data (adding, changed and deleting) via an elementary process (via an External Input). The primary intent of an EO is not to maintain an ILF.
Uniqueness:A unique set of data elements, and/or a different set of FTR’s, and/or a unique set of calculations makes one external output unique or different from other external outputs. That is, one ofthe following must be true:
Unique or different set of data elements Unique or different set of FTR’s Unique or different calculations Unique processing logic
Page 50 – Revised August 2002
External Outputs
Understanding Enhancement Function Points:Modification of any of the items, which make an External Output unique from other external outputs, causes the EO to be “enhanced.” If any of the following are true:
DET’s added to an EO DET’s modified on an EO. The DET was included in the last FP
Count. A New FTR Modifications to a calculation that appears on an EO.
Technology Issues:Each media that a report is sent to is counted as a unique EO.If a report were available on line, paper and electronic it wouldbe counted as three EO’s.
Disk Cache: Information that is prepared, processed, and derivedand put on cache files for another application to utilize shouldnot be overlooked. These cached files may be external outputs orexternal inquiries. The difference would be if the file containsderived data.
Standard Documentation: Report Layouts Design Documentation Functional Specifications User Requirements Database descriptions Field Sizes and Formats Graphical Report Layouts
Tips to Identify External Outputs early in the life cycle:The following types of documentation can be used to assist incounting External Outputs prior to system implementation.
Copyright Longstreet Consulting Inc. Page 51
Chapter 6
Any refined objectives and constraints for the proposedsystem.
Collected documentation regarding the current system, if sucha system (either automated or manual) exits.
Documentation of the users’ perceived objectives, problems andneeds.
Preliminary Data Flow Diagrams.
Typical Vocabulary:The following words are associated with an “external outputs.” While reading textual documents or application descriptions look for these types of words. They may indicate an external output. Notice these words are very similar to those words used for an External Inquiry (discussed in the next chapter).
BrowseDisplayGetOn-linesOutputPrintQuery
ReportsRequestRetriev
eSeekSelectView
Special Issues and Concerns:
When to count DET’s for Report Headings:Report headings are counted when they are dynamic. That is, if report headings are being read from an internal logical file theyshould be counted as DET’s.
Can an External Output have an input side?Since the input side is not stand-alone (independent or an elementary process) it should be considered as part of the entireexternal output. The FTR’s and DET’s used to search should be combined with unique outside DET’s and FTR’s for at grand total FTR’s and DET’s for the entire EO. In short, an external output can have an input side.
Page 52 – Revised August 2002

External Outputs
Can an External Output Update an Internal Logical File?An external output can update an internal logical file, but it isincorrect to say that an external output can maintain an internallogical file. The update is part of the elementary process of the external output. An external input maintains data on and ILFfile. The maintain process is an elementary process alone. The definition for maintaining is discussed in the internal logical file and external input sections of this book.
GraphsGraphs are counted the same way as the textual EO’s. That is, the graph is rated and valued based on the number of DET’s and the number of FTR’s. In fact, recursive information is easily seen in a graph, but can be more difficult to visualize in a textreport.
There are 10 data elements in the following table 1. Days2. Hits3. % of Total Hits4. User Sessions5. Total Hits (weekday)6. Total % (weekday)7. Total User Sessions (weekday)8. Total Hits (weekend)9. Total % (weekend)10. Total User Sessions (weekend)
Copyright Longstreet Consulting Inc. Page 53

Chapter 6
Days, Hits, % of Total Hits and User Sessions all have recursive data.
The same data could be processed and presented as bar graph. But on the following bar graph there are only two data elements (user session and day of week). The bar graph is a separate external output and is unique from the above table. In short, itprovides slightly different information than the table.
Skill Builder:The following questions are used to help build on the concepts discussed in this section. They are designed to encourage thought and discussion.
Page 54 – Revised August 2002

External Outputs
Ice Cream Cone Sales by Month
Flavor Jan Feb
Mar Apr May Jun Jul Aug Sep
Oct
Nov Dec
Total
VanillaVanilla 80 85 85 90 110 120
135 145
90 84 75 70 1169
ChocolatChocolatee
75 80 70 83 100 105
109 120 80 70 69 65 1026
StrawberStrawberryry
30 35 35 40 70 80 95 105 40 34 25 20 609
PistachioPistachio 8 9 9 9 11 12 14 15 9 8 8 7 119OtherOther 12 13 13 13 15 17 19 20 14 13 13 12 174TotalTotal 205 22
2212 235 306 33
4372 405 23
3209
190 174
1. How many data elements are there in the above chart?
2. Is there recursive (repetitive) information? What is it?
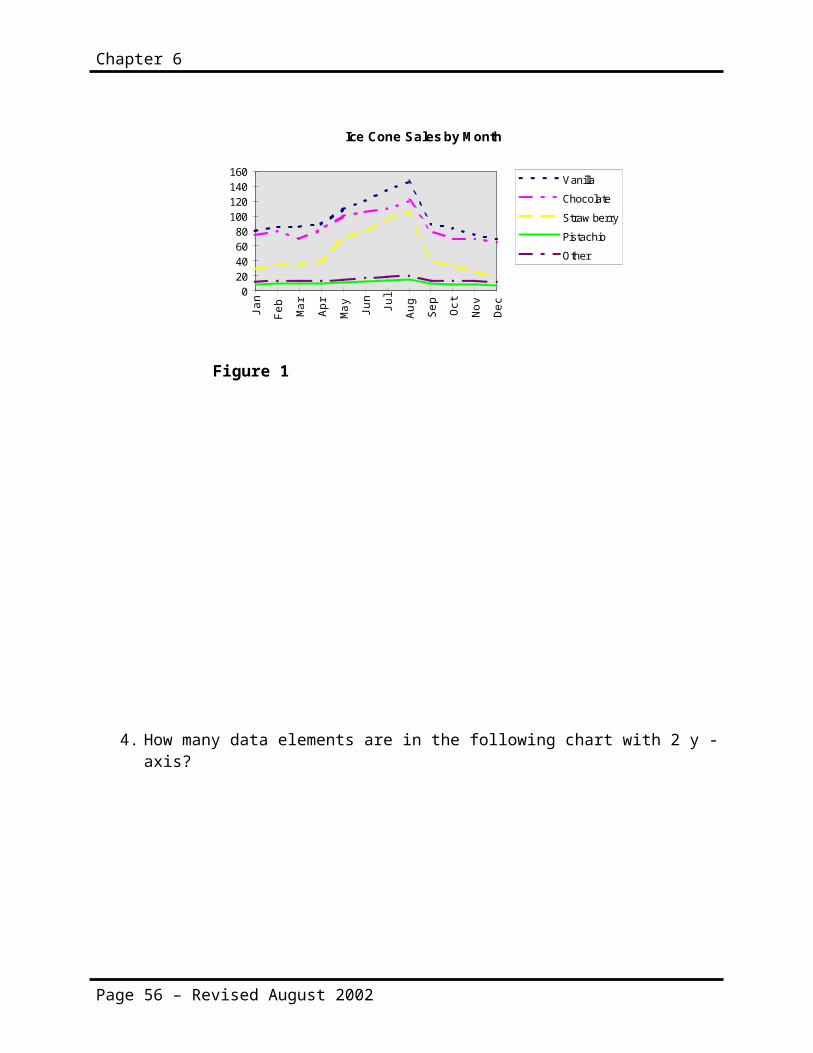
3. How many data elements are there in the following line chart? Can recursive information be seen easier in graphs?
Copyright Longstreet Consulting Inc. Page 55
Chapter 6
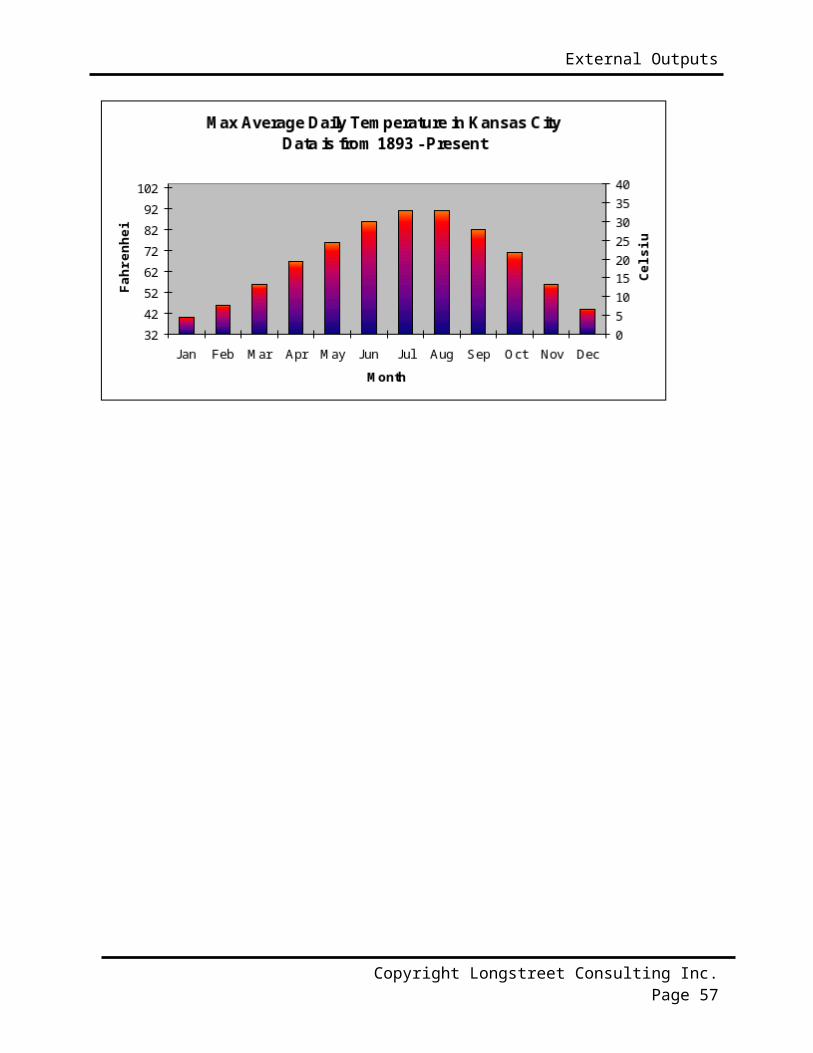
4. How many data elements are in the following chart with 2 y -axis?
Page 56 – Revised August 2002
Ice Cone Sales by M onth
020406080100120140160
Jan
Feb
Mar
Apr
May
Jun
Jul
Aug
Sep
Oct
Nov
Dec
VanillaChocolateStraw berryPistachioOther
Figure 1
External Outputs
Copyright Longstreet Consulting Inc. Page 57
Chapter 6
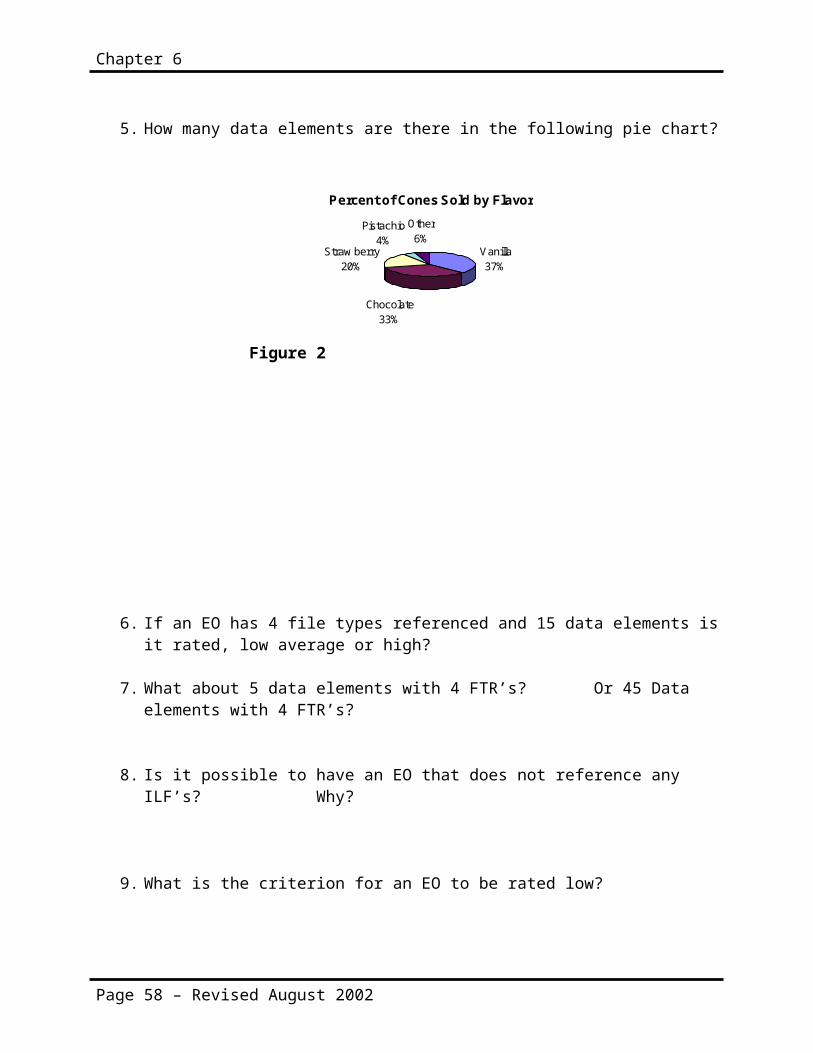
5. How many data elements are there in the following pie chart?
6. If an EO has 4 file types referenced and 15 data elements isit rated, low average or high?
7. What about 5 data elements with 4 FTR’s? Or 45 Data elements with 4 FTR’s?
8. Is it possible to have an EO that does not reference any ILF’s? Why?
9. What is the criterion for an EO to be rated low?
Page 58 – Revised August 2002
Percent of Cones Sold by Flavor
Vanilla37%
Chocolate33%
Straw berry20%
Pistachio4%
Other6%
Figure 2

External Outputs
10. Fill in the “value” of a low ____ average ____ and high____ EO? How does this compare to an EQ? Why the difference?
11. You have a list of 25 reports and you can safely assumethat each report is separate elementary processes, estimate the number of unadjusted function points.
12. You are given a list of the following 5 reports and theonly information you have are the number of FTR’s.
Report 1, 3 FTR’sReport 2, 5 FTR’sReport 3, 1 FTRReport 4, 2 FTR’sReport 5, 1 FTR
Estimate the number of unadjusted function points. What method did you use?
13. How would estimate the unadjusted number of function points if you were provided the following information.
Report 1, 4 DET’sReport 2, 25 DET’sReport 3, 10 DET’sReport 4, 15 DET’sReport 5, 2 DET’s
14. What method did you use?
15. Previously, the line graph of ice cream cone sales wascounted as one unique External Output. If a graph wereexactly the same except in Italian, would this be consideredanother unique external output?
16. Two separate checks are created an expense check and a payroll check. Both checks look identical and have the
Copyright Longstreet Consulting Inc. Page 59
Chapter 6
following fields, employee name, employee address, amount ofcheck, date of check is printed. The expenses check uses the expenses reimbursement file and the employee file and the payroll check uses the payroll file and the employee file. The calculations for each check are different. How many external outputs are there? Explain your answer?
Page 60 – Revised August 2002
EXTERNAL INQUIRIES
Objective of Section:Describe and define the concepts necessary to identify and rateExternal Inquiries. The exercises at the end of the section helpthe student demonstrate that they have gained the basic knowledgerequired.
Definition:External Inquiry (EQ) - an elementaryprocess with both input and outputcomponents that result in dataretrieval from one or more internallogical files and external interfacefiles. The input process does notupdate or maintain any FTR’s(Internal Logical Files or External Interface Files) and the output side does not contain derived data.
Rating:Like all components, EQ’s are rated and valued. Basically, an EQ is rated (Low, Average or High) like an EO, but assigned a value like and EI. The rating is based upon the total number of unique (combined unique input and out sides) data elements (DET’s) and the file types referenced (FTR’s) (combined unique input and output sides). DET’s and FTR’s were discussed later inthis chapter. If the same FTR is used on both the input and output side, then it is counted only one time. If the same DET is used on both the input and output side, then it is only counted one time.
Functional rating table (shared table between EO and EQ)File Types Referenced(FTR)
Data Elements
7

Chapter 7
1-5 6-19 Greaterthan 19
less than 2 Low (3) Low (3) Average(4)
2 or 3 Low (3) Average(4)
High (6)
Greater than 3 Average(4)
High (6) High (6)
The combined data elements (DET’s) that make up an EQ plus the number of file types referenced are considered when determining the rating of the EQ. For example an EQ with 4 DET’s that references two FTR’s would be rated low and be valued at 3 unadjusted function points.
While the rating table is shared between an EO and EQ, the EQ is valued the same as an EI.
Page 62 – Revised August 2002
External Inquiries
Examples:EQ’s can contain business data, control data and rules baseddata.
Business Applications: An example of Business data is customer names,addresses, phone number, so on and so forth. An example of RulesData is a table entry that tells how many days a customer can belate before they are turned over for collection.
Drop Down List (a listing of customers by name) would be anexample of an EQ.
A screen full of customer address information would be an exampleof an EQ.
Terminology:There are a lot of commonalities between an EO and EQ. Both haveinput and output sides, but an EQ cannot have derived data. An EQ cannot update an ILF. An EQ is basically a read from a FTR.
Data Elements:Unique sets of data elements help to distinguish one external inquiry from another external inquiry.
Input SideClick of a the mouseSearch valuesAction keys (command buttons)Error Messages Confirmation Messages (searching)Clicking on the an action keyScrollingRecursive fields are counted only once.
OutsideValues read from an internal logical file or external
interface fileColor or Font changes on the screen
Copyright Longstreet Consulting Inc. Page 63

Chapter 7
Error MessagesConfirmation MessagesRecursive fields are counted only once.
The combined (unique) total input and outside DET’s are used whenrating EQ’s.
Like an EI, action keys that perform the same function but appearmultiple times are counted as only one DET.
Error Messages and confirmation messages can and do occur on either the input side and/or output side. If a user initiates asearch and a message is displayed, “please wait searching” is an example of a confirmation message on the input side. The message “all fields must be populated” is another example of an error message on the input side. On the other hand, if the message is“customer not found” is an example of an error message on the output side. That is, the input side contained no problems. Thedatabase was searched and the “error” has occurred on the output side of the transaction.
File Type Referenced (FTR’s):Unique FTR’s help distinguish one external inquiry from another external inquiry. Every EQ must have at least one associated FTR(either ILF or EIF). If the EQ does not have an associated FTR, then where did the information (DET’s that appear on the EQ) comefrom?
Both the input side and output side must be considered when evaluating the FTR’s used by an external inquiry. Normally they are the same but there are instances where they may not be the same. The combined total should be used when evaluating an EQ. For example, a security check may be done on the input side of anexternal inquiry. The security check is done to make sure the user of the application has the appropriate level of authority toview the data.
Page 64 – Revised August 2002
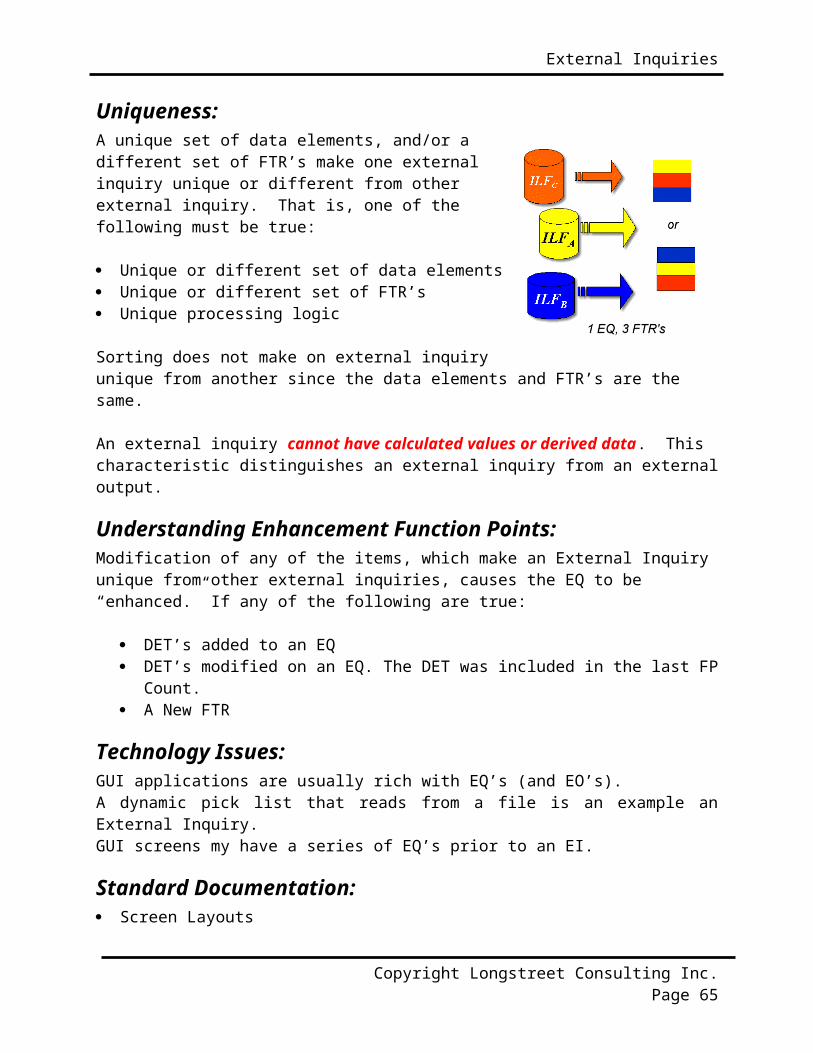
External Inquiries
Uniqueness:A unique set of data elements, and/or adifferent set of FTR’s make one externalinquiry unique or different from otherexternal inquiry. That is, one of thefollowing must be true:
Unique or different set of data elements Unique or different set of FTR’s Unique processing logic
Sorting does not make on external inquiryunique from another since the data elements and FTR’s are the same.
An external inquiry cannot have calculated values or derived data. This characteristic distinguishes an external inquiry from an externaloutput.
Understanding Enhancement Function Points:Modification of any of the items, which make an External Inquiry unique from other external inquiries, causes the EQ to be “enhanced.” If any of the following are true:
DET’s added to an EQ DET’s modified on an EQ. The DET was included in the last FP
Count. A New FTR
Technology Issues:GUI applications are usually rich with EQ’s (and EO’s). A dynamic pick list that reads from a file is an example anExternal Inquiry. GUI screens my have a series of EQ’s prior to an EI.
Standard Documentation: Screen Layouts
Copyright Longstreet Consulting Inc. Page 65

Chapter 7
Design Documentation Functional Specifications Table Layouts User Requirements Database descriptions Pick lists Field sizes and formats
Tips to Identify EQ’s early in the life cycle:The following types of documentation can be used to assist incounting internal logical files prior to system implementation.
Any refined objectives and constraints for the proposedsystem.
Collected documentation regarding the current system, if sucha system (either automated or manual) exits.
Documentation of the users’ perceived objectives, problems andneeds.
Preliminary Data Flow Diagrams.
Typical Vocabulary:The following words are associated with an “external inquiry.” While reading textual document or application description look for these type of words. They may indicate an external inquiry. Notice the words are very similar to those related to external outputs.
BrowseDisplayExtractFetchFindGetDrop DownListsLook UpsOn-linesOutputPick Lists Print
QueryScanSeekSelectShowViewReports
Page 66 – Revised August 2002

External Inquiries
Special Issues and Concerns:
Can an External Inquiry not have an input side?Even though it may not be visible all external inquiries have an input side. In cases where the input side is not readily visibleis referred to as an implied inquiry.
Menus (Dynamic Menus)The menu displayed to theright is a dynamic menu.Word displays the lastseveral files that have beenopened. We can easilyconclude that thisinformation is being readfrom some type of internalfile. Hence, theinformation is dynamic. Themenu would be counted as anexternal inquiry.
Even though the IFPUG Manual explicitly states that menus are notcounted, in this case it is clear that the menu is dynamic and changes.
Copyright Longstreet Consulting Inc. Page 67
Chapter 7
The real distinction is if a menu is dynamic or static. That is,are the contents of the screen or report dynamic (read from some file) or are they static (hard coded).
Page 68 – Revised August 2002

External Inquiries
Skill Builder:The following questions are used to help build on the conceptsdiscussed in this section. They are designed to encouragethought and discussion.
The following customer list is displayed byclicking on the title bar “Customer.” Thefollowing list is displayed (and is read from a file).
If a particular customer is double clicked additional informationis displayed.
Copyright Longstreet Consulting Inc. Page 69
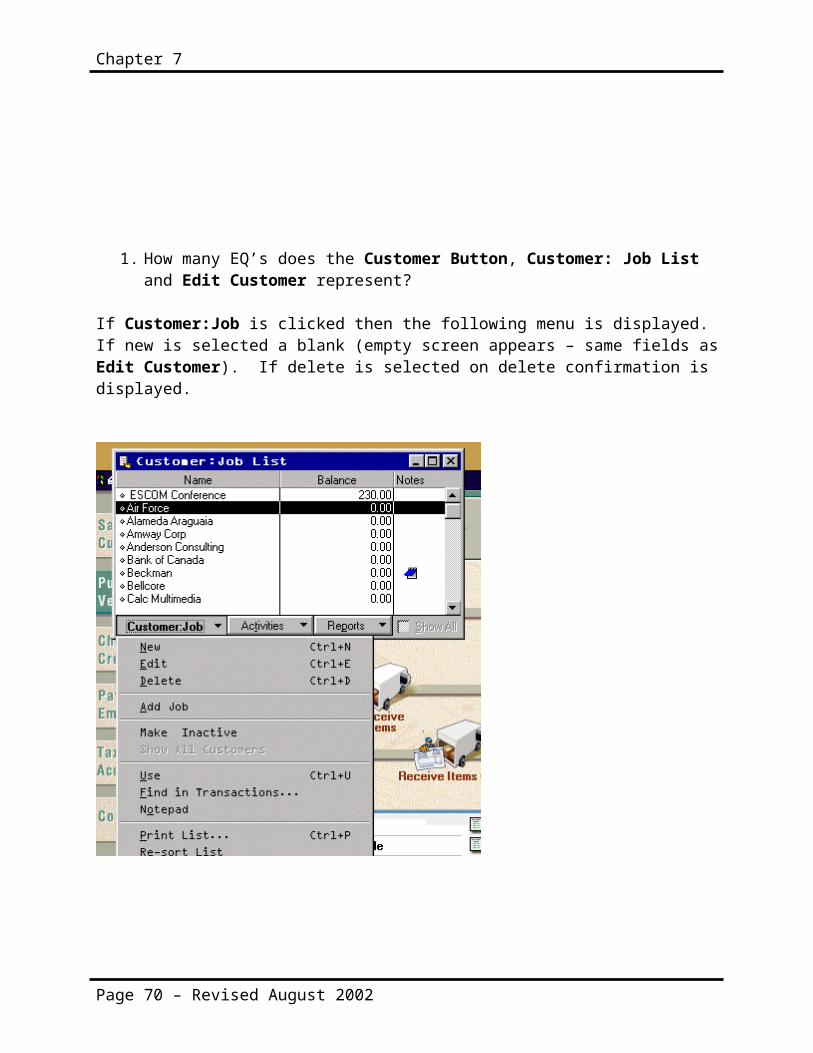
Chapter 7
1. How many EQ’s does the Customer Button, Customer: Job List and Edit Customer represent?
If Customer:Job is clicked then the following menu is displayed. If new is selected a blank (empty screen appears – same fields asEdit Customer). If delete is selected on delete confirmation is displayed.
Page 70 – Revised August 2002
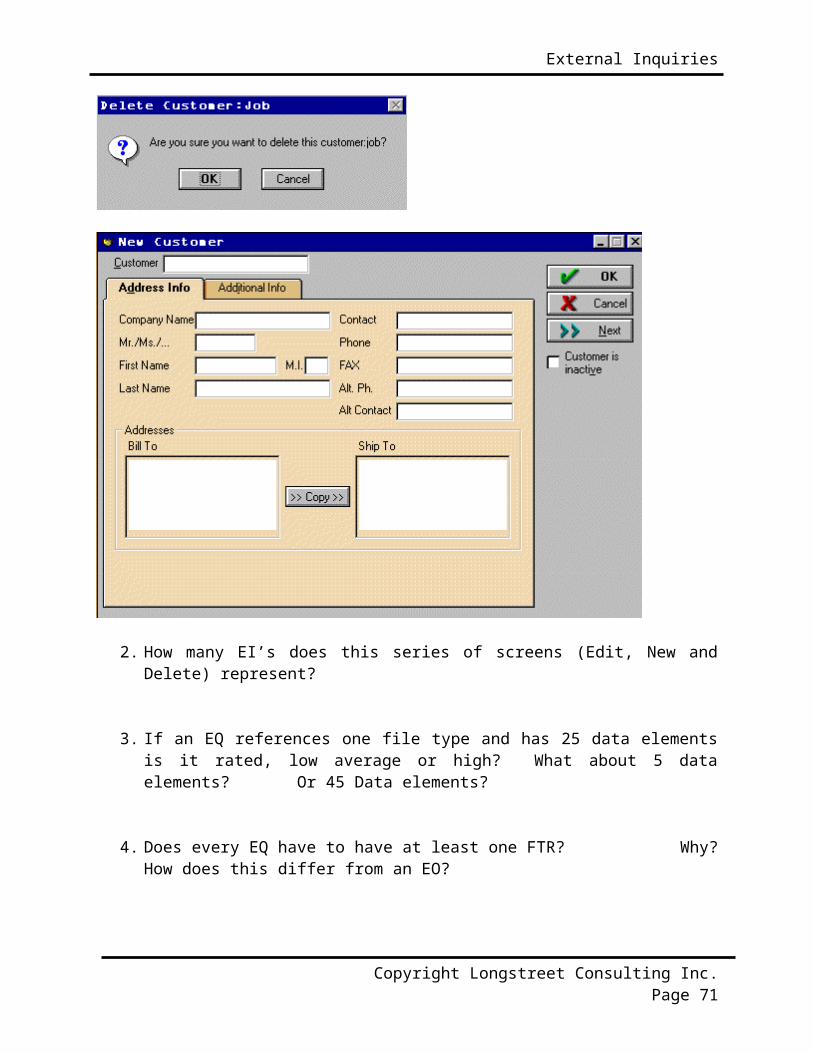
External Inquiries
2. How many EI’s does this series of screens (Edit, New andDelete) represent?
3. If an EQ references one file type and has 25 data elementsis it rated, low average or high? What about 5 dataelements? Or 45 Data elements?
4. Does every EQ have to have at least one FTR? Why?How does this differ from an EO?
Copyright Longstreet Consulting Inc. Page 71

Chapter 7
5. What is the criterion for an EQ to be rated high?
Page 72 – Revised August 2002
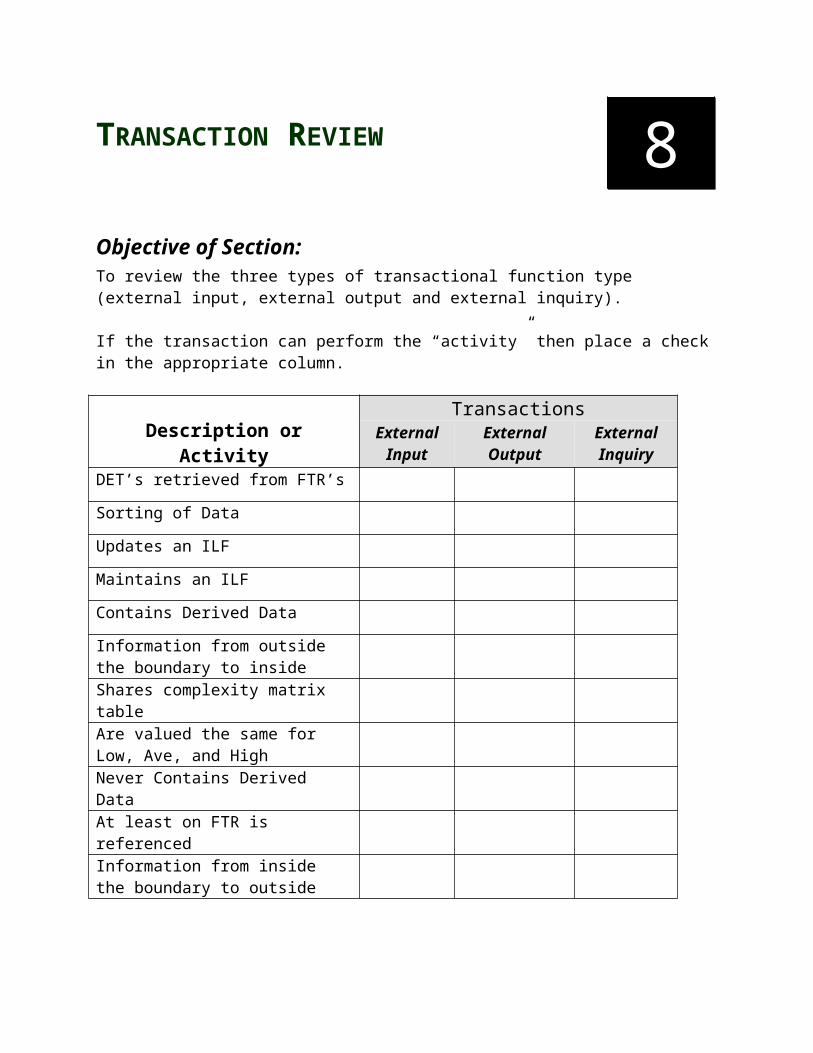
TRANSACTION REVIEW
Objective of Section: To review the three types of transactional function type (external input, external output and external inquiry).
If the transaction can perform the “activity” then place a check in the appropriate column.
Description orActivity
TransactionsExternal
InputExternalOutput
ExternalInquiry
DET’s retrieved from FTR’s
Sorting of Data
Updates an ILF
Maintains an ILF
Contains Derived Data
Information from outside the boundary to insideShares complexity matrix tableAre valued the same for Low, Ave, and HighNever Contains Derived DataAt least on FTR is referencedInformation from inside the boundary to outside
8
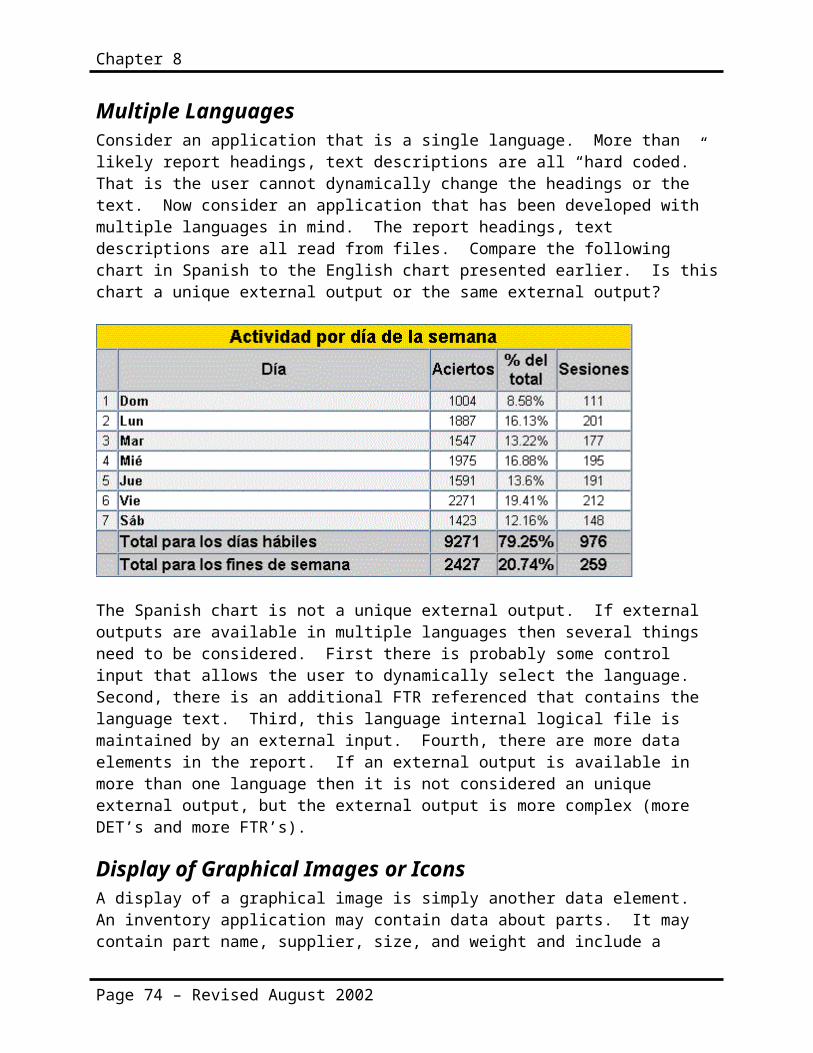
Chapter 8
Multiple LanguagesConsider an application that is a single language. More than likely report headings, text descriptions are all “hard coded.” That is the user cannot dynamically change the headings or the text. Now consider an application that has been developed with multiple languages in mind. The report headings, text descriptions are all read from files. Compare the following chart in Spanish to the English chart presented earlier. Is thischart a unique external output or the same external output?
The Spanish chart is not a unique external output. If external outputs are available in multiple languages then several things need to be considered. First there is probably some control input that allows the user to dynamically select the language. Second, there is an additional FTR referenced that contains the language text. Third, this language internal logical file is maintained by an external input. Fourth, there are more data elements in the report. If an external output is available in more than one language then it is not considered an unique external output, but the external output is more complex (more DET’s and more FTR’s).
Display of Graphical Images or IconsA display of a graphical image is simply another data element. An inventory application may contain data about parts. It may contain part name, supplier, size, and weight and include a
Page 74 – Revised August 2002
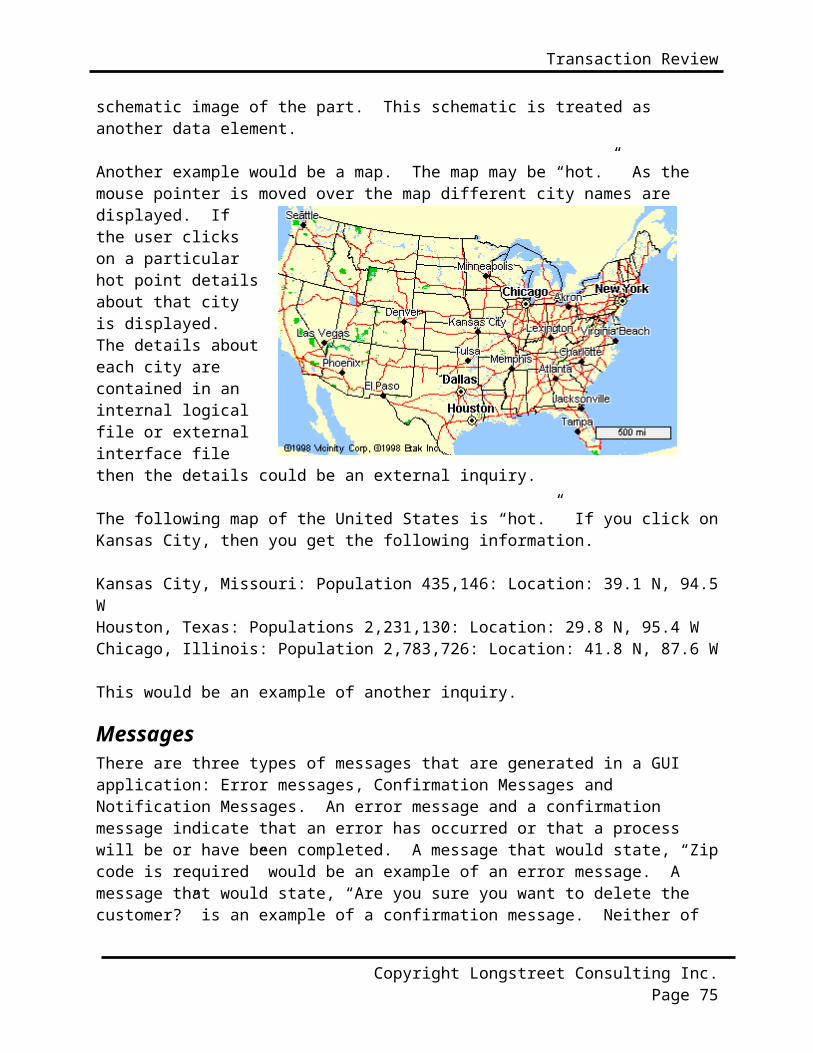
Transaction Review
schematic image of the part. This schematic is treated as another data element.
Another example would be a map. The map may be “hot.” As the mouse pointer is moved over the map different city names are displayed. Ifthe user clickson a particularhot point detailsabout that cityis displayed.The details abouteach city arecontained in aninternal logicalfile or externalinterface filethen the details could be an external inquiry.
The following map of the United States is “hot.” If you click onKansas City, then you get the following information.
Kansas City, Missouri: Population 435,146: Location: 39.1 N, 94.5WHouston, Texas: Populations 2,231,130: Location: 29.8 N, 95.4 WChicago, Illinois: Population 2,783,726: Location: 41.8 N, 87.6 W
This would be an example of another inquiry.
MessagesThere are three types of messages that are generated in a GUI application: Error messages, Confirmation Messages and Notification Messages. An error message and a confirmation message indicate that an error has occurred or that a process will be or have been completed. A message that would state, “Zipcode is required” would be an example of an error message. A message that would state, “Are you sure you want to delete the customer?” is an example of a confirmation message. Neither of
Copyright Longstreet Consulting Inc. Page 75

Chapter 8
these types of messages is treated as a unique External Output, but they are treated as data elements for the appropriate transaction.
On the other hand, a notification messages is a business type message. It is the basis of processing and a conclusion being drawn. For example, you may try to withdraw from an ATM machine more money than you have in your account and you receive the dreaded message, “You have insufficient funds to cover this transaction.” This is the result of information being read from a file regarding your current balance and a conclusion being drawn. A notification message is treated as an External Output.
Notification Messages may be the result of processing and the actual processing or derived data my not be seen. If a message is created to be sent to a pager (beeper) at a given time. This is much like an alarm. That is current time is compared to set time and they are equal the message is sent. The pager message has one data element the text message.
Page 76 – Revised August 2002

Transaction Review
Complex ControlInputs
Control inputs change the behavior of an application or the content of a report. In the “Create Report” control screen, the user has the ability to select which reports are going to be produced. This particular screen has several data element types.The check box, graph type, dimensions elements, sub-items and theaction keys.
Note that the users can choose each reportindividually. In fact each report is as anobject. The generated report is a combinationof several reports (or objects). Each objecthas several attributes.
Hyperlinks on WebPages
Many hyperlinks are nothing more than menus.In this case the meomix.com, dogchow.com arenothing more then links to other pages. Inthis case, they are not treated as an EI, EOor EQ.
Copyright Longstreet Consulting Inc. Page 77
Chapter 8
According to the rules for an external inquiry a request must come from outside the application boundary and information must be displayed from inside to outside the application boundary. A hyperlink is just that – a hyperlink. A hyperlink is navigation to another part of the application or another Internet/Intranet site. No information crosses the boundary.
An external inquiry must reference at least one internal logical file and/or one external interface file. Both an internal logical file and an external interface file must be a logical group of related information. Imagine hyper linking to another Website -- all the information displayed is not a logical group of information.
On the other hand, a hyperlink that sends a parameter that is used to search could be an example of an external inquiry. That is, the hyperlink follows the rules required for an external inquiry. There is an input side (the parameter) and there is an output side the results of the search. In this case the output side is dynamic and changes. This is in sharp contrast to a static hyperlink that navigates to another part of the Website. Hyperlinks that navigate to other parts of a website are nothing more than static menus and should not be considered in function point counting.
Page 78 – Revised August 2002
INTERNAL LOGICAL FILES
Objective of Section:Describe and define the concepts necessary to identify and rateInternal Logical Files. The exercises at the end of the sectionhelp the student demonstrate that they have gained the basicknowledge required.
Definition:Internal Logical Files (ILF) - a user identifiable group of logically related data that resides entirely within the application boundary and is maintained through External Inputs. Maintained isthe process of modifying data (adding, changed and deleting) via an elementary process (via an External Input).
Even though it is not a rule, an ILF should have at least one external output and/or external inquiry. That is, at least one external output and/or external inquiry should include the ILF asan FTR. Simply put, information is stored in an ILF, so it can be used later. The EO or EQ could be from another application. It is worth noting that an ILF may not be referenced by EO or EQ,but may be used by an EI (other than the EI that maintains it).
Again, even though it is not a rule, an ILF should have at least one external input. If an ILF does not have an EI, then one can ask where does the information for the ILF come from? Understanding this relationship improves the thoroughness of the function point count.
Rating:Like all components, ILF’s are rated and valued. The rating is based upon the number of data elements (DET’s) and the record types (RET’s). DET’s and RET’s were discussed earlier. The
9
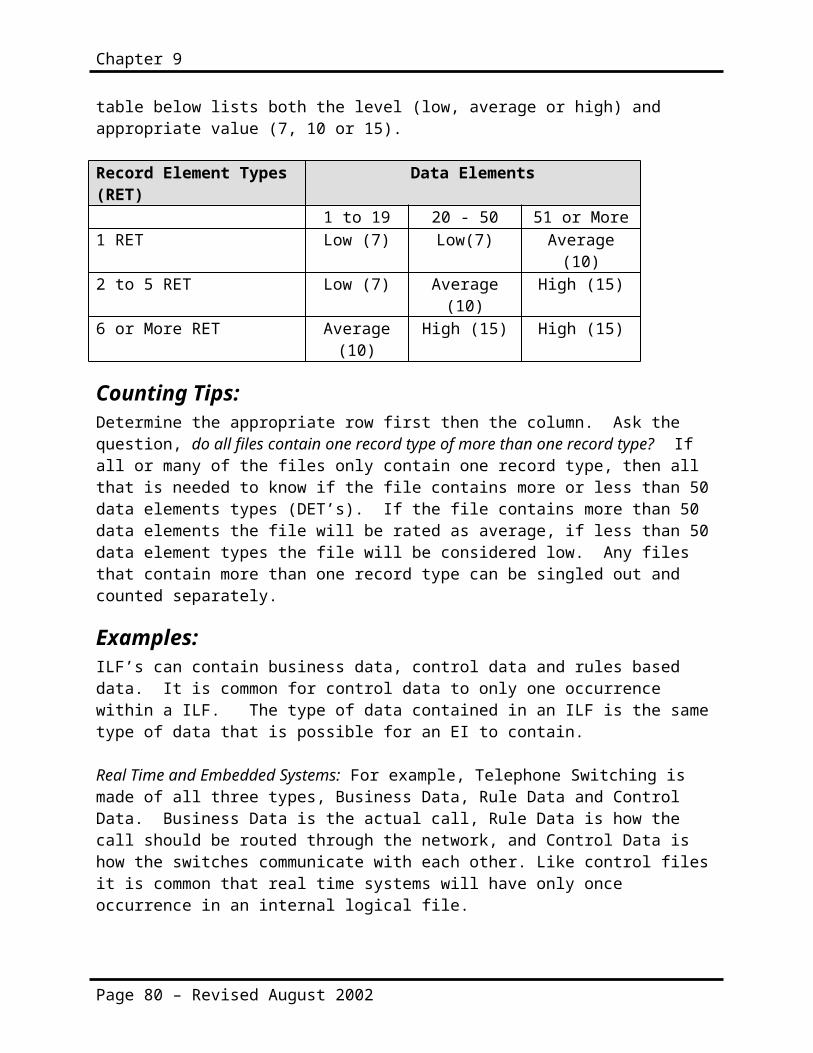
Chapter 9
table below lists both the level (low, average or high) and appropriate value (7, 10 or 15).
Record Element Types (RET)
Data Elements
1 to 19 20 - 50 51 or More1 RET Low (7) Low(7) Average
(10)2 to 5 RET Low (7) Average
(10)High (15)
6 or More RET Average(10)
High (15) High (15)
Counting Tips:Determine the appropriate row first then the column. Ask the question, do all files contain one record type of more than one record type? If all or many of the files only contain one record type, then all that is needed to know if the file contains more or less than 50 data elements types (DET’s). If the file contains more than 50 data elements the file will be rated as average, if less than 50 data element types the file will be considered low. Any files that contain more than one record type can be singled out and counted separately.
Examples:ILF’s can contain business data, control data and rules based data. It is common for control data to only one occurrence within a ILF. The type of data contained in an ILF is the same type of data that is possible for an EI to contain.
Real Time and Embedded Systems: For example, Telephone Switching is made of all three types, Business Data, Rule Data and Control Data. Business Data is the actual call, Rule Data is how the call should be routed through the network, and Control Data is how the switches communicate with each other. Like control files it is common that real time systems will have only once occurrence in an internal logical file.
Page 80 – Revised August 2002
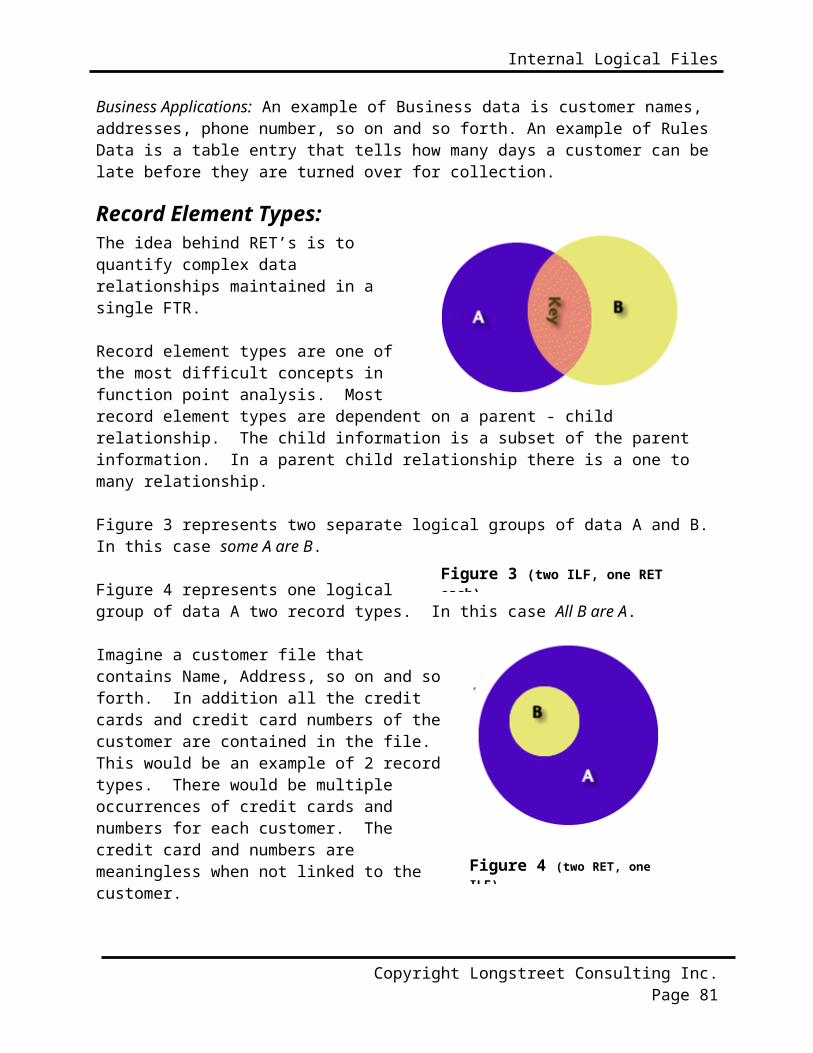
Internal Logical Files
Business Applications: An example of Business data is customer names, addresses, phone number, so on and so forth. An example of Rules Data is a table entry that tells how many days a customer can be late before they are turned over for collection.
Record Element Types:The idea behind RET’s is toquantify complex datarelationships maintained in asingle FTR.
Record element types are one ofthe most difficult concepts infunction point analysis. Mostrecord element types are dependent on a parent - child relationship. The child information is a subset of the parent information. In a parent child relationship there is a one to many relationship.
Figure 3 represents two separate logical groups of data A and B. In this case some A are B.
Figure 4 represents one logicalgroup of data A two record types. In this case All B are A.
Imagine a customer file thatcontains Name, Address, so on and soforth. In addition all the creditcards and credit card numbers of thecustomer are contained in the file. This would be an example of 2 recordtypes. There would be multipleoccurrences of credit cards andnumbers for each customer. Thecredit card and numbers aremeaningless when not linked to thecustomer.
Copyright Longstreet Consulting Inc. Page 81
Figure 3 (two ILF, one RET each)
Figure 4 (two RET, one ILF)

Chapter 9
Additionally, a short article, Understanding RET’s can be found at www.SoftwareMetrics.Com/Articles.
Data Element Types:Count a DET’s for each unique user recognizable, nonrecursive field on the ILF or EIF. Fields that are redundant and appear more than one time are only counted one time. Fields that are redundant because of implementation concerns are counted only onetime.
Count a DET’s for each piece of data in an ILF or EIF that existsbecause the user requires a relationship with another ILF to be maintained (key information). If an EIF has multiple key fields only the key fields that relate back to an ILF are counted as data element types.
Technology Issues:Lotus Notes refers to data stores as “forms.” PowerbuilderApplications may store information on the host or client. Countit only one time. COBOL Applications may use a variety of datastores such as IMS, DB2 etc.… It is important to view data fromthe “logical model.”
In Internet applications an html can be a data store if it ismaintained.
Standard Documentation: Table Layouts Database descriptions Logical data models Field sizes and formats Design Documentation Functional Specifications User Requirements
Page 82 – Revised August 2002

Internal Logical Files
Tips to Identify ILF’s early in the life cycle:The following types of documentation can be used to assist in counting internal logical files prior to system implementation.
Any refined objectives and constraints for the proposed system.
Collected documentation regarding the current system, if such a system (either automated or manual) exits.
Documentation of the users’ perceived objectives, problems andneeds.
Preliminary Data Models.
Understanding Enhancement Function Points:If of the any DET’s or RET’s within an ILF that were previously counted (during the application count) are modified, then the ILFwould be part of the enhancement function point count (EFP).
If a new transaction includes the ILF as an FTR, then the ILF is not considered part of enhancement function point count (EFP). This assumes that the ILF is going to be used as is and no modifications were made to the ILF.
If any new ILF’s are created, then the ILF is considered part of the enhancement count. Additionally, any transactions that reference this new ILF (as and FTR) need to be included in the enhancement function point count.
Discussion of Enhanced Function Point Count can be found on page114 of this document.
Other comments:Code maintenance may not be maintained by the application and they may not be maintained by any other application, but they exist. The issue is that these same tables may be used by external inquiries. A strict interpretation of the rules would
Copyright Longstreet Consulting Inc. Page 83
Chapter 9
not allow the inquiries to be counted. It is recommended that this type of tables be treated as external interface file.
Skill Builder:The following questions are used to help build on the concepts discussed in this section. They are designed to encourage thought and discussion.
1. If a single internal logical file is separated into 3 physical files because of implementation concerns, then how many internal logical files are counted?
2. A logical group of data is best described as?
3. If an ILF has one record type and 25 data elements is it rated, low average or high? What about 5 data elements? Or 45 Data elements?
4. Does every ILF have to have at least one EI? Why?
5. Should every ILF have at least one external output or external inquiry? Why?
6. What are the criteria for an ILF to be rated high?
7. Fill in the “value” of a low ____ average ____ and high ____ILF? How does this compare to an EIF? Why the difference?
Page 84 – Revised August 2002

Internal Logical Files
Examine the following tables. The user requires detail information about customers and sales representatives.
1. How many internal logical files?
2. How many data elements? Is there more than one recordtype?
3. Can the tables be formed to combine one internal logical file?
Customer Table
CustomerNumber
Name Address City State
Zip Code
Balance
CreditLimit
Sales Rep Number
AN91 AtwaterNelson
215 Watkins
Oakdale IN 48101
$347 $700 04
AW52 Alliance West
266 Ralston
Allanson
IN 48102
$49 $400 07
BD22 Betodial
542 Prairie
Oakdale IN 48101
$57 $400 07
CE76 Carson Enterprise
96 Prospect
Bishop IL 61354
$425 $900 11
Sales Representative Table
Sales Rep Number
Last Name
FirstName
Address City State
Zip Code
Area Manager Number
04 Right Mike 95 Stockton
Oakdale
IN 48101 14
05 Perry Tom 198 Pearl
Oakdale
IN 48101 17
07 Sanchez
Rachel
867 Bedford
Benson MI 49246 17
11 Morris Katie 96 Prospect
Bishop IL 61354 21
Copyright Longstreet Consulting Inc. Page 85

Chapter 9
Page 86 – Revised August 2002
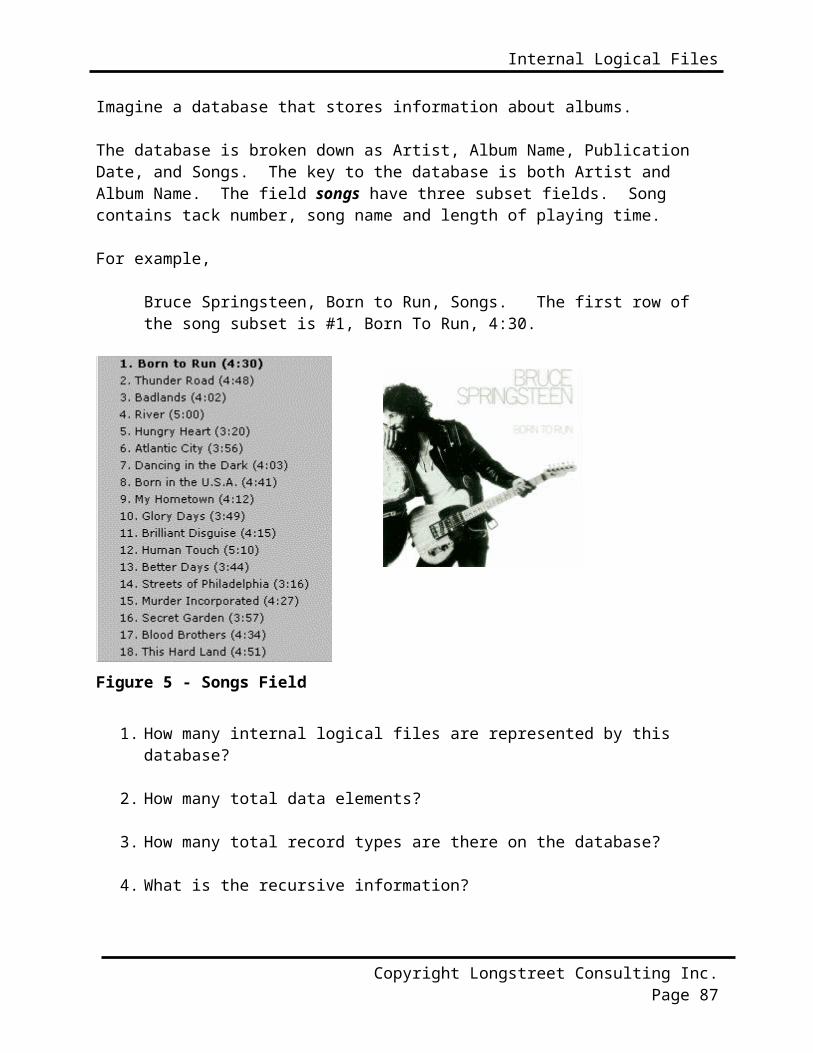
Internal Logical Files
Imagine a database that stores information about albums.
The database is broken down as Artist, Album Name, Publication Date, and Songs. The key to the database is both Artist and Album Name. The field songs have three subset fields. Song contains tack number, song name and length of playing time.
For example,
Bruce Springsteen, Born to Run, Songs. The first row of the song subset is #1, Born To Run, 4:30.
Figure 5 - Songs Field
1. How many internal logical files are represented by this database?
2. How many total data elements?
3. How many total record types are there on the database?
4. What is the recursive information?
Copyright Longstreet Consulting Inc. Page 87
EXTERNAL INTERFACE FILES
Objective of Section:Describe and define the concepts necessary to identify and rateExternal Interface Files. The exercises at the end of the sectionhelp the student demonstrate that they have gained the basicknowledge required.
Definition:External Interface Files (EIF) - a user identifiable group of logically related data that is used for reference purposes only. The data resides entirely outside the application boundary and is maintained by another applications external inputs. The externalinterface file is an internal logical file for another application.
Each EIF included must have at least one transaction, external input, external output or external inquiry against it. In other words there must at least one transaction that includes the EIF as a FTR. If the EIF does not have one transaction, then one must wonder what is the purpose of the EIF and how was the information retrieved.
Understanding the interrelationships between the five components (EI, EO, EQ, ILF and EIF) will help improve the accuracy of function point counts.
Rating:Like all components, EIF’s are rated and valued. The rating is based upon the number of data elements (DET’s) and the record types (RET’s). DET’s and RET’s are discussed later in this section and in the ILF section on page 81. The table below lists both the level (low, average or high) and appropriate value(5, 7 or 10 unadjusted function points).
10
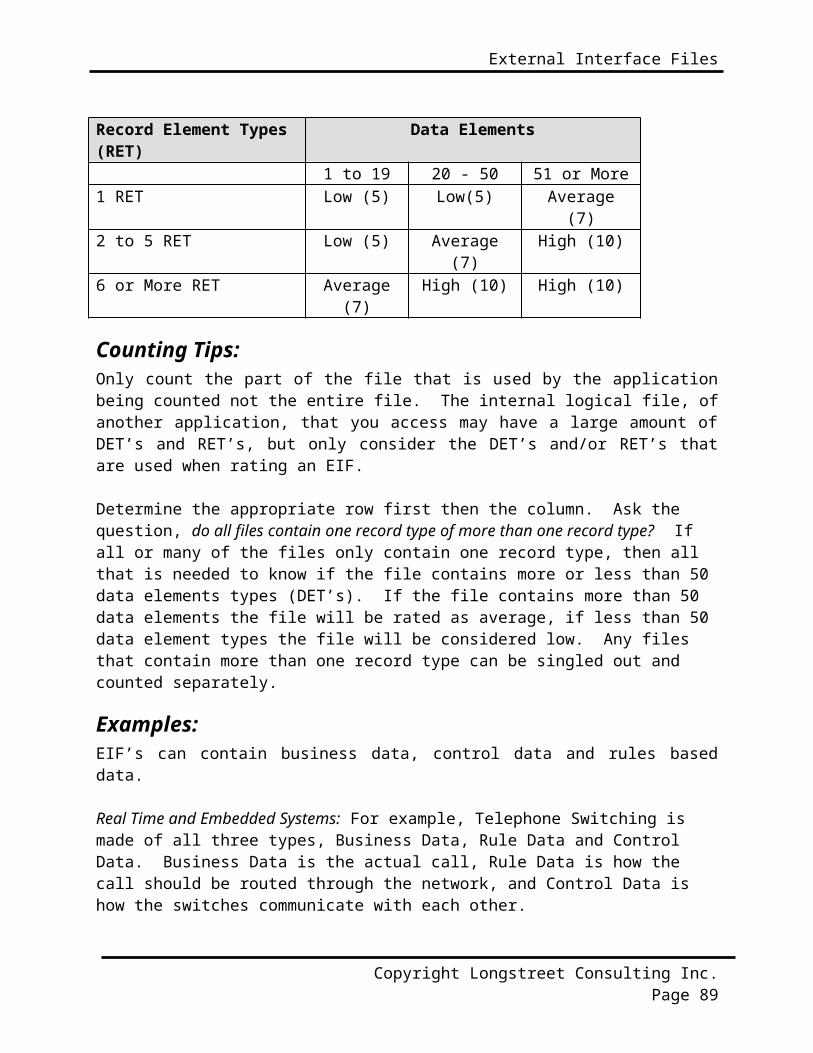
External Interface Files
Record Element Types (RET)
Data Elements
1 to 19 20 - 50 51 or More1 RET Low (5) Low(5) Average
(7)2 to 5 RET Low (5) Average
(7)High (10)
6 or More RET Average(7)
High (10) High (10)
Counting Tips:Only count the part of the file that is used by the applicationbeing counted not the entire file. The internal logical file, ofanother application, that you access may have a large amount ofDET’s and RET’s, but only consider the DET’s and/or RET’s thatare used when rating an EIF.
Determine the appropriate row first then the column. Ask the question, do all files contain one record type of more than one record type? If all or many of the files only contain one record type, then all that is needed to know if the file contains more or less than 50 data elements types (DET’s). If the file contains more than 50 data elements the file will be rated as average, if less than 50 data element types the file will be considered low. Any files that contain more than one record type can be singled out and counted separately.
Examples:EIF’s can contain business data, control data and rules baseddata.
Real Time and Embedded Systems: For example, Telephone Switching is made of all three types, Business Data, Rule Data and Control Data. Business Data is the actual call, Rule Data is how the call should be routed through the network, and Control Data is how the switches communicate with each other.
Copyright Longstreet Consulting Inc. Page 89
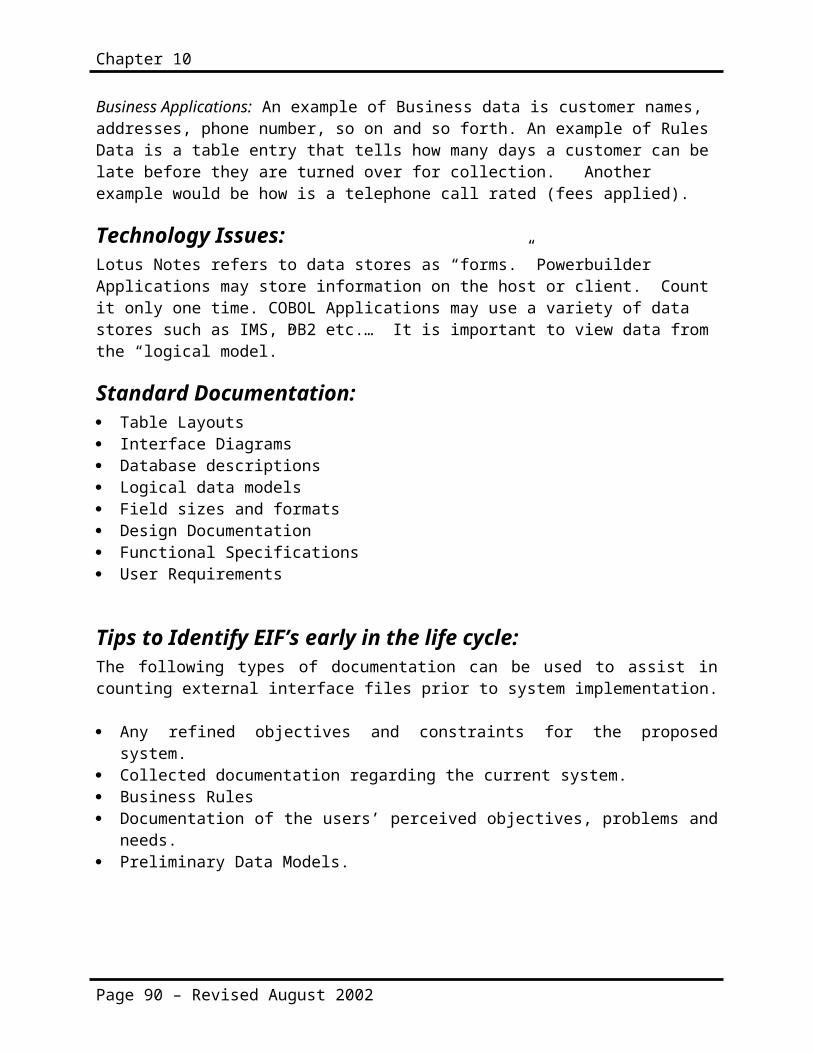
Chapter 10
Business Applications: An example of Business data is customer names, addresses, phone number, so on and so forth. An example of Rules Data is a table entry that tells how many days a customer can be late before they are turned over for collection. Another example would be how is a telephone call rated (fees applied).
Technology Issues:Lotus Notes refers to data stores as “forms.” Powerbuilder Applications may store information on the host or client. Count it only one time. COBOL Applications may use a variety of data stores such as IMS, DB2 etc.… It is important to view data from the “logical model.”
Standard Documentation: Table Layouts Interface Diagrams Database descriptions Logical data models Field sizes and formats Design Documentation Functional Specifications User Requirements
Tips to Identify EIF’s early in the life cycle:The following types of documentation can be used to assist incounting external interface files prior to system implementation.
Any refined objectives and constraints for the proposedsystem.
Collected documentation regarding the current system. Business Rules Documentation of the users’ perceived objectives, problems and
needs. Preliminary Data Models.
Page 90 – Revised August 2002

External Interface Files
Understanding Enhancement Function Points:When evaluating an EIF, only those DET’s and RET’s that are used are considered. If an enhanced or new transaction includes DET’sand/or RET’s that were not previously included in the applicationfunction point count, then consider the EIF modified and include it in the enhancement function point count (EFP).
If a new transaction includes the same DET’s as existing transactions (those that were part of the baseline or applicationcount), then the EIF would not be included in the enhancement function point count (EFP). The new transaction would be included in the enhancement function point count, but not the EIF.
Since an EIF is an ILF for another application, it is possible for the EIF to be modified by its “mother” application. That means additional DET’s and/or RET’s can be added. It is possibleto make modifications to the EIF (by the mother application) and have no impact on any of the transactions that include the EIF asan FTR. If there are modifications to the EIF that impacts the transactions that included the EIF as an FTR, then all those transactions need to be included in the enhancement function point count (EFP).
Discussion of Enhanced Function Point Count can be found on page114 of this document.
Copyright Longstreet Consulting Inc. Page 91

GENERAL SYSTEM CHARACTERISTICS
Objective of Section:Describe and define the concepts necessary to rate the General System Characteristics (GSC’s) to determine the overall Value Adjustment Factor (VAF). Multiplying the VAF by the unadjusted function point count equals the “adjusted function point count.” Up to this point in time only the unadjusted function point counthas been discussed.
More and more organizations are not applying the VAF, but are using the unadjusted function point count with other metrics. If an organization develops software in a homogenous environment,then the GSC will become fixed (or a constant). An organization should experiment to see which provides a better predictor of effort adjusted or unadjusted function points.
The exercises at the end of the section help the student demonstrate that they have gained the basic knowledge required.
Definition:The value adjustment factor (VAF) is based on 14 general system characteristics (GSC’s) that rate the general functionality of the application being counted. Each characteristic has associated descriptions that help determine the degrees of influence of the characteristics.
Rating:The degrees of influence range on a scale of zero to five, fromno influence to strong influence. Each characteristic isassigned the rating based upon detail descriptions provided bythe IFPUG 4.1 Manual. The ratings are:
0 Not present, or no influence
11

General System Characteristics
1 Incidental influence 2 Moderate influence 3 Average influence 4 Significant influence 5 Strong influence throughout
Standard Documentation: General Specification Documents Interviews with the users
Rating GSC’s early in the life cycle:GSC’s can be rated relative early in the software life cycle. Infact, if a user cannot answer these fourteen questions, then theentire project needs to be re-evaluated.
Copyright Longstreet Consulting Inc. Page 93

Chapter 11
Tabulating:Once all the 14 GSC’s have been answered, they should betabulated using the IFPUG Value Adjustment Equation (VAF) --
14 where: Ci = degree of influence for each General SystemCharacteristicVAF = 0.65 + [( å Ci) / 100] .i = is from 1 to 14 representing each GSC.
i =1 å = is summation of all 14 GSC’s.
Another way to understand the formula is VAF = (65 + TDI)/100, where TDI is the sum of the results from each question. A Microsoft Excel formula would be: =0.65+SUM(A1:A14)/100 ; assuming that the values for the characteristics were in cells A1– A14.
GSC’s at a Glance:
General System Characteristic
Brief Description
1. Data communications
How many communication facilitiesare there to aid in the transferor exchange of information withthe application or system?
2. Distributed data processing
How are distributed data andprocessing functions handled?
3. Performance Did the user require responsetime or throughput?
4. Heavily used configuration
How heavily used is the currenthardware platform where theapplication will be executed?
5. Transaction rate How frequently are transactionsexecuted daily, weekly, monthly,etc.?
6. On-Line data entry What percentage of theinformation is entered On-Line?
7. End-user efficiency
Was the application designed forend-user efficiency?
8. On-Line update How many ILF’s are updated by On-
Page 94 – Revised August 2002

General System Characteristics
Line transaction?9. Complex processing Does the application have
extensive logical or mathematicalprocessing?
10.
Reusability Was the application developed tomeet one or many user’s needs?
11.
Installation ease How difficult is conversion andinstallation?
12.
Operational ease How effective and/or automatedare start-up, back up, andrecovery procedures?
13.
Multiple sites Was the application specificallydesigned, developed, andsupported to be installed atmultiple sites for multipleorganizations?
14.
Facilitate change Was the application specificallydesigned, developed, andsupported to facilitate change?
Considerations for GUI ApplicationsGSC items such as Transaction Rates, End User Efficiency, On LineUpdate, and Reusability usually value higher for GUI applicationsthan on traditional applications. On the other hand,Performance, Heavily used configuration, multiple sites, willvalue lower for GUI applications than traditional applications.
Copyright Longstreet Consulting Inc. Page 95

Chapter 11
Detail GSC’s:
The data and control information used in the application are sent or received over communication facilities. Terminals connected locally to the control unit are considered to use communication facilities. Protocol is a set of conventions, which permit the transfer, or exchange of information between two systems or devices. All data communication links require some type of protocol.
Value As
Descriptions to Determine Degree of Influence
0 Application is pure batch processing or astandalone PC.
1 Application is batch but has remote data entry or remote printing.
2 Application is batch but has remote data entry and remote printing.
3 Application includes online data collection or TP (teleprocessing) front end to a batch process or query system.
4 Application is more than a front-end, butsupports only one type of TP communications protocol.
5 Application is more than a front-end, andsupports more than one type of TP communications protocol.
Comments:TCP/IP (Transmission Control Protocol/Internet Protocol). TCP/IP provides a common language for interoperation between networks that use a variety of local protocols (Ethernet, Netware, AppleTalk, DECnet and others) are examples of TP.An application that allows query of application via a web based solution and local access would receive a value of 3.An application that allows for the update of ILF’s via the Internet and local update would receive a value of a 5.
Page 96 – Revised August 2002
1. Data Communications

General System Characteristics
Distributed data or processing functions are a characteristic of the application within the application boundary.
Value As
Descriptions To Determine Degree of Influence
0 Application does not aid the transfer of data or processing function between components of the system.
1 Application prepares data for end user processing on another component of the system such as PC spreadsheets and PC DBMS.
2 Data is prepared for transfer, then is transferred and processed on another component of the system (not for end-userprocessing).
3 Distributed processing and data transfer are online and in one direction only.
4 Distributed processing and data transfer are online and in both directions.
5 Processing functions are dynamically performed on the most appropriate component of the system.
Comments:Copying files from a mainframe to a local PC or copy files from an Internet or intranet would receive a value of 2.Reading via a client or via Internet or intranet would receive a value of 3.Reading and updating via Internet or intranet would receive a value of 4.Depending on available resources, the application processes either local, on server, on intranet or Internet application would receive a value of 5.
Copyright Longstreet Consulting Inc. Page 97
2. Distributed Data Processing

Chapter 11
Application performance objectives, stated or approved by the user, in either response or throughput, influence (or will influence) the design, development, installation, and support of the application.
Value As
Descriptions To Determine Degree of Influence
0 No special performance requirements were stated by the user.
1 Performance and design requirements were stated and reviewed but no special actions were required.
2 Response time or throughput is critical during peak hours. No special design forCPU utilization was required. Processingdeadline is for the next business day.
3 Response time or throughput is critical during all business hours. No special design for CPU utilization was required. Processing deadline requirements with interfacing systems are constraining.
4 In addition, stated user performance requirements are stringent enough to require performance analysis tasks in thedesign phase.
5 In addition, performance analysis tools were used in the design, development, and/or implementation phases to meet the stated user performance requirements.
Comments:Again for a client/server or for internet/intranet application this remains the same.
Page 98 – Revised August 2002
3. Performance

General System Characteristics
A heavily used operational configuration, requiring special design considerations, is a characteristic of the application. For example, the user wants to run the application on existing orcommitted equipment that will be heavily used
Value As
Descriptions To Determine Degree of Influence
0 No explicit or implicit operational restrictions are included.
1 Operational restrictions do exist, but are less restrictive than a typical application. No special effort is needed to meet the restrictions.
2 Some security or timing considerations are included.
3 Specific processor requirements for a specific piece of the application are included.
4 Stated operation restrictions require special constraints on the application inthe central processor or a dedicated processor.
5 In addition, there are special constraints on the application in the distributed components of the system.
CommentsDoes this application share hardware that is busy?. For example,an application that shares a server with 5 other applications would need to be optimized because it shares resources with 4 other applications.
Copyright Longstreet Consulting Inc. Page 99
4. Heavily Used Configuration
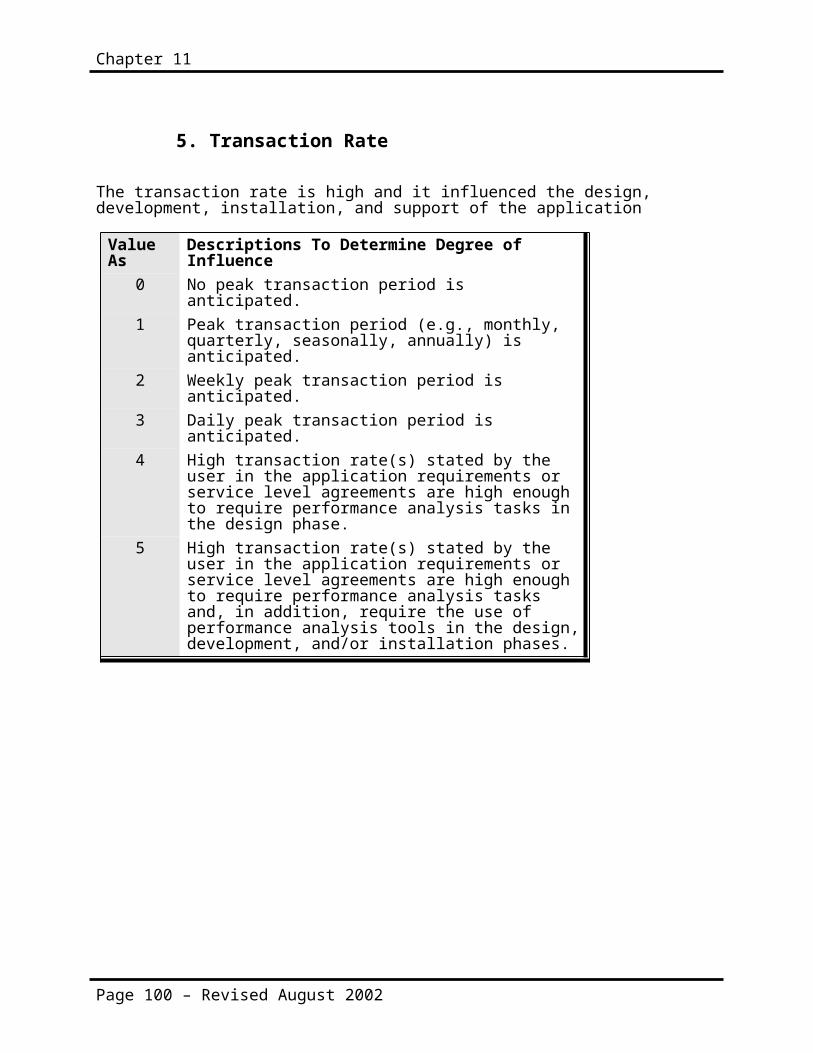
Chapter 11
The transaction rate is high and it influenced the design, development, installation, and support of the application
Value As
Descriptions To Determine Degree of Influence
0 No peak transaction period is anticipated.
1 Peak transaction period (e.g., monthly, quarterly, seasonally, annually) is anticipated.
2 Weekly peak transaction period is anticipated.
3 Daily peak transaction period is anticipated.
4 High transaction rate(s) stated by the user in the application requirements or service level agreements are high enough to require performance analysis tasks in the design phase.
5 High transaction rate(s) stated by the user in the application requirements or service level agreements are high enough to require performance analysis tasks and, in addition, require the use of performance analysis tools in the design,development, and/or installation phases.
Page 100 – Revised August 2002
5. Transaction Rate

General System Characteristics
Online data entry and control functions are provided in the application.
Value As
Descriptions To Determine Degree of Influence
0 All transactions are processed in batch mode.
1 1% to 7% of transactions are interactive data entry.
2 8% to 15% of transactions are interactivedata entry.
3 16% to 23% of transactions are interactive data entry.
4 24% to 30% of transactions are interactive data entry.
5 More than 30% of transactions are interactive data entry.
Copyright Longstreet Consulting Inc. Page 101
6. Online Data Entry
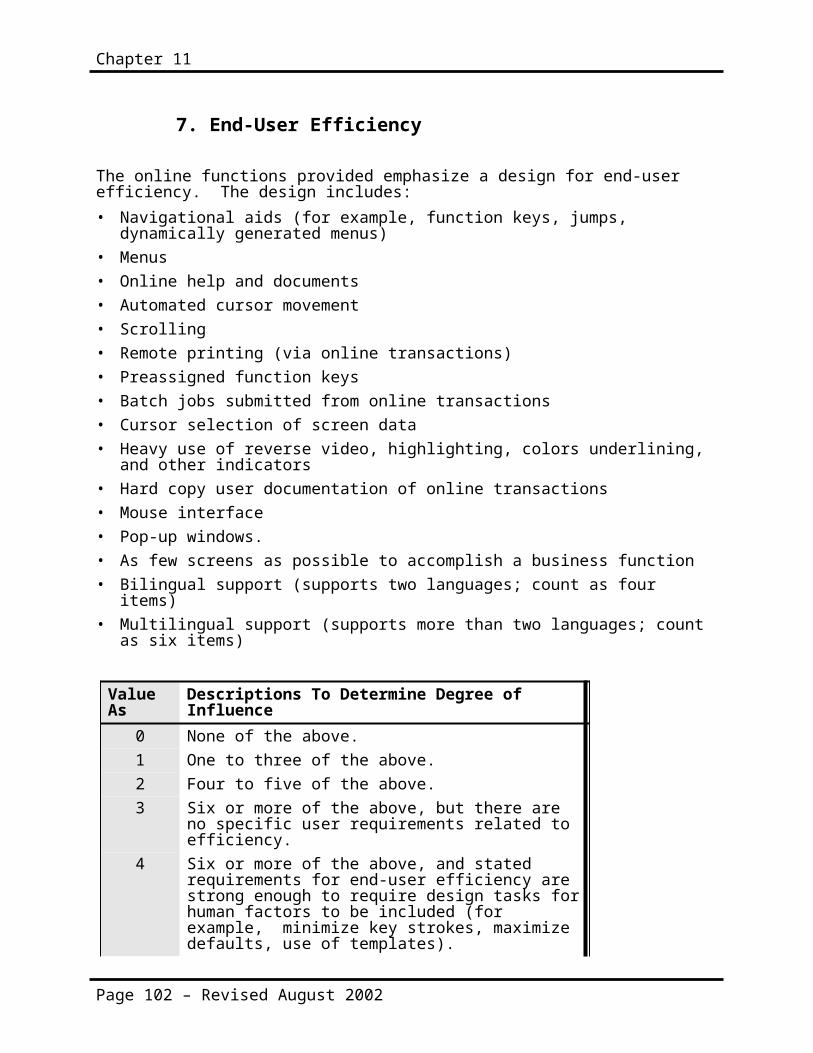
Chapter 11
The online functions provided emphasize a design for end-user efficiency. The design includes:• Navigational aids (for example, function keys, jumps,
dynamically generated menus)• Menus• Online help and documents• Automated cursor movement• Scrolling• Remote printing (via online transactions)• Preassigned function keys• Batch jobs submitted from online transactions• Cursor selection of screen data• Heavy use of reverse video, highlighting, colors underlining,
and other indicators• Hard copy user documentation of online transactions• Mouse interface• Pop-up windows.• As few screens as possible to accomplish a business function• Bilingual support (supports two languages; count as four
items)• Multilingual support (supports more than two languages; count
as six items)
Value As
Descriptions To Determine Degree of Influence
0 None of the above.1 One to three of the above.2 Four to five of the above.3 Six or more of the above, but there are
no specific user requirements related to efficiency.
4 Six or more of the above, and stated requirements for end-user efficiency are strong enough to require design tasks forhuman factors to be included (for example, minimize key strokes, maximize defaults, use of templates).
Page 102 – Revised August 2002
7. End-User Efficiency
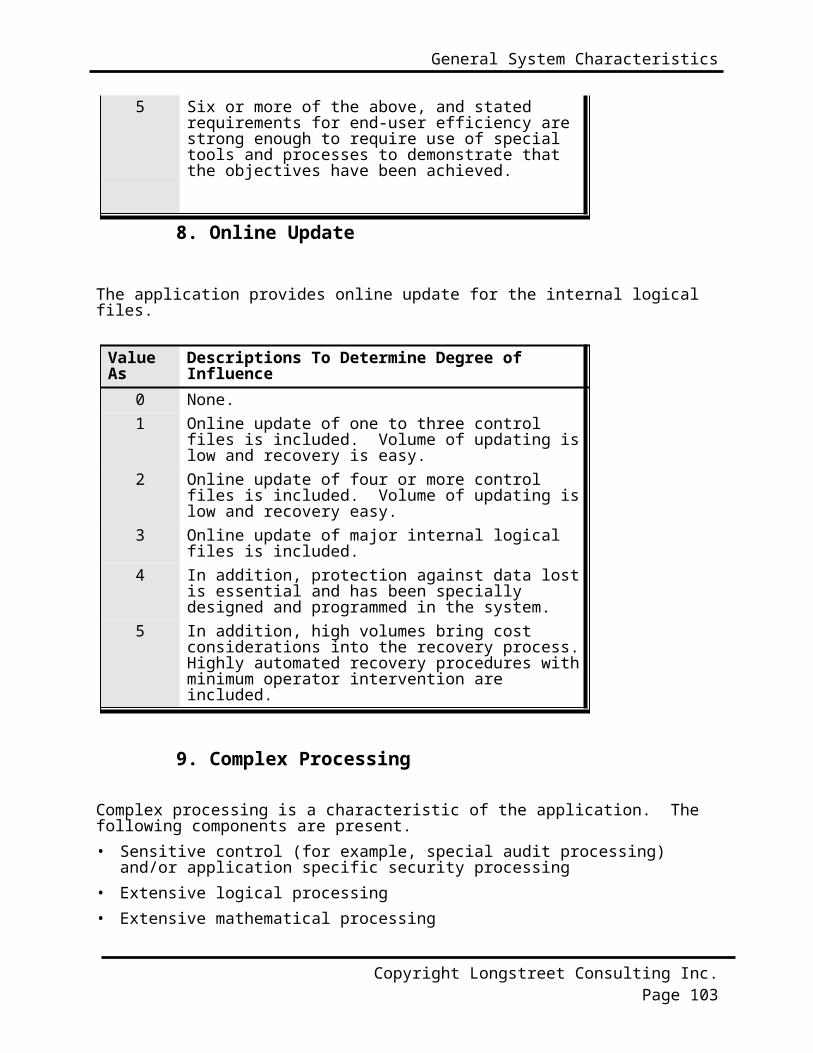
General System Characteristics
5 Six or more of the above, and stated requirements for end-user efficiency are strong enough to require use of special tools and processes to demonstrate that the objectives have been achieved.
The application provides online update for the internal logical files.
Value As
Descriptions To Determine Degree of Influence
0 None.1 Online update of one to three control
files is included. Volume of updating islow and recovery is easy.
2 Online update of four or more control files is included. Volume of updating islow and recovery easy.
3 Online update of major internal logical files is included.
4 In addition, protection against data lostis essential and has been specially designed and programmed in the system.
5 In addition, high volumes bring cost considerations into the recovery process.Highly automated recovery procedures withminimum operator intervention are included.
Complex processing is a characteristic of the application. The following components are present.• Sensitive control (for example, special audit processing)
and/or application specific security processing• Extensive logical processing• Extensive mathematical processing
Copyright Longstreet Consulting Inc. Page 103
8. Online Update
9. Complex Processing
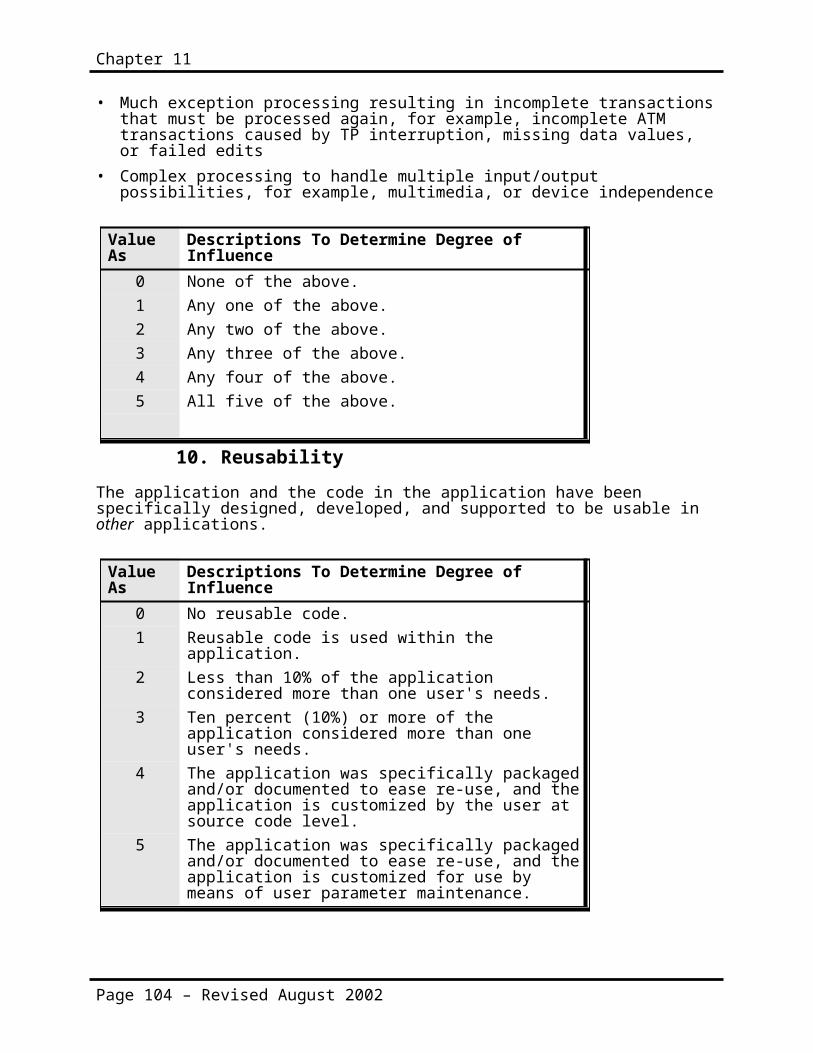
Chapter 11
• Much exception processing resulting in incomplete transactionsthat must be processed again, for example, incomplete ATM transactions caused by TP interruption, missing data values, or failed edits
• Complex processing to handle multiple input/output possibilities, for example, multimedia, or device independence
Value As
Descriptions To Determine Degree of Influence
0 None of the above.1 Any one of the above.2 Any two of the above.3 Any three of the above.4 Any four of the above.5 All five of the above.
The application and the code in the application have been specifically designed, developed, and supported to be usable in other applications.
Value As
Descriptions To Determine Degree of Influence
0 No reusable code.1 Reusable code is used within the
application.2 Less than 10% of the application
considered more than one user's needs.3 Ten percent (10%) or more of the
application considered more than one user's needs.
4 The application was specifically packagedand/or documented to ease re-use, and theapplication is customized by the user at source code level.
5 The application was specifically packagedand/or documented to ease re-use, and theapplication is customized for use by means of user parameter maintenance.
Page 104 – Revised August 2002
10. Reusability
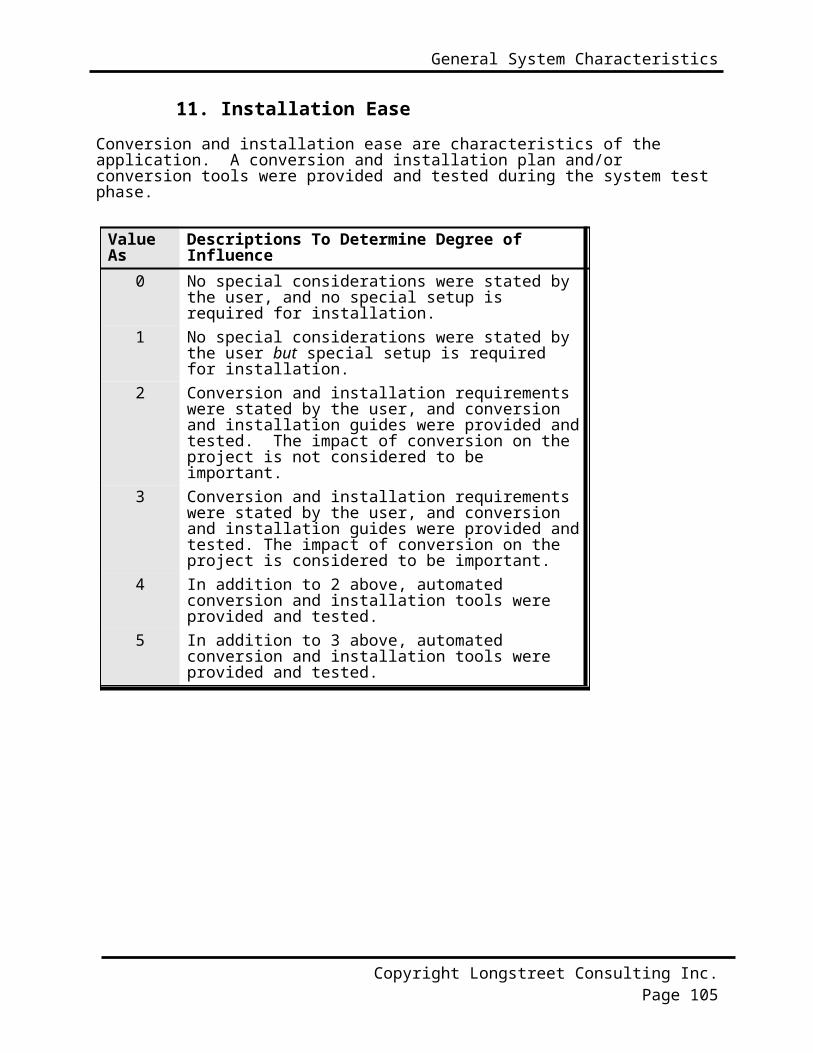
General System Characteristics
Conversion and installation ease are characteristics of the application. A conversion and installation plan and/or conversion tools were provided and tested during the system test phase.
Value As
Descriptions To Determine Degree of Influence
0 No special considerations were stated by the user, and no special setup is required for installation.
1 No special considerations were stated by the user but special setup is required for installation.
2 Conversion and installation requirements were stated by the user, and conversion and installation guides were provided andtested. The impact of conversion on the project is not considered to be important.
3 Conversion and installation requirements were stated by the user, and conversion and installation guides were provided andtested. The impact of conversion on the project is considered to be important.
4 In addition to 2 above, automated conversion and installation tools were provided and tested.
5 In addition to 3 above, automated conversion and installation tools were provided and tested.
Copyright Longstreet Consulting Inc. Page 105
11. Installation Ease

Chapter 11
Operational ease is characteristic of the application. Effectivestart-up, back-up, and recovery procedures were provided and tested during the system test phase. The application minimizes the need for manual activities, such as tape mounts, paper handling, and direct on-location manual intervention.
Value As
Descriptions To Determine Degree of Influence
0 No special operational considerations other than the normal back-up procedures were stated by the user.
1 - 4 One, some, or all of the following items apply to the application. Select all that apply. Each item has a point value of one, except as noted otherwise.Effective start-up, back-up, and recoveryprocesses were provided, but operator intervention is required.Effective start-up, back-up, and recoveryprocesses were provided, but no operator intervention is required (count as two items).The application minimizes the need for tape mounts.The application minimizes the need for paper handling.
5 The application is designed for unattended operation. Unattended operation means no operator intervention is required to operate the system other thanto start up or shut down the application.Automatic error recovery is a feature of the application.
Page 106 – Revised August 2002
12. Operational Ease
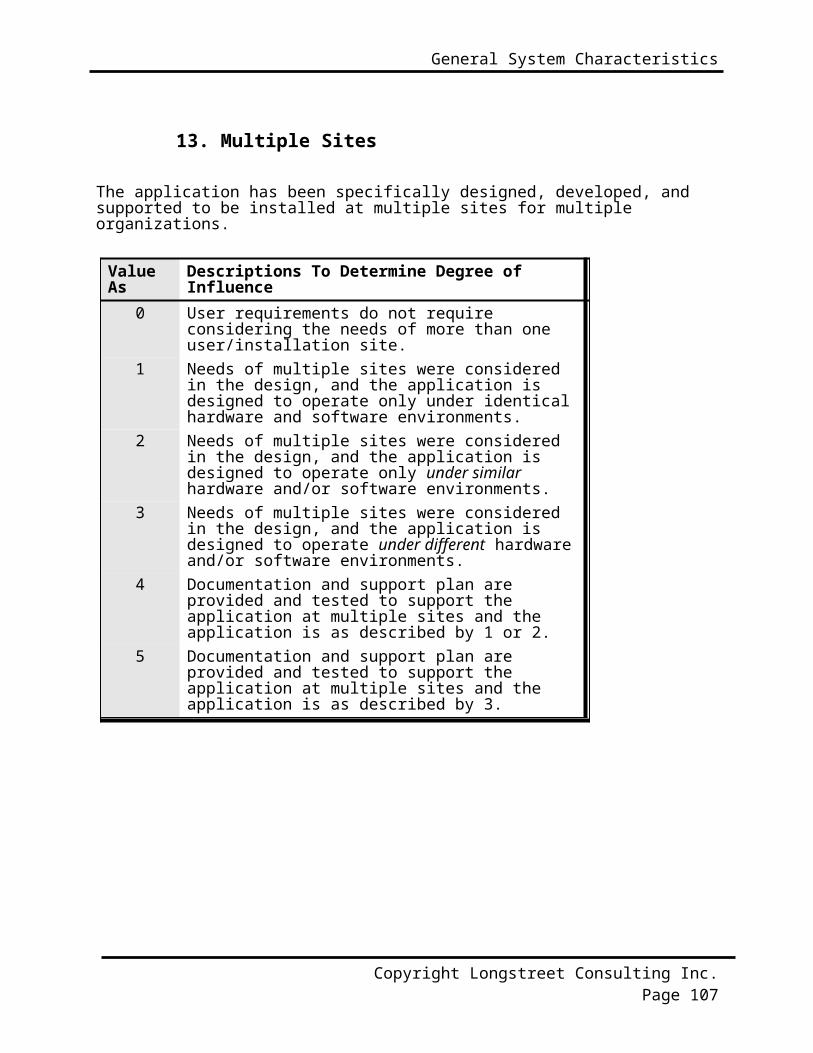
General System Characteristics
The application has been specifically designed, developed, and supported to be installed at multiple sites for multiple organizations.
Value As
Descriptions To Determine Degree of Influence
0 User requirements do not require considering the needs of more than one user/installation site.
1 Needs of multiple sites were considered in the design, and the application is designed to operate only under identical hardware and software environments.
2 Needs of multiple sites were considered in the design, and the application is designed to operate only under similar hardware and/or software environments.
3 Needs of multiple sites were considered in the design, and the application is designed to operate under different hardwareand/or software environments.
4 Documentation and support plan are provided and tested to support the application at multiple sites and the application is as described by 1 or 2.
5 Documentation and support plan are provided and tested to support the application at multiple sites and the application is as described by 3.
Copyright Longstreet Consulting Inc. Page 107
13. Multiple Sites
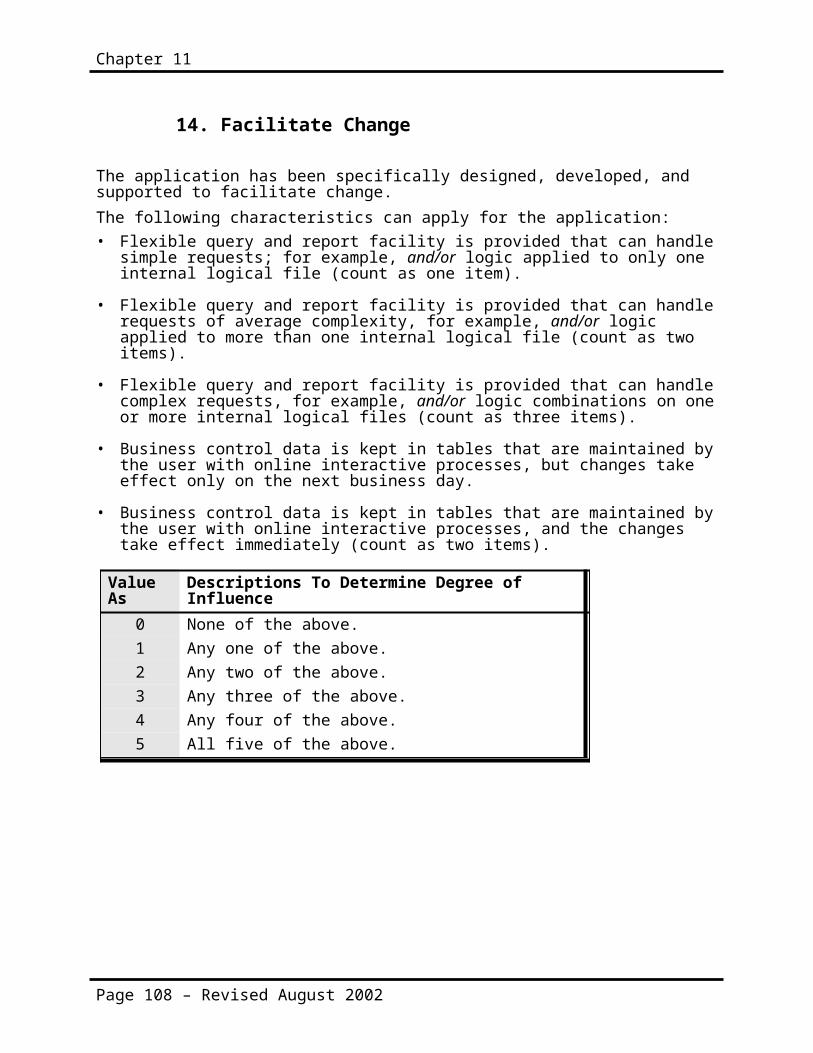
Chapter 11
The application has been specifically designed, developed, and supported to facilitate change.The following characteristics can apply for the application:• Flexible query and report facility is provided that can handle
simple requests; for example, and/or logic applied to only one internal logical file (count as one item).
• Flexible query and report facility is provided that can handlerequests of average complexity, for example, and/or logic applied to more than one internal logical file (count as two items).
• Flexible query and report facility is provided that can handlecomplex requests, for example, and/or logic combinations on oneor more internal logical files (count as three items).
• Business control data is kept in tables that are maintained bythe user with online interactive processes, but changes take effect only on the next business day.
• Business control data is kept in tables that are maintained bythe user with online interactive processes, and the changes take effect immediately (count as two items).
Value As
Descriptions To Determine Degree of Influence
0 None of the above.1 Any one of the above.2 Any two of the above.3 Any three of the above.4 Any four of the above.5 All five of the above.
Page 108 – Revised August 2002
14. Facilitate Change

General System Characteristics
Skill Builder:The following questions are used to help build on the conceptsdiscussed in this section. They are designed to encouragethought and discussion.
1. What is the value adjustment factor if all of the generalsystem characteristics valued a value of 5 (stronginfluence)?
2. What is the value adjustment factor if each of the generalsystem characteristics has no influence (a value of 0)?
3. What is the origin of the .65 in the value adjustment factorcalculation?
4. What is the possible (theoretical) range of the valueadjustment factor?
Copyright Longstreet Consulting Inc. Page 109

Chapter 11
General System Characteristics – Notes Page
Page 110 – Revised August 2002
HISTORY AND IFPUG
Objective of Section:To provide a brief history of Function Points and describe IFPUG.
Brief History:Function Point Analysis was developed first by Allan J. Albrecht in the mid 1970s. It was an attempt to overcome difficulties associated with lines of code as a measure of software size, and to assist in developing a mechanism to predict effort associated with software development. The method was first published in 1979, then later in 1983. In 1984 Albrecht refined the method and since 1986, when the International Function Point User Group (IFPUG) was set up, several versions of the Function Point Counting Practices Manual have been published by IFPUG.
Growth and Acceptance of Function Point AnalysisThe acceptance of Function Point Analysis continues to grow. This is indicated by the growth of the International Function Point User Group (IFPUG). Since 1987 membership in IFPUG has grown from 100 members to nearly 600 members in 1997. Additionally, in less than six years conference attendance has grown from 125 in 1988 to over 300 by 1997. Examination of IFPUGclearly indicates that the majority of its is members are from North America, but Function Point analysis growth outside North America is strong. This is evident by the growing number of function point organizations worldwide. There are numerous affiliate organizations of IFPUG. There are affiliate organizations in Italy, France, Germany, Austria, India, The Netherlands, Australia, Japan, and several other countries.
The exercises at the end of the section help the student demonstrate that they have gained the basic knowledge required.
12

Chapter 12
More Information about IFPUG:More information about joining IFPUG, conferences, committees canbe obtained by contacting the IFPUG.
Website: www.IFPUG.OrgEmail: [email protected]
Page 112 – Revised August 2002
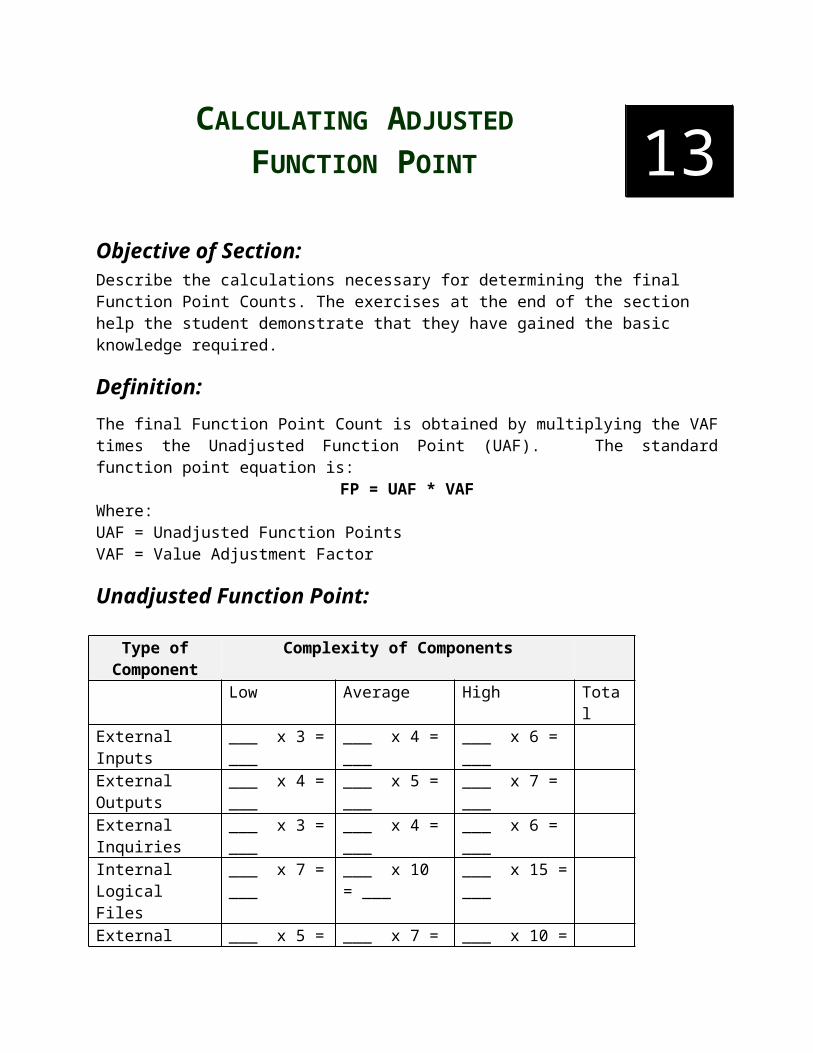
CALCULATING ADJUSTED FUNCTION POINT
Objective of Section:Describe the calculations necessary for determining the final Function Point Counts. The exercises at the end of the section help the student demonstrate that they have gained the basic knowledge required.
Definition:The final Function Point Count is obtained by multiplying the VAFtimes the Unadjusted Function Point (UAF). The standardfunction point equation is:
FP = UAF * VAFWhere: UAF = Unadjusted Function PointsVAF = Value Adjustment Factor
Unadjusted Function Point:
Type of Complexity of ComponentsComponent
Low Average High Total
External Inputs
___ x 3 =___
___ x 4 =___
___ x 6 = ___
External Outputs
___ x 4 =___
___ x 5 =___
___ x 7 = ___
External Inquiries
___ x 3 =___
___ x 4 =___
___ x 6 = ___
Internal Logical Files
___ x 7 =___
___ x 10 = ___
___ x 15 =___
External ___ x 5 = ___ x 7 = ___ x 10 =
13

Chapter 13
Interface Files
___ ___ ___
Total Number ofUnadjusted
Function Points _____
Understanding the Equations:There are three sets of equations new projects (Development), existing projects (Baseline or Application) and for enhancement projects. There are two equations for the enhancement projects. The first equation accounts for size of the enhancement project while the second equation adjusts the size of the Application.
Development Project Function Point Calculation:Use the following formula to calculate the development project function point count.
DFP = (UFP + CFP) * VAFWhere:DFP is the development project function point countUFP is the unadjusted function point countCFP is the function points added by the conversion unadjusted function point countVAF is the value adjustment factor
Enhancement Project Function Point Calculation:Use the following formula to calculating the size for enhancementprojects.
EFP = [(ADD + CHGA + CFP) * VAFA] + (DEL* VAFB)Where:EFP is the enhancement project function point count.
ADD is the unadjusted function point count of those functions that were added by the enhancement project.
Page 114 – Revised August 2002

Calculating Adjusted Function Points
CHGA is the unadjusted function point count of those functions that were modified by the enhancement project. This number reflects the functions after the modifications.
CFP is the function point count added by the conversion.
VAFA is the value adjustment factor of the application after the enhancement project.
DEL is the unadjusted function point count of those functions that were deleted by the enhancement project.
VAFB is the value adjustment factor of the application before the enhancement project.
Simplification of the equation:To examine the equation in detail let’s assume that VAFA = VAFB =1 and CFP = 0.Hence EFP = (ADD + CHGA + DEL).That is, the size of an enhancement project is a summation of alladded functionality, changed functionality and any deleted functionality.
In theory and in practice, each piece of the formula must be adjusted by the appropriate Value Adjustment factor. Assume now that VAFA VAFB. The added and changed after is adjusted by the VAFA, but the deleted is adjusted by the VAFB. Additionally,if CFP 0 then it should be adjusted by VAFA.
Copyright Longstreet Consulting Inc. Page 115

Chapter 13
Application After Enhancement Project:
AFP = [(UFPB + ADD + CHGA) - (CHGB + DEL)] * VAFA
Where:UFPB = Unadjusted Function Point Count Before Enhancement.AFP = Application Function Point Count after the enhancement.All other acronyms are the same as before.
Of course, an enhancement calculation can add and/or Delete functionality from the UFPB. Added functionality can be due to new components or added functionality can be due to increase in size of existing components. For example, an existing external input could go from a low to an average – valued at 3 to 4.
Simplification of Equation:The equation can be simplifiedAFP = [UFPB+ADD + CHGA-CHGB - DEL]* VAFA
Let’s assume that CHGA = CHGB and DEL = 0. ThenAFPs= (UFPB + ADD) * VAFA
Application Function Point Count (Baseline):Use the following formula to establish the initial function pointcount for an existing application. The user is receiving functionality. There are no changes to the existing functionality or deletions of unneeded functionality. The application function point count does not include conversion requirements.
AFPB = ADD * VAFAdditionally, this equation is used to establish the function point count for an application at any point in time.Where:AFPB is the initial application function point count.ADD is the unadjusted function point count of those functions that were installed by the development project. Since many
Page 116 – Revised August 2002

Calculating Adjusted Function Points
enhancement projects (that were not counted) have been installed in the application, the ADD in this case represents all functionality that exists within the application boundary at a particular point in time.VAF is the value adjustment factor of the application.
Copyright Longstreet Consulting Inc. Page 117

Chapter 13
Skill Builder:The following questions are used to help build on the concepts discussed in this section. They are designed to encourage thought and discussion.
1. An application has a base unadjusted function point count of500, a value adjustment factor of 1.10. What is the adjusted function point count?
2. An application has 100 unadjusted function points and a value adjustment factor of 1.02. An enhancement project adds 25 function points, deletes 20 function points, and changes 15 function points (in this case assume CHGB = CHGA). The new value adjustment factor is 1.05.
3. What is the new (after the enhancement) adjusted function point count?
4. What is the enhancement function point count?
An application has the following:10 Low External Inputs, 12 High External Outputs, 20 Low InternalLogical Files, 15 High External Interface Files, 12 Average External Inquiries, and a value adjustment factor of 1.10.
5. What is the unadjusted function point count?
6. What is the adjusted function point count?
Page 118 – Revised August 2002

CASE STUDIES
Objective of Section:The Case Studies require the student to put together several pieces of knowledge together to solve the case study. The case studies insure that the student is grasping and understanding notonly individual components but the components as they relate to each other.
While the exercises at the end of each section are intended to beguided practice, the case studies are intended to be independent practice. The student should be able to work solve the case study working alone or in a small group without instructor guidance.
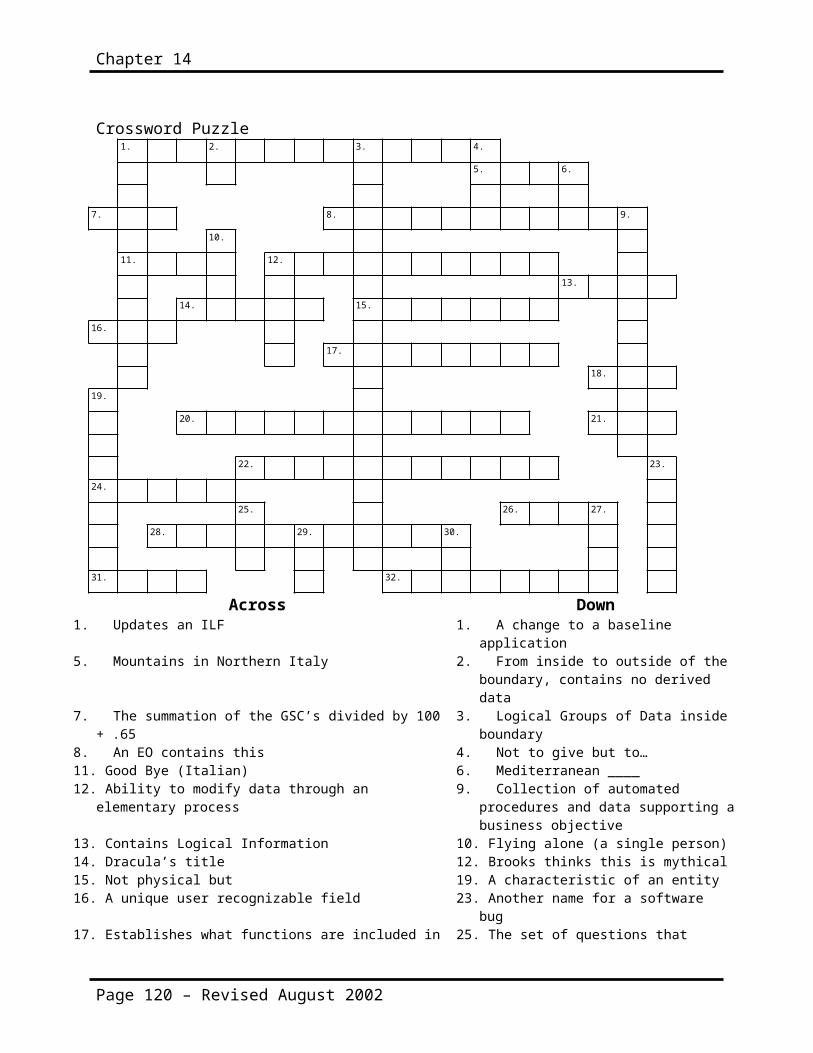
Chapter 14
Crossword Puzzle1. 2. 3. 4.
5. 6.
7. 8. 9.
10.
11. 12.
13.
14. 15.
16.
17.
18.
19.
20. 21.
22. 23.
24.
25. 26. 27.
28. 29. 30.
31. 32.
Across Down1. Updates an ILF 1. A change to a baseline
application5. Mountains in Northern Italy 2. From inside to outside of the
boundary, contains no derived data
7. The summation of the GSC’s divided by 100+ .65
3. Logical Groups of Data insideboundary
8. An EO contains this 4. Not to give but to…11. Good Bye (Italian) 6. Mediterranean ____12. Ability to modify data through an
elementary process9. Collection of automated
procedures and data supporting abusiness objective
13. Contains Logical Information 10. Flying alone (a single person)14. Dracula’s title 12. Brooks thinks this is mythical15. Not physical but 19. A characteristic of an entity16. A unique user recognizable field 23. Another name for a software
bug17. Establishes what functions are included in 25. The set of questions that
Page 120 – Revised August 2002

Case Studies and Exercises
the function point count evaluate the overall complexity of an application
18. Read or maintained by transaction 27. The eternal city20. What EI’s, EO’s and EQ’s are called 29. Not hello, but good ___21. Another measure of software size
(Abbreviation)30. Sí (English meaning)
22. The specification, construction, testing, and delivery of a new information systems
24. International Function Point User Group (Abbreviation)
26. Function points should be counted from the“ “ view
28. Another word for Reused (No. 10 of 14)31. Function points are not hard they are ..32. The first function point count
Copyright Longstreet Consulting Inc. Page 121

Chapter 14
Collection Letter<today_date>
Dear <title> <last_name>,
Our records indicate that you are past due <num_of_days>. If youdo not pay within <pay_day>, then we will kindly repo your <color><style_ automobile>.
<greeting>.
Warm Regards,<repo_man>
Example letterDecember 18, 1999
Dear Mr. Harmon,
Our records indicate that you are past due 255 days. If you do not pay within 5 days from the date of this letter, then we will kindly repo your red Ford 150 Truck.
Please have a Merry Christmas and prosperous New Year.
Warm RegardsRocky Balboa
Questions and other information The number of past due days (num of days) is date of letter
minus the due date. Due date derived from the Payment File Pay day is calculated.
Page 122 – Revised August 2002

Case Studies and Exercises
Repo Man is read from the Employee File Title and Last Name are read from the Customer File The greeting is based upon the date of the letter and an
appropriate message from the Greeting File.What are the data elements?Is this letter an EO or an EQ, why?How many FTR’s?
Copyright Longstreet Consulting Inc. Page 123

Chapter 14
Control Inputs
1. How many data elements are on the “CheckingPreferences” control Screen?
2. How many data elements are on the “GeneralPreferences” control Screen?
3. How many control inputs are represented by the menu items to the right?
4. If the “default” reads values from a control file,then how is “default” treated?
Page 124 – Revised August 2002

Case Studies and Exercises
Copyright Longstreet Consulting Inc. Page 125

Chapter 14
Graphical Information
1. What are the external outputs?
2. What are the data elements for each EO?
3. How are the legends treated?
Page 126 – Revised August 2002

Case Studies and Exercises
Graphs Part II
There are two data ILF’s that contain information needed to produce the graph. There is an additional control file which alters the way the graph looks.
1. Is there a control EI and control ILF for “graphs”?
2. How many total FTR’s are referenced for the graphs?
3. Does this graph represent another EO?
Copyright Longstreet Consulting Inc. Page 127
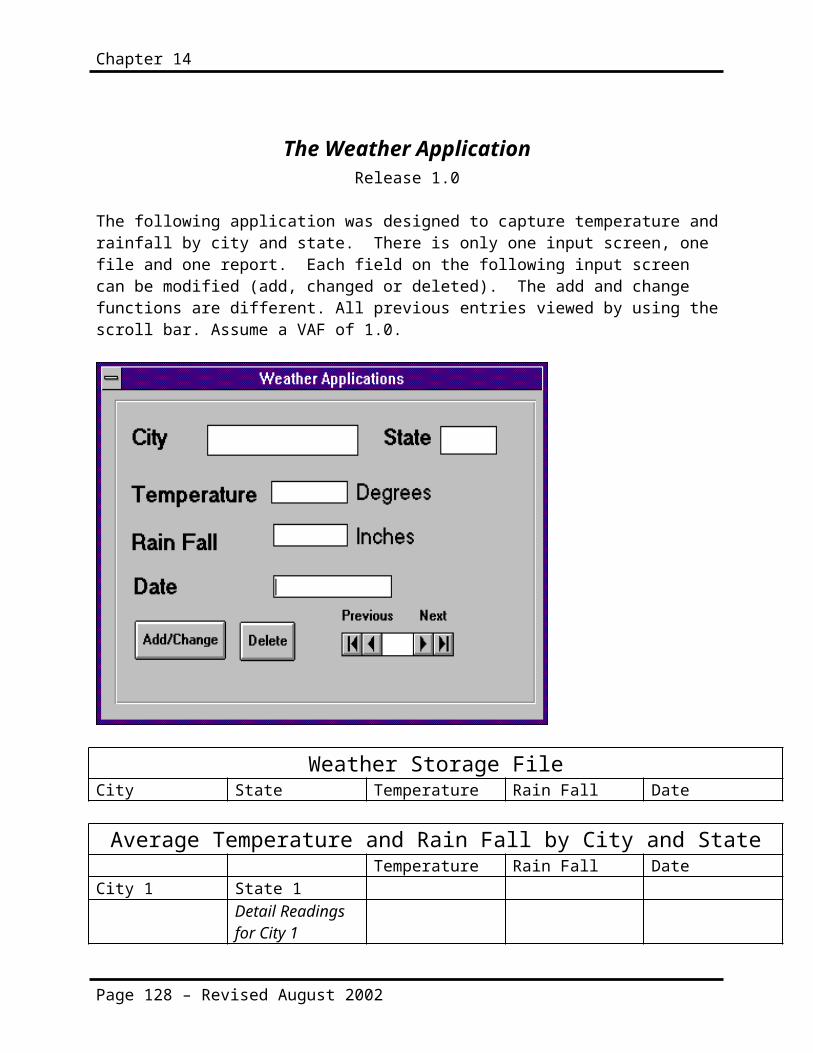
Chapter 14
The Weather ApplicationRelease 1.0
The following application was designed to capture temperature andrainfall by city and state. There is only one input screen, one file and one report. Each field on the following input screen can be modified (add, changed or deleted). The add and change functions are different. All previous entries viewed by using thescroll bar. Assume a VAF of 1.0.
Weather Storage FileCity State Temperature Rain Fall Date
Average Temperature and Rain Fall by City and StateTemperature Rain Fall Date
City 1 State 1Detail Readings for City 1
Page 128 – Revised August 2002
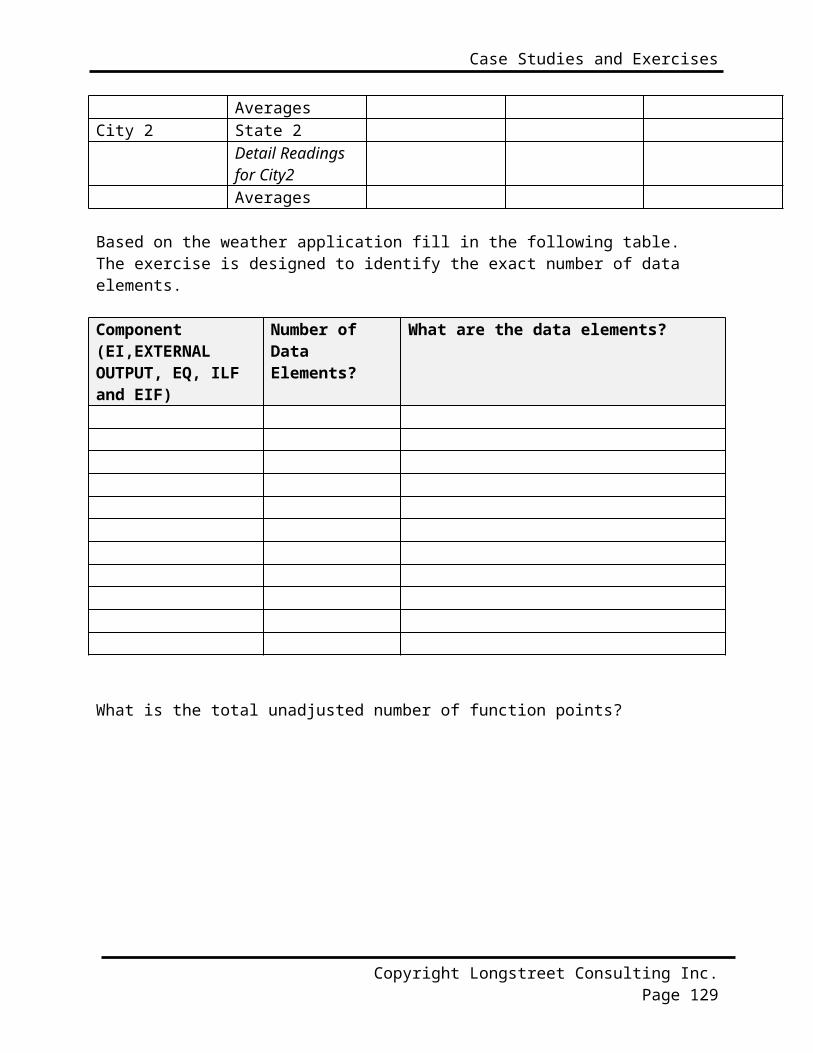
Case Studies and Exercises
AveragesCity 2 State 2
Detail Readings for City2Averages
Based on the weather application fill in the following table. The exercise is designed to identify the exact number of data elements.
Component (EI,EXTERNAL OUTPUT, EQ, ILF and EIF)
Number of Data Elements?
What are the data elements?
What is the total unadjusted number of function points?
Copyright Longstreet Consulting Inc. Page 129

Adding A New Customer
The following two screens are used to add a new customer to an application. The customer is not considered added until both Address information and Additional Information is completed.
The OK and Next buttons both save information to the file.
Figure 6
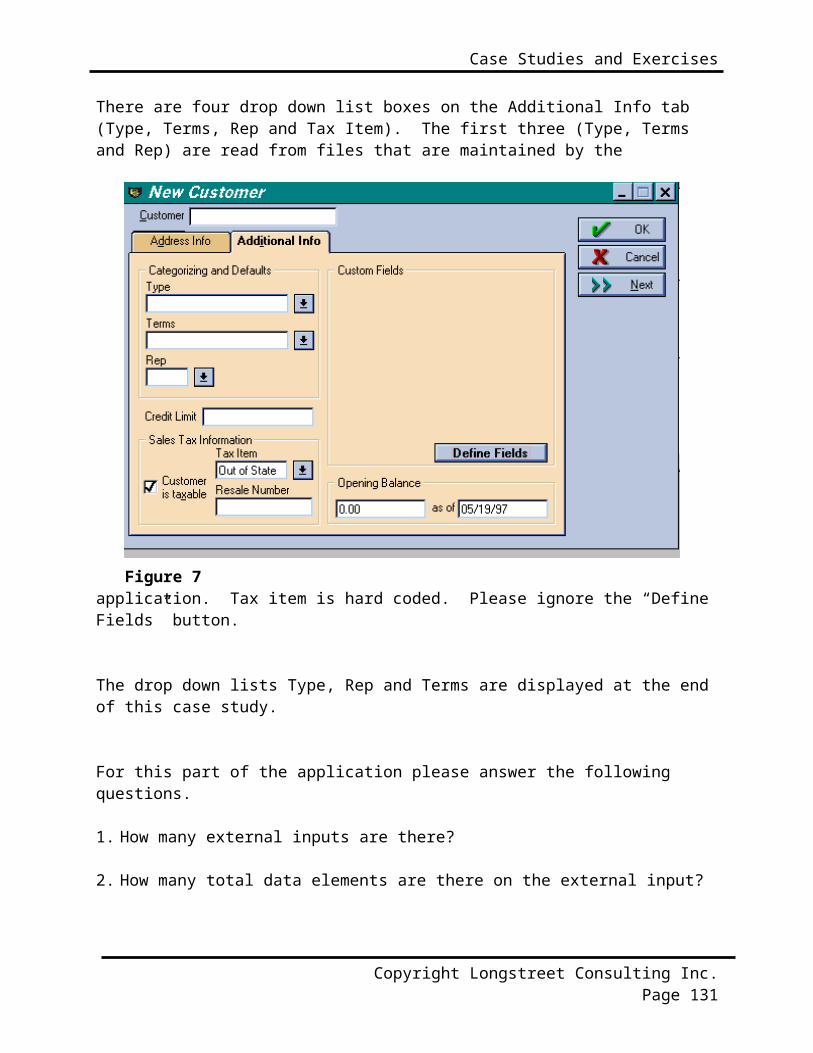
Case Studies and Exercises
There are four drop down list boxes on the Additional Info tab (Type, Terms, Rep and Tax Item). The first three (Type, Terms and Rep) are read from files that are maintained by the
application. Tax item is hard coded. Please ignore the “Define Fields” button.
The drop down lists Type, Rep and Terms are displayed at the end of this case study.
For this part of the application please answer the following questions.
1. How many external inputs are there?
2. How many total data elements are there on the external input?
Copyright Longstreet Consulting Inc. Page 131
Figure 7

Chapter 14
3. What are the data elements?
4. In terms of function points what are Type, Terms and Rep (see next page)?
5. In terms of function points how are Type and Terms treated thesecond time they appear? The Rep and Terms drop down box are used again when invoices are created.
Page 132 – Revised August 2002
Case Studies and Exercises
Enhanced Weather ApplicationRelease 2.0
Release 2.0 is an enhancement to “The Weather Application” Release 1.0. The user wants the ability to save temperature as either Celsius or Fahrenheit. To accomplish this a radio button is added to the input screen, which allows the user to select either Celsius or Fahrenheit. An additional field is added to the file, and an additional field is added to the reports. Assume that the value adjustment factor increases to 1.0.
How many “enhancement” function points does this represent?
What is the baseline function point of release 2.0?
Copyright Longstreet Consulting Inc. Page 133
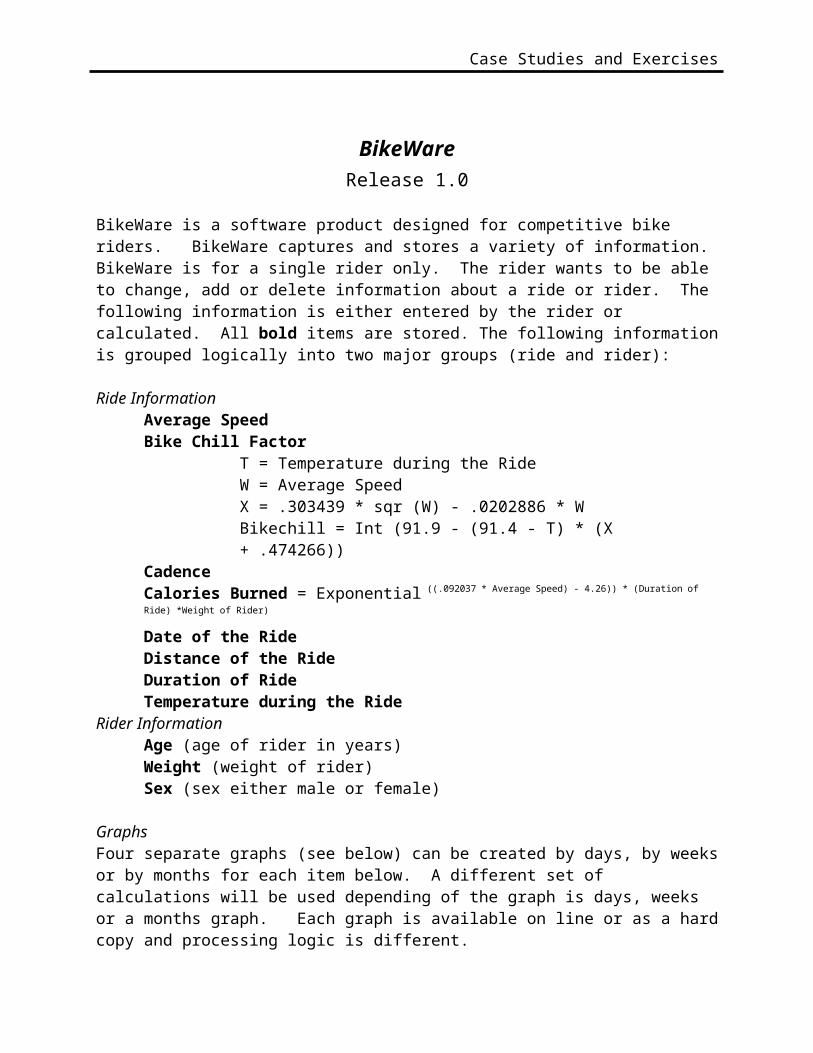
Case Studies and Exercises
BikeWareRelease 1.0
BikeWare is a software product designed for competitive bike riders. BikeWare captures and stores a variety of information. BikeWare is for a single rider only. The rider wants to be able to change, add or delete information about a ride or rider. The following information is either entered by the rider or calculated. All bold items are stored. The following informationis grouped logically into two major groups (ride and rider): Ride Information
Average Speed Bike Chill Factor
T = Temperature during the RideW = Average SpeedX = .303439 * sqr (W) - .0202886 * WBikechill = Int (91.9 - (91.4 - T) * (X + .474266))
Cadence Calories Burned = Exponential ((.092037 * Average Speed) - 4.26)) * (Duration of
Ride) *Weight of Rider)
Date of the RideDistance of the Ride Duration of RideTemperature during the Ride
Rider InformationAge (age of rider in years)Weight (weight of rider)Sex (sex either male or female)
Graphs Four separate graphs (see below) can be created by days, by weeksor by months for each item below. A different set of calculations will be used depending of the graph is days, weeks or a months graph. Each graph is available on line or as a hardcopy and processing logic is different.

Case Studies and Exercises
Distance of RideAverage SpeedDuration of RideCalories Burned
Chapter 14
For BikeWare determine the following information:
Identify the external inputs, how many data elements and how manyfiles will be referenced?
How many files type referenced are there for the add, the change and the delete? Is it always the same?
How many internal logical files are there and what are the data elements?
How many external outputs? Describe the external outputs also?
How many data elements for each external output?
Page 136 – Revised August 2002

Case Studies and Exercises
Pizza Screen Design
Option 1Toppings are read from another application (kitchen application). If the topping is not availableit is not displayed.
The cost of the Pizza is calculated automatically.
When the OK button is clicked the Toppings, Pizza Crust Type and Cost of Pizza are saved.
Option 2The Items in the drop down box are hard code – not read from a file.Available Toppings are read from another application (kitchen application).When a Topping is selected from Available Toppings it is copied to Selected Toppings
Figure 8
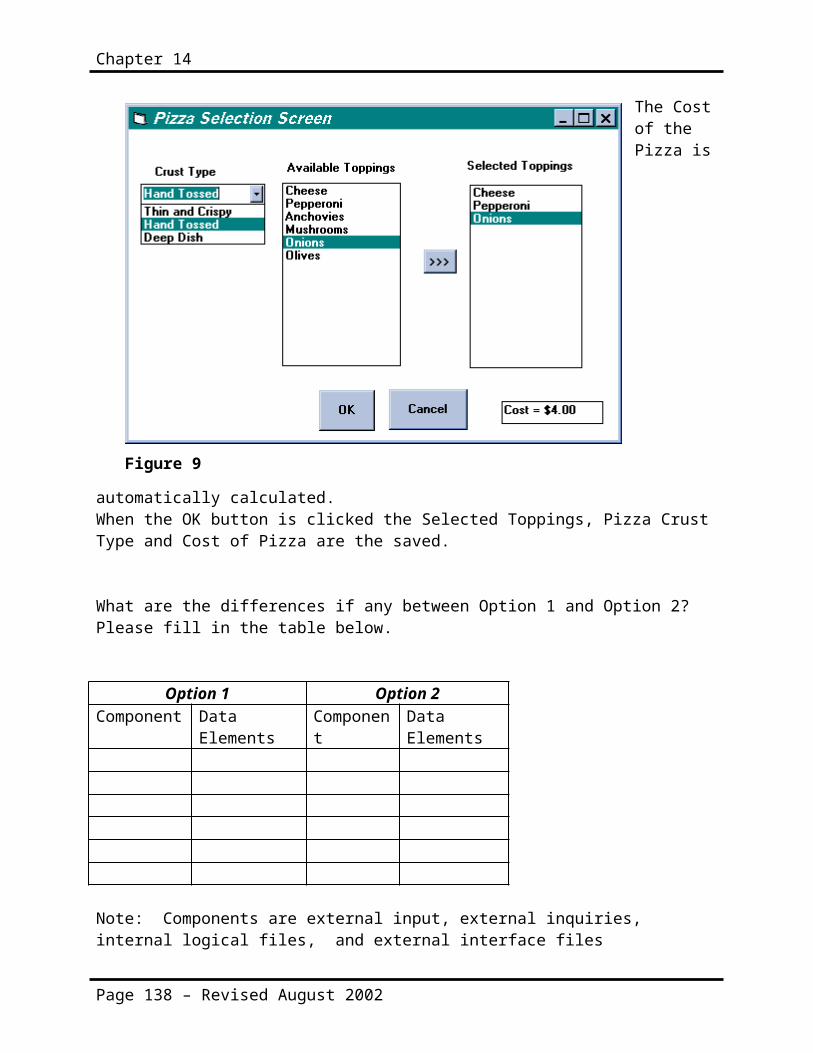
Chapter 14
The Costof the Pizza is
automatically calculated.When the OK button is clicked the Selected Toppings, Pizza Crust Type and Cost of Pizza are the saved.
What are the differences if any between Option 1 and Option 2? Please fill in the table below.
Option 1 Option 2Component Data
ElementsComponent
Data Elements
Note: Components are external input, external inquiries, internal logical files, and external interface files
Page 138 – Revised August 2002
Figure 9

Case Studies and Exercises
Chapter 14
www.PIZZACLUB.COM
Part 1
WWW.PizzaClub allows customers to order pizza via the Internet. The following is only one screen of many screens.
1. Once the customer has accessed www.PizzaClub.Com they fill out this screen.
2. When the customer clicks on the form the information is saved to a file.
3. If any of the fields are not filled out (populated) the customer receives and error message telling them “All fields must be populated”.
4. What are the data elements?5. How many unadjusted function points does this screen and one
file represent.
Page 140 – Revised August 2002
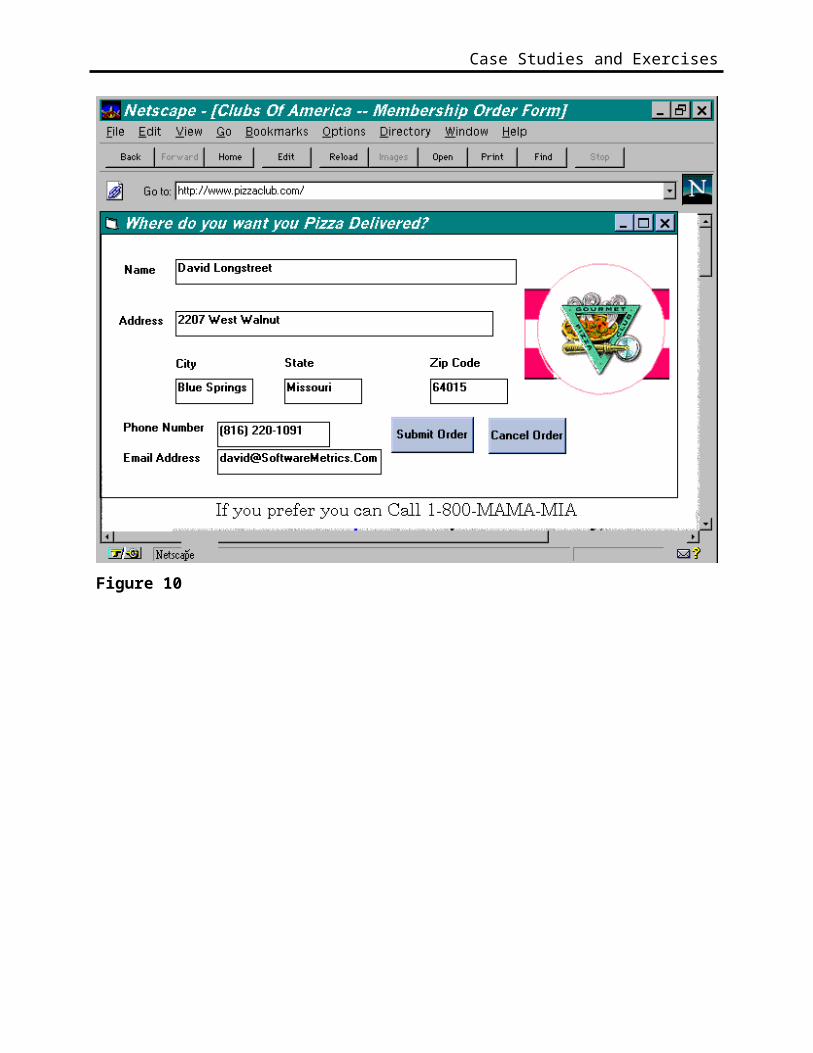
Case Studies and Exercises
Figure 10
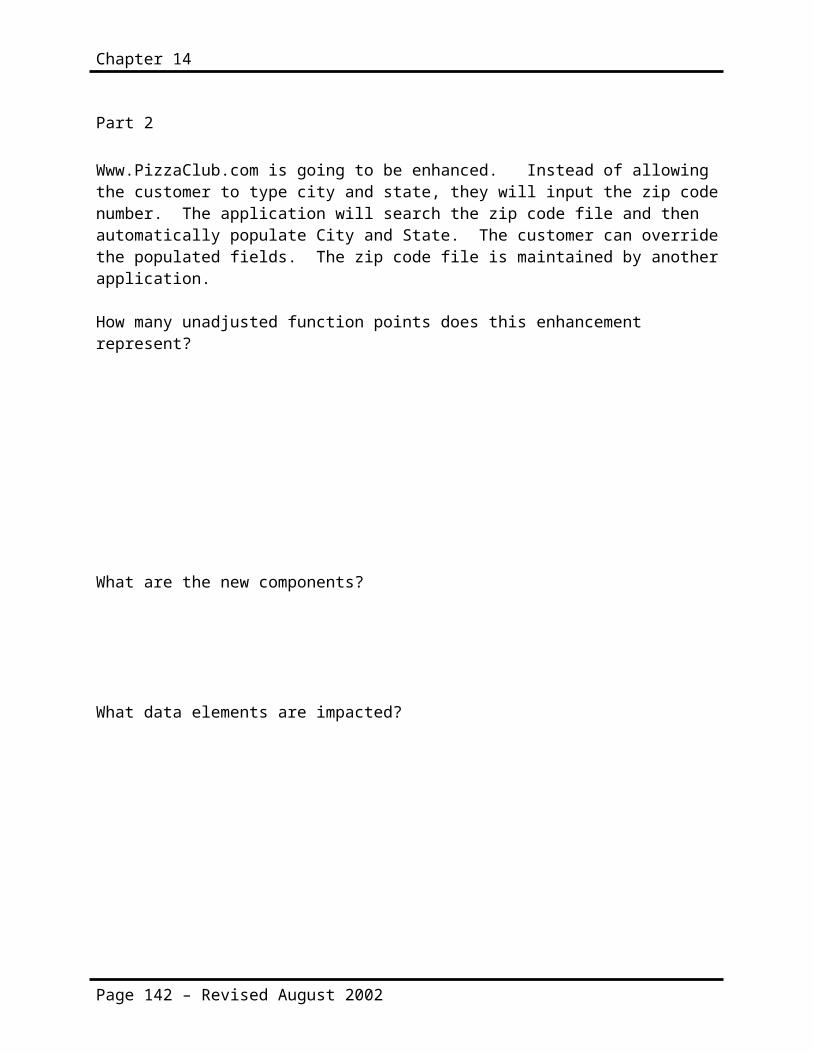
Chapter 14
Part 2
Www.PizzaClub.com is going to be enhanced. Instead of allowing the customer to type city and state, they will input the zip codenumber. The application will search the zip code file and then automatically populate City and State. The customer can overridethe populated fields. The zip code file is maintained by anotherapplication.
How many unadjusted function points does this enhancement represent?
What are the new components?
What data elements are impacted?
Page 142 – Revised August 2002
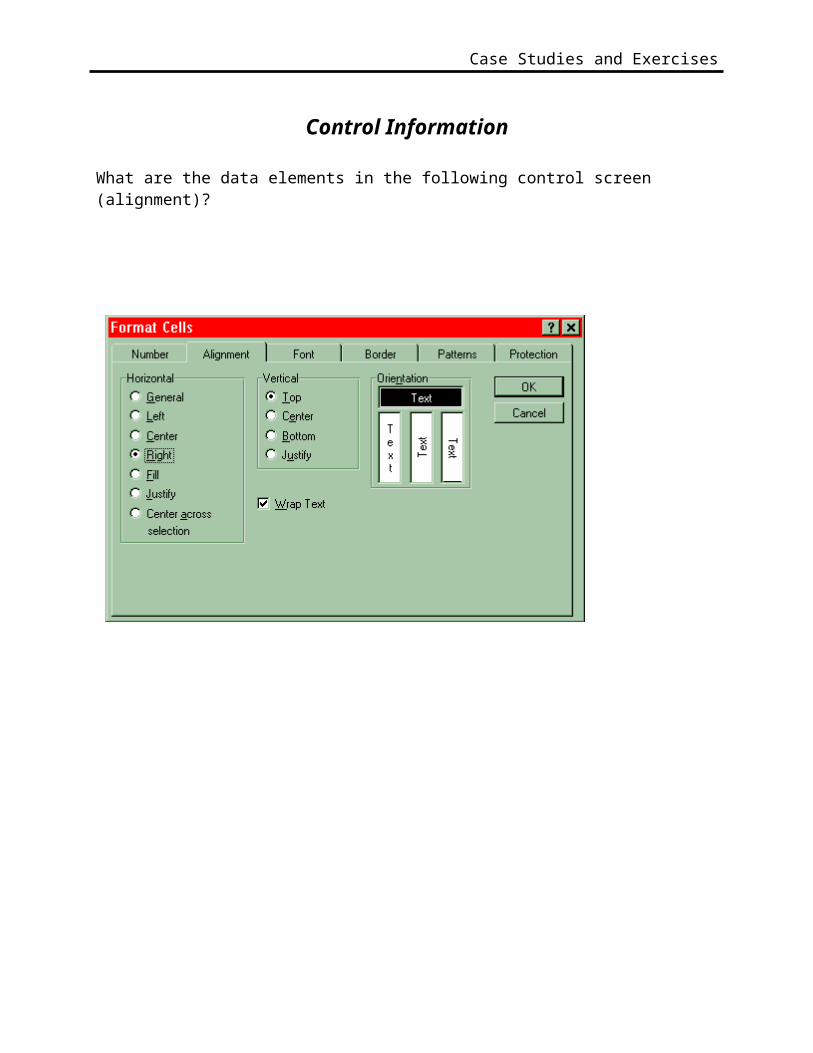
Case Studies and Exercises
Control Information
What are the data elements in the following control screen (alignment)?
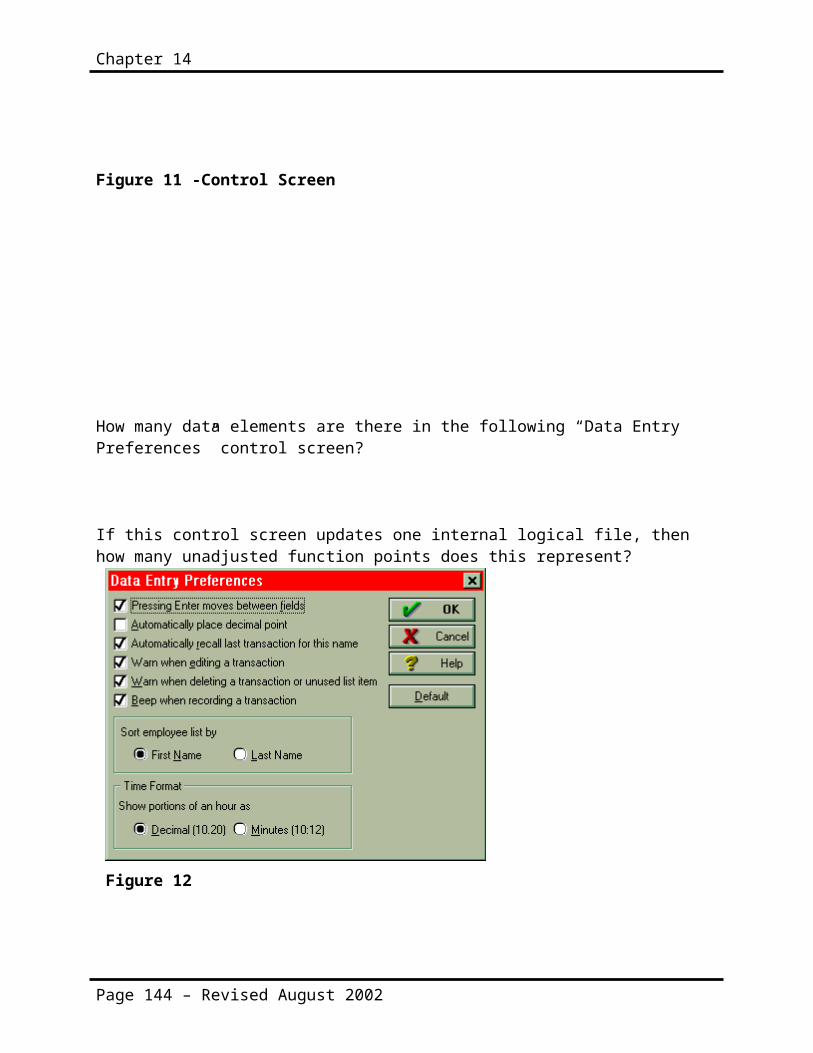
Chapter 14
Figure 11 -Control Screen
How many data elements are there in the following “Data Entry Preferences” control screen?
If this control screen updates one internal logical file, then how many unadjusted function points does this represent?
Page 144 – Revised August 2002
Figure 12

Case Studies and Exercises
Chapter 14
Word Problem 1
Let’s assume your productivity rate is 10 hours per function point (it takes 10 hours of work to deliver a function point). Additionally, assume your cost per hour is $60. Therefore, the cost to deliver 1 function point is $600.
1. How much would it cost to develop an application with 5,000 function points?
2. Let’s assume you anticipate a Maintenance Rate is $100/Function Point. How much needs to be budgeted to cover Maintenance Expenses for the first year?
3. Assume that the application will be operational for 6 years (application life expectancy is 6 years). Maintenance Costs will be fixed at $100/Function Point Per Year. What is the total expected cost of the application-- including all development and maintenance costs?
4. Should maintenance costs be considered when developing an application? How do you determine expected maintenance costs?
Page 146 – Revised August 2002

Case Studies and Exercises
Word Problem 2
Assume the same cost per function point as before ($600).
Suppose a vendor, a tool vendor, and claims that his tool will increase productivity by 50 percent -- cut your cost per functionpoint in half. Assume the following to be true:
You are planning on implementing 1,000 function points over the next year.You want the tool to pay for itself within 1 year.
1. What is the maximum amount you would be willing to pay for this tool -- You want to break even.
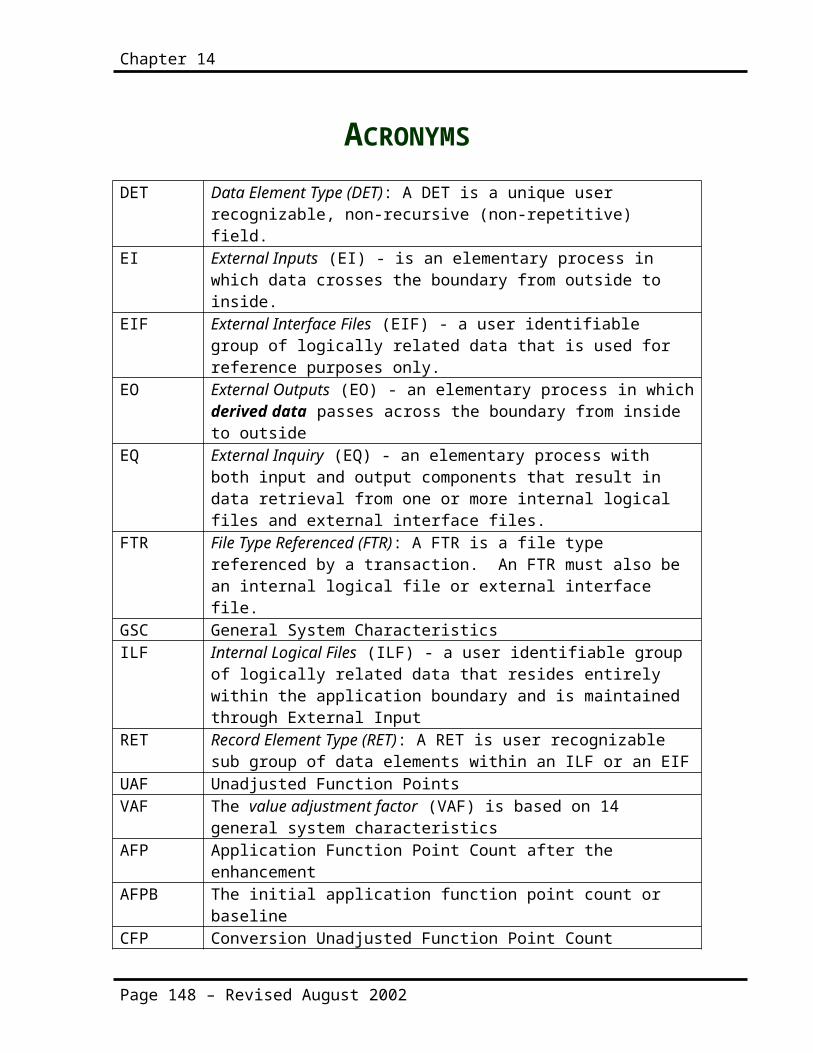
Chapter 14
ACRONYMSDET Data Element Type (DET): A DET is a unique user
recognizable, non-recursive (non-repetitive) field.
EI External Inputs (EI) - is an elementary process in which data crosses the boundary from outside to inside.
EIF External Interface Files (EIF) - a user identifiable group of logically related data that is used for reference purposes only.
EO External Outputs (EO) - an elementary process in whichderived data passes across the boundary from inside to outside
EQ External Inquiry (EQ) - an elementary process with both input and output components that result in data retrieval from one or more internal logical files and external interface files.
FTR File Type Referenced (FTR): A FTR is a file type referenced by a transaction. An FTR must also be an internal logical file or external interface file.
GSC General System CharacteristicsILF Internal Logical Files (ILF) - a user identifiable group
of logically related data that resides entirely within the application boundary and is maintained through External Input
RET Record Element Type (RET): A RET is user recognizable sub group of data elements within an ILF or an EIF
UAF Unadjusted Function PointsVAF The value adjustment factor (VAF) is based on 14
general system characteristicsAFP Application Function Point Count after the
enhancementAFPB The initial application function point count or
baselineCFP Conversion Unadjusted Function Point Count
Page 148 – Revised August 2002
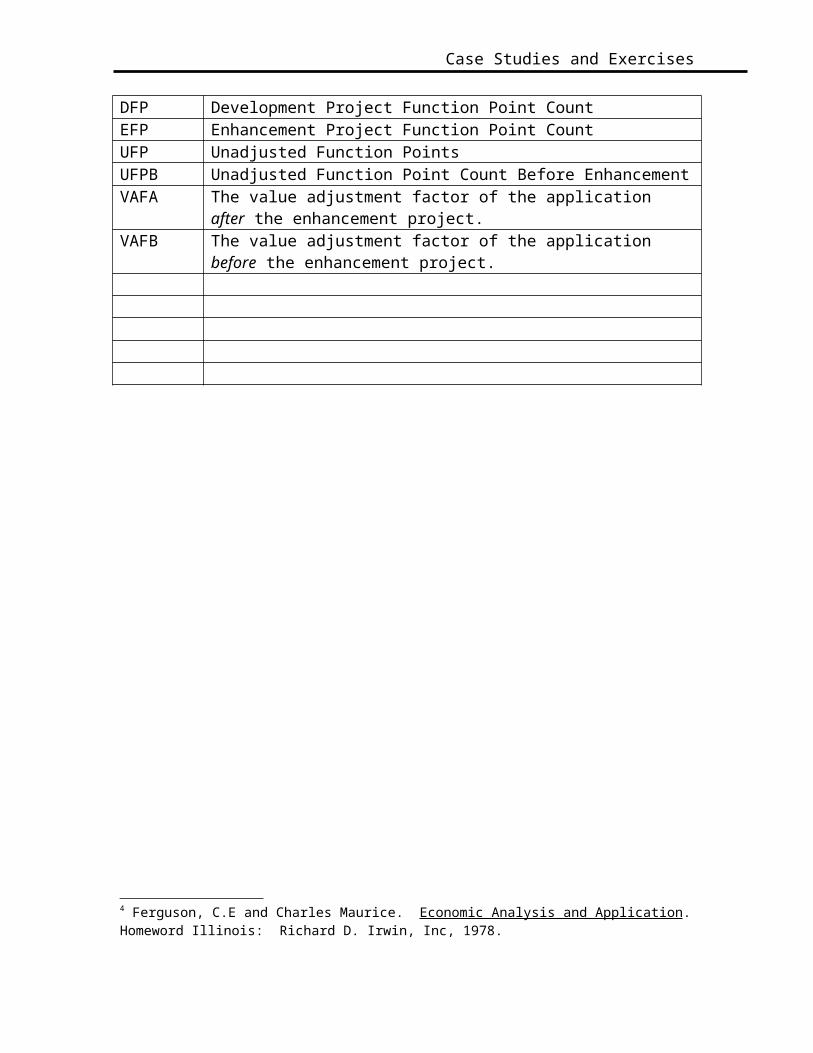
Case Studies and Exercises
DFP Development Project Function Point CountEFP Enhancement Project Function Point CountUFP Unadjusted Function PointsUFPB Unadjusted Function Point Count Before EnhancementVAFA The value adjustment factor of the application
after the enhancement project.VAFB The value adjustment factor of the application
before the enhancement project.
4 Ferguson, C.E and Charles Maurice. Economic Analysis and Application.Homeword Illinois: Richard D. Irwin, Inc, 1978.