F.TF.B.5: Modeling Trigonometric Functions 1b - JMAP
10
Regents Exam Questions Name: ________________________ F.TF.B.5: Modeling Trigonometric Functions 1b www.jmap.org 1 F.TF.B.5: Modeling Trigonometric Functions 1b 1 The equation y − 2 sin θ = 3 may be rewritten as 1) f(y) = 2 si n x + 3 2) f(y) = 2 si n θ + 3 3) f(x) = 2 si n θ + 3 4) f(θ) = 2 si n θ + 3 2 The voltage used by most households can be modeled by a sine function. The maximum voltage is 120 volts, and there are 60 cycles every second. Which equation best represents the value of the voltage as it flows through the electric wires, where t is time in seconds? 3 Which equation is represented by the graph below? 4 Which equation represents the graph below? 5 The accompanying diagram shows a section of a sound wave as displayed on an oscilloscope. Which equation could represent this graph? 6 A radio transmitter sends a radio wave from the top of a 50-foot tower. The wave is represented by the accompanying graph. What is the equation of this radio wave? 7 Which equation is represented by the accompanying graph?
-
Upload
khangminh22 -
Category
Documents
-
view
1 -
download
0
Transcript of F.TF.B.5: Modeling Trigonometric Functions 1b - JMAP

Regents Exam Questions Name: ________________________ F.TF.B.5: Modeling Trigonometric Functions 1bwww.jmap.org
1
F.TF.B.5: Modeling Trigonometric Functions 1b
1 The equation y − 2sinθ = 3 may be rewritten as1) f(y) = 2sinx + 32) f(y) = 2sinθ + 33) f(x) = 2sinθ + 34) f(θ) = 2sinθ + 3
2 The voltage used by most households can be modeled by a sine function. The maximum voltage is 120 volts, and there are 60 cycles every second. Which equation best represents the value of the voltage as it flows through the electric wires, where t is time in seconds?
3 Which equation is represented by the graph below?
4 Which equation represents the graph below?
5 The accompanying diagram shows a section of a sound wave as displayed on an oscilloscope.
Which equation could represent this graph?
6 A radio transmitter sends a radio wave from the top of a 50-foot tower. The wave is represented by the accompanying graph.
What is the equation of this radio wave?
7 Which equation is represented by the accompanying graph?
Regents Exam Questions Name: ________________________ F.TF.B.5: Modeling Trigonometric Functions 1bwww.jmap.org
2
8 Which equation is represented by the graph shown below?
9 Which equation is represented by the accompanying graph?
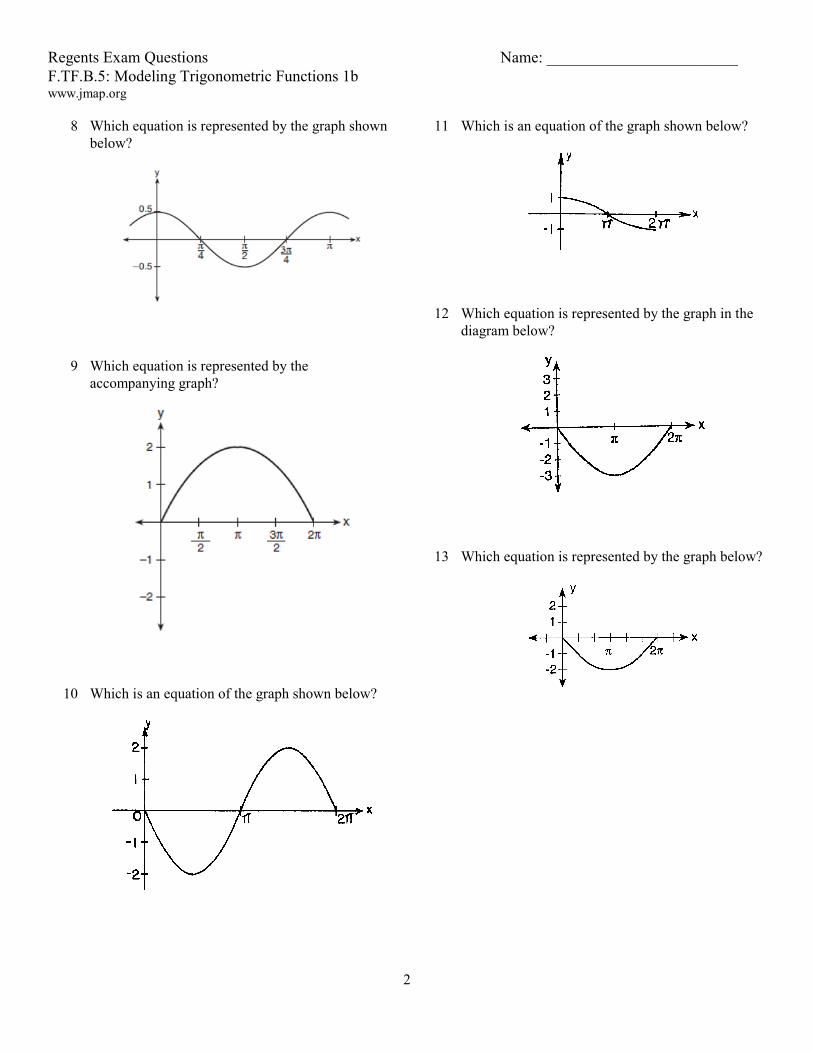
10 Which is an equation of the graph shown below?
11 Which is an equation of the graph shown below?
12 Which equation is represented by the graph in the diagram below?
13 Which equation is represented by the graph below?
Regents Exam Questions Name: ________________________ F.TF.B.5: Modeling Trigonometric Functions 1bwww.jmap.org
3
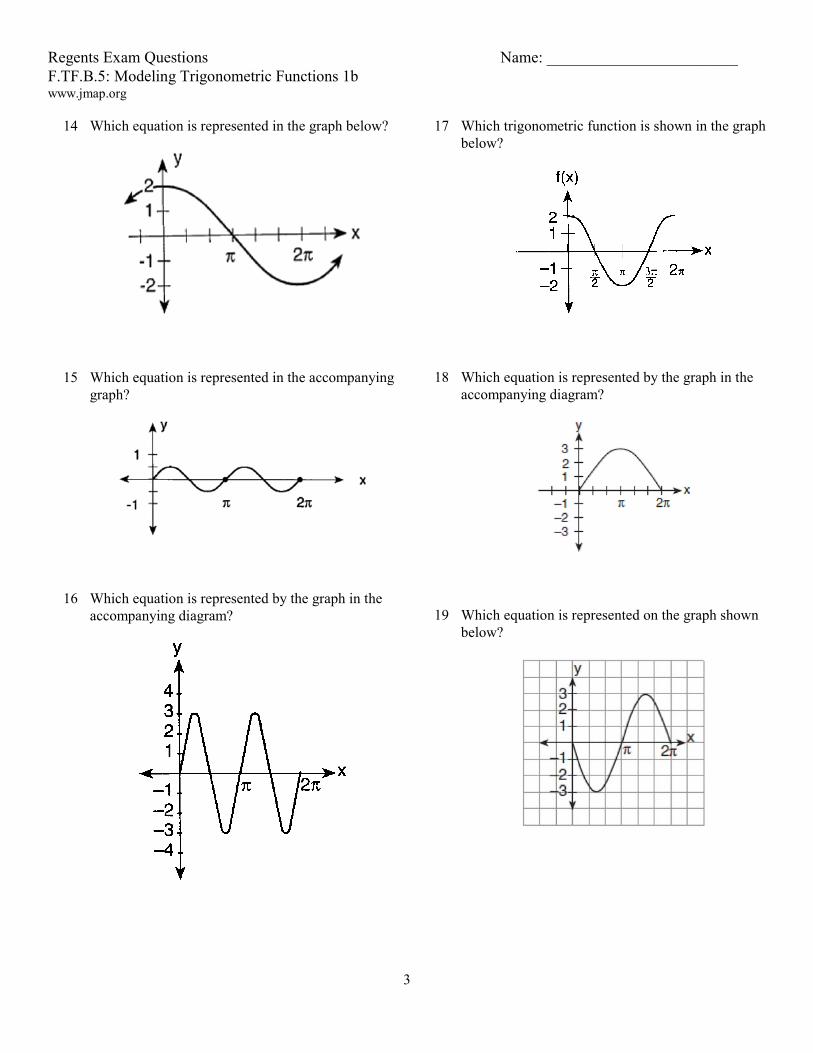
14 Which equation is represented in the graph below?
15 Which equation is represented in the accompanying graph?
16 Which equation is represented by the graph in the accompanying diagram?
17 Which trigonometric function is shown in the graph below?
18 Which equation is represented by the graph in the accompanying diagram?
19 Which equation is represented on the graph shown below?
Regents Exam Questions Name: ________________________ F.TF.B.5: Modeling Trigonometric Functions 1bwww.jmap.org
4
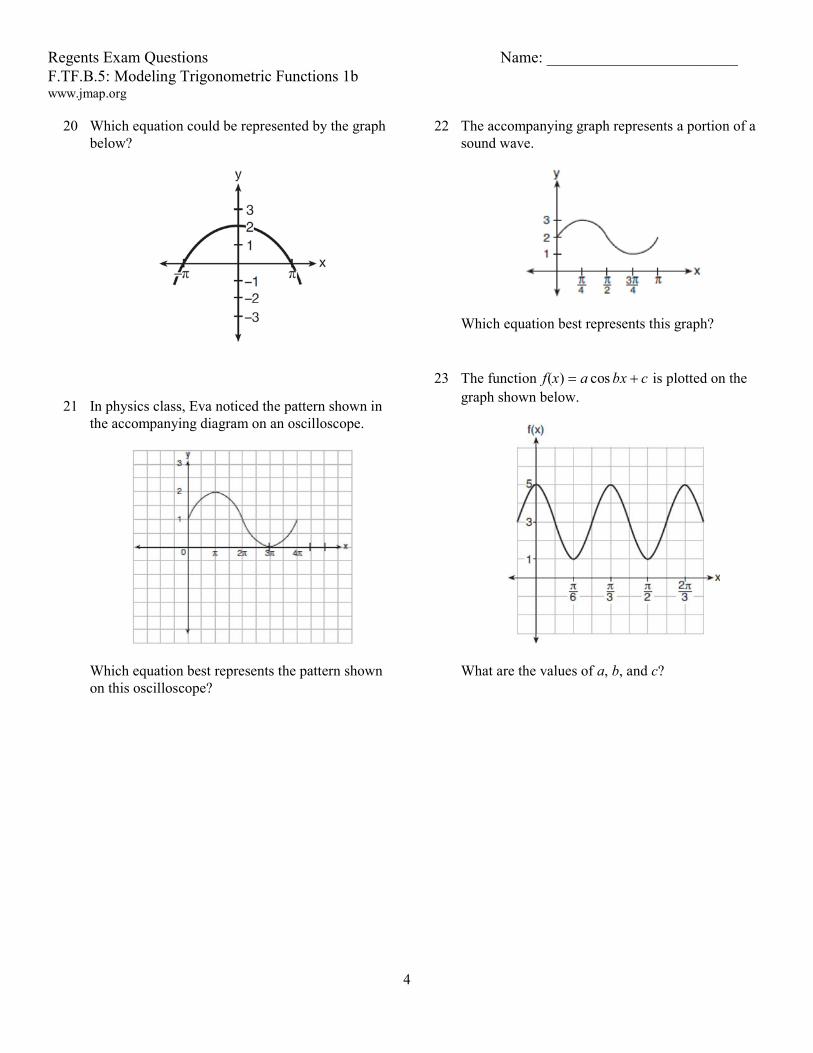
20 Which equation could be represented by the graph below?
21 In physics class, Eva noticed the pattern shown in the accompanying diagram on an oscilloscope.
Which equation best represents the pattern shown on this oscilloscope?
22 The accompanying graph represents a portion of a sound wave.
Which equation best represents this graph?
23 The function f(x) = a cos bx + c is plotted on the graph shown below.
What are the values of a, b, and c?

Regents Exam Questions Name: ________________________ F.TF.B.5: Modeling Trigonometric Functions 1bwww.jmap.org
5
24 Which equation is graphed in the diagram below?
25 The depth of the water at a marker 20 feet from the shore in a bay is depicted in the graph below.
If the depth, d, is measured in feet and time, t, is measured in hours since midnight, what is an equation for the depth of the water at the marker?
26 Which equation is represented by the graph below?
27 Which equation is sketched in the diagram below?
ID: A
1
F.TF.B.5: Modeling Trigonometric Functions 1b
Answer Section
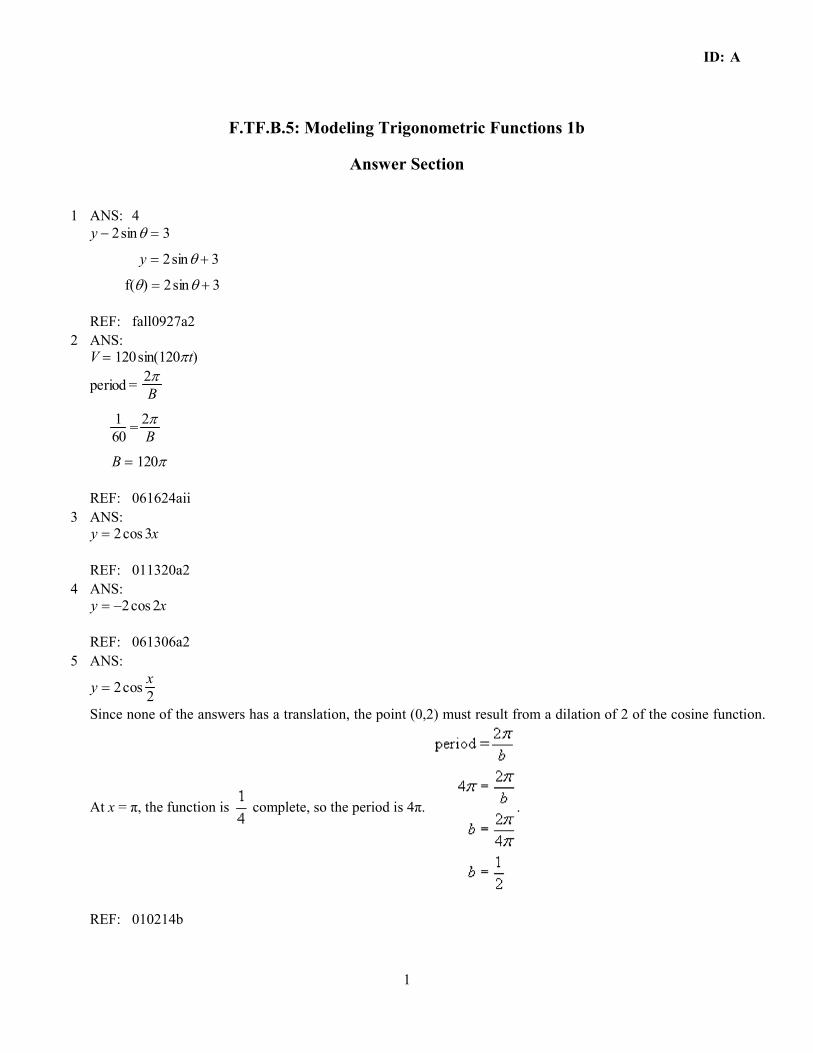
1 ANS: 4y − 2sinθ = 3
y = 2sinθ + 3
f(θ) = 2sinθ + 3
REF: fall0927a2 2 ANS:
V = 120sin(120πt)
period = 2πB
160 = 2π
B
B = 120π
REF: 061624aii 3 ANS:
y = 2cos 3x
REF: 011320a2 4 ANS:
y = −2cos 2x
REF: 061306a2 5 ANS:
y = 2cos x2
Since none of the answers has a translation, the point (0,2) must result from a dilation of 2 of the cosine function.
At x = π, the function is complete, so the period is 4π. .
REF: 010214b

ID: A
2
6 ANS: y = 1.5sinxThe maximum and minimum of this sine function indicates the amplitude is 1.5.
REF: 060608b 7 ANS:
y = cos x
REF: 060711b 8 ANS:
y = 12 cos 2x
REF: 061708aii 9 ANS:
y = 2sin 12 x
REF: 010419siii 10 ANS:
y = −2sinx
REF: 068633siii 11 ANS:
y = cos 12 x
REF: 018917siii 12 ANS:
y = −3sin 12 x
REF: 089522siii 13 ANS:
y = −2sin 12 x
REF: 069721siii 14 ANS:
y = 2cos 12 x
REF: 089725siii

ID: A
3
15 ANS:
y = 12 sin2x
REF: 019822siii 16 ANS:
y = 3sin2x
REF: 089820siii 17 ANS:
f(x) = 2cos x
REF: 010019siii 18 ANS:
y = 3sin 12 x
REF: 010119siii 19 ANS:
y = −3sinx
REF: 080121siii 20 ANS:
y = 2cos 12 x
REF: 081607a2 21 ANS:
y = sin 12 x
+ 1
The sine function has been translated +1. Since the maximum is 2 and the minimum is 0, the amplitude is 1.
.
REF: 010612b

ID: A
4
22 ANS: y = sin2x + 2The sine function has been translated +2. Since the maximum is 3 and the minimum is 1, the amplitude is 1.
.
REF: 080717b 23 ANS:
a = 2, b = 6, c = 3The cosine function has been translated +3. Since the maximum is 5 and the minimum is 1, the amplitude is 2. π3 = 2π
b
b = 6
.
REF: 011913aii 24 ANS:
y = −3cos π15 x
+ 5
2πb = 30
b = π15
REF: 011227a2 25 ANS:
d = 5sin π6 t
+ 9
a = 14− 42 = 5, d = 14+ 4
2 = 9
REF: 061810aii 26 ANS:
y = sec x
REF: 061020a2

ID: A
5
27 ANS: y = csc x
REF: 011123a2