From hospital to municipal cogeneration systems: an Italian case study
20
INTERNATIONAL JOURNAL OF ENERGY RESEARCH Int. J. Energy Res. 2007; 31:829–848 Published online 30 October 2006 in Wiley InterScience (www.interscience.wiley.com) DOI: 10.1002/er.1267 From hospital to municipal cogeneration systems: An Italian case study Damiana Chinese* ,y , Antonella Meneghetti, Gioacchino Nardin and Patrizia Simeoni DiEM}Dipartimento di Energetica e Macchine, University of Udine, Italy SUMMARY A mixed integer linear programming model combined with a more traditional design by scenarios is proposed to optimize facilities size and operation mode of a municipal energy system involving significant civil centres and a hospital. Moving from the need of a new heat and power station for the local hospital due to the construction of new pavilions, the opportunity of involving other centres in the neighbourhood in a distributed cogeneration system is analysed, increasing system complexity step by step. Smaller cogeneration units tailored to hospital needs are rewarding ventures with relatively low risks but, in a country whose traditional power generation systems heavily rely on fossil fuels and where energy policy and market conditions can make it profitable to sell surplus power, district heating systems foster the installation of larger cogenerators and lead thereby to higher profits and to better performance as for primary energy savings and greenhouse gases emission reduction. Copyright # 2006 John Wiley & Sons, Ltd. KEY WORDS: optimization models; cogeneration; district heating; hospitals; municipal energy systems 1. INTRODUCTION Technological evolution and progressive reduction of specific costs of energy conversion units have drastically improved perspectives for cogeneration and distributed energy generation. In Italy, this trend is nowadays fostered by liberalization of energy market, with new competitors coming to light, new investments in power generation and more opportunities to put power surplus on the market than in the past (Ambiente Italia et al., 1999). District heating can play a significant role in enhancing cogeneration facilities profitability, offering an efficient and secure recovery of waste heat. *Correspondence to: Damiana Chinese, DiEM, Department of Energy Technology, Via delle Scienze 208, 33100 Udine, Italy. y E-mail: [email protected] Contract/grant sponsor: Municipality of Udine Received 19 September 2006 Accepted 19 September 2006 Copyright # 2006 John Wiley & Sons, Ltd.
Transcript of From hospital to municipal cogeneration systems: an Italian case study

INTERNATIONAL JOURNAL OF ENERGY RESEARCHInt. J. Energy Res. 2007; 31:829–848Published online 30 October 2006 in Wiley InterScience(www.interscience.wiley.com) DOI: 10.1002/er.1267
From hospital to municipal cogeneration systems:An Italian case study
Damiana Chinese*,y, Antonella Meneghetti, Gioacchino Nardin and Patrizia Simeoni
DiEM}Dipartimento di Energetica e Macchine, University of Udine, Italy
SUMMARY
A mixed integer linear programming model combined with a more traditional design by scenarios isproposed to optimize facilities size and operation mode of a municipal energy system involving significantcivil centres and a hospital. Moving from the need of a new heat and power station for the local hospitaldue to the construction of new pavilions, the opportunity of involving other centres in the neighbourhoodin a distributed cogeneration system is analysed, increasing system complexity step by step.Smaller cogeneration units tailored to hospital needs are rewarding ventures with relatively low risks but,
in a country whose traditional power generation systems heavily rely on fossil fuels and where energypolicy and market conditions can make it profitable to sell surplus power, district heating systems foster theinstallation of larger cogenerators and lead thereby to higher profits and to better performance as forprimary energy savings and greenhouse gases emission reduction. Copyright # 2006 John Wiley & Sons,Ltd.
KEY WORDS: optimization models; cogeneration; district heating; hospitals; municipal energy systems
1. INTRODUCTION
Technological evolution and progressive reduction of specific costs of energy conversion unitshave drastically improved perspectives for cogeneration and distributed energy generation. InItaly, this trend is nowadays fostered by liberalization of energy market, with new competitorscoming to light, new investments in power generation and more opportunities to put powersurplus on the market than in the past (Ambiente Italia et al., 1999). District heating can play asignificant role in enhancing cogeneration facilities profitability, offering an efficient and securerecovery of waste heat.
*Correspondence to: Damiana Chinese, DiEM, Department of Energy Technology, Via delle Scienze 208, 33100 Udine,Italy.yE-mail: [email protected]
Contract/grant sponsor: Municipality of Udine
Received 19 September 2006Accepted 19 September 2006Copyright # 2006 John Wiley & Sons, Ltd.
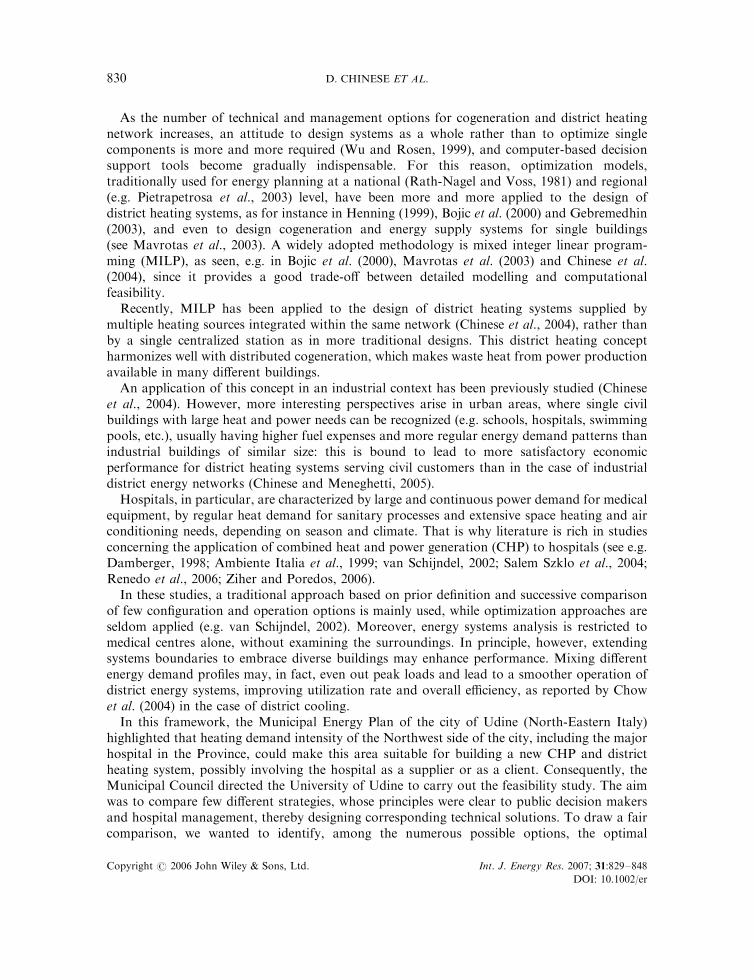
As the number of technical and management options for cogeneration and district heatingnetwork increases, an attitude to design systems as a whole rather than to optimize singlecomponents is more and more required (Wu and Rosen, 1999), and computer-based decisionsupport tools become gradually indispensable. For this reason, optimization models,traditionally used for energy planning at a national (Rath-Nagel and Voss, 1981) and regional(e.g. Pietrapetrosa et al., 2003) level, have been more and more applied to the design ofdistrict heating systems, as for instance in Henning (1999), Bojic et al. (2000) and Gebremedhin(2003), and even to design cogeneration and energy supply systems for single buildings(see Mavrotas et al., 2003). A widely adopted methodology is mixed integer linear program-ming (MILP), as seen, e.g. in Bojic et al. (2000), Mavrotas et al. (2003) and Chinese et al.(2004), since it provides a good trade-off between detailed modelling and computationalfeasibility.
Recently, MILP has been applied to the design of district heating systems supplied bymultiple heating sources integrated within the same network (Chinese et al., 2004), rather thanby a single centralized station as in more traditional designs. This district heating conceptharmonizes well with distributed cogeneration, which makes waste heat from power productionavailable in many different buildings.
An application of this concept in an industrial context has been previously studied (Chineseet al., 2004). However, more interesting perspectives arise in urban areas, where single civilbuildings with large heat and power needs can be recognized (e.g. schools, hospitals, swimmingpools, etc.), usually having higher fuel expenses and more regular energy demand patterns thanindustrial buildings of similar size: this is bound to lead to more satisfactory economicperformance for district heating systems serving civil customers than in the case of industrialdistrict energy networks (Chinese and Meneghetti, 2005).
Hospitals, in particular, are characterized by large and continuous power demand for medicalequipment, by regular heat demand for sanitary processes and extensive space heating and airconditioning needs, depending on season and climate. That is why literature is rich in studiesconcerning the application of combined heat and power generation (CHP) to hospitals (see e.g.Damberger, 1998; Ambiente Italia et al., 1999; van Schijndel, 2002; Salem Szklo et al., 2004;Renedo et al., 2006; Ziher and Poredos, 2006).
In these studies, a traditional approach based on prior definition and successive comparisonof few configuration and operation options is mainly used, while optimization approaches areseldom applied (e.g. van Schijndel, 2002). Moreover, energy systems analysis is restricted tomedical centres alone, without examining the surroundings. In principle, however, extendingsystems boundaries to embrace diverse buildings may enhance performance. Mixing differentenergy demand profiles may, in fact, even out peak loads and lead to a smoother operation ofdistrict energy systems, improving utilization rate and overall efficiency, as reported by Chowet al. (2004) in the case of district cooling.
In this framework, the Municipal Energy Plan of the city of Udine (North-Eastern Italy)highlighted that heating demand intensity of the Northwest side of the city, including the majorhospital in the Province, could make this area suitable for building a new CHP and districtheating system, possibly involving the hospital as a supplier or as a client. Consequently, theMunicipal Council directed the University of Udine to carry out the feasibility study. The aimwas to compare few different strategies, whose principles were clear to public decision makersand hospital management, thereby designing corresponding technical solutions. To draw a faircomparison, we wanted to identify, among the numerous possible options, the optimal
D. CHINESE ET AL.830
Copyright # 2006 John Wiley & Sons, Ltd. Int. J. Energy Res. 2007; 31:829–848
DOI: 10.1002/er

configuration and operation scheme implementing each strategy. To accomplish this task, wedeveloped a methodology based both on MILP and on proceeding by scenarios as in moretraditional design practices.
In the following sections, we introduce the case study, describing current energy situationin the area (Section 2) and developing possible scenarios reproducing various strategies(Section 3). In Section 4 the MILP optimization model is presented, while results are discussedin Section 5.
2. CURRENT ENERGY SITUATION OF NORTH-WEST SIDE OF UDINE CITY
The energy usage intensity by the North-West side of Udine city is mainly bound to therequirements by a few large civil centres, which could be connected to a district heating system.
The disposition of analysed buildings in the area is shown in Figure 1, while Table Isummarizes current technical and energy features of the building complexes and Table II givesan account of energy costs recently sustained by single centres.
As reported in Table I, which presents brief descriptions of various centres identified andnumbered in Figure 1, the area includes, beside the hospital, also three University buildingcomplexes and two swimming pools: so, there is a reasonable continuity in heating demand(especially by swimming pools) and a good variety in building usage too.
Currently, most of the examined centres are connected to local gas distribution network andhave autonomous natural gas boilers, which were mainly installed in the early 1990s. Anexception is represented by the Tomadini foundation (site 6), using quite old boilers fed byheavy fuel oil with limited sulphur content and partially with gas oil, which ought to be replacedin short time with natural gas boilers.
1
2
3
4
5
6
7
1 "Rizzi"
2 "Cotonificio"
3. "Kolbe"
4. Hospital
5. "AMGA"
6. "Tomadini”
7. “Palamostre”
Figure 1. The North-West side of Udine city with energy intensive building complexes.
FROM HOSPITAL TO MUNICIPAL COGENERATION SYSTEMS 831
Copyright # 2006 John Wiley & Sons, Ltd. Int. J. Energy Res. 2007; 31:829–848
DOI: 10.1002/er

TableI.
Energyconsumptionoftheanalysedcentres
(year2003)(TOE¼
equivalenttonsofoil).
Buildingor
building
complex
Site
number
Description
Totalheated
volumesðm
3Þ
Existingheating
system
s
Totalcapacity
ofexisting
heatingsystem
ðkW
tÞFuel
type
Fuel
quantity
(unityear�
1)
Electric
energy
(kWhyear�
1)
Totalenergy
dem
and
(TOEyear�
1)
Rizzi
1University
centrefor
scientificandtech-
nologicalfaculties
150000
Threeboilers,pro-
vidinghotwater
at858C
6050
Natural
gas
339000m
33900000
1120
Cotonificio
2University
labsand
researchdepart-
ments
62300
Twoboilers,provid-
inghotwaterat
758C;tw
onatural
gasboilersproviding
hotwaterat708C
3950
Natural
gas
91500m
3778000
243
Kolbe
3University
confer-
ence
hall,greenhouse
22600
Threeboilers,pro-
vidinghotwater
at708C
1230
Natural
gas
72000m
3743000
219
Hospital
4Largehospitalcom-
plexincluding23
buildings,14medical
divisionsandabout
800beds
520000
Twosteam
genera-
tors,partiallyused
forprocess
steam,
mainly
exchanging
heatto
thehotwater
distributionsystem
11300(approx-
imate
capacity,
17t=hsteam,
45–50bar;
4608C
)
Natural
gas
5396000m
318180000
8370
AMGA
5Threeoffice
build-
ings,chem
icallab,
warehouse
45000
Onecondensation
boiler
1200
Natural
gas
151000m
3818000
301
Fourgroupsof
twinned
boilers
(pairsofboilers
regulatedto
operate
alternately
inorder
toguaranteemaxi-
mum
reliability)
Onetraditional
boiler
Tomadini
6Boardingschoolfor
270students,confer-
ence
hall,church,
gymnasium
andin-
doorsw
immingpool
70600
Threeboilerspro-
vidinghotwaterand
usingheavyfuel
oil
withlow
sulphur
contentand,
partially,gasoil
2480
Heavy
low-sul-
phurfuel
oil
295000kg
510000
354
Gasoil
17800l
Palamostre
7Indoorandoutdoor
swim
mingpool,art
galleryandtheater
20700
Threehotwater
boilers
2100
Natural
gas
798000m
3570000
783
D. CHINESE ET AL.832
Copyright # 2006 John Wiley & Sons, Ltd. Int. J. Energy Res. 2007; 31:829–848
DOI: 10.1002/er

It should be underlined that all heat distribution systems within various complexes use hotwater as a heat carrier. Even at the hospital, where heat is produced by steam generators, heatexchangers are installed so that existing space heating systems and absorption cooling groupsare fed by hot water. Hence, hot water could be a suitable energy carrier for a district heatingsystem serving all the sets of buildings.
The hospital is the major energy consumer in the area, as emerges from Tables I and II, and itis also going to increase its energy needs. Within the hospital complex, new edifices for a totalvolume of 300 000 m3 are being built, including a new technical and CHP station meant to servethe hospital.
Energy requirements of the enlarged hospital centre will be considered in this study.Additional winter heating requirements are estimated as a percentage of 20% of current total
needs, considering the new volumes and the greater number of indoor air changes requested bypresent legislation, and taking an indoor temperature of 228C as reference for the whole day.
Hourly heat demand for a reference day in each month of the heating period has been drawnfor the hospital and for all examined centres considering a steady state, dispersion by walls andair change proportional to the difference between indoor and outdoor temperature, butnegligible anthropic contribution and dispersion by windows. Theoretical curves have beensuccessively corrected by comparison with actual consumption derived by monthly fuel invoices.
As for the hospital, a significant heat demand over summer months is currently associatedwith existing hot-water-fed absorption cooling systems.
Since summer heating demand by other centres is comparatively small, future seasonalpattern of thermal energy requirements will strongly depend on the type of refrigeration systemthat will be adopted at the hospital. If existing absorption groups are maintained and integratedby vapour-compression systems for the new buildings, then thermal requirements can beconsidered unchanged, while if an absorption system is chosen also for the new buildings, totalsummer heating demand will be enhanced significantly. Summer thermal energy demand curvesof the current configuration have been drawn by adopting a simulation program (Agnolettoet al., 1995) based on response factors and setting a 24 h day�1 operating period, referenceindoor temperature of 258C; indoor convective loads equal to 8Wm�2; indoor air changes of1:32 volumes hour�1: These profiles have been successively updated taking into accountrefrigeration systems efficiency in order to estimate actual demand curves to be covered byhospital facilities.
Table II. Energy costs of the analysed centres (year 2003).
Thermal energy Electric energy
CentresUnit costðch=m3Þ
Tax(%)
Totalðh year�1Þ
Unit costðch=m3Þ
Tax(%)
Totalðh year�1Þ
Hospital 40.0 20 2 590 000 8.20 20 1 790 000Rizzi 55.0 20 224 000 9.15 20 428 000Cotonificio 55.0 20 60 400 10.25 20 95 700Kolbe 55.0 20 47 500 10.25 20 91 400Tomadini 52.6 10 188 000 9.70 20 62 600AMGA 46.0 20 83 500 9.15 20 89 800Palamostre 57.6 20 552 000 12.50 20 85 500
FROM HOSPITAL TO MUNICIPAL COGENERATION SYSTEMS 833
Copyright # 2006 John Wiley & Sons, Ltd. Int. J. Energy Res. 2007; 31:829–848
DOI: 10.1002/er
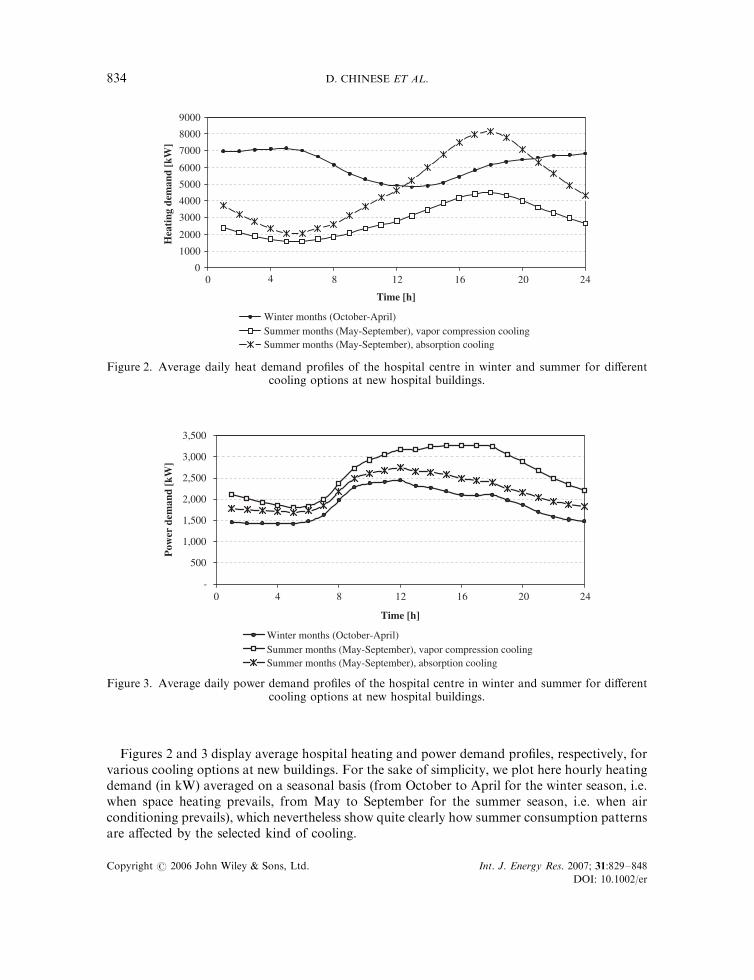
Figures 2 and 3 display average hospital heating and power demand profiles, respectively, forvarious cooling options at new buildings. For the sake of simplicity, we plot here hourly heatingdemand (in kW) averaged on a seasonal basis (from October to April for the winter season, i.e.when space heating prevails, from May to September for the summer season, i.e. when airconditioning prevails), which nevertheless show quite clearly how summer consumption patternsare affected by the selected kind of cooling.
0
1000
2000
3000
4000
5000
6000
7000
8000
9000
0 8 12 16 20 24
Time [h]
Hea
ting
dem
and
[kW
]
Winter months (October-April)Summer months (May-September), vapor compression coolingSummer months (May-September), absorption cooling
4
Figure 2. Average daily heat demand profiles of the hospital centre in winter and summer for differentcooling options at new hospital buildings.
-
500
1,000
1,500
2,000
2,500
3,000
3,500
0 4 8 12 16 20 24
Pow
er d
eman
d [k
W]
Time [h]
Winter months (October-April)Summer months (May-September), vapor compression coolingSummer months (May-September), absorption cooling
Figure 3. Average daily power demand profiles of the hospital centre in winter and summer for differentcooling options at new hospital buildings.
D. CHINESE ET AL.834
Copyright # 2006 John Wiley & Sons, Ltd. Int. J. Energy Res. 2007; 31:829–848
DOI: 10.1002/er

As regards electrical energy requirements, all centres are currently served only by the nationalgrid. Recorded demand profiles have been elaborated so that hourly demand curves for thereference day in each month could be drawn.
3. DEVELOPING SCENARIOS FOR A MUNICIPAL COGENERATION SYSTEM
The need of a new heat and power station at the hospital induced public decision makers toevaluate how the strategies by the Municipal Energy Program for a new CHP and districtheating system could be put into practice. Discussing with municipal and hospital managers, itemerged that it is either possible to settle for a cogeneration system serving the sole hospital orto pursue the development of a district heating system including the hospital as a major supplieror customer. In the first case, a cogeneration system could be tailored to hospital’s powerrequirements, that is to say possibly avoiding power purchase and surplus power sales, or wecould consider the opportunity of putting power surplus on the market and size the systemaccordingly. In the second case, it is either possible to conceive a central district heating stationat the hospital, i.e. within planned hospital CHP station, or to try and conceive an external,distributed cogeneration solution.
In every case, the system should be fueled with natural gas, which is already distributed in thearea and used by most buildings, as it is characterized by lower environmental impact, lowercosts and higher social acceptability than gas oil or fuel oil.
To carry out the feasibility study, we decided to proceed by creating four different scenariosimplementing these strategies, with the objective of identifying for each of them the besttechnical solution, that is to say, the best size and combination of cogenerators and peak loadboilers to be installed and their best operational schedule, taking into account differences inspecific capital costs, efficiency and maintenance costs and variations of heat and power demandand of energy price. To this end, an optimization model should be conceived, reflectingconstraints and systems boundaries of each scenario. In the following, we define each scenarioby qualitatively establishing which constraints it should meet and which costs and referencesystems for comparison should be considered in each case.
3.1. Scenario 1: a power station covering hospital energy demand
This scenario reflects the original hospital management preference for an internal CHP stationthat covers hospital’s power demand in a self-sufficiency perspective, avoiding to put powersurplus on the market. This choice arises from the need of limiting hospital centre dependencyon external power supply, on one hand, and, on the other hand, of maintaining a limitedcomplexity of service facilities so that they could be managed by internal staff. We translatethese specifications into constraints to have zero power sales and to cover electrical energydemand by the hospital continuously and completely, which may lead to dissipate waste heatfrom the engines in case internal power and heating demand do not match.
As for economic variables to be evaluated, only costs pertaining to hospital’s facilities will beconsidered. Thus, capital costs include cogenerators and boilers purchase, engineering andinstallation costs, operation costs include fuel and maintenance costs.
As a reference scenario for comparison, a base situation with new natural gas hot waterboilers for meeting hospital’s heating demand, vapour-compression chillers in the new buildingsand external power supply is considered.
FROM HOSPITAL TO MUNICIPAL COGENERATION SYSTEMS 835
Copyright # 2006 John Wiley & Sons, Ltd. Int. J. Energy Res. 2007; 31:829–848
DOI: 10.1002/er

3.2. Scenario 2: from self-sufficiency to market
In order to allow technical staff to focus on core competences, i.e. medical technical services,hospital managers are also thinking of contracting out the construction and conduction of thecogeneration system to some energy saving company.
Energy saving companies would have the skills to manage technical and administrative issuesconnected to put surplus power on the market, so they could do it in order to gain extra profitsfrom the liberalized energy market. Thus, there will be no limitation on power sales in thisscenario, while other constraints on power demand remain unchanged and heat dissipation isallowed. As size of cogenerators could increase in this case, an upper bound should be imposedto guarantee that energy conversion units fit into the planned hospital’s CHP station building.The same is done for integration boilers too. The reference scenario for comparison and thekinds of costs to be considered are the same as in Scenario 1, but incomes from power salesshould also be taken into account in this case.
3.3. Scenario 3: introducing a district heating network
In this scenario, we examine the opportunity of providing heating also to nearby buildingcomplexes, identified in Section 2, by means of a district heating network departing from theCHP station at the hospital. In this case, the construction and operation of the CHP station atthe hospital and of the district heating network built on public grounds would be contracted outon behalf of both the hospital and the municipality.
Besides money flows considered in Scenario 2, costs of the district heating system shouldbe considered now. Total costs of pipes, pumping systems and substations and heatexchangers will be estimated based on full loads by every connected centre and assumingthat hot water is fed into the district heating network at a maximum temperature of 998C;with an available thermal drop of 20–258C: Annual network operation and management costswill be estimated as a proportion of initial investments in the district heating subsystem.The reference scenario for comparison now embraces all the centres, assuming for simplicitythat up to date, independent natural gas boilers meet heating demand by every buildingcomplex.
3.4. Scenario 4: a municipal cogeneration system
In line with the fourth strategy, a more innovative district heating and distributed cogenera-tion solution with at least one CHP station external to the hospital should be conceived.According to public and hospital managers, in fact, building a CHP station out of hospitalgrounds could generate several long term and administrative advantages. District heatingpipes and at least one feeding station could be built on public grounds and thus be finallyowned by the municipality, which would hence possess a functionally complete system. Inthis way, the municipality expects to achieve a better bargaining position and higher flexi-bility in managing tenders and contracting procedures. Actually, more restrictive require-ments are likely to characterize the central district heating station located within thehospital centre.
As explained in Scenario 2, a space bound limits the size of cogenerators and boilers whichcould be installed at the hospital: this could represent an heavy restriction from the perspectiveof further expansion of the district heating network. Smaller buildings in the same area and
D. CHINESE ET AL.836
Copyright # 2006 John Wiley & Sons, Ltd. Int. J. Energy Res. 2007; 31:829–848
DOI: 10.1002/er

other neighbouring quarters of the city could, in fact, be served by the district heatingsystem after the initial connection of the core buildings identified in this study. Secondarily,higher safety assurance and more efficient pollution and noise abatement systems could berequired by local health, safety and environment protection authorities for energy conversionsystems located within a medical complex, which could result in unexpectedly highinvestments. Mentioned uncertainties and strategic issues could be hardly monetized, butstill they induce public decision makers to consider this solution as a valid alternative,provided its economic feasibility can be proved. On the other hand, hospital managerswould also appreciate a solution enabling the hospital to own and operate an internalcogeneration system designed according to hospital’s original plans (Scenario 1) andto purchase peak load heat at a favourable price from a district heating network ratherthan self-produce it.
To mirror these views, we conceived a system where the role of major energy producer andcontroller of the system is shifted outside the hospital centre towards the local water and naturalgas provider named AMGA (see Figure 1 and Table I). AMGA is, in fact, sited in a barycentricposition with respect to the other centres to be served and can provide skilled personnel tocontrol the whole system.
Therefore, AMGA energy station is charged with the main cogenerator and integrationboilers, while a second cogenerator is sited in the hospital power station and sized for hospitalelectrical energy demand. This choice allows to satisfy the request of power self-sufficiencyexpressed by hospital management, while, as to thermal energy, the hospital could get heat fromthe district heating network during hospital’s high demand periods and supply the system withits exceeding cogenerated heat when internal heating demand is low.
We developed two versions (a and b) of Scenario 4, to consider the different organizationalforms the venture can take. In particular, in Scenario 4a the hospital cogenerator is treated as aseparated investment, and its configuration and operation schedule are those designed inScenario 1, while the external cogenerator design is based on integration heating requirementsby the hospital and on heating demand of the other buildings. Only capital costs of the externalsystem (district heating network and second cogeneration group) are considered in this case,and, similarly, operation costs and savings bound to power production at the hospital are nottaken into account. In Scenario 4b, instead, the hospital cogenerator is recognized as part of theventure and the system is designed and optimized as a whole. Therefore, all capital costs,operational costs, savings and incomes from power sales are taken into account. In Scenario 4a,the reference system for comparison is represented by all the examined buildings but the hospitalplus hospital integration heating demand as calculated in Scenario 1, while in Scenario 4b thecomparison system is the same as in Scenario 3.
4. THE OPTIMIZATION MODEL
A MILP model has been conceived to optimize the size and operation mode of the describedcogeneration system in its different levels of complexity (from Scenarios 1 to 4). The model istime-dependent, in that it allows energy demand variations along the day and the year andhourly power sale price differentiation as proposed by the Italian Energy Bureau (AEEG, 2004).Data on hourly energy demand in working days and weekends averaged on a monthly basishave been grouped according to power tariff levels. By adding short periods to model peak
FROM HOSPITAL TO MUNICIPAL COGENERATION SYSTEMS 837
Copyright # 2006 John Wiley & Sons, Ltd. Int. J. Energy Res. 2007; 31:829–848
DOI: 10.1002/er

loads, 41 time periods have been obtained and power and heating demand profiles have beendiscretized accordingly (Gustafsson, 1998).
In the following subsections, model elements are described.
4.1. Variables
The main variables of the model are:
* Thermal capacities CapTh (kWt) for each heat technology techTh and production unituThz selected in each centre z:
* Electrical capacities CapEl ðkWeÞ for each production unit uElz selected in each centre zwith electrical energy technology techEl.
* Thermal power PowTh prod ðkWtÞ and electrical power PowEl prod ðkWeÞ produced byeach unit uThz and uElz; respectively.
* Electrical power PowEl sale ðkWeÞ produced for sales by each unit uElz:* Thermal power PowTh diss ðkWtÞ which is dissipated when it is necessary or profitable to
generate power even in the absence of a corresponding heating demand.* Natural gas amounts GasQty needed to produce energy flows for different uses us.
Different energy destinations (internal consumption, sales; . . .) imply different gas pricesdue to current tax system, which encourages cogeneration and district heating.
* Electrical energy ElQty purchased by each centre, including the hospital (if we relax theconstraint of meeting internal requirements) and}in Scenario 4}the AMGA centre, incase it is more convenient to buy electricity than to produce it locally.
Binary variables (bin) are introduced as needed to model scale economies and Italian taxsystem.
4.2. Parameters
The following parameters are taken into account:
* Investment costs, characterized by a variable component CostVarInv proportional tofacility sizes and a size-independent component CostFixInv.
* Costs related to district heating: pipeline installation CostDHpipe and operation costsCostDHop (pumping, personnel, maintenance) of the network.
* Costs of fuel, CostGas, dependent on the kind of final use us and cost of purchasedelectrical energy CostEl.
* Operation costs of electrical (El) and thermal (Th) facilities CostOp, including personnel,administration and maintenance.
* Dissipation cost CostDiss, related to costs of electrical energy consumed by dissipators.* Electrical energy sale price PriceEl, function of time period t (AEEG, 2004).* Thermal and electrical energy demand of each centre in every time period t; calculated for
each centre z by multiplying the duration of the time span in hours h by the required heatflow PowTh dem ðkWtÞ and the required power flow PowEl dem ðkWeÞ; respectively, bothaveraged on time span t:
* Technical performance measures related to each technology such as efficiency, power toheat ratio ðaÞ; dissipation coefficient and so on.
D. CHINESE ET AL.838
Copyright # 2006 John Wiley & Sons, Ltd. Int. J. Energy Res. 2007; 31:829–848
DOI: 10.1002/er

4.3. The objective function
The objective function is minimized and represents the total cost per year of the energy system ineach previously identified configuration (see paragraph 3); its simplified form is
min
annDHpipe � CostDHpipeþ CostDHopþP
t CostElt � ElQtyt � ht
þP
z;uThz;techThannuThz;techTh �
CostVarInvuThz;techTh � CapThuThz;techTh
þ binTh � CostFixInvuThz;techTh
0@
1A
þP
z;uElz ;techElannuElz;techEl �
CostVarInvuElz;techEl � CapEluElz;techEl
þ binEl � CostFixInvuElz;techEl
0@
1A
þP
us;z;uThz;techTh;tCostGasus;uThz � GasQtyus;uThz;techTh;t
þP
us;z;uElz;techEl;tCostGasus;uElz � GasQtyus;uElz;techEl;t
þP
z;uElz;techEl;tCostDisst � PowTh dissuElz ;techEl;t � ht
þP
z;uThz;techTh;tCostOpuThz;techTh;t � ht þ
Pz;uElz;techEl;t
CostOpuElz ;techEl;t � ht
�P
z;uElz;techEl;tPriceElt � PowEl saleuElz;techEl;t � ht
8>>>>>>>>>>>>>>>>>>>>>>>>>>>>>>>><>>>>>>>>>>>>>>>>>>>>>>>>>>>>>>>>:
9>>>>>>>>>>>>>>>>>>>>>>>>>>>>>>>>=>>>>>>>>>>>>>>>>>>>>>>>>>>>>>>>>;
ð1Þ
Investment costs are expressed on yearly basis by introducing the annuity factor ann dependingon expected life of each facility. Positive cash flows from electrical energy sales are then takeninto account by related incomes.
4.4. Constraints
From a functional point of view, two main types of constraints can be recognized:
* energy flow balances, which relate fuel amounts and purchased electrical energy to energyforms produced by the analysed system and to energy demand to be covered;
* capacity constraints, which relate operation modes and electrical and thermal powerproduced in each time period to installed capacities in system centres and guide facility sizeselection on the basis of actual commercial ranges.
Most important energy flow constraints are reported below and discussed in the following:X
uElz ;techEl
ðPowEl produElz;techEl;t � PowEl saleuElz;techEl;tÞ ¼ PowEl demz;t � ElQtyz;t8z;8t ð2Þ
Xz;uElz ;techTh
PowTh produThz;techTh;t þX
z;uElz;techEl
PowEl produElz;techEl;t
atechEl
¼Xz
PowTh demz;t þX
z;uElz;techEl;t
PowTh dissuElz;techEl;t 8t ð3Þ
FROM HOSPITAL TO MUNICIPAL COGENERATION SYSTEMS 839
Copyright # 2006 John Wiley & Sons, Ltd. Int. J. Energy Res. 2007; 31:829–848
DOI: 10.1002/er

GasQtyself ;uElz;techEl;t þ GasQtysales;uElz ;techEl;t40:25 � PowEl produElz ;techEl;t � ht
8z; 8uElz;8techEl;8t ð4Þ
XuElz;techEl;t
PowEl produElz ;techEl;t � ht50:1
PuThz;techTh;t
PowTh produThz;techTh;t � ht
þP
uElz;techEl;t
PowEl produElz;techEl;t
atechEl� ht
26664
377758z ð5Þ
Electrical energy flow balance (Equation (2)) is imposed at every centre to model self-sufficiencyas in the hospital case. Heat flow balance is, on the contrary, set at a global level as shown inEquation (3), where demanded power has been properly increased to take into account lossesalong the pipeline.
Depending on the scenario being analysed, constraints are introduced to model chara-cteristics of that configuration; for example, in Scenario 1, only the hospital centre isanalysed and both electrical power purchase and sale are excluded, ElQty and PowEl sale areset to zero.
A peculiarity of Italian energy system is its taxation, which requires the introduction of specialconstraints that differentiate our model from others in literature (Mavrotas et al., 2003;Sundberg and Henning, 2002). In particular, natural gas taxes vary depending on adoptedtechnology and final use of energy produced; special reductions are established for cogeneration(with slightly higher discounts for self consumed power}self in Equation (4)}than for soldpower}sales in Equation (4)) and for district heating. Fuel quantity with reduced tax is limitedto 0:25 Nm3 kW�1 h�1 (see Equation (4)), and a reduction is also granted to district heatingpeak load boilers coupled with cogeneration systems, provided that a minimum power to heatratio is satisfied over the year (see Equation (5)).
While Equation (4) promotes higher electric efficiency of cogenerators, Equation (5) requiresa minimum annual amount of produced electrical energy, actually setting a very relaxed bound:the required power to heat ratio is just 10% and thus the difference between the overall efficiencyof the CHP system and of a traditional system could be very small. This seems to foster theinstallation of cogenerators in order to take advantage from discounts on fuels for heatingsystems rather than to efficiently generate power; this disadvantage is, however, limited by highspecific costs of cogeneration units.
Beside usual capacity constraints (see e.g. Chinese et al., 2004), obliging energy flows by singleequipments not to exceed equipment capacity and installed capacities to be comprised withincommercially available ranges, a site-specific capacity constraint was introduced, imposingupper bounds to total power generation or, respectively, heat generation capacity at each site.In this way, the same model can be used to reflect different scenarios by modifying the valuesof capacity bounds at different sites: in Scenario 3, we allow large boilers and cogeneratorsto be installed at the hospital, while in Scenario 4, to model the construction of an externalCHP station at the AMGA, we limit power generation capacity at the hospital to minimumvalues meeting averaged peak demand and inhibit installation and use of boilers at thehospital station.
Finally, it should be observed that modelling fiscal incentives also requires to express logicalconditions and limitations (e.g. some benefits apply to cogeneration units only in the periods oflocal consumption, constraint 5 only applies when and where power is produced). These logical
D. CHINESE ET AL.840
Copyright # 2006 John Wiley & Sons, Ltd. Int. J. Energy Res. 2007; 31:829–848
DOI: 10.1002/er

conditions are modelled by adding auxiliary binary variables, working as flags which dropconstraints that do not hold (we refer to Williams (1990) about modelling logical conditionsin MILP).
5. RESULTS AND DISCUSSION
The model was implemented in AMPL1 (Fourer et al., 2003) and solved with the commercialsolver CPLEXTM (ILOG, 2002). Up to date natural gas boilers are adopted as heat generationtechnology. As power generation technologies, we consider three classes of gas engines,depending on the number of revolutions per minute and size (from slow engines, 750 rpm and aminimum capacity of 5000 kWe; to fast engines, 1500 rpm and a maximum capacity of 2400kWe; with medium engines at 1000 rpm and capacities from 2400 to 5000 kWeÞ: Gas turbines(minimum capacity of 1500 kWe) were initially tested, but they were never selected by theoptimization procedure, mainly because of their high specific cost and limited part loadoperation capabilities.
The total number of variables and constraints increases when progressing from anindependent CHP system with no sale opportunities (Scenario 1) to a market oriented butindependent cogeneration system (Scenario 2) up to a district heating system firstly involving asingle cogenerator (Scenario 3 and 4a), then two cogenerators located in different sites (Scenario4b). Problem size thus varies from 1259 variables}thereof 49 binary}and 2107 constraints inScenario 1 up to 3385 variables}thereof 100 binary}and 5078 constraints in Scenario 4b.
5.1. Sizing and overall performance
Results of the optimization model are summarized in Tables III and IV. As for cogeneratorsizing (see Table III), it should be stressed that, although the model allowed to install more unitsat the same site, e.g. to better manage part load operation, the optimization procedure alwayssettles for a single engine, thereby increasing heat dissipation levels if required.
It can also be observed that larger engines are preferred, because of their lower specific andmaintenance costs and partly because fuel detaxation makes an intense use of cogenerators formeeting heat requirements a cost effective option. For example, a capacity of 5000 kWe isinstalled in Scenario 1 and is always operated at partial load, as peak power demand of thehospital is about 3200 kWe: The size of cogenerators installed at the hospital grows in Scenario2 and 3, whereas in Scenario 4b the joint optimization of distributed cogeneration units leads toinstall a smaller engine at the hospital than in Scenario 1.
Table III. Optimal facility sizes for each scenario.
Hospital centrecogenerator ðkWeÞ
Hospital centreintegration boiler ðkWtÞ
AMGA centrecogenerator ðkWeÞ
AMGA centreintegration boiler ðkWtÞ
Scenario 1 5000 8300 } }Scenario 2 7400 1000 } }Scenario 3 8500 8500 } }Scenario 4a 5000 } 7900 7600Scenario 4b 3300 } 8000 7600
FROM HOSPITAL TO MUNICIPAL COGENERATION SYSTEMS 841
Copyright # 2006 John Wiley & Sons, Ltd. Int. J. Energy Res. 2007; 31:829–848
DOI: 10.1002/er

Considering overall performances (see Table IV), it can be observed that all scenarios achievepositive performances both from an economic and a primary energy saving and GreenhouseGas (GHG) emission reduction perspective. Scenario 1 proves to be a low risk scenario (smallcogenerator, small pay-back period, very high ratio between Net Present Value (NPV) andinvestment), with little heat dissipation but also with limited reduction of energy consumptionand GHG emissions and relatively small NPV. Better performances obtained in Scenario 2 areassociated with higher risks, since a larger cogenerator is installed and economic results largelydepend on putting power on the market, which can be a source of uncertainty. Emissionreduction and primary energy savings are remarkably better, in spite of large heat dissipation,because in Italy average GHG emissions and fossil fuel consumption per unit of traditionallygenerated power are anyway higher (values were obtained from ENEL, 2002 and from RegioneFriuli Venezia Giulia, 2003).
Thanks to district heating, heat dissipation is significantly reduced in Scenario 3, whichappears the best one looking at NPV, GHG emission and primary energy consumptionreduction and also considering the small increase in pay-back time compared to Scenario 1. Thissuggests how the need of a new hospital power station, if analysed from the wider perspective ofservice to municipality rather than to hospital centre only, can lead to a real application ofurban Facilities Management and be a chance of technological and economical development forlocal community. Scenario 4 is economically sub-optimal, mainly due to investment duplication,yet its overall performance is positive, and, as to the 4b variant, comparable with Scenario 3especially from an emission reduction perspective.
The main role played by hospital centre to foster a new energy system in the North-West sideof Udine city is highlighted by the high pay-back period achievable in Scenario 4a, wherehospital acts as a heat buyer for integration only. Power demand of hospital buildings representsa key element for profitability of the whole venture and variant 4b is definitely more practicablethan variant 4a.
Because of very high heat dissipation, large size of cogenerators and high dependence onpower sales, Scenario 4 is likely to be the most sensitive to internal and external sources ofuncertainty, which have not been dealt with so far as the model is deterministic. In view of thatand of the strategic importance that decision makers placed to this scenario (see Section 3.4), wewill briefly present a sensitivity analysis for Scenario 4b.
5.2. Sensitivity analysis for Scenario 4b
Five main sources of uncertainty have been identified, which arise in all scenarios.
Table IV. Investments and performances for each scenario (tCO2Eq ¼ equivalent tons of CO2).
Investment(kEuro)
Net PresentValue (NPV)
(kEuro)Pay-back
period (years)Energy savingsðTOE year�1Þ
Avoided emissionsðtCO2Eq year
�1ÞDissipated heat(MWh year�1)
Scenario 1 2874 13 860 2.08 3366 7391 1183Scenario 2 4244 20 450 1.84 6000 12 740 6443Scenario 3 6524 23 560 2.46 7573 16 090 4812Scenario 4a 5805 5806 5.74 4645 9259 11 390Scenario 4b 8371 19 680 3.48 7866 16 200 10 960
D. CHINESE ET AL.842
Copyright # 2006 John Wiley & Sons, Ltd. Int. J. Energy Res. 2007; 31:829–848
DOI: 10.1002/er

Two of them are internal, depending on errors in estimating internal properties and behaviourof the system:
1. Possible variations of values of thermal and electric peak load, to be carefully consideredbecause our dimensioning criterion was to fully cover hospital’s power demand.
2. Design choices which will be made for air conditioning of new hospital buildings, as thefinal proportion of vapour-compression and of absorption cooling is still unknown.
On the other hand, three main sources of uncertainty are associated with external conditions,represented by:
1. Actual levels of power buy-back tariffs, which may be linked to traders’ remunerationpercentage.
2. General levels of energy prices.3. Equipment grants that can be obtained by local authorities. Many Italian regions, in fact
support district heating and cogeneration projects through equipment grants, whichimprove pay-back periods of investments; however, the availability and the proportion ofequipment costs covered by such grants is not fixed.
As for peak load variations, we have analysed robustness of solutions to variations of electricand thermal loads in the most critical time periods, that are January for heating demand, Juneand July for power demand in the vapour-compression air conditioning case and December forpower demand in the absorption cooling case.
As can be seen in Figure 4(a), the optimal cogenerator size located in AMGA power station isbasically robust and only the size of the integration boiler changes. Demand variations havemore significant effects on the cogenerator to be installed at the hospital centre; as highlighted inFigure 4(b), however, peak load fluctuations have small impact both on NPV and pay-backperiod (note that pay-back period axis values range from 3 to 4).
Although the original view of hospital technical management was to adopt a compressionconditioning system for the new buildings, results of the analysis reported in Table V clearlyshow that chilling also new buildings with an absorption cooling system in summer is the betterchoice. The increased exploitation of waste heat in summer and the opportunity to produce andsell extra power in that season, when power tariffs reach their peak, fully compensate foradditional investments in absorption cooling groups, leading to a 23% increase of NPV,compared to the vapour-compression option, and to a better pay-back period, too. It isinteresting to note that, in the absorption cooling option, larger cogenerators would be installedat AMGA power station, whereas hospital cogenerator size needed to cover internal energyrequirements would decrease because electrical demand in summer would be smaller than in thevapour-compression case.
The variability of buy-back tariffs is considered by augmenting the remuneration share byenergy traders. The reference value of the percentage on electrical energy price required bytraders used in the model was 4% and the corresponding net wholesale tariffs were, on average,about 65% of end user tariffs. We have gradually increased remuneration percentage up to 20%,which means an average buy-back tariff of about 54% of power end user tariffs.
As highlighted by Figure 5 increasing percentages lead to smaller and smaller optimal size ofthe main cogenerator at AMGA power station, while larger peak load boilers are selected.Reduced profit by electrical energy sales are, in fact, counterbalanced by limited investments in
FROM HOSPITAL TO MUNICIPAL COGENERATION SYSTEMS 843
Copyright # 2006 John Wiley & Sons, Ltd. Int. J. Energy Res. 2007; 31:829–848
DOI: 10.1002/er

order to control NPV decrease, which is nevertheless notable, while pay-back periods remainalmost unchanged.
Considering future fluctuations of costs and sale price of fuels and electrical energy, weperformed sensitivity analysis assuming natural gas costs and electrical energy costs and pricesto be mutually linked, since they all depend on oil cost. It was observed that optimal energyfacility sizes are robust for small negative variations of energy costs and prices, while morepowerful cogenerators and smaller integration boilers are selected by the model when increasesof those parameters are recorded. A positive trend of energy costs and prices leads to improvedeconomical performances (see Figure 6), with potentials fully exploited by adapting facility sizesto follow electrical energy incomes.
Concerning the availability and amount of public subsidies, we have examined the possibilityto receive such grants in a variable proportion (up to 30%) of total investment. Table VI showshow such non-repayable equipment subsidies induce the model to select greater sizes for the
0
2000
4000
6000
8000
10000
12000
14000
16000
[kW
]
AMGA cogenerator [kWe]
AMGA integration boiler [kWt]
Hospital cogenerator [kWe]
0
5,000,000
10,000,000
15,000,000
20,000,000
90% 100% 105% 110% 120% 130% 160%
Electrical and thermal peak loads variation
90% 100% 105% 110% 120% 130% 160%
Electrical and thermal peak loads variation
NP
V [
Eu
ro]
3.00
3.20
3.40
3.60
3.80
4.00
Pay
bac
k p
erio
d [
year
s]
NPV payback period
(a)
(b)
Scenario 4b: Energy facilities size
Scenario 4b: Investment indices
Figure 4. Sensitivity to thermal and electric peak loads variations: (a) effects on facilities size;and (b) investment indices.
D. CHINESE ET AL.844
Copyright # 2006 John Wiley & Sons, Ltd. Int. J. Energy Res. 2007; 31:829–848
DOI: 10.1002/er

main cogenerator, stabilizing the choice at 8500 kWe: Public grants enable the municipal energysystem to gain better performances, due to enhanced capacity of producing and selling electricalenergy. This improves GHG emission reduction by further substituting electrical energy
Table V. Sensitivity to air conditioning system type: effects on facilities size and investment indices.
Cooling technology Vapour compression Absorption
Capacity of cogenerator at AMGA ðkWeÞ 8000 8500Capacity of integration boiler at AMGA ðkWtÞ 7600 7000Capacity of cogenerator at the hospital ðkWeÞ 3200 2600NPV ðkhÞ 19 680 24 280Simple pay-back period (years) 3.44 2.93
Scenario 4b: Energy facilities size
0
2000
4000
6000
8000
10000
12000
4% 8% 12% 16% 20%
Traders' remuneration on energy price
[kW
]
AMGA cogenerator [kWe] AMGA integration boiler [kWt]Hospital cogenerator [kWe]
Scenario 4b: Investment indices
0
2,000,000
4,000,000
6,000,000
8,000,000
10,000,000
12,000,000
14,000,000
16,000,000
18,000,000
20,000,000
22,000,000
4% 8% 12% 16% 20%
Traders' remuneration on energy price
NP
V [
Eu
ro]
3.00
3.10
3.20
3.30
3.40
3.50
3.60
3.70
3.80
3.90
4.00
Pay
bac
k p
erio
d [
year
s]
NPV payback period
(a)
(b)
Figure 5. Sensitivity to traders’ remuneration percentage on electrical energy price: (a) effects on facilitiessize; and (b) investment indices.
FROM HOSPITAL TO MUNICIPAL COGENERATION SYSTEMS 845
Copyright # 2006 John Wiley & Sons, Ltd. Int. J. Energy Res. 2007; 31:829–848
DOI: 10.1002/er

produced by traditional power stations with power from cogeneration, but it is bound to lead tolarger local heat dissipation, as heat demand profiles are unchanged.
5.3. General applicability and international context
Sensitivity analysis has shown that economic performance of cogeneration and district heatingsignificantly depends on external elements such as equipment subsidy and fuel and power costs,and especially on power buy-back tariffs, because sizing and operation of the system arebasically determined by power sales. Sizing and operational practices similar to the obtainedoptimization results are confirmed by distributed generation literature. Strachan andDowlatabady (2002), who compare the diffusion of distributed generation in the Netherlandsand in the U.K., point out that, where power buy-back tariffs are attractive and fuel incentivesfor CHP exist, equipment subsidies, originally meant to reduce the economical threshold size forCHP installation, actually result in the installation of larger capacities. These exploit botheconomies of scales and an innovative, power sales oriented utilization of DG, even if this maylead to more heat dissipation (Strachan and Dowlatabady refer to 20% rejection of availableheat, in our case the sizeable value of 11 390 MWh year�1 rejected in Scenario 4b correspondsto about 15% of heat available from cogenerators). This typically happens when profitmaximization objectives are pursued, as can be deduced from van Schijndel (2002), who presents
Scenario 4b: Investment indices
0.00
0.50
1.00
1.50
2.00
2.50
3.00
3.50
4.00
4.50
115%110%105%100%95%90%
Energy cost and price variation
Pay
bac
k p
erio
d [
year
s]
0
5,000,000
10,000,000
15,000,000
20,000,000
25,000,000
30,000,000
NP
V [
Eu
ro]
Payback period NPV
Figure 6. Sensitivity to fuel and electrical energy costs and prices: effects on investment indices.
Table VI. Sensitivity to equipment grants: effects on facilities size and investment indices.
Percentage of subsidy on equipment costs (%) 0 10 20 30
Capacity of cogenerator at AMGA ðkWeÞ 8000 8100 8500 8500Capacity of integration boiler at AMGA ðkWtÞ 7600 7500 7000 7000Capacity of cogenerator at the hospital ðkWeÞ 3300 3300 3300 3300NPV ðkhÞ 19 680 20 630 21 590 22 560Simple pay-back period (years) 3.44 3.10 2.79 2.44
D. CHINESE ET AL.846
Copyright # 2006 John Wiley & Sons, Ltd. Int. J. Energy Res. 2007; 31:829–848
DOI: 10.1002/er

the case of a hospital trigeneration system in the Netherlands. On the other hand, oppositeresults are obtained if power sale tariffs are low, especially if cogenerated power costs are high.Downsizing may then be the right option, as, for instance, in the Spanish case presented byRenedo et al. (2006), where better investment yield is obtained with minimum diesel enginesdesigned to work always at full load, rather than with larger engines meeting maximumelectrical demand. In that case, there might even be an intermediate optimal solution, whichcould be disclosed by adopting an optimization approach instead of the traditional one.Concerning the opportunity of developing district heating systems moving from hospitalcogeneration or trigeneration systems, it has been shown that better energy and environmentalperformances can be achieved in this way. Whether this improves profitability and in whatmeasure depends on the investments required for district heating networks (shorter networkswill perform better) and on how well do heat demand profiles match so that overall demandbecomes as uniform as possible throughout the year.
6. CONCLUSIONS
The study has highlighted that all the proposed cogeneration and district heating solutions havepositive economic performances and lead to better results in terms of GHG emission reductionand of primary energy savings. Profitability of cogeneration at the hospital boosts theprofitability of the whole venture and may draw capitals to the district heating project, whichwould be less attractive as a stand alone project. Where energy policy and market conditionsmake it profitable to sell electricity from distributed cogeneration, district heating may lead tothe installation of larger engines and to the production of more cogenerated power with less heatdissipation. Also where external conditions and internal heating demand profiles are such thatsmaller CHP systems, designed to meet only a fraction of internal power demand, are preferred,satisfying an external heating demand allows to efficiently generate more power to reliably coveran higher percentage of internal needs. Especially in the case of hospitals, this should encouragedesigners and public decision makers to broaden systems boundaries and consider also thesurroundings of such energy intensive buildings when designing new energy facilities.
As to methodology, the development and application of an optimization model to design thedescribed energy system has shown to be a powerful instrument for the identification of the mostsuitable solutions in terms of facility sizes and operation mode, especially because a jointoptimization takes account of interdependence between design and operational choices. Byintroducing proper constraints, different scenarios, related to different managerial perspectives,could be analysed and compared. The automation of procedure lets easily perform sensitivityanalyses on the most critical parameters, overcoming the deterministic approach typical of suchmodels. Based on these arguments, we promote a wider use of optimization methodologiesespecially in hospital energy systems design, where they have been less frequently applied up tonow but where the variety of types of energy demand and of possible technical solutionsenhances the complexity of designer decisions.
ACKNOWLEDGEMENTS
We gratefully acknowledge the cooperation and the financial support of the Municipality of Udine,financing the feasibility study and thereby the associated research project.
FROM HOSPITAL TO MUNICIPAL COGENERATION SYSTEMS 847
Copyright # 2006 John Wiley & Sons, Ltd. Int. J. Energy Res. 2007; 31:829–848
DOI: 10.1002/er

REFERENCES
AEEG. 2004. Testo integrato delle disposizioni dell’autorita per l’energia elettrica e il gas per l’erogazione dei servizi ditrasmissione, distribuzione, misura e vendita dell’energia elettricaperiodo di regolazione 2004–2007 (in Italian).Available at http://www.autorita.energia.it/docs/04/005-04all.pdf
Agnoletto L, Saro O, Romagnoli P. 1995. Combined radiative and convective cooling systems: thermal performancesand energy requirements. Proceedings of 1995 Workshop of CIB W67, Udine.
Ambiente Italia Srl. Kraftwarmeanlagen GmbH, Eicher+Pauli AG, CIT Energy Management AB. 1999. Risks andchances for small scale combined heat and power in the liberalised energy market. Chapter 1, Market Analysis, SAVEContract: XVII/4.1031/Z/99-063, http://www.ambienteitalia.it
Bojic M, Trifunovic N, Gustafsson SI. 2000. Mixed 0-1 sequential linear programming optimization of heat distributionin a district-heating systems. Energy and Buildings 32:309–317.
Chinese D, Meneghetti A. 2005. Optimization models for decision support in the development of biomass-basedindustrial district heating networks in Italy. Applied Energy 82:228–254.
Chinese D, Meneghetti A, Nardin G. 2004. Diffused introduction of organic Rankine cycle for biomass-based powergeneration in an industrial district: a systems analysis. International Journal of Energy Research 28(11):1003–1021.
Chow TT, Chan ALS, Song CL. 2004. Building mix optimization in district cooling system implementation. AppliedEnergy 77:1–13.
Damberger TA. 1998. Fuel cells for hospitals. Journal of Power Sources 71:45–50.ENEL. 2002. Environmental Report. http://www.enel.it/ambiente/leggi documenti/leggidoc 02 it.shtmFourer R, Gay DM, Kernighan BW. 2003. A Modeling Language for Mathematical Programming. Duxbury Press/
Brooks/Cole Thomson Publishing Company: Pacific Grove, CA.Gebremedhin A. 2003. The role of a paper mill in a merged district heating system. Applied Thermal Engineering 23:
769–778.Gustafsson SI. 1998. Municipal thermal and electricity loads: a case study in Linkoping. Applied Thermal Engineering
18(5):257–263.Henning D. 1999. Optimisation of local and national energy systems: development and use of the MODEST model.
Linkoping Studies in Science and Technology Dissertations No. 559, Linkoping.ILOG. 2002. CPLEX 8.0, User’s Manual. ILOG, Inc.: Incline Village, NV.Mavrotas G, Demertzis H, Meintani A, Diakoulaki D. 2003. Energy planning in buildings under uncertainty in fuel
costs: the case of a hotel unit in Greece. Energy Conversion and Management 44(8):1303–1321.Pietrapetrosa F, Cosmi C, Macchiato M, Marmo G, Salvia M. 2003. Comprehensive modelling to local scale. Renewable
and Sustainable Energy Reviews 7:249–270.Rath-Nagel S, Voss A. 1981, Energy models for planning and policy assessment. European Journal of Operational
Research 8:99–114.Regione Friuli Venezia Giulia. 2003. Regional energy plan (in Italian). http://www.regione.fvg.it/energia/allegati/
piano energetico.pdfRenedo CJ, Ortiz A, Manana M, Silio D, Perez S. 2006. Study of different cogeneration alternatives for a Spanish
hospital centre. Energy and Buildings 38:484–490.Salem Szklo A, Borghetti Soares J, Tiomno Tolmasquin M. 2004. Energy consumption indicators and CHP technical
potential in the Brazilian hospital sector. Energy Conversion and Management 45:2075–2091.Strachan N, Dowlatabadi H. 2002. Distributed generation and distribution utilities. Energy Policy 30:649–661.Sundberg G, Henning D. 2002. Investment in combined heat and power plants: influence of fuel price on cost minimized
operation. Energy Conversion and Management 43:639–650.van Schijndel AWM. 2002. Optimal operation of a hospital power plant. Energy and Buildings 34:1055–1065.Williams HP. 1990. Model Building in Mathematical Programming. Wiley Interscience: Chichester, 1990.Wu YJ, Rosen MA. 1999. Assessing and optimizing the economic and environmental impacts of cogeneration/district
energy systems using an energy equilibrium model. Applied Energy 62:141–154.Ziher D, Poredos A. 2006. Economics of a trigeneration system in a hospital. Applied Thermal Engineering 26:680–687.
D. CHINESE ET AL.848
Copyright # 2006 John Wiley & Sons, Ltd. Int. J. Energy Res. 2007; 31:829–848
DOI: 10.1002/er