From Extreme Weather to Climate Change in Africa - GCRF ...
53
School of Earth and Environment INSTITUTE FOR CLIMATE AND ATMOSPHERIC SCIENCE Benjamin L. Lamptey Cheney Fellow and Visiting Professor of Meteorology School of Earth and Environment University of Leeds 22 nd October 2019 Michael Sadler Rupert Beckett Lecture Theatre [email protected] ; [email protected] From Extreme Weather to Climate Change in Africa
-
Upload
khangminh22 -
Category
Documents
-
view
1 -
download
0
Transcript of From Extreme Weather to Climate Change in Africa - GCRF ...

School of Earth and EnvironmentINSTITUTE FOR CLIMATE AND ATMOSPHERIC SCIENCE
Benjamin L. Lamptey
Cheney Fellow and Visiting Professor of Meteorology
School of Earth and Environment University of Leeds
22nd October 2019
Michael Sadler Rupert Beckett Lecture Theatre
[email protected]; [email protected]
From Extreme Weather to Climate Change in
Africa

GRATITUDE
I thank Peter and Susan Cheney for funding my fellowship
I acknowledge all the different people and sources from which I got various
materials used.

Intergovernmental Panel on Climate Change
(IPCC)
The role of the IPCC is to assess on a
comprehensive, objective, open and
transparent basis the scientific, technical and
socio-economic information, relevant to:
understanding the scientific basis of risk of
human-induced climate change
Its potential impacts
And options for adaptation and mitigation

IPCC outreach on Climate Change
Climate change Evangelist
o https://youtu.be/T1eGJLqxxKQ
Some statements
1) Most of Africa’s natural disasters are hydrometeorological in origin
2) Natural disasters are challenging to predict, but we can plan for impending disasters and prepare for risks
3) Africa’s contribution to the greenhouse gas (GHG) emissions is negligible compared to developed countries (about 4% of global GHG emissions)
4) Africa is the most vulnerable to the impacts of climate change and disasters
5) Climate change will affect the weather systems differently in different regions of Africa
6) IPCC projects an increase in the intensity and frequency of extreme events (e.g. Floods, heatwaves, droughts and storms)
7) Climate is what you expect, Weather is what you get
8) Inferences about weather systems in a changing climate have been made from climate models (and not weather prediction models)

Extreme Event Prediction: The Case of
Cyclone Idai
1) The IPCC projects an increase in frequency and intensity of extreme events
2) The predictability of hurricanes/cyclones is relatively better compared to other extreme events
3) This is illustrated by model agreement from different centres
4) Yet the impact of one hurricane in one country is devasting enough
5) What preparation is being put into the other common extreme events in Africa whose predictability is relatively more challenging than the hurricanes?
6) Take home message: As resources are being put into climate change policies and strategies, there is the need to develop weather infrastructure along side. As the impact of climate change will still be felt if emissions were reduced to zero even in 2020. We all know we are very far from that even by 2050
7) More needs to be done to reduce the impact of extreme events. For example, early warning must be coupled with early action

School of Earth and EnvironmentINSTITUTE FOR CLIMATE AND ATMOSPHERIC SCIENCE
CYCLONE IDAI

Zimbabwe
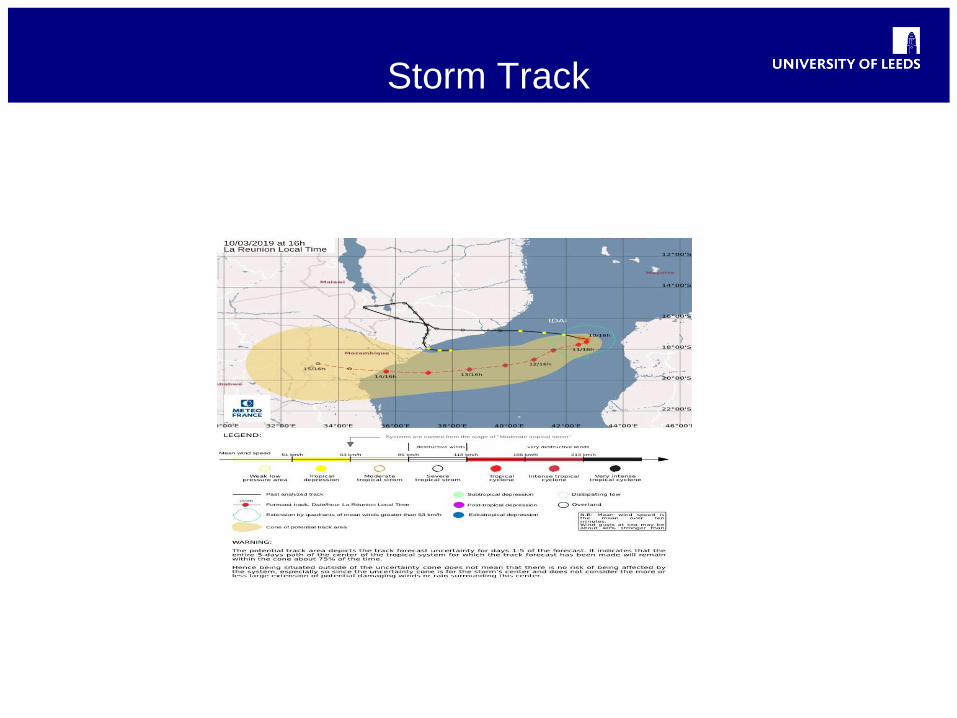
Storm Track

Model Agreement – Cyclone Idai: 24hr lead time
13th to 16th March 2019

Model Agreement – Cyclone Idai: 24hr lead time
17th to 21st March 2019

Respective updates from Mozambique, Malawi
and Zimbabwe on Impacts of Cyclone IDAI
Deaths Houses
(partially
or totally
destroyed)
Schools
affected
Classroom
s affected
Health
facilities
partially
destroyed
Health
facilities
completely
destroyed
603 240 000 137 4219 91 3
Deaths Houses
(partially
or totally
destroyed)
Schools
affected
Injured
people
Affected
people
Displaced
people
60 288,371 154 672 975,000 86, 976
Deaths Houses
(partially
or totally
destroyed)
Schools
affected
Injured
people
People
requiring
humanitari
an
assistance
Health
facilities
damaged
344 17, 000 971 192 270,000 294
Mozambique
Malawi
Zimbabwe
Summary
1. Models agree in their forecast with different lead times
(e.g. 24, 48 hrs.) – only 24 hr. lead time is shown
2. March 14, 2019 cyclone reached peak intensity with
maximum winds of 195 km/h (120 mph) and minimum
central pressure of 940mb in Mozambique
3. During the event, satellite picture showed the cyclone
enter Mozambique and later retreated. The models in
agreement captured this movement
4. There is growing confidence in the science of
attribution - To quantify the link between some
extreme weather events and climate change
Food for thought
1. Are we ready with the weather infrastructure to be able to predict these extreme events when the projections of the Intergovernmental Panel on Climate Change manifests?
2. Note the events will be weather events at the time of occurrence.
3. Studies in recent past, made projections for 2020. The year 2020 starts in a few months. How prepared are we to manage the projected events, should they occur? Examples of such studies:
a) Theobald, 2005: Landscape Patterns of Exurban Growth in the USA from 1980 to 2020
b) Hanaoka and Kainuma, 2012: Low carbon transitions in world regions: comparison of technological mitigation potential and costs in 2020 and 2030 through bottom-up analyses

Value of economic outcome
Could be increased:
1. By improving the forecast
2. By improving communication
3. By improving decision-making process
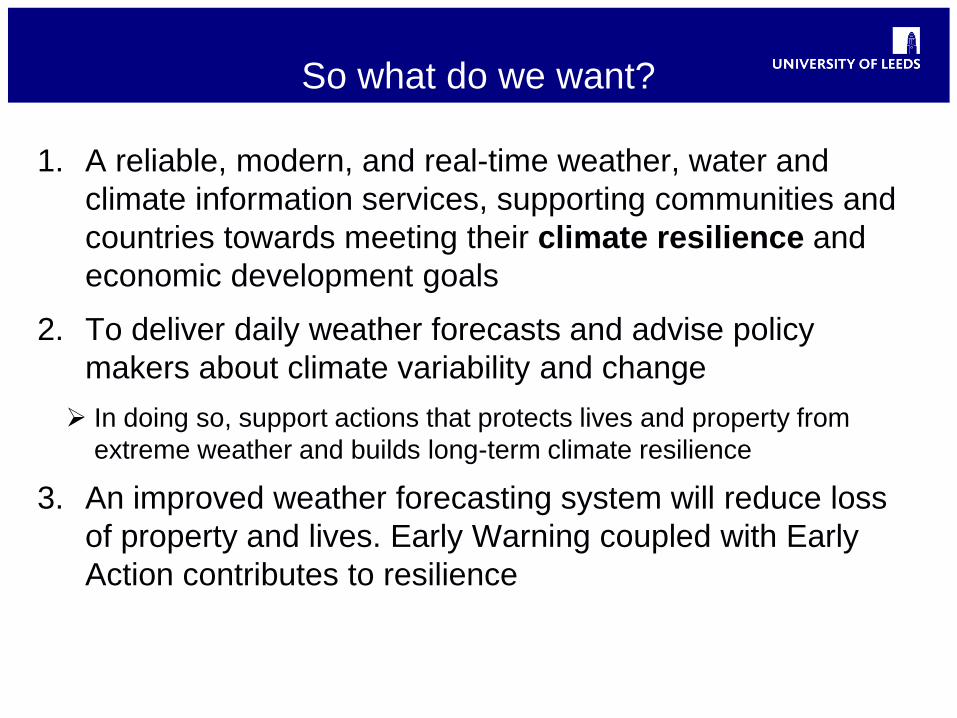
So what do we want?
1. A reliable, modern, and real-time weather, water and
climate information services, supporting communities and
countries towards meeting their climate resilience and
economic development goals
2. To deliver daily weather forecasts and advise policy
makers about climate variability and change
In doing so, support actions that protects lives and property from
extreme weather and builds long-term climate resilience
3. An improved weather forecasting system will reduce loss
of property and lives. Early Warning coupled with Early
Action contributes to resilience

Meteorology and Natural Disasters
1. Although, strategies for coping with weather disasters are essentially of national concern, they involve international considerations for the following reasons
a) Science and practice of meteorology requires an international approach, and national storm warning systems are dependent upon international exchange of information
b) In many developing countries, technical assistance is needed in developing the NMHS, so as to improve the internal storm warning systems (SWIFT and Nowcasting, etc.)
c) In some cases, devastation calls for international relief measures.
2. Basic International arrangements – WWW, GARP
3. Tropical cyclones most devastating, however, tornadoes, floods, blizzards, droughts are other examples of the manifestation of natural disasters.
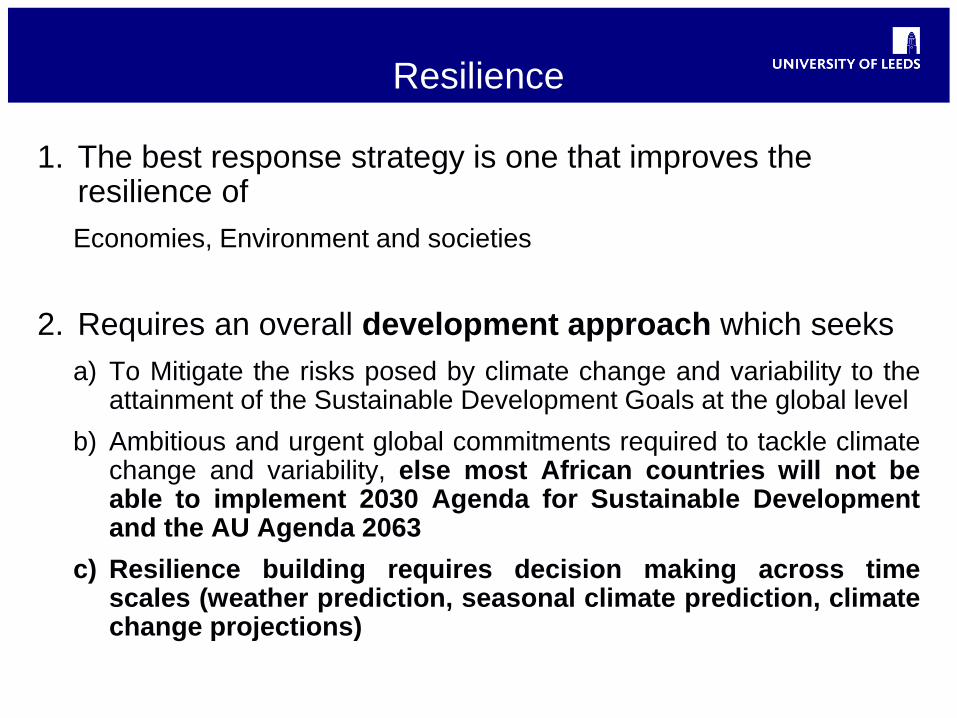
Resilience
1. The best response strategy is one that improves the resilience of
Economies, Environment and societies
2. Requires an overall development approach which seeks
a) To Mitigate the risks posed by climate change and variability to theattainment of the Sustainable Development Goals at the global level
b) Ambitious and urgent global commitments required to tackle climatechange and variability, else most African countries will not beable to implement 2030 Agenda for Sustainable Developmentand the AU Agenda 2063
c) Resilience building requires decision making across timescales (weather prediction, seasonal climate prediction, climatechange projections)

Decision-making across timescales
Begin monitoring mid-range
And short-range forecasts
Update contingency plans
Train volunteers
Sensitize communities
Enable early-warning systems
Continue monitoring
Short-time-scale forecasts
Mobilize assessment teams
Alert volunteers
Warn communities
Local preparation activities
Deploy assessment teams
Activate volunteers
Instruction to communities
to evacuate, if needed

Weather-climate interface
1. Resilience to present day climate is necessary for
resilience to the future
2. Impact-based weather forecasting is somehow necessary
for climate resilience
3. Management –
a) Emergency – Weather time scale
b) Operational – Weather and Seasonal time scale
c) Policy/Planning – Climate Change time scale
4. Decision
Tactical – Weather information
Strategic – Climate information
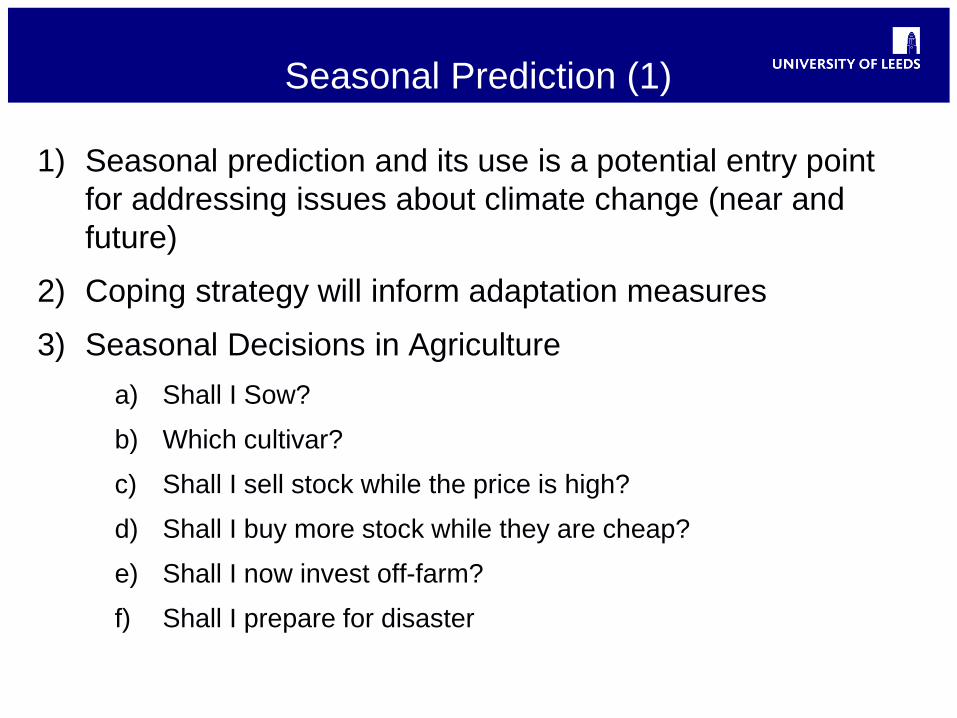
Seasonal Prediction (1)
1) Seasonal prediction and its use is a potential entry point
for addressing issues about climate change (near and
future)
2) Coping strategy will inform adaptation measures
3) Seasonal Decisions in Agriculture
a) Shall I Sow?
b) Which cultivar?
c) Shall I sell stock while the price is high?
d) Shall I buy more stock while they are cheap?
e) Shall I now invest off-farm?
f) Shall I prepare for disaster

1) Deterministic skill of North American Multi-Model Ensemble
a) To predict Sahel rainfall with respect to lead time
Skill for regionally averaged rainfall for the JAS target
season is essentially the same whether the forecast is
made in February/March or it is made in June
The two dominant influences on Sahel rainfall, North Atlantic and global tropical
oceans, shape predictability
MME skill hinges on the combination of skillful predictions of ENSO made with
one model (CMC2-CanCM4) with those of North Atlantic SST made with
another model (NASA-GEOSS2S)
b) An earlier prediction (2-3 months ahead) has consequences
for decisions such as purchasing, stocking and distributing
adapted seed varieties or preventing regional food insecurity
2) National Scale: Ongoing research for dynamical seasonal
forecast in Ghana (e.g. Agyeman et al., 2017)
Seasonal Prediction (2)

Climate Change

Half a degree matters for reducing & delaying global land
exposure to combined daytime-nighttime extremes
A 0.5degC reduction in global warming will shelter about
20% of global lands from strong increases and
prevalence of combined hot extremes
Compared to 2degC, the 1.5degC target helps avoid a new
heat regime with unprecedented combined hot extremes
becoming the norm in the tropics
Previous univariate-based analyses underestimate both
spatial scale and emergence rate of 0.5degC - added
hotspots to hot extremes
Chen_et_al_EF_2019

Simulation of relative impact of land cover and carbon dioxide
to climate change from 1700 to 2100
Lamptey_et_al_JGR_2005
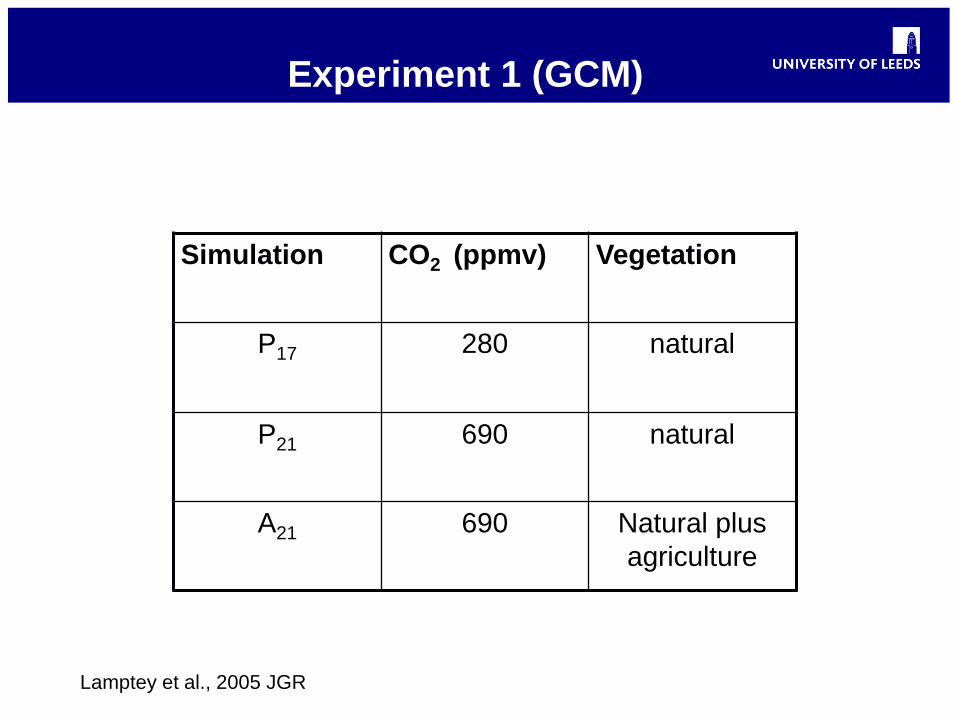
Experiment 1 (GCM)
Simulation CO2 (ppmv) Vegetation
P17 280 natural
P21 690 natural
A21 690 Natural plus
agriculture
Lamptey et al., 2005 JGR
Formula
100||||
||
17212121
2121
PPPA
PA

Mean DJF 2m temp. difference due to (a)
Increased CO2 (b) agriculture
Lamptey et al., 2005 JGR

2m temperature change (% explained by
LCC)
Lamptey et al., 2005 JGR
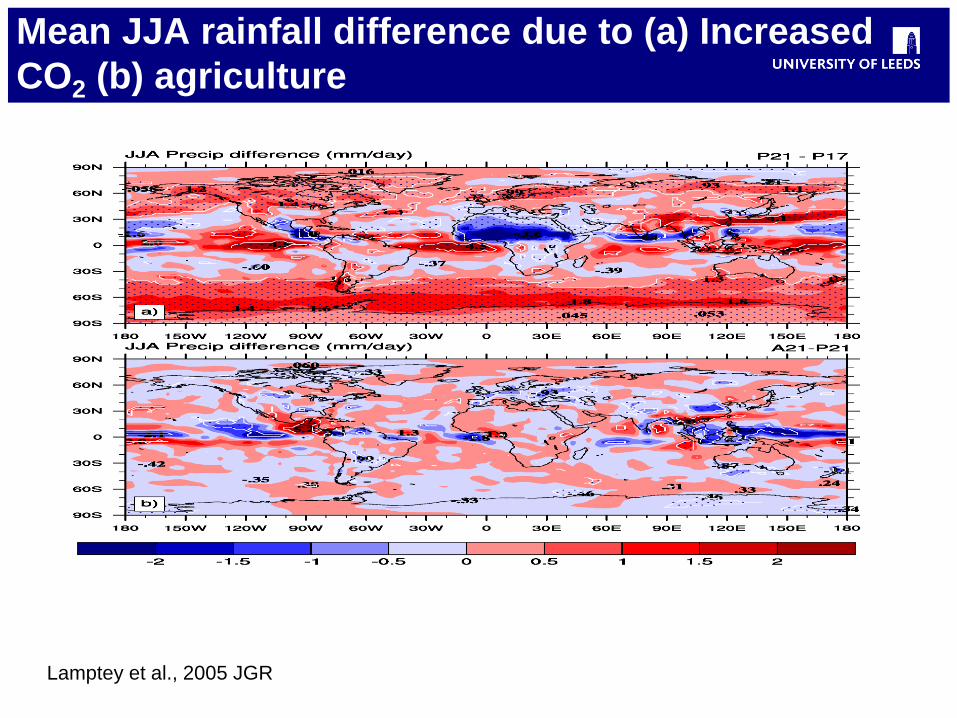
Mean JJA rainfall difference due to (a) Increased
CO2 (b) agriculture
Lamptey et al., 2005 JGR
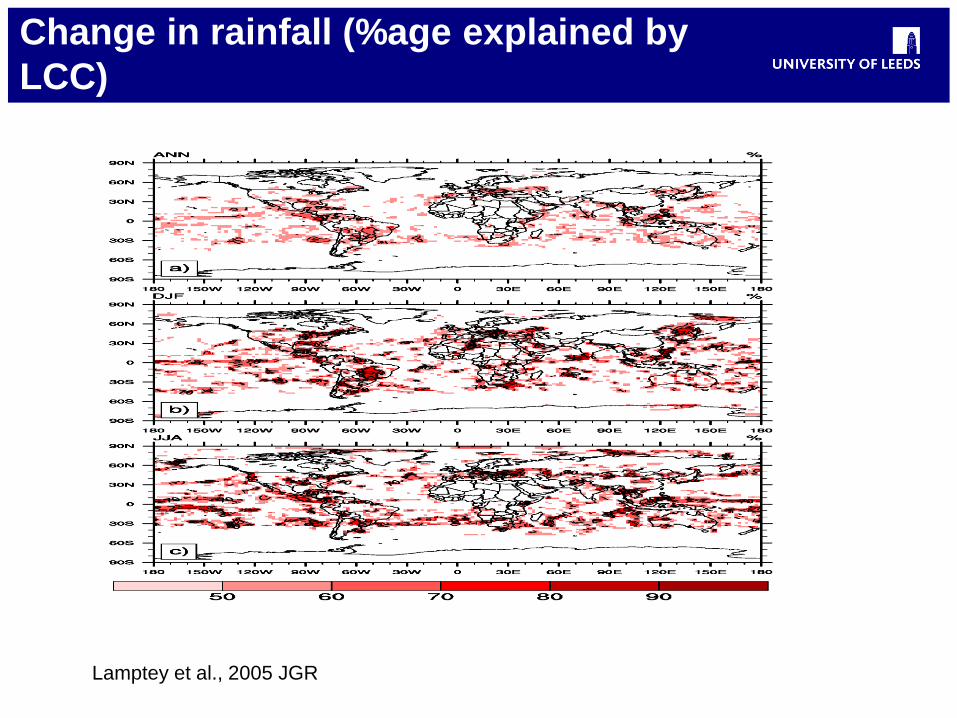
Change in rainfall (%age explained by
LCC)
Lamptey et al., 2005 JGR

DJF regional (WA) climate from GCM

Summary
1) LCC greatly modifies magnitude and spatial extent of
climate due to increased Carbon dioxide
2) Urbanization and regional agriculture produced a decrease
in diurnal temperature range

Summary from another regional study (middle
latitude)
1) Impacts of both agriculture and urban land
cover are more pronounced during summer
2) Urbanization increased mean temperature but
decreased diurnal temperature range
3) Urbanization effect was widespread
Lamptey et al., 2005 GPC
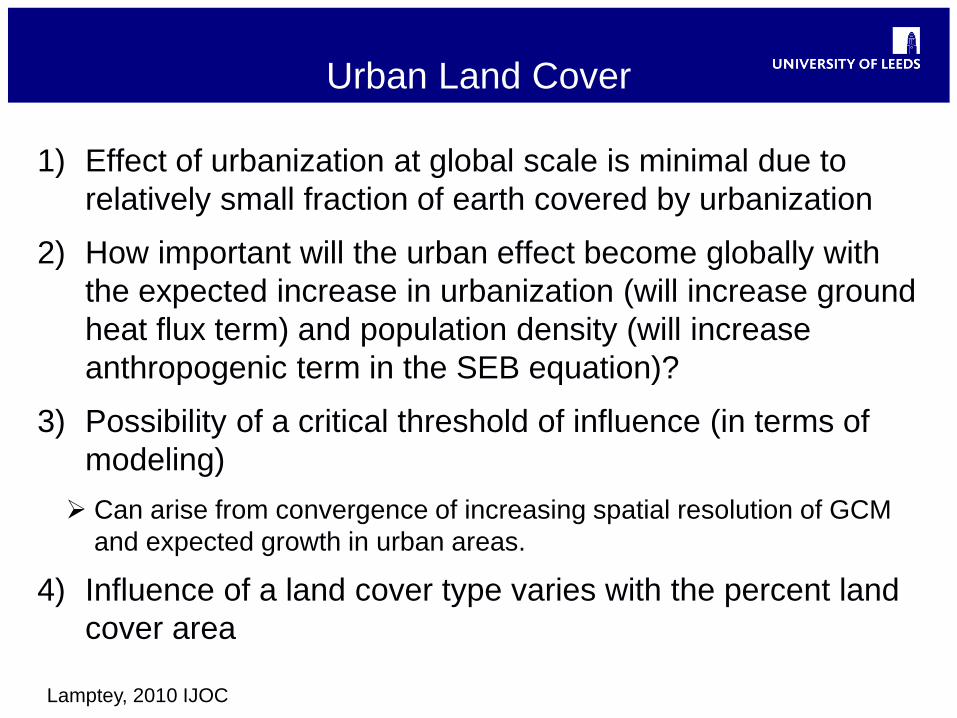
Urban Land Cover
1) Effect of urbanization at global scale is minimal due to
relatively small fraction of earth covered by urbanization
2) How important will the urban effect become globally with
the expected increase in urbanization (will increase ground
heat flux term) and population density (will increase
anthropogenic term in the SEB equation)?
3) Possibility of a critical threshold of influence (in terms of
modeling)
Can arise from convergence of increasing spatial resolution of GCM
and expected growth in urban areas.
4) Influence of a land cover type varies with the percent land
cover area
Lamptey, 2010 IJOC
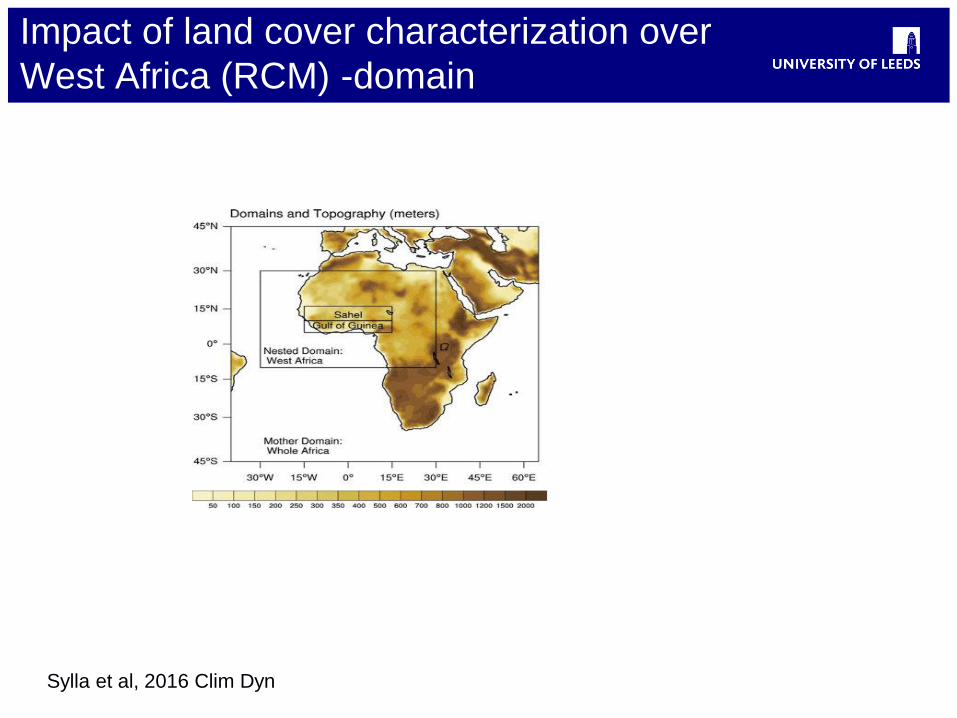
Impact of land cover characterization over
West Africa (RCM) -domain
Sylla et al, 2016 Clim Dyn

Impact of land cover characterization over
West Africa (RCM) - simulation
1) Model: RegCM4.3
2) Resolution: 50km - Africa, 25km – West Africa
3) Coupled with NCAR CLM3.5
4) Simulation period: 1998 - 2010
5) Simulation 1 uses Coarse Resolution Vegetation
6) Simulation 2 uses Newer High Resolution improved Land
Cover
7) Replacement of C4 and C3 grasses with corn and
Tropical broadleaf evergreen trees in parts of West
and Central Africa
Sylla et al, 2016 Clim Dyn
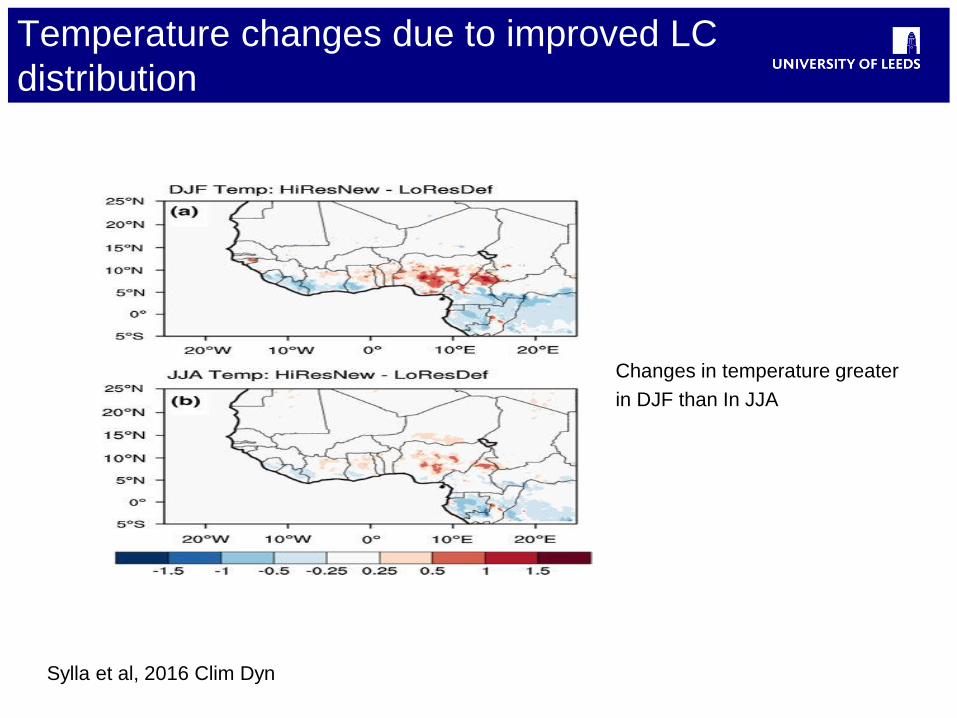
Temperature changes due to improved LC
distribution
Changes in temperature greater
in DJF than In JJA
Sylla et al, 2016 Clim Dyn
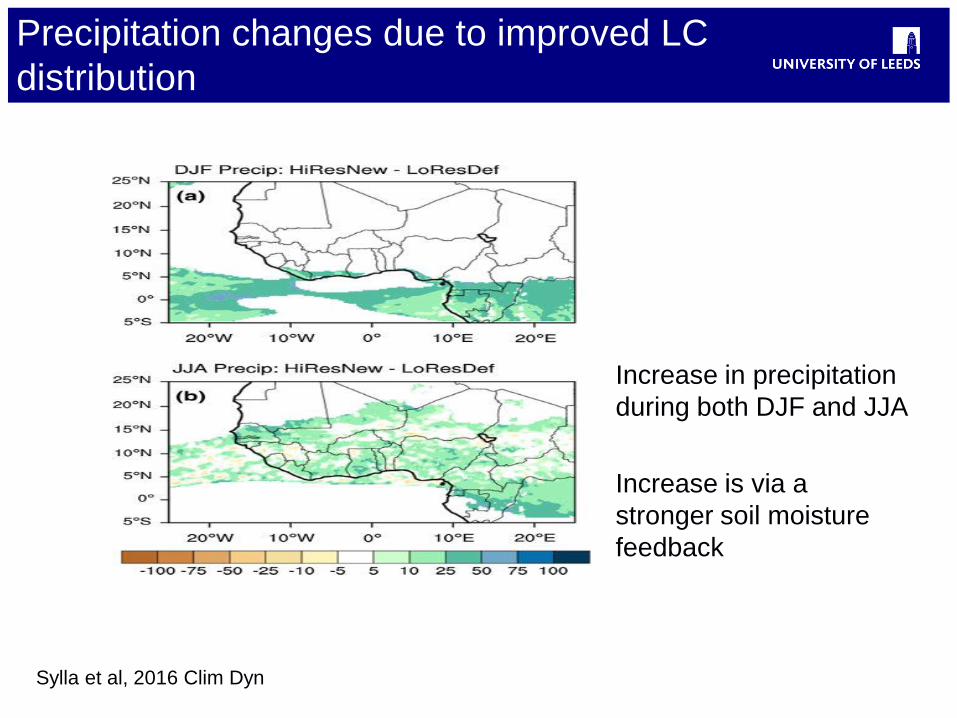
Precipitation changes due to improved LC
distribution
Increase in precipitation
during both DJF and JJA
Increase is via a
stronger soil moisture
feedback
Sylla et al, 2016 Clim Dyn

Summary from study
1) In DJF, increases in the frequency and intensity of precipitation
events occur mainly over the Gulf of Guinea coastlines and
Central Africa
2) In JJA, changes are more heterogeneous
3) The increased precipitation is caused by increased low level
convergence and enhanced soil moisture feedback
4) Wetter conditions are simulated over most part of the domain,
even in regions where land cover changes are negligible.
5) Replacement of C4 grass with corn produces warming while
replacement of C3 grass with tropical broadleaf evergreen trees
produces cooling over over areas of change
6) Results indicate land cover distribution should be accounted for
in climate change experiments over West Africa.
Sylla et al, 2016 Clim Dyn

Potential Impacts of the Great Green Wall (GGW)
on Climate Extremes in the Sahel
Saley et al., 2017 Atmos Sci Lett
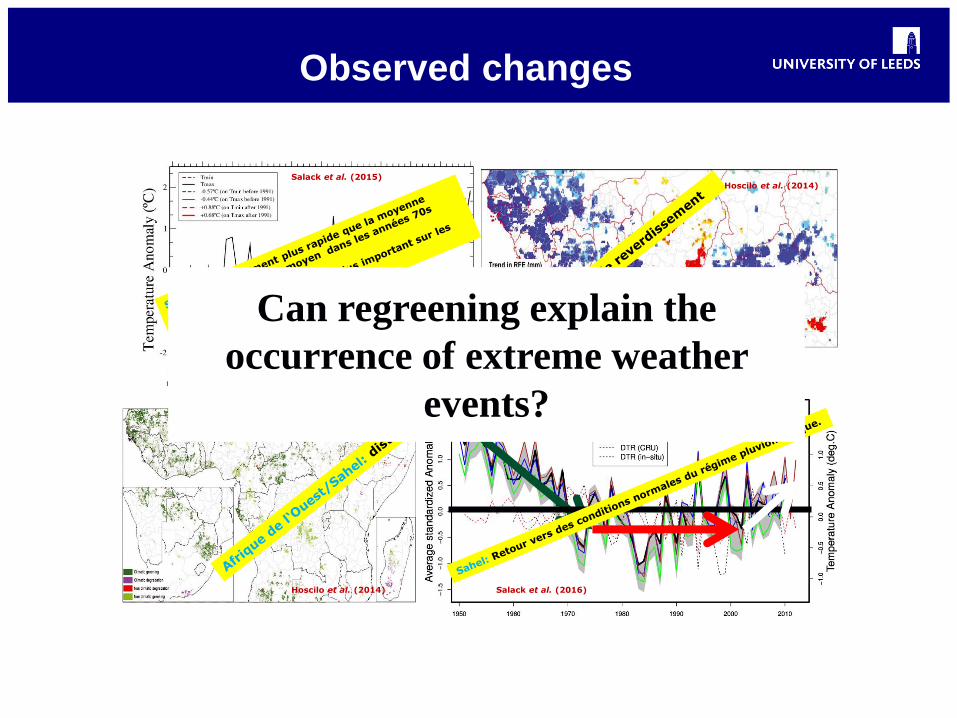
Salack et al. (2015)
Observed changes
Can regreening explain the
occurrence of extreme weather
events?
Salack et al. (2016)
Hoscilo et al. (2014)
Hoscilo et al. (2014)

The Great Green Wall (GGW)
• Project: CEN-SAD and
African Union
• Length: Dakar to Djibouti
(> 7000km)
• Width: 15km
• 11 states involved
• Endogenous species
(Dia and Dupponois, 2010)

Regrowth Scenario (GGW) (1)
Model: RegCM4
Resolution:
50kmx50kmx18pres. level
Period 1988-2012.
Initial and Boundary
Conditions: Re-analyzes ERA-
Interim, Optimum Interpolation
Sea Surface Temperature
(OISST).
A strip of vegetation on 14.08-
15.84 ° N wide.
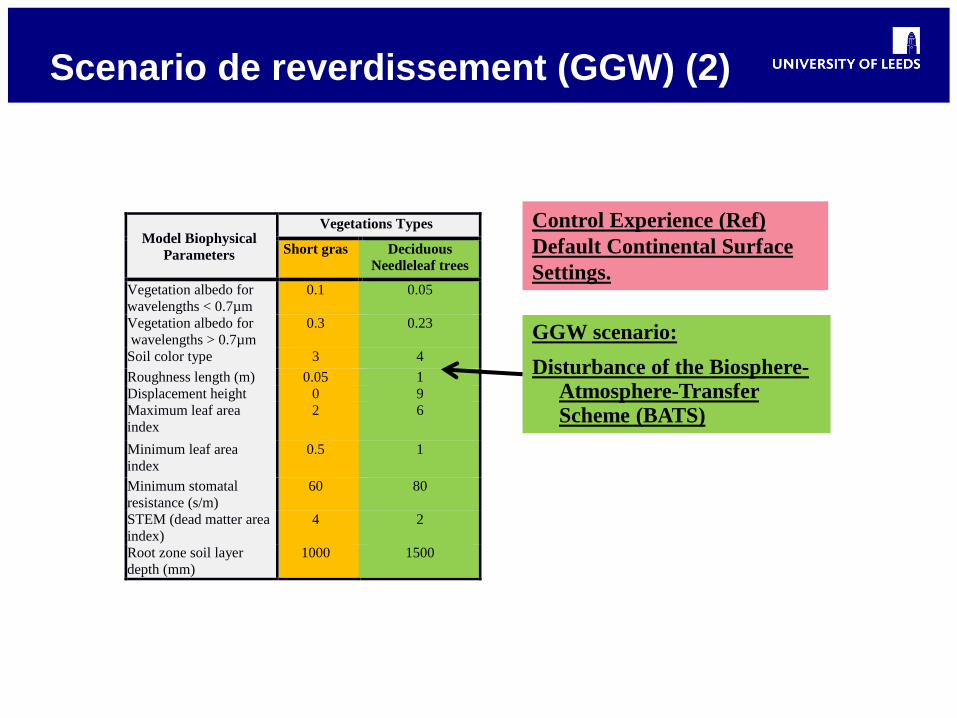
Control Experience (Ref)
Default Continental Surface
Settings.
GGW scenario:
Disturbance of the Biosphere-Atmosphere-Transfer
Scheme (BATS)
Model Biophysical
Parameters
Vegetations Types
Short gras Deciduous
Needleleaf trees
Vegetation albedo for
wavelengths < 0.7µm
0.1 0.05
Vegetation albedo for
wavelengths > 0.7µm
0.3 0.23
Soil color type 3 4
Roughness length (m) 0.05 1
Displacement height 0 9
Maximum leaf area
index
2 6
Minimum leaf area
index
0.5 1
Minimum stomatal
resistance (s/m)
60 80
STEM (dead matter area
index)
4 2
Root zone soil layer
depth (mm)
1000 1500
1
Scenario de reverdissement (GGW) (2)
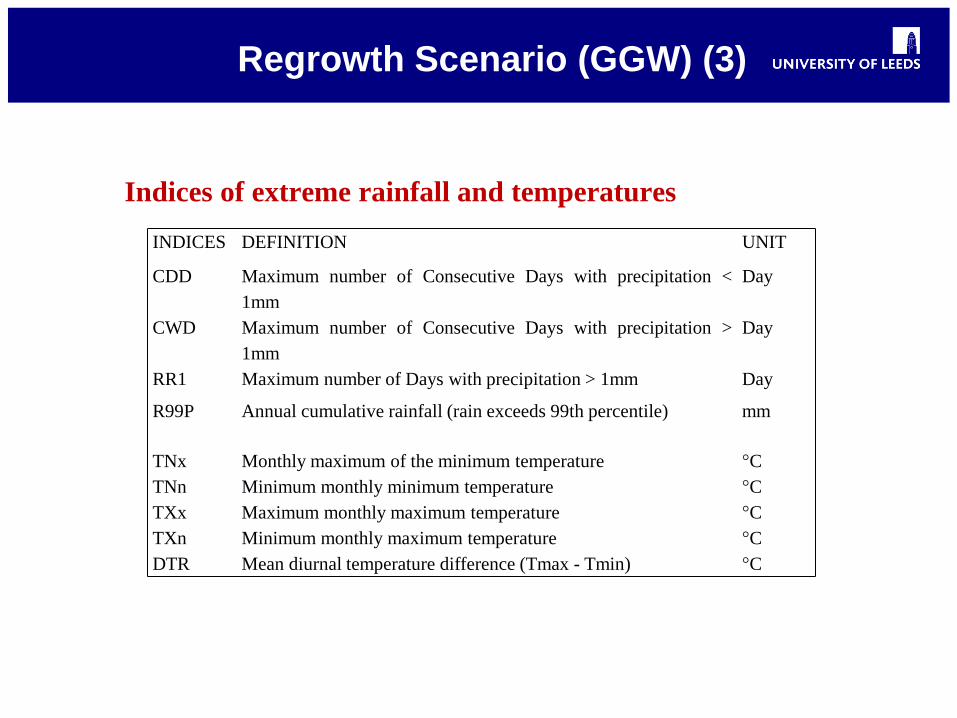
Indices of extreme rainfall and temperatures
INDICES DEFINITION UNIT
CDD Maximum number of Consecutive Days with precipitation <
1mm
Day
CWD Maximum number of Consecutive Days with precipitation >
1mm
Day
RR1 Maximum number of Days with precipitation > 1mm Day
R99P Annual cumulative rainfall (rain exceeds 99th percentile) mm
TNx Monthly maximum of the minimum temperature °C
TNn Minimum monthly minimum temperature °C
TXx Maximum monthly maximum temperature °C
TXn Minimum monthly maximum temperature °C
DTR Mean diurnal temperature difference (Tmax - Tmin) °C
Regrowth Scenario (GGW) (3)

Effects of GGW on extreme rainfall
• Increase in numbers of rainy days (RR1), and intense
rainfall (R99P);
• Precocity of the beginning of the rainy seasons (CDD)
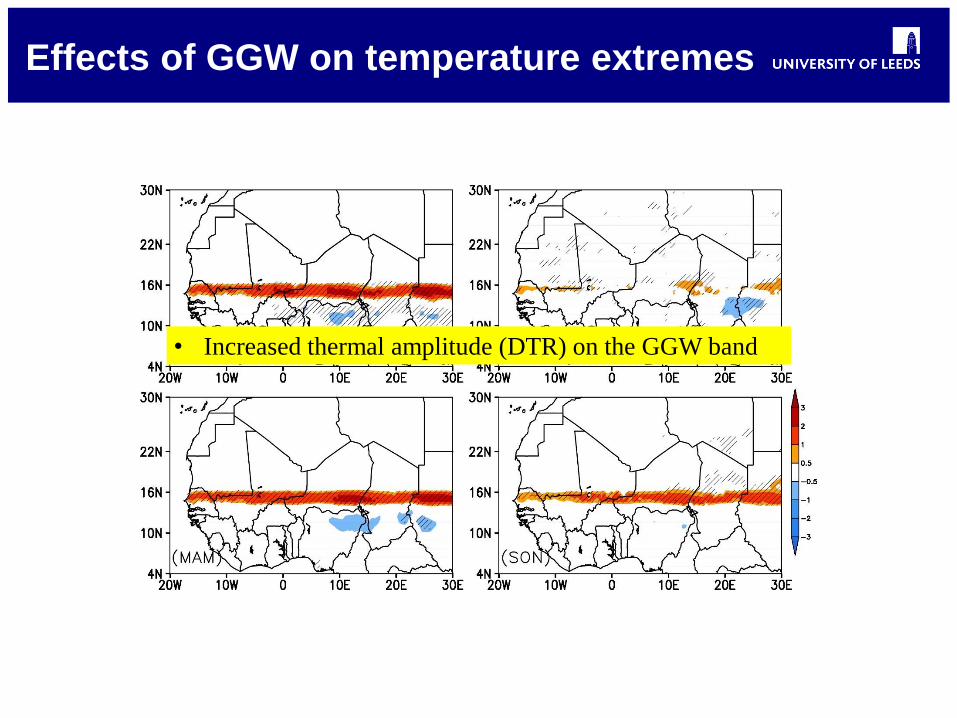
Effects of GGW on temperature extremes
• Increased thermal amplitude (DTR) on the GGW band

Summary
The recent regreening and the implementation of the GMV would lead to:
An increase in rainy days;
An increase in the frequency and amplitude of intense rainfall;
A precocity of the beginnings of the rainy seasons.
An increase in the daily thermal amplitude
The (hypothetical) Sahelian re-greening strengthens the
Land-Atmosphere feedback, which in turn alters the
frequency and magnitude of climatic extremes in the
subregion.

Concluding Food for thought
1. Weather Prediction: To what extent are we paying attention to building or improving infrastructure for weather prediction, as the projected increase in frequency and intensity of Extreme Events will occur on weather time scales, when the time comes?
2. Climate Resilience: To what extent are we paying attention to weather and seasonal time scales, in addition to formulating climate change policies and strategies, recognizing that resilience building requires decisions and action across time scales?
3. LULCC vs GHG Emissions: While preparing for the impact of climate change in Africa, is it worth considering the role of Land Use Land Cover Change as well?
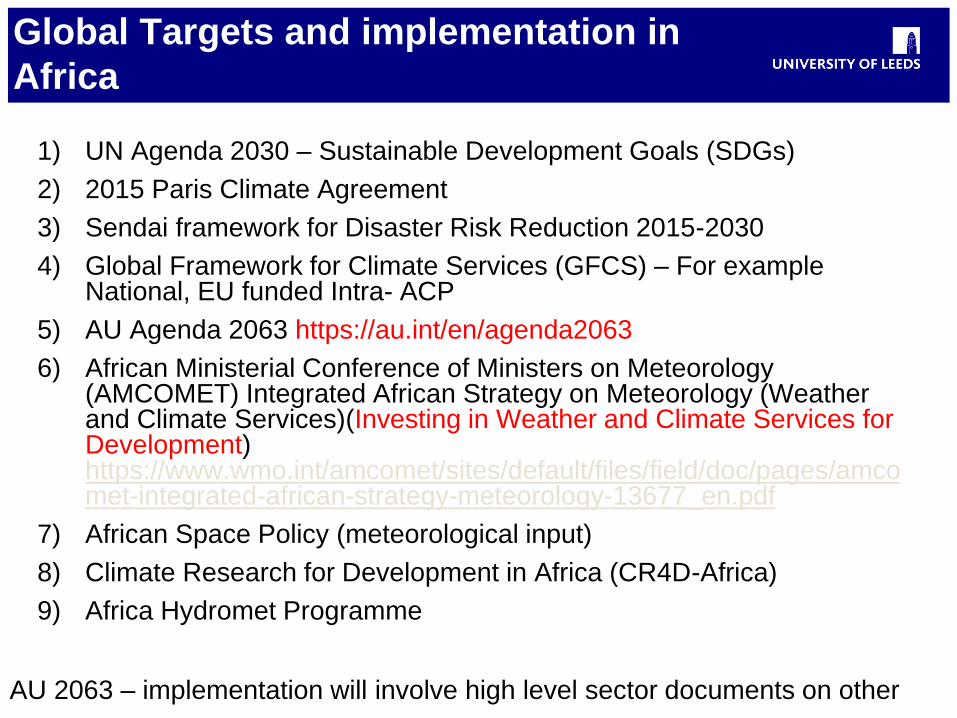
Global Targets and implementation in
Africa
1) UN Agenda 2030 – Sustainable Development Goals (SDGs)
2) 2015 Paris Climate Agreement
3) Sendai framework for Disaster Risk Reduction 2015-2030
4) Global Framework for Climate Services (GFCS) – For example National, EU funded Intra- ACP
5) AU Agenda 2063 https://au.int/en/agenda2063
6) African Ministerial Conference of Ministers on Meteorology (AMCOMET) Integrated African Strategy on Meteorology (Weather and Climate Services)(Investing in Weather and Climate Services for Development) https://www.wmo.int/amcomet/sites/default/files/field/doc/pages/amcomet-integrated-african-strategy-meteorology-13677_en.pdf
7) African Space Policy (meteorological input)
8) Climate Research for Development in Africa (CR4D-Africa)
9) Africa Hydromet Programme
AU 2063 – implementation will involve high level sector documents on other
sectors such as Agriculture (e.g. Malabo Declaration, CADAP), DRR, etc.
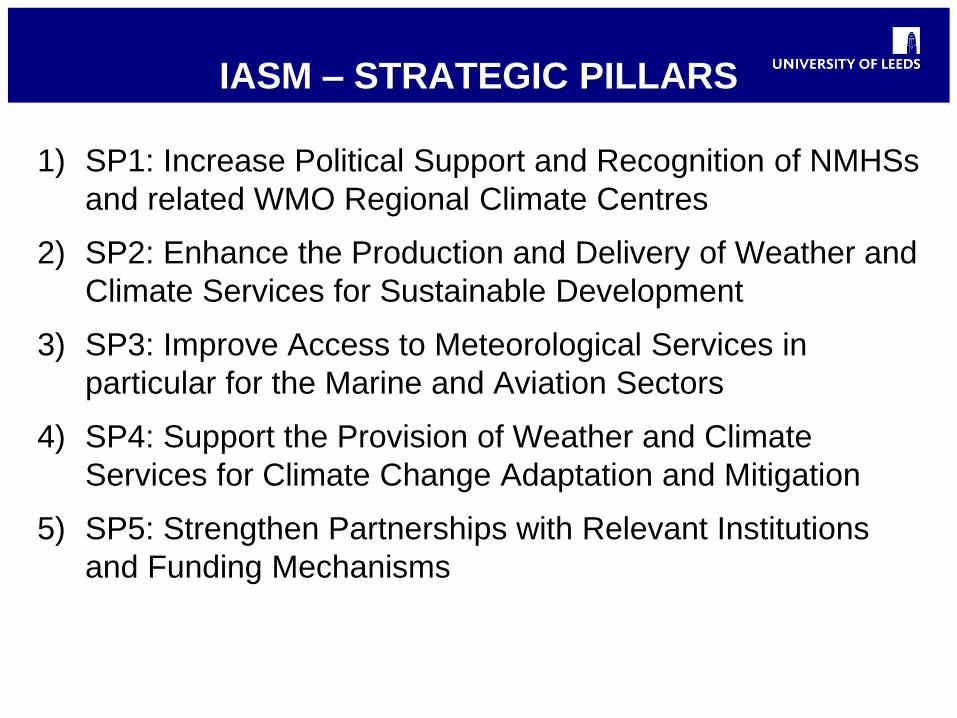
IASM – STRATEGIC PILLARS
1) SP1: Increase Political Support and Recognition of NMHSs
and related WMO Regional Climate Centres
2) SP2: Enhance the Production and Delivery of Weather and
Climate Services for Sustainable Development
3) SP3: Improve Access to Meteorological Services in
particular for the Marine and Aviation Sectors
4) SP4: Support the Provision of Weather and Climate
Services for Climate Change Adaptation and Mitigation
5) SP5: Strengthen Partnerships with Relevant Institutions
and Funding Mechanisms

THANK YOU
THANK YOU