Frequency analysis of tangential force measurements on a ...
12
Journal of Physics: Conference Series PAPER • OPEN ACCESS Frequency analysis of tangential force measurements on a vertical axis wind turbine To cite this article: Morgan Rossander et al 2016 J. Phys.: Conf. Ser. 753 042016 View the article online for updates and enhancements. Related content Measurement of friction coefficients with the atomic force microscope Phil Attard, Johanna Stiernstedt and Mark W Rutland - Research of a smart cutting tool based on MEMS strain gauge Y Zhao, Y L Zhao, YW Shao et al. - The physics of golf A Raymond Penner - Recent citations Multiple vertical axis wind turbines with passive rectification to a common DC-link Morgan Rossander et al - Critical Speed Control for a Fixed Blade Variable Speed Wind Turbine Morgan Rossander et al - This content was downloaded from IP address 130.238.171.44 on 19/12/2019 at 09:35
-
Upload
khangminh22 -
Category
Documents
-
view
0 -
download
0
Transcript of Frequency analysis of tangential force measurements on a ...

Journal of Physics: Conference Series
PAPER • OPEN ACCESS
Frequency analysis of tangential forcemeasurements on a vertical axis wind turbineTo cite this article: Morgan Rossander et al 2016 J. Phys.: Conf. Ser. 753 042016
View the article online for updates and enhancements.
Related contentMeasurement of friction coefficients withthe atomic force microscopePhil Attard, Johanna Stiernstedt and MarkW Rutland
-
Research of a smart cutting tool based onMEMS strain gaugeY Zhao, Y L Zhao, YW Shao et al.
-
The physics of golfA Raymond Penner
-
Recent citationsMultiple vertical axis wind turbines withpassive rectification to a common DC-linkMorgan Rossander et al
-
Critical Speed Control for a Fixed BladeVariable Speed Wind TurbineMorgan Rossander et al
-
This content was downloaded from IP address 130.238.171.44 on 19/12/2019 at 09:35

Frequency analysis of tangential force measurements
on a vertical axis wind turbine
Morgan Rossander, Anders Goude, Hans Bernhoff, Sandra Eriksson
Division of Electricity, Department of Engineering Sciences, Uppsala University, Box 534,751 21 Uppsala, Sweden
E-mail: [email protected]
Abstract. This paper presents experimental results of the torque ripple obtained from a threebladed 12 kW experimental H-rotor prototype. The measurements are performed by means ofload cells installed on the base of the struts and by electrical measurements on the generator. Theresulting torques are analysed in terms of frequency spectrum and order spectrum (synchronizedwith rotation). The measurements are compared to aerodynamic simulations of the turbine. Theexpected large torque ripple at three times the rotational speed (3 p) is only weakly representedat the hub and in the generator. This suggests that the system is filtering the ripple and/orthat the simulations are overestimating the 3 p component. The torque ripple loads on thedrive train are therefore lower than anticipated. Even if highly attenuated, most of the lowfrequencies correlating to aerodynamics are still represented in the generator electrical torque.Given a certain baseline, this opens for possible online monitoring of unbalances in the turbineby electrical measurements.
1. IntroductionThe majority of the wind turbines operating today are horizontal axis turbines (HAWT).However, there is a growing interest in vertical axis wind turbines (VAWT), since they havethe potential to further reduce energy cost [1]. Some of the advantages of VAWTs are theomnidirectional nature, ground level placement of generator and constant gravity loads.
There are also concerns associated with VAWTs. One of the main challenges is the varyingaerodynamic forces on the blades that lead to a force oscillation on the structure and a torqueripple in the drive train [1]. To better understand these forces, simulations and verifyingexperiments have been performed. Sandia National Laboratories conducted studies on forcemeasurements of large-scale VAWTs with troposkein shaped blades in the 1980s [2, 3, 4].
The presented study is based on force measurements on the 12 kW straight bladed VAWT(H-rotor) prototype built by the Division of Electricity at Uppsala University in 2006. Design andconstruction of the turbine prototype and its permanent magnet generator is further describedin [5, 6, 7, 8].
The experimental method for obtaining the measurements used in this work is describedin [9]. The measured normal force of the blade using the method has been presented earlier [10].The generator used in the experiments is passively rectified using diodes that introduce a highfrequency torque ripple [11]. The measured tangential force of the blade using the method alsorelieved large low frequency oscillations likely caused by the blade and support arms dynamics,which are further investigated in this study.
The Science of Making Torque from Wind (TORQUE 2016) IOP PublishingJournal of Physics: Conference Series 753 (2016) 042016 doi:10.1088/1742-6596/753/4/042016
Content from this work may be used under the terms of the Creative Commons Attribution 3.0 licence. Any further distributionof this work must maintain attribution to the author(s) and the title of the work, journal citation and DOI.
Published under licence by IOP Publishing Ltd 1
Several signal processing techniques have been studied for wind turbines, since they canbe useful for online monitoring and failure detection [12]. In this paper, the frequency andorder spectrum are used for analysing the tangential force as torque. The electric torqueoutput of the generator is also used in the analysis. The aim is to investigate how vibrationsand aerodynamic torque variations propagate through the wind turbine system as well as tomake initial assessments of whether measurements of electrical torque can reveal mechanicalproperties.
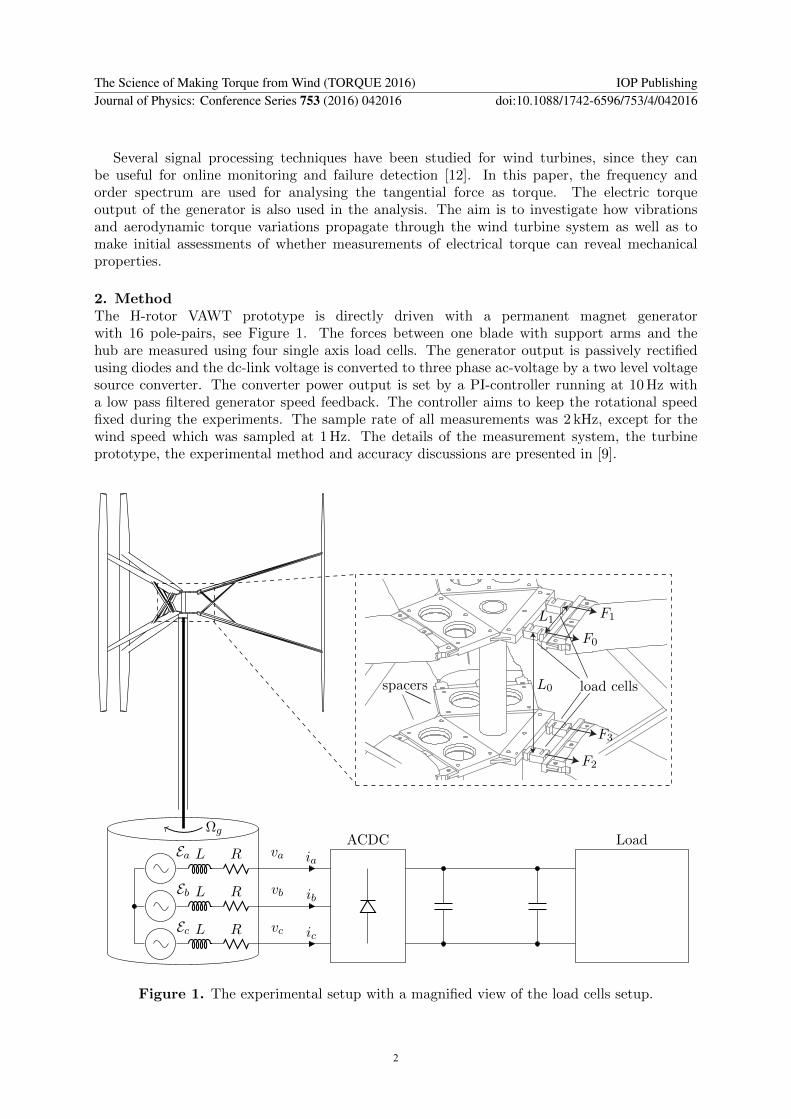
2. MethodThe H-rotor VAWT prototype is directly driven with a permanent magnet generatorwith 16 pole-pairs, see Figure 1. The forces between one blade with support arms and thehub are measured using four single axis load cells. The generator output is passively rectifiedusing diodes and the dc-link voltage is converted to three phase ac-voltage by a two level voltagesource converter. The converter power output is set by a PI-controller running at 10 Hz witha low pass filtered generator speed feedback. The controller aims to keep the rotational speedfixed during the experiments. The sample rate of all measurements was 2 kHz, except for thewind speed which was sampled at 1 Hz. The details of the measurement system, the turbineprototype, the experimental method and accuracy discussions are presented in [9].
load cells
L1
spacers L0
F3
F2
F1
F0
Ωg
Ea L R iava
Eb L R ibvb
Ec L R icvc
ACDC Load
Figure 1. The experimental setup with a magnified view of the load cells setup.
The Science of Making Torque from Wind (TORQUE 2016) IOP PublishingJournal of Physics: Conference Series 753 (2016) 042016 doi:10.1088/1742-6596/753/4/042016
2

2.1. Blade torqueThe tangential force is calculated from measurements by four single axis load cells installedbetween the support arms and the hub on one of the three blades. The load cells are the onlyattachment of the support arm to the hub and all force from the blade and support arm mustpass through the cells. The two additional blades of the turbine have spacers installed of thesame dimensions as the load cell assembly to compensate for the offset in radius, see Figure 1.The tangential force is obtained from the load cells as
FT =L1
2LB(F0 + F2 − F1 − F3 − FT,zero) (1)
where F0, F1, F2 and F3 are the measured forces from the load cells, L1 is the horizontal distancebetween the sensors, LB is the distance from load cells to the blade, Rt is the radius of the turbineand FT,zero is the zero calibration to compensate for the weight and the tension of the structure.The four load cells are positioned in a square and higher values of F0 and F2 compared to F1
and F3 indicate that a positive torque is transmitted through the load cell assembly. The zerocalibration is determined by:
FT,zero = F0,zero + F2,zero − F1,zero − F3,zero (2)
where F0,zero, F1,zero, F2,zero and F3,zero are the no-load forces measured by the load cells.These forces change over time and with temperature and an average was used to calibrate allmeasurements. Finally, the tangential force of the blade acting at the turbine radius Rt providesa torque as
τb = FTRt (3)
2.2. Generator electrical torqueThe electrical torque of a permanent magnet generator with non-salient poles can be determinedas
τel =Eaia + Ebib + Ecic
Ωg=
1
Ωg(iava + ibvb + icvc +L(ia
diadt
+ ibdibdt
+ icdicdt
) +R(i2a + i2b + i2c)) (4)
where Ea, Ea and Ec are the internally generated EMFs, R is the winding resistance, L is theequivalent series inductance, va, vb and vc are the terminal voltages as line to neutral voltages,ia, ib and ic are the currents and Ωg is the rotational speed of the generator [13].
2.3. Spectral analysisThe spectral analysis is performed by a Fast Fourier Transform (FFT) with a Minimum 4-termBlackman-Harris window. For signals where the interesting frequency components are likely tochange linearly with the average value of the signal, the FFT can be scaled by its average as
fft(x)
〈x〉=
fft(x)
fft(x)|ω=0
(5)
In this paper we note this self scaled FFT as the relative spectral amplitude. A convenient sideeffect from the relative spectral amplitude is the automatic compensation for the amplitudechange caused by the windowing.
The Science of Making Torque from Wind (TORQUE 2016) IOP PublishingJournal of Physics: Conference Series 753 (2016) 042016 doi:10.1088/1742-6596/753/4/042016
3

2.4. Frequency spectrum versus order spectrumFor rotating mechanical systems it is common to express frequencies in the unit (p), defined as
p =2πf
Ω(6)
where f is the frequency in (Hz) and Ω is the rotational speed in (rad/s). The benefit, comparedto frequency units such as (rad/s), (rpm) or (Hz) is that (p) is independent of the actual speedof the system. The spectrum in (p) is the order spectrum. For a wind turbine, the orderspectrum in low frequency should mainly correspond to aerodynamically induced oscillations.The frequency spectrum in (Hz) can be useful for study of the natural oscillations of the system.Some care is needed when looking at the order spectrum. For example, consider a three-bladedturbine where a 1 p frequency force is introduced by one blade. The frequency may appear asa 1 p frequency on the shaft. Additionally, if the two other blades also introduce a 1 p frequency,a 3 p component is also expected on the shaft.
2.5. Aerodynamic simulationsAerodynamic simulations were performed according to the vortex model described in [14]. Theobtained forces give a purely aerodynamic torque since the simulations are without any aeroelasticity or mechanical modelling of the system. The simulations were performed for tip speedratios (TSRs or λ) from 2.5 – 4.5 for three different wind speeds. During each simulation, theTSR and the wind speed were constant and a full 200 turbine revolutions was simulated. Thefirst half of the simulation stabilized the wake and the last 100 turbine revolutions were usedfor determining the relative spectral amplitude of the torque as an order spectrum (see sections2.3 and 2.4). The relative spectral amplitudes at 1 – 6 p were picked and plotted against theTSR. The process was done for the torque of one blade and for the total torque provided by allblades. The resulting two plots are given in Figure 2. The relative spectral amplitudes at 7 – 20 p,were <0.05 for the blade torque and <0.03 for the total torque. At those frequencies, the relativespectral amplitudes are not as smooth functions of TSR as for the lower frequencies 1 – 6 p.
These simulations ignore aero elasticity, mechanical dynamics and electrical properties ofthe system and can not be compared directly with the measurements of the blade torque andgenerator electrical torque. Still, from the simulations some conclusions can be drawn about theexpectations of the measurements of the blade torque:
• The order spectrum with relative spectral amplitudes mainly depends on the TSR of theturbine for the frequency range 1 – 6 p.
• The different Reynolds numbers (due to different wind speeds) cause some variation in therelative spectral amplitude of the order spectrum, mainly for 1 p, 3 p, 4 p and 5 p at lowTSRs.
• Most of the torque of one blade is represented by the spectral amplitudes at 1 – 6 p.
• Quadratic curve fits, one for each p, seem sufficient to capture the correlation between theTSR and relative spectral amplitude.
• The order spectrum at frequencies >6 p has low amplitudes and lacks smooth correlationto TSR (more random behaviour).
Additionally, it is noted that most of the total torque is represented by the relative spectralamplitude at 3 p with a small contribution at 6 p and 9 p. The other harmonics cancel out dueto the three blade symmetry. The symmetry also causes the relative amplitudes at 3 p, 6 pand 9 p to be the same for the total torque as for the one blade torque.
The Science of Making Torque from Wind (TORQUE 2016) IOP PublishingJournal of Physics: Conference Series 753 (2016) 042016 doi:10.1088/1742-6596/753/4/042016
4

λ
2 2.5 3 3.5 4 4.5
τb,aero/〈τ
b,aero〉
0
0.2
0.4
0.6
0.8
1
1.2(a)
λ
2 2.5 3 3.5 4 4.5
τt,aero/〈τ
t,aero〉
0
0.2
0.4
0.6
0.8
1
1.2(b)
1p 2p 3p 4p 5p 6p
Figure 2. The simulated relative spectral amplitude of the torque at 1 – 6 p plottedversus the TSR for three different wind speeds; dotted line = 4.5 m/s, solid line = 6.0 m/s,dashed line = 9.0 m/s. Figure (a) represents one blade. Figure (b) illustrates the sum of allthree simulated blades.
2.6. Data treatment and studyThe full measurement campaign was from 13 September to 4 December 2014. Sets of data wereextracted from the measurement campaign to get a spread in rotational speed, TSR and torquewhile the conditions (wind speed, wind direction, rotational speed and average power output) forthe duration of 10 full turbine revolutions were stable. Data sets of 10 turbine revolutions wherethe relative standard deviation of the 1 s averages were within 1 % for the rotational speed and5 % for the electrical torque were selected. Given that the rotational speed and electric torquewere stable, the other conditions were also assumed stable. A total of 21 datasets were collected,with TSR ranging 2.0 – 4.2, average torque 90 – 460 Nm and rotational speed 40 – 73 rpm. Thestatistics of these sets are presented in Appendix A. The blade torque and electrical torque weredetermined as described in section 2.1 and 2.2. The relative spectral amplitudes in frequencyspectrum were obtained as described in section 2.3. The relative spectral amplitudes in orderspectrum were obtained in the same way, but from rotation synchronized data. The rotationalsynchronization was performed by re-sampling of the time domain signals based on the zerocrossings of the voltage in one of the generator phases. Spline interpolation was used in there-sampling process.
3. Experimental results and discussionThe results from the analysis are divided into frequency spectrum and order spectrum. Thedifference is illustrated in Figure 3. From the blade torque τb (Figure 3a and 3b) it seems thatsynchronizing with rotation truly simplifies comparison and the relative spectral amplitudesindeed are of similar amplitudes for a specific TSR. By comparing the blade torque to thegenerator electrical torque τel (Figure 3c and 3d) it is clear that the relative spectral amplitudesare considerably lower for the generator. We also note a small amplitude at 16 p that isunrepresented at the blade. This correlates with the 16 pole pairs of the generator and likelycauses are reluctance cogging and/or uneven magnet placement. The passive rectification causesa large 96 p component in the electric power from the generator. However, since we here focuson lower frequencies it is omitted in figures. The rectification impact is further studied in [11].The difference in amplitudes between the frequency spectrum and the order spectrum is due tothe signal processing used to achieve the order spectrum. In the two following sections all of the21 data series are further analysed in order spectrum and frequency spectrum respectively.
The Science of Making Torque from Wind (TORQUE 2016) IOP PublishingJournal of Physics: Conference Series 753 (2016) 042016 doi:10.1088/1742-6596/753/4/042016
5

(b)
τb/〈τ
b〉
0
0.5
1
1.5(a)
(p)0 5 10 15 20
(d)
(Hz)0 5 10 15 20
τel/〈τ
el〉
0
0.02
0.04
0.06
0.08
0.1(c)
Rotational speed = 41.0rpm (1p = 0.68Hz), TSR = 3.03
Rotational speed = 50.7rpm (1p = 0.85Hz), TSR = 3.06
Rotational speed = 60.4rpm (1p = 1.01Hz), TSR = 2.91
Figure 3. Example result at three different rotational speeds with similar TSR in frequencyspectrum (Hz) Figure (a) and (c), and in order spectrum (p) Figure (b) and (d).
3.1. Order spectrumThe relative spectral amplitudes of the blade torque and the generator electrical torque in orderspectrum, are compared in Figure 4. Quadratic curve fits are added since the correlations areexpected to be quadratic, according to section 2.5. First, it should be considered that themeasurements are not directly comparable to the simulations in Figure 4. For the blade, themeasurements were made at the hub, while the simulated force is acting on the blade. Thereis added dynamics caused by aero elasticity and the inertia as well as the spring and damperproperties of the blade and support arms. For the generator torque, while correlated to the totaltorque, it is affected by the additional dynamics of the shaft and the generator on top of thatfrom the blade and the support arms. With these considerations in mind, an analysis of theresults can be made.
For the blade, the spread in the measured relative spectral torque is quite low and thequadratic curve fits look appropriate, see Figure 4. Comparing the spread around the curve fitswith the expected spread caused by variations in wind speed, the results show good coherence.Furthermore, the 2 p is indeed the most dominating frequency, but the amplitude is increasingmore at higher TSR than in the simulations. Perhaps a bit surprising, the amplitude at 3 p is thelowest one in the measurements, but the second largest in the simulations. The amplitude at 1 pis larger in measurements compared to simulations. One interpretation is that the dynamics ofthe system filter the aerodynamic torque. Another explanation could be that the simulationsare overestimating the amplitude at 3 p.
For the generator, the measured relative electrical torque is first of all much lower inamplitude compared to the blade. There are also only small differences in amplitude at
The Science of Making Torque from Wind (TORQUE 2016) IOP PublishingJournal of Physics: Conference Series 753 (2016) 042016 doi:10.1088/1742-6596/753/4/042016
6

different p. According to the simulations, the total torque is expected to mainly consist ofspectral amplitudes at 3 p with small contributions at 6 p and 9 p, and the relative spectralamplitude of one blade should be the same as the relative spectral amplitude of the total torque.Comparing amplitudes of the curve fits at 3 p and 6 p between blade and generator in Figure 4gives the relative spectral amplitude at 3 p for the generator to be at most 41 % of that of theblade. The same comparison for 6 p gives at most 11 %. This suggests some attenuation of thehub torque ripple before seen on the generator electrical output, and that the attenuation maychange with frequency (since 6 p is more attenuated that 3 p). The presence of some 1 p, 2 p,4 p and 5 p in generator electrical torque indicates a possible unbalance in the torque providedby the three blades. The relative amplitudes are in the same order of magnitude as at 3 p and6 p, which are known to be small based on the blade measurement, indicating that the possibleunbalance is probably small.
The measured relative spectral amplitudes at 7 – 10 p are plotted in Figure 5. As predictedby the aerodynamic simulations (see section 2.5), the correlations to TSR are more random forboth the blade and the generator electrical torque. However, spectral amplitudes of the bladeare at least 10 times larger than the simulations. One explanation could be that the naturalfrequencies of the system are synchronizing with some of the p-frequencies and are thereforemistakenly passing as one of them. The spectral amplitudes at the generator actually match thesimulated total turbine amplitudes for 7 – 10 p. This indicates that the rather high amplitudesmeasured at the blade are not progressing to the generator.
The maximum error in the torque measurement is carefully estimated in [9]. Since only oneblade is used here, the error is divided by three and presented in Appendix A. Estimating theerror in terms of the relative spectral amplitudes used in this paper is not as straight forward.However, we can conclude that the deviation between simulation and experiment regardingespecially the 3 p component in Figure 2a and 4a is unlikely explained as a measurement error.The measurement errors in the rotational speed and the wind speed contributes to an error inthe TSR. Without any estimations of its size, we still realize that an error in the TSR wouldonly shift the values in λ-direction (sideways).
The accuracy and resolution of the voltage and current measurements of the generator areassumed fairly good, however, at these low amplitudes, accuracy may be an issue. The rotationalspeed of the generator has been considered constant when estimating the electrical torque, whichis also a possible source of error.
3.2. Frequency spectrumThe relative spectral amplitude of the blade torque in frequency spectrum is illustrated inFigure 6. All 21 datasets are plotted on top of each other, with some transparency on eachline. From Figure 4 it is expected to see large peaks at especially 2 p, 1 p and 4 p. Most ofthe significant spikes in Figure 6a in the range 0 – 8 Hz are from those p-peaks. To find naturalfrequencies it is instead reasonable to focus on the areas where most of the spectrum seems tocoincide. These points indicate over-represented frequencies from all measurements. Two suchregions can be spotted; at bit fuzzy around 6 Hz and more distinctly slightly above 8 Hz. Fromhammer tests in [9], tangential modes were found at 8.0 Hz and 29 Hz for the measurement bladeand at 9.1 Hz and 29 Hz/36 Hz for the other blades, see Appendix B. These frequencies are alsoslightly visible in the spectrum, see Figure 6b.
The relative spectral amplitude of the generator electrical torque in frequency spectrumis illustrated in Figure 7. The relative spectral amplitude of the electrical torque forfrequencies 1 – 20 Hz is <3 % of the relative spectral amplitude of the blade. The possible reasonshave already been discussed in section 3.1. The 16 p spikes turn up, as mentioned before. Tospot any coinciding areas is even more difficult than in the blade torque plot and this approach tomonitor natural frequencies in the system seems difficult. Apart from all the p-peaks cluttering
The Science of Making Torque from Wind (TORQUE 2016) IOP PublishingJournal of Physics: Conference Series 753 (2016) 042016 doi:10.1088/1742-6596/753/4/042016
7

λ
2 2.5 3 3.5 4 4.5
τb/〈τ
b〉
0
0.5
1
1.5
2(a)
λ
2 2.5 3 3.5 4 4.5
τel/〈τ
el〉
0
0.02
0.04
0.06
0.08(b)
1p 2p 3p 4p 5p 6p
Figure 4. The measured relative spectral amplitude of the torque at 1 – 6 p plotted versusthe TSR (dots). Quadratic curve fits have been added (solid lines). Figure (a) is the blade andFigure (b) the generator electric torque.
λ
2 2.5 3 3.5 4 4.5
τb/〈τ
b〉
0
0.5
1
1.5
2(a)
λ
2 2.5 3 3.5 4 4.5
τel/〈τ
el〉
0
0.02
0.04
0.06
0.08(b)
7p 8p 9p 10p
Figure 5. The measured relative spectral amplitude of the torque at 7 – 10 p plotted versusthe TSR. The scale of the y-axis is the same as in Figure 4.
the spectrum, the overall amplitudes are low, making noise a larger part of the spectrum. InFigure 7b the frequency range is extended to 12 – 40 Hz in an attempt to locate the secondtangential mode of the blades, that was visible in blade torque spectrum. No clear evidenceof 29 Hz or 36 Hz is present in the generator electric torque spectrum.
Since the amplitude response of excited natural frequencies may change non-linearly withaverage force, the use of relative spectral amplitude to monitor the natural frequencies shouldbe considered a source of error.
3.3. General discussionAdvanced methods can be used for spectral estimations, and the FFT used here should beconsidered a possible source of error. Also, any possible impact caused by the passive rectificationof the generator or the load controller has not been considered in this work. Furthermore, evenif data with low variations has been selected, the measurements are performed in an open sitewhere wind speed, wind direction and rotational speed of the turbine are not constant.
The Science of Making Torque from Wind (TORQUE 2016) IOP PublishingJournal of Physics: Conference Series 753 (2016) 042016 doi:10.1088/1742-6596/753/4/042016
8

f (Hz)0 2 4 6 8 10 12
= b=h= b
i
0
0.5
1
1.5
(a)
f (Hz)15 20 25 30 35 40
#10-3
0
2
4
6
(b)
Figure 6. The measured relative spectral amplitude of the blade torque as frequencyspectrum at 0 – 12 Hz Figure (a) and 12 – 40 Hz Figure (b). For reference; 1 p = 0.67 – 1.21 Hz.All 21 datasets are plotted on top of each other. The blade first tangential natural frequencyis visible at 8 Hz. The second tangential natural frequencies are visible at 29 Hz and 36 Hzrespectively.
f (Hz)0 2 4 6 8 10 12
= el=
h=eli
0
0.02
0.04
0.06(a)
f (Hz)15 20 25 30 35 40
0
0.005
0.01
0.015(b)
Figure 7. The measured relative spectral amplitude of the generator electricaltorque as frequency spectrum at 0 – 12 Hz Figure (a) and 12 – 40 Hz Figure (b). Forreference; 1 p = 0.67 – 1.21 Hz. All 21 datasets are plotted on top of each other.
4. ConclusionsThe torque provided by one blade has been measured at the hub of a VAWT. The timedomain signals of the blade torque were distorted by the dynamics of the blade and supportarms. Aerodynamic simulations predict the order spectrum to mainly depend on TSR. Theexperimental results analysed in order spectrum indeed provided fairly consistent relative torquespectrum as a function of TSR for one blade. According to the aerodynamic simulations, theorder spectrum of the total torque is limited to 3 p with a small contribution at 6 p and 9 p.The rest of the order spectrum in the range 1 – 10 p cancel out due to symmetry. However,the spectral behaviour in the measurements differ from the aerodynamic simulations. Themeasured electrical torque, based on generator voltage and current, has only 3 % of the relativespectral amplitude of the blade torque in the range 1 – 12 Hz. The results suggest either that thesystem acts as a mechanical filter, highly attenuating even the 3 p component from the blade
The Science of Making Torque from Wind (TORQUE 2016) IOP PublishingJournal of Physics: Conference Series 753 (2016) 042016 doi:10.1088/1742-6596/753/4/042016
9

torque and/or that the aerodynamic simulations overestimate the 3 p component. An interestingconsequence is that the torque ripple entering the shaft of the turbine is surprisingly low. Thismay change during more turbulent conditions, when the blades provide uneven torque.
Even if filtered to lower values, the most dominating amplitudes in the order spectrum ofthe turbine torque are measurable in the generator electrical torque. The process is straightforward, given that the data can be re-sampled in synchronisation with the rotational speed.An unbalance in the turbine could possibly be identified by monitoring changes from a givenbaseline in the order spectrum.
The attempt to track natural frequencies in the system by simple FFT of the relative torquewas promising for the blade, but unsuccessful for the generator electrical torque. Two challengeswere discovered; the FFT of the generator electrical torque is cluttered by the p-frequencies andthe spectral amplitudes are small. Tracking of natural frequencies in a VAWT using this methodmay still be possible with more advanced signal processing and/or improved measurementperformance.
AcknowledgmentsThe J. Gust Richert foundation is acknowledged for contributions for equipment for the loadcell experiments. This work was conducted within the STandUp for Energy strategic researchframework.
References[1] Sutherland H J, Berg D E and Ashwill T D 2012 A retrospective of VAWT technology Tech. Rep. SAND2012-
0304 Sandia National Laboratories Albuquerque, New Mexico, USA[2] Johnston S F 1980 Proceedings of the Vertical Axis Wind Turbine (VAWT) Design Technology Seminar for
Industry Tech. Rep. SAND80-0984 Sandia National Laboratories Albuquerque, New Mexico, USA[3] Akins R E 1989 Measurements of Surface Pressures on an Operating Vertical-Axis Wind Turbine Tech. Rep.
SAND89-7051 Sandia National Laboratories Albuquerque, New Mexico, USA[4] Oler J, Strickland J, Im B and Graham G 1983 Dynamic stall regulation of the Darrieus turbine Tech. Rep.
SAND83-7029 Sandia National Laboratories Albuquerque, New Mexico, USA[5] Solum A, Deglaire P, Eriksson S, Stalberg M, Leijon M and Bernhoff H 2006 Proceedings of EWEC 2006 -
European Wind Energy Conference & Exhibition, Athens pp 1–9[6] Deglaire P, Eriksson S, Kjellin J and Bernhoff H 2007 Proceedings of EWEC 2007 - European wind energy
conference & exhibition, Milan[7] Kjellin J, Eriksson S, Deglaire P, Bulow F and Bernhoff H 2008 Proceedings of EWEC 2008 - European wind
energy conference & exhibition, Brussels[8] Eriksson S, Solum A, Leijon M and Bernhoff H 2008 Renewable Energy 33 674–681[9] Rossander M, Dyachuk E, Apelfrojd S, Trolin K, Goude A, Bernhoff H and Eriksson S 2015 Energies 8
5973–5996[10] Dyachuk E, Rossander M, Goude A and Bernhoff H 2015 Energies 8 8482–8496[11] Rossander M 2016 Blade force measurements and electrical torque ripple of a vertical axis wind turbine
Licentiate thesis Uppsala University Uppsala, Sweden[12] Barszcz T and Randall R B 2009 Mechanical Systems and Signal Processing 23 1352–1365[13] Pillay P and Krishnan R 1988 IEEE Transactions on Industrial Electronics 35 537–541[14] Dyachuk E 2015 Aerodynamics of Vertical Axis Wind Turbines - Development of Simulation Tools and
Experiments Ph.D. thesis Uppsala University
The Science of Making Torque from Wind (TORQUE 2016) IOP PublishingJournal of Physics: Conference Series 753 (2016) 042016 doi:10.1088/1742-6596/753/4/042016
10

Appendix A. Statistics of the datasets
Ωg (rpm) Wind speed (m/s) TSR 〈τel〉 (Nm) 〈τb〉 ±∆τb (Nm) Time
41.0 4.6 3.03 88.9 40.4± 4 2014-09-25 11:1540.3 6.8 2.00 106.0 46.0± 4 2014-10-07 13:4940.3 6.1 2.26 111.4 47.1± 4 2014-10-07 13:5540.6 6.7 2.06 110.2 46.6± 4 2014-10-07 13:5940.3 5.2 2.63 108.5 47.5± 4 2014-10-08 12:3350.3 5.5 3.08 177.3 72.1± 4 2014-09-23 07:2250.0 4.7 3.63 90.1 38.9± 4 2014-09-23 07:2950.7 5.6 3.06 170.3 66.5± 4 2014-09-23 07:3150.4 4.9 3.51 121.1 51.7± 4 2014-09-23 07:3451.1 5.2 3.30 126.9 55.7± 4 2014-10-06 11:5060.7 8.8 2.34 321.4 120.1± 5 2014-09-26 14:2860.5 7.6 2.72 345.9 125.9± 5 2014-10-08 05:3960.2 8.9 2.30 314.9 121.3± 5 2014-10-08 05:3959.8 10.2 2.00 253.6 97.2± 5 2014-10-08 05:4060.4 7.0 2.91 327.1 120.5± 5 2014-10-08 05:4465.6 5.3 4.17 137.1 59.0± 4 2014-10-07 19:2266.4 6.8 3.34 248.1 95.4± 5 2014-10-07 19:2565.2 5.7 3.90 130.8 57.0± 4 2014-10-07 19:2566.6 6.2 3.69 200.6 80.3± 4 2014-10-07 19:4765.5 6.6 3.37 303.2 112.9± 5 2014-10-07 20:0472.6 8.9 2.77 456.8 164.8± 5 2014-10-27 08:28
Appendix B. Tangential hammer test spectrum
f (Hz)0 10 20 30 40 50 60 70 80 90 100
Ft(N
)
10-2
100
102
Figure B1. The frequency spectrum of the tangential force measured by the load cells afterimpacting the front of the blade at about half of the blade length. The plot illustrates twosubsequent tests.
The Science of Making Torque from Wind (TORQUE 2016) IOP PublishingJournal of Physics: Conference Series 753 (2016) 042016 doi:10.1088/1742-6596/753/4/042016
11