
Framework for Managing Urban and Regional Economic Development Risks
19
Framework for Managing Local Economic Development Risks Emeritus Professor Brian H. Roberts, [email protected] ABSTRACT Effective management of risk events in local governments and communities is important to ensuring the sustainability of local economic development (LED). As urban and regional economies become more integrated into the global economy, their exposure to risks increases and the management of these becomes increasingly important. Policy makers face increasingly exacting choices about which risks to manage, how to measure the level of risks, who determines acceptable levels of risk exposure to communities and the most appropriate strategies to manage risk. These are demanding questions to answer, as risks by their very nature are difficult things to predict or fully understand. This paper elucidates upon the application of a risk evaluation technique, Multi-Sector Risk Analysis (Roberts, B.H, and C. Tabart, 2005) 1 , to develop a framework for pre and post risk strategies for managing local economic development risk in cities and regions. The framework was used for developing sector industry risk management strategies and plans for selected industries in Canberra, Australia. INTRODUCTION Risks are things we are all familiar with. They are events, factors or exchanges which have the potential to cause damage, result in harm, or disharmony, which bring about uncertainty in individuals, communities, governments, businesses and economic systems. Risks may be real or perceived. At a personal level we learn to develop strategies to manage risk every day. At community, national and global levels, however, this becomes more difficult. In a world where cities and regions have replaced nation states as the engines of economic growth and development (Harris, 1997; WBI, 2010), identifying ways to reduce the potential impact of risk events and factors that have the potential to damage the productive capacity and social cohesiveness of economies will become an important part of local economic development (LED) planning and strategy practice. Unfortunately, there are few best practice examples of regional economic risk assessment and management strategies to be found, and there is a need for much more research into the subject. This article presents a framework to assist local governments, businesses and communities to develop strategies and actions to manage local economic development risks. The article draws extensively on work undertaken several years ago on risks affecting the Australian National Territory (ACT) economy of Canberra, and the development of strategies to mitigate these (B.H. Roberts & Tabart, 2005). Much of the research to develop the framework was exploratory and developmental, using a range of established and new research techniques to investigate risks affecting the ACT economy, and strategies and actions to improve risk management of the economy. Local Economic Development Risk Local Economic Development (LED) risks are events or situations have the potential to create uncertainty or harm to local economies. LED risk events may be triggered by endogenous or exogenous factors or actions. Their impacts are often multi-dimensional – including physical, economic, social, environmental and psychological. Some risk events are dramatic, short-lived, and devastating. Others are slow and imperceptible, but can be equally devastating in their impact upon the local economies of cities and regions. Many studies have been conducted on the impact that risk events have on LED. Risk events such as terrorist attacks, earthquakes and typhoons, pandemic disease outbreaks and bushfires have caused significant damage to local economies and have had reverberations globally. September 11 was estimated to have cost the New York economy $US83 billion (NYC Partnership, 2002). The Fukushima Earthquake was estimated to have caused between $150 and $250 billion of damage and will reduce GDP by 2-3% (STANLIB, 2011). The ongoing impacts will continue for many years, just as they have with the Chernobyl disaster. 1 The author is indebted to his former research assistant Christine Tabart for the research and analysis undertaken as part of the ACT Risk Analysis Study, which this article draws upon. AcademyPublish.org – Risk Assessment and Management 200
Transcript of Framework for Managing Urban and Regional Economic Development Risks
Framework for Managing Local Economic Development Risks
Emeritus Professor Brian H. Roberts, [email protected]
ABSTRACT
Effective management of risk events in local governments and communities is important to ensuring the sustainability of localeconomic development (LED). As urban and regional economies become more integrated into the global economy, their exposure torisks increases and the management of these becomes increasingly important. Policy makers face increasingly exacting choices aboutwhich risks to manage, how to measure the level of risks, who determines acceptable levels of risk exposure to communities and themost appropriate strategies to manage risk. These are demanding questions to answer, as risks by their very nature are difficult thingsto predict or fully understand. This paper elucidates upon the application of a risk evaluation technique, Multi-Sector Risk Analysis(Roberts, B.H, and C. Tabart, 2005)1, to develop a framework for pre and post risk strategies for managing local economicdevelopment risk in cities and regions. The framework was used for developing sector industry risk management strategies and plansfor selected industries in Canberra, Australia.
INTRODUCTION
Risks are things we are all familiar with. They are events, factors or exchanges which have the potential to cause damage, result inharm, or disharmony, which bring about uncertainty in individuals, communities, governments, businesses and economic systems.Risks may be real or perceived. At a personal level we learn to develop strategies to manage risk every day. At community, nationaland global levels, however, this becomes more difficult.
In a world where cities and regions have replaced nation states as the engines of economic growth and development (Harris, 1997;WBI, 2010), identifying ways to reduce the potential impact of risk events and factors that have the potential to damage the productivecapacity and social cohesiveness of economies will become an important part of local economic development (LED) planning andstrategy practice. Unfortunately, there are few best practice examples of regional economic risk assessment and managementstrategies to be found, and there is a need for much more research into the subject.
This article presents a framework to assist local governments, businesses and communities to develop strategies and actions to managelocal economic development risks. The article draws extensively on work undertaken several years ago on risks affecting theAustralian National Territory (ACT) economy of Canberra, and the development of strategies to mitigate these (B.H. Roberts &Tabart, 2005). Much of the research to develop the framework was exploratory and developmental, using a range of established andnew research techniques to investigate risks affecting the ACT economy, and strategies and actions to improve risk management ofthe economy.Local Economic Development Risk
Local Economic Development (LED) risks are events or situations have the potential to create uncertainty or harm to local economies.LED risk events may be triggered by endogenous or exogenous factors or actions. Their impacts are often multi-dimensional –including physical, economic, social, environmental and psychological. Some risk events are dramatic, short-lived, and devastating.Others are slow and imperceptible, but can be equally devastating in their impact upon the local economies of cities and regions.
Many studies have been conducted on the impact that risk events have on LED. Risk events such as terrorist attacks, earthquakes andtyphoons, pandemic disease outbreaks and bushfires have caused significant damage to local economies and have had reverberationsglobally. September 11 was estimated to have cost the New York economy $US83 billion (NYC Partnership, 2002). The FukushimaEarthquake was estimated to have caused between $150 and $250 billion of damage and will reduce GDP by 2-3% (STANLIB, 2011).The ongoing impacts will continue for many years, just as they have with the Chernobyl disaster.
1 The author is indebted to his former research assistant Christine Tabart for the research and analysis undertaken as part of the ACTRisk Analysis Study, which this article draws upon.
AcademyPublish.org – Risk Assessment and Management 200

There are, however, other types of risk events which are more latent in nature, and have the potential to be even more devastating inthe longer term than the impacts associated with physical disasters and accidents. Risks factors such as the gradual impacts of climatechange, social unrest, economic reforms, foreign exchange rate fluctuations, and loss of skills through migration etc., can have animperceptible and cancerous impact on the health, vitality and development of local economies. Many of these events are gradual,inconspicuous and have cumulative causation effects (Myrdal, 1957) which can significantly affect the resilience of ailing localeconomies in recovery mode.
The way risk events influence the resilience or ability of local communities to recover from a disaster, illness or shock is not wellunderstood. LED risks are very difficult to anticipate, measure, and manage. The cumulative causation impacts and patternsgenerated from the initiating event or events do not always follow similar pathways. Local factors such as governance, communitycohesiveness, financial reserves, preparatory responses and chance can play a significant role the recovery of local economies thathave experienced some form of shock. Endemic factors such as corruption, leadership, poverty and generosity can greatly influencethe rate of recovery following a shock event.
As local economies become more internationalised, diverse and exposed to competition, they are becoming increasingly exposed tonew types of risk events. To more effectively manage LED risks, governments, businesses and communities will need to becomemuch more proficient at anticipating and developing strategies to manage these. There is a well established pool of literature andother material available on anticipating and managing major disaster risk events. However, it is the secondary and often delayedimpacts of cumulative risk events that are not understood and given inadequate consideration in things like post-disaster planning andrecovery. The economic plans for disaster recovery are often not prepared until well after the humanitarian program is finished.Because of the multi-dimensional nature of cumulative impacts that result from risks events, there is need to develop a multiple-strategy approach to risk management. There are few good examples of multiple-strategy approaches to LED risk managementStrategic Planning Framework for Risk Management
Strategic planning plays an important role in risk management. In developing a framework for managing LED risk, many of theprinciples and practices used in strategic planning for business are applied. Figure 1 shows the framework for preparing andimplementing a multi-sector risk management plan. There are five elements to the framework:
• Risk Analysis• Determination of Acceptable Risk• Principles Guiding Risk Management Plans• Multi-Sector Risk Management Plans• Regional Economic Risk Intelligence System
Fig. 1. Strategic planning framework for regional risk economic management
TEXT
RISK ANALYSIS
The first step in the preparation of an LED risk management plan is a multi-sector industry risk analysis. There are well-developedtools and techniques ranging from basic SWOT to Multi-Sector Regional Risk Analysis (MSA) for conducting risk analyses of localeconomies (B. H. Roberts, 2003; B.H Roberts, 2006; B. H. Roberts & Stimson, 1998). It is also recommended that when using theserisk analysis tools other qualitative research techniques such as focus groups and historic analysis be used to try and establish a pictureof the impact of past events on a local economy or similar types of economies elsewhere. The risk analysis should provide anassessment of the composite likelihood, impact and consequences of risk events affecting a local economy.
Sector Strategy
RegionalRisk
Analysis
RegionalRisk
Analysis
Determination ofAcceptable Risk
• Priorities• Nature of Risks• Values• Obligations &
Responsibilities• Cumulative
Determination ofAcceptable Risk
• Priorities• Nature of Risks• Values• Obligations &
Responsibilities
• Cumulative
AcademyPublish.org – Risk Assessment and Management 201
The risk analysis also provides useful data which can be used to set discount rates to test the feasibility of major projects thatgovernment may want to support as part of a local economic development plan. A general failure of LED planning is the general lackof a risk assessment undertaken in formulating development strategies and the absence of strategies in LED plans to manage thepotential impact of risk events. Ironically, this is a requirement of most corporate business plans and international developmentassistance prefeasibility projects, but is something seldom undertaken by local or regional governments in assessing the feasibility ofLED plans.
Multi-Sector Risk Analysis
There are standard techniques used to conduct risk management assessments. A modification to this standard assessment technique isrequired to conduct a risk assessment of local economies. Multi-sector risk analysis techniques using Multi-Criteria Analysis weredeveloped and tested by the author for the Far North Queensland Economy of Australia (B. H. Roberts & Stimson, 1998) andsubsequently a tool was developed for multi-sector risk analysis (B. H. Roberts, 2003) for application in other economies.
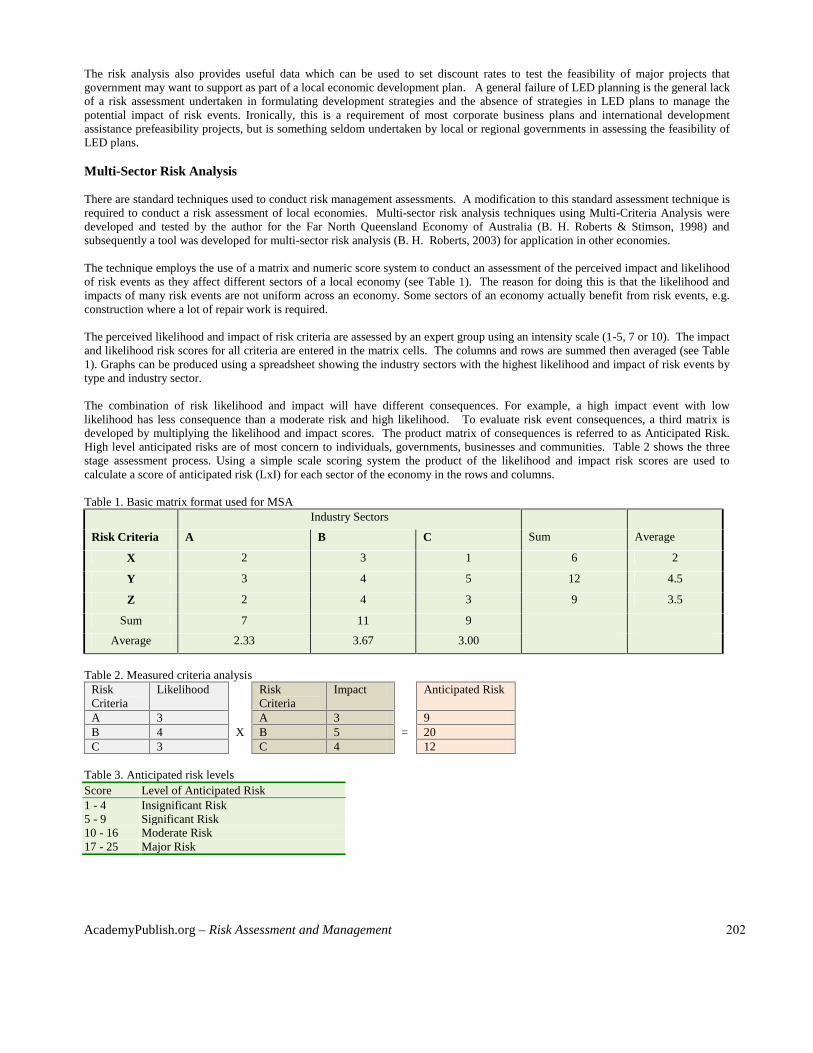
The technique employs the use of a matrix and numeric score system to conduct an assessment of the perceived impact and likelihoodof risk events as they affect different sectors of a local economy (see Table 1). The reason for doing this is that the likelihood andimpacts of many risk events are not uniform across an economy. Some sectors of an economy actually benefit from risk events, e.g.construction where a lot of repair work is required.
The perceived likelihood and impact of risk criteria are assessed by an expert group using an intensity scale (1-5, 7 or 10). The impactand likelihood risk scores for all criteria are entered in the matrix cells. The columns and rows are summed then averaged (see Table1). Graphs can be produced using a spreadsheet showing the industry sectors with the highest likelihood and impact of risk events bytype and industry sector.
The combination of risk likelihood and impact will have different consequences. For example, a high impact event with lowlikelihood has less consequence than a moderate risk and high likelihood. To evaluate risk event consequences, a third matrix isdeveloped by multiplying the likelihood and impact scores. The product matrix of consequences is referred to as Anticipated Risk.High level anticipated risks are of most concern to individuals, governments, businesses and communities. Table 2 shows the threestage assessment process. Using a simple scale scoring system the product of the likelihood and impact risk scores are used tocalculate a score of anticipated risk (LxI) for each sector of the economy in the rows and columns.
Table 1. Basic matrix format used for MSAIndustry Sectors
Risk Criteria A B C Sum Average
X 2 3 1 6 2
Y 3 4 5 12 4.5
Z 2 4 3 9 3.5
Sum 7 11 9
Average 2.33 3.67 3.00
Table 2. Measured criteria analysisRiskCriteria
Likelihood RiskCriteria
Impact Anticipated Risk
A 3 A 3 9B 4 X B 5 = 20C 3 C 4 12
Table 3. Anticipated risk levelsScore Level of Anticipated Risk1 - 4 Insignificant Risk5 - 9 Significant Risk10 - 16 Moderate Risk17 - 25 Major Risk
AcademyPublish.org – Risk Assessment and Management 202
Categories of Risk
To conduct a Multi-Sector Risk Analysis it is useful to categorize risks. Seven broad categories of risk are considered important in themanagement of regional development. These include:• Economic Risk relates to the impact of global markets, trade factors, inflation, transportation and communication affectinggoods and services.• Production Risk relates to access to resources, profits, and production costs, such as labor disruptions, change in materialand energy prices affecting production and corruption.• Governance Risk relates to sovereign risk, government instability and loss of control over economic development processesby government.• Environmental Risk relates to resource depletion, pollution, disease, natural and man-made disasters and quality of life.• Societal or Social Risk relates to public liability claims against businesses, community attitudes towards development andpressure groups.• Technological Risk relates to risks associated with the applications of technologies used in production processes• Behavioral Risk relates to the behavioral characteristics of people. The level of trust, sense of security and attitudes to workaffect the performance and efficiency of firms, organizations and industry sectors.Other categories of LED risk can be added to this list.
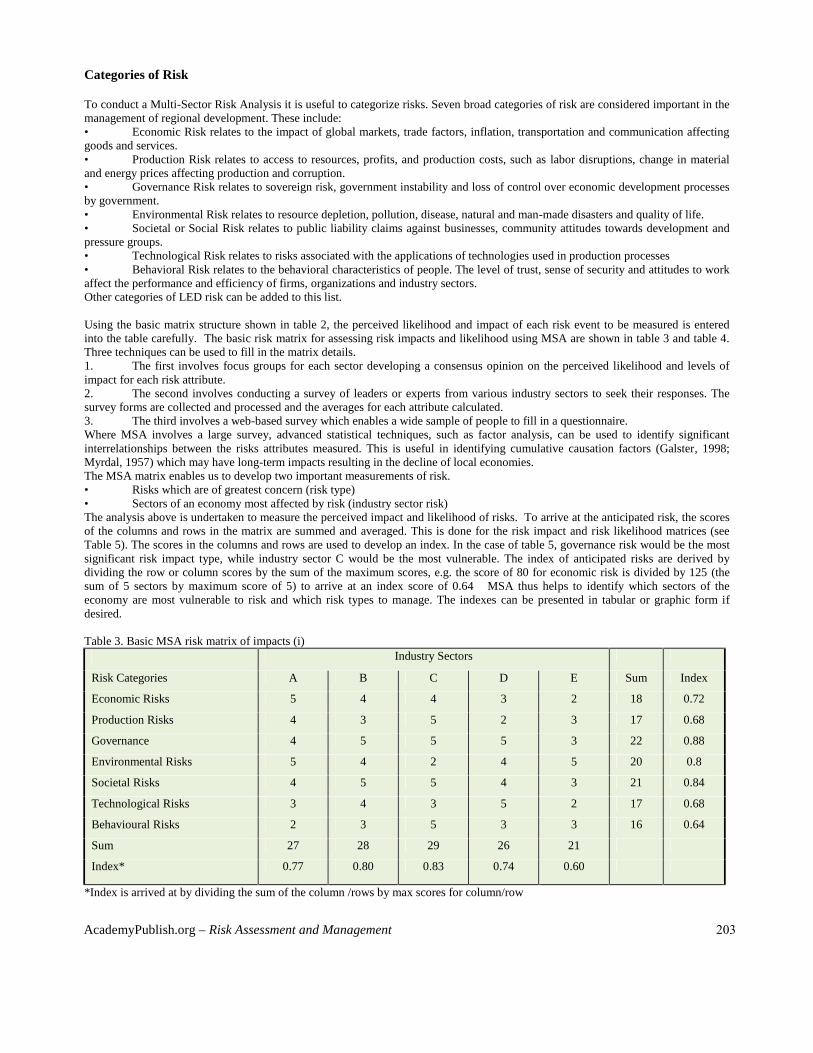
Using the basic matrix structure shown in table 2, the perceived likelihood and impact of each risk event to be measured is enteredinto the table carefully. The basic risk matrix for assessing risk impacts and likelihood using MSA are shown in table 3 and table 4.Three techniques can be used to fill in the matrix details.1. The first involves focus groups for each sector developing a consensus opinion on the perceived likelihood and levels ofimpact for each risk attribute.2. The second involves conducting a survey of leaders or experts from various industry sectors to seek their responses. Thesurvey forms are collected and processed and the averages for each attribute calculated.3. The third involves a web-based survey which enables a wide sample of people to fill in a questionnaire.Where MSA involves a large survey, advanced statistical techniques, such as factor analysis, can be used to identify significantinterrelationships between the risks attributes measured. This is useful in identifying cumulative causation factors (Galster, 1998;Myrdal, 1957) which may have long-term impacts resulting in the decline of local economies.The MSA matrix enables us to develop two important measurements of risk.• Risks which are of greatest concern (risk type)• Sectors of an economy most affected by risk (industry sector risk)The analysis above is undertaken to measure the perceived impact and likelihood of risks. To arrive at the anticipated risk, the scoresof the columns and rows in the matrix are summed and averaged. This is done for the risk impact and risk likelihood matrices (seeTable 5). The scores in the columns and rows are used to develop an index. In the case of table 5, governance risk would be the mostsignificant risk impact type, while industry sector C would be the most vulnerable. The index of anticipated risks are derived bydividing the row or column scores by the sum of the maximum scores, e.g. the score of 80 for economic risk is divided by 125 (thesum of 5 sectors by maximum score of 5) to arrive at an index score of 0.64 MSA thus helps to identify which sectors of theeconomy are most vulnerable to risk and which risk types to manage. The indexes can be presented in tabular or graphic form ifdesired.
Table 3. Basic MSA risk matrix of impacts (i)Industry Sectors
Risk Categories A B C D E Sum Index
Economic Risks 5 4 4 3 2 18 0.72
Production Risks 4 3 5 2 3 17 0.68
Governance 4 5 5 5 3 22 0.88
Environmental Risks 5 4 2 4 5 20 0.8
Societal Risks 4 5 5 4 3 21 0.84
Technological Risks 3 4 3 5 2 17 0.68
Behavioural Risks 2 3 5 3 3 16 0.64
Sum 27 28 29 26 21
Index* 0.77 0.80 0.83 0.74 0.60
*Index is arrived at by dividing the sum of the column /rows by max scores for column/row
AcademyPublish.org – Risk Assessment and Management 203
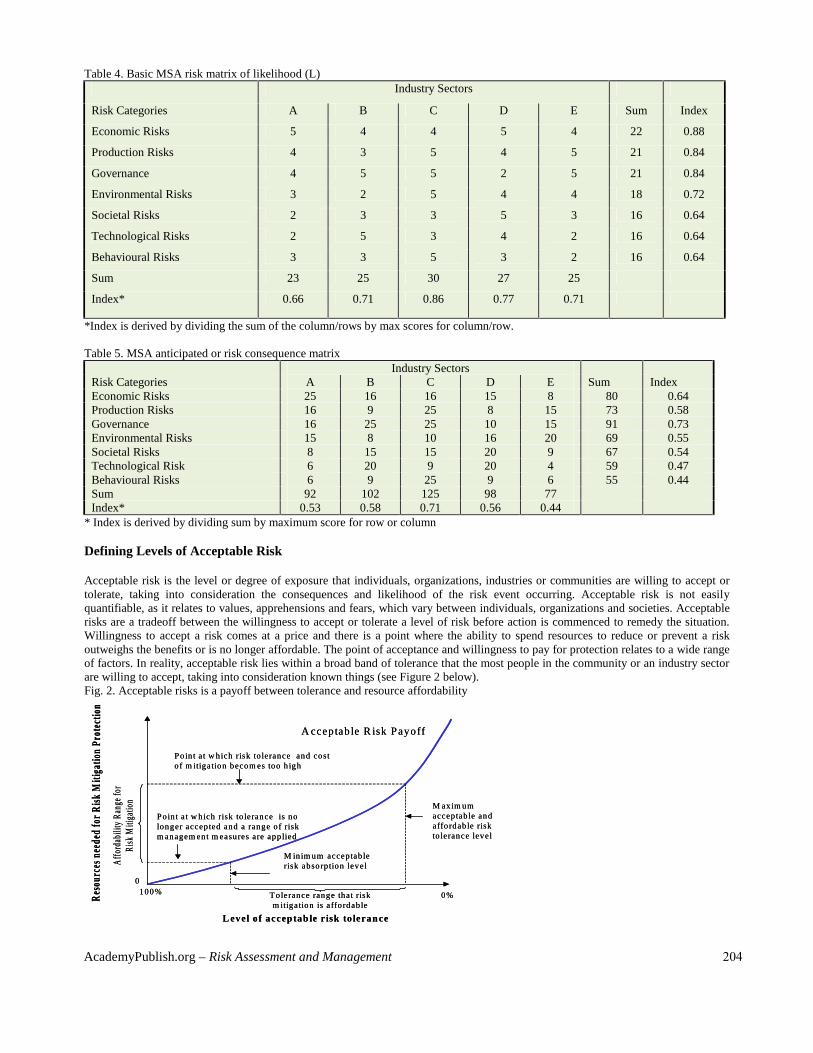
Table 4. Basic MSA risk matrix of likelihood (L)Industry Sectors
Risk Categories A B C D E Sum Index
Economic Risks 5 4 4 5 4 22 0.88
Production Risks 4 3 5 4 5 21 0.84
Governance 4 5 5 2 5 21 0.84
Environmental Risks 3 2 5 4 4 18 0.72
Societal Risks 2 3 3 5 3 16 0.64
Technological Risks 2 5 3 4 2 16 0.64
Behavioural Risks 3 3 5 3 2 16 0.64
Sum 23 25 30 27 25
Index* 0.66 0.71 0.86 0.77 0.71
*Index is derived by dividing the sum of the column/rows by max scores for column/row.
Table 5. MSA anticipated or risk consequence matrixIndustry Sectors
Risk Categories A B C D E Sum IndexEconomic Risks 25 16 16 15 8 80 0.64Production Risks 16 9 25 8 15 73 0.58Governance 16 25 25 10 15 91 0.73Environmental Risks 15 8 10 16 20 69 0.55Societal Risks 8 15 15 20 9 67 0.54Technological Risk 6 20 9 20 4 59 0.47Behavioural Risks 6 9 25 9 6 55 0.44Sum 92 102 125 98 77Index* 0.53 0.58 0.71 0.56 0.44
* Index is derived by dividing sum by maximum score for row or column
Defining Levels of Acceptable Risk
Acceptable risk is the level or degree of exposure that individuals, organizations, industries or communities are willing to accept ortolerate, taking into consideration the consequences and likelihood of the risk event occurring. Acceptable risk is not easilyquantifiable, as it relates to values, apprehensions and fears, which vary between individuals, organizations and societies. Acceptablerisks are a tradeoff between the willingness to accept or tolerate a level of risk before action is commenced to remedy the situation.Willingness to accept a risk comes at a price and there is a point where the ability to spend resources to reduce or prevent a riskoutweighs the benefits or is no longer affordable. The point of acceptance and willingness to pay for protection relates to a wide rangeof factors. In reality, acceptable risk lies within a broad band of tolerance that the most people in the community or an industry sectorare willing to accept, taking into consideration known things (see Figure 2 below).Fig. 2. Acceptable risks is a payoff between tolerance and resource affordability
A cceptab le R isk P ayoff
L evel o f acceptab le r isk to lerance
Reso
urce
s nee
ded f
or R
isk M
itiga
tion P
rotec
tion
100% 0%
Poin t a t w hich risk to lerance and costof m itigation becom es too h igh
Poin t a t w hich risk to lerance is nolonger accep ted and a range of riskm anagem ent m easures are app lied
M axim umacceptab le andaffordab le riskto lerance level
M inim um accep tab lerisk absorp tion levelA
fford
abili
ty R
ange
for
Risk
Miti
gatio
n
T o lerance range that riskm itigation is affordab le
0
AcademyPublish.org – Risk Assessment and Management 204
The level of acceptable risks that regional communities, firms, and industries are prepared to accept or tolerate can have a significantinfluence on regional economic competitiveness. A region whose local businesses and firms are strongly risk averse will have low riskthresholds and is highly likely to be a moderate economic performer. Regions that have high risk thresholds – i.e. are risk takers – arelikely to be more competitive, but may also experience greater shocks or fluctuations in fortunes in the local economy.
It is not generally possible to eliminate all risks. Regional firms and public agencies must, therefore, determine what level of risk aregional economy or sector industries can tolerate. In arriving at a consensus of acceptable risk, the cost of measures to manage riskssomehow must be balanced against economic or efficiency gains and the expenditure allocated to recurrent business operations, newinvestment and savings. A low acceptable risk tolerance level has the potential to reduce business profitability and waste resources inthe public sector. There are no best practices to indicate how to optimize acceptable risk in terms of trade off and potential losses.
There are five important factors that influence how regions, sector industries and individual enterprises arrive at a level of acceptablerisk. These are:
PrioritiesDetermining risk priorities is an enormously difficult task. However, necessity dictates that we set priorities for a wide range ofbusiness and personal functions for which we are involved. Ranking risks is a useful means to enable us to set priorities for riskmanagement. The measurement of Anticipated Risk described in earlier enables regions and sector industries to identify the types ofrisks they should manage.
Nature of RisksA significant factor associated with determining acceptable risk is whether risks are perceptual or real. Fear has a major influence ondecisions made about acceptable risk. Fear of an aircraft accident is many times greater than fear of a motor vehicle accident, yet theprobability of involvement in the latter is substantially greater than the former. It is extremely difficult to rationalize the extent towhich regional risks are actual or real, but the failure to arrive at a level of acceptable risk, which is rational, can have substantialresource implications, as witnessed by the current levels of public expenditure on terrorism prevention globally.
A bias towards perceptual risk may lead to an over-allocation of resources on measures to reduce what turns out to be a phantom risk.In the process, resources that might otherwise have been directed to investment in the public and private sectors are diverted, leadingto under-investment and a possible decline in regional competitiveness. A major challenge in defining acceptable risk is to rationalizethe fear and perceptual factor. A useful means of doing this is to use Delphi Analysis or expert reference groups to carefully reviewthe risk analysis technique used, and to adjust the ratings and ranking of risks if necessary.
ValuesCommunity, business and public institution values have a strong influence on acceptable risk. These values are determined by suchthings as: culture, education, past histories and level of development. As countries and regions develop, acceptable risk thresholdstend to drop, as organizations and individuals adopt a generally more conservative approach to risk management in order to protectassets and investments. In assessing business values about acceptable risk, there can be expected to be significant variations betweensmall and medium enterprises (SME) and big business, and also between sectors. Similar variances can be found in public institutions.The structure of an economy, therefore, will strongly influence the values of public institutions and businesses hold about acceptablerisk.
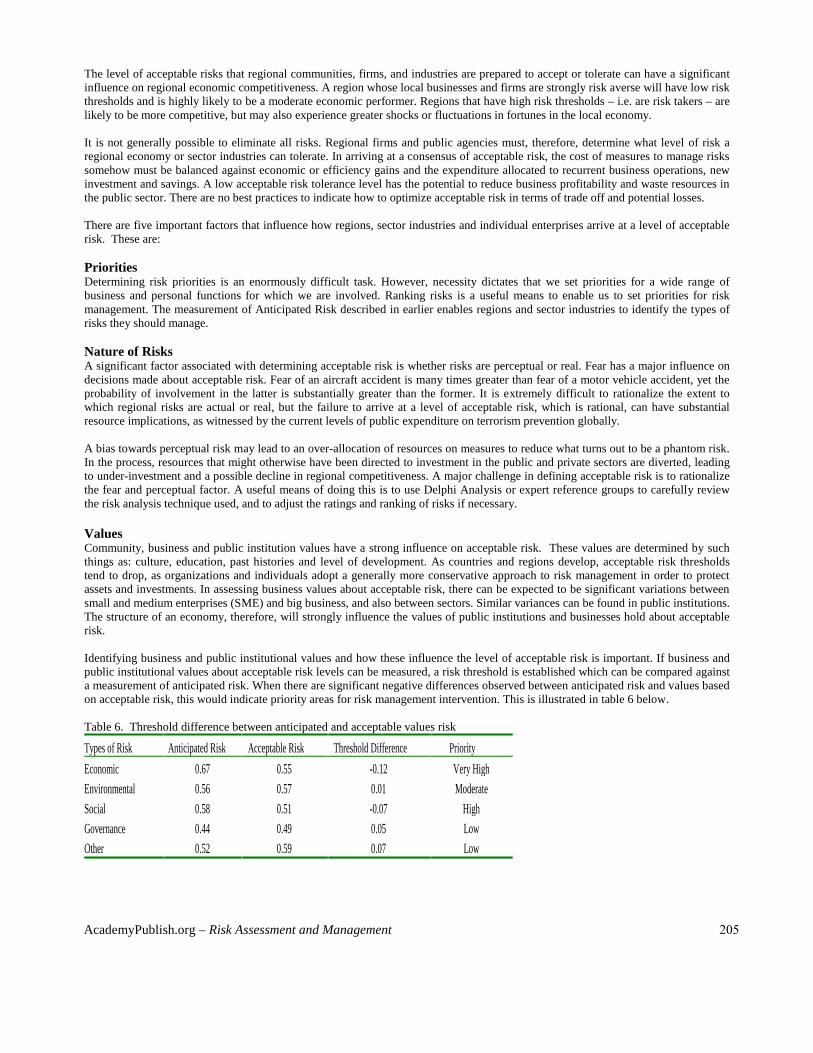
Identifying business and public institutional values and how these influence the level of acceptable risk is important. If business andpublic institutional values about acceptable risk levels can be measured, a risk threshold is established which can be compared againsta measurement of anticipated risk. When there are significant negative differences observed between anticipated risk and values basedon acceptable risk, this would indicate priority areas for risk management intervention. This is illustrated in table 6 below.
Table 6. Threshold difference between anticipated and acceptable values risk
Types of Risk Anticipated Risk Acceptable Risk Threshold Difference Priority
Economic 0.67 0.55 -0.12 Very High
Environmental 0.56 0.57 0.01 Moderate
Social 0.58 0.51 -0.07 High
Governance 0.44 0.49 0.05 Low
Other 0.52 0.59 0.07 Low
AcademyPublish.org – Risk Assessment and Management 205

Obligations and ResponsibilitiesAcceptable risk is also determined by related obligations and responsibilities for managing risk at different organizational levels.Figure 2 shows responsibility for risks rests with many levels. For example, international agencies such as the UN and the EC havedeveloped and coordinate international strategies to deal with health, environment and transnational disasters. At the national level,Australia has well-developed strategies for natural hazard disasters2, although these are not widely known at a community level, andin preparing strategies for health, terrorism and like emergencies. State and provincial governments also have well-developedemergency and disaster management strategies, but there are few strategies to deal with economic and social risk.
Fig. 3. Levels and obligations to manage risks
Spatial factors bring about the need for obligations by authorities to delegate responsibilities for risk management at higher and lowerlevels of organizations. For example, containing diseases such as SARS is coordinated by the World Health Organization (WHO) butthe obligation for risk protection is designated to both country and regional levels. In other cases, local emergencies will becoordinated at a state level but operational responsibilities may be managed by regional or local governments. The spatial dimensionof risk management changes the concept of acceptable risk to a mutual obligation to support other regions. For example, floodmitigation may require local governments in the downstream catchment area to accept the need to provide support for upper streamcatchments in order to mitigate risks in the event of a major flood.
Cumulative RiskThe final area of acceptable risk concern is cumulative risk. Cumulative risks involve a risk chain reaction, the effects of which can becatastrophic. Myrdall (1957) identified a range of factors contributing to social decline in his studies of cumulative causation. Whenthe responsibility for the management of a risk event, which falls under one jurisdiction, triggers events in other sectors, each underdifferent management jurisdictions, acceptable risk levels inevitably change. There is a compound factor that must be allowed for indefining acceptable risk for cumulative type events. Determining acceptable risks for complex risk events is extremely difficult, as thecombinations of risk events are never predictable. For this reason, it is useful to understand the potential nature of chain reaction risksand how to manage these.When these cumulative types of events occur, a transfer of responsibility for coordination of risk management to a higherorganizational level is often needed. However, unless acceptable risks relating to chain reaction events are defined, domains ofresponsibility for risk management become unclear and the subsequent impacts can become severe and prolonged.
BASIC PRINCIPLES GUIDING REGIONAL RISK MANAGEMENT PLANS
The success of multi-sector LED risk management plans is dependent upon cooperation between many stakeholders and interestedparties. For cooperation to be encouraged and to avoid misunderstandings it is useful for risk management plans to be guided byprinciples that outline mutual obligations and values shared by stakeholders and other parties. The following principles arerecommended for guiding the preparation and implementation of risk management plans.
Regional and sector industry risk management plans should:• Include a declaration of mutual obligations and responsibilities by all stakeholders and parties for implementation ofstrategies and measures included in a risk plan
2 See Emergency Management Australia, http://www.ema.gov.au/
InternationalInternational
NationalNational
StateState
RegionalRegional
SectorSector
EnterpriseEnterprise
Economic Environmental Social Governance Other
Types of Risk
Org
anis
atio
nal L
evel
of R
isk
Man
agem
ent
InternationalInternational
NationalNational
StateState
RegionalRegional
SectorSector
EnterpriseEnterprise
Economic Environmental Social Governance Other
Types of Risk
Org
anis
atio
nal L
evel
of R
isk
Man
agem
ent
AcademyPublish.org – Risk Assessment and Management 206
• Be well balanced, current, and sustainable• Identify and prioritize key risk concerns and responsible agencies• Recognize the levels and inter-relationship of risk management responsibilities and the obligation that result from this• Have proper regard to community and regional views and values• Have a communication plan to inform stakeholders and affected parties• Have a well-defined and agreed communication and control system to ensure all parties are informed of what they aresupposed to do in the event of a risk event occurring• Identify risks which offer economic benefits or business development opportunities• Indicate possible legal liabilities related to specific risks• Measure the impact of expenditure effectiveness of risk measures• Include performance measures to enable plans to be properly interpreted, revised regularly and improved over time.
SIX BASIC STRATEGIES FOR LED RISK MANAGEMENT
To understand how to manage LED risks, we need to think of them as having a lifecycle. There are many types and causes of riskevents which can impact on regional and local economies. Few risk events ever reach a level where they cause catastrophic loss orirreparable damage. Many risks can be managed before they eventuate. Even after an event has occurred there are strategies to helprestore economic systems. This has become the subject of a growing area of research on resilience (Rose, 2007).
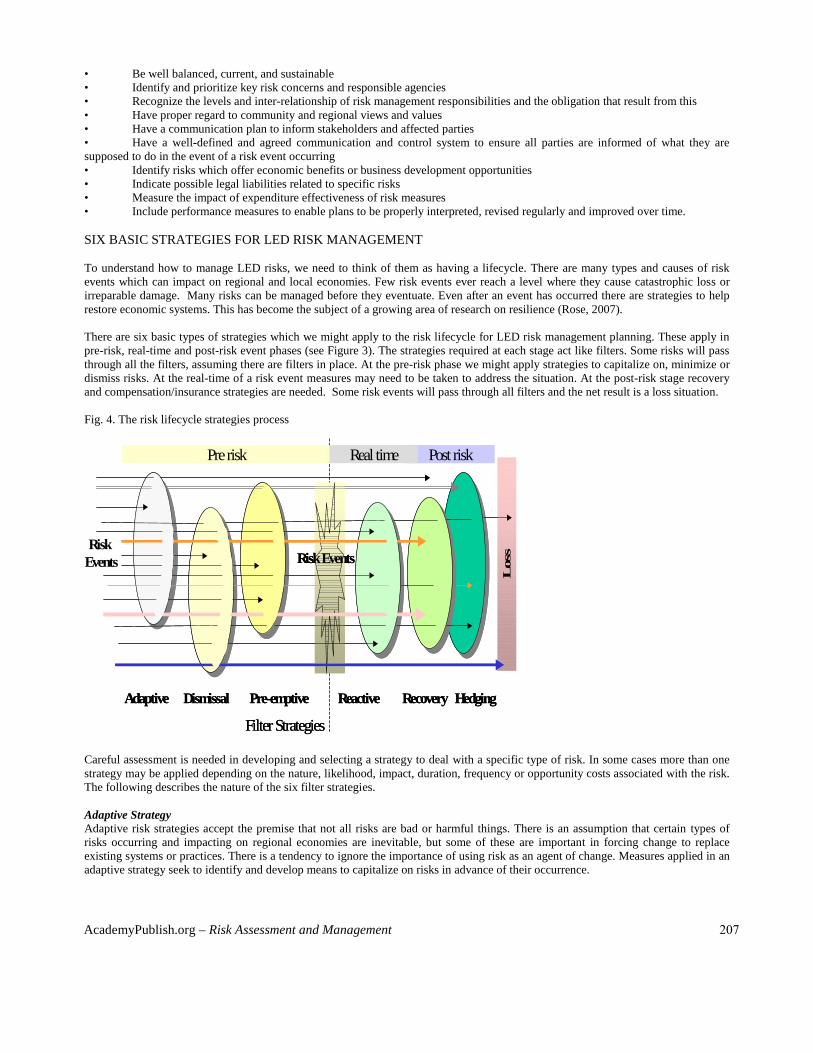
There are six basic types of strategies which we might apply to the risk lifecycle for LED risk management planning. These apply inpre-risk, real-time and post-risk event phases (see Figure 3). The strategies required at each stage act like filters. Some risks will passthrough all the filters, assuming there are filters in place. At the pre-risk phase we might apply strategies to capitalize on, minimize ordismiss risks. At the real-time of a risk event measures may need to be taken to address the situation. At the post-risk stage recoveryand compensation/insurance strategies are needed. Some risk events will pass through all filters and the net result is a loss situation.
Fig. 4. The risk lifecycle strategies process
Careful assessment is needed in developing and selecting a strategy to deal with a specific type of risk. In some cases more than onestrategy may be applied depending on the nature, likelihood, impact, duration, frequency or opportunity costs associated with the risk.The following describes the nature of the six filter strategies.
Adaptive StrategyAdaptive risk strategies accept the premise that not all risks are bad or harmful things. There is an assumption that certain types ofrisks occurring and impacting on regional economies are inevitable, but some of these are important in forcing change to replaceexisting systems or practices. There is a tendency to ignore the importance of using risk as an agent of change. Measures applied in anadaptive strategy seek to identify and develop means to capitalize on risks in advance of their occurrence.
DismissalAdaptive Pre-emptive Reactive Hedging
Risk Events
Filter Strategies
Recovery
Los
s
Pre risk Post risk
RiskEvents
Real time
DismissalAdaptive Pre-emptive Reactive Hedging
Risk Events
Filter Strategies
Recovery
Los
s
Pre risk Post risk
RiskEvents
Real time
AcademyPublish.org – Risk Assessment and Management 207
The idea of adaptive strategy has its origins in evolution. Successful adaptive strategies involve learning how systems operate andrespond to shocks and change, and what competitive advantage can be gained from this. Implicit in such a strategic approach is thenotion that risks unlock creative capital, ideas and potential, which enable systems to evolve and thrive. Adaptive strategies takesystems into a higher evolutionary state of development.
A good example of an adaptive strategy is the potential created by the risk of rising energy prices in future on local economies,especially on sectors like transport and energy. The response for high-energy import-dependent regions is for the R&D sector to comeup with innovative solutions to improve fuel and energy efficiency through adaptations or/and energy saving measures.
Implicit in this approach to strategy is the need to ensure systems of governance, production, consumption and disposal are focused onfostering evolutionary concepts and ideas for developing systems and solutions to turn risks into opportunities, and to developmeasures to address risks well before they become realities.
Pre-emptive StrategyPre-emptive strategy involves laying out a path to minimize risks before they cause major harm. The aim is to confine risks within anacceptable range and path. The approach to path minimization may involve selecting adaptive risk strategies to stimulate change andinnovation in an industry sector but to apply responsive and acceptable risk strategies to protect and maintain key strategicinfrastructure needed to maintain production.
The approach to path minimization risk management is to set risk thresholds, where different risk management strategies are appliedto contain risk. Specific measures will be locked into the strategies, which are triggered when threshold levels are met. This is akin tosetting levels of preparedness or alertness at which specific measures will be applied. Locking into futures contracts at certainthreshold prices is a pre-emptive strategy that enables businesses to operate within a known price range for the sale of their goods orcommodities.
Pre-emptive strategies also have well-developed measures for post-shock or disaster recovery. Few risk management plans have short,medium and long-term measures to restore economies, and other systems, back to health. The development of pre-emptive strategiesto rebuild economies started in the US after the end of the Cold War. Many defensive base towns knew they were under threat. Thosethat developed a path towards creating a new economy well before a base closure have generally fared much better than those whichwaited for federal government assistance to deal with adjustments. Many of these now face chronic unemployment problems.
Pre-emptive risk strategies differ between industry sectors. Export industry sectors are likely to be more adaptive to capitalize on riskopportunities and to encourage innovation and competitiveness. Domestic or endogenous industry sectors will more likely focus onpre-emptive and responsive risks to ensure the value of strategic assets is preserved.
Dismissal StrategyThis strategy involves a deliberate decision to ignore or dismiss a risk. It assumes the possibility of certain types of risk is so smallthat it is not worth developing a strategy or measures to address it. For example, earthquake risk is comparatively small in Australiacompared to Japan or New Zealand. Alternatively, it may involve accepting the risk because the cost of adopting other strategies tominimize the risk is too high.
A very large number of risks facing business and organizations are ignored or dismissed, despite a high possibility of occurrence. Insome cases firms or organizations may possess superior knowledge about certain risk events than the market, enabling them to dismissthe likelihood of occurrence.
Many ignored risks are calculated; that is, some form of assessment is undertaken to determine if the risk is significant or not. Manyignored risks are not even thought about. The industry focus groups cited several examples of industries in the ACT ignoring thepotential impacts of exchange rates or fuel price rises on business costs.
Responsive StrategyResponsive strategies are designed to reduce collateral damage. The strategy is to mount a carefully orchestrated defense against risksto stabilize situations as quickly as possible and to return systems to the status quo. Responsive risk strategies support the idea ofmaintaining the equilibrium of systems. One of the problems with responsive risk management strategies is that they can hinder theencouragement of change and innovation.
Responsive risk management strategies usually involve a two-pronged approach. The first involves the adoption of specific measuresto manage risk events at the time these occur. The second element involves a plan and measures for rapid recovery after the risk eventhas passed or subsided. This element is often overlooked or poorly considered. Most disaster management plans in Australia comprisethe first element of the strategy, but not the second.
AcademyPublish.org – Risk Assessment and Management 208

Responsive risk management strategies are used to manage pervasive, extreme and high-level uncertainty risk events. The techniquesused to make the overall assessment of the risks were presented in Chapter 4. From this assessment risk management strategies areprepared and implemented as required.
Recovery StrategyRecovery strategies involve developing measures to assist recovery after a major risk event or shock to an economy. One of the least-developed areas of risk management planning is post-risk event recovery. While the focus of risk management should concentratemost strongly on strategies to prevent and manage risks when these occur, the failure to have risk recovery strategies drawn up to dealwith post-risk recovery can prolong the impact of risk events. These are some of the lessons learned from September 11 and otherrecent disasters.
Recovery strategies need a clear set of actions (and responsibilities for actions) to be executed once a risk event has occurred. It isessential that the recovery strategies have:• A central control and risk recovery task force in place• Priority needs and actions identified – especially safety and welfare needs• A critical path for the execution of activities• A means to secure the necessary resources quickly to implement actions• Plans for how the affected community will be informed and told what is expected of them.
Hedging StrategyHedging strategies involve the use of insurances or other financial instruments to receive payment for loss or compensation. Hedgingassumes that an acceptable price can be determined or agreed for a loss or a claim. Hedging strategies are designed to transfer theresponsibility for costs or liabilities that may be associated with risk away from government, business and/or individuals. A growingpractice amongst public agencies and large corporations is to request professional indemnity insurance for contractors andsubcontractors to indemnify them against potential loss or litigation claims in future.
Most organizations have insurance cover to compensate for losses associated with risk. However, insurance such as professionalindemnity, public liability and property insurance is becoming increasingly expensive and reduces profit margins and competitiveness.Seldom are insurance payouts sufficient to meet the total costs associated with risk loss. One of the biggest problems with the hedgingstrategy is it tends to override other options, some of which may result in better outcomes and reduced costs to business.
SELECTING AN APPROPRIATE STRATEGY
The selection of strategies is likely to be a mix but will be influenced by factors like: impacts of past events, trade dependency, riskaverseness of business and regional populations, geography, types of risk exposure and frequency of risk events.
The selection of risk management strategies will have a significant impact on regional competitiveness. Adopting a conservative, low-risk threshold approach to risk may result in a regional economy being left behind in the highly competitive world of business. At theother extreme, regions that adopt high-risk strategies run the risk of failure. There is no best practice strategy to maximize economicdevelopment potential and minimize risk.
Regardless of the level of risk exposure, all firms, organizations and industry sectors should have acceptable or hedging risk strategiesin place. The failure to insure the strategic assets needed to support the wide range of activities in a local economy would be foolish.However, firm or sector risk minimization strategies that embrace responsive and acceptable risk measures only fails to capitalize onthe many opportunities risks create to help an economy evolve and become more competitive. Many economies have underminedtheir economic development potential by adopting strategies that are extremely conservative and risk averse.
BASIC FRAMEWORK FOR SECTOR RISK MANAGEMENT PLAN
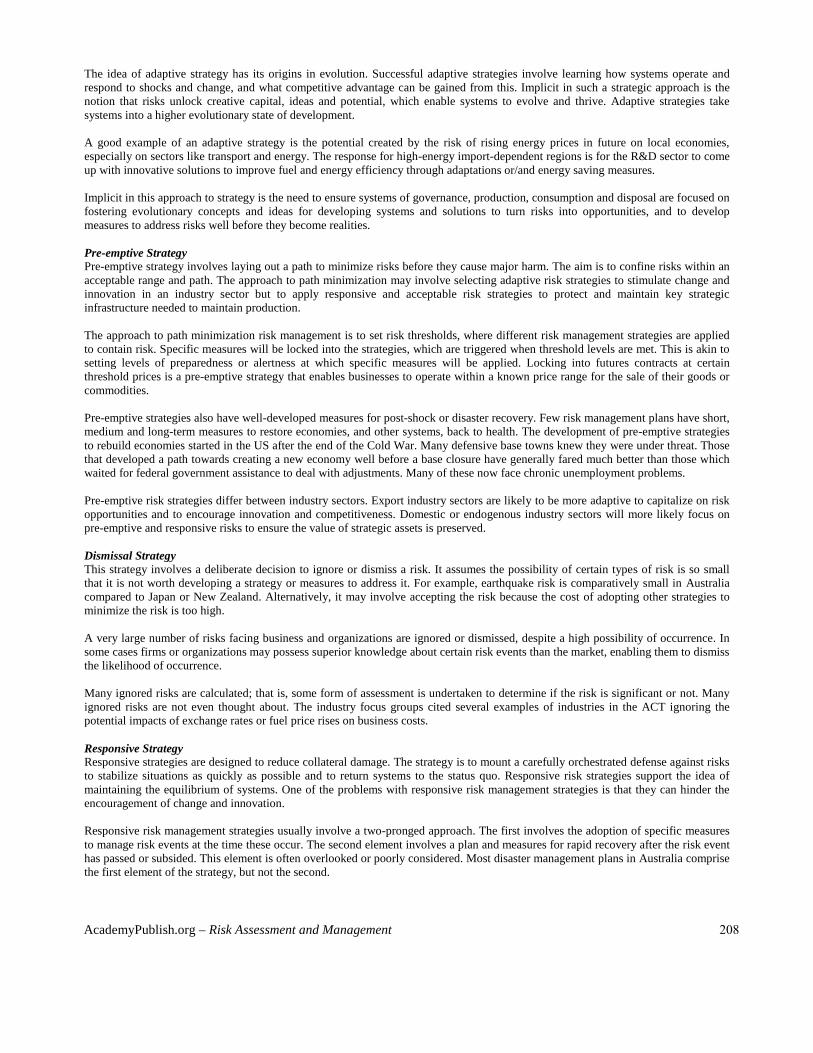
Figure 5 shows the basic strategic framework used to develop to a sector strategy risk management plan. There are two componentsfor the plan: the strategies, and action plan details. The first three strategies are pre-risk and related to numbers 1-3 above. Strategy 4is a real time event. Strategy 5 relates to recovery and Strategy 6 to hedging. The action plan will include measures, controls,responsibilities (including coordination arrangements), resource requirements and monitoring and evaluation. The latter items are usedto monitor plan performance.
AcademyPublish.org – Risk Assessment and Management 209
Fig. 5. Basic sector risk management plan frameworksSector Strategy
Risk Strategies Risk Action Plan
1 2 3 4 5 6 Measures Controls Responsibilities Resources Monitoring and Evaluation
Governance
Environmental
Economic
Societal
Others
Action Plans
Action plans describe measures that organizations and public agencies will apply to implement a plan. Two key sets of measures willbe actions to reduce the likelihood and impact of risks.
Measures to Manage Risk LikelihoodThe Australian/New Zealand Standard (Standards Australia/Standards New Zealand, 2009) on risk management suggests thefollowing 14 measures to reduce the likelihood of risk:1. Audits and compliance programs2. Contract conditions3. Formal reviews of requirements, specifications, design, engineering and operations4. Inspection and process controls5. Investment and portfolio management6. Project management7. Preventative maintenance8. Quality assurance, management and standards9. Research and development, technological development10. Structured training and other programs11. Supervision12. Testing13. Technical controls14. Organizational arrangements
The list provides a useful check on the types of measures sector industries might adopt to include in a risk management plan. Thereare many other checks than can be added to this list, but these will depend on the type of risk plan that is to be prepared.
Measure to Management Risk ImpactsThe Australian/New Zealand Standard (Standards Australia/Standards New Zealand, 2009) on risk management suggests thefollowing 13 measures to reduce the impacts of risk:
1. Contingency planning2. Contractual arrangements3. Contract conditions4. Design features5. Disaster recovery plans6. Engineering and structural barriers7. Fraud control planning8. Minimizing exposure to sources of risk9. Portfolio planning10. Pricing policy and controls11. Separation or relocation of an activity and resources12. Public relations
AcademyPublish.org – Risk Assessment and Management 210

13. Ex gratia payments
ControlsAs with all planning processes, there will be need to adopt control measures to implement risk management strategies. These mayrange from simple voluntary measures to regulations to ensure order or the efficient use of resources.
Responsibilities for Risk ManagementAustralian States and Territories have principal responsibility for natural disaster preparedness and response. Each has well-established and practiced systems and arrangements under multi-agency whole-of-government approaches. The Commonwealthprovides assistance and resources when the State or Territory resources are insufficient and such assistance is requested.
The responsibility for the management of risk falls into three categories: government, firms and organizations, and individuals.Governments have traditionally been responsible for sovereign risk, natural disasters and societal risk (Beck, 1992). Responsible firmsand organizations put in place strategies to individually manage or protect their business activities and interests through a range ofmeasures. The management of individual risk is largely personal, although law protects individuals by defining citizens’ righ ts.For business and government, the management of risk is becoming increasingly difficult, expensive and time consuming. Both areseeking ways to minimize the likelihood, impact and cost of risk events. Historically, firms and institutions have adopted twoapproaches to risk management: prevention measures and event management. Post-risk event recovery has been largely a matter ofanalysis and formulation of recovery strategies at the time. A significant failure of risk management prevention strategies has been thelack of post-risk recovery strategies that describe what governments, business and communities should do after the initial impact of anevent has been felt.
For most risk events, the general nature of these is known and the potential impacts and likelihood anticipated or predicted. We referto these broadly as historic, recurrent, behavioral or cyclical events. There is significant literature, research and statistical analysisgiven to the study of these risk events in order to model or provide projections about the future likelihood and nature of these. Theinsurance industry relies heavily upon research into these types of events to set premiums and profit margins.
The most difficult risk events to manage are those we cannot anticipate or conceptualize. Some of these relate to human activities suchas terrorism, medical and technology discoveries, and the changing perceptions, values and preferences individuals, communities andsocieties have about things. It is not easy for business, governments and communities to foresee and manage the potential risk impactthat some of these activities may pose. However, the ability to anticipate and manage risk events created by the above has a significantimpact upon competitiveness and the attractiveness of cities and regions as places to do business, visit, live and work.
ResourcesResource needs for regional risk management are very difficult to estimate because of the unpredictable nature of risk events. Thereare various resource demands that need to be provided for in a sector industry risk management plan. These include provision of fundsand other resources for:• Research and development – especially for developing better prediction models• Risk intelligence systems• Risk management planning• Exercises involving simulations risk events• Ongoing risk management operations and risk mitigation measures• Emergency allocation or stabilizing shock impacts
Monitoring and EvaluationMonitoring and evaluation (M&E) of risk provides important information about trends and consequences of different types of riskevents: it forms an integral part of a risk intelligence system. M&E reporting also provides valuable information about how well riskevents or economic shocks are managed. The key elements of a risk monitoring and evaluation system include:• Benchmarking specific risks• Indicators monitoring the performance risk management measures• Reporting systems to inform about risks trends and behavior• Reporting systems for management on resource utilization and efficiency
Risk Intelligence SystemsEconomic Risk Intelligence Systems (ERIS) provides information and forecasts about risks that have the potential to impact oneconomic development. The cost of gathering information on risk by individual business and organizations is very expensive. Mostorganizations rely on business and other networks, or public information services, to gain information on risks. There are many typesof risks that are common to sector industries or public agencies. The sharing of this information helps to eliminate rumor or lack offacts often associated with risks.
AcademyPublish.org – Risk Assessment and Management 211

Risk intelligence systems play an important role in reducing some of the uncertainties associated with risk. We have well-developedintelligence systems for advising on natural hazards, security, and terrorism alerts etc., but there is generally very poor riskintelligence undertaken to support local business and public organizations on the potential likelihood or consequences of regionaleconomic risks. Developing a regional economic risk intelligence system must be a collective responsibility between governments,business, and professional and community interest groups.
The following key elements will form part of a regional economic intelligence system.
• A set of commonly agreed risk indicators for which data will be collected• A coordinating unit whose responsibility it is to collect and ensure the quality of the data collected and used for riskintelligence• Regular reporting on trends in risk, usually a set of risk indicators that advise changes in real and perceived levels of risksfor a range of risk indicators• A bulletin board for posting risk alerts and risk levels, similar to fire danger alerts• A website advising on best and leading practices in regional economic risk management• A chat network that enables information of risks to be shared among interested parties• A financial mechanism to fund the ongoing operations of the regional risk intelligence system
APPLYING FRAMEWORK FOR BUSINESS SERVICES RISK MANAGEMENT PLAN FOR THE ACT
The following is a case study of a study of a project to develop a local economic development risk management strategy for theAustralian Capital Territory, where Australia’s national capital, Canberra, is located. The Australian Capital Territory (ACT) regionlies inland approximately 300 km SW of Sydney. The national capital Canberra has a population of 340,000 and nearby Queanbeyanhas a population of over 35,000. Selected as the national capital in 1908, its development has had varying degrees of support. Thefinal transfer of departments from Melbourne did not occur until the mid 1980s. The ACT’s main business is government. More than30 percent of the workforce is employed in the government and defense sectors. The economy has few export industries but morethan 16,000 small businesses, many of which provide consulting and other services to Federal and Local government departments.The GRP of the ACT economy in 2009-10 was about AUD$27,773 billion, with a GRP per capita around AUD$81,000. Grosshousehold disposable income per capita in the ACT in 2009-10 was the highest of all jurisdictions ($62,340) and 65.3% higher thanthe national average ($37,714).
The ACT economy has undergone several sharp shocks in its recent history. Most of these have been political in origin, caused byvacillating support for the development of the nation’s capital city by different governments. Other national capital cities likeWashington and Ottawa have experienced similar fluctuating economic histories but have subsequently emerged with more robust anddiversified economies. Canberra can be expected to follow this pattern, provided the city continues to grow. The ACT economy has avery promising future; however, the development of the economy can be expected to undergo further periodic setbacks. Managingthese events and converting them into an advantage for local business will be essential if the ACT is to develop a strong and vibranteconomy in future.
ANALYZING THE RISKS
To analyze the ACT a survey was conducted of 103 ACT businesses and institutions in 2004 to measure the perception of differentaspects of risks affecting the economy. The survey findings were presented to seven sector industry focus groups to seek confirmation,elaboration and clarification of the results and to provide additional information on risks affecting specific industry sectors of theeconomy.
The e-survey involved a qualitative assessment of 41 risks variables using a ranking assessment scale of 1-5 as described above. Thee-survey was designed to measure three attributes of perceived risk: impacts (assuming a worst case scenario), likelihood andanticipated risk. Anticipated risk is a measure of the importance that should be placed on the management of specific types of risk. Itwas hoped the survey sample would allow for a detailed analysis of 25 sectors of the economy, but spam filters, changed emailaddresses and a moderate refusal rate led to a low response. The sample size however, was sufficiently large to enable a good crosssection of interests to be surveyed and some statistical analysis of the relationships between risks.
For convenience and ease of reporting the results of the survey, the 41 risks are grouped and discussed in the report under five broadrisk categories. These are:• Macro Economic• Micro Economic• Governance• Environmental• Social and Personal
AcademyPublish.org – Risk Assessment and Management 212
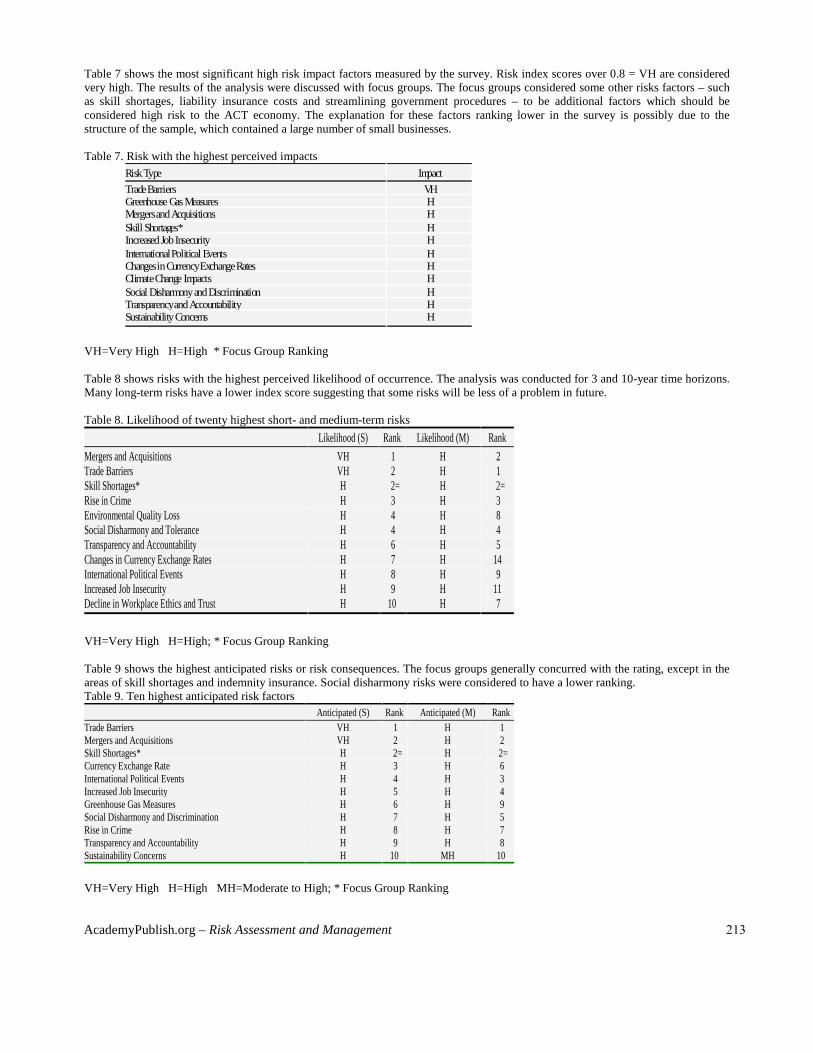
Table 7 shows the most significant high risk impact factors measured by the survey. Risk index scores over 0.8 = VH are consideredvery high. The results of the analysis were discussed with focus groups. The focus groups considered some other risks factors – suchas skill shortages, liability insurance costs and streamlining government procedures – to be additional factors which should beconsidered high risk to the ACT economy. The explanation for these factors ranking lower in the survey is possibly due to thestructure of the sample, which contained a large number of small businesses.
Table 7. Risk with the highest perceived impactsRisk Type Impact
TradeBarriers VHGreenhouse Gas Measures HMergers and Acquisitions HSkill Shortages* HIncreased Job Insecurity HInternational Political Events HChanges in Currency Exchange Rates HClimate Change Impacts HSocial Disharmony and Discrimination HTransparency and Accountability HSustainability Concerns H
VH=Very High H=High * Focus Group Ranking
Table 8 shows risks with the highest perceived likelihood of occurrence. The analysis was conducted for 3 and 10-year time horizons.Many long-term risks have a lower index score suggesting that some risks will be less of a problem in future.
Table 8. Likelihood of twenty highest short- and medium-term risks
Likelihood (S) Rank Likelihood (M) Rank
Mergers and Acquisitions VH 1 H 2Trade Barriers VH 2 H 1Skill Shortages* H 2= H 2=Rise in Crime H 3 H 3Environmental Quality Loss H 4 H 8Social Disharmony and Tolerance H 4 H 4Transparency and Accountability H 6 H 5Changes in Currency Exchange Rates H 7 H 14International Political Events H 8 H 9Increased Job Insecurity H 9 H 11Decline in Workplace Ethics and Trust H 10 H 7
VH=Very High H=High; * Focus Group Ranking
Table 9 shows the highest anticipated risks or risk consequences. The focus groups generally concurred with the rating, except in theareas of skill shortages and indemnity insurance. Social disharmony risks were considered to have a lower ranking.Table 9. Ten highest anticipated risk factors
Anticipated (S) Rank Anticipated (M) RankTrade Barriers VH 1 H 1Mergers and Acquisitions VH 2 H 2Skill Shortages* H 2= H 2=Currency Exchange Rate H 3 H 6International Political Events H 4 H 3Increased Job Insecurity H 5 H 4Greenhouse Gas Measures H 6 H 9Social Disharmony and Discrimination H 7 H 5Rise in Crime H 8 H 7Transparency and Accountability H 9 H 8Sustainability Concerns H 10 MH 10
VH=Very High H=High MH=Moderate to High; * Focus Group Ranking
AcademyPublish.org – Risk Assessment and Management 213
The e-survey and subsequent critique by focus groups enabled some prioritizing of risks affecting the economy. The issue of theAustralia–United States Free Trade Agreement (AUSFTA), mergers and acquisitions, changes in currency exchange rates,international political events, job insecurity, skill shortages, costs of professional indemnity insurance, the risk averse business andpublic sector culture, and uncertainty over greenhouse gas issues are significant risks that will need to be managed carefully in future.Identifying strategies and measures to control some of the potential impacts that may result from these risks will be a challenge,especially given the poor risk intelligence systems in place in the ACT at present.
Surveys involving the measurement of perceptions about risk will be questioned about their reliability. The survey results indicatedthere are significant differences in perceptions about risks affecting the ACT. Most risks are real, but others are perceived. Regardlessif the risks measured are perceived or real, all have the potential to impact on decisions about investment, development, recruitmentand the attractiveness of the ACT as a place for business. Overcoming negative perceptions about the risks of doing business in theACT are significant challenges facing the development of the economy.While a larger survey of business and public agencies would have provided a deeper insight into sector industry risks, the overallresults have provided a basis to develop a framework for better risk management of the industry sectors which make up the ACTeconomy. However, to improve sector industry risk management it is essential that these sectors conduct more detailed investigationsthemselves using qualitative and semi-quantitative research techniques.
As a means of gaining a deeper understanding of the way risks affect different sectors of the ACT economy and to verify the results ofthe e-survey, seven sector industry focus groups were conducted. The focus groups comprised the IT, education, tourism,environmental, construction, business and defense sectors. They ranged in size from four to nine experts, representing differentinterests within the sectors. The focus groups were run as a semi-structured process involving a presentation of the survey, followedby a discussion of risks affecting the sector and possible strategies for sector industry risk management.
The focus groups provided an opportunity for seven key industry sectors in the ACT economy to express concerns about risks thathave the potential to impact on future business. While some of the risk matters raised might be seen as an opportunity to knockgovernment for inaction or conservatism relating to risk, the focus groups acknowledged that all industry sectors have their owndifficulties which need addressing if they are to be better equipped to manage risk in future. The general consensus of the groups wasrisks were of increasing concern to business competitiveness and viability and that most sector industries were not particularlyinformed or prepared to manage risks. There was strong consensus that government and business must work more closely to develop abetter understanding of regional risks and to identify ways to cooperate to improve risk management in the ACT.
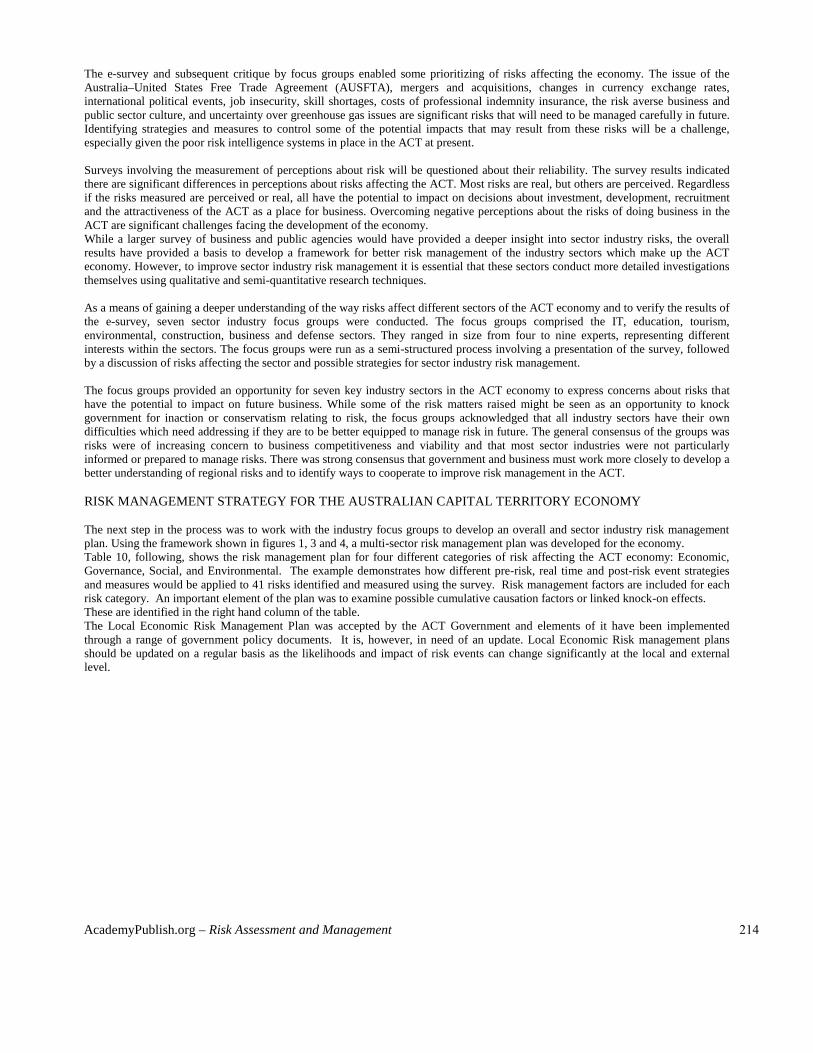
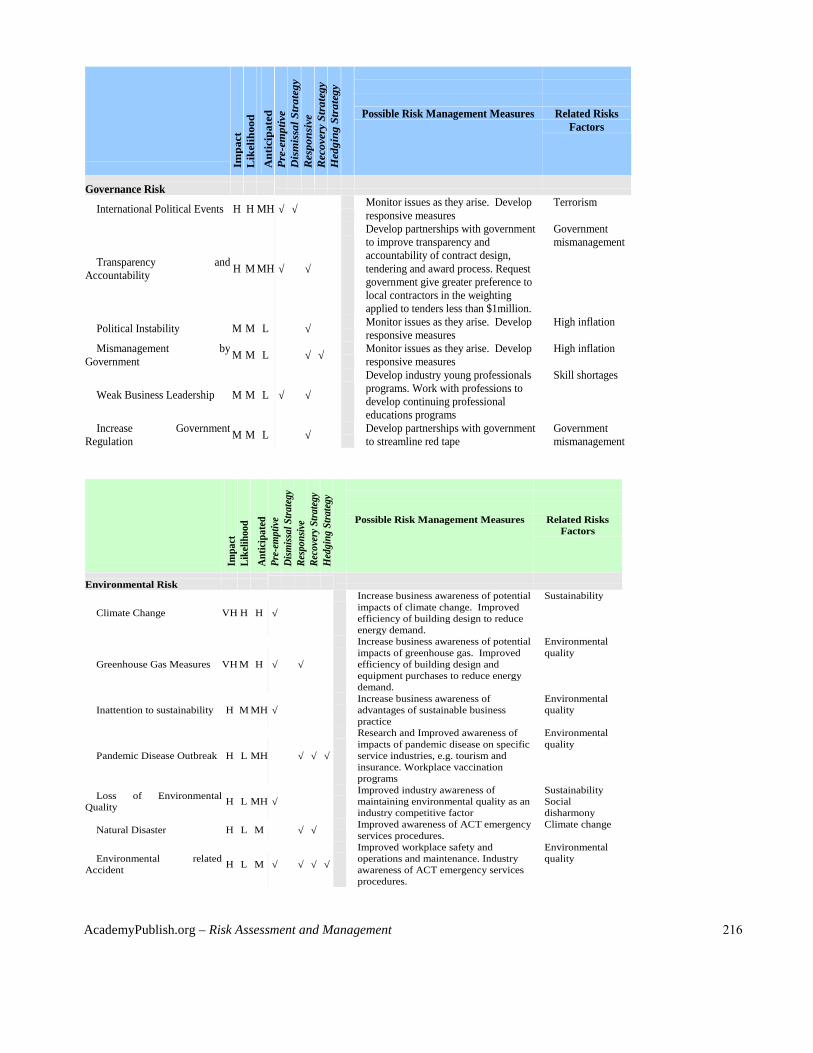
RISK MANAGEMENT STRATEGY FOR THE AUSTRALIAN CAPITAL TERRITORY ECONOMY
The next step in the process was to work with the industry focus groups to develop an overall and sector industry risk managementplan. Using the framework shown in figures 1, 3 and 4, a multi-sector risk management plan was developed for the economy.Table 10, following, shows the risk management plan for four different categories of risk affecting the ACT economy: Economic,Governance, Social, and Environmental. The example demonstrates how different pre-risk, real time and post-risk event strategiesand measures would be applied to 41 risks identified and measured using the survey. Risk management factors are included for eachrisk category. An important element of the plan was to examine possible cumulative causation factors or linked knock-on effects.These are identified in the right hand column of the table.The Local Economic Risk Management Plan was accepted by the ACT Government and elements of it have been implementedthrough a range of government policy documents. It is, however, in need of an update. Local Economic Risk management plansshould be updated on a regular basis as the likelihoods and impact of risk events can change significantly at the local and externallevel.
AcademyPublish.org – Risk Assessment and Management 214

Table 10. Risk management plan for the Australian capital territory economy
Imp
act
Lik
eli
ho
od
An
ticip
ate
d
Pre
-em
pti
ve S
trate
gy
Dis
mis
sal
Str
ate
gy
Resp
on
sive S
trate
gy
Recovery
Str
ate
gy
Hedgin
g S
trate
gy Possible Risk Management Measures Related Risks
Factors
Economic Risk
Trade Barriers VH VH VH √ √ Develop clusters, partnerships and joint ventures with international business Takeovers
Currency Exchange Rate H H H √ √ Hedging forward contracts involving foreign exchange if currency sensitive Inflation, high Interestrates
Takeovers of Local Business H H H √ √ Develop clusters, partnerships and joint ventures with international businessPreference purchasing policies for local business
Businesscompetitiveness
Disruption to TransportServices H H MH √ √ Contingency measures to be put in place to manage logistics Natural disasters,
terrorism
Skills Shortages M H MH √Training needs assessment of future skills requirements. International recruitment and migrant skillsdevelopment programs. Outsourcing and strategic partnerships to overcome specific skill shortages.Work with professions to develop continuing professional educations programs
Businesscompetitiveness
Inflation M H MH √ √ Reduce firm and sector loan and debt levelsIdentify efficiency savings
Currency X interestrates
Terrorism in Australia H H MH √ √ Improved security for firm operationsIdentify key sector industries likely to be impacted and develop measures to address these
Political events
Reduced BusinessCompetitiveness H H MH √ √ Monitoring and evaluation of factors of competitive advantage. Focus on innovation Skill shortages
Energy Price Rises H H M √ √ Installation of energy saving devicesReplace fittings and equipment with lower energy ratings.
Inflation, high interestrates
New Technologies Threats H H M √ √ Improve sector industry intelligence on new technology developments. Improved workplaceeducation on application of new technologies.
Businesscompetitiveness
Severe Breakdown of UtilityServices M M M √ √ Short term measures to maintain services.
Establish alternatives for relocation locations for operation of servicesNatural disasters,terrorism
Industrial Relations Unrest H H MH √ √ Improve workplace relations through the development of social contracts. Employee contracts toovercome redundancy and reduce under-deployed human resources
Job insecurityWages and salaries
High Interest Rates M M ML √ √ √ Reduce firm and sector loan and debt levelsIdentify efficiency savings
Inflation
Information E-services M M ML √ Contingency measures to be put in place to manage priority information.Regular backup of e-finance statements
Federal Tax Increases M M ML √ Evaluate impact on sector and local business operations Governmentmismanagement
Wage & Salary Blow out M M ML √ √ Sector industry wage & salary agreementsLong term employee contracts
Inflation, high interestrates
Blowouts in employee on costs M M ML √ Monitoring and evaluating industry trendsEngagements with government on social legislation change
Increasing Litigation M M ML √ Improved workplace quality assurance measures. Improved customer relations Loss of trust
Telecommunications Services L M L √ √ Short term measures to maintain services Natural disasters,terrorism
ACT Tax Increases M M L √ Evaluate impact on sector and local business operations Governmentmismanagement
AcademyPublish.org – Risk Assessment and Management 215
Impa
ctL
ikel
ihoo
dA
ntic
ipat
edPr
e-em
ptiv
eSt
rate
gyD
ism
issa
l Str
ateg
yR
espo
nsiv
eSt
rate
gyR
ecov
ery
Stra
tegy
Hed
ging
Str
ateg
y
Possible Risk Management Measures Related RisksFactors
Governance Risk
International Political Events H H MH √ √ Monitor issues as they arise. Developresponsive measures
Terrorism
Transparency andAccountability
H M MH √ √
Develop partnerships with governmentto improve transparency andaccountability of contract design,tendering and award process. Requestgovernment give greater preference tolocal contractors in the weightingapplied to tenders less than $1million.
Governmentmismanagement
Political Instability M M L √ Monitor issues as they arise. Developresponsive measures
High inflation
Mismanagement byGovernment
M M L √ √ Monitor issues as they arise. Developresponsive measures
High inflation
Weak Business Leadership M M L √ √
Develop industry young professionalsprograms. Work with professions todevelop continuing professionaleducations programs
Skill shortages
Increase GovernmentRegulation
M M L √ Develop partnerships with governmentto streamline red tape
Governmentmismanagement
Impa
ctLi
kelih
ood
Ant
icip
ated
Pre-
empt
ive
Stra
tegy
Dism
issal
Stra
tegy
Resp
onsiv
eSt
rate
gyRe
cove
ry S
trate
gyH
edgi
ng S
trateg
y
Possible Risk Management Measures Related RisksFactors
Environmental Risk
Climate Change VH H H √
Increase business awareness of potentialimpacts of climate change. Improvedefficiency of building design to reduceenergy demand.
Sustainability
Greenhouse Gas Measures VH M H √ √
Increase business awareness of potentialimpacts of greenhouse gas. Improvedefficiency of building design andequipment purchases to reduce energydemand.
Environmentalquality
Inattention to sustainability H M MH √Increase business awareness ofadvantages of sustainable businesspractice
Environmentalquality
Pandemic Disease Outbreak H L MH √ √ √
Research and Improved awareness ofimpacts of pandemic disease on specificservice industries, e.g. tourism andinsurance. Workplace vaccinationprograms
Environmentalquality
Loss of EnvironmentalQuality
H L MH √Improved industry awareness ofmaintaining environmental quality as anindustry competitive factor
SustainabilitySocialdisharmony
Natural Disaster H L M √ √ Improved awareness of ACT emergencyservices procedures.
Climate change
Environmental relatedAccident
H L M √ √ √ √
Improved workplace safety andoperations and maintenance. Industryawareness of ACT emergency servicesprocedures.
Environmentalquality
AcademyPublish.org – Risk Assessment and Management 216
Impa
ctLi
kelih
ood
Ant
icip
ated
Pre-
empt
ive
Stra
tegy
Dism
issal
Str
ateg
yR
espo
nsiv
e St
rate
gyR
ecov
ery
Stra
tegy
Hed
ging
Str
ateg
y
Possible Risk Management Measures Related RisksFactors
Social Risk
Racial and Social Disharmony H M MH √ √Workplace programs to encouragegreater awareness of human rights inthe workplace
Job insecurityPoliticalinstability
Increase job Insecurity H H MH √ √ √More open and transparent systems ofbusiness and sector industryperformance
Socialdisharmony,inflation
Increase in Crime H H MH √ √ Improved workplace security Socialdisharmony
Increase Pressure Groups Actions H H M √Industry engagement plan to addressissues that may arise from pressuregroups.
Socialdisharmony
Increased Employee HealthProblems
H M M √ √
Improvements in workplaceoccupational safety and healthawareness.Development of employee personalhealth support plans
Job insecurity
Increased Public Liability Claims M L L √ √ Collective industry approach to publicindemnity insurance
Socialdisharmony
Living Standards Decline M M L √ √
Programs of awareness of human rightsin the workplace
SocialdisharmonyEnvironmentalquality
Decline in Trust M M L √ √ √
Improved workplace communicationsImproved HRD and disputes resolutionmanagement. Adoption of actionlearning processes in the workplace
SocialdisharmonyJob insecurity
CRITICAL ISSUES FOR RISK MANAGEMENT
Local economic development risk is a new field of risk management. It has developed as the result of the increasing influence ofglobalization on local economies, and other change factors such as climate change and energy efficiency. These factors are drivingthe need for greater competitiveness in production and governance systems to achieve more sustainable local economic developmentoutcomes. These changes have fundamentally increased the level of risk facing local economies and are changing the way firms,organizations and public institutions go about doing business.
Other changes, too, have affected the way we do business, adding to risk and uncertainty in local economies. Legislative changes haveintroduced greater transparency, accountability and equity into decision making processes leading to wider consultation anddemocratization of decision making processes that affect business, governments, communities and special interest groups.Management theory, new technology and civic and human rights have introduced dynamics that will continue to change the waysocieties and local communities function, impacting on the level and quality of services and conduct expected from business andgovernment.
Collectively these changes have improved our society and led to a substantial reduction in global poverty – but they also present aparadox. As countries open up and learn to cope with becoming more competitive, the level of uncertainty and subsequent risks tobusiness, governments and communities rises as they become more affected by risk events that occur outside their local area orjurisdiction of control. Learning how to anticipate and manage these ‘external risks’ is a challenge. It requires firms, governments andorganizations to develop new risk management competencies in future.
The management of local economic risk is not easy, as we are dealing extensively with many unknown or unpredictable factors. Oneof the most important skills for risk managers involved in local economic development is learning how to work collectively andcollaboratively to manage risk uncertainty. The more certain and knowledgeable local communities are about risk events that havethe potential to affect the functions of local economies, the less severe are the likely impacts of these on individuals, governments andbusinesses, and communities when they occur.
AcademyPublish.org – Risk Assessment and Management 217
To improve risk management in local economies it is essential we improve urban risk intelligence systems and develop morecollective industry approaches to risk management. We should also understand that risks create opportunities for cities to innovate andcapitalize upon the opportunities that risk events can create. Risk management can be used very constructively as ‘agents of change’,when communities show indifference. Risks provide important catalysts for changes in our approach to planning, urban managementand development practices.
Understanding the nature and consequences of regional economic risks is inherently difficult. The field of risk analysis andmanagement is an immensely complex subject. Predicting and managing risk is prone to substantial error. It is impossible tocompletely insulate economies against risk, but we must learn new skills to develop strategies and measures to minimize the level ofrisk local economies face to ensure that their future is more sustainable. The framework for local economic risk management and thecase study described above provide a useful illustration of a mechanism which can be used by local communities to analyze andmanage a wide range of risk events that have the potential to cause great harm and disruption to local economies.
REFERENCES
Beck, U. (1992). Risk Society: Towards a New Modernity. London: Sage Publications
Galster, G. (1998). An Econometric Model of the Metropolitan Opportunity Structure; Cumulative Causation Among City Markets,Social Problems and Underserved Areas. Washington, D.C: Fannie Mae Foundation and Urban Institute.
Harris, N. (1997). Cities as the engines of economic growth and development (discussion paper). Washington. D.C.
Myrdal, G. (1957). Economic theory and under-developed regions. London: Duckworth
Roberts, B. H. (2003). Regional Risk Management and Economic Development, . Australia New Zealand Regional ScienceAssociation, 9(1), 67-96.
Roberts, B. H. (2006). Analysing and Managing Local Economic Development Risk: A Study of Two Australian Cities. Special Issueof Built Environment, Learning from Urban Disasters: Planning for Resilient Cities., 32(4), 413-433
Roberts, B. H., & Stimson, R. J. (1998). Multi-sectoral qualitative analysis: a tool for assessing the competitiveness of regions andformulating strategies for economic development. The Annals of Regional Science, 32(4), 469-494.
Roberts, B. H., & Tabart, C. (2005). Managing the Risks: An investigation of risks affecting the ACT Economy. Canberra: Universityof Canberra, Centre for Developing Cities
Rose, A. (2007). Economic resilience to natural and man-made disasters: Multidisciplinary origins and contextual dimensionsEnvironmental Hazards, 7(4), 383-398.
Standards Australia/Standards New Zealand. (2009). Australian/New Zealand Standard ISO 31000:2009 Risk management -Principles and guidelines. Retrieved from http://infostore.saiglobal.com/store/Details.aspx?ProductID=1378670.
STANLIB. (2011). Japan: Economic Impact of The Recent Earthquake. Economic Focus.
WBI. (2010). Cities As Engines Of Economic Growth (World Bank Institute) fromhttp://www.youtube.com/watch?v=mANzdLhxXXw
AcademyPublish.org – Risk Assessment and Management 218