Formation of collapsed tetragonal phase in EuCo2As2 under high pressure
19
1 Formation of Collapsed Tetragonal Phase in EuCo 2 As 2 under High Pressure Matthew Bishop, Walter Uhoya, Georgiy Tsoi and Yogesh K. Vohra Department of Physics, University of Alabama at Birmingham (UAB), Birmingham, AL 35294, USA Athena S. Sefat and Brian C. Sales Oak Ridge National Laboratory (ORNL), Oak Ridge, TN 37831, USA The structural properties of EuCo 2 As 2 have been studied up to 35 GPa, through the use of x-ray diffraction in a diamond anvil cell at a synchrotron source. At ambient conditions, EuCo 2 As 2 (I4/mmm) has a tetragonal lattice structure with a bulk modulus of 48 4 GPa. With the application of pressure, the a-axis exhibits negative compressibility with a concurrent sharp decrease in c-axis length. The anomalous compressibility of the a-axis continues until 4.7 GPa, at which point the structure undergoes a second-order phase transition to a collapsed tetragonal (CT) state with a bulk modulus of 111 2 GPa. We found a strong correlation between the ambient pressure volume of 122 parents of superconductors and the corresponding tetragonal to collapsed tetragonal phase transition pressures. PACS: 62.50.-p, 74.62.Fj, 64.70.K-
-
Upload
ua-birmingham -
Category
Documents
-
view
4 -
download
0
Transcript of Formation of collapsed tetragonal phase in EuCo2As2 under high pressure
1
Formation of Collapsed Tetragonal Phase in EuCo2As2 under High Pressure
Matthew Bishop, Walter Uhoya, Georgiy Tsoi and Yogesh K. Vohra
Department of Physics, University of Alabama at Birmingham (UAB), Birmingham, AL
35294, USA
Athena S. Sefat and Brian C. Sales
Oak Ridge National Laboratory (ORNL), Oak Ridge, TN 37831, USA
The structural properties of EuCo2As2 have been studied up to 35 GPa, through the use of
x-ray diffraction in a diamond anvil cell at a synchrotron source. At ambient conditions,
EuCo2As2 (I4/mmm) has a tetragonal lattice structure with a bulk modulus of 48 4 GPa.
With the application of pressure, the a-axis exhibits negative compressibility with a
concurrent sharp decrease in c-axis length. The anomalous compressibility of the a-axis
continues until 4.7 GPa, at which point the structure undergoes a second-order phase
transition to a collapsed tetragonal (CT) state with a bulk modulus of 111 2 GPa. We
found a strong correlation between the ambient pressure volume of 122 parents of
superconductors and the corresponding tetragonal to collapsed tetragonal phase transition
pressures.
PACS: 62.50.-p, 74.62.Fj, 64.70.K-
2
Introduction:
In recent years, there has been a continuous interest in using the pressure as a
variable in the study and discovery of superconducting properties, magnetic and
structural phase transitions in materials. Among such materials studied are the pnictides
AFe2As2 (A=divalent alkaline earth metal or divalent rare-earth metal). These form in the
tetragonal ThCr2Si2 (‘122’)-type structure and can exhibit superconductivity under
chemical-doping (isoelectronic- or electron-) and application of external pressure [1-5].
The Fe atom can be replaced by Co and the As atom can be replaced by the isoelectronic
element P forming ternary phosphides in the same 122-type structure [6]. Studies on 122
phosphide systems have been carried out and isostructural transitions from tetragonal to
collapsed tetragonal accompanied by negative compressibility axial properties have been
reported in ternary phosphides under pressure [7, 8] and in other compounds [9]. It has
been observed that the transition metal element essentially determines the nature of this
phase transition in ternary phosphides. For instance, compounds such as EuFe2P2 exhibit
a second order phase transition under pressure, however, in contrast to EuFe2P2 the
pressure - induced structural phase transition is first-order in compounds such as EuCo2P2
in which Fe atom is replaced by Co atom [7, 8]. These experimental findings lead one to
wonder whether the type of transition metal (T=Fe, Co) determines the first-order or
second-order nature of tetragonal to collapsed-tetragonal phase transition in all 122-type
compounds. Increase of interest in studying the compression behavior of the AFe2As2
family have been generated by the recent discovery of superconductivity and also the
pressure-induced isostructural (tetragonal to collapsed tetragonal) phase transition
accompanied by extremely anisotropic and negative compressibility axial phenomenon in
which the a-axis length increases while c-axis length decreases under pressure in the
ternary iron pnictides superconductors; EuFe2A2 [10], BaFe2As2 and CaFe2As2 [11]. The
negative compressibility phenomenon is suggested to be a common phenomenon in other
iron based superconductors of type AT2As2 (A= Ba, Eu, Sr, Ca and T=Fe, Co). In order
to investigate the structural properties of EuCo2As2, we have synthesized and performed
measurement of the lattice parameters as a function of pressure at room temperature
using synchrotron x-ray diffraction technique. We have been motivated by the occurrence
3
of CT phase and exotic negative compressibility phenomenon in isostructural compounds
of ThCr2Si2 type.
Experimental Details:
Single crystal samples of EuCo2As2 were grown from a CoAs flux, similar to that
described in reference [2]. The crystals were ground into a polycrystalline sample and
loaded into a 60-micron hole of a spring-steel gasket that was first pre-indented to a ~50
micron thickness and mounted in a diamond anvil cell for high pressure x-ray diffraction
experiments. In this study, no pressure medium was employed and hence the structural
transition reported in this study corresponds to a non-hydrostatic case.
The high pressure x-ray diffraction experiments were carried out at the beam-line
16-ID-B, HPCAT, Advanced Photon Source, Argonne National Laboratory. An angle
dispersive technique with a MAR345 image-plate area detector was employed using a
focused monochromatic beam with x-ray wavelength, λ = 0.4325 Å. Experimental
geometric constraints and the sample to image plate detector distance were calibrated
using a CeO2 diffraction pattern and were held at the standard throughout the entirety of
the experiment. Pressure was applied through the use of a diamond anvil cell and an
internal copper pressure standard placed next to the sample was employed for the
calibration of pressure .[12] The Birch Murnaghan equation [13] as shown by equation
(1) was fitted to the available equation of state data on copper pressure standard [12].
EEE fBffBP 4'2
31213 2
5
0 (1)
Where Bo is the bulk modulus, B´ is the first derivative of bulk modulus at ambient
pressure, and V0 is the ambient pressure volume. The fitted values for the copper
pressure standard are B0 = 121.6 GPa, B´ = 5.583, and V0 = 11.802 Å3/atom.The
parameter fE is related to volume compression and is described below.
2
13
2
E
V
V
f
o
(2)

4
Results and Discussions:
The diffraction images obtained were integrated using the program FIT2D [14] to
yield intensity vs. diffraction angle (2 theta) plots. At ambient temperature and pressure,
x-ray diffraction revealed a tetragonal structure with the lattice parameters a = 3.9752
0.0031 Å, c = 11.1011 0.0032 Å and an axial ratio (c/a) = 2.7926 0.0032 Å. These
lattice parameters were confirmed independently through a collection of data using a
PANalytical X’Pert Pro MPD at room temperature (using Cu K1 radiation), and a
LeBail fit giving a = 3.9671(1) Å and c = 11.0632(5) Å. The ThCr2Si2-type structure has
the following crystalline arrangement: Eu atoms at the 2a position (0,0,0), Co atoms at
the 4d positions (0,1/2,1/4) and (1/2, 0, 1/4), and As atoms at the 4e positions (0,0,z) and
(0,0,-z) . The approximate structural parameter z = 0.36 has been obtained based on
Rietveld refinement of x-ray diffraction data [15].
Figure 1 (a) shows the x-ray diffraction pattern at 0.33 GPa with EuCo2As2
sample in the I4/mmm tetragonal structure and the copper pressure marker in the face
centered cubic (fcc) phase. The diffraction peaks are labeled with their respective (hkl)
values. The tetragonal phase of EuCo2As2 is characterized by the (101), (110), (112),
(200), (213) and (224) Bragg diffraction peaks. The fcc phase of the copper pressure
marker is characterized by the (111), (200), (220), (311) and (222) Bragg diffraction
peaks. The measured volume of copper pressure marker obtained from the x-ray
diffraction was used to calculate the sample pressure from the equation of state given by
equation (1). The obtained lattice parameters for the sample at a pressure of 0.33 GPa are
a = 3.9923 0.0031 Å and c = 10.7347 0.01 Å. Figure 1(b) shows the x-ray diffraction
pattern of the sample at 3.2 GPa with the lattice parameters a = 4.0114 0.0031 Å and c
= 10.0698 0.0194 Å. When comparing the low-pressure spectrum figure 1(a) with
figure 1(b), the sample peaks dependent only on the a-axis: (110) and (200) are all
moving to lower diffraction angles while all non-a-dependent peaks move to higher
diffraction angles and peaks dependent on both a and c remain approximately in the
same position. Conventional behavior of the material under compression suggests that all
peaks would move to higher angles in the x-ray diffraction spectrum; however, in
comparing figure 1(a) with 1(b) all a-dependent peaks move to lower diffraction angles.
This is a clear indication of negative compressibility in the a-axis of the tetragonal lattice
5
structure in EuCo2As2 due to the increase in the a-axis concurrent with a sharp decrease
in the c-axis with the application of pressure. Similar observations were seen in
EuFe2As2, [10] BaFe2As2 and CaFe2As2 [11] during the transition to their respective
collapsed tetragonal phases under compression. Another important note is that the
predominant peaks unlabeled in the diffraction spectrums in figure 1, are identified as
CoAs orthorhombic impurity phase (Cmcm) flux, which might have remained on the
surface of the crystals. These peaks are predominant in spectrum below 13 GPa and
become progressively less evident at higher pressures. Figure 1(c) shows that the sample
remained in the tetragonal phase up to the highest pressure of 35.8 GPa with lattice
parameters a = 3.777 0.0021 Å and c = 9.2367 0.0493 Å . The compression behavior
above 4.7 GPa is considered normal as all Bragg peaks move to higher diffraction angles.
Figure 2 shows the measured a-axis as a function of pressure, exhibiting
anomalous compression phenomenon. The a-axis shows an initial increase in axial length
with increasing pressure up to 3.2 GPa prior to exhibiting normal compression up to a
pressure of 35.8 GPa. The sample was then decompressed, exhibiting normal behavior up
to 14 GPa where a hysteresis occurs. The a-axis begins to increase at a more rapid rate,
reaching a maximum at 5.1 GPa prior to returning to slightly below its initial value. The
anomalous behavior of the a-axis is paired with a sharp but continuous decrease in c-axis
until 4.7 GPa, where a normal decrease in lattice parameter length occurs up to 35.8 GPa
where upon decompression, the c-axis returned to approximately its initial length.
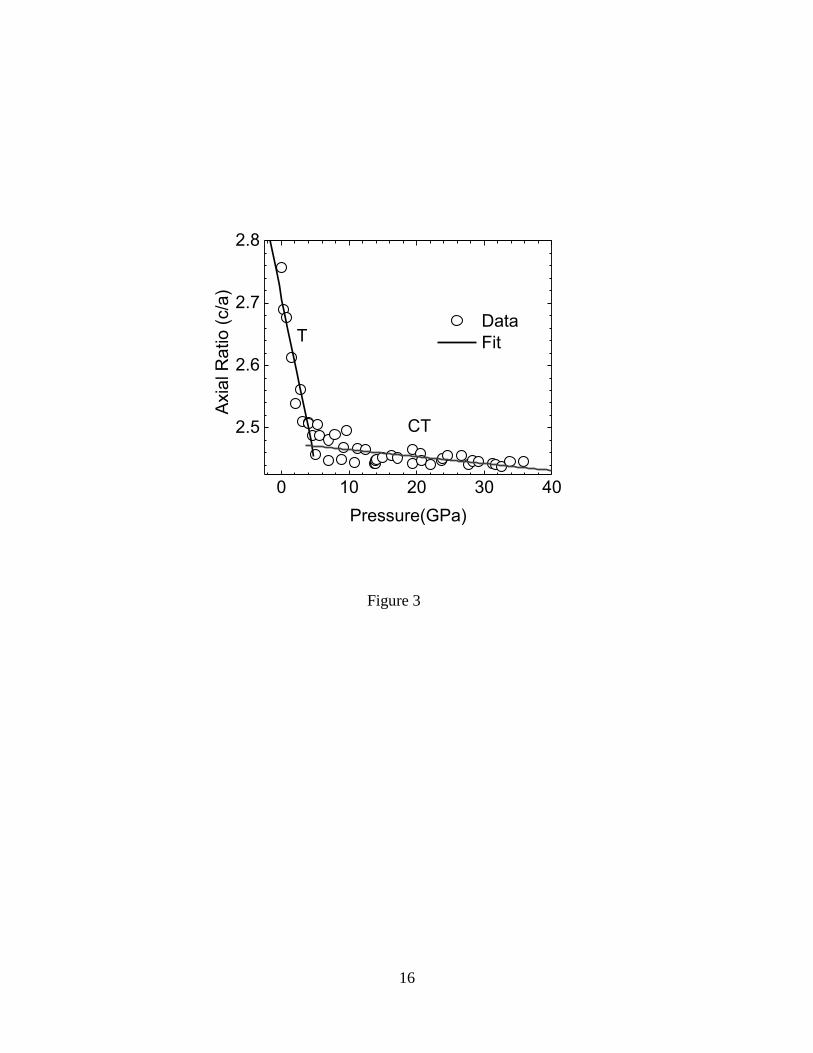
Figure 3 shows all the axial ratio (c/a) data points that were obtained during this
experiment and we have combined the data obtained during compression and
decompression in to one data set for subsequent analysis. The axial ratio shows a sharp
decrease with increasing pressure up to 4.7 GPa and then a gradual decrease with further
increase in pressure up to the highest pressure of 35.8 GPa. The variation of c/a with
pressure can be divided in to two linear regions. The fits for the two linear regions are
shown in figure 3 and are described by the following equations:
c / a = 2.7102 – 0.53P, 0 ≤ P ≤ 4.7 GPa, (3)
c / a = 2.4762 – 0.001P, 0 ≤ P ≤ 35.8 GPa (4)
6
The intersection of the two linear regions as described by equations (3) and (4) defines
the phase transition from the ambient pressure T phase to the CT phase. EuCo2As2 is
found to undergo this phase transition at 4.7 GPa at ambient temperature. The nature of
this phase transition is clearly continuous as can be seen in pressure dependence of the
structural parameters (figures 2, 3 and 4). Similar continuous T to CT phase transition has
been observed in the compression behavior of the related ThCr2Si2 structure-type
compounds of EuFe2As2, [10] EuFe2P2 and LaFe2P2 [8]. This is in sharp contrast to
observations made in ternary phosphides in which replacing Fe atom with Co atom
reduces the nature of the observed structural phase transition from second order
(continuous) to first order (discontinuous) type [7,8]. The bonding characteristics of As
and P atoms along with the pressure induced changes in electronic structure determine
the formation of collapsed tetragonal structure in these materials. . An additional
consideration for present studies is that the high-pressure Mössbauer investigations on
EuFe2P2 have revealed a continuous structural phase transition which is accompanied
with a continuous valence transition from a magnetic Eu2+
state to a nonmagnetic Eu3+
state in the pressure range between 3-9 GPa [16]. We expect this valence fluctuation to
have an influence on magnetic phase transitions at low temperatures and have an overall
effect on structural phase transitions under high pressure at room temperature due to
enhanced compressibility that accompanies valence fluctuations.
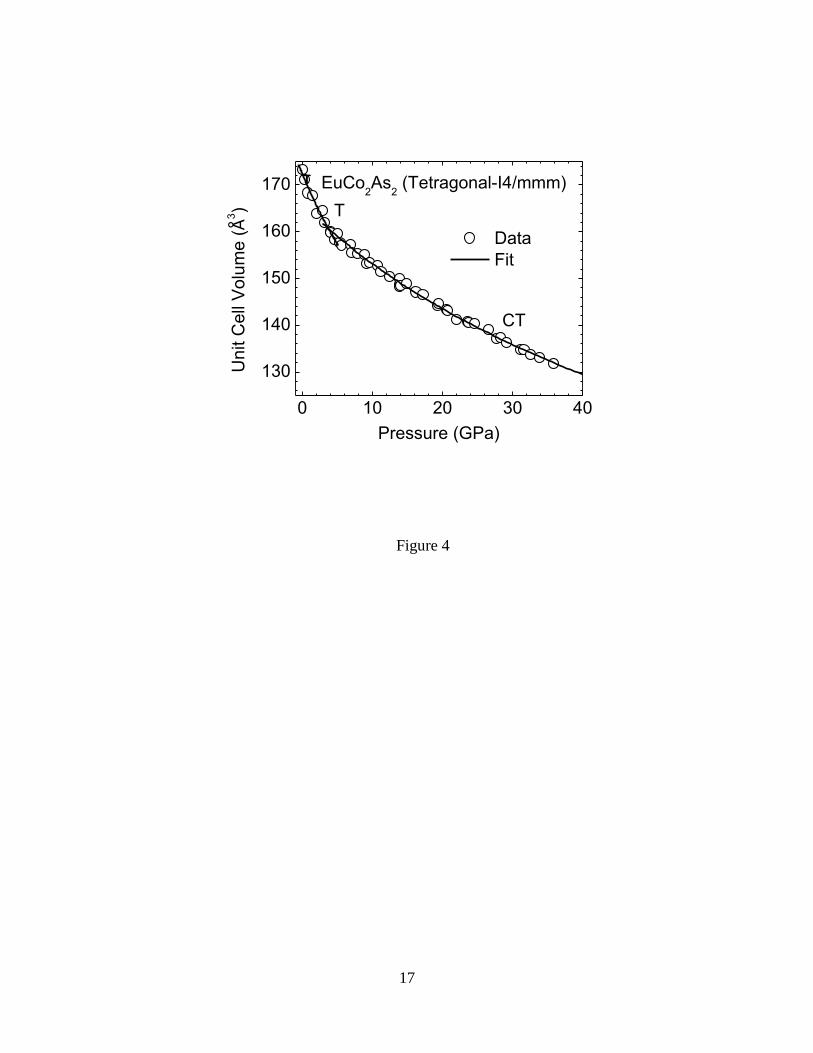
Figure 4 shows the measured pressure-volume curve of EuCo2As2 up to 35.8 GPa
at ambient temperature. The pressure -volume data were fitted by the Birch-Murnaghan
equation of state described by equation (1). The fits from the axial ratio showed a phase
transition from the T to the CT phase at 4.7 GPa. The transition pressure obtained from
the axial ratio was used to separate the tetragonal phase from the collapsed tetragonal
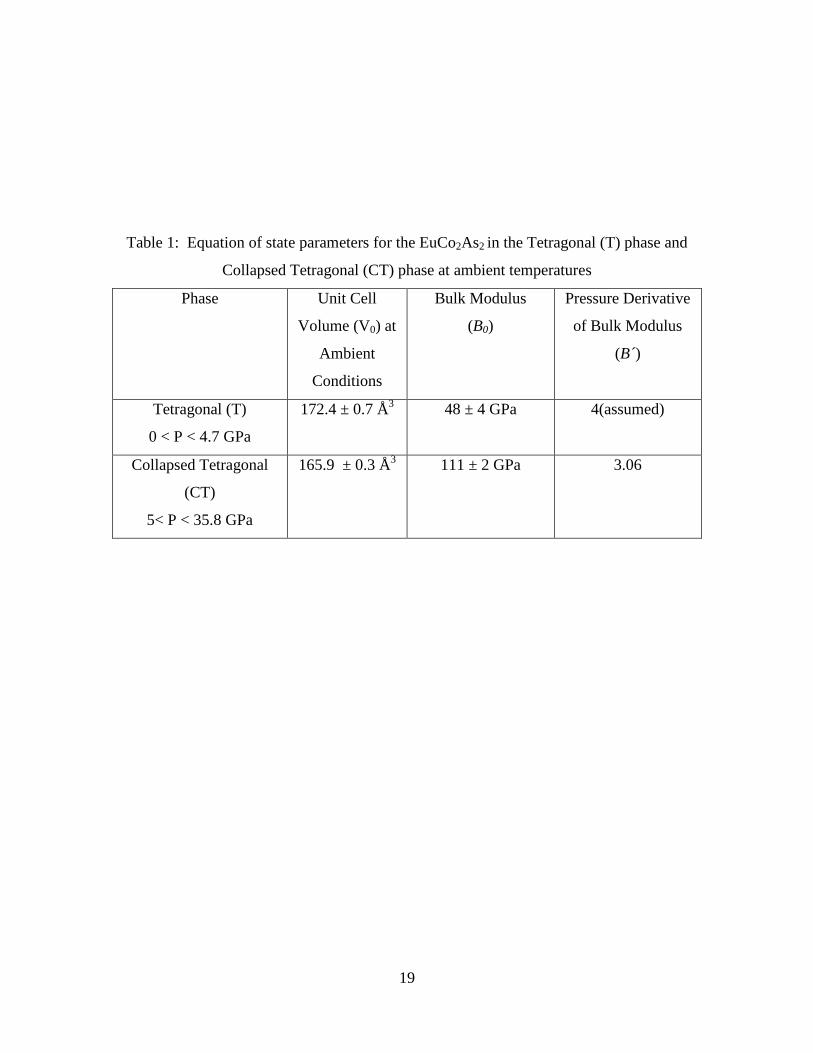
phase when determining the equation of state for EuCo2As2. The fitted zero-pressure
volumes (V0) for the tetragonal and collapsed tetragonal phases are 172.4 ± 0.7 Å3 and
165.9 ± 0.3 Å3 respectively. The measured change in volume with the application of
pressure shows a significant decrease in overall unit cell volume indicating the collapsed
tetragonal phase has a 3.8% higher density than the tetragonal phase at zero pressure. The
Birch-Murnaghan fit revealed a bulk modulus for the tetragonal phase to be Bo = 48 ± 4
GPa and 111 ± 2 GPa for the CT phase. This comparison shows that the T phase is 2.3
7
times more compressible than the CT phase at zero pressure. Due to the limited number
of data points in the tetragonal phase, the first derivative of the bulk modulus could not
be estimated and was fixed at 4. The calculated first derivative of the bulk modulus for
the collapse tetragonal phase was found to be B`= 3.06. These fit parameters are
summarized in Table 1.
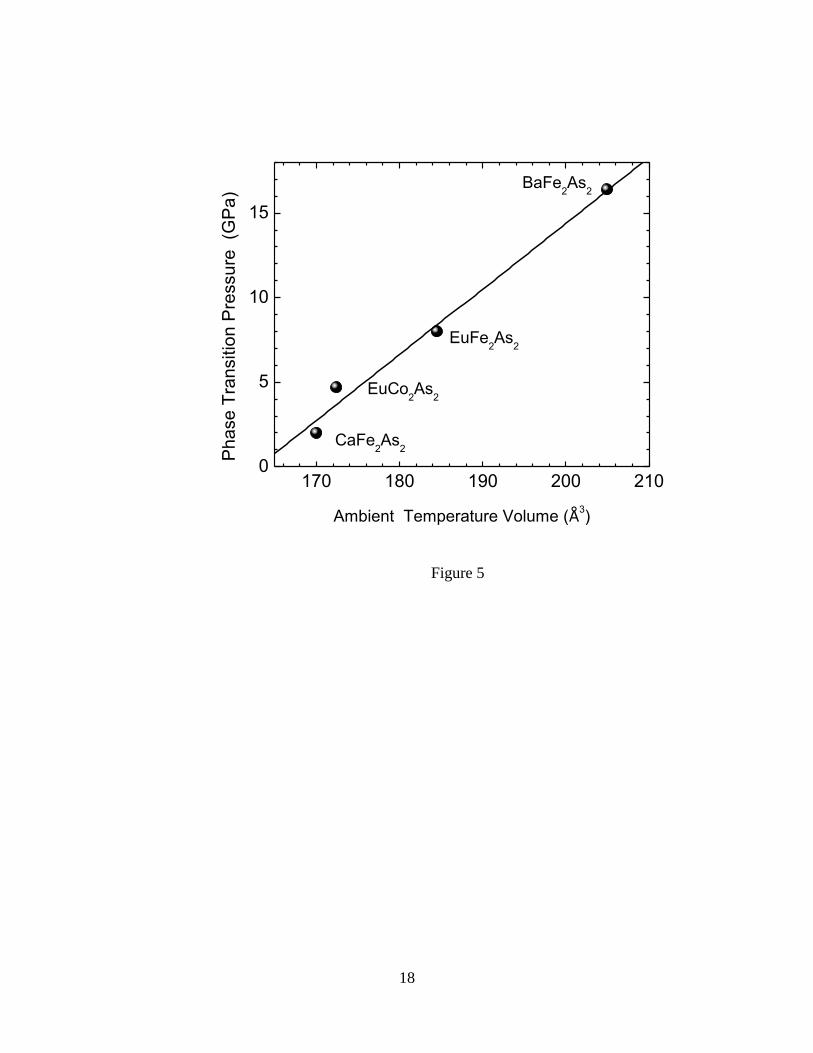
Figure 5 shows the correlation between the observed zero pressure volume (V0)
for AT2As2 122 materials (A=Ba ,Fe, Ca and Eu ;T=Fe, Co) and their corresponding
phase transition pressures (PT) from T to CT phases at 300 K. The data for EuFe2As2
were obtained from ref [10] and the data for CaFe2As2 were taken from ref [11]. The
variation shows a nearly linear increase in PT with increasing V0 .The solid curve is the
linear fit to data and is described by the equation below:
PT = 0.388V0 (+/-0.034) GPa/Å3
- 63.259 (+/- 6.2) GPa. (5)
Following this work, we suggest that transition from the T- to CT-phase, under
compression with a concurrent negative axial compressibility, is a common effect in all
the parents of iron-based arsenic 122 superconductors and perhaps other related
compounds of the 122-type, The T- to CT-phase of these compounds at 300 K can be
estimated using equation (5) if their corresponding zero pressure volume at ambient
temperature is known. The pressure induced isostructural phase transition to a collapsed
tetragonal at ambient temperature is not unique among arsenic compounds that have
ThCr2Si2 type structure. The effect is found among the phosphides that are isostructural
to AT2As2 compounds such as EuCo2P2 and SrNi2P2 [7], EuFe2P2 [16]. These phosphides
compounds have been widely studied and the rapid decrease observed in their c/a ratios
in the collapsed tetragonal phase has been attributed to bonding transitions associated
with the formation of P-P single bond between ions in adjacent planes along the c-axis
[17]. In connection to arsenic compounds, recent theoretical calculations for CaFe2As2
suggest that there is similar transition in the bonding character of As ions and the
enhancement of the As-As bonds across the Fe2As2 layers under pressure [18]. This work
and previous studies on the related 122 compounds suggest that the collapsed tetragonal
phase, with the space group.I4/mmm, is the stable high-pressure phase of the AT2As2 type
compounds, and there have been no any evidence of post collapsed phase transitions at
8
least up to maximum pressures of these studies (70 GPa in EuFe2As2 [10], 56 GPa in
BaFe2As2, 51 GPa in CaFe2As2 [11] and 35 GPa EuCo2As2).
Conclusions:
In summary, we have studied the pressure effects on the crystal structure of the
layered ThCr2Si2-type EuCo2As2 up to 35.8 GPa at ambient temperature using
synchrotron x-ray diffraction. The x-ray diffraction patterns collected reveal a highly
anisotropic and anomalous compressibility effects in which a-axis increases with
increasing pressures up to a maximum then decreases normally while the c-axis decreases
continuously with increasing pressure. Analysis of the x-ray diffraction data indicates a
tetragonal phase to a collapsed tetragonal phase transition in EuCo2As2 at 4.7 GPa. The
equations of state for the T- and CT-phases show distinct Bulk Moduli. At ambient
pressure, an extrapolated CT phase has a density that is 3.8 % higher as compared to the
T-phase under similar conditions. We suggest that the transition from T- to CT-phase
under compression, along with a concurrent negative axial compressibility, is a common
effect in every compound of the type AT2As2 (A = Ba, Ca, Sr, Eu and T = Fe, Co). A
linear correlation between the ambient pressure volume for such 122 materials and their
corresponding phase transition pressures from T- to CT-phase at 300K is obtained.
Additional systematic theoretical and experimental studies of structural phase transitions
in AT2As2 compounds under hydrostatic and non-hydrostatic pressure conditions are
required to clearly establish a correlation between transition pressure, initial volume, and
electronic structure of these materials
ACKNOWLEDGMENT
Matthew Bishop acknowledges support from the National Science Foundation (NSF)
Research Experiences for Undergraduates (REU)-site under Grant No. NSF-DMR-
06446842. Walter Uhoya acknowledges support from the Carnegie/Department of
Energy (DOE) Alliance Center (CDAC) under Grant No. DE-FC52-08NA28554
Research at Oak Ridge National Laboratory is sponsored by the Materials Sciences and
Engineering Division, Office of Basic Energy Sciences, US Department of Energy.
9
Discussions with M. A. McGuire are appreciated. The synchrotron facility used was
Argonne National Laboratory’s Advanced Photon Source (APS): HPCAT (Sector 16.)
10
References:
1. M. Rotter, M .Tegel, and D. Johrendt, Phys. Rev.lett.101, 107006 (2008).
2. A. S. Sefat, R. Jin, M. A. McGuire, B. C. Sales, D. J. Singh, and D. Mandrus, Phys.
Rev. Lett. 101, 117004 (2008).
3. P. L. Alireza, J. Gillett, Y. T. Chris Ko, S. E. Sebastian, and G.G. Lorezarich, J.Phys.:
Condens. Matter 21, 012208 (2009).
4. M. S. Torikachvili, S. L. Bud’ko, N. Ni, and P. C. Canfield,Phys. Rev. Lett. 101,
057006 (2008).
5. T. Park, E. Park, H. Lee, T. Klimczuk, E. D. Bauer, F. Ronning, and J. D. Thompson,
J. Phys.: Condens. Matter 20, 322204 (2008).
6. R. Marchand and W. Jeitschko, J. Solid State Chem.24, 351(1978).
7. C. Huhnt, W. Schlabitz, A. Wurth, A. Mewis, M. Reehuis, Phys. Rev. B 56, 13796
(1997).
8. C. Huhnt, W. Schlabitz, A. Wurth, A. Mewis, M. Reehuis, Physica B 252, 44 (1998).
9. R.Gatt and J.Grima ,Phys. Stat.Sol 5 DOI 10.1002(2008)
10. W. Uhoya, G. Tsoi1, Y. K Vohra, M. A. McGuire, A. S. Sefat, B. C Sales, D.
Mandrus and S. T.Weir, J. Phys.: Condens. Matter 22, 292202 (2010).
11. R.Mittal,S.K.Mishra,S.L.Chaplot,S.V.Ovsyannikov,E.Greenberg,D.M.Trots,L.Dubro
nvinsky,Y.Su,T.Brueckel,S.Matsuishi,H.Hosono,G.Garbarino,arXiv: 1007 2320
v1,[cond -mat.supra-con] (July, 2010).
12. N. Velisavljevic and Y. K. Vohra, High Pressure Research 24, 295 (2004).
13. F. Birch, Phys. Rev. 71, 809 (1947).
14. A.P.Hammersley, Report No.EXP/AH/95-01,( 1995)
11
15. M. Tegel, M. Rotter, V. Weiβ, F. M. Schappacher, R. Pöttgen, and D. Johrendt, J.
Phys.: Condens. Matter 20, 452201 (2008).
16. B. Ni , N. M. Abd-Elmeguid , H. Micklitz , J. P. Sanchez , P. Vulliet and D.
Johrendt ,Phys. Rev. B .63, 100102(R) (2001).
17. R. Hoffmann and C. Zheng, J.Phys. Chem. 89,4175( 1985)
18. T. Yildirim, arXiv : 0807.3936 v1,[cond -mat.supra-con] (Feb, 2009).
12
Figure Captions:
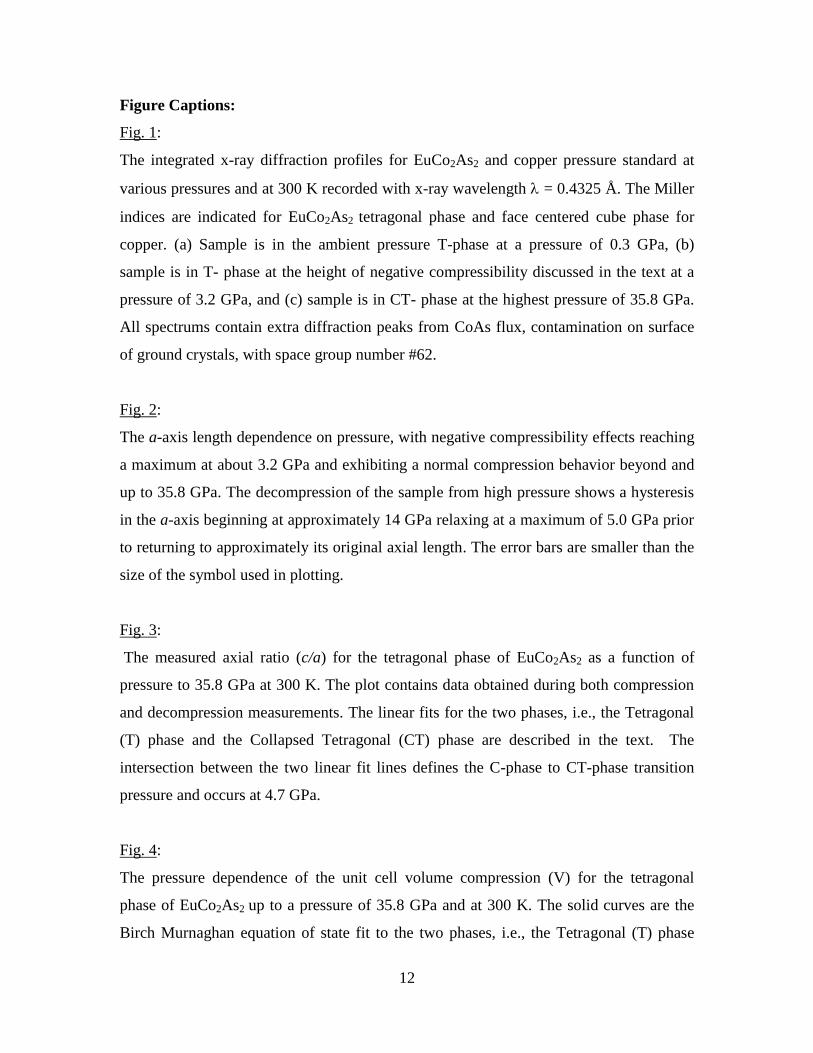
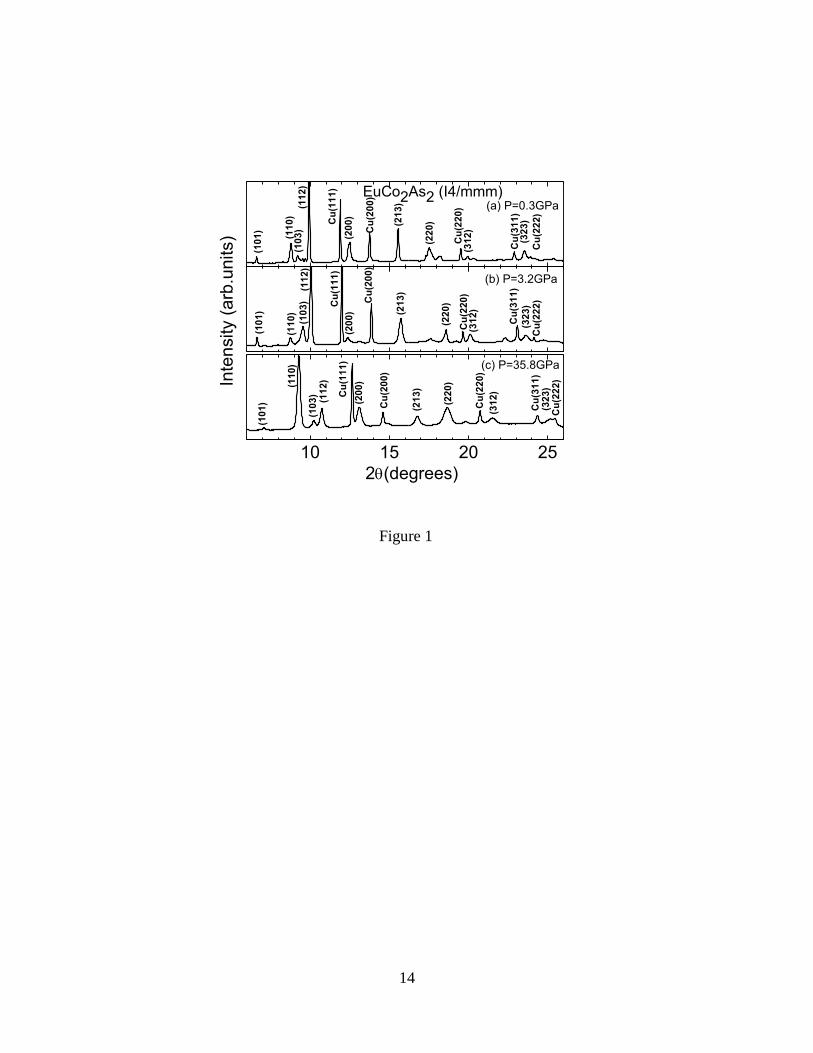
Fig. 1:
The integrated x-ray diffraction profiles for EuCo2As2 and copper pressure standard at
various pressures and at 300 K recorded with x-ray wavelength = 0.4325 Å. The Miller
indices are indicated for EuCo2As2 tetragonal phase and face centered cube phase for
copper. (a) Sample is in the ambient pressure T-phase at a pressure of 0.3 GPa, (b)
sample is in T- phase at the height of negative compressibility discussed in the text at a
pressure of 3.2 GPa, and (c) sample is in CT- phase at the highest pressure of 35.8 GPa.
All spectrums contain extra diffraction peaks from CoAs flux, contamination on surface
of ground crystals, with space group number #62.
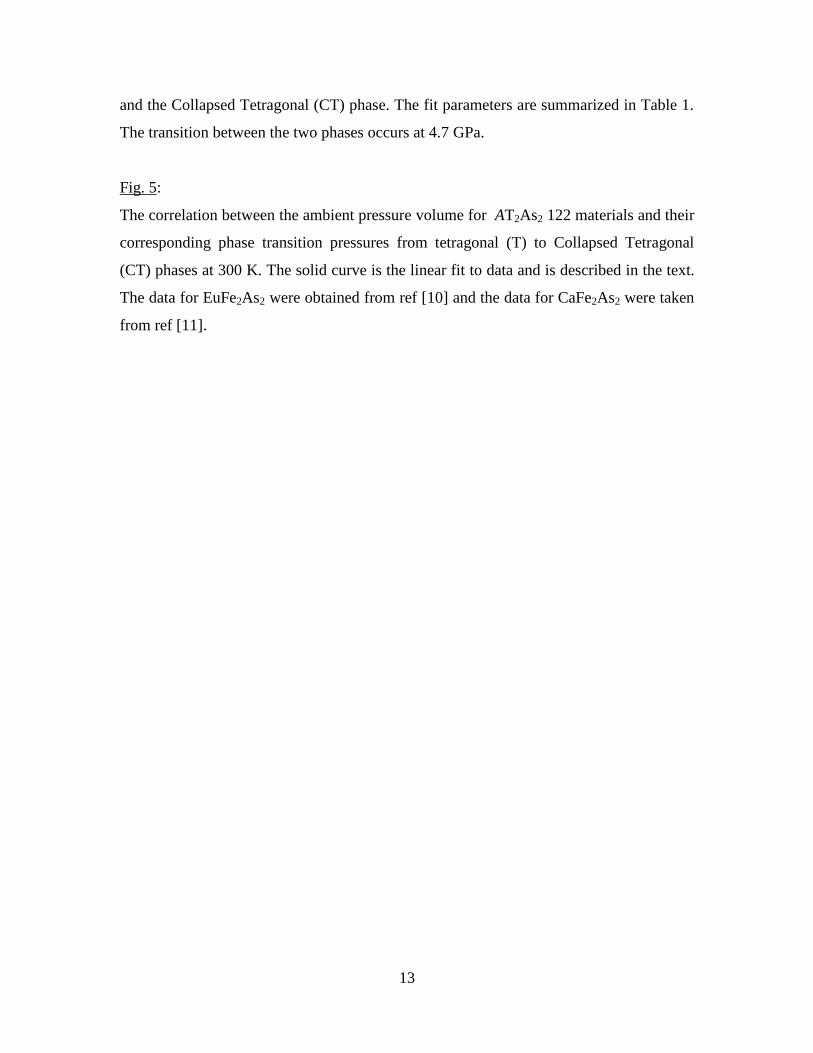
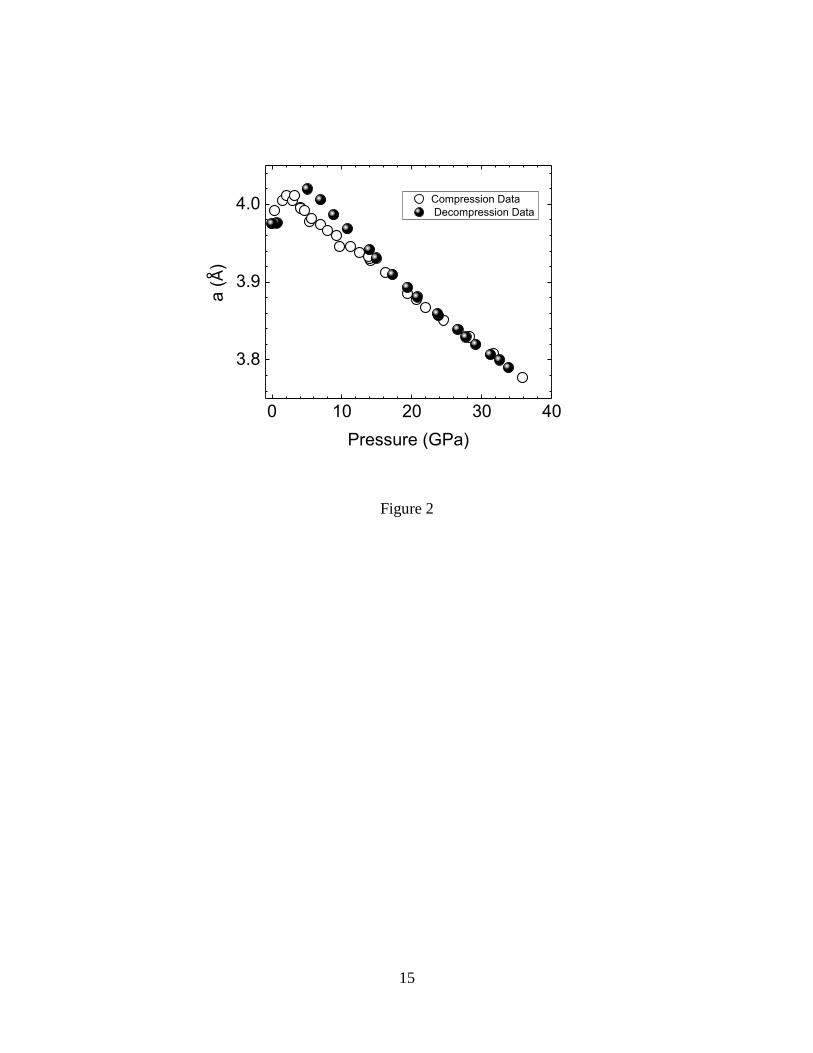
Fig. 2:
The a-axis length dependence on pressure, with negative compressibility effects reaching
a maximum at about 3.2 GPa and exhibiting a normal compression behavior beyond and
up to 35.8 GPa. The decompression of the sample from high pressure shows a hysteresis
in the a-axis beginning at approximately 14 GPa relaxing at a maximum of 5.0 GPa prior
to returning to approximately its original axial length. The error bars are smaller than the
size of the symbol used in plotting.
Fig. 3:
The measured axial ratio (c/a) for the tetragonal phase of EuCo2As2 as a function of
pressure to 35.8 GPa at 300 K. The plot contains data obtained during both compression
and decompression measurements. The linear fits for the two phases, i.e., the Tetragonal
(T) phase and the Collapsed Tetragonal (CT) phase are described in the text. The
intersection between the two linear fit lines defines the C-phase to CT-phase transition
pressure and occurs at 4.7 GPa.
Fig. 4:
The pressure dependence of the unit cell volume compression (V) for the tetragonal
phase of EuCo2As2 up to a pressure of 35.8 GPa and at 300 K. The solid curves are the
Birch Murnaghan equation of state fit to the two phases, i.e., the Tetragonal (T) phase
13
and the Collapsed Tetragonal (CT) phase. The fit parameters are summarized in Table 1.
The transition between the two phases occurs at 4.7 GPa.
Fig. 5:
The correlation between the ambient pressure volume for AT2As2 122 materials and their
corresponding phase transition pressures from tetragonal (T) to Collapsed Tetragonal
(CT) phases at 300 K. The solid curve is the linear fit to data and is described in the text.
The data for EuFe2As2 were obtained from ref [10] and the data for CaFe2As2 were taken
from ref [11].
14
10 15 20 25
Cu(222)
Cu(311)
Cu(200)
Cu(111)
(112)
(103)(110)
(323)
Cu(220)
(312)
(220)
(200)
(213)
(101)
(a) P=0.3GPaEuCo2As2 (I4/mmm)
Cu(222)
(323)
Cu(311)
(312)
Cu(220)
(200)
Cu(111)
(112)
(103)
(110) (213)
Cu(200)
(220)
(101)
(b) P=3.2GPa
(323)
Cu(311)
Cu(222)
(312)
(103)
Cu(220)
(101) Cu(200)
(213)
(220)
(200)
Cu(111)
(112)(110) (c) P=35.8GPa
Inte
nsity (
arb
.un
its)
2(degrees)
Figure 1
15
Figure 2
0 10 20 30 40
3.8
3.9
4.0
Compression Data
Decompression Data a
(Å
)
Pressure (GPa)
16
Figure 3
0 10 20 30 40
2.5
2.6
2.7
2.8
Data
Fit
CT
T
A
xia
l R
atio
(c/a
)
Pressure(GPa)
17
Figure 4
130
140
150
160
170
0 10 20 30 40
T
CT
Data
Fit
EuCo2As
2 (Tetragonal-I4/mmm)
Pressure (GPa)
Un
it C
ell
Vo
lum
e (Å
3)
T
18
Figure 5
170 180 190 200 2100
5
10
15
CaFe2As
2
EuCo2As
2
EuFe2As
2
BaFe2As
2
Ph
ase
Tra
nsitio
n P
ressu
re
(GP
a)
Ambient Temperature Volume (Å3)
19
Table 1: Equation of state parameters for the EuCo2As2 in the Tetragonal (T) phase and
Collapsed Tetragonal (CT) phase at ambient temperatures
Phase Unit Cell
Volume (V0) at
Ambient
Conditions
Bulk Modulus
(B0)
Pressure Derivative
of Bulk Modulus
(B´)
Tetragonal (T)
0 < P < 4.7 GPa
172.4 ± 0.7 Å3 48 ± 4 GPa 4(assumed)
Collapsed Tetragonal
(CT)
5< P < 35.8 GPa
165.9 ± 0.3 Å3 111 ± 2 GPa 3.06