Formant Measurement of Indonesian Speakers in English ...
14
International Journal of Innovation, Creativity and Change. www.ijicc.net Special Edition: Safe Communities, 2020 1051 Formant Measurement of Indonesian Speakers in English Vowels Dedy Subandowo 1 , Eva Faliyanti 2 , Bambang Eko Siagiyanto 3 1 Department of Applied Linguistics, Pázmány Péter Catholic University, Hungary, 2,3 Department of English Education, University Muhammadiyah Metro, Indonesia Email: 1 [email protected], 2 evafaliyanti1980.gmail.com, 3 [email protected] This study investigated the formant measurement of Indonesian speakers in pronouncing English vowels, and aimed to calculate the average level of F1 and F2 to produce the English vowels. The participants were second- semester students at the University of Muhammadiyah Metro in Indonesia, with an age range between 20-22. The data is primarily taken from the recordings of minimal English pairs, such as look-room, cat-kate, set-seat, cut-cute, hope-hope, hall-hurl, live-leave, father-family, get-ego, bear-bar. The results revealed that the pronunciation of English vowels recorded by the Indonesian students seemed to be difficult, particularly in minimal word pairs. The Indonesian speakers found it difficult to distinguish the phonemes /i/ and /ɪ/, /ɛ/ and /ᴂ/, which are almost all close to /e/ in Bahasa Indonesia. The formants of phonemes /i/, /ɪ/, /ɛ/, /ᴂ/, and /ʌ/ are relatively produced higher than normal English. The production of English vowel /ʌ/ is identical to Indonesian vowel /a/ and phoneme /ɜ/ is pronounced close to /o/ /ɔ /, /ʊ/ to /u/ in Bahasa Indonesia. Key Words: Formant Measurement, English, Vowels, Indonesia
-
Upload
khangminh22 -
Category
Documents
-
view
1 -
download
0
Transcript of Formant Measurement of Indonesian Speakers in English ...

International Journal of Innovation, Creativity and Change. www.ijicc.net
Special Edition: Safe Communities, 2020
1051
Formant Measurement of Indonesian
Speakers in English Vowels
Dedy Subandowo1, Eva Faliyanti2, Bambang Eko Siagiyanto3
1Department of Applied Linguistics, Pázmány Péter Catholic University, Hungary, 2,3Department of English Education, University Muhammadiyah Metro, Indonesia
Email: [email protected], 2evafaliyanti1980.gmail.com,
This study investigated the formant measurement of Indonesian speakers in
pronouncing English vowels, and aimed to calculate the average level of F1
and F2 to produce the English vowels. The participants were second-
semester students at the University of Muhammadiyah Metro in Indonesia,
with an age range between 20-22. The data is primarily taken from the
recordings of minimal English pairs, such as look-room, cat-kate, set-seat,
cut-cute, hope-hope, hall-hurl, live-leave, father-family, get-ego, bear-bar.
The results revealed that the pronunciation of English vowels recorded by
the Indonesian students seemed to be difficult, particularly in minimal word
pairs. The Indonesian speakers found it difficult to distinguish the phonemes
/i/ and /ɪ/, /ɛ/ and /ᴂ/, which are almost all close to /e/ in Bahasa Indonesia.
The formants of phonemes /i/, /ɪ/, /ɛ/, /ᴂ/, and /ʌ/ are relatively produced
higher than normal English. The production of English vowel /ʌ/ is identical
to Indonesian vowel /a/ and phoneme /ɜ/ is pronounced close to /o/ /ɔ /, /ʊ/
to /u/ in Bahasa Indonesia.
Key Words: Formant Measurement, English, Vowels, Indonesia
International Journal of Innovation, Creativity and Change. www.ijicc.net
Special Edition: Safe Communities, 2020
1052
Introduction
Indonesia is a Republic country in South East Asia that consists of more than seventeen
thousand islands from Sabang to Merauke with a combination of land and sea areas and
a population of more than 260 million people(Mulyanto, 2018). Indonesia is the Association
of Southeast Asain Nations(ASEAN) most populated country and the fourth-largest country
in terms of population sizeon earth(Zein, 2019).It comprises over 40 percent of the entire
population of Southeast Asia (Jones, 2014). Indonesia is characterized by multi-ethnic
variations with hundreds of different ethnic groups and cultures. There are significant
numbers ofdistinct ethnic groups speaking roughly 2500 languages throughout over 17,000
islands of Indonesia (Paauw, 2009). Nababan(1985)claimed that there are more than 400
languages spoken in Indonesia, and it makes the archipelago diverse, which has been known
as Bhineka Tunggal Ikawhich means ‘unity in diversity’.
Function and Number of Speakers of Indonesian
Indonesian or Bahasa Indonesia, synonymously with modern Malay or Malay dialect,is the
national language since it was declared to change from the Malay Language to Indonesian of
the Republic of Indonesia in 1930. It has a function as lingua franca among thousands of
different ethnic groups acrossthe archipelago in Indonesia (Widagsa, Agung, & Putro, 2017).
It also became the teaching language in schools andis used in formal settings such as news
media and official matters, etc (Adisasmito-Smith, 1999; Widagsa, Perwitasari& Sari, 2018).
Although the Indonesian language is infused with highly distinctive accents from different
ethnic languages, there are many similarities in patterns across the archipelago (Sakti et al.,
2008; Perwitasari, 2013; Wardana, 2014). Indonesian is a member of the Malayo-Polynesian
(Austronesia) Language Family and remains close to Modern Indo-European language
(Hanna, 1974). The linguistic history affects the large and growing vocabularies from
European and Indigenous language. Hence, Indonesian is likely to be slightly different toa
standard dialect of the Malay Peninsula. The Indonesian statistics census in 2010 published
that the total number of Indonesian speakers is 197 million people (Badan Pusat Statisitik,
2010).
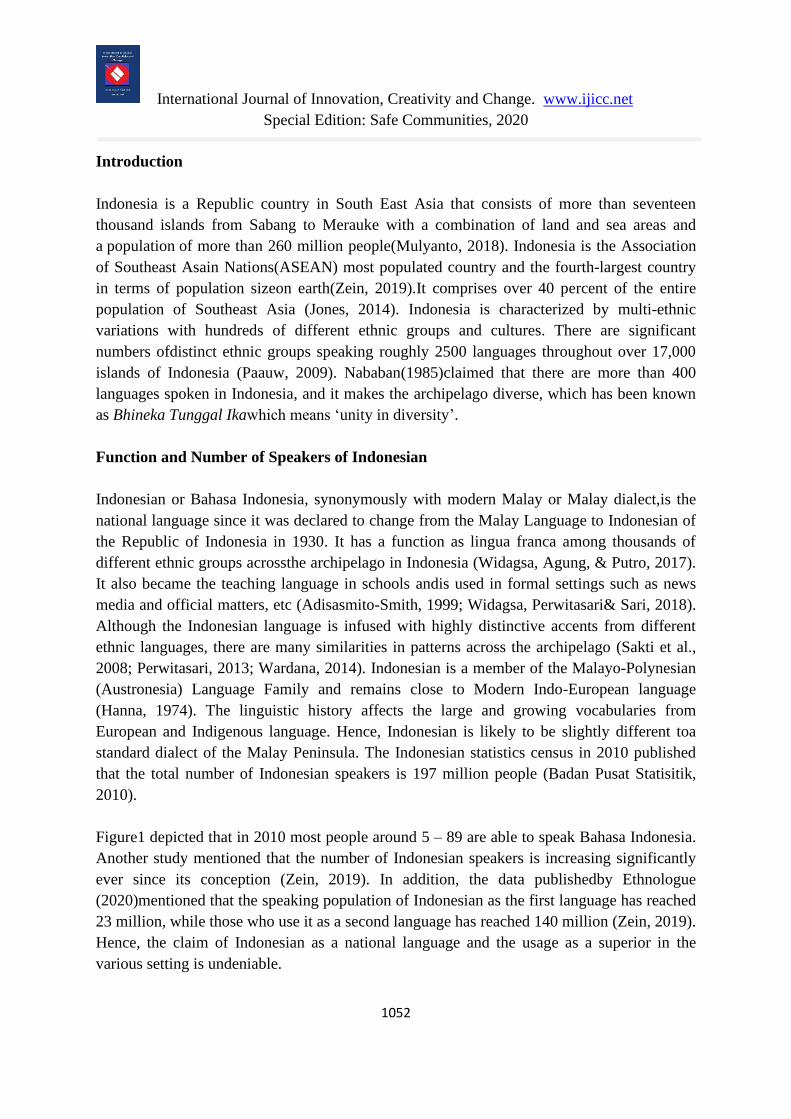
Figure1 depicted that in 2010 most people around 5 – 89 are able to speak Bahasa Indonesia.
Another study mentioned that the number of Indonesian speakers is increasing significantly
ever since its conception (Zein, 2019). In addition, the data publishedby Ethnologue
(2020)mentioned that the speaking population of Indonesian as the first language has reached
23 million, while those who use it as a second language has reached 140 million (Zein, 2019).
Hence, the claim of Indonesian as a national language and the usage as a superior in the
various setting is undeniable.

International Journal of Innovation, Creativity and Change. www.ijicc.net
Special Edition: Safe Communities, 2020
1053
Figure 1. Population 5 Years of Age and Over by Age Group and Ability to Speak Indonesian
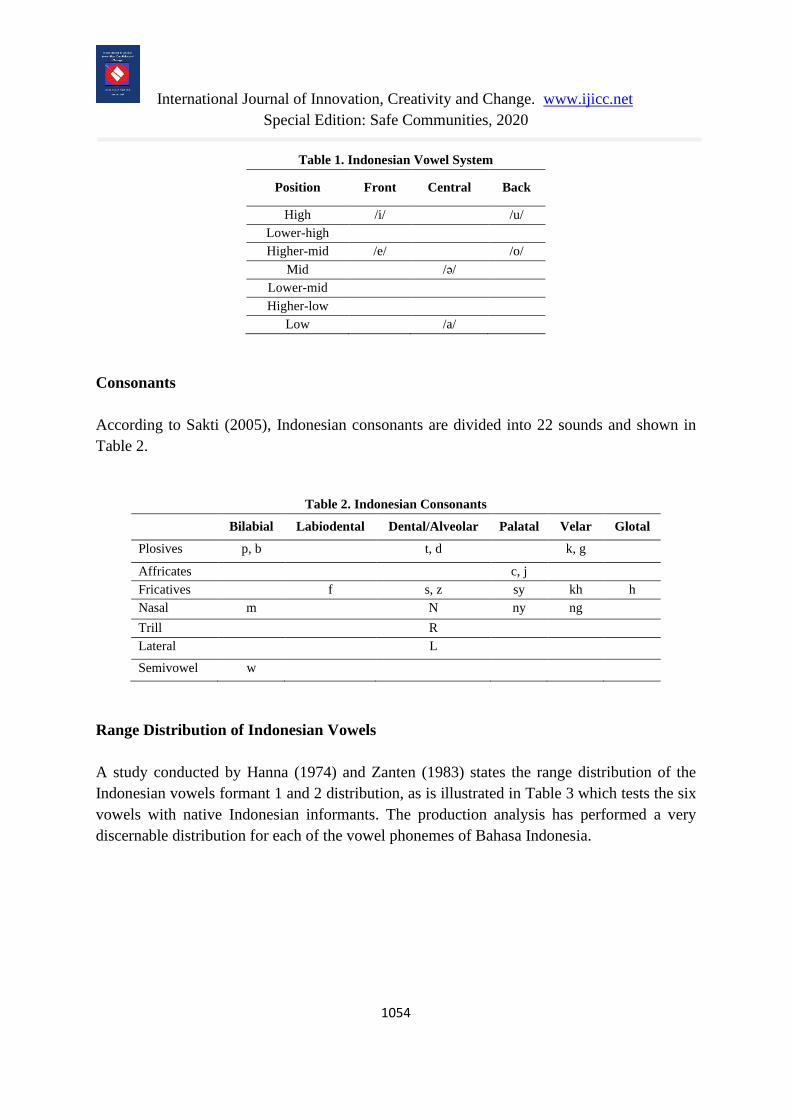
Indonesian Vowel System
According to Wijana (2003), the Indonesian vowel inventory is dividedinto the language of
the six vowel system. The vowels are /i/, /u/, /e/, /o/, /a/, and /ə/. Bahasa Indonesia is divided
into two different contrasting of front vowels high, higher-mid tongue position, two central
mid and low tongue position,and two back vowels contrasting high and higher-mid tongue
position(Tilman& Nurhayani, 2015;Zanten & Heuven, 1984).
Furthermore, Table 1 shows that the characteristics of the similarity or parallel distribution
and their meaning capacity tend to be the distinctive features of the vowels. The existence of
Indonesian vowels is likely to occur in the beginning, middle, and end either open or closed
syllables. Vowel /a/ and /ə/ are sounds with no allophonic variation. On the other hand, the
other sounds /i/, /u/, /e/, and /o/ have one allophone, /I/, /U/, /ɛ/, and /ɔ/. Hence, /i/ can come
to realize as [i] and [I] in pipi (cheek in english) and kikIr (stingy); /u/ has realization as /u/ in
kamu (you) and /U/ sumUr (well); /e/ has variation into /e/ in lele (cat fish) and /ɛ/ ketek
(armpit); /o/ has allophone as/o/ otak (brain) and /ɔ/ tɔkɔh (figure)(Zanten & Heuven, 1984).
International Journal of Innovation, Creativity and Change. www.ijicc.net
Special Edition: Safe Communities, 2020
1054
Table 1. Indonesian Vowel System
Position Front Central Back
High /i/
/u/
Lower-high
Higher-mid /e/
/o/
Mid
/ə/
Lower-mid
Higher-low
Low
/a/
Consonants
According to Sakti (2005), Indonesian consonants are divided into 22 sounds and shown in
Table 2.
Table 2. Indonesian Consonants
Bilabial Labiodental Dental/Alveolar Palatal Velar Glotal
Plosives p, b
t, d k, g
Affricates
c, j
Fricatives
f s, z sy kh h
Nasal m
N ny ng
Trill
R
Lateral
L
Semivowel w
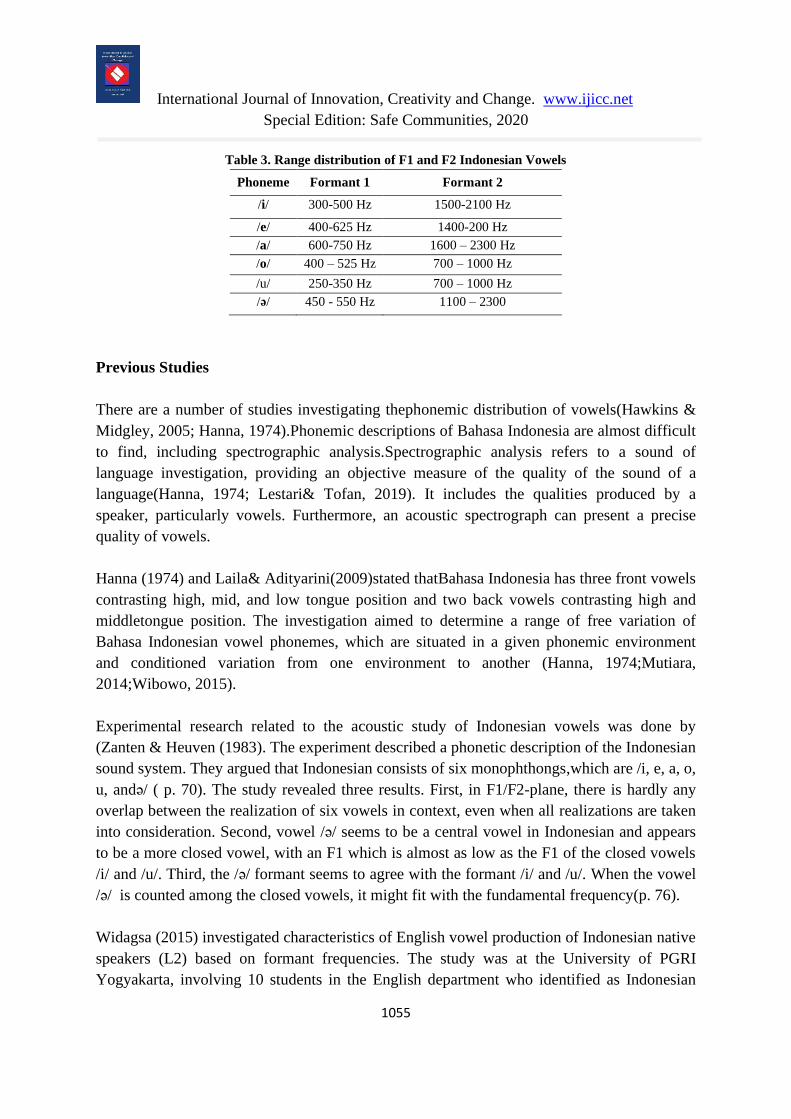
Range Distribution of Indonesian Vowels
A study conducted by Hanna (1974) and Zanten (1983) states the range distribution of the
Indonesian vowels formant 1 and 2 distribution, as is illustrated in Table 3 which tests the six
vowels with native Indonesian informants. The production analysis has performed a very
discernable distribution for each of the vowel phonemes of Bahasa Indonesia.
International Journal of Innovation, Creativity and Change. www.ijicc.net
Special Edition: Safe Communities, 2020
1055
Table 3. Range distribution of F1 and F2 Indonesian Vowels
Phoneme Formant 1 Formant 2
/i/ 300-500 Hz 1500-2100 Hz
/e/ 400-625 Hz 1400-200 Hz
/a/ 600-750 Hz 1600 – 2300 Hz
/o/ 400 – 525 Hz 700 – 1000 Hz
/u/ 250-350 Hz 700 – 1000 Hz
/ə/ 450 - 550 Hz 1100 – 2300
Previous Studies
There are a number of studies investigating thephonemic distribution of vowels(Hawkins &
Midgley, 2005; Hanna, 1974).Phonemic descriptions of Bahasa Indonesia are almost difficult
to find, including spectrographic analysis.Spectrographic analysis refers to a sound of
language investigation, providing an objective measure of the quality of the sound of a
language(Hanna, 1974; Lestari& Tofan, 2019). It includes the qualities produced by a
speaker, particularly vowels. Furthermore, an acoustic spectrograph can present a precise
quality of vowels.
Hanna (1974) and Laila& Adityarini(2009)stated thatBahasa Indonesia has three front vowels
contrasting high, mid, and low tongue position and two back vowels contrasting high and
middletongue position. The investigation aimed to determine a range of free variation of
Bahasa Indonesian vowel phonemes, which are situated in a given phonemic environment
and conditioned variation from one environment to another (Hanna, 1974;Mutiara,
2014;Wibowo, 2015).
Experimental research related to the acoustic study of Indonesian vowels was done by
(Zanten & Heuven (1983). The experiment described a phonetic description of the Indonesian
sound system. They argued that Indonesian consists of six monophthongs,which are /i, e, a, o,
u, andə/ ( p. 70). The study revealed three results. First, in F1/F2-plane, there is hardly any
overlap between the realization of six vowels in context, even when all realizations are taken
into consideration. Second, vowel /ə/ seems to be a central vowel in Indonesian and appears
to be a more closed vowel, with an F1 which is almost as low as the F1 of the closed vowels
/i/ and /u/. Third, the /ə/ formant seems to agree with the formant /i/ and /u/. When the vowel
/ə/ is counted among the closed vowels, it might fit with the fundamental frequency(p. 76).
Widagsa (2015) investigated characteristics of English vowel production of Indonesian native
speakers (L2) based on formant frequencies. The study was at the University of PGRI
Yogyakarta, involving 10 students in the English department who identified as Indonesian

International Journal of Innovation, Creativity and Change. www.ijicc.net
Special Edition: Safe Communities, 2020
1056
native speaker respondents. The research included the first frequency of first formant (F1)
and second formants (F2). The findings of the study, which was done by using Praat
software, showed English vowel productions of English-L2 tend to be very close to the
nearest Indonesian vowels. The frequency of the vowels included /i/ and /ɪ/ is identical. They
ranged F1 403.5 Hz, F2 2070.4 Hz for /i/ and F1 416.5, F2 2065.5 for /ɪ/. Another
characteristic, which is close to Indonesian, is the utterance of /ɒ/ and /ɔ/. Thus, the study
concluded that vowel /ɒ/ seems to be more front instead of back.
Perwitasari, Klamer, & Schiller(2016) investigated the formant frequency of ten English
words influenced by Javanese and Sundanese speakers. The study involved 40 speakers of
Javanese (JE) and Sundanese (SE) as well as 10 American English speakers (AmE). They
claimed that Javanese and Sundanesespeakers should have problems in producing similar
vowels such as (/I, ɛ, ʊ/) and should not have greater L2 differences with new vowels such as
(/i:, æ, ɑː, ɔ:, u:, ʌ, ɜ:/). The results demonstrated that Javanese speakers seemed to have
different F1 and F2 values for vowels (/æ, ɑː, ɔ:/) when compared to the English native
speakers. Otherwise, vowels (/I, ʊ/) were considered to be similar vowels in the L1 vowel
system. In addition, the production of vowels, either Javanese or Sundanese tended to be
slightly smaller than that of the native English speakers. At the same time, a study conducted
by Suyudi & Saptono (2016)is aimed to analyze vocal tract speech sound. This acoustic study
was inspired by Zanten & Heuven (1983). The data were mainly taken from some informants
of native and non-native speakers Bahasa Indonesia by recording technique. These
informants produced vowel and consonants by two experiments, which are producing isolated
vowels and vocal sounds as well as consonants based on certain words. The result showed
vowel sounds were measured in isolation and in words which are then compared. The
measurement of F1 and F2 has been successfully carried out by using VisArtico and Praat
software. Thus, the calculation of the vocal tract has been obtained a precise value.
According to Suyudi & Saptono (2016), vocal quality is specified by the levels of openness
mouth. It indicates that constants variables will affect the movement. The more wide-open
mouth and articulatory movement are, the longer the vowel will be.
A related study concerning acoustic analysis on English oral vowels has been done by Fata,
Fitrian & Yusuf(2017). Their attention is paid to the production of English vowels produced
by English teacher candidates. The participants of this study are five females and five males
with ages ranging from 18-22 years of old who were born and raised in Aceh Besar,
Indonesia. Praat software version 6.0.14 is chosen to analyze the wav file conversion. Finding
show males tend to be higher than females in the production of English vowels. On the other
hand, there is no significant difference between Acehnese males and females in producing
English vowels such as /I/ and /i/, /e/ and /a/, /u/ and /ʊ/, and /ɒ/ and /ↄ/.

International Journal of Innovation, Creativity and Change. www.ijicc.net
Special Edition: Safe Communities, 2020
1057
Second language (L2) learners might face a problem when they come to learn sound
productions. It involves a linguistic difference between their first (L1) and L2. Some phonetic
features of L2 that do not occur in L1 tend to be a difficult factorinfluencing their successful
L2 learning(Mcallister, Flege, & Piske, 2002). Consequently, producing certain sounds might
overlap in some cases. For example, Indonesian learners who speak English as a foreign
language experience problems when producing English vowels. In this sense, English and
Indonesian vowels system lead to distinctive vowel production (Widagsa et al., 2017).
However, this vowel production distinction can be recognized in format frequency. This
argument is supported by (Peterson & Barney, 1952). They argue that format frequencies are
reliable for identifying correct pronunciation and intelligibility.
As mentioned above, studies of acoustic analysis have been primary concerns over language
systems that highly concentrate on vowels. This research investigation related to Indonesian
native speakers producing English vowels seems rather difficult to uncover. This paper is
aimed to present another view of acoustic analysis and illustrate the average range of
Indonesian speakers when producing English vowels.
Methods
This experiment has conducted by analyzing voice records of the second-semester
undergraduate students of the English education department of Universitas Muhammadiyah
Metro in Lampung Province Sumatera. Four participants are focusing on the analysis, and
they are all female students. The participants are requested to pronounce some English
minimal pairs such as look-room, cat-kate, set-seat, cut-cute, hope-hope, hall-hurl, live-leave,
father-family, get-ego, bear-bar. They are around 22 – 24 years of age. The vowels selected
to be analyzed the comparison in producing the sounds /i/ and/I/, /ɛ/ and /æ/, /ʊ/ and /ɜ/, and
/ɑ/ and / ʌ/. The sound spectrogram and text grid are combined and analyzed by using Praat.
At that point, the data analysis is descriptively written and illustrated in the following
diagram.
Results and Discussion
Based on Praat analysis, the explanation related to the issue of formant frequency is
formulated to some points. First, there is no significant difference in pronouncing phoneme
/i:/, and /ɪ/. Second, Phoneme /ɛ/ tends to be pronounced as /e/ in Bahasa Indonesia. Third,
some speakers changed vowel /ɛ/ to /ɪ/, and substituted /æ/ with close /ɛ/ and /e/ respectively.
On the other hand, a frequent change also happens to phonemes /ɜ/ to /ɔ /, /ʊ/ to /u/ and /ɜ/ to
/o/ that are close to Bahasa Indonesia. This seems to implyt hat their first language plays a
major impact on producing vowel sounds. In this sense, the Indonesian speakers are difficult
to distinguish between phonemes /i/ and /ɪ/, /ɛ/ and /ᴂ/, which are almost close to /e/ in

International Journal of Innovation, Creativity and Change. www.ijicc.net
Special Edition: Safe Communities, 2020
1058
Bahasa Indonesia. The formant of phonemes /i/, /ɪ/, /ɛ/, /ᴂ/ , and /ʌ/ are higher than English.
The production of English vowel /ʌ/ is seems identical to Indonesian vowel /a/ and phoneme
/ɜ/ is close to /o/, /ɔ /, and /ʊ/ to /u/.
The average number of F1 and F2 Indonesian speakers when producing English vowels is
various and fluctuates. It is evident that the first language is considered an influencing factor
in producing a formant frequency of English vowels. The following diagram in Figure 2
illustrates how Indonesian speakers encounter some problems, even confusion when
producing English vowels.
Figure 2. The Average of F1 and F2 of Indonesian Speakers
The average data of F1 and F2 performed by the students’ record has shown a fluctuating
chart. The categorization of the average is illustrated by each word of minimal pairs
pronounced by the participants. There are precisely eleven phonemes depicted from the
records. The highest average of F1 is /ɒ/ and /ʌ/ that are documented more than 900 hertz,
and the lowest phonemes are /i:/, /ə/ and /ʊ/. By contrast, the phoneme /i:/ sound for F2 has
reached the highest level into nearly 800 hertz followed by /I/, /ɛ/ at the same level on more
than 600 hertz. Besides, the /ə/, /ɑ/, /ɒ/, /ɔ/, /ʌ/ tend to locate more than 1200 hertz, and ʊ and
ɜ have raised to more than 1100 hertz.

International Journal of Innovation, Creativity and Change. www.ijicc.net
Special Edition: Safe Communities, 2020
1059
Figure 3. F1 & F2 of phoneme /i/ and /I/ produced by Indonesian Speakers
From Figure 3, there is no significant difference in pronouncing phoneme /i/ and /I/ unless the
speaker 1 who stressed only in phoneme /i/. The F1 either /i/ or /I/ is relatively close to
roughly 400 Hz and 500 Hz. The F2 shows /i/ is 2500 Hz and /I/ is less than 3000 Hz.
In Figure 4, Phoneme /ɛ/ tends to be pronounced as /e/ in Bahasa Indonesia. Speaker 3has
changed the phoneme /ɛ/ to /I/, substituted /æ/ with close /ɛ/ and /e/ respectively. The F1 of
vowel /ɛ/ tends to be more than 500 Hz,and it is relatively similar to /æ/ which is less than
800 Hz. The F2 shows that vowels /ɛ/ and /æ/ reach the highest level more than 2500 Hz and
2300 Hz, respectively.
Figure 4.Phoneme /ɛ/ & /æ/
0
500
1000
1500
2000
2500
3000
3500
i
I
0
500
1000
1500
2000
2500
3000
ɛ
æ

International Journal of Innovation, Creativity and Change. www.ijicc.net
Special Edition: Safe Communities, 2020
1060
From Figure 5, the speaker of 1, and 3 seem to change/ɜ/ to /ɔ /, /ʊ/ to /u/ and /ɜ/ to /o/ that
are close to Bahasa Indonesia. It indicates that the first language has an impact on producing
the sounds. The F1 of vowels /ʊ/ and /ɜ/ are estimated 500 Hz and 600 Hz. On the other hand,
a fluctiative chart has shown by both sounds for F2, which is related to 1200 Hz.
Figure 5. F1 & F2 of /ʊ/ and /ɜ/
Ultimately, the Figure 6 shows comparison between vowels /ɑ/ & / ʌ/. It does not tend to
overlap each other. The F1 average of vowels /ɑ/ tends to close 700 Hz, while / ʌ/ is nearly
1000 Hz. The F2 formant of vowels /ɑ/ & / ʌ/ has the same pattern, which does not have a
significant difference between 1500 Hz and 1600 Hz.
Figure 6. Phoneme /ɑ/ & / ʌ/
0
200
400
600
800
1000
1200
1400
1600
ʊ
ɜ
0200400600800
100012001400160018002000
ɑ
ʌ

International Journal of Innovation, Creativity and Change. www.ijicc.net
Special Edition: Safe Communities, 2020
1061
Conclusion
Bahasa Indonesia has six vowel inventories /i/, /u/, /e/, /o/, /a/, and /ə/ and tend to be simple
language. Besides, Bahasa Indonesia is divided into two different contrasting of front vowels
high, higher-mid tongue position, two central mid and low tongue position, and two back
vowels contrasting high and higher-mid tongue position. However, the production of vowels
of English recorded by the Indonesian students seems to be difficult particularly in
pronouncing the minimal word pairs. The Indonesian speakers are difficult to distinguish the
phonemes /i/ and /ɪ/, /ɛ/ and /ᴂ/, which are almost all close to /e/ in Bahasa Indonesia. The
formants of phonemes /i/, /ɪ/, /ɛ/, /ᴂ/ , and /ʌ/ are relatively produced higher than normal
English. The production of English vowel /ʌ/ is identical to Indonesian vowel /a/ and
phoneme /ɜ/ is pronounced close to /o/ /ɔ /, /ʊ/ to /u/ in Bahasa Indonesia. A further study is
suggested to take place in different group study and quantity to be able to provide accuracy
and performance. In addition, an effective tool is needed to be applied to receive better sound
quality. Hence, the data are examined appropriately and accurately.
International Journal of Innovation, Creativity and Change. www.ijicc.net
Special Edition: Safe Communities, 2020
1062
References
Adisasmito-Smith, N. (1999). Influence Of Javanese Vowel Patterning On Indonesian : An
Acoustic Investigation. In 14th international Congress of Phonetic Sciences (pp. 1109–
1112). San Fransisco, California: ICPH-14.
Badan Pusat Statisitik. (2010). Penduduk Berumur 5 Tahun Keatas Menurut Kelompok Umur
dan Kemampuan Berbahasa Indonesia. Retrieved from
https://sp2010.bps.go.id/index.php/site/tabel?search-
tabel=Penduduk+Berumur+5+Tahun+Keatas+Menurut+Kelompok+Umur+dan+Kemam
puan+Berbahasa+Indonesia&tid=283&search-
wilayah=Indonesia&wid=0000000000&lang=id
Ethnologue. (2020). Indonesian. Retrieved January 19, 2020, from
https://www.ethnologue.com/language/ind
Fata, I. A., Fitrian, F., Mohammad, T., & Yusuf, Y. Q. (2017). Acoustic Analysis on English
Oral Vowels Produced by Acehnese Speakers from Aceh Besar by Using PRAAT
Software. Proceedings of AICS-Social Sciences, 7, 591-596.
Hanna, I. T. (1974). A Spectrographic Analysis of Bahasa Indonesia Vowel Phonemes Under
Primary Stress in CVC Words. Portland State University.
Hawkins, S., & Midgley, J. (2005). Formant frequencies of RP monophthongs in four age
groups of speakers. Journal of the International Phonetic Association, 35(2), 183-199.
https://doi.org/10.1017/S0025100305002124
Jones, G. W. (2014). The 2010-2035 Indonesian Population Projection. Singapore.
Laila, M., & Adityarini, H. (2009). Kualitas Pengucapan Bunyi Bahasa Inggris Oleh
Pemelajar Bahasa Inggris Yang Berlatar Belakang Bahasa Jawa Di Surakarta (Doctoral
dissertation, LPPM UMS).
Lestari, R. F., & Tofan Dwi Hardjanto, M. A. (2019). Akurasi dan Keberterimaan Pelafalan
Vokal Belakang Bahasa Inggris oleh Mahasiswa Indonesia: Studi Kasus Mahasiswa
Prodi Bahasa Inggris, IKIP Budi Utomo Malang (Doctoral dissertation, Universitas
Gadjah Mada).
Mcallister, R., Flege, J. E., & Piske, T. (2002). The influence of L1 on the acquisition of
Swedish quantity by native speakers of Spanish , English, and Estonian. Journal of
Phonetics, 30, 229–258. https://doi.org/10.1006/jpho.2002.0174
Mulyanto, J., Kringos, D. S., & Kunst, A. E. (2018). Socioeconomic inequalities in healthcare
utilization in Indonesia: a comprehensive survey-based overview. BMJ Open, 9(7).
https://doi.org/: 10.1136/bmjopen-2018-026164
Mutiara, R. (2014). Analisis Kesalahan Pelafalan pada Vokal Murni Bahasa Inggris oleh
Petugas Customer Service Center di Bandara Juanda (Doctoral dissertation, Universitas
Brawijaya).
Nababan, P. W. J. (1985). Bilingualism in Indonesia: Ethnic Language Maintenance and the
Spread of the National Language. Southeast Asian Journal of Social Science, 13(1), 1–
18. https://doi.org/10.1163/080382485X00020
International Journal of Innovation, Creativity and Change. www.ijicc.net
Special Edition: Safe Communities, 2020
1063
Paauw, S. (2009). One land, one nation, one language: An analysis of Indonesia’s national
language policy. University of Rochester Working Papers in the Language Sciences,
5(1), 2-16.
Perwitasari, A. (2013). Slips of the ears: Study on vowel perception in Indonesian learners of
English. Jurnal Humaniora, 25(1), 103-110.
Perwitasari, A., Klamer, M., & Schiller, N. O. (2016). Formant Frequencies and Vowel Space
Area in Javanese and Sundanese English Language Learners. The Southeast Asian
Journal of English Language Studies, 22(3), 141–152. https://doi.org/10.17576/3L-2016-
2203-10
Peterson, G. E., & Barney, H. L. (1952). Control Methods Used in a Study of the Vowels.
The Journal of the Acoustical Society of America, 24(2), 175–184.
https://doi.org/10.1121/1.1906875
Sakti, S., Kelana, E., Riza, H., Sakai, S., Markov, K., & Nakamura, S. (2008). Development
of Indonesian large vocabulary continuous speech recognition system within A-STAR
project. In Proceedings of the Workshop on Technologies and Corpora for Asia-Pacific
Speech Translation (TCAST).
Sakti, S., Markov, K., & Nakamura, S. (2005). Rapid Development of Initial Indonesian
Phoneme-based Speech Recognition Using The Cross-Language Approach. In Proc.
Oriental COCOSDA, 38–43.
Suyudi, I., & Saptono, D. (2016). Indonesian Formants In Acoustic Analysis. Asian Journal
of Basic and Applied Sciences, 3(2).
Tilman, R. D. C., & Nurhayani, I. (2015). Kesalahan Pengucapan Vokal Depan Bahasa
Inggris Oleh Mahasiswa Semester I Universitas Nasionaltimor Lorosa’e. LITE: Jurnal
Bahasa, Sastra, dan Budaya, 11(2).
Wardana, I. K. (2014). Kesalahan Artikulasi Phonemes Bahasa Inggris Mahasiswa Prodi
Bahasa Inggris Unmas Denpasar; Sebuah Kajian Fonologi Generatif. Jurnal Bakti
Saraswati (JBS), 3(02).
Wibowo, A. H. (2015). Permasalahan Pengucapan Bunyi Vokal Bahasainggris.
Widagsa, R. (2015). Acoustic Analysis of English Vowel Formant Frequencies Produced by
Indonesian Native Speakers. In C. Kristiyani, C. Tutyandari, B. Barm, Y. A. Iswandari,
L. Sumarni, & T. A. Pasaribu (Eds.), The 2nd International Language and Language
Teaching Conference. Yogyakarta: Sanata Dharma University.
Widagsa, R., & Putro, A. A. Y. (2017). Acoustic Measurement On Vowel Production Of
English As A Second Language By Indonesian EFL Learners. English Review: Journal
of English Education, 6(1), 71-80. https://doi.org/10.25134/erjee.v6i1.772.
Widagsa, R., Perwitasari, A., & Sari, M. K. (2018). Vowel Space Area of Minangkabau
Learners of English. Language Circle: Journal of Language and Literature, 12(2), 153-
164. https://doi.org/10.15294/lc.v12i2.14174
Wijana, I. D. P. (2003). Indonesian Vowels and Their Allophones. Jurnal Humaniora, 15(1),

International Journal of Innovation, Creativity and Change. www.ijicc.net
Special Edition: Safe Communities, 2020
1064
39-42.
Zanten, E. V. A. N., & Heuven, V. J. V. A. N. (1983). A Phonetic Analysis of the Indonesian
Vowel System: A Preliminary Acoustic Study. NUSA,Linguistic Studies of Indonesian
and Other Languages in indone-sia,15, 70–80.
Zanten, E. V. A. N., & Heuven, V. J. V. A. N. (1984).The Indonesian vowels as pronounced
and perceived by Toba Batak, Sundanese and Javanese speakers. Bijdragen tot de Taal-,
Land-en Volkenkunde, (4de Afl), 497-521.
Zein, S. (2019). English, Multilingualism annd Globalisation In Indonesia A Love Triangle:
Why Indonesia should move towards multilingual education. English Today, 35(1), 48–
53. https://doi.org/10.1017/S026607841800010X