Representations of impedance spectra of ceramics. Part II. Spectra of polycrystalline SrTiO3
62
International Journal of Bioelectromagnetism www.ijbem.org Vol. 12, No. 2, pp. 62 - 75, 2010
Forensics of Features in the Spectra of Biological Signals
Sladjana Spasić1, Aleksandar Perović4, Wlodzimierz Klonowski2,
Zoran Djordjević4, Wlodzisław Duch3, Aleksandar Jovanović4
1Institute for Multidisciplinary Research,Belgrade, Serbia,
2Lab. Biosignal Analysis Fundamentals, Institute of Biocybernetics & Biomedical Engineering, Polish Academy of Sciences, Warsaw, Poland, [email protected] 3Department of Informatics, Nicolaus Copernicus University, Torun, Poland, [email protected] 4Group for Intelligent Systems, School of Mathematics, University of Belgrade, [email protected]
Correspondence: Aleksandar Jovanovic, School of Mathematics, University of Belgrade, Studentski trg 16, 11000 Belgrade, Serbia. email: [email protected] phone +381 11 2027801, cell +38164 1412527
Abstract Semantics of spectroscopy of biological signals and criteria of semantic stability are the initial issues in this article. Motivated with some semantic confusion related to our cooperation and elsewhere, we are investigating the circumstances in which spectroscopic features have direct meaning and when that is questioned. Two problems arise immediately: what are additional ways in signal analysis through spectroscopy and generalizations and how can we learn more on the processes investigated. Our aim is to enrich the available methods and tools providing researchers with additional ways in detailed analysis of biological signal spectra and help to overcome some of difficulties. We show some of our work in signal spectroscopy, aiming to signal forensics and to uncover more details in the investigated signals, discuss invariants of involved operators, addressing the WYSIWYG - “what you see is what you get” method property. Ziggurat like structures of spectral features, parallel multiple resolution spectroscopy, application of image processing tools on spectral features and second order spectroscopy take place in the investigation of fine spectrogram feature details. Automatized feature detection and comparisons techniques, are used. These set of procedures represent our improvements and contribution to this important method for analysis of biological signals, illustrated on the examples from our practice, processed with our implementations. Keywords: Spectrogram features; Signal forensics; WYSIWIG in spectroscopy; BCI - Brain Computer Interface;
Introduction
Fourier spectroscopy is extensively used in all biomedical signal analysis, hardly rivaled whenever there are periodic components in the signals. We were involved in a variety of neurological, cardiologic, other electrophysiological and bio-acoustic applications. Most often we can find FFT or a power spectrum which posses some accented features that correspond to the investigated phenomena important or most important attributes. In such circumstances, Fourier spectra are taken as mathematical representations which characterize certain important states and the spectral patterns are accepted as important mathematical invariants related to the investigated system behavior. Within each field of research, the standards for Fourier spectroscopy are usually well established, with precise recommendations for all related important parameters. We would like to stress the importance of spectral stability and semantic stability of applied method. For spectra that substantially change quickly in time we need increased attention when we choose individual spectrum as a system representation. We need to know about the spectral stability over time before we can correspond any meaning to it. There are ways to provide spectral stability in time. The straight way is to control and reduce the investigated system dynamics and reach close to stationary states. Then we can have spectra which could represent the system state very well.

63
This is often present in experimental practice. However, there are phenomena and systems whose dynamics resist such simplifications, or we loose the substance following such a way. Then, individual Fourier spectra might be insufficient and omitting essential insight into the investigated phenomena.
Fortunately, in a number of those situations, time Fourier spectroscopy, i.e. time continuous spectrograms might still do extremely well, or be used for subsequent calculations of corrected spectrograms. Some examples of such scenario take place in applications in cardiology and neurology, speech recognition and other acoustic and neuro acoustic research.
Since early 90’s our attention was focused on the investigation of rather complex contents in the spectra of EEG recordings of the externally sensed music, the inner-imagined music and inner (imagined) tones [Jovanović, 1997, 1998, 2001, 2006]. We have been developing methods and tools for pattern classification and recognition of the EEG with inner tones, aiming to brain computer interfaces (BCI) based on inner music. In these efforts continuous time Fourier spectroscopy was and remained our best available tool. The basic reason is that it offers insight into essential details and relations.
Using some of our implementations of spectroscopy in different areas [Jovanović, 1997; Japundžić- Žigon, 2001; Japundžić- Žigon et al., 2004], we present situations in signal spectroscopy with stable and unstable semantics, which might diverge semantically, and would try to show what might be unnoticed or invisible in our representations. We suggest how to overcome some potential difficulties, with method details, which would involve parallel multiple resolution FFT, corrected and higher order spectroscopy, visual processing combined with signal processing tools on the examples of spectrogram features analysis. In the Case study section this is shown in significant details on the examples of signals from the survival experiments which should be of serious interest for further investigations. The ideas and procedures presented have a broader applicability in diverse experimentation with biological signals. Our implementations and signals from presented experiments are available at our web site www.matf.bg.ac.yu/~aljosha. Method
Some of researchers in biomedical signal analysis, following recommendations of accepted standards, reach conclusions that might be displaced from what was really going on in their experiments, even seriously lacking the possibly better insight. Not uncommon in our practice was that a signal component with dominant amplitude corresponds to some of subdominant spectral lines, due to some simple reason. Thus, after regular application of mathematics, the smaller became bigger. It was hard to maintain the confidence in Mathematics after such events. The semantic stability of Fourier spectroscopy method is based on intuition - the fact that it provides straight insight into details in the investigated experimental signals and this is responsible for its broad application. The method is WYSIWYG, even in real time and the provided insight presents details in their realistic relationships. Obviously, researchers using it are aware of well known uncertainty relations, some parts of which sometimes vanish in higher sampling frequency. We present some examples, Figures 1 and 2, with acoustic registrations and real time analysis, which are simple enough to be understood straightforward, yet complex enough to reflect interesting moments which we discuss later on in other useful method application.

64
Figure1. Song of Balena: spectrogram of a complete recording. Boxed - characteristic melodious pattern expanded.
Figure 2. Acoustic recordings. Left: d2e2c2c1g1, played on a simple organ; right: entrance of BACH theme in the contrapunctus 18 in Kunst Der Fuge - KDF, played on church organ with reach stops disposition.
The complexity of musical contents will not be reduced if it is used as brain stimulation in EEG registrations. Generally, musical contents in brain signals should have such appearance, plus some extra activity, both in the case of externally sensed and internally imagined music. Individual imagined - inner tones, the atoms of the inner music, result in rather complex spectra and spectrograms. However, the spectral neighborhoods of the frequencies involved in the inner tones are often simple enough, which makes detection possible. Examples of locally separable inner tones are given in the Figure 3.

65
Figure 3. Spectrograms of EEG signals with simple inner tones. The individual constant tones were imagined and detected at their positions in synchronous spectrograms of EEG signals. Left: a formation of inner tones; right: inner tone c2, on the composite spectrograms.
First, we will discuss very simple experiments, as shown on the Figure 4. The simplest case is when we have a simple single periodic component in the signal, i.e. a pulse with constant amplitude and frequency. Similarly simple might be the trigonometric polynomial with the same sort of unchangeable components, which are well separated, so that any numeric interference is negligible. Let us imagine the following sequence of events, related to the uniform propagation of the FFT window along the signal. The simple periodic component is entering the FFT window - its amplitude in the spectrogram is small; then the periodic component is scrolling through the FFT window - its amplitude in the power spectrum increases; then the periodic component is all inside the FFT window - when its amplitude in power spectrum reaches maximum, remaining constant while the periodic component is moving towards the FFT window tail; then the spectral amplitude is decreasing when the periodic component starts leaking out of the FFT window, and vanishes when it is all out. The profile of the spectral line corresponding to such periodic component, in simplest case has a trapezium or a mounted trapeziums – ziggurat shaped tower. Periodic components with the time-length greater than or equal to the FFT window time length are presented in the spectrogram with the realistic amplitude maximum. However, periodic components lasting shorter than the FFT window length (or those with some energy dispersion) are shown with their intensity in the spectrogram reduced proportionally to the ratio the periodic signal-time-base/FFT-window-length. Consequently, our method is partly WYSIWYG in real time and partly not, with some components shown realistically and some with the reduced intensity (an example is given in the Figure 5). In the complex spectrograms, this becomes hardly visible or even invisible and this can cause problems.
Figure 4. EEG recording of externally played simple melody. Left: the dafd theme (Kunst Der Fuge – KDF) entrance; middle: Overlapping tones and a harmonic with two spectral line profiles: ziggurat transit/overlap tone d; right: ziggurat shaped spectral line profile: the simple periodic component, entering FFT window, feeling in – the amplitude
66
increasing, constant when the whole periodic pulse is within the FFT window, decreasing when it starts leaking out of the FFT window, with short constant amplitude step – entrance of the shorter same sort of pulse, finally, vanishing out.
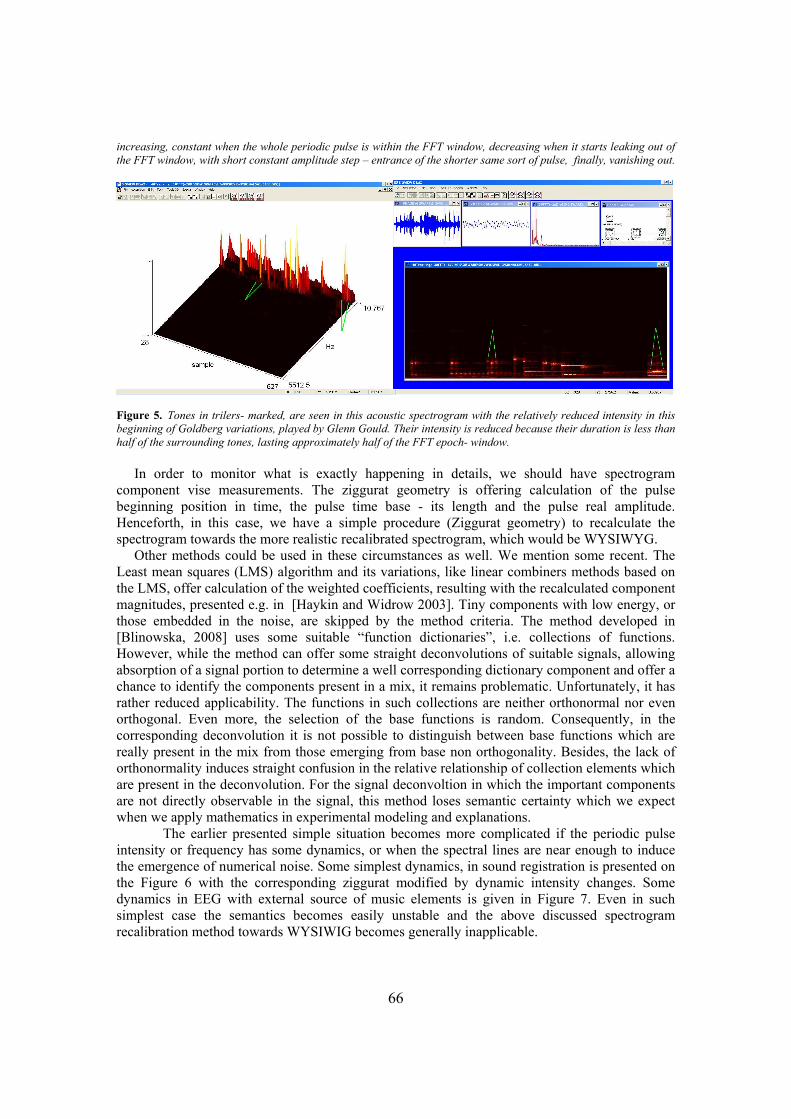
Figure 5. Tones in trilers- marked, are seen in this acoustic spectrogram with the relatively reduced intensity in this beginning of Goldberg variations, played by Glenn Gould. Their intensity is reduced because their duration is less than half of the surrounding tones, lasting approximately half of the FFT epoch- window. In order to monitor what is exactly happening in details, we should have spectrogram component vise measurements. The ziggurat geometry is offering calculation of the pulse beginning position in time, the pulse time base - its length and the pulse real amplitude. Henceforth, in this case, we have a simple procedure (Ziggurat geometry) to recalculate the spectrogram towards the more realistic recalibrated spectrogram, which would be WYSIWYG. Other methods could be used in these circumstances as well. We mention some recent. The Least mean squares (LMS) algorithm and its variations, like linear combiners methods based on the LMS, offer calculation of the weighted coefficients, resulting with the recalculated component magnitudes, presented e.g. in [Haykin and Widrow 2003]. Tiny components with low energy, or those embedded in the noise, are skipped by the method criteria. The method developed in [Blinowska, 2008] uses some suitable “function dictionaries”, i.e. collections of functions. However, while the method can offer some straight deconvolutions of suitable signals, allowing absorption of a signal portion to determine a well corresponding dictionary component and offer a chance to identify the components present in a mix, it remains problematic. Unfortunately, it has rather reduced applicability. The functions in such collections are neither orthonormal nor even orthogonal. Even more, the selection of the base functions is random. Consequently, in the corresponding deconvolution it is not possible to distinguish between base functions which are really present in the mix from those emerging from base non orthogonality. Besides, the lack of orthonormality induces straight confusion in the relative relationship of collection elements which are present in the deconvolution. For the signal deconvoltion in which the important components are not directly observable in the signal, this method loses semantic certainty which we expect when we apply mathematics in experimental modeling and explanations.
The earlier presented simple situation becomes more complicated if the periodic pulse intensity or frequency has some dynamics, or when the spectral lines are near enough to induce the emergence of numerical noise. Some simplest dynamics, in sound registration is presented on the Figure 6 with the corresponding ziggurat modified by dynamic intensity changes. Some dynamics in EEG with external source of music elements is given in Figure 7. Even in such simplest case the semantics becomes easily unstable and the above discussed spectrogram recalibration method towards WYSIWIG becomes generally inapplicable.

67
Figure 6. A recorded tone with dynamic intensity. Ziggurat modified by dynamic intensity changes, visible 50Hz modulation.
Figure 7. Some less simple dynamics - EEG recording of stimulation: CG interval – played externally on simple organ; almost constant c2 and regularly modulated tone g2 exhibiting approximately the 2.4 Hz rhythmic intensity changes. These lines are rather broad: c2 line has a 15Hz broad dispersion, the g2 is somewhat sharper.
There is often some incongruence of semantics in mathematics and reality, with significant divergence, caused by even simple parameter magnitudes or their changes, like spectral resolution, epoch scrolling length, sampling rate. Obviously, it is necessary to determine and understand invariants of the operators involved in our work because they shape our understanding and our explanations of reality.
Even our basic concepts, like the definition of a spectral line, have displaced meanings from mathematics to the experimental reality demands, which are more functional. The spectral line in a signal x, corresponds to a coefficient in the Fourier development of the element x in a Hilbert space X,
iIi
i xxx
ˆ
where coefficients ,),,(ˆ Iixxx ii are projections to the orthonormal base vectors ix in the
base set B, obtained as inner products, which are always scalars, hence constants. Let us mention a typical mechanical example. Take a binary star, with one more massive and other spinning around it. Consider certain line in the stellar spectrum of the smaller star. As the star is spinning around the other, the spectral line will be continuously shifted towards red or violet, while the star is receding or approaching the observer, making a periodic pattern due to the Doppler effect. The spectral line dynamics is related to stellar dynamics, helping to determine basic characteristics of such system: velocity vectors, masses and distances involved. Classification of stellar spectra preceded inventory of stellar types, followed by theory of stellar evolution. We

68
have similar examples in acoustics and in electronic systems - periodic movement of a frequency line related to some feed back control circuitry or a subsystem activity. In both examples the spectral line is moving, it’s meaning drifting away of the initial mathematical concept.
The Fourier analysis established profound understanding of behavior of functions and their representations and assisted better organization of important issues and interesting problems solutions. Yet, some simple dynamic issues remain partly or seriously inaccessible for this kind of treatment. Inner products are constants and it is rather hard to keep the rest of the theory gain, while allowing them to float in time and become time functions )(ˆ txi . Moreover, switching the
sequence of sets of basis functions B becomes desirable in some cases. Besides variety of efforts, there is no harmonic theory satisfactorily applicable even to the examples with minimum complexity. That means the problems of modeling in practice will rely on the method tuning, mix, iterations and approximations. Lacking a nicely completed theory, we will proceed with some pragmatic steps, which we illustrate with simple signal forensics.
We need a good bond of Mathematics with reality. The fuzzy concepts like spectral features - formations, like c2, g2 in the previous example, are often useful in reality. While all could be rather easy in stationary states, even elementary dynamics can involve serious complications. We will discuss spectral features/formations, or more preciously, spectrogram features and formations. They could be defined as “organized spectral contents in time/frequency/intensity”, or as compact continuous 3D manifolds (with rather simple border) or, somewhat more generally, as non-random (i.e. geometric) spectrogram structures. Hence, non-random vs. random could be taken as a general experimentally acceptable criterion. This is applicable for the phenomena distinguished from the noise. For those that are embedded in the surrounding noise, there still might be a good chance for the filtering out, using more refined techniques. Even random looking dot clouds might contain substantial information on causality. We need these concepts precised, since they are used in algorithms e.g. for pattern recognition and classification. Similar processes might have similar footprints. In this way, feature comparison can provide information on the processes involved, bring unknown close to the well known process, or assist in grouping/clustering semantically apparently diverse and not related phenomena. In order to have comparisons meaningful, spectrogram features need to be treated by certain normalization procedures which are context sensitive and dependent.
A case study - example of feature forensics with death announcement
For the illustration of feature analysis we use here examples from neuro cardiology, the spectra of blood pressure (BP) signals with the controls in the central (CNS) and autonomous nervous systems (ANS). Researchers there are investigating the circuitry, links, cuts, bridges, inhibitors and stimulators in the BP controls, involving neuroactive substances related to the pituitary gland and hypothalamus [Zigon, 2001]. Examples of BP signal spectrograms are given in the Fiure 8.

69
Figure 8. Actions on the system/components result in spectral modifications. Examples of spectrograms of BP signals. Left: a BP spectrogram with a deficiency – omitted a HF spectral line. Right: dramatic changes in the BP spectrograms after administration of Fisostigmine. Then the reverse exercise remains: given spectrogram transitions, the question how to determine which system action is responsible for it would lead to the mathematical characterization of the process.
The standardized procedure in this field of research is focused on the states altered by pharmacologic substances but is avoiding serious dynamics - alterations and includes animal preparation, standard administration of selected pharmacology, aiming at certain selected functional assembly - system, BP signal registration with standardized sampling rate during short period of time, i.e. 5 - 8 minutes, preferably in as stationary conditions as possible, with the numeric post processing and analysis, with the higher resolution spectra - 2k, earlier with one spectrum, recently involving time spectroscopy - spectrograms.
Opposite to this controlled experimentation, the longer lasting experiments, with some inner dynamics might be desirable for the investigation of “phase transitions” in the system behavior. From our cooperation we were awarded with BP recordings of very long experiments, lasting one hour and more. These were signals from a sequence of survival experiments with 1/3 blood volume hemorrhaged rats. We will show two such interesting experiments, Figure 9 and later, applying multiple resolution FFT, some tools we use in image processing, spectroscopy on spectral features and detailed pattern analysis and matching.
Figure 9. Standardized Spectrograms, with 2k resolution – 90 minutes time power spectra of signals of arterial pressure of two animals exposed to 1/3 of blood volume hemorrhage. Left: animal 1, Longliving - received fisostigmine which is survival supportive in heavy hemorrhage. Right: animal 2, Shortliving – did not receive anything;
The first spectrogram shown on Figure 9 is regular as usually, while the second is rather different and quite irregular. Now we have simple questions: Is there anything important about the two spectrograms? Do the two spectrograms have anything in common? What is characterizing their difference and what is characterized by their difference? Some information on the presence of very low frequencies - VLF is shown in Figure 10.

70
Figure 10. High resolution spectroscopy provides some information in the ultra low band, pointing to the presence of sub 1 mHz rhythm in both animals, noticeable in both spectrograms; it is less informative in HF, as seen on the third spectrogram. The analysis of BP-signal spectrogram details of animal-2 in the low frequency band and in the higher frequency band is shown in Figure 11, in the high frequency (HF), rather irregular feature and in the low frequency very regular twin ziggurat structure, with the duration of approximately 30 minutes.
Figure 11. Analysis of spectrograms of animal-2. Left spectrogram: morphology of the HF structure-feature. Right: nice ziggurat formation in LF – 0.3Hz
When we reduce FFT resolution in the power spectrogram of animal-1 (we increase the spectral resolution), a periodic pattern with very low frequency, invisible earlier, emerges in the HF. Reducing the FFT resolution further, another micro sub-pattern is popping up, both seen well on Figure 12.
Figure 12. Analysis of spectrogram of animal-1. Reduced FFT resolution shows a slow periodic pattern. Further reducing FFT resolution reveals more information on the HF feature - the slow pulsing micro structure.
In this way, we obtain richer information on the process by tuning FFT resolution (easily parallel). If we perform the similar operations with the spectrograms of the animal-2 and by tuning the global relative intensity, we can learn more on the HF feature which was earlier quite irregular. We notice that it turns on in the time when the low frequency (LF) ziggurat turns off, some 15 minutes before the end of the experiment recording. The synchronization of the two

71
processes is evident. Moreover, the HF feature is tilted – with the decreasing frequency, exhibiting a kind of a tilted periodic pattern, as seen on the Figure 13. This pattern emerges as a condensation of a sort of random dot cloud preceding it, which is very interesting per se.
Figure 13. Analysis of spectrograms of animal-2. Reduced FFT resolution with tuning of global intensity reveals more information on the HF feature( top): Final pattern emerges out of a random dot cloud, switching on after LF ziggurat pattern (lower) is switched off; it is decreasing in frequency, with a slow periodic pattern modulation.
We will get further information with a combined approach, using both signal and spectrogram processing operations and analysis tools. Proceeding with our signal forensics, we will localize the HF features in both animals’ spectrograms, extract them, analyze their “photometric” morphology, inspect the feature photo morphology sections characteristic features - invariants and reach the basis for comparative analysis, rather far from where we began.
Figure 14. Left: Localization and tracing, then extraction of spectral features in both animals’ spectrograms. Right: the extraction of smaller - embedded parts of those features.
In Figure 14 we have illustrated the results of alignment and extraction of the larger portions of these features, containing longer HF periodic pattern of animal-1 spectrogram and the whole HF irregular structure of animal-2 spectrogram. Subsequently, the same operations were performed on the fragments of these two features which both consist of seemingly periodic patterns, shown together with their “photometric” distributions.

72
Figure 15. Morphology of spectral features – smaller parts with the periodic patterns; feature profiles, their longitudinal sections, the (second order) spectra of the longitudinal sections - well matching in the dominant lines.
In the Figure 15 we have the extracted short fragments of the features from the spectrograms of both animals, presented in their “photo” morphology representations, with the characteristic longitudinal feature fragment sections and their power spectra, these are the second order spectra, with marked dominant spectral lines, which are at practically identical positions, demonstrating that the two spectrogram feature patterns have the same periodicity. This is consistent with the lower presented visual inspection and subsequent shape analysis and pattern matching. The section shapes show that the micro patterns are very similar in both structures. Apparently different, these two features have essential characteristics practically identical. This implies that the processes corresponding to these two features are of the same kind or identical.
Pattern alignment and comparison results are presented on the Figure 16. Longer pattern half-period, the bow like structures are present in the both animal observed spectrogram features and are practically identical. Embedded micro patterns periods are the same too, both pointing to ~1mHz and 6mHz rhythms, corresponding to the investigated features very slow changes; both patterns are well matching. Inspection of pattern shapes, with photo geodesy and photo morphology rectifying extracted bow like patterns, establishes approximately the same length and same curve length, similar granularity - micro pattern structure.
Figure 16. Pattern comparison. Both longer patterns exhibit the presence of the bow like structure, of the same length. In the animal-1 spectrogram it is periodically repeated. In the animal-2, the tilted feature, it is present at the tail, but in the feature central part too, as a more fuzzy structure. Its photo geodesic sections reveal the same kind of identified bow like structure. The embedded micro patterns show quite the same period length, corresponding to the basic bow structure rhythm multiple frequency, thus both miliHertz patterns, ~1 mHz and the 6 mHz are well matching.

73
Figure 17. Extracted bow like patterns in both features are rectified tracing their curvature first, and as such they exhibit practically the same length, corresponding to the original same bow curve length and curvature radius.
The longliving animal-1, which was administrated by fisostigmine, survived the experiment. Its BP spectrogram was like normal. The Ultra slow ~1mHz pulsing and the small-embedded pattern rhythm ~ 6mHz should be very interesting. These properties of both features point to some negative feed back controls and they have to be the expression of the same control system in CNS/ANS. The shortliving, animal-2 died at the end of the experiment. Its BP spectrogram revealed something like the synchronization and switching of control actions last twenty minutes of its life, pointing to some CNS control activity, with the final pattern morphology very similar to the longliving animal. Do we have here a sort of early death announcement? A Signature? Originating where? Probably, extended experimentation including polygraphy of both BP and CNS would provide deeper knowledge with more precise conclusions. Discussion and conclusions
Semantics of a variety of biological signals Fourier spectra and spectrograms is investigated. It is WYSIWYG in some circumstances with straight semantics, which is of crucial importance for the insight into the investigated processes, (but it is not always WYSIWIG). Spectral features have accented importance. In simple cases recalibrations of spectrograms are available. Elsewhere, even with some of these issues unresolved, we rely more on the signal forensics.
As shown partly here, the spectrogram or time spectroscopic feature forensics might include all familiar feature structurality and structural similarity, properties of feature micro fabric tissue, granularity, periodicity, morphology, spectra, histogram tuning and filtering, digital and Euclidian distance and length, scalar characteristics, measures of randomness, thresholding, operations on fuzzy structures, non-linear measures, other signal and image processing tools. We implemented methods for automatized feature localization, contour definition, orientation, extraction, normalization and matching/classification which are based on flexible criteria. Beside the problems here illustrated and discussed, they have applications in signal and image processing. Further automatization and integration of these methods could support variety of improvements in different applications, including adaptive and learning systems, and situations where massive data analysis is needed. There are important examples of signal analysis and classification, like one in the case study, which resist, more or less the complete automatization. There are other important issues where the automatization is simpler, like e.g. the examples from Figure 2. Generally, the basic criterion seems to be the level of randomness in the spectroscopic feature structures. Those more compact are easier for localization and separation from their spectral neiborghood. We are

74
involved in and developing the here treated methods of signal forensics and implementations, because of their potential in the neuroacoustic research too, including music perception problems and inner music based BCI, which is emerging from different sources [Jovanovic, 1995, 1997; Klonowski et al., 2009; Grierson, 2008]. Shortly back to the examples in Figure 7 of EEG spectrograms with simple external music stimulation. Application of the signal forensics of the kind as above provides more information on the feature shapes, periodicity-modulations, frequencies present in these and other brain signals containing sequences of tones, including those unstable in frequency and intensity. This kind of processing is needed automatized in the music based BCI. Once EEG signals containing music of external or imagined origin – inner music are filtered of other phenomena not corresponding to the played/imagined tones, we have the recognition well prepared and our developed feature extractor, providing automatic feature detection, contour definition, extraction and feature classification is the key module for the inner music based BCI. More on the success in BCI is available in [Babiloni et al., 2007; Cincotti et al., 2002; Kruger et al., 2006; Watkins et al., 2006]. We are investigating applicability of traditional linear and nonlinear methods in some of the current problems such as brain injury [Spasić et al., 2005, 2008], monitoring the depth of anaesthesia [Klonowski et al., 2006] and other applications in biomedicine [Klonowski, 2007]. In cases of less pronounced features or their absence the nonlinear analysis is providing additional insights. Acknowledgements We are grateful to our support team leading Nenad Andonovski, Maja Jovanović, Group for Intelligent Systems, School of Mathematics and professor Nina Zigon, from Institute for pharmacology and toxicology, School of Medicine, University of Belgrade, for the BP experimental recordings. This work was supported by Serbian Ministry of Science and Technological Development (Projects No. 143XXX, No.143027). References Babiloni F, Cincotti F, Marciani M, Salinari S, Astolfi L, Tocci A, Aloise F, De Vico Fallani F, Bufalari S, Mattia D. The estimation of cortical activity for brain-computer interface: applications in a domotic context. Computational Intelligence and Neuroscience, Volume 2007, Article ID 91651, 7 pages, 2007; doi:10.1155/2007/91651.
Blinowska K. Methods for localization of time-frequency specific activity and estimation of information transfer in brain, International Journal of Bioelectromagnetism, 2008, Vol.10, No. 1, pp 2-16 www.ijbem.org
Cincotti, F., Mattia, D., Babiloni, C., Carducci, F., Bianchi, L., del, R.M., Mourino, J., Salinari, S., Marciani, M.G., Babiloni, F. Classification of EEG mental patterns by using two scalp electrodes and Mahalanobis distance-based classifiers. Method of Information in Medicine, 41(4): 337-341, 2002.
Grierson M, Composing With Brainwaves: Minimal Trial P300b Recognition as an Indication of Subjective Preference for the Control of a Musical Instrument, Submitted to the ICMC 2008
Haykin S, Widrow B. (Editor) Least-Mean-Square Adaptive Filters, Wiley, 2003, ISBN 0-471-21570-8 Japundžić- Žigon N. Effects of Nonpeptide V1a and V2 Antagonists on Blood Pressure Fast Oscillations in Conscious Rats, Clinical and Experimental Hypertension, 23(4), 2001. Japundžić-Žigon N, Milutinović S, Jovanović A. Effects of Nonpeptide and Selective V1 and V2 Antagonists on Blood Pressure Short-Term variability in Spontaneously Hypertensive Rats, Journal of Pharmacological Sciences 95, 47-55 (2004) .
Jovanovic A. Inner music, report on the conference Mathematics and other sciences, Greek Math Soc. Crete, 1995.
Jovanovic A. CD-ROM: CCD microscopy, image & signal processing, School of Mathematics, Univ. of Belgrade, 1997
Jovanovic A. Brain signals in computer interface, (Russian: Kompjuterni interfeis s ispolzovaniem elektronnih signalov mozga), Intelektualnie Sistemi, 3(1-2): 109-117, 1998, (Lomonosov, Russ. Ac. of Sc.)
Jovanovic A. Research in the Group for intelligent systems at Belgrade University, problems and results (Russian: Isledovania v oblasti intelektualnih system v Belgradskom Universitete, problemi i rezultati), Intelektualnie Sistemi 6(1-4): 163-182, 2001, (Lomonosov, Russ. Ac. of Sc.)
Jovanovic A, Jovanovic M, Perovic A, Maric M. A System for neural acoustics analysis. In proceedings of the 4th Annual Serbian – Hungarian joint symposium on Intelligent Systems, SISY 2006, 275-283.
Jovanovic A, Perovic A. Brain computer interfaces, some technical remarks, International journal for bioelectromagnetism, 9(3): 91-102, 2007. www.ijbem.org.

75
Klonowski W., Olejaczyk E., Stepien R., Jalowiecki P., Rudner R. Monitoring the Depth of Anaesthesia using Fractal Complexity Method. In: Complexus Mundi, Emergent Patterns in Nature, (Ed. M. M. Novak.), World Scientific, pp. 333-342, 2006.
Klonowski W. From conformons to human brains: an informal overview of nonlinear dynamics and its applications in biomedicine, Nonlinear Biomedical Physics, 1, 5 , 2007, BioMed Central, London,
Klonowski W, Duch W, Perovic A, Jovanovic A. Some computational aspects of the Brain Computer Interfaces based on Inner Music, to appear in Computational Intelligence and neuroscience, Vol. 2009, Article ID 950403, 9 pages, doi:10.1155/2009/950403 Kroger JK, Elliott L, Wong TN, Lakey J, Dang H, George J. Detecting mental commands in high-frequency EEG: faster brain-machine interfaces. In proceedings of the 2006 Biomedical Engineering Society Annual Meeting, Chicago, 2006. Spasić, S., Kalauzi, A., Ćulić, M., Grbić, G., and Lj. Martać (2005). Fractal analysis of rat brain activity after injury. Med. Biol. Eng. Comput. 43:345-348.
Spasić, S., Ćulić, M., Grbić, G., Martać Lj., Sekulić, S, and D. Mutavdžić (2008). Spectral and fractal analysis of cerebellar activity after single and repeated brain injury. Bull. Math. Biol. 70(4):1235-1249
Watkins C, Kroger J, Kwong N, Elliott L, George J. Exploring high-frequency EEG as a faster medium of brain-machine communication. In Proceedings Institute of Biological Engineering 2006 Annual Meeting, Tucson, 2006.
Copyright © 2022 FDOKUMEN