Foraging range use by a colony of greater horseshoe bats Rhinolophus ferrumequinum in the Swiss...
25
PhD Fabio Bontadina (2002): Conservation Ecology in Horseshoe Bats 40 Foraging range use by a colony of greater horseshoe bats Rhinolophus ferrumequinum in the Swiss Alps: implications for landscape planning Fabio Bontadina a,b* , Sandra Gloor b , Therese Hotz b , Andres Beck c , Miriam Lutz d & Erich Mühlethaler d a Division of Conservation Biology – Zoological Institute, University of Bern, Baltzerstrasse 6, CH-3012 Bern, Switzerland. b SWILD - Urban Ecology & Wildlife Research, Wuhrstrasse 12, CH- 8003 Zürich, Switzerland. c Bahnhofstrasse 51b, CH-5430 Wettingen, Switzerland. d Muschnas, Encarden 51, CH-7152 Sagogn, Switzerland. Key words: population decline, conservation, space use, kernel esti- mation, critical season, management. * corresponding author: SWILD Urban Ecology & Wildlife Research, Wuhrstrasse 12, CH-8003 Zürich, Switzerland, [email protected], Fax 0041-1-450 68 09. (for submission to Biological Conservation)
-
Upload
independent -
Category
Documents
-
view
2 -
download
0
Transcript of Foraging range use by a colony of greater horseshoe bats Rhinolophus ferrumequinum in the Swiss...
PhD Fabio Bontadina (2002): Conservation Ecology in Horseshoe Bats 40
Foraging range use by a colony of greater
horseshoe bats Rhinolophus ferrumequinum in
the Swiss Alps:
implications for landscape planning
Fabio Bontadinaa,b*, Sandra Gloorb, Therese Hotzb, Andres Beckc,
Miriam Lutzd & Erich Mühlethalerd
a Division of Conservation Biology – Zoological Institute, University of
Bern, Baltzerstrasse 6, CH-3012 Bern, Switzerland.b SWILD - Urban Ecology & Wildlife Research, Wuhrstrasse 12, CH-
8003 Zürich, Switzerland.c Bahnhofstrasse 51b, CH-5430 Wettingen, Switzerland.d Muschnas, Encarden 51, CH-7152 Sagogn, Switzerland.
Key words: population decline, conservation, space use, kernel esti-
mation, critical season, management.
* corresponding author: SWILD Urban Ecology & Wildlife Research,
Wuhrstrasse 12, CH-8003 Zürich, Switzerland,
[email protected], Fax 0041-1-450 68 09.
(for submission to Biological Conservation)

PhD Fabio Bontadina (2002): Conservation Ecology in Horseshoe Bats 41
AbstractAbstract
After having suffered a dramatic population decline, the greater horse-
shoe bat has been classified as highly endangered in central and western
Europe. We studied seasonal foraging range use of one large colony by
radio-tracking so as to get founded arguments in the face of rising land
use conflicts.
The individual bats used largely overlapping foraging ranges: on average
10 bats exploited more than 80 % of the colony range estimated to be 6.7
(±0.34) km2. Altitude above sea level and distance to the roost explained
30.5 % of the variation in utilisation density. Core foraging areas en-
closed 74 % of the foraging activity of the bats within 30 % of colony
home range. Foraging distances were larger in spring, which is probably
the critical season for greater horseshoe bats.
We conclude that conservation of the colony must be given priority (1)
within distances of up to 4 km from the nursery roost, (2) especially
within core foraging areas; and we suggest that (3) management meas-
ures would be more effective if implemented near to the nursery colony
and would contain habitats used in spring, the season suspected to be
most critical.
PhD Fabio Bontadina (2002): Conservation Ecology in Horseshoe Bats 42
IntroductionIntroduction
In temperate regions female bats associate in large numbers during the
reproduction season to benefit from communal heating to raise their
young (Lyman 1970). In general, the availability of a suitable and safe
place for reproduction is a key resource (Begon et al. 1990). This is par-
ticularly true for bat colonies which choose their roosting places accord-
ing to complex microclimatic and structural requirements and often use
these locations in strict tradition over decades. Such roosts represent
therefore a limiting factor: all reproducing females of the colony join at a
unique place which determines the reproductive outcome of the year.
It is therefore not surprising that so far conservation measures for endan-
gered bat populations often have concentrated mostly on the protection
of the breeding roosts (Stutz & Haffner 1984, Beck & Schelbert 1999).
However, the importance of the foraging areas connected to these
maternity sites have often been neglected. The location of the roost
further constraints the females in their choice to find foraging areas with
abundant food. This is even more important in a maternity roost, as
pregnant or lactating females have to fulfil extraordinary energetic de-
mands (Speakman & Racey 1987, Ransome 1990).
In Switzerland we were challenged by a relict and isolated nursery
colony of the greater horseshoe bat Rhinolophus ferrumequinum
(Schreber, 1774). This originally cave dwelling bat tends, particularly in
the northern part of its range, to roost in buildings during the summer.
Females exhibit a strong philopatric behaviour and apparently reproduce
mostly in the same nursery colony where they were born themselves
(Ransome 1990). This may explain the observed traditional use of a
singular reproduction roost.
The greater horseshoe bat was once widely distributed through western,
central and southern Europe (Schober 1998). However it has suffered a
significant decline in the northern extent of its range during the second
half of the 20th century (Stebbings 1988, Ohlendorf 1996). Local popu-
lation declines and the loss of colonies are well documented for most
PhD Fabio Bontadina (2002): Conservation Ecology in Horseshoe Bats 43
countries north of the Alpine arch (Ohlendorf 1996). This dramatic de-
cline led to the persistence of small remnant colonies at the northern
border of the European distribution area, populations which are often
isolated from each other. The species is classified as in danger of ex-
tinction in most central European countries and listed in the EC Habitat
Directive (Ransome & Hutson 2000), which demands priority efforts in
the protection of roosts and habitat.
Although in Switzerland many colonies of greater horseshoe bats have
been documented once (Baumann 1949), today only three nursery roosts
are known (Beck & Schelbert 1999). Whereas two of the nursery colonies
are inhabited by only 10 and 50 bats, respectively, some 150 adult bats
reproduce in the third roost, which is situated in the attic of a church in
an isolated alpine valley. The latter, our study site, represents the largest
nursery colony of this species known in central Europe (Ohlendorf
1996).
Such remnant colonies are of special concern in conservation biology of
a species because they could be starting points for a later recolonisation
of abandoned area (Bellamy 1996, Bontadina et al. 2000) and represent a
last chance to understand the local species specific requirements (Carroll
1992).
The nursery roost was secured by a site agreement with local authorities
(Lutz & Mühlethaler 1996). However, in the direct surrounding of this
vulnerable reproduction roost a reorganisation of agricultural land use
and ownership was planned. This type of agricultural landscape planning
is known to reduce the area of natural habitats and it often negatively
affects their quality and biodiversity (Tanner & Zoller 1996, Vickery et
al. 2001). Therefore the urgent need for a conservation study of this
colony was given.
We investigated spatial requirements and resource exploitation of this
colony in order to recognise potential utilisation conflicts, to suggest
sound conservation recommendations going beyond roost protection,

PhD Fabio Bontadina (2002): Conservation Ecology in Horseshoe Bats 44
and to propose the implementation of conservation measures in the re-
organisation of future land use.
The detailed objectives of the study presented here, were 1) to designate
the perimeter of potential land use conflict, 2) to identify representative
core foraging areas and, 3) to examine whether spatial behaviour
provides evidence for seasonal resource limitation.
Colony and study areaColony and study area
The nursery colony roosted in the attic of the church in the centre of the
small village Castrisch, in the Upper Rhine Valley, Eastern Switzerland
(46°51.31’ N, 8°26.14’ E, 720 meters asl.). Counts of the number of
animals leaving the roost in the evening, carried out since 1984, revealed
constant colony size with a seasonal peak of about 150 emerging bats at
the beginning of July (Lutz & Mühlethaler, unpubl. data). With
“colony” we designate according to Gaisler (1963) all bats which consti-
tute a reproductive community connected to the nursery roost. Usually
only a small proportion of males join the summer group in the nursery
roost. Including the males, we therefore estimate the colony to number
about 200 individuals in total.
At the study site, annual precipitation is 950 mm, typical for an alpine-
continental climate, with hot summers and relatively long, cold winters.
The roost is situated in the river basin, 250 m from the Upper Rhine on a
system of former gravel terraces only slightly higher than the river. The
river valley rises on both sides steep up to 3000 m asl. There are several
brooks from the sides entering the main river, which contribute with
gorges and gravel deltas with treelines and bushes to a diversely
structured relief.
The ground of the valley is shaped by the river with well expanded
riparian vegetation. On the slopes predominate mixed broadleaf wood-
lands, whereas pine forests are less frequent. The productive ground in
the plain is covered by intensively managed agricultural fields mostly de-
voted to hey production and pastures. The villages have retained some of
the traditionally–managed orchards in their vicinity.

PhD Fabio Bontadina (2002): Conservation Ecology in Horseshoe Bats 45
MethodsMethods
The study was conducted in 1993, one year before the landscape plan-
ning was completed. In order to compare the foraging behaviour during
different seasons we studied the bats in the following three periods:
spring (from 1st May to 9 June), summer (from 1st July to 6 August) and
autumn (from 31st August to 12 October) corresponding to early preg-
nancy, lactation and post-lactation, respectively.
Radio-transmitters and tracking methods
To minimise the disturbance to the bats in the roost we caught the study
animals in mist nets along flight lines when they left the roost at dusk or
returned at dawn at eight different points between 10 and 500 m from the
church. The bats caught were held in bags before having biometric data
taken from them. Animals were sexed, the reproductive condition of the
females was assessed and the individuals were banded using the official
wing bands of the Museum of Geneva. Parous females were identified by
the presence of large pelvic nipples (Gaisler 1963, Ransome 1990) and
palpably pregnant animals were recorded. For the radio-tracking study
we only tagged females as they are more bound to the maternity roost.
Yet, in two cases males were radio-tracked. In order to study a repre-
sentative sample of the colony we did no selection in the bats caught for
tagging, except in that we omitted heavily gravid females for obvious
reasons. Four individuals were tracked in two different seasons. This was
due to the constraint by the limited colony size.
The bats were tagged with BD-2B transmitters from Holohil (Holohil
Systems Ltd, 112 John Cavanagh Rd., Ontario KOA 1LO, Canada,
www.holohil.com) with position sensors which allowed the discrimi-
nation between flying and hanging bats. The transmitters were attached
to the back of the bats between the scapulae, the fur was trimmed and the
tag was glued close to the skin using surgical cement (SkinBond, Smith
& Nephew United Inc., Largo, Florida, USA). The transmitter batteries
had a minimum lifespan between 10 to 21 days. We tracked the bats
using TRX-1000 (Wildlife Materials, Inc., 1031 Autumn Ridge Road,
Carbondale 62901, Illinois, USA, www.wildlifematerials.com) and
PhD Fabio Bontadina (2002): Conservation Ecology in Horseshoe Bats 46
modified YEASU FT-290 receivers (adapted by Karl Wagener, Tele-
metrie-Material, Herwarthstrasse 22, D-5000 Köln 1, Germany) with
hand-held H-aerials.
The location of the tagged bats were recorded in 15 minute intervals
(interval sampling, Altmann 1974) throughout the night by triangulating
the signal direction by two mobile persons. They co-ordinated their
simultaneous bearings using trigger signals from Casio DB-31 watches
and hand-held FM-radios were used to keep contact. If one person lost
contact with the bat, the other tried to homing-in on the animal (White
& Garrott, 1990). This was only possible with any reasonable accuracy
when the animal was foraging in a small area. We assigned locations to
one of three accuracy classes (50, 100 and 250 m) depending our confi-
dence in the estimated location. The highest accuracy class could only be
assigned when we were in close proximity to the bat, and using triangu-
lation. The accuracy of these classes was determined during a field test at
night with a transmitter being moved around in a foraging area by a
colleague. A test of the deviation of the estimated locations from exactly
known locations (location error method - Zimmermann & Powell, 1995)
gave a location error with standard deviation (SD) of +- 9.3 degrees with
the estimated locations bivariately normally distributed around the
“true” transmitter position. The locations of the estimated accuracy
classes of 50, 100 and 250 meters had their centre not significantly
different from the “true” centre, the standard deviations of the normally
distributed location errors were 44, 85 and 162 meters, respectively
(Bontadina & Naef-Daenzer, in press).
Time, location of observers, bearings of the bats, accuracy data and
general observations were recorded in the field on a dictaphone and later
transcribed onto data sheets. The positions of the bats in the field were
subsequently calculated from the bearings and their estimated location
digitised using a self–written program.
Habitat data, spatial calculations and statistical analysis
The studied bats used not exclusively the maternity roost but inhabited
occasionally other day roosts (unpubl. data). For a better comparability,
PhD Fabio Bontadina (2002): Conservation Ecology in Horseshoe Bats 47
the calculated flight line distances of the location do not always refer to
the maternity roost but to the day roost used the preceding day. Foraging
radius (= maximum distance) and median distance of locations (=
distance, which includes 50% of locations) were calculated for each bat
with all data of several nights. Bootstrap calculations for the colony
foraging area were computed using a self–adapted program written in
Turbo Pascal (Tufto et al. 1999). We investigated the influence of spatial
features by regression analysis (Norusis 1986). Linear regressions per-
formed better than exponential decay models. We used the geographical
variables DIST and ALTITUDE and five parameters which describe
land cover: BROADLEAF (amount of broadleaf woodland), CONIFER
(amount of conifer woodland), REST (other open land as bare, gravel),
GREEN (cover by meadows & pastures) and ARABLE (cover by arable
land) (Beck et al. 1994).
The spatial model was calculated based on all locations included in a 98
% minimum convex polygon (n = 1320) to ensure, that some unique
outliers do not inflate the foraging area. We defined individual core
foraging areas by the 50 % kernel contour lines.
Because of the seasonal stratified range use in bats the foraging ranges
we observed do not include all places relevant to a home range. We
therefore use the term activity ranges for the areas used by individual
bats during the relatively short study period of some days.
There is a problem to composite core foraging areas from several
individuals (Wray et al. 1992). We computed utilisation density by
kernel estimations (Worton 1989) according to the procedure described
in Naef-Daenzer (1994) and Bontadina & Naef-Daenzer (in press). In
order to weight all individuals equally, we calculated first a matrix of
utilisation density for every bat, than the matrices of all bats of a season
were combined and finally the matrices of the three seasons were joined.
We delimited core foraging areas of the colony by those 30 percent of the
total used area with the highest utilisation density of all radio-tracked
bats.
PhD Fabio Bontadina (2002): Conservation Ecology in Horseshoe Bats 48
ResultsResults
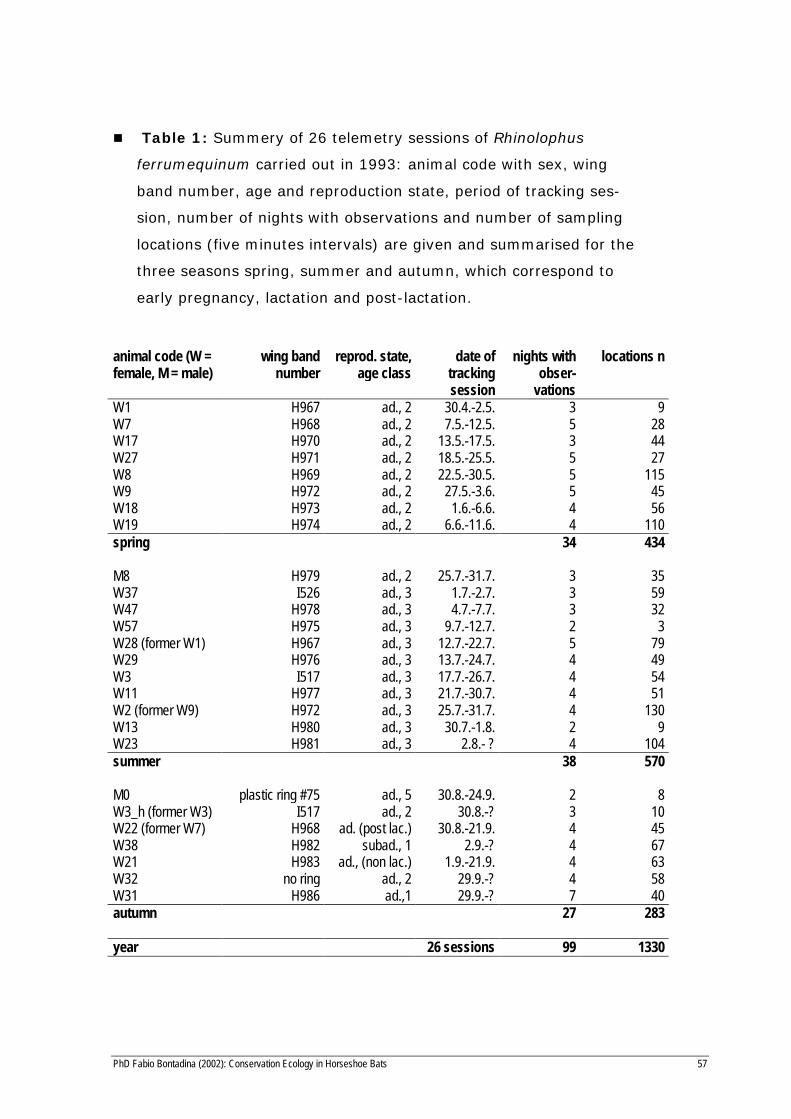
In 26 radio-tracking sessions we collected 1330 locations from 22
foraging greater horseshoe bats during 99 nights (Table 1). Data col-
lection per session lasted for 3.8 ± 1.2 (mean ± SD) nights. Four bats
were radio-tracked in two seasons. In one of these cases the foraging
ranges showed a minor overlap of 13%, in the other three cases no over-
lap at all, pointing to spatially seasonal foraging areas. For the spatial
analysis we therefore treated all tracking sessions as samples of inde-
pendent members of the colony. Accordingly we studied 8 bats in spring,
11 in summer and 7 in autumn.
[ Table 1 ]
Foraging areas
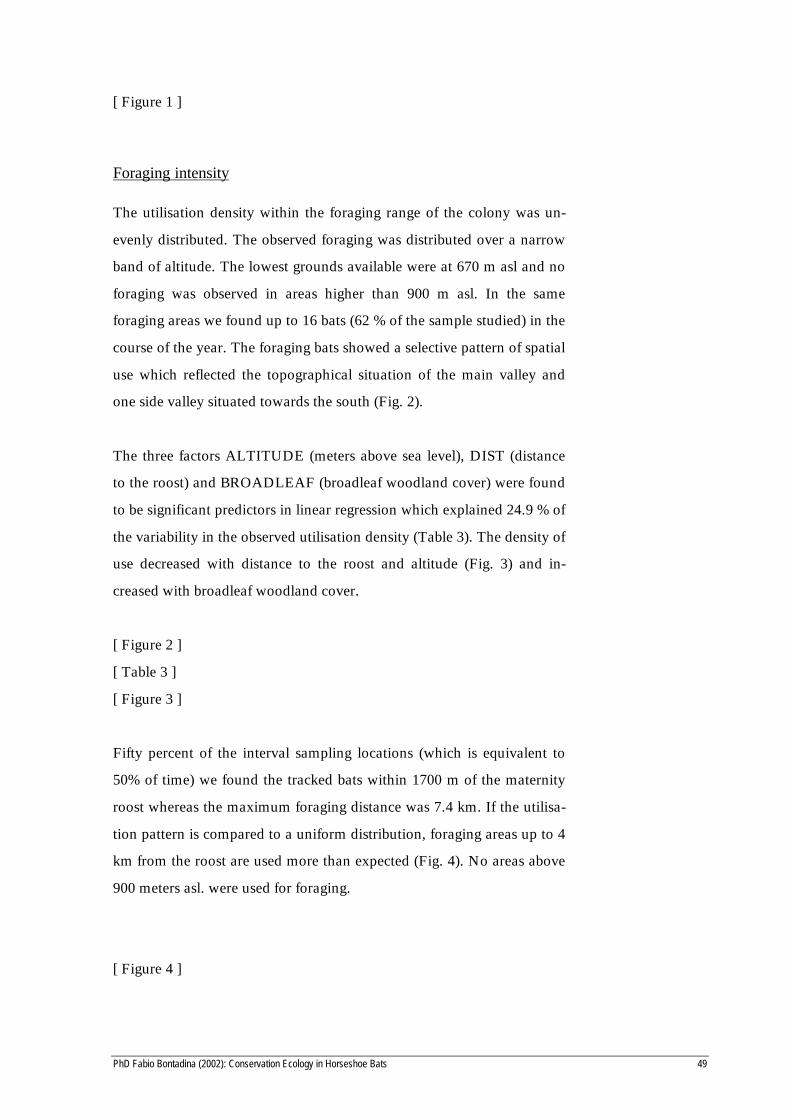
The bats foraged every night within large individual foraging areas.
Mean size of activity range, revealed by 90 % kernel density contour
lines, was 50.8 ± 30.3 ha (n = 26, range 21.9 - 162.8 ha, Table 2). The
overall range use by the colony was calculated by summing up all
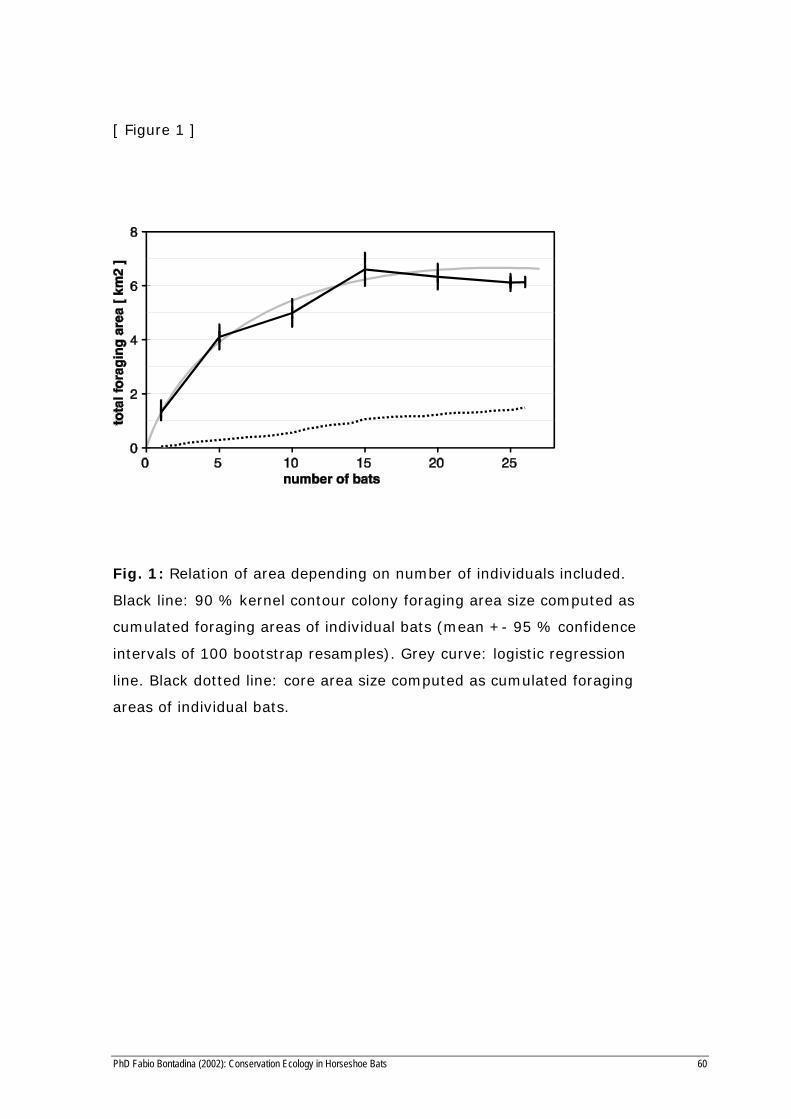
individual foraging areas. The recorded area increased progressively with
the number of bats studied. In order to estimate the total foraging range
of the colony we randomly added individual foraging ranges of radio-
tracked bats and calculated the cumulative foraging area (Fig. 2). This
was repeated for hundred calculations while the bats included were per-
muted (bootstrap sampling). The individual foraging ranges overlapped
to a large extent with each other: 10 bats used already more than 80 % of
the total recorded foraging area. The overall foraging range of all 26 bats
was 6.13 km2. The regression curve of the bootstrapped range data
approaches an asymptote at about 6.7 km2, but is nearly reached by the
locational data of about 15 bats from different seasons. The extrapolated
foraging range of the total colony lies with confidence of 95% between
6.4 and 7.0 km2.
PhD Fabio Bontadina (2002): Conservation Ecology in Horseshoe Bats 49
[ Figure 1 ]
Foraging intensity
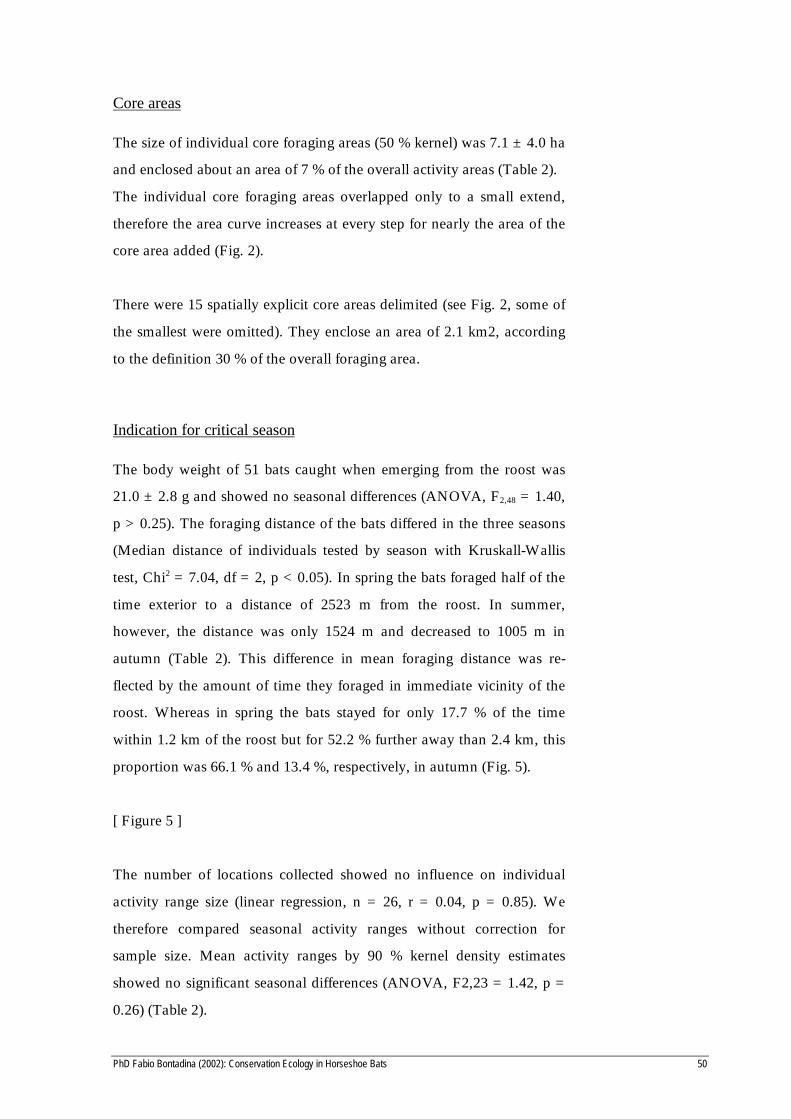
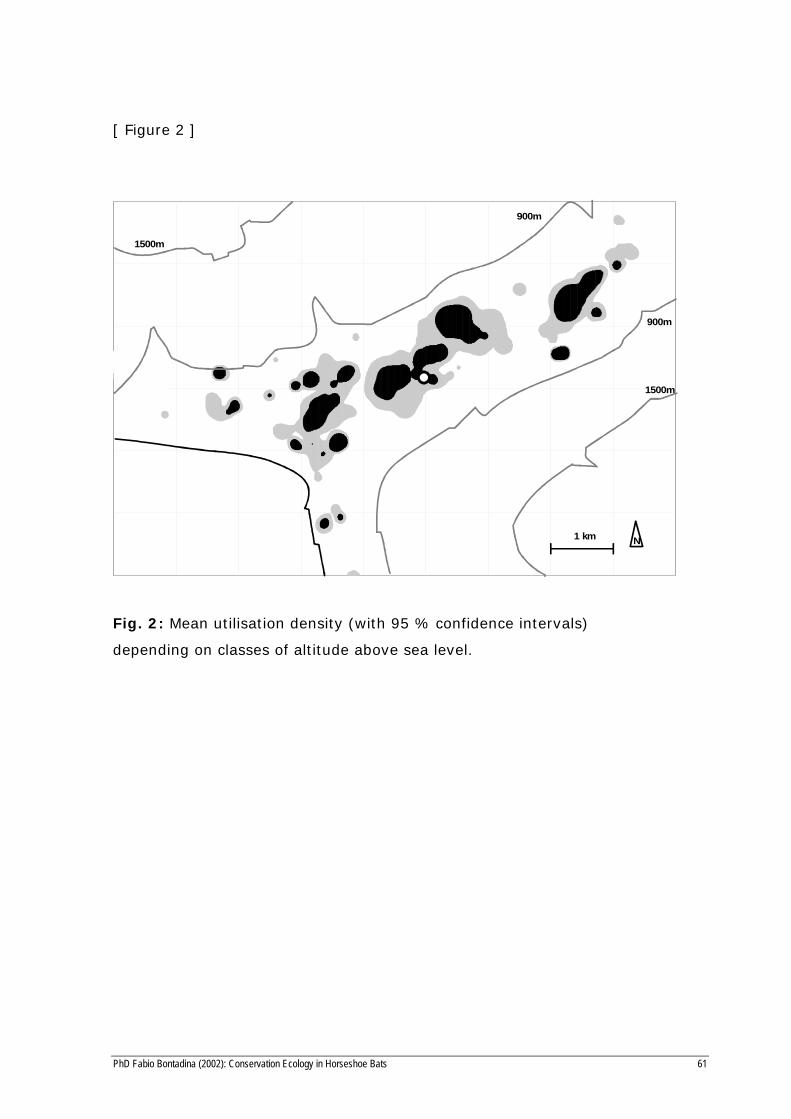
The utilisation density within the foraging range of the colony was un-
evenly distributed. The observed foraging was distributed over a narrow
band of altitude. The lowest grounds available were at 670 m asl and no
foraging was observed in areas higher than 900 m asl. In the same
foraging areas we found up to 16 bats (62 % of the sample studied) in the
course of the year. The foraging bats showed a selective pattern of spatial
use which reflected the topographical situation of the main valley and
one side valley situated towards the south (Fig. 2).
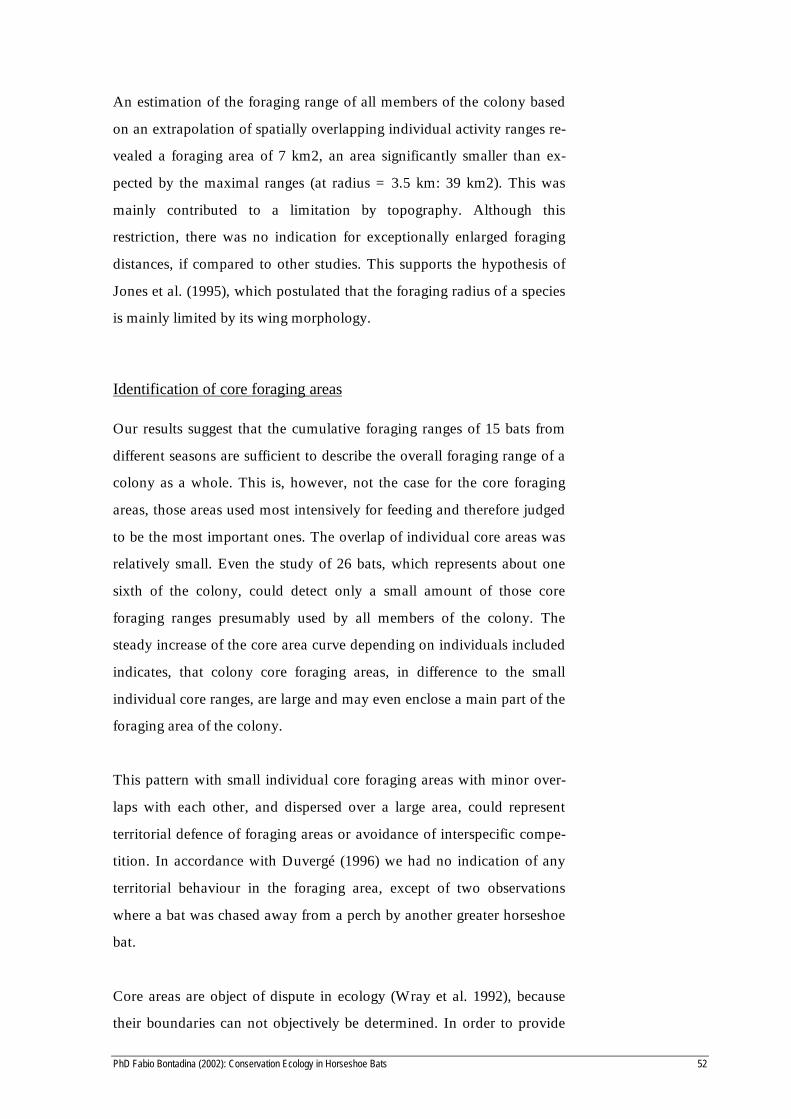
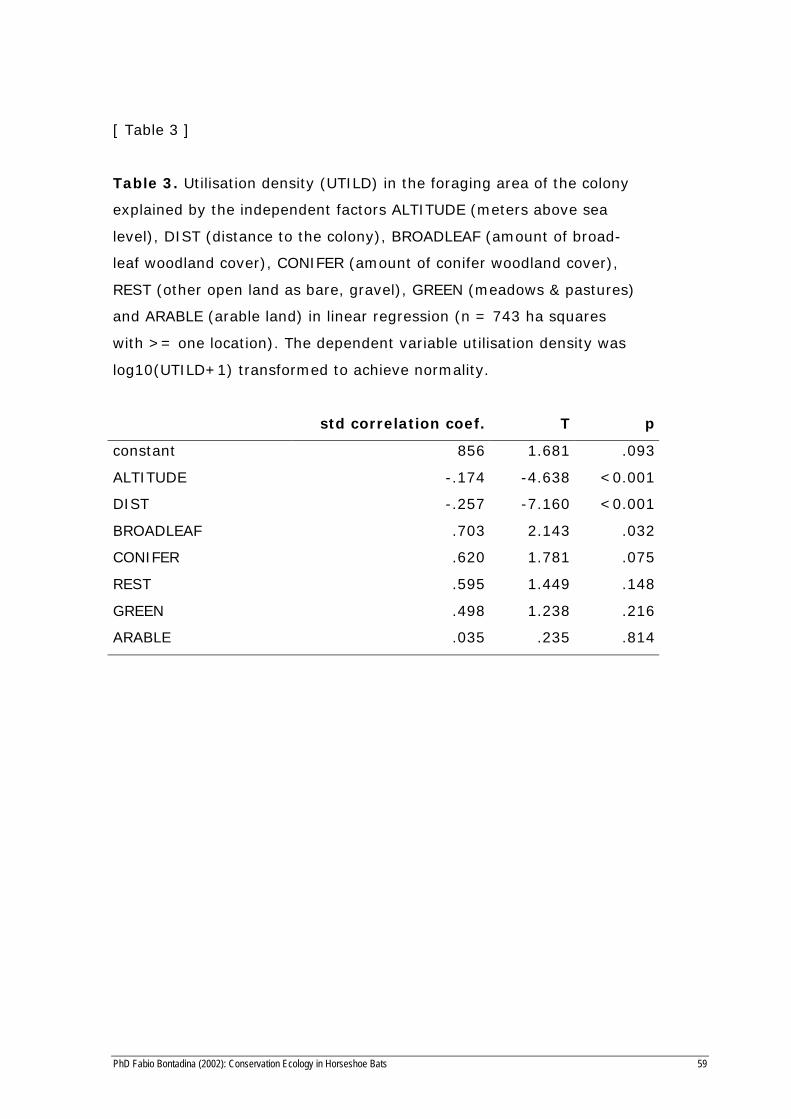
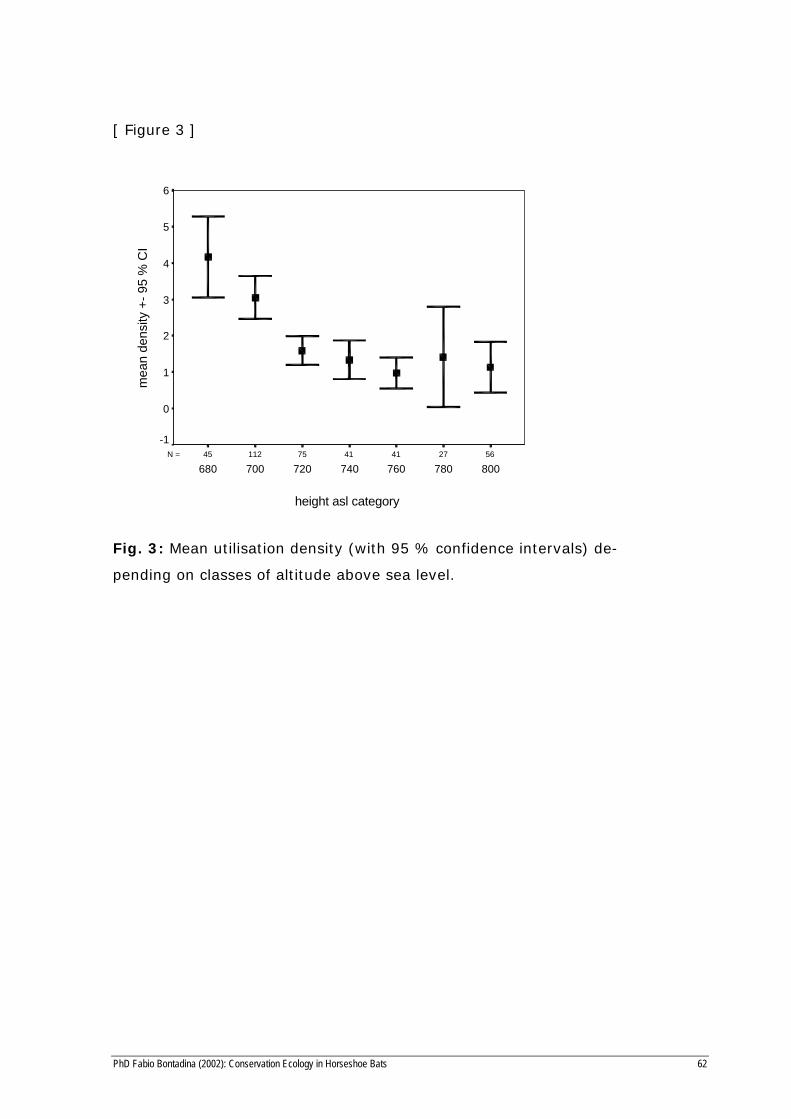
The three factors ALTITUDE (meters above sea level), DIST (distance
to the roost) and BROADLEAF (broadleaf woodland cover) were found
to be significant predictors in linear regression which explained 24.9 % of
the variability in the observed utilisation density (Table 3). The density of
use decreased with distance to the roost and altitude (Fig. 3) and in-
creased with broadleaf woodland cover.
[ Figure 2 ]
[ Table 3 ]
[ Figure 3 ]
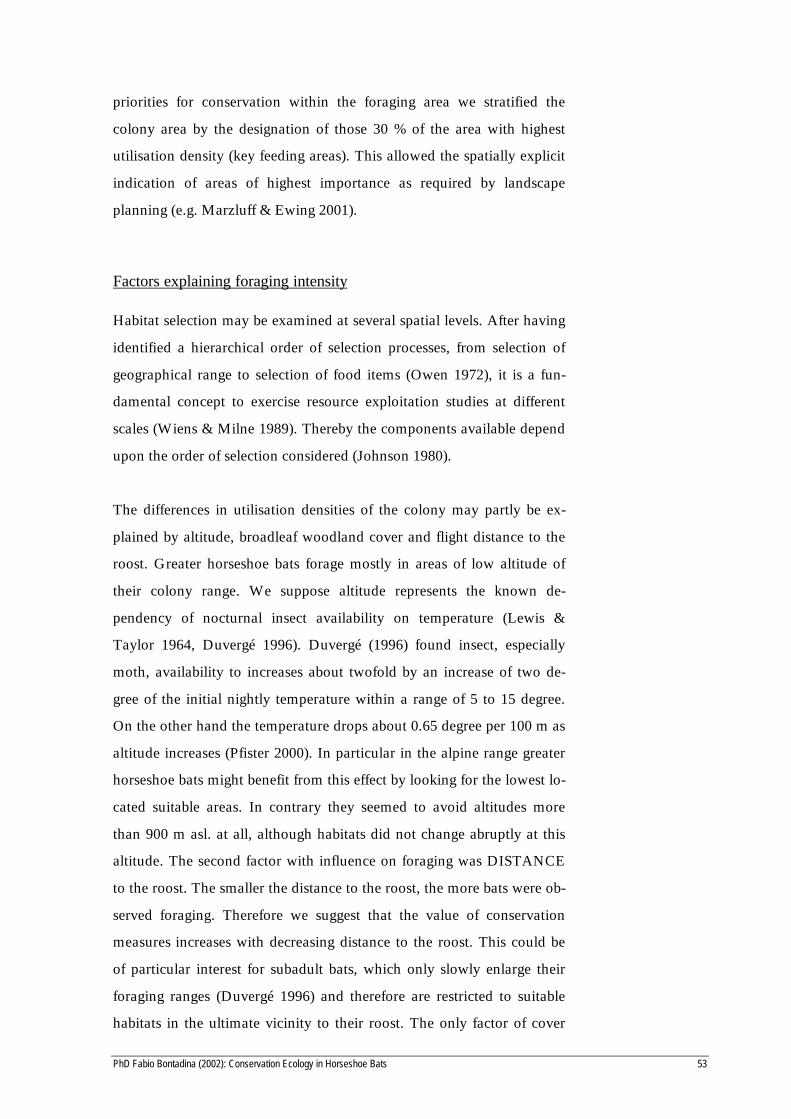
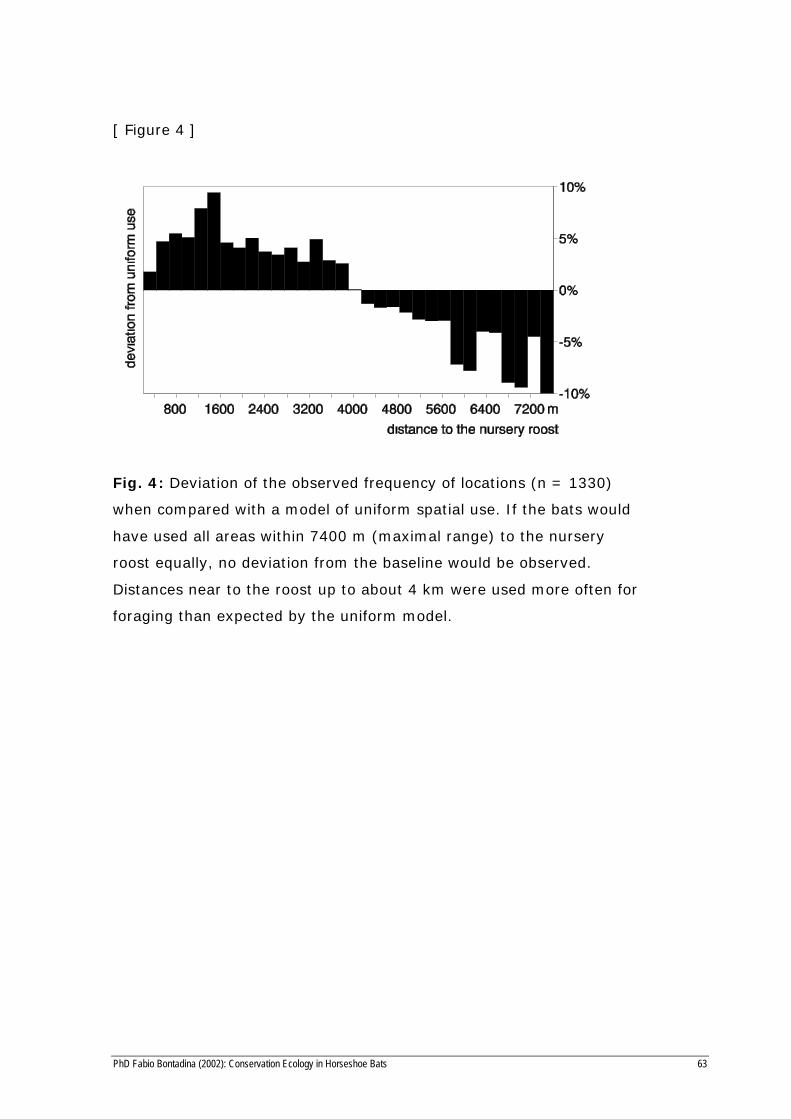
Fifty percent of the interval sampling locations (which is equivalent to
50% of time) we found the tracked bats within 1700 m of the maternity
roost whereas the maximum foraging distance was 7.4 km. If the utilisa-
tion pattern is compared to a uniform distribution, foraging areas up to 4
km from the roost are used more than expected (Fig. 4). No areas above
900 meters asl. were used for foraging.
[ Figure 4 ]
PhD Fabio Bontadina (2002): Conservation Ecology in Horseshoe Bats 50
Core areas
The size of individual core foraging areas (50 % kernel) was 7.1 ± 4.0 ha
and enclosed about an area of 7 % of the overall activity areas (Table 2).
The individual core foraging areas overlapped only to a small extend,
therefore the area curve increases at every step for nearly the area of the
core area added (Fig. 2).
There were 15 spatially explicit core areas delimited (see Fig. 2, some of
the smallest were omitted). They enclose an area of 2.1 km2, according
to the definition 30 % of the overall foraging area.
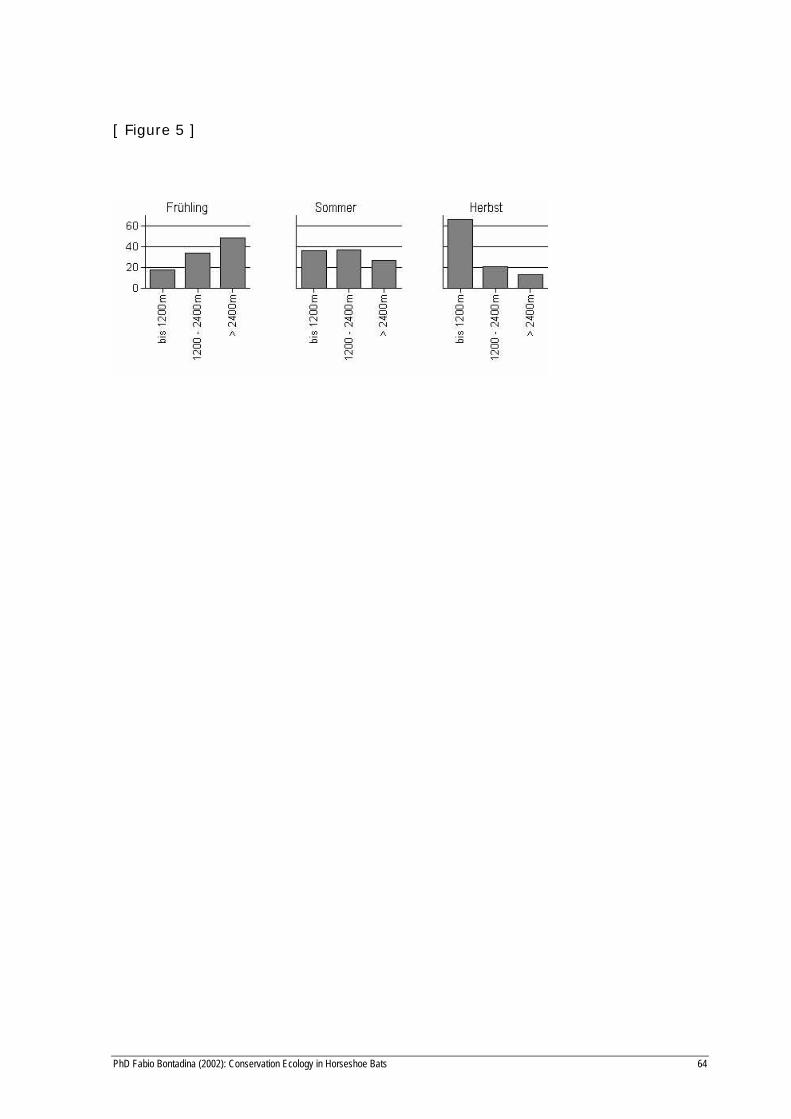
Indication for critical season
The body weight of 51 bats caught when emerging from the roost was
21.0 ± 2.8 g and showed no seasonal differences (ANOVA, F2,48 = 1.40,
p > 0.25). The foraging distance of the bats differed in the three seasons
(Median distance of individuals tested by season with Kruskall-Wallis
test, Chi2 = 7.04, df = 2, p < 0.05). In spring the bats foraged half of the
time exterior to a distance of 2523 m from the roost. In summer,
however, the distance was only 1524 m and decreased to 1005 m in
autumn (Table 2). This difference in mean foraging distance was re-
flected by the amount of time they foraged in immediate vicinity of the
roost. Whereas in spring the bats stayed for only 17.7 % of the time
within 1.2 km of the roost but for 52.2 % further away than 2.4 km, this
proportion was 66.1 % and 13.4 %, respectively, in autumn (Fig. 5).
[ Figure 5 ]
The number of locations collected showed no influence on individual
activity range size (linear regression, n = 26, r = 0.04, p = 0.85). We
therefore compared seasonal activity ranges without correction for
sample size. Mean activity ranges by 90 % kernel density estimates
showed no significant seasonal differences (ANOVA, F2,23 = 1.42, p =
0.26) (Table 2).

PhD Fabio Bontadina (2002): Conservation Ecology in Horseshoe Bats 51
DiscussionDiscussion
Foraging area of the colony
Greater horseshoe bats usually forage in short distance to their nursery
roost, as the results of this study demonstrate. This finding could only be
revealed by radio-tracking, as former attempts to find foraging areas by
the use of an ultrasound detector in the field were only successful near to
the nursery roost (Zahner 1997). Since the availability of transmitters,
light enough to study greater horseshoe bats, there are several investi-
gations which explored foraging behaviour in greater horseshoe bats in
UK (Stebbings 1982, Jones & Morton 1992, Jones et al. 1996, Duvergé
1996), in Luxembourg (Pir 1994), Germany (Geiger et al. 1993), Italy
(Bontadina et al. 1999) and Switzerland (Beck et al. 1994, Bontadina et
al. 1995, Lugon 1996).
Lugon (1996) found median foraging radii of 1 km in an Alpine Valley.
Jones & Morton (1992) calculated mean foraging radii between 2 and 4
km, and Duvergé (1996) found values between 1.6 and 2.8 km in his
extensive study. Our results are consistent with these findings and con-
firm that in different habitats and regions the mean distances used by
greater horseshoe bats are very limited, mainly in the range of 1-4 km,
although this sometimes may include foraging in peak distances of up to
7 km, as we observed in our study. The relatively small range used for
foraging by greater horseshoe bats gets even more obvious when it is
compared with ranges of other European bat species of similar size.
Greater mouse eared bats Myotis myotis were observed to commute
much larger distances of up to 25 km for foraging (Güttinger 1997,
Arlettaz 1999) and noctule bats Nyctalus noctula went at least 16 km
(Kronwitter 1988).
PhD Fabio Bontadina (2002): Conservation Ecology in Horseshoe Bats 52
An estimation of the foraging range of all members of the colony based
on an extrapolation of spatially overlapping individual activity ranges re-
vealed a foraging area of 7 km2, an area significantly smaller than ex-
pected by the maximal ranges (at radius = 3.5 km: 39 km2). This was
mainly contributed to a limitation by topography. Although this
restriction, there was no indication for exceptionally enlarged foraging
distances, if compared to other studies. This supports the hypothesis of
Jones et al. (1995), which postulated that the foraging radius of a species
is mainly limited by its wing morphology.
Identification of core foraging areas
Our results suggest that the cumulative foraging ranges of 15 bats from
different seasons are sufficient to describe the overall foraging range of a
colony as a whole. This is, however, not the case for the core foraging
areas, those areas used most intensively for feeding and therefore judged
to be the most important ones. The overlap of individual core areas was
relatively small. Even the study of 26 bats, which represents about one
sixth of the colony, could detect only a small amount of those core
foraging ranges presumably used by all members of the colony. The
steady increase of the core area curve depending on individuals included
indicates, that colony core foraging areas, in difference to the small
individual core ranges, are large and may even enclose a main part of the
foraging area of the colony.
This pattern with small individual core foraging areas with minor over-
laps with each other, and dispersed over a large area, could represent
territorial defence of foraging areas or avoidance of interspecific compe-
tition. In accordance with Duvergé (1996) we had no indication of any
territorial behaviour in the foraging area, except of two observations
where a bat was chased away from a perch by another greater horseshoe
bat.
Core areas are object of dispute in ecology (Wray et al. 1992), because
their boundaries can not objectively be determined. In order to provide
PhD Fabio Bontadina (2002): Conservation Ecology in Horseshoe Bats 53
priorities for conservation within the foraging area we stratified the
colony area by the designation of those 30 % of the area with highest
utilisation density (key feeding areas). This allowed the spatially explicit
indication of areas of highest importance as required by landscape
planning (e.g. Marzluff & Ewing 2001).
Factors explaining foraging intensity
Habitat selection may be examined at several spatial levels. After having
identified a hierarchical order of selection processes, from selection of
geographical range to selection of food items (Owen 1972), it is a fun-
damental concept to exercise resource exploitation studies at different
scales (Wiens & Milne 1989). Thereby the components available depend
upon the order of selection considered (Johnson 1980).
The differences in utilisation densities of the colony may partly be ex-
plained by altitude, broadleaf woodland cover and flight distance to the
roost. Greater horseshoe bats forage mostly in areas of low altitude of
their colony range. We suppose altitude represents the known de-
pendency of nocturnal insect availability on temperature (Lewis &
Taylor 1964, Duvergé 1996). Duvergé (1996) found insect, especially
moth, availability to increases about twofold by an increase of two de-
gree of the initial nightly temperature within a range of 5 to 15 degree.
On the other hand the temperature drops about 0.65 degree per 100 m as
altitude increases (Pfister 2000). In particular in the alpine range greater
horseshoe bats might benefit from this effect by looking for the lowest lo-
cated suitable areas. In contrary they seemed to avoid altitudes more
than 900 m asl. at all, although habitats did not change abruptly at this
altitude. The second factor with influence on foraging was DISTANCE
to the roost. The smaller the distance to the roost, the more bats were ob-
served foraging. Therefore we suggest that the value of conservation
measures increases with decreasing distance to the roost. This could be
of particular interest for subadult bats, which only slowly enlarge their
foraging ranges (Duvergé 1996) and therefore are restricted to suitable
habitats in the ultimate vicinity to their roost. The only factor of cover
PhD Fabio Bontadina (2002): Conservation Ecology in Horseshoe Bats 54
which contributed to the model was cover of broadleaf woodland.
However, only 25 % of the variability in utilisation density could be ex-
plained by spatial and geographical factors at the colony level. A first
evaluation of the individual's selection of their activity ranges revealed a
selective use of woodlands in spring (Bontadina et al. 1995). Other stud-
ies found specific habitat types selected for, too (Pir 1994, Duvergé 1996,
Lugon 1996). We suppose therefore that habitat selection, carried out by
individuals within their activity ranges, is responsible for a large part of
the remaining variability in utilisation density.
Indication for critical season
In the circadian rhythm of hibernating bats, spring usually represents the
season with their lowest weight of the year (Beasley et al. 1984). In
captive pallid bats Antrozous pallidus peak levels of food intake occurred
at times of the year when body weight was low (Beasley 1986). Ransome
(1990) observed in greater horseshoe bats a body weight reduction of
about one third during hibernation. The bats have to restore their con-
dition after hibernation which signifies an increased energy demand.
This is especially the case for female bats, which only shortly afterwards
enter pregnancy and it is probably more severe in the continental climate
of the Alps with long, cold winters. Moreover in early spring the insect
abundance is very low (Ransome 1990, Duvergé 1996, own unpublished
data) which requires an additional effort to replenish their resources. It
was in spring, when we found larger foraging radii of female greater
horseshoe bats. This means not only additional travel expenses, but also
that the bats dispersed over more than twice the area used by the colony
in summer (area with radius 1.5 km = 7 km2 vs. 19.6 km2 at radius of
2.5 km). We interpret the increase in foraging distance as an indication
for food being a limiting resource in this season. This is in accordance
with the findings from Ransome (1978), that reproduction success (in
term of an early date of birth) was mostly related with the mean tempera-
ture, and hence insect availability, in spring. Racey & Swift (1985) found
foraging areas contracting in lactating female Pipistrelle bats in summer,
but Barclay (1989) found no correlation of foraging behaviour with sea-
PhD Fabio Bontadina (2002): Conservation Ecology in Horseshoe Bats 55
son in pipistrelle bats Pipistrellus pipistrellus. Significant differences can
be interpreted as a seasonal or reproductive effect (Duvergé 1996). This
plays a minor role in our interpretation, as we use the result as indication
of an increased effort necessary, independent whether this derives from
increased energetic demand by the reproduction state and/or a seasonal
shortage of food.
Species that have low fecundity but are long-lived, as this is the case in
greater horseshoe bats (Ransome 1990), are most sensitive to seasonal
resource bottlenecks (Payne & Wilson 1999). We therefore suggest to
pay special attention to critical seasons in greater horseshoe bats. If the
requirements of a highly endangered species has to be included into a
conservation scheme in densely populated area, utilisation conflicts are
inevitable. This is even more the case in synanthropic bat species which
often have their roost within a human settlement and use large foraging
areas in the vicinity. It was generally recognised in mammals, that viable
populations often would require the preservation of areas of a size of
some magnitudes larger than any existing natural reserves (Shaffer 1987).
If therefore compromises between different utilisation interests are
drawn, areas and habitats used in such a critical season should gain
priority in a conservation scheme.
Implications for conservationImplications for conservation
Mitchell-Jones (1995, 1999) outlined the importance of the identification
of critical feeding areas around the breeding roosts. The spatial demands
of this large relict colony of greater horseshoe bats, as revealed by radio-
tracking, extends the perception of the conservation needs of this colony
beyond the roost. For a successful conservation of the colony their spa-
tial requirements for foraging must be considered (Bontadina et al. 1996).
FirstFirst, we suggest that with regard to possible utilisation conflicts the
presence of greater horseshoe bats and their requirements must be con-
sidered within a distance of up to 10 km around all roosts used by several
greater horseshoe bats. However, the requirements of greater horseshoe

PhD Fabio Bontadina (2002): Conservation Ecology in Horseshoe Bats 56
bats must be given priority within a distances of 4 km to the nursery
roost. SecondSecond, conservation of key feeding areas should earn highest
priority. They concentrate a major amount of foraging activity of a signi-
ficant proportion of the colony on a relatively small area. Further
analysis should investigate fine grained habitat use within individual
activity areas, in order to be able to extrapolated sufficiently the essential
foraging areas. ThirdThird, we suggest that management measures are more
effective, when they are implemented near to the nursery colony and en-
close habitats used in spring, the season suspected to be critical.
Acknowledgement
We like to thank especially for fruitful discussions and a thorough
appraisal of the manuscript to R. Arlettaz, D. Hegglin, B. Naef-Daenzer.
We thank all the people who supported the realisation of the project and
helped in field work, in particular R. Arlettaz, B. Denneler, A.
Denzinger, C. Geiger, H. Geiger, R. Güttinger, D. Hegglin, J.
Hartmann, P. Hohler, I. Hugentobler, G. Jones, E. Kohli, C. Luginbühl,
A. Lugon, U. Maissen, M. Meier, M. Moretti, J. Niederberger, M.
Obrist, U. Schnitzler, J. Schmid, L. Schmid, H-P. B. Stutz, G. Sutter, R.
Zuber, D. Zürcher.
This study was supported by: Amt für Landschaftspflege und
Naturschutz Graubünden, Dr. Bertold Suhner-Stiftung für Natur-, Tier-
und Landschaftsschutz BSS, Bündner Naturschutzbund BNB, Swiss
Agency for Environement, Forests and Landscape BUWAL, G. und A.
Claraz-Foundation, Elisabeth Rentschler-Foundation, Graubündner
Kantonalbank, Graubündner Tierschutzverein, Karl Mayer Foundation,
Migros-Genossenschafts-Bund, Swiss Bat Conservation KOF & CCO,
Zürcher Tierschutz ZT.
PhD Fabio Bontadina (2002): Conservation Ecology in Horseshoe Bats 57
n Table 1: Summery of 26 telemetry sessions of Rhinolophus
ferrumequinum carried out in 1993: animal code with sex, wing
band number, age and reproduction state, period of tracking ses-
sion, number of nights with observations and number of sampling
locations (five minutes intervals) are given and summarised for the
three seasons spring, summer and autumn, which correspond to
early pregnancy, lactation and post-lactation.
animal code (W =female, M = male)
wing bandnumber
reprod. state,age class
date oftrackingsession
nights withobser-
vations
locations n
W1 H967 ad., 2 30.4.-2.5. 3 9W7 H968 ad., 2 7.5.-12.5. 5 28W17 H970 ad., 2 13.5.-17.5. 3 44W27 H971 ad., 2 18.5.-25.5. 5 27W8 H969 ad., 2 22.5.-30.5. 5 115W9 H972 ad., 2 27.5.-3.6. 5 45W18 H973 ad., 2 1.6.-6.6. 4 56W19 H974 ad., 2 6.6.-11.6. 4 110spring 34 434
M8 H979 ad., 2 25.7.-31.7. 3 35W37 I526 ad., 3 1.7.-2.7. 3 59W47 H978 ad., 3 4.7.-7.7. 3 32W57 H975 ad., 3 9.7.-12.7. 2 3W28 (former W1) H967 ad., 3 12.7.-22.7. 5 79W29 H976 ad., 3 13.7.-24.7. 4 49W3 I517 ad., 3 17.7.-26.7. 4 54W11 H977 ad., 3 21.7.-30.7. 4 51W2 (former W9) H972 ad., 3 25.7.-31.7. 4 130W13 H980 ad., 3 30.7.-1.8. 2 9W23 H981 ad., 3 2.8.- ? 4 104summer 38 570
M0 plastic ring #75 ad., 5 30.8.-24.9. 2 8W3_h (former W3) I517 ad., 2 30.8.-? 3 10W22 (former W7) H968 ad. (post lac.) 30.8.-21.9. 4 45W38 H982 subad., 1 2.9.-? 4 67W21 H983 ad., (non lac.) 1.9.-21.9. 4 63W32 no ring ad., 2 29.9.-? 4 58W31 H986 ad.,1 29.9.-? 7 40autumn 27 283
year 26 sessions 99 1330

PhD Fabio Bontadina (2002): Conservation Ecology in Horseshoe Bats 58
Table 2: Maximum foraging radius and Median distances (IQR = inter-
quartile range) the bats went foraging from the roost.
animal code maximum foragingradius
Median distance (IQR) 50 % kernelcore area size
[ ha ]
90 % kernelactivity range size
[ ha ]W1 1917 1733 (1700 - 1785) 5 26.98W17 2460 1950 (1589 - 2056) 10.3 61.04W18 3262 2439 (627 - 2997) 6.1 56.85W19 4174 3171 (2743 - 3608) 2.5 70.78W27 7372 5941 (2347 - 6842) 4.4 48.12W7 2333 1969 (1649 - 2069) 4.7 34.04W8 4565 2448 (2295 - 2628) 5.4 27.39W9 1702 535 (431 - 1143) 4.2 35.07mean spring 3473 2523 (1672 - 2891) 5.3 ± 2.7 45.03 ± 16.59
W13 3457 536 (261 - 3332) 1.8 43.78M8 3918 2928 (1982 - 2948) 5.2 23.76W11 4744 1417 (1032 - 1527) 4.4 65.87W2 4369 1876 (1763 - 3071) 4.2 35.51W23 3789 1041 (951 - 1164) 5.6 40.97W28 3251 1877 (1030 - 2151) 10 74.88W29 2726 893 (258 - 1377) 7 59.87W3 3448 1257 (951 - 1853) 18.7 162.80W37 3290 2794 (2672 - 2995) 11.1 56.33W47 2453 1010 (637 - 1575) 14.1 93.37W57 2841 1129 (792 - 1985) 10.9 25.58mean summer 3448 1524 (1121 - 2180) 8.5 ± 5.0 62.07 ± 39.53
M0 728 275 (205 - 544) 5.1 38.19W21 5540 2411 (1175 - 2804) 5.1 27.35W22 2118 1194 (950 - 1397) 5.4 28.05W3_h 3282 617 (201 - 1519) 6.8 51.96W31 1839 746 (456 - 1386) 13.9 83.64W32 1235 787 (714 - 862) 4.9 21.87W38 1472 1003 (685 - 1087) 10.8 27.02mean autumn 1839 1005 (627 - 1371) 7.4 ± 3.5 39.73 ± 21.80
mean year 2743 1691 7.1 ± 1.6 50.81 ± 30.28
PhD Fabio Bontadina (2002): Conservation Ecology in Horseshoe Bats 59
[ Table 3 ]
Table 3. Utilisation density (UTILD) in the foraging area of the colony
explained by the independent factors ALTITUDE (meters above sea
level), DIST (distance to the colony), BROADLEAF (amount of broad-
leaf woodland cover), CONIFER (amount of conifer woodland cover),
REST (other open land as bare, gravel), GREEN (meadows & pastures)
and ARABLE (arable land) in linear regression (n = 743 ha squares
with >= one location). The dependent variable utilisation density was
log10(UTILD+1) transformed to achieve normality.
std correlation coef. T p
constant 856 1.681 .093
ALTITUDE -.174 -4.638 <0.001
DIST -.257 -7.160 <0.001
BROADLEAF .703 2.143 .032
CONIFER .620 1.781 .075
REST .595 1.449 .148
GREEN .498 1.238 .216
ARABLE .035 .235 .814
PhD Fabio Bontadina (2002): Conservation Ecology in Horseshoe Bats 60
[ Figure 1 ]
Fig. 1: Relation of area depending on number of individuals included.
Black line: 90 % kernel contour colony foraging area size computed as
cumulated foraging areas of individual bats (mean +- 95 % confidence
intervals of 100 bootstrap resamples). Grey curve: logistic regression
line. Black dotted line: core area size computed as cumulated foraging
areas of individual bats.
PhD Fabio Bontadina (2002): Conservation Ecology in Horseshoe Bats 61
[ Figure 2 ]
1 km
1500m
1500m
900m
900m
N
Fig. 2: Mean utilisation density (with 95 % confidence intervals)
depending on classes of altitude above sea level.
PhD Fabio Bontadina (2002): Conservation Ecology in Horseshoe Bats 62
[ Figure 3 ]
562741417511245N =
height asl category
800780760740720700680
mea
n de
nsity
+-
95 %
CI
6
5
4
3
2
1
0
-1
Fig. 3: Mean utilisation density (with 95 % confidence intervals) de-
pending on classes of altitude above sea level.
PhD Fabio Bontadina (2002): Conservation Ecology in Horseshoe Bats 63
[ Figure 4 ]
Fig. 4: Deviation of the observed frequency of locations (n = 1330)
when compared with a model of uniform spatial use. If the bats would
have used all areas within 7400 m (maximal range) to the nursery
roost equally, no deviation from the baseline would be observed.
Distances near to the roost up to about 4 km were used more often for
foraging than expected by the uniform model.
PhD Fabio Bontadina (2002): Conservation Ecology in Horseshoe Bats 64
[ Figure 5 ]