For Official Use ECO/CPE/WP1(2015)6 - OECD
63
For Official Use ECO/CPE/WP1(2015)6 Organisation de Coopération et de Développement Économiques Organisation for Economic Co-operation and Development 27-Feb-2015 ___________________________________________________________________________________________ _____________ English - Or. English ECONOMICS DEPARTMENT ECONOMIC POLICY COMMITTEE Working Party No. 1 on Macroeconomic and Structural Policy Analysis THE FUTURE OF PRODUCTIVITY 71st Meeting This document is part of the project on Long Run Productivity, prepared for the Working Party No. 1 of the Economic Policy Committee and the Committee on Industry, Innovation and Entrepreneurship. It reflects joint work between the Economics Department and Directorate for Science, Technology and Innovation. These outputs will be released in a series of publications after WP1 and CIIE have reviewed them. Mr. Giuseppe Nicoletti, tel: (33-1) 45 24 87 30; Email:[email protected] Mr. Dan Andrews, tel: (33-1) 45 24 14 68 ; Email: [email protected] Ms. Chiara Criscuolo, tel: (33-1) 45 24 79 68 ; Email: [email protected] JT03371242 Complete document available on OLIS in its original format This document and any map included herein are without prejudice to the status of or sovereignty over any territory, to the delimitation of international frontiers and boundaries and to the name of any territory, city or area. ECO/CPE/WP1(2015)6 For Official Use English - Or. English
-
Upload
khangminh22 -
Category
Documents
-
view
2 -
download
0
Transcript of For Official Use ECO/CPE/WP1(2015)6 - OECD

For Official Use ECO/CPE/WP1(2015)6 Organisation de Coopération et de Développement Économiques Organisation for Economic Co-operation and Development 27-Feb-2015
___________________________________________________________________________________________
_____________ English - Or. English ECONOMICS DEPARTMENT
ECONOMIC POLICY COMMITTEE
Working Party No. 1 on Macroeconomic and Structural Policy Analysis
THE FUTURE OF PRODUCTIVITY
71st Meeting
This document is part of the project on Long Run Productivity, prepared for the Working Party No. 1 of the
Economic Policy Committee and the Committee on Industry, Innovation and Entrepreneurship. It reflects joint
work between the Economics Department and Directorate for Science, Technology and Innovation. These
outputs will be released in a series of publications after WP1 and CIIE have reviewed them.
Mr. Giuseppe Nicoletti, tel: (33-1) 45 24 87 30; Email:[email protected]
Mr. Dan Andrews, tel: (33-1) 45 24 14 68 ; Email: [email protected]
Ms. Chiara Criscuolo, tel: (33-1) 45 24 79 68 ; Email: [email protected]
JT03371242
Complete document available on OLIS in its original format
This document and any map included herein are without prejudice to the status of or sovereignty over any territory, to the delimitation of
international frontiers and boundaries and to the name of any territory, city or area.
EC
O/C
PE
/WP
1(2
01
5)6
Fo
r Officia
l Use
En
glish
- Or. E
ng
lish

ECO/CPE/WP1(2015)6
2
TABLE OF CONTENTS
EXECUTIVE SUMMARY ............................................................................................................................. 4
THE FUTURE OF PRODUCTIVITY ............................................................................................................ 6
1. Introduction .......................................................................................................................................... 6 1.1 Approach ..................................................................................................................................... 7 1.2 Key issues, concepts and caveats ................................................................................................ 7 1.3 Structure of the paper .................................................................................................................. 8
2. The past and future of productivity: some simple growth accounting .................................................. 8 2.1 Global productivity has been solid, despite the slowdown in OECD countries .......................... 8 2.2 The OECD productivity slowdown in long-run comparative context ......................................... 9 2.3 Structural dimensions to the productivity slowdown ................................................................ 12 2.4 The impact of the crisis ............................................................................................................. 15 2.5 The sources of future growth ..................................................................................................... 19
3. Thinking about productivity ............................................................................................................... 23 3.1 The global productivity frontier ................................................................................................ 25 3.2 Diffusion of innovations and best practices............................................................................... 27 3.3 Firm heterogeneity and reallocation .......................................................................................... 30
4. Enhancing productivity in a globalised world .................................................................................... 30 4.1 Facilitating global learning spillovers ....................................................................................... 31 4.2 Allowing productive firms to thrive .......................................................................................... 35 4.3 Making the most of human capital ............................................................................................ 38
5. The role of public policy ..................................................................................................................... 40 5.1 Public policy and the global productivity frontier ..................................................................... 41 5.2 Innovation-specific policies are important but trade-offs emerge ............................................. 42 5.3 Well-designed framework policies allow productive firms to thrive ........................................ 48 5.4 Making the most of human capital requires a range of policies ................................................ 52
6. Avenues for future research ................................................................................................................ 56
REFERENCES .............................................................................................................................................. 57
Tables
Table 1. Synoptic table on the channels through which policies shape productivity ................................. 41 Table 2. Estimated gain to labour productivity from policy reforms that reduce skill mismatch .............. 53
Figures
Figure 1. Large differences in income per capita mostly reflect labour productivity gaps, 2013 ................ 6 Figure 2. Global productivity growth since 1990 ........................................................................................ 8 Figure 3. Labour productivity performance in long run comparative perspective ..................................... 10

ECO/CPE/WP1(2015)6
3
Figure 1B. Labour productivity growth in ICT-producing, ICT-using and non-ICT sectors .................... 11 Figure 4. Labour productivity growth since 1990 ...................................................................................... 12 Figure 5. Drivers of GDP growth since 1990 ............................................................................................ 13 Figure 6. Business dynamism in declining in OECD countries ................................................................. 15 Figure 7. Business investment and the crisis ............................................................................................. 17 Figure 8. The crisis accelerated the pace of productivity-enhancing reallocation in Europe .................... 19 Figure 9. MFP as an increasingly important driver of future growth ........................................................ 20 Figure 10. A stylised depiction of the factors shaping aggregate productivity growth ............................. 25 Figure 11. Solid growth at the global frontier productivity but spillovers have slowed down .................. 26 Figure 12. Firms at the global productivity frontier have become older ................................................... 27 Figure 13. Stylised depiction of how differences in productivity spreads matters for policy .................... 30 Figure 14. Learning from the frontier is shaped by key structural factors ................................................. 31 Figure 15. Rising GVC participation has important implications for MFP growth ................................... 32 Figure 16. Global production networks increasingly rely on the domestic services sector ....................... 34 Figure 2B. Resources are allocated less efficiently in the services sector ................................................. 34 Figure 17. Performance gaps between the national and global frontier: a two-country example .............. 35 Figure 18. The strength of market selection and post-entry growth varies across countries ..................... 37 Figure 19. Up-or-out dynamics vary across countries ............................................................................... 37 Figure 20. Cross-country differences in skill mismatch are significant ..................................................... 38 Figure 21. Counterfactual productivity gains from reducing skill mismatch ............................................ 40 Figure 22. Direct government funding of business R&D (BERD) and tax incentives for R&D .............. 43 Figure 23. Investment in BERD has grown more quickly than basic research .......................................... 45 Figure 24. Public policies and learning from the global frontier ............................................................... 45 Figure 25. R&D Collaboration and MFP convergence to the National Frontier ....................................... 47 Figure 26. Impact on industry productivity of policy reforms that enhance the ability of national frontier
firms to attract resources and grow ............................................................................................................ 49 Figure 27. Reforms to market regulations and MFP convergence to the national frontier ........................ 50 Figure 28. The probability of skill mismatch and framework policies ...................................................... 53 Figure 29. The probability of skill mismatch and other policies ............................................................... 55
Boxes
Box 1. ICT and productivity ...................................................................................................................... 10 Box 2. Multi Factor Productivity: concepts and measurement issues ....................................................... 14 Box 3. The debate on the future prospects for productivity and innovation .............................................. 21 Box 4. Empirical approaches ..................................................................................................................... 22 Box 5. Trade and productivity ................................................................................................................... 28 Box 6. Structural transformation and productivity .................................................................................... 34 Box 7. Measuring skill mismatch from the OECD Survey of Adult Skills ............................................... 39 Box 8. The importance of transparency in the design of patent systems ................................................... 48
_____________________________
The statistical data for Israel are supplied by and under the responsibility of the relevant Israeli authorities. The use of
such data by the OECD is without prejudice to the status of the Golan Heights, East Jerusalem and Israeli settlements
in the West Bank under the terms of international law.

ECO/CPE/WP1(2015)6
4
EXECUTIVE SUMMARY
Productivity growth slowed in many OECD countries even before the crisis, which amplified the phenomenon.
The slowdown in knowledge-based capital accumulation and decline in business start-ups over this period also
raises concerns of a structural slowing in productivity growth.
The economic forces shaping productivity developments can be better understood by focusing on three types of
firms: the globally most productive (i.e. global frontier firms), the most advanced firms nationally and laggard
firms.
Productivity growth at the global frontier has remained relatively robust in the 21st century, despite the slowdown
in average productivity growth. For example, labour productivity at the global frontier increased at an average
annual rate of 3½ per cent in the manufacturing sector over the 2000s, compared to an average growth in labour
productivity of just ½ per cent for non-frontier firms. However, firms at the global frontier have become older,
which may foreshadow a slowdown in the arrival of radical innovations and productivity growth.
The rising gap in productivity growth between the global frontier and other firms raises questions about: i) the
ability of the most advanced firms nationally to adopt new technologies and knowledge developed at the global
frontier; ii) diffusion of existing technologies and knowledge from national frontier firms to laggards; and iii) the
rise of tacit knowledge as a source of competitive advantage for global frontier firms.
The most advanced national firms in some economies have productivity levels close to the global frontier, but
their weight in the aggregate economy is very small. Reallocating scarce resources to the most productive firms
and addressing relatively high rates of skill mismatch would enhance the growth of innovative firms. In this
regard, it is also important that young firms either grow rapidly or exit but not linger and become small-old
firms.
Three policy areas appear to be of key importance to sustain productivity growth: i) foster innovation at the
global frontier and facilitate the diffusion of new technologies to firms at the national frontier; ii) create a market
environment where the most productive firms are allowed to thrive, thereby facilitating the more widespread
penetration of available technologies; and iii) reduce skill mismatches.
Policies to sustain productivity growth include:
Improvements in public funding and the organisation of basic research, which provide the right
incentives for researchers, are crucial for moving the global frontier and to compensate for inherent
underinvestment in basic research.
Rising international connectedness and the key role of multi-national enterprises in driving frontier R&D
imply a greater need for global mechanisms to co-ordinate investment in basic research and related
policies, such as R&D tax incentives, corporate taxation and IPR regimes.
Productivity growth via the diffusion of innovations at the global frontier to national frontier firms is
facilitated by trade openness, participation in global value chains (GVCs) and the international mobility
of skilled workers. Rising GVC participation magnifies the benefits from lifting barriers to international
trade and from easing services regulation.
Well-functioning product, labour and risk capital markets as well as policies that do not trap
resources in inefficient firms – including efficient judicial systems and bankruptcy laws that do not
excessively penalize failure – help firms at the national frontier to achieve a sufficient scale, enter global
markets and benefit from innovations at the global frontier.

ECO/CPE/WP1(2015)6
5
A competitive and open business environment that favours the adoption of superior managerial
practices and does not give incentives for maintaining inefficient business structures (e.g. via inheritance
tax exemptions for family-owned firms) facilitates within-firm productivity improvements. Stronger
competition also enables the diffusion of existing technologies to laggards, which underpins their catch-
up to the national frontier.
Innovation policies, including R&D fiscal incentives, collaboration between firms and universities and IPR
protection, should be designed to ensure that they do not excessively favour applied vs basic research
and incumbents vs young firms.
Framework policies that reduce barriers to firm entry and exit and improve the efficiency of
matching in labour markets can improve productivity performance by reducing skill mismatch.
Reforms to policies that restrict worker mobility and amplify skill mismatch – e.g. high transaction
costs on buying property and stringent planning regulations – and funding for lifelong learning will
become increasingly necessary, to combat slowing growth and rising inequality.

ECO/CPE/WP1(2015)6
6
THE FUTURE OF PRODUCTIVITY
1. Introduction
1. Paul Krugman (1994) once noted: “productivity isn't everything, but in the long run it is almost
everything”. Indeed, the large differences in income per capita observed across countries mostly reflect
differences in labour productivity (Figure 1), and productivity is also expected to be the main driver of
economic growth and well-being over the next 50 years, via investment in innovation and knowledge-
based capital (Braconier et al., 2014). Thus, it is of little surprise that the recent productivity slowdown has
sparked widespread interest, with the debate centring on the extent to which the productivity slowdown is
temporary, or a sign of more permanent things to come.
Figure 1. Large differences in income per capita mostly reflect labour productivity gaps, 2013
Percentage difference in labour resource utilisation and labour productivity compared with the upper half of OECD countries
1
Notes: GDP per capita can be decomposed into the contributions of labour productivity (GDP per hour worked) and labour resource utilisation (total number of hours worked per capita). The sum of the percentage difference in labour resource utilisation and labour productivity do not add up exactly to the GDP per capita difference since the decomposition is multiplicative. Compared to the simple average of the 17 OECD countries with highest GDP per capita in 2013 based on 2013 purchasing power parities (PPPs).
Source: OECD, Going for Growth Database.
2. The debate on the future of productivity has manifested itself in two polar views. There is a
pessimistic view, which holds that the recent slowdown is a permanent phenomenon and that the types of
innovations that took place in the first half of the 20th century (e.g. electrification) are far more significant
than anything that has taken place since then (e.g. Information and Communication Technologies, ICT), or
indeed, likely to transpire in the future (Gordon, 2012). Future economic growth will also slow further,
owing to a number of headwinds related to demography, education, inequality, globalisation, environment
and debt. By contrast, technological optimists argue that the underlying rate of technological progress has
not slowed and that the IT revolution will continue to dramatically transform frontier economies
(Brynjolfsson and McAfee, 2011).

ECO/CPE/WP1(2015)6
7
3. This paper aims to identify a set of issues that are relevant for understanding productivity
performance. Future labour productivity growth will increasingly depend on a policy framework that: i)
fosters innovation at the global frontier and reaps the benefits of globalisation by facilitating the diffusion
of new technologies; ii) creates a market environment where the most productive firms are allowed to
thrive, thus facilitating the more widespread penetration of available technologies; and iii) makes the most
of human capital. A key idea is that certain sources of productivity growth – while particularly relevant for
past performance – may become increasingly difficult to harness in the future. This idea can be understood
in terms of the projected slowdown in human capital accumulation; a further exhaustion of the catch-up
process; continued global integration, albeit at a slower pace; and structural adjustment towards services,
partly due to population ageing (Braconier et al., 2014). This leads to the study of a set of issues that have
received less attention to date, but if successfully addressed by policy, may clear the path for higher
productivity growth.
1.1 Approach
4. The paper draws on: i) growth accounting and analysis of aggregate data to explore past growth
performance; ii) long term economic projections (Braconier et al., 2014) to identify relevant issues for
future productivity; and iii) firm-level analysis to investigate the economic forces shaping productivity.
Given current limitations with respect to firm level data, the paper relies on a mix of critical review of
existing evidence, descriptive analysis and when possible, firm level econometric analysis to try to provide
insights, sometimes speculative, into some elements of the productivity puzzle (see Box 4 for an outline of
the various empirical approaches). This highlights a number of outstanding areas for policy research,
which may be possible to tackle in the future (Section 6).
1.2 Key issues, concepts and caveats
5. Aggregate growth accounting (Section 2) can help describe productivity developments but sheds
only a little light on the economic forces that shape them. Thus, Section 3 provides further insight into the
dynamics of growth by allowing one to distinguish within sectors firms that are at the global productivity
frontier (GF firms), those that are at the national – but not at the global – productivity frontier (NF firms)
and laggard firms.
1.2.1 The global productivity frontier and technological diffusion
6. Despite the slowing in aggregate productivity over the 2000s, productivity growth at the GF has
remained relatively robust. New innovations at the GF are initially adopted by NF firms, and whether they
diffuse to laggards will depend on policy and structural factors. However, the rising gap in productivity
growth between GF firms and other firms since the beginning of the century raises questions about how
policies shape the ability of: i) NF firms to adopt new technologies developed at the GF; and ii) diffusion
of existing technologies from NF firms to laggards.
1.2.2 Resource allocation as a driver of aggregate productivity
7. The aggregate gains from the diffusion of GF technologies will be magnified by policies that do
not impede the reallocation of scarce resources to the most productive firms. In this regard, the paper
explores the link between policies and two striking facts: i) NF firms in some economies have the
productivity levels that are quite close to that of the GF but their impact on aggregate productivity is
muted, to the extent that they are undersized; ii) relatively high rates of skill mismatch imply rigidities in
labour market matching and constrains the growth of innovative firms. Tackling skill mismatch is
particularly important in light of the projected slowdown in human capital accumulation and evidence that
mismatch has increased over time (EC, 2013a).

ECO/CPE/WP1(2015)6
8
1.2.3 Caveats
8. Assigning relative importance to the role of frontier innovation versus diffusion is difficult since
their specific relevance will depend on an economy’s distance from the global productivity frontier,
distribution of firm productivity and allocation of resources across firms. More crucially, currently
available firm-level data sources are not ideal, particularly for analysis of the productivity dynamics of
laggard firms. Nevertheless, is comforting that the results from policy analysis using incomplete firm level
data are often confirmed by analysis using official industry level data. It is also possible to infer some
aspects of the distribution of firm productivity within countries from recently collected OECD data on the
distribution of firm size and age.
1.3 Structure of the paper
9. Section 2 explores the factors shaping past and future productivity trends and the potential impact
of the crisis on productivity. Section 3 provides a framework for analysing the economic forces that shape
productivity developments. Section 4 identifies a set of structural themes relevant for future productivity,
broadly defined as: i) facilitating global learning spillovers; ii) allowing productive firms to thrive; and iii)
making the most of human capital. Section 5 reviews evidence on how policies can boost productivity in
these areas, while Section 6 identifies avenues for future research.
2. The past and future of productivity: some simple growth accounting
2.1 Global productivity has been solid, despite the slowdown in OECD countries
10. From a global perspective, the trajectory of labour productivity growth has accelerated from 1990
until the eve of the crisis (Figure 2), reflecting a pick-up in productivity growth in emerging market
economies, which more than offsets the slowdown observed in the OECD area. However, in the post-crisis
period, there was relatively weak growth in multi-factor productivity (MFP), which reflects the efficiency
with which inputs are used – via improvements in the management of production processes, organisational
change or R&D and innovation more generally (see Box 2 for a discussion). Thus, much of the growth in
the labour productivity of emerging markets reflects increased capital deepening (see Figure A1 in Annex
1).1 This raises important questions about the capacity of both emerging and OECD economies to adopt
new technologies and allocate resources efficiently – a key theme explored in this paper.
Figure 2. Global labour productivity growth since 1990
A: Growth in labour productivity
1 The subsequent Tables A2-A6 and Figures A1-A17 are in Annex 1 (ECO/CPE/WP1(2015)6/ANN1).

ECO/CPE/WP1(2015)6
9
B: Growth in multi-factor productivity
Notes: Multi-factor productivity (MFP) growth measures the growth of GDP over the combined contributions of total hours, workforce skills, machinery and structures and ICT capital. Emerging market and developing countries include China, India, and other developing Asia economies, Latin America, Middle East, North Africa, Sub-Saharan Africa, Russia, Central Asia and Southeast Europe. World refers to the 122 countries included in the Database. Excluding China lowers the overall rates of world labour productivity and MFP growth, but the main trends remain the same. Results are available on request.
Source: OECD calculations based on the Conference Board Total Economy Database. See ECO/CPE/WP1(2015)6/ANN1.
2.2 The OECD productivity slowdown in long-run comparative context
11. Turning to developments at the country-level, Figure 3 provides a long-run comparative
perspective on cross-country productivity developments since 1950, whereby growth in labour productivity
is decomposed into four key periods that broadly align with the structural breaks in United States
productivity (see Fernald, 2013, for example). Countries and regional aggregates – the latter used for
presentation purposes2 – are ranked in terms of their initial labour productivity gap with the United States
(Panel B), which had the highest aggregate productivity level in 1950.3 In general, there is evidence of
conditional convergence during the 1950-1995 period, whereby in economies that started further behind
the US productivity level, productivity grew relatively fast. Of course, the experience of Latin America
suggests that this process is not automatic, while New Zealand is noteworthy given that it was relatively
close to US levels in 1950, but fell further behind over time. However, the process of convergence halted
after 1995, underscoring two ideas: i) as economies converge toward the frontier, the ability to capitalise
on innovations in the most advanced countries or industries – such as ICT – becomes more important
(Section 3);4 ii) the potential for digital technologies to unleash winner-take-all dynamics, which allows
technological leaders to increase their productivity gap with laggards (Brynjolfsson and McAfee, 2011).5
2 The corresponding country-specific data can be found in Annex 1.
3 In this paper, the country, industry or group of firms with the highest productivity level is called “the frontier”. This
frontier can be national or global.
4 See Conway et al., (2006) for discussion and empirical evidence.
5 Digital technologies – which allow the replication of informational goods and business processes at near zero marginal
cost – enables the top-quality provider to capture most, or all, of their market, while only a tiny fraction of that revenue
may accrue to the next-best (even if they are almost as good as the best provider).

ECO/CPE/WP1(2015)6
10
Figure 3. Labour productivity performance in long run comparative perspective
A: GDP per hour worked; annual average growth
B: Per cent gap in GDP per hour worked with the United States
Notes: Growth rates for the period ranges are the annual averages. Country groupings are aggregated using GDP-PPP weights. Europe-5 includes: Austria, Belgium, Luxembourg, the Netherlands and Switzerland; Nordics includes: Denmark, Finland, Iceland, Norway and Sweden; Southern Europe includes: Greece, Portugal and Spain; and Latin America includes: Brazil, Chile and Mexico. The corresponding country-specific data are contained in Table A1 in ECO/CPE/WP1(2015)6/ANN1.
Source: OECD calculations based on the Conference Board Total Economy Database.
Box 1. ICT and productivity
The acceleration in productivity growth in the United States from the mid-1990s largely reflected the rapid diffusion of ICT, but these benefits were not necessarily realised in all economies, with Europe in particular falling behind. While this was reflected in the direct contribution of ICT capital to labour productivity growth (Figure A2), several key factors related to ICT are also embodied in MFP growth: i) the MFP growth in ICT-producing sectors themselves; ii) the growing share of these sectors in OECD economies; and iii) the productivity improvements in ICT-using industries, such as high-tech manufacturing and, especially, some service industries (Arnold et al., 2008). Figure 1B shows that the contribution of ICT-using sectors – such as retail and wholesale, finance and real estate and other business services (see Figure A3) – to aggregate productivity growth rose significantly in the United States and other English speaking economies after 1995, but this pattern was less evident in some European economies.1

ECO/CPE/WP1(2015)6
11
Figure 1B. Labour productivity growth in ICT-producing, ICT-using and non-ICT sectors
Percentage point contribution to non-farm business sector labour productivity growth, selected OECD countries
Notes: The industries are coded according to ISIC Rev. 4 industry classification. ICT-producing sectors: 30-33, 64; ICT-using sectors: 21-22, 29, 34-35, 50-52, 65-67, 71-74; non-ICT intensive: 15-16, 17-19, 20, 23-25, 26, 27-28, 34-35, 40-41, 45, 55, 70. Industry groupings are aggregated using value-added weights.
Source: OECD calculations based on the EU-KLEMS and WIOD Databases.
1. According to national statistics, the contribution of some ICT-using sectors (e.g. retail and wholesale and finance) to aggregate labour productivity in New Zealand also increased after 1997, compared to the 1990-97 period (Meehan, 2014).
12. More specifically, labour productivity initially grew rapidly following 1950, reflecting significant
scope for catch-up and the rebuilding of war-ravaged capital stocks. Productivity growth decelerated from
the early 1970s, but convergence continued in many economies. From the mid-1990s, productivity growth
accelerated in the United States, largely reflecting the large productivity gains associated with rapid
diffusion in ICT (Box 1). While these benefits were partly realised in other English speaking and Nordic
countries, some economies – particularly in Europe – began to fall behind. From 2004, the benefits from
the ICT revolution began to wane (in the US) and labour productivity growth in the most recent period has
been the weakest on record in most OECD countries since 1950. As discussed below, the slowdown
reflected a mixture of structural and cyclical factors.

ECO/CPE/WP1(2015)6
12
2.3 Structural dimensions to the productivity slowdown
13. The crisis left a legacy of slower productivity growth in many economies, but labour productivity
had slowed in a number of OECD countries even before the crisis (e.g. during the 2000-2007 period;
Figure 4). To understand the sources of these developments, Figure 5 decomposes GDP growth in the
periods: 1990-2000, 2000-2007 and 2007-2013 into the separate contributions of labour quantity, labour
composition (i.e. human capital accumulation), capital deepening and MFP. A number of key points
emerge:
After 2000, a broad-based decline in the contribution of labour composition (i.e. human capital
accumulation) to GDP growth is observed across OECD countries – a pattern which is expected
to continue into the future (Section 2.5).
The contribution of capital deepening slowed after 2000 in the United States, Europe, Korea and
Japan (Figure 5 and Figure A2), and this pattern was accentuated during the post-2007 crisis
period. Capital accumulation remained robust in Australia and Canada, partly reflecting the
significant ramp-up in mining sector investment to fuel the capital-intensive boom in China and
India.
Between 2000 and 2007, MFP slowed in most economies depicted in Figure 5 – save for Korea,
Japan, China and India – and MFP actually contracted in Australia, Canada, New Zealand,
Southern Europe and Latin America.
Figure 4. Labour productivity growth since 1990
Growth in GDP per hour worked (unless otherwise noted)
Notes: Labour productivity data for China and India refer to GDP per worker and thus are not shown in Figure 3 for details on country groupings. The corresponding country-specific data are contained in Table A2 in ECO/CPE/WP1(2015)6/ANN1.
Source: OECD calculations based on the Conference Board Total Economy Database.

ECO/CPE/WP1(2015)6
13
Figure 5. Drivers of GDP growth since 1990
Contribution of production factors to GDP growth
Notes: Multi-factor productivity (MFP) growth measures the growth of GDP over and above the combined contributions of total hours, workforce skills, machinery and structures and ICT capital. See Figure 3 for details on country groupings. The corresponding country-specific data are contained in Table A3 in ECO/CPE/WP1(2015)6/ANN1.
Source: OECD calculations based on the Conference Board Total Economy Database.
14. These pre-2007 developments in MFP suggest that there may be structural dimensions to the
slowdown. When interpreting MFP data, it is important to recognise that innovation is underpinned by
investments in knowledge-based capital (KBC), including: R&D, firm specific skills, organisational know-
how, databases, design and various forms of intellectual property. While incorporating KBC into growth
accounting reduces the contribution of (the residual) MFP, KBC is often only partially excludable, which
gives rise to knowledge spillovers (see Annex 1). This raises the possibility that the productivity slowdown
may partly reflect the pull-back in the pace of KBC accumulation observed in many OECD economies
during the early 2000s (Figure 6, Panel A), and this factor has been cited as an important contributor to the
productivity slowdown in the United States and the United Kingdom (Fernald, 2014; Goodridge et al.,
2013).

ECO/CPE/WP1(2015)6
14
Box 2. Multi Factor Productivity: concepts and measurement issues
Multi-factor productivity (MFP) relates output to a suitably defined combination of inputs and is often used to capture technological progress and efficiency of production. MFP is measured as a residual and therefore can often be a measure of our ignorance (Abramowitz, 1956; Solow, 1957) and capture more than technology and efficiency. In fact, developments in measurement and a broadening of research into factors of production, such as knowledge-based capital (KBC) and natural resources have raised important issues related to both the measurement and trends in MFP.
Amongst the measurement issues, the correct estimation of the quality adjusted-capital and labour inputs needs to be considered. First, the labour input measure should ideally account for both the hours worked and the skill composition of the labour force. While differences in hours worked and education levels of the workforce are accounted for in the aggregate productivity estimates shown in this section, this exercise is particularly difficult to perform at the firm level, on a consistent basis across countries. Second, the measure of capital input should capture the services flowing from the capital stock and be adjusted for the capital stock composition, including the use of information and communication technology (ICT) capital. Services from KBC, such as R&D and innovative property more generally, databases, management and organizational capital, should be included as inputs. Accurate measurement of these inputs, however, is still a work in progress and estimates at the firm and industry level are not yet widely available. Incorporating KBC into growth accounting leads to an increase of both output and inputs but generally reduces the measured contribution of MFP to growth. Finally, linked to the assumptions of the production function and to data constraints hampering a precise measurement of inputs, MFP also captures factors such as adjustment costs, changes in capacity utilization, economies of scale, effects from imperfect competition and measurement errors (OECD, 2001).
An additional input that has not been generally considered but is used in production are environmental services and emissions both as input to and as (“bad”) output of the production process (Brandt et al., 2014). The main measurement challenge for this approach based on growth accounting is the assumption on explicit shadow prices and the choices of which environmental inputs and outputs to focus on (Brandt et al., 2013).
Finally, the standard approach generally assumes that the factors of production are flexible; i.e. can be adjusted instantaneously and are fully employed. However, most inputs are characterized by adjustment costs, such as hiring and firing costs or the installation and effective operation of new machinery and equipment. If it is costly to adjust inputs, firms may respond to short-run fluctuations in demand by varying the rates at which their existing capital and labour are utilized, for example by hoarding labour at the time of a crisis waiting for the recovery or underutilizing the existing capital stock without shedding it. This leads MFP to behave pro-cyclically.1
1. For example, the recent weakness in MFP in the United Kingdom has been attributed to the transient labour hoarding of firms facilitated by the weakness in real wages relative to the cost of capital (Oulton and . Sebastiá-Barriel, 2013).
15. While the factors shaping the slowdown in KBC accumulation are not well understood, one
factor may be the decline in business start-ups rates – observed in many OECD countries even before the
crisis (Figure 6, Panel B) – given the key role of entrants in the formation of new ideas. A satisfactory
explanation for this development remains elusive (Decker et al., 2014), but at least part of the slowdown in
MFP growth can be accounted for by this decline. For example, evidence from eight European economies
suggests that MFP growth over the 2000s was weaker in sectors that recorded larger declines in the share
of young firms (under 6 years), and in particular start-ups (under 3 years) (see Annex 3; Box 4). At the
same time, increases in the share of old and small firms (over 6 years and fewer than 50 employees) were
associated with weaker MFP growth. Simulations suggest that had the share of young firms not declined
from 2002 levels, average annual MFP growth over 2002-10 would have been at least a ¼ percentage point
higher than the baseline on average across countries, which is significant given the weakness in MFP over
this period (Table A2).

ECO/CPE/WP1(2015)6
15
Figure 6. Business dynamism is declining in OECD countries
A: Investment in KBC; annual average growth
B: Share of start-ups in all firms; average over period
Notes: Panel B reports start-up rates (defined as the fraction of firms which are from 0 to 2 years old among all firms) averaged across three-year periods for the manufacturing, construction, and non-financial business services sectors. Data refer to 2001-2010 for AUT, BRA, ITA, LUX, NOR, ESP and SWE; 2001-2009 for JPN and NZL; 2001-2007 for FRA; and 2006-2011 for PRT. Owing to methodological differences, figures may deviate from officially published national statistics. For Japan, data are at the establishment level. Data for Canada refer only to organic employment changes and abstract from M&A activity.
Source: Panel A is sourced from Corrado et al., (2012); Panel B is sourced from Criscuolo, Gal and Menon (2014).
2.4 The impact of the crisis
16. The legacy of the crisis on productivity performance in OECD countries is particularly
noticeable. Part of this presumably reflects the pro-cyclicality of MFP (Box 2). Yet, even by 2013, average
MFP in the OECD remained almost 2% below the pre-crisis level of 2007, reflecting particular weaknesses
in the Euro Area, but also in the United Kingdom, Australia, Canada and New Zealand, while labour
productivity performance has also been weak (see Table A4). This raises questions about the longer run
productivity consequences of the crisis – and macroeconomic conditions observed in its wake – which are
ECO/CPE/WP1(2015)6
16
reviewed in this section focusing on: i) physical capital accumulation; ii) KBC and skills; and iii) creative
destruction.
2.4.1 Tangible investment was hit hard during the crisis and remains weak
17. The onset of the financial crisis resulted in a very sharp decline in tangible investment in many
countries and the subsequent recovery has been sluggish compared to recovery from past recessions
(Figure 7, Panels A and B). While most of the fall in business investment reflected weak demand, financial
factors and the pre-crisis build-up of corporate leverage have also played a role in the initial phase. The
impact of the latter has since waned and only continues to be a constraint on credit supply in countries with
weak financial systems (e.g. some euro area countries), especially for SMEs (Lewis et al., 2014).
18. Going forward, higher demand and lower uncertainty will be important for closing investment
gaps and raising potential output. The high level of uncertainty regarding the level and growth of potential
output during the recession may have contributed to the decline in business investment (Davis, 2010;
Baker et al., 2013; EC, 2013b).6 When investment decisions are costly to reverse (e.g. due to fixed costs),
high uncertainty gives agents an incentive to postpone or cancel their decisions until uncertainty is resolved
and more information is available, effectively freezing-up reallocation (Bernanke, 1983).
2.4.2 ... while investment in KBC and skills was more resilient
19. Investment in KBC (Figure 7, Panel C) was somewhat more resilient to the crisis than tangible
investment. This might reflect the long term nature of R&D investments and the large sunk costs that
might be borne at the initial stages of the investment, which might act as buffers to the transmission of
cycles. Moreover, to the extent that investments in R&D and worker training divert resources from current
production but only generate future benefits, their opportunity costs are likely to be lower during
downturns because there is potentially less revenue to be forgone from normal productive activities than
otherwise (López-García et al., 2013). Thus, all else equal, KBC investment is potentially countercyclical
but the presence of credit constraints can reverse this result: if firms depend on external finance, their
ability to borrow in order to fund innovative activity will decline during downturns, due to the drop in
current earnings (Aghion et al., 2014).7 Consistent with this, the sharp disruption in the availability of
external finance during the Great Depression in the United States temporarily reduced patenting rates
(Nanda and Nicholas, 2014).8
6 Although a reduction in uncertainty should quickly translate into activity measures, this may have changed given that
some measures of uncertainty (e.g. news searches, dispersion of economic forecasts and tax code expirations) have
been elevated for a long time (Haddow et al., 2013).
7 R&D might be pro-cyclical, even in the absence of credit constraints. If R&D is only partially excludable, there is only
a short window of time for firms to appropriate profits from innovation, which makes firms more inclined to introduce
innovations in boom-times in order to extract the highest benefit (see Barlevy, 2007).
8 It also shifted the trajectory of innovation away from more experimental, radical innovations to incremental
innovations, particularly in small firms in capital intensive industries reliant on bank lending.

ECO/CPE/WP1(2015)6
17
Figure 7. Business investment and the crisis
A: Real business investment growth compared to previous cycles (peak =100)
B: Comparison between actual and steady state non-residential investment as a percentage of potential GDP
C: Business investment in knowledge assets weathered the crisis better and recovered earlier; OECD
Notes: Panel A: Data are for OECD countries for which the breakdown of investment is available. Panel B:The steady-state level of
investment to (potential) output is given by
, where k* is the steady-state capital-output ratio, δ is the depreciation rate
which is assumed constant over time, and g is the endogenous potential growth rate, which is dependent upon labour utilisation, physical and human capital intensity and multi-factor productivity (based on OECD long-term projections) . An important caveat is that changes in potential output growth could change the steady-state capital-output ratio both indirectly and directly by raising the equilibrium real interest rate in proportion to the rise in the potential growth rate.
Source: Panel A and B: Lewis et al. (2014) based on the OECD Economic Outlook 95 Database. Panel C: OECD (2014a).

ECO/CPE/WP1(2015)6
18
20. The long term impact of the crisis on human capital will only become evident over time.
Preliminary evidence suggests that so far the negative impact on skills may be somewhat contained. While
low-skilled workers have been more at risk of job displacement, most of them have subsequently found
jobs using similar skills to their pre-displacement jobs (OECD, 2013a). Furthermore, there has been an
increase in individuals returning to full-time education or staying in education longer, which might
increase the average quality of labour in the long run (OECD, 2011).9 However, the negative impact of the
crisis on earnings might have adverse consequences going forward. The wage moderation observed since
the start of the crisis has been disproportionate due to the wages of new hires, as opposed to that of
incumbents (OECD, 2014b).
2.4.3 Productivity-enhancing reallocation during the crisis
21. The process of creative destruction and reallocation can be significantly affected by the
economic cycle. On the one hand, recessions can be a solid breeding ground for productivity-enhancing
reallocation and firm restructuring, and pave the way for economic recovery.10
On the other hand,
recessions – particularly when associated with financial crises – might have long-term scarring effects if: i)
they reduce the availability of finance for entrepreneurs (Caballero and Hammour, 2005) and thus scope
for experimentation (Ziebarth, 2012; Buera and Moll, 2013); and ii) surges in job destruction are not
matched by surges in employment creation, as was the case in the recent crisis.
22. Cross-country evidence on how job creation and destruction of different firms have been affected
by the crisis is still scarce. Nonetheless, new OECD evidence is consistent with the notion that
productivity-enhancing reallocation was the main source of productivity growth during the crisis. Figure 8
(Panel A) shows average employment growth differentials across the quartiles of firm productivity, in 11
European countries. If reallocation is productivity-enhancing, more productive firms should grow larger,
and less productive firms should shrink (or exit). Indeed, this pattern is observed over the pre-crisis period,
with the two most productive quartiles of firms expanding relative to the least productive quartiles (2002-
07). Interestingly, however, the pace of productivity-enhancing reallocation intensified once the crisis set
in (2008-10), with job losses particularly concentrated amongst the least productive firms. A similar story
is also evident in Figure 8 (Panel B), whereby old firms – which are often less productive than young firms
(see Section 2.3) – shed more jobs during the crisis, even though this occurred through their downsizing,
rather than exit (Criscuolo et al., 2014).
23. While these patterns may augur well for future productivity performance in Europe, it is not clear
– owing to data limitations – whether the Great Recession was more cleansing than other recessionary
episodes. Recent evidence from the United States suggests that the pace of reallocation during the crisis
picked up relative to normal times, but it was less productivity-enhancing than during previous
recessionary episodes (Foster et al., 2014). This is consistent with the notion that financial crises may
mitigate the potential cleansing effects of recessions if less finance is available to facilitate the growth of
the most productive firms. However, there is no evidence – for the European countries analysed in Figure 8
(Panel A) – that the cleansing effects of the crisis were lesser in industries more dependent on external
financing (Annex 3).
9 Between 2007 and 2012 across OECD economies, the share of 15-29 year-olds in education rose from 45.2% to 48.8%
and expected years in education rose from 6.8 to 7.3 years.
10 See: Hall, (1993) and Caballero and Hammour (1994). Of course, in the event of a demand shock, some labour
hoarding may be desirable – despite its initial dampening effect on productivity – if it provides the ability to return to
higher productivity, once market conditions improve.

ECO/CPE/WP1(2015)6
19
Figure 8. The crisis accelerated the pace of productivity-enhancing reallocation in Europe
A: Average employment growth across the firm MFP distribution; deviation from 2002-10 average
B: Contributions to aggregate net job creation by entrants, young/old exitors, and young/old incumbents
Notes: Panel A shows average employment growth across the lagged distribution of MFP for firms in the business sector (i.e. NACE 15-74), based on an unweighted average of 11 European countries: AUT, DEU, DNK, FIN, FRA, ITA, NOR, NLD, POL, SWE, GBR. A common (European) industrial structure is employed to aggregate 2-digit industries to the business sector level. Panel B: Average across all available countries. Contributions are calculated as the net job creation by age groups and by incumbent status over total average employment. See notes to Figure 6 for more details on the sample coverage.
Source: Panel A is based on the calculations in ECO/CPE/WP1(2015)6/ANN3, performed on production survey data from ESSLait. Panel B is sourced from Criscuolo, Gal and Menon (2014).
2.5 The sources of future growth
24. Over the period to 2060, potential global growth is projected to slow in most countries, even
though a rising share of fast growing non-OECD economies in global output should dampen the slowdown
at the global level (Figure 9, Panel A). Besides population ageing, this reflects the slowing in growth of the
labour force and education (Figure 9, Panel B) – which is consistent with roughly constant returns to
investment in education (Johansson et al., 2013) – and decreasing potential for catching-up. Growth is set
to become increasingly dependent on improvements in MFP, reflecting: i) continuing investments in KBC
as well as pro-competition reforms in countries where regulations are relatively restrictive; and ii) the

ECO/CPE/WP1(2015)6
20
continued dissemination of new discoveries made at the technological frontier.11
These trends will imply a
rising demand for skills, which given the projected slowdown in human capital accumulation implies rising
wage inequality within countries.
Figure 9. MFP as an increasingly important driver of future growth
A: Contribution to growth in GDP per capita; 2000-2060 (annual average)
B: Mean years of schooling 1990-2060
Notes: Non-OECD G20 countries are Argentina, Brazil, China, India, Indonesia, Russian Federation, Saudi Arabia and South Africa.
Source: Braconier, Nicoletti and Westmore (2014).
25. Nevertheless, the pace of future MFP growth is highly uncertain, in large part due to uncertainty
in the outlook for frontier growth. Indeed, there are strongly contrasting views on the most likely pace of
future frontier growth, with much of the discussion revolving around the potential of ICT to continue to
propel growth (Box 3). To be sure, the techno-pessimists have on their side the recent productivity
slowdown but this ignores: i) that the big payoffs from general purpose technologies are only realised once
organisational structures are reconfigured to fully exploit the flexibility provided by these new
11 Even so, average annual MFP growth in the OECD is anticipated to fall from 1.1% in the decade to 2030 to 1.0% to
2040 and 0.9% to 2050. MFP growth in some non-OECD countries that have grown rapidly in recent years through
catching-up is likely to slow more sharply as incomes in these countries converge closer to OECD levels.
ECO/CPE/WP1(2015)6
21
technologies (David and Wright, 2005)12
; and ii) the tendency for innovations to arise from the
combination and recombination of previous innovations (Weitzman, 1998). Even so, it is remarkable how
little is actually known about the characteristics of firms that operate at the global productivity frontier and
whether the productivity growth of these firms has slowed over time, thus motivating an analysis of these
factors in Section 3.1.
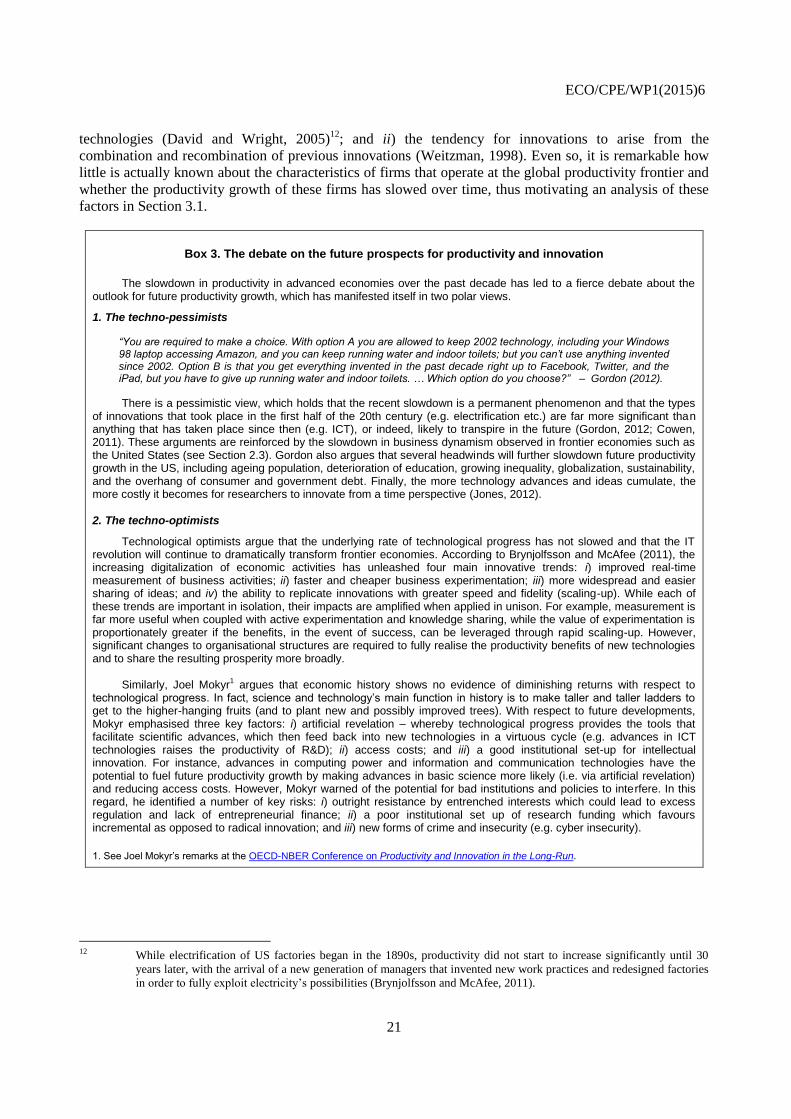
Box 3. The debate on the future prospects for productivity and innovation
The slowdown in productivity in advanced economies over the past decade has led to a fierce debate about the outlook for future productivity growth, which has manifested itself in two polar views.
1. The techno-pessimists
“You are required to make a choice. With option A you are allowed to keep 2002 technology, including your Windows 98 laptop accessing Amazon, and you can keep running water and indoor toilets; but you can’t use anything invented since 2002. Option B is that you get everything invented in the past decade right up to Facebook, Twitter, and the iPad, but you have to give up running water and indoor toilets. … Which option do you choose?” – Gordon (2012).
There is a pessimistic view, which holds that the recent slowdown is a permanent phenomenon and that the types of innovations that took place in the first half of the 20th century (e.g. electrification etc.) are far more significant than anything that has taken place since then (e.g. ICT), or indeed, likely to transpire in the future (Gordon, 2012; Cowen, 2011). These arguments are reinforced by the slowdown in business dynamism observed in frontier economies such as the United States (see Section 2.3). Gordon also argues that several headwinds will further slowdown future productivity growth in the US, including ageing population, deterioration of education, growing inequality, globalization, sustainability, and the overhang of consumer and government debt. Finally, the more technology advances and ideas cumulate, the more costly it becomes for researchers to innovate from a time perspective (Jones, 2012).
2. The techno-optimists
Technological optimists argue that the underlying rate of technological progress has not slowed and that the IT revolution will continue to dramatically transform frontier economies. According to Brynjolfsson and McAfee (2011), the increasing digitalization of economic activities has unleashed four main innovative trends: i) improved real-time measurement of business activities; ii) faster and cheaper business experimentation; iii) more widespread and easier sharing of ideas; and iv) the ability to replicate innovations with greater speed and fidelity (scaling-up). While each of these trends are important in isolation, their impacts are amplified when applied in unison. For example, measurement is far more useful when coupled with active experimentation and knowledge sharing, while the value of experimentation is proportionately greater if the benefits, in the event of success, can be leveraged through rapid scaling-up. However, significant changes to organisational structures are required to fully realise the productivity benefits of new technologies and to share the resulting prosperity more broadly.
Similarly, Joel Mokyr1 argues that economic history shows no evidence of diminishing returns with respect to technological progress. In fact, science and technology’s main function in history is to make taller and taller ladders to get to the higher-hanging fruits (and to plant new and possibly improved trees). With respect to future developments, Mokyr emphasised three key factors: i) artificial revelation – whereby technological progress provides the tools that facilitate scientific advances, which then feed back into new technologies in a virtuous cycle (e.g. advances in ICT technologies raises the productivity of R&D); ii) access costs; and iii) a good institutional set-up for intellectual innovation. For instance, advances in computing power and information and communication technologies have the potential to fuel future productivity growth by making advances in basic science more likely (i.e. via artificial revelation) and reducing access costs. However, Mokyr warned of the potential for bad institutions and policies to interfere. In this regard, he identified a number of key risks: i) outright resistance by entrenched interests which could lead to excess regulation and lack of entrepreneurial finance; ii) a poor institutional set up of research funding which favours incremental as opposed to radical innovation; and iii) new forms of crime and insecurity (e.g. cyber insecurity).
1. See Joel Mokyr’s remarks at the OECD-NBER Conference on Productivity and Innovation in the Long-Run.
12 While electrification of US factories began in the 1890s, productivity did not start to increase significantly until 30
years later, with the arrival of a new generation of managers that invented new work practices and redesigned factories
in order to fully exploit electricity’s possibilities (Brynjolfsson and McAfee, 2011).

ECO/CPE/WP1(2015)6
22
Box 4. Empirical approaches
The empirical research underpinning this paper exploits cross-country, industry- and firm-level data to explore structural dimensions of productivity and the multiple channels through which policies affect productivity. This Box briefly outlines the various approaches and data sources used in these analyses.
Structural analysis (Sections 2-4)
What’s happening at the global productivity frontier?
Using harmonised cross-country firm level data, Annex 2 (ECO/CPE/WP1(2015)6/ANN2) identifies the globally most productive firms in each 2 digit industry based on a number of definitions (e.g. the top 100 firms in each industry etc) from 2001-2009. The analysis then highlights: i) cross-sectional differences in a range of economic indicators – e.g. labour and multifactor productivity, size, age, patenting activity and MNE status – between global frontier (GF) firms and non-frontier firms in 2005; and ii) the evolution of these indicators over the 2000s, for GF and non-frontier firms.
The underlying data source for this analysis (and the productivity indicators in Annex 4) is the commercial database ORBIS. Prior to the construction of firm level productivity indicators (e.g. MFP), these data have been significantly transformed by Gal (2013) along of number of dimensions, including harmonisation to improve cross-country comparability. As discussed elsewhere in the paper, ORBIS has a number of drawbacks including the fact that is a selected sample of larger and more productive firms, which tends to result in smaller and younger firms being under-represented in some economies. Accordingly, firms with less than 20 employees are dropped in the analysis in Annex 2, while sampling weights estimated by Gal (2013) are applied to improve representativeness in Annex 4.
At the same time, while the coverage of ORBIS is less satisfactory for the United States than many European countries, its coverage of US affiliates abroad is still good. A priori, it is not clear in which direction this will bias the analyses given: i) the focus is only the global frontier and thus country boundaries are less relevant; and ii) the United States is excluded from the firm level policy analysis given that a differences-differences estimation procedure is employed (whereby the US is the benchmark country).1 Finally, the key trends in Figure 10 are robust to excluding firms that are part of a multi-national group (i.e. headquarters or subsidiaries) where profit-shifting activity may be relevant.
Firm dynamics and productivity
Annex 3 (ECO/CPE/WP1(2015)6/ANN3) explores the link between MFP growth and the share of each firm dynamics class (e.g. young firms, starts-up, old and small firms etc) with respect to the total employment and the number of firms, using a panel econometric specification that controls for country*year and industry fixed effects. This analysis utilises data from the ESSLimit project from 2001-2010, which aggregates micro-data from Production Surveys for the non-farm business sector (i.e. nace 15-74) for eight European countries: Denmark, Finland, France, Italy, the Netherlands, Norway, Sweden and the United Kingdom. The paper also contains some descriptive analysis into the impact of the crisis on resource reallocation for these eight economies plus Austria, Germany and Poland.
This analysis uncovers a statistically significant positive relationship between the share of young firms and productivity growth at the industry level, which in turns motivates a more detailed analysis of firm and employment dynamics for a broader set of OECD countries.
Firm and employment dynamics
Criscuolo, Gal and Menon (2014) explore the dynamics of employment using an innovative methodology that aggregates confidential firm-level data from national sources (e.g. national business registers) to produce new cross-country indicators on: i) the share of each size; age and status class (e.g. start-ups, small and young, small and old firms; large firms; and incumbents, entrants and exitors) with respect to the total number of firms and employment; ii) job dynamics and their contribution to aggregate job creation and destruction. The paper provides evidence on the asymmetric impact of the crisis on employment growth (with respect to young and old firms) and the sources of aggregate employment growth, which highlights the importance of young firms to job creation. The data contain longitudinal information on 3 sectors (Manufacturing, Services and Construction) over 2001-2011 for 17 OECD countries plus Brazil. See the Dynamics of Employment Growth for details.
Calvino et al., (2015) extends the above analysis and reports descriptive evidence on cross-country differences in employment dynamics and in post-entry employment growth performance based on micro-aggregated data for 2-digit industries for 12 OECD countries over the period 2001-2012. The analysis investigates: i) the role of high–growth firms; ii) the performance of cohort of firms 3; 5 and 7 years after entry; and iii) within industry employment growth dispersion. [The paper also examines the impact of the crisis and employs a difference-in- difference approach to study the contribution of policies to the observed differences in post-entry growth performance across countries]. See
DSTI/IND(2015)5.
Skill mismatch and labour productivity
Annex 4 (ECO/CPE/WP1(2015)6/ANN4) utilises cross-country data to regress industry-level labour productivity indicators – constructed from firm level data (ORBIS) – on measures of skill and qualification mismatch, aggregated from

ECO/CPE/WP1(2015)6
23
PIAAC micro-data for 2011/12. Three productivity indicators are utilised: i) industry level labour productivity; ii) average differences in within-firm productivity – measured by the unweighted average of firm productivity, irrespective of each firm’s relative size – which is increasing in the ratio of high productivity to low productivity firms within an industry; and iii) the extent to which, all else equal, it is the more productive firms that command a larger share of industry employment (i.e. allocative efficiency). The specification controls for country and industry fixed effects, and other possible determinants of productivity, including market concentration and managerial quality. The sample is based on data for 19 OECD countries for which mismatch and productivity data are available.
Policy analysis (Section 5)
A key issue identified in this paper is the relationship between policies and the diffusion of: i) new technologies from the GF to NF firms; and ii) existing technologies from the NF to laggard firms. While a number of steps have been taken to the harmonised the firm-level data across countries (see Gal, 2013), these data are still not ideal for addressing some of these policy questions. This is particularly the case for the analysis of the least productive firms, since ORBIS is generally a selected sample of the most productive and larger firms (i.e. small firms are under-represented). Given this, analysis at the industry level is conducted in parallel to firm level policy research and an attempt is then made to interpret the results from industry-level analysis through the firm-level framework developed in Section 3.
The diffusion of new technologies from the global frontier to national frontier
Besides providing a descriptive analysis of firms at the global productivity frontier, Annex 2 uses harmonised cross-country firm level data1 to explore the link between policies and the magnitude of the productivity and size gaps between NF and GF firms within each industry (see Figure 17 for an example). A differences-in-differences estimator is used to identify the impact of policies on these gaps, while the specification also controls for country and industry fixed effects. The sample is based on data for 19 OECD countries in 2005.
The question of how policies shape the diffusion of new technologies from the GF to NF firms is also addressed indirectly using industry-level data. For example, when MFP growth spillovers from the global frontier (i.e. the most productive economy in each sector) to laggard economies in a given sector, this is likely to reflect the process of NF firms adopting new technologies from the global frontier. Accordingly, Annex 5 (ECO/CPE/WP1(2015)6/ANN5) employs a neo-Schumpeterian growth framework to explore the extent to which spillovers from the global productivity frontier onto (country*industry) MFP growth varies with selected framework and innovation-specific policies. This is done by interacting policy (and structural variables) with the industry global frontier MFP growth term, using a differences-in-differences estimator. The regression specification controls for country*year and industry fixed effects and policy interactions with the lagged distance to the frontier term. This Annex also analyses how policies shape the impact of GVC participation on MFP growth, by employing a differences-in-differences specification whereby national policies are interacted with industry level GVC participation for the United States. The sample is based on a dataset of 20 industries for 15 OECD countries over the period 1984-2007.
The diffusion of existing technologies from the national frontier to laggard firms
Annex 2 also uses firm level data1 to explore the link between policies and the speed of catch-up to the NF within each industry (the NF is defined as the most productive 5% of firms in each country*industry cell). A differences-in-differences estimator is used to identify the impact of policies and the policy term is interacted with the lagged productivity quartile of each firm relative to the NF (see notes to Figures 25 and 27 for more details). The specification also controls for country and industry fixed effects. The sample is based on data for 20 OECD countries in 2005.
As discussed above, this issue is also addressed indirectly in Annex 5 using industry-level data by including policy interactions with the lagged distance to the frontier term.
Skill mismatch and public policy
Using a logit regression framework, Annex 6 (ECO/CPE/WP1(2015)6/ANN6) exploits micro-data from PIAAC to assess the relationship between different policy settings (framework, housing and labour market and education) and the probability of skill mismatch, controlling for relevant individual and country level characteristics in 2011/12. Heterogeneous effects of policies are also explored by allowing the impact of the policies to vary with age and managerial quality. The sample is based on data for 22 OECD countries for which mismatch data are available.
1. The choice of the US as the benchmark country in the differences-in-differences specification reflects data constraints and identification assumptions regarding the industry exposure variables. For example, data on firm turnover and job layoff rates at the industry level are often only available for the US. In theory, the benchmark should also provide an estimate of the frictionless economy.
3. Thinking about productivity
26. Growth accounting can help describe productivity developments but does not shed much light on
the economic forces that shape them. If technology and knowledge flows freely across borders, aggregate
productivity growth in less advanced economies and firms will be a positive function of growth in those
that operate at the global technological frontier as well as of the gap between the level of productivity at

ECO/CPE/WP1(2015)6
24
this frontier and the productivity of the less advanced (Acemoglu et al., 2006; Aghion and Howitt, 2006).
Put differently, economies and firms lagging behind the global frontier can improve their productivity by
benefiting from the spillovers from frontier innovations and the adoption of technologies and knowledge
already in use at the global frontier. This creates scope for some cross-country convergence in productivity
levels as those that start further behind the global frontier can grow relatively faster, since the marginal
(productivity) benefit of implementing technological and organisational innovations will be higher the less
sophisticated is the technology embedded in existing capital. In the long-run, countries will converge not
necessarily to the same productivity level but instead to a common productivity growth rate, which is
pinned down by the rate of productivity growth in the most advanced economies. The extent of
convergence in productivity levels will be conditional on country-specific factors, including policies.
27. But the process of productivity convergence is not to be taken for granted and history suggests
that a lot can go wrong along the way (Pritchett, 1997). In fact, while adoption lags for new technologies
across countries have fallen, there has been a divergence in long-run penetration rates once technologies
are adopted, with important implications for cross-country income differences (Comin and Mestieri, 2013).
In other words, new technologies developed at the global frontier do not immediately and automatically
spread to all firms within any economy, and many existing technologies may remain unexploited by a non-
trivial share of firms in an economy. Thus, in order to understand the forces shaping aggregate productivity
one needs to go beyond aggregates to understand the dynamics of knowledge diffusion and productivity
catch-up across industries and firms.
28. Accordingly, Figure 10 sketches an analytical framework that combines different types of firms –
e.g. firms that are at the global frontier, those that are at the national (but not at the global) frontier and
laggards – and technologies, i.e. new vs existing. Innovation at the global technological frontier leads to the
discovery of new technologies and organisational innovations. These new (global) frontier technologies do
not immediately diffuse to all firms. At first, they are only accessible to the most productive firms in an
economy (i.e. national frontier firms; NF). Then, over time they can represent a source of technological
diffusion to laggards, but presumably only once they have been adapted to national circumstances by
national frontier firms. This is consistent with evidence that the productivity growth of laggard firms
within a country is more strongly related to productivity developments of the most advanced domestic
firms as opposed to those of the globally most advanced (Annex 2; Bartelsman et al., 2008; Iacovone and
Crespi, 2010).13
29. As discussed below, the extent to which new technologies and knowledge diffuse to NF firms
and in due course to laggards will depend on a host of policy and structural factors. In this context,
aggregate productivity will be shaped by two main factors:
Productivity-enhancing investments within each firm, particularly in knowledge based capital
(KBC) such as R&D and organisational capital; and
A market environment that facilitates the growth of the most productive firms.
30. These two factors interact since firms’ productivity-enhancing investments (especially in KBC)
will also be shaped by their perceptions of the costs and benefits of implementing and commercialising
new ideas, the ability to scale-up activity if successful or to exit at low cost if unsuccessful, which each
depend on the ease of reallocating resources to their best use.14
13 This tendency is exacerbated for larger technological lags of non-frontier firms that might not have the absorptive
capacity to learn from a foreign knowledge base.
14 If the costs of reallocation are too high, firms may be discouraged from productivity enhancements or focus merely on
incremental improvements, rather than experiment with risky technologies, because it will be more difficult to realise

ECO/CPE/WP1(2015)6
25
Figure 10. A stylised depiction of the factors shaping aggregate productivity growth
Source: OECD Secretariat
31. The remainder of this section elaborates on this framework, and discusses: i) developments at the
global productivity frontier; ii) the diffusion of innovations and best practices; and iii) firm heterogeneity
and reallocation.
3.1 The global productivity frontier
32. Research on the global frontier (GF) is scarce – e.g. most existing studies take developments at
the GF as a given – and industry level MFP studies (see Bourles et al., 2013) often assume that one country
(i.e. the United States) occupies the position of the global leader.15
However, new OECD evidence – which
identifies the 100 most globally productive firms in each industry at the frontier each year – shows that the
global productivity frontier is actually comprised of firms from different countries, reflecting varying
patterns of comparative advantage and natural endowments. Moreover, they are very much “global firms”
in the sense that they operate in different countries (often part of a MNE group16
), and are interconnected
with suppliers/customers from different countries along global value chains (GVCs). This carries important
policy implications, as discussed in Section 5.1.
33. Given the difficulties in measuring technology, the globally most productive firms are also
assumed to operate with the globally most advanced technologies but it should be recognised that very
technologically advanced firms might not necessarily appear as the globally most productive or the most
successful in terms of profits.17
34. Firms at the global productivity frontier are on average 4-5 times more productive than non-
frontier firms in terms of MFP, while this difference is more than 10 times with respect to labour
the benefits when successful and contain losses when unsuccessful (Bartelsman, 2004). Put differently, policies may
provide direct incentives for within-firm productivity improvements but such incentives may also be enhanced by
policies that facilitate between-firm reallocations (see Andrews and Criscuolo, 2013).
15 For example, in the Bourles et al., (2013) dataset comprising 15 OECD countries and 20 industries over the period
1984-2007, the United States occupied the leader position in almost 60% of cases.
16 Based on the definition in Figure 11, the probability that a GF firm is part of a MNE group structure is around 0.42,
compared to 0.29 for non-frontier firms. This difference is statistically significant at the 1% level.
17 This might be driven by high levels of R&D investments that are not (yet) matched by high sales values.

ECO/CPE/WP1(2015)6
26
productivity (which includes capital intensity).18
Figure 11 charts the evolution of labour productivity for
firms at the global productivity frontier, non-frontier firms and all firms for the years for which comparable
data are available. GF firms have become relatively more productive over the 2000s, expanding at an
average annual rate of 3½ per cent in the manufacturing sector, compared to an average growth in labour
productivity of just ½ per cent for non-frontier firms. While data limitations make it difficult to say
whether growth has slowed relative to earlier periods, it is interesting that frontier growth remained robust
after 2004, when aggregate productivity in advanced economies (e.g. the United States) began to slow.
35. More importantly, the rising gap in productivity growth between firms at the GF and other firms
since the beginning of the century suggests that the capacity of other firms in the economy to learn from
frontier may have diminished. This is consistent with: i) longer run evidence on the penetration rates of
new technologies (e.g. Comin and Mestieri, 2013); ii) winner takes all dynamics (Gabiax and Landier,
2008); and iii) the rising importance of tacit knowledge. With respect to the latter, it is likely that the
competitive advantage of GF firms arises not only from their investments in KBC, but how they tacitly
combine different types of intangibles – e.g. computerized information; innovative property and economic
competencies – in the production process.
Figure 11. Solid growth at the global productivity frontier but spillovers have slowed down
Labour productivity; index 2001=0
Notes: “Frontier firms” corresponds to the average labour productivity of the 100 globally most productive firms in each 2-digit sector in ORBIS. “Non-frontier firms” is the average of all other firms. “All firms” is the sector total from the OECD STAN database. The average annual growth rate in labour productivity over the period 2001-2009 for each grouping of firms is shown in parentheses. The broad patterns depicted in this figure are robust to: i) using different measures of productivity (e.g. MFP); ii) following a fixed group of frontier firms over time; and iii) excluding firms that are part of a multi-national group (i.e. headquarters or subsidiaries) where profit-shifting activity may be relevant.
Source: see ECO/CPE/WP1(2015)6/ANN2.
36. Firms at the global productivity frontier are typically larger, more profitable, and more likely to
patent, than other firms. Moreover, they are on average younger, consistent with the idea that young firms
possess a comparative advantage in commercialising radical innovations (Henderson, 1993; Baumol, 2002)
and firms that drive one technological wave often tend to concentrate on incremental improvements in the
subsequent one (Benner and Tushman, 2002). However, the average age of firms in the global frontier has
been increasing since 2001 (Figure 12). To the extent that this reflects a slowdown in the entry of new
18
This difference is statistically significant at the 1% level and is based on a sample of 3657 frontier firms and 294031
non-frontier firms in 2005.

ECO/CPE/WP1(2015)6
27
firms at the global frontier, it could also foreshadow a slowdown in the arrival of radical innovations and
productivity growth.19
Figure 12. Firms at the global productivity frontier have become older
Average age (years) of firms in the frontier and non-frontier groups
Notes: Frontier is measured by the top 100 firms in each 2-digit industry and each year, based on Solow residual-based MFP. The difference in firm age between 2001 and 2009 is statistically significant, for frontier and non-frontier firms alike.
Source: see ECO/CPE/WP1(2015)6/ANN2.
3.2 Diffusion of innovations and best practices
37. It is important to understand the factors which shape the ability of firms that are the most
advanced at home to learn from the globally most advanced firms. This learning creates scope for the
diffusion of technologies and business practices from the home frontier firms to laggard firms within the
same country. Moreover, given that cross-country differences in penetration rates of new technologies have
increased over time (Comin and Mestieri, 2013), understanding barriers to the diffusion of unexploited
existing technologies from national frontier firms to laggards is key in understanding cross-country
differences in aggregate performance.
38. The working hypothesis in Figure 10 is that the capacity of home frontier firms to capitalise on
new technologies developed abroad is enhanced by three key factors: i) openness to trade and global factor
mobility; ii) the potential for up-scaling; and iii) competitive pressures to invest in KBC.
3.2.1 Openness and global factor mobility
39. An economy’s ability to sustain productivity growth via learning from the global frontier will
depend on trade and international investment. More specifically, it will hinge on its degree of
interconnectedness with countries that are at the global frontier in the traded goods and services or
investment areas. Firms that make it to the global market, via trade and foreign direct investment, are a
group of “selected” companies that are larger, more innovative and more skill-intensive (i.e. they belong to
the national frontier).20
Exposure to trade and FDI entails exposure to knowledge and know-how of the
19
An alternative explanation is that this reflects the emergence of a market for innovation whereby incumbents buy
innovations via merger and acquisitions with young firms.
20 See Eaton et al., (2011) for evidence on goods traders and Breinlich and Criscuolo (2011) on services traders.

ECO/CPE/WP1(2015)6
28
“best” foreign and domestic firms (Alvarez et al., 2013). Learning takes place from competing global firms
but even more along GVCs from suppliers and customers, and will also be facilitated by closer
geographical proximity, particularly in high-tech sectors where knowledge is tacit (see Box 5 for details on
the channels linking trade and productivity).
40. Migration – particularly of high-skilled individuals – may also push the frontier, enhance
diffusion and propel innovation more generally (Alesina and La Ferrara, 2005; Kerr 2008; OECD 2008). In
particular, birthplace diversity enhances variety in ability and knowledge, which in turn supports
innovation (Alesina et al., 2013). Using data on cross-country flows of scientists, Appelt et al., (2015) find
evidence which supports the circular nature of knowledge flows, as opposed to the traditional brain
gain/drain paradigm. More specifically, brain circulation – which might stimulate knowledge flows,
collaboration and ultimately high impact research – tends to be enhanced by a countries’ degree of physical
proximity, service trade connections and common language and scientific subject specialisation, while it
might be hindered by visa restrictions.
Box 5. Trade and productivity
There is a vast literature documenting the positive effects of trade on productivity performance. In general, these effects are realized through three key channels:
Trade openness leads to tougher product market competition, which in turn promotes productivity-enhancing reallocation via the expansion of the most productive firms into foreign markets and exit of low productivity firms (Melitz, 2003; Melitz and Ottaviano, 2008; Melitz and Trefler, 2012).
Trade and foreign direct investment enhance knowledge flows from global customers and suppliers (Crespi et al., 2008; Duguet and MacGarvie, 2005) and from the activities of multinational firms. Enhanced knowledge exchanges will take place within the multinational firm itself (Criscuolo et al., 2010), both from the headquarters to their affiliates and vice versa, via reverse technology transfer (Griffith et al., 2006), and from the multinationals to local economic agents and vice versa (Puga and Trefler, 2010). Moreover, domestic firms that trade are put in touch with the most efficient foreign and domestic producers that are able to compete on international markets and thus get them closer to the global frontier (Alvarez et al., 2013).
Trade openness increases the effective market size, which magnifies the expected profits arising from the successful adoption of foreign technologies (Schmookler, 1966; Acemoglu and Lin, 2004).
Although trade plays a key role in facilitating learning from the frontier (Alvarez et al., 2013), geographical distance remains an important obstacle to sharing knowledge given its tacit and non-codifiable nature and the local nature of spillovers. This is true for embodied and even more so for disembodied knowledge transfer (Keller and Yeaple, 2013). Recent evidence from the timing of patent citations, which captures the time it takes for a patented innovation to be used in subsequent patents (Griffith et al., 2011; Aldieri, 2011) and evidence from knowledge sharing through patent transactions (Mowery and Ziedonis, 2001; Drivas and Economidou, 2014) show that proximity is still important for market and non-market transacted knowledge diffusion, even though its importance has been decreasing recently.
3.2.2 Up-scaling
41. While trade can facilitate learning, firms must overcome a number of hurdles before they can
trade. A key barrier is insufficient scale to the extent that international trade entails a number of fixed costs
that must be met (Melitz, 2003).21
Firm size tends to grow with the effective market size, implying that
small and geographically isolated economies will be at a natural disadvantage in this regard. This
disadvantage will be compounded by the fact that participation in trade results in larger market size, which
in turn raises the returns to investments in R&D (Acemoglu and Lin, 2004; de Serres et al., 2013).
Reaching sufficient scale takes on heightened importance given rising global integration. All else equal,
tougher global competition implies that the ‘minimum’ level of performance in terms of size (and
21 This is consistent with the finding that a relatively small share of large firms accounts for the lion’s share of an
economy’s exports (Eaton et al., 2011; Breinlich and Criscuolo, 2011).

ECO/CPE/WP1(2015)6
29
productivity) at which firms are able to compete on global markets may have risen over time (Altomonte et
al., 2011).22
Reaping the benefits of firm growth will depend on potential barriers to up-scaling and up-
grading, underscoring the importance of efficient reallocation and the significant opportunity costs of high
rates of skill mismatch in some OECD economies, which are factors that are strongly influenced by the
policy environment.
3.2.3 Knowledge-based capital and competition
42. The diffusion of ideas from the global frontier firms to home frontier firms also requires
complementary investments in KBC, to facilitate the absorption and implementation of new ideas. In this
regard, a strong domestic R&D sector is important for countries’ ability to benefit from new discoveries by
facilitating the adoption of foreign technologies (Griffith et al., 2004). Some aspects of new technologies
are difficult to codify and require practical investigation before they can be properly incorporated into
production processes and thus the availability of researchers that can de-mystify “tacit” knowledge plays a
crucial role. Moreover, implementing and realising the full productivity benefits from new technologies
(such as ICT) entails significant organisational restructuring, which requires considerable managerial skill
(Bloom et al., 2012a).
43. The diffusion of existing technologies from the most advanced national firms to the rest of the
economy will be shaped by the degree of competitive pressure and barriers to the diffusion of investment
in KBC. Increases in competition induced by international trade shocks reduces the market share and
profits of low productivity (or import-competing) firms, which increases these firms’ incentives to adopt
better technologies (Perla et al., 2015; Bloom et al., 2011).23
Technological adoption will also be swifter in
institutional settings that are less susceptible to lobbying by producers of incumbent technologies (Comin
and Hobjin, 2009). Even so, persistent barriers to the diffusion of existing technologies remain, including
the role of technological knowledge – i.e. “knowledge about technology and how to use it productively”.
Put differently, knowledge is accumulated by using new technologies but using new technologies is what
facilitates the absorption of technological knowledge.24
Increases in the complexity of technologies over
time may have also increased the amount and sophistication of complementary investments required for
technological adoption.25
44. While these hurdles to technological adoption are significant, they may be partly overcome by
removing barriers to improvements in managerial quality. Indeed, aggregate level evidence suggests that
an economy’s speed of convergence to its long-run steady state level of MFP is positively related to the
quality of its managerial capital (Andrews and Westmore, 2014). This is likely to reflect the
aforementioned complementarity between technological adoption and managerial capital, but also the
tendency for better managed firms to be more effective in matching workers to jobs (i.e. they are less
susceptible to skill mismatch; Section 5.4). Greater R&D collaboration between firms and universities
might also facilitate the technological diffusion to laggards by providing smaller and less productive firms
with access to sources of knowledge – e.g. the necessary set of advanced machinery and skilled scientists
and personnel – that typically require large upfront investments.
22
This argument should not be overstated given the rise of: i) “micro-multinationals” – i.e. start-up firms that start global;
and ii) ICT, which enables firms to outsource and establish a global presence more quickly.
23 Similarly, evidence from Spain shows that firms with an initially low productivity increase their productivity in
response to increased import competition, whereas firms with an initially high productivity increase their productivity
as response to access to export markets (Steinwender, 2015). 24
Diego Comin’s comments at the OECD-NBER Conference on Productivity and Innovation in the Long-Run. 25
Chad Syverson’s comments at the OECD-NBER Conference on Productivity and Innovation in the Long-Run.

ECO/CPE/WP1(2015)6
30
3.3 Firm heterogeneity and reallocation
45. An economy’s potential to have global frontier firms or to adopt frontier innovations will also
depend on its ability to reallocate scarce resources to the most productive firms (Andrews and Criscuolo,
2013). The widespread heterogeneity in firm performance that is evident within even narrowly defined
sectors has important aggregate consequences (Syverson, 2011). Aggregate productivity could be lower
than otherwise due to a technological gap of the national relative to the global frontier (e.g. country A and
B to varying degrees); a weak market selection, which enables too many bad performers to survive in the
market (country C); or both (Figure 13). For example, average productivity is identical in both countries B
and C, despite the presence of global frontier firms in the latter but the long tail of low productivity firms
weighs on aggregate productivity in Country C.
Figure 13. Stylised depiction of how differences in productivity spreads matter for policy
Source: Adapted from Bartelsman et al., (2008).
46. Coexistence of poorly performing firms with star performers can be due to a number of factors,
but barriers to exit and skill mismatch clearly play a role. The opportunity cost of such barriers and
mismatch can be large as – at least in the short to medium-run – firms’ innovation activities draw from a
scarce and fixed pool of contestable resources, particularly skilled labour. Thus, trapping resources in
relatively small and low productivity firms (Section 4.2) can hinder the growth prospects of more
innovative firms (Acemoglu et al., 2013). Similarly, the significant incidence of skill mismatch –
particularly over-skilling – is harmful to aggregate productivity because it constrains the growth of the
most productive firms (Section 4.3). These frictions may explain why national frontier firms are undersized
in some economies, greatly diminishing their aggregate impact (Section 4.2).
4. Enhancing productivity in a globalised world
47. This section examines some key factors that are likely to increasingly affect future productivity
performance, which centre on: i) facilitating global learning spillovers; ii) allowing productive firms to
thrive; and iii) making the most of human capital.

ECO/CPE/WP1(2015)6
31
4.1 Facilitating global learning spillovers
48. Consistent with the framework laid out in Figure 10, the ability to learn from the global frontier is
stronger in economies that are more connected with the global frontier via trade; are more integrated in
global value chains (GVCs); allocate skills more efficiently and invest more in KBC, such as R&D and
managerial capital, and ICT readiness (Figure 14). The role of trade is particularly important: assuming a
2% acceleration in MFP growth at the frontier, the estimated gain to annual MFP growth would be around
1/3 percentage points higher in a country which trades very intensively with the frontier economy (e.g.
Canada), than in one where such trade is relatively weak (e.g. Austria).
Figure 14. Learning from the global frontier is shaped by key structural factors
% difference in frontier spillover effect between maximum and minimum value of each structural variable, assuming 2% MFP growth at the frontier
Notes: Trade with the global frontier measures the intensity of trade with the productivity leader in each manufacturing industry (Minimum: Austria, Maximum: Canada). GVC Participation is based on the measure in Figure 15 (Minimum: Canada, Maximum: Belgium). Efficiency of skill allocation (Minimum: Italy, Maximum: Belgium) and managerial quality (Minimum: Italy, Maximum: Finland) are sourced from Annex 4. Business R&D is defined as the ratio of business R&D expenditures to value added and sourced from OECD, Main Science and Technology Indicators (Minimum: Australia, Maximum: Sweden). E-government readiness index (Minimum: Greece, Maximum: the Netherlands) is from OECD, Internet Economy Outlook 2012.
Source: see ECO/CPE/WP1(2015)6/ANN5.
49. The strong link between trade, globalisation and productivity growth (Box 5) carries significant
implications for future productivity. While globalisation is likely to continue in the future, this may take
place at a slower pace than observed recently (Braconier et al., 2014).26
The intensity of fragmentation of
GVCs may also slow down as there are likely physical limits on how much a product and task can be
fragmented (Fontagné and Fouré, 2013).27
Thus, on the one hand, rising trade integration is projected to
boost MFP growth over coming decades, by improving: i) the returns to innovations at the frontier due to
market size effects; ii) the speed of convergence to economies’ long-run steady states (Johansson et al.,
2013); and iii) the effectiveness of learning from the frontier for those economies that trade more
26 World trade estimated to grow by 3.5% annually over the next 50 years, compared with 6.9% over 1990-2007, since
the gains from the global integration of large emerging economies (e.g. China) will not be repeated.
27 However, there is more uncertainty surrounding this development, given: i) scope to increase GVC participation in
some countries; ii) the potential for reshaping of GVCs along regional dimensions as the centre of global economic
gravity shifts; and iii) possible re-shoring as the cost advantages of emerging countries dissipate.

ECO/CPE/WP1(2015)6
32
intensively with frontier economies. On the other hand, with the positive effects on productivity of the
globalisation shock – triggered by the emergence of China – likely to fade and uncertainties regarding the
further fragmentation of GVCs,28
a key issue for future productivity is how to best capitalise on the
benefits of GVC participation.
4.1.1 The rise of global value chains
50. Economies participate in GVCs both as users of foreign inputs and as suppliers of intermediate
goods and services that can be used in other economies’ exports (OECD, 2013b). GVC participation has
risen in most economies since the mid-1990s, although important cross-country differences remain (Figure
15, Panel A). GVC participation tends to be higher in small open economies – such as Luxembourg and
Eastern Europe – than in economies with large domestic markets such as the United States and Japan. In
contrast, GVC participation falls as the reliance on primary exports and distance to market increase – two
relevant factors for Australia and New Zealand.
51. GVC participation may boost productivity via a number of channels, including stronger
competitive pressures that reduce the cost of intermediate inputs and access to a wider variety of foreign
inputs that embody more productive technologies. Indeed, MFP grew more quickly in those industries that
experienced larger increases in GVC participation (Annex 5) and suggests that raising GVC participation
to higher levels would be associated with significant productivity gains in a number of OECD countries
(Figure 15; Panel B). These potential gains to productivity come on top of the more effective learning from
the frontier that is also associated with higher GVC participation (Figure 14). Of course, the likelihood that
more productive firms self-select into GVC participation makes causality difficult to establish and thus
these numbers should be interpreted with caution.
Figure 15. Rising GVC participation and links with productivity growth
A: GVC participation
28 The removal of product-specific quotas (on Chinese imports into Europe) following China’s accession to the WTO
triggered a significant increase in R&D, patenting and productivity in European firms (Bloom et al., 2011).
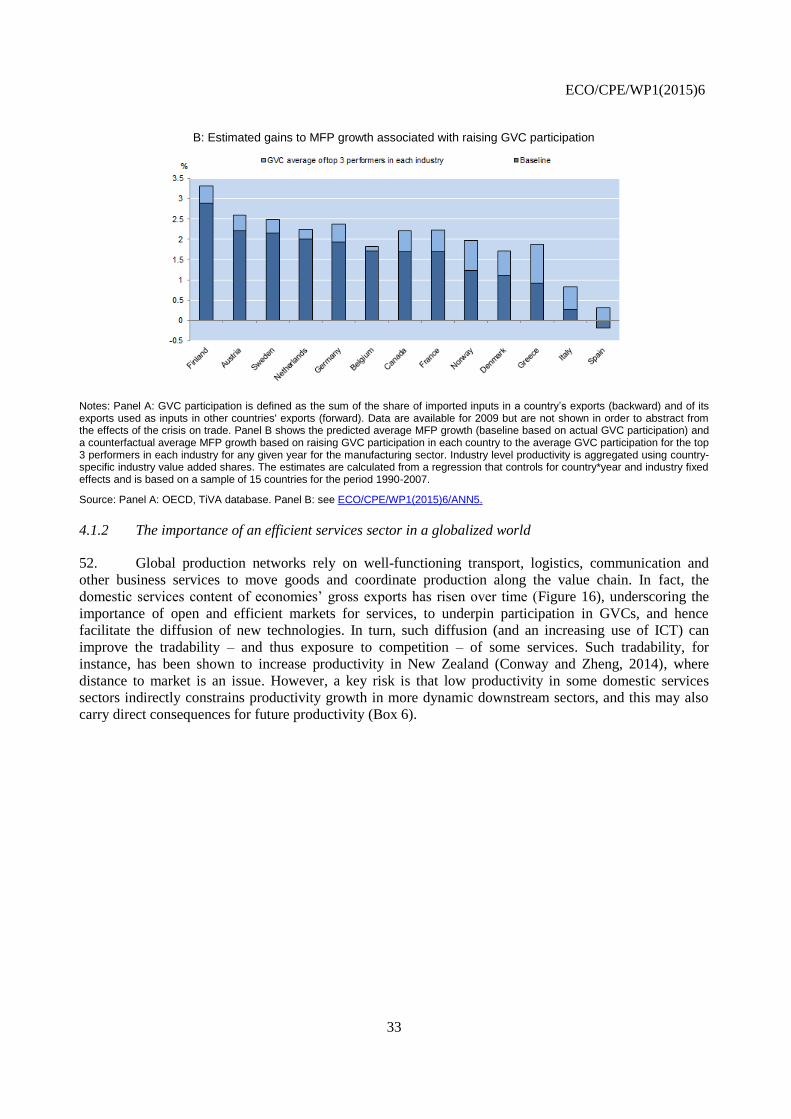
ECO/CPE/WP1(2015)6
33
B: Estimated gains to MFP growth associated with raising GVC participation
Notes: Panel A: GVC participation is defined as the sum of the share of imported inputs in a country’s exports (backward) and of its exports used as inputs in other countries' exports (forward). Data are available for 2009 but are not shown in order to abstract from the effects of the crisis on trade. Panel B shows the predicted average MFP growth (baseline based on actual GVC participation) and a counterfactual average MFP growth based on raising GVC participation in each country to the average GVC participation for the top 3 performers in each industry for any given year for the manufacturing sector. Industry level productivity is aggregated using country-specific industry value added shares. The estimates are calculated from a regression that controls for country*year and industry fixed effects and is based on a sample of 15 countries for the period 1990-2007.
Source: Panel A: OECD, TiVA database. Panel B: see ECO/CPE/WP1(2015)6/ANN5.
4.1.2 The importance of an efficient services sector in a globalized world
52. Global production networks rely on well-functioning transport, logistics, communication and
other business services to move goods and coordinate production along the value chain. In fact, the
domestic services content of economies’ gross exports has risen over time (Figure 16), underscoring the
importance of open and efficient markets for services, to underpin participation in GVCs, and hence
facilitate the diffusion of new technologies. In turn, such diffusion (and an increasing use of ICT) can
improve the tradability – and thus exposure to competition – of some services. Such tradability, for
instance, has been shown to increase productivity in New Zealand (Conway and Zheng, 2014), where
distance to market is an issue. However, a key risk is that low productivity in some domestic services
sectors indirectly constrains productivity growth in more dynamic downstream sectors, and this may also
carry direct consequences for future productivity (Box 6).

ECO/CPE/WP1(2015)6
34
Figure 16. Global production networks increasingly rely on the domestic services sector
Value-added share of domestic services in gross exports
Source: OECD TiVA database.
Box 6. Structural transformation and productivity
The share of services in economic activity has risen over time, and population ageing is likely to underpin a further shift in demand towards services. This carries important implications for future productivity to the extent that productivity in domestic services is generally low, consistent with lower competitive pressure, relatively inefficient resource allocation (Figure 2B) and low managerial quality (Section 5.3).1 While over the short to medium term, the impact of inter-sectoral reallocation on aggregate productivity is relatively modest (Mora-Sanguinetti and Fuentes, 2012; Meehan, 2014), the rising share of services may also weigh on aggregate productivity via input-output linkages. Moreover, over the longer run, models of structural transformation suggest that while most countries have experienced substantial productivity catch-up in agriculture and industry relative to the United States, the productivity gap in most services has remained high (Duarte and Restuccia, 2010). This is consistent with the firm level analysis in Figure 11, which shows that the rising gap in the productivity growth of GF firms and other firms is stronger in services than manufacturing. Thus, as economies move through the process of structural transformation, they can initially experience a period of catch-up driven growth but then later stagnate, due to the low productivity in the services sector.
Figure 2B. Resources are allocated less efficiently in the services sector
Contribution of the allocation of employment across firms to the level of labour productivity; per cent
Notes: The estimates show the extent to which firms with higher than average labour productivity have larger employment shares. For example, productivity in the manufacturing sector in the US is around 60% higher due to the actual allocation of employment, compared to a baseline in which labour is allocated randomly across firms (index=0).
Source: Andrews and Cingano (2014).
1. The measurement of productivity in services is clearly an issue and there is also heterogeneity within the services sector, with some business services increasingly exposed to international competition, thus raising their productivity.

ECO/CPE/WP1(2015)6
35
4.2 Allowing productive firms to thrive
4.2.1 Significant productivity gains from improving the performance of national frontier firms
53. One way to raise aggregate productivity is to improve the performance of national frontier firms
towards the global productivity frontier. By way of illustration, Figure 17 shows that overall manufacturing
sector labour productivity would be around 20% higher in Italy but little changed in the United States if
national frontier firms were as productive and large as the global frontier benchmark (Annex 2). More
specifically, in Italy, approximately three-quarters of this productivity gap can be explained by the fact that
national frontier firms – while actually quite productive in global terms – are relatively small compared to
those at the global frontier. A similar phenomenon is also observed in the auto-parts manufacturing sector
in Mexico (Bolio et al., 2014). By contrast, while national frontier firms in the United States are larger than
those at the global frontier, aggregate productivity could rise by around 10% if they were also as
productive as those at the global frontier.29
Figure 17. Performance gaps between the national and global frontier: a two-country example
How much would overall manufacturing sector productivity rise if firms at the national frontier were as productive and large as firms at the global frontier?
Notes: The productivity (size) gap shows how much higher manufacturing productivity would be relative to baseline if the national frontier firms (NF) were as productive (large) as the global frontier (GF) benchmark. The cross term shows the impact on aggregate productivity of simultaneously closing the productivity and size gaps. The estimates are constructed by taking the difference between counterfactual labour productivity and actual labour productivity. The counterfactual gaps are estimated by replacing the labour productivity (employment) of the top 10 NF firms with the labour productivity (employment) of the 10th most globally productive firm in each two-digit sector. The industry estimates are aggregated using US employment weights.
Source: see ECO/CPE/WP1(2015)6/ANN2.
54. Overall, these differences in the size of national frontier firms are consistent with recent firm-
level research for the broader economy which highlights that: i) the share of small firms is much higher in
Italy, than in the United States and other OECD countries (Criscuolo et al., 2014); and ii) the United States
is much more successful than Italy at channelling scarce resources to the most productive firms (Andrews
and Cingano, 2014) and to innovative firms (Andrews et al., 2014). They are also informative from a
policy perspective, and suggest that policy reforms in Italy should focus on improving the efficiency of
29 This sizeable productivity gap effect reflects the relative efficient allocation of resources in the United States – i.e. the
most productive firms command a high share of resources – which effectively magnifies the aggregate gains of
aligning the productivity of the national frontier with the global benchmark.

ECO/CPE/WP1(2015)6
36
resource reallocation mechanisms, while in the United States, policies that can improve within-firm
productivity decisions could yield a greater marginal benefit. The types of policies that might be effective
in closing these performance gaps are discussed in Section 5.
4.2.2 But achieving these gains is difficult when market selection and post-entry growth are weak
55. The significant differences in the size of national frontier firms across countries extend to the
whole population of businesses and intensify with the age of the firm. To a certain extent, these differences
reflect barriers to up-scaling after firm entry. Indeed, cross-country differences in the post-entry
performance tend to be more marked than differences in entry and exit patterns (Bartelsman et al., 2003).
While there are different ways to investigate differences in up-scaling across countries,30
this section
focuses on: i) the share of small firms that are relatively old, which is negatively related to aggregate MFP
and employment growth (see Sections 2.3 & 3.3; Criscuolo et al., 2014); and ii) post-entry growth patterns,
which reveal important cross-country differences in the ability of firms to achieve sufficient scale to enter
global markets (Section 3.2).
56. If small firms are (on average) old, this might reflect barriers to post-entry growth and weak
market selection mechanisms. For instance, only 22% of small firms in Finland – which account for 41%
of total employment – can be classified as “young” (i.e. less than 5 years old), against more than 50% in
the United States and other countries (Figure 18, Panel A). There are also significant cross-country
differences in the relative sizes of old and new businesses: while old businesses in the United States are
more than seven times larger than start-ups, this ratio drops to just above two in Italy and Norway, and
below two in France, Finland or the Netherlands (Figure 18, Panel B).
57. Similar differences can be observed following cohorts of firms across countries. A key message
is that creative destruction and up-or-out dynamics are central: entry matters but what happens next is
crucial – all else equal, young firms should grow rapidly or exit (i.e. “up-or-out”) but not linger and
become small-old firms. In this regard, comparing countries with similar survival rates but significantly
different post-entry growth patterns – e.g. Sweden vs Italy and Finland vs New Zealand – is instructive
(Figure 19).
58. Survival rates are relatively high in both Sweden and Italy – i.e. above 50% after 7 years.
However, post-entry employment growth tends to flatten out in Italy in the years following initial market
entry, while surviving firms in Sweden on average are more than 200% larger 7 years after entry, which is
more than double the growth observed in Italy. In Sweden, high survival rates might be symptomatic of an
efficient selection of firms at entry, which results in a high proportion of firms with strong growth
potential. By contrast, it is more likely to reflect a weak selection process in Italy, which might result in
resources being used by a larger proportion of less productive firms that do not exit and thus stifle the
growth opportunities of more productive firms.
59. By contrast, survival rates are relatively low in both Finland and New Zealand (about 40% of an
entry cohort survives after 7 years) and post-entry growth exhibits monotonic patterns over time. At first
glance, this suggests a healthy creative destruction process that facilitates experimentation and firm growth
(exit) in the event of success (failure). However, the magnitude of post-entry growth rates in New Zealand
is about one-half of that observed in Finland, possibly reflecting the barriers to up-scaling related to
geographical remoteness and small market size in New Zealand.
30 Focusing on size per se might be misleading because a large share of small firms (or small average firm size) might
reflect a large share of start-ups experimenting at small scale due to low entry costs.

ECO/CPE/WP1(2015)6
37
Figure 18. The strength of market selection and post-entry growth varies across countries
A: Many small and old firms suggest less intense market selection in some countries
B: Post-entry growth – average size of young and old firms
Notes: Panel A shows the share of firms by age group in the total number of micro and small firms (below 50 employees). The numbers at the top of the chart shows the share of small firms in the overall population of firms. Panel B reports the average size of start-up firms (from 0 to 2 years old) and firms more than 10 years old. See notes to Figure 6 for details on the sample.
Source: Criscuolo, Gal and Menon (2014).
Figure 19. Up-or-out dynamics vary across countries
Firm growth and survival rates, by firm age
Notes: Based on preliminary data from the Dynemp v.2 project. The dots report the average survival rates after 3, 5 and 7 years for start-ups (less than 10 employees) of the 2001; 2004 and 2007 cohorts. The bars report average growth rates relative to their initial size. Values are averaged across all available years. See Figure A6 for a broader set of countries.
Source: Calvino et al., (2015). See DSTI/IND(2015)5.

ECO/CPE/WP1(2015)6
38
4.3 Making the most of human capital
60. While increases in the number of highly educated workers have significantly boosted labour
productivity over the past 50 years, the rate of increase in the stock of human capital is projected to slow.
At the same time, the increasing economic importance of knowledge is projected to raise the returns to
skills, thus underpinning further increases in wage inequality within countries (Braconier et al., 2014). In
order to mitigate this unfavourable combination of slowing growth and rising inequality, it will become
increasingly important to allocate skills efficiently.31
This is also important since the benefits of human
capital-augmenting policies take a long time to be realised, while improving the allocation of skills will
enhance the ‘bang-for-the-buck’ (i.e. productivity impact) of such policies.
61. Indicators of skill mismatch, constructed from the OECD Survey of Adult Skills (see Box 7 for
details), suggest that there is considerable scope to improve the efficiency of human capital allocation and
labour market matching more generally. On average across countries, roughly one-quarter of workers
report a mismatch between their existing skills and those required for their job – i.e. they are either over or
under-skilled. Moreover, important cross-country differences emerge, with the incidence of skill mismatch
ranging from around one-third in Italy, Spain and the Czech Republic, to less than one-fifth in a diverse set
of countries, including Poland, Sweden and the United States (Figure 20). Over-skilling is generally more
common than under-skilling, with being over-skilled on average roughly two and a half times more
widespread than being under-skilled (Figure A7).
Figure 20. Cross-country differences in skill mismatch are significant
Percentage of workers with skill mismatch; selected OECD countries, 2011-12
Note: The figure shows the percentage of workers who are either over- or under- skilled (see Box 7 for definitions), for a sample of 11 market industries: manufacturing; electricity, gas, steam and air conditioning supply; water supply; construction; wholesale and retail trade; transportation and storage; accommodation and food service activities; information and communication; real estate activities; professional, scientific and technical activities, and administrative and support service activities. In order to abstract from differences in industrial structures across countries, the 1-digit industry level mismatch indicators are aggregated using a common set of weights based on industry employment shares for the United States.
Source: See ECO/CPE/WP1(2015)6/ANN4, which is based on the Survey of Adult Skills (2012).
31
Rising inequality might also reduce the effective human capital pool if it undermines the education opportunities for
disadvantaged individuals (Cingano, 2015). While this issue is beyond the scope of this paper, it suggests that a range
of education and social welfare policies may also matter for long term productivity.

ECO/CPE/WP1(2015)6
39
Box 7. Measuring skill mismatch from the OECD Survey of Adult Skills
The Survey of Adult Skills assesses the proficiency of adults aged between 16 and 65 in literacy, numeracy and problem solving in technology-rich environments in 22 OECD countries.1 Besides the level of skills, information was collected on the background of respondents, their education and labour market experience, their skill use at work and at home plus indicators of well-being. The Survey, conducted in 2011-12, has a number of advantages over comparable datasets as it extends the number of countries, sample size per country and the range of assessed skills.
As discussed in Annex 4, skill mismatch can be measured in several ways, each with their advantages and disadvantages. One is through self-assessment by asking workers to compare their skill level and that required for their job. Another approach is to compare the skill levels – as measured by proficiency scores – to skill use at work. A final approach, developed in OECD (2013c) and employed in this analysis, combines information on self-reported skill mismatch and quantitative information on skill proficiency by:
1. The (literacy) proficiency scores of workers who report themselves as well-matched – i.e. those who neither feel they have the skills to perform a more demanding job nor feel the need for further training in order to be able to perform their current job satisfactorily – are used to create a quantitative scale of the skills required to perform the job for each occupation (based on 1-digit ISCO codes). 2
2. Using this scale of proficiency scores of well-matched workers, minimum and maximum threshold values – based on the 5th and 95th percentile, for example – are identified, which effectively provide the bounds that define what it is to be a well-matched worker.3
3. Respondents whose scores are lower (higher) than this minimum (maximum) threshold in their occupation and country, are classified as under- (over-) skilled. By contrast, respondents whose proficiency scores reside within these bounds are not counted as mismatched, regardless of whether they self-report as being well-matched or mismatched.
1. AUS, AUT, BEL, CAN, CZE, DNK, EST, FIN, FRA, DEU, IRL, ITA, JPN, KOR, NLD, NOR, POL, SVK, ESP, SWE, GBR and USA.
2. Literacy is defined as the ability to understand, evaluate, use and engage with written texts to participate in society, to achieve one’s goals, and to develop one’s knowledge and potential.
3. The analysis here uses different threshold values based on the 10th and 90th percentiles.
62. New OECD research uses cross-country data to explore the direct relationship between mismatch
and industry-level labour productivity indicators, constructed from firm level data (Annex 4). Skill
mismatch and aggregate productivity could be related through two channels: lower (or higher) within-firm
productivity and a less efficient allocation of labour across firms. Higher skill mismatch is found to be
associated with lower labour productivity via the channel of less efficient resource allocation. Furthermore,
this largely reflects the strong negative correlation between over-skilling and productivity. One explanation
for this could be that as firms draw from a scarce and fixed pool of skilled labour, trapping resources in
relatively low productivity firms – which tends to occur in industries with a high share of over-skilled
workers – can make it more difficult for more productive firms to attract skilled labour and gain market
shares at the expense of less productive firms.32
63. Based on these results, Figure 21 illustrates the potential gains to labour productivity from
reducing skill mismatch in each country to the lowest cross-country level in each industry.33
If interpreted
causally, reducing skill mismatch in countries such as Italy and Spain to the lowest level would be
associated with an increase in allocative efficiency of around 10%. This accounts for about one-fifth of the
gap in non-farm business sector allocative efficiency between Italy and the United States (or Sweden).
Hence, skill mismatch can potentially account for a non-trivial share of cross-country labour productivity
gaps, thus motivating an analysis of the link between policies and mismatch.
32 Moreover, these effects of mismatch on resource allocation are sizeable enough to more than offset any private
productivity benefit that may accrue to the firms that actually employ these over-skilled workers.
33 This exercise primarily focuses on allocative efficiency as opposed to overall labour productivity to the extent that
fewer cross-country or cross-sector comparability issues arise with respect to the former.

ECO/CPE/WP1(2015)6
40
Figure 21. Counterfactual productivity gains from reducing skill mismatch
Simulated gains to allocative efficiency from reducing skill mismatch to the lowest level; per cent
Note: The chart shows the difference between the actual allocative efficiency and a counterfactual allocative efficiency based on lowering the skill mismatch in each country to the best practice level of mismatch, which implies a productivity gain of around 10% in Italy and 3% in the United States. 1-digit industry level mismatch indicators are aggregated using a common set of weights based on the industry employment shares for the United States. The estimated coefficient of impact of mismatch on productivity is based on a sample of 19 countries for which both firm level productivity and mismatch data are available. While mismatch indicators are available for AUS, CAN and IRL, the estimates for these three countries should be interpreted with caution to the extent that they are not included in the econometric analysis due to insufficient productivity data.
Source: see ECO/CPE/WP1(2015)6/ANN4.
5. The role of public policy
64. Table 1 summarises the key channels through which different public policies shape productivity
performance, in the context of the framework for analysis and relevant issues identified in Sections 3 and
4. Column 1 points to three key sources of aggregate productivity growth to be promoted: i)
experimentation with new knowledge and technologies in the globally most advanced firms and their
subsequent diffusion to the most advanced firms at the national level; ii) the diffusion of globally available
knowledge and technologies to both advanced and laggard firms at home; and iii) the efficient reallocation
of resources to enhance the aggregate impact – and further encourage – the within-firm productivity
improvements that will be realised from the previous two key channels. Columns 2 to 4 contain the
relevant policies, channels through which these sources of growth can be promoted and the outcome that
the policy at hand, if well-designed, can achieve. The final three columns provide an indication of their
relevance to the three groups of firms identified in Section 3.
65. This section first discusses the potential for policy to promote growth at the global technological
frontier, and then turns to the links between policies and other aspects of productivity performance,
including the diffusion of frontier technologies. In this regard, Section 5.2 discusses the role of innovation
policies, while Sections 5.3 and 5.4 show that well-designed framework policies can create the conditions
for: i) productive firms to thrive and learn from the frontier; and ii) societies to allocate skills more
efficiently. The latter also requires policy-makers to cast a wider net, such as addressing the potentially
adverse effects of housing policies on skill mismatch.

ECO/CPE/WP1(2015)6
41
Table 1. Synoptic table on the channels through which policies shape aggregate productivity
Source: OECD Secretariat.
Notes: In the final three columns, “V” denotes “relevant” and “VV” denotes “highly relevant” for the particular firm at hand.
5.1 Public policy and the global productivity frontier
66. Since firms at the productivity frontier are inherently global in nature, assessing how policies
shape frontier growth is difficult as it is not clear which countries’ policies are most relevant for these
firms. Nevertheless, frontier growth might be sustained by a policy framework that promotes more
effective international co-ordination in certain areas and facilitates experimentation within firms.
5.1.1 International policy co-ordination
67. Innovation at the frontier partly depends on basic research, which drives fundamental advances in
technological knowledge and in turn opens up windows of opportunity for future research (Nelson, 1959;
Aghion and Howitt, 1996). However, basic research may be underprovided due to difficulties in
appropriating the full benefits, which tend to spillover across various sectors and create larger social

ECO/CPE/WP1(2015)6
42
benefits than applied research (Akcigit et al., 2014). Publicly-funded research often plays a crucial role in
the development of new general purpose technologies (Sheehan and Wyckoff, 2003). More generally,
evidence suggests that government, both as a buyer of technology – e.g. through defense projects – and as
funder – e.g. of research in universities and public research centres – provides significant knowledge
spillovers. This tends to underpin significant increases in R&D expenditures and patents of private
companies (Draca, 2012; Moretti et al., 2014 and Azoulay et al., 2014) pushing the frontier both directly
and indirectly.
68. Rising international connectedness and the key role of MNEs in driving frontier R&D imply that
the benefits from public basic research and support to private R&D will become more widespread globally.
This may weaken incentives for national governments to support these activities (Braconier et al., 2014)
while at the same time pushing them to compete to attract mobile investments by MNEs. Thus, global
mechanisms to support basic research – i.e. joint funding and mechanisms to facilitate cross-border and
cross-field collaboration – will become increasingly desirable in the future. A global coherence of
intellectual property rights (IPR) regimes – e.g. via the continued international harmonisation of national
patents systems and subsequent enforcement of these measures34
– may also need to be fostered. The
global nature of frontier firms also suggests a need to co-ordinate R&D fiscal incentives and corporate
taxation to ensure a level playing field (see ECO/CPE/WP1(2015)2). This is essential to incentivise true
innovation, as opposed to rent seeking behaviour – i.e. tax competition effects – that might lead to a zero
sum game for the global economy (Wilson, 2009).
5.1.2 Policies to promote experimentation
69. Experimenting with new products and processes is a defining feature of innovation at the firm
level.35
Moreover, the innovation process is inherently uncertain and the highly skewed nature of the
returns on venture capital (VC) investments suggest that the rapid success of frontier firms in some IT
markets is impossible to predict a priori, even amongst the savviest VC investors (Kerr et al., 2014). In this
environment, experimentation allows agents to assess and commercialize projects without investing the full
amount and terminate projects quickly if they are not successful (Nanda and Rhodes-Kopf, 2012). While
advances in ICT technologies have significantly lowered the cost of experimentation for frontier firms
(Box 3), policies that can reduce the costs of experimentation on the entry (regulations affecting product
and financial markets) and exit (EPL and bankruptcy law) margins will be important (see Section 5.3). In
parallel, the uncertainty highlighted above demonstrates the dangers for governments using industrial
policies to promote national champions.36
5.2 Innovation-specific policies are important but trade-offs emerge
5.2.1 Fiscal incentives for R&D
70. R&D tax incentives, a non-discriminatory tool that aims to reduce firms’ marginal cost of R&D
activities, are present in the majority of OECD member countries, and also in Brazil, China, the Russian
34 Since the Trade-related Aspects of Intellectual Property Rights agreement in 1994 – which established common
standards for patent law and scope for international sanctions against offending states – patent laws have been
strengthened worldwide, especially in developing countries (Martinez and Guellec, 2004). Even so, the lack of
enforcement remains a point of contention between developed and emerging economies (OECD, 2010).
35 For instance, every year, about 25% of consumer goods for sale are either new or will be discontinued the next year, at
least 40% of new goods are sold only for a single year, and plants adopt only between half and a third of the
technologies they try (see Gabler and Poschke, 2011).
36 Although agglomeration economies have been found to be an important source of productivity growth, existing
evidence suggests that it is extremely difficult for governments to replicate such agglomeration economies through
active cluster policies. Removing land use restrictions might be more effective (Aghion et al., 2013a).

ECO/CPE/WP1(2015)6
43
Federation and South Africa.37
Support for business R&D through the tax system is typically combined
with a broader set of direct support policies (e.g. grants, loans, loan guarantees) that are also intended to
address market failures related to investment in innovation. While significant cross-country differences
exist in the policy mix (Figure 22, Panel A), there has recently been a general shift away from direct
support (Figure A8) and R&D tax incentives have become more generous.
71. This shift in the composition of fiscal support should be cast against evidence suggesting that
while more generous R&D fiscal incentives stimulate additional business R&D, their impact on
productivity growth is less clear-cut (see Box A1 in Annex 1). New OECD research also finds little
evidence that economies with more generous R&D tax incentives are more able to learn from the global
frontier (Annex 5). Furthermore, while more generous R&D tax subsidies for SMEs might raise the
productivity of national frontier firms towards the global frontier benchmark, these effects are offset by the
fact that such policies may reduce the relative size of national frontier firms (Annex 2).
72. Recent OECD research also underlines the potential for R&D tax incentives to stifle reallocation
(see Bravo-Biosca et al., 2013) and highlights potential policy complementarities between innovation
policies and framework policies that shape the exit margin (e.g. bankruptcy legislation). For example,
Acemoglu et al., (2013) show that policy intervention such as R&D tax subsidies are only truly effective
when policy-makers can encourage the exit of low-potential incumbent firms, in order to free-up R&D
resources (i.e. skilled labour) for innovative incumbents and entrants. This reflects the idea that low-
potential firms – despite their lack of innovativeness – still employ skilled labour to cover the fixed costs
of operation, such as management and back-office operations.38
Figure 22. Direct government funding of business R&D (BERD) and tax incentives for R&D
A: Cost to public budgets as per cent of GDP; 2012 and 2006
Notes: These are experimental indicators. International comparability may be limited. For more information and for country specific notes see www.oecd.org/sti/rd-tax-stats.htm. Estimates do not cover sub-national and income-based R&D tax incentives and are limited to the business sector (excluding tax incentive support to individuals).
Source: OECD R&D Tax Incentives Indicators, based on 2013 OECD-NESTI data collection on tax incentives support for R&D expenditures and OECD, National Accounts and Main Science and Technology Indicators, 15 September 2014. Direct funding estimates for Brazil are based on national sources.
37 Details can be found in Table A5 and on http://www.oecd.org/sti/rd-tax-stats.htm.
38 One implication is that a R&D subsidy will be fully capitalised into the high skilled wage rate – without a concomitant
rise in innovation output (see Goolsbee, 1998) – unless the effective supply of high skilled labour can rise to meet
additional demand via the downsizing and/or exit of “low-type” firms.

ECO/CPE/WP1(2015)6
44
73. In any case, design features of such R&D incentive schemes are crucial in order to avoid their
unintended negative consequences and costs to the tax payer (Andrews and Criscuolo, 2013):
R&D tax incentives should be refundable or contain carry-over provisions so as to avoid overly
favouring incumbents at the expense of young firms (Table A5). The implicit subsidy rate of
R&D tax incentives increases with the profitability of the firm (Figure A9) and many young
innovative firms are typically in a loss position in the early years of an R&D project.
Recent improvements in the design of schemes that provide direct government support to R&D
may explain why, in contrast with earlier empirical research, there is now clearer evidence of a
positive association with innovation (Westmore, 2013).39
5.2.2 The primacy of basic research
74. The shift in the composition of fiscal support towards R&D tax incentives may accentuate the
misallocation of research effort between basic and applied research.40
Basic research results in significantly
larger knowledge spillovers than applied research and basic research also makes applied innovation 60%
more productive (Akcigit et al., 2014). The largely non-rival nature of basic research is likely to lead to an
excessive devotion of private research effort towards applied research – which entails significant costs to
aggregate welfare. R&D tax subsidy policies that do not take into account this asymmetric externality are
likely to accentuate the over-investment in applied research.
75. Over recent decades, the developmental and applied stages of research have represented the
largest share of the research expenditure of industry across OECD economies. Moreover, business R&D
(BERD) has significantly outgrown higher education sector R&D and more generally basic research
(Figure 23), while investment in scientific research by publicly traded US companies has actually fallen
over time (Arora et al., 2015). At the same time, cross-country differences in basic research investment are
significant (Figure A10).41
76. Yet, higher public spending on basic research enhances the ability of economies to learn from
new innovations at the global frontier (Figure 24). Assuming a 2% acceleration in MFP growth in the
frontier economy – roughly equivalent to what was observed during the late 1990s boom – annual MFP
growth is estimated to be around 0.2 percentage points higher in a country where public expenditure on
basic research is high (e.g. France), than in one where such spending is relatively low (e.g. Belgium).
These gains from more effective learning are significant, given that MFP growth in the OECD averaged
only ½ per cent between 1995 and 2007.
77. Despite emerging evidence of a positive link between basic research and productivity, the
question on how best to support basic research remains. Given the high social value of basic research,
which is maximised when accompanied by full public disclosure, governments often perform (as well as
fund) research themselves through universities or public laboratories. One concern is that government
research expenditure might crowd-out rather than spur private sector research. While evidence on this issue
is mixed, recent research suggests that public funding of basic research at the National Institutes of Health
39 For example, the structure of public support has become more focused on subsidies for commercial R&D activities and
matching grants (for private investments) have become more common.
40 According to the Frascati Manual (OECD 2002), basic research is experimental or theoretical work undertaken
primarily to acquire new knowledge of the underlying foundation of phenomena and observable facts, without any
particular application or use in view. Applied research is also original investigation undertaken in order to acquire new
knowledge. It is, however, directed primarily towards a specific practical aim or objective.
41 For example, spending on basic research ranges from less than 0.1% of GDP in Chile to 0.8% of GDP in Korea.

ECO/CPE/WP1(2015)6
45
in the United States results in significant spillovers, crowding-in private sector innovation and patenting
activity (Azoulay et al., 2014).
Figure 23. Investment in BERD has grown more quickly than basic research
Average across selected OECD countries; index 1992=100
Notes: Basic research includes research performed by the public and private sectors, and thus some basic research will be included in the BERD category. The data are based on the following countries: AUS, AUT, CHL, CZE, DNK, EST, FRA, DEU, GRC, HUN, ISL, IRL, ISR, ITA, JPN, KOR, MEX, NLD, NZL, NOR, POL, PRT, SVK, SVN, ESP, SWE, CHE, GBR and USA.
Source: OECD calculations based on Main Science and Technology Indicators.
Figure 24. Public policies and learning from the global frontier
Estimated frontier spillover (% per annum) associated with 2% point increase in MFP growth at the global frontier
Notes: The chart shows how the sensitivity of MFP growth to changes in the frontier leader growth varies with different levels of framework and innovation policy variables. The diamond refers to the estimated frontier spillover effect associated with a 2% MFP growth at the frontier around the average level of the policy. The label “Minimum” (Maximum) indicates the country with the lowest (highest) value for the given policy indicator in a given reference year.
Source: see ECO/CPE/WP1(2015)6/ANN5.
78. Incentivizing creativity and risk taking by researchers and entrepreneurs alike also requires a
long-horizon structure with tolerance for early failure associated with reward for long-term success
(Manso, 2011; Ederer, 2009). Funding models based on grants that are not based on short review cycles or

ECO/CPE/WP1(2015)6
46
strictly predefined deliverables but are rather forgiving of (early) failure and focus on experimentation and
creativity are associated with more novel and higher impact research output (Azoulay et al., 2011).42
However, while a high tolerance of early failure raises the researchers’ and entrepreneurs’ willingness to
experiment, it may also lower the willingness of (private profit making) financiers to fund experimentation
and push them to fund less radical innovations that are more likely to have positive expected Net Present
Values (Nanda and Rhodes-Kopf, 2012).
5.2.3 R&D collaboration between firms and universities
79. To enhance the contribution from academic research to business innovation, governments in
several OECD countries promote the transfer of knowledge from academia to industry and the
commercialization of academic inventions. This is typically done by allowing patented inventions from
academic staff to be commercialized exclusively by university Technology Licensing Offices (TLOs) and
the license royalties to be shared between the academic institutions and the academic inventor. Evidence
on whether academic research and inventive activity respond to the introduction of monetary incentives is
still scarce but when available, suggests a positive response (Lach and Schankerman, 2008). Therefore,
monetary incentives in academic institutions (e.g. royalty shares, bonuses and career advancements) and
university TLOs might raise productivity growth.
80. R&D collaboration between private firms and public research entities has also become
increasingly common (OECD, 2002).43
OECD evidence suggests that more intensive collaboration
between firms and universities – as proxied by the share of higher education R&D financed by industry
(Figure A11) – is associated with more diffusion of foreign advanced technologies (Figure 24).
Accordingly, the productivity gap between national and global frontier firms tends to be lower in countries
where there is more intensive R&D collaboration (Annex 2). This may reflect the fact that university
researchers might be more connected to the global knowledge frontier, which increases the speed of
technological diffusion, while financial support from industry might increase research possibilities and
scope for international collaboration, further enhancing knowledge spillovers.
81. R&D collaboration can also facilitate the diffusion of existing technologies from the national
frontier to laggard firms. Higher R&D collaboration is associated with a faster catch-up process of laggards
firms very far from the national frontier, while firms close to this frontier (i.e. Quartile 1) keep pace with it
(Figure 25). R&D collaboration with universities might facilitate the technological diffusion by providing
smaller and less productive firms with access to sources of knowledge – e.g. advanced machinery and
skilled scientists – that typically require large upfront costs. To the extent that small firms collaborate with
universities to develop technologies core to their business (Santoro and Chakrabati, 2002), the benefits to
productivity will be realised relatively quickly. By contrast, larger and more productive firms are more
likely to collaborate with universities on speculative leading-edge technologies, which are at the pre-
competitive stage and less readily applicable to the firm’s core business (Santoro and Chakrabati, 2002).
While this form of R&D collaboration is likely to push the frontier forward over time, the gains to
productivity may be less immediate.
82. While some countries provide firms with fiscal incentives for R&D collaboration (Table A5), it is
unclear whether this can be justified in terms of typical market failure arguments and evidence on their
42 Similarly, evidence from corporate R&D suggests that, to foster innovation, businesses should also have a long term
horizon, for example by offering contracts with a long-term commitment and protection from failure.
43 Collaboration between private firms and public research entities might be especially important for young firms, which
are less likely to have access to their own research facilities.

ECO/CPE/WP1(2015)6
47
effectiveness is scarce (Criscuolo et al., 2009).44
One concern is that subsidies for collaboration may distort
university investment towards applied research, at the expense of basic research (Dasgupta and David,
1994). However, the lack of evidence of a crowding-out effect from higher patenting activity relative to
academic publications suggests possible complementarities between basic research activities of academics
and applied research. A related concern is that university-industry collaboration might reduce knowledge
spillovers from academic research. Evidence on the issue is scarce but this could occur if: i) part of the
spillovers are internalised through the university-business partnership, and ii) spillovers to third parties are
likely to be smaller, given the strong incentives for the partner firm to avoid leaking information about the
research to competitors.
Figure 25. R&D Collaboration and MFP convergence to the National Frontier, 2005
Impact of increasing R&D Collaboration on firm MFP growth; % difference between high and low knowledge intensive industries
Notes: The chart simulates how increasing R&D collaboration from the relatively low level in FRA to the OECD average could affect firm MFP growth in an industry with high knowledge intensity (e.g. Manufacture of rubber and plastic products), relative to an industry with low knowledge intensity (e.g. Manufacture of textiles). The identification approach assumes that (country level) R&D collaboration will be more strongly related to firm MFP growth in industries that have high knowledge intensity (proxied by the share of labour compensation of personnel with tertiary education), than in other industries. For firms far from the NF (i.e. Quartile 4), an increase in R&D collaboration would be associated with an increase in firm MFP growth of around 1½ percentage points in an industry with high knowledge intensity, relative to an industry with low knowledge intensity. This size of this impact declines for firms closer to the NF.
Source: see ECO/CPE/WP1(2015)6/ANN2.
5.2.4 The role of patent protection
83. Patents provide firms with the incentive to innovate, but maximum effects are obtained when
they are coupled with pro-competition policies (Westmore, 2013; Aghion et al., 2013b). However, in some
emerging KBC sectors where the innovation process is typically fragmented (e.g. software), the patent
system may unduly favour incumbents at the expense of young firms (Cockburn et al., 2009), thus
undermining productivity. Indeed, in more R&D intensive sectors, stronger protection for patent holders is
associated with a lower productivity gap between national and global frontier firms, relative to other
44 Public support is often justified on the basis that: i) cooperative projects are more akin to basic research; ii) firms
underestimate the value of knowledge produced in universities; and iii) translating basic research into knowledge
useful for practical applications is costly and risky (Prinz et al., 2011; Ioannidis, 2011).

ECO/CPE/WP1(2015)6
48
sectors, while the reverse is true in more dynamic sectors (Annex 2).45
One key factor to ensure that IPRs
do not become a significant obstacle to entry and further technological development is the transparency of
the patent system (Box 8).
Box 8. The importance of transparency in the design of patent systems
An important factor in ensuring that IPRs do not impose barriers to entry and further technological development is the transparency of the patent system. Ideally, the social benefits of a transparent patent system would arise from the increased rate of innovation, due to: i) the provision of guaranteed rewards to the inventor if successful; ii) the facilitation of knowledge transmission; and iii) a lower risk of duplication of innovation efforts owing to the disclosure of the detailed technical information. Lack of transparency in the technical content of the patent document in the breadth and scope of the patent rights and/or in the ownership of that right would undermine these social benefits.
In some patent systems, it might be difficult or excessively costly – particularly in high-technology fields – to unambiguously identify the scope and validity of patents (Bessen and Meurer, 2008). This would reduce the likelihood of a level playing field between firms with varying degrees of internal funding or access to external finance (e.g. young/small vs large/mature applicants). These problems might be particularly acute for complex products bundling several patented inventions, as in the case of “smart” IT equipment. The transaction costs and the fear of strategic behaviour by incumbents (holding the patent) might hinder the entry of new products in the market. This might inhibit the knowledge diffusion and follow-up innovation (see Heller and Eisenberg, 1998 and Ziedonis, 2004). This so-called the “tragedy of the anti-commons” might have long-term consequences on the development of new products especially if it happens in upstream research as it will affect the pace of innovation in downstream products.
5.3 Well-designed framework policies allow productive firms to thrive
5.3.1 Anti-competitive product market regulations have pervasive effects
84. Lifting anti-competitive product market regulations can spur productivity growth via: i) more
entry, which raises productivity directly given that young firms have a comparative advantage in radical
innovations and indirectly if more entry pressures incumbents to innovate;46
ii) greater market discipline,
which improves management performance and scope for technology adoption; and iii) easier and cheaper
access to inputs, which – because of easier reallocation – raises the returns to investing in KBC. This
contributes to stronger market selection and post-entry growth, thereby enhancing the ability of firms to
achieve sufficient scale to enter global markets.
85. Reforms to product market regulations (PMR), particularly those reducing entry barriers, can
facilitate more effective learning from the global frontier, given the comparative advantage of young firms
in commercialising and adopting new technologies. Given a 2 percentage point acceleration in frontier
growth, the estimates in Figure 24 imply a gain to annual MFP growth of around 0.2 percentage points
higher in a country with low administrative barriers to entrepreneurship (e.g. Sweden), than in one where
such barriers are relatively high (e.g. Greece). Pro-competition policies are associated with improvements
in the performance of national frontier firms relative to the global frontier benchmark (Annex 2). For
example, less cumbersome barriers to entrepreneurship disproportionately increases the size of national
frontier firms in knowledge intensive industries relative to other industries, reflecting more efficient
resource allocation (Figure 26, Panel A).
45
This is consistent with evidence from the United States suggests that the cost of litigation exceeded the profit from
patents in the late 1990s in industries outside pharmaceuticals and chemicals (Bessen and Meurer, 2008). Indeed, the
increasing emergence of “non-practicing entities” that accumulate software patents with the sole objective of extracting
rents from innovators may challenge innovation activities.
46 The nature of this effect will vary with a firm’s distance to the frontier (Aghion and Griffith, 2005).

ECO/CPE/WP1(2015)6
49
Figure 26. Impact on industry productivity of policy reforms that enhance the ability of national frontier firms to attract resources and grow, 2005
Impact of policy reforms on the level of labour productivity; % difference between industries with high and low exposure to the policy
Notes: The chart estimates the gains to industry labour productivity from reforms to the best practice level for policy variables that may partly explain cross-country industry differences in the size of national frontier (NF) firms, relative to global frontier (GF) benchmark (i.e. the size gap in Figure 17). The identification approach assumes that a country level policy (e.g. EPL) will have a stronger impact on firm size of NF firms in industries that are more exposed to the policy (e.g. those with relatively high job layoff rates), than in other industries. For barriers to entrepreneurship, bankruptcy law and venture capital, the corresponding industry exposure variable is knowledge intensity (see Figure 25 for details). Panel B shows that a reduction in EPL on regular contracts from the average level in GRC to the lowest level in the sample (i.e. CHE) would be associated with an increase in the level of labour productivity of around 6% in an industry with high job layoff rates (e.g. manufacture of machinery and equipment), relative to an industry with low layoff rates (e.g. Manufacture of other transport equipment).
Source: ECO/CPE/WP1(2015)6/ANN2.
86. Product market regulations also shape the diffusion of existing technologies from the national
frontier to laggard firms. Figure 27 (Panel A) suggests that reducing the stringency of product market
regulations – e.g. from the relatively high level in Greece to the OECD average – is associated with
disproportionately higher MFP growth for firms in industries with high firm turnover rates, than in other
industries. The strength of this effect also varies according to a firms’ initial distance to the national
productivity frontier. While less stringent PMR would facilitate the catch-up of all firms to the national
frontier, the reform appears to disproportionately boosts MFP growth for firms that are either close to the
frontier (i.e. Quartile 1) or very far from it (i.e. Quartile 4). The latter is consistent with research showing
that higher competition sharpens the incentives of low productivity firms to adopt better technologies
(Perla et al., 2015).47
47
Other factors such as geographical isolation (Syverson, 2004) will also matter and may explain why economies with
relatively lax regulation (e.g. New Zealand) exhibit a long tail of low productivity firms (Conway 2014).
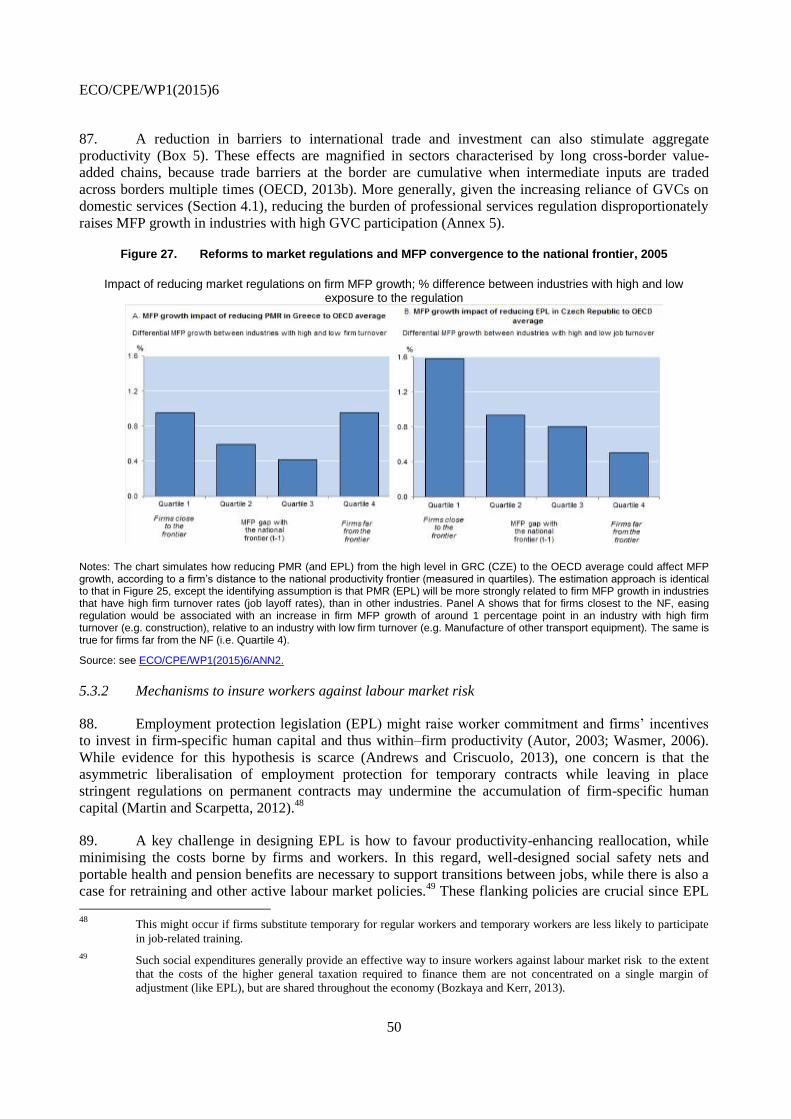
ECO/CPE/WP1(2015)6
50
87. A reduction in barriers to international trade and investment can also stimulate aggregate
productivity (Box 5). These effects are magnified in sectors characterised by long cross-border value-
added chains, because trade barriers at the border are cumulative when intermediate inputs are traded
across borders multiple times (OECD, 2013b). More generally, given the increasing reliance of GVCs on
domestic services (Section 4.1), reducing the burden of professional services regulation disproportionately
raises MFP growth in industries with high GVC participation (Annex 5).
Figure 27. Reforms to market regulations and MFP convergence to the national frontier, 2005
Impact of reducing market regulations on firm MFP growth; % difference between industries with high and low exposure to the regulation
Notes: The chart simulates how reducing PMR (and EPL) from the high level in GRC (CZE) to the OECD average could affect MFP growth, according to a firm’s distance to the national productivity frontier (measured in quartiles). The estimation approach is identical to that in Figure 25, except the identifying assumption is that PMR (EPL) will be more strongly related to firm MFP growth in industries that have high firm turnover rates (job layoff rates), than in other industries. Panel A shows that for firms closest to the NF, easing regulation would be associated with an increase in firm MFP growth of around 1 percentage point in an industry with high firm turnover (e.g. construction), relative to an industry with low firm turnover (e.g. Manufacture of other transport equipment). The same is true for firms far from the NF (i.e. Quartile 4).
Source: see ECO/CPE/WP1(2015)6/ANN2.
5.3.2 Mechanisms to insure workers against labour market risk
88. Employment protection legislation (EPL) might raise worker commitment and firms’ incentives
to invest in firm-specific human capital and thus within–firm productivity (Autor, 2003; Wasmer, 2006).
While evidence for this hypothesis is scarce (Andrews and Criscuolo, 2013), one concern is that the
asymmetric liberalisation of employment protection for temporary contracts while leaving in place
stringent regulations on permanent contracts may undermine the accumulation of firm-specific human
capital (Martin and Scarpetta, 2012).48
89. A key challenge in designing EPL is how to favour productivity-enhancing reallocation, while
minimising the costs borne by firms and workers. In this regard, well-designed social safety nets and
portable health and pension benefits are necessary to support transitions between jobs, while there is also a
case for retraining and other active labour market policies.49
These flanking policies are crucial since EPL
48
This might occur if firms substitute temporary for regular workers and temporary workers are less likely to participate
in job-related training.
49 Such social expenditures generally provide an effective way to insure workers against labour market risk to the extent
that the costs of the higher general taxation required to finance them are not concentrated on a single margin of
adjustment (like EPL), but are shared throughout the economy (Bozkaya and Kerr, 2013).

ECO/CPE/WP1(2015)6
51
that imposes heavy or unpredictable costs on hiring and firing slows down the reallocation process and
aggregate productivity growth (Bassanini et al., 2009; Andrews and Cingano, 2014). Similarly, by raising
exit costs in the case of business failure, stringent EPL makes it less attractive for firms to experiment with
uncertain technologies.
90. Stringent EPL is significantly associated with lower ability of innovative firms to attract the
complementary tangible resources that are required to implement and commercialise new ideas, and the
burden of this effect falls disproportionately on young firms, which are more likely to experiment with
radical innovation (Andrews et al., 2014). Moreover, in sectors with higher job layoff rates (where
reallocation needs are likely to be more intense), stringent EPL disproportionately reduces the size of
national frontier firms in sectors with higher job layoff rates, relative to other sectors (Figure 26, Panel B).
This is consistent with the finding that stringent EPL might adversely affect the growth potential of more
productive firms (Figure 27, Panel B) and weaken post-entry growth.50
5.3.3 Bankruptcy legislation and judicial efficiency shape the exit margin
91. Bankruptcy regimes can foster experimentation with risky technologies if they do not sanction
business failure too severely. Lowering the cost to close a business increases the ability of economies to
learn from new innovations at the frontier (Figure 24) and the size of national frontier firms, with the
benefits particularly large in Italy and some Eastern European economies (Figure 26, Panel C). A lower
cost of winding-down a business also makes it less likely that (inefficient) firms with low growth potential
will continue to operate – which is a problem in some countries (Figure 18) where exit costs are also high
(Figure A12), such as Italy and Spain. This in turn releases resources to underpin the reallocation of capital
toward more innovative business ventures (Andrews et al., 2014; Bravo-Biosca et al., 2013). Such
arrangements could, however, also discourage risk taking if credit conditions are tightened as a result of
reduced loss recovery in case of bankruptcy. Striking the right balance between these two forces makes the
design of bankruptcy provisions complicated.
92. The swift reallocation of resources from failed ventures will also be affected by the time required
for the full completion of all legal procedures to wind up a business and the obstacles to the use of out of
courts arrangements. In this regard, well-designed legal systems can raise the returns to innovation (Nunn,
2007; Andrews et al., 2014), thereby enhancing the ability of economies to learn from new innovations at
the frontier (Figure 24).51
5.3.4 Risk capital markets
93. While a vast literature demonstrates the importance of financial development for productivity
performance (Rajan and Zingales, 1998), financing constraints tend to be more acute for young firms to the
extent that they have limited internal funds and lack a track record to signal their “quality” to investors.
This financing gap is partly bridged by venture capitalists or business angels, who address informational
asymmetries by intensively scrutinising firms before providing capital and subsequent monitoring (Hall
and Lerner, 2009).
94. Venture capital (VC) financing has a sizeable positive impact on innovation and growth (Kortum
and Lerner, 2000; Samila and Sorenson, 2011). The productivity and size of national frontier firms also
50 For example, in more R&D-intensive industries, less stringent EPL raises productivity growth to the extent that it is
associated with a more dynamic firm growth distribution – that is, a lower share of static firms and higher share of
growing and shrinking firms (Bravo-Biosca et al., 2013).
51 Robust public institutions that provide strong rule of law and minimise corruption and informality can support efficient
resource allocation (D’Erasmo and Moscoso-Boedo, 2012).

ECO/CPE/WP1(2015)6
52
increases with the depth of markets for seed and early stage VC (Annex 2; Figure 26, Panel D). The same
is true concerning the ability of economies to learn from the frontier, while learning is also positively
associated with the extent of policy support for seed and early stage VC (Figure 24), as proxied by the
number of tax and equity policy instruments provided to nurture this market (Table A6).52
5.4 Making the most of human capital requires a range of policies
95. Making the most of human capital requires a range of policies to reduce skill mismatch. Skill
mismatch is associated with aggregate productivity through two channels: within-firm productivity and the
allocation of labour across firms (Section 4.3). Accordingly, the relationship of skill mismatch and policies
that shape productivity via both channels is explored. Since the primary aim is to highlight skill mismatch
as a new channel through which policies may affect productivity, rather than additional productivity
impacts to those identified in Section 5.3, the estimates in Table 2 should be interpreted with caution and a
causal interpretation should not be applied.53
5.4.1 Well-designed framework policies might lower skill mismatch
96. Reallocation-friendly framework policies are associated with lower skill mismatch, after
controlling for individual and country-specific characteristics (Figure 28).54
Reducing the stringency of
product and labour market regulations from the maximum levels to the median levels is roughly associated
with a 3 percentage point reduction in mismatch and 1 percentage point gain in labour productivity (Table
2). Similarly, bankruptcy legislation that does not excessively penalise business failure can reduce the
likelihood that valuable skills are trapped in inefficient firms. For example, reducing the stringency of
bankruptcy legislation from its most restrictive level in Italy (where mismatch is very high; Figure 20) to
the median level in Canada is associated with a 10 percentage point decrease in mismatch. Given that the
average level of mismatch is 22%, the implied gains to labour productivity from improving bankruptcy
legislation are also large (3.6 percentage points).
97. Policies that distort reallocation mechanisms – e.g. stringent EPL – tend to disproportionately
raise the incidence of skill mismatch amongst young people (Annex 6). Indeed, labour market fluidity is
particularly important for the job prospects of youth, since it provides scope to improve the quality of job-
worker matching, which is naturally lower amongst young people due to their lack of experience (Davis
and Haltiwanger, 2014).
52
This is consistent with research showing that: i) greater policy support for seed and early stage VC (SES-VC) is
associated with a lower age at which firms receive such financing (Andrews and Criscuolo, 2013); and ii) countries
with more developed markets for SES-VC tend to invest more heavily in KBC (Andrews et al., 2014).
53 This section covers only a subset of potentially relevant policies but a range of other – more difficult to measure –
policies (e.g. vocational education and training) may also matter. Of course, policies to increase human capital
accumulation, such as investment in higher education, are also crucial (Braconier et al., 2014).
54 Results with respect to over-skilling and under-skilling are presented in Annex 6. Most of the relationship between
policies and over-skilling continue to hold, while the results are less robust for under-skilling. This is not surprising
since the share of under-skilled workers is quite low across OECD countries (Figure A7).

ECO/CPE/WP1(2015)6
53
Figure 28. The probability of skill mismatch and framework policies
Notes: The dot is the average probability to have mismatch evaluated at the median level of the policy and individual characteristics, which include age, marital and migrant status, gender, level of education, firm size, contract type, a dummy for working full-time and working in the private sector. The distance between the Min/Max and the median is the change in the probability of skill mismatch associated with the respective policy change.
Source: see ECO/CPE/WP1(2015)6/ANN6 based on the Survey of Adult Skills (2012).
Table 2. Estimated gains to labour productivity from policy reforms that reduce skill mismatch
Percentage point increase in the level of labour productivity from reducing policy from sample maximum to median value
t
Notes: Policy experiments are roughly equivalent to the impact of a 1 to 1.5 standard deviation change in the policy variables of interest on the probability of mismatch, except for PMR, EPL, participation in lifelong learning and managerial quality which are equivalent to the impact of a 2 to 2.5 standard deviation change. Estimates are based on: i) logit regressions of probability of mismatch controlling for age, marital and migrant status, gender, education, firm size, contract type, a dummy for working full-time and working in the private sector (see Figures 28 and 29) and; ii) OLS regressions of labour productivity on skill mismatch.
Source: ECO/CPE/WP1(2015)6/ANN6.

ECO/CPE/WP1(2015)6
54
5.4.2 Barriers to mobility in housing markets may exacerbate skill mismatch
98. Housing market policies vary significantly across countries (Figures A13-A15), and in turn shape
residential mobility, which is positively correlated with worker reallocation rates (Caldera Sánchez and
Andrews, 2011; Figure A16) and the efficiency of job matching (Henley, 1998). Lower residential mobility
and higher home-ownership rates are associated with higher skill mismatch, and the same housing policies
which impede residential mobility might also amplify skill mismatch:
Lowering transaction costs could reduce skill mismatch. By creating lock-in effects, transaction
costs affecting the buying and selling of dwellings – e.g. transfer taxes (stamp duties, acquisition
taxes), registration and notarial fees – can reduce residential mobility. The estimates in Figure 29
imply that reducing transaction costs from the highest level (Belgium) to the median level
(Finland) is associated with a 7 percentage point reduction in mismatch, implying potential gains
to labour productivity of 2.5 percentage points (Table 2).
Strict rent controls and rules excessively favouring tenants over landlords are associated with
higher skill mismatch: Reducing rent controls from the most restrictive country (Sweden) to the
median (Canada) is associated with a reduction in skill mismatch of 5 percentage points (Figure
29), while reforms making rules governing tenant-landlord relations more landlord-friendly have
similar effects. The implied gain in labour productivity from implementing these policies are 1.6
percentage points (Table 2).
Policies that restrict housing supply are associated with higher skill mismatch: A low price
responsiveness of housing supply can reduce labour mobility by affecting the average availability
of housing. The elasticity of housing supply is lower in countries where it takes longer to acquire
a building permit, underscoring the importance of efficient land-use regulations (Andrews et al.,
2011). Indeed, reducing the number of days to obtain a building permit from its maximum level
(Slovak Republic) to the median (the Netherlands), is associated with a two percentage points
decrease in skill mismatch (Figure 29) and a 0.7 percentage point implied gain in labour
productivity.
99. Moreover, high transaction costs and strict rental market regulations are associated with
disproportionately higher mismatch amongst youth. Such policies might be more relevant for young people
since they have a naturally higher propensity to move (Caldera Sánchez and Andrews, 2011) and may have
fewer resources to finance the higher moving costs that these policies imply.
5.4.3 Labour market and education policies can improve the matching of skills to jobs
100. The returns to skills are lower in countries with more centralised wage bargaining systems, which
make it more difficult for employers to adjust wages according to skills. This may be the case because
wage decisions are more likely to be based on observable characteristics, such as formal qualifications in
such wage-setting systems (OECD, 2014b). Adding some degree of flexibility to at least allow scope for
wage bargaining around some centrally-agreed standards to take place at the firm level may be desirable
from the perspective of reducing mismatch (Figure 29). Skills can be gained beyond formal qualifications
through both on the job-training and opportunities for lifelong education and training, which may also raise
labour productivity via lower mismatch (Figure 29, Table 2).
5.4.4 Better managerial quality could reduce skill mismatch
101. Higher managerial quality raises within-firm productivity (Bloom et al., 2012b) while better
managed firms may also be less susceptible to mismatch if they are more effective at: i) screening job
applicants; ii) developing new work practices; iii) internally reallocating over-skilled workers; and iv)

ECO/CPE/WP1(2015)6
55
retraining or removing under-skilled workers. Indeed, differences in managerial quality can account for
part of the association between skill mismatch and labour productivity: raising managerial quality from its
minimum levels in Italy to the median in Canada is associated with a 7 percentage point decline in skill
mismatch and a 2.5 percentage point implied gain in labour productivity (Table 2).
Figure 29. The probability of skill mismatch and other policies
Notes: The dot is the average probability of mismatch evaluated at the median level of the policy and individual characteristics (see Figure 28). The distance between the Min/Max and the median is the change in the probability of skill mismatch with the respective policy change.
Source: ECO/CPE/WP1(2015)6/ANN6 based on the Survey of Adult Skills (2012).
102. While product market regulations are a key determinant of managerial quality, competition may
be less effective at facilitating the exit of poorly managed family-owned firms to the extent that they are
subsidised by their family owners through cheap capital (Bloom et al., 2014).55
Through this channel,
inheritance tax exemptions with respect to family firms might contribute to lower managerial quality.
Indeed, in countries where inheritance tax exemptions for family firms are generous – e.g. the United
Kingdom, France, Germany and Italy – the share of family-managed firms tends to be higher than in the
United States, which has no substantial family firm exemptions (Bloom and Van Reenen, 2007). Hence,
reducing such exemptions could increase the likelihood that badly managed family-owned firms change
ownership, potentially raising aggregate productivity and intergenerational social mobility.
5.4.5 Reallocation-friendly policies can leverage the benefits managerial quality
103. Independent of the level of managerial ability, policies may also shape the leeway for managers
to reduce mismatch within firms. For example, stringent EPL is found to thwart the ability of managers to
reduce mismatch for any given level of managerial quality (Annex 6), possibility reflecting excessive
protection for incumbent workers in a firm, who might not be the best match for their job. Reallocation-
friendly policies can also magnify the gains to aggregate productivity from a given improvement in
managerial quality by ensuring that the most effective managers are responsible for a larger share of the
economy’s resources (Bloom et al., 2013; Figure A17).
55 Family-owned firms are typically less well-managed, especially those managed by the oldest son of founders (Bloom
and van Reenen, 2007). Selecting the CEO from among the small group of potential family members reduces the
available pool of managerial ability and the incentives of the children to acquire human capital.

ECO/CPE/WP1(2015)6
56
6. Avenues for future research
104. While this paper has identified a number of key issues with respect to long-run productivity
growth, a key limitation to further research is the lack of suitable data to conduct cross-country
comparisons and policy analyses. These concerns pertain to both the outcomes of interest – e.g.
productivity indicators – as well as the measurement of the policy environment.
105. Ongoing efforts within the OECD Directorate for Science, Technology and Innovation to collect
harmonised cross-country micro-aggregated data from official sources hold out the prospect that some of
issues identified in this paper can be more deeply explored. The representative nature of these data will
allow a more robust analysis of the processes of technology diffusion to laggard firms and firm entry and
exit – two issues that commercial databases (e.g. ORBIS) are less than ideal for. The DYNEMP project
will provide the data needed to understand the policy drivers of entry and exit rates and post-entry growth
performance. These data combined with productivity data from the MULTIPROD project will shed light
on: i) the contribution of business dynamics and creative destruction to aggregate productivity growth; ii)
the effects of the crisis on within-firm productivity growth and reallocation (e.g. cleansing vs scarring
effects); iii) the sources of the cross-country differences in aggregate productivity; and iv) the influence of
policies on these aforementioned factors.
106. The OECD has a long-standing experience in providing internationally comparable industry level
data on output, employment, investment, R&D investment, trade and GVC participation. However, given
the increasing importance of emerging economies, improving the coverage of non-OECD industry level
data (within and across countries) – especially for BRIICS – is a priority. Given the importance of
knowledge-based assets, improvements in the measurement of human capital, skills, ICT use and
intangible assets would also be valuable. More generally, the widespread heterogeneity in firm
performance within industries makes it important to go beyond the paradigm of the average firm. However,
this requires databases that include different moments of the firm productivity distribution and more
detailed information on firm size, age, location and trade and ownership status.
107. This research agenda could also benefit from more refined policy indicators to shed light on the
optimal design of policy in three key areas.
The ability of IPR regimes to effectively balance the incentive to innovate with the broad
diffusion of knowledge is receiving increasing attention, but the inability of existing policy
indicators to adequately measure the quality of IPR regimes presents a key barrier to research.
However, ongoing efforts within the OECD [see ECO/CPE/WP1(2014)24] to assemble
indicators on economically-relevant features of patent systems will facilitate more extensive
analysis on the consequences of IPR regimes for innovation and productivity.
While firm exit is central to productivity growth, currently available indicators regarding the cost
of bankruptcy proceedings (sourced from the World Bank Doing Business Database) are
relatively crude and have not been vetted by member country governments. Thus, the
development of more refined indicators may shed light on how bankruptcy legislation can be best
designed to strike a balance between leniency (to encourage risk taking) and protection of
creditors (to avoid adverse effects on credit supply). This could also facilitate analysis into
economic resilience and questions related to the optimal level of risk-taking in an economy.
More analysis of the optimal design of innovation policies would also be useful. While progress
has been made collecting more granular information on the features of R&D tax incentive
systems, future measurement and analytical efforts could focus on the design of other areas of
innovation policies, including the funding of basic research.

ECO/CPE/WP1(2015)6
57
REFERENCES
Abramovitz, M. (1956), “Resource and Output Trends in the U.S. since 1870”, American Economic Review,
Papers and Proceedings, 46(2), pp. 5-23.
Acemoglu, D., U. Akcigit, N. Bloom and W. Kerr (2013), “Innovation, Reallocation and Growth”, NBER Working Papers, No. 18993.
Acemoglu, D., P. Aghion and F. Zilibotti (2006), “Distance to Frontier, Selection and Economic Growth,”
Journal of the European Economic Association, pp. 37-74.
Acemoglu, D. and J. Linn (2004), “Market Size in Innovation: Theory and Evidence from the Pharmaceutical
Industry”, Quarterly Journal of Economics, 119(3), pp. 1049–1090.
Aghion P and P. Howitt (1996), “Research and Development in the Growth Process”, Journal of Economic
Growth (1), pp. 49-73.
Aghion, P., and P. Howitt (2006), “Joseph Schumpeter Lecture: Appropriate Policy Growth: A Unifying
Framework,” Journal of the European Economic Association 4, pp. 269–314.
Aghion, P and R. Griffith (2005), Competition and Growth. Reconciling Theory and Evidence MIT Press.
Aghion, P. et al. (2013a), “Investing for Prosperity: Skills, Infrastructure and Innovation”, Report of the LSE
Growth Commission.
Aghion, P., P. Howitt and S. Prantl (2013b), “Patent Rights, Product Market Reforms, and Innovation,” NBER
Working Papers Series, No. 18854.
Aghion, P. D. Hemous, and E. Kharroubi (2014), “Credit Constraints, Cyclical Fiscal Policy and Industry
Growth”, Journal of Monetary Economics 62, pp. 42-58.
Akcigit, U., D. Hanley and N. Serrano-Velarde (2014), “Back to Basics: Basic Research Spillovers, Innovation
and Growth”, NBER Working Paper Series, No. 19473.
Aldieri, L (2011), “Technological and Geographical Proximity Effects on Knowledge Spillovers: Evidence from
the US Patent Citations”, Economics of Innovation and New Technology, 20(6), pp. 597-607.
Alesina, A. and E. La Ferrara (2005), “Preferences for Redistribution in the Land of Opportunities”, Journal of
Public Economics, Vol. 89(5-6), pp. 897-931.
Alesina, A., J. Harnoss and H. Rapoport (2013), “Birthplace Diversity and Economic Prosperity”, NBER Working Paper Series, No. 18699.
Altomonte, C., G.B. Navaretti, F. di Mauro and G. Ottaviano (2011), “Assessing Firm Competitiveness: How
Can Firm-Level Data Help?”, Bruegel Policy Contribution 2011/16.
Alvarez, F., F. Buera and R. Lucas, Jr. (2013), “Idea Flows, Economic Growth and Trade”, NBER Working
Paper Series, No. 19667.
Andrews, D., A. Caldera Sánchez and Å. Johansson (2011), “Housing Markets and Structural Policies in OECD
Countries”, OECD Economics Department Working Papers, No. 836.
Andrews, D. and C. Criscuolo (2013), “Knowledge Based Capital, Innovation and Resource Allocation”, OECD
Economics Department Working Papers, No. 1046.
Andrews, D. and F. Cingano (2014), “Public Policy and Resource Allocation: Evidence from Firms in OECD
Countries”, Economic Policy, No. 29(78), pp. 253-296.
Andrews, D., C. Criscuolo and C. Menon (2014), “Do Resources Flow to Patenting Firms?: Cross-Country
Evidence from Firm Level Data”, OECD Economics Department Working Papers, No. 1127.
Andrews, D., and B. Westmore (2014), “Managerial Capital and Business R&D as Enablers of Productivity
Convergence”, OECD Economics Department Working Papers, No. 1137.
Appelt, S., F. Galindo-Rueda, R. de Pinho, and B. van Beuzekom (2015), “Which Factors Drive the
International Mobility of Research Scientists?”, OECD Science, Technology and Industry Working
Papers (forthcoming), OECD Publishing, Paris.

ECO/CPE/WP1(2015)6
58
Arnold, J., G. Nicoletti, and S. Scarpetta (2008). “Regulation, Allocative Efficiency and Productivity in OECD
Countries” , OECD Economics Department Working Papers, No. 616.
Arora, A., S. Belenzon and A. Patacconi (2015), “Killing the Golden Goose? The Decline of Science in
Corporate R&D”, NBER Working Paper, No. 20902.
Autor, D.H. (2003), “Outsourcing at Will: the Contribution of Unjust Dismissal Doctrine to the Growth of
Employment Outsourcing”, Journal of Labour Economics, 21(1), pp. 1-42.
Azoulay, P., J. Graff Zivin, D. Li and D.N Sampat (2014), “Public R&D Investments and Private-sector
Patenting: Evidence from NIH Funding Rules”, Mimeo.
Azoulay, P., J. Graff Zivin and G. Manso (2011), “Incentives and Creativity: Evidence from the Academic Life
Sciences”, RAND Journal of Economics, Vol. 42(3), pp. 527-554.
Baker, S., N. Bloom and S. Davis (2013), “Measuring Economic Policy Uncertainty”, Chicago Booth Research
Paper, No. 2.
Barlevy, G. (2007), “On the Cyclicality of Research and Development”, American Economic Review, Vol.
97(4), pp. 1131-1164.
Bartelsman, E.J., (2004), “Firm Dynamics and Innovation in the Netherlands: A Comment on Baumol”, De Economist, 152(3), 353-363.
Bartelsman, E.J., S. Scarpetta and F. Schivardi (2003), “Comparative Analysis of Firm Demographics and
Survival: Micro-Level Evidence for the OECD Countries”, OECD Economics Department Working Papers, No. 348, OECD, Paris.
Bartelsman, E.J., J. Haskel and R. Martin (2008), “Distance to Which Frontier? Evidence on Productivity
Convergence from International Firm-level Data”, CEPR Discussion Papers, No. 7032.
Bassanini, A., L. Nunziata and D. Venn (2009), “Job Protection Legislation and Productivity Growth in OECD
Countries”, Economic Policy, Vol. 24, pp. 349-402.
Baumol, W.J. (2002), The Free-Market Innovation Machine: Analyzing the Growth Miracle of Capitalism Princeton University Press.
Benner, M.J. and M. Tushman (2002), “Process Management and Technological Innovation: A Longitudinal
Study of the Photography and Paint Industries”, Administrative Science Quarterly, 47(4), pp. 676-706.
Bernanke, B. (1983), “Irreversibility, Uncertainty and Cyclical Investment”, Quarterly Journal of Economics, Vol. 98.
Brandt, N., P. Schreyer and V. Zipperer (2014), “Productivity Measurement with Natural Capital and Bad
Outputs”, OECD Economics Department Working Papers, No. 1154.
Brandt, N., P. Schreyer and V. Zipperer (2013), “Productivity Measurement with Natural Capital”, OECD
Economics Department Working Papers, No. 1092.
Breinlich, H., and C. Criscuolo (2011), “International Trade in Services: A Portrait of Importers and Exporters”,
Journal of International Economics, 84(2), pp. 188-206.
Bessen, J. and M.J. Meurer (2008), Patent Failure: How Judges, Bureaucrats and Lawyers Put Innovators at
Risk, Princeton University Press.
Bloom, N. and J. Van Reenen (2007), “Measuring and Explaining Management Practices Across Firms and
Countries”, Quarterly Journal of Economics, 122 (4), pp. 1351-1408.
Bloom, N., M. Draca and J. Van Reenen (2011), “Trade Induced Technical Change? The Impact of Chinese
Imports on Innovation, IT and Productivity”, NBER Working Papers, No. 16717.
Bloom, N., R. Sadun and J. Van Reenen (2012a), “Americans Do IT Better: US Multinationals and the
Productivity Miracle”, American Economic Review, 102(1): 167–201.
Bloom, N., C. Genakos, R. Sadun and J. Van Reenen (2012b), “Management Practices Across Firms and
Countries”, NBER Working Paper, No 17850.

ECO/CPE/WP1(2015)6
59
Bloom, N., R. Sadun, and J. Van Reenen (2013), “Management as a Technology”, LSE mimeo,
http://cep.lse.ac.uk/textonly/_new/staff/vanreenen/pdf/mat_2013dec1.pdf.
Bloom, N., R. Lemos, R. Sadun, D. Scur, J. Van Reenen (2014), “The New Empirical Economics of
Management”, NBER Working Papers, No. 20102.
Bolio, E. et al., (2014), “A Tale of Two Mexicos: Growth and Prosperity in a Two-speed Economy”, McKinsey Global Institute, March 2014.
Bourlès, R., et al. (2013), “Do Product Market Regulations in Upstream Sectors Curb Productivity Growth?:
Panel Data Evidence for OECD Countries”, The Review of Economics and Statistics, Vol. 95(5), pp.
1750-1768.
Bozkaya, A. and W.R. Kerr (2014), “Labor Regulations and European Venture Capital”, Journal of Economics
& Management Strategy, Vol. 23, pp. 776-781.
Braconier, H., G. Nicoletti and B. Westmore (2014), “Policy Challenges for the Next 50 Years”, OECD
Economics Department Policy Papers, No. 9.
Bravo Biosca, A., C. Criscuolo and C. Menon (2013),”What Drives the Dynamics of Business Growth?”,
OECD Science, Technology and Industry Policy Papers, No. 1.
Breinlich, H. and C. Criscuolo (2011), “International Trade in Services: A Portrait of Importers and Exporters”,
Journal of International Economics, Vol. 84(2), pp. 188-206.
Brynjolfsson, E, and A. McAfee (2011), Race Against The Machine: How the Digital Revolution is Accelerating Innovation, Driving Productivity, and Irreversibly Transforming Employment and the Economy, Digital
Frontier Press.
Buera, F.J. and B. Moll (2013), “Aggregate Implications of a Credit Crunch”, Mimeo.
http://www.princeton.edu/~moll/AICC.pdf
Caballero, R., and M. Hammour (1994), “The Cleansing Effect of Recessions”, The American Economic Review, Vol. 84 (5), pp. 1350–68.
Caballero, R. and M. Hammour (2005), “The Cost of Recessions Revisited: A Reverse-Liquidationist View”,
The Review of Economic Studies, Vol. 72(2), pp. 313-341.
Caldera Sánchez, A. and. D. Andrews (2011), “To Move or not to Move: What Drives Residential Mobility
Rates in the OECD? ”, OECD Economics Department Working Papers, No. 846.
Calvino et al. (2015), “ ”, OECD Science, Technology and Industry Policy Paper, forthcoming.
Cingano, F. (2015), “Trends in Income Inequality and its Impact on Economic Growth”, OECD Social,
Employment and Migration Working Papers, forthcoming.
Cockburn, I.M., M.J. MacGarvie and E. Muller (2009), “Patent Thickets, Licensing and Innovative
Performance”, ZEW Discussion Paper, No. 08-101.
Comin, D and M. Mestieri (2013), “If Technology Has Arrived Everywhere, Why Has Income Diverged?”
NBER Working Paper Series, No. 19010.
Conway, P., D. de Rosa, G. Nicoletti and F. Steiner (2006), "Product Market Regulation and Productivity
Convergence," OECD Economic Studies, Vol. 2006(2), pp. 39-76.
Conway, P (2014), “New Zealand’s Productivity Story: More Questions than Answers”, Understanding
productivity growth – new insights, new questions, OECD Paris, 22-23 October 2014,
http://www.oecd.org/sti/ind/Session%203%20-%20Paul%20Conway.pdf.
Conway, P. and G. Zheng (2014), “Trade Over Distance for New Zealand Firms: Measurement and
Implications”, New Zealand Productivity Commission Working Paper, No. 5.
Corrado, C., J. Haskel., C. Jona-Lasinio and M. Iommi (2012), “Intangible Capital and Growth in Advanced
Economies: Measurement Methods and Comparative Results”, INTAN-Invest Mimeo.
Cowen, T. (2011), The Great Stagnation: How America Ate All the Low-Hanging Fruit of Modern History, Got Sick, and Will (Eventually) Feel Better.

ECO/CPE/WP1(2015)6
60
Crespi, G., C. Criscuolo and J. Haskel, (2008), “Productivity, Exporting, and the Learning-by-Exporting
Hypothesis: Direct Evidence from UK Firms”, Canadian Journal of Economics, 41(2), pp. 619-638.
Criscuolo, C., D. Czarnitzki, C. Hambro and J. Warda (2009), “Design and Evaluation of Tax Incentives for
Business Research and Development: Good Practice and Future Development”, final report submitted by
the Expert Group on Impacts of R&D Tax Incentives to the European Commission, Directorate General –
Research, 15 November.
Criscuolo, C., J.E. Haskel and M.J. Slaughter (2010), “Global Engagement and the Innovation Activities of
Firms”, International Journal of Industrial Organization, 28(2): pp. 191-202.
Criscuolo, C., P. Gal and C. Menon (2014), “The Dynamics of Employment Growth: New Evidence from 18
Countries”, OECD Science, Technology and Industry Policy Papers, No. 14.
Dasgupta, P. and P. David (1994), “Toward a New Economics of Science”, Research Policy, Vol. 23(5), pp.
487-521.
David, P. and G. Wright (2005), “General Purpose Technologies and Productivity Surges: Historical Reflections
on the Future of the ICT Revolution”, Economic History.
Davis, E. P. (2010), “Asset Prices and Real Economic Activity”, OECD Economics Department Working
Papers, No. 764.
Davis, S. and J. Haltiwanger (2014), “Labor Market Fluidity and Economic Performance”, NBER Working Papers, No. 20479.
D’Erasmo, H.J. and P.N. Boedo (2012), “Misallocation, Informality, and Human Capital”, Mimeo.
http://econweb.umd.edu/~derasmo/research/tfp_hk/dms.pdf.
Decker, R., J. Haltiwanger, R. Jarmin and J. Miranda (2014), “The Role of Entrepreneurship in US Job Creation
and Economic Dynamism”, Journal of Economic Perspectives, Vol. 28(3), pp. 3-24.
de Serres, A. et al. (2014), “An International Perspective on the New Zealand Productivity Paradox”, NZ Producitivity Commission Working Paper, No.1.
Draca, M (2012), “Reagan's Innovation Dividend? Technological Impacts of the 1980s US Defense Build-Up”,
Mimeo.
Drivas, K. and C. Economidou (2014), “Is Geographic Nearness Important for Trading Ideas? Evidence from
the US”, MPRA Paper, No. 58105.
Duarte, M and D. Restuccia (2010), “The Role of The Structural Transformation In Aggregate Productivity,”
Quarterly Journal of Economics, 125(1), pp. 129-73.
Duguet, E. and M. MacGarvie (2005), “How Well do Patent Citations Measure Flows of Technology? Evidence
from French Innovation Surveys”, Economics of Innovation and New Technology, 14(5), pp. 375-393.
Eaton J., S. Kortum and F. Kramarz, (2011), “An Anatomy of International Trade: Evidence From French
Firms”, Econometrica, 79(5), pp. 1453-1498.
Ederer, F. (2009), “Launching a Thousand Ships: Incentives for Parallel Innovation”, Mimeo.
European Commission (2013a), “The Skill Mismatch Challenge in Europe”, EU Commission Staff Working Papers, No. 9.
European Commission (2013b), “Box 1.2: The Impact of Uncertainty on Productive Investment”, Quarterly
Report on the Euro Area, No. 12/2.
Fernald, J. (2014), “Productivity and Potential Output Before, During, and After the Great Recession”, in:
NBER Macroeconomics Annual 2014, Volume 29.
Fontagné, L. and J. Fouré (2013), “Opening a Pandora's Box: Modelling World Trade Patterns at the 2035
Horizon”, CEPII Working Papers, No. 22.
Foster, L. C. Grim and J. Haltiwanger (2014), “Reallocation in the Great Recession: Cleansing or Not?”, NBER Working Paper, No. 20427.

ECO/CPE/WP1(2015)6
61
Gabaix, X. and A. Landier (2008), “Why Has CEO Pay Increased So Much?”, The Quarterly Journal of Economics, Vol. 123(1), pp. 49-100.
Gabler, A. and M. Poschke (2011), “Growth through Experimentation”, Centre interuniversitaire de recherche
en économie quantitative working papers, No. 11.
Gal, P. (2013), “Measuring Total Factor Productivity at the Firm Level using OECD-ORBIS”, OECD Economics Department Working Papers, No. 1048.
Goolsbee, A. (1998), “Investment Subsidies and Wages in Capital Goods Industries: To the Workers Go the
Spoils?”, NBER Working Papers, No. 6526.
Gordon, R. (2012), “Is U.S. Economic Growth Over? Faltering Innovation Confronts the Six Headwinds”,
NBER Working Papers, No. 18315.
Griffith, R., S. Redding and J. Van Reenen (2004), “Mapping the Two Faces of R&D: Productivity Growth in a
Panel of OECD Industries”, The Review of Economics and Statistics, 86(4), pp. 883-895.
Griffith, R., S. Redding and H. Simpson (2006), "Technological Catch-Up and the Role of Multinationals",
Revised Version of CEPR Discussion Paper No. 3765.
Griffith, R., S. Lee and J. Van Reenen (2011), “Is Distance Dying at Last? Falling Home Bias in Fixed‐effects
Models of Patent Citations,” Quantitative Economics, 2(2), pp. 211-249.
Haddow, A., C. Hare, J. Hooley and T. Shakir (2013), “Macroeconomic Uncertainty: What Is It, How Can We
Measure It and Why Does It Matter?”, Bank of England Quarterly Bulletin, Q2.
Hall, R.E (1993), “Labour Demand, Labour Supply, and Employment Volatility”, in OJ Blanchard and S.
Fisher, NBER Macroeconomics Annual MIT Press, Cambridge MA, pp, 17-47.
Hall, B.H. and J. Lerner (2009), “The Financing of R&D and Innovation”, NBER Working Paper, No. 15325.
Heller, M. A. and R. Eisenberg (1998), “Can Patents Deter Innovation? The Anticommons in Biomedical
Research”, Science, Vol. 280.
Henderson, R. (1993), “Underinvestment and Incompetence as Responses to Radical Innovation: Evidence from
the Photolithographic Alignment Equipment Industry”, RAND Journal of Economics. 24(2), pp. 248–270.
Henley, A. (1998), “Residential Mobility, Housing Equity and the Labour Market”, Economic Journal, Vol.
108, pp. 414-427.
Iacovone, L. and G. Crespi (2010), “Catching Up with the Technological Frontier: Micro-level Evidence on
Growth and Convergence”, Industrial and Corporate Change, Vol. 19(6), pp. 2073-2096.
Ioannidis, J.P.(2011), “Fund People Not Projects”, Nature, 29 September 2011, Vol. 477, pp. 529-531.
Johansson, Å. et al. (2013), “Long-Term Growth Scenarios”, OECD Economics Department Working Papers,
No. 1000.
Keller, W. and S. Yeaple (2013), “The Gravity of Knowledge”, American Economic Review, Vol. 103(4), pp.
1414-44.
Kerr, W. R. (2008), “Ethnic Scientific Communities and International Technology Diffusion”, The Review of Economics and Statistics, Vol. 90(3), pp. 518-537.
Kerr, W.R.., R. Nanda, and M. Rhodes-Kropf (2014), “Entrepreneurship as Experimentation”, Journal of
Economic Perspectives 28(3), pp. 25–48.
Kortum, S. and J. Lerner (2000), “Assessing the Impact of Venture Capital on Innovation”, Rand Journal of Economics, 31, pp. 674-92.
Krugman, P. (1994), The Age of Diminished Expectations, Cambridge, MIT Press.
Lach, S. and M. Schankerman (2008), “Incentives and Invention in Universities”, RAND Journal of Economics,
Vol. 39(2), pp.403-433.
Lewis, C., N. Pain, J. Strasky and F. Menkyna (2014), “Investment Gaps After the Crisis”, OECD Economics Department Working Papers, No. 1168.

ECO/CPE/WP1(2015)6
62
López-García, P., J.M. Montero and E. Moral-Benito (2013), “Business Cycles and Investment in Productivity-
Enhancing Activities: Evidence from Spanish Firms”, Industry and Innovation, Vol. 20.
Manso, G. (2011), “Motivating Innovation,” Journal of Finance, vol. 66, pp. 1823-1869.
Martin, J.P. and S, Scarpetta (2012), “Setting it Right: Employment Protection, Labour Reallocation and
Productivity”, De Economist, 160, pp. 89-166.
Martinez, C. and D. Guellec (2004), “Overview of Recent Changes and Comparison of Patent Regimes in the
United States, Japan and Europe”, chapter in Patents, Innovation and Economic Performance, OECD,
Paris, pp. 127-162.
Meehan, L. (2014), “Structural Change and New Zealand’s Productivity Performance”, New Zealand
Productivity Commission Working Paper, No. 4.
Melitz, M. (2003), “The Impact of Trade on Intra-Industry Reallocations and Aggregate Industry Productivity”,
Econometrica, Vol. 71, pp. 1695-1725.
Melitz, M. and G. Ottaviano (2008), “Market Size, Trade, and Productivity”, Review of Economic Studies, Vol.
75, pp. 295-316.
Melitz, M. and D. Trefler (2012), “Gains from Trade When Firms Matter”, Journal of Economic Perspectives, Vol. 26(2), pp. 91-118.
Mora Sanguinetti, J. and A. Fuentes (2012), “An Analysis of Productivity Performance in Spain Before and
During the Crisis: Exploring the Role of Institutions”, OECD Economics Department Working Papers, No. 973.
Moretti, E., C. Steinwender and J. Van Reenen (2014), “The Intellectual Spoils of War? Defense R&D,
Productivity and Spillovers", mimeo.
Mowery, D.C. and A. Ziedonis (2001), “The Geographic Reach of Market and Non-Market Channels of
Technology Transfer: Comparing Citations and Licenses of University Patents”, NBER Working Paper Series, No. 8568.
Nanda, R. and T. Nicholas (2014), “Did Bank Distress Stifle Innovation during the Great Depression?,”,
Journal of Financial Economics, Vol. 114(2), pp. 273-292.
Nanda, R. and M. Rhodes-Kropf (2012), “Innovation and the Financial Guillotine” Harvard Business School Working Paper, No. 13-038.
Nelson R. R. (1959), “The Simple Economics of Basic Scientific Research”, Journal of Political Economy, Vol.
67, pp. 297-306.
Nunn, N. (2007), “Relationship-Specificity, Incomplete Contracts and the Pattern of Trade”, Quarterly Journal of Economics, 122(2), pp. 569-600.
OECD (1996), The Knowledge-Based Economy OECD, Paris.
OECD (2001), Measuring Productivity: OECD Manual OECD, Paris.
OECD (2002), Frascati Manual: Proposed Standard Practice for Surveys on Research and Experimental
Development OECD, Paris.
OECD (2008), The Global Competition for Talent: Mobility of the Highly Skilled OECD, Paris.
OECD (2009), OECD Science, Technology and Industry Scoreboard 2009, OECD, Paris.
OECD (2010), The OECD Innovation Strategy: Getting a Head Start on Tomorrow, OECD, Paris.
OECD (2011), Employment Outlook 2011, OECD, Paris.
OECD (2013a), Employment Outlook 2013, OECD, Paris.
OECD (2013b), Interconnected Economies: Benefiting from Global Value Chains, OECD, Paris.
OECD (2013c), Skills Outlook 2013, OECD, Paris.
OECD (2014a), OECD Science, Technology and Industry Outlook 2014, OECD, Paris.
OECD (2014b), Employment Outlook 2014, OECD, Paris.
ECO/CPE/WP1(2015)6
63
Oulton, N and M. Sebastiá-Barriel (2013), “Long and short-term effects of the financial crisis on labour
productivity, capital and output”, Bank of England working papers, 470.
Perla, J., C. Tonetti and M. Waugh (2015), “Equilibrium Technology Diffusion, Trade and Growth”,
NBER Working Papers, No. 20881.
Prinz F., T. Schlange and K. Asadullah (2011), “Believe it or not: How much can we Rely on Published Data on
Potential Drug Targets?”, Nature Reviews Drug Discovery,10(9), pp.712-721.
Pritchett, L. (1997), “Divergence, Big Time”, Journal of Economic Perspectives, Vol. 11(3), pp. 3-17.
Puga, D. and D. Trefler (2010), “Wake Up and Smell the Ginseng: The Rise of Incremental Innovation in Low-
Wage Countries”, Journal of Development Economics, Vol. 91(1), pp. 64-76.
Rajan, R. and L. Zingales (1998), “Financial Dependence and Growth”, American Economic Review, 88(3), pp.
559-86.
Samila, S. and O. Sorenson (2011), “Venture Capital, Entrepreneurship and Economic Growth”, Review of
Economics and Statistics, 93(1), pp. 338-349.
Santoro, M., D. Alok and K. Chakrabarti, (2002), “Firm Size and Technology Centrality in Industry–University
Interactions”, Research Policy, 31(7), pp. 1163-1180.
Schmookler, J. (1966), Invention and Economic Growth (Cambridge, MA: Harvard University Press).
Sheehan, J. and A. Wyckoff (2003), “Targeting R&D: Economic and Policy Implications of Increasing R&D
Spending”, OECD Science, Technology and Industry Working Papers, No. 08.
Solow, R. M. (1957), “Technical Change and the Aggregate Production Function”, Review of Economics and Statistics, Vol. 39(3), pp. 312-20.
Steinwender, C. (2015), “The Roles of Import Competition and Export Opportunities for Technical Change”,
mimeo.
Syverson, C. (2004), “Product Substitutability and Productivity Dispersion”, The Review of Economics and Statistics, Vol. 86(2), pp. 534-550.
Syverson, C. (2011), “What Determines Productivity?”, Journal of Economic Literature, 49(2), pp. 326–365.
Wasmer, E. (2006), “Interpreting Europe-US Labour Market Differences: the Specificity of Human Capital
Investments”, American Economic Review, 96(3), pp. 811-31.
Weitzman, M.L (1998), “Recombinant Growth”, Quarterly Journal of Economics, Vol. 113(2), pp.331-360.
Westmore, B. (2013), “R&D, Patenting and Productivity: The Role of Public Policy”, OECD Economics Department Working Paper, No. 1046.
Wilson, D.J. (2009 ), “Beggar Thy Neighbor? The In-State, Out-of-State, and Aggregate Effects of R&D Tax
Credits”, Review of Economics and Statistics, 91(2), pp. 431–436.
Ziebarth, N. (2012), “Misallocation and Productivity during the Great Depression”, unpublished working paper,
University of Iowa.
Ziedonis, R. H. (2004), “Don't fence me in: Fragmented markets for technology and the patent acquisition
strategies of firms”, Management Science, 50(6), pp 804-820.