FOOD SYSTEMS AND NATURAL RESOURCES
164
U NITED N ATIONS E NVIRONMENT P ROGRAMME FOOD SYSTEMS AND NATURAL RESOURCES
-
Upload
khangminh22 -
Category
Documents
-
view
1 -
download
0
Transcript of FOOD SYSTEMS AND NATURAL RESOURCES

Un
ite
d n
at
ion
s e
nv
iro
nm
en
t P
ro
gr
am
me
FOOD SYSTEMS AND NATURAL
RESOURCES
United Nations Environment ProgrammeP.O. Box 30552 Nairobi, 00100 Kenya
Tel: (254 20) 7621234Fax: (254 20) 7623927
E-mail: [email protected]: www.unep.org
www.unep.org
EditorThe International Resource Panel (IRP)Working Group on Food Systems and Natural Resources chaired by Maarten Hajer
Lead AuthorsHenk Westhoek (lead coordinating author, PBL Netherlands Environmental Assessment Agency), John Ingram (University of Oxford), Siemen van Berkum (LEI –Wageningen UR), Leyla Özay (PBL Netherlands Environmental Assessment Agency) and Maarten Hajer (Professor at Utrecht University and former Director General of PBL Netherlands Environmental Assessment Agency).
Contributions were received from: Maurits van den Berg (PBL), Martha van Eerdt (PBL), Maria Amélia Enríquez (Brazilian Society for Ecological Economy), Len R. Garces Braz (WorldFish – Philipines), Jeff Herrick (USDA-ARS), Lotte Huisman (PBL), Ma Lin, James Lomax (UNEP), Llorenç Mila-I-Canals (UNEP), Kazunobu Onogawa (IGES, Japan), Maripaz Perez (WorldFish – Philipines); Martijn Vink (PBL), Guus de Hollander (PBL) and Gete Zeleke (WLRC- Ethiopia).
The authors would like to thank PBL Netherlands Environmental Assessment Agency for its support in the preparation of this report. They would also like to thank participants of the workshops organized by the IRP in Paris (5-6 September 2012); Nairobi (8-9 November 2013); Jakarta (30 April–1 May 2014); and The Hague (17-18 September 2014) for the inputs provided during the preparation of this report.
The report went through a peer review process coordinated by Elias Ayuk with the support of the IRP Secretariat. The authors thank the anonymous peer reviewers for their constructive comments.
Special thanks go to Janez Potočnik and Ashok Khosla, Co-Chairs of the IRP during the preparation of this report, for their dedication and commitment, as well as to all members of the IRP and its Steering Committee for their constructive comments.
The Secretariat of the IRP coordinated the preparation of this report with the technical support of María José Baptista.
The main responsibility for errors remains with the authors.
Copyright © United Nations Environment Programme, 2016This publication may be reproduced in whole or in part and in any form for educational or nonprofit purposes without special permission from the copyright holder, provided acknowledgement of the source is made.
UNEP would appreciate receiving a copy of any publication that uses this publication as a source. No use of this publication may be made for resale or for any other commercial purpose whatsoever without prior permission in writing from the United Nations Environment Programme.
Design/layout: Marie Moncet, SOURIBLE
Printed by: UNESCO
Cover photos@: 1. Byjeng, Shutterstock.com; 2. Kumpol Chuansakul, Shutterstock.com; 3. CRSHELARE, Shutterstock.com; 4. Aleksandar Todorovic, Shutterstock.com.
Graphics: Filip de Bois and Arie den Boer (PBL)
DisclaimerThe designations employed and the presentation of the material in this publication do not imply the expression of any opinion whatsoever on the part of the United Nations Environment Programme concerning the legal status of any country, territory, city or area or of its authorities, or concerning delimitation of its frontiers or boundaries. Moreover, the views expressed do not necessarily represent the decision or the stated policy of the United Nations Environment Programme, nor does citing of trade names or commercial processes constitute endorsement
The full report should be referenced as followsUNEP (2016) Food Systems and Natural Resources. A Report of the Working Group on Food Systems of the International Resource Panel. Westhoek, H, Ingram J., Van Berkum, S., Özay, L., and Hajer M.
Job Number: DTI/1982/PA
ISBN: 978-92-807-3560-4
Acknowledgements
UNEP promotes environ-
mentally sound practices globally and in its own activities.
This publication is printed on 100% recycled paper, using vegetable -based inks and other eco-friendly practices. Our distribution policy aims to reduce
UNEP’s carbon footprint.

Food
sys
tem
s an
d na
tura
l res
ourc
es
3
About the International Resource Panel
This report was prepared by the Working Group on Food Systems of the International Resource
Panel (IRP). The IRP was established to provide independent, coherent and authoritative scientific
assessments on the use of natural resources and its environmental impacts over the full life cycle
and contribute to a better understanding of how to decouple economic growth from environmental
degradation. Benefiting from the broad support of governments and scientific communities, the Panel is
constituted of eminent scientists and experts from all parts of the world, bringing their multidisciplinary
expertise to address resource management issues. The information contained in the International
Resource Panel’s reports is intended to be evidence based and policy relevant, informing policy
framing and development and supporting evaluation and monitoring of policy effectiveness.
The Secretariat is hosted by the United Nations Environment Programme (UNEP). Since the
International Resource Panel’s launch in 2007, fourteen assessments have been published. Earlier
reports covered biofuels; sustainable land management; priority economic sectors and materials for
sustainable resource management; benefits, risks and trade-offs of Low-Carbon Technologies for
electricity production; metals stocks in society, their environmental risks and challenges, their rates
of recycling and recycling opportunities; water accounting and decoupling; city-level decoupling;
REDD+ to support Green Economy; and the untapped potential for decoupling resource use and
related environmental impacts from economic growth.
The assessments of the IRP to date demonstrate the numerous opportunities for governments and
businesses to work together to create and implement policies to encourage sustainable resource
management, including through better planning, more investment, technological innovation and
strategic incentives.
Following its establishment, the Panel first devoted much of its research to issues related to the
use, stocks and scarcities of individual resources, as well as to the development and application
of the perspective of ‘decoupling’ economic growth from natural resource use and environmental
degradation. Building upon this knowledge base, the Panel has now begun to examine systematic
approaches to resource use. These include the direct and indirect (or embedded) impacts of trade
on natural resource use and flows, and the city as a societal ‘node’ in which much of the current
unsustainable usage of natural resources is socially and institutionally embedded. In a similar vein it
has become apparent that the resource use and requirements of the global food consumption call for
a better understanding of the food system as a whole, and in particular its role as a node for resources
such as water, land, and biotic resources on the one hand and the varied range of social practices
that drive the consumption of food on the other. The years to come will therefore focus on and further
deepening these work streams. Upcoming work by the IRP will focus on integrated scenarios of future
resource demand, material flow database and analysis, resource implications of future urbanization,
global resource efficiency prospects and economic implications, and remanufacturing.


United Nations Environment ProgrammeP.O. Box 30552 Nairobi, 00100 Kenya
Tel: (254 20) 7621234Fax: (254 20) 7623927
E-mail: [email protected]: www.unep.org
www.unep.org
FOOD SYSTEMS AND NATURAL RESOURCES
United Nations Environment ProgrammeP.O. Box 30552 Nairobi, 00100 Kenya
Tel: (254 20) 7621234Fax: (254 20) 7623927
E-mail: [email protected]: www.unep.org
www.unep.org

Pref
ace
6
PrefaceWe are what we eat, they say. Our existence and, therefore, any of the aspirations we might have as a society depend on the availability of, and access to, food. At the same time, our food depends directly on the state of our natural resources. The food we grow, harvest, trade, transport, store, sell and consume is therefore one of the essential connecting threads between people, their culture and wellbeing, and the health of our planet.
Concerns from population growth, climate change, changing patterns of resource consumption, food price volatility, and malnutrition, among others, have raised the profile of the food security debate within the
international science and policy communities. Goal number 2 of the recently adopted Sustainable Development Goals, crystallizes the outcome of this debate and puts it at the top of policy agendas worldwide. It is well acknowledged that without eliminating hunger, achieving food security and improving health and nutrition of the world population, the 2030 Agenda for Sustainable Development cannot be effectively implemented.
Understanding the fundamental role of natural resources in the sound functioning of our global food systems is at the heart of this new report developed by the Food Systems Working Group of the International Resource Panel (IRP). With this report, the IRP is changing the conversation. We are no longer talking about the consequences of unsustainable agriculture and fisheries only. We are talking about the natural resource use and environmental impacts of all food related activities, their governance structures, socio-economic outcomes, and the complex interlinkages between all of these.
The report finds that many of our food systems are currently unsustainable from a natural resources perspective. The way in which these food systems currently operate are responsible for land degradation, depletion of fish stocks, nutrient losses, impacts on terrestrial and aquatic biodiversity, impacts on air, soil and water quality, and greenhouse gas emissions contributing to climate change. The expected population growth, expansion of cities, dietary shifts to unhealthy and unsustainable consumption will increase the pressures even more.
There are, however, significant opportunities to decouple food system activities from environmental degradation, specifically by both increasing efficiencies and improving the management of the natural resource base. Some options include increasing efficiencies of livestock feed (farmed animals consume around 35% of the total crop production), nutrients (the global average nutrient efficiency for nitrogen and phosphorus is only around 20%), genetics and water. New farming technologies (e.g. drip irrigation, ‘low till and precision agriculture’) and improved varieties (e.g. more resilient to water and heath stresses) have the potential to increase the efficiency at multiple levels (lower nitrogen losses, lower water use, and higher productivity), allowing to produce more food with less resources New farm- and decision-making related innovations (e.g. use of mobile technology to provide price and weather related information to farmers, remote sensing monitoring) can help reduce on-farm food loses and improve transparency in food markets thus reducing price volatility. More energy and water efficient food processing (e.g. dry extraction of plant-sourced protein) is also possible. A reduction in food loss and waste across food systems, and a levelling off of meat and dairy consumption in developed countries could reduce the global cereal demand by 15%; while the reduction by 50% of meat and dairy consumption in these countries could lead to up to 40% lower nutrient losses and greenhouse gas emissions.
The assessment shows that there is still much more to do if we want to identify effective points of intervention along the system. While there is a large amount of literature covering natural resource use and impacts from agriculture, there are still important data gaps on other food system activities, their outcomes and their connections (e.g. cultural and health dimensions). Defining the right framework is a necessary starting point.
We are very grateful to Maarten Hajer, John Ingram, Henk Westhoek, and the rest of the team for what we believe is a valuable contribution to advance systems thinking in a topic that requires the fullest attention. Their remarkable work gives us hope that with new practices and engaged actors, it is possible to feed the global population with sufficient nutritious food while nurturing our planet, to ensure continuity of supply for future generations.
Dr. Alicia BárcenaDr. Janez Potočnik
Co-Chairs, International Resource Panel

Food
sys
tem
s an
d na
tura
l res
ourc
es
7
ForewordFor thousands of years, nature has gracefully provided the necessary inputs to feed us, and we have in many occasions taken these precious gifts for granted. This report, “Food Systems and Natural Resources” developed by the International Resource Panel (IRP) is an effort to account for these inputs, looking at how we are using and managing them, the consequences of that management and the options to improve the efficiency with which they are managed.
The 2030 Agenda for Sustainable Development, a historic global commitment to a world free of poverty and hunger, will require science-based decisions that balance and integrate the social, environmental and economic pillars of sustainable development. In this report, the IRP proposes a new way of looking at food, one that moves from a
compartmentalized vision to a more comprehensive, complex yet realistic approach. A ‘food systems lens’ goes beyond the classic production-centered discussions to connect all activities concerned with the food we eat (growing, harvesting, processing, packaging, transporting, marketing, consuming, and disposing of food and food-related items) and the various socio-economic and environmental outcomes of these activities.
The authors provide solid evidence on the need to transition to more ‘resource-smart food systems’, an imperative for the achievement of at least 12 out of the 17 Sustainable Development Goals (SDGs).
Globally, food systems are responsible for 60% of global terrestrial biodiversity loss, around 24% of the global greenhouse gas emissions, 33% of degraded soils, the depletion of 61% of ‘commercial’ fish populations, and the overexploitation of 20% of the world’s aquifers. These pressures on our natural resource base are expected to significantly increase with population, urbanization and supermarketization trends, as well as dietary shifts to more resource-intensive food. By 2050, an expected 40% of the world population will be living in severely water-stressed river basins and greenhouse gas emissions from agriculture may increase from 24% to 30%.
There are also a number of alarming disparities worldwide that reveal the impacts of current food systems on our health. Nearly 800 million people are hungry, over 2 billion suffer from micronutrient deficiencies, while over 2 billion people are obese. Ensuring access to nutritious food will often depend on the way markets function at the local, national, regional and global levels, on the social safety nets created for vulnerable groups of the population (e.g. smallholder farmers), and on their access to infrastructure, finance, knowledge and technology. In countries suffering from overconsumption, lifestyle choices and consumer information play a fundamental role.
The IRP tells us that combined action at different points of intervention and by a diversity of actors throughout the system could lead to resource efficiency gains of up to 30% for certain resources and impacts. Governments, private sector actors, civil society and consumers all have a critical role to play.
The International Resource Panel, under the leadership of the Co-Chairs Alicia Bárcena and Janez Potočnik, has produced a state of the art analysis which reveals some of the greatest complexities we are living with in the anthropocene. I wish to congratulate and thank the authors for this important piece of scientific literature, which sheds some light on the magnitude of challenges we must face and opportunities we must seize to
ensure access by all people to safe, nutritious and sufficient food, all year round.
Achim Steiner
UN Under-Secretary-General
UNEP Executive Director

Food
sys
tem
s an
d na
tura
l res
ourc
es
9
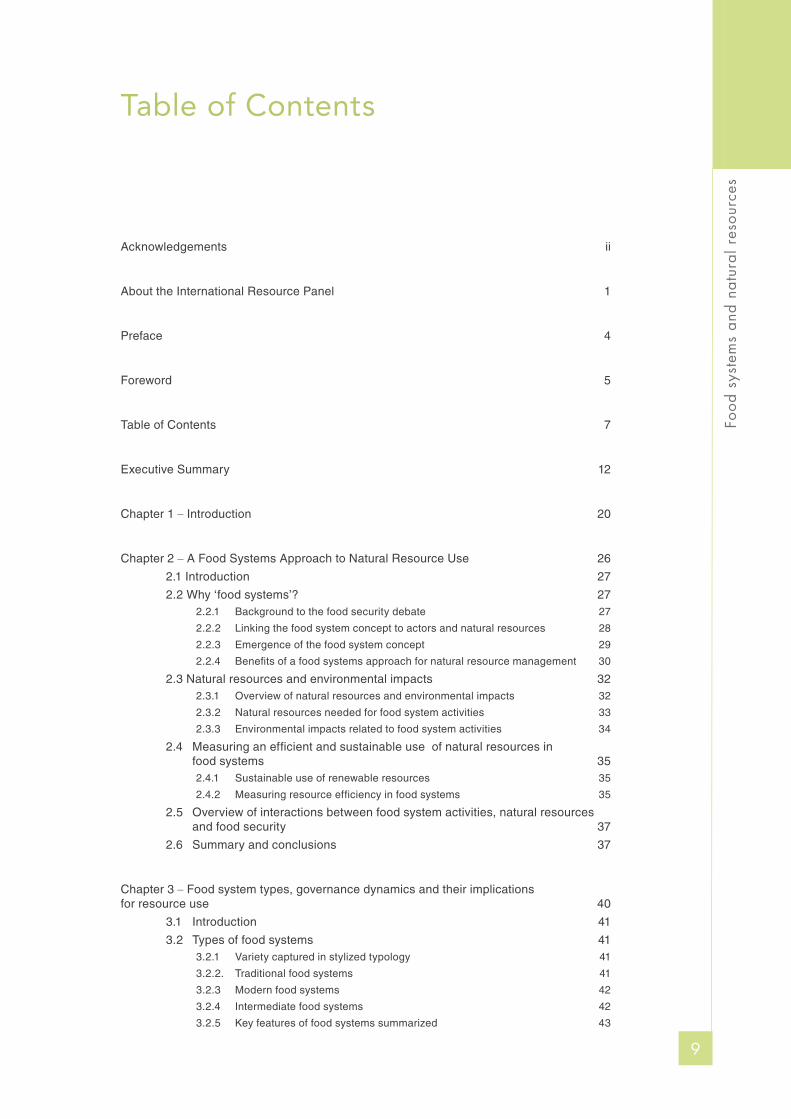
Table of Contents
Acknowledgements ii
About the International Resource Panel 1
Preface 4
Foreword 5
Table of Contents 7
Executive Summary 12
Chapter 1 – Introduction 20
Chapter 2 – A Food Systems Approach to Natural Resource Use 26
2.1 Introduction 27
2.2 Why ‘food systems’? 272.2.1 Background to the food security debate 27
2.2.2 Linking the food system concept to actors and natural resources 28
2.2.3 Emergence of the food system concept 29
2.2.4 Benefits of a food systems approach for natural resource management 30
2.3 Natural resources and environmental impacts 322.3.1 Overview of natural resources and environmental impacts 32
2.3.2 Natural resources needed for food system activities 33
2.3.3 Environmental impacts related to food system activities 34
2.4 Measuring an efficient and sustainable use of natural resources in food systems 352.4.1 Sustainable use of renewable resources 35
2.4.2 Measuring resource efficiency in food systems 35
2.5 Overview of interactions between food system activities, natural resources and food security 37
2.6 Summary and conclusions 37
Chapter 3 – Food system types, governance dynamics and their implications for resource use 40
3.1 Introduction 41
3.2 Types of food systems 413.2.1 Variety captured in stylized typology 41
3.2.2. Traditional food systems 41
3.2.3 Modern food systems 42
3.2.4 Intermediate food systems 42
3.2.5 Key features of food systems summarized 43
Tabl
e of
Con
tent
s
10
3.3 Main features of coordination mechanisms in food systems 45
3.4 Governance of food systems 463.4.1 Change in role of government 46
3.4.2 Food systems increasingly governed by downstream actors 47
3.4.3 Implications of ‘supermarketization’ for food market structures and resource use 49
3.5 Summary and conclusions 50
Chapter 4 – Socio-economic drivers impacting on food demand, production and food system outcomes 52
4.1 Introduction 53
4.2 Population growth and urbanization 53
4.3 Implications for food demand 55
4.4 Trends in global food production and trade in response to changing consumption patterns 584.4.1 Developments in crop production and trade 58
4.4.2 Increase in yields is expected to remain the main driver of production growth 59
4.4.3 Large increase in livestock production 60
4.4.4 Fisheries and aquaculture 61
4.5 Food system outcomes for food security 624.5.1 Number of people undernourished 62
4.5.2 Food price development 63
4.5.3 Rural livelihoods in the context of rapidly changing and consolidating food systems 65
4.5.4 Food losses and food waste 65
4.5.5 Food consumption trends and health 66
4.6 Summary and Conclusions 69
Chapter 5 – Natural resources and environmental impacts of food systems 70
5.1 Introduction 71
5.2 Land, landscape and soils 715.2.1 Land use and food systems 71
5.2.2 Are current and future land use efficient and sustainable? 72
5.2.3 Consequences of unsustainable or inefficient land use 75
5.3 Water 755.3.1 Water and food systems 75
5.3.2 Is current and projected water use efficient and sustainable? 76
5.3.3 Consequences of inefficient or unsustainable water use 77
5.4 Minerals (nutrients) 785.4.1 Nutrients and food systems 78
5.4.2 Is the current and projected use of minerals efficient? 80
5.4.3 What are the consequences of an inefficient use of minerals? 81
5.5 Biodiversity and ecosystem services 835.5.1 The relevance of biodiversity and ecosystem services for food systems 83
5.5.2. Is the current and projected use of biodiversity and ecosystem services sustainable and efficient? 84
5.5.3 What are the consequences of inefficient and unsustainable use? 86
5.6 Genetic resources 86
5.7 Marine and inland aquatic resources 875.7.1 Marine resources and food systems 87
5.7.2 Are marine resources used efficiently and sustainably? 88
5.7.3 What are the consequences of the inefficient and unsustainable use of marine resources? 90
5.8 Fossil fuels 90

Food
sys
tem
s an
d na
tura
l res
ourc
es
11
5.9 Environmental impacts 915.9.1 Water quality 91
5.9.2 Soil quality 92
5.9.3 Air quality 92
5.9.4 Greenhouse gas emissions 92
5.10 Food categories, resource use and human health 93
5.11 Summary and Conclusions 96
Chapter 6 – Understanding food systems in context: actors, behaviors and institutions 98
6.1 Introduction 99
6.2 Food system actors and their behavior 99
6.3 Farmers and fishermen 1006.3.1 Institutional and regulatory environment 100
6.3.2 Physical environment 102
6.3.3 Social, cultural and economic environment 102
6.4 Consumers and citizens 103
6.5 Food companies, food service and retail 104
6.6 Governments 105
6.7 Non-governmental and other civil society actors 105
6.8 Summary and conclusions 106
Chapter 7 – Options towards environmentally-sustainable food systems 108
7.1 Introduction 109
7.2 What do sustainable food systems look like from a natural resource perspective? 109
7.3 Overview of options 111
7.4 Brief description of options 1157.4.1 Options to increase resource efficiency in primary food production 115
7.4.2 Options to increase resource efficiency along food systems 117
7.4.3 Options outside the food system 120
7.5 Potential effects of options 120
7.6 Summary and conclusions 121
Chapter 8 – Opportunities for a transition towards sustainable food systems 124
8.1 Introduction 125
8.2 Limitations and the need for realism 125
8.3 ‘Principles’ and importance of the ‘food system lens’ 126
8.4 Analysis of national or regional food systems and impact on national resources 126
8.5 Three pathways towards environmentally-sustainable food systems 1288.5.1 Reforms by governments and international institutions 128
8.5.2 Private actors 131
8.5.3 Alternative (niche) innovators and NGOs 131
8.5.4 Co-evolution of three pathways for an upward spiral movement 133
8.5.5. Flexible, participative governance and co-opting with private actors that integrate sustainability as the core of their business 133
8.6 Nodes of action 1358.6.1 Cities and reconnecting urban – rural relationships 135
8.6.2 Changing food consumption patterns, using health as a point of entry to improve natural resource management 136
8.6.3 Nutrients flows as indicator for food system functioning 137
8.7 Summary and conclusions 138
Tabl
e of
Con
tent
s
12
References 140
Annex 1 Resource specific options for a more sustainable and efficient use of natural resources in food systems 153
Annex 2 Glossary 158
List of figuresFigure 1 Relation between resource use, environmental impacts and food system activities 30
Figure 2 Relation between resource use and environmental impacts related to food system activities 33
Figure 3 Conceptual Framework of Food System Activities and Natural Resources 38
Figure 4 Population growth and urbanization per region 54
Figure 5 Urbanization and megacities by 2025 54
Figure 6 Per capita consumption of meat in selected countries or regions 56
Figure 7 Past and projected wheat import in five selected tropical countries (in 1000 t per year) 57
Figure 8 Per capita consumption of cereals in selected countries or regions 57
Figure 9 Current and projected production of cereals and oilseeds in a number of selected regions 58
Figure 10 Evolution of cereal utilisation shares (wheat and coarse cereals) in developed and developing countries between the base year (2011/13) and 2023 59
Figure 11 Increase in yield and harvested areas for main crops 60
Figure 12 Livestock production in various regions 61
Figure 13 Fishery production in live weight equivalent 61
Figure 14 Prevalence of undernourishment 62
Figure 15 Food affordability 63
Figure 16 Food price developments 1961–2014 64
Figure 17 Per capita food losses and waste in different regions (kg/year) 66
Figure 18 Prevalence of obesity 67
Figure 19 Yield gaps for wheat, maize and rice combined for the year 2000 73
Figure 20 Trends in total harvested area of staple crops and three major cereal crops 73
Figure 21 Regions vulnerable to crop production losses due to irrigation water shortages 76
Figure 22 Nutrient flows in food systems and various impacts 80
Figure 23 Trends and projections in global consumption of nitrogen and phosphorus fertilizer 81
Figure 24 Status of fish stocks 1974–2011 89
Figure 25 Land use (left) and greenhouse gas emissions (right) per kilogram of protein 95
Figure 26 Options for sustainable and efficient use of natural resources and reduced environmental impacts in food systems 112
Figure 27 Effect of various scenarios on cereal demand 121
Figure 28 Schematic representation of a national (or regional) food system, disaggregated into a food production and consumption system 128
Figure 29 Spiral movements created by the co-evolution of different pathways 133
Figure B.1 Geographical distribution of aquaculture production 2013 68
Figure B.2 Evolution of canal, tank and well irrigation in India 1950-2000 78
Figure B.3 Flows of N and P in the food pyramid in China at national level in 1980 and 2005 82
Figure B.4 Changes in environmental services and goods of watershed treated by MERET Project 119
Figure B.5 Changes in asset at HH level due to integrated homestead development in Ana Belesa watershed, Lemu, Ethiopia 119
Figure B.6 Fish consumption in the Netherlands 132

Food
sys
tem
s an
d na
tura
l res
ourc
es
13
List of TablesTable 1. Indicative functions of natural resources needed for food system activities 34
Table 2. Causes of negative impacts of food system activities on the environment 35
Table 3. Definition of efficiency and sustainable use of natural resources needed for food system activities 36
Table 4. Comparing some features of ‘traditional’, ‘intermediate’, and ‘modern’ food systems 44
Table 5. Concentration in the Food Supply Chain – A Global Perspective 48
Table 6. Essential minerals (nutrients) needed in the food system, for crop and animal production as well as for humans 79
Table 7. Benefits from ecosystem services on various food system activities and impacts of these activities on terrestrial and aquatic biodiversity 84
Table 8. Estimates of GHG emissions (in or around the year 2010) of sources within the food system (Mt CO2-eq/yr) 94
Table 9. Status of natural resources as needed for food system activities 96
Table 10. Property rights regimes and institutional arrangements 101
Table 11. Principles and indicators for sustainable food systems from the natural resource perspective 111
Table 12. Example of options to reduce the impact of food system activities on resources and the environment (including synergies and trade-offs) 114
Table 13. Non-exhaustive overview of current policies influencing directly or indirectly food systems and the use of natural resources 130
Table 14. List of illustrations of sustainability-encouraging initiatives by the private sector (non-exhaustive) 132
List of BoxesBox 1 Combining resources: the great balancing act to reach good overall efficiency 37
Box 2 Rapid changes in Southeast Asia 56
Box 3 Case study aquaculture 68
Box 4 Rapid growth of groundwater irrigation in India 78
Box 5 Case study of China 82
Box 6 Genetically-modified (GM) crops 88
Box 7 ‘THINK EAT SAVE’ – Global engagement for the zero hunger challenge 117
Box 8 Reducing waste in Surabaya through composting and multi-stakeholder collaboration 118
Box 9 Case Study: Impacts of MERET Project on environment and livelihoods 119
Box 10 Draft framework for analyzing national food systems, with focus on national resources 127
Box 11 MSC and the Netherlands 132
Box 12 The School Lunch Programme in Brazil: The case of Paragominas 134

Exec
utiv
e Su
mm
ary
14
Executive Summary
1. Environmentally-Sustainable Food Systems1: an Imperative for Sustainable Development
Food systems are at the heart of the 2030 Agenda for Sustainable Development, a historic global
commitment to eradicate poverty and hunger while ensuring healthy, prosperous and fulfilling lives.
The food we grow, produce, consume, trade, transport, store and sell is the essential connecting
thread between people, prosperity, and planet. We therefore need ‘resource-smart’ food systems.
Food systems crucially depend on natural resources: land, soil, water, terrestrial and marine
biodiversity, minerals (essential nutrients for crops and animals) and fossil fuels. The use of these
natural resources goes beyond primary food production, e.g. fresh water for processing and biomass
for packaging or cooking. If we want ensure all people have safe and nutritious food, in appropriate
amounts, these natural resources need to be managed sustainably and used efficiently, while
reducing environmental impacts.
The food sector is globally the dominant user of a number of natural resources, particularly land,
biodiversity, fresh water, nitrogen and phosphorus. Food systems, and food production in particular,
are also a major driver of a number of environmental impacts, such as the loss of biodiversity, soil
degradation, water depletion and greenhouse gas emissions. Therefore, the people who directly or
indirectly manage our food systems are also the largest group of natural resource managers in the
world and could become critical agents of change in the transformation of current consumption and
production systems.
2. Current food systems are unsustainable and/or inefficient. [cf. Chapter 5]
Key statistics show the crucial role of food systems in the degradation or depletion of natural
resources and provide evidence of unsustainable and/or inefficient practices regarding the use of said
resources. This data is necessarily indicative. Indeed, the considerable lack of reliable data on the
current condition of natural resources is a concern in itself. Also, the current state of natural resources
significantly varies across regions.
−33% of soils is moderately to highly degraded due to erosion, nutrient depletion, acidification,
salinization, compaction and chemical pollution2;
−61% of ‘commercial’ fish populations are fully fished and 29% are fished at a biologically unsustainable
level and therefore overfished3.
−At least 20% of the world’s aquifers are overexploited, including in important production areas such
as the Upper Ganges (India) and California (US)4;
−60% of global terrestrial biodiversity loss is related to food production5, while ecosystem services
supporting food production are often under pressure;1234 5
1. A food system “gathers all the elements (environment, people, inputs, processes, infrastructures, institutions, etc.) and activities that relate to the production, processing, distribution, preparation and consumption of food, and the outputs of these activities, including socio-economic and environmental outcomes”. (HLPE, 2014a)
2. http://www.fao.org/nr/lada/gladis/gladis/; FAO (2015) Soil is a non-renewable resource: Data for 2000-20053. FAO (2014) The state of world fisheries and aquaculture 2014, Rome. Data for 2011.4. Gleeson T., Wada Y., Bierkens M.F., van Beek L.P. (2012) Water balance of global aquifers revealed by groundwater footprint. Nature 488:197-200.5. PBL (2014) How sectors can contribute to sustainable use and conservation of biodiversity, The Hague, (eds Kok M, Alkemade R), PBL & CBD. Data for 2010

Food
sys
tem
s an
d na
tura
l res
ourc
es
15
−Of the total input in the form of nitrogen- and phosphorus fertilizers, only 15-20% is actually
embedded in the food that reaches the consumers’ plates, implying very large nutrient losses to
the environment6. Some regions have lower efficiency and higher losses (North America, East Asia),
while in Sub-Saharan Africa soil nutrient depletion (where extraction is higher than input) is common.
−Globally, food systems account for around 24% (21-28%) of the global greenhouse gas emissions7.
There are large regional differences in how food systems are managed, and hence the nature of
their impacts on natural resources. In some regions, land degradation and biodiversity loss are the
major issues, while in other regions high nutrient losses leading to declines in air and water quality
are of greater concern. In many cases, progress has been made over recent decades on various
aspects of resource use in their food systems leading to, for example, higher crop yields (meaning
more efficient use of agricultural land), increased nutrient- and water-use efficiency, improved water
quality and lower greenhouse gas emissions. In other cases, such progress has been slower, or trade-
offs have occurred, for example the focus on higher crop yields has led to water pollution by nutrients
or pesticides or to soil degradation.
3. Food, natural resources and health concerns interrelate: current food security, natural resource management practices and diet-related human health are far from satisfactory. [cf. Chapter 4]
Although much progress has been made in some aspects, current food systems are not delivering
food security and healthy food for everyone nor are they sustainably using the limited natural resource
inputs as explained above. Food production has more than doubled, diets have become more
varied (and often more energy-intense) satisfying peoples’ preferences in terms of form, taste and
quality; numerous local, national and multi-national food-related enterprises have emerged providing
livelihoods for millions. Nonetheless over 800 million people are hungry, over 2 billion suffer from
micronutrient deficiencies, in particular vitamin A, iodine, iron and zinc, and over 2 billion people
overweight or obese8. This situation, and particularly the unhealthy overconsumption by an increasing
number of people, is unsustainable and needs to change.
Nutrition is the cornerstone of sustainable development. To achieve the international targets set by
the United Nations Secretary-General Zero Hunger Challenge9 and Sustainable Development Goal
210 we must re-think the way in which food system activities are structured and carried out. Ensuring
access to nutritious food for all is at the core of this change and this will often depend on the way
markets function at the local, national, regional and global levels, on the social safety nets created for
vulnerable groups of the population (e.g. the urban poor and smallholder farmers), and on their access
to infrastructure, finance, knowledge and technology. In societies suffering from overconsumption,
lifestyle choices and consumer information play a fundamental role.
6 7 8 9 10
6. Sutton M.A., et al (2013) Our nutrient world: the challenge to produce more food and energy with less pollution NERC/Centre for Ecology & Hydrology, Edinburgh. Data for 2000 - 2011
7. FAO. (2014) Agriculture, Forestry and Other Land Use emissions by sources and removals by sinks, Rome; Vermeulen S.J., Campbell B.M., Ingram J.S.I. (2012) Climate Change and Food Systems. Annual Review of Environment and Resources 37:195-222. Data for 2010. See also chapter 5 of this report
8. Ng M., Fleming T., Robinson M., Thomson B., Graetz N., Margono C., Mullany E.C., Biryukov S., Abbafati C., Abera S.F. (2014) Global, regional, and national prevalence of overweight and obesity in children and adults during 1980–2013: a systematic analysis for the Global Burden of Disease Study 2013. The Lancet.
9. The Zero Hunger Challenge sets five targets: 100% access to adequate food all year round; 0 stunted children under the age of 2; all food systems are sustainable; 100% increase in smallholder productivity and income; zero food loss or waste.
10. Sustainable Development Goal 2: “End hunger, achieve food security and improved nutrition and promote sustainable agriculture”.

Exec
utiv
e Su
mm
ary
16
4. Pressure on natural resources is expected to increase steadily over the coming decades. [cf. Chapters 4 and 5]
A number of developments will have important consequences for the use of natural resources in food
systems:
1. The expected population growth, especially in Africa and Asia, implying a higher demand for food;
2. The increase in wealth in a large number of developing countries, typically leading to diets which are
richer in resource-intensive products, such as (red) meats, fish, fruits and vegetables as well ultra-
processed food and drink products. This process is intermingled with the effects of urbanization.
3. Climate change, which will impact both average weather conditions and extremes, which will have
a large impact on the natural resources needed for food production.
5. There are significant opportunities to decouple food system activities from environmental degradation. [cf. Chapter 7]
The sustainable and efficient management of natural resources is now an imperative for the achievement
of all United Nations Sustainable Development Goals (SDGs). Restoring and maintaining the health of
the natural resource base is not only needed to adequately feed current and projected populations,
but to provide a better quality of life in the years to come.
Sustainable resource management is about preventing degradation of resources (land, sea,
ecosystem services), by reducing overexploitation (for example through regulation, pricing strategies
or resource valuation) and adopting effective management practices of landscape elements such as
wooded areas, hedges and wetlands.
Increasing the efficient use of all resources in all food system activities will help move towards a
more sustainable use of renewable resources (e.g. fresh water reserves), lower environmental impacts
(e.g. eutrophication from nutrient run-off and lower greenhouse gas emissions) and a lower depletion
rate of non-renewable resources (e.g. fossil fuels and minerals).
Many options across the whole food system are already available to enable more efficient natural
resource use and enhance decoupling of increasing food production from resource depletion. Although
good integrated assessments of the combined potential of various options are lacking, findings from
studies looking at individual options indicate that these could lead to an estimated 5–20% improvement
in efficiency; when combined, the increase could be up to 20–30% for certain resources and impacts,
assuming limited rebound effects. Options towards environmentally-sustainable food systems are very
context and location dependent, but could include:
− ‘Sustainable intensification’ of crop production (e.g. higher yields without increasing environmental
impacts);
−More effective use of ecosystems services (e.g. integrated pest management to reduce pesticide
use);
−Better feed conversion (without reducing animal welfare) and higher productivity of pastoral systems;
−Higher nutrient efficiency along the food chain (e.g. better recycling of minerals in animal manure,
use of by-products or food wastes as feed or compost, recycling of minerals from cities, etc.);
−More efficient aquaculture systems, with lower nutrient losses and less impact on coastal systems;
−More energy- and water-efficient food processing;
−Reduction of food losses in farms and fisheries, and reduction of food waste throughout food systems;

Food
sys
tem
s an
d na
tura
l res
ourc
es
17
−Reduction of overconsumption and change of unhealthy dietary patterns (e.g. shift in affluent
societies from animal-based to more plant-based diets).
If the above changes are not made, land degradation, the depletion of aquifers and fish stocks and
contamination of the environment will lower future food production capacity. It will undermine the
food systems upon which our food security depends, as well as cause further degradation of other
ecosystem functions.
6. A ‘food systems’ lens is essential to improve resource efficiency, food and nutrition security. [cf. Chapter 2, 6 and 8]
One of the great strengths of the SDGs is the global recognition of the close links between human
well-being, economic prosperity and a healthy environment. There is a growing amount of scientific
information about the inter-linkages between the Earth’s systems and human activities. A systems
approach is needed to understand these complexities and identify effective responses to emerging
human development challenges. This is certainly also applicable to the analysis of natural resource
use and environmental impacts of food.
To effectively enhance resource efficiency in food systems the focus of attention should be expanded
from farmers and fishermen, to include other actors further along (“downstream”) the ‘food chain’, and
ultimately to consumers. In our interconnected and complex world, acknowledging the important roles
of food processors, packers, transporters, retailers and consumers, in addition to food producers, is
an important step to identify pathways that address the challenges regarding natural resources, while
simultaneously improving food and nutrition security. Using the food systems lens on local, national or
regional levels allows for the analysis of underlying drivers and possible solutions in a more systematic
and holistic manner.
A thorough analysis of existing food systems can assist in identifying the most important issues
regarding natural resources, as well as the opportunities for effective policy, fiscal, social and/or
technical interventions. In order to identify these opportunities, national or local food systems need to
be properly analyzed (a multi-disciplinary exercise): Who are the main actors? How is the economic
system functioning? What are the crucial institutional and governance arrangements? Which regulations
are in place? What are the major developments of the last 10-20 years? What is the position of women
in food systems?
An analysis from a systems perspective will reveal underlying causes of unsustainable production and
consumption patterns. These underlying causes will vary substantially across world regions. Analysis
through a food systems ‘lens’ helps identify where the greatest overall resource use efficiency gains
can be achieved. Ambitions can be set to improve resource use efficiency as well as food security
outcomes.
When analyzing food systems, it is important to note that on a local or national level, the food
production system and the food consumption system rarely coincide: a part of the food produced
might be exported, while a part of the food consumed is imported. This can reduce the capacity of
governments to take action, for example because they cannot directly influence natural resource use
of imported food products.

Exec
utiv
e Su
mm
ary
18
7. The convergence of some unsustainable trends in global food systems can lead to greater resource inefficiencies. [cf. Chapter 3 and 4]
Current food systems vary worldwide from ‘modern’ food systems in industrialized and emerging
regions to more ‘traditional’ food systems in rural areas in developing countries. This variety in food
systems, in combination with the social and natural environment in which they operate, has important
implications on the possible pathways towards sustainable food systems and on the logic of intervention.
In developing regions, there is a rapidly evolving replacement of traditional food systems by modern
food systems. This trend is driven by macro-trends such as urbanization, increased wealth and other
socio-economic and demographic developments. These intertwined trends also imply changes in
dietary patterns and ‘supermarketization’ in many parts of the world. These developments significantly
increase the pressure on our natural resources.
8. There are multiple pathways towards sustainable food systems. [cf. Chapter 8]
By using the food system lens, effective interventions can be identified towards sustainable food
systems. These actions can be initiated by various actors from governments, companies and civil
society. Governments have an important task in setting the institutional and regulatory framework.
Especially in developing countries, poor tenure rights (of land and water) and access to natural capital,
coupled with weak regulation, poor levels of education and limited access to input and output markets
do not encourage sustainable resource use. The environmental costs (externalities) of the food
system are hardly included in food prices (TEEB, 2015)11. The pricing of environmental externalities,
reinforcement of legislation to prevent pollution and other forms of environmental degradation, and the
removal of harmful subsidies (e.g. fossil fuels) could provide important incentives to improve resource
efficiency. Governments play an important role in education, which is relevant both for food producers,
as well as for food consumers. Children need to be taught how to prepare food from basic ingredients,
and need to be aware of its nutritional aspects.
In all countries there is currently a large number of laws, financial and other regulations that are
influencing directly or indirectly food systems and the use of natural resources. These can be policies
at the international level (e.g. trade regulations), at the national level, but also at the local level (e.g.
local farming extension services, location of restaurants, urban waste management, etc.). Aligning
these policies in such a way that these contribute to sustainable food systems is thus an important
mission for authorities at various levels of government. Governments have also a role in stimulating
and facilitating innovations, new initiatives, collaboration and cooperation along the system. In general,
special attention is needed for the role of women, as they are usually critical participants in food
production and main managers of food consumption in their households. A number of concrete actions
that governments could implement are:
1. Removal of subsidies that encourage unsustainable production or practices (e.g. fossil fuel
subsidies);
2. Creation of adequate legal frameworks to secure property rights and land tenure and regulate
access to and use of water, biodiversity, and ecosystems services;
3. Creation of adequate legal frameworks to regulate environmental impacts from food systems (e.g.
regulation to prevent nutrient losses at all stages, but especially in the livestock sector);11
11. TEEB (2015) TEEB for Agriculture & Food: an interim report, United Nations Environment Programme, Geneva, Switzerland

Food
sys
tem
s an
d na
tura
l res
ourc
es
19
4. Investment in management practices and research development to enable a more effective use of
biodiversity and ecosystem services in food production;
5. Investment in technology and research development for locally suitable seeds and breeds (with
proper infrastructure, distribution system, quality assurance and certification schemes);
6. Creation of incentives for local or regional sourcing and investment in sustainable local supply
chains;
7. Attraction of investments in rural infrastructure, small enterprise development (e.g. inputs, local
storage and processing facilities, logistic and transport);
8. Facilitation of collaborative schemes between different food system actors (e.g. cooperation
agreements among retailers to establish marketing codes of conduct);
9. Creation of incentives for cities to become innovation incubators where ideas on sustainable food
systems are tested (urban farming, education campaigns, sustainable sourcing, food environment
regulations, etc.);
10. Adoption of consumption-oriented policies (e.g. to promote consumption behavior research,
stricter marketing rules for unhealthy food, create a food environment which stimulates healthy
and sustainable diets);
11. Creation of adequate monitoring systems of the status of the natural resources needed in food
systems, as well as their environmental impacts;
12. Creation of education programmes on the links between natural resources, consumption patterns
and health.
The global community has called upon all businesses “to apply their creativity and innovation to solving sustainable development”.12 Private actors are crucially important players in food systems, as food
systems are in effect a collation of enterprises. The current business logic of many food systems
does not always give actors the right incentives to promote more sustainable practices. However,
many companies are increasingly seeing it in their long term interest to invest in more sustainable
supply chains. Private companies could undertake actions such as paying farmers and fishermen for
better management of natural resources, helping smallholder farms and small agri-food businesses in
developing countries invest in more sustainable activities including improving water and energy use-
efficiency in food storage and processing, and in other post-farm-gate activities. Private actors have a
key role in reducing food waste, especially in modern food systems, as well as in making healthy and
sustainable food choices easier for consumers.
In many developing countries, smallholder farmers are not connected to modern food value chains
that largely target urban consumers or export markets. Actors as retailers and food companies could
invest in local supply chains, while assisting farmers to increase production in a sustainable way.
In affluent sections of society – both in ‘developing’ or ‘developed’ regions – the high consumption of
animal based products, as well as of ultra-processed food (often containing ‘empty calories’) brings
disproportionate environmental costs, and moreover undermines public health due to obesity-related
diseases. This high consumption is partly driven by food companies influencing demand towards
products with attractive profit margins.
Finally, actors from civil society can stimulate governments and private actors to take action, either in
the form of constructive dialogue or by awareness raising and campaigning. They also can stimulate
certain niche players, and thus challenge incumbent actors to act more swiftly.
12
12. General Assembly resolution 70/1, Transforming our world: the 2030 Agenda for Sustainable Development, A/RES/70/1 (21 October 2015), available from undocs.org/A/RES/70/1.

Exec
utiv
e Su
mm
ary
20
Twelve critical shifts towards environmentally-sustainable food systems1. Reduce food loss and waste.
2. Reorient away from resource-intensive products such as meat, ‘empty calories’ and ultra-processed food; and rethink the ‘food environment’ (the physical and social surroundings that influence what people eat, especially relevant in urban areas) to facilitate consumers adopting more healthy and sustainable diets.
3. Reframe thinking by promoting ‘resource-smart food systems’ in which ‘Climate-Smart Agriculture’ (CSA) plays one part, and search for linkages to new dominant values such as ‘wellbeing’ and ‘health’.
4. Reconnect rural and urban, especially in developing regions, where urban actors (e.g. supermarkets) could invest in regional supply chains and improve the position of smallholders.
5. Revalue the pricing of environmental externalities, reinforce legislation to prevent pollution and other forms of environmental degradation and remove subsidies that provide disincentives for better resource efficiency.
6. Reconnect urban consumers with how their food is produced and how it reaches their plates, and inform them about both the health and environmental consequences of dietary choices, protect peri-urban zones around cities and use them for local food production.
7. Research the current functioning of the local, national or regional food systems and their impact on national resources.
8. Reconnect mineral flows between urban areas and rural areas, as well as between crop and livestock production.
9. Reform policies on land and water rights, develop and implement policies at all levels of governments (multilateral, national and local) to enable better resource management and encourage synergistic ‘adaptive governance’ by the wide range of non-state actors (i.e. businesses and civil society) within the food system.
10. Reinvigorate investment in rural infrastructure, education, training, technology, knowledge transfer and payments of environmental services.
11. Research and innovate, to decouple food production from resource use and environmental impacts, and to replace certain inputs (such as pesticides) with ecosystem services.
12. Rebuild feedback loops by functional and informative monitoring and reporting, at various levels, such as countries, cities and companies.


Intr
od
uctio
n
Cre
dit:
And
rii G
orul
ko, S
hutt
erst
ock.
com
Introduction
Chapter
1

23
Food
sys
tem
s an
d na
tura
l res
ourc
es
All people have the right to a healthy diet. This
right has been unequivocally recognized by the
international policy, scientific and civil society
communities. It was reaffirmed by global leaders
at the Conference on Sustainable Development
(Rio+20) and integrated into the 2030 Agenda for
Sustainable Development, a universally adopted
document which establishes the goal to “end
hunger, achieve food security and improved
nutrition and promote sustainable agriculture”.
This fundamental right and the goal set by the
international community will only be protected
and achieved if we change the way in which
we manage our food system, that is the way
in which we grow, produce, trade, transport,
store, sell and, consume our food. In fact, the
effective implementation of the entire agenda for
sustainable development will depend on the way
in which we manage the natural resources that
allow the food system to function effectively.
The food system is critically dependent on
a large array of natural resources. These
include land, water, minerals, biodiversity and
ecosystem services, including genetic resources
and marine resources such as fish stocks. The
sustainable and efficient use of these resources
is thus essential for satisfying both current and
future food demand. Due to increased wealth,
globalization and urbanization, substantial
changes in food systems and consumption
patterns have taken place in many parts of the
world. These changes are projected to continue,
leading to an increase in total food demand and
hence an increase in resource use.
The UNEP International Resource Panel (IRP)
has identified food and its multiple resource
interactions as an important ‘node’. Rather
than looking at each resource separately (such
as land, water, minerals and biodiversity), the
Panel has chosen a more integrated approach.
In relation to food production in particular, this
approach is based on its report on priority
products and materials which states that
agriculture “is responsible for by far the most
of the land and water use globally, leading to
habitat loss and other negative impacts on
ecosystems. The use of agrochemicals is related
to ecotoxicity, eutrophication and depletion
of phosphorus stocks. Intensive agriculture is
related to substantial energy use. The loss of soil
and biomass carbon can contribute to climate
change. [.]. On the other hand, agriculture can
also contribute to environmental solutions, e.g. by
binding carbon in the soil, increase biodiversity
through diverse habitats. The impacts of
agriculture thus depend to a substantial degree
on specific aspects of the activities and hence the
resource management regime.” The same report
points at fisheries, stating that “overexploitation
of resources is clearly associated with this
sector, as well as relatively high emissions from
industrial fisheries.”13
The Panel also aims to support the
implementation of the UN Secretary-General’s
‘Zero Hunger Challenge’ which aims for
sustainable food systems and a 100% access to
adequate food all year round. The UN Secretary-
General states that the elimination of hunger by
2050 requires “comprehensive efforts to ensure
that every man, woman and child enjoy their
right to food, […] investments in agriculture, rural
development, decent work, social protection and
equality of opportunity” and he encourages a
range of organizations and social movements to
participate and invest in this vision14.
For these reasons, and recognizing that food
security involves more than just food production,
the IRP decided to undertake a study on ‘Food
Systems and Natural Resources’. Before delving
into the reasons for taking this focus, it is useful
to define what is meant by ‘food systems’. The
High Level Panel of Experts on Food Security
and Nutrition which report to the UN Committee
on World Food Security (CFS), define a food
system as:
“all the elements (environment, people, inputs,
processes, infrastructures, institutions, etc.)
and activities that relate to the production, 13 14
13. UNEP (2010) Assessing the environmental impacts of consumption and production: priority products and materials, Nairobi / Paris, International Resource Panel United Nations Environmental Programme.
14. http://www.un.org/en/zerohunger/challenge.shtml

24
Intro
duct
ion
processing, distribution, preparation and
consumption of food, and the outputs of these
activities, including socio-economic and
environmental outcomes” (HLPE, 2014a).
There are a number of reasons for looking at food
systems rather than at food production alone:
−Recent decades have seen many initiatives
and activities undertaken to increase the
output of the agricultural and fisheries sectors.
In parallel to this, much effort has been put
into increasing the sustainable and efficient
use of natural resources, with mixed results
and major challenges. An approach which
merely focuses on the production side does
not consider opportunities within other food
system activities (such as food processing,
retailing and preparing) to attain more resource
efficiency across the whole system. Reducing
food losses and waste offers an especially
important opportunity, and this has received
more attention in recent years. Furthermore, a
production-oriented approach cannot directly
consider the socio-economic consequences
of certain measures or choices, such as
changes in demand or the effects of changes
in trade regimes.
−A food systems approach addresses more
directly the important food security issues of
both undernutrition and overconsumption. A
production-oriented approach fails to take into
account the serious health implications that
arise from current food consumption patterns.
An increasing number of people are suffering
from ‘non-communicable diseases’ such as
diabetes, certain types of cancer or heart
diseases related to the overconsumption of
sugar and fat. Different dietary choices could
lead to more resource-efficient food systems,
resulting in both reduced pressures on natural
resources and better health outcomes.
−A food systems approach also considers
changes such as “supermarketization”,
referring to the increasing share of (in most
cases) internationally-operated supermarkets
in the total share of consumer food purchases,
a trend that is particularly seen in Asia and
South America. This supermarketization not
only affects the power relations in the food
supply chain, but very often also affects
eating habits and product sourcing. A rapid
consolidation process has taken place both
in the input and the processing industries,
resulting in dually structured food chains with
a small number of companies dominating
the market.
−Finally, a food systems approach considers
food supply and demand in a balanced way,
within the context of actors, institutions and
governance. It is therefore better equipped
to identify actual opportunities linked to
food system actors (i.e. farmers/fishers,
food companies, retailers and consumers).
Although much of the resource use is at the
farm or fisheries level, many opportunities to
change practices exist ‘upstream’ in the food
system. Many of the production activities
are controlled by demand, and therefore are
largely set by signals that come from the whole
food chain.
With increasing globalization and concomitant
demand for food, the food systems approach is
now more relevant than ever. Most of the food
consumed is no longer produced in self-sufficient
families or communities, but travels (and often
a long way) from producer to consumer. A
globally increasing share of all consumed food
is processed and arrives in packaged forms
at the consumer. The global food system that
makes this happen is not a neutral supply chain;
actors such as food processing companies and
retailers largely shape both supply and consumer
demand (Lang et al., 2009, Pinstrup-Andersen,
2002, Pinstrup-Andersen & Watson II, 2011).
This is why in this study a ‘food system lens’ is
used to identify biophysical, policy and other
socioeconomic options and opportunities for
these actors to arrive at more resource-efficient
food systems with lower environmental impacts,
while at the same time aiming to improve the
societal outcomes (such as human health and
rural livelihoods). Given the need to radically
enhance both food security and environmental
conditions, such an approach will also be helpful
for policy development and implementation

25
Food
sys
tem
s an
d na
tura
l res
ourc
es
by governments where the different aspects
(nutrition, health, agriculture, fisheries, food
industry, resources) are often treated separately.
There are two important points to bear in mind:
(i) For specific issues (for example land
degradation) the more traditional physical,
resource-oriented approach and the more
holistic food systems approach should be seen
as complementary – the former can identify
concrete options within the current context related
to natural resource management per se, while the
food systems approach offers opportunities from
a broader perspective. It should be stressed that
this report can only very limitedly capture the
wealth of information available on the specific
natural resources and environmental impacts of
food systems. (ii) The food systems approach
is relatively new and is still being developed
and adopted. This report should be seen as an
important step in this process, helping to further
develop the approach and its application to the
sustainable use of natural resources in food
systems. The food systems analysis has to be
concise, and more information is available in the
current literature on some aspects related to the
interactions between specific natural resources
in given food systems, which are very largely
region- and issue-specific.
It should also be noted that many regional and
local food systems are connected to some
degree, for example through trade or the
exchange of technologies or resources. This
study therefore includes a set of regional case
studies for Sub-Saharan Africa, South East
Asia and Europe. These have been selected
to cover a wide range of contexts, from those
in which food security is still mainly dependent
on local subsistence/low-input farming, to
‘modern’ food systems connecting high-input
production areas with consumers worldwide.
Food systems therefore vary significantly across
the globe in terms of actors, technology and
type of resources used. Although very diverse,
ultimately all of these food systems depend on
natural resources.
Given the large and increasing reliance on natural
resources of food production and consumption,
as well as the significant environmental impacts
of food systems, the IRP developed this report to:
1. Assess the current status and dynamics of
natural resource use in food systems and
the food system impacts on the environment
(Chapters 4 and 5);
2. Determine opportunities for improving
resource efficiency in food systems,
responding to the following questions:
−What do sustainable food systems look
like from a natural resources perspective?
(Chapter 7)
−How can improvements in resource
efficiency be made to enhance food
security? (Chapter 7)
−How can a transition towards sustainable
food systems be stimulated? (Chapter 8)
In order to address these objectives, the report
is structured as follows:
Chapter 2 introduces and explains the
concept of a food systems approach and shows
how this concept can help in developing ways
to improve the efficient use of natural resources
across the whole food system. It also provides
background information on the use of natural
resources in food production, processing, retail
and consumption, as well the environmental
impacts related to these activities.
Chapter 3 introduces and describes the
characteristics of major types of food systems in
terms of their natural resource use implications.
It also describes the key characteristics in
food systems governance and coordination
mechanisms, and how these food systems have
evolved over the past few decades, particularly
driven by changing socio-economic and bio-
physical circumstances.
Chapter 4 analyzes the projected socio-
demographic changes and how these might
affect food systems and the related natural
resource and environmental issues. It also
looks into the effects of current and projected

26
Intro
duct
ion
food consumption patterns on human health.
Where does under-nutrition occur, now and
in the near future? Where does over-nutrition
and obesity occur and what are the trends?
Where are diets expected to become more
resource demanding?
Chapter 5 focuses on the natural resource
use and environmental impacts of current and
projected food consumption and production in
the context of food systems. The current and
projected status and dynamics of natural resource
use in regional food systems is reviewed, as well
as a number of environmental pressures.
Chapter 6 looks at the behavior of food
system actors and the context in which they
operate, with a particular focus on property and
tenure rights regimes. The chapter highlights
issues around access, control and use of various
resources and pinpoints to several institutional
conditions that are relevant for moving towards
more sustainable food systems.
Chapter 7 discusses the options for more
sustainable food systems. It first describes the
principles for sustainable food systems from a
natural resources perspective. It then goes on
to discuss a number of biophysical options to
improve the overall resource efficiency of food
systems while taking into account aspects such as
food security, the contribution of food production
to rural livelihoods and food sovereignty.
Chapter 8 suggests concrete actions that
different actors could undertake to reduce
the current environmental impacts of food
system activities.
The urgency of the various issues covered in this
report cannot be under-stressed. Many studies
seem to focus on some decades ahead (e.g., 2050,
2100), many of the problems relate to aspects of
the current food system, and many of the solutions
already exist. Various natural resources that are
critical for food production are under increasing
pressure due, for example, to land degradation
and the depletion of aquifers. The Green
Revolution has boosted crop production in many
areas, but some of these areas now show signs
of stagnating increases in, or even declining, crop
yields. This is caused by a combination of soil
fertility decline, water shortages and changes in
pest and disease dynamics. The environmental
impacts of current food system activities often
compound the situation locally, through, for
instance, nutrient losses from intensive crop and
livestock systems, and aquaculture, increasing
resource demand, and effluents from other food
system activities. Diets are changing rapidly
worldwide, with dramatic consequences for both
natural resources and human health. Now is the
time to apply the many solutions already known
to exist in order to move towards environmentally-
sustainable food systems.


A Food Systems Approach to Natural
Resource Use
Chapter
2
Cre
dit:
little
sam
, Shu
tter
stoc
k.co
m

29
Food
sys
tem
s an
d na
tura
l res
ourc
es
2.1 Introduction
This chapter provides background information on
the use of natural resources as needed for food
production, processing, retail and consumption,
as well as the environmental impacts related
to these activities. Food production is critically
dependent on a large array of natural resources,
such as land, fresh water, genetic resources
and minerals. Many of these resources are
in principle ‘renewable’ and, given proper
management, can be used for centuries or more
as they are naturally replenished or regenerated.
When this is however not the case, the potential
of these resources to provide a resilient basis
for food systems, and notably food production,
will be reduced, including lower crop yields, fish
catches or livestock production. This intrinsically
connects the issue of natural resource use to the
food security challenge.
The food systems concept has proved its utility in
helping to address this challenge (Ingram, 2011).
In this report the same concept is extended to
assess the current and projected use of natural
resources within food systems. The concept is
helpful as it integrates the notion of the full set
of activities and actors (including the socio-
economic environment in which they operate)
in the ‘food chain’ (i.e. producing, processing,
distributing, retailing and consuming food) with
the outcomes of these activities for food security.
It is increasingly being adopted by the food
security community: Healthy people depend on
healthy food systems (FAO, 2013a).
Using the food systems concept to structure
the discussion, the chapter also considers the
numerous two-way interactions between food
systems and natural resources. This is important
as food system activities (from producing to
consuming food) are in many cases significantly
degrading the natural resources upon which our
food security depends, while also contributing
to climate change, local and regional pollution.
Tackling these problems now is of the utmost
urgency considering one billion people will be
added to the global population, mainly in cities
where food insecurity is already a challenge.
This population increase will be compounded
by an increasing middle class, which in turn will
result in a change towards more energy- and
natural resource-intense diets. The combined
impact of these trends on natural resources is
likely to be substantial.
Finally, the chapter also includes a discussion
on the benefits of a food systems approach for
natural resource management. It concludes
by presenting the concepts used in this report
related to natural resource use and environmental
impacts of food systems.
2.2 Why ‘food systems’?
2.2.1 Background to the food security debateRecent years have seen a heightened debate
on ‘food security’ within science and policy
communities, the food industry and the media.
This has been largely driven by concerns about
population growth, anticipated increases in
food demand due to economic growth and
climate change. Typical questions include:
How will climate change affect food supplies?
How will food price spikes affect the poor? How
will the growing food demand be met without
further undermining the natural resource base
upon which our food security depends? Food
security – and particularly its interactions with
environmental concerns – now takes centre
stage. Perhaps the most widely cited definition of
food security is based on the 1996 Declaration
on World Food Security definition (World Food
Summit, 1996), but with the addition of the
notion of ‘social’ access to food (CFS, 2009).
According to this definition, food security is a
condition whereby:
‘all people, at all times, have physical, social
and economic access to sufficient, safe, and
nutritious food to meet their dietary needs and
food preferences for an active and healthy life’.

30
A F
ood
Syst
ems
App
roac
h to
Nat
ural
Res
ourc
e U
se
As well as highlighting ‘access’ to food, the
definition of the Committee on World Food Security
(CFS) – Food and Agriculture Organization of the
United Nations (FAO) also integrates the notions
of food availability and food utilization, moving
beyond the productionist paradigm. There are
several reasons for the debate on ‘food security’.
The central one is that, in spite of the fact that
food production has significantly increased
over the last 50 years, globally still around 850
million people are undernourished. The debate
has also been driven by the food price spikes of
2008 and 2011 (which showed the vulnerability
of major commodity prices to a number of
interacting factors) (Martin & Anderson, 2011),
and the fact that coming decades will likely
show continued increases in overall demand
(driven by the combination of population growth
per se and changes in overall consumption
patterns). Another important notion in the CFS-
FAO definition above is ‘sufficient’. While this
was originally included to ensure ‘not too little’,
its meaning of ‘not too much’ is now of growing
importance, given the rising obesity epidemic.
This therefore raises another major question:
how can over-consumption by increasing
affluent people be moderated? Apart from the
health costs of the epidemic, there are also major
environmental concerns related to supplying this
additional food (i.e. in addition to the baseline
increase due to population growth).
Discussions about a ‘solution’ within the debate
on food security and how to make the food system
more environmentally benign mostly remain
focused on the food production aspects (e.g.
‘climate smart agriculture’). These are certainly
important as more food has to be produced over
the coming decades. However, neither food
security nor the sustainable management of
natural resources are directly addressed when
focusing on the production side of food only.
A food systems approach relates all the
food system activities (growing, harvesting,
processing, packaging, transporting, marketing,
consuming, and disposing of food and food-
related items) to the outcomes of these activities,
not only for food security and other socio-
economic issues, but also the environment.
Food systems are therefore defined as both the
food chain activities, and the food security and
other outcomes of these activities (Ericksen,
2008, Ingram, 2011). The food systems
approach thus allows the food chain activities
to be linked to their social and environmental
context. Moreover, actors in each section of the
food chain have their own interests and affect
each other’s behavior. The food chain activities
have implications for social and environmental
welfare (Figure 1) but the latter also affect food
chain activities; the systems approach implies
the feedback and two-way linkages are taken
into account.15
A food system therefore also encompasses the
interdependent sets of enterprises, institutions,
activities and relationships that collectively
develop and deliver material inputs to the
farming sector, produce primary commodities,
and subsequently handle, process, transport,
market and distribute food and other agro-
based products to consumers. Food systems
differ regionally in terms of actors involved and
characteristics of their relationships and activities.
In all cases they need to be ‘sustainable’, i.e: ‘a
sustainable food system (SFS) is a food system
that delivers food security and nutrition for all
in such a way that the economic, social and
environmental bases to generate food security
and nutrition for future generations are not
compromised’ (HLPE, 2014a).
2.2.2 Linking the food system concept to actors and natural resourcesThere are several ways to make the food system
concept operational for analytical purposes. For
instance, the agro-food system can be broken
down into sub-sectors, generally by commodity
or group of commodities (cereals, dairy industry,
fruit and vegetables, etc.), each with their own
specific features of structure, institutions and
relationships. A disadvantage of a focus on
sectors may be that the coordinating role of
actors engaged in activities such as input, 15
15. The environmental context shows the natural resource endowment (including the quality of resources) which makes food production possible. The social context of a food system determines how resources are being used.

31
Food
sys
tem
s an
d na
tura
l res
ourc
es
processing and logistics industries and retail in
a food system are neglected. The transition from
primarily subsistence farming to cash cropping
and/or commercial livestock production and
marketing entails the development of systems
to coordinate the activities of input providers,
producers and downstream agents, across both
space and time. Moreover, a food system also
has an institutional (rules and regulations) and a
jurisdictional, administrative (provincial, national,
intergovernmental) dimension (Ingram et al., 2010). This implies that there are many aspects
that should be taken into account when defining
and describing a food system. For the purpose
of this report, the objective is not to cover a very
wide array of food systems, but rather to sketch
the main characteristics of broadly-defined
types of food systems to show their impacts on
natural resource use and on the environment
more generally.
2.2.3 Emergence of the food system conceptThe food system concept is not new; driven by
social and political concerns, rural sociologists
have promoted this approach for some years
(McMicheal, 1994, Tovey, 1997). Several authors
have since put forward frameworks for analyzing
food systems, but (Sobal et al., 1998) noted
that few existing models broadly described the
system and most focused on one disciplinary
perspective or one segment of the system. They
identified four major types of models: food chains,
food cycles, food webs and food contexts, and
developed a more integrated approach including
nutrition. (Dixon, 1999), meanwhile, proposed
a cultural economy model for understanding
power in commodity systems, while (Fraser et al., 2005) proposed a framework to assess the
vulnerability of food systems to future shocks
based on landscape ecology’s ‘Panarchy
Framework’. Since then, food systems have been
defined in a number of ways. Most focus on the
‘food chain’, which includes the whole array of
“activities” ranging from the input of germplasm
and agrichemicals, through harvesting, storing,
processing, packaging, distributing and retailing
food, to consuming food.
The suite of food system activities needs to
be seen within the context of the overall food
security objective and, despite these varied
approaches, none was suitable for specifically
analyzing the food security outcomes. One
reason is that these analytical frames do
not sufficiently recognize that food security
outcomes have multiple causes and are the
result of a complex set of activities, interactions
and interdependencies among different aspects
of food systems. This is therefore why the further
extension of the inclusion of the ‘outcomes’ of
these activities has been helpful; they relate to
food security per se (incorporating components
of access to, and utilisation of food, in addition
to food availability – all of which need to be
stable over time). They also include outcomes
relating to other socio-economic goals such
as employment and wealth creation for those
engaged in any of these activities. However, they
also lead to a range of environmental outcomes
that all impact natural resources. In summary, the
food system concept can thus be thought of as
a combination of the activities (the ‘what we do’)
and the outcomes of these activities (the ‘what
we get’). The ‘combined’ food systems approach
therefore clearly defines the full set of activities
(not just the production aspects) and links these
to a notion of food security ‘unpacked’ into its
varied elements, in accordance with the FAO
definition (Ericksen, 2008, Ingram, 2011). As
all the activities have interactions with natural
resources, this allows for a more thorough
analysis of the links between food security and
natural resources (Figure 1).
Figure 1 shows the four major sets of food system
activities (all of which are dependent on natural
resources) and their outcomes in relation to: (i)
the three major components of food security and
their respective elements (as derived from FAO’s
food security definition; in italics), all of which
need to be satisfied for food security to be met;
(ii) other societal factors; and (iii) environmental
factors. Outcomes related to social factors
feedback to social-economic drivers while
the outcomes related to environmental factors
feedback to natural resources
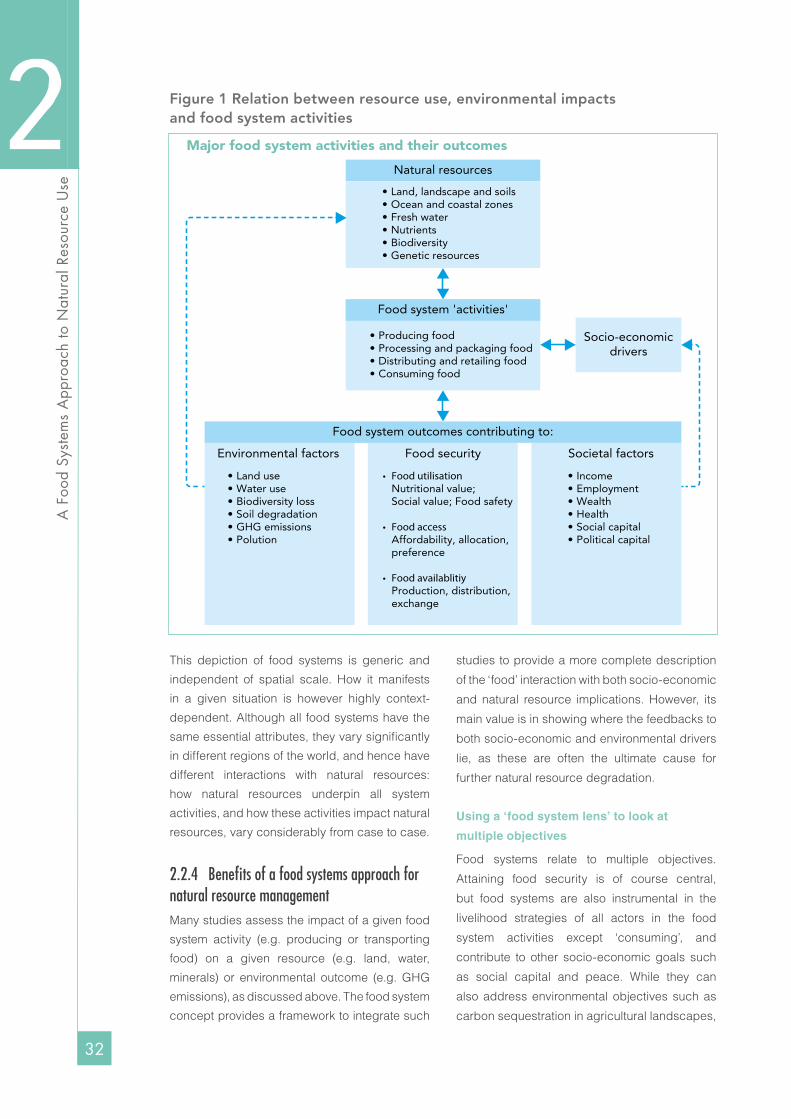
32
A F
ood
Syst
ems
App
roac
h to
Nat
ural
Res
ourc
e U
se
Figure 1 Relation between resource use, environmental impacts and food system activities
Major food system activities and their outcomes
Natural resources
• Land, landscape and soils• Ocean and coastal zones• Fresh water• Nutrients• Biodiversity• Genetic resources
• Food utilisation Nutritional value; Social value; Food safety
• Food access Affordability, allocation, preference
• Food availablitiy Production, distribution, exchange
• Income• Employment• Wealth• Health• Social capital• Political capital
• Land use• Water use• Biodiversity loss• Soil degradation• GHG emissions• Polution
Environmental factors Food security Societal factors
• Producing food• Processing and packaging food• Distributing and retailing food• Consuming food
Socio-economicdrivers
Food system 'activities'
Food system outcomes contributing to:
This depiction of food systems is generic and
independent of spatial scale. How it manifests
in a given situation is however highly context-
dependent. Although all food systems have the
same essential attributes, they vary significantly
in different regions of the world, and hence have
different interactions with natural resources:
how natural resources underpin all system
activities, and how these activities impact natural
resources, vary considerably from case to case.
2.2.4 Benefits of a food systems approach for natural resource managementMany studies assess the impact of a given food
system activity (e.g. producing or transporting
food) on a given resource (e.g. land, water,
minerals) or environmental outcome (e.g. GHG
emissions), as discussed above. The food system
concept provides a framework to integrate such
studies to provide a more complete description
of the ‘food’ interaction with both socio-economic
and natural resource implications. However, its
main value is in showing where the feedbacks to
both socio-economic and environmental drivers
lie, as these are often the ultimate cause for
further natural resource degradation.
Using a ‘food system lens’ to look at
multiple objectives
Food systems relate to multiple objectives.
Attaining food security is of course central,
but food systems are also instrumental in the
livelihood strategies of all actors in the food
system activities except ‘consuming’, and
contribute to other socio-economic goals such
as social capital and peace. While they can
also address environmental objectives such as
carbon sequestration in agricultural landscapes,

33
Food
sys
tem
s an
d na
tura
l res
ourc
es
there is usually a trade-off between the social,
economic and environmental goals.
As highlighted by the IRP “[T]he SDGs have been
designed to address all of the dimensions of
sustainable development – economic, social and
environmental – in the recognition that progress
will need to be made on all of them together,
and that policies for implementing them need to
be based on a systemic understanding of the
different goals and be designed as an integrated,
coherent package managing for co-benefits and
mitigating the effects of trade-offs” (UNEP, 2015).
The food system approach helps both identify
and ‘map’ these multiple goals, as well as
organize and systematically structure the
conversations needed to identify and work
towards potential synergies between them.
Using a ‘food system lens’ to deal with
complexity
(Ingram, 2011), summarizing (Ericksen, 2008),
notes the food systems approach frames
the food system activities as “dynamic and
interacting processes embedded in social,
political, economic, historical and environmental
contexts”. There are numerous food system
‘actors’ who undertake these ‘activities’ and
they behave, act and influence each other in a
certain way to attain their objectives. These are
however no sets of linear acts and influences
that follow each other in a predictable or
sequential order. Food system actors decide
and behave in response to what they perceive as
incentives (opportunities, challenges and risks)
and constraints (environmental, institutional
and financial) in a particular context. These
perceptions are continuously re-shaped by
non-linear feedbacks that emerge from their
interactions with other segments in the food
system, but also from changes in the socio-
economic context. This has two implications.
The first is that the dynamics and feedbacks in
food systems need to be analyzed as the result
of a mix of factors, such as actors’ relations,
access to information, regulations, markets,
market demand, and so on. The second is
that the non-linearity of feedbacks means that
even a small change may have unpredicted
effects across different parts of the food system.
These effects can be positive or negative and
of varying significance. To understand food
system outcomes, these changes need to be
taken into account. The food system approach
deals with these complexities and enables the
identification of the mix of factors that clarify food
system actors responses and behaviors and
particular outcomes (Ericksen, 2008).
Using a ‘food system lens’ to look from a
range of viewpoints
There is a need for improved food system
management to address current and anticipated
food security inequalities and population
health – and natural resources. This need
is exacerbated by anticipated changes in
climate, water availability, biodiversity and other
critically-important environmental factors, all of
which affect food supply. Meanwhile, methods
of food production and other activities along
the ‘food chain’ (i.e. processing, packaging,
distributing, retailing and consuming) need to be
more resource efficient, as current methods are
seriously degrading the natural resource base
which underpins many of these activities. This
is of keen interest to a wide range of institutions,
businesses and policy goals, as well as research.
Look from a business viewpoint
Many businesses are now striving to improve
the management of natural resources, both
to ensure continuity of essential feedstock for
their processes, and also to project a more
sustainable message to their customer base.
This is a very important development, as the
opportunity to bring about positive change in
managing natural resources often best falls to
resource managers and other non-state actors
‘on the ground’, rather than to the formal policy
process. The food system ‘lens’ helps these
actors to understand better where certain policy
and/or technical interventions can have the best
impact, and also helps them to consider what
might otherwise have been the unforeseen
consequences of such interventions. Using a
food systems lens therefore helps move towards
both better food security outcomes and better
management of the natural resources upon
which food security ultimately depends.
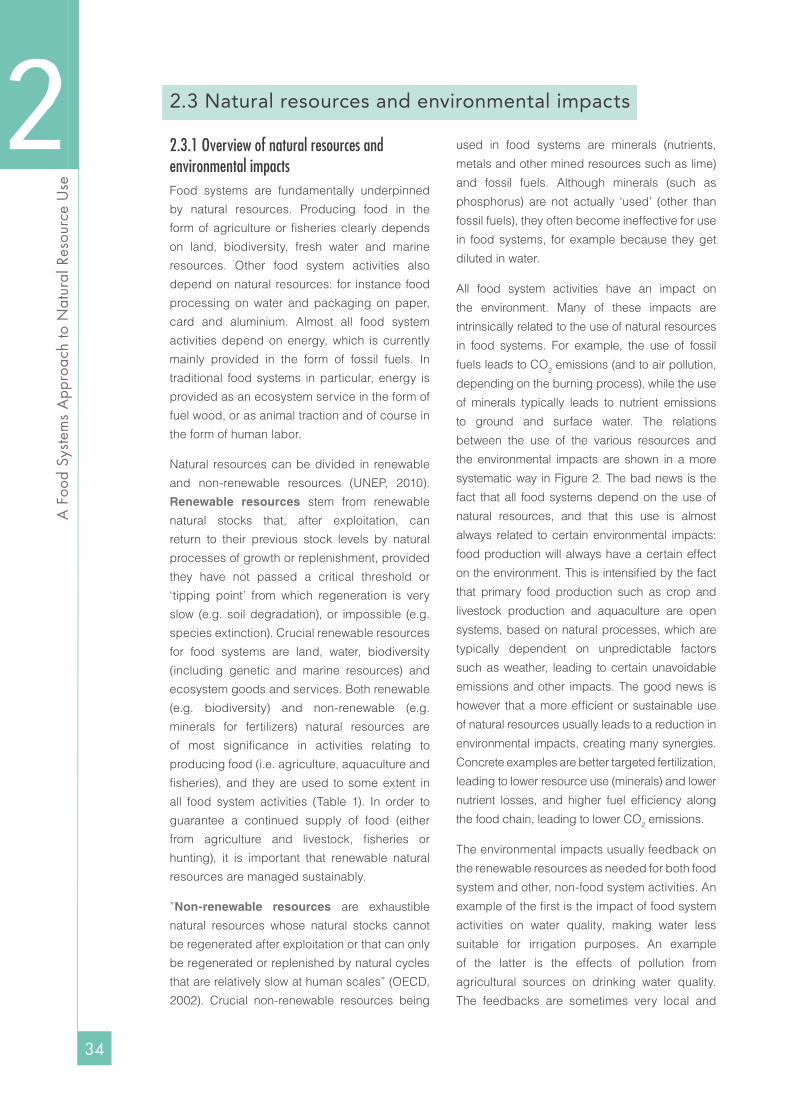
34
A F
ood
Syst
ems
App
roac
h to
Nat
ural
Res
ourc
e U
se
2.3 Natural resources and environmental impacts
2.3.1 Overview of natural resources and environmental impacts Food systems are fundamentally underpinned
by natural resources. Producing food in the
form of agriculture or fisheries clearly depends
on land, biodiversity, fresh water and marine
resources. Other food system activities also
depend on natural resources: for instance food
processing on water and packaging on paper,
card and aluminium. Almost all food system
activities depend on energy, which is currently
mainly provided in the form of fossil fuels. In
traditional food systems in particular, energy is
provided as an ecosystem service in the form of
fuel wood, or as animal traction and of course in
the form of human labor.
Natural resources can be divided in renewable
and non-renewable resources (UNEP, 2010).
Renewable resources stem from renewable
natural stocks that, after exploitation, can
return to their previous stock levels by natural
processes of growth or replenishment, provided
they have not passed a critical threshold or
‘tipping point’ from which regeneration is very
slow (e.g. soil degradation), or impossible (e.g.
species extinction). Crucial renewable resources
for food systems are land, water, biodiversity
(including genetic and marine resources) and
ecosystem goods and services. Both renewable
(e.g. biodiversity) and non-renewable (e.g.
minerals for fertilizers) natural resources are
of most significance in activities relating to
producing food (i.e. agriculture, aquaculture and
fisheries), and they are used to some extent in
all food system activities (Table 1). In order to
guarantee a continued supply of food (either
from agriculture and livestock, fisheries or
hunting), it is important that renewable natural
resources are managed sustainably.
”Non-renewable resources are exhaustible
natural resources whose natural stocks cannot
be regenerated after exploitation or that can only
be regenerated or replenished by natural cycles
that are relatively slow at human scales” (OECD,
2002). Crucial non-renewable resources being
used in food systems are minerals (nutrients,
metals and other mined resources such as lime)
and fossil fuels. Although minerals (such as
phosphorus) are not actually ‘used’ (other than
fossil fuels), they often become ineffective for use
in food systems, for example because they get
diluted in water.
All food system activities have an impact on
the environment. Many of these impacts are
intrinsically related to the use of natural resources
in food systems. For example, the use of fossil
fuels leads to CO2 emissions (and to air pollution,
depending on the burning process), while the use
of minerals typically leads to nutrient emissions
to ground and surface water. The relations
between the use of the various resources and
the environmental impacts are shown in a more
systematic way in Figure 2. The bad news is the
fact that all food systems depend on the use of
natural resources, and that this use is almost
always related to certain environmental impacts:
food production will always have a certain effect
on the environment. This is intensified by the fact
that primary food production such as crop and
livestock production and aquaculture are open
systems, based on natural processes, which are
typically dependent on unpredictable factors
such as weather, leading to certain unavoidable
emissions and other impacts. The good news is
however that a more efficient or sustainable use
of natural resources usually leads to a reduction in
environmental impacts, creating many synergies.
Concrete examples are better targeted fertilization,
leading to lower resource use (minerals) and lower
nutrient losses, and higher fuel efficiency along
the food chain, leading to lower CO2 emissions.
The environmental impacts usually feedback on
the renewable resources as needed for both food
system and other, non-food system activities. An
example of the first is the impact of food system
activities on water quality, making water less
suitable for irrigation purposes. An example
of the latter is the effects of pollution from
agricultural sources on drinking water quality.
The feedbacks are sometimes very local and
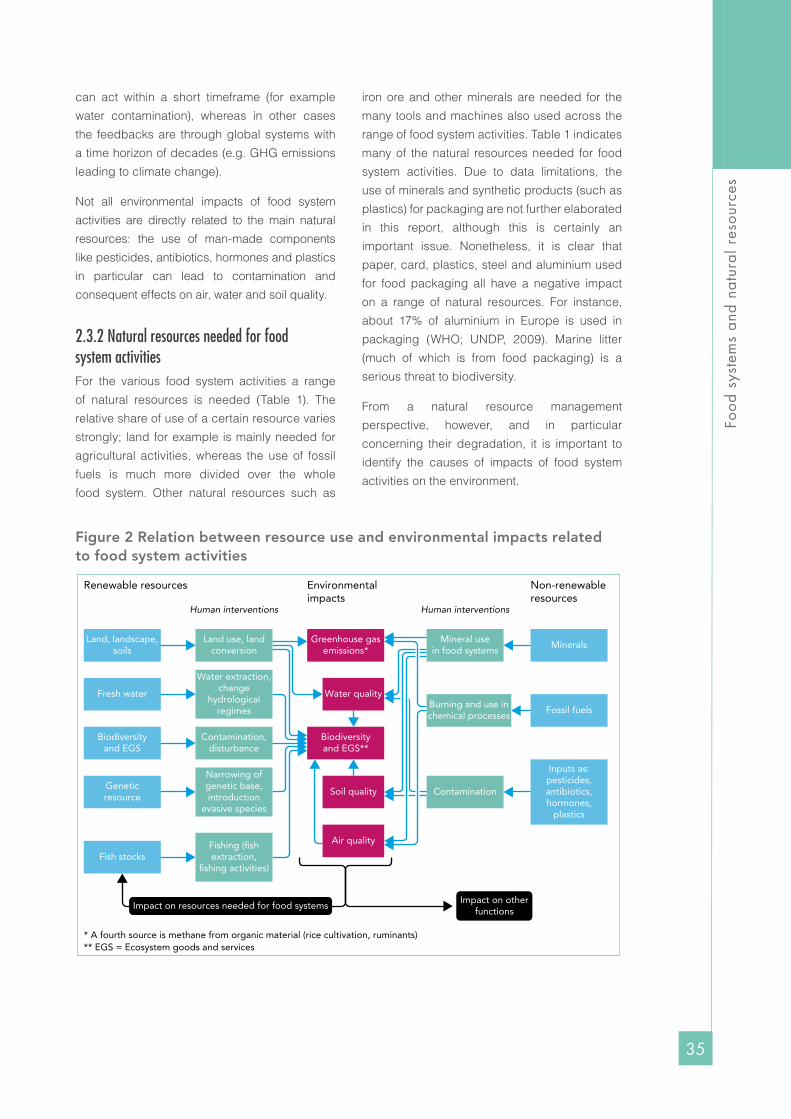
35
Food
sys
tem
s an
d na
tura
l res
ourc
es
can act within a short timeframe (for example
water contamination), whereas in other cases
the feedbacks are through global systems with
a time horizon of decades (e.g. GHG emissions
leading to climate change).
Not all environmental impacts of food system
activities are directly related to the main natural
resources: the use of man-made components
like pesticides, antibiotics, hormones and plastics
in particular can lead to contamination and
consequent effects on air, water and soil quality.
2.3.2 Natural resources needed for food system activities For the various food system activities a range
of natural resources is needed (Table 1). The
relative share of use of a certain resource varies
strongly; land for example is mainly needed for
agricultural activities, whereas the use of fossil
fuels is much more divided over the whole
food system. Other natural resources such as
iron ore and other minerals are needed for the
many tools and machines also used across the
range of food system activities. Table 1 indicates
many of the natural resources needed for food
system activities. Due to data limitations, the
use of minerals and synthetic products (such as
plastics) for packaging are not further elaborated
in this report, although this is certainly an
important issue. Nonetheless, it is clear that
paper, card, plastics, steel and aluminium used
for food packaging all have a negative impact
on a range of natural resources. For instance,
about 17% of aluminium in Europe is used in
packaging (WHO; UNDP, 2009). Marine litter
(much of which is from food packaging) is a
serious threat to biodiversity.
From a natural resource management
perspective, however, and in particular
concerning their degradation, it is important to
identify the causes of impacts of food system
activities on the environment.
Figure 2 Relation between resource use and environmental impacts related to food system activities
Source: PBL
Renewable resources
Human interventions Human interventions
Environmental impacts
Non-renewable resources
Land, landscape,soils
Fresh water
Biodiversityand EGS
Geneticresource
* A fourth source is methane from organic material (rice cultivation, ruminants)** EGS = Ecosystem goods and services
Land use, landconversion
Greenhouse gasemissions*
Mineral usein food systems
Minerals
Water extraction,change
hydrologicalregimes
Water qualityBurning and use inchemical processes
Fossil fuels
Contamination,disturbance
Biodiversityand EGS**
Contamination
Inputs as:pesticides,antibiotics,hormones,
plastics
Narrowing ofgenetic base,introduction
evasive species
Soil quality
Fishing (fishextraction,
fishing activities)
Air quality
Fish stocks
Impact on resources needed for food systemsImpact on resources needed for food systemsImpact on other
functionsImpact on other
functions

36
A F
ood
Syst
ems
App
roac
h to
Nat
ural
Res
ourc
e U
se
Table 1. Indicative functions of natural resources needed for food system activities16
Natural Resources
Producing food
Processing & Packaging food
Distributing & Retailing food
Consuming food
Managing waste
Renewable resourcesLand, soils and landscape
Cropping; grazing crop; hunting
●●●●●
Sites for factories
●
Sites for transport and storage, infrastructure and shops
●
Sites for landfill
●
Water Irrigation; aquaculture
●●●●●
Washing; cooking
●
Cooking
●
Dumping and removing waste
●
Biodiversity and ecosystem services
Pollination; pest control; water and nutrient regulation
●●●●
Biomass for paper and card
●
Livestock for transport
●
Food variety; charcoal and wood for cooking
●●
Microbes to aid decomposition
●●
Genetic resources ●●●●● ●
Non-renewable resourcesMinerals P, K etc. for
fertilizer and feed; chalk (liming)machinery
●●●●●
Iron, tin, bauxite (Al), kaolin and other resources for packaging
●●
Iron and other resources for transport, infrastructure
●●
Iron and other resources for cooking and storage, equipment
●
Iron and other resources for incinerators
●
Fossil fuel Fertilizer and agrichemical production; machinery
●●●
For cleaning; drying; processing; packaging
●●
For transport and warehousing; freezing and cooling; heating and lighting shops
●●●
Cooking; cleaning
●
Collecting; re-cycling; purifying
●
2.3.3 Environmental impacts related to food system activities As with many human activities, food system
activities are leading to a number of – largely
unintended – environmental effects. Examples
of how food system activities impact on the
environment are summarized in Table 2. Loss of
both terrestrial and marine biodiversity is largely
driven by food system activities. Satisfying future
demand by increasing agricultural intensification
through the use of more fertilizers, irrigation and
pesticides increases production, but if not done
properly can be environmentally deleterious.
In addition to environmental concerns,
intensification in this way is also increasingly
expensive as energy prices rise and freshwater
supplies diminish, so food affordability for many
will decrease. Conscious of the negative impacts
of most current food production methods on
natural resources, it is clear that the necessary
gains in production will have to be made in a more
environmentally-benign manner (Foresight, 2011,
Gregory & Ingram, 2000). To this end, research
has increasingly focused on the production
system (rather than just on the plant or animal
component), seeking to increase the efficiency
by which inputs (especially nitrogen and water)
are used, and reducing negative externalities
such as soil degradation, water pollution, loss
of biodiversity and greenhouse gas emissions.
The food systems approach has been further
developed by the Global Environmental Change
and Food Systems (GECAFS) project and in the
international context such as (ICN2, 2014).16
16. Dots indicate the estimated relative share of the use.
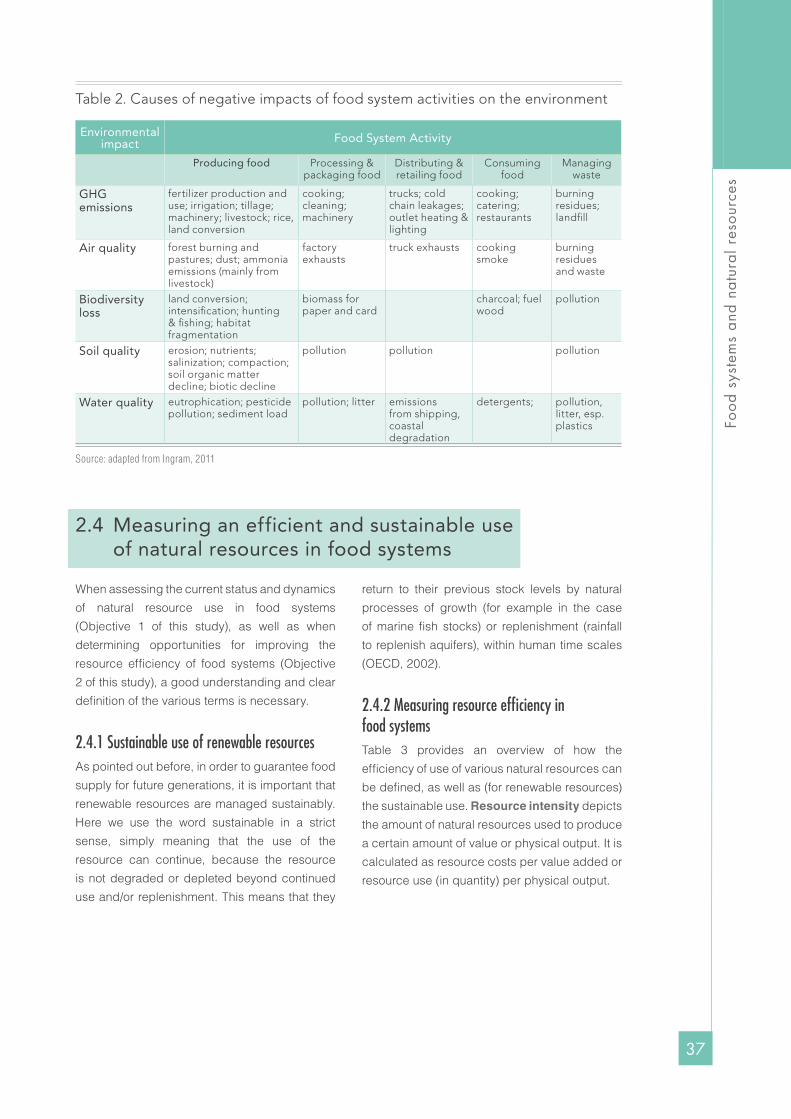
37
Food
sys
tem
s an
d na
tura
l res
ourc
es
Table 2. Causes of negative impacts of food system activities on the environment
Environmental impact Food System Activity
Producing food Processing & packaging food
Distributing & retailing food
Consuming food
Managing waste
GHG emissions
fertilizer production and use; irrigation; tillage; machinery; livestock; rice, land conversion
cooking; cleaning; machinery
trucks; cold chain leakages; outlet heating & lighting
cooking; catering; restaurants
burning residues; landfill
Air quality forest burning and pastures; dust; ammonia emissions (mainly from livestock)
factory exhausts
truck exhausts cooking smoke
burning residues and waste
Biodiversity loss
land conversion; intensification; hunting & fishing; habitat fragmentation
biomass for paper and card
charcoal; fuel wood
pollution
Soil quality erosion; nutrients; salinization; compaction; soil organic matter decline; biotic decline
pollution pollution pollution
Water quality eutrophication; pesticide pollution; sediment load
pollution; litter emissions from shipping, coastal degradation
detergents; pollution, litter, esp. plastics
Source: adapted from Ingram, 2011
2.4 Measuring an efficient and sustainable use of natural resources in food systems
When assessing the current status and dynamics
of natural resource use in food systems
(Objective 1 of this study), as well as when
determining opportunities for improving the
resource efficiency of food systems (Objective
2 of this study), a good understanding and clear
definition of the various terms is necessary.
2.4.1 Sustainable use of renewable resourcesAs pointed out before, in order to guarantee food
supply for future generations, it is important that
renewable resources are managed sustainably.
Here we use the word sustainable in a strict
sense, simply meaning that the use of the
resource can continue, because the resource
is not degraded or depleted beyond continued
use and/or replenishment. This means that they
return to their previous stock levels by natural
processes of growth (for example in the case
of marine fish stocks) or replenishment (rainfall
to replenish aquifers), within human time scales
(OECD, 2002).
2.4.2 Measuring resource efficiency in food systemsTable 3 provides an overview of how the
efficiency of use of various natural resources can
be defined, as well as (for renewable resources)
the sustainable use. Resource intensity depicts
the amount of natural resources used to produce
a certain amount of value or physical output. It is
calculated as resource costs per value added or
resource use (in quantity) per physical output.

38
A F
ood
Syst
ems
App
roac
h to
Nat
ural
Res
ourc
e U
se
Table 3. Definition of efficiency and sustainable use of natural resources needed for food system activities
Resource Renewable? Measure of efficiency Measure for sustainable use
Land, landscape, soils Yes Micro: yield per haMacro: amount of land needed for food production
Degree of land degradation / land restoration
Water* Largely; extraction of fossil water is the exception
Micro: volume of water used per unit of final product Macro: total amount of ‘blue’ and ‘green’ water1 in a food system
Regeneration (or depletion) of water in aquifers; disturbance of watersheds
Biodiversity and ecosystem services
Yes Cannot be defined in terms of efficiency
Conservation of biodiversity; maintenance of ecosystem services
Including: Genetic resources
Yes
Cannot be defined in terms of efficiency
Genetic diversity. Including the conservation of old varieties
Marine resources Yes % by-catch Regeneration of marine stocks
Nutrients (minerals) No Micro: input / output ratio at crop or animal levelMacro: output / input ratio for a food system / region
-
Minerals (packaging, machinery)
No Amount of materials used for whole food chain per product / consumer; For nutrients: whole food chain efficiency (output / input)
-
Fossil fuels No Amount of fossil fuels used for whole food chain per unit product
-
* Blue water is defined as fresh surface and groundwater, in other words, the water in freshwater lakes, rivers and aquifers; Green water is water which is stored in the soil or temporarily stays on top of the soil or vegetation.
A food system is considered more resource
efficient when more food is produced and finally
consumed with the same amount of resources,
or when the same amount of food is produced
with fewer resources (UNEP, 2011b). Higher
resource-use efficiency can be realized in
various ways: by more efficient production (also
called decoupling17), as well as by reducing food
demand and consumption in various ways (by
reducing food waste, by dietary changes towards
less resource-demanding products and by
reducing overconsumption of resource-intensive
calories). Resource efficiency is a key aspect of
sustainable food systems, but ‘sustainable food
systems’ is a broader concept that also includes
economic and social dimensions.
In some cases, increasing resource-use
efficiency can be achieved by addressing
a single parameter, for example increasing
water-use efficiency by reducing leakages from
irrigation systems. In food systems, the situation
is usually more complex as more resources have
to be considered simultaneously. For example,
increasing nitrogen fertilization can lead to a
lower overall N-use efficiency (i.e. yield per unit
N applied), but the increase in crop yields leads
to higher efficiencies for other resources, such
as for land, water and fossil fuels (for ploughing),
as well as for human labor in the case of manual
cultivation (see Box 1).
17
17. Resource decoupling means delinking the rate of use of primary resources from economic activity. Absolute resource decoupling would mean that the Total Material Requirement of a country decreases while the economy grows. It follows the same principle as dematerialization i.e. implying the use of less material, energy, water and land to achieve the same (or better) economic output (UNEP (2011b) Draft Glossary of Terms Used by the International Resource Panel, Nairobi / Paris, UNEP International Resource Panel.

39
Food
sys
tem
s an
d na
tura
l res
ourc
es
2.5 Overview of interactions between food system activities, natural resources and food security
Building on Figure 1, a conceptual framework of
the interactions between food system activities
and natural resources has been developed by
the authors (Figure 3). This identifies a number
of socio-economic drivers which affect the
socio-economic conditions within which the
array of food system actors operate. Driven
by a range of motives (e.g. food production,
profit), the ‘activities’ of these actors draw on a
range of natural resources. This impacts these
resources directly (usually by depleting them)
and indirectly by driving other environmental
processes such as greenhouse gas emissions
leading to climate change.
2.6 Summary and conclusions
In our interconnected and complex world,
acknowledging the critical roles of food
processors, packers, transporters, retailers
and consumers, in addition to food producers,
is an important step in identifying pathways
to address the challenges regarding natural
resources, while simultaneously improving food
and nutrition security.
The food system concept relates all the
food system activities (growing, harvesting,
processing, packaging, transporting, marketing,
consuming, and disposing of food and food-
related items) to the outcomes of these activities,
not only for food security and other socio-
economic issues, but also for the environment.
Box 1 Combining resources: the great balancing act to reach good overall efficiency
Farmers (and, to varying degrees, other food system actors) have long had to deal with the question of how to optimize various inputs, including natural resources, labor and capital goods, in order to reach an optimal outcome of their hard work. Historically, important inputs which could be influenced were labor (with the possibility to switch to animal traction), type of crop, seeds (amount, variety), land, water and manure. Simultaneously, farmers had to cope with unknown variables such as weather and pests. Currently, new inputs such as fertilizers, fossil fuel and pesticides have become part of the equation. When assessing resource efficiency, notably in agriculture, it is essential to assess the efficiency of the total combination of natural resources. Judging the efficiency of one resource only, will lead to erroneous conclusions.
The following example might help to explain this: assume a soil with low inherent soil fertility (and most soils are indeed low in nitrogen). A dose of nitrogen fertilizer of 20 kg of nitrogen per ha will in most cases increase crop yield. If we would increase the dose to 40 kg, crop yields will increase again (but a little less). The nitrogen efficiency of the second dose will be lower than that of the first dose (defined for example as nitrogen in crop / nitrogen applied). Also the additional crop production of the second step will be lower compared to the first step. With each additional application, the nitrogen efficiency will further decline (and losses to the environment might increase).
When evaluated from the point of view of nitrogen fertilizer, no use or very limited use is the most efficient. When evaluated from the point of view of land, water, seed input or labor, higher inputs of nitrogen typically lead to higher efficiency. The crop yield might double from 0 to 40 kg N per ha, without additional input of land, water, or labor, so that all these resource are used more efficiently. The same is also true assuming a higher input of other resources: if phosphorus is limiting crop production, additional input of phosphorus might make the input of nitrogen more efficient. This is not a plea for the unlimited application of nitrogen fertilizer, but the crucial point is that (especially at the farming stage) the effect of the combined inputs of the various natural resources needs to be assessed.

40
A F
ood
Syst
ems
App
roac
h to
Nat
ural
Res
ourc
e U
se
Figure 3 Conceptual Framework of Food System Activities and Natural ResourcesConceptual framework food systems and natural resources
This is akin to the DPSIR framework, i.e. is a causal framework for describing the interactions between society and the environment.
Environmentalimpacts
• Atmospheric composition (e.g. from GHG emissions)• Air quality• Water quantity and quality, eutrophication, toxicity• Biodiversity loss
Biophysicaldrivers
Changes in:Land cover andsoils, Climatevariability and
means, Water availability
and quality,Nutrient
availability andcycling, Biodiversity
Food systemsoutcomes, e.g. • Food affordability• Food safety• Food and health• Rural and urban livelihoods
Naturalresources
Food system activities and actors
Socio-economic driversChanges in:
Demographics, Economics, Socio-political context,Labour availability, Cultural context, Science & Technology,
Regulators, Institutions, NGOs
Renewables:• Land, landscape and soils• Fresh water• Genetic resources• Biodiversity, marine resources, ecosystem services
Non-renewables:• Fossil fuels• Minerals (nutrients)
Food system activities affect environmentFood system activities affect environment
Food system activities drawon natural resources
Food system activities drawon natural resources
Food system activitiesaffect natural resourcesFood system activities
affect natural resources
Socioeconomic conditions influence food system actorsSocioeconomic conditions influence food system actors
Inputindustry
Farmers,fishermen
Traders,processors
Foodindustry
Retailers,food
service
ConsumersWaste
process,sewage
Subsistence farmers
´Exchange of information, contracts,standards, monetary flows
´Exchange of information, contracts,standards, monetary flows
A food system therefore also encompasses the
interdependent sets of enterprises, institutions,
activities and relationships that collectively
develop and deliver material inputs to the
farming sector, produce primary commodities,
and subsequently handle, process, transport,
market and distribute food and other agro-
based products to consumers. Food systems
differ regionally in terms of actors involved
and characteristics of their relationships and
activities. In all cases they need to become
‘sustainable’, i.e: ‘a sustainable food system (SFS) is a food system that delivers food security and nutrition for all in such a way that the economic, social and environmental bases to generate food security and nutrition for future generations are not compromised ’ (HLPE, 2014a).
The food system concept provides a framework
to integrate such studies to provide a more
complete description of the ‘food’ interaction
with both socio-economic and nature resource
implications. However, its main value is in
showing where the feedbacks to both socio-
economic and environmental drivers lie, as
these are often the ultimate cause for further
natural resource degradation.
Food systems are fundamentally underpinned
by natural resources. Producing food in the form
of agriculture or fisheries clearly depends on
renewable resources such as land, biodiversity,
fresh water and marine resources, as well as on
non-renewable resources such as fossil fuels
and minerals. Other food system activities also

41
Food
sys
tem
s an
d na
tura
l res
ourc
es
depend on natural resources: for instance food
processing on water, packaging on paper, card
and aluminium and distributing and cooling on
fossil fuels.
Driven by a range of motives (e.g. food
production, profit), the ‘activities’ of these
actors draw on a range of natural resources.
This impacts these resources directly (either by
degrading or depleting them) and indirectly by
driving other environmental processes such as
greenhouse gas emissions leading to climate
change. As with many human activities, food
system activities are leading to a number of –
largely unintended – environmental effects.
A food system is considered more resource
efficient when more food is produced and finally
consumed with the same amount of resources, or
when the same amount of food is produced with
fewer resources. Higher resource-use efficiency
can be realised in various ways: by more efficient
production (also called decoupling), as well as
by reducing food demand and consumption in
various ways (by reducing food waste, by dietary
changes towards less resource-demanding
products and by reducing overconsumption
of resource-intensive calories). Food system
actors will be confronted with difficult resource
management decisions when seeking ways
to improve the efficiency with which they are
used. The combined effects of their activities in
the environment must be taken into account to
ensure effective and durable environmental and
economic co-benefits.
Besides an efficient use of resources, a
sustainable use of renewable resources
(such as soils and marine resources) is
critical to ensure food security for future
generations. The efficient use of natural
resources is a key aspect of sustainable food
systems, but ‘sustainable food systems’ is a
broader concept that also includes economic
and social dimensions.

Foo
d s
yste
m t
ypes
, g
ove
rnan
ce d
ynam
ics
and
the
ir im
plic
atio
ns
for
reso
urce
use
Foo
d s
yste
m t
ypes
, g
ove
rnan
ce d
ynam
ics
and
the
ir im
plic
atio
ns
for
reso
urce
use
Food system types, governance dynamics and their implications
for resource use
3
Cre
dit:
06ph
oto,
Shu
tter
stoc
k.co
m
Chapter

43
Food
sys
tem
s an
d na
tura
l res
ourc
es
3.1 Introduction
Chapter 2 highlighted the relevance and value
of a food systems approach. This chapter
introduces the types of food systems used in
this study. Food systems are defined in stylized
forms, with various features such as length of the
supply chain, food production system, nutrition
and environmental concerns. The coordination of
linkages between the actors in the supply chain
is also a key and distinguishing characteristic
of a food system. Coordination mechanisms,
such as contracts and standards, are key in
explaining the governance and power relations
in a system. This chapter shows a historical
pattern of changes in the governance structures
of food systems in the Western world, which is
also taking place in most of the emerging and
developing countries as well. The implications of
these governance dynamics in the food systems
for natural resource use are briefly indicated
in the concluding section of this chapter and
further analyzed in the following chapters.
3.2 Types of food systems
3.2.1 Variety captured in stylized typologyFood systems vary highly across the world. They
span a wide spectrum from those developed by
communities dependent on hunter-gathering to
satisfy local needs, to systems developed by
globalized societies interacting within a global
market. Even within major types of food systems
there can be variations: in more ‘traditional’
food systems some modern elements might
be present (e.g. some processed food such
as cooking oil), while in modern food systems
some degree of subsistence might occur
(home gardens, etc.). Most food systems, even
the most traditional ones, are linked to some
extent, through the transfer of food commodities,
genetic materials, technology and processed
foodstuffs, and through food prices.
In sketching developments in food systems
over the centuries, (Reardon & Timmer, 2012)
follow earlier literature on the evolution of food
systems (e.g. (Ericksen, 2008, FAO & UNEP,
2014, Malassis & Ghersi, 1996) in characterizing
food systems as traditional and modern, while
also noting an intermediate system. This report
follows the authors in using this typology, but by
no means does this represents a value judgement
(e.g. modern would be better than traditional).
It is simply a way of indicating the rapid pace
of change in food systems from labor-intensive
towards capital- and other external input-
intensive systems, where traditional systems are
defined as being on the spectrum where labor is
dominant over capital, and the modern system
the other way around. Also, in characterizing the
systems in a condensed way, the authors are
aware of running the risk of oversimplification as
local or regional circumstances (both of natural
resources and/or socioeconomic conditions)
may add particularities to the two food systems
highlighted in the sections below. The inclusion
of an intermediate version (in section 3.2.4 and
in Table 4) captures the existing variety in food
systems only to some extent.
3.2.2. Traditional food systemsIn this stylized dichotomy, ‘traditional’ food
systems (or ‘low external input-intensive food
systems’) involve farmers and fishers using
mainly inputs available on the farm, applying
growing and harvesting techniques established
already for a long time and moving produce by
foot, animal or cart to local markets, where they
usually sell or trade their commodities relatively
unprocessed. Crop yields and livestock
productivity are usually low relative to high
external-input systems and consumers tend to

44
Food
sys
tem
type
s, g
over
nanc
e dy
nam
ics
and
thei
r im
plic
atio
ns fo
r re
sour
ce u
se
process food at home. Agricultural production,
commodity and food trading and processing
takes place in small-scale operational units, which
have little or no commercial linkages outside the
local region. Part of the farming community may
be of a subsistence type, not integrated in the
market directly. Typically, market relations are
spot exchange, in which commodities are traded
for immediate delivery. Most food is sold raw to
be milled, slaughtered and processed at home
or by small local processors. The great majority
of the food consumed comes from the local area
and consumption patterns are often seasonally
dictated. A typical food basket is dominated by
plant-based products, although with exceptions
(e.g. communities in coastal zones or pastoralists
with livestock, and forest dwellers that gather
[honey] and hunt [wild meat]).
As people in such systems mainly depend on
locally-produced food, a failure in sufficient food
production can lead to local food shortages.
An additional demand for food in this situation,
notably as a result of a growing population,
will create a need to either exploit new natural
resources (e.g. clear marginal land not previously
used for agricultural purposes, or extend into
new fisheries) or intensify production. This
exploitation of often additional natural resources
creates risks for natural resource degradation,
while unsustainable forms of intensification will
lead to higher environmental impacts.
3.2.3 Modern food systemsIn contrast, ‘modern’ systems (alternatively
referred to as ‘high external-input food systems’)
depend on a range of inputs such as new
crop varieties, fertilizers, pesticides, veterinary
applications, machinery and other high-tech
equipment for producing food, and high-tech
systems for storing, transporting, processing
and retailing activities. Productivity in terms of
production per worked hour, per hectare and per
animal is generally high compared to low external
input systems. Especially in developed countries
where labor is expensive, some inputs such as
fertilizers, pesticides, seeds and fossil fuel are
relatively cheap. Farmers in these countries
therefore tend to avoid risks of lower crop yields
by overusing the cheaper inputs, resulting in an
‘efficiency gap’ between actual and potential
efficiency. Generally, many farmers are operating
at small margins and often lack the capacity to
invest in a sustainable use of resources. Chapter
5 further clarifies the impacts of food systems on
natural resource use, underlining that there are
marked differences between the two systems
with regard to the use of natural resources and
environmental impacts.
Consumers in modern food systems largely
purchase processed, packaged food that
originates from all over the world. Furthermore,
the processing, transporting/trading and retailing
activities are all activities that are a substantial
factor in employment and value addition. These
activities also use substantial amounts of energy
(mainly derived from fossil fuels) contributing
significantly to GHG emissions. A modern food
system is also characterized by specialized
farms, firms and traders, operating at a large
scale and connected by linkages in both
product and service flows and by institutional
linkages (e.g. contracts and standards such as
coordination arrangements).
Furthermore, a modern food system typically
consolidates the processing and food retail
segments of the supply chain, which has, or
has had, significant effects on the organization
and structure of other segments of the supply
chain too (such as farm consolidation). Supply
chain relations and activities are increasingly
of a transnational nature. This transformation
process in the food system mainly took place in
the 20th century in Europe, the USA and other
industrialized parts of the world.
3.2.4 Intermediate food systemsSince the 1980s, a ‘modernization’ of the food
system has taken place in many developing
countries in Latin America, Asia, Eastern

45
Food
sys
tem
s an
d na
tura
l res
ourc
es
Europe and some African countries. In these
countries, however, consolidation in the retail
and processing segments occurs in a context
of many small-scale actors on the supply side
and persistent strata of poverty among both
consumers and suppliers. The production is still
largely dominated by small- and medium-sized
farms. Here, empirical evidence shows that food
processing and retail apply different sets of
procurement methods, sourcing by spot market
exchange and by contracts depending on the
characteristics of the product and the suppliers
(Berdegué et al., 2005, Reardon & Timmer,
2012). The food system in these countries could
be characterized as an intermediate traditional
system, whereby regional food systems are in
the process of becoming integrated into global
food systems.
In most parts of the world, food systems are
currently somewhere in between the two
extremes of a traditional and modern food
system. In large parts of Asia, for example, most
people primarily buy unprocessed or partly
processed food, generally not from supermarkets
but grocery stores or street markets. At the
same time, supermarkets are enhancing their
market position, and modernization and rapid
consolidation is taking place in the processing
sector. Sections 3.4.2 and 3.4.3 address this
trend of ‘supermarketization’ in more detail.
3.2.5 Key features of food systems summarizedTable 4 below shows some of the key features
of traditional and modern types of food systems.
Important in this context is that environmental
concerns relating to the two systems are quite
different. Traditional food systems typically face
the risk of soil degradation (in particular when
population grows) because there are no or too
few options for applying an adequate amount
of nutrients (in the form of manure or fertilizers).
Consequently, crop yields remain low and
in some regions farmers need to clear land
previously not used for agricultural purposes.
Farming in modern food and intermediate
systems, on the other hand, sometimes uses
too much fertilizer and pesticides, so that
water quality and ecosystems are negatively
affected. Another source of nutrient losses is
crop-livestock interactions (i.e. specialization
of regions), especially with confined animals.
In addition, the processing, transport/trade
and retail activities are fossil fuel and water use
intensive and contribute substantially to GHG
emissions (see also Section 2.2.3).
It is also important to note two further issues:
First, modern and traditional types of food
systems can occur in a town, country or region
alongside one another, although there are
regions in which traditional food systems are
found more often than modern systems (and
the other way around). In regions where modern
food systems dominate, exceptions to that trend
such as regional product chains and organic
agriculture may be found. It shows again that
in a particular country or region, diverse food
systems are possible.
Second, food systems do not operate in
isolation from other key systems (e.g. energy,
water and health) and other aspects of society
(e.g. urbanization and political issues). Food
systems interact strongly with all of these and the
nature and intensity of such interactions affects
the interaction of food systems with natural
resources (Ingram, 2011).

46
Food
sys
tem
type
s, g
over
nanc
e dy
nam
ics
and
thei
r im
plic
atio
ns fo
r re
sour
ce u
se
Table 4. Comparing some features of ‘traditional’, ‘intermediate’, and ‘modern’ food systems
Food system feature ‘Traditional’ food systems
Intermediate food systems ‘Modern’ food systems
Estimated number of people in system
~1 billion ~4 billion ~2 billion
Principal employment in food sector
In food production In food production In food processing, packaging and retail
Supply chain Short, local; small-scale structures
Short to longer, supply chain has typically more actors than in ‘modern’ food systems
Long with many food miles and nodes; consolidation in input, processing and food retail segment; transnational companies and chains
Supply chain coordination system
Ad-hoc, spot exchange Mainly ad-hoc, spot exchange
Contracts, standards, vertical integration
Food production system Diverse, mixed production system (crops and animal production), varied productivity; low-input farming systems. Food systems are the main source of energy
Combination of diverse, mixed production system and specialised operations with a certain degree of inputs, including fossil fuels
Few crops dominate (e.g. monoculture); specialisation and high productivity; high external input intensity, including fossil fuels. Food production consumes more energy than it delivers.
Typical farm Family-based, small to moderate
Combination of small-holder farms and larger farms / fishery operations
Industrial, larger than in a traditional setting
Typical food consumed Basic locally-produced staples
Combination of basic products and processed food
Larger share of processed food with a brand name, more animal products
Food bought from Small, local shop or market
Small, local shop or market, share of supermarkets small but rapidly growing
Predominantly large supermarket chain, food service and catering (out of home)
Nutritional concern Undernutrition Both undernutrition and diet-related diseases
Diet-related diseases
Main source of national food shocks
Production shocks International price and trade problems
International price and trade problems
Main source of household food shocks
Production shocks International shocks leading to food poverty
International shocks leading to food poverty
Major environmental concerns
Soil degradation, land clearing, water shortage
Combination of concerns in traditional and modern systems
Emissions of nutrients and pesticides, water demand, greenhouse gas emissions, and others due to fossil fuel use
Influential scale Local to national Local to global National to global
Source: adapted from (Ericksen, 2008).

47
Food
sys
tem
s an
d na
tura
l res
ourc
es
3.3 Main features of coordination mechanisms in food systems
A key element in defining food systems is how
the system’s activities and actors are linked
with each other. Typically, traditional food
systems have a relatively short supply chain,
with several activities concentrated at the
farm: producing crops and animal products (in
mixed farming systems), processing them in-
house, and trading the raw and/or processed
products. Commercial relationships largely
take place on a spot or cash market, implying
loose connections between the segments of
the food chain. In fact, farmers and fishermen
are simultaneously producer, processor and
trader of their produce in a traditional food
system, as there are relatively few processing
and food retail actors in addition to the primary
producers. Modern food systems, on the other
hand, are characterized by specialization and
subdivision of activities. At the farming stage,
this often leads to highly specialized farms,
implicating monocultures and segregation of
crop and livestock production. This feature
also increases the length of the supply chain,
including specialized companies in delivering
inputs such as seed, fertilizers, machinery and
feed, and several stages of processing and
trade (distribution, wholesale, retail).
Coordination of all the activities of the specialized
actors in such a system is typically based on
contracts and standards (of measurement,
quality, etc.) to save time and transaction costs.
The vertical integration of activities is also a way
to reduce transaction costs and business risk.
The latter effectively means a shortening of the
supply chain as a company (partly) owns and
controls a downstream (inputs) or upstream
(distribution or retail) activity in the supply chain.
Farmers/fishermen and other actors in the food
supply chain have to comply with contract and
standard requirements, otherwise they run the
risk of being excluded from selling to a market
that may be attractive to them. The coordination
mechanism in the food system is key in
explaining the governance and power relations
in a system as those who set the conditions
for contracts and/or the standard requirements
determine the playing field for the various actors
in the food system.
Modern food systems are characterized
by institutional arrangements governing
or coordinating economic relations between
segments and transacting parties using
procurement systems such as contracts and
private standard requirements of quality and
safety. Modern procurement systems also include
the use of dedicated wholesalers and logistics
firms (elements of a transformed wholesale
and logistics sector) who contract with retail
chains downstream and with farmers or traders
upstream (Reardon & Timmer, 2012). Empirical
evidence shows that the procurement system
applied by the retail chain is conditioned by the
characteristics of the product and the supplier. In
general, the more perishable and niche-like the
product and the more concentrated its suppliers,
the greater likelihood the product is procured
directly. In contrast, the more bulk commodity-
like a product is and the more it is produced by
many small producers, the more likely it is to be
procured via the traditional wholesale market.18
The intermediate method – procurement via a
specialized/dedicated wholesaler – lies between
these two poles as far as the range of product
and supplier characteristics are concerned.
18
18. Governments in developing countries are trying to institutionalize redistributive mechanisms that serve both commercialization and regional food security (e.g. the rise of commodity exchanges and warehouse receipt systems in some countries in East Africa).

48
Food
sys
tem
type
s, g
over
nanc
e dy
nam
ics
and
thei
r im
plic
atio
ns fo
r re
sour
ce u
se
3.4 Governance of food systems
Governance can be defined as a system of
rules, authority and institutions that coordinate,
manage or steer society. Governance is more
than the formal functions of government but also
includes markets, traditions and networks and
non-state actors such as firms and civil society.
The governance of food systems has changed
dramatically over the last 50–60 years due to the
liberalization of agricultural and financial markets
that started in the 1980s, the transformation and
consolidation process in the food chain and the
‘rolling back’ of the state. ‘Non-state’ actors now
dominate governance arrangements in many
food systems.
3.4.1 Change in role of governmentMany countries have a long tradition in
protecting its agricultural sector, for strategic
food security reasons. This policy received
an impetus after World War II, to restore and
increase agricultural and food production in the
regions most affected. During the first decades
after WWII agricultural commodity markets in
North America and Western Europe were largely
regulated through domestic price support,
while high tariffs kept low cost products out. In
communist countries, the agri-food chain was
a state affair by default, while in many African
countries, having gained independence in the
1960s, governments were heavily involved in
agriculture through direct investments in (state)
farms and enterprises, parastatals and marketing
boards. Food production in several Asian
countries (India, Philippines) increased through
the Green Revolution, which refers to a series
of research and technology transfers aiming at
increasing the productivity of cereals (mainly
rice, wheat and maize). Programmes introducing
new seed varieties (and the use of fertilizers and
pesticides) were supported and co-financed
by the World Bank, the United Nations (FAO,
United Nations Development Programme)
and donor organizations. These programmes
have generally been less successful in Africa
(Wiggins, 2014).
Due to the rapidly increasing productivity in major
OECD countries in particular, the 1970s and 1980s
were characterized by domestic overproduction,
resulting in domestic surpluses. The subsidized
export of these surpluses tended to depress world
prices, affecting agriculture production in other
countries. Distortions to global markets reached
a peak in the 1980s, with the overproduction of
food in the European Union (EU) and an export/
subsidy war between the United States of America
(USA) and the EU further depressing agricultural
prices in low- and middle-income markets.
These effects, plus the increasing budgetary
burden of government support for agriculture,
were a justification for liberalization policies and
for redefining the role and form of government
interventions in agricultural markets. Moreover,
by the end of the 1970s it had been increasingly
recognized that the tendency for subsidies to
encourage the intensification of production was
environmentally damaging where the social and
environmental costs (negative externalities) of
production were ignored.
Since the 1980s, both external and internal
pressures for reform have resulted in progressive
liberalization in agricultural markets, with a
prominent role of the General Agreement on
Tariffs and Trade/World Trade Organization
(GATT/WTO) as the international forum to discuss
and agree on agricultural trade-related issues.
In addition, deregulation of the financial markets
including relaxed controls in many countries on
flows of foreign direct investment (FDI) enabled
and occurred alongside corporate consolidation
19
19. Other than SPS standards, environmental and social standards are not set in the WTO, which is a trade agency, but in international agreements outside the WTO. At present there are about 200 international agreements dealing with different environmental issues in force. For information on how environmental issues are dealt with in the WTO see: www.wto.org/english/thewto_e/whatis_e/tif_e/bey2_e.htm.

49
Food
sys
tem
s an
d na
tura
l res
ourc
es
at multiple levels in the food supply chain. In
developing countries, the start of processing
transformation occurred together with FDI
liberalization and the start of the privatization of
parastatals and other state-owned agribusiness
enterprises, specifically in countries that had
a relatively early economic and urbanization
growth spurt in the mid-1980s to early 1990s
(e.g. Mexico, Central America, Southeast Asia)
(Reardon & Timmer, 2012).
Over the last decades, governments in many
high-income countries reduced production
encouraging (direct) subsidies or price
guarantees to farmers (OECD, 2011). At the
same time, public standards were introduced
or reinforced, which primarily apply to food
safety, particularly sanitary and phytosanitary
(SPS) standards relating to animal, plant and
human health, but increasingly covering other
aspects such as sustainability or social and
labor standards.19 In addition to these public
standards, private standards have been
introduced by retail and processing companies,
which producers have to meet if they want to
sell their products to global retailers and their
intermediates. Standards largely refer to product
quality and technical specifications, but may
also encompass norms and standards related
to environmental, social and ethical issues.
Some standards only refer to raw materials,
other include processing and manufacturing.
One of the oldest certification schemes, still
having a significant market share, is on organic
products. The latter emerged in the late 1980s
and 1990s in areas where national and global
legislation were weak but the consumer and
NGO movement around the globe demanded
action. Indeed, most sustainability standards
that are being adopted today were initiated by
social movements (examples are Fairtrade and
Rainforest Alliance) or individual companies
(e.g. UTZ Certified, GLOBALGAP).20 Although
legally non-binding, voluntary standards may
be important market entry hurdles, as the
implementation costs are usually moved on to
the producers rather than the retailers (Story et al., 2008). Therefore, these (both public
and private) standards are important drivers of
change in the global food supply chain.
3.4.2 Food systems increasingly governed by downstream actorsFood supply systems are increasingly driven
by consumer preferences, which are heavily
influenced by food marketing and media
(FAO, 2011c, Kearney, 2010) and fueled by
income increases and urbanization, both
affecting dietary and lifestyle patterns. This is
key in understanding the governance changes
of the food supply chain. These changes
provide fertile ground for modern food retail
formats (Lawrence & Burch, 2007, Reardon &
Timmer, 2012), whereas the increasing demand
for processed and differentiated products has
expanded opportunities for the food industry to
increase its scale and scope of production. As
well as an increasing food demand in volume and
variety, the emergence of new technologies and
government policies are two additional important
drivers of consolidation. Companies have
sought to acquire relevant technological and
biotechnological capacities and to serve large
markets to share the fixed costs associated with
investments in new technologies, and large firms
appear to be better able to address the changes
in (stricter) government regulations governing
health, safety and environmental impacts of food
products. Large food companies and restaurant
chains also have a scale advantage in marketing,
which has led to a number of ‘global brands’,
many in the sphere of confectionary, soft drinks,
beer and fast food restaurants.
The result has been a – still continuing – process
of consolidation of the food input supply and
processing industry and the retail segment
20 21
20. Currently there are over 170 ‘sustainability standards’ worldwide (see www.standardsmap.org). The United Nations Forum on Sustainability Standards (UNFSS) is a forum that gathers stakeholders with the aim to address information needs and discuss concerns. The forum works towards addressing the sustainable development impacts of these standards and harnessing them to support pro-poor sustainable development objectives and facilitate access to global markets in developing countries. See www.unfss.org.
21. See businessvibes.com for the overall overviews. A series of food industry related websites also provide national data. For instance, the four big supermarket chains in the UK are reported to have a combined market share of 76% in of the UK grocery market in June 2013 (www.kamcity.com), and the top four in the USA a market share of approximately 40–50%, number one accounting for more than 25% of the supermarket industry’s total revenue (www.businessinsider.com).

50
Food
sys
tem
type
s, g
over
nanc
e dy
nam
ics
and
thei
r im
plic
atio
ns fo
r re
sour
ce u
se
of the food system. Firms have also sought
strategies to achieve a competitive advantage
in cost and quality in an environment of rapidly
consolidating sectors and markets, applying
governance mechanisms such as contracts and
standards (to steer suppliers toward meeting the
quality demanded by the market). In the context
of less guaranteed prices offered by government
policies, the effect has been a greater weight
of the downstream segments in the agro-food
supply chain’s power balance.
In the USA and Western Europe, the input and
processing segments of the food supply chain
have been rapidly consolidating, mainly driven by
cost efficiency considerations (Fuglie et al., 2011,
OECD, 2013b, Saitone & Sexton, 2012, Sexton,
2000). A similar if not more rapidly emerging
process has taken place in food retail (OECD,
2013b, Reardon & Timmer, 2012). Global food
retail sales are about US$7 trillion annually, with
supermarkets/hypermarkets accounting for the
largest share of sales (Agropoly, 2013). Most of
the leading global retailers are US and European
firms as large multinational retailers expand their
presence in developing countries and small retail
firms increasingly account for a smaller share of
total food sales. The top 15 global supermarket
companies account for more than 30% of world
supermarket sales. With improved technologies
and economies of size, these retailers enjoy
operating cost advantages over smaller local
retailers21 whereas the growth of private label
products and the point-of-sale data generated
by checkout scanners and barcodes has
helped shift bargaining power from the product
suppliers to the increasingly-concentrated
retailers (Senauer & Seltzer, 2010). Table 5
provides an overview of the rate of concentration
in the food supply chain, emphasizing the strong
position of a small number of companies in the
input, processing and retail segments, while the
farm sector remains very fragmented.22
Table 5. Concentration in the Food Supply Chain – A Global Perspective
Agricultural input industry Farms Food processing industry Food retailers
Co
nsumers
Turnover: US$520 bnOf whichAnimal feed: US$350 bnSeeds: US$35 bnFertilizer: US$90 bnPesticides: US$45 bn
Agricultural value added: US$2,175 bn
Turnover: US$1, 377 bn
Turnover: US$7,180 bn
Market share of top 10 corporations:Animal feed: 16%Seeds: 75%Fertilizer: 55%Pesticides: 95%
Globally 1 billion farmers with around 450 million farms, of which an estimated 85% small-scale with less than 2 ha. 20-24 million farmers in OECD countries (national stats).
Market share of top 10 corporations: 28%
Market share of top 10 corporations: 10.5%
Major companies:Animal feed: CP Group (Thailand), Cargill (USA), New Hope Group (Taiwan, China);Seeds: Monsanto (USA), DuPont (USA), Syngenta (Switzerland);Fertilizer: Yara (Norway), Mosaic (USA), Agrium (USA);Pesticides: Syngenta (Switzerland), Bayer (Germany), BASF (Germany)
USA: largest producer of maize and soya beans;EU: largest wheat producer;China: largest rice producer
Major companies:Nestle (Switzerland), PepsiCo (USA), Kraft (USA), ABinBev (Brazil), ADM (USA)
Major companies: Walmart (USA), Carrefour (France), Schwartz Group (Germany), Tesco (UK), Aldi (Germany)
Source: (Agropoly, 2013)
22
22. A segment that could be added to this figure is food service and catering (e.g. restaurants, schools, hospitals), including the fast food chain, which along with the growth of supermarkets has shown a rapid rise over the world. The observed growth is not only from the multinational companies, but also from domestic firms. The spread of fast food chains over the world also illustrates the rapid change in diets, which seem to be getting more uniform globally. For an overview of global fast food chains see: www.forbes.com/pictures/feji45hfkh/top-10-global-fast-food-brands-2 (accessed on 6 March, 2014). Estimates indicate that 50% of US food expenditures are out-of-home. Global figures are not available.

51
Food
sys
tem
s an
d na
tura
l res
ourc
es
However, it is in the developing economy’s retail
sector that the consolidation of influence and
market share has been most dramatic over the
last two decades. Latin America (particularly
Brazil) has led the way with rises in supermarket
dominance from an average of around 15% in the
1990s to current levels of more than 60% share
in overall food retail. This is closely followed by
other countries, including South Africa, which
rose very rapidly (in particular since the end
of Apartheid in 1994) to 55% in 2003 (Reardon et al., 2003). Since 2006, India has seen a
rapid increase in supermarkets, mainly in the
presence of large domestic conglomerates that
have invested in retail (Reardon & Minten, 2011),
while the modern food retail sector is emerging
rapidly in China, with many international retailers
already present and growing fast (Garnett &
Wilkes, 2014, McLoughlin et al., 2012, USDA,
2012). Retail distribution channels, though,
are still highly fragmented in these two large
countries, with some emerging regional food
retail concentration.
3.4.3 Implications of ‘supermarketization’ for food market structures and resource useImplications of consolidation trends in food
retail and processing are related to the supplier-
buyers relationships. Most food supply chains
are dominated by a few large companies, often
multinationals exerting market power (being
exerted by procurement, i.e. buyer power),
which is illustrated by price setting behavior
and/or determining other business conditions
suppliers have to comply with. For more
examples from literature, see (OECD, 2013b). As
indicated above, governance mechanisms such
as contracts and private (quality) standards are
increasingly used, resulting in – next to all positive
effects of increased efficiency by reducing
transaction costs and of responding to consumer
preferences for attractive priced quality products
- a deepening of the dependency of suppliers on
their client as suppliers invest in specific assets
to comply with the conditions set by their product
buyer. Consequently, competitive pressures
in the supply chain are high and profitability in
upstream industries is generally low, increasing
further pressure to rationalize production
processes and to produce against lowest
possible costs. The emphasis on economizing
and rationalizing production is fostering the
treadmill of increasing scale of production in the
processing component of the food supply chain,
implying in most cases a more capital-intensive
production process.
Disproportionate buying power, though, tends
to depress prices that food producers at the
bottom of those chains receive for their produce.
This in turns means lower incomes for these
producers, which may have an impact on their
ability to invest for the future (e.g. in product and
production process innovation that contributes
to sustainable farming and processing).
At the primary level, the consolidation trends in
the food processing and retail industry further
pressure the rural farming community to follow
the same path and increase its scale and intensity
(of using external inputs) of production. With a
declining number of buyers putting downward
pressure on the prices farmers receive, the
latter are forced to search for strategies to
maintain profitability. Two strategies (that are
often combined) to remain economically viable
are to increase the scale of production (in order
to reduce costs) and/or to improve productivity
(that is producing more per unit area and/or unit
of labor used). The emphasis on increased labor
and land productivity implies that a farmer will
generally use more fertilizers, more productive
seeds, plant protection products, antibiotics and
genetics and/or increase the number of animals
per hectare, in cases beyond their technical
optimum, leading to high environmental impacts.
This is especially the case when inputs such as
fertilizers and pesticides are cheap compared
to the cost of labor and land. In some cases,
these inputs are even subsidized. Also, crop
and livestock production is typically becoming
more spatially separated, leading to nutrient
deficiencies in crop areas and surpluses in
other areas. In analyzing the rapid changes
in Chinese food systems, Garnett and Wilkes

52
Food
sys
tem
type
s, g
over
nanc
e dy
nam
ics
and
thei
r im
plic
atio
ns fo
r re
sour
ce u
se
(2014) illustrate the impact of changing diets
on livestock production and its intersect with
multiple environmental issues. According to
the authors, the transformation of the livestock
sector in China in the last 35 years has created
massive problems of manure surpluses polluting
soils and water, while overgrazing in pastoral
regions contributes to land degradation.
3.5 Summary and conclusions
Food systems vary highly across the world.
They span a wide spectrum from ‘traditional’
subsistence based systems to ‘modern’ systems
in urbanized societies, with most people
depending on food systems that lie somewhere
between these extremities. These ‘intermediate’
types of food systems are rapidly evolving. Most
food systems, even the most traditional ones, are
to some extent linked with each other through the
exchange of food or feed commodities (trade),
genetic materials, technology and processed
foodstuffs, or through food prices. Moreover,
modern and traditional types of food systems
can occur in a country or region alongside
one another.
In this stylized dichotomy, ‘traditional’ food
systems involve farmers and fishermen using
low-tech growing and harvesting techniques,
usually selling their commodities relatively
unprocessed. Crop yields and livestock
productivity are typically low, partially because
external inputs (such as fertilizers) are relatively
expensive. In contrast, ‘modern’ systems
depend on a range of inputs for producing food,
and a range of inputs for storing, transporting,
processing and retailing activities. While labor
is expensive, some inputs such as fertilizers,
pesticides, seeds and fossil fuel are relatively
cheap. Farmers therefore tend to avoid risks of
lower crop yields by overusing these cheaper
inputs. This not only results in an ‘efficiency
gap’ between actual and potential efficiency,
but leads to high environmental impacts as well.
Next, specialization into crop or livestock farms
can have large effects on natural resource use
and environmental impacts, too.
Food systems in Latin America, Asia, Eastern
Europe and some African countries are rapidly
evolving towards modern food systems. While
production is still largely dominated by small-
and medium-sized farms, supermarkets and
food companies are enhancing their market
position, leading to the ‘supermarketization’ of
these food systems. This in consequence leads
to profound changes in both supply chains as
well as in changes in consumption patterns.
The governance of food systems has changed
dramatically over the last 50–60 years, due to the
liberalization of agricultural and financial markets
that started in the 1980s, the transformation and
consolidation process in the food chain and the
‘rolling back’ of the state. The private sector –
food processors, retailers and input suppliers
such as seed companies – now dominates some
aspects of governance arrangements in many
food systems. The central role of private actors is
enhanced by ongoing processes of consolidation
of the input and processing industries, as well as
of the retail and food service sectors.


So
cio
-eco
nom
ic d
rive
rs im
pac
ting
on
foo
d d
eman
d,
pro
duc
tion
and
fo
od
sys
tem
out
com
es
Socio-economic drivers impacting on food
demand, production and food system outcomes
Chapter
4
Cre
dit:
ssgu
y, S
hutt
erst
ock.
com

55
Food
sys
tem
s an
d na
tura
l res
ourc
es
4.1 Introduction
In Chapter 3 it was demonstrated that there are
different food systems around the world and
that they are evolving, driven by socioeconomic
developments and framed by biophysical
circumstances. It described the governance
features of current dominating types of food
systems around the world and the dynamics in
food system governance in the past that were
due to the liberalization of agricultural and
financial markets. This chapter deals with future
expectations of population growth, urbanization
and income growth, and their projected impact
on food consumption levels and patterns. The
latter will affect food production and the further
evolution of food systems around the world, and
consequently impact the use of natural resources
and the environment. Projections of these
key socioeconomic drivers described in the
sections below provide a regional perspective
of consumption pattern shifts that might take
place in the coming years. Projections on
agricultural markets presented in this section are
generally based on the OECD/FAO Agricultural
Outlook, which presents a baseline up to ten
years ahead assuming a ‘business-as-usual’
situation implying no policy changes beyond
those already known. The projections are,
therefore, not ‘unavoidable’ results of trends and
the continuation of current policies; if they occur,
undesired outcomes can be mitigated or altered
by policy responses.23 Future developments of
these drivers (population/urbanization, income,
food demand, policies) for the coming decades
demonstrate the challenge to enhance resource
efficiency, which is further emphasized by the
unsatisfactory outcomes of present food systems
that are summarized in Section 4.5.
4.2 Population growth and urbanization
One of the main determinants of current and
future food demand is the global population
growth. According to the UN medium growth
scenario, the global population is projected
to increase from 6.9 billion people in 2010 to
9.3 billion people in 2050 (UNDESA, 2013).
There are marked regional variations: Europe’s
population is projected to decline, while Africa’s
will double (Figure 4). China’s population is
projected to peak in around 2030. By 2020, India
is expected to be the most populated country.
In 2025 two thirds of the population is expected
to live in Asia, especially in already densely
populated countries like China, India and the
South East part of the continent (Indonesia,
Malaysia, Vietnam, etc.). These countries are
also assumed to show the highest economic
growth in the coming ten years, according to
OECD-FAO projections (OECD & FAO, 2014),
with profound effects on their economic structure
(see Box 2). The population increase (in %) is
expected to be the largest in Sub-Saharan
Africa. In developed and emerging countries in
particular, the population will age.
When aggregated at the global scale, the
population growth will be almost exclusively in
cities. The number of people living in urban areas
is projected to increase by 75% over the period
2010–2050. As a consequence, the number
of megacities will increase as well (Figure 5).
In some regions, particularly in Sub-Saharan
Africa, the rural population is also expected to
increase, by around 60%.23
23. There are many sources and studies providing quantitative food market projections, using economic models. A comparison of the results of ten global economic models shows large differences in outcomes (such as projected food demand), which are explained by differences in assumptions on economic relations and variables taken into account. See Schmitz C., van Meijl H., Kyle P., Nelson G.C., Fujimori S., Gurgel A., Havlik P., Heyhoe E., d’Croz D.M., Popp A., Sands R., Tabeau A., van der Mensbrugghe D., von Lampe M., Wise M., Blanc E., Hasegawa T., Kavallari A., Valin H. (2014) Land-use change trajectories up to 2050: insights from a global agro-economic model comparison. Agricultural Economics, 45: 69-84. DOI: 10.1111/agec.12090, ibid., Valin H., Sands R., Van der Mensbrugghe D., Nelson G.C., Ahammad H., Blanc E., Bodirsky B., Fujimori S., Hasegawa T., Havlik P., Heyhoe E., Kyle P., Mason-D’Croz D., Paltsev S., Rolinski S., Tabeau A., van Meijl H., von Lampe M., Willenbockel D. Ibid.The future of food demand: understanding differences in global economic models. 51-67. DOI: 10.1111/agec.12089. for an evaluation of these models. The examples presented in this report refer to OECD/FAO projections that are published on an annual basis in the Agricultural Outlook with a time horizon of ten years ahead.
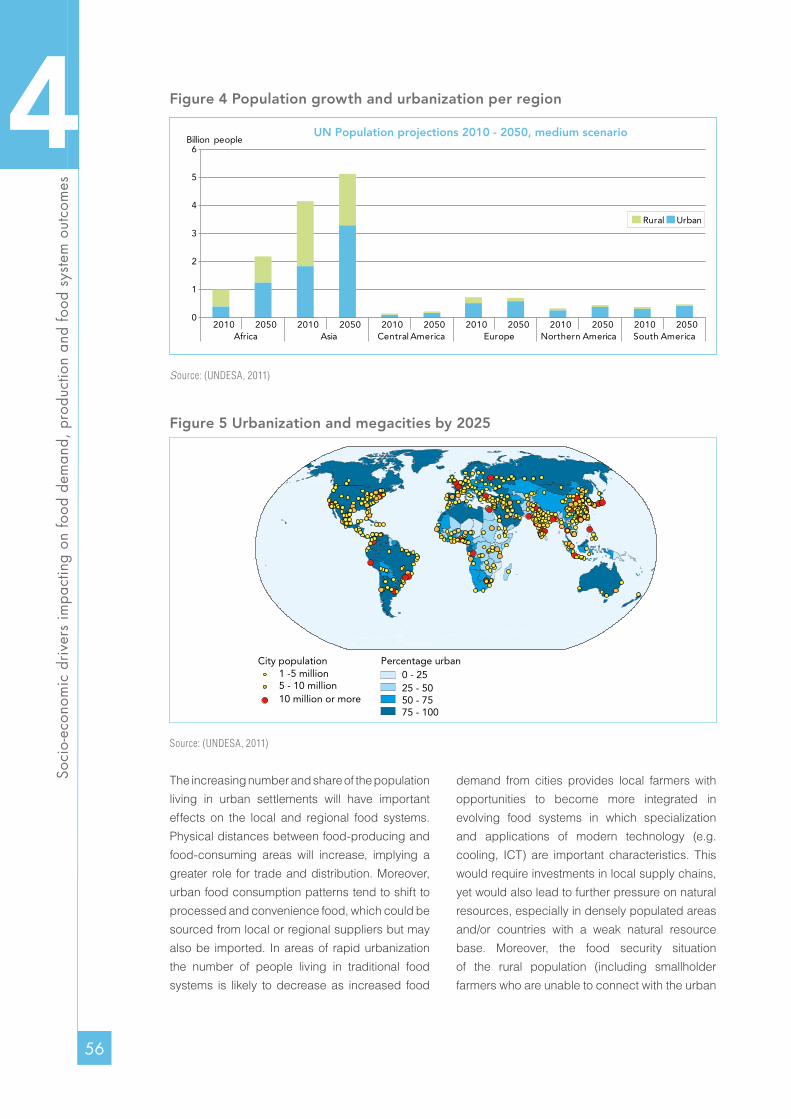
56
Soci
o-ec
onom
ic d
river
s im
pact
ing
on fo
od d
eman
d, p
rodu
ctio
n an
d fo
od s
yste
m o
utco
mes
Figure 4 Population growth and urbanization per region
UN Population projections 2010 - 2050, medium scenario
0
1
2
3
4
5
6
2010 2050 2010 2050 2010 2050 2010 2050 2010 2050 2010 2050Africa Asia Central America Europe Northern America South America
Billion people
Rural Urban
Source: (UNDESA, 2011)
Figure 5 Urbanization and megacities by 2025
Percentage urban0 - 2525 - 5050 - 7575 - 100
City population1 -5 million5 - 10 million10 million or more
Source: (UNDESA, 2011)
The increasing number and share of the population
living in urban settlements will have important
effects on the local and regional food systems.
Physical distances between food-producing and
food-consuming areas will increase, implying a
greater role for trade and distribution. Moreover,
urban food consumption patterns tend to shift to
processed and convenience food, which could be
sourced from local or regional suppliers but may
also be imported. In areas of rapid urbanization
the number of people living in traditional food
systems is likely to decrease as increased food
demand from cities provides local farmers with
opportunities to become more integrated in
evolving food systems in which specialization
and applications of modern technology (e.g.
cooling, ICT) are important characteristics. This
would require investments in local supply chains,
yet would also lead to further pressure on natural
resources, especially in densely populated areas
and/or countries with a weak natural resource
base. Moreover, the food security situation
of the rural population (including smallholder
farmers who are unable to connect with the urban

57
Food
sys
tem
s an
d na
tura
l res
ourc
es
market, whilst many of them are net-food buyers)
may worsen if increasing demand for food from
growing cities leads to local price rises. In regions
where intermediate food systems are already
developing, the increasing urbanization may
encourage a shift towards modern food systems.
4.3 Implications for food demand
Growth in population size and income per
capita leads to increasing demand for food and
a shift from starch-rich towards more sugar/
fat-rich foods. As income per capita rises,
people’s diets change from one that is largely
rich in carbohydrates to a diet which is richer
in calories, sugars, lipids and to more livestock
based products and vegetables (UNEP, 2014).
(Alexandratos & Bruinsma, 2012) show that per
capita consumption of rice and wheat levelled off
in both developed and developing countries after
the late 1980s, whereas an increasing share of
cereals goes to feed as livestock sectors grow.
Overall, and especially in developing countries,
consumption of meat and (to a lesser extent)
dairy shows a significant increase in per capita
consumption. Figures from some of the emerging
economies of China and Brazil illustrate the shift
in diet and food consumption patterns towards
livestock products: China went from 14 kg/year/
per capita in the early 1970s to 52 kg/year/per
capita in 2010, and Brazil went from 40 kg/year/
per capita to 78 kg/year/per capita over the same
period (Alexandratos & Bruinsma, 2012).
The result of this process is the nutritional
transition that has major implications for food
supply and natural resource use as typically
the production of livestock based food requires
more resources: for example, instead of grain
being directly consumed by humans it is used
as animal feed for livestock production which is
then consumed by humans. This is overall a more
inefficient process in food energy terms, but also
requires much more land for cereal production
and grazing (Arets et al., 2011, UNEP, 2014).
Moreover, as wealth increases, dietary patterns
turn to more convenience, pre-packaged,
chilled and processed food, that is transported
over long distances, implying a generally fossil
energy-intensive process and a food system
with a web of nodes of specialized companies
and chains. Global data on these aspects are
scarce, yet information from different sources and
different countries can be retrieved. For instance,
consumer market research summarizing data
from a sample of country reports show that since
2002 sales of packaged food jumped by 92%
to US$ 2.2 trillion in 2012 in these countries; in
emerging economies like Brazil, China and
Russia sales are three to four times their level in
2002 (The Economist, 2012)24. Soft drinks are an
important product on these market (Wong, 2014).
The market for packaged foods and drinks is
expected to grow in emerging regions, while due
to reasons such as health concerns and an aging
population, markets for these products will slightly
shrink in Western Europe and Northern America.
Environmental impacts of these food sales trends
are not only related to the fact that foods are
increasingly packaged or chilled, but also that
these foods are more processed and livestock
based, hence requiring more land, water and
fossil energy compared to a vegetarian, crop
based diet.
Regional food consumption patterns
Currently, there are large contrasts in food
consumption patterns between countries and
world regions. These differences have various
causes: cultural (as tradition plays an important
role in food consumption), economic (incomes,
affordability of food), biophysical (local cropping
patterns vary depending on climate and
soil conditions) and social (for example rural
versus urban).
Also the per capita intake of meat shows distinct
geographical differences in terms of types
and quantities. Per capita meat consumption 24
24. Reference is being made here to a journal, as the original data source is not publically available
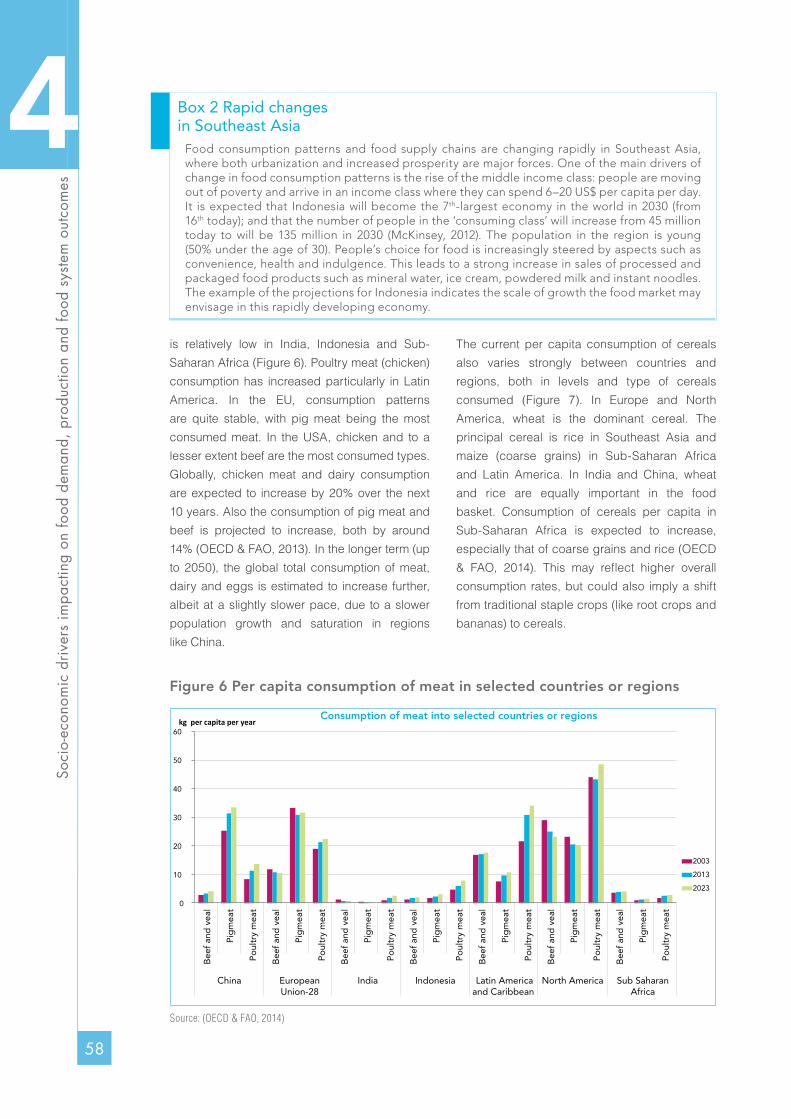
58
Soci
o-ec
onom
ic d
river
s im
pact
ing
on fo
od d
eman
d, p
rodu
ctio
n an
d fo
od s
yste
m o
utco
mes
is relatively low in India, Indonesia and Sub-
Saharan Africa (Figure 6). Poultry meat (chicken)
consumption has increased particularly in Latin
America. In the EU, consumption patterns
are quite stable, with pig meat being the most
consumed meat. In the USA, chicken and to a
lesser extent beef are the most consumed types.
Globally, chicken meat and dairy consumption
are expected to increase by 20% over the next
10 years. Also the consumption of pig meat and
beef is projected to increase, both by around
14% (OECD & FAO, 2013). In the longer term (up
to 2050), the global total consumption of meat,
dairy and eggs is estimated to increase further,
albeit at a slightly slower pace, due to a slower
population growth and saturation in regions
like China.
The current per capita consumption of cereals
also varies strongly between countries and
regions, both in levels and type of cereals
consumed (Figure 7). In Europe and North
America, wheat is the dominant cereal. The
principal cereal is rice in Southeast Asia and
maize (coarse grains) in Sub-Saharan Africa
and Latin America. In India and China, wheat
and rice are equally important in the food
basket. Consumption of cereals per capita in
Sub-Saharan Africa is expected to increase,
especially that of coarse grains and rice (OECD
& FAO, 2014). This may reflect higher overall
consumption rates, but could also imply a shift
from traditional staple crops (like root crops and
bananas) to cereals.
Figure 6 Per capita consumption of meat in selected countries or regions
0
10
20
30
40
50
60
Bee
f an
d v
eal
Pig
mea
t
Po
ultr
y m
eat
Bee
f an
d v
eal
Pig
mea
t
Po
ultr
y m
eat
Bee
f an
d v
eal
Pig
mea
t
Po
ultr
y m
eat
Bee
f an
d v
eal
Pig
mea
t
Po
ultr
y m
eat
Bee
f an
d v
eal
Pig
mea
t
Po
ultr
y m
eat
Bee
f an
d v
eal
Pig
mea
t
Po
ultr
y m
eat
Bee
f an
d v
eal
Pig
mea
t
Po
ultr
y m
eat
Consumption of meat into selected countries or regions
2003
2013
2023
kg per capita per year
China European Union-28
India Indonesia Latin America and Caribbean
North America Sub Saharan Africa
Source: (OECD & FAO, 2014)
Box 2 Rapid changes in Southeast Asia
Food consumption patterns and food supply chains are changing rapidly in Southeast Asia, where both urbanization and increased prosperity are major forces. One of the main drivers of change in food consumption patterns is the rise of the middle income class: people are moving out of poverty and arrive in an income class where they can spend 6–20 US$ per capita per day. It is expected that Indonesia will become the 7th-largest economy in the world in 2030 (from 16th today); and that the number of people in the ‘consuming class’ will increase from 45 million today to will be 135 million in 2030 (McKinsey, 2012). The population in the region is young (50% under the age of 30). People’s choice for food is increasingly steered by aspects such as convenience, health and indulgence. This leads to a strong increase in sales of processed and packaged food products such as mineral water, ice cream, powdered milk and instant noodles. The example of the projections for Indonesia indicates the scale of growth the food market may envisage in this rapidly developing economy.

59
Food
sys
tem
s an
d na
tura
l res
ourc
es
Figure 7 Past and projected wheat import in five selected tropical countries (in 1000 t per year)
0
2000
4000
6000
8000
10000
2000 2004 2008 2012 2016 2020 2024
ktonnes per year
Indonesia
Nigeria
Philippines
Thailand
Ethiopia
Source: (OECD & FAO, 2014)
Figure 8 Per capita consumption of cereals in selected countries or regions
0
20
40
60
80
100
120
140
160
180
Coa
rse
grai
ns
Rice
Whe
at
Coa
rse
grai
ns Rice
Whe
at
Coa
rse
grai
ns Rice
Whe
at
Coa
rse
grai
ns Rice
Whe
at
Coa
rse
grai
ns Rice
Whe
at
Coa
rse
grai
ns Rice
Whe
at
Coa
rse
grai
ns Rice
Whe
at
China European Union-28
India Indonesia Latin America and Caribbean
North America Sub Saharan Africa
Consumption of cereals in selected countries or regions
2003
2013
2023
kg per capita per year
Source: (OECD & FAO, 2014)

60
Soci
o-ec
onom
ic d
river
s im
pact
ing
on fo
od d
eman
d, p
rodu
ctio
n an
d fo
od s
yste
m o
utco
mes
4.4 Trends in global food production and trade in response to changing consumption patterns
4.4.1 Developments in crop production and tradeIn order to satisfy the growing demand for food,
feed, fuels and biofuels, the agriculture and
fishery sector will need to expand production.
Currently, the USA, China, the EU27, India
and Latin America are main producers of
cereals, and Latin America and the USA
produce large quantities of oil crops (Figure 9).
Generally speaking, OECD/FAO projections
indicate that developing countries will become
more dependent on food imports as food
consumption will increase faster than the growth
in agricultural production.
This imbalance between consumption and
production areas for major food crops is also
reflected in trade balances, which show main
importing countries and regions such as China
and the EU for oil crops (or protein meals) and
China and Sub-Saharan Africa for cereals
(UNCOMTRADE). Main exporting regions are
Latin America (oil crops) and the USA (both
cereals and oil crops). (OECD & FAO, 2014)
projections for the next ten years confirm these
net trade positions, whereas FAO’s longer term
projection up to 2050 (FAO, 2012b) shows that
the imported quantity of cereals by net importers
among the developing countries will almost
double over the period 2010–2050. This implies
that some developing countries will increasingly
depend on international food markets for their
food supply. These markets are generally thin
(meaning a small share of production is traded
internationally) and therefore often feature strong
price fluctuations, that are next to the results
of harvest also affected by government policy
interventions (see (CFS, 2012a, HLPE, 2011)).
Food security in countries that rely increasingly
on food imports will therefore benefit from open
markets, which connect food shortage regions
with those where food production is abundant.
Figure 9 Current and projected production of cereals and oilseeds in a number of selected regions
0
50
100
150
200
250
300
350
400
450
Co
arse
gra
ins
Oils
eed
s
Ric
e
Whe
at
Co
arse
gra
ins
Oils
eed
s
Ric
e
Whe
at
Co
arse
gra
ins
Oils
eed
s
Ric
e
Whe
at
Co
arse
gra
ins
Oils
eed
s
Ric
e
Whe
at
Co
arse
gra
ins
Oils
eed
s
Ric
e
Whe
at
Co
arse
gra
ins
Oils
eed
s
Ric
e
Whe
at
Co
arse
gra
ins
Oils
eed
s
Ric
e
Whe
at
North America Latin Americaand Caribbean
European Union-28
Sub Sahara Africa China India Southeast Asia
milion tonnes
2003
2013
2023
Southeast Asia is based on four countries: Indonesia, Thailand, Vietnam and the Philippines. Source: (OECD & FAO, 2014)

61
Food
sys
tem
s an
d na
tura
l res
ourc
es
Figure 10 Evolution of cereal utilisation shares (wheat and coarse cereals) in developed and developing countries between the base year (2011/13) and 2023
0 250 500 750 1000 1250 1500
2023
2011/13
2023
2011/13
De
velo
pe
dD
eve
lop
ing
million tonnes
Feed Use
Food Use
Biofuel Use
Other use
Source: (OECD & FAO, 2014)
The expected increase in meat and dairy
consumption also has significant implications for
feed demand and consequently for resource use:
in 2011/13, about 20% and 55% of total wheat
and coarse grain production respectively was
already used as feed and these percentages will
slowly increase in the coming decade (OECD &
FAO, 2014). Also, more wheat and coarse grain
will be used as biofuels, largely in developed
countries, although biofuel use as a share of
total cereal production will slightly contract,
partly due to the fact that an increasing share of
biofuel production will be from sugar (ethanol)
and vegetable oils (biodiesel from soybeans,
palm oil, rapeseed oil).25 Figure 10 summarizes
the projected evolution of cereal utilization in
developed and developing countries over the
next ten years.
4.4.2 Increase in yields is expected to remain the main driver of production growthA main question is how the additionally needed
crop production will be produced: from higher
yields per hectare26, or from additional (new)
cropland. In the Green Revolution, crop yields
increased remarkably, but in various regions and
for various crops crop yields stagnated (Grassini et al., 2013, Weidema, 2006). As previously
pointed out by the IRP, the growing demand
for food will lead to an expansion of global
cropland as yield growth alone will not be able
to compensate for the expected surge in global
demand (UNEP, 2014). The options to expand
production either by area or yield increase (or
a combination of the two) vary by region and
by crop.
According to the (OECD & FAO, 2014) projections
for the coming ten years, yields of the most
important crops will increase by around 8–16%
over the next decade whereas the harvested areas
of these crops will grow by 2–10% (Figure 11). The
main sources of production increase will therefore
be higher yields and increased cropping intensity,
representing 75% of the required increase.
The remaining 25% will be based on cropland
expansion; an estimated 8–10 million hectares per
year over the next ten years (OECD & FAO, 2014).
2526
25. Governmental policies (notably in the EU and in the USA), in combination with high oil prices, have led to a large increase in biofuel use in recent years and are expected to continue to have an impact on biofuel demand.
26. This could also include a higher cropping intensity, i.e. more crops per year (or less fallow time between crops).

62
Soci
o-ec
onom
ic d
river
s im
pact
ing
on fo
od d
eman
d, p
rodu
ctio
n an
d fo
od s
yste
m o
utco
mes
Figure 11 Increase in yield and harvested areas for main crops
0
2
4
6
8
10
12
14
16
-2 0 2 4 6 8 10 12 14
Changes in harvested area (%, 2023 vs.2011-13)
Coarse grains
Wheat
Oilseeds
Rice
Cotton
Sugarcane
Sugarbeet
Changes in yield (%, 2023 vs.2011-13)
Source: (OECD & FAO, 2014)Note: The size of the bubbles indicates the proportion of harvested area of one crop relative to all crops
For the longer term, projections of land use
changes show much variation, as demonstrated
by a comparison of different agro-economic
models (Schmitz et al., 2014). The various
models27 project a an increase in global cropland
area of between -100 million hectares to +300
million hectares over a period up to 2050. The
largest average cropland expansion by far is
projected in Africa (+121 million ha), followed by
Latin America (+57 million ha). Cropland areas
in Europe, the area of the former Soviet Union
and North America are on average projected
to remain stable or even contract somewhat,
particularly in the Mediterranean.
4.4.3 Large increase in livestock productionGlobal meat production is expected to increase
by around 15% for pig and beef and by 25%
for poultry in the period 2011/13–2023. Meat
production is projected to remain unevenly
distributed between the various regions
(Figure 12). The rapid growth in livestock
production in Asia is projected to continue,
albeit at a slightly slower pace than before. Asia
overtook the OECD as the main production
region of meat in around 2012. Also in Latin
America, production is expected to increase.
In relative terms, Sub-Saharan Africa shows the
largest increase in production, but this is from
a very low starting point. The developments in
supply and demand imply that both the African
and the Asian continents import an increasing
volume of meat, notably of poultry meat in the
projections up to 2023. OECD countries as
well as Latin America (Brazil, Argentina and
Uruguay) will remain large meat exporters.
In China where meat production growth is
expected to continue too, the livestock sector is
highly reliant on feed grains (Garnett & Wilkes,
2014). Expansion of meat and dairy production
has led already to a higher proportion of coarse
grains in the country’s total grain production,
and will require much more imports of coarse
grains and oilseeds for feed purposes (OECD
and FAO, 2014a), showing the global dimension
of the close interaction between livestock and
crop/feed production in modern food systems.27
27. The comparison includes four partial (PE) and six general equilibrium (GE) models. The PE models are MAgPIE, GLOBOIM, GCAM and IMPACT. The GE models are all based on the GTAP database: AIM, FARM, GTEM, ENVISAGE, MAGNET and EPPA. The models differ substantially in how they model land supply and the amount of potential land, and are heterogeneous in other key features as well, such as spatial dimensions, data sources and technological change.

63
Food
sys
tem
s an
d na
tura
l res
ourc
es
Figure 12 Livestock production in various regions
0
10
20
30
40
50
60
70
Bee
f an
d v
eal (
cwe)
Pig
mea
t (c
we)
Po
ultr
y m
eat
(rtc
)
Bee
f an
d v
eal (
cwe)
Pig
mea
t (c
we)
Po
ultr
y m
eat
(rtc
)
Bee
f an
d v
eal (
cwe)
Pig
mea
t (c
we)
Po
ultr
y m
eat
(rtc
)
Bee
f an
d v
eal (
cwe)
Pig
mea
t (c
we)
Po
ultr
y m
eat
(rtc
)
Bee
f an
d v
eal (
cwe)
Pig
mea
t (c
we)
Po
ultr
y m
eat
(rtc
)
Bee
f an
d v
eal (
cwe)
Pig
mea
t (c
we)
Po
ultr
y m
eat
(rtc
)
Bee
f an
d v
eal (
cwe)
Pig
mea
t (c
we)
Po
ultr
y m
eat
(rtc
)
Rest of Asia China India Latin America and Caribbean
North America Sub Saharan Africa European Union-28
200320132023
million tonnes
Source: (OECD & FAO, 2014)
4.4.4 Fisheries and aquacultureCaptured supply is expected to remain stable,
while fishery production by means of aquaculture
is expected to increase steadily (Figure 13 and
Box 3). This therefore requires additional feed.
This is mainly land-produced feed in the form of
cereals and protein crops, but still large amounts
of fish meal and oil are used as well (although
the proportion of global fish production used as
fishmeal has decreased from an average of 23%
in the 1990s to 10% in 2012 (HLPE, 2014b). Fish
catches are expected to remain stable as many
marine fish stocks are already overexploited (see
Section 5.7).
Figure 13 Fishery production in live weight equivalent
0
20
40
60
80
100
1993 1998 2003 2008 2013 2018 2023
Aquaculture
China Other Asia Rest of the World
million tonnes
0
20
40
60
80
100
1993 1998 2003 2008 2013 2018 2023
Capture
China Other Asia Rest of the World
million tonnes
Source:(OECD & FAO, 2014)

64
Soci
o-ec
onom
ic d
river
s im
pact
ing
on fo
od d
eman
d, p
rodu
ctio
n an
d fo
od s
yste
m o
utco
mes
Figure 14 Prevalence of undernourishment
995939
893863
827
WFS target
23.6%
18.8%16.7% 15.5% 14.3%
MDG-target
5
10
15
20
25
30
35
40
45
300
400
500
600
700
800
900
1000
1100
1990 1995 2000 2005 2010 2015
millions
Undernourishment in the developing regions
Number (left axis) Prevalence (right axis)
Percentage undernourishedUndernourishment in 2014-2016, by region
Oceania1
Caucasus and Central Asia
6Developed regions
15
Western Asia 19
Latin America and the Caribbean
34South-Eastern Asia
61
Eastern Asia145
Sub-Saharan Africa220
Southern Asia281
Northern Africa
4
Total = 786 million
Source: FAO (2015e)
4.5 Food system outcomes for food security
The previous sections show how socioeconomic
drivers result in increasing future food demand
and shifts in food consumption patterns
to animal products. This will increase the
challenges to increase resource efficiency
and improve natural resource management in
a way that these resources remain a resilient
basis for future food production. As argued in
chapter 2, the issue of natural resource use is
highly connected with food security, through
the interactions between environmental impacts
of natural resource use and the socioeconomic
conditions of food production and distribution.
Using the concept of food systems would
help to structure and analyze these (two-way)
interactions. The High Level Panel of Experts
on Food Security and Nutrition (HLPE) defines
a sustainable food system as a ‘food system
that ensures food security and nutrition for all
in such a way that the economic, social and
environmental bases to generate food security
and nutrition of future generations are not
compromised’ (HLPE, 2014a). A key question is
whether current food systems have satisfactory
outcomes in terms of food and nutrition security.
If not, how to enhance these outcomes while
improving natural resource efficiency? This
section provides some insights in a number of
food system outcomes for food security and
consequences for natural resource use.
4.5.1 Number of people undernourishedDespite the great increase in food production
volumes in recent decades, current food systems
have not been able to eradicate hunger. In 2014,
about 795 million people were undernourished
globally. This is 216 million less than in 1990–92
(FAO (2015e) (Figure 14). The largest number of
undernourished are found in Southern Asia, Sub-
Saharan Africa and Eastern Asia, where over 80%
of the undernourished are found. While in many
regions the number of undernourished people has
declined, it is more or less stable in Southern Asia,
and it has increased in Sub-Saharan Africa from
176 to 220 million people.
Three quarters of all hungry people live in rural
areas, mainly in Asia and Africa. Many of these rural
poor depend on smallholder-based agriculture
to improve their livelihoods. According to the
(FAO, 2012b) study World Agriculture Towards 2030/2050, there will only be a modest reduction
in the number of undernourished people in the
decades ahead. The main reason for this is that
many countries start with adverse initial conditions
such as ‘low national average food availability, high
undernourishment, high population growth and
also poor land and water resource endowments’
(FAO, 2012b). Improved utilization of these
scarce land and water resources can thus play a
crucial role in poverty alleviation in rural areas of
developing countries.

65
Food
sys
tem
s an
d na
tura
l res
ourc
es
Figure 15 Food affordability
Food affordabilityScore 0-100100=best environment
> 7555 - 75
35 - 5515 - 35
Source: Global Food Security Index (EUI, 2014)
4.5.2 Food price development Prices and income levels and development
determine to a great extent the affordability of
food. Figure 15 presents an overview of the food
affordability situation in the world, measured by
the Global Food Security Index (EUI, 2014) of
the Economist Intelligence Unit.28 The situation
is worst in the low-income countries in Sub-
Saharan Africa, plus several low-income
countries in Asia and the Caribbean. Densely
populated countries like Egypt, India, Vietnam
and Indonesia have a slightly higher score.
Developments in food prices show considerable
fluctuations for recent decades. Periods of
declining levels alternate with upward trends
in prices, which show peaks in the mid-1970s
and in 2008 and 2011, with 2014 prices down
compared to 2011 but still close to the 2008
levels (see Figure 16). Since the early 2000’s,
prices (both in nominal and deflated terms)
show an overall remarkable upward trend
driven by population and income growth as two
fundamental drivers of food demand, next to,
among others, the use of feedstock for biofuels.
Food has started to become more expensive
over the last two decades, which might become
a problem for the lower income classes that
spend a significant part of their (low) income
on food and are net buyers of food, therefore
making that category very vulnerable to price
peaks.29 A continuation of the increasing trends
in food prices may endanger food security for
these lower income classes, both in developed
and less developed countries.
OECD-FAO medium term projections do expect
prices of major commodities to rise up to levels
above the pre-2008 period as global food
consumption continues to increase (OECD & FAO,
2014). These projections for the next ten years
also assume a slowly increasing crude oil price,
which will encourage further biofuel production.30
This highlights the increasing linkage between
2829
28. The Global Food Security Index (GFSI) of the EUI (2014) looks at affordability through two primary lenses – whether an average individual in a country has sufficient means to purchase food, and the public structures that have been established to respond to personal or societal shocks. Together these provide a holistic treatment of affordability, exploring elements of ability to pay and cost under a broad array of environmental conditions.
29. Food price fluctuations raise great concerns in developing countries given the large share of income spent on food by the poor, and the importance of agriculture as a source of income for many poor people. The challenge for policy is to identify (a combination of) policies to ensure both the livelihood security and food security of vulnerable people. See Beekman G., Meijerink G. (2010) Reducing food price variability in Sub-Saharan Africa, The Hague, LEI Wageningen UR, World Bank (2014a) Food Price Volatility, Food Security and Trade Policy Conference. For a discussion of the usefulness of government-run or market-based instruments to stabilise prices and/or managing risks related to price variability.

66
Soci
o-ec
onom
ic d
river
s im
pact
ing
on fo
od d
eman
d, p
rodu
ctio
n an
d fo
od s
yste
m o
utco
mes
the agricultural and energy market caused
by biofuel programmes implemented by the
US, EU, Brazil and many other countries (see
also (HLPE, 2013a)). Although biofuels have
not been the most dominant contributor to the
recent food-price inflation (see e.g. (Zilberman et al., 2012), prices of agricultural commodities
and crude oil increasingly correlate since the
introduction of biofuel programmes in the US:
ethanol prices follow oil prices and prices of
corn and other cereals adjust to a change in the
price of ethanol (Marimpi, 2014, Merkuseva &
Rapsomanikis, 2013). Hence, fossil fuel market
developments affect agricultural commodity
markets increasingly and in two ways as
agriculture is both a user and a producer of fuel.
Modern agriculture is heavily reliant on fossil
fuel derived inputs such as fertilizers and fuel,
while food processing, preserving/cooling and
transport and distribution are energy-intensive
activities too. As a result, the global food
supply is highly dependent on fossil fuel and
food prices continue to be pressured upwards
by fossil energy prices that tend to increase
over time due to increasing global demand
and the depletion of currently known reserves.
In addition, biofuel production is encouraged
by mandatory policies and affected by fossil
fuel price developments. All in all, if fossil fuel
prices increase, agricultural production costs
increase and biofuel production becomes more
attractive. Both tendencies have an upward
pressure on food prices unless food production
increases through land area expansion or the
more intensive use of the currently available
agricultural area. Increasing demand for
agricultural commodities for biofuels highlights
the additional need for pursuing higher yields
based on improved resource use efficiency.
Figure 16 Food price developments 1961–2014
0
50
100
150
200
250
1961 1967 1973 1979 1985 1991 1997 2003 2009 2015
Nominal Price Index
Deflated Price Index
Index (2002-2004 = 100)
Source: (FAO, 2014b)
30
30. A reduction in demand – due to economic decline in China and some other emerging economies - in parallel with an expansion of supply caused a significant drop in fossil fuel prices in 2014 and 2015. The World Bank Commodity Price Forecasts to 2025 project prices to increase again in 2017 and onwards (http://www.worldbank.org/en/research/commodity-markets, retrieved 22 January 2016).

67
Food
sys
tem
s an
d na
tura
l res
ourc
es
4.5.3 Rural livelihoods in the context of rapidly changing and consolidating food systemsWhereas in developed economies agriculture is
a relatively small economic activity, it is a major
if not dominant source of income and livelihood
in many developing countries. According to the
(World Bank, 2007), agriculture is a source of
livelihood for an estimated 86% of rural people.
It provides jobs for 1.3 billion smallholders and
landless workers, ‘farm-financed social welfare’
when there are urban shocks, and a foundation
for viable rural communities. Of the developing
world’s 5.5 billion people, 3 billion live in rural
areas – nearly half of humanity. Of these rural
inhabitants an estimated 2.5 billion are in
households involved in agriculture, and 1.5
billion are in smallholder households.
A total of 1.3 billion people live on less than
US$1.25 a day (in 2005 purchasing power parity);
this level is defined as living in extreme poverty
(World Bank, 2014b). Half of this population is
concentrated in Africa and another 30% lives in
South Asia. Three out of every four poor people
in developing countries live in rural areas, and
most of them depend directly or indirectly on
agriculture for their livelihoods. Therefore, in many
of these countries agriculture is a strong option
for spurring growth, overcoming poverty and
enhancing food security. Increased agricultural
productivity generates higher incomes and
creates income-generating opportunities for
otherwise destitute population groups, offering
a recognized way to escape the poverty trap in
many rural areas. However, many smallholders
are not able to use the opportunities provided
by increasing resource efficiency as they are
not well-integrated in markets or included in
the (increasingly lengthy) food supply chains
dominated by an progressively concentrated
retail segment (FAO, 2013b, Kirsten et al., 2009,
Wiggins, 2014). Processors and retailers tend
to have a preference for suppliers that have a
certain scale, in order to guarantee the requested
volumes in the appropriate quality and on time.
Among the risks faced by agri-processors in
setting up business relations with smallholders
are difficulties in getting the latter to comply with
standard requirements on products and other
contractual agreements, as well as problems
(and costs) relating to communication and
coordination with a large number of suppliers.
Smallholders, on their side, face serious
constraints in accessing essential inputs (feed,
fertilizer, seeds, capital, etc.) and in selling their
products. The problems are worsened by the
lack of public institutions necessary to support
market-based transactions, such as those for
enforcing property and/or user rights (of land or
water resources) and contractual agreements.
4.5.4 Food losses and food wasteA characteristic of current food systems is the
significant food losses and waste. This adds to
food insecurity, spoils natural resources (such
as land, water, minerals) as well as human
resources. Across the food chain, a substantial
percentage (20–30%) of agricultural produce
is lost for food intake, and further proportions
are used for animal feed and biofuel. This is
approximately equal to a loss of 1.3 billion tonnes
per year (Gustavsson et al., 2011). Most experts
differentiate between food losses and food waste;
a distinction which is also relevant when thinking
about solutions. Food that gets lost, spilled or
spoilt before it reaches its final product or retail
stage is called food loss. Food waste refers to
food that is of good quality and fit for human
consumption but that does not get consumed
because it is discarded either before or after it
is spoiled (Lipinski et al., 2013). It needs to be
stressed that numbers on food waste and losses
need to be considered with caution, as studies
employ different definitions and indicators and
there are gaps in data availability (HLPE, 2014a).
(Gustavsson et al., 2011) provide an illustrative
global overview of current levels of food loss and
waste. In Europe and North America, the per
capita overall food loss and waste is estimated to
be between 280–300 kg per year, while in Sub-
Saharan Africa and Southeast Asia this amount
is between 120–170 kg, and in the other regions
between 210 and 240 kg per year (Figure 17).
The figures in this study show that food waste
(at consumption level) has a higher share in
total food loss and waste in developed countries
than in developing countries. The authors’

68
Soci
o-ec
onom
ic d
river
s im
pact
ing
on fo
od d
eman
d, p
rodu
ctio
n an
d fo
od s
yste
m o
utco
mes
background figures also indicate that the nature
of food losses differs per region. In developed
countries, food production losses mainly occur
in the food processing stage (loss of food parts
during standardized preparation of specific
products). However, 40% of the total estimated
losses and waste in developed countries occur
at the retail and consumer level, representing
around 222 million tonnes; almost as high as
the total net food produced in Sub-Saharan
Africa (which is around 230 million tonnes).
In developing countries, around 40% of food
losses and waste occurs during the post-harvest
stage but losses at the field stage are also
prevalent. For instance, in Sub-Saharan Africa
the losses in cereal grains range from 5–40% of
the total production. Post-harvest losses in fruit
and vegetables in Sub-Saharan Africa range
between 30–40 %, although the extent of these
losses varies according to region, season and
commodity. Recent studies in India, Ghana,
Rwanda and Benin show even higher losses
ranging from 30–80% in different commodities
(Kitinoja et al. (2011) cited in (HLPE, 2014a).
4.5.5 Food consumption trends and healthAs income rises, people tend to shift from starch-
rich to sugar/fat-rich foods, with more animal
protein products (meat and dairy) and fruit and
vegetables. An increase in dietary diversity can
have positive effects on health compared with
a diet dominated by cereals, roots and tubers.
However, increased consumption of sugar/
fat-rich food per capita does not always have
positive effects: many countries struggle with
obesity. Figure 18 below shows the prevalence
of obesity in the world indicating that it is not
only a problem in some high-income countries
but also in many developing countries, where
almost two in three of the world’s obese
people live.
Overweight and obesity is a fast-growing,
globalizing problem with well over two billion
adults overweight or obese in 2013: worldwide,
the proportion of adults with a body mass index
(BMI) of 25 kg/m² or greater increased between
1980 and 2013 from 28.8% to 36.9% in men,
and from 29.8% to 38.0% in women (Ng et al., 2014). Causes are related to food consumption
habits and lifestyle: overweight is linked with
an increased intake of foods that are high in
calories and an increase in physical inactivity
due to the increasingly sedentary nature of many
forms of work, changing modes of transportation
and increasing urbanization (WHO, 2013).
Overweight and obesity should be tackled by
energy rebalancing between calories consumed
and calories expended.
Figure 17 Per capita food losses and waste in different regions (kg/year)
0
50
100
150
200
250
300
350
Europe North America and Oceania
IndustrializedAsia Sub-Saharan
AfricaNorth Africa,
West andCentral Asia
South and Southeast Asia
Latin America
kg/capita/year
Consumer
Production to retailing
Source: (Gustavsson et al., 2011)

69
Food
sys
tem
s an
d na
tura
l res
ourc
es
Figure 18 Prevalence of obesity
Prevalence of obesity* , ages 18+, both sexes, 2014
Prevalence of obesity (%)< 10 10 - 19.9 20 - 29.9 = 30 Data not available
* BMI =30 kg/m2
Source: (WHO, 2014)
Overweight and obesity are associated with high
individual and societal costs. Firstly, they lead to
increased risks of life-threatening diseases.31
This implies huge costs to national health
systems. To illustrate this: treating the projected
growth in preventable weight-related diseases
in the USA and UK alone was estimated at $66
billion a year (Metelerkamp, 2013) an amount that
equals Luxembourg’s GDP. Secondly, adults with
overweight have a poor health condition and are
less productive and efficient than they could be,
implying a significant cost of overconsumption
from an economic perspective too. A specific
concern is the increase of childhood overweight,
the prevalence of which is increasing dramatically
in all regions, of the world, particularly in Africa
and Asia. In its Global Nutrition Targets 2025 the
WHO has set an implementation plan to stop the
increase of childhood overweight, including a
mix of policies and actions aimed at changing
behavior and reducing social risk factors which
lead to unhealthy weight gain in children (WHO,
2012).
Like overweight, undernourishment (insufficient
intake to meet energetic needs) and diets
lacking essential micronutrients both affect
global public health. According to the recent
GBD study32 (Lim et al., 2013), the disease
burden due to childhood underweight, including
communicable disease, has fallen substantially
since 1990, from around 8% of the total disease
burden to around 3% in 2010. The decrease is
substantially higher in Asia than in Africa. At the
same time, the disease burden due to excessive
food consumption increased substantially. For
instance, the disease burden due to overweight
(high Body Mass Index) rose from 2.2% to almost
4% of the total disease burden (TDB) worldwide.
In developing regions too, the disease burden
due to overweight and obesity more than
doubled. Especially in Africa, both underweight
and overweight constitute predominant risk
factors simultaneously.
Taken together, dietary risk factors account for
10% of the total global disease burden, which
is higher than the main individual factors, which
are smoking including second hand smoke,
and high blood pressure (6.5% and 7% of the
TDB respectively). The relative high position of
‘low fruit’, ‘low nuts and seeds’, ‘low vegetables’
and ‘low omega-3’ on the GBD list of risk
factors implies that there is more to healthy food
communication than advising a lower intake of
saturated fats. There seems to be cause to pay 31
32
31. Cardiovascular diseases, diabetes, musculoskeletal disorders and some cancers (WHO (2013) Obesity and overweight Fact sheet N°311 updated on March 2013, http://www.who.int/mediacentre/factsheets/fs311/en.
32. The Global Burden of Disease (GBD) study is a comprehensive regional and global assessment of mortality and disability from major diseases, injuries, and risk factors. GBD is a collaboration of over 500 researchers representing over 300 institutions and 50 countries.

70
Soci
o-ec
onom
ic d
river
s im
pact
ing
on fo
od d
eman
d, p
rodu
ctio
n an
d fo
od s
yste
m o
utco
mes
Box 3 Case study aquacultureOpportunities of aquaculture for food supply and income generation (smallholders as well as private businesses)
Aquaculture is the fastest-growing food-production sector in the world, now providing almost half of the global fish supply (FAO, 2012a, Hall et al., 2011). In 2012, world aquaculture production attained an all-time high of 90 million tonnes (live weight equivalent) valued at US$144 billion. This includes 67 million tonnes of food fish (US$138 billion) and 24 million tonnes of aquatic algae (mostly seaweeds, US$6.4 billion) (FAO, 2014c). The fast growth rate in farmed food fish production resulted in average annual per capita consumption of farmed fish rising by almost seven times, from 1.1 kg in 1980 to 8.7 kg in 2010 (FAO, 2012a). For global fish availability to meet projected demand, it is estimated that aquaculture production will need to more than double by mid-century, rising to roughly 140 million tonnes in 2050 (Waite et al., 2014).
In 2010, the Asia and the Pacific region produced 53.1 million tonnes of aquaculture products (excluding aquatic plants) which accounted for 89% of the global aquaculture production (Funge-Smith et al., 2012). In terms of value, this is 80% of the total value of global aquaculture. Nine of the top 10 fish producing countries in the world are in Asia, all of which started from small-scale aquaculture. Small-scale aquaculture has not only supplied animal protein to the rural poor but has also generated income and has also served as a gateway to commercial farming and export earnings, such as catfish (Pangasius) farming in Vietnam and shrimp in Thailand (Bhujel, 2012).
Globally, aquaculture provided almost 19 million on-farm jobs in 2012, 96%t of which were located in Asia (FAO, 2014c, Waite et al., 2014). When accounting for secondary sectors such as fish processing and marketing, as well as for workers’ families, the number of people reliant on aquaculture for a living rises to more than 100 million (Waite et al., 2014). Small-scale aquaculture also offers important livelihood opportunities for women in developing countries through their direct involvement in the production, processing and sale of fish (FAO, 2014c). Aquaculture also addresses poverty and food insecurity through a variety of routes and at various scales (Beveridge et al., 2010). It offers a means for smallholder farmers to diversify production, thereby providing nutritious food for their own families, and sometimes those of their neighbors, while also generating surpluses for sale. Aquaculture enterprises from micro to large scale, providing fish exclusively for sale, create farm income and employment opportunities throughout the value chain and provide affordable, highly nutritious food in response to market demand.
Natural resource and environmental implications (risks, opportunities)
Fish in aquaculture systems is on average more efficient than most terrestrial livestock systems in converting feed into protein (HLPE, 2014). Yet, for most species the availability of fish feed is one of the key issues for the future, especially in the case of fishmeal (FAO, 2012b). Some species however, such as mollusks and filter-feeding finfish (e.g. silver carp, bighead carp) do not require feeding.
Aquaculture is also constrained by local environmental factors and the carrying capacity of the environment where production occurs. Especially coastal areas are vulnerable. Furthermore, the aquaculture production system contributes to eutrophication (Bouwman et al., 2013a, Hall et al., 2011). However, aquaculture can potentially enhance resilience through improved resource efficiencies and increased diversification of farmed species, locales of production, and feeding strategies (Troell et al. 2014). These would require the development of a diversity of aquaculture species; the promotion of co-products from the crop, livestock, and fisheries sectors for feeds, the design of infrastructure that uses renewable energy and the implementation of management practices that minimize wastes and environmental impacts.
The “Blue Frontier” report (Hall et al., 2011) outlines interventions on innovation, regulation and policy, technologies management, monitoring and compliance, and consumer and markets. Also, investing in science and technology is important for achieving more sustainable aquaculture development. The following are among the key areas for improvement that are particularly relevant to major aquaculture counties in Asia region (Hall et al., 2011): (i) reduction of the dependency of some aquaculture production systems on fishmeal and fish oil, and where used assuring such ingredients derive from more sustainable sources; (ii) increased use of water and energy audits to foster better practices that reduce environmental resource demands; (iii) investments in improving fish strains through selective breeding and also focus on selection for feeding efficiency and disease resistance; (iv) analysis of climate change related vulnerabilities and adaptation strategies, shift of the location of aquaculture to new areas that become more suitable.
Finally, to provide wider ecosystem stewardship and improved governance of the sector, FAO is promoting “Blue Growth” as a coherent approach for the sustainable, integrated and socio-economically sensitive management of oceans and wetlands, focusing on capture fisheries, aquaculture, ecosystem services, trade and social protection of coastal communities (FAO 2014). The Blue Growth framework promotes responsible and sustainable fisheries and aquaculture by way of an integrated approach involving all stakeholders, anchored in the principles set out in the benchmark Code of Conduct for Responsible Fisheries of 1995.
Figure B.1 Geographical distribution of aquaculture production 2013
Aquaculture production 2013 (million tonnes)No data Less then 0.5 0.5 - 1 1 - 5 5 - 10 10 - 25 25 and greater
Source: FAO (2014)
(Source: Adopted from Waite et al. 2014).

71
Food
sys
tem
s an
d na
tura
l res
ourc
es
more attention to ‘healthy food components’ that
might be missing in our diets.
Considering the key findings of the Global
Burden of Disease study with respect to dietary
risk factors, diverse diets appear to be the key to
healthy food consumption.
Turning to a more healthy diet could have
significant implications for at least part of the
present food system as it includes a significant
reduction of meat and dairy consumption levels
and more fruits and vegetables. This will have
significant impacts on natural resources as meat
and dairy sectors are particularly intensive users
of land (including fodder production) and water.
4.6 Summary and Conclusions
Food demand is expected to increase and
change drastically in composition over the
coming decades due to the increasing population
coupled with increased wealth, and ongoing
urbanization, especially in regions outside the
developed countries. Figures from the emerging
economies of China and Brazil illustrate this
shift in diets, by showing a rapid increase in per
capita meat consumption over the last 40 years.
Globally, the expected increase of meat and
dairy consumption has large implications for feed
demand and consequently for resource use. Over
the next 10 years, around 75% of the additional
crop production projected will be based on
higher crop yields; the rest from an increase in
growing areas. Increases in fish consumption
over the next 10 years will be based on a 35%
expansion in aquaculture production, with supply
from captured fish expected to remain stable. For
aquaculture to grow, additional feed is needed
too. Aquaculture is becoming a major pressure
on the marine environment, due to nutrient losses
in coastal areas.
The increasing size, wealth and share of the
population living in urban settlements will lead
to important changes in local and regional food
systems. Physical distances between food
producing and consuming areas will increase,
implying a greater role for trade and distribution.
Moreover, urban food consumption patterns
tend to shift to processed and ‘western’ style
convenience food. Especially in a number of
Asian and African countries, an increasing share
of these foods are imported for different reasons:
local supply chains are less cost-efficient than
globalized supply chains, some crops cannot be
grown domestically (such as wheat), or the local
land base is not enough to produce satisfactory
volumes. Moreover, many smallholders are
not able to increase production as they are
not well-integrated in markets or included in
the (increasingly lengthy) food supply chains
dominated by an increasingly concentrated
retail segment.
Current food systems have several unsatisfactory
outcomes in terms of food and nutrition security.
First, over 800 million people are still suffering
from chronic hunger. In addition, over 2 billion
people suffer from micronutrient deficiencies.
Three quarters of all hungry people live in
rural areas, mainly in Asia and Africa. Many
of the rural poor depend on smallholder-
based agriculture to improve their livelihoods.
Second, food losses and waste are significant,
about one-third of the mass of food available
for human consumption is lost. In developing
countries most food loss occurs in the field
and during post-harvest storage, whereas food
waste in high-income countries is mainly at retail,
restaurant/catering/hospitality and domestic
consumer stages. In addition, the loss of food for
potential consumption represents a significant
unnecessary use of natural resources. And third,
there is a strong increase in obesity and diet-
related diseases. As income per capita rises,
people’s diets change from one that is largely
rich in carbohydrates to a diet richer in calories,
sugars, and lipids, with more livestock-based
products and vegetables. In combination with
an increasingly sedentary lifestyle, this has led
to a sharp increase in obesity. Globally, more
than two billion people are currently overweight
or obese. In Africa in particular, both under- and
overweight constitute predominant disease risk
factors simultaneously.

Natural resources and environmental
impacts of food systems
Chapter
5
Cre
dit:
And
rzej
Kub
ik, S
hutt
erst
ock.
com

73
Food
sys
tem
s an
d na
tura
l res
ourc
es
5.1 Introduction
The previous two chapters described current
food systems and current and projected food
production and consumption trends. This
chapter focuses on the natural resources needed
for food system activities (Table 1) and their
environmental impacts (Table 2). As can been
seen in Table 1 the actual use of most resources
is concentrated in the primary production
stage (farming, fishing, aquaculture). The main
exceptions are fossil fuels (currently 70% is for
off-farm activities) and minerals for packaging.
Minerals in the form of nutrients (as P, K, etc.)
flow through the food system.
Given the fact that most resources are used in the
primary production stage, it might seem that the
‘food system lens’ is not fully used in this chapter.
As the next chapters will clarify, the key to a more
sustainable and efficient use of resources at the
primary production stage is often in the hands
of other actors in the food system. Still, to better
understand the real issues concerning natural
resources and food systems, an assessment
per natural resource is essential. In the first part
of this chapter a brief description is given of the
current and projected state of the main renewable
and non-renewable resources, as well as the
consequences of their unsustainable or inefficient
use. Each subsection closes with a brief summary
of biophysical options for the more efficient and
sustainable use of the particular resource. The
current and projected environmental impacts of
food production and consumption are described
in Section 5.9. The chapter closes with an overview
of the resource use and environmental impacts of
different food products and diets (Section 5.10).
5.2 Land, landscape and soils
5.2.1 Land use and food systemsHumankind has increasingly transformed land
and ecosystems in order to increase food
production or other outputs, leading to major
changes in biodiversity, biogeochemistry and
climate (Ellis et al., 2013). Currently, of the 149
million km2 of total global land area, 15 million km2
(1500 million hectares) are predominantly being
used for crop production (including permanent
crops and fallow land) and around 34 million km2
for rangelands (including grassland and other
areas growing primarily native vegetation) (FAO,
2011e). Globally, croplands produce the largest
share of food, although the contribution from
other sources (rangelands, fisheries, hunting
and gathering) should not be underestimated.
In some traditional food systems, these sources
even provide a major part of the diet. Within
food systems, land is predominantly used for
primary production, although locally large
areas are allocated to other activities such as
food processing, retail and restaurants. Due
to high local concentrations of the population,
for example in urban centers, food demand
exceeds local production potential in many
areas, leading to large trade flows within and
between countries (Chapter 4). Soils are a
major component of the land resource, since
soil quality is an important determinant of the
suitability of land for agriculture, in combination
with other land characteristics (such as slope)
and climate. Landscapes refer to interacting
ecosystems related to the spatial configuration
of heterogeneous types of land use. Both
agricultural as non-agricultural ecosystems
(like forests or wetlands) can provide essential
supporting and regulating ecosystem services
to agriculture, such as pest and disease control

74
Nat
ural
res
ourc
es a
nd e
nviro
nmen
tal i
mpa
cts
of fo
od s
yste
ms
and water regulation (See also Section 5.5 on
Biodiversity and ecosystem services). Cropland
and pasture land provide important ecosystem
services as well (Wood et al., 2000a), such as
water and climate regulation, but also disservices
(for example disturbance of watersheds).
Large differences in land potential
Not all land on earth has the potential to
sustainably support agricultural production.
For a particular piece of land, this potential is
a function of both the land’s current production
potential and the land’s resistance and resilience
to degradation (UNEP, 2016). FAO distinguishes
three classes of potential cropland: prime, good
and marginal/unsuitable (FAO, 2011e). Globally,
28% of the cultivated land is classified as prime
quality, and 53% as good. The productivity of
inputs such as labor, seeds, water and nutrients
is higher on prime land than on good or marginal
land. As discussed in UNEP’s report ‘Assessing
global land use’ (UNEP, 2014), the potential
of a specific piece of land is not static: land
potential can be increased through innovation
and investments. It can also decline through
soil loss and other forms of degradation. The
land quality of a certain plot or region can be
improved by good management, but can also
deteriorate in the case of poor management.
Much of the current prime agricultural land has
been improved over time: soil acidity has been
corrected by liming and soil fertility has been
increased through fertilization and amendments
to organic material. More dramatic and long-
term changes to land potential have been
achieved through the modification of water flows
through the soil via terracing and the installation
of surface and sub-surface drainage systems.
Terraces can actually increase soil erosion when
not maintained, resulting in a net loss of potential
productivity. Terrace abandonment often occurs
when labor costs rise, reducing the profitability
of managing steep lands for agriculture.
5.2.2 Are current and future land use efficient and sustainable?The important question is whether the current
use of land, soils and landscape is efficient
and sustainable. As clarified in Chapter 2, the
‘efficiency’ of land use is defined here as land
productivity or crop yields, which should be
assessed against its potential productivity. This
latter aspect is important as not all land or soils
have the same potential. As Figure 19 shows, the
main areas with large yield gaps are in developing
and emerging countries. There are however
important exceptions: large parts of Asia and South
America have relatively small yield gaps, whereas
parts of the USA and Russia have significant
yield gaps. Much research has been conducted
that shows the difficulty of exactly defining the
potential yield level (Licker et al., 2010, Neumann
et al., 2010, Phalan et al., 2014). Rather than
focusing on the potential yield, it seems more
fruitful to acknowledge that yield gaps exist,
and to determine effective ways of increasing
crop yields and the productivity of pastures.
It is important to place the existence of yield
gaps within the context of food systems and the
socioeconomic system as a whole. On the one
hand, the biophysical causes of yield gaps are
driven by socioeconomic factors (see Chapter 3
and 4) as well as by other components of the food
system. On the other hand, higher crop yields
could lead to higher labor productivity and better
socioeconomic outcomes. Higher crop yields
could reduce the need for additional agricultural
land and thus slow down the rate of deforestation.
This last mechanism is however disputed, as
various rebound effects can occur. On a local
scale, more efficient agriculture is likely to be
more profitable and could thus locally lead to an
expansion of the cultivated area (Lambin et al.,
2014). On a global scale, higher crop yields will
probably lead to lower commodity prices, and
thus stimulate the demand for products as meat
and biofuels.

75
Food
sys
tem
s an
d na
tura
l res
ourc
es
Figure 19 Yield gaps for wheat, maize and rice combined for the year 2000
Ratio between actual and potential yields, under similar climatic conditions and soil fertility (the higher the percentage, the smaller the yield gap)
Lower than 20 % 20 – 40 % 40 – 60 % 60 – 80 % 80 % and higher
Source: (PBL, 2012)
Over the last 40 years, increases in crop yields
have greatly contributed to crop production
growth and have in many cases probably
prevented large-scale land conversion. However,
(Grassini et al., 2013) have demonstrated that
this period includes two separate phases, one
with a modest increase in harvested area for
rice, wheat and maize in the period of 1980–
2000 (see Figure 20) at 1.6 million ha per year,
and another one with an annual increase of 9.8
million ha per year over the period of 2002-2011.
The authors link this stronger increase to the
observation that the yields of wheat and rice in
particular reached a plateau in major production
areas as East Asia for rice and Northwest Europe
and India for wheat.
Figure 20 Trends in total harvested area of staple crops and three major cereal crops
0
100
200
300
400
500
600
1961 1971 1981 1991 2001 2011
Crop harvested area (million hectares)
Rice, paddy Maize Wheat
Source: (FAO, 2015a)

76
Nat
ural
res
ourc
es a
nd e
nviro
nmen
tal i
mpa
cts
of fo
od s
yste
ms
Unsustainable use of land: soil and land
degradation are taking place in many areas
Soil degradation is defined as a change in
the soil health status resulting in a diminished
capacity of the ecosystem to provide goods and
services33. Land degradation has a wider scope
than both soil erosion and soil degradation in that
it covers all negative changes in the capacity of
the ecosystem to provide goods and services
(id). Forms of land degradation are soil erosion
(by wind or water), chemical (contamination and
nutrient depletion) and physical degradation (soil
compaction). Based on the global assessment
of Oldeman et al. (1991) (GLASOD), (Middleton
& Thomas, 1997) estimate that about 7 million
km2 of grassland and about 5.5 million km2 of
cropland are degraded. This means that about
25% of the global agricultural land (50 million
km2) is degraded. Accelerated soil degradation
has reportedly affected as much as 500 million
hectares (Mha) in the tropics, and globally 33%
of earth’s land surface is affected by some type
of soil degradation (FAO, 2015b). (Wood et al., 2000b) concluded that over 40% of agricultural
land has been moderately degraded, and
another 9% strongly or extremely degraded
since the mid-1990s. (Bai et al., 2008) found
that around 22% of agricultural land has been
degraded since around 2005. Estimates of the
scale of land degradation vary considerably
so that accurate numbers are hard to provide.
According to FAO, an estimated 33% of soils is
moderately to highly degraded due to erosion,
nutrient depletion, acidification, salinization,
compaction and chemical pollution (FAO, 2015b).
It is disconcerting that we know so little about one
of the most important resources for humankind.
An underlying issue for this uncertainty is the
fact that there is no consensus between different
disciplines (economists, agronomists) of what
land degradation actually means and what is
consequences are (Eswaran et al., 2001).
Land and soil restoration can improve their
quality and productivity. Over the last decades,
restoration projects have been successfully
carried out (see Box 9). Many countries have
regulations in place to prevent land degradation,
for example by prescribing certain measures
such as counter ploughing, wind breaks and
cover crops. This certainly has led to less land
degradation. Certain forms of soil degradation,
such as soil compaction, are more difficult
to regulate.
Projected land use
In order to meet the growing global food and
feed demand (see Chapter 4), but certainly
also due to more local developments (Lambin et al., 2001), the total crop area is still growing,
especially in South America, East and West
Africa, and South and Southeast Asia (Grassini et al., 2013). At the global level, yield increases
are estimated to contribute 90% to the growth
in crop production that is expected until 2050;
for developing countries this figure is around
80% while for developed countries it is almost
100% (FAO, 2012b). This implies that 20% of
crop production increases in the developing
world will come from cropland expansion. This
expansion is often at the expense of natural
areas such as forests, wetlands and rangelands.
The largely policy-driven increase in demand
for biofuel and bio-energy creates an additional
demand for croplands (UNEP, 2014). In addition
to the net expansion of cropland, there is also a
gross expansion of cropland as a consequence
of growth of urban areas and soil degradation
(UNEP, 2014). This important effect is usually not
taken into account in land use projections. Under
business-as-usual conditions the net expansion
of cropland will range from around 120 to 500
Mha between 2005 and 2050, while the gross
expansion of cropland might be in the range of
320 to 850 Mha (UNEP, 2014).
There is much debate and uncertainty on how
much cropland (and pastures) will be needed
in the future, as well as how much and where
additional land suitable for agriculture is actually
available (Chamberlin et al., 2014, Deininger &
Byerlee, 2011, Lambin et al., 2013, Schmitz et al., 2014). How much additional cropland is needed
depends in theory on three determinants: the
total demand for agricultural products (food,
feed, fuel and fibers), the increase of crop yields 33
33. http://www.fao.org/soils-portal/soil-degradation-restoration/en/

77
Food
sys
tem
s an
d na
tura
l res
ourc
es
on existing land and the initial crop yields on
the new land. However, local factors such as
population density and the socioeconomic
context also play an important role. According
to (Lambin et al., 2001), land cover changes
are driven by peoples’ responses to economic
opportunities, as mediated by institutional
factors in an increasingly globalized world.
5.2.3 Consequences of unsustainable or inefficient land useUnless current agricultural land is used more
efficiently, population growth and an increased
demand for food, feed and biofuels are likely to lead
to cropland expansion, resulting in the additional
conversion of natural vegetation and consequent
loss of biodiversity and ecosystem services.
Land degradation could exacerbate this problem,
as it typically leads to lower crop yields, and
consequently to a demand for more new
croplands, as well as to a lower efficiency of other
inputs. Soil erosion can cause serious problems
downstream, such as flooding and sedimentation.
Land degradation also affects livelihoods. Many
people are facing a downward spiral of land
degradation, falling yields and the lack of means
to invest in land quality improvements (Tittonell
& Giller, 2013). Over 40% of the very poor live in
degraded areas (Conway, 2012).
Unsustainable land management has large
implications for future crop yields and related
food production, as following generations will
also crucially depend on productive land. The
sustainability of land use should therefore be
assessed at a timescale of hundreds (or even
thousands) of years.
5.3 Water
5.3.1 Water and food systemsFresh water of good quality is essential for
humans, as well as for crop and livestock
production, and for land-based aquaculture.
In the rest of the food system, water is also
needed for activities such as food processing,
preparation and waste disposal. However,
because of the dominance of agriculture in food
systems’ total water use, this section will focus
on that aspect.
Vast amounts of water are needed for food
production. It is estimated that the daily average
per capita water use for food production is
nearly 4 000 litres (Hoekstra & Mekonnen,
2012). Rain-fed agriculture depends on ‘green’
water, whereas irrigated agricultural depends
on a combination of ‘green’ and ‘blue’ water34.
Irrigated agriculture currently accounts for 70%
of the total global ‘blue’ water withdrawals. In
richer countries, this is around 42–44%, mainly
because water use in other sectors is higher
(OECD, 2010). Around 18% of the global crop
area is irrigated, while this produces about 40%
of the total crop production (Gleick et al., 2002,
MA, 2005a). In many areas, water is the main
limiting factor to increase crop production. A
good and reliable supply of water to the plant
(either by rainwater or through irrigation) is thus
key in enhancing the overall resource efficiency
of agriculture.
Water as a natural resource has a number of
important characteristics that makes it different
from other natural resources:
−Water is not actually used, but evaporates and
becomes part of the larger water cycle.
−The availability of water is highly localized. An
excess of water in one region cannot easily be
transported to regions with water shortages.
Currently, around one third of the global
population is living in countries suffering from
a medium to high water stress (OECD, 2012).
− In many regions, the presence of sufficient
water for crop growth is uncertain, as the
quantity and timing of rainfall is uncertain.
34
34. Green water is water stored in the soil or temporarily on top of the soil or vegetation. Blue water refers to fresh surface and groundwater, in other words, the water in freshwater lakes, rivers and aquifers: http://www.waterfootprint.org/?page=files/Glossary.
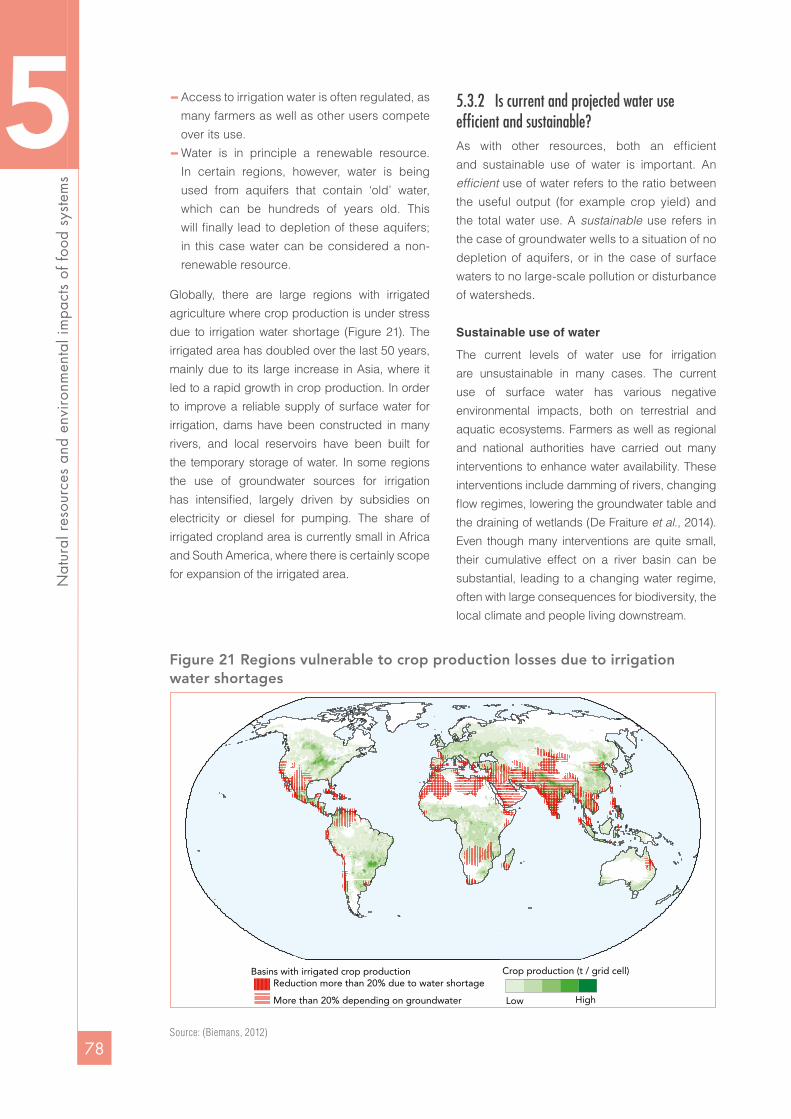
78
Nat
ural
res
ourc
es a
nd e
nviro
nmen
tal i
mpa
cts
of fo
od s
yste
ms
−Access to irrigation water is often regulated, as
many farmers as well as other users compete
over its use.
−Water is in principle a renewable resource.
In certain regions, however, water is being
used from aquifers that contain ‘old’ water,
which can be hundreds of years old. This
will finally lead to depletion of these aquifers;
in this case water can be considered a non-
renewable resource.
Globally, there are large regions with irrigated
agriculture where crop production is under stress
due to irrigation water shortage (Figure 21). The
irrigated area has doubled over the last 50 years,
mainly due to its large increase in Asia, where it
led to a rapid growth in crop production. In order
to improve a reliable supply of surface water for
irrigation, dams have been constructed in many
rivers, and local reservoirs have been built for
the temporary storage of water. In some regions
the use of groundwater sources for irrigation
has intensified, largely driven by subsidies on
electricity or diesel for pumping. The share of
irrigated cropland area is currently small in Africa
and South America, where there is certainly scope
for expansion of the irrigated area.
5.3.2 Is current and projected water use efficient and sustainable?As with other resources, both an efficient
and sustainable use of water is important. An
efficient use of water refers to the ratio between
the useful output (for example crop yield) and
the total water use. A sustainable use refers in
the case of groundwater wells to a situation of no
depletion of aquifers, or in the case of surface
waters to no large-scale pollution or disturbance
of watersheds.
Sustainable use of water
The current levels of water use for irrigation
are unsustainable in many cases. The current
use of surface water has various negative
environmental impacts, both on terrestrial and
aquatic ecosystems. Farmers as well as regional
and national authorities have carried out many
interventions to enhance water availability. These
interventions include damming of rivers, changing
flow regimes, lowering the groundwater table and
the draining of wetlands (De Fraiture et al., 2014).
Even though many interventions are quite small,
their cumulative effect on a river basin can be
substantial, leading to a changing water regime,
often with large consequences for biodiversity, the
local climate and people living downstream.
Figure 21 Regions vulnerable to crop production losses due to irrigation water shortages
Basins with irrigated crop productionReduction more than 20% due to water shortage
More than 20% depending on groundwater
Crop production (t / grid cell)
HighLow
Source: (Biemans, 2012)

79
Food
sys
tem
s an
d na
tura
l res
ourc
es
In addition to surface water, groundwater is
another water source for irrigation (see Box 4).
Water is sometimes pumped from layers that are
located very deep below the surface. Some of
these water reserves have existed for hundreds
of years. At least 20% of the world’s groundwater
aquifers are considered to be overexploited
(Gleeson et al., 2012). This leads to a lowering
of groundwater tables, resulting in increased
pumping costs, and lower availability of irrigation
and drinking water. Especially in Asia (e.g. Upper
Ganges) and North America (California), many
large aquifers that are critical to agriculture are
overexploited (Gleeson et al., 2012).
Water-use efficiency
The water-use efficiency can be defined in
several ways. The more narrow definition, widely
used in irrigation is the (dimensionless) ratio
between water arriving at plant level and the
amount of extracted water (HLPE, 2015, WWAP,
2015). The broader definition also assess the
water productivity: how much crop (or value) is
being produced per volume of water applied
(HLPE, 2015, WWAP, 2015). Hence, water
productivity is closely related to the efficiency of
other resources such as the quality of land and
management practices.
In many regions the water-use efficiency (in
terms of the narrow definition) is currently low
(Molden, 2007, OECD, 2008) as a result of
current practices of direct or indirect subsidies,
as well as distribution mechanisms. Losses of
50% of water are common. In many countries
relatively inefficient techniques are still being
used, such as flooding or high pressure rain gun
technologies, which use considerably greater
quantities of water than low pressure sprinklers
and drip irrigation techniques (OECD, 2008). In
irrigated agriculture, water losses can already
occur before the water has even reached the
crop roots, for example through leakage in
channels, direct evaporation during irrigation,
foliar interception by under-canopy, transpiration
by weeds or run-off and percolation losses
caused by over-irrigation. Not all “lost” water
from irrigations system is completely lost, as it
often still returns to useful water flows and can
be reused further downstream (HLPE, 2015).
Also in terms of the broader definition (including
water productivity) large inefficiencies occur,
for example due to pests, low soil fertility,
unsuitable varieties or wrong timing of irrigation.
A comprehensive global overview of current
water efficiency in agriculture and along the food
chain is however lacking.
Future use
According to the OECD Environmental Outlook,
agricultural water use is projected to diminish
slightly in spite of increased production (OECD,
2012). In certain regions, however, climate
change will lead to lower or more unpredictable
rainfall, thus increasing the need for irrigation.
In addition, water use in other sectors (e.g.
manufacturing and private household use) is
projected to increase sharply due to population
growth, increasing prosperity and urbanization.
The number of people living in severely water-
stressed river basins is projected to increase
from 1.6 billion in 2000 to 3.9 billion by
2050, or over 40% of the world population of
2050 (OECD, 2012).
Climate change is expected to have a large effect
on the availability of water in many regions, by
affecting precipitation, runoff, hydrological flows,
water quality, water temperature and groundwater
recharge (HLPE, 2015). Due to reduced
precipitation or increased evapotranspiration,
droughts may intensify in some seasons and
areas (idem). Without mitigation measures, this
might lead to reduced crop productivity in certain
regions (IPCC, 2014b). Climate change will also
lead to sea level rise, which may lead to flooding
of fertile coastal regions, as well as to salinization
of freshwater resources in coastal areas.
5.3.3 Consequences of inefficient or unsustainable water useInefficient water use can have several negative
consequences, such as a more rapid depletion
of non-renewable water resources, lower
crop yields than potentially possible or lower
water availability for farmers, other users and
downstream ecosystems.
Unsustainable water use will cause depletion of
aquifers, which will mean that future generations
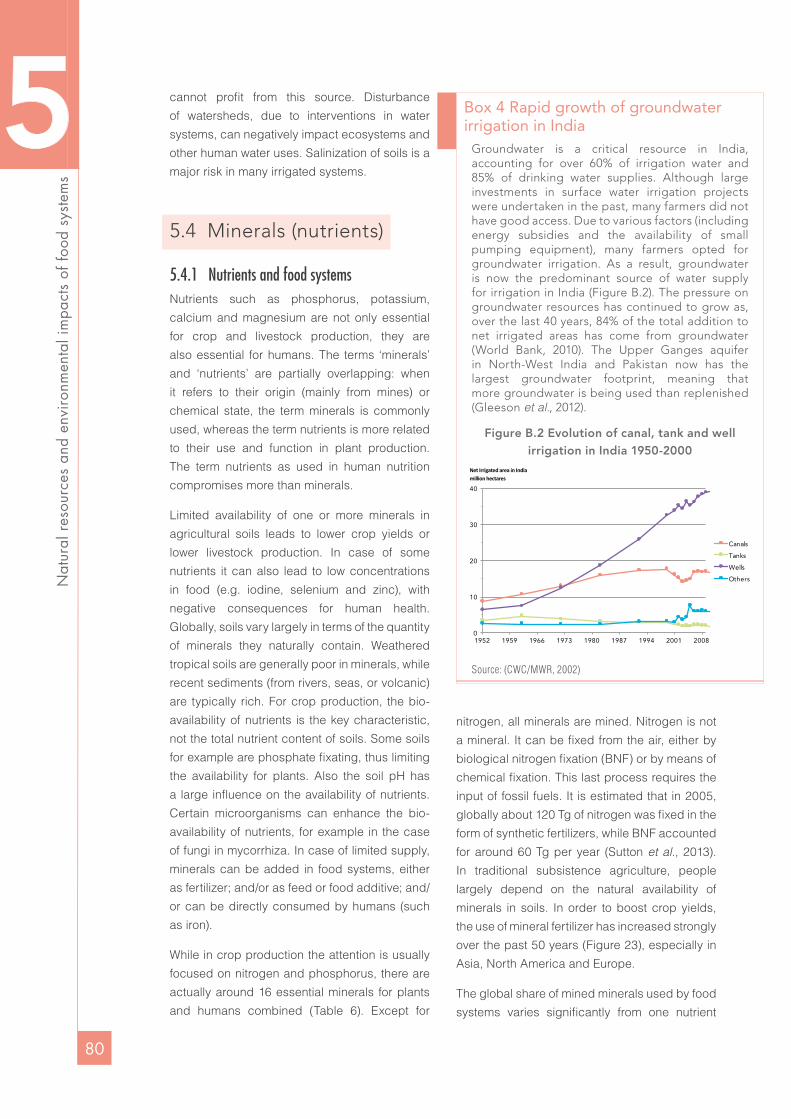
80
Nat
ural
res
ourc
es a
nd e
nviro
nmen
tal i
mpa
cts
of fo
od s
yste
ms
cannot profit from this source. Disturbance
of watersheds, due to interventions in water
systems, can negatively impact ecosystems and
other human water uses. Salinization of soils is a
major risk in many irrigated systems.
5.4 Minerals (nutrients)
5.4.1 Nutrients and food systemsNutrients such as phosphorus, potassium,
calcium and magnesium are not only essential
for crop and livestock production, they are
also essential for humans. The terms ‘minerals’
and ‘nutrients’ are partially overlapping: when
it refers to their origin (mainly from mines) or
chemical state, the term minerals is commonly
used, whereas the term nutrients is more related
to their use and function in plant production.
The term nutrients as used in human nutrition
compromises more than minerals.
Limited availability of one or more minerals in
agricultural soils leads to lower crop yields or
lower livestock production. In case of some
nutrients it can also lead to low concentrations
in food (e.g. iodine, selenium and zinc), with
negative consequences for human health.
Globally, soils vary largely in terms of the quantity
of minerals they naturally contain. Weathered
tropical soils are generally poor in minerals, while
recent sediments (from rivers, seas, or volcanic)
are typically rich. For crop production, the bio-
availability of nutrients is the key characteristic,
not the total nutrient content of soils. Some soils
for example are phosphate fixating, thus limiting
the availability for plants. Also the soil pH has
a large influence on the availability of nutrients.
Certain microorganisms can enhance the bio-
availability of nutrients, for example in the case
of fungi in mycorrhiza. In case of limited supply,
minerals can be added in food systems, either
as fertilizer; and/or as feed or food additive; and/
or can be directly consumed by humans (such
as iron).
While in crop production the attention is usually
focused on nitrogen and phosphorus, there are
actually around 16 essential minerals for plants
and humans combined (Table 6). Except for
nitrogen, all minerals are mined. Nitrogen is not
a mineral. It can be fixed from the air, either by
biological nitrogen fixation (BNF) or by means of
chemical fixation. This last process requires the
input of fossil fuels. It is estimated that in 2005,
globally about 120 Tg of nitrogen was fixed in the
form of synthetic fertilizers, while BNF accounted
for around 60 Tg per year (Sutton et al., 2013).
In traditional subsistence agriculture, people
largely depend on the natural availability of
minerals in soils. In order to boost crop yields,
the use of mineral fertilizer has increased strongly
over the past 50 years (Figure 23), especially in
Asia, North America and Europe.
The global share of mined minerals used by food
systems varies significantly from one nutrient
Box 4 Rapid growth of groundwater irrigation in India
Groundwater is a critical resource in India, accounting for over 60% of irrigation water and 85% of drinking water supplies. Although large investments in surface water irrigation projects were undertaken in the past, many farmers did not have good access. Due to various factors (including energy subsidies and the availability of small pumping equipment), many farmers opted for groundwater irrigation. As a result, groundwater is now the predominant source of water supply for irrigation in India (Figure B.2). The pressure on groundwater resources has continued to grow as, over the last 40 years, 84% of the total addition to net irrigated areas has come from groundwater (World Bank, 2010). The Upper Ganges aquifer in North-West India and Pakistan now has the largest groundwater footprint, meaning that more groundwater is being used than replenished (Gleeson et al., 2012).
Figure B.2 Evolution of canal, tank and well irrigation in India 1950-2000
0
10
20
30
40
1952 1959 1966 1973 1980 1987 1994 2001 2008
Net Irrigated area in India
Canals
Tanks
Wells
Others
million hectares
Source: (CWC/MWR, 2002)
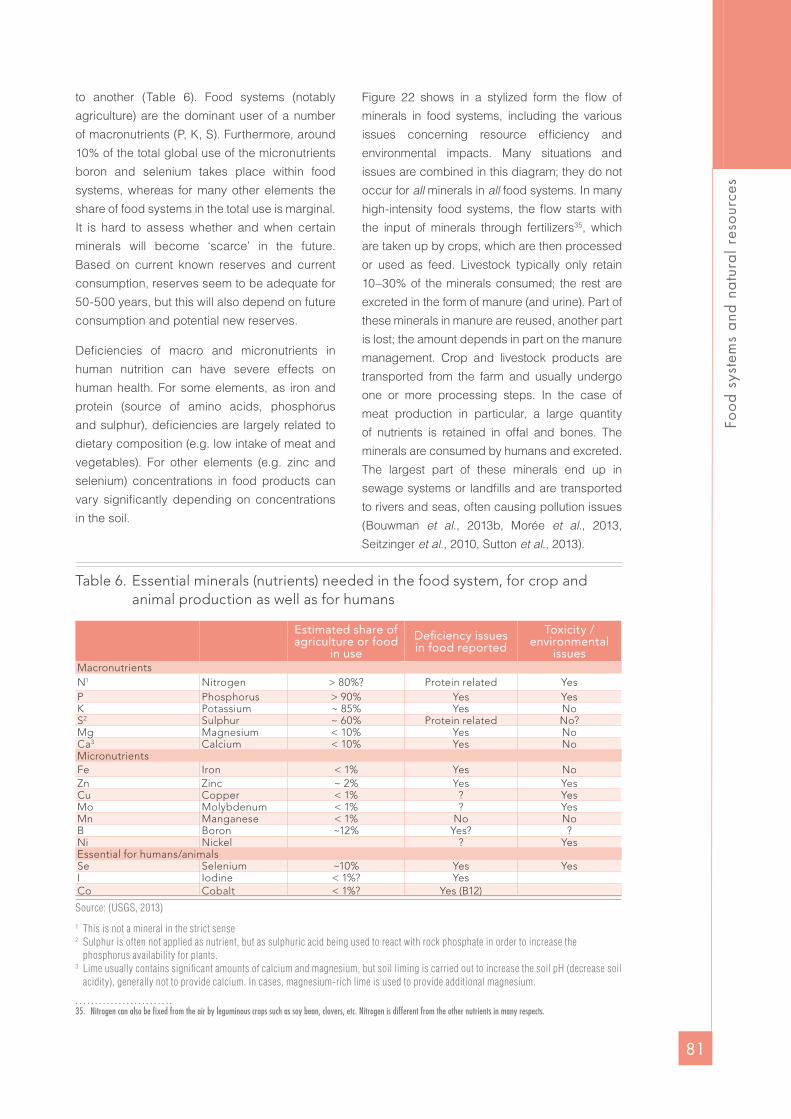
81
Food
sys
tem
s an
d na
tura
l res
ourc
es
to another (Table 6). Food systems (notably
agriculture) are the dominant user of a number
of macronutrients (P, K, S). Furthermore, around
10% of the total global use of the micronutrients
boron and selenium takes place within food
systems, whereas for many other elements the
share of food systems in the total use is marginal.
It is hard to assess whether and when certain
minerals will become ‘scarce’ in the future.
Based on current known reserves and current
consumption, reserves seem to be adequate for
50-500 years, but this will also depend on future
consumption and potential new reserves.
Deficiencies of macro and micronutrients in
human nutrition can have severe effects on
human health. For some elements, as iron and
protein (source of amino acids, phosphorus
and sulphur), deficiencies are largely related to
dietary composition (e.g. low intake of meat and
vegetables). For other elements (e.g. zinc and
selenium) concentrations in food products can
vary significantly depending on concentrations
in the soil.
Figure 22 shows in a stylized form the flow of
minerals in food systems, including the various
issues concerning resource efficiency and
environmental impacts. Many situations and
issues are combined in this diagram; they do not
occur for all minerals in all food systems. In many
high-intensity food systems, the flow starts with
the input of minerals through fertilizers35, which
are taken up by crops, which are then processed
or used as feed. Livestock typically only retain
10–30% of the minerals consumed; the rest are
excreted in the form of manure (and urine). Part of
these minerals in manure are reused, another part
is lost; the amount depends in part on the manure
management. Crop and livestock products are
transported from the farm and usually undergo
one or more processing steps. In the case of
meat production in particular, a large quantity
of nutrients is retained in offal and bones. The
minerals are consumed by humans and excreted.
The largest part of these minerals end up in
sewage systems or landfills and are transported
to rivers and seas, often causing pollution issues
(Bouwman et al., 2013b, Morée et al., 2013,
Seitzinger et al., 2010, Sutton et al., 2013).
Table 6. Essential minerals (nutrients) needed in the food system, for crop and animal production as well as for humans
Estimated share of agriculture or food
in use
Deficiency issues in food reported
Toxicity /environmental
issuesMacronutrients N1 Nitrogen > 80%? Protein related YesP Phosphorus > 90% Yes YesK Potassium ~ 85% Yes NoS2 Sulphur ~ 60% Protein related No?Mg Magnesium < 10% Yes NoCa3 Calcium < 10% Yes NoMicronutrients Fe Iron < 1% Yes NoZn Zinc ~ 2% Yes YesCu Copper < 1% ? YesMo Molybdenum < 1% ? YesMn Manganese < 1% No NoB Boron ~12% Yes? ?Ni Nickel ? YesEssential for humans/animalsSe Selenium ~10% Yes YesI Iodine < 1%? YesCo Cobalt < 1%? Yes (B12)
Source: (USGS, 2013)
1 This is not a mineral in the strict sense2 Sulphur is often not applied as nutrient, but as sulphuric acid being used to react with rock phosphate in order to increase the
phosphorus availability for plants.3 Lime usually contains significant amounts of calcium and magnesium, but soil liming is carried out to increase the soil pH (decrease soil
acidity), generally not to provide calcium. In cases, magnesium-rich lime is used to provide additional magnesium.35
35. Nitrogen can also be fixed from the air by leguminous crops such as soy bean, clovers, etc. Nitrogen is different from the other nutrients in many respects.

82
Nat
ural
res
ourc
es a
nd e
nviro
nmen
tal i
mpa
cts
of fo
od s
yste
ms
Figure 22 Nutrient flows in food systems and various impacts
Issues concerning nutrients in food systems
Rural areas Cities
Land
Due to insufficient recycling, new inputs are continuously needed; depletion of reserves
Due to overfertilization some soil get too enriched, leading to leaching or toxicity issues
Due to natural condition or constant export of minerals, other soils have low nutriet status, leading to low yields and low concentration of minerals in food
Losses of nitrogen to air (ammonia, GHG gases), leading to various environmental issues
Losses tosurface waters,coastal areas
Too low concentration of minerals in food, with negative health impacts
No proper recycling of minerals in waste and manure
Losses of minerals to surface waters, leading to environmental issues
Foodprocessing
Foodretail /
services
Humanconsumption
Fertilizers
Leaching
Feed Livestock
Food
Crop N2
fixation
Food additives;biofortification
Feed additives
Manure
Waste
Fish
O = N flows (2000-2010) per year
11
1
2
2
3
3
4
4
5
5
6
6
6
7
7
7
60
120
6 4
22
Source: Adapted from (Sutton et al., 2013)
5.4.2 Is the current and projected use of minerals efficient?As minerals are actually transferred from a
fertilizer factory, via the field to the fork, the overall
nutrient efficiency of the food chain can be
calculated (see Chapter 2). The global average
nutrient efficiency for nitrogen and phosphorus
is only around 15 - 20% (Cordell et al., 2009,
Sutton et al., 2013). This is a global average of two
contrasting, but both unsustainable, situations:
in the case of soil depletion this percentage is
higher, whereas in heavily fertilized areas this
percentage is lower. In many traditional food
systems, the soil nutrient status is already low and
the exported or lost minerals are not replenished,
leading to low crop yields. Fertilizer use in Sub-
Saharan Africa is currently very low at around
8 kg/ha (harvested area), both compared to
other regions and compared to nutrient exports
by crops. In many modern and intermediate food
systems, fertilizer input per hectare is high, with
low food chain nutrient efficiencies. For example,
in China the whole food chain efficiency was
only 9% for N and 7% for P in 2005 (Ma et al.,
2010) (see Box 5: Case study of China).
Flow of minerals from rural to urban areas
Most modern and intermediate food systems
are characterized by a linear flow of minerals
from rural areas to urban areas. Globally, an
estimated 4% of urban N and P flows were
recycled back to agriculture in 2000 (Morée et al., 2013), whereas most of the minerals ended
up in sewage systems (and finally rivers and
coastal waters) or landfills. Significant amounts
of minerals are also lost between fertilization and
human consumption, due to the over-fertilization
of crops, concentration of livestock production
in certain regions with poor reuse of minerals
in manure, and food processing. For example,
in some processes, nutrient-rich proteins are
separated from carbohydrates and only the latter
used (e.g. beer brewing and sugar production).

83
Food
sys
tem
s an
d na
tura
l res
ourc
es
Use of fertilizers is projected to increase
The issues concerning minerals are expected
to aggravate due to population increase,
urbanization (see Chapter 4, meaning larger
flows of minerals to cities) and increased livestock
production (Bouwman et al., 2009, Bouwman et al., 2013b, Neset & Cordell, 2012, Sutton et al., 2013). According to most projections,
the global fertilizer consumption will increase
(Figure 23) in order to facilitate a growing crop
production. (FAO, 2012b) estimate an increase
in total fertilizer consumption (N+P+K) from 166
million tonnes in 2006 to 263 million tonnes in
2050. Fertilizer use is especially projected to
increase in Sub-Saharan Africa, South Asia
and Latin America. Regions with currently high
fertilizer application rates (East Asia, many of the
OECD countries) are not expected to experience
an increase. The increased fertilizer use and
manure production, related to the larger livestock
production (Chapter 4) is expected to lead
to larger nitrogen and phosphorus surpluses
and thus to higher losses to the environment
(Bouwman et al., 2009).
Figure 23 Trends and projections in global consumption of nitrogen and phosphorus fertilizer
0
20
40
60
80
100
120
140
160
180
200
1960 1970 1980 1990 2000 2010 2020 2030 2040 2050
Fert
ilize
r co
nsum
pti
on
(in T
g N
and
P2 O
5 )
NitrogenPhosphorus
Source: (Sutton et al., 2013)
5.4.3 What are the consequences of an inefficient use of minerals?The current inefficient use of minerals (nutrients),
as well as nutrient deficiencies in soils, leads to
a number of serious issues:
−A low nutrient status in soils generally leads to
low crop yields. The low nutrient availability (not
only of N, P and K, but also of micronutrients)
is one of the main causes of yield gaps. Due to
an ongoing flow of minerals from rural areas to
cities, this issue is expected to aggravate.
−For some minerals (zinc, selenium), insufficient
concentrations also lead to quality deficiencies
in crops, which can lead to health problems for
animals and humans. An estimated 17.3% of the
world’s population is at risk of inadequate zinc
intake, with higher risks in Sub-Saharan Africa,
India and Indonesia (Wessells & Brown, 2012).
−The low farm-to-fork efficiency in most food
systems implies that ‘fresh’ minerals are
constantly needed as fertilizer to maintain
current levels of crop production. This leads
to a rapid depletion of current stocks of a
number of minerals (P, K, Zn and Se for
example). In the case of nitrogen, it means that
significant amounts of fossil fuels are needed to
produce fertilizer.

84
Nat
ural
res
ourc
es a
nd e
nviro
nmen
tal i
mpa
cts
of fo
od s
yste
ms
Box 5 Case study of ChinaChina currently feeds 22% of the global population using only 9% of the world’s arable land. Population increases and dietary changes are expected to result in an 80% increase of China’s demand for animal-derived food by 2030. National grain production has increased from around 100 to 500 million tonnes due to the introduction of high-productivity varieties, irrigation and the increased use of mineral fertilizers.
Ma et al. (2010) modelled annual nitrogen (N) and phosphorus (P) flows in the food chain for China’s 31 provinces. The food chain is assessed in four compartments: soil and crop production, animal production, food processing and households (human diet). Total inputs of ‘new’ N and P into the food chain in 2005 were 48.8 and 7.8 Tg, respectively (see Figure B.3 for data flows on P). Only 4.4 Tg N and 0.6 Tg P reached households as food. Total N losses to water and atmosphere almost tripled between 1980 (14.3 Tg) and 2005 (42.8 Tg). Estimated P losses to water systems increased from 0.5 Tg in 1980 to 3.0 Tg in 2005. In the whole food chain the efficiency decreased from 16% to 9% for N and from 19% to 7% for P between 1980 and 2005 (Ma et al., 2010). The main reasons for the decreasing nitrogen and phosphate use efficiencies in the food chain are (i) changes towards a diet with more animal-derived protein, (ii) over-fertilization in crop production, and (iii) the decoupling of crop and animal production, which has led to less recycling of manure nutrients.
Various promising nutrient management concepts and technologies have been developed and tested in research, especially in crop production. Adoption of these concepts and technologies in practice is however still negligible. Key actions include (1) nutrient management in the whole food chain (2) improved animal waste management, based on coupled animal production and crop production systems, and (3) much greater emphasis on technology transfer from science to practice, through education, training, demonstration and extension services.
Figure B.3 Flows of N and P in the food pyramid in China at national level in 1980 and 2005
1980 2005
Cropproduction (soil)
Animal production
Food processing
House-holds
Cropproduction (soil)
Animal production
Food processing
House-holds
Imports1,6 (100%)
P P
Source: (Ma et al., 2010)
−The low efficiencies also imply that there are
large losses of nutrients to the environment,
and an accumulation of certain minerals
(e.g. copper and zinc), leading to soil and
food quality issues. Losses of ammonia
(nitrogen) to the air lead to the disturbance
of terrestrial ecosystems. Losses of nitrogen
and phosphorus lead to the eutrophication
of surface and coastal waters, which can
lead to the large-scale disturbance of marine
ecosystems, with consequences for food
production from marine sources.

85
Food
sys
tem
s an
d na
tura
l res
ourc
es
5.5 Biodiversity and ecosystem services
5.5.1 The relevance of biodiversity and ecosystem services for food systemsBiodiversity and ecosystem services are
crucial natural resources for primary food
production in all its forms: agriculture,
aquaculture, fisheries, hunting and gathering
(Le Roux et al., 2008, MA, 2005b). The first
essential step for all food production is primary
production by plants, mainly in the form of
crops, semi-natural vegetation (grasslands)
and algae (fisheries). Agro-ecosystems are
both providers and consumers of ecosystem
services. Besides depending on biodiversity
and ecosystem services, food systems also put
major pressures on biodiversity and ecosystem
services. As a consequence, food systems
affect the functioning of ecosystem services and
biodiversity at large: it is estimated that around
60% of all global loss of terrestrial biodiversity is
related to the food sector (PBL, 2014a).
Biodiversity is generally defined as the variety and
variability of animals, plants and microorganisms
at the genetic, species and ecosystem levels.
This variety is necessary to sustain key functions
of ecosystems, their structure and processes.
Ecosystem services are defined as benefits
people obtain from ecosystems. The Millennium
Ecosystems Assessment divides ecosystem
services into four categories: provisioning
services (such as food via hunting, agriculture
or fisheries), regulating services (such as pest
control), cultural services (for example cultural,
recreational and spiritual) and supporting
services (for example nutrient recycling), which
forms the basis for the services of the other
three categories (MA, 2005b). The definition of
ecosystem services points only to the benefits,
however one should be aware that nature can
also provide disservices for crop and livestock
production, for example grazing by flocks of
geese, locust plagues or food raiding by apes
(Ango et al., 2014). As for the other resources,
the key question is whether biodiversity and
ecosystem services are currently managed
sustainably and efficiently. Genetic resources
for crop and livestock production are an
important aspect of biodiversity, which will be
treated separately (Section 5.5.5), as will marine
resources (Section 5.6).
Table 7 provides a more systematic overview of the
benefits of regulating and supporting ecosystem
services for various food system activities, as well
as the impacts of food production on terrestrial
and aquatic biodiversity. Ecosystem services are
certainly not only relevant for agriculture; they are
essential or at least important for all food system
activities.
The dependence on ecosystem services
appears to be most relevant for traditional food
systems, which to a large extent still depend on
these services for all food system activities. In
many traditional food systems, a certain portion
of food is still based on hunting and gathering,
while cooking is done with fuel wood. The
decomposition of crop and household residues
(and related nutrient recycling) is dependent on
bacteria, and agriculture still largely relies on
ecosystem services for pest and disease control.
In modern food systems, a number of these
services have been replaced by external inputs
such as pesticides, fertilizers and fossil fuels for
farm machinery and cooking. Even so, most high
external input farmers still depend on ecosystem
services such as pollination, biological pest
and disease control and the regulation of soil
structure and nutrient recycling (for example
through the decomposition of plant residues).
However, many farmers are not fully aware of
their dependency on ecosystem services.
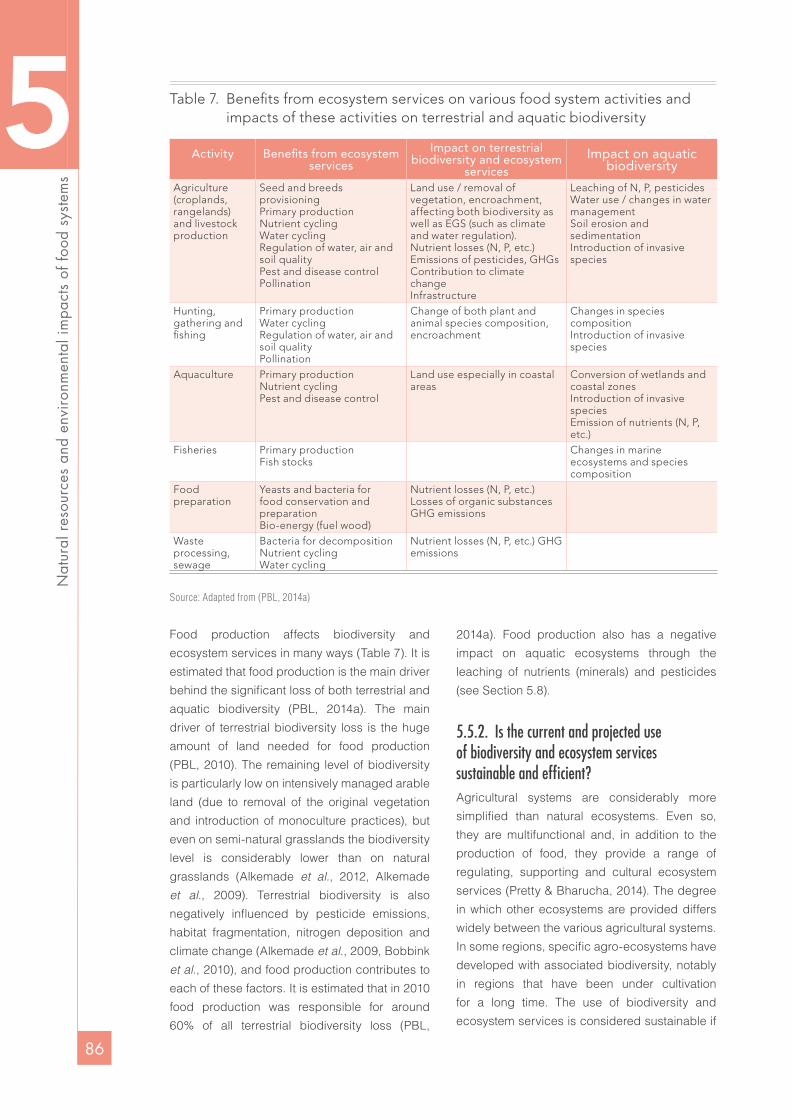
86
Nat
ural
res
ourc
es a
nd e
nviro
nmen
tal i
mpa
cts
of fo
od s
yste
ms
Table 7. Benefits from ecosystem services on various food system activities and impacts of these activities on terrestrial and aquatic biodiversity
Activity Benefits from ecosystem services
Impact on terrestrial biodiversity and ecosystem
servicesImpact on aquatic
biodiversity
Agriculture (croplands, rangelands) and livestock production
Seed and breeds provisioningPrimary productionNutrient cyclingWater cyclingRegulation of water, air and soil qualityPest and disease controlPollination
Land use / removal of vegetation, encroachment, affecting both biodiversity as well as EGS (such as climate and water regulation).Nutrient losses (N, P, etc.) Emissions of pesticides, GHGsContribution to climate changeInfrastructure
Leaching of N, P, pesticidesWater use / changes in water managementSoil erosion and sedimentationIntroduction of invasive species
Hunting, gathering and fishing
Primary productionWater cyclingRegulation of water, air and soil qualityPollination
Change of both plant and animal species composition, encroachment
Changes in species compositionIntroduction of invasive species
Aquaculture Primary productionNutrient cyclingPest and disease control
Land use especially in coastal areas
Conversion of wetlands and coastal zonesIntroduction of invasive speciesEmission of nutrients (N, P, etc.)
Fisheries Primary productionFish stocks
Changes in marine ecosystems and species composition
Food preparation
Yeasts and bacteria for food conservation and preparation Bio-energy (fuel wood)
Nutrient losses (N, P, etc.) Losses of organic substancesGHG emissions
Waste processing, sewage
Bacteria for decompositionNutrient cyclingWater cycling
Nutrient losses (N, P, etc.) GHG emissions
Source: Adapted from (PBL, 2014a)
Food production affects biodiversity and
ecosystem services in many ways (Table 7). It is
estimated that food production is the main driver
behind the significant loss of both terrestrial and
aquatic biodiversity (PBL, 2014a). The main
driver of terrestrial biodiversity loss is the huge
amount of land needed for food production
(PBL, 2010). The remaining level of biodiversity
is particularly low on intensively managed arable
land (due to removal of the original vegetation
and introduction of monoculture practices), but
even on semi-natural grasslands the biodiversity
level is considerably lower than on natural
grasslands (Alkemade et al., 2012, Alkemade et al., 2009). Terrestrial biodiversity is also
negatively influenced by pesticide emissions,
habitat fragmentation, nitrogen deposition and
climate change (Alkemade et al., 2009, Bobbink et al., 2010), and food production contributes to
each of these factors. It is estimated that in 2010
food production was responsible for around
60% of all terrestrial biodiversity loss (PBL,
2014a). Food production also has a negative
impact on aquatic ecosystems through the
leaching of nutrients (minerals) and pesticides
(see Section 5.8).
5.5.2. Is the current and projected use of biodiversity and ecosystem services sustainable and efficient?Agricultural systems are considerably more
simplified than natural ecosystems. Even so,
they are multifunctional and, in addition to the
production of food, they provide a range of
regulating, supporting and cultural ecosystem
services (Pretty & Bharucha, 2014). The degree
in which other ecosystems are provided differs
widely between the various agricultural systems.
In some regions, specific agro-ecosystems have
developed with associated biodiversity, notably
in regions that have been under cultivation
for a long time. The use of biodiversity and
ecosystem services is considered sustainable if
87
Food
sys
tem
s an
d na
tura
l res
ourc
es
the provision of ecosystem services and other
conservation values by an agro-ecosystem
equals that of a system in the same environment
and with the same level of agricultural output
that is optimally managed for ecosystem co-
benefits (Milder et al., 2012). A first attempt to
assess the potential supply of some current
and future ecosystem services globally was
made by (PBL, 2014a). Services such as pest
control, pollination, erosion protection, wild
food availability and the provisioning of water
were, not surprisingly, found to be suboptimal
and projected to decrease further, with the
largest decrease for water provisioning. Carbon
sequestration was projected to increase. As this
assessment did not take into account agricultural
productivity and there is currently no proper
global or even regional monitoring system of the
state of the various ecosystem services needed
for food production (Cumming et al., 2014), it is
not possible to determine whether the current
delivery of ecosystem services is sustainable.
However, a number of threats can be identified:
−Overexploitation of provisioning services
leading to the degradation of ecosystem
services and production capacity such as
overgrazing and fish stock depletion;
−Ongoing deforestation, drainage of wetland
and removal of landscape elements, which
will also impact certain ecosystem services
such as pest control, water regulation
and pollination;
−The (still) increasing share of monocultures,
often based on crops with a narrow
genetic base;
−Use of pesticides, antibiotics and other
biocides that might disturb current ecosystems
(including biodiversity in agricultural soils)
and therefore the functioning of ecosystem
services;
−Nutrient losses which may lead to large-scale
changes in ecosystems, notably of wetlands,
lakes and coastal seas, affecting for example
fish stocks;
−Climate change which might impact the
functioning of ecosystems and therefore
the delivery of certain ecosystem services
(IPCC, 2014b).
The pressure on biodiversity is expected to
increase due to the projected increase in food
production leading, among other things, to the
expansion of crop areas and increased nutrient
losses (PBL, 2014a).
Diversity is not only important for the proper
functioning of ecosystems, diverse diets are
also important for human health. It has been well
established that less diverse diets not only present
a risk in terms of nutritional quality due to a lack of
vitamins and micronutrients, but that they also lead
to higher risks in terms of the overconsumption of
calories (Khoury et al., 2014).
On the positive side, it can be noted that
farmers and other land managers and actors
(governments and the private sector) are starting
to realise the importance of ecosystem services
and therefore are more willing to invest in the
protection and proper management of ecosystem
services. Sometimes this results in payment
schemes for the maintenance or enhancement
of certain ecosystem services such as clean
water and landscape elements. An initiative at
global level is The Economics of Ecosystems and
Biodiversity (TEEB) which draws attention to the
economic value of biodiversity and growing costs
of biodiversity loss and ecosystem degradation.
Through various studies and country initiatives,
TEEB aims to capture the economic values and
benefits of ecosystems and biodiversity, and
points out to ways in which decision makers
could integrate their value into policies (TEEB,
2014). Data and other information to judge
whether ecosystem services are currently used
efficiently are also lacking. Potentially, farmers
could in various ways rely much more on
ecosystem services and less on external inputs
such as fossil fuel, pesticides, and irrigation
water, while simultaneously arriving at higher
yields. Examples are biological pest control,
better water infiltration and thus reduced need
for irrigation through improved soil structure,
reduced soil tillage as well as higher crop yields
through better soil structure, as well as better
pollination and water regulation at the landscape
level. In many cases, the availability of relatively
cheap external inputs (such as fossil fuels and
pesticides) has reduced the need to rely on

88
Nat
ural
res
ourc
es a
nd e
nviro
nmen
tal i
mpa
cts
of fo
od s
yste
ms
ecosystem services. In terms of knowledge and
technology, much innovation still seems possible
to enhance the efficient and sustainable use of
ecosystem services.
5.5.3 What are the consequences of inefficient and unsustainable use?There are many important consequences of
the current largely inefficient and unsustainable
use of biodiversity and ecosystem services. A
number of high-profile studies have highlighted
and underpinned the importance of biodiversity
and ecosystem services for food production,
as well as society as a whole, such as the
Millennium Ecosystem Assessment (MA, 2005b),
the TEEB approach (TEEB, 2010) and other
UNEP publications (UNEP, 2012). Without being
exhaustive, a number of essential consequences
of inefficient and unsustainable use are:
−Loss of resilience of agro-ecosystems, which
lowers the capacity of these systems to cope
with shocks such as climatic events and
certain pests and diseases, resulting in lower
crop yields;
−Lower delivery of certain ecosystem services,
such as pollination, (resulting in lower crop
yields, especially for crops supplying essential
nutrients such as vitamins A and C, folic acid
and iron (Eilers et al., 2011));and fuel wood
(leading to higher fossil fuel input);
−Higher need for certain inputs such as
pesticides and nutrients, replacing ecosystem
services;
−Lower regeneration of fish stocks, leading to
lower fish catches.
5.6 Genetic resources
Genetic resources are an important aspect of
agro-biodiversity, including aquaculture36. Over
the last century, plant and animal breeding
have been professionalized and are now largely
practiced by private companies and public
research institutes. In developing countries,
the ‘informal’ seed sector is still important.
The general aim of breeding is to increase the
production of useable products (such as eggs,
meat, milk, wool, grains, fruits and nuts), with the
desired quality (taste, nutritional composition and
storage), while minimizing the use of resources
(land, water, and nutrients) and in some cases
co-generating ecosystem services. This can
be achieved in various ways: by selecting
high-yielding plant varieties, by increasing the
tolerance to certain environmental pressures
(salinity, extreme temperature and drought), and
by increasing the resistance to viruses and fungi
or the tolerance to insect pests. High-yielding
varieties typically require optimal conditions
to produce well, and these varieties generally
perform less well under harsh conditions. For
farm animals, aspects such as high growth
rates, high productivity (or high feed conversion
rates), longevity (for dairy cows, sheep, goats
and laying hens) and behavior are important
criteria. Due to plant and animal breeding,
substantial progress has been made over the
last 50 years in terms of yields per hectare, feed
conversion, growth rates and productivity (milk,
eggs), although in some cases this has been
at the expenses of robustness (to disease and
adverse climatic conditions) and animal welfare
(Dawkins & Layton, 2012). For farmers, not only
the genetic potential of seeds is important, but
also the general quality in terms of absence
of disease, moisture content, physical purity,
genetic purity, vitality and germination.
Plant breeding started by selecting food plants
(or animals) with desired characteristics. About
100 years ago, plant breeding became based on
deliberate pollination. An important development
was the introduction of hybrid seeds, based on the
principle of heterosis. This means that a specific
cross can outperform both parents. Maize was
the first species in which heterosis was widely
used to produce hybrids. A disadvantage of
hybrid seeds for farmers is that they have to buy 36
36. Genetic resources as discussed here refer to plant and animals as directly used for agricultural production. Other genetic resources such as soil biodiversity, pollinators and pests are implicitly included in the previous section on Biodiversity and ecosystem services.

89
Food
sys
tem
s an
d na
tura
l res
ourc
es
new seeds every year. After 1950, other breeding
techniques were introduced, such as plant
tissue culture and techniques (based on certain
chemicals or radiation) to generate mutants.
A relatively new technique is marker-assisted
selection, which is used for quick selection on
certain properties. Genetic engineering (also
called genetic modification) is another recent,
but contested technique (see Box 6 Genetically-
modified crops).
The above-mentioned progress in performance
has created some risks: in plants, but perhaps
even more relevant for animals, the trend towards
genetic uniformity has narrowed the genetic base
and hence the susceptibility to certain diseases
or pests and the ability to perform under diverse
conditions. (FAO, 2015c) report that ‘traditional
production systems that harbor diverse genetic
resources have been marginalized and a narrow
range of international transboundary breeds
have become more widely used’.
Animal welfare is in some cases affected, for
example in the case of high growth rates in
broilers. In certain regions, imported seeds
and breeds have replaced local varieties,
thus reducing agro-biodiversity, but often also
reducing the resilience as local breeds are
generally better adapted to local conditions. In
traditional food systems, farmers still largely use
seeds from the informal sector, while in ‘modern’
food systems most seeds are provided by
commercial firms.
The efforts of private actors concentrate on
the improvement of commercially interesting
crops often in combination with certain agro-
ecological zones. The improvement of ‘orphan’
crops is often neglected, while these crops
play an important role in regional food security.
Examples are millet, many tubers (as yams)
and local vegetables. This issue is addressed
in the form of plant and animal breeding
programs of public research institutes, such
as the Consultative Group for International
Agricultural Research (CGIAR) institutes and
many national research institutes, as well as by
specific initiatives such as the African Orphan
Crops Consortium (AOCC). In many regions,
a combination of formal and informal seed
systems are important, as for example in Sub-
Saharan Africa.
5.7 Marine and inland aquatic resources
5.7.1 Marine resources and food systemsThe two principle ways in which food systems rely
on marine and inland water resources are through
capture fisheries and aquaculture. In 2010, these
two sectors jointly accounted for 16.7% of global
animal protein consumption, with 60% of the
population acquiring over 15% of their protein
intake from fish (FAO, 2014c, PBL, 2014a). Fish
and seafood products account for 10% of global
food-related trade, with an expected growth
in demand for the coming decades (Garcia &
Rosenberg, 2010). Of the total fishery production
of around 160 million tonnes, 50% stems from
marine fisheries and 7% from inland fisheries.
Inland aquaculture provides another 27%, and
marine aquaculture another 16% (see Box 3 on
aquaculture). Fisheries, aquaculture and related
industries are an important source of income:
an estimated 660 to 820 million people (workers
and their families) totally or partly depend on it
(HLPE, 2014b).
Marine fisheries systems are highly
heterogeneous, with large variations in gear,
capacity, marine system targeted (e.g. pelagic
versus demersal fisheries) and value chain in
which they are embedded. Fisheries range from
traditional, low-capacity, subsistence-based
systems that operate on an exclusively local
scale to fully industrialized fisheries that operate
within a long and complex value network that
covers large geographical distances. In some
cases, these different systems compete with
each other for resources. The annual contribution
to the global economy of activities directly and
indirectly related to capture fisheries is estimated
at USD 380 billion (Dyck & Sumaila, 2009). The
90
Nat
ural
res
ourc
es a
nd e
nviro
nmen
tal i
mpa
cts
of fo
od s
yste
ms
marine fisheries sector currently supports 260
million jobs worldwide (Teh & Sumaila, 2013).
In contrast to global capture fisheries, which are
stagnating (possibly due to unsustainable use,
see below), the aquaculture sector is growing
rapidly. With an average annual growth rate of
8.6% between 1980 and 2010, this is the fastest-
growing food production sector (FAO, 2014c,
PBL, 2014a). Most of the aquaculture sector is
land-based. This section focuses exclusively on
marine aquaculture.
5.7.2 Are marine resources used efficiently and sustainably?Studies reveal that global fishing capacity has
increased by an estimated ten-fold since the
1950s (Watson et al., 2013), amongst others
due to the introduction of super trawlers. Apart
from the increase in fishing power, global fishing
fleets have also expanded their reach. The
development of industrial-scale diesel powered
vessels with sophisticated locating equipment
and refrigeration has enabled increasingly
longer trips (Swartz et al., 2010).
In spite of the increased fishing power and
expansion of global fishing grounds, the average
catch per unit of effort (expressed in terms of
engine power) has decreased to half of what it
was 50 years ago (Watson et al., 2013). Globally,
marine capture fisheries production has been
stagnating since the late 1980s (Pauly et al., 2005). This suggests that the increased fishing
pressure has led to an increasing decline in
fish abundance and a resulting decrease of the
energy efficiency of the global fishing effort.
This finding is corroborated by the fact that, in
2011, 29% of the ‘commercial’ fish populations
were estimated to be overexploited; a proportion
which has been increasing since the 1970s,
although the percentage dropped from 32.5%
in 2008 (Figure 24). Another 61% of these
populations are fully fished.
With a global demand for fish that is expected
to increase from 140 million tonnes in 2004 to
227 million tonnes in 2050 under a business-as-
usual scenario, capture fisheries will not be able
to meet the future demand (PBL, 2010).
Box 6 Genetically-modified (GM) crops New techniques (‘biotechnology’) have been developed over recent decades to improve genetic characteristics of crops and animals. These supplement traditional methods of crop and animal breeding. The application of genetically modified (GM) crops, a particular type of biotechnology, is controversial, with strong advocates both for and against it (see for example (Mannion & Morse, 2012)).
GM varieties with pest management traits (Bt traits) and herbicide tolerance (HT, sometimes called Roundup Ready) became commercially available for crops such as soy, corn and cotton from 1996 onwards (Fernandez-Cornejo et al., 2014). Globally, around 170 million hectares (around 15% of the total global cropland area) were planted with GM crops in 2012 – mainly maize, cotton, soybean and rapeseed (Fernandez-Cornejo et al., 2014). In some countries, the share of GM crops is more than 90% for crops such as soy, maize and cotton (as in the USA). In the USA more than half of the cropland area is planted with GM crops. In other regions (especially the EU) GM crops are hardly grown. This difference is mainly due to differences in legislation, as well as in the public acceptance of GM crops.
Advocates of the use and development of GM-crops point at current advantages such as higher crop yields (e.g. herbicide-tolerant crops), and savings in labor and agrochemicals (e.g. crops with Bt traits). They also point at potential new applications, such as drought tolerant crops, and crops that are resistant to certain diseases (Whitty et al., 2013). Opponents of GM crops point to potential side effects on human health (e.g. possible allergies), ecological damage (due to the spread of GM genes to organic crops and wild relatives), the development of herbicide-resistant weeds, and the over-use of herbicides, impacting groundwater quality. Beside these biophysical reasons, critical questions are raised whether smallholder farmers would benefit from GM-crops (Azadi et al., 2015, Jacobsen et al., 2013). Opponents also state that the development of GM crops is done by a small number of companies, who make large profits on GM crops.
While GM crops are already widely used, some scientists doubt however whether they will really have improved stress tolerance (for example drought tolerance) or faster growth rates (e.g. improved photosynthetic efficiency) for two main reasons: first of all, natural selection has already tested more options than humans ever will. It is unlikely that ‘nature will have missed simple, trade-off-free options’ (Denison, 2012). Connected to this is the second argument: it is likely that the required modifications are highly complex, whereas in the current GM crops only one trait has been added.
While laying out some arguments for and against GM, this report takes a neutral position in the debate.
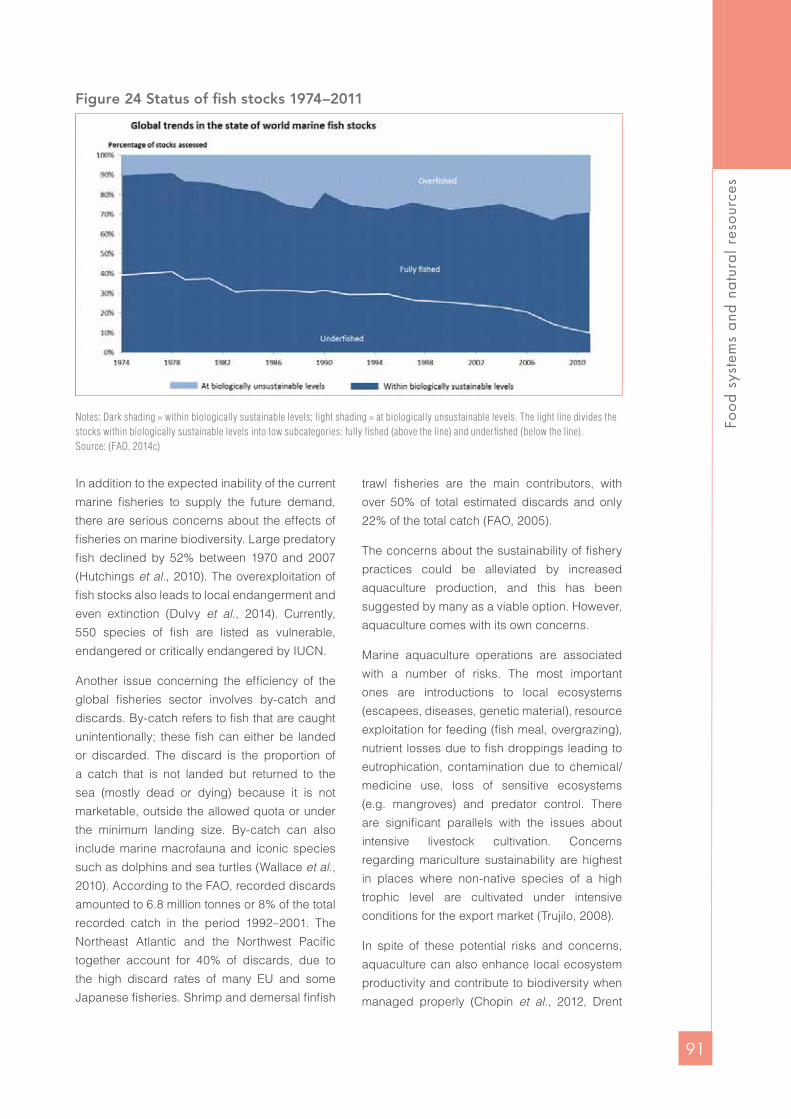
91
Food
sys
tem
s an
d na
tura
l res
ourc
es
Figure 24 Status of fish stocks 1974–2011
Notes: Dark shading = within biologically sustainable levels; light shading = at biologically unsustainable levels. The light line divides the stocks within biologically sustainable levels into tow subcategories: fully fished (above the line) and underfished (below the line).Source: (FAO, 2014c)
In addition to the expected inability of the current
marine fisheries to supply the future demand,
there are serious concerns about the effects of
fisheries on marine biodiversity. Large predatory
fish declined by 52% between 1970 and 2007
(Hutchings et al., 2010). The overexploitation of
fish stocks also leads to local endangerment and
even extinction (Dulvy et al., 2014). Currently,
550 species of fish are listed as vulnerable,
endangered or critically endangered by IUCN.
Another issue concerning the efficiency of the
global fisheries sector involves by-catch and
discards. By-catch refers to fish that are caught
unintentionally; these fish can either be landed
or discarded. The discard is the proportion of
a catch that is not landed but returned to the
sea (mostly dead or dying) because it is not
marketable, outside the allowed quota or under
the minimum landing size. By-catch can also
include marine macrofauna and iconic species
such as dolphins and sea turtles (Wallace et al., 2010). According to the FAO, recorded discards
amounted to 6.8 million tonnes or 8% of the total
recorded catch in the period 1992–2001. The
Northeast Atlantic and the Northwest Pacific
together account for 40% of discards, due to
the high discard rates of many EU and some
Japanese fisheries. Shrimp and demersal finfish
trawl fisheries are the main contributors, with
over 50% of total estimated discards and only
22% of the total catch (FAO, 2005).
The concerns about the sustainability of fishery
practices could be alleviated by increased
aquaculture production, and this has been
suggested by many as a viable option. However,
aquaculture comes with its own concerns.
Marine aquaculture operations are associated
with a number of risks. The most important
ones are introductions to local ecosystems
(escapees, diseases, genetic material), resource
exploitation for feeding (fish meal, overgrazing),
nutrient losses due to fish droppings leading to
eutrophication, contamination due to chemical/
medicine use, loss of sensitive ecosystems
(e.g. mangroves) and predator control. There
are significant parallels with the issues about
intensive livestock cultivation. Concerns
regarding mariculture sustainability are highest
in places where non-native species of a high
trophic level are cultivated under intensive
conditions for the export market (Trujilo, 2008).
In spite of these potential risks and concerns,
aquaculture can also enhance local ecosystem
productivity and contribute to biodiversity when
managed properly (Chopin et al., 2012, Drent

92
Nat
ural
res
ourc
es a
nd e
nviro
nmen
tal i
mpa
cts
of fo
od s
yste
ms
& Dekker, 2013, Saier, 2002). Together with
the potential alleviation of the pressure on wild
fisheries, this makes aquaculture a viable option
for the sustainable use of marine resources.
5.7.3 What are the consequences of the inefficient and unsustainable use of marine resources?The global decline of fish stocks is thought
to have far-ranging negative impacts on the
regulation of food web dynamics (Holmlund &
Hammer, 1999, Jackson et al., 2001, Pauly et al., 1998). The removal of top predators can lead to a
trophic cascade resulting in dramatic changes in
species composition, in other words an increase
in small pelagic fish and crustaceans resulting
in a decrease in herbivorous zooplankton with a
possibility of harmful phytoplankton blooms as
a consequence.
Many demersal fisheries also directly damage
coastal ecosystems. Bottom trawling is thought
to have detrimental effects on some benthic
habitats, although these effects are highly
variable and dependent on the ecosystem
type (Burke et al., 2011, Waycott et al., 2009).
Furthermore, dynamite and poison fishing
threaten an estimated 55% of coral reefs
worldwide (Burke et al., 2011).
The increasing fossil fuel requirements of
fisheries due to the fishing efforts being located
progressively further away from coastal areas
causes concerns regarding greenhouse gas
emissions and the sustainable use of resources
other than the marine resources themselves.
A general shift to fossil fuel intensive methods
such as deep sea fishing and bottom trawling
aggravates this concern. These effects could
backfire on the availability of marine resources,
as their supply is thought to be highly sensitive
to increased emissions and the effects of global
climate change (PBL, 2014a).
Many OECD and other countries have indirect
fuel subsidies (mainly in the form of fuel tax
concessions). The estimated total value of fuel
tax concessions for OECD countries was in 2008
USD 2 billion (Martini, 2008). Fuel tax exemptions
reduce the relative cost of fuel and thus will not
encourage fishers to use less of it (OECD, 2005).
This might have negative implications for marine
resources and carbon dioxide emissions.
5.8 Fossil fuels
The use of fossil fuels in food systems is very
diverse: from no or very limited use in traditional
food systems, to use in all food system activities
in modern food systems. Fossil fuel is a non-
essential input for food production: humankind
has survived for thousands of years without
the use of fossil fuel. The use of fossil fuel in
the primary production stage in particular has
led to a vast reduction in human labor and
caused an enormous rise in labor productivity.
Notably ploughing, threshing and milling used
to be very labor-demanding activities, and still
are in many developing countries. Mainly due
to the mechanization of these activities, labor
productivity in agriculture and the production of
basic food products (such as bread and milk)
has increased by a factor of 100.
It is estimated that the food sector currently
accounts for around 30% of the world’s total
end-use energy consumption, of which more
than 70% is used beyond the farm gate (FAO,
2011a). Excluding human and animal power,
the on-farm direct energy demand is around 6
EJ/yr. This energy is used for purposes such
as pumping water, cultivating and harvesting
crops, heating protected crops, and storage.
Indirect energy demands total around 4 EJ/
yr, while the synthesis of nitrogenous fertilizers
consumes approximately 5% of the annual
natural gas demand (around 5 EJ/yr). Fisheries
consume around 2 EJ/yr. These figures illustrate
how heavily dependent agriculture and fisheries
currently are on the energy sector. Still, the
largest part of fossil fuel use is in other food
system activities, notably for the transport,
cooling, processing and preparation of food.
93
Food
sys
tem
s an
d na
tura
l res
ourc
es
5.9 Environmental impacts
The various food system activities have a large
impact on the environment (Section 2.6), many
of which are intrinsically related to the use of
natural resources in food systems (see Figure 2).
Major environmental impacts include:
− Impacts on terrestrial and aquatic biodiversity,
mainly due to changes in land use and
ecosystems (see Section 5.5 above), as well as
impacts on air, soil and water quality.
− Impacts on water, air and soil quality, mainly
related to nutrient losses and emissions of
pesticides and other agents (antibiotics,
residues of veterinary medicines).
−Greenhouse gas emissions contributing to
climate change.
The environmental impacts usually have a
feedback on both the renewable resources
needed for food production and on resources
needed outside the food system. An example of
the first is the impact of food system activities
on water quality, making water less suitable for
irrigation purposes. An example of the latter is
the effect of pollution from agricultural sources
on drinking water quality. The feedbacks are
sometimes very local with a short timeframe (for
example water contamination), whereas in other
cases the feedbacks are via global systems with
a time horizon of decades (e.g. GHG emissions
leading to climate change).
5.9.1 Water qualityWater quality is affected in many ways by food
system activities, and in the form of various
pollutants: nutrients, heavy metals, pesticides,
hormones, plant growth regulators, medicine
residues, bacteriological contamination and
organic compounds (from food processing and
food wastes). Some issues can be primarily
local, such as pollution in the form of organic
compounds (such as food waste, or effluents
from food processing plants), which can lead
to dead rivers or lakes due a high biological
oxygen demand. Other forms of pollution have
an effect at a continental scale (e.g. nutrient
losses), or even global scale (e.g. residues
of persistent pesticides like DDT). In many
developing countries (e.g. India), pesticide
residues in drinking water have become a major
challenge (Van Drecht et al., 2009). Continuous
consumption of contaminated water leads to
severe health risks.
Nutrient losses (especially of nitrogen and
phosphorus) are already leading to major
environmental problems around the world
(Seitzinger et al., 2010, Sutton et al., 2013). The
main pathway is to diffuse water pollution through
the leaching of nitrogen and phosphorus from
agricultural soils to groundwater and surface
waters. In some regions, wind or water erosion
is also an important pathway, especially for
phosphorus, when nutrient-rich topsoil particles
are blown or washed away. Nutrient losses cause
various problems, including excessive nitrate
concentrations in drinking water (impacting
human health) and the eutrophication of lakes
and coastal waters (Sutton et al., 2013). This
eutrophication can lead to dead zones, hypoxia,
fish kills and algal blooms, which might lower
marine production (Heisler et al., 2008). In some
cases, however, moderate increases of nitrogen
and phosphorus in coastal waters can increase
marine production, although they often affect
species composition. Other pathways of nutrient
losses are losses in the form of waste water
from the food processing industry and sewage.
It is estimated that the annual global N and P
emissions from sewage could increase from
6.4 Tg N in 2000 to 12-16 Tg N in 2050, and for
phosphorus from 1.3 Tg P to 2.4-3.1 Tg P (Van
Drecht et al., 2009).
Due to increased fertilization, livestock
production, aquaculture production and
urbanization, emissions of nitrogen and
phosphorus to groundwater and surface waters
are expected to increase in the coming decades.
One of the driving forces is the increase in positive
soil N and P budgets due to over-fertilization and
concentrated applications of manure (Bouwman et al., 2013b). In combination with higher
emissions from urban areas, the total load of N
and P to surface waters is projected to expand,
which will aggravate the environmental problems
described above (Seitzinger et al., 2010).
94
Nat
ural
res
ourc
es a
nd e
nviro
nmen
tal i
mpa
cts
of fo
od s
yste
ms
5.9.2 Soil qualityAgricultural soils can become polluted by food
system activities, but also by other human
activities. Risks within food systems include
the use of pesticides, fertilizers and manures.
Phosphate fertilizers in particular can be
contaminated with cadmium and other heavy
metals. Animal manure sometimes contains
relatively high concentrations of copper and
zinc, which are used as nutrients and sometimes
as growth promoters in livestock production.
Contaminants from outside the food systems
are for example those related to emissions
from industry such as heavy metals, persistent
organic pollutants or acidifying components
such as sulphur dioxide and Nitrogen Oxide
(NOx). These contaminants can make large
areas unsuitable for agricultural production;
either because crop production is directly
affected, or because the food being produced
is contaminated. As mentioned earlier, the
contamination of certain flows (such as manure
or crop residues) can also hamper the options
for recycling.
As most contamination is related to local sources,
there is hardly any global data available on the
present extent of contaminated soils. A major
consequence of most forms of soil contamination
is that once a soil is contaminated, the soil will
remain contaminated for hundreds or thousands
of years. Remediation (the removal of pollution or
contaminants) is often very expensive and typically
costs much more than the cost of prevention.
5.9.3 Air qualityIn the case of air quality too, food system activities
are both a source and a victim. Major sources from
food system activities are: ammonia emissions
(from manure and fertilizers), pesticides and
black carbon (related to the combustion of fossil
fuels and biomass, including crop residues).
Air pollution from non-agricultural sources can
lead to soil contamination (as described above).
Ammonia emissions and consequent deposition
can lead to ecological damage. Atmospheric
nitrogen deposition exceeds 5 kg per ha per
year across half of the ‘global biodiversity
hotspots’ and G200 ecoregions (Bleeker et al., 2011). Certainly not all of this nitrogen deposition
is related to agricultural sources; in many regions
the combustion of fossil fuels is a major source
of NOx.
Burning of crop plant residues (e.g. wheat and
rice straw) after harvesting also leads to air
pollution. Indoor air pollution from inefficient
stoves using traditional fuels is estimated to
cause almost two million premature deaths, per
year. Approximately a million of these deaths
are caused by lower respiratory infections or
pneumonia in children. The other million deaths
mainly concern elderly, due to chronic lung
disease and lung cancer (WHO; UNDP, 2009).
5.9.4 Greenhouse gas emissionsGreenhouse gas emissions occur during all
food system activities, mainly in the form of CO2
(from sources such as fossil fuels, land use
and deforestation), CH4 (enteric fermentation,
manure management and rice cultivation), and
N2O (mainly from manure and fertilizers). Table 8
shows the main sources of GHG emissions from
the food sector for the year 2010, mainly based
on (FAO, 2014a) and (Vermeulen et al., 2012).
It also includes an indication of probable range,
as a number of sources are either difficult to
measure, especially non-CO2 emissions (IPCC,
2014a), or because the share of agriculture in
the source is uncertain (as for example in case
of deforestation). Much of the data on GHG
emissions available is specified according the
IPCC/UNFCCC categories. According to the
IPCC/UNFCCC methodology, food system-
related emissions are distributed over the
categories Energy (i.e. transport and cooling),
Industrial Processes (i.e. fertilizer and cement
manufacturing), Agriculture, Land Use, Land Use Change and Forestry (LULUCF) and Waste.
In some cases (i.e. deforestation) it is difficult
to judge within one category (e.g. LULUCF)
whether emissions are attributed to food
production, timber production or other activities.
Total GHG emissions from the food sector are
estimated to be 10.6 – 14.3 gigatonnes CO2-
eq in 2010, being around 24% (21-28%) of total
anthropogenic GHG in that year.

95
Food
sys
tem
s an
d na
tura
l res
ourc
es
Of all food system activities, agricultural production
(including indirect emissions associated with land-
cover change) still contributes to approximately
80% of total emissions. In industrialized and
urbanized regions, the share of agriculture in total
food systems emissions is lower, due to larger
GHG emissions from other food system activities
(Vermeulen et al., 2012).
Table 8 demonstrates that deforestation is the
dominant source (22% of food system related
emissions), followed by CH4 emissions (17%)
from enteric fermentation (mainly from cows,
sheep and goats). N2O emissions from manure
and synthetic fertilizers are also a substantial
source, particularly as the global warming
potential of N2O is about 300 times that of CO2.
Other sources are N2O from cultivated soils and
CH4 from rice cultivation. Globally, around two
thirds of the GHG emissions from agriculture
(including land-use changes) can be attributed
to livestock production. According to the FAO,
the global livestock sector was responsible for 7.1
gigatonnes CO2-eq per year in 2005, being equal
to 14.5% of total human-induced GHG emissions;
beef accounts for 41% of the emissions from the
livestock sector and milk production for 20%
(Gerber et al., 2013).
Total emissions from the ‘Agriculture, Forestry and
Other Land Use’ (AFOLU) sector have decreased
when comparing 2000–2009 to 1990–1999,
mainly as a result of lower emissions from land-
use change and forestry. Agricultural emissions
from crop and livestock production grew from 4.7
gigatonnes CO2-eq in 2001 to over 5.3 gigatonnes
in 2011, with the increase occurred mainly in
developing countries due to an expansion of total
agricultural outputs (FAO, 2014a).
The largest sources of emissions for post-farm
gate food system activities are refrigeration,
followed by transport and packaging. It is
estimated that 15% of the electricity consumed
worldwide is for refrigeration (Vermeulen et al., 2012). In retailing, refrigerant leakage from fridges
and freezers accounts for a significant proportion
of supermarkets’ direct GHG emissions, while the
preparation of food also contributes significantly
to GHG emissions.
Future GHG emissions from agriculture may
further increase by up to 30% by 2050 if no further
mitigation measures and technical efficiency
improvements are implemented (FAO, 2014a).
5.10 Food categories, resource use and human health
Human diets vary largely across the globe (see
Section 3), based on aspects such as food
availability, food prices, culture, and personal
preferences. Differences in diet may lead to large
differences in resource use and environmental
impacts as some food categories are less
resource-efficient or lead to more environmental
impacts than others. One of the main distinctions
is between animal- and plant-based products
(Garnett, 2011, PBL, 2011, Tilman & Clark,
2014, Westhoek et al., 2014). This difference
is mainly due to the fact that animals consume
more energy and protein than is embedded
in the final products (meat, eggs and dairy).
This is because part of the energy, proteins
and minerals in feed are used for the animals’
metabolism and another part ends up in inedible
parts such as bones. In modern livestock
production, feeds are used that would also be
suitable for human consumption (e.g. cereals
and soy beans); therefore it would be more
efficient if humans were to eat this food directly.
This is different in traditional livestock systems
such as pastoralism, in which plant materials
that are not suitable for human consumption are
converted into edible products such as meat and
dairy. In the past, most of the confined animals
were mainly reared on by-products, and food
losses and waste. Currently, large quantities of
cereals and oil meals are being used as feed for
confined animals.
However, it is not easy to compare individual
products:
−Some production systems produce more
than one product: for example dairy systems

96
Nat
ural
res
ourc
es a
nd e
nviro
nmen
tal i
mpa
cts
of fo
od s
yste
ms
Table 8. Estimates of GHG emissions (in or around the year 2010) of sources within the food system (Mt CO2-eq/yr)
Total global emissions Source 2010
Energy use on farm 785 FAO, 2014aEnteric fermentation 2071 FAO, 2014aManure management 362 FAO, 2014aRice cultivation 522 FAO, 2014aAgricultural soils
Synthetic fertilizer 725 FAO, 2014a Manure applied to soils 185 FAO, 2014a Manure left on pasture 824 FAO, 2014a Crops residues 197 FAO, 2014a Cultivation organic soils 133 FAO, 2014a
Savanna burning 287 FAO, 2014aBurning crop residues 29 FAO, 2014a
Total direct agricultureUncertainty range1
61205485 – 7470
Forestry and land use related emissionsNet forest conversion3 1850 - 3365 FAO, 2014a Cropland 756 FAO, 2014a Grassland 26 FAO, 2014a Burning biomass 290 FAO, 2014a
Inputs production Fertilizer manufacturing 611 2007; IFA, 2009 2
Energy use animal feed production 60 2007; Vermeulen 2012 Pesticide production 3–140 2007; Vermeulen 2012
Post-farmgate food system activities Primary and secondary processing 192 2007; Vermeulen 2012 Storage, packaging and transport 396 2007; Vermeulen 2012 Refrigeration 490 2007; Vermeulen 2012 Retail activities 224 2007; Vermeulen 2012 Catering and domestic food 160 2007; Vermeulen 2012 Waste disposal 72 2007; Vermeulen 2012
Total 10,640 – 14,250
1 These figures include an estimation of uncertainties, notably in the source agricultural soils, based on (FAO, 2014a, IPCC, 2014a) 2 Based on (IFA, 2009) which estimates a share of 1.2% of fertilizer production in total energy consumption, increased with estimated N2O
emissions from nitric acid production3 Attribution based on an estimated share of 50-90% of agriculture in deforestation related emissions
produce meat and dairy. Dairy is a complex
product, consisting of fats, proteins and lactose;
a diet in which only fat-free milk products are
consumed is therefore inconsistent with the
natural production system, through which
proteins and fats are inherently coupled.
−Food products are very diverse: some hardly
provide any nutritional value (water, coffee,
tea), some only provide energy and no nutrients
(sugar, oil), and others provide a whole range
of nutrients, such as vegetables, meat and
fish. The difficult question is what should be
the basis of comparison: per kg product, per
unit of energy (kcal), or per unit protein? Some
food products also contain components that
might have negative health consequences
when consumed in excessive quantities (such
as salt and saturated fats).
−Even within one product (for example beef, milk
or French beans), there are large differences
in environmental impacts, depending on
factors such as production system, season
and transport distances.
−Food products typically require a large range
of natural resources (land, water, minerals,
etc.) and have a large range of environmental
impacts. To use only the greenhouse gas
footprint of different products would be an
oversimplification. This is less so when the
high greenhouse gas emissions are due to the
use of fossil fuel (mainly related to transport,
cooling and heating).
−Resource use is in some cases difficult to
compare, for example land use (crops, meat)
versus marine resources (wild fish).

97
Food
sys
tem
s an
d na
tura
l res
ourc
es
Over the last ten years, a large number of studies
have been carried out that either compare
various food products (especially with regard
to GHG emissions and land use) or complete
diets (Stehfest et al., 2009, Tilman & Clark, 2014,
Tukker et al., 2011, Westhoek et al., 2014). These
studies unanimously conclude that livestock
products lead to higher GHG emissions than
plant-based equivalents. The same is true for
studies on dietary shifts from typical high-meat,
Western-type diets to diets with lower quantities
of meat, dairy and eggs.
Figure 25 demonstrates the differences in
resource use and environmental pressure
expressed as land area and greenhouse gas
emissions per kg of protein, based on a review
of a large number of LCA studies. Land area
is the highest for beef, although it should be
noted that extensive beef in particular is fed
on semi-natural grasslands. Poultry meat, milk
and eggs require on average about two to three
times more land per unit than vegetable types
of protein, and pig meat even requires a factor
of five more land. Similar differences have been
found between the various protein sources and
nitrogen emissions (Leip et al., 2014).
Figure 25 Land use (left) and greenhouse gas emissions (right) per kilogram of protein
Beef and veal extensiveBeef and veal intensive
Beef and dairy cowsPig meat
Poultry meatMilk
EggsFish from aquaculture
Vegetal proteinOther meat substitutes
0 50 100 150 200 250m2 per kg protein
Literature data point
Range
Fish from aquaculture: only land use for vegetal component of fish feedOther meat substitutes: enriched with egg or milk proteins
Land use per protein source
2100 Beef and veal extensive
Beef and veal intensive
Beef and dairy cows
Pig meat
Poultry meat
Sheep meat
Milk
Eggs
Fish from aquaculture
Other fish and shellfish
Vegetal protein
Other meat substitutes
0 50 100 150 200 250kg CO2eq per kg protein
Literature data point
Range
Other meat substitutes: enriched with egg or milk proteins
Greenhouse gas emissions per protein source
640
750
540
Source: (Nijdam et al., 2012)

98
Nat
ural
res
ourc
es a
nd e
nviro
nmen
tal i
mpa
cts
of fo
od s
yste
ms
Table 9. Status of natural resources as needed for food system activities
Resource Issues regarding sustainable use Issues regarding efficiency Renewable resourcesLand, landscape, soils Around 33% of soils is moderately to
highly degraded In large regions: low crop yields
Water Depletion and pollution of aquifers; disturbance of watersheds, eutrophication
In many regions inefficient or ineffective use of both rainwater and irrigation water
Biodiversity and ecosystem services
Loss of terrestrial and aquatic biodiversity and ecosystem services
Ecosystem services are often not used effectively
Including: Genetic resources Narrowing of genetic baseMarine resources Around 29% of fish stocks overfished Large quantities of by-catch; low yields due
to overexploitationNon-renewable resourcesNutrients (minerals) - Low efficiency over food chain (15–20%)Fossil fuels - Around 30% of all fossil fuel use related to
food systems
5.11 Summary and Conclusions
Natural resources such as land and soils,
fresh water, biodiversity (including genetic
resources), marine resources (including fish
stocks) and minerals are in many cases not
managed sustainably or efficiently (Table 9).
This creates risks for future food production,
and simultaneously leads to considerable
environmental impacts outside the food
system: About 24% of all anthropogenic global
greenhouse gas emissions are related to food
systems. Main sources are direct and indirect
emissions resulting from animal husbandry, the
application of manure and fertilizers, rice fields,
deforestation, the use of peatlands and the use
of fossil fuels for farm activities and fertilizer
production. In modern food systems, fossil fuel
use for processing, transporting and cooling
food is a major source as well. Water quality is
in certain regions strongly affected by nutrient
losses, leading to eutrophication of fresh water
and coastal areas. Pesticides, organic food
wastes and residues from antibiotics also impact
water quality. Food system activities also affect
soil quality, directly or indirectly.
Due to a combination of factors, the pressure
on natural resources is expected to increase
over the coming decades. Main factors are the
increase in population (mainly in Asia and Africa),
increased wealth combined with urbanization
(leading to dietary shifts) and climate change.
For example, due to the increased food demand,
the cropland area is projected to grow by 2050,
mainly at the expense of ecologically vulnerable
areas such as savannahs and forests.


Chapter
6
Cre
dit:
DO
NO
T6_S
TUD
IO, S
hutt
erst
ock.
com
Understanding food systems in context:
actors, behaviors and institutions

101
Food
sys
tems
and na
tura
l res
ourc
es
6.1 Introduction
This chapter explores the actors, behaviors and
institutions that together shape current food
systems. This context is useful when considering
options towards environmentally-sustainable
food systems as discussed in Chapters 7 (on
biophysical options) and Chapter 8 (on socio-
economic options). The identification of options
which are likely to be adopted and successful
requires an understanding of the context in which
food system actors operate. It should be stressed,
however, that understanding the role of actors
and institutions in food systems requires specific
diagnostics at the country, region or landscape
level (Lieshout van et al., 2010, North, 1990).
The variety of institutional arrangements (such
as national legislation) and the status of natural
resources in different types of food systems,
makes drawing general conclusions about these
contexts highly problematic.
Section 6.2 outlines the array of food system
actors and behaviors that form the basis for
understanding food system dynamics, while
the following sections identify the institutional
arrangements that influence and guide their
behavior: Sections 6.3 to 6.8 focus on the individual
actors, ranging from farmers and fishermen, to
non-governmental organizations (NGOs).
6.2 Food system actors and their behavior
Food system actors represent today the largest
group of natural resource managers in the world.
Therefore, when it comes to sustainability along
the system, they are critical in both creating
the problems and implementing the solutions.
Many of these agents of change will require
empowerment and knowledge to contribute to
a positive transition (i.e. smallholder farmers,
women, fisher folks, indigenous communities,
etc.). Others will need incentives to change
the way in which they operate and consume.
The behavior of all of them will depend on their
specific context.
Food systems actors, ranging from consumers,
via food processors and farmers to the
agro-input industry, live and act in a certain
context. Important elements of this context
(see also Chapters 3 and 4) are:
− Institutional and regulatory environment,
including aspects as property and tenure
rights, laws related to food safety, the
environment, among others.
−The physical environment (nature and
proximity to natural resources, infrastructure,
proximity to shops for consumers).
−The social, economic and technical setting:
education and training, gender and equity
aspects; prices (of food, inputs, labor),
related to aspects such as bargaining power,
trade arrangements, price volatility and
taxes. Available knowledge, technology and
innovations also play a major role.
−Cultural aspects, such as religion, traditions,
habits, norms and values.
This context is thus not only different for each
food system actor, but is also highly country-
and location- specific. Commercial farmers in
developed countries operate in a completely
different context than subsistence farmers in a
developing country, and while the commercial
farmer may use a range of fertilizers and
agrochemicals, both depend on the same
natural resources of soil, water, biodiversity, etc.
to some extent. And the relevant elements of the
context for a commercial farm (being for example
labor prices, environmental legislation and
commodity prices) are quite different from those
of a city-dweller, who is influenced by aspects
as eating habits, retail prices and marketing. In
traditional food systems, the distinction between
the various actors is much less clear, as people
are for example both food producers as well
as consumers.

102
Und
erst
andi
ng fo
od s
yste
ms
in c
onte
xt:
acto
rs,
beha
vior
s an
d in
stitu
tions
6.3 Farmers and fishermen
The global community of farmers and fishermen
is very diverse. Many low- and middle-income
countries are still primarily agricultural with
smallholder farmers and fishermen predominating
the rural population (HLPE, 2013b). Due to the
expected population growth, mainly in cities
but also in rural areas, this number is likely to
increase (Chapter 3) and hence these primary
producers will continue to play an important role
in food production and the direct management
of natural resources. Smallholder farms are
predominantly family operations, with often even
more labor input from women than from men.
They produce at least 56% of all agricultural
production worldwide and in regions like Africa
they are responsible for the production of up to
80% of the food consumed by the population
(UN, 2014). Artisanal fishing is, in contrast,
normally dominated by men, with women more
engaged in processing the catch. In ‘modern’
food system, most of the agricultural production
is produced by larger, specialized farms.
Due to various limitations, many smallholder
farmers have not been able to increase their
land and labor productivity. A typical limitation
that many of these farmers face is the general
context of rural poverty with inadequate
infrastructure and limited access to agricultural
inputs like knowledge and technology, feed,
fertilizers, seeds and capital; and/or market
opportunity. This situation is often worsened
by the fact that these farmers often live in
ecologically vulnerable environments where
resources are depleted (Chapter 5). It is against
this background that many smallholders have
not been integrated into food supply chains that
are part of a quickly transforming intermediate
food system (FAO, 2013b, Kirsten et al., 2009,
Wiggins, 2014). If equipped with the appropriate
knowledge, technologies and means of
production, smallholder farmers can increase
productivity and simultaneously regenerate
or preserve natural resources. Improved
production technologies and links to markets
would reduce the pre and post-harvest losses.
Moreover, addressing these farmers’ conditions
and limitations is not only a way to realize
more efficient and sustainable management of
resources. It could also give impetus to break
the cycle of rural poverty and allow farmers to
shift to other types of entrepreneurial activities.
Wiggins (2014) points at case studies showing
how smallholders in parts of Africa have been
supported to intensify production and have
been linked by small and medium enterprises to
growing and diversifying food markets in urban
Africa. As a result, these smallholders have
been able to increase their income, which may
improve their food security situation.
In fisheries, the contribution of small-scale
producers (including inland fisheries) in
terms of overall production and contribution
to food security and nutrition is also often
underestimated or ignored. More than 120
million people in the world depend directly on
fisheries-related activities.
6.3.1 Institutional and regulatory environmentOne of the important aspects for farmer and
fishermen is the access to natural resources.
Ostrom and others (North, 1987, Ostrom, 1990)
showed how collectives of actors might
coordinate or ‘govern’ common pool resources,
preventing unsustainable use by actors’ free riding. Governing usually involves some form of
organization, rules, contracts, rights or regulation;
phenomena which can be summarized as
institutions. Institutions generally enhance trust
or overcome high transaction costs. In addition
institutions allow for coordination, regulation of
an array of individuals’ behavior and decision
making in collective action (Ostrom, 1990,
Ostrom, 1992, Wansink, 2004). Institutions might
come as local informal patterns or routines in
community based cooperation, but might as
well be governments, laws, formal ownership,
policies or constitution.
Property rights and tenure regimes can be
categorized into four groups: private, common, state and open access, each having their own
institutions, dynamics and outcomes in terms
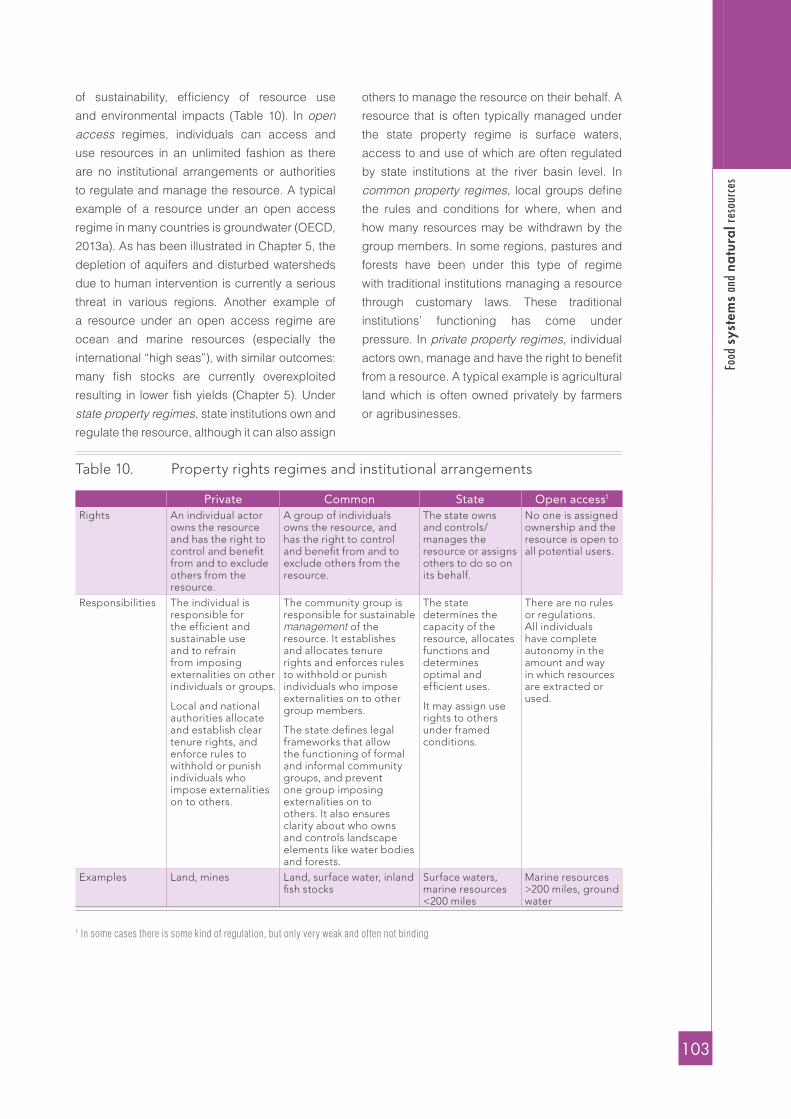
103
Food
sys
tems
and na
tura
l res
ourc
es
of sustainability, efficiency of resource use
and environmental impacts (Table 10). In open access regimes, individuals can access and
use resources in an unlimited fashion as there
are no institutional arrangements or authorities
to regulate and manage the resource. A typical
example of a resource under an open access
regime in many countries is groundwater (OECD,
2013a). As has been illustrated in Chapter 5, the
depletion of aquifers and disturbed watersheds
due to human intervention is currently a serious
threat in various regions. Another example of
a resource under an open access regime are
ocean and marine resources (especially the
international “high seas”), with similar outcomes:
many fish stocks are currently overexploited
resulting in lower fish yields (Chapter 5). Under
state property regimes, state institutions own and
regulate the resource, although it can also assign
others to manage the resource on their behalf. A
resource that is often typically managed under
the state property regime is surface waters,
access to and use of which are often regulated
by state institutions at the river basin level. In
common property regimes, local groups define
the rules and conditions for where, when and
how many resources may be withdrawn by the
group members. In some regions, pastures and
forests have been under this type of regime
with traditional institutions managing a resource
through customary laws. These traditional
institutions’ functioning has come under
pressure. In private property regimes, individual
actors own, manage and have the right to benefit
from a resource. A typical example is agricultural
land which is often owned privately by farmers
or agribusinesses.
Table 10. Property rights regimes and institutional arrangements
Private Common State Open access1 Rights An individual actor
owns the resource and has the right to control and benefit from and to exclude others from the resource.
A group of individuals owns the resource, and has the right to control and benefit from and to exclude others from the resource.
The state owns and controls/manages the resource or assigns others to do so on its behalf.
No one is assigned ownership and the resource is open to all potential users.
Responsibilities The individual is responsible for the efficient and sustainable use and to refrain from imposing externalities on other individuals or groups.
Local and national authorities allocate and establish clear tenure rights, and enforce rules to withhold or punish individuals who impose externalities on to others.
The community group is responsible for sustainable management of the resource. It establishes and allocates tenure rights and enforces rules to withhold or punish individuals who impose externalities on to other group members.
The state defines legal frameworks that allow the functioning of formal and informal community groups, and prevent one group imposing externalities on to others. It also ensures clarity about who owns and controls landscape elements like water bodies and forests.
The state determines the capacity of the resource, allocates functions and determines optimal and efficient uses.
It may assign use rights to others under framed conditions.
There are no rules or regulations. All individuals have complete autonomy in the amount and way in which resources are extracted or used.
Examples Land, mines Land, surface water, inland fish stocks
Surface waters, marine resources <200 miles
Marine resources >200 miles, ground water
1 In some cases there is some kind of regulation, but only very weak and often not binding
104
Und
erst
andi
ng fo
od s
yste
ms
in c
onte
xt:
acto
rs,
beha
vior
s an
d in
stitu
tions
6.3.2 Physical environmentThe physical environment in which farmers and
fishermen operate is one of the key determining
factors. A number of characteristics, such as
climate and general landscape conditions are
mainly beyond direct human control, but others
can be influenced. One important aspect is rural
infrastructure like roads, telecommunication,
irrigation, water supply and services that enable
local production. Especially in developing
countries (but certainly not exclusively),
current rural infrastructure is underdeveloped.
Improvements in rural infrastructure could in
many ways lead to an improved use if natural
resources, for example by reducing food losses,
by making inputs cheaper and more timely
available (such as fertilizers and water) and by
facilitating knowledge exchange.
6.3.3 Social, cultural and economic environmentThe social, cultural and economic environment
substantially varies around the world. A large
number of farmers are mainly subsistence
farmers, for whom a stable supply of food is
of key importance. Their decisions largely
depend on the social and cultural context (for
example which crops to plant), although many
subsistence farmers are connected in various
ways to markets.
At the other end of the spectrum are farmers
in modern food systems, who operate in a
commercial context, often specialized in one
crop or commodity, and depend on prices
of inputs, labor and produced commodities,
as well as on credit facilities. In this context,
companies in the food supply chain are the ones
that exert large influence over farmers’ decisions
on how they manage resources (Chapter 3). A
recurrent issue that farmers face is the low price
they receive for their products and labor, which
limits their ability to invest in new technologies
and farming approaches. In the US for instance,
the share of the consumer’s food dollar that gets
back to the farmer has dropped from 40 cents in
1910 to 7 cents in 1997; a similar trend occurred
in the UK (Lang & Heasman, 2004).
Stronger position and bargaining power
against downstream food actors could increase
resource efficiency in food systems. Higher
product prices in itself are not a guarantee for
a more sustainable use of natural resources, to
the contrary, in many cases this has led to the
opposite result. But the combination of more
stable prices (making for example investments in
land quality and precision equipment possible)
and remuneration by markets of better practices
(for example in the form of certification schemes)
could certainly be important.
Particularly in high income countries, an
underlying reason for food loss is the
overproduction by farmers who want to ensure
the delivery of agreed quantities to their
customers and who anticipate possible events
like bad weather and disease outbreaks. In
some cases, the surplus is sold to processors
or as animal feed, but in many cases farmers
also choose not to harvest crops because the
related costs (labor, energy and transport) are
expected to be higher than incomes; mainly
due to low crop prices (Lipinski et al., 2013).
The same authors (Lipinski et al., 2013) also
refer to situations where customers like retailers
either eventually buy less from farmers than
initially agreed or refuse to buy at all due to non-
compliance of the crops with desired standards
for size, shape, weight, colour, etc.
Ways to strengthen the position and bargaining
power of farmers are, for example, stronger
farmer institutions such as cooperatives
or associations.

105
Food
sys
tems
and na
tura
l res
ourc
es
6.4 Consumers and citizens
Consumers are a crucial node in the food
systems. By exercising effective demand, they
basically determine food production, although
this demand is strongly influenced by food
availability and income as well as by the ‘food
environment’ (see below). People not only
influence food systems in their role of consumers,
they also act as citizens, who vote, have
opinions, and sometimes organize themselves in
for example NGOs. Food consumption patterns
also have a large effect on peoples’ health. And
finally, consumers are partly responsible for food
waste, particularly in more affluent societies.
Consumers are a very diverse group of people,
ranging from rural poor, to urban poor and urban
rich. Even within rich societies there are many
people below poverty line, who spend a high
share of their income on food, and for whom
access to healthy food is as much a problem as it
is for poor people in developing countries. A very
dynamic and large group of consumers is the
increasing middleclass in developing countries.
In an economic sense, not all people are ‘food
consumers’. Consumers are the people who
spend money on food. In many countries, women
are the main consumers, as they are responsible
for meal planning and food purchases. They
have to balance household budgets, as well
as time. The time issue is important, both in
food preparation (leading to a trend towards
convenience), as well is in food purchasing (one
of the factors behind supermarketization). A
consequence of the trend towards convenience
food is the observed loss of cooking skills (Meah
& Watson, 2011).
Food consumption patterns are partly determined
by food prices and household income. Socio-
economic conditions are an important factor in
changes of food demand and dietary patterns,
which have been a driving force in food system
transformation (Sections 4.2, 4.3 and 4.4) and
its impacts on natural resources (Chapter 5).
Culture, tradition and religion play a major
role as well, with marked differences between
various countries and societies. An important
factor which determines consumption behavior
are the dominating norms, values and beliefs
about food. Although traditions are important,
food consumption patterns are far from static,
as can be seen by the large changes in food
consumption patterns within the timespan of
one generation.
The ‘food environment’, being the physical, social
and economic surroundings that influence what
people eat, plays a major role in determining food
consumption patterns, especially in urban food
systems. Food companies, restaurants, food
vendors and retailers are actively influencing
this food environment to tempt people to
make certain choices. This influencing could
be in various ways, ranging from advertising,
packaging, location, to creating aromas or
presentation in shops or restaurants. Changing
this food environment could be an important
lever towards dietary change and reducing food
waste, and hence make a major contribution to
increasing natural resource use efficiency. Partly
as a consequence of this food environment,
ultra-processed foods (including beverages)
have become a dominant part of Western diets.
These foods are often rich in sugars, fat and salt
and lend themselves well to mass production,
bulk storage and automated preparation. The
nature of these products makes them cheaper
to produce and attractive to promote and sell
because they usually have high profit margins
(Lang & Heasman, 2004), (Swinburn et al., 2011).

106
Und
erst
andi
ng fo
od s
yste
ms
in c
onte
xt:
acto
rs,
beha
vior
s an
d in
stitu
tions
Due to changes in food systems over the last
century, many food items are now produced and
distributed in complex food nets and lengthy
supply chains. Consequently, citizens have
limited information and insight into what they
consume and what the consequences of their
consumption behavior are. Raising people’s
awareness could therefore be an important lever
for change, particularly if people are able to
relate to the new information and messages they
receive. In this sense, the current societal trends
and debates on healthy food could be used as a
vehicle to encourage discussions on sustainable
food as well, particularly where healthy and
sustainable foods coincide. Research by the
UK government into consumer attitudes and
behavior showed, for instance, that choices
around food are mainly driven by health (81%)
and the price of products, while environment
is much less a concern (26%). A similar study
among consumers in the EU-27 revealed similar
findings, cited in (WWF, 2014).
6.5 Food companies, food service and retail
There is a large variation in the various types
of companies who process, package, prepare
and sell food for consumers. The large food
companies and retailers attract most of the
attention, but there are also many small and
medium-sized enterprises, ranging from local
food stalls, ‘mom and pop’ shops, bakeries
and family-owned restaurants to (for example)
medium-sized food processors. This ensemble
of private actors makes the food sector the largest
economic sector in many regions, such as the
EU for example (Underwood et al., 2013). Some
of these actors operate mainly at a local level
(within a large context), while other companies
operate at a global level. Some of these global
companies are well-known and have global
brands (e.g. cereals, snacks, soft drinks, beers,
coffee and sweets). Other global companies
(more directly related to natural resources)
operating at earlier stages in the food chain
(e.g. seed, fertilizers and feed companies) are
generally less well-known by the general public.
Private actors operate within a certain
institutional, social and economic framework.
Large food companies employ strategies to
survive in highly competitive and saturated
markets, where reputation is an important factor
to acquire and bind new customers to their
services or products. Companies expand to new
customer segments, for instance among the
urban middle class in emerging economies. They
employ various strategies to create additional
demand for their products, for instance through
innovation, responding to market demand or
by shaping people’s norms and perceptions of
food through the food environment (Esnouf et al., 2013). In the context of highly competitive and
globalizing markets, a company will generally
strive to be cost-efficient which could often lead
to externalization of environmental costs.
For many food companies, as well as fast-
food restaurants for example, it is easier to
make profit on calories (fat and sugar), i.e.
rich, ultra-processed foods and beverages.
This is one of the drivers of obesity and diet-
related diseases like cardio-vascular diseases
(Swinburn et al., 2011).
In modern food systems, the strive for cost
efficiency has encouraged the vertical integration
in supply chains (see also Section 3.4). The
process of consolidation has been accompanied
by a shift in power from primary producers to
actors downstream in supply chains. Particularly
retailers who gained disproportionate buying
power both in relation to primary producers and
food companies with their own brands. While
some of the major companies do operate from
‘farm to fork’, and hence have a direct influence
on natural resources along the whole food
system, many of the smaller downstream food
actors do not directly manage resources for
food production. Their decisions do however
indirectly influence the way natural resources are
managed, and this influence could work both in
a positive and a negative direction.

107
Food
sys
tems
and na
tura
l res
ourc
es
6.6 Governments
Governments play different roles depending
on their national context. In countries with a
liberalized economy, governments tend to play
a regulating and facilitating role. In other types
of economies, governments (i.e. state controlled
enterprises) sometimes take part in food
producing, processing, trading and retailing.
Even in liberalized economies, governments
(both national authorities as well as local
authorities) exercise a large influence (although
often implicit) on the way the food system
is organized, as well as on natural resource
management approaches and environmental
impacts. This could be in the form of:
−financial instruments (taxes, import and export
tariffs, subsidies, payments);
− legislation and regulation (or the absence of
regulation), for example on food;
−by setting objectives for education (for
example on nutrition);
−by stimulating and facilitating innovations, new
initiatives, collaboration and cooperation.
Although natural resources are crucial input for
food production, they are often not priced (e.g.
water, fish stocks) or have low market value (e.g.
land). The (FAO, 2004) indicates that the non-
traded nature of natural resources and the lack of
a market for the public benefit of these resources
limits the incentive to maintain the resource and
results in market failures. They suggest that
putting a monetary value on resources and
pricing their extraction would result in more
efficient uses (e.g. water). Moreover, inefficient
use of energy, fertilizers, minerals, and water
are often encouraged by pricing resources
below their true costs (e.g. through subsidies for
irrigation, fertilizer and pesticides) (OECD, 2005;
OECD, 2013a).
In many countries, the environmental costs
(externalities) of the food system are not included
in food prices (TEEB, 2015). Governments
could promote the prevention of negative
externalities through environmental regulations
and standards. Financial incentives could also
promote a shift to more sustainable practices.
Such incentives could be created by taxing
environmental impacts (nitrate leakages, water
pollution from pesticides, GHG emissions and
so on), while positive financial incentives could
be created by rewarding those who assure the
maintenance of ecosystem services, for instance
through Payments for Environmental Services
(PES) schemes. These are a way to encourage
sustainable resource use that create positive
externalities, such as appreciated landscapes,
erosion prevention, downstream flood protection,
watershed protection and hydrological functions
such as water purification.
6.7 Non-governmental and other civil society actors
There are many NGOs and other non-state actors
(e.g. civil society groups) actively engaged in
the area of food systems and natural resources
(Schilpzand et al., 2010a). Some are small and
local, while others operate at the global level.
They also vary widely in objective: some have
more socio-economic goals (e.g. strengthening
the position of smallholders or women), others
are more concerned with people’s health,
while others are mainly oriented towards nature
conservation.
NGOs sometimes have a large role in initiating
changes in food systems and can be major
‘influencers’ of state policy making. NGOs also
influence the behavior of companies, especially
large multinationals by a variety of strategies,
ranging from cooperation and mutual support to
‘naming and shaming’.
108
Und
erst
andi
ng fo
od s
yste
ms
in c
onte
xt:
acto
rs,
beha
vior
s an
d in
stitu
tions
6.8 Summary and conclusions
In order to analyze why in many instances
natural resources are not managed sustainably
or efficiency, it is important to analyze the
behavior of the various food system actors as
well the context in which they operate. A better
understanding of the governance of natural
resources, as well as of food systems as a whole,
is pivotal to identifying effective levers for change.
It should be stressed, that understanding the
role of actors and institutions in food systems
requires country-, region- or landscape–
specific diagnostics. The variety of institutional
arrangements (such as national legislation)
and the status of natural resources in different
types of food systems, makes drawing general
conclusions about these contexts problematic.
Food systems actors live and act in a certain
context, the elements of which can include: the
institutional and regulatory environment (e.g.
property and tenure rights, laws); the physical
environment (nature and proximity to natural
resources, infrastructure, proximity to shops for
consumers); the social, economic and technical
setting (e.g. education and training, gender and
equity aspects); prices (of food, inputs, labor)
and related aspects (bargaining power, trade
arrangements, price volatility, taxes, available
knowledge, technology and innovations); as well
as cultural aspects (religion, traditions, habits,
norms and values).
When analyzing this context, special attention
should be given to the role of women, given their
important role both in food production, as well as
in food preparation and consumption. Property
and tenure rights regimes have a large influence
on the way certain renewable natural resources
are governed. These regimes can be categorized
as: private, common, state and open access,
each with their own institutions, dynamics and
outcomes in terms of sustainability, efficiency
of resource use and environmental impacts.
The absence of clear regulatory frameworks,
rights and enforcement mechanisms has in
many cases driven unrestricted use and caused
the depletion of resources like water and land.
To ensure the sustainable use of resources, a
clear regulatory framework (with consideration
of distributional effects) is needed to manage
the access and use of resources and to regulate
environmental impacts. Clear definition of roles
and responsibilities for the regular monitoring
and assessment of the environmental state
of resources are also important. Additionally,
financial incentives can be critical. Through
taxes and subsidies governments can influence
the use of certain inputs such as fossil fuel and
fertilizers. Fossil fuel subsidies for irrigation
purposes can drive the over-extraction of water.
On the other hand, payments for environmental
services (such as flood control or well-
maintained landscapes) can encourage farmers
to undertake actions to improve the delivery of
environmental services.
Private actors are a very diverse group, ranging
from very small businesses to large multinationals.
Large food companies employ strategies to
survive in highly competitive and saturated
markets, where reputation is an important
factor to acquire and bind new customers
to their services or products. Companies
employ various strategies to create additional
demand for their products, for instance through
innovation, responding to market demand or by
shaping people’s norms and perceptions on food
through the food environment. In the context of
highly competitive and globalizing markets, a
company will generally strive to be cost-efficient
which could often lead to externalization of
environmental costs.
Consumers are a crucial node in the food
systems. By exercising effective demand, they
basically determine food production, although this
demand is strongly influenced by food availability
and income as well as by the ‘food environment’.
People not only influence food systems in their
role of consumers, they also act as citizens, who
vote, have opinions, and sometimes organize
themselves in for example NGOs. NGOs can play
different roles, ranging from a cooperative role, to
a more activist role, for example by ‘naming and
shaming’ individual companies.


Options towards environmentally-sustainable food
systems
Chapter
7
Cre
dit:
Qui
ck S
hot,
Shu
tter
stoc
k.co
m

111
Food
sys
tem
s an
d na
tura
l res
ourc
es
7.1 Introduction
In Chapter 5 we asserted that many of the
natural resources that underpin food systems
are not managed sustainably or efficiently, and
that increasing food demand due to population
growth and increasing prosperity will increase
the pressure on these resources (Chapters 4
and 5). Moreover, the food system leads to a
number of environmental pressures, such as
biodiversity loss and GHG emissions which in
turn further undermine food production. Chapter
6 has highlighted a number of mechanisms
behind the current functioning of food systems.
That raises the important question of what can
be done to steer food systems towards more
efficient use of natural resources.
This chapter first explores what sustainable
food systems could look like from a natural
resource perspective (Section 7.2). An overview
is also given of the options available to enhance
the sustainable and efficient use of natural
resources and to reduce negative impacts on
the environment (Section 7.3). It is important to
reiterate that food systems vary widely around
the world. This means that there are large
differences in the challenges and opportunities
with regard to natural resources (Section 5)
as well as in the ways to achieve progress in
overcoming these challenges.
Section 7.4 gives a brief description of a
number of options, in particular ‘overarching’,
non-resource-specific options, both on the
production side (such as reduction of food
losses and increased feed efficiency) and
on the consumption side (such as reduction
of food wastes and dietary shifts). Finally,
Section 7.5 summarizes some key literature
concerning the potential effect of a number of
biophysical options.
7.2 What do sustainable food systems look like from a natural resource perspective?
One of the key questions this report addresses is:
‘What do sustainable food systems look like from
a natural resource perspective?’ There are many
answers to this critical question. For example,
some promote the use of GM crops, pesticides
and antibiotics in order to increase agricultural
productivity, thereby reducing pressure to covert
more ‘natural’ land; others categorically reject
these kinds of approaches and stress their
negative impacts on biodiversity, environment
and human health. When defined at a higher
abstraction level however, consensus might be
more attainable: few will reject the ambition for
increased use efficiency of nutrients (and other
inputs and lower greenhouse gas emissions,
as well as the importance of sustainable land
management. Discussion may than still arise
about the speed, the technology to be applied
and the final level of ambition: for instance, is
the ambition to avoid soil erosion completely,
or is some erosion acceptable in some cases?
Furthermore, there are many trade-offs and
potential co-benefits to be considered. Based
on the conceptual framework as presented in
Chapter 2, and the definition of sustainable
food systems, three main basic principles for
sustainable food systems from a natural resource
perspective can be defined:
1. Sustainable use of renewable resources: no
degradation.
2. Efficient use of all resources.
3. Low environmental impacts from the food
system activities.
It is evident that sustainable food systems are
not only about sustainable and efficient food
production; the key challenge is to be effective
in terms of food security, livelihoods and
human health.
1. Sustainable use of renewable resources:
no degradation
The sustainable use of the renewable resources
in food system activities is essential to ensure the
112
Opt
ions
tow
ards
env
ironm
enta
lly-s
usta
inab
le fo
od s
yste
ms
continuity of primary food production (crop and
livestock production, fisheries and aquaculture).
Table 11 lists these resources and also provides
a more specific interpretation of the meaning
of ‘sustainable’ use for each one of them. An
unsustainable use of these resources would
not only have negative implications for food
production, it might also lead to environmental
effects outside the food system (see Chapter 2).
An example is the clogging of rivers, lakes and
reservoirs with sediment from soil erosion. Land
degradation may also lead to the conversion
of additional land into cropland or pastures to
compensate for the lost productive land (UNEP,
2014). Pressures leading to an unsustainable
use of natural resources may also come from
outside the food system, for example in the form
of contaminants.
2. Efficient use of all resources
Chapter 2 defines efficient use of resources as
‘high output per unit of input’, to be measured at
various scales’. Table 11 lists what efficient use
could imply for various resources.
An efficient use of both non-renewable and
renewable resources is essential to transition
towards more sustainable food systems,
considering:
a. the amount of resources used within food
system activities is generally related to
environmental impacts: more fossil fuel use
means more greenhouse gas emissions,
lower land use for agriculture (due to higher
crop yields) generally means less land
conversion;
b. in the case of non-renewable resources
(such as minerals and fossil fuels) a higher
efficiency means a lower demand and thus a
lower depletion rate.
One could therefore argue that increasing the
efficiency of use is actually a means to move
towards more sustainable use as it contributes
to a low depletion rate (mainly at the global
scale) or limits the environmental impacts of food
systems This implies decoupling food production
from resource use (UNEP, 2011a). For most
resources, there is no absolute maximum that
can be reached in terms of efficiency. However,
some targets could be envisioned for fossil fuels
and non-renewable nutrients. In the case of fossil
fuels, the long-term ambition could be to replace
all of these with renewable sources. In the case
of non-renewable nutrients (e.g. P and K), the
ambition could be to reach a 100% efficiency
along the food chain, which implies that no
‘new’ minerals would need to be extracted from
reserves to replace the lost minerals.
As discussed in Chapter 5, an optimal mix of
the various inputs (including natural resources)
is essential in crop production to reach a good
overall efficiency. If one of the production factors
(for example nitrogen) is limiting, other production
factors (land, water, labor, seeds) are utilised sub-
optimally. Similarly, if the use of nitrogen results in
nitrogen leaching into groundwater and surface
waters, its use is inefficient.
A key aspect of resource-efficient food systems
is the ability to recycle materials and nutrients.
The absence of contaminants of various kinds
is therefore important as these can inhibit the
proper recycling of food waste, manure and
human excreta. Specific contaminants that
inhibit recycling along the food chain include
heavy metals, residues of pesticides or drugs
(oestrogens, antibiotics, anthelmintic treatments)
and antibiotic resistant bacteria. There might also
be some more ‘natural’ causes such as zoonoses,
parasites or plant pests and diseases that make
recycling difficult. There are ways of restoring
the usability of certain streams: for example,
the proper composting of crop residues can kill
certain types of pathogen. Human excrements
(night soil) can contain pathogenic bacteria, virus
and parasitic ova. With proper treatment these
can be killed, making the recycling of nutrients
possible, although certain risks may still exist.
3. Low environmental impacts from the food
system
Given the current, let alone future, food demand,
zero food system impacts on the environment is
not feasible. The emission of certain greenhouse
gases, or nutrient losses cannot be reduced to
zero. Yet, these emissions should be reduced
as much as possible. Contamination of various
kinds could also affect soil and water quality and
thus the sustainable use of these resources.

113
Food
sys
tem
s an
d na
tura
l res
ourc
es
Table 11. Principles and indicators for sustainable food systems from the natural resource perspective
Principle of sustainable use
Indicator of efficient useIn italics: ambition at food
system level
Indicator of reduced environmental impacts
Renewable resourcesLand, landscapes and soils
No or very limited land degradation (in all forms) / soil erosion, prevent contamination, maintenance of landscape diversity, aiming at sustained crop yields
Optimized crop yields, closing the ‘yield gap’ without increasing environmental impactsNo further land needed in food systems
No / limited conversion of natural areas into agricultural land; maintenance of landscape diversity
Water No depletion of groundwater / disturbance of water systems; prevent pollution / contamination
High water-use efficiency along food chainLow total amount of water needed in food systems
Limited changes in hydrological regimes
Biodiversity Conservation - no degradation of biodiversity
Biodiversity maintained/enhanced
Reduced disturbance / extinction of species
Genetic resources Conservation of genetic diversity for resilient food systems
Genetic potential of crops and farmed animals exploited, not only in terms of productivity but also in terms of robustness and nutritional quality
Marine resources Conservation / no depletion of fish stocks – no disturbance of marine environment
Avoidance of by-catch, proper use of by-catch
Limited disturbance of marine environment
Non-renewable resourcesMinerals - High nutrient efficiency along
the food chainLow total amount of ‘new’ minerals for food systems
Reduced pollution by minerals
Fossil fuel - High energy efficiency / renewable energy sources Low total amount of fossil fuels for food systems
Reduced burning fossil fuels / clean burning methods (GHG emissions, air pollution)
Use of agents / synthetic components
- Minimized use Reduced pollution and contamination (soil, air and water quality)
(1) The columns ‘sustainable use’ and ‘efficient use’ are not meant to indicate a contradiction; in most cases both are needed simultaneously. See for example the SAFA guidelines for implementation at enterprise level (FAO, 2013c).(2) For reasons of simplicity, this is defined in physical terms. Farmers might be more interested in outputs related to revenue or employment.
7.3 Overview of options
The underlying principles of resource-efficient
food systems were presented in Section 7.2,
while a number of resource-specific options
were presented in Chapter 5 that make the use of
the various natural resources more sustainable
and efficient and reduce the environmental
effects. These options were resource-specific,
implying that synergies and trade-offs were not
discussed. Neither were options in the whole
food system presented, such as options on the
consumption side.
A large number of options are available to make
food systems more sustainable in terms of
resource use and environmental impacts. Some
of these options not only result in a positive
effect on the resource that is targeted, but could
also have a positive effect on other resources
or environmental impacts. For example, better
nitrogen management will not only lead to
improved resource efficiency, it might also lead
to better water quality and lower greenhouse
gas emissions. Reduced food waste will
reduce overall demand thereby reducing all

114
Opt
ions
tow
ards
env
ironm
enta
lly-s
usta
inab
le fo
od s
yste
ms
environmental food system impacts. Conversely,
trade-offs are also possible. Some of the options
can be implemented ‘downstream’ in the food
system including the reduction of food waste at
the retail, food service or household level.
There are many options for sustainable and
efficient use of natural resources and reduced
environmental impacts in food systems. For
analytical purposes, the authors propose four
main option categories: options to reach a
sustainable use of natural resources, options
to increase resource efficiency in primary food
production, options along the supply chain
to increase resource efficiency (including
recycling) and options outside the food system.
A number of possible measures within each one
of these categories are presented in Figure 26.
Table 12 shows, in a very general manner, a
few examples of options to reduce the impact
of food system activities on resources and
the environment. A number of points should
be noted:
−Many of the options mentioned cannot be directly
achieved but require more specific actions
(these are included in the column ‘Examples’).
For instance, ‘increasing crop yields’ is an
outcome of actions such as improved seeds,
better weed control, better fertilization, and so
on. This may however lead to certain trade-offs
such as loss of biodiversity.
Figure 26 Options for sustainable and efficient use of natural resources and reduced environmental impacts in food systemsOptions for sustainable and efficient use in food systems
Source: PBL
Options for sustainable use
Natural resource
Options for more efficient use in food systems ( )
Prevent landdegradation: cover soil, provide organic matter, maintain landscape elements, avoid contemination
Land, landscape, soils
No depletion of aquifiers, prevent pollution
Fresh water
No degradation of biodiversity and EGS, habitat protection, no contamination
Biodiversiy and EGS
Maintain diversity. Avoid invasive species
Genetic resource
Minerals
Fossil fuels
No catches beyond MSY; conserve habitats, especially breeding grounds
Fish stocks
Primary food production
Crops
Livestock
Inputindustry
Food processing
Food distributionand retailing
Aquaculture
Fisheries
Foodconsumption
Wastemanagement
Increase use of EGS
Improve feedconversion
Increase production per ha
Reduction of food losses
Improvemanurerecylcling
More crop per drop
Improved varieties
Optimalquantity
Improve fuel efficiencyon farms / fisheriesReduction of
by-catches
Recycle nutrientsMore efficientwater use /less pollution
Increase fuel efficiency of / lessprocessing, transport and cooling
Replace renewable energy sources
Reduce pressures from outside the food system:• Loss of good land due to urbanization• Cropland use for fuel and fibers• Climate change, urban water use
No over-consumption,dietary shifts
Reductionof foodwastes
115
Food
sys
tem
s an
d na
tura
l res
ourc
es
The assessment of the environmental effects
of the various options is an indication, and only
valid in the case of a judicious application.
−The biophysical options are regarded as
variable and location-specific with regard
to technology and farm scale; for example
‘precision farming techniques’ may be
executed with high-tech equipment and
sensors, or with manual labor and human
observations.
−A tentative estimate has been made of the
impact of each option on food availability.
The fact that a better management of natural
resources can truly support better livelihoods
is illustrated by a case study from Ethiopia
(see Box 9). Rehabilitation of degraded lands and
better use of environmental goods and services
led to significant improvement in livelihoods of
the communities concerned.
Table 12 and Figure 26 contain a large number of
‘resource-specific’ options, largely aimed at the
sustainable or more efficient use of an individual
resource. These resource specific options are
mainly aimed at the primary production. As the
options are not new, and much work already has
been done in developing and implanting these
options, this report will not focus on these. Still,
these are very important and relevant options,
especially when implemented in combination.
Annex A to this report provides a brief overview
of these options, but much more information can
be found in the underlying literature.
A number of important lessons can be learned
from Figure 26 and Table 12:
−There are many options to move towards
the sustainable use of renewable resources,
enhance the efficient use of natural resources
and reduce the environmental impacts of food
systems.
−As the direct use of most renewable resources
is related to primary food production
(agriculture and fisheries), the practices at this
stage largely determine whether the resources
are managed sustainably. In the rest of the
food system most of the available options
target a more efficient use of resources
(including recycling). Reduction of pollution
is still an important option, in and outside the
food system, to guarantee a sustainable use of
natural resources.
−A number of options are suggested along
the food system, such as a reduction of food
waste and dietary changes, which have an
effect on the total demand of food production
and, therefore, could reduce the pressure on
natural resources as well as the environmental
impacts.
−Several options proposed at the farm level
have simultaneous positive effects on the
efficient use of a number of resources, such
as improving feed conversion and increasing
crop yields.
−Many resource-specific efficiency options
have a positive effect on other resources or
environmental impacts.
−Figure 26 and Table 12 are comprehensive
as they should in principle cover all the
points of intervention; however, behind each
point of intervention there are many ways
of achieving the indicated objective. For
example, ‘increased crop yields’ or ‘increased
feed efficiency’ could be reached by dozens
of different measures, often also influencing
the use of other resources.

116
Opt
ions
tow
ards
env
ironm
enta
lly-s
usta
inab
le fo
od s
yste
ms
Table 12. Example of options to reduce the impact of food system activities on resources and the environment (including synergies and trade-offs)
Natural Resources Environmental ImpactsPoints of
interventionLand, land-scape soils
Fresh water
Bio-diversity
Genetic resour-
ces
Minerals Fossil fuels
GHG emissions
Water, soil, air quality
Food availa-bility /health
Examples
Sustainable use Land, landscape soils
+ 0 + 0 + + +Soil conservation practices
Fresh water0 + 0 + +
No depletion of aquifers
Biodiversity+ 0 + + 0 + +
Biodiversity conservation at landscape level
Genetic resources0 0 + + 0 0 +
Maintenance of genetic diversity
Efficient use in primary food production
Increase crop yields + + + 0 + + + -? +Sustainable intensification
Improve water efficiency on farms
+ + 0 0 + +? 0 +? +Drip irrigation, reduced leakages
Enhance use of ecosystem services
+ 0 + 0 0 0 0 + +?Biological pest control
Seeds with more genetic potential
+ ? ? + + + + 0? +High yielding varieties
Improve soil fertility, improve efficiency
+ + +/- 0 + +? + -? +Fertilization, better placement
Improve fuel efficiency on farms
0 0 0 0 0 + + 0 0No-tillage farming, fuel efficient equipment
Increase feed efficiency livestock
+ + + 0 + + + +? +Better feeding techniques
Improve grassland use / feed efficiency for beef and dairy
+ +? + 0 + + + 0 + Controlled grazing
Improve manure recycling
+ + + 0 + 0 + + 0Coupling crop and livestock production
Reduce post-harvest losses
+ + 0 0 + 0 0 +? + Better storage
Integrated pest management
+? +? + +? 0 0 0 + +Application based on pest monitoring
Reduce use of pesticides, antibiotics, etc.
+? + + + 0 0 0 + +
Efficient use in food chainImprove recycling minerals, including reduction of emissions
+ 0? + 0 + +? + + +?
Improved integration of animal manure in crop production
Improve water efficiency in food chain
+ + 0 +? 0? +?Reduce water use in processing
More efficient fossil fuel use
0? 0? + 0? + + +More efficient transport and cooling
Reduction food wastes
+ + + + + + +Reduce post-harvest losses
Less resource-intensive (‘sustainable’) diets
+ + + 0 + +? + + +
Reduce overconsumption, moderate meat intake
Outside the food systemReduction use of biofuels and natural fibres
+ + + 0 + + + +Less biofuels and fibres from croplands
Reduce pollutants + + + + 0 0 0 0 +Control industrial air pollution
(1) + = positive effect /intended or large positive effect; 0 = neutral effect; - = negative effect; ? = effect uncertain. Green shading means directly intended effect. Marine activities are excluded from this overview.
(2) The scores are generally based on expert judgement and indicate a general direction. Large variations may occur in individual cases.

117
Food
sys
tem
s an
d na
tura
l res
ourc
es
7.4 Brief description of options
This section provides a brief description of
the various options, in particular a number of
‘overarching’ options both on the production
side and the consumption side. A number
of resource-specific options were already
discussed in Chapter 5. It is not possible to give a
full description of all options within the framework
of this report, partly because of the need for
succinctness, but more importantly because
almost all options are very context-specific.
Therefore, information would need to be available
at the national (or in many cases even local) level
to obtain consistent information, which is not
feasible within the framework of this report.
7.4.1 Options to increase resource efficiency in primary food productionOptions to improve the use of natural resources
can be divided in options which aim at the
improved use of individual resources (‘resource-
specific’ options), while other options (for example
improved feed efficiency) have a positive effect
on several or even all natural resources. These
resource-specific options are essential, and
in many situations these options have already
be implemented. Nevertheless, there are also
ample opportunities to improve the use of various
resources. A brief overview of these options is
given in Annex 1. For most natural resources
there is much literature available on good
management practices and options to improve
the use of the individual resources. Given the fact
that many of these resource-specific options are
well-known in a technical sense, this report will
focus on their implementation (Chapter 8) as well
as on cross-cutting options, such as sustainable
intensification and increasing feed efficiency.
Sustainable intensification of crop
production
Sustainable intensification can be defined as
simultaneously improving the productivity and
sustainable management of natural resources,
although various, overlapping definitions exist
(Buckwell et al., 2014, Garnett et al., 2013, Pretty et al., 2011). Sustainable intensification of crop
production is a strategic objective of the FAO.
The core idea of sustainable intensification is
making better use of existing resources (e.g.
land, water, biodiversity), while not undermining
the capacity to produce food in the future (Pretty,
2007). Especially for regions with a large yield
gap for crops, sustainable intensification is seen
as the most important route to increase crop
production (both per hectare as well as for a
whole region), while minimizing resource use
and environmental impacts (AGRA, 2013, FAO,
2011d). For many it is also seen as an important
economic opportunity37.
Although promoted by many, the concept, or at
least the actual implementation of sustainable
intensification, is also criticized. Some see
sustainable intensification as a pretext for the
introduction of GM crops, pesticides or free trade
(Friends of the Earth International, 2012). Critics
fear not only the environmental consequences
of these inputs, but also that they would make
farmers more dependent on large companies. It
should be stressed that sustainable intensification
rather denotes a goal, without specifying with
which agricultural approach this could be attained
(Garnett et al., 2013). The concept does not
require certain technologies or the use of certain
inputs such as GM seeds or pesticides. It should
also be stressed that sustainable intensification
does certainly not imply the mechanization of
farming by means of farm machinery, nor does
it necessarily imply certain inputs or upscaling
of farms. Especially for smallholder farms,
sustainable intensification might even be a
promising route to increase crop or monetary
output per hectare, thus obtaining more income
from the same area of land (FAO, 2011d).
From a biophysical perspective, there are many
ways in which crop yields could increase.
These include higher soil fertility (integrated 37
37. The latest report from TEEB for Agriculture and Food found that “if Senegal was to change all of its irrigated lowland systems from conventional management to SRI (System of Rice Intensification), about US$11 million of savings in water consumption related health and environmental costs would be generated. At the same time, the rice producer community would gain a total of US$17 million through yield increases.” (TEEB, 2015).

118
Opt
ions
tow
ards
env
ironm
enta
lly-s
usta
inab
le fo
od s
yste
ms
nutrient management), improved crop varieties,
better water supply or utilization of rainwater
and improved pest and weed management
(for example by biological or integrated pest
management). The identification of the most
effective measures is very site-specific and no
blanket recommendation can be given. In many
cases (but certainly not in all) increasing crop
yields by taking away the most limiting factor (for
example water availability) might not only increase
crop yields (thus land productivity), but also the
efficient use of other resources such as minerals
(fertilizers), fossil fuels and human labor (Ittersum
van & Rabbinge, 1997, Rabbinge et al., 1994).
Increase feed efficiency of livestock and
improve grassland use
Farmed animals consume around 35% of the
total crop production on arable land (Steinfeld et al., 2006). In addition, grassland and other
forages are being used, as well as large
amounts of co-products (such as oil meals) and
by-products (such as molasses). An increase
in feed efficiency could lead to a reduced
demand for feed crops and thus to a reduced
pressure on all natural resources needed for
crop production (land, minerals and water).
Globally, there are still large differences in feed
efficiency (Gerber et al., 2013). ‘Closing the feed
efficiency gap’ is therefore identified as one of
the three focus areas of the Global Agenda for
Sustainable Livestock38.
Efforts to increase feed efficiency should
certainly not be restricted to confined animals, as
it is also relevant for grazing animals. Improved
grassland and ranging management has a large
potential, given the fact that more than 75% of all
agricultural land use is in the form of grasslands.
Concrete measures to increase the overall feed
efficiency include improving feed composition,
reducing feed losses, better storage of feed, and
improving animal health. ‘Overall feed efficiency’
indicates that it is not only about the individual
animal’s performance, but that aspects such as
mortality, reproductive performance and longevity
are important too. Furthermore, feed efficiency
should be analyzed in a broader context: if
livestock farmers were to shift from by-products
and crop residues to crop products with a high
nutritional value, the feed efficiency expressed as
kg dry matter per kg meat (or weight gain) might
improve, but the agricultural system as a whole
would become less resource efficient.
However, a very narrow focus on high feed
efficiency might compromise animal welfare,
animal health or human health. It is well-
known that free-range animals have a lower
feed efficiency than animals in a restricted
environment (De Vries & De Boer, 2010). Fast-
growing broilers have a high feed efficiency,
but there are also trade-offs with the chicken’s
welfare and health. Some heavy metals (copper
and zinc) and antibiotics promote a high feed
efficiency, but have clear environmental impacts
or consequences for human health (development
of antibiotic resistance).
Reduction of food losses
A final overarching option at the farm level is the
reduction of pre- and post-harvest food losses.
Improving crop protection worldwide helps
reduce losses to pests, disease and weeds,
thereby increasing input use efficiency of
production. Substantial losses also occur post-
harvest, i.e. in drying and storage. The losses
can be both physical losses caused by rodents,
insects or infestations, and loss of quality and
value of crops. The extent of these losses is
globally substantial, but hard data are lacking.
Estimates range from 5–30% or more. This
represents a vast amount of food, along with the
wasted cost and effort of producing it. In Sub-
Saharan Africa, the post-harvest grain losses
are estimated to have a value of USD 4 billion
per year (World Bank & FAO, 2011). Food losses
can be reduced by better storage techniques
(including cooling by natural techniques), on-
farm processing and better transport from rural
areas to urban areas. In Chapter 7 a brief analysis
of the causes of food losses will be presented.
38
38. http://www.livestockdialogue.org/en/
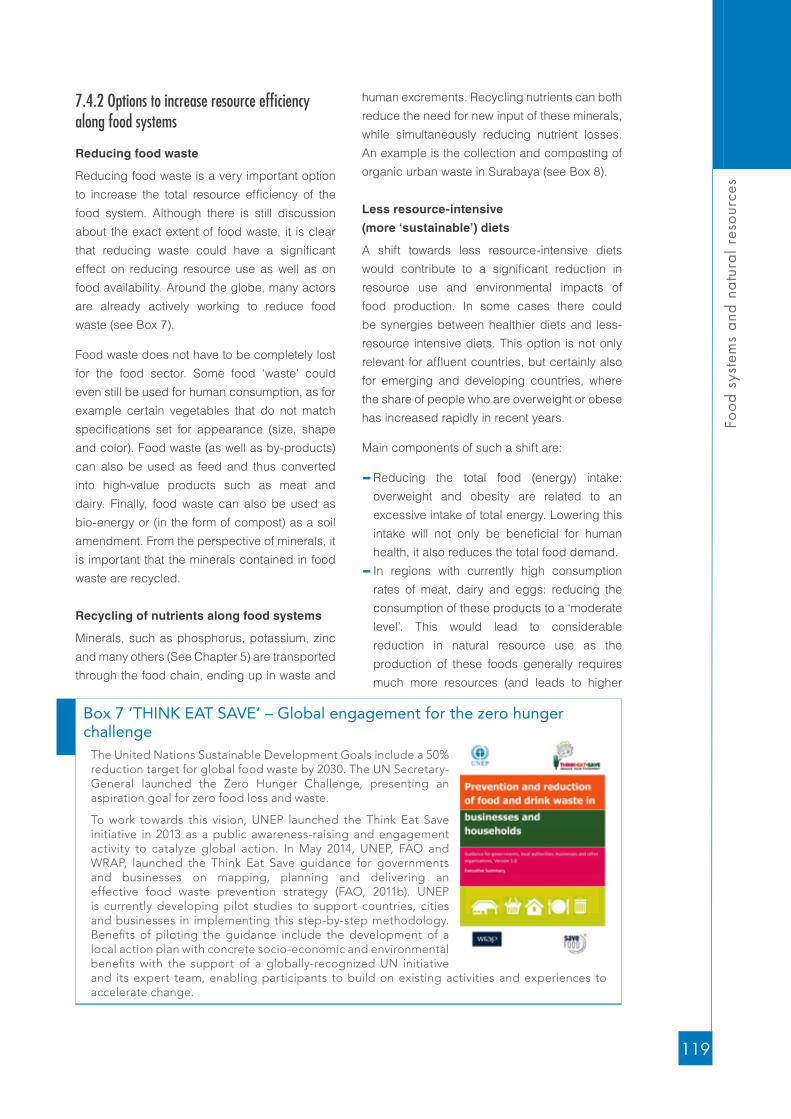
119
Food
sys
tem
s an
d na
tura
l res
ourc
es
7.4.2 Options to increase resource efficiency along food systems
Reducing food waste
Reducing food waste is a very important option
to increase the total resource efficiency of the
food system. Although there is still discussion
about the exact extent of food waste, it is clear
that reducing waste could have a significant
effect on reducing resource use as well as on
food availability. Around the globe, many actors
are already actively working to reduce food
waste (see Box 7).
Food waste does not have to be completely lost
for the food sector. Some food ‘waste’ could
even still be used for human consumption, as for
example certain vegetables that do not match
specifications set for appearance (size, shape
and color). Food waste (as well as by-products)
can also be used as feed and thus converted
into high-value products such as meat and
dairy. Finally, food waste can also be used as
bio-energy or (in the form of compost) as a soil
amendment. From the perspective of minerals, it
is important that the minerals contained in food
waste are recycled.
Recycling of nutrients along food systems
Minerals, such as phosphorus, potassium, zinc
and many others (See Chapter 5) are transported
through the food chain, ending up in waste and
human excrements. Recycling nutrients can both
reduce the need for new input of these minerals,
while simultaneously reducing nutrient losses.
An example is the collection and composting of
organic urban waste in Surabaya (see Box 8).
Less resource-intensive
(more ‘sustainable’) diets
A shift towards less resource-intensive diets
would contribute to a significant reduction in
resource use and environmental impacts of
food production. In some cases there could
be synergies between healthier diets and less-
resource intensive diets. This option is not only
relevant for affluent countries, but certainly also
for emerging and developing countries, where
the share of people who are overweight or obese
has increased rapidly in recent years.
Main components of such a shift are:
−Reducing the total food (energy) intake:
overweight and obesity are related to an
excessive intake of total energy. Lowering this
intake will not only be beneficial for human
health, it also reduces the total food demand.
− In regions with currently high consumption
rates of meat, dairy and eggs: reducing the
consumption of these products to a ‘moderate
level’. This would lead to considerable
reduction in natural resource use as the
production of these foods generally requires
much more resources (and leads to higher
Box 7 ‘THINK EAT SAVE’ – Global engagement for the zero hunger challenge
The United Nations Sustainable Development Goals include a 50% reduction target for global food waste by 2030. The UN Secretary-General launched the Zero Hunger Challenge, presenting an aspiration goal for zero food loss and waste.
To work towards this vision, UNEP launched the Think Eat Save initiative in 2013 as a public awareness-raising and engagement activity to catalyze global action. In May 2014, UNEP, FAO and WRAP, launched the Think Eat Save guidance for governments and businesses on mapping, planning and delivering an effective food waste prevention strategy (FAO, 2011b). UNEP is currently developing pilot studies to support countries, cities and businesses in implementing this step-by-step methodology. Benefits of piloting the guidance include the development of a local action plan with concrete socio-economic and environmental benefits with the support of a globally-recognized UN initiative and its expert team, enabling participants to build on existing activities and experiences to accelerate change.

120
Opt
ions
tow
ards
env
ironm
enta
lly-s
usta
inab
le fo
od s
yste
ms
GHG emissions) than plant-based alternatives
such as cereals and pulses. As many livestock
products contain saturated fats, a reduction
in their consumption will also have health
benefits. In many developing and emerging
countries too, certain groups (notably in cities)
have also geared towards high consumption
rates of animal products.
−Reducing the intake of certain beverages such
as soft drinks, alcoholic beverages and bottled
water as these have generally low nutritional
value but a high resource use (especially for
transport, packaging and cooling).
There is not always a synergy between ‘healthier’
and ‘sustainable’. Examples where there are
trade-offs are a higher consumption of fatty fish,
fruits and vegetables. In regions with diets that
are low in nutritional value, an increase in meat
and dairy consumption (to a moderate level)
could have positive health outcomes as meat
and fish contain essential nutrients and minerals.
Box 8 Reducing waste in Surabaya through composting and multi-stakeholder collaboration
With three million inhabitants, Surabaya is the second largest city in Indonesia. Waste is a major environmental concern and solid waste management a huge burden on the city’s budget. In the framework of a city-to-city cooperation with Kitakyushu (Japan), Surabaya authorities were able to reduce daily waste by more than 20% from 1500 to 1000 tonnes a day. The process was organized as a multi-stakeholder cooperation. The focus was on organic waste, which accounts for 55% of the city’s total solid waste. Between 2005 and 2009, Surabaya authorities intensively promoted composting practices among households and established composting centers for public operation.
Pusdakota’s community-based composting centre(Photo courtesy of KITA)
Surabaya City’s market-waste composting centres
Composting centres in Surabaya The initiative started in 2004 as a pilot model for efficient solid waste management in a community run by KITA (techno-cooperative association) from Japan and a local NGO (Pusdakota). After a period of testing composting methodologies, training households and distributing composting baskets, Pusdakota started to operate as a community waste station and collected organic and inorganic waste separately from households to produce high quality compost. After initial success, the city authorities started to scale-up this initiative, in close cooperation with KITA, civil society organizations, media and private companies. Between 2005 and 2011 over 80,000 households were trained on composting. Composting baskets were distributed freely to 19,000 households, local campaigns were carried out and additional composting centers were established, 14 of which are operated by the city. The city purchased baskets from Pusdakota and outsourced the distribution to a local women’s group and NGOs.
Eventually these composting centers proved to be profitable, and the rate of return of investments has been estimated to be just over two years. Another interesting finding has been that every kg reduction in organic waste leads to 1–2 kg reduction of other types of solid waste, probably because organic waste separation encourages the reuse and recycling of other dry waste materials.
Similar projects have started in other cities in Indonesia, and the approach has been disseminated to the Philippines and Thailand. An important lesson from these initiatives is that financial and political support from local governments is essential for local groups to start up the operation of composting centers, as they are not able to bring up the investment costs and the demand for compost may fluctuate. Another lesson is that NGOs and community groups have also played an essential role as mediators in the process of the scaling-up and cross-sharing of experiences and good practices.
Source: (IGES, 2009)

121
Food
sys
tem
s an
d na
tura
l res
ourc
es
Box 9 Case Study: Impacts of MERET Project on environment and livelihoods
MERET (Managing Environmental Resources to Enable Transitions to sustainable livelihoods) is a community-based and people-centered land rehabilitation and livelihood improvement project of the Government of Ethiopia that has been supported by WFP-Ethiopia since the mid-1980s (FAO, 2015d).
Rehabilitation of degraded lands and enhancement of environmental goods and services constitutes the core component of MERET. Land degradation and associated poverty was a major challenge in many parts of Ethiopia resulting in extreme food insecurity. Reform of government policy towards addressing environmental degradation through participation of communities and aligning resources from development partners were the major driving force of the initiation of this project. After its success in improving the lives of local communities, the market became a major driver for its continuation. .
The on-site and off-site benefits of MERET are noticeable features of the treated watersheds. Taking a few key biophysical impact indicators, it was observed that MERET was able to induce significant positive changes in the overall vegetation cover, reduction of current rate of soil erosion, improve in soil productivity, improve hydrologic regime and overall change in the micro-climate of the watersheds and their surroundings (Figure B.4).
Figure B.4 Changes in environmental services and goods of watershed treated by MERET Project
(Source, WLRC, 2013)
The outcomes achieved in the domain of watershed rehabilitation combined with homestead development interventions and other income generating activities have brought about enhanced food security and positive livelihood impacts to beneficiary households in the sub-watersheds. The observed impacts include (i) increased crop production and productivity, (ii) increased livestock productivity, (iii) incomes from sale of grass and wood from closed areas, and (iv) increased household incomes from homestead development and income generating activities (See Figure B.5).
Figure B.5 Changes in asset at HH level due to integrated homestead development in Ana Belesa watershed, Lemu, Ethiopia
Source, WLRC 2013(a) house before project intervention, (b) mid-project and (c) end of project. The picture in the left shows a combination of interventions around the homestead including water harvesting.
(b) (C)(a)
Enemerid/M.Shewito (Adwa) in 1986 Enemerid/M.Shewito (Adwa) in 2000 Enemerid/M.Shewito (Adwa) in 2010
122
Opt
ions
tow
ards
env
ironm
enta
lly-s
usta
inab
le fo
od s
yste
ms
7.4.3 Options outside the food system
Reduce the use of biofuels and
natural fibers
Reducing the use of biofuels and natural
fibers is an option largely beyond current food
systems, but as their production requires similar
resources as food (land, water and minerals)
they should be briefly mentioned here. Biofuels
(mainly produced from maize, sugar cane and
oil seeds) now occupy around 4–5% of the
global cropland area (OECD & FAO, 2014).
Their production and use is often stimulated by
legislation as mandatory. A lower production
of biofuels would in principle make more land
available for food production and reduce the
need for new cropland (UNEP, 2014). Also the
production of natural fibers (such as cotton)
requires significant amount of resources, such
as land and water.
7.5 Potential effects of options
What could various options achieve in terms of
a more sustainable and efficient use of natural
resources and reducing environmental impacts?
In various studies, the potential effect of a number
of the options (as mentioned in Table 12) has
been assessed. These studies are very diverse in
character: they vary in geographical scope (from
national to global), the ways in which options are
modelled (individual options versus combination
of options) and results (ranging from effects on
GHG or nutrient emissions to food security).
A common issue is that few studies are able
to model the effect on the sustainable use of
natural resources and most models struggle to
incorporate feedback loops (unsustainable use
of natural resources leading to degradation of
resources which leads to a lower potential in crop
yields, water availability, biodiversity, fish stocks).
There are several useful examples:
−A recent IFPRI publication assessed the
potential effect of a number of technologies
(such as no-till, precision agriculture, drip
irrigation and nitrogen-use efficiency) on
crop yields, prices and food security. The
technologies that lead to the highest yield
increase (15–32%) are no-till (for maize and
wheat), nitrogen-use efficiency (maize and
rice), heat-tolerant maize varieties and precision
agriculture (rice and wheat) (Rosegrant et al., 2014). Many of the technologies also lead to
lower nitrogen losses, lower water use and
higher water productivity (especially drip
irrigation). Many technologies lead to a lower
harvested area (0–10%). Projected kilocalorie
availability improves, while the number of
malnourished children decreases by up to 9%
in certain regions.
−A number of pathways are analyzed in the
Roads from Rio+20 study (PBL, 2012). All of
these pathways (apart from the Trend scenario)
assume that undernutrition is eradicated,
thus more calories are needed. The Global
Technology Pathway addresses most of the
issues through production increase. In the
Consumption Change pathway, an assumed
In terms of adaptation to and mitigation of climate change, MERET has constituted a range of local level adaptation responses which are already responding to climate variability and are vital to enhance resilience to future impacts of climate change. In more specific terms, the achievements of MERET include: (i) unproductive and degraded wastelands have been turned into productive lands for crop production, forage production or woodlands; (ii) integrated application of erosion control and moisture retention measures with soil fertility treatment, mainly compost, has led to increased productivity and yields from cultivated lands; (iii) soil and water conservation has, in some cases, made possible the use of chemical fertilizers and improved crop varieties in areas where this had become impossible due to moisture stress, (iv) rainwater retention within catchments has increased surface and underground water availability and created opportunities for small scale irrigation in downstream areas and reduced flood damage to downstream areas; and (v) household level rainwater harvesting efforts have enabled introduction and production of a wide variety of fruit trees and vegetables formerly unknown to the communities which diversifies income and nutrition at the household level.
MERET communities have become more resilient to climate change, and their livelihoods has significantly improved going from being highly dependent on food aid to becoming self-sufficient and connected to the market.
Bo
x 9
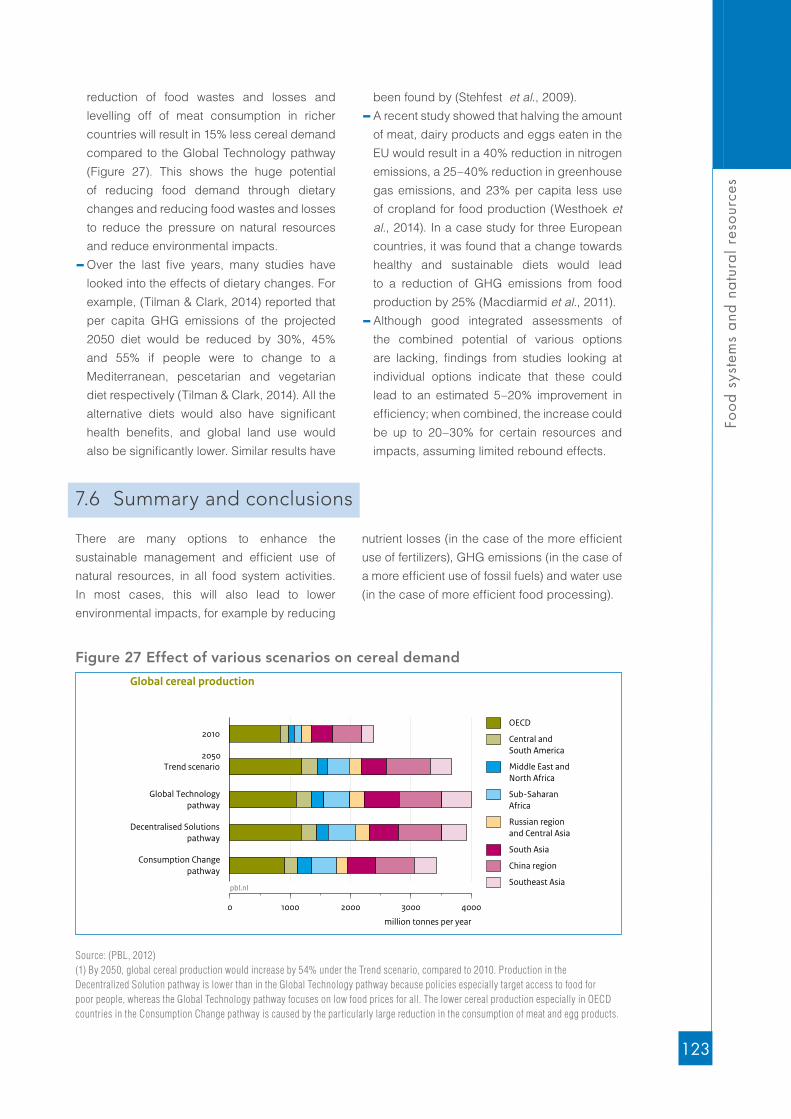
123
Food
sys
tem
s an
d na
tura
l res
ourc
es
reduction of food wastes and losses and
levelling off of meat consumption in richer
countries will result in 15% less cereal demand
compared to the Global Technology pathway
(Figure 27). This shows the huge potential
of reducing food demand through dietary
changes and reducing food wastes and losses
to reduce the pressure on natural resources
and reduce environmental impacts.
−Over the last five years, many studies have
looked into the effects of dietary changes. For
example, (Tilman & Clark, 2014) reported that
per capita GHG emissions of the projected
2050 diet would be reduced by 30%, 45%
and 55% if people were to change to a
Mediterranean, pescetarian and vegetarian
diet respectively (Tilman & Clark, 2014). All the
alternative diets would also have significant
health benefits, and global land use would
also be significantly lower. Similar results have
been found by (Stehfest et al., 2009).
−A recent study showed that halving the amount
of meat, dairy products and eggs eaten in the
EU would result in a 40% reduction in nitrogen
emissions, a 25–40% reduction in greenhouse
gas emissions, and 23% per capita less use
of cropland for food production (Westhoek et al., 2014). In a case study for three European
countries, it was found that a change towards
healthy and sustainable diets would lead
to a reduction of GHG emissions from food
production by 25% (Macdiarmid et al., 2011).
−Although good integrated assessments of
the combined potential of various options
are lacking, findings from studies looking at
individual options indicate that these could
lead to an estimated 5–20% improvement in
efficiency; when combined, the increase could
be up to 20–30% for certain resources and
impacts, assuming limited rebound effects.
7.6 Summary and conclusions
There are many options to enhance the
sustainable management and efficient use of
natural resources, in all food system activities.
In most cases, this will also lead to lower
environmental impacts, for example by reducing
nutrient losses (in the case of the more efficient
use of fertilizers), GHG emissions (in the case of
a more efficient use of fossil fuels) and water use
(in the case of more efficient food processing).
Figure 27 Effect of various scenarios on cereal demand
2010
Trend scenario
Global Technologypathway
Decentralised Solutionspathway
Consumption Changepathway
0 1000 2000 3000 4000
million tonnes per year
pbl.nl
OECD
Central andSouth America
Middle East andNorth Africa
Sub-SaharanAfrica
Russian regionand Central Asia
South Asia
China region
Southeast Asia
Global cereal production
2050
Source: (PBL, 2012) (1) By 2050, global cereal production would increase by 54% under the Trend scenario, compared to 2010. Production in the Decentralized Solution pathway is lower than in the Global Technology pathway because policies especially target access to food for poor people, whereas the Global Technology pathway focuses on low food prices for all. The lower cereal production especially in OECD countries in the Consumption Change pathway is caused by the particularly large reduction in the consumption of meat and egg products.

124
Opt
ions
tow
ards
env
ironm
enta
lly-s
usta
inab
le fo
od s
yste
ms
Options to attain a sustainable use of
renewable resources (land, soils, water, and
ecosystem services) are largely connected to
farmers (including aquaculture) and fishermen,
as they are typically the main users of these
resources. Potential biophysical options are the
prevention of land degradation (e.g. by keeping
the soil covered and by using soil amendments as
compost), limited water use to prevent depletion
of aquifers and the inclusion or conservation
of biodiversity in agricultural landscapes. An
important measure for fisheries is balancing fish
catches with their ecological carrying capacity.
There are many options to improve the efficient
use of natural resources in agricultural systems.
Sustainable intensification is an important route,
mainly increasing crop yields with no negative
effects on other resources and no additional
environmental impacts. Other important ways
to improve resource efficiency are better water
management (both of rainwater and irrigation
water), a more effective use of ecosystem
services (for example for pest and disease
management, which could reduce the use of
pesticides), and better nutrient management.
An important route to improve nutrient efficiency
is the closing of the crop-feed-manure loop.
This loop is now often broken due to a spatial
segregation of crop and livestock production.
There are good opportunities in pastoral
livestock systems to increase production while
using the same amount of natural resources
(mainly land, including ecosystem services and
genetic material). In pig and poultry production,
opportunities exist to increase feed efficiencies.
On the demand side, the reduction of food
losses and waste is a crucial route to improving
the resource efficiency of food systems. The
main causes of food losses in the field are pests
and diseases. Post-harvest losses are often due
to inadequate storage allowing rodent and insect
damage, insufficient processing capacity at the
farm or local level and other logistical issues.
Food availability in rural areas in developing
countries will generally benefit from a reduction
in past-harvest food losses. There is no simple,
single solution to the reduction of food losses
and waste. In many cases, systemic solutions are
needed, such as improving rural infrastructure
or changes in the institutional configuration.
Food waste and residues from food processing
still contain valuable minerals and organic
substances which could be recycled to farms,
for example in the form of feed or compost. Food
waste might also be used for energy production,
for example through industrial digesting.
Changes in food consumption patterns have
a significant potential to reduce the use of natural
resources and environmental impacts. In affluent
societies, people currently consume relatively
high amounts of various animal products (meat,
eggs, dairy and fish). In general, a shift to a more
plant-based diet would lead to lower resource
use as well as to healthier diets, because of
the lower intake rate of saturated fats as well
as of red and processed meat. For hungry and
undernourished people the situation is obviously
different.
There are thus significant opportunities to
reduce resource use on the consumption
side. A reduction in food loss and waste, and
a levelling off of meat and dairy consumption
in richer societies could for example result in a
15% lower global cereal demand compared to a
baseline scenario.


Opportunities for a transition
towards sustainable food systems
Chapter
8
Cre
dit:
Mar
co A
lhel
m, S
hutt
erst
ock.
com

127
Food
sys
tem
s an
d na
tura
l res
ourc
es
8.1 Introduction
A sustainable food system is defined as ‘a food system that ensures food security and nutrition for all in such a way that the economic, social and environmental bases to generate food security and nutrition of future generations are not compromised ’ (HLPE, 2014a). Chapter 4 of this
report demonstrated that current food systems
do not result in proper nutrition for many people
in different world regions. Chapter 5 established
that, in many cases, natural resources are not
managed sustainably or efficiently throughout
food systems, leading to risks for future
food supply as well as high and increasing
environmental impacts. Chapter 6 analyzed the
contexts in which food systems operate, many of
which lead to an unsustainable or inefficient use
of natural resources. Chapter 7 demonstrated
that there is a large range of biophysical options
to improve the use of natural resources in food
systems.
This chapter presents the institutional options
to move towards environmentally-sustainable
food systems, exploring how a transition in
this direction could be stimulated. It provides a
thinking framework illustrated by some exemplar
actions currently taking place within food systems.
8.2 Limitations and the need for realism
First, it should be stressed that the necessary
transition will mainly involve adaptations within a
given food system (as described in Chapter 3).
The type (or types) of food systems in a certain
region is mainly the result of the prevailing socio-
economic and biophysical contexts, and the
transition pathway needs to be developed within
those contexts.
When trying to identify pathways towards
sustainable food systems a number of factors
mean that some realism should be observed:
−Food systems are globally very diverse as well
as complex and dynamic (Chapter 3). This
implies that there are no ‘universal’ solutions,
−Moreover, such a transition has many
features of a ‘wicked’ problem (Allen et al., 2011, Ludwig, 2001). Food systems are not
only complex; there are many differences in
perception in society on the critical issues and
challenges, as well as on pathways forward.
There is also considerable disagreement on
the role governments could (or should) play.
−Food systems are more and more governed
by private actors (Schilpzand et al., 2010a),
acting across national borders, making it
harder for governments to exert influence
(Schilpzand et al., 2010b). Due to urbanization
and globalization the spatial, and –although
harder to prove – mental disconnect between
food production and food consumption is
growing. This makes it harder for consumers
to influence production practices, but certainly
not impossible.
−There is a significant lack of information
concerning both the current state of natural
resources for, and the environmental impacts
of, food systems (Chapter 5);
These factors do not mean nothing is possible,
as will be shown in the rest of this chapter. It is
however important to make the point that, given
different interests and the huge complexity,
no ‘blue-prints’ or general recommendations
can be provided. Making progress towards
sustainable food systems will imply ‘muddling
through’ (Sayer et al., 2013). Incremental
improvements are therefore important to make
progress. The massive challenges do however
justify radical incrementalism (Hajer, 2011). In
most cases, it will require learning-by-doing and
adaptive approaches (Allen et al., 2011, Ludwig,
2001, Sayer et al., 2013). Given the large global
variation in food systems, this report can only
be generic and provide a framework of thinking,
underlining that actual actors on the ground
have to cooperate to make food systems more
sustainable and healthier.
128
Opp
ortu
nitie
s fo
r a
trans
ition
tow
ards
sus
tain
able
food
sys
tem
s
8.3 ‘Principles’ and importance of the ‘food system lens’
The motivation to apply a ‘food system lens’ has
been provided in Chapter 2 and the following
chapters have supported the value of such an
approach: using a food systems approach is
an important method to identify and analyze
issues around food systems and natural
resources, as well as to identify concrete options
and opportunities for change. Governments,
researchers and private actors often focus on
farmers and fishermen to attain a more efficient
and sustainable use of natural resources, or
on one issue (‘carbon footprints’), or on one
commodity. Some examples are:
− resource-oriented policies and actions, for
example targeting sustainable land use (Sayer et al., 2013, Scherr & McNeely, 2008, Verburg et al., 2013), efficient use of nutrients (Oenema et al., 2007, Sutton et al., 2013, Sutton et al., 2011b), and water use (De Fraiture et al., 2014, FAO, 2011e, HLPE, 2015, Hoekstra &
Mekonnen, 2012, WWAP, 2015).
−commodity-oriented policies, for example
around soy beans (Nepstad et al., 2014, RTRS,
2010) and palm oil (Oosterveer et al., 2014,
RSPO, 2013), or in general production chain
oriented (Oorschot van et al., 2014).
− issue-oriented policies, for example reduction
of food waste (Gustavsson et al., 2011, HLPE,
2014a), climate-smart agriculture or dietary
changes (FAO, 2010, Tilman & Clark, 2014,
Westhoek et al., 2011).
All these approaches certainly have their merits
and should be mainly continued, as in a many
cases an approach that targets one commodity
or one resource might be very effective. In other
cases, a food system lens has added value, as
it looks systematically at both mechanisms and
actors in the food system, and not only at the
level of primary production, but along the food
chain. The approach also looks at aspects of
food consumption, food loss and waste. The
food system lens can thus facilitate reframing the
thinking in terms of ‘resource-smart food systems’.
In a food system approach one actor can
stimulate another to take action, as in the case
of MSC fisheries where food companies and
supermarkets enable fishermen to adopt better
fishing techniques (see Box 11). Or governmental
programs for school lunches lead to better
nutrition but can also stimulate local farmers’
choices (see Box 12).
Finally, it has to be acknowledged that the
food system approach is based on a ‘vertical’
food chain concept, identifying where food
systems activities interact with natural resources.
There are many other factors besides food
system activities involved in natural resource
management warranting a more ‘horizontal’
landscape approach, which also addresses other
activities in landscapes. These landscape-level
considerations need to be seen as complementary
to the integrated food system approach.
8.4 Analysis of national or regional food systems and impact on national resources
Given the limitations of a general, global
approach, it is suggested that governments and
other actors operating at a national level (or at
city level) start with a comprehensive analysis
of the national food system. This can assist in
the identification of the most important issues
regarding natural resources as used in national
food systems, as well as effective opportunities
for intervention. The level or type of analysis
(country, regional; local, urban) depends on the
goal. As a first step, it is good to realize (see also
Chapter 2 and 3) that the ‘food production system’
(including agriculture, fisheries and related food
processing) generally does not geographically
coincide with the ‘food consumption system’
(see Figure 28), and hence the importance of

129
Food
sys
tem
s an
d na
tura
l res
ourc
es
trade and transport infrastructure. Part of the
national (or local) production is usually exported
to other regions, and part of the consumed
food is imported. The share of imported or
exported food in the total food production and
consumption does not only depend on the share
of food that is produced at the given level, but
also on the related socioeconomic and political
contexts. The difference between nationally- (or
locally-) produced food and imported food is
relevant as national governments generally have
more influence over national natural resources
as needed to support the food system, then they
have over those used to produce food elsewhere
in the world. The growing urban populations
are a special case as almost all of the food will
come from outside the city’s boundaries. In this
case, a food systems approach is particularly
useful. There are many opportunities to improve
national resource efficiency by actions at city
level, for example by promoting small-scale
horticulture (which significantly helps nutrition
and livelihoods), reducing food waste, promoting
different diets and by recycling food residues and
nutrients back to the rural areas. To assist in this
analysis, a draft framework has been developed,
but this should be seen as a first step, which
should be further developed and improved (see
Box 10). The FAO has also developed a set of
indicators on good governance, natural use and
social well-being (FAO, 2013c).
Box 10 Draft framework for analyzing national food systems, with focus on national resources
On the present prevailing food systems 1. What is the prevalent type of food system? Who are the principal actors? What is the relation between
national food production and food consumption?
2. How is food production (farming, fishing) organized? What farms and fishery types are dominant? What is the size and nature of livestock and aquaculture production?
3. Where is primary and secondary processing done and by whom?
4. Where is food being transported from and how?
5. How is food consumption being organized? What is the share of supermarkets and out-of-home consumption in total expenditures?
On natural resources:1. What is the nature and extent of land use: is there expansion or contraction of the agricultural area?
What is the situation regarding land degradation? How are crop yields compared to similar regions / potentially attainable yields? How is pasture land being used?
2. How are fisheries managed? What is the status of fish stocks? Is there aquaculture, and what are the related environmental impacts?
3. What is the situation regarding plant and animal breeds: availability, diversity, quality, genetic potential?
4. What is the nutrient use efficiency, amount of nutrients (minerals) being used, nutrient losses?
5. Is water being used sustainably and efficiently in irrigation and food processing? Are groundwater levels being monitored? Is there potential for expansion of irrigated area?
6. What are the amounts and proportions of fossil and biomass fuel used in which food system activities?
7. What are the overall environmental impacts: GHG emissions, nutrient losses, pesticide emissions, soil and water quality?
8. How are property rights and land tenure organized?
With respect to food demand:1. What is the food security situation (stability of food availability, food access, food utilization)?
2. What is the nutritional security situation (prevalence of undernutrition, overnutrition, other forms of malnutrition? What is the trend in diets over the last 10 – 20 years? What are the expectations for the future? What is the share of livestock products in diets?
3. How much fossil fuels and packaging are used in food consumption?
4. How much food waste occurs? What is happening to food waste, food residues and human excreta?
5. What is the fate of nutrients entering urban food systems?
With respect to actors, institutions, regulation:1. What kinds of regulation are in place to regulate food system activities, and the use of and access to
natural resources?
2. What kinds of environmental regulation are in place? How are they implemented and enforced?
3. Which subsidies are installed? What is the tax regime? Are there import and export tariffs?

130
Opp
ortu
nitie
s fo
r a
trans
ition
tow
ards
sus
tain
able
food
sys
tem
s
Figure 28 Schematic representation of a national (or regional) food system, disaggregated into a food production and consumption system
Linkages between national food production and food consumption
Source: PBL
Exported food
National food production system:Farming, fisheries,food processing, ...
National food consumption
system:Consumers,
retailers, restaurants, ...
Imported food
Impact on naturalresources elsewhere
Impact on nationalnatural resources
Food produced andconsumed nationally
(or locally)
Food security aspects:• Food availability
• Food access• Food utilisation
How can natural resources be used more sustainably and efficientlyboth within and outside national borders?
8.5 Three pathways towards environmentally-sustainable food systems
Drawing from the transition theory (Haan de &
Rotmans, 2011) three governance dynamics or
‘pathways’ can be distinguished that have the
power to reshape current food systems, and
hence their interactions with natural resources.
These governance dynamics are (i) reforms
by governments and international institutions;
(ii) adaptations by food system actors; and (iii)
alternative (niche) innovators. The question of
how these three pathways interact and co-evolve
largely depends on the context and the type of
food system.
8.5.1 Reforms by governments and international institutions National and local governments play an important
role in pursuing public goals like human health,
education, the sustainable use of natural
resources and the mitigation of environmental
impacts by human actions. States are often the
legitimate authority to establish legal frameworks
and their decisions give direction to societal
change. Aside from national governments,
international institutions play an important role for
similar reasons. International trade agreements
(either in the framework of the WTO or bilateral
agreements) have an influence on a country’s
agricultural and fisheries sectors. Governments
can intervene in the functioning of food systems
by creating positive and negative pressures and
incentives, by initiating public debates and by
triggering people and businesses to think in new
directions. An overview is given in Table 13 of
existing regulations and entry points that states,
local authorities, international institutions and
other actors could use to initiate change in food
systems to promote the sustainable use of natural
resources and reduce environmental impacts.
One of the priority areas for government reforms,
particularly in lower income countries, is to
establish clear property and tenure rights regimes
for natural resources (see Chapter 6). It must be
131
Food
sys
tem
s an
d na
tura
l res
ourc
es
noted that decentralized government units often
lack the financial and administrative capacity for
the allocation of resources and are often unable
to solve natural resource-related conflicts. At
the international level, global guidance is useful
for national governments in setting up land
use and land tenure laws and ensuring their
local implementation and enforcement, as for
example is done in the Voluntary Guidelines
on Responsible Governance of Tenure of Land
and other natural resources by the Committee
on World Food Security (CFS, 2012b). Another
priority issue for government reform especially in
low income countries is the need for investments
in rural infrastructure including irrigation, water
supply, roads and services that enable both
local production and ‘value-addition’ activities
such as processing and packaging (HLPE,
2013b, World Bank, 2007).
Incentives for food systems actors, to prevent
them from imposing negative externalities
can stem from environmental regulations (e.g.
environmental standards) or pricing externalities.
To be effective it is important that legislation
is binding and enforced both at international
and national levels. At the national level,
governments can initiate environmental fiscal reforms that tax and discourage non-sustainable
production practices; this could for instance
be done through policies that put a price on
greenhouse gas emissions, nutrient leakages to
groundwater or water use. Another measure that
could trigger improved use of resources is the
creation of markets for resource ‘stocks’ such as
for water (OECD, 2010), or financial incentives
for natural resource users through PES schemes
(FAO, 2007).
Another priority area is the removal of subsidies
that encourage unsustainable or inefficient
production or practices like the subsidies for
fossil fuels that stimulate for example water
extraction for irrigation or unsustainable fishery
practices (see examples in Chapter 5 for both).
Price subsidies for agricultural commodities
(for example for rice and sugar), which are
generally distorting and lead to overproduction
and inefficient practices (see also Chapter 3),
could also be revisited by national governments
(OECD, 2013c). Other policies that could be
revised are targets and subsidies related to
biofuels. Countries could reverse the demand
for biofuels by eliminating the direct and
indirect subsidies to produce fuel crops and
by phasing out biofuel quotas (HLPE, 2013a,
UNEP, 2009, UNEP, 2014). There are already
various examples of environmental policies
in the form of environmental regulations or
taxations of pollution, for instance the EU
Nitrates Directive (Velthof et al., 2014) and EU
pesticides measures. It should however also be
noted that, in many countries, such measures
have often met with resistance. Reporting on the
implementation of such regulations in the EU,
US and Canada, (Grossman, 2006) shows the
difficulty of applying the polluter pays principle
to agriculture, as it is complex both to control
diffuse emissions from agriculture and to allocate
responsibility for the remaining emissions.
Aside from regulation and financial policies, policy
interventions could include the development of
physical infrastructure (especially focused at rural
infrastructure), capacity building for best farming
practices, and measures to improve a better
functioning of markets (with special attention to
the position of smallholders and consumers).
Evidence from Asia and Africa has proven that
investments in rural infrastructure, agricultural
research and extension have large impacts on
agricultural productivity and poverty reduction
(Fan, 2010, HLPE, 2013b). Rural Areas are
critical points of intervention in the food system
considering most of the poor populations in the
world depend directly or indirectly on agriculture
to produce their own food and generate their
income. With improved rural infrastructure and
relatively simple technologies, some quick and
significant gains can be made in terms of reducing
pre- and post-harvest losses in low income regions
(HLPE, 2014a, Lipinski et al., 2013). Governments
in many low income countries however often lack
sufficient capital and infrastructural development
often does not materialize. Considering the
magnitude of the need and the potential benefits
to food systems as a whole, it is in the interest
of many to pool resources and invest in rural
infrastructure and services.

132
Opp
ortu
nitie
s fo
r a
trans
ition
tow
ards
sus
tain
able
food
sys
tem
s
Table 13. Non-exhaustive overview of current policies influencing directly or indirectly food systems and the use of natural resources
Aspects International institutions National governments Local authorities Agriculture Trade policies and
agreements Common principles for agricultural practices Research and innovations relevant for vulnerable groups and environments
Agricultural policiesSustainable Public Procurement Policies Mainstream (private) standards and certification schemes Rural investments (infrastructure, rural services)
Iterative technology development with farmersInstitutional strengthening of local groups and farmers (cooperatives, water groups, farmer field schools, etc.)Local extension services
Fisheries Treaties on fisheries (200 miles zone, UN Fish Stocks Agreement) in High Seas, Code of Conduct for Responsible Fisheries for fisheries;
Standards for fish stocks, genetic diversity, rules and guidelines for aquacultureStandards for sustainable fishing
Formal and informal arrangements on fishing rights, quotas, etc.
Resources International Treaty on Plant Genetic Resources for Food and Agriculture;(Voluntary) Guidelines on Responsible Governance of Tenure of Land and other natural resources (CFS and FAO); UNCCD
Property rights regimes, legal frameworks Markets for resource stocks (water, fish)PES schemes Laws for genetic resources
Resource allocation and (integrated) resource use plansMonitoring quality and quantity of resources Local breeding programmes and seed banks Urban infrastructure (waste, sewage, water reuse)
Environmental impacts
Various conventions and processes (UNFCC, CBD, IPCC) UN – System of Environmental-Economic Accounting 2012 / Experimental Ecosystem Accounting (SEEA)
Environmental regulation (pesticides, fertilizer, water quality, waste disposal)Eliminate harmful policies and subsidies (biofuels, water use, pesticides, etc.)
Monitoring/taxing environmental standardsWaste management (and reuse)
Food safety SPS (The Agreement on the Application of Sanitary and Phytosanitary Measures); Codex Alimentarius (International food standards)
Food security policies (for example minimum stocks of notably cereals)
Food and health
International guidelines (WHO)
Regulating the food environment (stricter rules on marketing, promotion, labelling, etc.)Dietary guidelinesNational campaigns to promote diets.
Local regulation of the food environmentCooperation with retailers to establish codes of conduct
Food security SDGs, Zero Hunger Challenge, etc.Committee on World Food Security (CFS)
Food programmesPrice support to farmers National food stocks
Local food stocks
Economic and fiscal policies
Treaties and Voluntary Agreements on investments and business practices (e.g. UN Global Compact, FAO / OECD guidelines).Principles for responsible investments in agriculture and food systems (CFS 2014)
Regulations for sustainable sourcing (adopt and mainstream standards, certification schemes) Environmental regulations and fiscal reforms (tax on using inputs or related pollution)Subsidies (water, fertilizers)Changes in anti-trust laws
Monitor contractual agreements farmers-buyersRules and regulations for retailers/food industry to source locally Pool private investments for rural development
Food and waste (including recycling of nutrients)
Establish guidelines, indicators and international targets for waste reduction and monitoring
National Waste Reduction strategies and targets Regulations and taxes on waste disposalSubsidies for new technologies Facilitating of multi-stakeholder platforms
Local wet marketsUrban infrastructure (waste, sewage, water reuse)Municipal waste management and reuse Local strategies to prevent and reduce food waste
Food and education
Global Food Education campaigns (e.g. Think, Eat, Save)
Inclusion of food in primary and secondary school curriculumsRegulations on labellingInformation campaigns Institutions for consumer and health protection
Educational programmes and campaigns School gardens Composition of school mealsLocal information campaigns

133
Food
sys
tem
s an
d na
tura
l res
ourc
es
8.5.2 Private actorsIn the past few decades, a shift has occurred
in the governance of food systems from public
to private actors, which is largely related to
the ‘rolling back’ of the state as outlined in
Sections 3.4.1 and 3.4.2. Many businesses
recognize the pressures on natural resources
and food systems and have started to perceive
these as threats to their – possibly long-term –
operations. Consequently, many businesses
are experimenting with innovative business
models and adapting their strategies for more
sustainability (KPMG, 2012). These dynamics
can be referred to as the adaptation pathway
in which change is initiated from within the
prevailing system and by actors that already
determine its current functioning. Forerunners
in the food system thus act as main agents of
change on a voluntary basis and apply self-
steering mechanisms.
Businesses increasingly recognize the need to take
steps towards sustainability and act individually
or collaborate around technological innovations
with other businesses, civil society organizations
and governments at a pre-competitive stage.
Several examples of ongoing private initiatives
are given in Table 14. The Sustainable Agriculture
Initiative Platform (SAI) is an example of a private
initiative that brings around 50 leading businesses
together to cooperate on a joint agenda. These
businesses jointly analyze problems, formulate
shared values, goals and standards and monitor
and support each other in the implementation of
agreed sustainability measures. Multi-stakeholder
platforms are another form of collaboration with
a diverse and flexible membership base that
attempt to tackle issues at a sector or supply-chain
level and over a longer period of time. Examples
are The Roundtable on Responsible Soy (RTRS),
the Roundtable on Sustainable Palm Oil (RSPO)
and The Global Roundtable for Sustainable Beef
(GRSB). These initiatives thus can potentially lead to shifts towards sustainable production in
some sectors. However, it has to be noted that
businesses are mainly profit-driven, and that they
will only undertake actions to a certain levels of
costs. One of the reasons is the fear of ‘free-riders’,
companies who do not take action but who profit
from actions taken by others. Another mechanism
is ‘green-washing’, where companies overstate
their actions or claims on products, in order to
meet consumer demand for environmentally
friendly goods and services.
Proactive companies in the food sector, as in
other sectors, have essentially three drivers to
work for sustainable food systems:
1. Supply risk management: through various
sustainability innovations, businesses try
to secure continued crop supply, which is
fundamental to their business operations.
2. Improve reputation: increasing pressure by
consumers in the marketplace, but mostly
by civil society opinion steered by pressure
groups and NGOs, demand a proactive
action by private companies in manufacturing
and retail sectors (particularly those facing
the consumers, but increasingly also their big
suppliers of commodities and raw materials).
These companies realize that unless they can
prove due diligence in their operations they
risk losing consumers who are increasingly
aware and informed.
3. Sustainability as a business model: companies
that believe in sustainability as the only valid
way of doing business and work under the
assumption that only proactive companies
who do their bit and beyond to ensure
sustainability will win in the marketplace.
8.5.3 Alternative (niche) innovators and NGOsCivil society actors have been another driving force
in food system governance. By using information
from research and international fora (e.g. IPCC,
UNEP, FAO), pilot projects, information channels,
local and international networks, these actors play
an important role in drawing the public attention
to the adverse outcomes of current food systems.
Through lobby and advocacy, these actors inform
the public and put pressures on companies and
governments to address these adverse outcomes
(Doh & Guay, 2006, Oosterveer & Spaargaren,
2011, Schilpzand et al., 2010b). These actors
experiment with food system innovators, and
although some innovators initially emerge as
niches, those that prove viable can sustain. The
innovators can thus inspire other companies,
governments and other more mainstream food
system actors.

134
Opp
ortu
nitie
s fo
r a
trans
ition
tow
ards
sus
tain
able
food
sys
tem
s
Table 14. List of illustrations of sustainability-encouraging initiatives by the private sector (non-exhaustive)Initiative Initiators Target Type of intervention
SAI Platform Food and drink companies
Farmer Consensus about farm sustainability requirements
Global GAP Retail Farmer Food safety and farm audit systemUN Global CompactAnd Global Reporting Initiative
Companies and governments
Whole value chain Consensus on high level principles
TSC Retail Whole value chainThe Roundtable on Sustainable Soy (RTRS)
Sector and NGOs
One commodity Certification
The Roundtable on Sustainable Palm Oil (RSPO)
Sector and NGOs
One commodity Certification
Source: based on (Ywema, 2014)
Box 11 MSC and the NetherlandsThe Marine Stewardship Council (MSC) was founded in 1997 as a joint project between the WWF and Unilever. During a two-year process they developed a set of criteria for sustainable and well-managed fisheries, which was used from March 2002 onwards as a label on products (PBL, 2014b). In 2008 Dutch supermarkets set the goal to only sell sustainable fish by 2011, mainly focusing on MSC and ASC (Aquaculture Stewardship Council) certified products. At the end of 2011 around 85% of the supply of fish in supermarkets (fresh fish and frozen fish from private labels (own brands) was MSC-certified (or comparable). No specific targets are set for other brands.
The amount of MSC-certified products consumed has increased considerably: from 6% of the consumption in 2007/2008 to almost 40% of the consumption in 2011/2012 (PBL, 2014b). This is lower than the share in supermarkets as a result of a lower percentage in specialized shops and fresh produce markets. MSC did lead to economic benefits for some fisheries as it provided market access and price advantages (PBL, 2014b). The higher price enabled fishermen to adopt new, less harmful fishing techniques. A positive by-effect is that the new methods require far less fuel. The Dutch government played a facilitating role, partly by subsidizing the cost of the development of certification schemes, partly by fiscal measures which supported investments in new fishing gear.
Figure B.6 Fish consumption in the Netherlands
2004 2006 2008 2010 2012
0
10
20
30
40
50
60thousand tonnes
Source: MSC International, 2012
pb
l.nl
Total household consumption(excluding restaurants)
Non-certified
Aquaculture
Wild catch
MSC certified
Wild catch
Dutch consumption of fish
Source: (PBL, 2014b)(1) The consumption of fish in the Netherlands is increasing, and that is primarily due to the increasing amount of aquaculture. The share of the MSC certification label in the consumption of wild caught fish has risen to 40%.

135
Food
sys
tem
s an
d na
tura
l res
ourc
es
Figure 29 Spiral movements created by the co-evolution of different pathways
Towards sustainable food systems
Source: PBL
4. Government reforms or legislation
3. Scaling-up by businesses
3. Scaling-up by businesses
Repeat of step 1
3. Scaling-up by businesses
1. Government reforms
1. NGO initiative
2. Supportedby NGO
2. Forerunning business
2. Forerunning business
New standard setby governments
1. Forerunning business
Time
Sustainability
(1) Small actions and innovations are gradually taken over by frontrunners (private actors), governments respond by institutional arrangements to enable scaling up, until the practice is applied by 80–90% of the industry.
8.5.4 Co-evolution of three pathways for an upward spiral movement The governance dynamics in reform, adaptation
and niche-innovations are not mutually exclusive
but usually co-evolve alongside each other (see
Figure 29). The interplay and synergies among
these three pathways could create a culminating
effect towards more sustainable food systems.
Businesses with international operations could
benefit from the expertise, strengths and position
of civil society and governments, for instance in
expanding their business into new unfamiliar
contexts or in making sustainability shifts. In
their turn, civil society can utilize the power and
capacities of private actors, which is otherwise
out of their reach. Civil society organizations
could also play a watchdog role to ensure that
private actors comply with public norms and
standards as established by governments and
international institutions.
Finally, civil society actors and governments
could align with existing multi-stakeholder
roundtables to ensure that public values and
interests are well represented. At this point, the
practice becomes the new norm, either set by
governmental reforms or industry standards.
To realize the upward spiral movements, both
governments and the private sector need to
reconsider their roles and approaches. An
example of such an approach is the development
of the Marine Stewardship Council (see Box 11).
In this example, governments have mainly played
a facilitating role, although it has not resulted yet
in new standards.
8.5.5. Flexible, participative governance and co-opting with private actors that integrate sustainability as the core of their businessIn a context of rapidly changing socio-economic
environments and the shift of power to private
actors, governments have come to a point where
they need to rethink their roles, responsibilities
and approaches to public governance. With
regard to food systems, governments’ role
and influence has been diminishing, while the
complexity of food systems has been growing.
Contrary to traditional societies, the connection
between food and consumption no longer
takes place within clear boundaries, making it
more difficult for governments to regulate and

136
Opp
ortu
nitie
s fo
r a
trans
ition
tow
ards
sus
tain
able
food
sys
tem
s
control. Therefore, to realize ambitions towards
sustainable food systems, governments need to
co-opt with private actors and civil society, and
use their positive energies and power as a vehicle
for change. Regardless of how effective these are,
the existence of so many initiatives proves that
there is some form of awareness and willingness
to change among private businesses. It is argued
that governments lag behind businesses and
civil society in sustainability innovations (Lang
& Heasman, 2004, WWF, 2014). Co-opting with
private actors requires governments to adopt
institutional frameworks that are flexible and
participative and which facilitate these new types
of alliances to collaborate, experiment, and learn.
Governments could pay attention to the following
to create a more enabling environment for private
actors to scale up their innovations:
−Creating a level playing field through regulatory
pressures for sustainability.
−Deal with the distrust among businesses. In a
context of high competition, cooperation can
be counterintuitive or jeopardize corporate
interests, which may withhold businesses
from cooperating. Governments could initiate
multi-stakeholder platforms and play the role
of a ‘third party’ that facilitates and mediates
between different stakeholders. Civil society
organizations (NGOs) could also take on this
role of third party.
Box 12 The School Lunch Programme in Brazil: The case of ParagominasIn Brazil, eating at school is considered a right of students in public elementary school and a state duty. For practical reasons, many schools purchase their meals from large companies, while one of the great challenges of the local administration is to improve the quality of school meals and at the same time improve local food production.
Against this background, in 2009 the Brazilian government passed a law that required at least 30% of the total funds allocated in the National School Feeding Programme (PNAE) to be used to purchase food directly from family farms. This requires special attention to guarantee that the producers are able to produce the required quantity, quality and regularity, which is challenging because in general the local production is irregular and below quality standards. However, some cities have achieved good results, as in the case of Paragominas, in the Pará State of Northern Brazil.
The city of Paragominas (with around 100.000 inhabitants) had already started to enable the purchase of food from family farms since 2005, planning a balanced menu, controlling the quality of products and monitoring food handling. Most of the vegetable production from family farms was targeted at school lunches, through a partnership agreed with the city. The introduction of local production using vegetables rich in iron and regional fruits like açai ensured that the nutritional needs of students were met and, in fact, contributed to the improvement in education indicators of the municipalities. Beyond this benefit, the relationship between school meals and local family farm production stimulated production, the organization and strengthening of associations of farmers and the value of household production. This promoted increased investment to diversify production, introduction of gardens with greenhouses, irrigation water, artesian wells, fish farming and added value to products, among other things. All this contributed to boosting the local economy, improving the supply of food, ensuring food security and simultaneously providing healthy food for school students.
(1) Law no 11.947; http://www.planalto.gov.br/ccivil_03/_ato2007-2010/2009/lei/l11947.htm) (2) School lunch programmes can help reconnect urban demand and regional production (pictures are not from the Paragominas region) http://www.agriculturesnetwork.org/magazines/global/regional-food-systems/brazil-paa

137
Food
sys
tem
s an
d na
tura
l res
ourc
es
−Actively address institutional constrains. A
barrier for private actors to cooperate is the fear
that this could be illegitimate and against existing
competition laws and anti-trust agreements. To
create space for cooperation, governments
could make exceptions in competition law that
makes cooperation possible. Governments
need to be in continuous dialogue with
businesses and platforms to learn about the
institutional barriers private actors face in
scaling up innovations, and try to address these
barriers, for instance through cross ministerial
dialogue for institutional adaptation.
−Financial support for innovation and scaling up.
Both governments and businesses can pool
resources to invest in sustainability innovations
and collaborate to manage and spread risks
associated with new technologies.
Obviously, the interaction between administration,
private partners and NGOs can materialize at
different levels: global, national and locally.
Examples at the global level are the UN Global
Compact (UN Forum for Sustainability Standards)
as well as the Sustainability Assessment of Food
and Agriculture systems (FAO).
8.6 Nodes of action
Chapter 6 and the previous paragraphs have
provided a broad overview of the role and
processes through which governments, private
actors and civil society could move towards
sustainable food systems. This section presents
several ‘nodes’ as areas for concrete action.
Although many more nodes exist, the identified
nodes are areas where cooperation between
governments, private sector and civil society
could have significant potential for a transition
towards sustainable food systems.
8.6.1 Cities and reconnecting urban – rural relationshipsCities are, for a number of reasons, very important
nodes in food systems, both in industrialized
countries, as well as in low income regions
(Garnett et al., 2015). Globally, more than 50% of
the population now lives in cities, implying that at
least 50% of the food is consumed in cities, and
that large quantities of nutrients are transported
to cities. Cities can therefore be the node where
a transformation towards more sustainable food
systems might start.
Urbanization, which is currently occurring
very rapidly in many developing countries
(Chapter 4) has a large impact on food systems
and therefore on the use of natural resources
(Chapter 4 and 5). Examples of transformations
are supermarketization and changing food
preferences: more ultra-processed food, meat,
rice and wheat, less tubers and coarse grains.
These transformations can have a large effect
on smallholder farms in the region, for example
because they are often not able to match the
requirements or product quality standards set
by procurers, or because they are trapped in a
price-cost squeeze (HLPE, 2013b). In response,
large buyers often prefer imported food products
in order to meet the demand, implying that local
farmers hardly profit from the increased buying
power from cities. If smallholder farms would
be better connected to the urban markets in
their region, this could lead to investments and
increase in local production capacity. Provided
that these investments are directed in the right way
(for example to support sustainable intensification
or sustainable fisheries practices) this could lead
to a more efficient and sustainable use of natural
resources. This is of course only possible if there
is enough potential to increase in a sustainable
manner the agricultural production around the
involved cities. Locally or regionally produced food
is certainly not by definition more environmentally
friendly (Edwards-Jones et al., 2008).
Re-linking urban demand with regional
production can also provide important economic
opportunities for farmers, only if the necessary
regulatory instruments are established to bridge
the significant gap in economic and political power
between smallholders and their organizations
on the one side, and the other contracting
organizations (such as supermarkets and large
138
Opp
ortu
nitie
s fo
r a
trans
ition
tow
ards
sus
tain
able
food
sys
tem
s
food companies) on the other side (HLPE,
2013b). Contract farming is not a priori beneficial
for smallholders; it needs certain supports and
policies to be successful (ibid.). Re-linking also
offers many opportunities for new enterprises
such as packaging, transporting and trading to
emerge. A concrete example of re-linking urban
demand with regional production is the case of
School Lunches in Paragominas (see Box 12).
Urbanization also causes a mental disconnect
between food consumption and food production.
An increasing number of people do not know
how food is being produced, and how much
effort it takes to produce food. This could lead
to unhealthier diets and higher food wastes.
However, cities are also the breeding places
of new initiatives, as well as social and cultural
movements. Although city dwellers are sometimes
not well informed or have romantic ideas about the
reality on the ground, as well as on the potential of
certain ‘solutions’, this kind of initiatives could be
an important starting point for innovations. Various
resourceful studies have explored opportunities
that cities offer to drive society towards a green
economy, such as the Green Economy report by
(UNEP, 2011c) and City-level decoupling report
(UNEP, 2013) that zoomed into resource flows
and infrastructural re-configurations that would
contribute to a green economy.
In many cities, initiatives have started around
urban agriculture (or actually mostly horticulture).
Although globally urban agriculture can only play
a limited role in food production (UNEP, 2014), it
can have many other benefits. These range from
improvements in the social and physical climate
in cities to more awareness among city-dwellers
on the importance of food and food choices by
reconnecting people in cities to the origins of
their food.
Closing nutrient cycles is another import element
of re-linking urban food systems with food
producing regions. Currently, only a small fraction
(estimated to be around 5%) of all the nutrients
transported to cities is recycled to rural areas
(Morée et al., 2013), not only creating pollution
issues in and around cities, but also leading
to soil depletion (Chapter 5). Options for better
recycling include the collection and composting
of food residues and recycling of residues from
the food processing industry (see Box 8 for an
example). An important requirement is that the
composted material is free from contamination
(for example in the form of heavy metals, harmful
microorganisms or residues from medicines
and pesticides).
8.6.2 Changing food consumption patterns, using health as a point of entry to improve natural resource managementA reorientation to healthier and more sustainable
diets39 could contribute to a lower resource
use in food systems with the added benefit of
a significant reduction in the global burden of
diet-related disease (Section 6.4.2). (Swinburn et al., 2011) suggest that over-consumption
and obesity are a predictable outcome of non-
regulated and liberalized market economies that
are based on consumption growth. The same
authors conclude that governments need to take
responsibility in guiding private actors and civil
society in a new direction. This recommendation
is in line with (Lang & Heasman, 2004), who argue
that health has been marginalized in the food
economy not seen as the prime responsibility
of any one group in the food supply chain, and
that public policies integrating food and health
are still missing. Governments could combine
long-term strategies with short-term pragmatic
actions for dietary change (see for example
(FAO, 2015e, McKinsey, 2014). While the type of
effective intervention is highly context depended,
and more research is needed, the following are
some possible interventions:
−Formulating national policies, behavior
change strategies and programmes based on
insights in the determinants of consumption
behavior (such as people’s values, knowledge
and motives).
−Stricter regulations on selling food items that
are high in saturated fats and sugars or highly
resource-intensive, or the introduction of
certain price incentives.
− Informing consumers about potential health
risks, as done by the Good Guide for cosmetics.
−Restricting promotional activities like 39
39. It should be stressed that healthy food items are certainly not always more sustainable
139
Food
sys
tem
s an
d na
tura
l res
ourc
es
advertisement and other forms of marketing,
especially if these are targeted to vulnerable
groups like children.
−Regulating and planning the amount and
location of food ‘outlets’ like fast food
restaurants, small shops and supermarkets
(local authorities could play a particularly
important role in this).
−Encouraging retailers and food outlet chains
in establishing codes of conduct around
marketing.
− Introducing measures for labelling to ensure
that citizens have access to correct and
uniform flows of environmentally related
information. Labels could also be used as a
way to increase people’s awareness of the
farmers’ share in the price and profits and
the share in price that consumers pay for
advertising and marketing costs.
−Launching national information campaigns
and initiating dialogues on consumption
patterns to challenge people’s perceptions
and values around food.
The first four actions are especially aimed at
rethinking and redesigning the ‘food environment’,
being the physical and social surroundings that
influence what people eat, which is especially
relevant in urbanized food systems. Although
governments could take a leading and guiding
role in the above-mentioned interventions, they
can only realize these through close cooperation
with private sector and civil society actors (see
also Section 8.5.4). Governments could, for
example, make use of existing dynamics in
society, such as alternative food movements and
networks or cooperate with civil society actors
around national behavioral change campaigns.
One example of the latter is the LiveWell project
in which the WWF cooperates with European
governments in formulating and promoting
healthier and more sustainable diets, as well
as tools for people to assess their own habits
(WWF, 2014).
8.6.3 Nutrients flows as indicator for food system functioningNon-renewable nutrients (minerals) such as
phosphorus, potassium, zinc and many others
(See Chapter 5) are transported through the
food chain, ending up in waste and human
excrements. The global nutrient efficiency for
nitrogen and phosphorus is around 15-20%,
implying large nutrient losses to the environment.
Historically, and still in traditional food systems,
most of the minerals in waste were recycled.
This was also a necessity as fresh inputs of
minerals (in the form of fertilizer) were scarce
not only unavailable. Since the discovery of
the role of minerals in the nineteenth century,
minerals were mined to fertilize soils. Ever since
the invention of the chemical binding of nitrogen
from the air, a still growing amount of reactive
nitrogen is synthesized and used as fertilizer. As
in many cases these fresh inputs can replace the
extracted minerals, the nutrient cycle has become
a one-way street: globally only an estimated
4% of the minerals exported to urban areas is
recycled (Chapter 5). Within the agricultural
system the circle has also been broken. This is
more visible in the livestock sector, were due to
the spatial concentration of animal production,
manure has become ‘waste’, leading to pollution,
instead of being a valuable source of nutrients.
This spatial concentration is possible due to the
massive transport of feed (containing minerals),
often even between countries.
Nutrient flows and efficiencies along food
systems can thus be seen as an indicator of how
nutrient flows are organized in these systems.
There are many advantages of better nutrient
management, ranging from lower depletion
rates of mines, to environmental benefits (less
water pollution) and human health benefits
(more nutrient rich food, especially regarding
micronutrients).
As demonstrated in Chapters 5 and 6, there are
many ways to improve the recycling of nutrients,
and reduce nutrient losses to the environment.
These range from better fertilizing practices,
to re-establishing the spatial reconnection of
crop and livestock production or recovering
and recycling nutrients from urban waste and
sewages. The actual implementation of these
technical solutions could be stimulated by
regulation (for example on farming practices
and on the prevention of spatial concentration
of livestock). Another route could be that
private partners (including feed companies,

140
Opp
ortu
nitie
s fo
r a
trans
ition
tow
ards
sus
tain
able
food
sys
tem
s
large food companies and waste processors)
adopt more stewardship for mineral flows. The
closing of nutrient cycles could be facilitated
by innovations, ranging from precision farming
techniques to mineral extraction techniques from
sewage systems.
8.7 Summary and conclusions
This chapter provided a framework of thinking
on how food systems can move towards more
sustainable food systems. A first important step
in this framework is the use a food systems lens.
Using a food system approach is an important
method to identify concrete options and levers.
Governments, researchers and private actors
often focus on farmers and fishermen to attain a
more efficient and sustainable use of resources.
This report includes a draft for a framework
to make a systematic analysis of national
(or local) food systems and their impacts on
national resources.
Three governance dynamics or ‘pathways’ can
be distinguished that have the power to reshape
current food systems. These three pathways
are: reforms by governments and international
institutions; adaptive food system actors
(notably private actors); and alternative (niche)
innovators. These pathways are not exclusive,
but could motivate each other and create positive
feedback loops. An initiative could start from civil
society, be taken over by companies and finally
be embedded as standard through legislation.
Next to government-led interventions, the
potential of softer ‘governance’ regimes could be
explored as well, as dedicated actions from the
private sector (food companies, retailers) and
civil society. The logic of the ‘quadruple helix’
between governments, business, science and
civil society aimed at continuous improvement
could be applied here.
Private actors are crucial, but need to be
encouraged and steered. In general, due to
the ‘rolling back’ of the state and consolidation
process in downstream industries, much of the
power is now concentrated in the private actors
of the food industry. Some of these private
actors, particularly the larger businesses, play
a leading role in the transition towards more
sustainable production practices. They either
take individual actions or create their own
platforms to cooperate. Governments can play
an active role by providing an overarching
framework of vision, goals, and regulations for
sustainable production and consumption. This
would give leading businesses the confidence
to expand the level and scope of their individual
and joint activities. Secondly, as private
actors operate in a context of competition and
uncertainty, they often need a third party that
can bring different actors together and play
a neutral role in mediating different interests.
Governments could take up this role or ensure
that another third party is established to play this
intermediary role.
Civil society actors (such as NGOs) have been
an important driving force in drawing attention to
the adverse outcomes of current food systems
and in offering alternative solutions. By using
research, pilot projects, information channels
and networks, these actors put pressure on
governments and businesses to change and
put innovative solutions on the political and
business agenda.
Niche innovators have the ability to experiment
with innovative business models and solutions
that large businesses might not be able to
realize due to their vested interests. These niche
innovations can serve as a source of information
and inspire larger businesses or governments.
Governments and businesses could in turn pay
systematic attention to supporting, cooperating
with and learning from alternative movements.

Refe
renc
es
142
References
AGRA (2013) Africa agriculture status report. Focus on staple crops, Nairobi, The Alliance for a Green Revolution
in Africa
Agropoly (2013) A handful of corporations control world food production, Zürich, Berne Declaration (DB) &
EcoNexus.
Alexandratos N., Bruinsma J. (2012) World agriculture: towards 2015/2030. The 2012 Revision, Rome, Food and
Agriculture Organization of the United Nations
Alkemade R., Reid R.S., van den Berg M., de Leeuw J., Jeuken M. (2012) Assessing the impacts of livestock
production on biodiversity in rangeland ecosystems. Proceedings of the National Academy of Sciences. DOI:
10.1073/pnas.1011013108.
Alkemade R., Van Oorschot M., Miles L., Nellemann C., Bakkenes M., Ten Brink B. (2009) GLOBIO3: A framework
to investigate options for reducing global terrestrial biodiversity loss. Ecosystems, 12: 374-390. DOI: 10.1007/
s10021-009-9229-5.
Allen C.R., Fontaine J.J., Pope K.L., Garmestani A.S. (2011) Adaptive management for a turbulent future. Journal
of Environmental Management, 92: 1339-1345. DOI: 10.1016/j.jenvman.2010.11.019.
Ango T.G., Börjeson L., Senbeta F., Hylander K. (2014) Balancing Ecosystem Services and Disservices: Smallholder
Farmers’ Use and Management of Forest and Trees in an Agricultural Landscape in Southwestern Ethiopia.
Ecology and Society, 19: 30. DOI: 10.5751/ES-06279-190130.
Arets E.J.M.M., Van Berkum S., Van Oosten C., Bindraban P.S., Jongschaap R.E.E., Van Bodegom A.J., Stehfest
E., Rozemeijer N., Geissen V., Hessel R., Van der Valk O.M.C., De Jager A.J. (2011) Competing claims on
natural resources. Global trends and local case studies, Wageningen, Alterra Wageningen UR.
Asfaw S., Lipper L. (2011) Economics of PGRFA Management for Adaptation to Climate Change: A Review of
Selected Literature, Rome, FAO.
Azadi H., Samiee A., Mahmoudi H., Jouzi Z., Rafiaani Khachak P., De Maeyer P., Witlox F. (2015) Genetically
modified crops and small-scale farmers: main opportunities and challenges. Critical Reviews in Biotechnology:
1-13. DOI: 10.3109/07388551.2014.990413.
Bai Z., Dent D., Olsson L., Schaepman M. (2008) Global assessment of land degradation and improvement. 1.
Identification by remote sensing, Wageningen, International Soil Reference and Information Centre (ISRIC).
Beekman G., Meijerink G. (2010) Reducing food price variability in Sub-Saharan Africa, The Hague, LEI Wageningen
UR.
Berdegué J.A., Balsevich F., Flores L., Reardon T. (2005) Central American supermarkets’ private standards
of quality and safety in procurement of fresh fruits and vegetables. Food Policy, 30: 254-269. DOI: 10.1016/j.
foodpol.2005.05.003.
Beveridge M.C.M., Phillips M., Dugan P., Brummet R., Center W. (2010) Barriers to aquaculture development as a
pathway to poverty alleviation and food security. Advancing the Aquaculture Agenda: Workshop Proceedings,
Organization for Economic Cooperation and Development, Paris. pp. 345-359
Bhujel R.C. (2012) Small-scale aquaculture: Global and national perspectives. Small-scale aquaculture for rural
livelihoods: Proceedings of the Symposium on Small-scale aquaculture for increasing resilience of Rural
Livelihoods in Nepal. 5-6 Feb 2009. Kathmandu, Nepal. pp.
Biemans H. (2012) Water constraints on future food production. Dissertation Wageningen University, Wageningen.
Bleeker A., Hicks W., Dentener F., Galloway J., Erisman J. (2011) N deposition as a threat to the World’s protected
areas under the Convention on Biological Diversity. Environmental Pollution, 159: 2280-2288. DOI: 10.1016/j.
envpol.2010.10.036.

Food
sys
tem
s an
d na
tura
l res
ourc
es
143
Bobbink R., Hicks K., Galloway J., Spranger T., Alkemade R., Ashmore M., Bustamante M., Cinderby S., Davidson
E., Dentener F., Emmett B., Erisman J.W., Fenn M., Gilliam F., Nordin A., Pardo L., De Vries W. (2010) Global
assessment of nitrogen deposition effects on terrestrial plant diversity: a synthesis. Ecological Applications,
20: 30-59. DOI: doi:10.1890/08-1140.1.
Bommarco R., Kleijn D., Potts S.G. (2013) Ecological intensification: harnessing ecosystem services for food
security. Trends in Ecology & Evolution, 28: 230-238. DOI: doi:10.1016/j.tree.2012.10.012.
Bouwman A.F., Beusen A.H.W., Billen G. (2009) Human alteration of the global nitrogen and phosphorus soil
balances for the period 1970-2050. Global Biogeochemical Cycles, 23. DOI: 10.1029/2009GB003576.
Bouwman L., Beusen A., Glibert P.M., Overbeek C., Pawlowski M., Herrera J., Mulsow S., Yu R., Zhou M. (2013a)
Mariculture: significant and expanding cause of coastal nutrient enrichment. Environmental Research Letters,
8: 044026.
Bouwman L., Goldewijk K.K., Van Der Hoek K.W., Beusen A.H.W., Van Vuuren D.P., Willems J., Rufino M.C.,
Stehfest E. (2013b) Exploring global changes in nitrogen and phosphorus cycles in agriculture induced by
livestock production over the 1900–2050 period. Proceedings of the National Academy of Sciences, 110:
20882-20887. DOI: 10.1073/pnas.1012878108.
Buckwell A., Nordang Uhre A., Williams A., Poláková J., Blum W.E.H., Schiefer J., Lair G.J., Heissenhuber A., Peter
Schießl P., Krämer C., Haber W. (2014) Sustainable intensification of European agriculture: A review sponsored
by the RISE Foundation, Brussels, RISE Foundation.
Burke L.M., Reytar K., Spalding M., Perry A. (2011) Reefs at risk revisited, World Resources Institute Washington,
DC.
Cassman K.G., Dobermann A., Walters D.T. (2002) Agroecosystems, nitrogen use efficiency and nitrogen
management. Ambio, 31: 132-141.
CFS (2009) Reform of the CFS, Final version CFS 35: 2009/2 Rev. 2. October 2009, Rome, Committee on World
Food Security.
CFS (2012a) Coming to terms with terminology, Rome, Committee on World Food Security.
CFS (2012b) Voluntary guidelines on the responsible governance of tenure of land, fisheries and forests in the
context of national food security, Rome, Committee on World Food Security.
Chamberlin J., Jayne T., Headey D. (2014) Scarcity amidst abundance? Reassessing the potential for cropland
expansion in Africa. Food Policy, 48: 51-65. DOI: 10.1016/j.foodpol.2014.05.002.
Chopin T., Cooper J.A., Reid G., Cross S., Moore C. (2012) Open–water integrated multi–trophic aquaculture:
environmental biomitigation and economic diversification of fed aquaculture by extractive aquaculture.
Reviews in Aquaculture, 4: 209-220. DOI: 10.1111/j.1753-5131.2012.01074.x.
Conway G. (2012) One billion hungry: can we feed the world?, Cornell, Cornell University Press.
Cordell D., Drangert J.O., White S. (2009) The story of phosphorus: Global food security and food for thought.
Global Environmental Change, 19: 292-305. DOI: doi:10.1016/j.gloenvcha.2008.10.009.
Cumming G.S., Buerkert A., Hoffmann E.M., Schlecht E., von Cramon-Taubadel S., Tscharntke T. (2014) Implications
of agricultural transitions and urbanization for ecosystem services. Nature, 515: 50-57. DOI: 10.1038/nature13945.
CWC/MWR (2002) Water Statistics, Central Water Commission, Ministry of Water Resources.
Dawkins M., Layton R. (2012) Breeding for better welfare: genetic goals for broiler chickens and their parents.
Animal Welfare-The UFAW Journal, 21: 147. DOI: 10.7120/09627286.21.2.147
De Fraiture C., Fayrap A., Unver O., Ragab R. (2014) Integrated water management approaches for sustainable
food production. Irrigation and Drainage, 63: 221-231. DOI: 10.1002/ird.1847.
De Vries M., De Boer I.J.M. (2010) Comparing environmental impacts for livestock products: A review of life cycle
assessments. Livestock Science, 128: 1-11. DOI: doi:10.1016/j.livsci.2009.11.007.
Deininger K.W., Byerlee D. (2011) Rising global interest in farmland: can it yield sustainable and equitable benefits?,
World Bank Publications.
Denison R.F. (2012) Darwinian agriculture: How understanding evolution can improve agriculture, Princeton NJ,
Princeton University Press.
Refe
renc
es
144
Dixon J. (1999) A cultural economy model for studying food systems. Journal of the Agriculture, Food, and Human
Values Society, 16: 151-160. DOI: 10.1023/a: 1007531129846.
Doh J.P., Guay T.R. (2006) Corporate social responsibility, public policy, and NGO activism in Europe and the
United States: An institutional stakeholder perspective. Journal of Management Studies, 43: 47-73. DOI:
10.1111/j.1467-6486.2006.00582.x.
Drent J., Dekker R. (2013) How different are sublitoral Mytilus edulis communities of natural mussel beds and
mussel culture plots in the western Dutch Wadden Sea, Texel, NIOZ.
Dulvy N.K., Fowler S.L., Musick J.A., Cavanagh R.D., Kyne P.M., Harrison L.R., Carlson J.K., Davidson L.N.,
Fordham S.V., Francis M.P. (2014) Extinction risk and conservation of the world’s sharks and rays. Elife, 3. DOI:
10.7554/eLife.00590.002.
Dyck A., Sumaila U. (2009) Contribution of ocean fish populations to the world economy, Vancouver, Fisheries
Centre, University of British Columbia.
EAA (2014) Aluminium packaging: Convenient, safe and infinitely recyclable, Brussels, European Aluminium
Association.
Edwards-Jones G., Milà i Canals L., Hounsome N., Truninger M., Koerber G., Hounsome B., Cross P., York E.H.,
Hospido A., Plassmann K. (2008) Testing the assertion that ‘local food is best’: the challenges of an evidence-
based approach. Trends in Food Science & Technology, 19: 265-274. DOI: 10.1016/j.tifs.2008.01.008.
EEA (2010) Agriculture: nitrogen balance (SEBI 019). Assessment published May 2010, European Environment
Agency www.eea.europa.eu/data-and-maps/indicators/agriculture-nitrogen-balance/agriculture-nitrogen-balance-assessment-
published.
Eilers E.J., Kremen C., Smith Greenleaf S., Garber A.K., Klein A.M. (2011) Contribution of Pollinator-Mediated
Crops to Nutrients in the Human Food Supply. PLoS ONE 6(6): e213636(6) DOI: 10.1371/journal.pone.0021363.
Ellis E.C., Kaplan J.O., Fuller D.Q., Vavrus S., Klein Goldewijk K., Verburg P.H. (2013) Used planet: A global history.
Proceedings of the National Academy of Sciences, 110: 7978-7985. DOI: 10.1073/pnas.1217241110.
Ericksen P.J. (2008) Conceptualizing food systems for global environmental change research. Global Environmental
Change, 18: 234-245. DOI: 10.1016/j.gloenvcha.2007.09.002.
Esnouf C., Russel M., Bricas N. (2013) Food system sustainability: insights from duALIne, Cambridge, Cambridge
University Press.
Eswaran H., Lal R., Reich P.F. (2001) Land degradation: an overview. Responses to Land degradation, Proc. 2nd.
International Conference on Land Degradation and Desertification. pp. 20-35
EUI (2014) Global Food Security Index.The Economist Intelligence Unit, http://foodsecurityindex.eiu.com.
Fan S. (2010) Halving hunger: meeting the first millennium development goal through business as unusual,
Washington D.C, International Food Policy Research Institute.
FAO (2005) Discards in the world’s marine fisheries: an update, Rome, Food and Agriculture Organization of the
United Nations.
FAO (2007) The State of Food and Agriculture 2007: Paying farmers for environmental services Rome, Food and
Agriculture Organization of the United Nations.
FAO (2010) Sustainable Diets and Biodiversity. Directions and Solutions for Policy, Research and Action. Proceedings
of the International Scientific Symposium ‘Biodiversity and Sustainable Diets United Against Hunger’ on 3-5
November 2010 Food and Agriculture Organization of the United Nations, Rome.
FAO (2011a) Energy-smart food for people and climate: issue paper, Rome, FAO.
FAO (2011b) Global food losses and food waste. Extend, causes and prevention, Rome, Italy, Food and Agriculture
Organization of the United Nations.
FAO (2011c) Safeguarding food security in volatile global markets, Rome, Food and Agriculture Organization of
the United Nations.
FAO (2011d) SAVE and GROW: A policymaker’s guide to the sustainable intensification of smallholder crop
production, Rome, Food and Agriculture Organization of the United Nations.

Food
sys
tem
s an
d na
tura
l res
ourc
es
145
FAO (2011e) The state of the world’s land and water resources for food and agriculture. Managing systems at risk,
Rome, Food and Agriculture Organization of the United Nations.
FAO (2012a) The State of World Fisheries and Aquaculture 2012, Rome, Food and Agriculture Organization of the
United Nations.
FAO (2012b) World AgricultureTowards 2030/2050. The 2012 Revision, Rome, (eds Alexandratos N, Bruinsma J),
Global Perspective Studies Team, Food and Agriculture Organization of the United Nations.
FAO (2013a) Healthy people depend on healthy food systems. Sustainable food systems for food security and
nutrition. World Food Day,16 October 2013, Rome, Food and Agriculture Organization of the United Nations.
FAO (2013b) Rebuilding West Africa’s food potential: policies and market incentives for smallholder-inclusive food
value chains, Rome The Food and Agriculture Organization of the United Nations & The International Fund for
Agriculture Development
FAO (2013c) SAFA Indicators: Sustainability assessment of food and agriculture systems, Rome, Food and
Agriculture Organization of the United Nations
FAO (2014a) Agriculture, Forestry and Other Land Use emissions by sources and removals by sinks, Rome, (ed)
FAO).
FAO (2014b) FAO Food Price Index, Food and Agriculture Organization of the United Nations, http://www.fao.org/
worldfoodsituation/foodpricesindex/en/ retrieved on 30-09-2014.
FAO (2014c) The State of World Fisheries and Aquaculture 2014, Rome, Food and Agriculture Organization of the
United Nations.
FAO (2015a) FAOstat production data, FAO.
FAO (2015b) GLADIS, Food and Agriculture Organization of the United Nations, www.fao.org/nr/lada/gladis/gladis/.
FAO (2015c) The Second Report on the State of the World’s Animal Genetic Resources for Food and Agriculture,
edited by B.D. Scherf & D. Pilling. FAO Commission on Genetic Resources for Food and Agriculture
Assessments. Rome, Food And Agriculture Organization of The United Nations.
FAO (2015d) Soil is a non-renewable resource (fact sheet), Rome, Food and Agriculture Organization of the United
Nations.
FAO (2015e) The State of Food Insecurity in the World - Meeting the 2015 international hunger targets: taking stock
of uneven progress, Rome, Food And Agriculture Organization of The United Nations.
FAO, UNEP (2014) Voluntary standards for sustainable food systems. Joint FAO/UNEP Workshop on Voluntary
Standards for Sustainable Food Systems: Challenges and Opportunities (2013: Rome, Italy). pp.
Fernandez-Cornejo J., Wechsler S., Livingston M., Mitchell L. (2014) Genetically Engineered Crops in the United
States, Washington DC, US Department of Agriculture Economic Research Service.
Foresight (2011) The Future of Food and Farming Final Project Report, London, The Government Office for Science.
Fraser E.D.G., Mabee W., Figge F. (2005) A framework for assessing the vulnerability of food systems to future
shocks. Futures, 37: 465-479. DOI: 10.1016/j.futures.2004.10.011.
Friends of the Earth International (2012) Wolf in sheep’s clothing? An analysis of the ‘sustainable intensification’ of
agriculture, Amsterdam, Friends of the Earth International.
Fuglie K., Heisey P., King J.L., Day-Rubenstein K., Schimmelpfennig D., Wang S.L., Pray C.E., Karmarkar-
Deshmukh R. (2011) Research investments and market structure in the food processing, agricultural input, and
biofuel industries worldwide, Washington DC, USDA-Economic Research Service.
Funge-Smith S., Briggs M., Miao W. (2012) Regional overview of fisheries and aquaculture in Asia and the Pacific
2012. Asia-Pacific Fishery Commission RAP Publication 2012/26, FAO Regional Office for Asia and the Pacific.
Garcia S.M., Rosenberg A.A. (2010) Food security and marine capture fisheries: characteristics, trends, drivers
and future perspectives. Philosophical Transactions of the Royal Society B: Biological Sciences, 365: 2869-
2880. DOI: 10.1098/rstb.2010.0171.
Garnett T. (2011) Where are the best opportunities for reducing greenhouse gas emissions in the food system
(including the food chain)? Food Policy, 36: S23-S32. DOI: 10.1016/j.foodpol.2010.10.010.

Refe
renc
es
146
Garnett T., Appleby M.C., Balmford A., Bateman I.J., Benton T.G., Bloomer P., Burlingame B., Dawkins M., Dolan
L., Fraser D., Herrero M., Hoffmann I., Smith P., Thornton P.K., Toulmin C., Vermeulen S.J., Godfray H.C.J.
(2013) Sustainable intensification in agriculture: Premises and policies. Science, 341: 33-34. DOI: 10.1126/
science.1234485.
Garnett T., Mathewson S., Angelides P., Borthwick F. (2015) Policies and actions to shift eating patterns: What
works?, Oxford and London, Food Climate Research Network. University of Oxford and Chatham House The
Royal Institue of International Affairs.
Garnett T., Wilkes A. (2014) Appetite for change: social, economic and environmental transformations in China’s
food system, Oxford, Food Climate Research Network. University of Oxford.
Gerber P.J., Steinfeld H., Henderson B., Mottet A., Opio C., Dijkman J., Falcucci A., Tempio G. (2013) Tackling
climate change through livestock – A global assessment of emissions and mitigation opportunities, Rome,
Food and Agriculture Organization of the United Nations.
Gleeson T., Wada Y., Bierkens M.F., van Beek L.P. (2012) Water balance of global aquifers revealed by groundwater
footprint. Nature, 488: 197-200. DOI: 10.1038/nature11295
Gleick P.H., Burns W., Chalecki E., Cohen M., Cushing K., Mann A., Reyer R., Wolff G., Wong A. (2002) The World’s
Water 2002-2003, The biennial report on freshwater resources, Washington DC, Island Press.
Grassini P., Eskridge K.M., Cassman K.G. (2013) Distinguishing between yield advances and yield plateaus in
historical crop production trends. Nature communications, 4. DOI: 10.1038/ncomms3918.
Gregory P.J., Ingram J. (2000) Food and forestry: global change and global challenges. Agriculture, Ecosystems
and Environment, 82: 1-2. DOI: 10.1016/s0167-8809(00)00211-5.
Grossman M.R. (2006) Agriculture and the polluter pays principle. Electronic Journal of Comparative Law, 11.3.
Gustavsson J., Cederberg C., Sonesson U., Van Otterdijk R., Meybeck A. (2011) Global food losses and food
waste. Extent, causes and prevention, Rome Food and Agriculture Organization of the United Nations and
Swedish Institute for Food and Biotechnology (SIK).
Haan de J., Rotmans J. (2011) Patterns in transitions: Understanding complex chains of change. Technological
Forecasting and Social Change, 78: 90-102. DOI: 10.1016/j.techfore.2010.10.008.
Hajer M. (2011) The energetic society: In search of a governance philosophy for a clean economy, The Hague /
Bilthoven, Netherlands Environmental Assessment Agency (PBL).
Hall S.J., Delaporte A., Phillips M.J., Beveridge M., O’Keefe M. (2011) Blue frontiers: managing the environmental
costs of aquaculture Penang, Malaysia, The WorldFish Center.
Heisler J., Glibert P.M., Burkholder J.M., Anderson D.M., Cochlan W., Dennison W.C., Dortch Q., Gobler C.J., Heil
C.A., Humphries E. (2008) Eutrophication and harmful algal blooms: a scientific consensus. Harmful Algae, 8:
3-13. DOI: 10.1016/j.hal.2008.08.006.
HLPE (2011) Price volatility and food security, A report by the High Level Panel of Experts on Food Security and
Nutrition of the Committee on World Food Security, Rome, HLPE.
HLPE (2013a) Biofuels and food security. A report by the High Level Panel of Experts on Food Security and Nutrition
of the Committee on World Food Security, Rome, HLEP.
HLPE (2013b) Investing in smallholder agriculture for food security. A report by the High Level Panel of Experts on
Food Security and Nutrition of the Committee on World Food Security, Rome, HLPE.
HLPE (2014a) Food losses and waste in the context of sustainable food systems. A report by the High Level Panel
of Experts on Food Security and Nutrition of the Committee on World Food Security, Rome, HLPE.
HLPE (2014b) Sustainable fisheries and aquaculture for food security and nutrition. A report by the High Level Panel
of Experts on Food Security and Nutrition of the Committee on World Food Security, Rome, HLPE.
HLPE (2015) Water for food security and nutrition. A report by the High Level Panel of Experts on Food Security and
Nutrition of the Committee on World Food Security., Rome, HLPE.
Hoekstra A.Y., Mekonnen M.M. (2012) The water footprint of humanity. Proceedings of the National Academy of
Sciences, 109: 3232-3237. DOI: 10.1073/pnas.1109936109.
Food
sys
tem
s an
d na
tura
l res
ourc
es
147
Holmlund C.M., Hammer M. (1999) Ecosystem services generated by fish populations. Ecological Economics, 29:
253-268. DOI: 10.1016/S0921-8009(99)00015-4.
Horton R., Lo, S (2013) Nutrition: a quintessential sustainable development goal. The Lancet, 382, Issue 9890. DOI:
10.1016/S0140-6736(13)61100-9
Hutchings J.A., Minto C., Ricard D., Baum J.K., Jensen O.P. (2010) Trends in the abundance of marine fishes.
Canadian Journal of Fisheries and Aquatic Sciences, 67: 1205-1210. DOI: 10.1139/F10-081.
ICN2 (2014) Rome Declaration on Nutrition, Rome, WHO and FAO.
IFA (2009) Energy Efficiency and CO2 Emissions in Ammonia Production 2008-2009 Summary Report, Paris,
International Fertilizer Association.
IGES (2009) Reducing waste through the promotion of composting and active involvement of various stakeholders:
Replicating Surabaya’s solid waste management model. Policy Brief 9, Hayama, Institute for Global
Environmental Strategies.
Ingram J. (2011) A food systems approach to researching food security and its interactions with global environmental
change. Food Security, 3: 417-431. DOI: 10.1007/s12571-011-0149-9.
Ingram J.S.I., Ericksen P.J., Liverman D.M.e. (2010) Food security and global environmental change, London
Earthscan.
IPCC (2014a) Climate Change 2014 Mitigation of Climate Change, Contribution of Working Group III to the Fifth
Assessment Report of the Intergovernmental Panel on Climate Change.
IPCC (2014b) Climate Change 2014: Impacts, Adaptation, and Vulnerability, Contribution of Working Group II to
the Fifth Assessment Report of the Intergovernmental Panel on Climate Change, Final Draft Accepted on 30
March 2014.
Ittersum van M.K., Rabbinge R. (1997) Concepts in production ecology for analysis and quantification of agricultural
input-output combinations. Field Crops Research, 52: 197-208. DOI: 10.1016/S0378-4290(97)00037-3.
Jackson J.B., Kirby M.X., Berger W.H., Bjorndal K.A., Botsford L.W., Bourque B.J., Bradbury R.H., Cooke R.,
Erlandson J., Estes J.A. (2001) Historical overfishing and the recent collapse of coastal ecosystems. Science,
293: 629-637. DOI: 10.1126/science.1059199.
Jacobsen S.E., Sørensen M., Pedersen S.M., Weiner J. (2013) Feeding the world: Genetically modified crops
versus agricultural biodiversity. Agronomy for Sustainable Development, 33: 651-662. DOI: 10.1007/s13593-
013-0138-9.
Kearney J. (2010) Food consumption trends and drivers. Philosophical Transactions of the Royal Society B:
Biological Sciences, 365: 2793-2807. DOI: 10.1098/rstb.2010.0149.
Khoury C.K., Bjorkman A.D., Dempewolf H., Ramirez-Villegas J., Guarino L., Jarvis A., Rieseberg L.H., Struik P.C.
(2014) Increasing homogeneity in global food supplies and the implications for food security. Proceedings of
the National Academy of Sciences. DOI: 10.1073/pnas.1313490111.
Kirsten J.F., Dorward C., Poulton C., Vinck N. (eds) (2009) Institutional economics perspectives on African
agricultural development, Washington D.C., International Food Policy Research Institute
KPMG (2012) Expect the unexpected: Building business value in a changing world, KPMG International.
Lambin E., Gibbs H., Ferreira L., Grau R., Mayaux P., Meyfroidt P., Morton D., Rudel T., Gasparri I., Munger J.
(2013) Estimating the world’s potentially available cropland using a bottom-up approach. Global Environmental
Change, 23: 892-901. DOI: 10.1016/j.gloenvcha.2013.05.005.
Lambin E.F., Meyfroidt P., Rueda X., Blackman A., Börner J., Cerutti P.O., Dietsch T., Jungmann L., Lamarque
P., Lister J., Walker N.F., Wunder S. (2014) Effectiveness and synergies of policy instruments for land use
governance in tropical regions. Global Environmental Change, 28: 129-140. DOI: 10.1016/j.gloenvcha.2014.06.007.
Lambin E.F., Turner B.L., Geist H.J. et al. (2001) The causes of land-use and land-cover change: Moving beyond
the myths. Global Environmental Change, 11: 261-269.
Lang T., Barling D., Caraher M. (2009) Food policy: integrating health, environment and society, Oxford, Oxford
University Press.
Lang T., Heasman M. (2004) Food wars: the global battle for mouths, minds and markets, London, Earthscan.
Refe
renc
es
148
Lawrence G., Burch D. (2007) Understanding supermarkets and agri-food supply chains, in: Burch D, Lawrence
G (Eds.), Supermarkets and agri-food supply chains: transformations in the production and consumption of
foods, Edward Elgar, Cheltenham and Northampton.
Le Roux X., Barbault R., Baudry J., Burel F., Doussan I., Garnier E., Herzog F., Lavorel S., Lifran R., Roger-Estrade
J., Sarthou J.P., Trommetter M. (2008) Agriculture and biodiversity: benefiting from synergies. Multidisciplinary
Scientific Assessment, Synthesis Report, Paris.
Leip A., Weiss F., Lesschen J.P., Westhoek H. (2014) The nitrogen footprint of food products in the European Union.
The Journal of Agricultural Science, 152: 20-33. DOI: 10.1017/S0021859613000786.
Licker R., Johnston M., Foley J.A., Barford C., Kucharik C.J., Monfreda C., Ramankutty N. (2010) Mind the gap:
how do climate and agricultural management explain the ‘yield gap’of croplands around the world? Global
Ecology and Biogeography, 19: 769-782. DOI: 10.1111/j.1466-8238.2010.00563.x.
Lieshout van P., Went R., Kremer M. (2010) Less pretension, more ambition: development policy in times of
globalization, Amsterdam, Amsterdam University Press.
Lim S.S., Vos T., Flaxman A.D., Danaei G., Shibuya K., Adair-Rohani H., AlMazroa M.A., Amann M., Anderson
H.R., Andrews K.G. (2013) A comparative risk assessment of burden of disease and injury attributable to 67
risk factors and risk factor clusters in 21 regions, 1990–2010: a systematic analysis for the Global Burden of
Disease Study 2010. The Lancet, 380: 2224-2260. DOI: 10.1016/S0140-6736(12)61766-8.
Lipinski B., Hanson C., Lomax J., Kitinoja L., Waite R., Searchinger T. (2013) Reducing food loss and waste,
Washington D.C., World Resources Institute.
Ludwig D. (2001) The era of management is over. Ecosystems, 4: 758-764. DOI: 10.1007/s10021-001-0044-x.
MA (2005a) Ecosystems and Human Well-being: Scenarios, Volume 2. Millennium Ecosystem Assessment,
Washington DC, Island Press.
MA (2005b) Synthesis report, Millennium Ecosystem Assessment.
Ma L., Ma W.Q., Velthof G.L., Wang F.H., Qin W., Zhang F.S., Oenema O. (2010) Modeling nutrient flows in the food
chain of China. Journal of Environmental Quality, 39: 1279-1289. DOI: 10.2134/jeq2009.0403.
Macdiarmid J., Kyle J., Horgan G., Loe J., Fyfe C., Johnstone A., McNeill G. (2011) Livewell: a balance of healthy
and sustainable food choices, Godalming, WWF-UK.
Malassis L., Ghersi G. (1996) Économie de la Production et de la Consommation: méthodes et concepts, Paris,
Cujas.
Mannion A.M., Morse S. (2012) Biotechnology in agriculture: Agronomic and environmental considerations
and reflections based on 15 years of GM crops. Progress in Physical Geography, 36: 747-763. DOI:
10.1177/0309133312457109.
Marimpi D.M. (2014) Empirical investigation of the dynamic linkages between crude oil and maize prices: Dating the
structural breaks. Journal of Development and Agricultural Economics, 6: 193-202. DOI: 10.5897/JDAE2013.0552.
Martin W., Anderson K. (2011) Export restrictions and price insulation during commodity price booms. American
Journal of Agricultural Economics: aar105. DOI: 10.1596/1813-9450-5645
Martini R. (2008) Fuel Tax Concessions in the Fisheries Sector, Paris, OECD Publishing.
McKinsey (2012) The archipelago economy: Unlashing Indonesia’s potential, McKinsey Global Institute
McKinsey (2014) Overcoming obesity: an initial economic analysis, McKinsey Global Institute
McLoughlin D., Bourne S., Shelman M., Bradley F., Connolly A. (2012) Towards a branded food economy in China.
Industry speaks. International Food and Agribusiness Management Review, 15: 177-184.
McMicheal P. (ed) (1994) The global restructuring of agro-food systems, Cornell NY, Cornell University Press.
Meah A., Watson M. (2011) Saints and slackers: challenging discourses about the decline of domestic cooking.
Sociological Research Online, 16: 6.
Merkuseva N., Rapsomanikis G. (2013) Non-lineair cointegration in the food-ethanol oil system: evidence from
snmooth threshold vector error correction models. Agricultural Market Information System (AMIS), Food and
Agriculture Organization of the United Nations

Food
sys
tem
s an
d na
tura
l res
ourc
es
149
Metelerkamp L. (2013 ) A sustainability review of the global food system. Food systems series part 1, Ernst and
Young
Middleton N., Thomas D. (1997) World atlas of desertification - Hodder Arnold Publication, London, Routledge.
Milder J.C., Garbach K., Declerck F.A.J., Driscoll L., Montenegro M. (2012) An Assessment of the Multi-Functionality
of Agroecological Intensification, Bill & Melinda Gates Foundation.
Molden D. (2007) Water for Food, Water for Life: A Comprehensive Assessment of Water Management in Agriculture,
London and Washington, Earthscan.
Morée A., Beusen A., Bouwman A., Willems W. (2013) Exploring global nitrogen and phosphorus flows in urban
wastes during the twentieth century. Global Biogeochemical Cycles, 27: 836-846. DOI: 10.1002/gbc.20072.
Nepstad D., McGrath D., Stickler C., Alencar A., Azevedo A., Swette B., Bezerra T., DiGiano M., Shimada J., Seroa
da Motta R., Armijo E., Castello L., Brando P., Hansen M.C., McGrath-Horn M., Carvalho O., Hess L. (2014)
Slowing Amazon deforestation through public policy and interventions in beef and soy supply chains. Science,
344: 1118-23. DOI: 10.1126/science.1248525.
Neset T.S.S., Cordell D. (2012) Global phosphorus scarcity: Identifying synergies for a sustainable future. Journal
of the Science of Food and Agriculture, 92: 2-6. DOI: 10.1002/jsfa.4650.
Neumann K., Verburg P.H., Stehfest E., Müller C. (2010) The yield gap of global grain production: A spatial analysis.
Agricultural Systems, 103: 316-326. DOI: 10.1016/j.agsy.2010.02.004.
Ng M., Fleming T., Robinson M., Thomson B., Graetz N., Margono C., Mullany E.C., Biryukov S., Abbafati C., Abera
S.F. (2014) Global, regional, and national prevalence of overweight and obesity in children and adults during
1980–2013: a systematic analysis for the Global Burden of Disease Study 2013. The Lancet.
Nijdam D., Rood T., Westhoek H. (2012) The price of protein: Review of land use and carbon footprints from life
cycle assessments of animal food products and their substitutes. Food Policy, 37: 760-770. DOI: 10.1016/j.
foodpol.2012.08.002.
North D.C. (1987) Institutions, transaction costs and economic growth. Economic inquiry, 25: 419-428. DOI: 10.1111/
j.1465-7295.1987.tb00750.x.
North D.C. (1990) Institutions, institutional change and economic performance, Cambridge, Cambridge University
Press.
OECD (2002) Measuring material flows and resource productivity. Volume 1. The OECD Guide Glossary, Paris,
OECD.
OECD (2005) Subsidies: a Way Towards Sustainable Fisheries? , Paris, OECD.
OECD (2008) Environmental Performance of Agriculture in OECD Countries Since 1990, Paris, OECD Publishing.
OECD (2010) Sustainable management of water resources in agriculture, Paris, OECD.
OECD (2011) Evaluation of Agricultural Policy Reforms in the European Union, Paris, OECD.
OECD (2012) OECD environmental outlook to 2050, Paris, OECD.
OECD (2013a) Agricultural Policies in non-OECD countries: monitoring and evaluation, Paris, OECD.
OECD (2013b) Competition issues in the food chain industry, Paris, OECD.
OECD (2013c) Policy instruments to support green growth in agriculture, Paris, OECD Publishing.
OECD, FAO (2013) OECD-FAO Agricultural Outlook 2013-2022, Paris, OECD.
OECD, FAO (2014) OECD-FAO Agricultural Outlook 2014-2023, Paris, OECD Publishing.
Oenema O., Oudendag D., Velthof G.L. (2007) Nutrient losses from manure management in the European Union.
Livestock Science, 112: 261-272. DOI: 10.1016/j.livsci.2007.09.007.
Oenema O., Witzke H.P., Klimont Z., Lesschen J.P., Velthof G.L. (2009) Integrated assessment of promising
measures to decrease nitrogen losses from agriculture in EU-27. Agriculture, Ecosystems and Environment,
133: 280-288. DOI: 10.1016/j.agee.2009.04.025.
Oorschot van M., Kok M., van der Esch S., Janse J., Rood T., Vixseboxse E., Wilting H., Vermeulen W. (2014)
Sustainability of international Dutch supply chains: Progress, effects and perspectives, The Hague / Bilthoven,
PBL (Netherlands Environmental Assessment Agency).

Refe
renc
es
150
Oosterveer P., Adjei B.E., Vellema S., Slingerland M. (2014) Global sustainability standards and food security:
Exploring unintended effects of voluntary certification in palm oil. Global Food Security, 3: 220-226. DOI: http://
dx.doi.org/10.1016/j.gfs.2014.09.006.
Oosterveer P., Spaargaren G. (2011) Organising consumer involvement in the greening of global food
flows: the role of environmental NGOs in the case of marine fish. Environmental Politics, 20: 97-114. DOI:
10.1080/09644016.2011.538168.
Ostrom E. (1990) Governing the commons. The evolution of institutions for collective action, Cambridge, Cambridge
University Press.
Ostrom E. (1992) Crafting institutions for self-governing irrigation systems, San Francisco, ICS Press.
Pauly D., Christensen V., Dalsgaard J., Froese R., Torres F. (1998) Fishing down marine food webs. Science, 279:
860-863. DOI: 10.1126/science.279.5352.860
Pauly D., Watson R., Alder J. (2005) Global trends in world fisheries: impacts on marine ecosystems and food
security. Philosophical Transactions of the Royal Society B: Biological Sciences, 360: 5-12. DOI: 10.1098/
rstb.2004.1574.
PBL (2010) Rethinking Global Biodiversity Strategies: Exploring structural changes in production and consumption
to reduce biodiversity loss, Den Haag/Bilthoven, PBL Netherlands Environmental Assessment Agency.
PBL (2011) The protein puzzle. The consumption and production of meat, dairy and fish in the European Union,
The Hague (eds Henk W, Rood T, M. Bvd, Janse J, Nijdam D, Reudink M, Stehfest E), PBL Netherlands
Environmental Assessment Agency.
PBL (2012) Roads from Rio+20, PBL Netherlands Environmental Assessment Agency
PBL (2014a) How sectors can contribute to sustainable use and conservation of biodiversity, The Hague, (eds Kok
M, Alkemade R), PBL & CBD.
PBL (2014b) Sustainability of international Dutch supply chains. Progress, effects and perspectives, The Hague,
PBL.
Phalan B., Green R., Balmford A. (2014) Closing yield gaps: perils and possibilities for biodiversity. Philosophical
Transactions B, 369. DOI: 10.1098/rstb.2012.0285
Pinstrup-Andersen P. (2002) Towards a sustainable global food system: What will it take?, Washington.
Pinstrup-Andersen P., Watson II D.D. (2011) Food policy for developing countries: The role of government in global,
national, and local food systems, Ithaca and London, Cornell University Press.
Ponisio L.C., M’Gonigle L.K., Mace K.C., Palomino J., de Valpine P., Kremen C. (2015) Diversification practices
reduce organic to conventional yield gap. Proceedings of the Royal Society of London B: Biological Sciences,
282: 20141396. DOI: 10.1098/rspb.2014.1396.
Pretty J. (2007) Agricultural sustainability: concepts, principles and evidence. Philosophical Transactions of the
Royal Society, 363: 447-465. DOI: 10.1098/rstb.2007.2163.
Pretty J., Bharucha Z.P. (2014) Sustainable intensification in agricultural systems. Annals of Botany, 114: 1571-
1596. DOI: 10.1093/aob/mcu205.
Pretty J., Toulmin C., Williams S. (2011) Sustainable intensification in African agriculture. International Journal of
Agricultural Sustainability, 9: 5-24. DOI: 10.3763/ijas.2010.0583.
Rabbinge R., Van Diepen C.A., Dijsselbloem J., De Koning G.J.H., Van Latesteijn H.C., Woltjer E., Van Zijl J. (1994)
Ground for choices: a scenario study on perspectives for rural areas in the European Community.
Reardon T., Minten B. (2011) Surprised by supermarkets: diffusion of modern food retail in India. Journal of
Agribusiness in Developing and Emerging Economies, 1: 134-161. DOI: 10.1108/20440831111167155.
Reardon T., Timmer C.P. (2012) The economics of the food system revolution. Annual Review of Resource
Economics, 4: 225-264. DOI: 10.1146/annurev.resource.050708.144147.
Reardon T., Timmer C.P., Barrett C.B., Berdegué J. (2003) The rise of supermarkets in Africa, Asia, and Latin
America. American Journal of Agricultural Economics, 85: 1140-1146. DOI: 10.1111/j.0092-5853.2003.00520.x
Food
sys
tem
s an
d na
tura
l res
ourc
es
151
Rosegrant M.W., Koo J., Cenacchi N., Ringler C., Robertson R.D., Fisher M., Cox C.M., Garrett K., Perez N.D.,
Sabbagh P. (2014) Food security in a world of natural resource scarcity: The role of agricultural technologies,
Washington DC, International Food Policy Research Institute.
RSPO (2013) Principles and Criteria for the Production of Sustainable Palm Oil, Kuala Lumpur, RSPO.
RTRS (2010) Standard for Responsible Soy Production. Version 1.0. , Round Table on Responsible Soy Association,
http://www.responsiblesoy.org/index.php?option=com_docman&task=cat_view&gid=71&Itemid=40&lang=en.
Saier B. (2002) Subtidal and intertidal mussel beds (Mytilus edulis L.) in the Wadden Sea: diversity differences of
associated epifauna. Helgoland marine research, 56: 44-50. DOI: 10.1007/s10152-001-0097-4.
Saitone T.L., Sexton R.J. (2012) Market structure and competition in the US food industries. Implications for the
2012 Farm Bill, American Enterprise Institute, http://www.aei.org/wp-content/uploads/2012/04/-market-structure-and-competition-
in-the-us-food-industries_102234192168.pdf.
Sayer J., Sunderland T., Ghazoul J., Pfund J.-L., Sheil D., Meijaard E., Venter M., Boedhihartono A.K., Day M.,
Garcia C. (2013) Ten principles for a landscape approach to reconciling agriculture, conservation, and other
competing land uses. Proceedings of the National Academy of Sciences, 110: 8349-8356. DOI: 10.1073/
pnas.1210595110.
Scherr S.J., McNeely J.A. (2008) Biodiversity conservation and agricultural sustainability: towards a new paradigm
of ‘ecoagriculture’ landscapes. Philosophical Transactions of the Royal Society of London B: Biological
Sciences, 363: 477-494. DOI: 10.1098/rstb.2007.2165
Schilpzand R., Liverman D., Tecklin D., Gordon R., Pereira L., Saxl M., Wiebe K. (2010a) Governance Beyond the
State: Non-state Actors and Food Systems, in: Ingram J, Ericksen P, Liverman D (Eds.), Food Security and
Global Environmental Change, Earthscan, London.
Schilpzand R., Liverman D., Tecklin D., Gordon R., Pereira L., Saxl M., Wiebe K. (2010b) Governance beyond the
state: non-state actors and food systems, in: Ingram JSI, Ericksen PJ, Liverman DM (Eds.), Food Security and
Global Environmental Change, Earthscan, London. pp. 272-300.
Schmitz C., van Meijl H., Kyle P., Nelson G.C., Fujimori S., Gurgel A., Havlik P., Heyhoe E., d’Croz D.M., Popp A.,
Sands R., Tabeau A., van der Mensbrugghe D., von Lampe M., Wise M., Blanc E., Hasegawa T., Kavallari
A., Valin H. (2014) Land-use change trajectories up to 2050: insights from a global agro-economic model
comparison. Agricultural Economics, 45: 69-84. DOI: 10.1111/agec.12090.
Seitzinger S.P., Mayorga E., Bouwman A.F., Kroeze C., Beusen A.H.W., Billen G., Van Drecht G., Dumont E., Fekete
B.M., Garnier J., Harrison J.A. (2010) Global river nutrient export: A scenario analysis of past and future trends.
Global Biogeochemical Cycles, 24. DOI: 10.1029/2009GB003587.
Senauer B., Seltzer J. (2010) The changing face of food retailing. Choices Magazine, 25 (4).
Sexton R.J. (2000) Market consolidation poses challenges for food industry. California Agriculture, 56 (5).
Sobal J., Kettel Khan L., Bisogni C. (1998) A conceptual model of the food and nutrition system. Social Science &
Medicine, 47: 853-863. DOI: 10.1016/S0277-9536(98)00104-X.
Stehfest E., Bouwman L., van Vuuren D.P., den Elzen M.G.J., Eickhout B., Kabat P. (2009) Climate benefits of
changing diet. Climatic Change, 95: 83-102. DOI: 10.1007/s10584-008-9534-6.
Steinfeld H., Gerber H., Wassenaar T., Castel V., Rosales M., Haan de C. (2006) Livestock’s long shadow:
environmental issues and options, Rome, Food and Agriculture Organization of the United Nations.
Story M., Kaphingst K.M., Robinson-O’Brien R., Glanz K. (2008) Creating healthy food and eating environments:
policy and environmental approaches. Annual Review of Public Health, 29: 253-272. DOI: 10.1146/annurev.
publhealth.29.020907.090926.
Sutton M.A., Bleeker A., Howard C.M. et al. (2013) Our nutrient world: the challenge to produce more food and
energy with less pollution, Edinburgh, NERC/Centre for Ecology & Hydrology.
Sutton M.A., Howard C.M., Erisman J.W., Billen G., Bleeker A., Grennfelt P., van Grinsven H., Grizzetti B. (eds)
(2011a) The European Nitrogen Assessment: Sources, Effects and Policy Perspectives, Cambridge, Cambridge
University Press.

Refe
renc
es
152
Sutton M.A., van Grinsven H., Billen G., Bleeker A., Bouwman A.F., Bull K., Erisman J.W., Grennfelt P., Grizzetti B.,
Howard C.M., Oenema O., Spranger T., Winiwarter W. (2011b) The European Nitrogen Assessment: Summary
for policy makers, in: Sutton MA, Howard CM, Erisman JW, Billen G, Bleeker A, Grennfelt P, van Grinsven H,
Grizzetti B (Eds.), The European Nitrogen Assessment: Sources, Effects and Policy Perspectives, Cambridge
University Press, Cambridge. pp. xxiv-xxxiv.
Swartz W., Sala E., Tracey S., Watson R., Pauly D. (2010) The spatial expansion and ecological footprint of fisheries
(1950 to present). PloS one, 5: e15143. DOI: 10.1371/journal.pone.0015143
Swinburn B.A., Sacks G., Hall K.D., McPherson K., Finegood D.T., Moodie M.L., Gortmaker S.L. (2011) The global
obesity pandemic: shaped by global drivers and local environments. The Lancet, 378: 804-814. DOI: 10.1016/
S0140-6736(11)60813-1.
TEEB (2010) The economics of ecosystems and biodiversity: mainstreaming the economics of nature: a synthesis
of the approach, conclusions and recommendations of TEEB, UNEP.
TEEB (2014) http://www.teebweb.org/.
TEEB (2015) TEEB for Agriculture & Food: an interim report, Geneva, United Nations Environment Programme
(UNEP).
Teh L.C., Sumaila U. (2013) Contribution of marine fisheries to worldwide employment. Fish and Fisheries, 14: 77-
88. DOI: 10.1111/j.1467-2979.2011.00450.x.
The Economist (2012 ). Food for thought. Food companies play an ambivalent part in the fight against flab, The
Economist Retrieved from http://www.economist.com/news/special-report/21568064-food-companies-play-ambivalent-part-
fight-against-flab-food-thought
Thorstad E.B., Fleming I.A., McGinnity P., Soto D., Wennevik V., Whoriskey F. (2008) Incidence and impacts of
escaped farmed Atlantic salmon Salmo salar in nature, Norwegian Institute for Nature Research (NINA).
Tilman D., Clark M. (2014) Global diets link environmental sustainability and human health. Nature, 515: 518-522.
DOI: 10.1038/nature13959.
Tittonell P., Giller K.E. (2013) When yield gaps are poverty traps: The paradigm of ecological intensification in
African smallholder agriculture. Field Crops Research, 143: 76-90. DOI: 10.1016/j.fcr.2012.10.007.
Tovey H. (1997) Food, environmentalism and rural Sociology: On the organic farming movement in Ireland.
Sociologia Ruralis, 37: 21-37. DOI: 10.1111/1467-9523.00034.
Trujilo P. (2008) Using a mariculture sustainability index to rank countries performances, Vancouver, (ed) D.Pauly
JAa), The Fisheries centre, University of BC.
Tukker A., Goldbohm R.A., De Koning A., Verheijden M., Kleijn R., Wolf O., Pérez-Domínguez I., Rueda-Cantuche
J.M. (2011) Environmental impacts of changes to healthier diets in Europe. Ecological Economics, 70: 1776-
1788. DOI: 10.1016/j.ecolecon.2011.05.001.
UN (2014) Report of the Secretary-General to the General Assembly 69/279, Agriculture Development, food
security and nutrition, A/69/279 (7 August 2014), available from undocs.org/A/69/279.
Underwood E., Baldock D., Aiking H., Buckwell A., Dooley E., Frelih-Larsen A., Naumann S., O’Connor C.P., J.,
Tucker G. (2013) Technology options for feeding 10 billion people. Synthesis report: Options for sustainable
food and agriculture in the EU, Brussels Science and Technology Options Assessment (STOA), European
Parliament
UNDESA (2011) World Urbanization Prospects: The 2011 Revision, New York, UN Department of Economic and
Social Affairs.
UNDESA (2013) World population prospects: The 2012 Revision, New York, UN Department of Economic and
Social Affairs.
UNEP (2009) Assessing biofuels. Towards sustainable production and use of resources. A report by the Working
Group on Biofuels of the International Resource Panel, Paris, (ed) Bringezu S. SH, O´Brien M., Kauppi L.,
Howarth R.W., McNeely J.), United Nations Environment Programme
UNEP (2010) Assessing the environmental impacts of consumption and production: priority products and materials,
Nairobi / Paris, International Resource Panel United Nations Environmental Programme.

Food
sys
tem
s an
d na
tura
l res
ourc
es
153
UNEP (2011a) Decoupling natural resource use and environmental impacts from economic growth International
Resource Panel, Nairobi / Paris.
UNEP (2011b) Draft Glossary of Terms Used by the International Resource Panel, Nairobi / Paris, UNEP International
Resource Panel.
UNEP (2011c) Towards a Green Economy: Pathways to Sustainable Development and Poverty Eradication. A
Synthesis for Policy Makers, Paris United Nations Environment Programme
UNEP (2012) The Fifth Global Environment Outlook (GEO-5). Environment for the future we want, Nairobi, UNEP.
UNEP (2013) City-level decoupling: Urban resource flows and the governance of infrastructure transitions. A Report
of the Working Group on Cities of the International Resource Panel, Nairobi / Paris.
UNEP (2014) Assessing global land use: Balancing consumption with sustainable supply. A Report of the Working
Group on Land and Soils of the International Resource Panel, Nairobi / Paris, (eds Bringezu S, Schütz H, Pengue
W, O ́Brien M, Garcia F, Sims R, Howarth R, Kauppi L, Swilling M, Herrick J), United Nations Environment
Programme (UNEP).
UNEP (2015) Policy Coherence of the Sustainable Development Goals: a Natural Resource Perspective. A Report
by the International Resource Panel, Nairobi / Paris, United Nations Environment Programme (UNEP).
UNEP (2016) Unlocking the Potential of Land Resources: Evaluation Systems, Strategies and Tools for Sustainability.
A Report of the Working Group on Land and Soils of the International Resource Panel. Herrick, J., Nairobi and
Paris, United Nations Environment Programme (UNEP).
USDA (2012) China retail report, United States Department of Agriculture, Foreign Agricultural Service.
USGS (2013) Mineral Commodity Summaries: (various elements), Washington, U.S. Geological Survey
Valin H., Sands R., Van der Mensbrugghe D., Nelson G.C., Ahammad H., Blanc E., Bodirsky B., Fujimori S.,
Hasegawa T., Havlik P., Heyhoe E., Kyle P., Mason-D’Croz D., Paltsev S., Rolinski S., Tabeau A., van Meijl
H., von Lampe M., Willenbockel D. (2014) The future of food demand: understanding differences in global
economic models. Agricultural Economics, 45: 51-67. DOI: 10.1111/agec.12089.
Van Drecht G., Bouwman A., Harrison J., Knoop J. (2009) Global nitrogen and phosphate in urban wastewater for
the period 1970 to 2050. Global Biogeochemical Cycles, 23. DOI: 10.1029/2009GB003458.
Velthof G.L., Lesschen J.P., Webb J., Pietrzak S., Miatkowski Z., Pinto M., Kros J., Oenema O. (2014) The impact
of the Nitrates Directive on nitrogen emissions from agriculture in the EU-27 during 2000–2008. Science of the
Total Environment, 468–469: 1225-1233. DOI: 10.1016/j.scitotenv.2013.04.058.
Verburg P.H., Mertz O., Erb K.H., Haberl H., Wu W. (2013) Land system change and food security: towards
multi-scale land system solutions. Current Opinion in Environmental Sustainability, 5: 494-502. DOI: 10.1016/j.
cosust.2013.07.003.
Vermeulen S.J., Campbell B.M., Ingram J.S.I. (2012) Climate Change and Food Systems. Annual Review of
Environment and Resources, 37: 195-222. DOI: 10.1146/annurev-environ-020411-130608.
Waite R., Beveridge M., Brummett R.E., Castine S., Chaiyawannakarn N., Kaushik S., Mungkung R., Nawapakpilai
S., Phillips M. (2014) Improving productivity and environmental performance of aquaculture. Working Paper,
Installment 5 of Creating a Sustainable Food Future, Washington, DC, World Resources Institute.
Wallace B.P., Lewison R.L., McDonald S.L., McDonald R.K., Kot C.Y., Kelez S., Bjorkland R.K., Finkbeiner E.M.,
Helmbrecht S.r., Crowder L.B. (2010) Global patterns of marine turtle bycatch. Conservation Letters, 3: 131-
142. DOI: 10.1111/j.1755-263X.2010.00105.x.
Wansink B. (2004) Environmental factors that increase the food intake and consumption volume of unknowing
consumers*. Annual Review of Nutrition, 24: 455-479. DOI: 10.1146/annurev.nutr.24.012003.132140.
Watson R.A., Cheung W.W., Anticamara J.A., Sumaila R.U., Zeller D., Pauly D. (2013) Global marine yield halved as
fishing intensity redoubles. Fish and Fisheries, 14: 493-503. DOI: 10.1111/j.1467-2979.2012.00483.x.
Waycott M., Duarte C.M., Carruthers T.J., Orth R.J., Dennison W.C., Olyarnik S., Calladine A., Fourqurean J.W., Heck
K.L., Hughes A.R. (2009) Accelerating loss of seagrasses across the globe threatens coastal ecosystems.
Proceedings of the National Academy of Sciences, 106: 12377-12381. DOI: 10.1073/pnas.0905620106

Refe
renc
es
154
Weidema B. (2006) The integration of economic and social aspects in Life Cycle Impact Assessment. The
International Journal of Life Cycle Assessment, 11: 89-96. DOI: 10.1065/lca2006.04.016.
Wessells K.R., Brown K.H. (2012) Estimating the Global Prevalence of Zinc Deficiency: Results Based on Zinc
Availability in National Food Supplies and the Prevalence of Stunting. PLoS ONE, 7: e50568. DOI: 10.1371/journal.
pone.0050568.
Westhoek H., Lesschen J.P., Rood T., Wagner S., De Marco A., Murphy-Bokern D., Leip A., van Grinsven H., Sutton
M.A., Oenema O. (2014) Food choices, health and environment: Effects of cutting Europe’s meat and dairy
intake. Global Environmental Change. DOI: 10.1016/j.gloenvcha.2014.02.004.
Westhoek H., Rood T., Berg M.v.d., Janse J., Nijdam D., Reudink M.A., Stehfest E. (2011) The protein puzzle :
the consumption and production of meat, dairy and fish in the European Union, The Hague / Bilthoven, PBL
(Netherlands Environmental Assessment Agency).
Whitty C.J.M., Jones M., Tollervey A., Wheeler T. (2013) Biotechnology: Africa and Asia need a rational debate on
GM crops. Nature, 497: 31-33. DOI: 10.1038/497031a.
WHO (2012) Global targets 2025 To improve maternal, infant and young child nutrition. Resolution 65.6 Geneva,
World Health Assembly - World Health Organization.
WHO (2013) Obesity and overweight Fact sheet N°311 updated on March 2013, http://www.who.int/mediacentre/factsheets/
fs311/en.
WHO (2014) Global Health Observatory data: overweight, situation and trends. World Health Organization. http://
www.who.int/gho/ncd/risk_factors/overweight_text/en/ last accessed 28-01-2015, .
WHO; UNDP (2009) The energy access situation in developing countries. A review focusing on the Least Developed
Countries and Sub-Saharan Africa, New York, United Nations Development Programme.
Wiggins S. (2014) African agricultural development: lessons and challenges. Journal of Agricultural Economics 65:
529-556. DOI: 10.1111/1477-9552.12075.
Wong V. (2014). Four Reasons Why Coca-Cola Will Stick to Sweet Sodas, Businessweek,10 April 2014. Retrieved
from http://www.businessweek.com/articles/2014-04-10/four-reasons-why-coca-cola-will-stick-to-sweet-sodas
Wood S., Sebastian K., Scherr S.J. (2000a) Agroecosystems - Pilot Analysis of Global Ecosystems, Washington,
World Resources Institute and International Food Policy Research Institute and World Resources Institute.
Wood S., Sebastian K., Scherr S.J. (2000b) Agroecosystems - Pilot Analysis of Global Ecosystems, Washington
DC, International Food Policy Research Institute and World Resources Institute.
World Bank (2007) World development report 2008: Agriculture for development, Washington D.C., World Bank.
World Bank (2010) Deep wells and prudence: towards pragmatic action for addressing groundwater overexploitation
in India.
World Bank (2014a) Food Price Volatility, Food Security and Trade Policy Conference.
World Bank (2014b) World Development Indicators 2014, Washington, DC, World Bank.
World Bank, FAO (2011) Missing Food: the case of Post Harvest Grain Losses in Sub-Saharan Africa Washington
WorldBank, FAO, Natural Resources Institute
Worldfoodsummit (1996) Declaration on World Food Security, Rome.
WWAP (2015) The United Nations World Water Development Report 2015: Water for a Sustainable World, Paris,
UNESCO.
WWF (2014) Adopting healthy sustainable diets: Key opportunities and barriers. LiveWell Project report, World Wide
Fund.
Ywema P.E. (2014) Personal communication, Sustainable Agriculture Initiative.
Zilberman D., Hochman G., Rajagopal D., Sexton S., Timilsina G. (2012) The impact of biofuels on commodity
food prices: Assessment of findings. American Journal of Agricultural Economics. DOI: doi: 10.1093/ajae/aas037.

Food
sys
tem
s an
d na
tura
l res
ourc
es
155
Annex 1 Resource specific options for a more sustainable and efficient use of natural resources in food systems
This Annex lists a number of resource specific
biophysical options to make more sustainable
and efficient use of the various natural resources
as being used in food systems. It has to be
stressed that the choice of options is very
resource-specific and, therefore, no general
recommendations can be given. Additionally,
much more can be said about options for each
individual resource than is feasible in the context
of this report. For more detailed options and
their consequences, specific literature should
be consulted (i.e. literature cited below).
Options for more sustainable and efficient
land use
Many biophysical interventions exist to enhance
the sustainable and efficient use of land and
soils. In many cases there are even synergies
between these two goals, for example in the
case of soil amelioration, although tensions may
also exist between the short-term goal of high
yields and the long-term goal of sustainable
use. Given the large varieties in soils and
climatic and socioeconomic conditions, there
are no universal solutions, only directions that
have to be tailored to the local context. Options
for a more sustainable management of land,
landscapes and soils include:
−At the landscape level, maintenance or
reintroduction of landscape elements and
other ‘natural’ areas, which can provide
valuable ecosystem services (Scherr &
McNeely, 2008);
−Maintenance of soil organic matter content,
because of its role in soil biodiversity, water
regulation and nutrient adsorption. Soil organic
matter content can be maintained by a regular
supply of organic substances (plant residues,
manure, compost, etc.).
−Prevention of soil erosion, for example by
keeping the soil covered (with growing plants or
mulching with leaves for example), by counter
ploughing as well as by the maintenance of
landscape features such as hedges, tree rows
and ditches, as they usually help to prevent
erosion. These features also help to provide
other ecosystem services such as pollination,
pest control and water and nutrient regulation.
−Prevention of overgrazing and restoration of
degraded rangelands.
Options for a more efficient management of land
and soils include:
−Sustainable intensification, implying higher
crop yields per unit of land. As in most cases
this will mean a higher or better targeted input
of other resources (water, minerals, seeds),
the word ‘sustainable’ in this case means
without significant trade-offs. Sustainable
intensification is discussed in further detail in
Chapter 6.
Options for more sustainable and efficient
water use
There are many potential biophysical
interventions available for enhancing the
sustainable and efficient use of water. In rain-
fed systems the central point is the increase of
the crop yield per raindrop. Farmers have many
ways of optimizing crop yield per raindrop. Many
of these measures coincide with sustainable and
efficient land management practices. First of all,
it is important that rainwater can infiltrate into the
soil rather than running off the land, which also
creates risks of soil erosion. Measures such as
maintaining a good soil structure and terracing
Ann
ex 1
Res
ourc
e sp
ecifi
c op
tions
for
a m
ore
sust
aina
ble
and
effic
ient
use
of n
atur
al r
esou
rces
in fo
od s
yste
ms
156
the land or counter ploughing are usually helpful
to enhance infiltration. Secondly, creating a
deep and well-structured topsoil helps to store
a larger amount of water in the root zone. Finally,
good crop management, weed control and
in some cases covering the soil with litter can
help maximize the amount of water available to
crops. In some areas, supplementary irrigation
(addition of small amounts of water to essentially
rainfed crops) could be effective.
In many areas where yield gaps exist,
supplemental irrigation has an underexploited
potential and can be pivotal in lifting people
out of poverty (Molden, 2007). An important
component is to make more water available
to crops when it is most needed, for example
during flowering. This usually requires far less
water than full-scale irrigation. Supplemental
irrigation is possible wherever water storage
is feasible, and by relatively simple irrigation
methods. Especially in Sub-Saharan Africa, there
is a large potential, also given the current limited
area that is irrigated. In some areas, small-scale
individually managed water technologies can be
introduced, such as small affordable pumps and
low-cost drip irrigation.
In areas with large-scale irrigation schemes,
two actions are crucial: increasing water-use
efficiency and halting water overexploitation.
Water-use efficiency can be increased in many
ways, depending on the local situation. Important
actions are the reduction of water losses in
canals and pipe systems, a balanced division of
water between farmers, the introduction of drip
irrigation and precision agriculture and good
crop management (weed control, appropriate
fertilization).
Sources like treated wastewater and recycled
grey water could alleviate the pressure of fresh
water sources, provided that this water is free
from contaminants. Also rainwater harvesting is
in some areas a useful technique.
Options for a more efficient use of minerals
in food systems
There are many specific measures along the
food chain to improve nutrient efficiency. In
addition, there are also more generic measures
such as a reduction in food losses and wastes
and a reduction in the consumption of animal
products (see Chapter 6). Concrete options are:
− Improving fertilizer efficiency (recovery) at the
crop level through soil testing, appropriate
amount and timing of fertilizers (precision
agriculture), replacement of mineral fertilizers
with animal manure, soil conservation to
reduce nutrient losses and the use of catch
crops to capture post-harvest soil reserves
(Cassman et al., 2002, Oenema et al., 2009,
Sutton et al., 2013).
− In some regions, many successful efforts have
been undertaken over the last 20 years to
improve efficient fertilization at the crop level.
For example, in several EU Member States,
environmental impacts related to various forms
of nitrogen pollution were already recognized
in the 1980s, resulting in both national policies
and the EU Nitrate Directive (1991) 91/676/
EEC. This directive obliged all Member
States to take action to reduce nitrate losses
from agricultural sources. The directive was
followed by the Water Framework Directive
(Directive 2000/60/EC), which addresses all
sources and all pollutants, and by the NEC
Directive (Directive 2001/81/EC), which sets
upper limits for each Member State for total
emissions of ammonia and other pollutants.
These directives were translated into national
policies, and several EU countries already
implemented policies before they were obliged
to do so. This resulted in a reduction in the
nitrogen surplus in Denmark by around 30%
between 1990 and 2003. Belgium and the
Netherlands showed a similar decrease over
the period 2000 –2008 (Grinsven van et al.,
2012), while the surplus in Denmark continued
to decrease. The nitrogen surplus (in kg N per
ha) in the Netherlands is still the highest in the
EU (EEA, 2010).
−The reduction in surplus was achieved with no
or little reduction in production, which means
an absolute decoupling as well as a strong
increase in overall nitrogen-use efficiency.
The reduction in nitrogen surplus was mainly
the result of improved manure management,
including better application techniques and

Food
sys
tem
s an
d na
tura
l res
ourc
es
157
timing (just before the growing season instead
of all year round), and improved overall
fertilization (better timing and amounts based
on crop requirements).
−One of the methods propagated is Integrated
Soil Fertility Management (ISFM) strategies,
which centre on the combined use of
mineral fertilizers and locally available soil
amendments (such as lime and phosphate
rock) and organic matter (crop residues,
compost and green manure) to replenish lost
soil nutrients: http://www.ifdc.org/.
− In the livestock sector, large improvements are
possible. The appropriate feeding of animals
is a first important step. In traditional food
systems in particular, animal productivity is
low, whereas in modern food systems feed
composition is not always balanced containing
more minerals than is actually necessary.
−Potentially, the largest gain can be realized by
re-establishing the crop-feed-manure loop.
Concentration of livestock is often caused by
a combination of agglomeration effects and a
lack of appropriate policies. Solutions consist
of proper manure collection in stables, manure
storage and manure spreading techniques. To
reduce ammonia (nitrogen) losses, manure
storage need to be covered, and manure
spreading needs to be based on low-emission
techniques (Sutton et al., 2011a). Appropriate
storage capacity is needed to be able to apply
the manure at the right time.
−Minerals in food losses and wastes, food
residues and by-products could be recycled
better. This would lead to a return flow of
minerals from urban to rural areas.
−The final steps involve the minerals from
human excreta and other sources in sewage
systems. The first concern is that these
minerals should not be released into freshwater
or coastal systems, where they might cause
serious pollution issues. Secondly, recycling
of the nutrients will increase overall nutrient
efficiency.
It should be emphasized that, as previously
described, there are more essential minerals
than N and P. In fact there are 6 macronutrients
(N, P, S, K, Ca and Mg) and 7–10 micronutrients.
Proper recycling and increased efficiency should
therefore not only focus on N and/or P.
Biophysical options for a more efficient and
sustainable use of biodiversity
A more sustainable use of biodiversity and
ecosystem services can be achieved in various
ways, mostly by reducing pressures. Important
aspects are the maintenance of system integrity
and stimulation of the resilience of ecosystems.
Effective ecological intensification requires an
understanding of the relations between crop
growth at different scales and the community
composition of ecosystem service-providing
organisms above and below ground and the
contribution to yield the multiple services
delivered by these organisms (Bommarco et al., 2013). Farmer knowledge might help
understanding these relations and services
with respect to local crops, thereby stimulating
agro-biodiversity. Understanding ecological
processes and addressing how to harness
functional biodiversity to secure food production
without damaging the wider environment emerge
as research priorities. Concrete measures
include:
−Conservation or reintroduction of landscape
elements such as wetlands, hedges and other
more natural areas.
−Agricultural diversification practices such as
agroforestry, multi-cropping and crop rotations
(Ponisio et al., 2015).
−Adoption of measures to prevent desertification
due to overgrazing.
−Reduced and more targeted use of pesticides
and other biocides.
−Reduction of land conversion, water use and
nutrient losses (see previous sections).
A more efficient and sustainable use of
ecosystem services would potentially implicate a
shift from current high-input agricultural systems
to systems that profit more from ecosystem
services such as pest and disease control,
pollination, nutrient and water cycling, and
provisioning of habitat, while maintaining or even
enhancing food production.
Ann
ex 1
Res
ourc
e sp
ecifi
c op
tions
for
a m
ore
sust
aina
ble
and
effic
ient
use
of n
atur
al r
esou
rces
in fo
od s
yste
ms
158
Options for a more efficient and sustainable
use of genetic resources
Important options for enhancing the sustainable
and efficient use of genetic resources are:
−The conservation of the present agro-
biodiversity. This is important because
the current genetic resources may contain
genetic information that is important for future
food systems. In some cases, it might be
necessary to use the old landraces, as well as
wild relatives in further breeding. Fortunately,
the conservation of agro-biodiversity has been
put on the international and research agenda.
−The conservation of system integrity. System
integrity might be at risk for several reasons: (i)
the introduction of exotic species, which has
taken place often during the last few centuries,
sometimes leading to major disasters,
especially when the newly-introduced species
strongly competed with local species, (ii) the
inter-breeding of farm with wild populations, as
for example in the case of farmed salmon. This
can result in reduced lifetime success, lowered
individual fitness, and decreases in production
over at least two generations (Thorstad et al.,
2008), and (iii) gene flow, being the exchange
of genes between cultivated and wild relatives.
People are particularly concerned about the
consequences of this in the case of Genetically
Modified crops.
−New directions for plant and animal breeding.
Besides aiming for higher yields, efforts
could be directed at plants and animals that
perform better under marginal and/or variable
conditions. In plant breeding in particular,
more attention could be paid to the nutritional
value. Other directions that enhance or profit
from more agro-biodiversity are plants that
are better suited for intercropping or mixed
cropping systems, or the use of mixtures
of varieties that might increase resilience.
Adaptation to climate change might require
changing crops, varieties and farming
practices (Asfaw & Lipper, 2011).
Options for a more efficient and sustainable
use of marine resources
Several measures can be taken to improve both
the efficiency and the sustainability of marine
resource use. Many assessments emphasize a
combination of rebuilding overfished stocks with
an increase in sustainable aquaculture in order
to meet global fish demands while relieving the
pressure on marine ecosystems. Options for
fisheries include:
−Limiting fish yields to an ecologically
sustainable level, also taking into account
social aspects. The concept of Maximum
Sustainable Yield (MSY) is often used in
policies, although this concept is challenged
(see also next bullet point). MSY is the largest
yield that is theoretically possible over an
indefinite period when a steep, immediate
and prolonged reduction of the fishing effort
is called for. Model scenarios show that even
with a dramatic reduction in the global catch
to 12 million tonnes (from currently ~ 80 million
tonnes) that is then built up incrementally, it will
take 20–30 years to attain a MSY of 80 million
tonnes per year (PBL, 2010).
−An ecosystems approach to fisheries
management. A more holistic approach to
fisheries management is thought to have much
more beneficial effects on marine biodiversity
than the current species-by-species approach
(PBL, 2014a). Given the importance of small-
scale operations in the global fisheries sector,
policies and other actions should directly
address the sustainability and efficiency issues
faced by this segment. The predominance of
small fishing vessels (~79% of all motorized
boats were smaller than 12m in 2012) illustrates
the importance of small-scale fisheries and
their potential impact on the sustainable and
efficient use of marine resources (FAO, 2014c).
Small-scale fisheries are increasingly viewed
as catalysts of sustainable development in
fisheries (PBL, 2012). Differentiation between
large- and small-scale operations would
have to be carefully designed to secure the
sustainability of the stocks that the small-scale
segment ultimately depends on.
−Eliminate destructive fishing gear such as
dynamite and poison fishing and minimize use
of potentially damaging techniques like bottom
trawling in vulnerable areas.
−Changing consumers’ preferences, for
example towards the consumption of smaller
Food
sys
tem
s an
d na
tura
l res
ourc
es
159
fish, other fish or shellfish species.
−Adopt greener technologies that reduce fossil
fuel use and greenhouse gas emissions as
well as by-catch. A great example of this is the
recently adopted technology of pulse fishing
as an alternative to bottom trawling. This
technology can reduce fossil fuel use by up
to 50%, while at the same time reducing by-
catch significantly.
− Increase sustainable aquaculture production.
Important options for this sector include
improving feeding efficiency, the substitution
of fish meal with vegetarian resources and
a focus on herbivorous fish; preventing spill
over into wild ecosystems by using sterile
triploids; minimizing the application of
chemicals such as anti-fouling agents and
antibiotics and focusing on cultivation for
domestic consumption (PBL, 2014a). One
of the difficulties in replacing fish meal with
plant-based alternatives is that the fatty acid
composition is less favorable, as the plant-
based alternatives mainly contain omega-6
fatty acids, instead of omega-3 fatty acids.
Options for more efficient use of fossil fuels
and replacement with renewable sources
The main pathways to reduce fossil fuel use are:
−Reduce energy-use and improve energy
efficiency at all stages: energy-efficient
equipment (cooling, transportation), reduction
of transport (especially energy-intensive
transport as air freight) and through synergies
with other resources. For example, a more
efficient use of water and fertilizers will reduce
energy demand. Change in lifestyle and diets
(for example lower consumption of products
that need cooling) also lead to reduced
energy-use.
−Switch to renewable energy sources, such as
solar, wind or forms of bioenergy.
At the same time, the use of bioenergy (notably
bio-fuels) as an alternative for fossil fuels has
several trade-offs that need to be taken into
consideration (UNEP, 2009). A higher demand
for biofuels will add to the need of expanding
cropland to meet growing food demand, and also
creates risks of higher food prices. Expansion
may also be at the expense of forests. For
instance, in Indonesia an estimated two-thirds
of the current expansion of palm oil cultivation
has resulted from the conversion of rainforests.
In addition, several environmental effects are
associated with growing biofuel crops such
as increased eutrophication and water quality
problems (UNEP, 2009)
Options to reduce greenhouse gas
emissions
In the IPCC report on the Mitigation of Climate
Change a number of mitigation options were
identified for the AFOLU sector, sorted into
supply-side options. Demand-side options were
also identified, such as reducing food losses
and wastes and dietary changes (Chapter
6). These don’t include options for other food
system activities, although a number of demand-
side options (such as reduced food wastes and
losses) will affect all food system activities.
It should be noted that many of the mitigation
options will also have benefits for resource use
(notably of land, water and nutrients), while
some will also lead to a reduction of nutrient
losses. Estimates for the mitigation potential of
supply-side options from the agricultural sector
range from 0.3 to 4.6 Gt CO2-eq/yr at prices up
to 100 USD/tCO2-eq (IPCC, 2014a). The IPCC
WG III report states that demand-side options
are largely under-researched. Changes in diet
and reductions in losses in the food supply
chain could however have a significant impact
on GHG emissions from food production (0.76–
8.55 GtCO2-eq/yr by 2050).
Ann
ex 2
Glo
ssar
y
160
Annex 2 Glossary
Biodiversity The Millennium Ecosystem Assessment (MA, 2005) defines biodiversity
as “the variability among living organisms from all sources including, inter
alia, terrestrial, marine and other aquatic ecosystems and the ecological
complexes of which they are part; this includes diversity within species,
between species and of ecosystems.” Biodiversity forms the foundation
for ecosystem services
Ecosystem services Ecosystem services are defined as benefits people obtain from
ecosystems.(MA, 2005)
Efficient resource use An efficient use of resources is defined as ‘high output per unit of input’, to
be measured at various spatial and temporal levels.
Environmentally-
sustainable food
systems
An environmentally-sustainable food system is a food system in which the
environmental bases to deliver food security for future generations is not
compromised. A sustainable and efficient use of natural resources for, as
well as a limited environmental impacts of, food system activities are key
components of an environmentally-sustainable food system.
Environmental
impacts
Environmental impacts (of food systems) refer to impacts of food system
activities on the environment. Main environmental impacts are a result of
direct human interventions, such as deforestation, as well as in the form of
emissions (e.g. of nutrients, greenhouse gases and pesticides).
Food chain A food chain is the set of activities within the food system, usually including
producing, processing, distributing, preparing and consuming food.
Food losses and
waste
Food loss and waste (FLW) refers to a decrease of the amount of food that
was originally intended for human consumption, regardless of the cause.
It can occur at any stage of the food chain from harvesting to consuming.
Food losses refers to a decrease, at all stages of the food chain prior to the
retail or consumer level, in mass, of food that was originally intended for
human consumption, regardless of the cause.
Food waste refers to food appropriate for human consumption being
discarded or left to spoil at retail or consumer level – regardless of the
cause. Based on HLPE(2014a)
Food security A state or condition when all people, at all times, have physical, economic
and social access to sufficient safe and nutritious food that meets their
dietary needs and food preferences for an active and healthy life CFS
(2009)

Food
sys
tem
s an
d na
tura
l res
ourc
es
161
Food system A food system gathers all the elements (environment, people, inputs,
processes, infrastructures, institutions, etc.) and activities that relate to
the production, processing, distribution, preparation and consumption of
food, and the outputs of these activities, including socio-economic and
environmental outcomes (HLPE, 2014a)
Genetically -modified
(GM) organisms
Genetically modified organisms (GMOs) can be defined as animals or
plants in which the genetic material (DNA) has been altered in a way that
does not occur naturally by pollination and/or natural recombination. It
allows selected individual genes to be transferred from one organism into
another, also between nonrelated species. Foods produced from or using
GM organisms are often referred to as GM foods. (WHO)
Genetic resources The diversity of plants, animals and micro-organisms on which all food
systems depend
Intermediate food
systems
Food systems which show part of the characteristics of traditional food
systems, but also characteristics of modern food systems
Malnutrition Bad nutrition, either too little or too much on required calories and nutrients
Minerals Minerals in this report refer to the chemical elements (apart from C, H
and O) which are essential for plant growth, animals and humans (e.g.
P, K, Ca and Mg). Minerals can be naturally present in the soils, or can be
mined from geological stocks. The terms minerals and nutrients are use as
alternate terms.
Modern food systems ‘Modern’ systems (alternatively referred to as ‘high external-input food
systems’) are food systems which depend on a range of inputs such as new
crop varieties, fertilizers, pesticides, veterinary applications, machinery
and other high-tech equipment for producing food, and high-tech systems
for storing, transporting, processing and retailing activities.
Non-renewable
resources
Non-renewable resources are exhaustible natural resources whose
natural stocks cannot be regenerated after exploitation or that can only
be regenerated or replenished by natural cycles that are relatively slow
at human scales” (OECD, 2002). They include fossil fuels, metals and
minerals. (UNEP, 2010)
Nutrients See minerals. These terms are in these report largely used as synonyms.
The term nutrients is more related to their use and function in plant
production. The term nutrients as used in human nutrition compromises
more substances than minerals.
Nutrition security A state or condition when all people at all times have physical, social
and economic access to food, which is safe and consumed in sufficient
quantity and quality to meet their dietary needs and food preferences, and
is supported by an environment of adequate sanitation, health services
and care, allowing for a healthy and active life (Horton and Lo, 2013).
Obesity Obesity is a medical condition in which a high amount of body fat increases
the chance of developing medical problems.
Obese Adults with a Body Mass Index (BMI) higher than 30.0
Ann
ex 2
Glo
ssar
y
162
Overweight Adults with a Body Mass Index (BMI) 25.0 to 29.9
Renewable resources Renewable resources stem from renewable natural stocks that, after
exploitation, can return to their previous stock levels by natural processes
of growth or replenishment, provided they have not passed a critical
threshold or ‘tipping point’ from which regeneration is very slow (e.g.
soil degradation), or impossible (e.g. species extinction) (UNEP, 2010).
Crucial renewable resources for food systems are land, water, biodiversity
(including genetic and marine resources) and ecosystem goods and
services
‘Resource-Smart’
Food Systems
Alternate term for environmentally-sustainable food systems
Sustainable food
system
A sustainable food system (SFS) is a food system that ensures food
security and nutrition for all in such a way that the economic, social and
environmental bases to generate food security and nutrition of future
generations are not compromised. (HLPE, 2014a)
Sustainable
intensification
Sustainable intensification can be defined as simultaneously improving the
productivity and sustainable management of natural resources, although
various, overlapping definitions exist (Buckwell et al., 2014, Garnett et al., 2013, Pretty et al., 2011)
Traditional food
system
‘Traditional’ food systems (or ‘low external input-intensive food systems’)
involve farmers and fishers using mainly inputs available on the farm,
applying growing and harvesting techniques established already for a
long time and moving produce by foot, animal or cart to local markets,
where they usually sell or trade their commodities relatively unprocessed.
(Chapter 3)
Undernourishment Undernourishment means that a person is not able to acquire enough food
to meet the daily minimum dietary energy requirements, over a period
of one year. FAO defines hunger as being synonymous with chronic
undernourishment.
Water efficiency Water efficiency is described by the ratio of useful water outputs to inputs
of a given system or activity. It implies using less water to achieve more
goods and services and entails finding ways to maximize the value of
water use and allocation decisions. (UNEP, 2011b)
Water productivity Water productivity measures how a system converts water into goods and
services. It refers to the ratio of net benefits derived from e.g. crop, forestry,
fishery, livestock and industrial systems to the amount of water used in the
production process (product units/m3). Generally, increased productivity
of water means increasing the volume of benefit, i.e. output, service or
satisfaction from a unit of water used. When water productivity is measured
in monetary output instead of physical output, we speak about “economic
water productivity”. (UNEP, 2011b)

For more information, contact:
International Resource Panel Secretariat, United Nations Environment Programme Division of Technology, Industry and Economics Email: [email protected] Website: www.unep.org/resourcepanel Twitter: @UNEPIRP
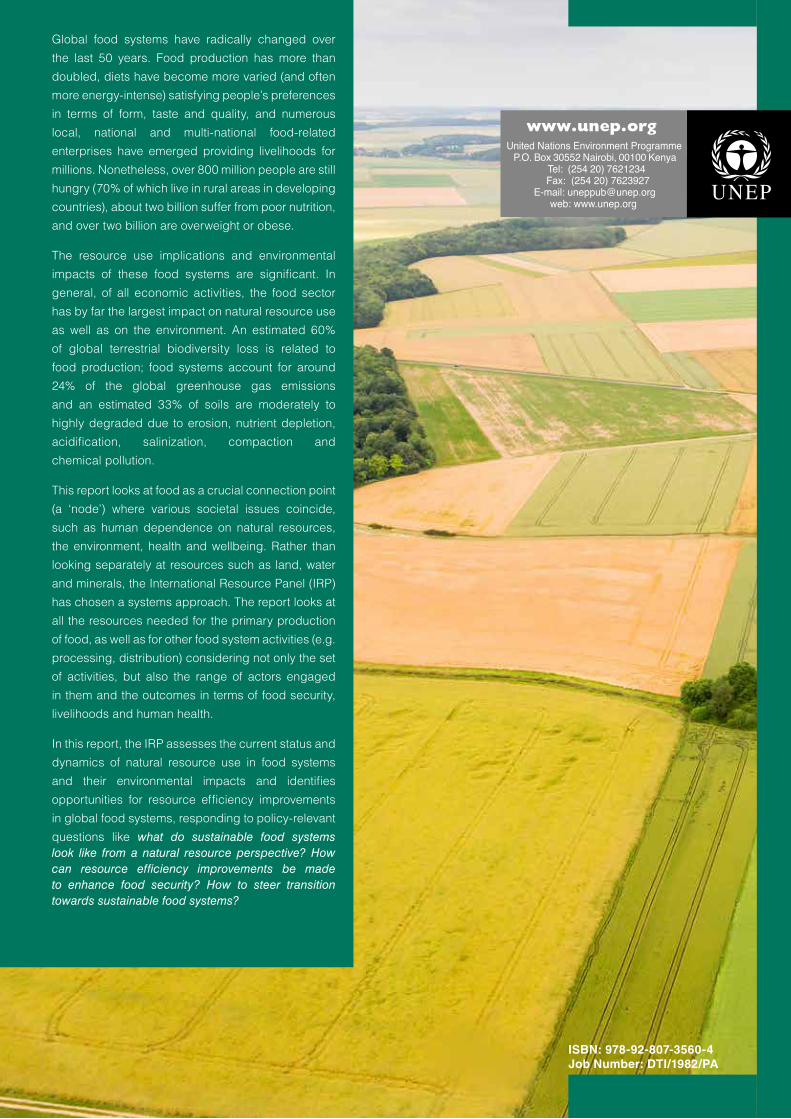
Global food systems have radically changed over
the last 50 years. Food production has more than
doubled, diets have become more varied (and often
more energy-intense) satisfying people’s preferences
in terms of form, taste and quality, and numerous
local, national and multi-national food-related
enterprises have emerged providing livelihoods for
millions. Nonetheless, over 800 million people are still
hungry (70% of which live in rural areas in developing
countries), about two billion suffer from poor nutrition,
and over two billion are overweight or obese.
The resource use implications and environmental
impacts of these food systems are significant. In
general, of all economic activities, the food sector
has by far the largest impact on natural resource use
as well as on the environment. An estimated 60%
of global terrestrial biodiversity loss is related to
food production; food systems account for around
24% of the global greenhouse gas emissions
and an estimated 33% of soils are moderately to
highly degraded due to erosion, nutrient depletion,
acidification, salinization, compaction and
chemical pollution.
This report looks at food as a crucial connection point
(a ‘node’) where various societal issues coincide,
such as human dependence on natural resources,
the environment, health and wellbeing. Rather than
looking separately at resources such as land, water
and minerals, the International Resource Panel (IRP)
has chosen a systems approach. The report looks at
all the resources needed for the primary production
of food, as well as for other food system activities (e.g.
processing, distribution) considering not only the set
of activities, but also the range of actors engaged
in them and the outcomes in terms of food security,
livelihoods and human health.
In this report, the IRP assesses the current status and
dynamics of natural resource use in food systems
and their environmental impacts and identifies
opportunities for resource efficiency improvements
in global food systems, responding to policy-relevant
questions like what do sustainable food systems look like from a natural resource perspective? How can resource efficiency improvements be made to enhance food security? How to steer transition towards sustainable food systems?
ISBN: 978-92-807-3560-4Job Number: DTI/1982/PA
United Nations Environment ProgrammeP.O. Box 30552 Nairobi, 00100 Kenya
Tel: (254 20) 7621234Fax: (254 20) 7623927
E-mail: [email protected]: www.unep.org
www.unep.org