Food-pics: an image database for experimental research on eating and appetite
10
ORIGINAL RESEARCH ARTICLE published: 24 June 2014 doi: 10.3389/fpsyg.2014.00617 Food-pics: an image database for experimental research on eating and appetite Jens Blechert 1 *, Adrian Meule 2,3 , Niko A. Busch 4,5 and Kathrin Ohla 6 1 Division of Clinical Psychology, Psychotherapy and Health Psychology, University of Salzburg, Salzburg, Austria 2 Institute of Psychology, University of Würzburg, Würzburg, Germany 3 Hospital for Child and Adolescent Psychiatry, LWL University Hospital of the Ruhr University Bochum, Hamm, Germany 4 Institute of Medical Psychology, Charité–Universitätsmedizin, Berlin, Germany 5 Berlin School of Mind and Brain, Humboldt Universität zu Berlin, Berlin, Germany 6 Section Psychophysiology, Department of Molecular Genetics, German Institute of Human Nutrition Potsdam-Rehbrücke, Nuthetal, Germany Edited by: Boris C. Rodríguez-Martín, Central University “Marta Abreu” of Las Villas, Cuba Reviewed by: Martin Yeomans, University of Sussex, UK Amy Claire Reichelt, University of New South Wales, Australia Michelle Dalton, University of Leeds, UK *Correspondence: Jens Blechert, Division of Clinical Psychology, Psychotherapy and Health Psychology, University of Salzburg, Hellbrunner Str. 34, 5020 Salzburg, Austria e-mail: [email protected] Our current environment is characterized by the omnipresence of food cues. The sight and smell of real foods, but also graphically depictions of appetizing foods, can guide our eating behavior, for example, by eliciting food craving and influencing food choice. The relevance of visual food cues on human information processing has been demonstrated by a growing body of studies employing food images across the disciplines of psychology, medicine, and neuroscience. However, currently used food image sets vary considerably across laboratories and image characteristics (contrast, brightness, etc.) and food composition (calories, macronutrients, etc.) are often unspecified. These factors might have contributed to some of the inconsistencies of this research. To remedy this, we developed food-pics, a picture database comprising 568 food images and 315 non-food images along with detailed meta-data. A total of N = 1988 individuals with large variance in age and weight from German speaking countries and North America provided normative ratings of valence, arousal, palatability, desire to eat, recognizability and visual complexity. Furthermore, data on macronutrients (g), energy density (kcal), and physical image characteristics (color composition, contrast, brightness, size, complexity) are provided. The food-pics image database is freely available under the creative commons license with the hope that the set will facilitate standardization and comparability across studies and advance experimental research on the determinants of eating behavior. Keywords: standardized food images, food pictures, food-cues, image properties, ERP, fMRI, eating behavior, obesity INTRODUCTION Our current environment is characterized by frequent cues for highly palatable foods. Many researchers partially attribute rising obesity rates and problems in eating-related self-regulation to this factor (Meule and Vögele, 2013). To examine the factors underly- ing appetitive responses to foods, research is increasingly using food images (Van Der Laan et al., 2011). Visual food cues consti- tute, like odors, a primary sensory input that allows predictions about the edibility and palatability of a food object. Thus, visual food cues can be regarded conditioned stimuli that are associated with the hedonic and homeostatic effects of ingestion and are therefore themselves rewarding (Dagher, 2012). Also, overt eat- ing behaviors are under strong conscious control and therefore do not always reveal underlying response tendencies. Using food images, neurocognitive and indirect measures have been partic- ularly successful in the study of subtle appetitive and regulatory determinants of overt eating behavior. The “picture viewing approach” is validated by several lines of evidence. First, food deprivation/hunger affects the response to food images on several levels. Short term food deprivation affects responses to food pictures as demonstrated for implicit food evaluation (e.g., Seibt et al., 2007; Hoefling and Strack, 2008), salivation (e.g., Wooley and Wooley, 1981), autonomic responding (e.g., Rodriguez et al., 2005), visual attentional pro- cessing (e.g., Stockburger et al., 2009b) and neural reward system activity (e.g., Labar et al., 2001; Uher et al., 2006; Castellanos et al., 2009; Goldstone et al., 2009). Second, food image responses reliably differentiate individuals with abnormal eating behav- ior from healthy controls: altered food cue processing has been reported in individuals with restrained (Blechert et al., 2010; Burger and Stice, 2011), external (Nijs et al., 2009) or emotional eating (Bohon et al., 2009), as well as in patients with eating dis- orders (Blechert et al., 2011; Nikendei et al., 2012) or obesity (Nijs and Franken, 2012; Martens et al., 2013). Third, food pic- ture viewing tasks have been adapted to train eating control, for example, through food-specific inhibition tasks (e.g., stop-signal task; Van Koningsbruggen et al., 2013) or attentional retraining (Werthmann et al., 2013; Kakoschke et al., 2014; Kemps et al., 2014) with measurable effects on actual food intake, supporting the notion that responding to food images is causally involved in eating behavior. In sum, there is good evidence that the food picture viewing approach is a useful tool for the study of eating www.frontiersin.org June 2014 | Volume 5 | Article 617 | 1
Transcript of Food-pics: an image database for experimental research on eating and appetite

ORIGINAL RESEARCH ARTICLEpublished: 24 June 2014
doi: 10.3389/fpsyg.2014.00617
Food-pics: an image database for experimental research oneating and appetiteJens Blechert1*, Adrian Meule2,3, Niko A. Busch4,5 and Kathrin Ohla6
1 Division of Clinical Psychology, Psychotherapy and Health Psychology, University of Salzburg, Salzburg, Austria2 Institute of Psychology, University of Würzburg, Würzburg, Germany3 Hospital for Child and Adolescent Psychiatry, LWL University Hospital of the Ruhr University Bochum, Hamm, Germany4 Institute of Medical Psychology, Charité–Universitätsmedizin, Berlin, Germany5 Berlin School of Mind and Brain, Humboldt Universität zu Berlin, Berlin, Germany6 Section Psychophysiology, Department of Molecular Genetics, German Institute of Human Nutrition Potsdam-Rehbrücke, Nuthetal, Germany
Edited by:
Boris C. Rodríguez-Martín, CentralUniversity “Marta Abreu” of LasVillas, Cuba
Reviewed by:
Martin Yeomans, University ofSussex, UKAmy Claire Reichelt, University ofNew South Wales, AustraliaMichelle Dalton, University ofLeeds, UK
*Correspondence:
Jens Blechert, Division of ClinicalPsychology, Psychotherapy andHealth Psychology, University ofSalzburg, Hellbrunner Str. 34,5020 Salzburg, Austriae-mail: [email protected]
Our current environment is characterized by the omnipresence of food cues. Thesight and smell of real foods, but also graphically depictions of appetizing foods, canguide our eating behavior, for example, by eliciting food craving and influencing foodchoice. The relevance of visual food cues on human information processing has beendemonstrated by a growing body of studies employing food images across the disciplinesof psychology, medicine, and neuroscience. However, currently used food image setsvary considerably across laboratories and image characteristics (contrast, brightness, etc.)and food composition (calories, macronutrients, etc.) are often unspecified. These factorsmight have contributed to some of the inconsistencies of this research. To remedythis, we developed food-pics, a picture database comprising 568 food images and 315non-food images along with detailed meta-data. A total of N = 1988 individuals withlarge variance in age and weight from German speaking countries and North Americaprovided normative ratings of valence, arousal, palatability, desire to eat, recognizabilityand visual complexity. Furthermore, data on macronutrients (g), energy density (kcal), andphysical image characteristics (color composition, contrast, brightness, size, complexity)are provided. The food-pics image database is freely available under the creative commonslicense with the hope that the set will facilitate standardization and comparability acrossstudies and advance experimental research on the determinants of eating behavior.
Keywords: standardized food images, food pictures, food-cues, image properties, ERP, fMRI, eating behavior,
obesity
INTRODUCTIONOur current environment is characterized by frequent cues forhighly palatable foods. Many researchers partially attribute risingobesity rates and problems in eating-related self-regulation to thisfactor (Meule and Vögele, 2013). To examine the factors underly-ing appetitive responses to foods, research is increasingly usingfood images (Van Der Laan et al., 2011). Visual food cues consti-tute, like odors, a primary sensory input that allows predictionsabout the edibility and palatability of a food object. Thus, visualfood cues can be regarded conditioned stimuli that are associatedwith the hedonic and homeostatic effects of ingestion and aretherefore themselves rewarding (Dagher, 2012). Also, overt eat-ing behaviors are under strong conscious control and thereforedo not always reveal underlying response tendencies. Using foodimages, neurocognitive and indirect measures have been partic-ularly successful in the study of subtle appetitive and regulatorydeterminants of overt eating behavior.
The “picture viewing approach” is validated by several linesof evidence. First, food deprivation/hunger affects the responseto food images on several levels. Short term food deprivationaffects responses to food pictures as demonstrated for implicit
food evaluation (e.g., Seibt et al., 2007; Hoefling and Strack,2008), salivation (e.g., Wooley and Wooley, 1981), autonomicresponding (e.g., Rodriguez et al., 2005), visual attentional pro-cessing (e.g., Stockburger et al., 2009b) and neural reward systemactivity (e.g., Labar et al., 2001; Uher et al., 2006; Castellanoset al., 2009; Goldstone et al., 2009). Second, food image responsesreliably differentiate individuals with abnormal eating behav-ior from healthy controls: altered food cue processing has beenreported in individuals with restrained (Blechert et al., 2010;Burger and Stice, 2011), external (Nijs et al., 2009) or emotionaleating (Bohon et al., 2009), as well as in patients with eating dis-orders (Blechert et al., 2011; Nikendei et al., 2012) or obesity(Nijs and Franken, 2012; Martens et al., 2013). Third, food pic-ture viewing tasks have been adapted to train eating control, forexample, through food-specific inhibition tasks (e.g., stop-signaltask; Van Koningsbruggen et al., 2013) or attentional retraining(Werthmann et al., 2013; Kakoschke et al., 2014; Kemps et al.,2014) with measurable effects on actual food intake, supportingthe notion that responding to food images is causally involvedin eating behavior. In sum, there is good evidence that the foodpicture viewing approach is a useful tool for the study of eating
www.frontiersin.org June 2014 | Volume 5 | Article 617 | 1

Blechert et al. Food-pics database
behavior and appetitive/motivational brain systems. However, anumber of factors need to be taken into account during selec-tion of images to be able to draw firm conclusions. These factorsbroadly fall into the categories (1) food types, (2) individualdifferences, and (3) image characteristics.
Regarding food types, cultures around the world have broughtabout a vast variety of foods that researchers need to considerwhen designing experiments. What might be the dimensions thatneed to be considered during image selection? First, foods differin caloric content, which has been shown to affect early elec-trocortical responses (Toepel et al., 2009; Meule et al., 2013).However, caloric density often goes along with the degree of foodprocessing: processed foods are often more energy-dense than nat-ural, unprocessed foods. Processed foods furthermore differ intheir colors from whole foods like fruits and vegetables, whichutilize the entire color spectrum. Thus, image selection accord-ing to caloric density should simultaneously consider level ofprocessing and colors. Besides caloric density, macronutrients,that are proteins, fats, and carbohydrates, should be taken intoaccount, if craving for certain types of food is a construct of inter-est (e.g., craving for carbohydrates, Corsica and Spring, 2008).Furthermore, there are distinguishable food classes such as vegeta-bles, meat-containing dishes, fruits, and snacks which each differin their (seasonal) availability, readiness to eat, flavor, nutritionalcomposition, healthiness, color, and familiarity. Obviously, thecategorization of foods into some classes is dependent not onlyon individual experiences and availability of certain foods but alsoon the research questions asked. It is for that reason, that food-picsprovides a variety of food images that cover many food classes andthat, most importantly, can be classified as needed by the user.
Not only is there a wide variety of food types to choose frombut researchers need to consider the targeted population andtherefore individual differences for image selection. For example,if vegetarians or vegans are part of the sample, meat containingimages should probably be avoided as these trigger altered neu-ral and behavioral responses in vegetarians compared to omni-vores (Stockburger et al., 2009a). Similar considerations apply tofood preferences based on cultural, religious or health grounds(Hoffman et al., 2013). Individual preferences affect brainresponses, which is why some studies individualize stimuli tomatch each participant’s preferences (e.g., Hollmann et al., 2012;Giuliani et al., 2013). Further individual differences in age andgender, educational status, and body mass index (BMI) should beconsidered for images selection (Caine-Bish and Scheule, 2009;Raffensperger et al., 2010; Berthoud and Zheng, 2012).
A third class of factors are image characteristics. Unfortunately,dimensions such as brightness, contrast, or spatial frequencieshave not received much attention in studies using food-relatedimages. However, effects of such image features on visual per-ception and stimulus-evoked neuronal responses are well known.Consequently, it is recommended to carefully control the phys-ical properties of visual stimulus material (Knebel et al., 2008;Willenbockel et al., 2010; Kovalenko et al., 2012; Ball et al., 2013).For example, the role of image complexity and spatial frequenciesfor neural responses are heavily debated in the field of face pro-cessing (Vuilleumier et al., 2003; Thierry et al., 2007; Rossion andJacques, 2008) and are increasingly considered during affective
picture viewing (Bradley et al., 2007; Delplanque et al., 2007;Wiens et al., 2011). Thus, similar standards must apply to stud-ies using food pictures rendering standardized stimulus sets andassociated meta-data essential. To this end, Foroni et al. (2013)recently presented an image database featuring food (natural,transformed), rotten food, non-food objects (natural, artificial),animals, and scenes along with normative ratings by 73 healthyparticipants and physical image properties (size, brightness andspatial frequency). They focused on the natural (food, non-food) and artificial distinction in their data analyses. While theirdatabase (Foodcast Research Image Database, FRIDa) representsan important step forward in the field of food picture research andtheir variety of images is broad, the number of edible food itemsis relatively restricted and, in part, specific to the Mediterraneancuisine. Moreover, their normative data stem from a small sam-ple with little demographic diversity, resulting in a relatively lownumber of ratings per image.
In the present study, we present food-pics, a stimulus set of 568food and 315 non-food images. In our study design (normativeratings, image characteristics), we aimed to be complementaryto FRIDa and at the same time address some of its limitations.Food-pics was aggregated to represent a wider range of foodsto allow applicability in western countries. Our normative par-ticipant samples (N = 1988) were selected to represent typicaluniversity student samples but, in total, span a comparativelywide range of age (11–77 years), BMI (12–67 kg/m2), and culturalbackground (German-speaking countries and the USA), to pro-vide robust and generalizable normative data on commonly usedperceptual and psychological parameters like palatability, desireto eat, recognizability, familiarity, valence and arousal. Physicalimage characteristics, that is, color, size, contrast, brightness, andcomplexity, were computed to complement the dataset and allowthe selection of physically matching groups of images. Our anal-yses explore several example dimensions relevant to study design:(1) image type (e.g., food vs. non-food images) and food type (e.g.,vegetables vs. meat vs. fruits, high- vs. low-calorie dense food,sweet vs. savory food, whole vs. processed food), (2) individualdifferences (e.g., demographics such as age, gender, and BMI, butalso cultural background and vegetarianism) and (3) state vari-ables (e.g., hunger and current weight reduction diet) on imageratings. We also explored the relationship of (4) image characteris-tics (e.g., contrast, brightness, complexity) with subjective ratingsand nutritional content.
METHODSSTIMULIThe database comprises 568 food images including sweet (e.g., icecream, chocolate), savory (e.g., pistachios, sandwiches), processed(e.g., hamburger, French fries, potato chips, chocolate bars) andwhole foods (e.g., vegetables and fruits) and beverages (e.g., cof-fee, orange juice). Images of single items (e.g., one apple), severalitems (e.g., three apples) as well as full meals (e.g., roast beef withvegetables), were included. The food images are complementedby 315 non-food images comprising animals (n = 37, e.g., but-terflies, dogs), flowers and leaves (n = 42), common householdobjects (n = 89, e.g., bucket, flat iron), office supply (n = 20, e.g.,paper clip, ball pen), kitchen accessories (n = 46, e.g., toaster,
Frontiers in Psychology | Eating Behavior June 2014 | Volume 5 | Article 617 | 2

Blechert et al. Food-pics database
pan), as well as tools (n = 23, e.g., pliers, screws), food packag-ing (n = 33, e.g., pizza box; no food visible on packaging), andother objects (n = 25). Images were selected from a commerciallyavailable database (Hemera Photo Objects, Vols. I-III), collectedfrom non-copyrighted sources on the internet, or taken in ourlab using an Olympus SZ-31MR digital camera (OlympusCorp.,Tokyo, Japan). All images are color photographs with a resolu-tion of 600 × 450 pixels (96 dpi, sRGB color format). Images werestandardized on background color (white) and selected/editedto be relatively homogeneous with regard to, viewing distance(≈80 cm), angle and simple figure-ground composition. Thebackground was adapted to meet eating conditions: some foodscan be presented without dishware (e.g., fruits or hamburger),while others naturally require a plate or bowl (e.g., soup or fruitsalad).
IMAGE CHARACTERISTICSFor each image, we computed relevant image properties thatcharacterize the images’ physical appearance using customizedscripts written in Matlab R2011b (The Mathworks, Inc. Natick,
USA). Scripts can be downloaded from the food-pics website(www.food-pics.sbg.ac.at). With the exception of the RGB chan-nel contribution, all properties were computed after convertingthe colored image to gray values by forming a weighted sum ofthe red, green, and blue color channels: 0.2989 × red + 0.5870 ×green + 0.1140 × blue. This procedure converts RGB imagesto gray-scale by eliminating the hue and saturation informationwhile retaining image luminance (Poynton, 2012). The followingimage properties were analyzed:
Color, quantified as the proportional contribution of the red,green, and blue channel, averaged across all non-white pixels. Forexample, a tomato is characterized by a strong contribution of thered channel (see Figure 1).
Size, quantified as the proportion of non-white pixels relativeto total number of pixels (identical as in Foroni et al., 2013).
Brightness, quantified as the difference between the meanluminance of all non-white pixels of the gray scale image and thewhite background (Foroni et al., 2013). Thus, the most salientobjects (i.e., very dark objects on white background) yielded thehighest brightness values.
FIGURE 1 | Example pictures illustrating image characteristics from low (left) to high parameter value (right).
www.frontiersin.org June 2014 | Volume 5 | Article 617 | 3

Blechert et al. Food-pics database
Within-object contrast, quantified as the standard deviation ofluminance across all non-white pixels of the gray scaled image.For example, an image of a black chocolate bar on a white platecontains pixels with luminance values ranging from very darkto white. Thus, this image is characterized by a high standarddeviation of luminance values. By contrast, an image of whippedcream on a white plate comprises very few dark pixels, and so ischaracterized by a small standard deviation.
Spatial frequenciesMedian power of each object was analyzed by computing a two-dimensional fast Fourier transform on the gray-scale images.One-dimensional power spectra were obtained by computing aradial average of the two-dimensional power spectra. This proce-dure yields a measure of the image’s spatial frequencies, reflectingvariations in pixel luminance, independent of their location inthe image. To represent spectral power in a single value foreach image, we computed the median power across all spatialfrequencies.
ComplexityWhile some images display a single homogenous object (e.g.,a slice of cheese), other images display multiple objects (e.g.,an assortment of different fruits) or objects consisting of mul-tiple components (e.g., a pizza). Images that are complex inthis sense are characterized by multiple object outlines. Thus,we analyzed the images for outlines using a Canny edge detec-tion algorithm (Canny, 1986) and quantified image complexityby computing the proportion of outline-related pixels within theimage. However, the number of outline-pixels is also determinedby the object’s size—a magnified version of the identical objectwould have larger outlines and would yield a higher complexityvalue. Therefore, we also computed a normalized complexity mea-sure that is independent of object size, by additionally dividing theproportion of outline-related pixels by the total number of non-white pixels in the image. Size and brightness were computed inthe same way as reported by Foroni et al. (2013).
MACRONUTRIENTSNumber of kcal and macronutrient composition (proteins, car-bohydrates, fat) of a depicted food were estimated for each foodimage by a trained research assistant (psychology master level stu-dent) using food databases on the internet and food packaginginformation. Kcal and macronutrients are provided as kcal/100gand grams/100g as well as total kcal and grams, respectively,for the depicted portion. Whenever multiple food items weredisplayed (e.g., grapes) counts were provided to facilitate analy-ses of experimental test meals. To cross-validate the accuracy ofthese data, a second research assistant (also a psychology masterlevel student) estimated these data a second time for a randomlyselected subsample of 38 food items1. Agreement between the twocoders was excellent; Pearson correlations ranged from r = 0.84to r = 0.99 with a mean of r = 0.95.
1Image numbers were 4, 9, 10, 15, 26, 41, 46, 64, 85, 95, 101, 110, 116, 134,148, 152, 153, 159, 185, 189, 192, 193, 194, 198, 199, 205, 206, 211, 244, 248,249, 262, 264, 265, 282, 298, 308, 309.
PARTICIPANTSFour samples completed an anonymous online survey (seeTable 1 for sample descriptions) to provide normative datafor food-pics. Only participants who completed all ratings forat least 3 food images were included (see “Online Survey”below). The first sample (“UniHagen sample,” n = 638) com-prised undergraduates of the University of Hagen, a German dis-tance teaching university, who completed the survey in exchangefor course credit and the option of participating in a raf-fle for 3 × 50 Euro upon completion. The second sample wasrecruited through mailing lists of several universities in Germany,Switzerland and Austria (“German-speaking sample,” n = 831).The third sample addressed US-participants (“US sample,” n =496), recruited though the online work marketplace “MechanicalTurk” at Amazon, where registered users work on online tasks
Table 1 | Demographic characteristics by sample.
German-
speaking
US-
American
UniHagen Austrian
children
sample Sample and youth
AGE
Mean (SD) 24.7 (5.46) 35.9(13.41)
32.8(10.07)
13.9 (1.56)
Median (Min, Max) 23 (18–65) 32 (18–77) 30 (17–73) 14 (11–18)
GENDER
Male (%) 16.7 36.3 17.2 60.9
NATIONALITY (%)
Germany 93.0 0 93.1 4.35
Austria 3.01 0 2.35 91.3
Switzerland 0.12 0 1.1 0
Other European country 2.17 0 2.19 4.35
Non-European country 1.68 0 1.25 0
USA 0 98.7 0 0
Canadian 0 0.4 0 0
Other 0 0.80 0 0
BODY MASS INDEX (kg/m2)
Mean(SD) 22.5 (3.70) 27.3 (7.29) 23.4 (4.68) 18.7 (2.77)
Median (Min, Max) 21.7(14.2–45.3)
25.7(15.5–67.4)
22.4(12.1–60.5)
18.6(14.6–24.34)
EATING STYLE (%)
Omnivore 75.9 92.3 77.7 95.7
Vegetarian 20.2 5.4 19.6 4.3
Vegan 3.9 2.2 2.7 0.0
CURRENTLY DIETING
(%) 10.3 23.8 9.9 4.3
EMPLOYMENT (%)
High school 1.2 10.7 0.0 100
College/University 86.8 11.3 100 0.0
Apprenticeship 5.1 0.6 0.0 0.0
Self-employed 1.1 21.6 0.0 0.0
Unemployed 1.2 17.1 0.0 0.0
Other 4.6 38.7 0.0 0.0
PROGRESS IN SURVEY
% Completed 77.6 69.6 89.8 78.3
% Partial completion 22.4 30.4 10.2 21.7
Frontiers in Psychology | Eating Behavior June 2014 | Volume 5 | Article 617 | 4

Blechert et al. Food-pics database
in exchange for payment. The fourth sample addressed childrenand youth at an Austrian high school (“Children/youth sample,”n = 23) to extend the age range. The German-speaking and theChildren/youth samples were also offered participation in a rafflefor 3 × 50 Euros. All surveys were completed between May andAugust 2013. The ethics board of the University of Salzburg hadapproved the study.
ONLINE SURVEYAs participants could not be expected to reliably rate all 882images, each participant rated a random subset of images, sep-arately drawn from non-food and food images. Due to dif-ferent modes of compensation (course credit, payment, raffle)the samples differed in the number of images rated by eachparticipant: UniHagen sample 40 non-foods/80 foods, German-speaking sample 25/40, US sample 17/35, and Children/Youthsample 5/35. On average, each image was rated by 48.8(SD = 22.9) participants.
The survey commenced with an assessment of demographics(age, gender, height, occupation, nationality) and eating habits(weight, diet: omnivore/vegetarian/vegan, weight-loss dieting)before displaying a detailed explanation as well as an example rat-ing for all scales. During the survey, one image was displayed at atime and ratings were required for the dichotomous item famil-iarity (yes or no) and recognizability (easy or difficult). Visualanalog scales (VAS, approximately 8 cm long) were displayed torate complexity (only the extremes were labeled, scale ranged from“very little” to “very high”), valence (from “very negative” to“very positive”), and arousal (from “not at all” to “extremely”).Food items were additionally rated on palatability (from “notat all” to “extremely”) and desire to eat (from “not at all” to“extremely”). General instructions read “how palatable is thisfood for you in general?” and “how much would you like toeat this food right now if it was in front of you.” Anchors oneach visual analog scale for each image read “Palatability” (inGerman “Schmackhaftigkeit”): “not at all” to “extremely”; and“Desire to eat” (German “Verlangen”): “not at all” to “extremely.”Complexity (German “Komplexität”): “very low” to “very high”;was explained as being characterized by “many components,details and subobjects” as well as by “many edges and borders.”The VAS was displayed as a solid bar along which a cursor wasto be moved; the rating was logged upon mouse click. The scalerepresented, invisible to the participants, 100 points (from 1 to100).
DATA ANALYSESTo describe and explore the food-pics normative database and tohighlight some variables that might guide users during imageselection and study design we performed the following analyses:
(1) Image type: Descriptive data are given on stimulus valenceand arousal across different stimulus classes (including non-food images) in the database. For foods (and most remaininganalyses), palatability and desire to eat ratings are of primeimportance and are reported as a function of caloric con-tent (high- vs. low-calorie foods), sweetness (sweet vs. savoryfoods) and degree of processing (whole vs. processed foods).
(2) Individual differences and demographics: Effects of gender,age, and BMI, as well as diet (omnivore vs. vegetarian),and culture (German speaking vs. North American) wereexplored with regard to palatability and desire to eat ratings.
(3) State variables: Hunger ratings were correlated with palata-bility and desire to eat ratings. Likewise, dieters (“currentweight reduction diet”) were compared with non-dieters onpalatability and desire to eat ratings.
(4) Image characteristics, ratings, and macronutrients:Correlational analyses explored relationships betweensubjective ratings, image characteristics, and nutrients.
Generally, due to the high statistical power in the present sam-ple, we only report effects with at least medium (η2 > 0.06,Cohen’s d > 0.3) effect sizes unless otherwise noted. Within eachsubgroup of comparisons we used paired sample Student t-testto compare subgroups of images or display 95% confidenceintervals.
RESULTSIMAGE TYPETo provide an example characterization food and non-foodobjects were classified into several specific categories. Foodobjects were categorized, based on the dominant food in theimage, into fruits (13.3% of all food images), vegetables (20.7%),chocolates (11.4%), meat (11.1%), fish (2.28%), nuts (1.76%),beverages (1.58%) and 38% other foods without clear domi-nance of one food type. Non-food images were categorized intoflowers & leaves (13.4%), animals (10.1%), tools (7.32%), house-hold items (non-kitchen, 28.3%), kitchen utensils (14.6%), officesupply (6.37%), food packaging (10.5%) and other items (1%).Figure 2 displays valence, arousal, palatability, and desire to eatratings for these categories along with 95% confidence intervals.Objects, flowers & leaves and animals were rated more positivelyon valence compared to tools, household and kitchen utensilsas revealed by non-overlapping confidence intervals. Flowers &leaves and animals were also rated more positive on valence thanmost of the foods, except for fruit. Within foods, fruits weremost popular, both in terms of valence and palatability and interms of desire to eat. Interestingly, meat was rated lowest onpalatability and desire to eat (closely followed by nuts for desireto eat).
In addition, as previous research has contrasted foods accord-ing to caloric density, degree of processing, and gustatory qualities,we classified our food pictures into high vs. low caloric den-sity (median split regarding caloric density = kcal/100 g) as wellas into processed (32.0% of all foods) vs. whole (66.7% of allfoods, 1.3% not classifiable) and sweet (42.8%) vs. savory foods(38.8%, 18.4% not classifiable; see Table 2 for means and stan-dard deviations of all ratings of the different food types) anddetermined palatability and desire to eat ratings for each category.High vs. low calorie-dense foods received lower ratings in terms ofpalatability, t(1942) = 13.0, p < 0.001, d = 0.46, and desire to eat,t(1942) = 9.3, p < 0.001, d = 0.42. Sweet vs. savory foods receivedhigher ratings in terms of palatability, t(1960) = 20.3, p < 0.001,d = 0.46, and desire to eat, t(1960) = 18.8, p < 0.001, d = 0.42.Whole vs. processed foods received higher ratings in terms of
www.frontiersin.org June 2014 | Volume 5 | Article 617 | 5

Blechert et al. Food-pics database
FIGURE 2 | (A) Means and 95% confidence intervals for valence (“very negative” to “very positive”) and arousal (“very little” to “very high”) across all imagecategories. (B) Means and 95% confidence intervals for palatability and desire to eat (both “not at all” to “extremely”) across food types.
palatability, [t(1858) = 15.1, p < 0.001, d = 0.35] and desire toeat, [t(1858) = 9.86, p < 0.001, d = 0.23]. In brief, valence andarousal ratings largely mirrored these differences and familiarityand recognizability was consistently high (>93.2% of all foodswere rated as recognizable and 94.6% of all foods were rated asfamiliar).
INFLUENCE OF DEMOGRAPHICS AND INDIVIDUAL DIFFERENCEVARIABLES: CULTURE, GENDER AND VEGETARIANISM, BMI AND AGEIn brief, effects of culture (North America vs. German speak-ing) on all food ratings (all foods, high calorie vs. low
calorie/processed vs. non-processed foods, meat vs. non-meat)were significant but of small effect size (η2
p < 0.06) when con-sidering age and gender differences between the samples ascovariates.
Women gave lower desire to eat ratings for all foods com-pared to men [M = 32.2, SD = 19.6 vs. M = 40.5, SD = 20.5,t(1963) = 7.70, p < 0.001, d = 0.42] whereas no gender differ-ences were found for palatability [M = 58.8, SD = 14.5 vs.M = 59.1, SD = 15.6, t(1963) < 1.00].
Vegetarians rated meat containing images lower than omni-vores on palatability [M = 19.6, SD = 21.2, vs. M = 56.1, SD =
Frontiers in Psychology | Eating Behavior June 2014 | Volume 5 | Article 617 | 6

Blechert et al. Food-pics database
Table 2 | Subjective ratings as a function if different food types (mean, standard deviations).
High calorie Low calorie Processed Whole Sweet Savory
Palatability 56.8 (16.8) 60.9 (15.4) 57 (16.1) 62.8 (17) 62.2 (16.6) 55.5 (16.4)
Desire to eat 32 (21.5) 35.1 (20.7) 32.4 (21) 36.1 (21.7) 37.5 (22.5) 30.4 (21)
Valence 52 (16.7) 58.1 (16.2) 52.3 (16.1) 61.2 (18.3) 56.9 (16.8) 52.2 (15.7)
Arousal 33.4 (20.9) 34.7 (21.4) 33.9 (20.6) 34.6 (22.6) 37 (22.3) 32.2 (20.4)
Recognizability (%) 94.6 (8.72) 96.1 (9.30) 93.2 (9.25) 96.4 (7.3) 94.4 (9.27) 93.4 (10.4)
Familiarity (%) 94.6 (8.73) 96.2 (9.35) 95.1 (8.42) 97.6 (6.9) 95.2 (9.58) 96.1 (8.66)
Recognizability and Familiarity were dichotomous yes/no decisions.
21.2, t(1879) = 29.6, p < 0.001, d = 1.72] and desire to eat[M = 7.46, SD = 13.2, vs. M = 31.3, SD = 26.3, t(1879) = 16.8,p < 0.001, d = 1.21].
BMI was not associated with palatability [r(1916) = 0.029,n.s.] and positively but weakly correlated with desire to eat[r(1961) = 0.117, p < 0.001, for high-calorie foods, r(1961) =0.146, p < 0.001, for low calorie foods r(1961) = 0.059, p <
0.001]. Correlations of age with palatability and desire to eat werevery weak (rs < 0.1).
INFLUENCE OF STATE VARIABLES: HUNGER AND CURRENT DIETINGInterestingly, being currently on a weight reduction diet (13.6%answered this question with yes) did influence ratings onlyto a minor degree. Dieters did not differ from non-dieterson palatability ratings [M = 59.0, SD = 14.9, vs. M = 58.8,SD = 14.8, t(1963) < 1.00] and gave slightly elevated desire toeat ratings [M = 37.1, SD = 19.9, vs. M = 33.5, SD = 20.1,t(1963) = 2.71, p = 0.007, d = 0.21]. Hunger (averaged acrosspre- and post-questionnaire ratings) was weakly positively corre-lated with palatability, r(1965) = 0.120, p < 0.001 (r = 0.04 andr = 0.141 for low- and high-calorie food images, respectively),but showed a medium sized positive correlation with desire to eat,r(1965) = 0.528, p < 0.001 (r = 0.473 and r = 0.524 for low- andhigh-calorie food images, respectively).
IMAGE CHARACTERISTICS, RATINGS AND MACRONUTRIENTSThe main purpose of including image characteristics was to allowfor matching of different stimulus sets in studies using neurocog-nitive measures (e.g., set of high and low calories, i.e., Toepelet al., 2009). Since we had no neurocognitive measures in thisdatabase, we explored how image characteristics were related to(a) the subjective ratings and (b) macronutrients of the displayedfoods. Such data could serve to raise awareness of the importanceto control for such characteristics by an appropriate selection ofimages in future research. To do so, we computed Pearson cor-relations (images on rows) between picture characteristics andsubjective ratings (averaged across all participants) as well as withmacronutrients.
The only correlation of close to medium size indicated thatimage with stronger contribution of the red color channelwere rated as more arousing, r(883) = 0.279, p < 0.001. In addi-tion, image complexity (edge detection), as well as normalizedimage complexity (complexity relative to image size) correlatedwith subjectively rated complexity [r(883) = 0.349, p < 0.001 andr(883) = 0.248, p < 0.001]. A higher contribution of the green
color channel went along with lower concentrations of pro-tein, fat and carbohydrates as well as with lower number ofcalories (r = −0.251, r = −0.209, r = −0.257, and r = −0.313,respectively)
DISCUSSIONThe present study presents food-pics, a database of images offoods for experimental research on food perception and eatingbehavior. Previous studies are limited considerably in stimulusselection and/or characterization of stimulus material and foodcontents hampering the comparability of findings across labora-tories. Food-pics comprises a large variety of foods and non-foodsalong with detailed data on image characteristics, food contents,and normative ratings. We presented example analyses of foodtypes, individual differences, state effects, and image character-istics to explore key variables relevant for experimental design offood viewing studies.
Regarding food types, our results confirm that calorie contentis a relevant determinant of subjective responses, in line with aseveral studies showing distinct neural responses for high- vs.low-calorie images (e.g., Killgore et al., 2003; Cornier et al., 2007;Toepel et al., 2009; Frank et al., 2010). Interestingly, our nor-mative data suggest slightly lower palatability and desire to eatratings for high-calorie images (small to medium effect size), pos-sibly reflecting the rising awareness of the unhealthy nature ofthese foods in the populations studied here or self-presentationbiases. Other self-report studies show the opposite (Richter et al.,under review), as do implicit measures (Houben et al., 2012). Itis possible that food restrictions prior testing played a role herebecause food deprivation renders particularly high-calorie foodsmore attractive (Goldstone et al., 2009). Our data indicate thatparticipants were not very hungry [M = 28.5, SD = 25.4, on a1 (not hungry) to 100 (very hungry) scale] but hunger corre-lated slightly stronger with palatability/desire to eat ratings ofhigh- compared to low-calorie images. Sweet compared to savoryfoods were rated more palatable and with stronger desire to eat, aswere whole vs. processed foods. One has to keep in mind that weused all images of the respective type of the database so it mightwell be that certain subcategories with a high number of imagescontributed more than others (e.g., 76 images displayed fruit inthe whole and sweet categories). Together these results suggestthat image selection will substantially influence (rating) results,depending on the proportion of high-calorie, sweet and wholefoods in a specific category. Processed foods are often higher incaloric density, however, researchers could still match the total
www.frontiersin.org June 2014 | Volume 5 | Article 617 | 7
Blechert et al. Food-pics database
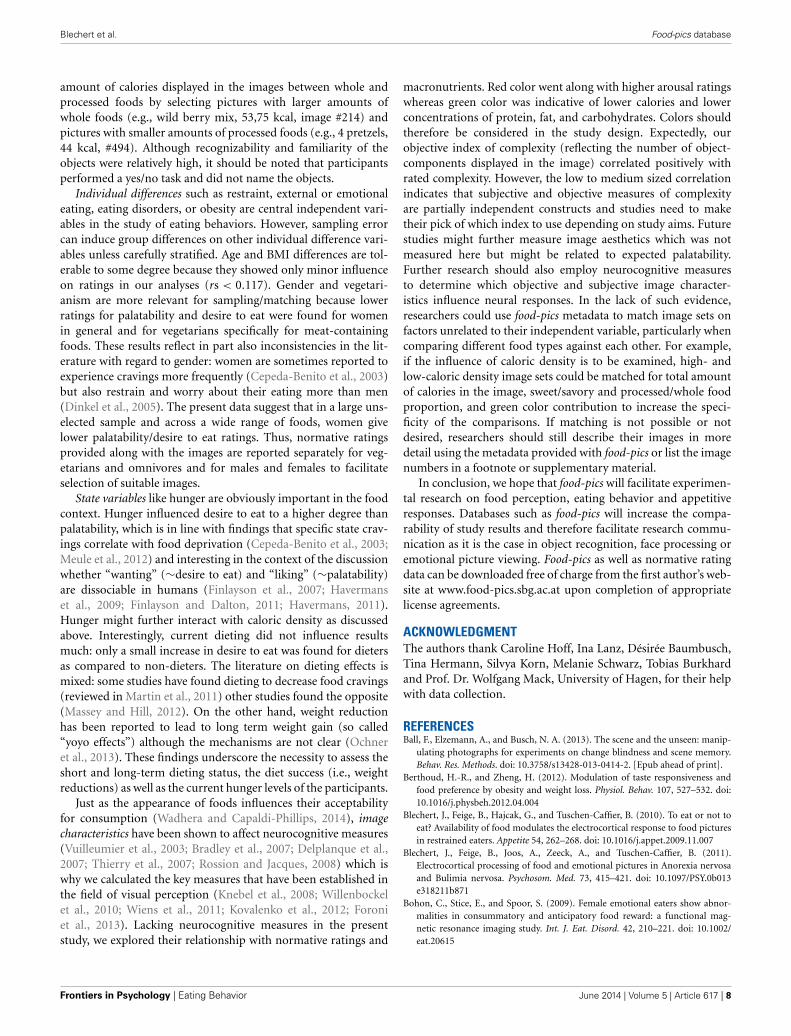
amount of calories displayed in the images between whole andprocessed foods by selecting pictures with larger amounts ofwhole foods (e.g., wild berry mix, 53,75 kcal, image #214) andpictures with smaller amounts of processed foods (e.g., 4 pretzels,44 kcal, #494). Although recognizability and familiarity of theobjects were relatively high, it should be noted that participantsperformed a yes/no task and did not name the objects.
Individual differences such as restraint, external or emotionaleating, eating disorders, or obesity are central independent vari-ables in the study of eating behaviors. However, sampling errorcan induce group differences on other individual difference vari-ables unless carefully stratified. Age and BMI differences are tol-erable to some degree because they showed only minor influenceon ratings in our analyses (rs < 0.117). Gender and vegetari-anism are more relevant for sampling/matching because lowerratings for palatability and desire to eat were found for womenin general and for vegetarians specifically for meat-containingfoods. These results reflect in part also inconsistencies in the lit-erature with regard to gender: women are sometimes reported toexperience cravings more frequently (Cepeda-Benito et al., 2003)but also restrain and worry about their eating more than men(Dinkel et al., 2005). The present data suggest that in a large uns-elected sample and across a wide range of foods, women givelower palatability/desire to eat ratings. Thus, normative ratingsprovided along with the images are reported separately for veg-etarians and omnivores and for males and females to facilitateselection of suitable images.
State variables like hunger are obviously important in the foodcontext. Hunger influenced desire to eat to a higher degree thanpalatability, which is in line with findings that specific state crav-ings correlate with food deprivation (Cepeda-Benito et al., 2003;Meule et al., 2012) and interesting in the context of the discussionwhether “wanting” (∼desire to eat) and “liking” (∼palatability)are dissociable in humans (Finlayson et al., 2007; Havermanset al., 2009; Finlayson and Dalton, 2011; Havermans, 2011).Hunger might further interact with caloric density as discussedabove. Interestingly, current dieting did not influence resultsmuch: only a small increase in desire to eat was found for dietersas compared to non-dieters. The literature on dieting effects ismixed: some studies have found dieting to decrease food cravings(reviewed in Martin et al., 2011) other studies found the opposite(Massey and Hill, 2012). On the other hand, weight reductionhas been reported to lead to long term weight gain (so called“yoyo effects”) although the mechanisms are not clear (Ochneret al., 2013). These findings underscore the necessity to assess theshort and long-term dieting status, the diet success (i.e., weightreductions) as well as the current hunger levels of the participants.
Just as the appearance of foods influences their acceptabilityfor consumption (Wadhera and Capaldi-Phillips, 2014), imagecharacteristics have been shown to affect neurocognitive measures(Vuilleumier et al., 2003; Bradley et al., 2007; Delplanque et al.,2007; Thierry et al., 2007; Rossion and Jacques, 2008) which iswhy we calculated the key measures that have been established inthe field of visual perception (Knebel et al., 2008; Willenbockelet al., 2010; Wiens et al., 2011; Kovalenko et al., 2012; Foroniet al., 2013). Lacking neurocognitive measures in the presentstudy, we explored their relationship with normative ratings and
macronutrients. Red color went along with higher arousal ratingswhereas green color was indicative of lower calories and lowerconcentrations of protein, fat, and carbohydrates. Colors shouldtherefore be considered in the study design. Expectedly, ourobjective index of complexity (reflecting the number of object-components displayed in the image) correlated positively withrated complexity. However, the low to medium sized correlationindicates that subjective and objective measures of complexityare partially independent constructs and studies need to maketheir pick of which index to use depending on study aims. Futurestudies might further measure image aesthetics which was notmeasured here but might be related to expected palatability.Further research should also employ neurocognitive measuresto determine which objective and subjective image character-istics influence neural responses. In the lack of such evidence,researchers could use food-pics metadata to match image sets onfactors unrelated to their independent variable, particularly whencomparing different food types against each other. For example,if the influence of caloric density is to be examined, high- andlow-caloric density image sets could be matched for total amountof calories in the image, sweet/savory and processed/whole foodproportion, and green color contribution to increase the speci-ficity of the comparisons. If matching is not possible or notdesired, researchers should still describe their images in moredetail using the metadata provided with food-pics or list the imagenumbers in a footnote or supplementary material.
In conclusion, we hope that food-pics will facilitate experimen-tal research on food perception, eating behavior and appetitiveresponses. Databases such as food-pics will increase the compa-rability of study results and therefore facilitate research commu-nication as it is the case in object recognition, face processing oremotional picture viewing. Food-pics as well as normative ratingdata can be downloaded free of charge from the first author’s web-site at www.food-pics.sbg.ac.at upon completion of appropriatelicense agreements.
ACKNOWLEDGMENTThe authors thank Caroline Hoff, Ina Lanz, Désirée Baumbusch,Tina Hermann, Silvya Korn, Melanie Schwarz, Tobias Burkhardand Prof. Dr. Wolfgang Mack, University of Hagen, for their helpwith data collection.
REFERENCESBall, F., Elzemann, A., and Busch, N. A. (2013). The scene and the unseen: manip-
ulating photographs for experiments on change blindness and scene memory.Behav. Res. Methods. doi: 10.3758/s13428-013-0414-2. [Epub ahead of print].
Berthoud, H.-R., and Zheng, H. (2012). Modulation of taste responsiveness andfood preference by obesity and weight loss. Physiol. Behav. 107, 527–532. doi:10.1016/j.physbeh.2012.04.004
Blechert, J., Feige, B., Hajcak, G., and Tuschen-Caffier, B. (2010). To eat or not toeat? Availability of food modulates the electrocortical response to food picturesin restrained eaters. Appetite 54, 262–268. doi: 10.1016/j.appet.2009.11.007
Blechert, J., Feige, B., Joos, A., Zeeck, A., and Tuschen-Caffier, B. (2011).Electrocortical processing of food and emotional pictures in Anorexia nervosaand Bulimia nervosa. Psychosom. Med. 73, 415–421. doi: 10.1097/PSY.0b013e318211b871
Bohon, C., Stice, E., and Spoor, S. (2009). Female emotional eaters show abnor-malities in consummatory and anticipatory food reward: a functional mag-netic resonance imaging study. Int. J. Eat. Disord. 42, 210–221. doi: 10.1002/eat.20615
Frontiers in Psychology | Eating Behavior June 2014 | Volume 5 | Article 617 | 8

Blechert et al. Food-pics database
Bradley, M. M., Hamby, S., Low, A., and Lang, P. J. (2007). Brain potentials inperception: picture complexity and emotional arousal. Psychophysiology 44,364–373. doi: 10.1111/j.1469-8986.2007.00520.x
Burger, K. S., and Stice, E. (2011). Relation of dietary restraint scores to activationof reward-related brain regions in response to food intake, anticipated intake,and food pictures. Neuroimage 55, 233–239. doi: 10.1016/j.neuroimage.2010.12.009
Caine-Bish, N. L., and Scheule, B. (2009). Gender differences in food prefer-ences of school−aged children and adolescents. J. Sch. Health 79, 532–540. doi:10.1111/j.1746-1561.2009.00445.x
Canny, J. (1986). A computational approach to edge detection. Patt. Anal.Mach. Intell. IEEE Trans. Anal. Mach. Intell. PAMI-8, 679–698. doi:10.1109/TPAMI.1986.4767851
Castellanos, E. H., Charboneau, E., Dietrich, M. S., Park, S., Bradley, B. P., Mogg,K., et al. (2009). Obese adults have visual attention bias for food cue images:evidence for altered reward system function. Int. J. Obes. (Lond). 33, 1063–1073.doi: 10.1038/ijo.2009.138
Cepeda-Benito, A., Fernandez, M. C., and Moreno, S. (2003). Relationship of gen-der and eating disorder symptoms to reported cravings for food: constructvalidation of state and trait craving questionnaires in Spanish. Appetite 40,47–54. doi: 10.1016/s0195-6663(02)00145-9
Cornier, M. A., Von Kaenel, S. S., Bessesen, D. H., and Tregellas, J. R. (2007). Effectsof overfeeding on the neuronal response to visual food cues. Am. J. Clin. Nutr.86, 965–971.
Corsica, J. A., and Spring, B. J. (2008). Carbohydrate craving: a double-blind,placebo-controlled test of the self-medication hypothesis. Eat. Behav. 9,447–454. doi: 10.1016/j.eatbeh.2008.07.004
Dagher, A. (2012). Functional brain imaging of appetite. Trends in Endocrinol.Metab. 23, 250–260. doi: 10.1016/j.tem.2012.02.009
Delplanque, S., N’Diaye, K., Scherer, K., and Grandjean, D. (2007). Spatial frequen-cies or emotional effects? A systematic measure of spatial frequencies for IAPSpictures by a discrete wavelet analysis. J. Neurosci. Methods 165, 144–150. doi:10.1016/j.jneumeth.2007.05.030
Dinkel, A., Berth, H., Exner, C., Rief, W., and Balck, F. (2005). German versionof the Restraint Scale for the assessment of restrained eating. Diagnostica 51,67–74. doi: 10.1026/0012-1924.51.2.67
Finlayson, G., and Dalton, M. (2011). Current progress in the assessment of ‘liking’vs. ‘wanting’ food in human appetite. Response to RC Havermans [“You Say it’sLiking, I Say it’s Wanting....” On the difficulty of disentangling food reward inman. Appetite 57, 286–294. doi: 10.1016/j.appet.2011.05.310
Finlayson, G., King, N., and Blundell, J. E. (2007). Is it possible to dissociate ‘liking’and ‘wanting’ for foods in humans? A novel experimental procedure. Physiol.Behav. 90, 36–42. doi: 10.1016/j.physbeh.2006.08.020
Foroni, F., Pergola, G., Argiris, G., and Rumiati, R. I. (2013). The FoodCastresearch image database (FRIDa). Front. Hum. Neurosci. 7:51. doi:10.3389/fnhum.2013.00051
Frank, S., Laharnar, N., Kullmann, S., Veit, R., Canova, C., Hegner, Y. L., et al.(2010). Processing of food pictures: influence of hunger, gender and caloriecontent. Brain Res. 1350, 159–166. doi: 10.1016/j.brainres.2010.04.030
Giuliani, N. R., Calcott, R. D., and Berkman, E. T. (2013). Piece of cake. Cognitivereappraisal of food craving. Appetite 64, 56–61. doi: 10.1016/j.appet.2012.12.020
Goldstone, A. P., Prechtl De Hernandez, C. G., Beaver, J. D., Muhammed,K., Croese, C., Bell, G., et al. (2009). Fasting biases brain reward systemstowards high-calorie foods. Eur. J. Neurosci. 30, 1625–1635. doi: 10.1111/j.1460-9568.2009.06949.x
Havermans, R. C. (2011). “You Say it’s Liking, I Say it’s Wanting. . . .” On thedifficulty of disentangling food reward in man. Appetite 57, 286–294. doi:10.1016/j.appet.2011.05.310
Havermans, R. C., Janssen, T., Giesen, J. C., Roefs, A., and Jansen, A. (2009). Foodliking, food wanting, and sensory-specific satiety. Appetite 52, 222–225. doi:10.1016/j.appet.2008.09.020
Hoefling, A., and Strack, F. (2008). The tempting effect of forbidden foods. Highcalorie content evokes conflicting implicit and explicit evaluations in restrainedeaters. Appetite 51, 681–689. doi: 10.1016/j.appet.2008.06.004
Hoffman, S. R., Stallings, S. F., Bessinger, R. C., and Brooks, G. T. (2013).Differences between health and ethical vegetarians. Strength of conviction,nutrition knowledge, dietary restriction, and duration of adherence. Appetite65, 139–144. doi: 10.1016/j.appet.2013.02.009
Hollmann, M., Hellrung, L., Pleger, B., Schlogl, H., Kabisch, S., Stumvoll, M., et al.(2012). Neural correlates of the volitional regulation of the desire for food. Int.J. Obes. 36, 648–655. doi: 10.1038/ijo.2011.125
Houben, K., Roefs, A., and Jansen, A. (2012). Guilty pleasures II: restrained eaters’implicit preferences for high, moderate and low-caloric food. Eat. Behav. 13,275–277. doi: 10.1016/j.eatbeh.2012.03.007
Kakoschke, N., Kemps, E., and Tiggemann, M. (2014). Attentional biasmodification encourages healthy eating. Eat. Behav. 15, 120–124. doi:10.1016/j.eatbeh.2013.11.001
Kemps, E., Tiggemann, M., Orr, J., and Grear, J. (2014). Attentional retrain-ing can reduce chocolate consumption. J. Exp. Psychol. Appl. 20, 94–102. doi:10.1037/xap0000005
Killgore, W. D., Young, A. D., Femia, L. A., Bogorodzki, P., Rogowska, J., andYurgelun-Todd, D. A. (2003). Cortical and limbic activation during viewing ofhigh- versus low-calorie foods. Neuroimage 19, 1381–1394. doi: 10.1016/S1053-8119(03)00191-5
Knebel, J. F., Toepel, U., Hudry, J., Le Coutre, J., and Murray, M. M. (2008).Generating controlled image sets in cognitive neuroscience research. BrainTopogr. 20, 284–289. doi: 10.1007/s10548-008-0046-5
Kovalenko, L. Y., Chaumon, M., and Busch, N. A. (2012). A pool of pairs of relatedobjects (POPORO) for investigating visual semantic integration: behavioral andelectrophysiological validation. Brain Topogr. 25, 272–284. doi: 10.1007/s10548-011-0216-8
Labar, K. S., Gitelman, D. R., Parrish, T. B., Kim, Y. H., Nobre, A. C., andMesulam, M. M. (2001). Hunger selectively modulates corticolimbic activationto food stimuli in humans. Behav. Neurosci. 115, 493–500. doi: 10.1037/0735-7044.115.2.493
Martens, M. J. I., Born, J. M., Lemmens, S. G. T., Karhunen, L., Heinecke, A.,Goebel, R., et al. (2013). Increased sensitivity to food cues in the fasted stateand decreased inhibitory control in the satiated state in the overweight. Am. J.Clin. Nutr. 97, 471–479. doi: 10.3945/ajcn.112.044024
Martin, C. K., McClernon, F. J., Chellino, A., and Correa, J. B. (2011).“Food cravings: a central construct in food intake behavior, weightloss, and the neurobiology of appetitive behavior,” in Handbook ofBehavior, Food and Nutrition, eds V. R. Preedy, R. R. Watson, and C.R. Martin (New York, NY: Springer), 741–755. doi: 10.1007/978-0-387-92271-3_49
Massey, A., and Hill, A. J. (2012). Dieting and food craving. A descriptive, quasi-prospective study. Appetite 58, 781–785. doi: 10.1016/j.appet.2012.01.020
Meule, A., Kübler, A., and Blechert, J. (2013). Time course of electrocortical food-cue responses during cognitive regulation of craving. Front. Psychol. 4:669. doi:10.3389/fpsyg.2013.00669
Meule, A., Lutz, A., Vögele, C., and Kübler, A. (2012). Food cravings discrimi-nate differentially between successful and unsuccessful dieters and non-dieters.Validation of the Food Cravings Questionnaires in German. Appetite 58, 88–97.doi: 10.1016/j.appet.2011.09.010
Meule, A., and Vögele, C. (2013). The psychology of eating. Front. Psychol. 4:215.doi: 10.3389/fpsyg.2013.00215
Nijs, I. M. T., and Franken, I. H. (2012). Attentional processing of food cues in over-weight and obese individuals. Curr. Obes. Rep. 1, 106–113. doi: 10.1007/s13679-012-0011-1
Nijs, I. M. T., Franken, I. H. A., and Muris, P. (2009). Enhanced processingof food-related pictures in female external eaters. Appetite 53, 376–383. doi:10.1016/j.appet.2009.07.022
Nikendei, C., Friederich, H. C., Weisbrod, M., Walther, S., Sharma, A., Herzog,W., et al. (2012). Event-related potentials during recognition of semantic andpictorial food stimuli in patients with anorexia nervosa and healthy controlswith varying internal States of hunger. Psychosom. Med. 74, 136–145. doi:10.1097/PSY.0b013e318242496a
Ochner, C. N., Barrios, D. M., Lee, C. D., and Pi-Sunyer, F. X. (2013). Biologicalmechanisms that promote weight regain following weight loss in obese humans.Physiol. Behav. 120, 106–113. doi: 10.1016/j.physbeh.2013.07.009
Poynton, C. (2012). Digital Video and HD: Algorithms and Interfaces. Waltham, MA:Morgan Kaufmann Publishers.
Raffensperger, S., Kuczmarski, M. F., Hotchkiss, L., Cotugna, N., Evans, M. K.,and Zonderman, A. B. (2010). The effect of race and predictors of socioe-conomic status on diet quality in the Healthy Aging in Neighborhoods ofDiversity across the Life Span (HANDLS) study sample. J. Natl. Med. Assoc. 102,923–930.
www.frontiersin.org June 2014 | Volume 5 | Article 617 | 9

Blechert et al. Food-pics database
Rodriguez, S., Fernandez, M. C., Cepeda-Benito, A., and Vila, J. (2005).Subjective and physiological reactivity to chocolate images in high andlow chocolate cravers. Biol. Psychol. 70, 9–18. doi: 10.1016/j.biopsycho.2004.10.001
Rossion, B., and Jacques, C. (2008). Does physical interstimulus vari-ance account for early electrophysiological face sensitive responses in thehuman brain? Ten lessons on the N170. Neuroimage 39, 1959–1979. doi:10.1016/j.neuroimage.2007.10.011
Seibt, B., Häfner, M., and Deutsch, R. (2007). Prepared to eat: how imme-diate affective and motivational responses to food cues are influencedby food deprivation. Eur. J. Soc. Psychol. 37, 359–379. doi: 10.1002/ejsp.365
Stockburger, J., Renner, B., Weike, A. I., Hamm, A. O., and Schupp, H. T. (2009a).Vegetarianism and food perception. Selective visual attention to meat pictures.Appetite 52, 513–516. doi: 10.1016/j.appet.2008.10.001
Stockburger, J., Schmalzle, R., Flaisch, T., Bublatzky, F., and Schupp, H. T.(2009b). The impact of hunger on food cue processing: an event-relatedbrain potential study. Neuroimage 47, 1819–1829. doi: 10.1016/j.neuroimage.2009.04.071
Thierry, G., Martin, C. D., Downing, P., and Pegna, A. J. (2007). Controlling forinterstimulus perceptual variance abolishes N170 face selectivity. Nat. Neurosci.10, 505–511. doi: 10.1038/nn1864
Toepel, U., Knebel, J. F., Hudry, J., Le Coutre, J., and Murray, M. M. (2009). Thebrain tracks the energetic value in food images. Neuroimage 44, 967–974. doi:10.1016/j.neuroimage.2008.10.005
Uher, R., Treasure, J., Heining, M., Brammer, M. J., and Campbell, I. C. (2006).Cerebral processing of food-related stimuli: effects of fasting and gender. Behav.Brain Res. 169, 111–119. doi: 10.1016/j.bbr.2005.12.008
Van Der Laan, L. N., De Ridder, D. T. D., Viergever, M. A., and Smeets, P. A.M. (2011). The first taste is always with the eyes: a meta-analysis on the neu-ral correlates of processing visual food cues. Neuroimage 55, 296–303. doi:10.1016/j.neuroimage.2010.11.055
Van Koningsbruggen, G. M., Veling, H., Stroebe, W., and Aarts, H. (2013).Comparing two psychological interventions in reducing impulsive processes ofeating behaviour: effects on self-selected portion size. Br. J. Health Psychol. doi:10.1111/bjhp.12075. [Epub ahead of print].
Vuilleumier, P., Armony, J. L., Driver, J., and Dolan, R. J. (2003). Distinct spa-tial frequency sensitivities for processing faces and emotional expressions. Nat.Neurosci. 6, 624–631. doi: 10.1038/nn1057
Wadhera, D., and Capaldi-Phillips, E. D. (2014). A review of visual cues associatedwith food on food acceptance and consumption. Eat. Behav. 15, 132–143. doi:10.1016/j.eatbeh.2013.11.003
Werthmann, J., Field, M., Roefs, A., Nederkoorn, C., and Jansen, A. (2013).Attention bias for chocolate increases chocolate consumption - an attentionbias modification study. J. Behav. Ther. Exp. Psychiatry 45, 136–143. doi:10.1016/j.jbtep.2013.09.009
Wiens, S., Sand, A., and Olofsson, J. K. (2011). Nonemotional features suppressearly and enhance late emotional electrocortical responses to negative pictures.Biol. Psychol. 86, 83–89. doi: 10.1016/j.biopsycho.2010.11.001
Willenbockel, V., Sadr, J., Fiset, D., Horne, G. O., Gosselin, F., and Tanaka, J. W.(2010). Controlling low-level image properties: the SHINE toolbox. Behav. Res.Methods 42, 671–684. doi: 10.3758/BRM.42.3.671
Wooley, O., and Wooley, S. (1981). Relationships of salivation in humans todeprivation, inhibition, and the encephalization of hunger. Appetite 2, 331. doi:10.1016/S0195-6663(81)80019-0
Conflict of Interest Statement: The authors declare that the research was con-ducted in the absence of any commercial or financial relationships that could beconstrued as a potential conflict of interest.
Received: 19 March 2014; accepted: 31 May 2014; published online: 24 June 2014.Citation: Blechert J, Meule A, Busch NA and Ohla K (2014) Food-pics: an imagedatabase for experimental research on eating and appetite. Front. Psychol. 5:617. doi:10.3389/fpsyg.2014.00617This article was submitted to Eating Behavior, a section of the journal Frontiers inPsychology.Copyright © 2014 Blechert, Meule, Busch and Ohla. This is an open-access articledistributed under the terms of the Creative Commons Attribution License (CC BY).The use, distribution or reproduction in other forums is permitted, provided theoriginal author(s) or licensor are credited and that the original publication in thisjournal is cited, in accordance with accepted academic practice. No use, distribution orreproduction is permitted which does not comply with these terms.
Frontiers in Psychology | Eating Behavior June 2014 | Volume 5 | Article 617 | 10