
Food Marketing to Children and Youth - FE UNJ
537
-
Upload
khangminh22 -
Category
Documents
-
view
0 -
download
0
Transcript of Food Marketing to Children and Youth - FE UNJ


Committee on Food Marketing and the Diets of Children and Youth
J. Michael McGinnis, Jennifer Appleton Gootman,Vivica I. Kraak, Editors
Food and Nutrition BoardBoard on Children, Youth, and Families
Food Marketing toChildren and YouthFood Marketing toChildren and Youth

THE NATIONAL ACADEMIES PRESS 500 Fifth Street, N.W. Washington, DC 20001
NOTICE: The project that is the subject of this report was approved by the Governing Boardof the National Research Council, whose members are drawn from the councils of the Na-tional Academy of Sciences, the National Academy of Engineering, and the Institute of Medi-cine. The members of the committee responsible for the report were chosen for their specialcompetences and with regard for appropriate balance.
The study was supported by Contract No. 200-2000-00629, Task Order No. 27 between theNational Academy of Sciences and the Centers for Disease Control and Prevention. Anyopinions, findings, conclusions, or recommendations expressed in this publication are those ofthe authors and do not necessarily reflect the views of the organizations or agencies thatprovided support for the project.
Library of Congress Cataloging-in-Publication Data
Institute of Medicine (U.S.). Committee on Food Marketing and the Diets of Children andYouth. Food marketing to children and youth : threat or opportunity? / Committee on FoodMarketing and the Diets of Children and Youth, Food and Nutrition Board, Board onChildren, Youth, and Families ; J. Michael McGinnis, Jennifer Appleton Gootman, Vivica I.Kraak, editors. p. ; cm. Includes bibliographical references and index. ISBN 0-309-09713-4 (hardback) 1. Children—Nutrition. 2. Youth—Nutrition. 3. Food industry and trade. 4. Targetmarketing. 5. Health promotion. 6. Nutrition policy. 7. Child consumers. [DNLM: 1. Food. 2. Adolescent. 3. Advertising. 4. Child. 5. Diet. 6. Food Habits. 7.Public Policy. WS 115 I59f 2006] I. McGinnis, J. Michael. II. Gootman, Jennifer Appleton.III. Kraak, Vivica I. IV. Title. RJ206.F66 2006 618.92’39—dc22 2005037404
Additional copies of this report are available from the National Academies Press, 500 FifthStreet, N.W., Box 285, Washington, DC 20055. Call (800) 624-6242 or (202) 334-3313 (inthe Washington metropolitan area), Internet, http://www.nap.edu.
For more information about the Institute of Medicine, visit the IOM home page at:www.iom.edu.
Copyright 2006 by the National Academy of Sciences. All rights reserved.
Cover design by Spectrum Science Communications.
Printed in the United States of America.
The serpent has been a symbol of long life, healing, and knowledge among almost all culturesand religions since the beginning of recorded history. The serpent adopted as a logotype by theInstitute of Medicine is a relief carving from ancient Greece, now held by the StaatlicheMuseen in Berlin.

“Knowing is not enough; we must apply. Willing is not enough; we must do.”
—Goethe
Advising the Nation. Improving Health.
The National Academy of Sciences is a private, nonprofit, self-perpetuating societyof distinguished scholars engaged in scientific and engineering research, dedicatedto the furtherance of science and technology and to their use for the general welfare.Upon the authority of the charter granted to it by the Congress in 1863, the Acad-emy has a mandate that requires it to advise the federal government on scientific andtechnical matters. Dr. Ralph J. Cicerone is president of the National Academy ofSciences.
The National Academy of Engineering was established in 1964, under the charter ofthe National Academy of Sciences, as a parallel organization of outstanding engi-neers. It is autonomous in its administration and in the selection of its members,sharing with the National Academy of Sciences the responsibility for advising thefederal government. The National Academy of Engineering also sponsors engineer-ing programs aimed at meeting national needs, encourages education and research,and recognizes the superior achievements of engineers. Dr. Wm. A. Wulf is presi-dent of the National Academy of Engineering.
The Institute of Medicine was established in 1970 by the National Academy ofSciences to secure the services of eminent members of appropriate professions in theexamination of policy matters pertaining to the health of the public. The Instituteacts under the responsibility given to the National Academy of Sciences by itscongressional charter to be an adviser to the federal government and, upon its owninitiative, to identify issues of medical care, research, and education. Dr. Harvey V.Fineberg is president of the Institute of Medicine.
The National Research Council was organized by the National Academy of Sciencesin 1916 to associate the broad community of science and technology with theAcademy’s purposes of furthering knowledge and advising the federal government.Functioning in accordance with general policies determined by the Academy, theCouncil has become the principal operating agency of both the National Academyof Sciences and the National Academy of Engineering in providing services to thegovernment, the public, and the scientific and engineering communities. The Coun-cil is administered jointly by both Academies and the Institute of Medicine. Dr.Ralph J. Cicerone and Dr. Wm. A. Wulf are chair and vice chair, respectively, of theNational Research Council.
www.national-academies.org

v
COMMITTEE ON FOOD MARKETING ANDTHE DIETS OF CHILDREN AND YOUTH
J. MICHAEL MCGINNIS (Chair), Institute of Medicine, Washington, DCDANIEL R. ANDERSON, Department of Psychology, University of
Massachusetts, AmherstJ. HOWARD BEALES III, School of Business, George Washington
University, Washington, DCDAVID V. B. BRITT, Sesame Workshop (emeritus), Amelia Island, FLSANDRA L. CALVERT, Children’s Digital Media Center, Georgetown
University, Washington, DCKEITH T. DARCY, Ethics Officer Association, Waltham, MAAIMÉE DORR, Graduate School of Education and Information Studies,
University of California, Los AngelesLLOYD J. KOLBE, Department of Applied Health Science, Indiana
University, BloomingtonDALE L. KUNKEL, Department of Communication, University of
Arizona, TucsonPAUL KURNIT, KidShop, Kurnit Communications, and Lubin School of
Business at Pace University, Chappaqua, New YorkROBERT C. POST, Yale Law School, New Haven, CTRICHARD SCHEINES, Department of Philosophy, Carnegie Mellon
University, Pittsburgh, PAFRANCES H. SELIGSON, Nutrition Consultant, Hershey, PAMARY STORY, Division of Epidemiology, School of Public Health,
University of Minnesota, MinneapolisELLEN A. WARTELLA, Office of the Executive Vice Chancellor and
Provost, University of California, RiversideJEROME D. WILLIAMS, Department of Advertising, University of
Texas, Austin
Liaison from the Food and Nutrition Board
NANCY F. KREBS, Department of Pediatrics, University of ColoradoHealth Sciences Center, Denver

vi
Staff
JENNIFER APPLETON GOOTMAN, Study DirectorVIVICA I. KRAAK, Study DirectorLESLIE J. SIM, Research AssociateSHANNON L. WISHAM, Research AssociateAMIEE M. ADASCZIK, Health Science Intern (January 2005 through
May 2005)KELLY D. HORTON, Christine Mirzyan Science and Technology Policy
Fellow (June 2005 through August 2005)
FOOD AND NUTRITION BOARD
ROBERT M. RUSSELL (Chair), U.S. Department of Agriculture JeanMayer Human Nutrition Research Center on Aging, Tufts University,Boston, MA
LARRY R. BEUCHAT, Center for Food Safety, University of Georgia,Griffin
MICHAEL P. DOYLE, Center for Food Safety, University of Georgia,Griffin
SUSAN FERENC, SAF* Risk, LC, Madison, WINANCY F. KREBS, Department of Pediatrics, University of Colorado
Health Sciences Center, DenverSHIRIKI K. KUMANYIKA, Center for Clinical Epidemiology and
Biostatistics, University of Pennsylvania School of Medicine,Philadelphia
REYNALDO MARTORELL, Rollins School of Public Health, EmoryUniversity, Atlanta, GA
J. GLENN MORRIS, University of Maryland, School of Medicine,Baltimore
SUZANNE P. MURPHY, Cancer Research Center of Hawaii, Universityof Hawaii, Honolulu
JOSE M. ORDOVAS, Nutrition and Genomics Laboratory, TuftsUniversity, Boston, MA
LYNN PARKER, Child Nutrition Programs and Nutrition Policy, FoodResearch and Action Center, Washington, DC
NICHOLAS J. SCHORK, Department of Psychiatry, PolymorphismResearch Laboratory, University of California, San Diego
REBECCA J. STOLTZFUS, Division of Nutritional Sciences, CornellUniversity, Ithaca, NY
JOHN W. SUTTIE, Department of Biochemistry, University ofWisconsin, Madison
WALTER C. WILLETT, Department of Nutrition, Harvard School ofPublic Health, Harvard University, Boston, MA
CATHERINE E. WOTEKI, Global Director of Scientific Affairs, Mars,Incorporated, McLean, VA
BARRY L. ZOUMAS, Department of Agricultural Economics and RuralSociology, Pennsylvania State University, University Park
vii

Staff
LINDA D. MEYERS, DirectorGERALDINE KENNEDO, Administrative AssistantANTON BANDY, Financial AssociateELISABETH RIMAUD, Financial Associate (through May 2005)
IOM boards do not review or approve individual reports and are not asked toendorse conclusions and recommendations. The responsibility for the content of thereports rests with the authoring committee and the institution.
viii

BOARD ON CHILDREN, YOUTH, AND FAMILIES
MICHAEL I. COHEN (Chair), Department of Pediatrics, Albert EinsteinCollege of Medicine, Bronx, NY
BARBARA L. WOLFE (Vice-chair), Departments of Economics andPopulation Health Sciences, University of Wisconsin, Madison
JAMES A. BANKS, Center for Multicultural Education, University ofWashington, Seattle
WILLIAM R. BEARDSLEE, Department of Psychiatry, Children’sHospital, Boston, MA
P. LINDSAY CHASE-LANSDALE, School of Education and SocialPolicy, Northwestern University, Evanston, IL
THOMAS DEWITT, Children’s Hospital Medical Center ofCincinnati, OH
MARY JANE ENGLAND, Regis College, Weston, MABRENDA ESKENAZI, School of Public Health, University of California,
BerkeleyCHRISTINE FERGUSON, Children’s Investment Project, Alexandria, VAPATRICIA GREENFIELD, Department of Psychology, University of
California, Los AngelesNEAL HALFON, School of Public Health, University of California,
Los AngelesHARRIET KITZMAN, School of Nursing, University of Rochester, NYSUSAN MILLSTEIN, Division of Adolescent Medicine, University of
California, San FranciscoELENA NIGHTINGALE, The National Academies/Institute of Medicine,
Washington, DCGARY D. SANDEFUR, College of Letters and Science, University of
Wisconsin, MadisonRUTH STEIN, Department of Pediatrics, Albert Einstein College of
Medicine, Bronx, NYLAURENCE D. STEINBERG, Department of Psychology, Temple
University, Philadelphia, PAELLEN A. WARTELLA, Office of the Executive Vice Chancellor and
Provost, University of California, Riverside
ix

Staff
ROSEMARY CHALK, DirectorWENDY KEENAN, Senior Program Assistant (through April 2005)DEBORAH JOHNSON, Senior Program Assistant
IOM boards do not review or approve individual reports and are not asked toendorse conclusions and recommendations. The responsibility for the content of thereports rests with the authoring committee and the institution.
x
xi
Reviewers
This report has been reviewed in draft form by individuals chosen for theirdiverse perspectives and technical expertise, in accordance with proceduresapproved by the National Research Council’s Report Review Committee.The purpose of this independent review is to provide candid and criticalcomments that will assist the institution in making its published report assound as possible and to ensure that the report meets institutional stan-dards for objectivity, evidence, and responsiveness to the study charge. Thereview comments and draft manuscript remain confidential to protect theintegrity of the deliberative process. We wish to thank the following indi-viduals for their review of this report:
MARK P. BECKER, Office of the Executive Vice President andProvost, University of South Carolina, Columbia
ODILIA BERMUDEZ, Friedman School of Nutrition Science andPolicy, Tufts University, Boston, MA
RONETTE BRIEFEL, Mathematica Policy Research, Inc.,Washington, DC
KATE CLANCY, Union of Concerned Scientists, Washington, DCJANICE DODDS, School of Public Health, University of North
Carolina, Chapel HillADAM DREWNOWSKI, Department of Epidemiology, University of
Washington, SeattleRACHEL GELLER, The Geppetto Group, New York, NY

JAMES O. HILL, Center for Human Nutrition, University ofColorado, Denver
DONNA JOHNSON, Center for Public Health Nutrition, Universityof Washington, Seattle
MILTON KOTELCHUCK, Department of Maternal and ChildHealth, Boston University School of Public Health, MA
SHIRIKI K. KUMANYIKA, Center for Clinical Epidemiology andBiostatistics, University of Pennsylvania School of Medicine,Philadelphia
MICHAEL MUDD, Kraft Foods (emeritus), Chicago, ILJOHN C. PETERS, Food and Beverage Technology, Procter &
Gamble Company, Cincinnati, OHBARRY M. POPKIN, School of Public Health, University of North
Carolina, Chapel HillJULIET SCHOR, Department of Sociology, Boston College, MASTEPHEN D. SUGARMAN, School of Law, University of California,
BerkeleyJANET TENNEY, Alexandria, VALARRY WALLACK, School of Community Health, College of Urban
and Public Affairs, Portland State University, OR
Although the reviewers listed above have provided many constructivecomments and suggestions, they were not asked to endorse the conclusionsor recommendations nor did they see the final draft of the report before itsrelease. The review of this report was overseen by JOHANNA DWYER,Office of Disease Prevention, National Institutes of Health, and ELENANIGHTINGALE, Institute of Medicine, the National Academies.
Appointed by the National Research Council, they were responsible formaking certain that an independent examination of this report was carriedout in accordance with institutional procedures and that all review com-ments were carefully considered. Responsibility for the final content of thisreport rests entirely with the authoring committee and the institution.
xii REVIEWERS
Preface
Marketing works. It is a primary engine of our economy and its content cansometimes give us a glimpse of the forces shaping our futures. How market-ing affects the perspectives and behaviors of our children and youth, includ-ing their diets, has been a subject of active discussion and debate for morethan three decades, beginning in a time when marketing could generally becharacterized in terms of the advertising done through the traditional me-dia—television, radio, print. Times have changed markedly. Marketing isnow a regular feature of virtually all the venues and communication ve-hicles we encounter in our daily lives. Television advertising remains thedominant form of marketing reaching children and youth that is formallytracked, but the expansion of alternative advertising and marketing strate-gies is evolving rapidly.
Against the backdrop of pressing public concern over the rapid andwidespread increase in the prevalence of childhood obesity, Congress,through the FY2004 Health, Labor, and Education Committee appropria-tion, directed the Centers for Disease Control and Prevention (CDC) toundertake a study of the role that marketing of food and beverages mayplay as a determinant of the nutritional status of children and youth, andhow marketing approaches might be marshaled as a remedy. The CDCturned to the Institute of Medicine (IOM) of the National Academies toconduct this study, a natural corollary to the IOM report released in 2004,Preventing Childhood Obesity: Health in the Balance.
The IOM Committee on Food Marketing and the Diets of Children andYouth is pleased to present this report, Food Marketing to Children and
xiii

Youth: Threat or Opportunity? The report represents the most comprehen-sive review to date of the scientific studies designed to assess the influenceof marketing on the nutritional beliefs, choices, practices, and outcomes forchildren and youth. In conducting our study, the committee not only devel-oped and applied a rigorous analytic framework to the assessment of therelevant scientific literature but also undertook an extensive review of thenutritional status and trends for children and youth, what is known aboutthe full range of factors that influence their dietary patterns, the broad andevolving food and beverage marketing environment, and the relevant policylevers that might be brought to bear to improve our children’s nutritionalstatus. Important and relevant findings from our committee’s review aredistributed throughout the body of the text. A summary list of the findingsis provided in the final chapter, along with the committee’s overall conclu-sions and recommendations.
This report notes that the prevailing pattern of food and beverageproducts marketed to children and youth has been high in total calories,sugar, salt, fat, and low in nutrients. A dietary profile that mirrors theproducts marketed would put our children and youth at risk for the types ofnutritional problems that we see occurring today—increasing rates of obe-sity, and inadequacies of certain important micronutrients—and for thedevelopment of various serious chronic diseases later in life. Dietary choicesare made in the midst of myriad social, cultural, and economic environmen-tal influences. The focus of the committee was on the role of food andbeverage marketing as one of these intersecting influences.
In our review, the committee faced certain challenges related to thenature of the available research material. First, virtually all of the publishedscientific research has focused on advertising—and television advertising inparticular. While television maintains an important place in food and bev-erage marketing, industry strategies have moved far beyond television ad-vertising. Second, much of the research underpinning the development andimplementation of food and beverage marketing activities is proprietaryand unpublished, and, given the National Academies’ requirement thatinformation used be in the public domain, a large amount of marketingresearch was unavailable for the committee’s use.
Nonetheless, ample information and studies were available for the com-mittee to draw certain key conclusions, including that television advertisinginfluences the food preferences, purchase requests, and diets, at least ofchildren under the age of 12 years, and is associated with the increasedrates of obesity among children and youth. The committee could not statethe relationship in quantitative terms, but it is clear that even a small effectacross the entire population would represent an important impact. Al-though we could not draw conclusions about the impact of the broadermarketing environment, it is highly likely that the influences reinforce those
xiv PREFACE

seen from advertising. Moreover, the committee found that, for an issue ofthis potential magnitude, there was both a need and an opportunity forsubstantially more industry and government attention and action—andcooperation—on an agenda to turn food and beverage marketing forcestoward better diets for American children and youth. These recommenda-tions are detailed in Chapter 7.
A word is indicated about the members of the IOM Committee onFood Marketing and the Diets of Children and Youth. Befitting the breadthof the topic, this was a committee of unusually varied expertise, experience,and perspective. It was, in addition, a committee that engaged the task withextraordinary energy, commitment, and resolve—both to undertake a rig-orous assessment and to do it cooperatively. Shared leadership has been acentral feature of the work, as members worked both individually and ingroups to ensure that each dimension of the task was skillfully executed.The process has been thorough, the discussions vigorous, and the reportrepresents a consensus document in the best sense of the word. We believereaders will find the documentation to be extensive, the evidence analysesto be seminal, and the findings to be carefully considered.
As is so often the case with these studies, vital guidance and tirelessenergy were contributed to the work by the co-study directors, JenniferGootman and Vivica Kraak, who received highly skilled support from re-search associates Leslie Sim and Shannon Wisham. We are also grateful forthe careful shepherding of the study by the directors of the two sponsoringboards: Linda Meyers of the Food and Nutrition Board and RosemaryChalk of the Board on Children, Youth, and Families.
There can be few matters of such compelling importance as the healthof America’s children and youth. The committee is grateful for the opportu-nity to contribute this report as a resource for insight and action, and weare hopeful that its recommendations will help turn the threat of the currenttrends into an opportunity for change.
J. Michael McGinnis, ChairCommittee on Food Marketing
and the Diets of Children and Youth
PREFACE xv

xvii
Acknowledgments
Beyond the hard work of the committee and IOM project staff, this reportreflects contributions from various other individuals and groups that wewant to acknowledge.
The committee greatly benefited from the opportunity for discussionwith the individuals who made presentations and attended the committee’sworkshops and meetings including: Leann Birch, Brady Darvin, Mary Engle,Lance Friedmann, Marvin Goldberg, Bob McKinnon, Elizabeth Moore,Alisa Morris, Marlena Peleo-Lazar, Ken Powell, Morris Reid, VictoriaRideout, Marva Smalls, Ellen Taaffe, as well as all those who spoke duringthe open forum (Appendix H).
This study was sponsored by the U.S. Department of Health and Hu-man Services’ Centers for Disease Control and Prevention. We wish tothank William Dietz, Casey Hannan, Barbara Polhamus, and their col-leagues for their support and guidance on the committee’s task.
We appreciate the extensive contribution of Courtney Carpenter,Kunter Gunasti, Alan Mathios, Marvin Goldberg, and Edward Palmer forauthoring commissioned papers that were used as background in the re-port. University students Amiee Adasczik, Frederick Eberhardt, EmilyEvans, Shimada Hall, Kelly Horton, Glynnis Johnson, Linda Kao, HeatherKirkorian, and Meghan Malloy all provided outstanding assistance in re-viewing literature and organizing data for the committee. We also thank theUniversity of Texas at Austin students for their contribution to the productproliferation analysis working paper cited in the report.
The committee acknowledges the contribution of Collier Shannon Scott

and Georgetown Economic Services that shared three brief and relevantsummaries of analyses—two of which had been prepared for the GroceryManufacturers Association (GMA) and the Association of National Adver-tising, and the third was a collaborative endeavor between four GMA foodand beverage company members—General Mills, Inc., Kellogg Company,Kraft Foods, Inc., and PepsiCo—which collectively responded to specificquestions about advertising and marketing trends and company activitiesthat were requested by the committee. We also thank Nielsen Media Re-search and Nielsen//Net Ratings, The Geppetto Group, KidShop, StrottmanInternational, and Yankelovich for sharing relevant data. There were othercolleagues who provided useful international data and reports to the com-mittee: Martin Caraher in the United Kingdom, Corinna Hawkes, Filippavon Haartman in Sweden, Gitte Laub Hansen in Denmark, and Anne-Marie Hamelin in Quebec.
There are others at the IOM who provided support to this project:Wendy Keenan for logistical support; Anton Bandy, Elisabeth Rimaud, andGary Walker for financial oversight; and guidance from Clyde Behney,Jennifer Bitticks, Mark Chesnek, Jim Jensen, Jennifer Otten, and ChristineStencel. The report has been greatly enhanced by the public relations andcreative work of Spectrum Science Communications staff including ErikaBorodinsky, Susannah Budington, Rosalba Cano, Victoria Kirker, PamelaLippincott, Leslie Priest, Susie Tappouni, Mark Trinkaus, Clarissa Vander-steen, and Jane Woo. We thank them for their creative efforts.
J. Michael McGinnis, ChairCommittee on Food Marketing
and the Diets of Children and Youth
xviii ACKNOWLEDGMENTS

Contents
xix
EXECUTIVE SUMMARY 1
1 SETTING THE STAGE 17
2 HEALTH, DIET, AND EATING PATTERNS OFCHILDREN AND YOUTH 39
3 FACTORS SHAPING FOOD AND BEVERAGECONSUMPTION OF CHILDREN AND YOUTH 91
4 FOOD AND BEVERAGE MARKETING TO CHILDRENAND YOUTH 133
5 INFLUENCE OF MARKETING ON THE DIETS ANDDIET-RELATED HEALTH OF CHILDREN AND YOUTH 226
6 PUBLIC POLICY ISSUES IN FOOD AND BEVERAGEMARKETING TO CHILDREN AND YOUTH 319
7 FINDINGS, RECOMMENDATIONS, NEXT STEPS 373

APPENDIXESA Acronyms 391B Glossary 394C Literature Review 410D Chapter 2 Appendix 416E Chapter 4 Appendix 427F Chapter 5 Appendix 436G Chapter 6 Appendix 468H Workshop Program 481I Biographical Sketches of Committee Members and Staff 484
INDEX 497
xx CONTENTS

1
Executive Summary
Creating an environment in which children and youth can grow up healthyshould be a very high priority for the nation. Yet the prevailing pattern offood and beverage marketing to children in America represents, at best, amissed opportunity, and, at worst, a direct threat to the health of the nextgeneration. Dietary patterns that begin in childhood give shape to the healthprofiles of Americans at all ages. Because these patterns reflect the intersect-ing influences of our cultural, social, and economic environments, ensuringthat these environments support good health is a fundamental responsibil-ity, requiring leadership and action from all sectors.
The dramatic rise in the number of U.S. children and youth who areobese, have type 2 diabetes, and are at increased risk for developing obesityand related chronic diseases in adulthood, is a matter of national concern.Obesity among children and youth has more than tripled over the past fourdecades—from about 5 percent in 6- to 19-year-olds in the 1960s to 16 per-cent in 1999–2002. More than 9 million U.S. children and youth are obeseand another 15 percent are at risk for becoming obese. The prevalence oftype 2 diabetes among children and youth—previously known as “adult-onset” diabetes—has more than doubled in the past decade.
As a society, we have moved well beyond the era when our dietaryfocus was on ensuring caloric sufficiency to meet basic metabolic needs. Weare now confronted with nutritional inadequacy of a different sort. Dietsthat are high in calories and other constituents such as saturated fats, andlow in certain nutrients are putting our children and youth at risk fordiseases later in life, such as heart disease, stroke, circulatory problems,

2 FOOD MARKETING TO CHILDREN AND YOUTH
some cancers, diabetes, and osteoporosis. Parents, communities, the gov-ernment, public health sector, health care systems, and private enterprise allface significant challenges to create an environment for our children andyouth that turns the course and enhances their prospects for healthy lives.
DIETARY PATTERNS FOR CHILDREN AND YOUTH
Health-related behaviors such as eating habits and physical activitypatterns develop early in life and often extend into adulthood. A healthfuland balanced diet provides recommended amounts of nutrients and otherfood components to promote normal growth and development, reducechronic disease risk, and foster appropriate energy balance and a healthyweight trajectory. Yet the diets of America’s children and adolescents de-part substantially from recommended patterns that puts their health at risk.Although there have been some improvements with respect to the intake ofcertain micronutrients, overall our children and youth are not achievingbasic nutritional goals. They are consuming excess calories and added sug-ars and have higher than recommended intakes of sodium, total fat, andsaturated fats. Moreover, dietary intakes of whole grains, fiber, calcium,potassium, magnesium, and vitamin E are well below recommendationsand are sufficiently low to warrant concern. Adolescent girls and low-income toddlers are especially at risk for inadequate intakes of iron.
The result is that the health of children and adolescents is not as goodas it should or could be. Because of improvements in immunization levels,injury rates, and the availability of and access to children’s services, deathand disease rates for children are generally low. But more sedentary lifestylesand diets that are too high in calories, fat, sugars, and sodium, are puttingchildren’s futures at risk. Those who are poor face the greatest risk, as aresult of their already greater health, social, and nutrition disparities.
If children and youth of all income and ethnic groups are to developdietary patterns that will provide lifelong health promotion and diseaseprevention benefits, their diets will need to change significantly. Theyneed to increase their intakes of fruits, vegetables, legumes, whole grains,and low-fat dairy products, and reduce their intakes of high-calorie andlow-nutrient foods and beverages, including snack foods and sweetenedbeverages.
The dietary and related health patterns of children and youth resultfrom the interplay of many factors (Figure ES-1)—genetics and biology,culture and values, economic status, physical and social environments, andcommercial and media environments—all of which, apart from geneticpredispositions, have undergone significant transformation over the pastthree decades. Among the various environmental influences, none has morerapidly assumed a central socializing role for young people than the media,

3
FIG
UR
E E
S-1
Infl
uenc
es o
n th
e di
ets
and
rela
ted
heal
th o
utco
mes
of
child
ren
and
yout
h.
Indi
vidu
al &
Dev
elop
men
tal
Fac
tors
Fam
ily&
Hom
e
Sch
ool
&P
eers
Nei
ghbo
rhoo
d &
Com
mun
ity
Mar
ketin
g
Pro
duct
, Pla
ce,
Pric
e, P
rom
otio
n
Cul
ture
&
Val
ues
Eco
nom
ic F
acto
rs
Pub
lic P
olic
ies
Pro
duct
ion,
D
istr
ibut
ion,
Pro
mot
ion
Gen
etic
s &
Bio
logy
Hea
lthO
utco
mes
for
Chi
ldre
n an
d Y
outh
Phy
sica
l Act
ivity
Die
t

4 FOOD MARKETING TO CHILDREN AND YOUTH
in its multiple forms. With its growth in variety and penetration has come aconcomitant growth in the promotion of branded food and beverage prod-ucts in the marketplace, and the influence addressed in this report on thediet and related health patterns of children and youth.
FOOD AND BEVERAGE MARKETING
The commercial advertising and marketing of foods and beveragesinfluences the diets and health of children and youth. With annual salesnow approaching $900 billion, the food, beverage, and restaurant indus-tries take a central place in the American marketplace. Total marketinginvestments by these industries have not been clearly identified, althoughadvertising alone accounted for more than $11 billion in industry expendi-tures in 2004, including $5 billion for television advertising. Televisionremains the primary promotional vehicle for measured media marketing,but a shift is occurring toward unmeasured sales promotion, such as mar-keting through product placement, character licensing, special events, in-school activities, and advergames. In fact, only approximately 20 percent ofall food and beverage marketing in 2004 was devoted to advertising ontelevision, radio, print, billboards, or the Internet.
Children and youth represent a primary focus of food and beveragemarketing initiatives. Between 1994 and 2004, the rate of increase in theintroduction of new food and beverage products targeted to children andyouth substantially outpaced the rate for those targeting the total market.An estimated more than $10 billion per year is spent for all types of foodand beverage marketing to children and youth in America. Moreover, al-though some very recent public announcements by some in the industrysuggest an interest in change, the preponderance of the products introducedand marketed to children and youth have been high in total calories, sugars,salt, and fat, and low in nutrients.
How this marketing affects children and youth is the focus of thisreport. The process begins early in life. Children develop consumer social-ization skills as they physically and cognitively mature. Over the span ofages 2–11 years, they develop consumption motives and values as they areexposed to commercial activities; they develop knowledge about advertis-ing, products, brands, pricing, and shopping; and they begin to developstrategies for purchase requests and negotiation. The family is the firstsocializing agent, as parents and older siblings act as sources of informationand provide social support and pressure that affect children’s behaviors.
Media now have a more central role in socializing today’s childrenand youth than ever before. Advertising and marketing messages reachyoung consumers through a variety of vehicles—broadcast and cable tele-vision, radio, magazines, computers through the Internet, music, cell
EXECUTIVE SUMMARY 5
phones—and in many different venues—homes, schools, child-care set-tings, grocery stores, shopping malls, theaters, sporting events, and evenairports. Virtually all children ages 2–18 years now live in householdswith a television, and more than half of today’s children and youth reportthat their families have no rules for television viewing. Children and youthunder the age of 18 years comprise 20 percent of those using the Internet.Myriad marketing approaches are now available, and targeted and inte-grated marketing has become more prevalent.
With new outlets, attractions, and tools, children and youth represent apowerful demographic force. Collectively, children and youth spend morethan $200 billion annually, and they influence many food and beveragepurchases beyond those they make directly. Although children’s choices arestrongly influenced by their parents and siblings, they are increasingly mak-ing decisions at younger ages in the marketplace, either in ways that areindependent of parental guidance, or as agents influencing the choices andpurchasing decisions of their parents and caregivers. Of the various itemsthat children and youth purchase and influence, food and beverages—particularly candy, carbonated soft drinks, and salty snacks—consistentlyrepresent the leading categories.
An important issue in discussions about the influence of food andbeverage advertising and marketing reaching children and youth relates tothe stages of discernment. Before a certain age, children lack the defenses,or skills, to discriminate commercial from noncommercial content, or toattribute persuasive intent to advertising. Children generally develop theseskills at about age 8 years, but children as old as 11 years may not activatetheir defenses unless explicitly cued to do so. Concern about young chil-dren’s limited ability to comprehend the nature and purpose of advertising,and about the appropriateness or impact of food marketing to whichyounger children might be exposed, led to a Federal Trade Commission(FTC) rulemaking process in the late 1970s on the question of whetheradvertising to young children should be restricted or banned as a protectivemeasure. Congress eventually intervened, and the FTC terminated the rule-making in 1981.
The question persists, however, about the effects of advertising expo-sure on children, and it has been deepened and broadened by a developingappreciation of the influence of environmental signals on personal behav-iors, regardless of age; by the expansion and the nature of youth and child-oriented food and beverage products in the marketplace; by the dramaticaugmentation of strategic tools and vehicles for marketing activities; and, inparticular, by concern about the relation of the marketing environment,among the multiple influences, to the rapid growth of childhood obesity inthe United States.
This concern is not unique to the United States. In addition to the

6 FOOD MARKETING TO CHILDREN AND YOUTH
discussions in this country, several related activities have been initiated inother countries and through international organizations. Certain countrieshave instituted formal bans or restrictions on televised food and beverageadvertising to children. Others have undertaken reviews of the issue. Priorto this study, the most recent systematic evidence review of the scientificliterature was the report of Hastings and colleagues in 2003, sponsored bythe Food Standards Agency in the United Kingdom. That study found thatfood advertising to children affected children’s preferences, purchase be-haviors, and consumption, not just for different brands but also for differ-ent food and beverage categories. In 2004, the World Health Assembly,drawing on a number of key documents, endorsed marketing practices andpolicies that acknowledged the vulnerability of children and encouragedmarketing practices that promote healthful foods and beverages. Our re-view has been undertaken in a context of global interest in the issue.
COMMITTEE APPROACH AND EVIDENCE REVIEW
The Committee on Food Marketing and the Diets of Children andYouth was established in 2004. Its charge was to explore what is knownabout current food and beverage marketing practices, the influence of thesepractices on the diets and health of U.S. children and youth, and public andprivate strategies that have been used or could be used to promote healthfulfood and beverage choices among children and youth. The committee rec-ognizes that a variety of interacting factors affect the health and weight ofchildren and youth, including societal norms, culture, socioeconomic fac-tors, race/ethnicity, education, and physical activity. Although important,these are not the subject of this report, which specifically examines the roleof food and beverage marketing in the diets of children and youth.
The committee drew on multiple sources of evidence in its review,including peer-reviewed literature, as well as industry and marketingsources. Particular attention and emphasis was given to the developmentand implementation of a disciplined process of gathering, classifying, andconsidering the available scientific literature relevant to the committee’scharge. Articles identified in an initial search of the literature werescanned for relevance and methodologic rigor. Approximately 200 of thestrongest and most pertinent articles were further reviewed and, of these,123 were subjected to a systematic evidence review using a protocol es-tablished by the committee. Each study was coded on several dimensions,including the relationship of marketing to diet, the cause and effect vari-ables studied, the methods used, and the comparative relevance of theevidence. The results drawn from this assessment provide much of thefoundation for the recommendations of this report and are discussed inChapter 5.

EXECUTIVE SUMMARY 7
It is important to underscore several points about the literature. First,the importance of this issue commands much more study. Although thou-sands of papers touch on the topic, the number of carefully designed studiesis far too limited for a problem that may so substantially affect the nation’shealth and that is so intrinsically complicated. Second, the available peer-reviewed literature focuses predominantly on television advertising, butfood and beverage marketing extends far beyond television and is changingrapidly to include integrated marketing campaigns that extend to new me-dia platforms that target multiple venues simultaneously. Virtually no sci-entific studies are available to assess these other techniques. Third, the greatbulk of the available research that deals with health outcomes involvesdirect measures only of overall television viewing, not exposure to televi-sion advertising. Because the overall amount of television viewing is highlycorrelated with the amount of exposure to television advertising, this mea-surement strategy is informative, but interpretation requires adjusting forother factors, such as sedentary behavior, snacking frequency, or the typesof foods consumed. Finally, the committee acknowledges that there arecertain constraints that apply to any literature of this sort. It concludes thatalthough publication bias is possible in such research, if it exists it is smalland would not influence the conclusions of the report.
On the matter of characterizing commercial marketing practices andtrends, the committee faced several notable challenges. Substantial propri-etary market research data were either not publicly accessible, or availableonly for purchase at considerable cost and with prohibitive constraints onpublic use of the data. Public use provisions were required because theNational Academies are subject to section 15 of the Federal Advisory Com-mittee Act of 1997, which requires that the National Academies makeavailable to the public all written materials presented to an expert commit-tee in order for its recommendations to be used by a sponsoring govern-ment agency. The result was highly limited availability to the committee ofpotentially relevant proprietary information that could be considered forthe review.
The committee was also asked, if feasible, to estimate costs and providebenchmarks to evaluate progress. Because of the complexity of the issues,the multiplicity of stakeholders, and the unavailability of data necessary onwhich to establish estimates and baselines, the committee lacked the evi-dence and resources to address these dimensions with confidence. As notedbelow, it did, however, include in its recommendations the designation of apublic agency responsible for tracking progress, and the establishment of amechanism for commercial marketing data to be made available as a pub-licly accessible resource, so that such estimates and benchmarks could bedeveloped and tracked in the future.
8 FOOD MARKETING TO CHILDREN AND YOUTH
KEY FINDINGS
The committee’s review indicates that, among many factors, food andbeverage marketing influences the preferences and purchase requests ofchildren, influences consumption at least in the short term, is a likely con-tributor to less healthful diets, and may contribute to negative diet-relatedhealth outcomes and risks among children and youth. The literature indi-cates relationships among marketing, dietary precursors, diets, diet-relatedhealth, and, in particular, adiposity (body fatness).
Specifically, the committee’s systematic evidence review found that:
With respect to dietary precursors, food and beverage advertising ontelevision has some influence on the preferences and purchase requests ofchildren and youth:
• There is strong evidence that television advertising influencesthe food and beverage preferences of children ages 2–11 years. There isinsufficient evidence about its influence on the preferences of teens ages 12–18 years.
• There is strong evidence that television advertising influencesthe food and beverage purchase requests of children ages 2–11 years. Thereis insufficient evidence about its influence on the purchase requests of teensages 12–18 years.
• There is moderate evidence that television advertising influ-ences the food and beverage beliefs of children ages 2–11 years. There isinsufficient evidence about its influence on the beliefs of teens ages 12–18 years.
• Given the findings from the systematic evidence review of theinfluence of marketing on the precursors of diet, and given the evidencefrom content analyses that the preponderance of television food and bever-age advertising relevant to children and youth promotes high-calorie andlow-nutrient products, it can be concluded that television advertising influ-ences children to prefer and request high-calorie and low-nutrient foodsand beverages.
With respect to diets, food and beverage advertising on television hassome influence on the dietary intake of children and youth:
• There is strong evidence that television advertising influencesthe short-term consumption of children ages 2–11 years. There is insuffi-cient evidence about its influence on the short-term consumption of teensages 12–18 years.
• There is moderate evidence that television advertising influ-ences the usual dietary intake of younger children ages 2–5 years and weakevidence that it influences the usual dietary intake of older children ages 6–

EXECUTIVE SUMMARY 9
11 years. There is also weak evidence that it does not influence the usualdietary intake of teens ages 12–18 years.
With respect to diet-related health, food and beverage advertising ontelevision is associated with the adiposity (body fatness) of children andyouth:
• Statistically, there is strong evidence that exposure to televisionadvertising is associated with adiposity in children ages 2–11 years andteens ages 12–18 years.
• The association between adiposity and exposure to televisionadvertising remains after taking alternative explanations into account, butthe research does not convincingly rule out other possible explanations forthe association; therefore, the current evidence is not sufficient to arrive atany finding about a causal relationship from television advertising to adi-posity. It is important to note that even a small influence, aggregated overthe entire population of American children and youth, would be conse-quential in impact.
Most children ages 8 years and under do not effectively comprehendthe persuasive intent of marketing messages, and most children ages 4 yearsand under cannot consistently discriminate between television advertisingand programming. The evidence is currently insufficient to determinewhether or not this meaningfully alters the ways in which food and bever-age marketing messages influence children.
CONCLUSIONS AND RECOMMENDATIONS
The prevalence of obesity in children and youth has occurred in parallelwith significant changes in the U.S. media and marketing environments.This relationship has lead to the committee’s primary inquiry about whatthe available data indicate as to the influence of food and beverage market-ing on the diets and health of American children and youth. This issue wasthe focus of the committee’s systematic evidence review which is describedin Chapter 5 and Appendix F.
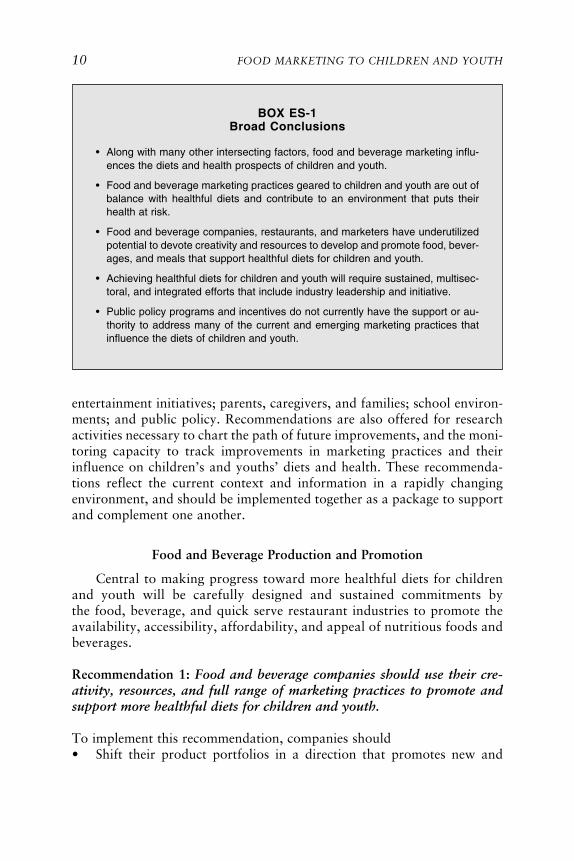
Embedded in relevant sections throughout the text of the report, thecommittee presents findings in these key dimensions: health, diet, and eat-ing patterns of children and youth; food and beverage marketing to chil-dren and youth; the influence of food and beverage marketing on the dietsand diet-related health of children and youth; and the policy environment.These findings are listed again in Chapter 7. Based on these findings, thecommittee has identified five broad conclusions that serve as the basis forits recommendations (Box ES-1).
Reflective of the responsibilities of multiple sectors, the committee’srecommendations address actions related to food and beverage production,processing, packaging, and sales; marketing practice standards; media and
10 FOOD MARKETING TO CHILDREN AND YOUTH
entertainment initiatives; parents, caregivers, and families; school environ-ments; and public policy. Recommendations are also offered for researchactivities necessary to chart the path of future improvements, and the moni-toring capacity to track improvements in marketing practices and theirinfluence on children’s and youths’ diets and health. These recommenda-tions reflect the current context and information in a rapidly changingenvironment, and should be implemented together as a package to supportand complement one another.
Food and Beverage Production and Promotion
Central to making progress toward more healthful diets for childrenand youth will be carefully designed and sustained commitments bythe food, beverage, and quick serve restaurant industries to promote theavailability, accessibility, affordability, and appeal of nutritious foods andbeverages.
Recommendation 1: Food and beverage companies should use their cre-ativity, resources, and full range of marketing practices to promote andsupport more healthful diets for children and youth.
To implement this recommendation, companies should• Shift their product portfolios in a direction that promotes new and
BOX ES-1Broad Conclusions
• Along with many other intersecting factors, food and beverage marketing influ-ences the diets and health prospects of children and youth.
• Food and beverage marketing practices geared to children and youth are out ofbalance with healthful diets and contribute to an environment that puts theirhealth at risk.
• Food and beverage companies, restaurants, and marketers have underutilizedpotential to devote creativity and resources to develop and promote food, bever-ages, and meals that support healthful diets for children and youth.
• Achieving healthful diets for children and youth will require sustained, multisec-toral, and integrated efforts that include industry leadership and initiative.
• Public policy programs and incentives do not currently have the support or au-thority to address many of the current and emerging marketing practices thatinfluence the diets of children and youth.

EXECUTIVE SUMMARY 11
reformulated child- and youth-oriented foods and beverages that aresubstantially lower in total calories, lower in fats, salt, and added sug-ars, and higher in nutrient content.
• Shift their advertising and marketing emphasis to child- and youth-oriented foods and beverages that are substantially lower in total calo-ries, lower in fats, salt, and added sugars, and higher in nutrient content(see later recommendations on public policy and monitoring).
• Work with government, scientific, public health, and consumer groupsto develop and implement labels and advertising for an empiricallyvalidated industrywide rating system and graphic representation that isappealing to children and youth to convey the nutritional quality offoods and beverages marketed to them and their families.
• Engage the full range of their marketing vehicles and venues to developand promote healthier appealing and affordable foods and beveragesfor children and youth.
Recommendation 2: Full serve restaurant chains, family restaurants, andquick serve restaurants should use their creativity, resources, and fullrange of marketing practices to promote healthful meals for children andyouth.
To implement this recommendation, restaurants should• Expand and actively promote healthier food, beverage, and meal op-
tions for children and youth.• Provide calorie content and other key nutrition information, as pos-
sible, on menus and packaging that is prominently visible at the pointof choice and use.
Recommendation 3: Food, beverage, restaurant, retail, and marketing in-dustry trade associations should assume transforming leadership roles inharnessing industry creativity, resources, and marketing on behalf ofhealthful diets for children and youth.
To implement this recommendation, trade associations should• Encourage member initiatives and compliance to develop, apply, and
enforce industry-wide food and beverage marketing practice standardsthat support healthful diets for children and youth.
• Provide technical assistance, encouragement, and support for members’efforts to emphasize the development and marketing of healthier foods,beverages, and meals for children and youth.
• Exercise leadership in working with their members to improve theavailability and selection of healthful foods and beverages accessible at

12 FOOD MARKETING TO CHILDREN AND YOUTH
eye level and reach for children, youth, and their parents in grocerystores and other food retail environments.
• Work to foster collaboration and support with public-sector initiativespromoting healthful diets for children and youth.
Marketing Practice Standards
A reliable barometer of the commitment of the members of the food,beverage, and restaurant industries to promote the nutritional health ofchildren and youth will be the rigor of the standards they set and enforcefor their own marketing practices.
Recommendation 4: The food, beverage, restaurant, and marketing indus-tries should work with government, scientific, public health, and con-sumer groups to establish and enforce the highest standards for the mar-keting of foods, beverages, and meals to children and youth.
To implement this recommendation, the cooperative efforts should• Work through the Children’s Advertising Review Unit (CARU) to
revise, expand, apply, enforce, and evaluate explicit industry self-regulatory guidelines beyond traditional advertising to include evolvingvehicles and venues for marketing communication (e.g., the Internet,advergames, branded product placement across multiple media).
• Assure that licensed characters are used only for the promotion offoods and beverages that support healthful diets for children and youth.
• Foster cooperation between CARU and the Federal Trade Commissionin evaluating and enforcing the effectiveness of the expanded self-regulatory guidelines.
Media and Entertainment Initiatives
Because no element of the lives of Americans has a broader reach thanthe media and entertainment industry, their opportunities and responsibili-ties are great to depict and promote healthful diets and eating habits amongchildren and youth.
Recommendation 5: The media and entertainment industry should directits extensive power to promote healthful foods and beverages for childrenand youth.
To implement this recommendation, media, and the entertainment industryshould

EXECUTIVE SUMMARY 13
• Incorporate into multiple media platforms (e.g., print, broadcast, cable,Internet, and wireless-based programming) foods, beverages, and story-lines that promote healthful diets.
• Strengthen their capacity to serve as accurate interpreters and reportersto the public on findings, claims, and practices related to the diets ofchildren and youth.
Parents, Caregivers, and Families
Parents and families remain the central influence on children’s attitudesand behaviors, and social marketing efforts that aim to improve children’sand youths’ diets therefore must be tied directly to that influence.
Recommendation 6: Government, in partnership with the private sector,should create a long-term, multifaceted, and financially sustained socialmarketing program supporting parents, caregivers, and families in pro-moting healthful diets for children and youth.
To implement this recommendation• Elements should include the full range of evolving and integrated mar-
keting tools and widespread educational and community-based efforts,including use of children and youth as change agents.
• Special emphasis should be directed to parents of children ages birth to4 years and other caregivers (e.g., child-care settings, schools, after-school programs) to build skills to wisely select and prepare healthfuland affordable foods and beverages for children and youth.
• The social marketing program should have a reliable and sustainedsupport stream, through public-appropriated funds and counterpartcooperative support from businesses marketing foods, beverages, andmeals to children and youth.
School Environments
If schools and parents are to remain the strongest allies working topromote and advance the interests of American children and youth, theschool environment must be fully devoted to preparing students for health-ful lifelong dietary patterns.
Recommendation 7: State and local educational authorities, with supportfrom parents, health authorities, and other stakeholders, should educateabout and promote healthful diets for children and youth in all aspects ofthe school environment (e.g., commercial sponsorships, meals and snacks,curriculum).

14 FOOD MARKETING TO CHILDREN AND YOUTH
To implement this recommendation, companies should• Develop and implement nutrition standards for competitive foods and
beverages sold or served in the school environment.• Adopt policies and best practices that promote the availability and
marketing of foods and beverages that support healthful diets.• Provide visible leadership in this effort by public and civic leaders at all
levels such as the National Governors Association, the state and localBoards of Education, and the National Parent Teacher Association, aswell as trade associations representing private-sector businesses such asdistributors, bottlers, and vending machine companies that directlyinterface with the school administration.
Public Policy
A first obligation of public policy is to protect the vulnerable and asecond is to create the conditions for a desirable future. Both call for thecareful use of policy initiatives to foster healthy prospects for children andyouth.
Recommendation 8: Government at all levels should marshal the full rangeof public policy levers to foster the development and promotion of health-ful diets for children and youth.
To implement this recommendation• Government should consider incentives (e.g., recognition, performance
awards, tax incentives) that encourage and reward food, beverage, andrestaurant companies that develop, provide, and promote healthierfoods and beverages for children and youth in settings where theytypically consume them (e.g., restaurants, schools, amusement parks,sports venues, movie theaters, malls, and airports).
• Government should explore combining the full range of possible ap-proaches (e.g., agricultural subsidies, taxes, legislation, regulation, fed-eral nutrition programs) for making fruits and vegetables readily avail-able and accessible to all children, youth, and families.
• The U.S. Department of Agriculture should develop and test new strat-egies for promoting healthier, appealing school meals provided throughthe School Breakfast Program and the National School Lunch Programas well as other federal programs designed for after-school settings(Special Milk Program) and child-care settings (Child and Adult CareFood Program).
• If voluntary efforts related to advertising during children’s televisionprogramming are unsuccessful in shifting the emphasis away from high-calorie and low-nutrient foods and beverages to the advertising of

EXECUTIVE SUMMARY 15
healthful foods and beverages, Congress should enact legislation man-dating the shift on both broadcast and cable television.*
Research
Knowledge is the bedrock of effective action and progress, yet currentresources are scant to expand the knowledge base, from all sources, on thechanging ways in which marketing influences the diets and health of chil-dren and youth.
Recommendation 9: The nation’s formidable research capacity should besubstantially better directed to sustained, multidisciplinary work on howmarketing influences the food and beverage choices of children and youth.
To implement this recommendation• The federal research capacity, in particular supported by the agencies
of the U.S. Department of Health and Human Services (e.g., NationalInstitutes of Health, Centers for Disease Control and Prevention,Food and Drug Administration), the U.S. Department of Agriculture,the National Science Foundation, and the Federal Trade Commissionshould be expanded to illuminate the ways in which marketing influ-ences children’s attitudes and behaviors. Of particular importance arestudies related to newer promotion techniques and venues, healthierfoods and beverages and portion sizes, product availability, the im-pact of television advertising on diet and diet-related health, diverseresearch methods that systematically control for alternative explana-tions, stronger measurement, and methods with high relevance to ev-ery day life.
• A means should be developed for commercial marketing data to bemade available, if possible as a publicly accessible resource, for betterunderstanding the dynamics that shape the health and nutrition atti-tudes and behaviors of children and youth at different ages and indifferent circumstances, and for informing the multifaceted social mar-keting program targeting parents, caregivers, and families to promotehealthful diets for children and youth.
Monitoring Progress
The saying goes that “what gets measured gets done.” Yet no singlepublic body exists with responsibility or authority to track the influences of
*See text at pages 349 and 362.
16 FOOD MARKETING TO CHILDREN AND YOUTH
marketing on the dietary practices and health status of children and youthin the United States.
Recommendation 10: The Secretary of the U.S. Department of Healthand Human Services (DHHS) should designate a responsible agency,with adequate and appropriate resources, to formally monitor and re-port regularly on the progress of the various entities and activities re-lated to the recommendations included in this report.
To implement this recommendation• The Secretary should consult with other relevant cabinet officers and
agency heads (e.g., U.S. Department of Agriculture, U.S. Department ofEducation, Federal Trade Commission, Federal Communications Com-mission) in developing and implementing the required monitoring andreporting.
• Within 2 years, the Secretary should report to Congress on the progressand additional actions necessary to accelerate progress.
The review and recommendations presented in this report are anchoredin the presentation and interpretation of the evidence. This was the centralcharge to the committee, and the effort represents the most comprehensiveand rigorous review of existing scientific literature done to date. It is impor-tant to point out that the committee was not charged with, nor did it engagein, addressing some of the broader philosophical, social, and political issuesrelated to food and beverage marketing to children and youth. Perspectivesabout basic responsibilities to shepherd the welfare of those most vulner-able or impressionable, conjecture about insights from studies not yet doneor information not available on the strength of relationships between mar-keting and behavior of children and youth, and social urgency prompted bythe rapidly increasing prevalence of childhood obesity, all are legitimateand important matters for public discussion. But they were not centralfeatures of the committee’s charge or work. Neither was the related, butvital, matter of physical activity, which is so inextricably a part of thechallenge of childhood obesity. What the committee can contribute to theongoing and imperative public policy questions raised by this challenge is toconclude, based upon a thorough and impartial review of existing scientificdata, that the dietary patterns of our children and youth put their health atrisk, that the patterns have been encouraged and reinforced by prevailingmarketing practices, and that the turnaround required will depend uponaggressive and sustained leadership from all sectors, including the food andbeverage industries. This is a public health priority of the highest order.

17
1
Setting the Stage
What influence has food and beverage marketing had on the dietary pat-terns and health status of American children and youth? The answer to thisquestion has the potential to shape the health of generations and is thefocus of this report. The dramatic rise in the number of U.S. children andadolescents who are obese, have type 2 diabetes,1 have the metabolic syn-drome,2 and are at increased risk for developing other chronic diseases inadulthood has been a complex and troubling trend over the past 40 years.There is growing evidence that the early life environment is an importantdeterminant of obesity later in life (Reilly et al., 2005).
The term obesity is used in this report to refer to children and youthwho have a body mass index (BMI) equal to or greater than the 95thpercentile of the age- and gender-specific BMI charts developed by theCenters for Disease Control and Prevention (CDC) in 2000 (Kuczmarskiet al., 2000). In most children, such BMI values are associated with elevatedbody fat and reflect the presence or risk of related chronic diseases (IOM,2005). CDC uses the term overweight to refer to children and youth with
1Previously known as adult-onset diabetes, in the 1990s, cases of type 2 diabetes in childrenaccounted for 8 to 45 percent of all newly diagnosed childhood cases of diabetes when com-pared to less than 4 percent before the 1990s (Fagot-Compagna et al., 2000).
2The metabolic syndrome is diagnosed when an individual has at least three of five meta-bolic abnormalities: glucose intolerance, abdominal obesity, elevated triglyceride level, lowhigh-density lipoprotein (HDL) level, and high blood pressure.

18 FOOD MARKETING TO CHILDREN AND YOUTH
the same BMI values. Obese children have a greater chance of becomingobese adults than children of normal weight. Children of obese parentshave an even greater likelihood of becoming obese. An obese preschoolerwith normal weight parents has approximately a 25 percent chance ofbecoming an obese adult; however, the same child with an obese parent hasgreater than a 60 percent chance of becoming an obese adult (Whitakeret al., 1997). Moreover, an obese 2- to 5-year-old is more than four times aslikely to become an obese adult when compared to a child who is below the50th percentile of the CDC BMI charts3 (Freedman et al., 2005).
Although childhood-onset obesity accounts for only a quarter of adultobesity cases, obesity that is present before a child is 8 years of age, andpersists into adulthood, is associated with severe obesity—a BMI greaterthan 40 kg/m2—in adulthood as compared with a BMI of 35 kg/m2 foradult-onset obesity (Freedman et al., 2001). Between 1990 and 2000, se-vere obesity, which is associated with more serious health complications,more than doubled, increasing from 0.78 percent to 2.2 percent in U.S.adults (Freedman et al., 2002). Additionally, concerns about childhood-onset obesity are supported by documented associations between childhoodobesity and increased cardiovascular disease risk and mortality in adult-hood (Li et al., 2004; Srinivasan et al., 2002). The most promising way toprevent future adult obesity is to promote an environment conducive tohealthy eating among children and youth (Taylor et al., 2005).
Obesity is not the only diet-related problem children and youth face. Inaddition to the consumption of excess calories and added sugars, the con-sumption of sodium, saturated fats, and trans fats are well above recom-mended levels and the consumption of vegetables, fruits, whole grains, andcalcium are well below recommended levels. American children and youthare therefore at increased risk for developing conditions such as heart dis-ease, stroke, certain cancers, type 2 diabetes, and osteoporosis later in life.As discussed in Chapter 2, the most current data indicate that the overallnutrient intakes of children and adolescents4 depart substantially from rec-ommended patterns and reflect a pattern that puts young people’s health atrisk (Box 1-1).
3The CDC BMI charts are mathematically smoothed curves of the pooled growth param-eters of children and adolescents sampled in cross-sectional national health surveys conductedfrom 1963 to 1994. The current CDC guidelines for healthy weight in children and youth arein the range of the 5th to the 85th percetiles.
4See discussion later in this chapter for age categories and related terms used throughoutthis report.
SETTING THE STAGE 19
BOX 1-1Trends in U.S. Children’s and Adolescents’ Nutrient Intakes
and Eating Patterns, 1970s to 2004
• Children and youth are in energy imbalance as reflected by an aggregate calorieintake that has increased significantly for both younger children and adoles-cents, with modest increases also experienced among older children ages 6–11years.
• Calorie intake by infants and toddlers substantially exceeds their estimatedrequirements.
• Carbohydrate intake has increased over the past 25 years among children andyouth.
• Infants and toddlers are consuming diets disproportionately high in sweetenedfoods and beverages and fried potatoes, and disproportionately low in greenleafy vegetables.
• Added sugars consumed by younger children are well above recommended lev-els, and older children and adolescents are consuming about double the recom-mended amounts of added sugars in their diets.
• Sweetened beverage consumption by children and youth has steadily increasedover the past 35 years, and now represents a major source of calories and add-ed sugars.
• Consumption of milk by children and youth, a major source of dietary calcium,has declined over the past 35 years, and most have lower calcium intakes thanrecommended.
• Total fat and saturated fats consumed by children and youth remain at levelsthat exceed dietary recommendations.
• Mean sodium intake of children and youth has increased over the past 35 years,and the majority of children and adolescents are consuming sodium in greateramounts than recommended levels.
• Consumption of vegetables, fruits, and whole grains falls short of the daily rec-ommended servings for most children and youth.
• Snacking by children and youth has increased steadily over the past 25 years.
• Children and youth consume a large proportion of their total calories from foodsand beverages that are of high-calorie and low-nutrient content.
• Foods consumed outside of the home have steadily increased and now repre-sent about a third of the daily calories consumed by children and youth.
Creating an environment in which children and youth can grow uphealthy should be a high priority for the nation. Health is more than theabsence of physical or mental illness—it also is the extent to which childrenand youth have the capacity to reach their full potential (NRC and IOM,2004). Many factors affect children’s and youths’ dietary patterns and

20 FOOD MARKETING TO CHILDREN AND YOUTH
overall health. The Institute of Medicine’s (IOM’s) recent report, Prevent-ing Childhood Obesity: Health in the Balance (IOM, 2005), recognizes thatchildren, youth, and their parents are immersed in a modern milieu wherethe physical, social, commercial, and media environments have all under-gone significant transformations over the past several decades. Thesebroader environments now contribute to the rising prevalence of obesity inchildren and youth, thereby impacting their diets and health through achain of events that can have profound effects extending far into adulthood(IOM, 2005; NRC and IOM, 2004). On the other hand, there exists unre-alized potential to shift the broader environmental signals to encouragehealthy lifestyles in which eating habits and physical activity behaviorspromote healthy energy balance and nutritional status, and therefore workto prevent obesity and related chronic diseases (IOM, 2005; Peters et al.,2002).
Like adults, children and adolescents acquire new information andknowledge through both explicit and implicit learning—that is, throughthe processes of dedicated, didactic, and educational experiences, as wellas through passive, automatic, and unconscious acquisition of abstractknowledge that remains robust over time (Cleeremans et al., 1998). Inaddition, they acquire information through the socialization process thathelps them to develop their roles and behaviors as consumers and as mem-bers of society. The family is the first socializing agent because parentsand older siblings act as sources of information and provide social supportand pressure that affect children’s behaviors (Moore et al., 2002). Thereare also diverse social and cultural norms and values that influence eatingand physical activity. Whether influenced by their parents and siblings, orby other signals in their environments, children buy food and other goodsand influence the purchasing decisions of their parents and caregivers(McNeal, 1999).
Children acquire consumer socialization skills early in life, developingconsumption motives and values as they are exposed to commercial activi-ties. They develop knowledge about advertising, products, brands, pricingand shopping, and they adopt purchase requests and negotiation strategiesthat may be the result of marketing activities (John, 1999). Children musthave certain basic information-processing skills to fully understand adver-tising messages (Gunter et al., 2005; Kunkel, 2001). They must be able todiscriminate, at a perceptual level, commercial from noncommercial con-tent, and they must be able to attribute persuasive intent to advertising andto adjust their interpretation of commercial messages based on that knowl-edge. Each of these capabilities develops over time, largely as a function ofcognitive growth and development rather than the accumulation of anyparticular amount of experience with media content (John, 1999; Young,1990), including the acquisition of media literacy skills. Although cognitive
SETTING THE STAGE 21
defenses are critical, actual activation of these defenses must be assessed, aschildren as old as 11 years of age may not activate their defenses unlessexplicitly cued (Brucks et al., 1988; Moore and Lutz, 2000).
FOOD AND BEVERAGE MARKETING TOCHILDREN AND YOUTH
Choices are influenced by the way options are presented to individuals.Food and beverages are now marketed to children, youth, and their familiesin ways that are dramatically different from 40 years ago, and this market-ing today strongly influences their preferences and choices. Advertisingdoes not exist or operate in isolation from other aspects of marketingactivities. In most advertising, the commercial is an element of a largermarketing design that includes competition for securing market share ofbranded products, attention to retailers, point-of-purchase displays, attrac-tive packaging, strategic placement of items on store shelves, and the use ofcoupons, premiums, and price incentives to promote consumer purchases(Schudson, 1986). Children and youth are subsequently exposed to influ-ences from an array of marketing venues and vehicles including school-based marketing, promotions, television and movie product placement, andmarketing through the Internet, digital television, and mobile phones.
Moreover, integrated marketing communications have begun to per-meate the lives of children and youth. They are now being exposed to achanging landscape of media and promotional activities (Moore, 2005). Itis not simply a proliferation of existing media, but the advent of newermedia that are interactive and that blend entertainment with advertisingand other forms of promotion. Thus, children and youth are now exposedto media and marketing influences to a much greater extent, and throughmany more diverse and integrated venues embedded in their daily lives,when compared to previous generations.
With new outlets, attractions, and tools, children and youth collectivelyrepresent a powerful demographic segment. They are a primary market,spending discretionary income on a variety of products that they acquire byspending their own money; an influence market, determining a large pro-portion of what is spent by parents and households; and a future market,representing tomorrow’s adult customers for branded products and services(McNeal, 1999; MPA, 2004). Children and youth collectively spend morethan $200 billion annually (MPA, 2004; Teenage Research Unlimited,2004), and also determine a large proportion of what is spent by parentsand households (Chapter 4).
Parents and their children report that young people have the largestpurchase influence on food when compared to other nonfood spendingcategories such as music, electronics, and home decor. Of the various spend-

22 FOOD MARKETING TO CHILDREN AND YOUTH
ing categories, one-third of children’s direct purchases are for sweets, snacks,and beverages, followed by toys and apparel (Schor, 2004). Of the top 10items that children ages 8–12 years report they can select without parentalpermission, the leading four are food or beverage categories: candy orsnacks, soft drinks, fast food from quick serve restaurants, and breakfastcereals (Chaplin, 1999). Similarly, food or beverages—particularly candy,sweetened soft drinks, and salty snacks—represent the top items that teensages 13–17 years buy with their own money (MPA, 2004; Chapter 4).
Approximately half of all commercials during children’s television pro-gramming consists of branded foods and beverages that are disproportion-ately high in salt and calories (e.g., high fat, high sugar), and low in essen-tial nutrients (IOM, 2005)—primarily sweetened cereals, candies andsnacks, carbonated soft drinks and sweetened beverages, and fast food(Gamble and Cotugna, 1999). Additionally, companies use advertising andother marketing techniques that associate these specific foods with fun andpleasurable experiences (Hawkes, 2002; Schlosser, 2001).
When high-calorie and low-nutrient foods and beverages are marketedto infants, toddlers, and young children who have an innate biologicalpreference for high-calorie foods that are sweet and salty (Benton, 2004;Mennella and Beauchamp, 1998), or when these types of products aremarketed to parents, schools, or child-care settings and made easily avail-able and accessible in their environments, there is a much greater opportu-nity and likelihood that children will develop sustained preferences forthese products. Indeed, young children typically reject new foods and mayneed to be introduced to a new food as many as 5 to 10 times before theywill accept it (Birch, 1999). Children’s preferences for foods that lack sweetand salty tastes are learned and require repeated positive experiences, espe-cially to accept fruits, vegetables, and other nutrient-rich foods later in life(Birch 1999; Skinner et al., 2002; Chapter 3). When accompanied by physi-cal inactivity, preferences for and consumption of high-calorie foods andbeverages over time set in motion the circumstances that contribute toweight gain and obesity, especially for children and youth who are geneti-cally predisposed to gaining weight in an obesogenic environment (IOM,2005).
Moreover, the contemporary media landscape offers many more op-tions to market messages about foods and beverages to children and youththan just a decade ago, encompassing broadcast, satellite, and cable televi-sion; the video cassette recorder and digital video disk (DVD) recorder;portable audio media (e.g., radio, tapes, CDs, DVDs, MP3 players); printmedia (e.g., magazines, newspapers, books); computers and the online ac-tivities they provide with Internet access (e.g., e-mail, instant messaging,advergaming); and cell phones that can connect to the Internet and provide
SETTING THE STAGE 23
text messaging and digital screens (Roberts et al., 2005; Chapter 4). Theentertainment industry focuses more time and resources than ever before ontrying to understand the desires of children and youth (Schor, 2004), andthere are cable television networks exclusively devoted to reaching youngaudiences (Nickelodeon, 2005).
STUDY BACKGROUND AND RATIONALE
In FY 2004, Congress directed the CDC to support a comprehensive,evidence-based review of the effects of food marketing on children’s andyouths’ diet and health. With this congressional directive, the CDC turnedto the IOM in July 2004 to assess the effects of food marketing on children’sand youths’ diet and health. It had been nearly 25 years since a similarreview of the available evidence was undertaken in the United States for thistopic (Elliott et al., 1981). Several notable changes and innovations haveoccurred with food and beverage marketing and the media environmentsthat directly affect the lives of U.S. children and youth during this timeframe.
Committee Charge and Approach
The IOM appointed a 16-member committee on Food Marketing andthe Diets of Children and Youth in the fall of 2004 to undertake a compre-hensive evidence-based review of the influence of food and beverage mar-keting on the diets and health of children and youth in the United States,including the characteristics of effective marketing of foods and beveragesto promote healthful choices. The committee members have expertise in theareas of child and adolescent development, child and adolescent nutrition,psychology, behavioral economics, advertising, consumer marketing andbehavior, media, social marketing, program evaluation, education, publichealth, public policy, industry (e.g., food, beverage, children’s entertain-ment), statistics, constitutional law, and business ethics (Appendix I).
The committee was charged with the following six tasks:
1. Assess what is known about the scope, amount, venues, and typesof food and beverage product marketing (including market segmentationstrategies) to children and youth;
2. Conduct a comprehensive review of the available evidence aboutthe extent to which this marketing affects their diets, including their nutri-ent intake and health;
3. Synthesize lessons learned from relevant research and experiencefrom other marketing-oriented health promotion efforts (e.g., youth to-

24 FOOD MARKETING TO CHILDREN AND YOUTH
bacco prevention, underage drinking prevention, obesity prevention, andthe promotion of physical activity) that can contribute to the developmentof marketing strategies to promote healthful food choices among childrenand youth;
4. Identify gaps in the knowledge base related to the impact of mar-keting on the diets and health of children and youth;
5. Review the issues and strategic options for public policy and pri-vate stakeholders to promote public and commercial marketing strategiesthat foster healthful food and beverage choices by children and youth; and
6. Prepare a consensus report that describes the state of food andbeverage marketing to infants, toddlers, children, and adolescents; offers acoherent understanding about the impact of this exposure on their diets andhealth; and if feasible, provides benchmarks to evaluate progress towardhealthful food and beverage promotion to young consumers.
The committee acknowledges that a variety of interacting factors affectthe health and weight of children and youth, including societal norms,culture, socioeconomic factors, race/ethnicity, education, and physical ac-tivity (Ebbeling et al., 2002; Goran et al., 1999; IOM, 2005; Kumanyikaet al., 2001, 2002; NRC and IOM, 2004, Swinburn and Egger, 2002).Although important, these are not the subject of this report, which specifi-cally examines the role of food and beverage marketing in the diets anddiet-related health of children and youth.
An important starting point for the committee was the set of recom-mendations regarding the marketing of foods and beverages to children andyouth presented in the IOM report, Preventing Childhood Obesity: Healthin the Balance (2005). This report concluded that concentrated efforts areurgently needed among various sectors and stakeholder groups to changesocial norms about childhood obesity and to create supportive environ-ments and consistent messages that promote healthy lifestyles—includinghealthful eating habits and regular physical activity (IOM, 2005). The re-port recommended in particular that industry develop and strictly adhere tomarketing and advertising guidelines that minimize the risk of obesity inchildren and youth (IOM, 2005).
The work of the current committee was informed by a variety ofsources. Four formal meetings were held during the study. The committeeconducted a systematic literature review of evidence that addresses thelinkages from food and beverage marketing to young people’s diets anddiet-related health (Appendixes C, E, and F; Chapters 4 and 5). It alsocommissioned three papers: a synthesis of the literature on marketing tochildren over the past three decades; insights into future marketing tech-

SETTING THE STAGE 25
niques; and insights about the effectiveness of social marketing campaignsand its application to this issue.
One committee meeting included a public workshop held in January2005. The workshop, Marketing Strategies that Foster Healthy Food andBeverage Choices in Children and Youth, had two goals: to identify effec-tive processes, actions, and campaigns for promoting healthful food andbeverage choices and behaviors in children and youth, and to provide apublic forum for interested individuals and groups to share their perspec-tives to the committee. Ten invited speakers presented their views on thefood, beverage, and quick serve restaurant5 industries; youth-focused me-dia and marketing approaches; and research. The public forum included 16presenters who represented nonprofit organizations, trade organizations,professional associations, and interested individuals (Appendix H).
FOCUS AND CONCEPTS
Target Population
The focus of the committee’s study was on children and youth frombirth to 18 years of age. The committee recognized that among researchers,policy makers, and marketers, different age groups and terms are used todefine this diverse population. In general, the committee used the terms“children,” “youth,” “young people,” “teenagers,” and “adolescents.”When greater precision was needed, the following age categories and termswere used throughout the report: infants and toddlers (children under2 years of age), younger children (ages 2–5 years), older children (ages 6–11 years), and teens (ages 12–18 years). In selected sections of the report,particularly those drawing from the marketing literature, “tween” is usedto describe young people ages 9–13 years.
Marketing
The focus of the committee’s inquiry was on the marketing of foodsand beverages to children and youth. As discussed in greater depth inChapter 4, marketing is a process by which a variety of strategies are usedto stimulate consumer demand, promote frequency of purchases, buildbrand awareness and brand loyalty, and encourage potential or existingcustomers to try new foods and beverages. Marketing is defined as an
5Quick serve restaurants are commonly known as “fast food restaurants” and represent acategory of restaurants that supply food quickly after ordering with minimal service.

26 FOOD MARKETING TO CHILDREN AND YOUTH
“organizational function and a set of processes for creating, communicat-ing, and delivering value to customers and for managing customer relation-ships in ways that benefit an organization and its stakeholders” (AMA,2005). Marketing involves conducting research, defining the target market,analyzing the competition, and implementing the basic processes that con-stitute the marketing mix or drivers of business (McCarthy, 1975). The keycomponents are the following:
• Product (i.e., features, quality, quantity, packaging)• Place (i.e., location, outlets, distribution points used to reach the
target market)• Price (i.e., strategy, determinants, levels)• Promotion (i.e., advertising, sales promotion, public relations, trade
promotion)
Advertising is a form of paid nonpersonal public presentation and thepromotion of ideas, goods, or services by a sponsor (Kotler and Armstrong,2004). It is a specific type of marketing that brings a product to the atten-tion of consumers and may be delivered through a variety of media chan-nels such as television, radio, print, billboards, personal contact, and theInternet (Boone and Kurtz, 1998). Advertising is the most visible form ofmarketing that contributes to the success of other strategies by (1) provid-ing the conditions for developing a company’s brand image by buildingbrand awareness and brand loyalty among potential consumers, and (2) cre-ating perceived value by persuading consumers that they are getting morethan the product itself (e.g., a meal, food, or beverage product).
Ecological Perspective
Consistent with the committee’s charge, the primary focus of this re-port is the evaluation of the available evidence for assessing the nature ofthe relationship between marketing and the diets and health of children andyouth. The committee used a simplified ecological perspective to conceptu-alize the relationship of food marketing to other important influences onthe diets and related health outcomes of children and youth (Figure 1-1; seealso Chapter 3). This perspective places food and beverage marketing influ-ences within a context that recognizes the multiple interactions amongfactors that also affect children’s and adolescents’ food preferences andchoices, eating behaviors, total calorie intake, diet quality, and health out-comes. The use of an ecological perspective requires an understanding ofprocesses and intertwining interactions among individuals, communities,and their social, economic, cultural, and physical environments over time(IOM, 2001). This approach considers the relative strengths of the multiple

27
FIG
UR
E 1
-1 I
nflu
ence
s on
the
die
ts a
nd r
elat
ed h
ealt
h ou
tcom
es o
f ch
ildre
n an
d yo
uth.
Indi
vidu
al &
Dev
elop
men
tal
Fac
tors
Fam
ily&
Hom
e
Sch
ool
&P
eers
Nei
ghbo
rhoo
d &
Com
mun
ity
Mar
ketin
g
Pro
duct
, Pla
ce,
Pric
e, P
rom
otio
n
Cul
ture
&
Val
ues
Eco
nom
ic F
acto
rs
Pub
lic P
olic
ies
Pro
duct
ion,
D
istr
ibut
ion,
Pro
mot
ion
Gen
etic
s &
Bio
logy
Hea
lthO
utco
mes
for
Chi
ldre
n an
d Y
outh
Phy
sica
l Act
ivity
Die
t

28 FOOD MARKETING TO CHILDREN AND YOUTH
factors influencing diet, including the role of marketing in overall dietquality and quantity of foods consumed.
The committee’s perspective views children, adolescents, and their fami-lies as functioning within broader social, economic, and political systems—including the food and agricultural system and the marketplace where prod-ucts and services are exchanged. These systems also influence behaviors andmay facilitate or impede availability and access to nutritious foods andbeverages and to the resources necessary to maintain good health. Includedamong the systemic forces are the four components of the marketing mix—product, place, price, and promotion (discussed in more detail in Chap-ter 4); culture and values that influence societal norms and behaviors (Chap-ter 3); economic factors that influence food and beverage choices andconsumption patterns including family income, food security status, andaffordability (Chapter 3); and a broad range of policies that affect food andbeverage availability, access, affordability, preferences, choices, and pur-chases (Chapters 4 and 6).
These systematic factors interact with each other and with individualand developmental factors, family and home, school and peers, and neigh-borhood and community to influence children’s and youths’ diet and physi-cal activity patterns (Chapter 3). Genetic and biological factors also influ-ence these patterns and moderate the ways in which these patterns affecthealth outcomes for a given individual (Chapter 3). An important note isthat this committee recognizes the fundamental nature of the interactionbetween diet and physical activity for children and youth to achieve energybalance at a healthy weight; however, an examination of marketing relatedto promoting physical activity and reducing sedentary behaviors was be-yond the study charge. A review of this issue may be found in the IOMreport, Preventing Childhood Obesity: Health in the Balance.
RELATED BACKGROUND AND PERSPECTIVES
Advertising and marketing play a central role in shaping the profile andvitality of the U.S. economy and culture (Klein and Donaton, 1999). Mar-ket forces create, modify, and respond to consumer demand; they influencethe choices and preferences of individuals and populations, as well as theattitudes, opinions, and behaviors of consumers, industries, and govern-ments. The pace at which change occurs is influenced by cultural and socialnorms and values that support or reject new private-sector offerings andinnovations.
Industry develops new products, ideas, and services in response tochanging consumer demand and market forces (Kotler and Armstrong,2004), and it also creates consumer demand for products, including foodsand beverages consumed by individuals and populations over the long term

SETTING THE STAGE 29
(Hawkes, 2002). For this reason the issues often emphasized by industry—sales trends, marketing opportunities, product appeal, advertising expo-sure, brand awareness, brand recognition, brand loyalty, brand equity, andexpanding market share for specific product categories and product brands(Barbour, 2003; Moore et al., 2002; Roberts, 2004)—can also be impor-tant issues for healthier and more active lifestyles, including the promotionof healthful foods and beverages, more nutritious diets, more vigorousactivity patterns, and healthier weights.
Although food manufacturers and producers have not historicallyor predominantly viewed their roles and responsibilities in terms of chang-ing consumers’ preferences toward healthier choices, the recent trend to-ward heavier children and youth—and the broader increased prevalence ofobesity-related chronic disease among adults—places a compelling priorityon industry’s work with other groups and sectors to play a central role inachieving this goal (IOM, 2005). This is a complex challenge in a market-place driven by profit margins and market shares. There are encouragingexamples of food and beverage companies that are making changes to theirproduct portfolios. However, shifting the proportion of companies’ overallproduct portfolios from high-calorie and low-nutrient options to morehealthful foods and beverages will require substantial change and evalua-tion of these efforts to understand if they can retain market share for theirproducts (Chapters 4 and 6).
Also complex is the potential use of policy levers to guide marketingpractices when it comes to children and youth. Our legal traditions balancethe protection of the right to advertise and promote products and ideasthrough various communication channels with the duty to protect the wel-fare of children and youth. For example, with increasing understanding ofthe lifelong and life-threatening consequences of tobacco use, restrictionshave been imposed on tobacco advertising and promotion directed to youth.Yet tobacco companies have continued to use an extensive array of market-ing communication practices that reach youth. In this case, the compellingstate interest in promoting public health by protecting children has gener-ally prevailed over protecting the right to advertise as a form of free speech.
The Federal Trade Commission Case and Beyond
With respect to foods and beverages, Congress has been reluctant toimpose mandatory constraints on advertising to children. The illustrativecase is a Federal Trade Commission (FTC) exploration through a rule-making process more than 25 years ago on restricting or banning advertis-ing to young children (Beales, 2004; Elliott et al., 1981; Ratner et al., 1978).
In the late 1970s, consumer groups and members of a concerned Ameri-can public engaged Congress, industry representatives, and other stake-

30 FOOD MARKETING TO CHILDREN AND YOUTH
holders in a multiyear FTC deliberation to consider the possible need forgovernment intervention to regulate advertising because of the perceivedadverse effects of television advertising directed to young children. At thattime, strong scientific evidence connected the consumption of sugar to thedevelopment of dental caries, which became a public health concern. Theargument favoring regulation focused on the increased number of sweet-ened food and beverage advertisements that were reaching children throughtelevision (the primary media channel at that time), combined with thesocial concern that young children were unable to discern the differencebetween television advertisements and educational programming (Beales,2004; Ratner et al., 1978).
The FTC proposed a rulemaking process in 1978—known as “Kidvid”—that would either restrict or ban advertising to young children as a pro-tective measure, and FTC staff sought public comment on the issues, in-cluding three proposed alternative actions (Ratner et al., 1978). During thisprocess, the FTC provisionally concluded, based upon its review of scien-tific evidence, that television advertising directed at young children wasunfair and deceptive (Elliott et al., 1981). Congress subsequently objectedto intrusions on private-sector advertising and pressured the FTC to with-draw its proposed rule and to conclude that evidence of adverse effects ofadvertising on children was inconclusive (Elliott et al., 1981). Acknowledg-ing that there was some cause for concern, the FTC stated that it would bedifficult to develop a workable rule that would alleviate harm without alsoinfringing on First Amendment rights. Congress barred any rule based onunfairness, and the FTC terminated the rulemaking process in 1981 (Beales,2004; Elliott et al., 1981).
In the agency’s final report to Congress (Elliott et al., 1981), the FTCconcluded that young children lack the capacity to distinguish betweenpersuading and informing. The American Psychological Association TaskForce on Advertising and Children reiterated the same conclusion in areport nearly a quarter of a century later (Kunkel et al., 2004). Althoughsome have called for extension of the FTC conclusions on television adver-tising to vulnerabilities from other sources of marketing to children, theinfluence of other forms of consumer promotion and marketing strategiesto children has not been systematically studied, in part because of thenewness of the techniques and also because of the lack of peer-reviewedevidence and difficulties in accessing propriety data.
Common issues raised include not only concern with the content andintegrated nature (i.e., multiple channels and venues) of advertising andother forms of marketing to children and adolescents, but also the typesand overall quality of foods and beverages that are advertised and mar-keted to young consumers and their parents. Branding, for example, hasbecome a routine part of children’s lives. Some believe that parental abil-

SETTING THE STAGE 31
ity to guide their children’s consumption of food and beverages has beencompromised by an environment that exposes children to an array of ad-vertising and marketing messages for junk food6 (CSPI, 2003; IACFO,2003; Schor, 2004).
Market research shows that children as young as 2 years have beliefsabout specific brands that are promoted by television advertising and pa-rental usage (Hite and Hite, 1995). Young children ages 3 to 6 years recog-nize brand logos for all types of products, and this recognition increaseswith television viewing, age, and the use of visual cues in advertising (Fischeret al., 1991; Henke, 1995; Macklin, 1994; Chapter 5). Brand choices areintergenerationally influenced (Moore et al., 2002). Thus, it has been as-serted that commercialism and consumerism pervade the daily life of youngchildren to an extent that is far greater than that experienced by previousgenerations. Children’s consumer desires are now considered natural eventhough children and youth in previous generations and in different culturesvary widely in how much they care about consumer trends and engage inconsumer activities (Schor, 2004).
Since the FTC case was initiated in the 1970s, a lively debate haspersisted about the nature and extent of the influence of marketing onchildren’s food and beverage choices, eating behaviors, and diet-relatedhealth conditions. This debate has intensified recently in the face of grow-ing concern over childhood obesity, and reflects diverse values and stronglydiscordant viewpoints. It has been difficult to reconcile among these dis-tinct viewpoints, partly because of the paucity of robust evidence on causalrelationships among advertising, other forms of promotion, and consump-tion patterns.
Some view marketing as a form of information that contributes toconsumer choice in the marketplace. For adults the differentiation of brandscreates choices that provide the opportunity for individuals to make deci-sions based on their own needs, preferences, desires, and lifestyles. To theextent that children are to be educated and socialized into the autonomouspractices of adults, certain groups believe that they must learn to make suchdecisions for themselves. Proponents of an unrestricted advertising perspec-tive, such as the Alliance for American Advertising, created by the food andbeverage, advertising, and media industries (ANA, 2005; Office of theClerk and U.S. House of Representatives, 2004), have asserted that the FirstAmendment protects their rights to advertise to children (ANA, 2005;Egerstrom, 2005; Ellison, 2005).
6There is no widely accepted definition for junk food although it is often used by popularculture to describe high-calorie (e.g., high fat, high sugar), and low-nutrient foods and bever-ages. In this report, fast food is defined as any food designed for ready availability, use, orconsumption and sold at eating establishments for quick availability or takeout.

32 FOOD MARKETING TO CHILDREN AND YOUTH
Others are concerned about the ways marketing might undermine pa-rental authority and social morality, and the promotion of less healthfullifestyles (Bjurstrom, 1994; Haefner, 1991; Schor, 2004). Contemporarythinking about the long-term socialization effects of media suggests thatchildren’s unintended exposure to advertisements intended for other targetaudiences (e.g., older teens and adults) may influence their expectations,values, and world views (Haefner, 1991). Prompted by concerns about thepossible adverse health impact of food and beverage marketing to childrenand youth, a variety of states, localities, and school districts have takensteps to restrict marketing and distribution of certain foods and beveragesin schools, and various advocacy groups and legislative bodies have turnedstronger attention to the issues in the United States (Chapter 6).
International Perspectives
The rising concern about obesity in children and youth has promptedsome groups to call for collective international action among many stake-holder groups and changing behaviors across multiple sectors. The WorldHealth Organization’s Global Strategy on Diet, Physical Activity and Healthwas endorsed by the 57th World Health Assembly in 2004 (WHO, 2004).The Global Strategy provides member states with a range of policy optionsto address less healthful dietary practices and physical inactivity, includingprovisions for marketing, advertising, sponsorship, and promotion to sup-port international public health goals. These provisions recommended that“food and beverage advertisements should not exploit children’s inexperi-ence or credulity,” should discourage messages that promote less healthfuldietary practices, and should encourage positive healthful messages (WHO,2004).
The European Heart Network, concerned about the 20 percent ofschool-aged European children who are either obese or at risk for obesity,documented marketing trends for children in 20 European countries. TheNetwork is developing an action plan to address childhood obesity through-out the region of the European Union. The plan includes protection ofchildren from less healthful food marketing as one of many interventions toaddress childhood obesity (Matthews et al., 2005).
Several strong government and professional positions have been takenon the issue of advertising and marketing to children. Bans on televisionadvertising were adopted in the Canadian province of Quebec in 1980,Sweden in 1991, and Norway in 1992. The prevailing principle in thesecountries is that children should have the right to grow up in a commercial-free environment, especially younger children who are trusting and do notunderstand the difference between information and the persuasive intent of

SETTING THE STAGE 33
advertisements or commercials (Bjurstrom, 1994; Government of Quebec,2005; Haefner, 1991; Jarlbro, 2001; Norwegian Ministry of Children andFamily Affairs, 2005; The Consumer Ombudsman, 1999; Chapter 6). How-ever, comprehensive evaluations of the effects of the television advertisingbans are currently not available to assess their impact (Chapter 6). TheAustralian obesity prevention action plan supports stricter national regula-tions on food advertising directed at children, and is considering a banduring children’s television viewing time (NSW Centre for Public HealthNutrition, 2005). The British Medical Association recommended a ban onadvertising of less healthful foods, including certain sponsorship programstargeted at school children, and a ban on less healthful foods and beveragespurchased from school vending machines (British Medical Association andBoard of Science, 2005).
REVIEW OF THE EVIDENCE
The committee drew from several sources of evidence that were directlyrelevant to the committee’s charge—What is the effect of food and beveragemarketing on the diets and health of children and youth? In order to becomprehensive, the committee reviewed a broad range of material drawnfrom both academic, peer-reviewed literature and industry and marketingsources. In addition, the committee commissioned papers examining past,present, and future food and beverage marketing trends affecting childrenand youth and describing effective elements of social marketing campaigns.The committee also reviewed presentations and comments provided duringthe January 2005 public workshop, as well as documents received andplaced in the National Academies’ public access file.
Particular attention was given to the process of gathering and consider-ing the relevant scientific, peer-reviewed literature. Prior to this IOM study,the most recent systematic review of such literature was the report ofHastings et al. (2003). That review, sponsored by the Food StandardsAgency in the United Kingdom, found that food advertising to childrenaffected their preferences, purchase behaviors, and consumption, not justfor different brands but also for different food categories.
The committee’s search for relevant literature included an online bib-liographic search of several databases, outreach to experts in relevant fields,examination of published literature reviews, and acquisition of referencescited in articles found to be relevant (Appendix C). From this search, thecommittee selected 123 empirical studies that were subjected to a system-atic evidence review using a committee-established protocol. Each studywas coded on several dimensions, including the relationship of marketingto diet, cause and effect variables, methods of research, and the compara-
34 FOOD MARKETING TO CHILDREN AND YOUTH
tive quality of the evidence. Both the process and the results are described indetail in Chapter 5 and Appendix F.
In order to fully understand the status and influences of food andbeverage marketing in U.S. children and youth, the committee also drew onpublicly available industry and commercial marketing research. This mate-rial was acquired through marketing, advertising, or industry trade jour-nals; food and beverage companies’ annual reports; foundation and non-profit organization reports and briefs; government, company, and tradeorganization materials; popular magazines and books relevant to advertis-ing and marketing; news releases; government, company, and trade organi-zation websites; and selected marketing research briefs, executive summa-ries, or full reports that were requested by and provided to the committee.Much of this material focused on specific brands and products in targetmarkets, including brand or product awareness, product purchases, brandloyalty, perceived differentiation from competitors, marketing costs, andscalability. A discussion of this material is presented in Chapter 4.
The committee faced several notable challenges to acquiring and us-ing this commercial marketing research. Businesses are increasingly usingintegrated marketing strategies to ensure that young consumers are ex-posed to messages that will stimulate demand, build brand loyalty, andencourage potential or existing customers to purchase new products. Avariety of measured media channels (e.g., television, radio, magazines,Internet) and unmeasured media channels (e.g., product placement, videogames, advergames, in-store promotions, special events) and other venues(e.g., schools) are used to deliver promotional messages to young con-sumers. Many of these strategies are new, and are not well researched orevaluated. Additionally, a large proportion of this research is conductedfor paying clients and is therefore considered to be proprietary informa-tion that is not publicly accessible or is available only for purchase atconsiderable cost to the committee and with prohibitive constraints onpublic availability of the data.
Another challenge faced by the committee was understanding and rec-onciling the differences in the evidence derived from the various sources ofinformation presented in Chapters 4 and 5. For instance, in general, theindustry and marketing information presented in Chapter 4 is of short-termduration, the analyses tend to be descriptive, and they only rarely usemultivariate statistical designs. The peer-reviewed literature reviewed inChapter 5, on the other hand, uses distinct research methodologies to an-swer different research questions than those questions explored by market-ing research firms. The committee considered both of these sources indeveloping its findings and recommendations.

SETTING THE STAGE 35
GUIDE TO THE REPORT
This report describes the committee’s findings and conclusions, identi-fies promising strategies, and offers recommendations for public and pri-vate stakeholders to foster healthful food and beverage choices in childrenand youth. Chapter 2 provides a summary of the health, diet, and eatingpatterns of children and youth. Chapter 3 reviews the factors shaping thefood and beverage consumption of children and youth, including age-related developmental factors involved in consumer socialization—the pro-cess by which children acquire skills, knowledge, and attitudes relevant tofunctioning as consumers in the marketplace. Chapter 4 describes the statusand trends of food and beverage marketing to children and youth anddraws from a range of evidentiary sources. Chapter 5 systematically consid-ers the evidence from peer-reviewed literature on the influence of food andbeverage marketing on the diets and diet-related health of children andyouth. Chapter 6 considers relevant public policy issues. Chapter 7 summa-rizes the committee’s findings, conclusions, recommendations, and priori-ties for moving forward. For reference throughout the report, a list ofacronyms and a glossary of terms are provided in Appendixes A and B.
REFERENCES
AMA (American Marketing Association). 2005. Marketing Definitions. [Online]. Available:http://www.marketingpower.com/content4620.php [accessed August 4, 2005].
ANA (Association of National Advertisers). 2005. ANA Compendium of Legislative, Regula-tory, and Legal Issues 2004. New York: Association of National Advertisers, Inc.
Barbour J. 2003. The U.S. Market for Kids’ Food and Beverages—5th Edition. [Online].Available: http://www.marketresearch.com/product/display.asp?productid=849192&SID=46320173-327969985-290367212/ [accessed August 4, 2005].
Beales JH. 2004. Advertising to Kids and the FTC: A Regulatory Retrospective that Advisesthe Present. [Online]. Available: http://www.ftc.gov/speeches/beales/040802adstokids.pdf [accessed October 3, 2005].
Benton D. 2004. Role of parents in the determination of the food preferences of children andthe development of obesity. Int J Obes Relat Metab Disord 28(7):858–869.
Birch LL. 1999. Development of food preferences. Annu Rev Nutr 19:41–62.Bjurstrom E. 1994. Children and Television Advertising. Report No. 1994/95:8. Stockholm,
Sweden: Swedish Consumer Agency.Boone LE, Kurtz DL. 1998. Contemporary Marketing Wired. 9th ed. Orlando, FL: Harcourt
Brace College Publishers.British Medical Association and Board of Science. 2005. Preventing Childhood Obesity. Lon-
don, UK: British Medical Association.Brucks M, Armstrong GM, Goldberg ME. 1988. Children’s use of cognitive defenses against
television advertising: A cognitive response approach. J Consum Res 14:471–482.Chaplin H. 1999. Food fight! Am Demographics 21(6):64–65.Cleeremans A, Destrebecqz A, Boyer M. 1998. Implicit learning: News from the front. Trend
Cogn Sci 2(10):406–416.CSPI (Center for Science in the Public Interest). 2003. Pestering Parents: How Food Compa-
nies Market Obesity to Children. Washington, DC: CSPI.

36 FOOD MARKETING TO CHILDREN AND YOUTH
Ebbeling CB, Pawlak DB, Ludwig DS. 2002. Childhood obesity: Public-health crisis, commonsense cure. Lancet 360(9331):473–482.
Egerstrom L. 2005, January 27. General Mills exec to defend ads for kids; Hearing to focuson how food is marketed to children. Saint Paul Pioneer Press. P. 1C.
Elliott S, Wilkenfeld JP, Guarino ET, Kolish ED, Jennings CJ, Siegal D. 1981. FTC Final StaffReport and Recommendation That the Commission Terminate Proceedings for the Pro-mulgation of a Trade Regulation Rule on Children’s Advertising. TRR No. 215-60.Washington, DC: Federal Trade Commission.
Ellison S. 2005, January 26. Divided, companies fight for right to plug kids’ food. The WallStreet Journal Online. P. B1.
Fagot-Compagna A, Pettitt DJ, Engelgau MM, Burrows NR, Geiss LS, Valdez R, Beckles GL,Saaddine J, Gregg EW, Williamson DF, Narayan KM. 2000. Type 2 diabetes amongNorth American children and adolescents: An epidemiologic review and a public healthperspective. J Pediatr 136(5):664–672.
Fischer PM, Schwartz MP, Richards JW Jr, Goldstein AO, Rojas TH. 1991. Brand logorecognition by children aged 3 to 6 years. Mickey Mouse and Old Joe the Camel. J AmMed Assoc 266(22):3145–3148.
Freedman DS, Khan LK, Dietz WH, Srinivasan SR, Berenson GS. 2001. Relationship ofchildhood obesity to coronary heart disease risk factors in adulthood: The BogalusaHeart Study. Pediatrics 108(3):712–718.
Freedman DS, Khan LK, Serdula MK, Galuska DA, Dietz WH. 2002. Trends and correlatesof class 3 obesity in the United States from 1990 through 2000. J Am Med Assoc288(14):1758–1761.
Freedman DS, Khan LK, Serdula MK, Dietz WH, Srinivasan SR, Berenson GS. 2005. Therelation of childhood BMI to adult adiposity: The Bogalusa Heart Study. Pediatrics115(1):22–27.
Gamble M, Cotugna N. 1999. A quarter century of TV food advertising targeted at children.Am J Health Behav 23(4):261–267.
Goran MI, Reynolds KD, Lindquist CH. 1999. Role of physical activity in the prevention ofobesity in children. Int J Obesity 23(S3):S18–S33.
Government of Quebec. 2005. Consumer Protection Act P-40.1. [Online]. Available: http://www2.publicationsduquebec.gouv.qc.ca/home.php [accessed July 27, 2005].
Gunter B, Oates C, Blades M. 2005. Advertising to Children on TV. Content, Impact, andRegulation. Mahwah, NJ: Lawrence Erlbaum Associates.
Haefner MJ. 1991. Ethical problems of advertising to children. J Mass Media Ethics 6:83–92.Hastings G, Stead M, McDermot L, Forsyth A, MacKintosh AM, Rayner M, Godfrey C,
Caraher M, Angus K. 2003. Review of Research on the Effects of Food Promotion toChildren. Glasgow, UK: Centre for Social Marketing.
Hawkes C. 2002. Marketing activities of global soft drink and fast food companies in emerg-ing markets: A review. In: Globalization, Diets, and Non-Communicable Diseases.Geneva: World Health Organization.
Henke LL. 1995. Young children’s perceptions of cigarette brand advertising symbols: Aware-ness, affect, and target market identification. J Advertising 24(4):13–28.
Hite CF, Hite RE. 1995. Reliance on brand by young children. J Market Res Soc 37(2):185–193.
IACFO (International Association of Consumer Food Organizations). 2003. BroadcastingBad Health. Why Food Marketing to Children Needs to Be Controlled. London, UK:IACFO.
IOM (Institute of Medicine). 2001. Health and Behavior: The Interplay of Biological, Behav-ioral, and Societal Influences. Washington, DC: National Academy Press.

SETTING THE STAGE 37
IOM. 2005. Preventing Childhood Obesity: Health in the Balance. Washington, DC: TheNational Academies Press.
Jarlbro G. 2001. Children and Television Advertising. The Players, the Arguments, and theResearch During the Period 1994–2000. Stockholm, Sweden: Swedish Consumer Agency.
John D. 1999. Consumer socialization of children: A retrospective look at twenty-five yearsof research. J Consum Res 26(3):183–213.
Klein D, Donaton S. 1999. Letter from the editors. Advertising Age 70(13):3.Kotler P, Armstrong G. 2004. Principles of Marketing. 10th ed. Upper Saddle River, NJ:
Prentice Hall.Kuczmarski RJ, Ogden CL, Grummer-Strawn LM, Flegal KM, Guo SS, Wei R, Mei Z, Curtin
LR, Roche AF, Johnson CL. 2000. CDC growth charts: United States. Adv Data (314):1–27.
Kumanyika SK, Krebs-Smith SM. 2001. Preventive nutrition issues in ethnic and socioeco-nomic groups in the United States. In: Bendich A, Deckelbaum RJ, eds. Primary andSecondary Preventive Nutrition. Totowa, NJ: Humana Press. Pp. 325–356.
Kumanyika S, Jeffery RW, Morabia A, Ritenbaugh C, Antipatis VJ, Public Health Approachesto the Prevention of Obesity (PHAPO) Working Group of the International ObesityTask Force (IOTF). 2002. Obesity prevention: The case for action. Int J Obes RelatMetab Disord 26(3):425–436.
Kunkel D. 2001. Children and television advertising. In: Singer DG, Singer JL, eds. Hand-book of Children and the Media. Thousand Oaks, CA: Sage Publications. Pp. 375–393.
Kunkel D, Wilcox BL, Cantor J, Palmer E, Linn S, Dowrick P. 2004. Report of The APA TaskForce on Advertising and Children. Section: Psychological Issues in the Increasing Com-mercialization of Childhood. [Online]. Available: http://www.apa.org/releases/childrenads.pdf [accessed August 4, 2005].
Li X, Li S, Ulusoy E, Chen W, Srinivasan SR, Berenson GS. 2004. Childhood adiposity as apredictor of cardiac mass in adulthood: The Bogalusa Heart Study. Circulation110(22):3488–3492.
Macklin MC. 1994. The effects of an advertising retrieval cue on young children’s memoryand brand evaluations. Psychol Marketing 11(3):291–311.
Matthews A, Cowburn G, Rayner M, Longfield J, Powell C. 2005. The Marketing of Un-healthy Food to Children in Europe. A Report of Phase 1 of “The Children, Obesity andAssociated Avoidable Chronic Diseases” Project. Brussels: European Heart Network.
McCarthy EJ. 1975. Basic Marketing: A Managerial Approach. 5th ed. Homewood, IL: R.D.Irwin.
McNeal JU. 1999. The Kids Market Myths and Realities. Ithaca, NY: Paramount MarketPublishing.
Mennella JA, Beauchamp GK. 1998. Early flavor experiences: Research update. Nutr Rev56(7):205–211.
Moore ES. 2005, January 27. An Overview of Academic Marketing Research on Children’sIssues. Presentation at the Institute of Medicine Workshop on Marketing Strategies thatFoster Healthy Food and Beverage Choices in Children and Youth, Washington, DC.Committee on Food Marketing and the Diets of Children and Youth.
Moore ES, Lutz RJ. 2000. Children, advertising, and product experiences: A multimethodinquiry. J Consum Res 27(1):31–48.
Moore ES, Wilkie WL, Lutz RJ. 2002. Passing the torch: Intergenerational influences as asource of brand equity. J Marketing 66(2):17–37.
MPA (Magazine Publishers of America). 2004. Teen Market Profile. [Online]. Available:http://www.magazine.org/content/files/teenprofile04.pdf [accessed August 4, 2005].
Nickelodeon. 2005. All Nick TV Shows. [Online]. Available: http://www.nick.com/all_nick/[accessed August 4, 2005].

38 FOOD MARKETING TO CHILDREN AND YOUTH
Norwegian Ministry of Children and Family Affairs. 2005. The Norwegian Action Plan toReduce Commercial Pressure on Children and the Young People. [Online]. Available at:http://odin.dep.no/bfd/english/doc/handbooks/004061-990036/dok-bn.html [accessedJuly 27, 2005].
NRC (National Research Council) and IOM. 2004. Children’s Health, the Nation’s Wealth:Assessing and Improving Child Health. Washington, DC: The National Academies Press.
NSW Centre for Public Health Nutrition. 2005. Best Options for Promoting Healthy Weightand Preventing Weight Gain in NSW. Sydney, Australia: NSW Department of Health.
Office of the Clerk and U.S. House of Representatives. 2004. Alliance for American Advertis-ing House ID Numbers. [Online]. Available: http://clerk.house.gov/pd/houseID.html?reg_id=37455/ [accessed July 27, 2005].
Peters JC, Wyatt HR, Donahoo WT, Hill JO. 2002. From instinct to intellect: The challengeof maintaining healthy weight in the modern world. Obes Rev 3(2):69–74.
Ratner EM, Hellegers JF, Stern GP, Ogg RC, Adair S, Zacharias L. 1978. FTC Staff Reporton Television Advertising to Children. Washington, DC: Federal Trade Commission.
Reilly JJ, Armstrong J, Dorosty AR, Emmett PM, Ness A, Rogers I, Steer C, Sherriff A. 2005.Early life risk factors for obesity in childhood: Cohort study. Br Med J Online330(7504):1357–1364.
Roberts DF, Foehr UG, Rideout V. 2005. Generation M: Media in the Lives of 8–18 YearOlds. Menlo Park, CA: Henry J. Kaiser Family Foundation.
Roberts K. 2004. The Future Beyond Brands: Lovemarks. New York: PowerHouse Books.Schlosser E. 2001. Fast Food Nation. The Dark Side of the All-American Meal. Boston, MA:
Houghton Mifflin Company.Schor JB. 2004. Born to Buy: The Commercialized Child and the New Consumer Culture.
New York: Scribner.Schudson M. 1986. Advertising, The Uneasy Persuasion. It’s Dubious Impact on American
Society. New York: BasicBooks.Skinner JD, Carruth BR, Bounds W, Ziegler P, Reidy K. 2002. Do food-related experiences in
the first 2 years of life predict dietary variety in school-aged children? J Nutr EducBehav 34(6):310–315.
Srinivasan SR, Myers L, Berenson GS. 2002. Predictability of childhood adiposity and insulinfor developing insulin resistance syndrome (syndrome X) in young adulthood: TheBogalusa Heart Study. Diabetes 51(1):204–209.
Swinburn B, Egger G. 2005. Preventive strategies against weight gain and obesity. Obes Rev3:289–301.
Taylor JP, Evers S, McKenna M. 2005. Determinants of healthy eating in children and youth.Canadian J Public Health 96(Suppl 3):S20–S26.
Teenage Research Unlimited. 2004. Teens Spent $175 Billion in 2003. [Online]. Available:http://www.teenresearch.com/PRview.cfm?edit_id=168/ [accessed August 4, 2005].
The Consumer Ombudsman. 1999. Guidelines on the Consumer Ombudsman’s Practice.Marketing in Relation to Children and Young People. Lysaker, Norway: The ConsumerOmbudsman.
Whitaker RC, Wright JA, Pepe MS, Seidel KD, Dietz WH. 1997. Predicting obesity in youngadulthood from childhood and parental obesity. N Engl J Med 337(13):869–873.
WHO (World Health Organization). 2004. Global Strategy on Diet, Physical Activity andHealth. Report No. WHA57.17. [Online]. Available: http://www.who.int/gb/ebwha/pdf_files/WHA57/A57_R17-en.pdf [accessed August 5, 2005].
Young BM. 1990. Television Advertising and Children. Oxford, U.K.: Clarendon Press.

39
2
Health, Diet, and Eating Patterns ofChildren and Youth
INTRODUCTION
Over the past four decades, lower rates of nutrient deficiencies, dentalcaries, infectious diseases, and injuries have all contributed to lower child-hood morbidity and mortality and better health for children. In that sameperiod, a troubling new trend has steadily and dramatically emerged, threat-ening to reverse many of these gains. From 1963 to 2002, rates of obesitytripled for older children ages 6–11 years and adolescents ages 12–19 years.For consistency between Institute of Medicine (IOM) reports, the termobesity is used to refer to children and youth who have a body mass index(BMI) equal to or greater than the 95th percentile of the age- and gender-specific BMI charts developed by the Centers for Disease Control andPrevention (CDC). By this definition, an estimated 9.18 million U.S. chil-dren and adolescents ages 6–19 years are considered obese. If obesity levelscontinue at the current rate, the lifetime risk of being diagnosed with type 2diabetes at some point in their lives is 30 percent for boys and 40 percentfor girls. Moreover, an estimated 1 million 12- to 19-year-old Americanadolescents have the metabolic syndrome, described later in this chapter.
Health-related behaviors such as eating habits and physical activitypatterns develop early in life and often extend into adulthood. They conse-quently affect risk for a variety of chronic diseases including type 2 diabetesand cardiovascular disease. Parents, communities, government, the publichealth sector, and health care systems accordingly face the significant chal-lenge of creating a supportive environment in which children can grow up
40 FOOD MARKETING TO CHILDREN AND YOUTH
in a way that maximizes their chances for a healthy life. As a result of thedistinct trend toward the onset of chronic disease risks much earlier in life,dietary guidance for children and youth has evolved from an historic em-phasis on ensuring nutrient and energy (calorie) adequacy to meet basicmetabolic needs to the more recent focus on ensuring dietary quality whileavoiding calorie excesses. The current goal is to promote a lifestyle forchildren and youth that incorporates nutrient-dense foods and beveragesinto their diet, and balances their calorie consumption with levels of physi-cal activity sufficient to create energy balance at a healthy weight.1
This chapter provides an overview of the dietary intake, eating pat-terns, and sources of nutrients for infants and toddlers, younger children,school-aged children, and adolescents. It examines how nutrient and foodintakes compare to reference standards and guidelines, and it also addressesregional and income-related differences in food consumption and nutrientintake.
OVERVIEW OF CHILDREN’S HEALTH AND DIET
Public health and technological improvements over the past centuryhave enhanced the survival and health of infants, school-aged children, andadolescents in the United States (NRC and IOM, 2004). Widespread accessto potable water, vaccines, and antibiotics has reduced child morbidity andmortality rates attributed to infectious diseases (CDC, 1999; IOM, 2005b).Safety initiatives targeted to motor vehicles and children’s home and recre-ational environments have led to a 39 percent decline in unintentional in-jury deaths among children ages 14 and under from 1987 to 2000 (Na-tional SAFE KIDS Campaign, 2003). The introduction of various fluoridevehicles through municipal water systems and other sources has prompteda substantial decline in dental caries in children over the past two decades(DHHS, 2000b; Dye et al., 2004).
The health and nutritional well-being of millions of Americans havebenefited from a number of interventions, including the fortification of thefood supply with essential micronutrients such as B vitamins, iron, iodine,and folic acid (Hetzel and Clugston, 1999; Honein et al., 2001; IOM, 2003;Park et al., 2000; Pfeiffer et al., 2005). The diets of low-income families,their infants, and school-aged children have improved through the creationand expanded coverage of domestic food assistance programs to increase
1Growing children, even those at a healthy body weight, must be in a slightly positiveenergy balance to satisfy the additional calorie needs of tissue deposition for normal growth.However, for the purpose of simplicity in this report, the committee uses the term energybalance in children and youth to indicate an equality between energy intake and energyexpenditure that supports normal growth without promoting excess weight gain and body fat.

HEALTH, DIET, AND EATING PATTERNS OF CHILDREN AND YOUTH 41
food security, such as the Special Supplemental Nutrition Program forWomen, Infants, and Children (WIC), the National School Meals Program,and the Food Stamp Program (IOM, 2005b,c; USDA, 2005c); and im-proved state health insurance coverage for children living in poor families(Cohen and Bloom, 2005; Wise, 2004). The outcomes have been linked toincreased birth weights (IOM, 2005c), and a steady decline in the preva-lence of micronutrient-deficiency diseases in childhood such as rickets, pel-lagra, goiter, iron-deficiency anemia, and neural tube defects (CDC, 1999,2002; Honein et al., 2001).
Obesity
Although the health of children and youth has improved in many re-spects, they face new diet-related health problems today that were unex-pected just a generation ago. The increasing prevalence over the past threedecades of children who are obese, defined in this report as children andyouth who have a BMI equal to or greater than the 95th percentile of theage- and gender-specific BMI charts developed by the CDC, and those whoare at risk for becoming obese, defined in this report as children and youthwho have a BMI between the 85th and 95th percentile of the age- andgender-specific CDC BMI charts, makes it the most common serious con-temporary public health concern faced by young people in the United States(IOM, 2005b; Land, 2005). The average weight for a 10-year-old boyincreased from 74.2 pounds in 1963 to nearly 85 pounds in 2002. Theaverage weight for a 10-year-old girl went from 77.4 pounds to an esti-mated 88 pounds. The average 15-year-old boy weighed 135.5 pounds in1966, and 150.3 pounds in 2002. The average weight of a 15-year-old girlrose from 124.2 pounds to 134.4 pounds during the same time frame(Ogden et al., 2004). The trends are similar for American adults. Improvednutrition has helped them grow taller over the past four decades, but it hasalso made them heavier. Adults are an average of 1 inch taller than theywere in the 1960s but about 25 pounds heavier (Ogden et al., 2004).
Obesity has both short- and long-term consequences for children’s emo-tional health and physical and social functioning and well-being (IOM,2005b; Williams et al., 2005). Obesity also produces significant burdens onthe health care system. Obesity-associated annual hospital costs for chil-dren and adolescents more than tripled over two decades, rising from$35 million (1979–1981) to $127 million (1997–1999, based on 2001 dol-lars) (Wang and Dietz, 2002). After adjusting for inflation and convertingto 2004 dollars, the national direct and indirect health care expendituresassociated with adult overweight and obesity range from $98 billion to$129 billion (IOM, 2005b). If the childhood obesity epidemic continues atits current rate, conditions related to type 2 diabetes, such as blindness,

42 FOOD MARKETING TO CHILDREN AND YOUTH
coronary artery disease, stroke, and kidney failure, may become ordinaryconditions in middle age (IOM, 2005b).
Between 1999 and 2002, the prevalence of obesity was 10.3 percent foryounger children ages 2–5 years, 15.8 percent among children ages 6–11 years, and 16.1 percent among adolescents ages 12–19 years (Hedleyet al., 2004). Overall, 31 percent of U.S. children and adolescents are eitherobese (16 percent) or at risk of becoming obese (15 percent)—figures thatare three and six times greater than the Healthy People 2010 goal of 5 per-cent (DHHS, 2000a; Hedley et al., 2004). Since the 1970s, the rate ofobesity has more than doubled for preschool children ages 2 to 5 years(IOM, 2005b; Ogden et al., 2003). As shown in Figure 2-1, between 1963and 2002, obesity rates tripled for older children ages 6–11 years and youthages 12–19 years (CDC, 2005). More than 9 million U.S. children andadolescents ages 6–19 years are considered to be obese (CDC, 2004).
Leaner children and youth have remained more or less the same weight,
FIGURE 2-1 Prevalence of obesity among U.S. children and adolescents by agegroup and selected period, 1963–2002.NOTE: In this report, children with a body mass index (BMI) value at or above the95th percentile of the CDC age- and gender-specific BMI curves for 2000 arereferred to as obese, and children with a BMI value between the 85th percentile and95th percentile are referred to as at risk for becoming obese. These cut-off pointscorrespond to the terms, overweight and at risk for overweight, used for childrenand youth by the CDC.SOURCE: CDC (2005).
4 4
7
11
16
56
5
11
16
0
4
8
12
16
20
1963-1970 1971-1974 1976-1980 1988-1994 1999-2002
Year
6-11 years
12-19 years
Per
cent
age

HEALTH, DIET, AND EATING PATTERNS OF CHILDREN AND YOUTH 43
but those in the upper percentiles of the BMI charts are heavier. The CDCcompiled BMI charts on the basis of combined survey data from severalnationally representative cross-sectional samples of the U.S. populationthat were collected between 1963 and 1980.2 It is notable that the BMIlevels for children in the lower part of the BMI chart distribution (the 5th tothe 50th percentiles) remained stable when comparing the national surveys(Flegal and Troiano, 2000). Thus, a child in the 1990s who is at or belowthe 50th percentile is more likely to have a similar BMI when compared toa child in the 1970s; however, a child in the 1990s who is at or above the85th percentile is more likely to have a significantly higher BMI whencompared to a cohort from the 1970s.
Related Chronic Disease Risk
Even among children and youth who are not obese, diets too high insaturated fats, trans fat, and sodium predispose them to the risk of heartdisease, stroke, and certain cancers. Moreover, approximately 1 million 12-to 19-year-olds in the United States have the metabolic syndrome (AHA,2005; Cook et al., 2003), defined as having three or more of the followingabnormalities: blood triglyceride level of 110 milligrams per deciliter (mg/dL) or higher; high-density lipoprotein levels of 40 mg/dL or lower; el-evated fasting glucose of 110 mg/dL or higher; blood pressure above the90th percentile for age, sex, and height; and waist circumference at orabove the 90th percentile for age and sex.
About 30 percent of obese adolescents will develop the metabolic syn-drome, and nearly two-thirds who develop the syndrome are obese (AHA,2005). In adults, the metabolic syndrome is associated with type 2 diabetes(Cook et al., 2003; Haffner et al., 1992), cardiovascular disease (Cooket al., 2003; Isomaa et al., 2001), and a higher mortality rate (Cook et al.,2003; Lakka et al., 2002). Even among those obese youth who do not yethave clinical diabetes, components of the metabolic syndrome appear tocontribute to the development of atherosclerosis (Berenson et al., 1998;Mahoney et al., 1996; McGill et al., 2002). The association of childhoodand youth obesity with the metabolic syndrome, rather than exclusivelywith diabetes, may present the greatest physical health threat of child-hood obesity.
2Because of the increases in bodyweight that occurred in the 1980s and 1990s, the CDCdecided not to include the National Health and Nutrition Examination Study (NHANES) III(1988–1994) body weight data in the revised year 2000 charts of BMI standards for childrenages 6 years or older. The NHANES III data would have shifted the curves (weight-for-ageand BMI-for-age) upward, erroneously conveying a range of appropriateness to the higherweights.

44 FOOD MARKETING TO CHILDREN AND YOUTH
Micronutrient Inadequacies
Although progress has been made in certain areas, subgroups of chil-dren and adolescents still experience micronutrient inadequacies that mayadversely affect their health, particularly insufficient intakes of vitamins A,E, B6, and folate as well as calcium, iron, potassium, zinc, and magnesium(DHHS and USDA, 2004; Ganji et al., 2003; IOM, 2005c).
Inadequate dietary calcium intake combined with physical inactivityduring childhood, adolescence, and early adulthood compromises peak bonemass and contributes to bone resorption and bone diseases, including os-teomalacia and osteoporosis in later adulthood (NIH, 2001). Young adultswho do not reach a normal peak bone mass by 20 years of age have thegreatest risk of developing osteoporosis in later years (Beck and Shoemaker,2000). Osteoporosis is a serious health problem for today’s youth that hasbeen associated with a decline in calcium intake (NIH, 2001), attributed inpart to increased consumption of sweetened beverages (such as carbonatedsoft drinks, fruit drinks, and sweetened teas) and reduced consumption ofmilk—the primary source of calcium in U.S. children’s and adolescents’diets (AAP, 2004; Fisher et al., 2004; Mrdjenovic and Levitsky, 2003).Studies suggest that a higher consumption of carbonated beverages in ado-lescent girls may be associated with incidence of bone fracture (Wyshak,2000). Moreover, rickets among infants is attributed to inadequate vitaminD intake and reduced exposure to sunlight, and remains a problem in theUnited States. For example, reemergence of nutritional rickets has beenreported in some African American infants3 (Weisberg et al., 2004).
Dental Caries
Diets high in added sugars also predispose to dental caries. Althoughthe prevalence of dental caries has decreased in the United States, in par-ticular due to topical and water supply fluoridation, lack of access to carehas contributed to declines in dental visits and increased rates of untreateddental caries for children and adolescents (DHHS, 2000b; Gift et al., 1996).More than one-half of low-income children without health insurance hadno preventive dental care visits (Kenney et al., 2005). The Surgeon General’s
3The American Academy of Pediatrics (AAP) recommends that all infants, including thosewho are exclusively breastfed, receive a minimum intake of 200 international units (IU) ofvitamin D daily beginning during the first 2 months of life. Additionally, the AAP recom-mends that an intake of 200 IU of vitamin D be continued throughout childhood and adoles-cence because adequate sunlight exposure is not easily determined for an individual (Gartneret al., 2003). Daily sunlight exposure to skin allows the human body to convert vitamin D toa biologically active form that is absorbed by the lower intestine and metabolized with dietarycalcium to prevent rickets (IOM, 1997).
HEALTH, DIET, AND EATING PATTERNS OF CHILDREN AND YOUTH 45
Report on Oral Health in America (DHHS, 2000b) has documented thatdespite progress in reducing dental caries, children and adolescents in fami-lies living below the poverty level experience more dental decay than thosein higher socioeconomic levels. In addition, the proportion of teeth affectedby dental caries varies by age and race/ethnicity. Poor Mexican-Americanchildren ages 2–9 have the highest proportion of untreated decayed teeth(70.5 percent), followed by poor African-American children (67.4 percent),as compared to poor white children (57.2 percent). Poor adolescents ages12–17 years in each racial/ethnic group have a higher percentage of un-treated decayed primary teeth than their peers who do not live in poverty(DHHS, 2000b). Changes in dietary patterns of younger children ages 2–5 years (e.g., increased frequency of sweetened snacks) may also contributeto the reversal of oral health benefits of fluoridation observed since the1980s (Dye et al., 2004).
DIETARY RECOMMENDATIONS AND GUIDELINES
A healthful diet for children and adolescents provides recommendedamounts of nutrients and other food components within estimated energyrequirements (EER)4 to promote normal growth and development, a healthyweight trajectory, and energy balance.5 A healthful diet also reduces thelong-term risk for obesity and related chronic diseases associated with ag-ing, including type 2 diabetes and the metabolic syndrome (IOM, 2005b).
Thirty years ago, diet quality for children and youth focused on theconsumption of a sufficient and balanced intake of foods providing calories,protein, and micronutrients to prevent deficiency diseases. Today, by con-trast, dietary quality emphasizes the principles of adequacy, variety, propor-tionality, and moderation, as well as reinforcing recommendations for ahigh intake of fruits, vegetables, and whole grains; nutrient-dense foodsproviding sufficient calories that are balanced with daily physical activitylevels; and limited consumption of total fat, saturated fat, trans fatty acids,cholesterol, sodium, and added sugars (DHHS and USDA, 2005).
The average healthy child ages 2 to 5 years gains 4.5 to 6.5 pounds andgrows 2.5 to 3.5 inches each year (Story et al., 2003). Child growth contin-ues at a slow and steady rate until the onset of puberty in late middlechildhood or early adolescence. A healthy child’s appetite and food intake
4Estimated energy requirements (EER) are available for children and youth ages 2–18 yearsand calculated based gender, age, and three different activity levels (IOM, 2002–2005; Appen-dix D-1).
5In this report, energy balance in children and youth refers to a state in which energy intakeequals energy expenditure; energy balance supports normal growth and development withoutpromoting excess weight gain and body fat.

46 FOOD MARKETING TO CHILDREN AND YOUTH
varies with the rate of growth, which occurs unevenly in spurts and periodsof slower growth. The growth that occurs during adolescence is significantand comparable to the growth that occurs during the first year of life.During adolescence, nutrition needs are higher than during any other pe-riod of the lifecycle. Puberty is when adolescents gain approximately 50 per-cent of their adult body weight, accumulate an estimated 40–45 percent ofskeletal muscle mass, and achieve the final 15–20 percent of their lineargrowth (Shils et al., 1999; Story et al., 2003).
National dietary recommendations and guidelines established for theAmerican population have been used to assess the diets of children andyouth. These recommendations and guidelines collectively include the Di-etary Reference Intakes (DRIs), the Dietary Guidelines for Americans, andthe Food Guide Pyramid (FGP) and MyPyramid.
Dietary Reference Intakes
The DRIs is a term used for a set of distinct, nutrient-based referencevalues that are based on scientifically grounded relationships between nu-trient intake and indicators of good health and chronic disease prevention(IOM, 1997, 1998, 2001, 2002–2005, 2005a). The DRIs, which replacedthe former Recommended Dietary Allowances in the United States (NRC,1989), include values for the following:
• Estimated Average Requirement (EAR), which is the nutrient in-take level estimated to meet the requirements of half the healthy individualsin a given life stage and gender group for a specific indicator or outcome; itis the median of a distribution and can be used to estimate the prevalence ofinadequacy in a group;
• Recommended Dietary Allowance (RDA), which is a nutrient in-take level estimated to meet the needs of nearly all individuals (97.5 per-cent) within a given life stage and gender group, and is calculated as twostandard deviations above the EAR;
• Adequate Intake (AI),6 which is a nutrient intake level based onobserved or experimentally derived estimates of nutrient intake of healthy
6Mean usual intake at or greater than the AI is equated with a low prevalence of inadequatenutrient intakes, especially when the AI is based on the mean intake of a healthy group.Unlike an EAR, an AI value cannot be used to estimate the prevalence of nutrient inadequacyin a population. If at least 50 percent of the gender or age group has intakes greater than theAI, then the prevalence of inadequacy should be low. If less than 50 percent have intakesgreater than the AI, then no conclusion can be drawn about the prevalence of nutrient inad-equacy in a population group.

HEALTH, DIET, AND EATING PATTERNS OF CHILDREN AND YOUTH 47
people and used as a guide for individual intake when there is insufficientscientific evidence to calculate an RDA for a specific nutrient; and
• Tolerable Upper Intake Level (UL), which is based on a risk assess-ment model and used in the highest average daily intake likely to pose norisk of adverse health effects.
The DRI report series was released by the IOM between 1997 and2004. The 2002–2005 IOM report provided EER levels, which are sug-gested calorie7 intakes based on age, sex, and physical activity level, andDRIs for carbohydrate and fat (including saturated, unsaturated, and transfats), cholesterol, total protein, and individual amino acids (IOM, 2002–2005). This report introduced the concept of an Acceptable MacronutrientDistribution Range (AMDR), representing a range of intakes for carbohy-drates, fats, and protein expressed as a percentage of calorie intake. Con-sumption outside the AMDR is associated with an increased risk of chronicdisease and insufficient nutrient intake (IOM, 2002–2005).
Energy intakes based on the EER for proposed food consumption pat-terns have been developed for boys and girls ages 2 to 18 years for threephysical activity levels—sedentary, low active, and active (USDA, 2003a;Appendix D, Table D-1). The DRI report on electrolytes and water pro-vides total water AI levels for children and adolescents of different ages,which can be used as guidelines for total fluid intake obtained from bever-ages and foods (IOM, 2005a). Macronutrient and micronutrient recom-mendations for children and adolescents from the DRI reports are summa-rized in Appendix D, Tables D-2 and D-3. Many EAR, RDA, and AI levelsfor children and adolescents are estimates or extrapolations from data onadults (IOM, 1997, 1998, 2001, 2002–2005).
Finding: More certain determinations of nutritional requirements for chil-dren and adolescents await the development of better techniques anddata sets.
Dietary Guidelines for Americans
The Dietary Guidelines for Americans are developed jointly by the U.S.Department of Health and Human Services (DHHS) and the U.S. Depart-ment of Agriculture (USDA) and draw from recommendations of a non-federal Dietary Advisory Committee. The Dietary Guidelines for Americanspresent summary dietary recommendations for the public based on currentscientific evidence and medical knowledge. They represent the government
7In this report, the term calories is used synonymously with kilocalories.

48 FOOD MARKETING TO CHILDREN AND YOUTH
policy document on dietary practices and are mandated to be promoted inall federal nutrition education programs. Initially published in 1980, theyare revised every 5 years. The sixth edition was released in 2005. The keyrecommendations of the Dietary Guidelines, summarized in Box 2-1, arebased on a preponderance of the scientific evidence of nutritional factorsthat are important in lowering the risk of chronic disease and promotinghealth, including specific recommendations for weight management, physi-cal activity, food safety, and consumption patterns among food groups,saturated fats, trans fats, cholesterol, sugars, other carbohydrates, sodiumand potassium, and alcoholic beverages (DHHS and USDA, 2005).
Food Guide Pyramid and MyPyramid
The FGP is an educational tool for the public that was designed bythe USDA in 1992 as the graphic representation of the Dietary Guidelinesfor Americans. It takes the Dietary Guidelines, along with the Recom-mended Dietary Allowances, and translates them into servings from vari-ous food groups with the goal of promoting a healthful diet for the U.S.population. The qualitative dietary guidance depicted by the FGP is basedon the principles of balance, variety, proportionality, and moderation(USDA, 1992, 1996). The FGP for Young Children is similar in contentto the FGP but was adapted for younger children ages 2 to 6 years, andrecommended fewer serving sizes from certain food groups(USDA, 2003b).
In 2005, an interactive food guidance system, MyPyramid, was re-
BOX 2-12005 Dietary Guidelines for Americans
• Consume a variety of nutrient-dense foods and beverages within and among thebasic food groups while choosing foods that limit the intake of saturated andtrans fats, cholesterol, added sugars, salt, and alcohol.
• Meet recommended intakes within calorie needs by adopting a balanced eatingpattern, such as the U.S. Department of Agriculture Food Guide Pyramid or theDietary Approaches to Stop Hypertension (DASH) Eating Plan.
• For weight management, maintain body weight in a healthy range and balancecalories from foods and beverages with calories expended. To prevent gradualweight gain over time, make small decreases in food and beverage calories andincrease physical activity.
SOURCE: DHHS and USDA (2005).

HEALTH, DIET, AND EATING PATTERNS OF CHILDREN AND YOUTH 49
leased that replaced the existing FGP (USDA, 2005b). MyPyramid is acomponent of an overall food guidance system that emphasizes a moreindividualized approach to improving diet and lifestyle. In particular, itoffers personalized recommendations for the types and amounts of food forindividuals to consume each day, recommends gradual improvement indaily diet and lifestyle habits including physical activity, and underscoresthe principles of variety, moderation, and proportionality. A child-friendlyversion of MyPyramid was recently released to reach children ages 6–11 years with targeted messages about the importance of making healthfuleating and physical activity choices and an interactive computer game toapply these messages (USDA, 2005b).
Linked to MyPyramid is the MyPyramid Tracker, which has two com-ponents—assessment of food intake and physical activity. The food intakeassessment component incorporates what was previously the InteractiveHealthy Eating Index (HEI) as an online educational tool for individualswho would like to assess their dietary intake according to MyPyramid andthe Dietary Guidelines for Americans (USDA, 2005a). The USDA and otherresearchers use the HEI for research and assessment purposes to assess andmonitor diet quality of the U.S. population according to the Dietary Guide-lines for Americans and to investigate relationships between diet and health(USDA, 2005d). The HEI evaluates food consumption patterns against theFGP recommendations using five food-based components (grains, veg-etables, fruits, dairy, and meat) and it uses four nutrient-based componentsto assess adherence to recommendations in the 2000 Dietary Guidelines forAmericans for maximum daily intake of total fat and saturated fat, as wellas the IOM recommendations for daily cholesterol and sodium (Basiotiset al., 2002; Lin, 2005).8
WHAT CHILDREN AND YOUTH EAT
The Dietary Guidelines Advisory Committee Report (DHHS and USDA,2004) noted that, based on available food consumption data, children’s andadolescents’ dietary intakes of saturated fatty acids, trans fatty acids, andsodium are higher than recommended (DHHS and USDA, 2004). Addition-ally, the rising prevalence of obesity in children and adolescents of all agesand across all ethnic groups over the past four decades indicates that theircalorie intakes are not balanced with their energy expenditure levels over
8The HEI is being updated by the USDA Center for Nutrition Policy and Promotion toreflect the 2005 Dietary Guidelines for Americans. It should be completed by early 2006(USDA, 2005c). The food intake assessment component of MyPyramid Tracker will be up-dated in 2006 to reflect the new HEI.

50 FOOD MARKETING TO CHILDREN AND YOUTH
time (CDC, 2005; IOM, 2005b). The Dietary Guidelines Advisory Com-mittee Report also identified sufficiently low intakes of dietary calcium,potassium, fiber, magnesium, and vitamin E by children and adolescents toraise concern about nutrient adequacy, and highlighted the need for suffi-cient intake of iron and folic acid by adolescent girls of childbearing age(DHHS and USDA, 2004). Substantial evidence reviewed in this chapterunderlies the concern about the intake of certain nutrients and food compo-nents in the diets of children and adolescents, the food consumption pat-terns associated with these intakes, and changes observed over time.
Sources of Nutrient and Food Intake Information
Major sources of information about the food and nutrient intakes ofnationally representative groups of children and youth are the USDA’solder Nationwide Food Consumption Survey (NFCS) (through 1977) andits more recent Continuing Survey of Food Intakes by Individuals (CSFII)and the DHHS’s series of National Health and Nutrition ExaminationSurveys (NHANES).9 In general, these cross-sectional surveys are complexstratified samples of the population and sampling weights varied dependingon the design and oversampling of selected subgroups. The design, sam-pling, and methods for collecting dietary data differ among the surveys andhave evolved over time, confounding conclusions as to trends. Informationabout the dates, population, sample size, and methodology for assessingdietary intake for the main surveys referenced in this chapter is summarizedin Appendix D (Table D-4).
Challenges of Dietary Assessment Methods
Dietary assessment methods are subject to a variety of reporting errors,including problems associated with individuals accurately recalling the typesand quantities of foods and beverages consumed; estimating portion sizes;general misreporting according to what is considered socially desirable,especially among individuals who are overweight or obese; and selectiveunderreporting of specific foods (e.g., foods high in fat, sugars, and refinedcarbohydrates) (Huang et al., 2004; IOM, 2002–2005, 2005b).
To compensate for these methodological limitations, multiple passeswere added to the 24-hour dietary recall starting with CSFII 1994–1996,including detailed questions addressing food preparation and frequentlyunreported foods. These have improved the completeness of data collec-
9The dietary component of NHANES is called What We Eat in America, a joint effort ofthe USDA and DHHS.

HEALTH, DIET, AND EATING PATTERNS OF CHILDREN AND YOUTH 51
tion. The combination of improved methodology for collecting dietary in-formation and the pervasive problems of underreporting total food andcalorie intake confound the assessment of an individual’s actual dietaryintake as well as trends in dietary intake over time. However, the dietarydata from each survey provide the best estimate of a group’s intake at thatpoint in time. The assessment of children’s dietary intake poses additionalproblems due to the nature, extent, and determinants of underreporting oroverreporting for children and adolescents because the combinationof methodological limitations are not well understood (Livingstone andRobson, 2000). Additionally, food intake for younger children is providedby proxy. Although the primary caregiver may be a reliable reporter of achild’s food intake in the home setting, that may not be the case for foodsand beverages consumed away from home.
In NFCS 1977–1978 and CSFII 1989–1991, an adult household mem-ber reported information for children younger than age 12 years (Ennset al., 2002). In CSFII 1994–1996 and 1998, children ages 6–11 years wereinterviewed directly when asked to describe their individual food intakeand were assisted as necessary by an adult household member (Enns et al.,2002). When needed, additional information was obtained from the schoolcafeteria personnel or care providers to improve completeness of data col-lected. In NHANES III, proxy respondents provided information for 97 per-cent of the children younger than age 6 years; children ages 6–11 yearswere permitted to report their own intake but only 55 percent did so, withthe remaining respondents either completed by proxy (23 percent) or byboth a child and a proxy (23 percent) (Troiano et al., 2000). Children ages12 years and older typically reported their own dietary intake information(Enns et al., 2002; Troiano et al., 2000).
Huang and colleagues (2004) estimated that 55 percent of children andadolescents in CSFII 1994–1996 and 1998 had reported calorie intakes thatwere not scientifically reliable or plausible. In children with plausible data,calorie intake tended to be overreported for younger children and under-reported more often in obese older children, thereby concluding that it isnecessary to exclude implausible dietary reports to draw dietary associa-tions between children’s dietary intake and BMI percentiles. Experimentalstudies in children and adolescents have shown that mean daily calorieintakes can be underreported by as much as 17 to 33 percent of energyexpenditure and that underreporting tends to increase with age (Bandiniet al., 2003; Champagne et al., 1998). Similar methodological challengesexist for conducting research on children’s physical activity levels (IOM,2005b).
Finding: More accurate methods are needed to assess the dietary intakes ofchildren and youth, including calorie intakes and expenditures.

52 FOOD MARKETING TO CHILDREN AND YOUTH
Nutrient Intakes of Children and Youth
Mean Nutrient Intakes and Changes Between the 1970s and 1990s
Data from different sources on calorie intakes present variable resultsby age and gender. Substantial overall increases were reported in the meancalorie intakes of children and youth from the mid-1970s to the mid-1990s.Average calorie intakes by younger children ages 2–5 years increased by172 calories (Kranz et al., 2004), among adolescent boys by 243 calories(Enns et al., 2003), and among adolescent girls by approximately 113 calo-ries (Enns et al., 2003). Detailed data on the nutrient intakes of differentracial/ethnic groups is limited; thus, there is a need to be cautious whenextrapolating the results to the various groups of U.S. ethnic minoritychildren and youth.
Finding: Total calorie intake appears to have increased substantially overthe past 25 years for preschool children and adolescent boys and girls, withmore modest changes for children ages 6–11 years.10
Trends in percentage of calorie intake of specific foods and beverages inU.S. children and adolescents, ages 2–18 years, are available from 1977–1978 to 1994–1996 (Nielsen et al., 2002b). Some foods, such as low- andmedium-fat milk, and medium- and high-fat beef and pork, declined as apercentage of overall calorie intake from 1977–1978 to 1994–1996. Otherfoods and beverages revealed a modest increase in percentage of total calo-rie intake during this period, such as carbonated soft drinks (3 percent to5.5 percent), fruit drinks (1.8 percent to 3.1 percent), candy (1.1 percent to2.1 percent), french fries (1.7 percent to 2.6 percent), and pizza (1.4 per-cent to 3.4 percent) (Nielsen et al., 2002b). In this data analysis, meancalorie intake increased 118 calories (6.4 percent), from 1,840 calories in1977–1978 to 1,958 calories in 1994–1996.
Another analysis of CSFII 1989–1991 data examined major foodsources of nutrients and dietary constituents in 4,008 U.S. children ages2–18 years (Subar et al., 1998). Milk, yeast breads/donuts, beef, and cheesewere ranked among the top 10 sources of total calories, fat, and protein inchildren’s and youths’ diet. Many of the top 10 sources of carbohydratesand fat contributed more than 2 percent each to children’s calorie intake
10Although there are methodological challenges in accurately assessing both calorie intakeand physical activity levels, an in-depth discussion about physical activity is beyond thecommittee’s charge. An extensive discussion of trends in the physical activity of children andyouth, and its relationship to energy balance, may be found in the report, Preventing Child-hood Obesity: Health in the Balance (IOM, 2005b).

HEALTH, DIET, AND EATING PATTERNS OF CHILDREN AND YOUTH 53
(Subar et al., 1998; Appendix D, Table D-6). Carbohydrate sources includeyeast breads, soft drinks, sodas, milk, ready-to-eat (RTE) cereals, cakes/cookies/quick breads/donuts, sugars/syrups/jams, fruit drinks, pasta, andwhite potatoes. Fat sources include milk, cheese, cakes/cookies/quick breads/donuts, potato chips/corn chips, and ice cream/sherbet/frozen yogurt. Basedon this analysis, low-nutrient foods are a significant contributor to the totalcalorie, fat, and carbohydrate intake of children and youth (Subar et al.,1998). These results were confirmed in a more recent analysis of NHANESIII and NHANES 1999–2000 that examined foods and food groups con-tributing the most to population intake of calories (Block, 2004). Althoughthe analysis did not report percentage of calorie intake by age, it found thatthe top 10 food items that contributed the most to calorie intake in theentire U.S. population were high-calorie, low-nutrient foods and beverages(e.g., sweets and carbonated soft drinks), which contributed nearly onethird of all the calories consumed (Block, 2004; Appendix D, Table D-7).
Finding: Children and youth consume a large proportion of their totalcalories from foods and beverages that are of high-calorie and low-nutrientcontent.
Obesity may develop from a relatively small excess of daily caloriesconsumed (e.g., 50 to 100 calories/day) versus calories expended overseveral months and years (IOM, 2005b). Both excessive calorie intakeand physical inactivity are likely contributors to the calorie imbalancethat leads to obesity. Further study is needed on the relative contributionto childhood obesity of excess calorie intake versus insufficient calorieexpenditure (IOM, 2005b).
NFCS and CSFII data indicate changes in the macronutrient sources ofcalories for children (6–11 years) and adolescents (12–19 years) over time,suggesting a possible decrease in the gram (g) amounts of fat and proteinand an increase in the gram amounts of carbohydrate (Enns et al., 2002,2003) with associated changes in the percentage of calorie intake fromprotein, fat, and carbohydrates (Appendix D, Table D-5) (Enns et al., 2002,2003).
Carbohydrate intake increased both in total amount and as a percentof calories for boys, ages 6–11 years, from 226 g in 1977–1978 to 280 gin 1994–1996 and 1998 (representing an increase from 46.8 percent to54.8 percent of carbohydrates as a percent of total calories) and for girls,ages 6–11 years, an increase from 212 g in 1977–1978 to 250 g in 1994–1996 and 1998 (representing an increase from 47.4 percent to 54.9 per-cent of carbohydrates as a percent of total calories) (Enns et al., 2002).An analysis of the same data showed similar increased trends in carbohy-drate intake for adolescent boys, ages 12–19 years, from 279 g in 1977–

54 FOOD MARKETING TO CHILDREN AND YOUTH
1978 to 366 g in 1994–1996 and 1998 (representing an increase from44.6 percent to 53.2 percent of carbohydrates as a percent of total calo-ries) and for girls, ages 12–19 years, an increase from 45.4 g in 1977–1978 to 55 g in 1994–1996 and 1998 (representing an increase from45.4 percent to 55 percent of carbohydrates as a percent of total calories)(Enns et al., 2002).
Finding: Carbohydrate intake has increased substantially among childrenand youth over approximately the past two decades.
Total fat intake of children and adolescents was 38–40 percent ofcalories in 1977–1978 (Enns et al., 2002, 2003). Based on data fromCSFII 1994–1996 and 1998, total fat intake in children and adolescents(ages 6–18 years) was 32 percent of calories (Enns et al., 2002, 2003).Only an estimated 25 percent of children and adolescents had usual totalfat intakes that were 30 percent of energy or less (Gleason and Suitor,2001). Non-Hispanic black adolescents had slightly higher fat intakes(36 percent of calories) than non-Hispanic white adolescents (33 percentof calories) and Mexican American adolescents (34 percent of calories)(Troiano et al., 2000).
Another study based on CSFII 1994–1996 and 1998 showed a declinein fat and saturated fat intake as a percentage of calories for youngerchildren (ages 2–5 years) (Kranz et al., 2004). Fat intake decreased from36 percent of calories in 1977–1978 to 32 percent of calories in 1994–1996and 1998, and saturated fat intake decreased from 14 percent of calories to12 percent. However, the absolute amount of fat intake (measured bygrams/day) in younger children increased slightly (Kranz et al., 2004). Al-though children and youth may have reduced their fat intake and saturatedfat intake over the past 25 years, a large proportion still consume amountsthat exceed recommended levels.
Mean intakes of cholesterol ranged from 257 mg in younger children(ages 2–5 years) to 340 mg in youth (ages 12–19 years) in NHANES I, andintakes were highest in adolescent boys (411 mg) (Troiano et al., 2000).The higher cholesterol intake in adolescent boys is consistent with theirhigher calorie intake. Cholesterol intakes declined consistently betweenNHANES I, II, and III across all age, race, and sex groups to 193–211 mg,except for adolescent African American boys whose cholesterol intake re-mained at about 355 mg.
Of the vitamins and minerals reported in NFCS 1977–1978 and CSFII1994–1996 and 1998, the mean intake of vitamin B12 decreased signifi-cantly; thiamin and iron increased; and calcium, phosphorus, magnesium,and vitamin A did not change for children or adolescents (Enns et al., 2002,2003; Appendix D, Table D-5). Intakes of vitamin C, riboflavin, niacin,
HEALTH, DIET, AND EATING PATTERNS OF CHILDREN AND YOUTH 55
and vitamin B6 either increased or did not change significantly, dependingon age and sex. The nutrient intakes of girls did not appear to differappreciably between 6- to 11-year-olds and 12- to 19-year-olds, except for8 percent lower riboflavin and 10 percent lower calcium intakes in adoles-cents despite a higher calorie intake. Vitamin and mineral intakes for ado-lescent boys were higher than for the younger boys, and were most likelyrelated to the overall higher calorie intake of older boys. Iron intakes inyounger children (ages 2–5 years) increased between 1977–1978 and 1994–1996 and 1998 from 9.9 mg to 12.3 mg (Kranz et al., 2004).
Sodium intake data from the NHANES series reveal an increase inmean intake among all age groups of children and adolescents between1971–1974 and 1999–2000 (Briefel and Johnson, 2004; Appendix D, Ta-ble D-8). For example, sodium intake in older adolescent boys (ages 16–19 years) increased 34 percent between 1971–1977 and 1999–2000 from3,219 mg to 4,415 mg. Mean intakes increased 32–36 percent for children(ages 3–11 years) and younger adolescent boys (ages 12–15 years) and 45–68 percent for adolescent girls (ages 12–19 years). Assessment of sodiumintakes and trends is difficult because sources include salt added in cooking,salt added at the table, and processed foods, and there are uncertaintiesassociated with the exact sodium content of each source. Nonetheless in-creased consumption of processed foods and a greater frequency of eatingaway from home have contributed to the increased sodium intakes ob-served over the past three decades.
Nutrient Intakes Compared with the Dietary Reference Intakes andDietary Guidelines
Usual nutrient intakes of U.S. children and adolescents (ages 1–18 years)from the dietary interview component of the NHANES 2001–2002 havebeen compared to the DRIs (Moshfegh et al., 2005). In general, less than4 percent of 1- to 8-year-old children had nutrient intakes less than theEAR. Nutrients identified as potential problems in comparison with theEAR for boys and girls ages 9–18 years include vitamin A (13 percent to55 percent),11 vitamin E (80 percent to >97 percent), vitamin C (8 percentto 42 percent), and magnesium (14 percent to 91 percent). Adolescent girlswere at highest risk for having nutrient intakes below the EAR, especiallyfor folate (19 percent), phosphorus (49 percent),12 vitamin B6 (16 percent),zinc (26 percent), and copper (16 percent).
Although the AI cannot be used to estimate the prevalence of inad-
11Lowest and highest percent less than the EAR for the age range.12Also of concern for girls 14–18 years with 42 percent less than the EAR.

56 FOOD MARKETING TO CHILDREN AND YOUTH
equate nutrient intakes in a group, the prevalence of inadequacy should below if at least 50 percent of a group has intakes greater than the AI. Morethan 50 percent of 1- to 8-year-olds had calcium intakes above the AI, butless than 5 percent of 9- to 18-year-old girls had usual calcium intakesabove the recommended AI. The difference between the younger childrenand older girls is related primarily to the difference in the calcium AI valuesfor the two age groups (800 mg for 4- to 8-year-olds versus 1,300 mg for 9-to 18-year-olds), but is also related to the lower calcium intakes observed inadolescent girls. Only 6 percent of girls, ages 9–13 years, and 9 percent ofgirls, ages 14–18 years, had calcium intakes greater than the AI (Moshfeghet al., 2005).
Other analyses of foods indicate that dairy foods and ingredients con-tribute more than 60 percent of the dietary calcium, nearly 25 percent oftotal fat, 39 percent of saturated fat, and 31 percent of cholesterol to thetotal dietary intakes of children and adolescents from birth to 19 years ofage (Weinberg et al., 2004). Several studies have demonstrated that higherintakes of total dairy and milk are not only associated with increases in theintake of calcium but also often with significant increases in other essentialnutrients, including magnesium, potassium, zinc, iron, vitamin A, ribofla-vin, and folate (Subar et al., 1998; Weinberg et al., 2004).
An analysis of calorie intakes in relation to the EER was not available.An older analysis compared calorie intakes with the 1989 RecommendedEnergy Allowances (REA) (NRC, 1989). Calorie intakes were above theREA for more than half the children, but technically below the REA for theremainder of the children studied (Suitor and Gleason, 2002). Factors dis-cussed earlier that may explain why such a large proportion of childrenwere below the REA include underreporting of food intake, a level ofphysical activity that is below the REA, or a combination of both factors(Suitor and Gleason, 2002). Additionally, the REA for children and adoles-cents was based on a theoretical estimation of total energy expenditure fora defined activity pattern rather than on measured energy expenditure. As aresult the 1989 REA levels were based on a low to moderate activity levelthat is higher than the EER calculated for a sedentary activity level for thesame age groups reported in the DRI report on macronutrients (IOM,2002–2005) (Figure 2-2). The differences between the REA and EER sug-gest that children’s calorie needs were overestimated from the 1970s to2002. Some have suggested that decreased physical activity was likely moreimportant than increased calorie intake as a contributor to the increase inobesity prevalence (Troiano et al., 2000). If children and adolescents weremore sedentary over the past 20–30 years, then their REA levels shouldhave been adjusted accordingly to account for the lower energy expenditurelevels.
The current EER allows calorie requirements to be calculated based on

HEALTH, DIET, AND EATING PATTERNS OF CHILDREN AND YOUTH 57
FIGURE 2-2 Recommended Energy Allowances (REA) compared with EstimatedEnergy Requirements (EER) for U.S. children and adolescents, ages 1–18 years,1989 and 2002.NOTE: The REA for girls and boys, ages 1–18 years, were calculated based on alow to moderate activity level that is higher than the EER calculated for a sedentaryactivity level for the same age groups reported in the DRI report on macronutrients.SOURCES: IOM (2002–2005), NRC (1989).
Girl
s R
EA
Girl
s R
EA
Girl
s R
EA
Girl
s R
EA
Girl
s R
EA
Boy
s R
EA
Boy
s R
EA
Boy
s R
EA
Boy
s R
EA
Boy
s R
EA
Girl
s E
ER
Girl
s E
ER
Girl
s E
ER
Girl
s E
ER
Girl
s E
ER
Boy
s E
ER
Boy
s E
ER
Boy
s E
ER Boy
s E
ER B
oys
EE
R
0
250
500
750
1000
1250
1500
1750
2000
2250
2500
2750
3000
3250
1-3 4-6 7-10 11-14 15-18Age (years)
Ene
rgy
(Cal
orie
s/D
ay)
several different physical activity levels and the corresponding DRI reportprovides guidance for using the EER to maintain body weight, to preventweight gain, and assess intake in individuals and groups (IOM, 2002–2005).
A total fat intake of 30–40 percent of calories is recommended forchildren ages 1–3 years and 20–35 percent of calories for ages 4–18 years(IOM, 2002; Appendix D, Table D-2), and saturated fat intakes should beas low as possible—less that 10 percent of calories according to the DietaryGuidelines for Americans (DHHS and USDA, 2005). Data from CSFII1994–1996 found the mean usual intake of saturated fat among school-aged children to be 12 percent of calories (Gleason and Suitor, 2001). Onlyan estimated one-quarter of girls (23 percent) and boys (25 percent) ages 6–11 years and about one-third of girls (34 percent) and boys (28 percent)ages 12–19 years had saturated fat intakes less than 10 percent of calories(USDA, 1999).

58 FOOD MARKETING TO CHILDREN AND YOUTH
Based on percent of calories, the majority of children and adolescentsages 6–18 years met the intake recommendations for total fat (74 percent)and saturated fat (53 percent) during breakfast; however many fewer chil-dren met the recommendations (24 percent and 21 percent, respectively)during their lunch meals (Gleason and Suitor, 2001). Less Hispanic (17 per-cent; 10 percent) and African American (7 percent; 6 percent) children andadolescents achieved intakes within the recommendations for total fat andsaturated fat, respectively, compared to 29 percent and 18 percent of non-Hispanic whites (Gleason and Suitor, 2001). The overall mean saturated fatintake reported in NHANES III (1988–1994) also was 12 percent of calo-ries, varied little by sex and age, and displayed no consistent pattern by raceor ethnicity (Troiano et al., 2000). Data from 1988–1994 showed an im-provement in that about one-quarter of individuals under age 20 years hadsaturated fat intakes less than the recommended 10 percent of total calories(Carriquiry et al., 1997).
Similar to saturated fats, the intake of trans fatty acid should be kept aslow as possible within the context of a nutritionally adequate diet (DHHSand USDA, 2005; IOM, 2002). Trans fatty acid intakes estimated fromfood intake data reported in CSFII 1989–1991 was 2.6 to 2.8 percent ofcalorie intake for children and adolescents ages 3–19 years (Allison et al.,1999). Approximately 80 percent of trans fatty acid intake in the U.S. dietis attributed to partially hydrogenated vegetable oil, which is used in prod-ucts such as cakes, cookies, crackers, pies, and breads; margarine; friedpotatoes; and potato chips, corn chips, and popcorn. Trans fatty acids alsooccur naturally in animal products, which account for 20 percent of intake.
Cholesterol intake also should be as low as possible within the contextof a nutritionally adequate diet (IOM, 2002) with less than 300 mg/dayrecommended by the Dietary Guidelines for Americans (DHHS and USDA,2005). Mean and median cholesterol intakes from NHANES III (1988–1994) were below 300 mg/day, except for adolescent boys (Troiano et al.,2000); between 50 to 75 percent of individuals under age 20 years hadmean intakes below 300 mg/day (Carriquiry et al., 1997). Data from CSFII1994–1996 and 1998 indicate that at least 80 percent of children andadolescents ages 6–19 years had cholesterol intakes below 300 mg, exceptadolescent boys, 56 percent of whom achieved desirable intakes below300 mg/day (USDA, 1999).
Finding: Total fat and saturated fat intakes among children and youthremain at levels that exceed dietary recommendations.
A fiber intake of 14 g/1,000 calories is recommended as adequate(IOM, 2002). This translates to a daily total fiber intake of 19 to38 grams for children and adolescents depending on age and sex (Ap-
HEALTH, DIET, AND EATING PATTERNS OF CHILDREN AND YOUTH 59
pendix D, Table D-2). However, mean dietary fiber intakes based onCSFII 1994–1996 and 1998 were 12–13 g for girls and 14–17 g for boys(Enns et al., 2002, 2003), suggesting that most children and adolescentsare not consuming recommended amounts of dietary fiber. In this samesurvey, with the exception of vitamin B12 and calcium, nutrient and foodgroup consumption was better in younger children ages 2–5 years whoconsumed higher levels of dietary fiber, indicating a higher quality diet(Kranz et al., 2005a).
There is no DRI for added sugars13 because there was insufficient evi-dence to set a UL (IOM, 2002–2005). However, the suggested limit foradded sugars is that they should not exceed 25 percent of total calories toensure adequate micronutrient intakes (IOM, 2002–2005, 2005). The 2005Dietary Guidelines for Americans recommend that consumers choose andprepare foods and beverages with little added sugars, in amounts suggestedby the USDA food guidance system, MyPyramid, and the DASH EatingPlan (DHHS and USDA, 2005). The actual amount of added sugars that isconsistent with these eating plans varies and depends on total calorie intakeand the amount of discretionary fat14 consumed. The FGP suggested thefollowing daily amounts of added sugars intake: 6 teaspoons for a 1,600-calorie diet, 12 teaspoons for a 2,200-calorie diet, and 18 teaspoons for a2,800-calorie diet; these amounts are approximately 6, 9, and 10 percent ofcalories, respectively (USDA, 1996). A recent analysis that joined data fromCSFII 1994–1996 and 1998 and from the U.S. sweetener supply and utiliza-tion information indicate that sweetener consumption varies with age(Haley et al., 2005). At an average of over 135 pounds per year, adolescentboys and girls, ages 12–19 years had the highest per capita sweetener con-sumption (including refined sugar and corn sweeteners) compared toyounger children and adults (Haley et al., 2005). USDA dietary intake andsurvey data show that on average, older children ages 6–11 years consumed21–23 teaspoons per day of added sugars in diets that provided 1,800–2,000 calories, adolescent girls ages 12–19 years consumed 23 teaspoons inan 1,800-calorie diet, and adolescent boys consumed 34 teaspoons in a2,700–calorie diet (Enns et al., 2002, 2003). These amounts of added sug-ars provided approximately 20 percent of total calorie intake. Only 28 per-
13Added sugars, also known as caloric sweeteners, are sugars and syrups that are added tofoods at the table or during processing or preparation, which supply calories but few or nonutrients.
14Discretionary fat is the amount of dietary fat remaining in a child’s or adolescent’s“energy” allowance after consuming sufficient amounts of high-nutrient foods to meet one’senergy and nutrient needs while promoting a healthy weight gain trajectory. Examples ofdiscretionary fat include the fat in higher fat meats and dairy products, butter, shortenings,and hard margarine.

60 FOOD MARKETING TO CHILDREN AND YOUTH
cent of younger preschoolers and 21 percent of older preschoolers hadadded sugar intakes below 10 percent of total calories; 11 percent and12 percent, respectively, had intakes greater than 25 percent of calorieswhich is the maximal intake level (Kranz et al., 2005b).
Data comparing the sugar consumption of 743 sixth graders, ages 11–13 years, who had purchased and consumed school lunches in middle schoolcafeterias in Kentucky found that the mean sugar intake for students con-suming only the school lunch was 14.1 g, whereas students consuming oneor more food items in addition to the school lunch had a mean sugar intakeof 30.7 g (Templeton, 2005; Templeton et al., 2005). Chapters 3 and 6have a more extensive discussion about such supplemental or “competi-tive” foods.
Finding: Most preschool children consume added sugars well above sug-gested limits, and older children and adolescents consume about double thesuggested limit of added sugars in their diets.
Adequate intakes of potassium for children and adolescents rangefrom 3,000 mg/day (ages 1–3 years) to 4,700 mg/day (ages 14–18 years)(DHHS and USDA, 2005; IOM, 2005a). Virtually all children and ado-lescents ages 4–19 years had a potassium intake that exceeded their AI(Moshfegh et al., 2005).
The AI for sodium in children and adolescents ranges from 1,000 mg(1–3 years) to 1,500 mg (9–18 years), and the UL ranges from 1,500 mg(1–3 years) to 2,300 mg (14–18 years) (IOM, 2005a). An intake of lessthan 2,300 mg is recommended by the Dietary Guidelines for Americans(DHHS and USDA, 2005). However, according to data from NHANES III(1988–1994), mean sodium intakes ranged from 2,114 mg (ages 1–3 years)to 4,598 mg (adolescent boys ages 14–18 years) (Briefel and Johnson,2004). All of the children and adolescents—100 percent—ages 4–18 yearsexceeded the AI for sodium (IOM, 2005a; Appendix D, Table D-8). Ap-proximately 75 percent (children ages 4–6 years and adolescent girls ages14–18 years) to more than 91 percent (adolescent boys ages 14–18 years)had sodium intakes greater than 2,300 mg/day (Briefel and Johnson, 2004).In general, non-Hispanic whites, non-Hispanic blacks, and Mexican Ameri-cans consume similar amounts of dietary sodium (DHHS, 2000a). Theestimates of sodium intake did not include discretionary intake—what chil-dren and adolescents added to their meals at the table. Mean sodium in-takes reported in NHANES 1999–2000 are even higher than NHANES III(1988–1994) for children ages 1–2 years and 6–11 years; however intakesseem to decline slightly for all other age groups during that time period(Briefel and Johnson, 2004; Appendix D, Table D-8).

HEALTH, DIET, AND EATING PATTERNS OF CHILDREN AND YOUTH 61
Finding: Mean sodium intake of children and youth has increased over thepast 35 years, and the majority of children and adolescents are consumingsodium in greater amounts than recommended levels.
Dietary Supplement Use
Although essential nutrients can be obtained from a balanced diet,many individuals take dietary supplements. NHANES III (1988–1994) col-lected data on supplement use for all individuals including children (ages2 months–11 years) and adolescents (ages 12–19 years). About 40 percentof children and 25 percent of adolescents took some type of supplement(Ervin et al., 2004). Of those taken, multivitamins plus vitamin C (47 per-cent) was the leading supplement reported for children, followed by multi-vitamins/multiminerals (13 percent), multivitamins plus iron (10 percent),vitamin C (7 percent), and multivitamins plus fluoride (6 percent). Thesupplements reported by adolescent boys included vitamin C (24 percent);multivitamins/multiminerals (21 percent); multivitamins plus vitamin C(17 percent); supplements such as herbs, botanicals, and sport drinks (8 per-cent); and all other supplements such as single vitamins or minerals (29 per-cent). Those reported by adolescent girls included multivitamins/multi-minerals (23 percent), multivitamins plus vitamin C (20 percent), vitamin C(16 percent), iron (6 percent), vitamin E (5 percent), and a mixture of as-sorted other supplements (30 percent). The contribution of dietary supple-ments usually is not included in past assessments of nutrient intakes fromdietary survey data.
Dietary Intake and Eating Pattern Trends
Mean Food Intakes and Changes Between the 1970s and 1990s
Children’s and adolescents’ nutrient intakes reflect their food and bev-erage choices, which have changed substantially over time. In general, therehave been increases in consumption of sweetened carbonated soft drinks,noncitrus juices/nectars, and fruit drinks/ades; grain mixtures such as pastawith sauces, rice dishes, and pizza; salty snacks; fried potatoes; candy; low-fat and skim milk; and cheese. Intakes have decreased for total milk andwhole milk; yeast breads and rolls; green beans, corn, peas, and lima beans;and beef and pork (Enns et al., 2002, 2003). For younger children (ages2–5 years) between 1977 and 1998, the percentage of total calories fromadded sugars increased during the same time period (Kranz et al., 2004).There has been a small improvement in dietary quality since 1977. Pre-schoolers had an increased number of servings of grains, dairy products,juice, and fruits and vegetables, although the types of fruits and vegetables

62 FOOD MARKETING TO CHILDREN AND YOUTH
were not reported (Kranz et al., 2004). The improvements in fruit andvegetable consumption may be marginal. Data from the Feeding Infantsand Toddlers Study (FITS) found that up to one-third of infants and tod-dlers ages 7–24 months did not consume a discrete serving of vegetables;fewer than 10 percent consumed dark green leafy vegetables; and consump-tion of potatoes and starchy vegetables consumption increased with age(Fox et al., 2004; Skinner et al., 2004b). Up to one-third of infants andtoddlers in this age group did not consume a discrete serving of fruit and46–62 percent consumed fruit juice (Fox et al., 2004; Skinner et al., 2004b).
Food Intakes Compared with the Food Guide Pyramid
Although the FGP was updated and replaced with MyPyramid in 2005,a comparison of intakes with FGP servings still provides a general picture offood consumption patterns. In CSFII 1994–1996 and 1998, less than halfof children ages 6–11 years consumed the number of servings recom-mended by the FGP for any one food group (Enns et al., 2002; USDA,1996). In CSFII 1994–1996 and 1998, less than half of children ages 6–11 years consumed the number of servings recommended by the FGP forany one food group (Enns et al., 2002; USDA, 1996). On average, childrenin this age group consumed only one serving of whole grains per day,compared to the recommended three servings per day (DHHS and USDA,2004); 80 percent did not meet the recommended servings for vegetables orlegumes; and about a quarter met the recommendation for fruit intake(Enns et al., 2002). These dietary patterns contribute to the reported lowdietary fiber, potassium, and magnesium intakes. Only 29 percent of girlsand 40 percent of boys ages 6–11 years consumed the recommended dailyservings of dairy products, which explains the low calcium intakes in thisgroup (Enns et al., 2002). Twelve percent of girls and 21 percent of boysconsumed the recommended servings from the meat and meat alternativesgroup, but this may reflect methodological problems with assessing themeat content of meals such as casseroles in which overall protein intake isadequate (Enns et al., 2002). Low intakes of nuts, dark green leafy veg-etables, and vegetable oils account for children’s low vitamin E intakes.While overall reported energy intakes were below the REA, children ages6–11 years had intakes of discretionary fat and added sugars that werehigher than levels consistent with the healthy eating pattern suggested bythe FGP. These food intake patterns reveal that children are not achievingoptimal diet quality and nutrient density.
Similar proportions of adolescents (ages 12–19 years) as younger chil-dren consumed the recommended servings of whole grains, vegetables, andlegumes, and had intakes of discretionary fat and added sugars that ex-ceeded the FGP healthy eating pattern (Enns et al., 2003). Fewer adoles-

HEALTH, DIET, AND EATING PATTERNS OF CHILDREN AND YOUTH 63
cents than children consumed the recommended servings of fruits (18 per-cent of adolescent girls and 14 percent of adolescent boys) and dairy prod-ucts (12 percent of adolescent girls and 30 percent of adolescent boys),whereas a slightly higher percentage consumed the recommended servingsof meat and meat alternatives (22 percent of adolescent girls and 44 percentof adolescent boys) (Enns et al., 2003).
Dietary quality scores for intakes of grains (8–9), fruits and vegetables(6–7), and dairy products (6) by younger children in CSFII 1994–1996 and1998 were below the maximum possible for each group (10), and theamount of fruit juice consumed exceeded recommendations by the AAP byapproximately one 6-ounce (oz) serving (Kranz et al., 2004).15 In general,younger preschoolers (ages 2–3 years) had better dietary quality scores thanolder preschoolers (ages 4–5 years).
Finding: Over the past decade, most children and youth have not met thedaily recommended servings for vegetables, fruits, or whole grains.
Low-Nutrient Foods
Dietary calorie density is the calorie content in a given weight of food(calories/gram) and influences the calorie intake of individuals (Ledikweet al., 2005). Low-nutrient foods contribute a relatively low amount ofessential nutrients when expressed per serving or calorie content. Low-nutrient foods are high in calorie density; they include fats, oils, and sugars(e.g., sweets and confectionery), desserts (e.g., ice cream, puddings, cheese-cakes, pastries, cookies, cakes, pies), and salty snacks (e.g., potato, corn,tortilla chips), which are included in the dairy or grain groups of the FGP(Kant, 2004; Kant and Graubard, 2003). Carbonated soft drinks are low innutrient density but are not particularly calorie dense because of their highwater content. Fruits and vegetables are relatively nutrient dense, but notcalorie dense, because of their high water content (Rolls et al., 2004).
Low-nutrient foods contributed more than 30 percent of daily caloriesto the diets of children and adolescents ages 8–18 years who participatedin NHANES III (1988–1994) (Kant and Graubard, 2003). Of the low-nutrient foods, sweets (e.g., sugar, syrup, candy, carbonated soft drinks)and desserts (e.g., cookies, cakes, ice cream) accounted for nearly 25 per-cent of total calorie intake (Kant and Graubard, 2003; Figure 2-3). The
15The AAP has recommended not giving fruit juices to infants less than 6 months of age,and limiting 100 percent fruit juice consumption to one serving (4–6 oz/day) for children ages1–6 years, and two servings (8–12 oz/day) to children and youth ages 7–18 years (AAP,2001).

64 FOOD MARKETING TO CHILDREN AND YOUTH
FIGURE 2-3 Percentage of daily calories from low-nutrient food subgroups forU.S. children and adolescents, ages 8–18 years, from National Health and Nutri-tion Examination Survey (NHANES) III, 1988–1994.SOURCE: Kant and Graubard (2003).
0
5
10
15
20
25
30
35
All LN Foods Sweeteners Desserts Visible Fats Salty Snacks Miscellaneous
% D
aily
Ene
rgy
from
Low
-Nut
rient
Foo
ds
Boys 8-12 y Boys 13-18 y Girls 8-12 y Girls 13-18 y
Food subgroups
reported number of low-nutrient foods was positively related to total calo-rie intake and the percentage of calories from carbohydrate and fat, andwas negatively related to the intakes of fiber, vitamins A and B6, folate,calcium, magnesium, iron, and zinc. The strongest negative predictor ofthe reported number of low-nutrient foods was the amount of nutrient-dense foods consumed from the five major food groups (Kant andGraubard, 2003). Weekly consumption of a complete school lunch alsowas a negative predictor, whereas the number of reported eating occasionswas a positive predictor.
Stated another way, those children who consumed fewer low-nutrientfoods had better quality diets as reflected by fewer eating occasions re-ported, eating school lunch more regularly, and consuming more foodsfrom the major food groups. Gender- and age-adjusted BMI, sociodemo-graphic and family characteristics, and the reported hours spent in physicalactivity or watching television were not associated with the number of low-nutrient foods reported. The data suggest that increased access and avail-ability of nutrient-dense foods and decreased access to low-nutrient foodsin schools, homes, and other places will moderate low-nutrient food andcalorie intake.
Increasing added sugars intake in younger children ages 2–5 years fromCSFII 1994–1996 and 1998 was associated with decreasing intakes of sev-

HEALTH, DIET, AND EATING PATTERNS OF CHILDREN AND YOUTH 65
eral micronutrients (e.g., calcium, iron, folate, and vitamins A and B12) andfood groups (e.g., grains, vegetables, fruits, and dairy), and increasing pro-portions of children with intakes below the EAR or decreasing proportionabove the AI for selected nutrients (Kranz et al., 2005b). Younger childrenat the lowest level of added sugars intake (<10 percent of total calories)consumed approximately one serving more of grains, fruits, and dairy com-pared to those in the highest added sugar intake group (>25 percent of totalcalories). Approximately 75 percent of younger preschoolers (ages 2–3 years) and 50 percent of older preschoolers (ages 4–5 years) had calciumintakes above the AI with added sugar intakes of 16–25 percent of totalcalories; 60 percent and 30 percent of younger and older preschoolers, re-spectively, had calcium intakes above the AI when added sugars exceeded25 percent of total calories.16 The main sources of added sugars were fruitdrinks (19–20 percent), sweetened carbonated soft drinks (14–16 percent),and high-fat desserts (15–16 percent).
Beverages
The potential calorie and nutrient composition of beverages in the dietsof children and youth have important implications for diet-related healthrisks such as obesity and osteoporosis. Data from the national dietarysurveys indicate that beverage consumption habits have changed for chil-dren and adolescents over the past 35 years. Between 1965 and 2001, theintake of sweetened beverages (e.g., carbonated soft drinks and fruit drinks)by children and adolescents ages 2–18 years increased and milk decreased—whether expressed as percentage of per capita total calorie intake, percent-age of consumers, mean servings per day, or mean portions (Cavadini et al.,2000; Nielsen and Popkin, 2004; Appendix D, Table D-9). Milk consump-tion decreased from 13.2 percent of total calories in 1977–1978 to 8.3 per-cent in 2001 for children and youth ages 2–18 years (Nielsen and Popkin,2004). During this same time period, soft drink consumption in this agegroup increased from 3 to 6.9 percent, and fruit drink consumption in-creased from 1.8 to 3.4 percent (Nielsen and Popkin, 2004).
The decline in total milk consumption over time by children (ages 6–11 years) and adolescents (ages 12–19 years) is related to a decline in theconsumption of whole milk that is not offset by a commensurate increase inconsumption of low-fat milk and skim milk (Enns et al., 2002, 2003). From1965 to 1996, low-fat milk replaced higher-fat milk intake in 11- to 18-
16As noted previously, although the AI cannot be used to estimate the prevalence of inad-equate nutrient intakes in a group, the prevalence of inadequacy should be low if at least50 percent of a group has intakes greater than the AI.

66 FOOD MARKETING TO CHILDREN AND YOUTH
year-olds, yet total milk consumption decreased by 36 percent, and wasaccompanied by a three-fold increase in the consumption of sweetenedcarbonated soft drinks and a two-fold consumption of fruit-flavored bever-ages (Cavadini et al., 2000; Huang and McCrory, 2005; Figure 2-4).
A recent study of more than 3,000 children and youth ages 2–18 yearsusing NHANES 1999–2000 data found that sweetened beverages providedapproximately 13 percent of adolescents’ total caloric intake and repre-sented the single leading source of added sugars in adolescents’ diets(Murphy et al., 2005). The study also found that the consumption of car-bonated soft drinks and sweetened fruit drinks increased and milk de-creased in a step-wise direction as children aged (Murphy et al., 2005).
Diet carbonated soft drinks and water consumption have not beensystematically evaluated in national consumption surveys for children andyouth, although databases are available to assess nutrient availability percapita of beverages by nationally representative samples of U.S. householdpurchases. Understanding the beverage choices made by households is im-portant to assess the contribution of caloric beverages to total calorie in-take. A USDA analysis used the 1999 ACNielsen Homescan ConsumerPanel, which tracked household purchases of beverages over an entire year,to assess the nutrient availability for nonalcoholic beverages consumed athome. The analysis reflected only the purchasing patterns of householdsand the total household availability of nutrients, and did not disaggregatethe findings into intrahousehold differences (Capps et al., 2005). However,
334 374
584
862
174 177 191
330
1012
901
667614
0
200
400
600
800
1000
1200
1965 1977 1989 1996Year
Soft drinks Fruit drinks Total milk
gram
s/da
y
FIGURE 2-4 Trends in milk consumption versus carbonated soft drinks and fruit-flavored beverage consumption in U.S. adolescents, ages 11–18 years, 1965 to 1996.SOURCES: Cavadini et al. (2000); Huang and McCrory (2005).

HEALTH, DIET, AND EATING PATTERNS OF CHILDREN AND YOUTH 67
the analysis found that the average available calcium, vitamin C, and caf-feine intakes from nonalcoholic beverages per person per day were lower inhouseholds with children younger than 6 years, ages 6–12 years, and 13–17 years (Capps et al., 2005). Additionally, households with children ages13–17 years had higher daily available calorie intakes per person than didhouseholds with no children, though the analysis was unable to identify thereasons for this observation (Capps et al., 2005).
Data from the National Family Opinion Research/Beverage Unit’s Shareof Intake Panel (SIP) show positive trends in beverage consumption byyounger children (ages 1–5 years) during the periods of 1987–1988, 1992–1993, and 1997–1998 (Park et al., 2002). There was a decrease in thepercentage of children who consumed carbonated soft drinks (84, 78, and72 percent), powdered soft drinks17 (54, 51, and 45 percent), and tea (33,21, and 17 percent); an increase in those who consumed fruit drinks (53,55, and 61 percent); and no consistent change in juice (77, 77, and 79 per-cent) or milk consumption (94, 95, and 91 percent). There was also adecrease in the daily consumed quantity of carbonated soft drinks (from 5.2to 3.7 oz) and powdered soft drinks (from 4 to 3.5 oz), and an increase inmilk (from 11.6 to 13.5 oz), juices (from 5 to 7 oz), and fruit drinks (from2.1 to 2.9 oz).
The age, gender, and race/ethnicity of children and adolescents affectbeverage consumption patterns (Storey et al., 2004). In CSFII 1994–1996and 1998, milk product consumption in general increased in boys anddecreased in girls between ages 2–3 years and 14–18 years. Boys consumedmore milk products than girls at all ages, with the difference widening asage increased; white boys drank more milk products than African Americanboys at all ages and more than Hispanic/Latino boys ages 4–8 years (Storeyet al., 2004). White girls consumed similar amounts of milk products asHispanic/Latina girls until ages 9–18 years when white girls consumed moremilk products. African American girls consumed fewer milk products thanwhite or Hispanic/Latino girls at all ages. Sweetened carbonated soft drinksand fruit drinks/ades consumption generally increased with age in bothgenders, with boys increasingly consuming more than girls as age increased(Storey et al., 2004). African American children and adolescents generallyconsumed more fruit drinks/ades and less sweetened carbonated soft drinksthan whites (Storey et al., 2004). The amount of diet carbonated soft drinksconsumed was insignificant at ages 2–3 years and increased slightly withage, but was relatively low compared to other beverage sources (Storeyet al., 2004). Similar age and gender patterns in beverage intakes have beenobserved with data from SIP (Park et al., 2002).
17Powdered soft drinks are flavored powders that are reconstituted with water.

68 FOOD MARKETING TO CHILDREN AND YOUTH
Sweetened beverages (as a percentage of total calories in 1994–1996)were consumed by children and adolescents ages 2–18 years mostly at home(3.9 percent), followed by restaurants and quick serve restaurants (QSRs)(1.7 percent), obtained from a store but not eaten at home or ever broughtinto the home (0.7 percent), and vending machines (0.3 percent) (Nielsenand Popkin, 2004). Using a slightly different approach to analyzing thedata, French et al. (2003) also reported an increase in the prevalence ofsweetened carbonated soft drinks consumption and portion size amongyouth—with the largest source of consumption at home, followed by res-taurants and QSRs, other locations (e.g., friends’ homes and entertainmentvenues), school cafeterias, and vending machines. Sweetened beverages werethe largest contributors to added sweeteners in the diets of children andadolescents ages 2–18 years, from 34–52 percent depending on age and sexin 1994–1996 to 35–58 percent in 1999–2000 (Guthrie and Morton, 2000;Murphy et al., 2005). Sweetened beverages represent approximately 10 per-cent of their total calorie intake.
Finding: Sweetened beverage consumption (e.g., carbonated soft drinks andfruit drinks) by children and adolescents has increased considerably overthe past 35 years and is now a leading source of added sugars, especially inadolescents’ diets. The consumption of milk, a major source of dietarycalcium, has decreased among children and adolescents over the same pe-riod, and most have calcium intakes below the recommended adequateintake level.
Breakfast Consumption
Breakfast consumption also has changed over time. In NFCS 1965,90 percent of boys and 84 percent of girls consumed a food, beverage, orboth between 5 am and 10 am compared with 75 percent and 65 percent,respectively, in CSFII 1989–1991 (Siega-Riz et al., 1998). Consumptiondeclined approximately 5 percentage points in younger children, 9 points inolder children ages 8–10 years, and 13–20 points in adolescents. The great-est decline was among adolescent girls ages 15–18 years, who droppedfrom 84 percent in 1965 to 65 percent in 1991. Frequency of breakfastconsumption declines with age. In 1965, African Americans and whites hadsimilar breakfast consumption patterns; however, African American ado-lescents were less likely to consume breakfast by 1989–1991 (Siega-Rizet al., 1998). Data from the National Heart, Lung, and Blood InstituteGrowth and Health Study, a 9-year longitudinal biracial cohort of 2,379girls, found that white girls reported more frequent breakfast consumptionthan African American girls, but the racial differences decreased with age

HEALTH, DIET, AND EATING PATTERNS OF CHILDREN AND YOUTH 69
(Affenito et al., 2005). Beginning in 1977, more children attending school(preschool ages to 14 years) consumed breakfast than those not in school.
Breakfast consumption has been generally associated with higher pa-rental income (Siega-Riz et al., 1998). Eating this meal also has been corre-lated with higher calcium and fiber intakes, and the number of days eatingbreakfast is predictive of lower BMI levels (Affenito et al., 2005). Breakfastfood choices in 1989–1991 generally reflected fewer sources of dietary fat,especially lower consumption of whole milk, eggs, and bacon (Siega-Rizet al., 1998). Regular consumption of fortified RTE cereals with low-fatmilk for breakfast has been correlated with (1) higher nutrient intakes (e.g.,fiber, calcium, iron, folic acid, vitamin C, and zinc) (Barton et al., 2005;Subar et al., 1998), (2) decreased intake of fat and cholesterol (Barton et al.,2005), and (3) lower BMI levels in children ages 4–12 years (Albertsonet al., 2003) and girls ages 9–19 years (Barton et al., 2005).
Finding: Breakfast consumption by children and adolescents has de-creased considerably over the past 40 years and the occurrence of break-fast consumption declines with age. The frequency of breakfast consump-tion is predictive of lower BMI levels in children and adolescents.
Snacking Patterns
An examination of food intakes from NFCS and CSFII revealed anincrease in snacking prevalence across all age groups of children and ado-lescents ages 2–18 years—from 77 percent in 1977–1978 to 91 percent in1994–1996 (Jahns et al., 2001; Figure 2-5). Most of the increase occurredbetween 1989–1991 and 1994–1996. In 1994–1996, younger children (ages2–5 years) and older children (ages 6–11 years), except for Hispanics/La-tinos, were the highest proportion who snacked; slightly more boys thangirls snacked; and more Hispanics/Latinos and whites snacked than AfricanAmericans.
The average size (in grams) or calorie content per snack remainedrelatively constant over time from 1977–1978 to 1994–1996, but thenumber of snacking occasions increased significantly, thereby increasingthe average daily calories from snacks. The size of snacks increased withage during each time period (e.g., from 153 g for ages 2–5 years to 195 gfor ages 6–11 years to 307 g for ages 12–18 years in 1994–1996). Theaverage daily calorie intake from snacks increased over time for all agegroups because the number of snacking occasions increased by about 0.4snacking events per day overall. In 1994–1996, snacks contributed 378calories per day for younger children ages 2–5 years, 462 calories forolder children ages 6–11 years, and 612 calories for adolescents ages 12–

70 FOOD MARKETING TO CHILDREN AND YOUTH
FIGURE 2-5 Trends in prevalence of snacking among U.S. children and adoles-cents, ages 2–18 years.SOURCE: Jahns et al. (2001). Reprinted from Journal of Pediatrics, Jahns L, Siega-Riz AM, Popkin BM, The increasing prevalence of snacking among US childrenfrom 1977 to 1996, Pages 493–498, 2001, with permission from Elsevier.
7976 76
8178 77
9491
88
0
20
40
60
80
100
2-5 6-11 12-18
Per
cent
1977
1989
1996
Age (years)
18 years, representing an estimated 25 percent of total calorie intake(compared to an estimated 20 percent in 1977–1978). The calcium den-sity (mg/1,000 calories) of both meals and snacks decreased over20 years, with the magnitude of decline greater for snacks.
Finding: The prevalence of snacking and number of snacking occasions bychildren and youth have increased steadily over the past 25 years.
Portion Sizes
Although the size of each snack consumed by children and adolescentsover the past 20 years has remained relatively constant (Jahns et al., 2001),the portion size and calorie contribution of selected foods per eating occa-sion did increase based on an analysis of data for all individuals (ages2 years and older) who participated in NFCS 1977–1978, CSFII 1989–1991, and CSFII 1994–1996 and 1998 (Nielsen and Popkin, 2003). Thequantity of salty snacks consumed per eating occasion increased by 0.6 oz

HEALTH, DIET, AND EATING PATTERNS OF CHILDREN AND YOUTH 71
(93 calories), desserts by 0.6 oz (41 calories), carbonated soft drinks by 6.8oz (49 calories), fruit drinks by 3.8 oz (50 calories), hamburgers by 1.3 oz(97 calories), cheeseburgers by 1.5 oz (138 calories), french fries by 0.5 oz(68 calories), and Mexican dishes by 1.7 oz (133 calories). According tothese investigators, the portion size or calorie content of pizza did notchange during the time frame examined. There were no statistically signifi-cant different trends between age groups, and in most but not all cases,portion sizes increased for these foods whether obtained at home or awayfrom home, with the largest portion sizes in 1994–1998 found in QSRs andthe smallest in full serve restaurants (Chapter 3).
When data from CSFII 1989–1991 and CSFII 1994–1996 for foodscommonly consumed (e.g., by 7 percent or more of the population ages2 years and older) were compared, larger portions were reported in 1994–1996 for several foods, including spaghetti with tomato sauce (16 percentincrease in portion size), carbonated soft drinks (16 percent increase), fruitdrinks (16 percent increase), orange juice (12 percent increase), andRTE cereals (9.6 percent increase) (Smiciklas-Wright et al., 2003). Smallerportions were reported for a few foods such as margarine (18 per-cent decrease), mayonnaise (10 percent decrease), chicken (11 percent de-crease), pizza (14 percent decrease), and macaroni and cheese (17 percentdecrease). An increase in portion size was significant for RTE cereals con-sumed by older children ages 6–11 years and adolescent boys ages 12–19 years, fruit drinks and spaghetti with tomato sauce consumed by ado-lescent boys, and carbonated soft drinks consumed by adolescent girls. Adecrease in portion size was significant for chicken consumed by youngerchildren ages 2–5 years and older children ages 6–11 years, french fries byyounger children, and pizza by older children.
Eating Locations and Food Sources
Adolescents ages 12–18 years consumed most of their calorie intakefrom food prepared or obtained at home, but the percentage decreasedbetween 1977–1978 and 1994–1996 (74 versus 60 percent, respectively)(Nielsen et al., 2002b). A higher percentage of calories was consumed fromfoods obtained at full serve restaurants and QSRs (6.5 versus 19 percent)and less at school (11 versus 8 percent). Less than 1 percent of calorieintake was from foods obtained from vending machines at both time peri-ods (0.5 versus 0.9 percent) (Nielsen et al., 2002b). Children ages 2–12 years in 1994–1996 consumed more than two-thirds of their caloriesfrom food obtained or prepared at home (68 percent) (Lin et al., 1999).However, total calorie intake obtained from away-from-home food sourcesincreased for children from 20 percent to 32 percent between 1977–1978and 1994–1996 (Lin et al., 1999). Food obtained by children from schools,

72 FOOD MARKETING TO CHILDREN AND YOUTH
QSRs, and full serve restaurants accounted for 9 percent, 10 percent, and4 percent of total calorie intake, respectively. Similar trends have beenreported overall for children and adolescents ages 2–18 years (Nielsen et al.,2002a,b; Figure 2-6; Chapter 3).
Finding: There has been a steady increase in the proportion of calories thatchildren and youth have received from away-from-home foods over thepast 20 years. Approximately one-third or more of their calories are de-rived from foods purchased outside of the home, nearly one-half of which isobtained at full serve restaurants and quick serve restaurants that containhigher fat content than food consumed at home.
In 1994–1996, food consumed by children and adolescents ages 2–17 years that was prepared away from home, compared to food prepared athome, contained more total fat (36.1 versus 31.6 percent of calories) andsaturated fat (13.2 versus 11.5 percent of calories), and less cholesterol(106 versus 118 mg/1,000 calories), dietary fiber (6.2 versus 6.9 g/1,000calories), calcium (437 versus 474 mg/1,000 calories), and iron (6 versus8.3 g/1,000 calories) (Guthrie et al., 2002). There was no difference in thesodium content (per 1,000 calories) between food consumed at home andfood prepared away from home.
FIGURE 2-6 Trends in energy intake of U.S. children and adolescents, ages 2–18 years, by selected eating location, 1977–1978 to 1994–1996.SOURCE: Nielsen et al. (2002a).
76
511
3 50
71
1510
2 2 0
65
159 6 5
1
0
10
20
30
40
50
60
70
80
90
100
Eating Location
1977-1978 1989-1991 1994-1996
At Hom
e
Resta
uran
t/QSR
Schoo
lsOth
er
Store
/Eat
en O
ut
Vendin
g
% E
nerg
y

HEALTH, DIET, AND EATING PATTERNS OF CHILDREN AND YOUTH 73
Infants and Toddlers
Reports from the national dietary surveys usually provide limited de-tails of the food and nutrient intakes of infants (ages <12 months) andtoddlers (ages 12–24 months). Yet the first 2 years of life are associatedwith a transition from a largely milk-based diet to an increasingly complexdiet that includes a variety of common foods.
As discussed in Chapter 3, food preferences develop early in life andhave been shown to predict consumption habits. Thus, it is important tounderstand the overall nutritional adequacy and nature of the diets con-sumed by infants and toddlers. The 2002 Feeding Infants and ToddlersStudy has provided important information about the nutrient intakes, foodgroup consumption, and meal and snack patterns for a large, nationallyrepresentative, random sample of 3,022 infants and toddlers ages 4 to24 months (Devaney et al., 2004; Fox et al., 2004; Skinner et al., 2004a,b).FITS intake data are based on multiple-pass 24-hour dietary recalls con-ducted with a parent or caregiver.
Nutrient and Calorie Intakes
The usual nutrient intakes, from both foods and dietary supplements,of young (4–6 months) and older (7–11 months) infants exceeded the AI,often with the 10th percentile of usual intake either equaling or exceedingthe AI (Devaney et al., 2004). The estimated prevalence of nutrient inad-equacy for older infants was relatively low for iron (7.5 percent) and zinc(4.2 percent). For toddlers, the prevalence of inadequacy was low (<1 per-cent) for most nutrients, except for vitamin E. More than half (58 percent)of toddlers had vitamin E intakes below the EAR. The mean intakes forcalcium and vitamin D exceeded the AI. The percentages of usual intakesthat exceeded the UL were less than 1 percent for most nutrients. However,a relatively high percentage of toddlers had usual intakes for vitamin A(35 percent) and zinc (43 percent) that exceeded the UL. Overall the datasuggest that the diets of infants and toddlers are nutritionally adequate,with less than 1 percent of total nutrient intakes coming from supplements.The mean, median, and estimated percentiles of the usual calorie intakedistribution all exceeded the comparable EER. The mean usual calorieintake was higher than the mean EER by 10 percent for young infants,23 percent for older infants, and 31 percent by toddlers. Maternal employ-ment status did not influence calorie intake. The mean intakes of fat, carbo-hydrates, and protein of young infants exceeded the AI, as did the meanintakes of fat and carbohydrates for older infants. Thirty-eight percent oftoddlers had fat intakes outside the AMDR: 29 percent had fat intakebelow 30 percent of calories and 9 percent had intakes above 40 percent of
74 FOOD MARKETING TO CHILDREN AND YOUTH
calories. Mean fiber intake for toddlers was 8 g/day, far below the AIof 19 g.
Finding: Calorie intake by infants and toddlers substantially exceeds theirestimated requirements, although validation is needed on the reliability offood intake reporting by parents and caregivers, as well as on body weightestimates.
Food and Beverage Intakes
Food and beverage consumption patterns—reported as the percentageof infants and toddlers who consumed an item at least once in a day—from FITS have been described (Fox et al., 2004; Skinner et al., 2004b).Patterns that have been observed in older children and adults were ob-served in infants as young as 7 months. Up to one-third of infants andtoddlers ages 7–24 months did not consume a discrete serving of a veg-etable (18–33 percent) (Fox et al., 2004). In virtually all age groups,fewer than 10 percent consumed dark green leafy vegetables. Potato,starchy vegetable, and other vegetable consumption increased with age,with french fries or other fried potatoes being the third most consumedvegetable at 9–11 months (8.6 percent), second most consumed at 12–14 months (12.9 percent), and most consumed at ages 15–18 months(19.8 percent) and 19–24 months (25.5 percent) (Fox et al., 2004). Simi-lar to vegetable consumption, up to one-third of infants and toddlers ages7–24 months did not consume a discrete serving of a fruit (23–33 per-cent) and 46–62 percent consumed fruit juice (primarily apple juice).Most toddlers consumed cereals that were not presweetened, but 18–26 percent of toddlers, depending on age, consumed presweetened cereal(defined as 21.2 g of sugar/100 g). The percentage of infants and toddlerswho consumed desserts, sweets, or sweetened beverages increased sharplyafter the age 6 months (from about 10 percent at age 6 months to 91 per-cent by ages 19–24 months). Among older toddlers ages 19–24 months,60 percent consumed a baked dessert (e.g., cake, cookie, pie, or pastry)and 20 percent consumed candy.
Older toddlers primarily drank milk (93 percent), water (77 percent),100 percent fruit juices (62 percent), and fruit drinks (43 percent), and toa lesser extent carbonated soft drinks (12 percent) and other beverages(11 percent) (Skinner et al., 2004b). Many infants and toddlers consumedat least one sweetened beverage each day, infants ages 7–8 months(7.5 percent), toddlers ages 12–14 months (28.2 percent), and older tod-dlers ages 19–24 months (44.3 percent) (Fox et al., 2004). Toddlers, ages12–14 months and 15–18 months, who were in the upper quartile of to-
HEALTH, DIET, AND EATING PATTERNS OF CHILDREN AND YOUTH 75
tal calorie intake, showed a higher consumption of sweetened beverageswhen compared to toddlers in the lower quartile (Briefel et al., 2004).
Beverages, including milks and fruit juices, provided 36 percent of totalcalorie intake for older toddlers, with less than 25 percent of calories com-ing from milks. The calcium density of the diet was negatively associatedwith intake of 100 percent juice, fruit drinks, and carbonated soft drinks.The AAP recommendations for limiting 100 percent juice consumption—age of introduction and amount consumed (to 4–6 oz/day)—were not fol-lowed by a majority of parents.
Finding: Infants and toddlers are consuming diets disproportionately highin sweetened foods and beverages and fried potatoes, and disproportion-ately low in green leafy vegetables.
Meal and Snack Patterns
The median number of daily eating occasions was 7 for infants andtoddlers in FITS, regardless of age, and ranged from 3 to 15 (Skinner et al.,2004a). More than 89 percent ate breakfast, lunch, and dinner, and thepercentage reported to be eating snacks increased with age. More than80 percent of toddlers ages 12–24 months ate afternoon snacks, 66 percentconsumed a morning snack, and slightly more than 50 percent consumedan evening snack. Among toddlers, snacks provided about 25 percent ofdaily calorie intake; typical snacks were milk, water, and crackers but alsofruit drinks, candy, chips, and cookies. Frequent eating occasions are im-portant for infants and toddlers because of their small stomachs and usuallyhigh levels of activity.
Income and Regional-Related Food and Nutrient Patterns
Income and Childhood Obesity
Children who live in poverty experience greater health, social, andnutrition disparities when compared with middle- and high-income chil-dren (DHHS, 2000a, 2003; Evans, 2004; Wise, 2004). In 2002, approxi-mately 11.6 million children (17 percent) under the age of 18 years lived infamilies with incomes below 100 percent of the federal poverty level, andan additional four million children lived in families just above poverty(Federal Interagency Forum on Child and Family Statistics, 2004; Wise,2004). The poverty rate is much higher for ethnic minority children. In2000, 32 percent of African American children and 28 percent of His-panic/Latino children lived in poverty compared to 9 percent of white chil-dren (Federal Interagency Forum on Child and Family Statistics, 2004).

76 FOOD MARKETING TO CHILDREN AND YOUTH
Moreover, less than 70 percent of people living at or above the federalpoverty level have health insurance (DHHS, 2003). Despite evidence docu-menting health disparities by income, including nutrition-related healthdisparities, evidence on the relationship between household income andnutrient intake levels is mixed, and the relationship has varied over time(Devaney et al., 2005).
The prevalence of obesity in children and youth reveals significantdisparities by sex and between racial/ethnic groups (Hedley et al., 2004).As seen in Figure 2-7, NHANES data reveal that non-Hispanic black andMexican-American children and adolescents ages 6–19 years have a greaterprevalence of obesity (with a BMI equal to or greater than the 95th percen-tile of the CDC BMI charts) and are at greater risk of becoming obese(defined as having a BMI between the 85th and the 95th percentile of theCDC BMI charts) than are non-Hispanic whites (Hedley et al., 2004).
Despite the substantial variation in BMI that exists as a function ofboth socioeconomic status and ethnicity based on NHANES III in girls ages6–9 years (Winkleby et al., 1999), and the increase in obesity prevalenceamong African American youth at the lowest income (Strauss and Pollack,2001), uncertainties remain as to whether these rates can be attributed onlyto socioeconomic status because these disparities are not the same acrossethnic groups and they do not emerge at comparable times during child-hood. Also, there is no consensus, albeit many theories, about the mecha-nisms by which they occur. For example, analysis of the data from the1988–1994 NHANES shows that the prevalence of obesity in white adoles-cents is higher among those in low-income families, but there is no clearrelationship between family income and obesity in other age or ethnicsubgroups (Ogden et al., 2003; Troiano and Flegal, 1998). Two analyses ofnationally representative longitudinal data—the National Longitudinal Sur-vey of Youth (Strauss and Knight, 1999; Strauss and Pollack, 2001) and theNational Longitudinal Study of Adolescent Health (Goodman, 1999)—have suggested that family socioeconomic status is inversely related to obe-sity prevalence in children and that the effects of socioeconomic status andrace or ethnicity were independent of other variables.
Food insecurity—the limited or uncertain availability of nutritionallyadequate and safe foods, or the inability to acquire such foods in a sociallyacceptable way—is a significant issue for low-income18 families, especiallyAfrican American and Hispanic/Latino households that experience this con-dition at double the national average rate (Food Research Action Center,2005). In 2004, 38.2 million individuals, including 13.8 million children,
18Low-income is defined as a household income at or below 130 percent of the povertylevel.

77
FIG
UR
E 2
-7Pe
rcen
tage
of
U.S
. ch
ildre
n an
d ad
oles
cent
s w
ho a
re o
bese
or
at r
isk
for
obes
ity
by a
ge,
sex,
and
eth
nici
ty,
1999
–20
02.
SOU
RC
E:
Hed
ley
etal
. (2
004)
.
01020304050
Whites
Blacks
MexicanAmericans
Whites
Blacks
MexicanAmericans
Whites
Blacks
MexicanAmericans
Total
Total
CombinedTotal
Obe
se (B
MI ≥
95
perc
entil
e)A
t Ris
k (8
5 pe
rcen
tile ≥
BM
I ≤ 9
5pe
rcen
tile)
At R
isk
+ O
bese
Cat
egor
y by
Age
Gro
up, S
ex, a
nd E
thni
city
Percentage
Boy
s 2-
5 y
Girl
s 2-
5 y
Boy
s 6-
11 y
Girl
s 6-
11 y
Boy
s 12
-19
yG
irls
12-1
9 y

78 FOOD MARKETING TO CHILDREN AND YOUTH
lived in food-insecure households (an estimated 11.9 percent of all U.S.households), and 3.9 percent (4.4 million) of U.S. households were foodinsecure with hunger (Nord et al., 2005). An estimated 19 percent of allU.S. children and 38 percent of children living in poverty were classified asliving in food-insecure households (Nord et al., 2005).
State-specific prevalence and trends among 2- through 4-year-oldchildren from low-income U.S. families were examined from 1989 to2000. Results showed significant increases in obesity among low-incomechildren in 30 states and significant decreases in childhood underweightin 26 states (Sherry et al., 2004). Although no geographic predominancewas apparent, the number of states reporting obesity prevalence of morethan 10 percent increased from 11 in 1989 to 28 in 2000. Reported un-derweight decreased during the same time frame, as reflected by 9 statesin 1989 and 23 states in 2000 that had a prevalence equal to or less than5 percent (Sherry et al., 2004).
Food insecurity is associated with adverse health outcomes in infantsand toddlers younger than 36 months of age (Cook et al., 2004) and withnegative academic and psychosocial outcomes including depression in olderchildren (Alaimo et al., 2001a, 2002). When compared with higher incomehouseholds that were food insufficient, defined as inadequacy in the amountof food intake because of limited money or resources, low-income foodinsufficient households had more obese children. The available evidenceshows that food insufficiency alone has not been associated with obesityexcept in white girls ages 8 to 16 years (Alaimo et al., 2001b; Casey et al.,2001). Other studies have not been able to show a clear relationship be-tween childhood obesity and food insufficiency or food insecurity afteradjusting for other confounding variables (Kaiser et al., 2002; Mathesonet al., 2002).
Several states have examined the relationship of federal food assistancepolicies and programs to obesity in low-income participants. One analysisof the National Longitudinal Survey of Youth has suggested that long-termFood Stamp Program (FSP) participation was positively associated withobesity in young girls, ages 5–11 years; negatively related to obesity inyoung boys, ages 5–11 years; and not significantly related to obesityin older children (Gibson, 2004). However, the analysis did not control forfood insecurity. Another recent analysis, based on the 1997 Child Develop-ment Supplement to the Panel Study of Income Dynamics, examined theBMI levels of 1,268 children between the ages of 6 and 12 years, andfamilies and children who participated in the National School Lunch Pro-gram (NSLP) or School Breakfast Program (SBP), either for a free, reduced,or subsidized school meal. The sample included children from five familyincome categories: poor, near poor, working class, moderate income, andhigh income. Results found that children in the poorest families were less

HEALTH, DIET, AND EATING PATTERNS OF CHILDREN AND YOUTH 79
likely to be obese and have lower BMI levels than most other children.Children from high-income families were also less likely to be obese. Incontrast, children from families with incomes just above the poverty level—the near poor—are the children at greatest risk for obesity. School mealparticipation was not a determining factor in a child’s risk of obesity(Hofferth and Curtin, 2005). Another published study found that school-aged girls from food-insecure households who participated in the FSP, SBP,and NSLP had a lower risk of becoming obese than their cohorts in food-insecure households who did not participate in food assistance programs(Jones et al., 2003). It cannot yet be concluded whether FSP participationresults in obesity. Further research is needed to understand the mechanismsoperating among poverty, food insecurity, federal food assistance programparticipation, and obesity in children and youth (Frongillo, 2003).
Income and Diet Among Younger Children
Dietary intakes of younger children (ages 2–4 years) in NHANES III(1988–1994) who participated in the Special Supplemental Nutrition Pro-gram for Women, Infants, and Children have been compared to WIC in-come-eligible but nonparticipating children and higher income noneligiblechildren (Cole and Fox, 2004). More WIC children consumed fewer thanthree meals per day than higher income children (16 percent versus 10 per-cent), with fewer consuming breakfast (88 percent versus 94 percent) (Coleand Fox, 2004). WIC children had higher calorie and calcium intakes com-pared to the other two groups; however, all three groups appeared to haveadequate calcium as well as vitamin C, iron, and zinc intakes when com-pared to the DRIs. The diets of children participating in WIC generallywere similar to the diets of income-eligible, nonparticipants and higherincome children. Notable exceptions were higher intakes of calories, totalfat, saturated fat, cholesterol, and sodium compared to the higher incomechildren (Cole and Fox, 2004). Also, the WIC children had higher scoresfor the fruit component of the HEI compared to the income-eligible chil-dren, which suggests that eligible but nonparticipating WIC children hadlower quality diets.
Income and Diet Among School-Age Children
The diets of school-aged children, ages 5–18 years, who participated inNHANES III (1988–1994) have been analyzed based on income status:income at or below 130 percent of poverty (lowest income), income be-tween 131 and 185 percent of poverty (low income), and income higherthan 185 percent of poverty (higher income) (Fox and Cole, 2004). Chil-dren in the lowest income group were eligible for participation in the FSP

80 FOOD MARKETING TO CHILDREN AND YOUTH
and free meals in the NSLP and SBP; those in the low-income group wereeligible for reduced-price meals.
Slightly more children in the lowest income group consumed fewerthan three meals per day than those in the higher income group (39 versus34 percent), and slightly fewer had breakfast (44 versus 48 percent). Only14 percent of children in the lowest income group met the Dietary Guide-lines for total fat (no more than 30 percent of calories) compared to 10 per-cent in the low-income group and 22 percent in the higher income group.The available evidence reveals that compared with the higher incomegroup, slightly more of the lowest income children consumed less thanthree meals per day and did not eat breakfast; they had lower intakes ofcalcium and higher intakes of total fat, saturated fat, and sodium. Few ofthe children had good diets based on the HEI (Fox and Cole, 2004).
The prevalence of iron deficiency19 has decreased in the United States(Sherry et al., 2001). This decrease is attributed in part to the widespreaduse and greater bioavailability of iron-fortified foods and infant formula(IOM, 2005c; Sherry et al., 2001). However, iron deficiency remains anutritional concern for toddlers and younger children, especially low-income and minority children, and adolescent girls (CDC, 2002; DHHS,2000a; IOM, 2005c; Looker et al., 1997). Although iron-deficiency ane-mia is uncommon in the United States, population levels of iron deficiencyexceed the Healthy People 2010 objectives of 5 percent for toddlers,1 percent for younger children, and 7 percent for adolescent girls (DHHS,2000a). Iron-deficiency anemia is associated with low energy levels, re-duced attention span, compromised cognitive performance, developmentaldelays, and poor educational achievement (IOM, 2001; Pollitt, 1993).
Finding: Certain subgroups, such as low-income and minority children andadolescent girls, have inadequate dietary intakes of specific micronutrients(e.g., vitamins D and B6, folate, iron, zinc, and magnesium).
Regional Patterns
The NFCS, CSFII, and NHANES provide dietary information for anationally representative sample of the U.S. civilian, noninstitutionalizedpopulation and were not designed to evaluate specific regional differencesin dietary habits. Other studies have provided insights into regional differ-ences, especially in selected southern states.
19Iron deficiency is defined as an abnormal value for at least two of three indicators (e.g.,serum ferritin, transferrin saturation, and free erythrocyte protoporphyrin) (CDC, 2002).

HEALTH, DIET, AND EATING PATTERNS OF CHILDREN AND YOUTH 81
The Foods of Our Delta Study was a cross-sectional survey of a cultur-ally diverse population residing in the Lower Mississippi Delta region ofArkansas, Louisiana, and Mississippi (Champagne et al., 2004). Calorieintake did not differ between the children ages 3–18 years in the Delta andCSFII 1994–1996 and 1998.20 Average intakes of folate were consistentlyhigher in the Delta children due to the mandatory fortification of enrichedgrain products that occurred between the time of the national survey andthe Delta Study. The average food and nutrient intakes of African Ameri-can children in the Delta region were similar to those of African Americanchildren in the U.S. population, with the only difference being fewer serv-ings of RTE cereals in the Delta region.
However, intakes for white children in the Delta Study were signifi-cantly lower for dietary fiber, vitamin A, carotene, riboflavin, vitamin B6,vitamin C, calcium, and iron than for the white U.S. population, and moresimilar to intakes for African American children both in the Delta regionand nationally—except for vitamin C, which was lower, and calcium, whichwas higher, for whites. Lower intakes of RTE breakfast cereals, fruit, veg-etables, and dairy foods accounted for the lower nutrient intakes of thewhite Delta children. White Delta children had higher added sugar intakesthan those in the U.S. population. Overall the intake of fruits, vegetables,and dairy products was poor for the children in the Delta region—similar tochildren in the U.S. population in general.
Data from the Bogalusa Heart Study21 provide additional insight intodietary patterns of children (ages 10 years) residing in the South, includingtrends from 1973 to 1994. The trends in general are consistent with na-tional trends, with a few notable exceptions. For example, the percentage ofBogalusa children consuming desserts and candy and the mean gramamount consumed, decreased significantly, although they have increasednationally (Nicklas et al., 2004a). Similar to national trends, however, themean amount consumed increased for cheese, salty snacks, and sweetenedbeverages, and decreased for milk. Unlike the national population, though,the increase in overall sweetened beverage intake in Bogalusa was due to anincrease in the amount of tea with sugar consumed, as the amount of fruitdrinks and carbonated soft drinks did not change significantly (Rajeshwariet al., 2005).
Examination of the sweetened beverage data from Bogalusa by tertilesof consumption revealed no significant change in mean consumption be-
20Dietary information in the Foods of Our Delta Study was obtained by methods similar tothose used in CSFII 1994–1996 and 1998 (Champagne et al., 2004).
21A total of 1,548 10-year-old children, attending fifth grade in the Bogalusa, LA, schoolsystem, participated in one of seven cross-sectional surveys from 1973 to 1994 (Nicklas et al.,2004a). Dietary information was collected by a single 24-hour recall.

82 FOOD MARKETING TO CHILDREN AND YOUTH
tween 1973 and 1994 by children in the low tertile (68 g versus 77 g), butan increase for those in the middle (325 g versus 408 g) and high (770 gversus 868 g) tertiles. The total amount of milk consumption was signifi-cantly lower (~20 percent) in the middle and high sweetened beverage con-sumption groups compared to the low or no sweetened beverage consump-tion groups (Rajeshwari et al., 2005).
The percentage of Bogalusa children who skipped breakfast increasedfrom 8 percent in 1973 to 30 percent in 1978, but decreased to 13 percentafter the introduction of the SBP in 1981 (Nicklas et al., 2004b), a levellower than that observed nationally. Also unlike national trends, the per-centage of children consuming snacks as well as total eating episodes de-creased. On the other hand, similar to national trends, the percentage ofBogalusa children consuming a dinner at home decreased and those con-suming a dinner prepared outside the home or a meal at a restaurantincreased.
SUMMARY
The committee’s review of the health, diet, and eating patterns of chil-dren and youth finds several issues and trends relevant to its considerationof the potential for marketing practices to influence these patterns. Chil-dren and youth today face new diet-related health problems that wereunexpected just a generation ago. The increased prevalence of obesity andtype 2 diabetes and the growing incidence of the metabolic syndrome inchildren and adolescents of all ages and across all ethnic groups have thepotential to affect health gains that children have experienced in otherdimensions over the past 30–40 years. Children and adolescents today havehigher than recommended intakes of saturated fatty acids, trans fatty acids,and sodium. Moreover, dietary intakes of calcium, potassium, fiber, mag-nesium, and vitamin E are sufficiently low to warrant concern. Adolescentgirls of childbearing age and low-income toddlers are especially at risk ofinadequate intake of iron. Furthermore, recent trends in child health dis-parities reveal that social disparities persist despite significant improve-ments in absolute levels of child health. Children who live in poverty expe-rience greater health, social, and nutrition disparities when compared withmiddle- and high-income children.
The nutrient intakes of children and adolescents reflect their food andbeverage choices, which have changed substantially over time. A healthfuldiet provides recommended amounts of nutrients and other food com-ponents within estimated calorie needs to promote normal growth anddevelopment, a healthy weight trajectory, and caloric balance. Yet, currentconsumption patterns suggest disproportionately low intakes of fruits, veg-

HEALTH, DIET, AND EATING PATTERNS OF CHILDREN AND YOUTH 83
etables, legumes, whole grains, and dairy products, and disproportionatelyhigh intakes of high-calorie and low-nutrient foods and beverages.
REFERENCES
AAP (American Academy of Pediatrics). 2001. The use and misuse of fruit juice in pediatrics.Pediatrics 107(5):1210–1213.
AAP. 2004. Soft drinks in schools. Pediatrics 113(1):152–154.Affenito SG, Thompson DR, Barton BA, Franko DL, Daniels SR, Obarzanek E, Schreiber GB,
Striegel-Moore RH. 2005. Breakfast consumption by African-American and white ado-lescent girls correlates positively with calcium and fiber intake and negatively with bodymass index. J Am Diet Assoc 105(6):938–945.
AHA (American Heart Association). 2005. Heart Disease and Stroke Statistics—2005Update. Dallas, TX: AHA. [Online]. Available: http://www.americanheart.org/downloadable/heart/1105390918119HDSStats2005Update.pdf [accessed April 23,2005].
Alaimo K, Olson CM, Frongillo EA Jr. 2001a. Food insufficiency and American school-agedchildren’s cognitive, academic, and psychosocial development. Pediatrics 108(1):44–53.
Alaimo K, Olson CM, Frongillo EA Jr. 2001b. Low family income and food insufficiency inrelation to overweight in US children: Is there a paradox? Arch Pediatr Adolesc Med155(10):1161–1167.
Alaimo K, Olson CM, Frongillo EA. 2002. Family food insufficiency, but not low familyincome, is positively associated with dysthymia and suicide symptoms in adolescents. JNutr 132(4):719–725.
Albertson AM, Anderson GH, Crockett SJ, Goebel MT. 2003. Ready-to-eat cereal consump-tion: Its relationship with BMI and nutrient intake of children ages 4 to 12 years. J AmDiet Assoc 103(12):1613–1619.
Allison DB, Egan K, Barra LM, Caughman C, Infante M, Heimbach JT. 1999. Estimatedintakes of trans fatty and other fatty acids in the US population. J Am Diet Assoc99(2):166–174.
Bandini LG, Must A, Cyr H, Anderson SE, Spadano JL, Dietz WH. 2003. Longitudinalchanges in the accuracy of reported energy intake in girls 10–15 y of age. Am J ClinNutr 78(3):480–484.
Barton BA, Eldridge AL, Thompson D, Affenito SG, Striegel-Moore RH, Franko DL, Albert-son AM, Crockett SJ. 2005. The relationship of breakfast and cereal consumption tonutrient intake and body mass index: The National Heart, Lung, and Blood InstituteGrowth and Health Study. J Am Diet Assoc 105(9):1383–1389.
Basiotis PP, Carlson A, Gerrior SA, Juan WY, Lino M. 2002. The Healthy Eating Index:1999–2000. U.S. Department of Agriculture, Center for Nutrition Policy and Promo-tion. Report No. CNPP-12. [Online]. Available: http://www.usda.gov/cnpp/Pubs/HEI/HEI99-00report.pdf [accessed March 15, 2005].
Beck BR, Shoemaker MR. 2000. Osteoporosis: Understanding key risk factors and therapeu-tic options. The Physician and Sports Medicine 28(2).
Berenson GS, Srinivasan SR, Bao W, Newman WP III, Tracy RE, Wattigney WA. 1998.Association between multiple cardiovascular risk factors and atherosclerosis in childrenand young adults: The Bogalusa Heart Study. N Engl J Med 338(23):1650–1656.
Block G. 2004. Foods contributing to energy intake in the US: Data from NHANES III andNHANES 1999–2000. J Food Comp Analysis 17(3-4):439–447.
Briefel RR, Johnson CL. 2004. Secular trends in dietary intake in the United States. Annu RevNutr 24:401–431.

84 FOOD MARKETING TO CHILDREN AND YOUTH
Briefel R, Reidy K, Karwe V, Jankowski L, Hendricks K. 2004. Toddlers’ transition to tablefoods: Impact on nutrient intakes and food patterns. J Am Diet Assoc 104(1 Suppl):S38–S44.
Capps O Jr, Clauson A, Guthrie J, Pittman G, Stockton M. 2005. Contributions of Nonalco-holic Beverages to the U.S. Diet. U.S. Department of Agriculture. Economic ResearchService. Economic Research Report No. 1. [Online]. Available: http://www.ers.usda.gov/publications/err1/err1.pdf [accessed April 26, 2005].
Carriquiry AL, Kodd KW, Nusser SM. 1997. Estimating Adjusted Intake and BiochemicalMeasurement Distributions for NHANES III. Hyattsville, MD: National Center forHealth Statistics.
Casey PH, Szeto K, Lensing S, Bogle M, Weber J. 2001. Children in food-insufficient, low-income families: Prevalence, health, and nutrition status. Arch Pediatr Adolesc Med155(4):508–514.
Cavadini C, Siega-Riz AM, Popkin BM. 2000. US adolescent food intake trends from 1965 to1996. Arch Dis Child 83(1):18–24.
CDC (Centers for Disease Control and Prevention). 1999. Ten great public health achieve-ments—United States, 1990–1999. MMWR 48(12):241–243.
CDC. 2002. Iron deficiency—United States, 1999–2000. MMWR 51(40):897–899. [Online].Available: http://www.cdc.gov/mmwr/preview/mmwrhtml/mm5140a1.htm [accessedApril 24, 2005].
CDC. 2004. Obesity Still a Major Problem, New Data Show. National Center for HealthStatistics. [Online]. Available: http://www.cdc.gov/nchs/pressroom/04facts/obesity.htm[accessed November 3, 2004].
CDC. 2005. QuickStats: Prevalence of overweight among children and teenagers, by agegroup and selected period—United States, 1963–2002. MMWR 54(8):203. [Online].Available: http://www.cdc.gov/mmwr/preview/mmwrhtml/mm5408a6.htm [accessedMarch 9, 2005].
Champagne CM, Baker NB, DeLany JP, Harsha DW, Bray GA. 1998. Assessment of energyintake underreporting by doubly labeled water and observations on reported nutrientintakes in children. J Am Diet Assoc 98(4):426–433.
Champagne CM, Bogle ML, McGee BB, Yadrick K, Allen HR, Kramer TR, Simpson P,Gossett J, Weber J. 2004. Dietary intake in the lower Mississippi delta region: Resultsfrom the Foods of Our Delta Study. J Am Diet Assoc 104(2):199–207.
Cohen RA, Bloom B. 2005. Trends in health insurance and access to medical care for childrenunder age 19 years: United States, 1998–2003. Advance Data from Vital and HealthStatistics, No. 355. Hyattsville, MD: National Center for Health Statistics. [Online].Available: http://www.cdc.gov/nchs/data/ad/ad355.pdf [accessed April 18, 2005].
Cole N, Fox MK. 2004. Nutrition and Health Characteristics of Low-Income Participants.Volume II, WIC Program Participants and Nonparticipants. Report No. E-FAN-04-014-2. Washington, DC: U.S. Department of Agriculture, Economic Research Service.
Cook JT, Frank DA, Berkowitz C, Black MM, Casey PH, Cutts DB, Meyers AF, Zaldivar N,Skalicky A, Levenson S, Heeren T, Nord M. 2004. Food insecurity is associated withadverse health outcomes among human infants and toddlers. J Nutr 134(6):1432–1438.
Cook S, Weitzman M, Auinger P, Nguyen M, Dietz WH. 2003. Prevalence of a metabolicsyndrome phenotype in adolescents: Findings from the third National Health and Nutri-tion Examination Survey, 1988–1994. Arch Pediatr Adolesc Med 157(8):821–827.
Devaney B, Ziegler P, Pac S, Karwe V, Barr SI. 2004. Nutrient intakes of infants and toddlers.J Am Diet Assoc 104(1 Suppl):S14–S21.
Devaney B, Kim M, Carriquiry A, Camano-Garcia G. 2005. Assessing the Nutrient Intakes ofVulnerable Subgroups. Washington, DC: Economic Research Service, U.S. Departmentof Agriculture.

HEALTH, DIET, AND EATING PATTERNS OF CHILDREN AND YOUTH 85
DHHS (U.S. Department of Health and Human Services). 2000a. Healthy People 2010:Understanding and Improving Health. Washington, DC: DHHS.
DHHS. 2000b. Oral Health in America: A Report of the Surgeon General. Rockville, MD:DHHS, National Institute of Dental and Craniofacial Research, National Institutes ofHealth.
DHHS. 2003. National Healthcare Disparities Report. Rockville, MD: DHHS, Agency forHealthcare Research and Quality.
DHHS and USDA (U.S. Department of Agriculture). 2004. Nutrition and Your Health: Di-etary Guidelines for Americans. 2005 Dietary Guidelines Advisory Committee Report.[Online]. Available: http://www.health.gov/dietaryguidelines/dga2005/report/ [accessedAugust 10, 2004].
DHHS and USDA. 2005. Dietary Guidelines for Americans 2005. [Online]. Available: http://www.healthierus.gov/dietaryguidelines [accessed January 12, 2005].
Dye BA, Shenkin JD, Ogden CL, Marshall TA, Levy SM, Kanellis MJ. 2004. The relationshipbetween healthful eating practices and dental caries in children ages 2–5 years in theUnited States, 1988–1994. J Am Dent Assoc 135(1):55–66.
Enns CW, Mickle SJ, Goldman JD. 2002. Trends in food and nutrient intakes by children inthe United States. Fam Econ Nutr Rev 14(2):56–68.
Enns CW, Mickle SJ, Goldman JD. 2003. Trends in food and nutrient intakes by adolescentsin the United States. Fam Econ Nutr Rev 15(2):15–27.
Ervin RB, Wright JD, Reed-Gillette D. 2004. Prevalence of leading types of dietary supple-ments used in the Third National Health and Nutrition Examination Survey, 1988–94.Advance Data from Vital and Health Statistics, No. 349. Hyattsville, MD: NationalCenter for Health Statistics.
Evans GW. 2004. The environment of child poverty. American Psychologist 59(2):77–92.Federal Interagency Forum on Child and Family Statistics. 2004. America’s Children in Brief:
Key National Indicators of Well-Being, 2004. Washington, DC: U.S. Government Print-ing Office. [Online]. Available: http://childstats.gov [accessed March 8, 2005].
Fisher JO, Mitchell DC, Smiciklas-Wright H, Mannino ML, Birch LL. 2004. Meeting calciumrecommendations during middle childhood reflects mother–daughter beverage choicesand predicts bone mineral status. Am J Clin Nutr 79(4):698–706.
Flegal KM, Troiano RP. 2000. Changes in the distribution of body mass index of adults andchildren in the US population. Int J Obes 24(7):807–818.
Food Research Action Center. 2005. State of the States: 2005. A Profile of Food and Nutri-tion Programs Across the Nation. [Online]. Available: http://www.frac.org/State_Of_States/2005/Report.pdf [accessed March 9, 2005].
Fox MK, Cole N. 2004. Nutrition and Health Characteristics of Low-Income Populations.Vol III, School-age Children. Report No. E-FAN-04-014-3. Washington, DC: EconomicResearch Service, U.S. Department of Agriculture.
Fox MK, Pac S, Devaney B, Jankowski L. 2004. Feeding Intakes and Toddlers Study: Whatfoods are infants and toddlers eating? J Am Diet Assoc 104(1 Suppl):S22–S30.
French SA, Lin BL, Guthrie JF. 2003. National trends in soft drink consumption amongchildren and adolescents age 6 to 17 years: Prevalence, amounts, and sources, 1977/1978 to 1994/1998. J Am Diet Assoc 103(10):1326–1331.
Frongillo EA. 2003. Understanding obesity and program participation in the context of pov-erty and food insecurity. J Nutr 133(7):2117–2118.
Ganji V, Hampl JS, Betts NM. 2003. Race-, gender- and age-specific differences in dietarymicronutrient intakes of US children. Int J Food Sci and Nutr 54(6):485–490.
Gartner LM, Greer FR, Section on Breastfeeding and Committee on Nutrition, AmericanAcademy of Pediatrics. 2003. Prevention of rickets and vitamin D deficiency: New guide-lines for vitamin D intake. Pediatrics 111(4):908–910.

86 FOOD MARKETING TO CHILDREN AND YOUTH
Gibson D. 2004. Long-term food stamp program participation is differentially related tooverweight in young girls and boys. J Nutr 134(2):372–379.
Gift HC, Drury TF, Nowjack-Raymer RE, Selwitz RH. 1996. The state of the nation’s oralhealth: Mid-decade assessment of Healthy People 2000. J Public Health Dent 56(2):84–91.
Gleason P, Suitor C. 2001. Children’s Diets in the Mid-1990s: Dietary Intake and Its Rela-tionship with School Meal Participation. Report No. CN-01-CD1. Alexandria, VA: U.S.Department of Agriculture.
Goodman E. 1999. The role of socioeconomic status gradients in explaining differences in USadolescents’ health. Am J Public Health 89(10):1522–1528.
Guthrie JF, Morton JF. 2000. Food sources of added sweeteners in the diets of Americans. JAm Diet Assoc 100(1):43–48, 51.
Guthrie JF, Lin B, Frazão E. 2002. Role of food prepared away from home in the Americandiet, 1977–78 versus 1994–96: Changes and consequences. J Nutr Educ Behav 34(3):140–150.
Haffner SM, Valdez RA, Hazuda HP, Mitchell BD, Morales PA, Stern MP. 1992. Prospectiveanalysis of the insulin-resistance syndrome (syndrome X). Diabetes 41(6):715–722.
Haley S, Reed J, Lin B-H, Cook A. 2005. Sweetener Consumption in the United States.Report No. SSS-243-01. Washington, DC: Economic Research Service, U.S. Departmentof Agriculture.
Hedley AA, Ogden CL, Johnson CL, Carroll MD, Curtin LR, Flegal KM. 2004. Prevalence ofoverweight and obesity among US children, adolescents, and adults, 1999–2002. J AmMed Assoc 291(23):2847–2850.
Hetzel BS, Clugston GA. 1999. Iodine. In: Shils ME, Olson JA, Shike M, Ross AC, eds.Modern Nutrition in Health and Disease. 9th ed. Baltimore, MD: Williams and Wilkins.Pp. 253–263.
Hofferth S, Curtin S. 2005. Poverty, food programs, and childhood obesity. J Policy AnalysisManagement 24(4):703–726.
Honein MA, Paulozzi LJ, Mathews TJ, Erickson JD, Wong LY. 2001. Impact of folic acidfortification of the US food supply on the occurrence of neural tube defects. J Am MedAssoc 285(23):2981–2986.
Huang TT, McCrory MA. 2005. Dairy intake, obesity, and metabolic health in children andadolescents: Knowledge and gaps. Nutr Rev 63(3):71–80.
Huang TT, Howarth NC, Lin BH, Roberts SB, McCrory MA. 2004. Energy intake and mealportions: Associations with BMI percentile in U.S. children. Obes Res 12(11):1875–1885.
IOM (Institute of Medicine). 1997. Dietary Reference Intakes for Calcium, Phosphorus,Magnesium, Vitamin D, and Fluoride. Washington, DC: National Academy Press.
IOM. 1998. Dietary Reference Intakes for Thiamin, Riboflavin, Niacin, Vitamin B6, Folate,Vitamin B12, Pantothenic Acid, Biotin, and Choline. Washington, DC: National Acad-emy Press.
IOM. 2001. Dietary Reference Intakes for Vitamin A, Vitamin K, Arsenic, Boron, Chro-mium, Copper, Iodine, Iron, Manganese, Molybdenum, Nickel, Silicon, Vanadium, andZinc. Washington, DC: National Academy Press.
IOM. 2002–2005. Dietary Reference Intakes for Energy, Carbohydrate, Fiber, Fat, FattyAcids, Cholesterol, Protein, and Amino Acids (Macronutrients). Washington, DC: TheNational Academies Press.
IOM. 2003. Dietary Reference Intakes: Guiding Principles for Nutrition Labeling and Fortifi-cation. Washington, DC: The National Academies Press.
IOM. 2005a. Dietary Reference Intakes for Water, Potassium, Sodium, Chloride, and Sulfate.Washington, DC: The National Academies Press.

HEALTH, DIET, AND EATING PATTERNS OF CHILDREN AND YOUTH 87
IOM. 2005b. Preventing Childhood Obesity: Health in the Balance. Washington, DC: TheNational Academies Press.
IOM. 2005c. The WIC Food Package: Time for a Change. Washington, DC: The NationalAcademies Press.
Isomaa B, Almgren P, Tuomi T, Forsen B, Lahti K, Nissen M, Taskinen MR, Groop L. 2001.Cardiovascular morbidity and mortality associated with the metabolic syndrome. Diabe-tes Care 24(4):683–689.
Jahns L, Siega-Riz AM, Popkin BM. 2001. The increasing prevalence of snacking among USchildren from 1977 to 1996. J Pediatr 138(4):493–498.
Jones SJ, Jahns L, Laraia BA, Haughton B. 2003. Lower risk of overweight in school-agedfood insecure girls who participate in food assistance. Results from the panel study ofincome dynamics child development supplement. Arch Pediatr Adolesc Med 157(8):780–784.
Kaiser LL, Melgar-Quinonez HR, Lamp CL, Johns MC, Sutherlin JM, Harwood JO. 2002.Food security and nutritional outcomes of preschool-age Mexican-American children.J Am Diet Assoc 102(7):924–929.
Kant AK. 2004. Reported consumption of low-nutrient-density foods by American childrenand adolescents. National and health correlates, NHANES III, 1988 to 1994. ArchPediatr Adolesc Med 157(8):789–796.
Kant AK, Graubard BI. 2003. Predictors of reported consumption of low-nutrient-densityfoods in a 24-h recall by 8–16 year old US children and adolescents. Appetite 41(2):175–180.
Kenney GM, McFeeters JR, Yee JY. 2005. Preventive dental care and unmet dental needsamong low-income children. Am J Public Health 95(8):1360–1366.
Kranz S, Siega-Riz AM, Herring AH. 2004. Changes in diet quality of American preschoolersbetween 1977 and 1998. Am J Public Health 94(9):1525–1530.
Kranz S, Mitchell DC, Siega-Riz AM, Smiciklas-Wright H. 2005a. Dietary fiber intake byAmerican preschoolers is associated with more nutrient-dense diets. J Am Diet Assoc105(2):221–225.
Kranz S, Smiciklas-Wright H, Siega-Riz AM, Mitchell D. 2005b. Adverse effect of high addedsugar consumption on dietary intake in American preschoolers. J Pediatr 146(1):105–111.
Lakka HM, Laaksonen DE, Lakka TA, Niskanen LK, Kumpusalo E, Tuomilehto J, SalonenJT. 2002. The metabolic syndrome and total and cardiovascular disease mortality inmiddle-aged men. J Am Med Assoc 288(21):2709–2716.
Land KC. 2005. The Foundation for Child Development Index of Child Well-Being (CWI),1975–2003, with Projections for 2004. Durham, NC: Duke University.
Ledikwe JH, Blanck HM, Khan LK, Serdula MK, Seymour JD, Tohill BC, Rolls BJ. 2005.Dietary energy density determined by eight calculation methods in a nationally represen-tative United States population. J Nutr 135(2):273–278.
Lin B. 2005. Nutrition and Health Characteristics of Low-Income Populations: Healthy Eat-ing Index. Agriculture Information Bulletin 796-1. Washington, DC: Economic ResearchService, U.S. Department of Agriculture.
Lin B, Guthrie J, Frazao E. 1999. Quality of children’s diets at and away from home: 1994–96. Food Review 22(1):2–10.
Livingstone MBE, Robson PJ. 2000. Measurement of dietary intake in children. Proc NutrSoc 59(2):279–293.
Looker AC, Dallman PR, Carroll MD, Gunter EW, Johnson CL. 1997. Prevalence of irondeficiency in the United States. J Am Med Assoc 277(12):973–976.

88 FOOD MARKETING TO CHILDREN AND YOUTH
Mahoney LT, Burns TL, Stanford W, Thompson BH, Witt JD, Rost CA, Lauer RM. 1996.Coronary risk factors measured in childhood and young adult life are associated withcoronary artery calcification in young adults: The Muscatine Study. J Am Coll Cardiol27(2):277–284.
Matheson DM, Varady J, Varady A, Killen JD. 2002. Household food security and nutri-tional status of Hispanic children in the fifth grade. Am J Clin Nutr 76(1):210–217.
McGill HC Jr, McMahan CA, Herderick EE, Zieske AW, Malcom GT, Tracy RE, Strong JP.2002. Obesity accelerates the progression of coronary atherosclerosis in young men.Circulation 105(23):2712–2718.
Moshfegh A, Goldman J, Cleveland L. 2005. What We Eat in America, NHANES 2001–2002: Usual Nutrient Intakes from Food Compared to Dietary Reference Intakes. USDAAgricultural Research Service. [Online]. Available: http://www.ars.usda.gov/SP2UserFiles/Place/12355000/pdf/usualintaketables2001-02.pdf [accessed October 4, 2005].
Mrdjenovic G, Levitsky DA. 2003. Nutritional and energetic consequences of sweeteneddrink consumption in 6- to 13-year-old children. J Pediatr 142(6):604–610.
Murphy M, Douglass J, Latulippe M, Barr S, Johnson R, Frye C. 2005. Beverages as a sourceof energy and nutrients in diets of children and adolescents. Experimental Biology Meet-ing, San Diego, April 1–5. Abstract 275.4. FASEB J 19(4):A434.
National SAFE KIDS Campaign. 2003, May. Report to the Nation: Trends in UnintentionalChildhood Injury Mortality, 1987–2000. [Online]. Available: http://www.usa.safekids.org/content_documents/nskw03_report.pdf [accessed July 22, 2005].
Nicklas TA, Demory-Luce D, Yang SJ, Baranowski T, Zakeri I, Berenson G. 2004a. Children’sfood consumption patterns have changed over two decades (1973–1994): The BogalusaHeart Study. J Am Diet Assoc 104(7):1127–1140.
Nicklas TA, Morales M, Linares A, Yang SJ, Baranowski T, De Moor C, Berenson G. 2004b.Children’s meal patterns have changed over a 21-year period: The Bogalusa Heart Study.J Am Diet Assoc 104(5):753–761.
Nielsen SJ, Popkin BM. 2003. Patterns and trends in food portion sizes, 1977–1998. J AmMed Assoc 289(4):450–453.
Nielsen SJ, Popkin BM. 2004. Changes in beverage intake between 1997 and 2001. Am JPrev Med 27(3):205–210.
Nielsen SJ, Siega-Riz AM, Popkin BM. 2002a. Trends in energy intake in U.S. between 1977and 1996: Similar shifts seen across age groups. Obes Res 10(5):370–378.
Nielsen SJ, Siega-Riz AM, Popkin BM. 2002b. Trends in food locations and sources amongadolescents and young adults. Prev Med 35(2):107–113.
NIH (National Institutes of Health). 2001. Osteoporosis: Prevention, diagnosis, and therapy.J Am Med Assoc 285(6):785–795.
Nord M, Andrews M, Carlson S. 2005. Household Food Security in the United States, 2004.Economic Research Report Number 11. Washington, DC: U.S. Department of Agricul-ture, Economic Research Service.
NRC (National Research Council). 1989. Recommended Dietary Allowances. 10th ed. Wash-ington, DC: National Academy Press.
NRC and IOM. 2004. Children’s Health, the Nation’s Wealth. Washington, DC: The Na-tional Academies Press.
Ogden CL, Carroll MD, Flegal KM. 2003. Epidemiologic trends in overweight and obesity.Endocrinol Metab Clin North Am 32(4):741–760, vii.
Ogden CL, Fryar CD, Carroll MD, Flegal KM. 2004. Mean body weight, height and bodymass index, United States, 1960–2002. Advance Data from Vital and Health Statistics,No. 347. Hyattsville, MD: National Center for Health Statistics. [Online]. Available:http://www.cdc.gov/nchs/data/ad/ad347.pdf [accessed March 20, 2005].

HEALTH, DIET, AND EATING PATTERNS OF CHILDREN AND YOUTH 89
Park YK, Sempos CT, Barton CN, Vanderveen JE, Yetley EA. 2000. Effectiveness of foodfortification in the United States: The case of pellagra. Am J Public Health 90(5):727–738.
Park YK, Meier ER, Bianchi P, Song WO. 2002. Trends in children’s consumption of bever-ages: 1987 to 1998. Fam Econ Nutr Rev 14(2):69–79.
Pfeiffer CM, Caudill SP, Gunter EW, Osterloh J, Sampson EJ. 2005. Biochemical indicatorsof B vitamin status in the US population after folic acid fortification: Results from theNational Health and Nutrition Examination Survey 1999–2000. Am J Clin Nutr 82(2):442–450.
Pollitt E. 1993. Iron deficiency and cognitive function. Annu Rev Nutr 13:521–537.Rajeshwari R, Yang SJ, Nicklas TA, Berenson GS. 2005. Secular trends in children’s sweet-
ened-beverage consumption (1973 to 1994): The Bogalusa Heart Study. J Am DietAssoc 105(2):208–214.
Rolls BJ, Ello-Martin JA, Tohill BC. 2004. What can intervention studies tell us about therelationship between fruit and vegetable consumption and weight management? NutrRev 62(1):1–17.
Sherry B, Mei Z, Yip R. 2001. Continuation of the decline in prevalence of anemia in low-income infants and children in five states. Pediatrics 107(4):677–682.
Sherry B, Mei Z, Scanlon KS, Mokdad AH, Grummer-Strawn LM. 2004. Trends in state-specific prevalence of overweight and underweight in 2- through 4-year-old childrenfrom low-income families from 1989 through 2000. Arch Pediatr Adolesc Med 158(12):1116–1124.
Shils M, Shike M, Olson J, Ross AC. 1999. Modern Nutrition in Health and Disease. Balti-more, MD: Williams & Wilkins.
Siega-Riz AM, Popkin BM, Carson T. 1998. Trends in breakfast consumption for children inthe United States from 1965 to 1991. Am J Clin Nutr 67(4S):748S–756S.
Skinner JD, Ziegler P, Pac S, Devaney B. 2004a. Meal and snack patterns of infants andtoddlers. J Am Diet Assoc 104(1 Suppl 1):S65–S70.
Skinner JD, Ziegler P, Ponza M. 2004b. Transitions in infants’ and toddlers’ beverage pat-terns. J Am Diet Assoc 104(1 Suppl 1):S45–S50.
Smiciklas-Wright H, Mitchell DC, Mickle SJ, Goldman JD, Cook A. 2003. Foods commonlyeaten in the United States, 1989–1991 and 1994–1996: Are portion sizes changing?J Am Diet Assoc 103(1)41–47.
Storey ML, Forshee RA, Anderson PA. 2004. Associations of adequate intake of calcium withdiet, beverage consumption, and demographic characteristics among children and ado-lescents. J Am Coll Nutr 23(1):18–33.
Story M, Holt K, Sofka D, eds. 2003. Bright Futures in Practice: Nutrition. 2nd ed. Arling-ton, VA: National Center for Education in Maternal and Child Health. [Online]. Avail-able: http://www.brightfutures.org/nutrition/index.html [accessed August 22, 2005].
Strauss RS, Knight J. 1999. Influence of the home environment on the development of obesityin children. Pediatrics 103(6):E85.
Strauss RS, Pollack HA. 2001. Epidemic increase in childhood overweight, 1986–1998. J AmMed Assoc 286(22):2845–2848.
Subar AF, Krebs-Smith SM, Cook A, Kahle LL. 1998. Dietary sources of nutrients among USchildren, 1989–1991. Pediatrics 102(4 Pt 1):913–923.
Suitor CW, Gleason PM. 2002. Using Dietary Reference Intake-based methods to estimatethe prevalence of inadequate nutrient intake among school-aged children. J Am DietAssoc 102(4):530–536.
Templeton S. 2005. Sugar intake from combined school lunch and competitive food con-sumption. J Am Diet Assoc 105(7):1066–1067.
90 FOOD MARKETING TO CHILDREN AND YOUTH
Templeton SB, Marlette MA, Panemangalore M. 2005. Competitive foods increase the intakeof energy and decrease the intake of certain nutrients by adolescents consuming schoollunch. J Am Diet Assoc 105(2):215–220.
Troiano RP, Flegal KM. 1998. Overweight children and adolescents: Description, epidemiol-ogy, and demographics. Pediatrics 101(3 Pt 2):497–504.
Troiano RP, Briefel RR, Carroll MD, Bialostosky K. 2000. Energy and fat intakes of childrenand adolescents in the United States: Data from the National Health and NutritionExamination Surveys. Am J Clin Nutr 72(5 Suppl):1343S–1353S.
USDA (U.S. Department of Agriculture). 1992. The Food Guide Pyramid. A Guide to DailyFood Choice. Home and Garden Bulletin 252. Washington, DC: USDA Human Nutri-tion Information Service.
USDA. 1996. The Food Guide Pyramid. Center for Nutrition Policy and Promotion. Wash-ington, DC: U.S. Government Printing Office.
USDA. 1999. Food and Nutrient Intakes by Children, 1994–96, 1998, Table Set 17. FoodSurveys Research Group, Agricultural Research Service. [Online]. Available: http://www.barc.usda.gov/bhnrc/foodsurvey/home.htm [accessed January 4, 2005].
USDA. 2003a. Federal Register Notice on Technical Revisions to the Food Guide Pyramid.Table 2: Energy Levels for Proposed Food Intake Patterns. Center for Nutrition Policyand Promotion. [Online]. Available: http://www.cnpp.usda.gov/pyramid-update/FGP%20docs/TABLE%202.pdf [accessed March 28, 2005].
USDA. 2003b. The Food Guide Pyramid for Young Children. Center for Nutrition Policy andPromotion. [Online]. Available: http://www.usda.gov/cnpp/KidsPyra/LittlePyr.pdf [ac-cessed February 24, 2005].
USDA. 2005a. Interactive Healthy Eating Index. [Online]. Available: http://209.48.219.53/Default.asp [accessed July 6, 2005].
USDA. 2005b. MyPyramid: Steps to a Healthier You. [Online]. Available: http://www.mypyramid.gov/ [accessed April 25, 2005].
USDA. 2005c. The Food Assistance Landscape. Food Assistance and Nutrition ResearchReport No. 28-6. [Online]. Available: http://www.ers.usda.gov/publications/fanrr28-6/fanrr28-6.pdf [accessed April 24, 2005].
USDA. 2005d. USDA Healthy Eating Index. [Online]. Available: http://www.cnpp.usda.gov/healthyeating.html [accessed July 6, 2005].
Wang G, Dietz WH. 2002. Economic burden of obesity in youths aged 6 to 17 years: 1979–1999. Pediatrics 109(5):e81.
Weinberg, LG, Berner LA, Groves JE. 2004. Nutrient contributions of dairy foods in theUnited States, continuing survey of food intakes by individuals, 1994–1996, 1998. J AmDiet Assoc 104(6):895–902.
Weisberg P, Scanlon KS, Li R, Cogswell ME. 2004. Nutritional rickets among children in theUnited States: Review of cases reported between 1986 and 2003. Am J Clin Nutr 80(6Suppl):1697S–1705S.
Williams J, Wake M, Hesketh K, Maher E, Waters E. 2005. Health-related quality of life ofoverweight and obese children. J Am Med Assoc 293(1):70–76.
Winkleby MA, Robinson TN, Sundquist J, Kraemer HC. 1999. Ethnic variation in cardiovas-cular disease risk factors among children and young adults: Findings from the ThirdNational Health and Nutrition Examination Survey, 1988–1994. J Am Med Assoc281(11):1006–1013.
Wise PH. 2004. The transformation of child health in the United States. Health Affairs23(5):9–25.
Wyshak G. 2000. Teenaged girls, carbonated beverage consumption, and bone fractures.Arch Pediatr Adolesc Med 154(6):610–613.

91
3
Factors Shaping Food and BeverageConsumption of Children and Youth
INTRODUCTION
Eating behaviors cannot be understood, explained, or changed withoutconsidering the context in which an individual lives (e.g., individual charac-teristics, home, and family). This context is nested within a broader com-munity context, such as the neighborhood and schools, and societal factors(e.g., marketing, economics, culture). Interactions within and among thesecontexts affect behavior. A multidimensional approach to understandingthe processes and context of the influences shaping children’s and youths’eating behaviors can help explain relationships among factors in differentdomains.
This chapter presents an ecological perspective for understanding fac-tors that influence child and adolescent eating behaviors and food andbeverage choices. From this perspective, child and adolescent eating behav-iors are conceptualized as a function of individual and environmental influ-ences, or spheres of influence. These include biological factors, familial andsocial relationships, neighborhood, community, and institutional settings,culture and values, and broader social and economic trends. This chapterdescribes the following spheres of influence:
• Individual and developmental factors (e.g., developmental, biologi-cal, psychological/psychosocial);
• Family and social influences;• Institutional, neighborhood, and community environments; and• Macrosystem influences (e.g., marketing, culture and values, food
systems).

92 FOOD MARKETING TO CHILDREN AND YOUTH
All of these factors may directly or indirectly influence eating behav-iors. If the diets of children and youth are to improve, attention must begiven not only to the behavior of individuals but also to the environmentalcontext and conditions in which people live and eat.
Current studies are inadequate to explain with certainty how individualand environmental influences interact to influence dietary behaviors andhealth outcomes of children and youth. Simultaneous analyses of socio-demographic, psychological, developmental, and environmental factors andtheir interactions with food choices are rare in the literature. The few casesthat do exist are often focused on a specific age group or a single foodgroup, such as fruits and vegetables. The following sections present bothempirical evidence and theoretical links to eating behaviors.
INDIVIDUAL AND DEVELOPMENTAL FACTORS
Individual influences on children’s eating behaviors include biologicaland genetic factors, sensory characteristics, psychological and psychosocialfactors, developmental stages, consumer socialization, and lifestyle factors.
Biological and Genetic Factors
Biological Factors
Eating is a behavior influenced by physiological factors. It involvesmany organs and the central nervous system. Hunger, appetite, and satietyare all under neural regulatory control. Physiological factors influence foodintake through sensory stimulation (e.g., smell, sight, taste of food), gas-trointestinal signals, and circulating factors and chemical signals (e.g., glu-cose, insulin, peptides). Environmental and cognitive factors can interferewith or override physiological controls of eating and calorie intake. In fact,food intake in humans may depend more on external factors rather thanphysiological factors (Bell and Rolls, 2001).
Recent advances in the field of behavioral neuroscience have begun toincrease the scientific understanding of the neurobiology of eating and foodintake, including when and how much food is consumed and when eating isterminated. Gut–brain signals appear to be a critical neural network in theregulation of calorie intake and meal size. The discovery of bioactive food-stimulated gut peptides, adipocyte hormones, and hypothalamic neuropep-tides all appear to affect food intake (Schwartz, 2004). It has been sug-gested that central regulatory mechanisms may contribute to the preferenceof sugars and fats over other macronutrients and tastes (Drewnowski andLevine, 2003). Much of the neurobiological mechanism research has beendone in animal models, or human neuroimaging studies with patterns of

FACTORS SHAPING FOOD AND BEVERAGE CONSUMPTION 93
brain activation produced by the thought, sight, smell, or taste of food.Thus, the effect of the neurobiology of eating and food intake on humanbehavior has not been fully elucidated.
Some universal biological food predispositions may exist, includingpreferences for sweetness and fat texture, avoidance of irritation, avoidanceof bitter and strong tastes, a tendency to be suspicious of new foods, and aset of genetic learning predispositions (Rozin, 2002). These predispositionsmay have served an adaptive function in human history when food wasrelatively scarce, modest in fat or sugar content, and limited in variety(Rozin, 2002). However, food today is abundant and widely available andthousands of new food products are introduced every year, including thosehigh in sugar, fat, and salt, which appeal to our taste predispositions (Chap-ter 4). In today’s food environment, children’s predispositions and adults’responses to them can promote food preferences and intake patterns thatfoster less healthful eating patterns that can contribute to the developmentof obesity (Birch, 1999).
Genetic Factors
Although the influences of genes on weight status and obesity are welldocumented, genetic influences on eating patterns and behaviors have re-ceived much less attention. While there is strong support from animalmodels for a genetic basis to food intake, a limited number of humanstudies suggest that food selection and intake, specifically for macronutri-ents (e.g., fats, carbohydrates) and total calories, may be genetically influ-enced to some extent (Keller et al., 2002). Research from family and twinstudies suggests a modest to moderate genetic contribution to eating behav-iors (de Castro and Plunkett, 2002; Keller et al., 2002; Klump et al., 2000;Reed et al., 1997). Selected adult twin studies show that heredity accountsfor 11–65 percent of the variance in the average overall calorie intake(Keller et al., 2002). These studies also show the importance of nongeneticenvironmental effects. Studies among family members suggest that geneticinfluences on nutrient intake among first degree relatives is weak and thatnongenetic effects associated with a shared environment are the majorcontributors to energy intake (Perusse et al., 1988). Studies assessing foodpreferences in both families and twins have found that the heritable compo-nent for individual foods is very low (Reed et al., 1997; Rozin and Millman,1987). This suggests the important influential role of the environment ondietary patterns. Reported heritability of macronutrient intakes (e.g., fats,carbohydrates) tends to be somewhat stronger. A better understanding isneeded to elucidate the complex interplay between human genes and theenvironment.
Individual variation in taste and food preferences may be genetically

94 FOOD MARKETING TO CHILDREN AND YOUTH
influenced (Birch, 1999; Keller and Tepper, 2004). Sensitivity to bitter tasteis a heritable trait. Compounds such as 6-n-propylthiouracil (PROP) tastebitter to some people and are tasteless to others. Some, but not all studieshave shown that PROP tasters show lower acceptance of cruciferous andother bitter vegetables (e.g., broccoli, cabbage, brussel sprouts), have morefood dislikes, and are more sensitive to sweet tastes and the texture of fat(Birch, 1999; Keller and Tepper, 2004). These studies suggest that genetictaste factors may play an important role in the development of food prefer-ences and dietary intake in children (Keller et al., 2002). A better under-standing of the genetic basis of taste may lead to the design of better dietaryprevention strategies for children (Keller et al., 2002). More research isneeded to identify genetic markers that will facilitate our understanding ofgenetic predispositions and how they interact with feeding and dietaryexperiences and social and environmental contexts.
Sensory Characteristics and Taste
Sensory Characteristics
Perceptions and responses to the sensory properties of food—taste,smell, and texture—affect food preferences and eating habits (Drewnowski,1997). Sensory responses are influenced by genetic, physiological, and meta-bolic variables. Preferences for sweet tastes, saltiness, and fatty texturesmay be an innate human trait or acquired early in life. By about 4 months,for example, infants begin to show a preference for salt (Birch, 1999). Onthe other hand, bitter and strong tasting foods are often rejected early inlife. From an evolutionary basis, these responses may have served biologicalfunctions needed for survival. In nature, sweetness is associated with readilyavailable calories from carbohydrates, and salt is needed for survival. How-ever, bitterness may be associated with natural toxins signaling dietarydanger (Mennella et al., 2004, 2005; Rozin, 2002). The tendency to learnto prefer calorie-dense foods may have been adaptive at times in our historywhen food was scarce (Rozin, 2002).
Innate taste responses are observed immediately after birth. Facial ex-pressions on human newborns show a positive hedonic response to sweettastes and a negative response to bitter and sour tastes (Drewnowski, 1997).The sensory pleasure response to sweetness and dietary fat may be medi-ated by the brain through neurotransmitters or endogenous opiate peptides(Benton, 2004).
Studies of young children have shown that their food preferences areinfluenced primarily by two factors: sweetness and familiarity (Birch, 1999;Drewnowski, 1997). Preferences for fat also may be acquired in early life,as children learn to prefer those flavors of foods that are associated with

FACTORS SHAPING FOOD AND BEVERAGE CONSUMPTION 95
high-calorie and fat content (Drewnowski, 1997). However, the predisposi-tion to prefer a sweet taste is readily modified by experiences with food andeating (Birch, 1999). One study showed that at birth all infants preferredsweet solutions to water, but by 6 months, preference for sweetened waterwas linked to the infant’s food experience; those infants routinely givensweetened water by their mothers showed a greater preference for it thaninfants who had been given water that was not sweetened (Beauchamp andMoran, 1982). Substantial evidence shows that predispositions to prefersweet, fatty, and salty foods and reject bitter ones can be readily alteredthrough experience with food and eating (Birch, 1999).
Flavor is another primary dimension by which young children deter-mine food acceptance (Mennella et al., 2005). Some relatively new evidencehas hypothesized that experience with a flavor in amniotic fluid or breastmilk may modify an infant’s acceptance and enjoyment of similarly fla-vored foods at weaning, and that this may underlie individual differences infood acceptability and possibly serve as the foundation for lifelong foodhabits (Mennella et al., 2004). Mennella et al. (2001) found that weaninginfants who had exposure to the flavor of carrots in either amniotic fluid orbreast milk were perceived to respond more positively to that flavor in afood base than did nonexposed infants. Thus, preliminary research suggeststhat prenatal and early postnatal exposure to flavors may predispose theyoung infant to have a favorable response to those flavors in foods.
Taste
One of the most important individual influences on food choice is taste,which also is influenced by the aroma and texture of food. Research hasconsistently shown that children, adolescents, and adults all report thattaste is the most important influence on their food choices (Barr, 1994;French et al., 1999; Glanz et al., 1998; Horacek and Betts, 1998; Neumark-Sztainer et al., 1999). Taste preference has also been found to be directlyrelated to children’s fruit and vegetable consumption (Neumark-Sztaineret al., 2003), calcium intake (Barr, 1994), and carbonated soft drink con-sumption (Grimm et al., 2004). In studies assessing motivation for vendingsnack choices and food choices at school, adolescents rated taste as themost important factor to consider, followed by hunger and price (Frenchet al., 1999; Shannon et al., 2002). Those who placed greater emphasis onsnack taste were less likely to report low-fat vending snacks as current orintended choices. “Healthfulness” and “tastiness” tend to be seen as oppo-sites by children (Wardle and Huon, 2000).
There appears to be widespread belief among children and adolescentsthat “if a food tastes good, it must not be good for me” and “if a food tastesbad, it is probably good for me” (Baranowski et al., 1993). In one study of

96 FOOD MARKETING TO CHILDREN AND YOUTH
teenagers, only one-fourth thought low-fat foods taste good (Shannon et al.,2002). In an experimental study with 9- to 11-year-old children, Wardleand Huon (2000) tested the idea that a “healthy” label would reduce theappeal of a novel drink. Children were asked to taste and rate one or twodrinks—one was described and labeled as “a new health drink” and theother as a “new drink.” The results showed children rated the drink labeledhealthful as tasting less pleasant and said they would be less likely to asktheir parents to buy it than the same drink presented just as a “new drink”(Wardle and Huon, 2000).
Developmental Stages
Early childhood lays the foundation for food behaviors and food pref-erences. The developmental stage1 of a child has a central influence oneating behaviors. During infancy (ages 0–12 months), feeding is central tothe parent–child relationship and for the infant developing a sense of secu-rity and trust. Early childhood (ages 1–5 years) is characterized by rapidgrowth and change in the child’s physical, cognitive, communicative, andsocial development (NRC and IOM, 2000). Eating behaviors move fromcomplete dependence on the caregiver to more self-directed control. Duringearly childhood, parents and primary caretakers largely determine whatfoods are provided and when eating occurs. Developmental characteristicsof young children influence their eating behavior and include dislike fornew foods (neophobia), food jags (favoring only one or two foods), andpicky eating (e.g., refusal to eat certain foods and not wanting foods totouch each other on the plate) (Story et al., 2002a). These are normativebehaviors in young children (Birch, 1999).
Middle childhood (ages 6–11 years) is a time of major cognitive devel-opment and mastery of cognitive, physical, and social skills. Children inthis age group progress from dependence on their parents to increasingindependence, with a growing interest on the development of friendshipsand the world around them. Their eating behaviors reflect these changesand become more influenced by outside sources.
The dramatic physical, developmental, and social changes that occurduring adolescence (ages 12–19 years) can markedly affect eating behaviorsand dietary intake. Growing independence and eating away from home,concern with appearance and body weight, the need for peer acceptance,and busy schedules all can impact eating patterns and food choices.
1In this report, the committee characterized infants and toddlers as under age 2 years,younger children as ages 2–5 years, older children as ages 6–11 years, and teens as ages 12–18(Chapter 1). These age categories and terms differ slightly from what is presented from theresearch described in this chapter.

FACTORS SHAPING FOOD AND BEVERAGE CONSUMPTION 97
Age-associated declines in diet quality are evident as children movefrom childhood through adolescence. For example, a recent longitudinalstudy with girls found that dietary quality declined between ages 5 and9 years (Mannino et al., 2004). Girls at 9 years of age tended to haveinadequate intakes of dairy foods, fruits and vegetables, and several nutri-ents more often than the younger girls. Other longitudinal studies haveshown that dietary decline continues during middle childhood into adoles-cence; intakes of fruits, vegetables, and milk decreases, and carbonated softdrinks increase (Lytle et al., 2000).
Psychological and Psychosocial Factors
Food Preferences
The complex interactions of many factors shape food preferences, in-cluding a child’s early experiences with food and eating, positive or nega-tive conditioning, exposure, and genetics (Birch, 1999). Self-reported foodpreferences are one of the strongest predictors of food choices and dietaryintake (Baranowski et al., 2002; Birch and Fisher, 1998; Drewnowski andHann, 1999; Woodward et al., 1996). Repeated exposures increase chil-dren’s preference for a food or flavor (Birch, 1999). A longitudinal study ofchildren from ages 2–3 years to 8 years reported that a high percentage ofchildren’s food preferences are formed as early as ages 2–3 years, and fewchanges in preferences occurred over the 5-year period (Skinner et al., 2002).The strongest predictors of the number of foods liked at age 8 years werethe number of foods liked at age 4 years (Skinner et al., 2002).
When food is plentiful, food likes and dislikes play an important role ininfluencing food choices. Among children, sweet foods and high-fat foodstend to be the most preferred foods (Drewnowski, 1997; Rozin, 2002),while vegetables are the least preferred foods (Skinner et al., 2002). Parentsoften cite dislike as the primary reason for children’s low vegetable intakes(Wardle et al., 2003a). It is not clear why vegetables are disliked by chil-dren, but it may be because of the sensitivity to the bitter taste of crucifer-ous vegetables, bland preparation of vegetables, the negative context inwhich vegetables may be presented—if you want dessert, you have to eatyour peas, poor parental modeling, or low exposure. Skinner et al. (2002)found that foods disliked by mothers tended not to be offered to children. Agrowing body of research suggests that a dislike of foods can be trans-formed into liking with experience of repeated tasting or exposures (Wardleet al., 2003a). In one study with children, 10 daily exposures to the taste ofan unfamiliar vegetable (e.g., raw red pepper) significantly increasedchildren’s liking and consumption of the vegetable (Wardle et al., 2003b).Another recent study found that daily exposure for 14 days to the taste of a

98 FOOD MARKETING TO CHILDREN AND YOUTH
previously disliked vegetable increased children’s (ages 2–6 years) likingand consumption of that vegetable (Wardle et al., 2003a). These resultssuggest that repeated exposure through frequent tasting may be effective inincreasing children’s acceptance of vegetables and other healthful, but notnecessarily well-liked foods (e.g., whole grains, unsweetened cereals). Inhomes, schools, and child-care settings, repeated exposure to initially dis-liked foods in an emotionally positive atmosphere could increase preferenceand consumption of those foods.
Social factors and the context in which the food is offered are impor-tant in shaping children’s preferences. Preschool children’s preferences forand consumption of disliked vegetables increased when children observedpeers choosing and eating the vegetables that the target child disliked (Birch,1999). Child feeding practices may also impact children’s preferences andintake patterns. When children are given foods as rewards for approvedbehaviors, enhanced preference for those foods results (Birch, 1999). Incontrast, when children are rewarded for eating a disliked food such asvegetables, this leads to a decline in the preference for that food (Birch,1999).
Finding: Food preferences develop as early as 2–3 years of age and areshaped by a child’s early experiences, positive or negative conditioning,exposure to foods, and a biological predisposition to prefer sweet, high-fat,and salty foods.
Gender
Gender differences in food choices and dietary intakes emerge as chil-dren move into adolescence. During childhood food intakes are similarbetween girls and boys. U.S. Department of Agriculture (USDA) data fromthe 1989–1991 Continuing Surveys of Food Intakes by Individuals (CSFII)showed little differences in mean daily intakes of the Food Guide Pyramidgroups for grains, vegetables, fruit, dairy, and meat among boys and girlsages 2–5 years and ages 6–11 years (Munoz et al., 1997). Among adoles-cents, boys ate more servings of grains, more vegetables (including frenchfries), dairy, and meat servings compared to girls (Chapter 2).
Studies have shown that as a group, adolescent girls are more likelythan adolescent boys to have lower intakes of essential vitamins and miner-als, and fewer servings of fruits, vegetables, and dairy foods (Gleason andSuitor, 2001; Story et al., 2002b). Boys are more likely to have diets higherin total fat and saturated fat compared to girls (Gleason and Suitor, 2001;Troiano et al., 2000) and to consume larger amounts of carbonated softdrinks (French et al., 2003a). On average, adolescent boys eat larger quan-tities of food than adolescent girls, so they are more likely to meet daily

FACTORS SHAPING FOOD AND BEVERAGE CONSUMPTION 99
recommended intakes for vitamins and minerals. Adolescent girls are alsomore likely to skip meals, especially breakfast, than are adolescent males(Gleason and Suitor, 2001; Chapter 2).
Gender differences in attitudes towards food are also evident duringadolescence. Adolescent girls are more likely than adolescent boys to beconcerned about health and weight, and this concern is associated withmore positive attitudes and behaviors regarding healthful foods. In onestudy of 1,083 adolescent high school students, girls were more likely thanboys to report that low-fat foods are beneficial for future health and main-taining weight (Fulkerson et al., 2004a). Boys were more likely than girls toreport that healthful eating is not important to them. Girls’ weight concernsmay predispose them to have more favorable attitudes toward healthfuleating. These results suggest the importance of segmented nutrition educa-tion interventions for adolescents.
Concern About Health and Nutrition
Health and nutrition are not a primary influence on the food choicesamong the majority of children, adolescents, and adults. In a study of 289adolescents, while nearly two-thirds (61 percent) of the students reportedthat eating healthful foods was important to them, only 27 percent weremotivated by health in making food choices (Shannon et al., 2002). Genderdifferences are also evident; one-third (36 percent) of girls report beingmotivated by health concerns compared to only 18 percent of adolescentboys (Shannon et al., 2002). Studies have also shown that students withhigher health concerns have lower intakes of fat and higher nutrient intakescompared to those less concerned about health (Horacek and Betts, 1998).Conversely, those least motivated by health concerns had the highest fatintakes. Other studies have shown that children who value health for thefoods they choose have better dietary quality (Gibson et al., 1998). Re-search has demonstrated that age positively predicts the perceived impor-tance of nutrition and the health effects of food; it becomes more importantas people age and is most valued by older adults (Glanz et al., 1998).
From a developmental perspective, it is not surprising that health andnutrition are low-priority concerns for adolescents, that adolescents are themost inclined toward eating behaviors that are incompatible with a health-ful diet, and that they are less concerned about nutrition compared to theirparents or grandparents (Rozin, 2002). Qualitative research has shown thatmany adolescents do not perceive a need or urgency to change their eatingbehavior when the future seems so far away (Neumark-Sztainer et al., 1999;Story and Resnick, 1986). For many, the long-term benefits of good healthmay not outweigh the short-term advantages of convenience and immediategratification.
100 FOOD MARKETING TO CHILDREN AND YOUTH
Nutrition Knowledge
Although knowing how and why to eat healthfully is important, nutri-tion knowledge alone does not ensure that children or adolescents willadopt healthful eating behaviors. A meta-analysis of the literature withadults, adolescents, and children found the association of nutrition knowl-edge with dietary behavior to be very weak (r = 0.10) (Axelson et al.,1985). Another more recent study with adults using CSFII data found thatadults with more nutrition knowledge consumed more fruit and vegetables(Guthrie et al., 2005). Another study with mothers and children ages 9–11 years found that mothers’ nutrition knowledge was strongly correlatedto their children’s fruit intake, but not to their intake of vegetables orsweets (Gibson et al., 1998). Children’s own nutrition knowledge did notcorrelate with their fruit or vegetable intake (Gibson et al., 1998). Clearly,nutrition knowledge alone is not sufficient to change dietary behaviors.
Stress and Depression
Stress and depression can affect appetite through either an increase ordecrease in eating. However, relatively little research has been done withchildren or adolescents. Cartwright et al. (2003) examined associationsbetween psychological stress and dietary practices in a socioeconomicallyand ethnically diverse sample of 4,320 children ages 11–12 years. Childrencompleted a Perceived Stress Scale and food frequency questionnaires.Greater stress was associated with eating higher-fat foods, less fruit andvegetable intake, more frequent snacking, and skipping breakfast. Theseeffects were independent of gender, weight, socioeconomic status, andethnicity.
An extensive body of research supports a strong relationship betweendepression and eating disorders among adolescents, as well as depressionand weight dissatisfaction, negative body image, and disordered eatingbehaviors (Fulkerson et al., 2004b). Less is known about childhood depres-sion and dietary practices. In a survey of 4,734 ethnically diverse middleand high school students, Fulkerson et al. (2004b) found that depressivesymptoms were positively associated with perceived barriers to healthfuleating and weight concerns. Adolescents who reported more depressivesymptoms were less likely to eat breakfast, lunch, and dinner. No associa-tion was seen between depressive symptoms and calorie or nutrient intakes.
Dieting
Dieting is a widespread practice among preadolescents and adoles-cents, especially girls. Nationwide in 2003, 59 percent of high school girls
FACTORS SHAPING FOOD AND BEVERAGE CONSUMPTION 101
and 29 percent of high school boys reported trying to lose weight duringthe 30 days preceding a survey conducted by Grunbaum et al. (2004).Nearly 20 percent of girls had gone without eating for 24 hours or moreto lose weight, 11 percent had taken diet pills to lose weight, and 8 per-cent had vomited or taken laxatives to lose weight during the past 30 days(Grunbaum et al., 2004). The few studies that have examined adolescentweight control behaviors and associations with dietary intakes have hadinconsistent results (Barr, 1995; French et al., 1995; Neumark-Sztaineret al., 2000; Story et al., 1998). Studies have shown that adolescents whoengage in less healthful weight control behaviors (e.g., vomiting, laxatives,or diet pills) are at increased risk for dietary inadequacy and weight gain(Neumark-Sztainer et al., 2004; Story et al., 1998). Among 4,144 adoles-cents, girls using less healthful weight control behaviors had significantlylower intakes of fruits and vegetables, grains, calcium, iron, and othermicronutrients compared to girls using healthy weight control methods ornot dieting (Neumark-Sztainer et al., 2004). No such relationship wasfound among boys.
Portion Size
Several controlled laboratory and naturalistic studies show that in theshort-term, older children and adults eat more with increasing portion sizesand larger package sizes (Rolls, 2003). In a laboratory study (Rolls et al.,2000), 5-year-old children varied their intake at meals directly with changesin portion sizes. When offered larger portions, children ate substantiallymore. In the same study, young children (about 3.5 years old) did not varyintake in relation to changes in portion size, suggesting that the ability torespond to internal cues of hunger is stronger at younger ages and dimin-ishes with age as external factors become increasingly influential.
Food packaging and portion sizes have increased steadily over the past30 years (Wansink, 2004; Young and Nestle, 2002). Data suggest that thetrend toward larger portion sizes began in the 1970s, increased sharply inthe 1980s, and has continued to increase (Young and Nestle, 2002). Pack-age size influences the volume of food consumed. When food packages aredoubled in size, consumption in adults generally increases by 18–25 percentfor meal-related foods and 30–45 percent for snack-related foods (Wansink,2004). Data indicate that away-from-home portions sizes have increasedover time (Nielsen and Popkin, 2003; Young and Nestle, 2002; Chapter 2).Larger portions not only contain more calories but also encourage peopleto eat more. Research suggests that individuals tend to overconsume highenergy-dense foods beyond physiological satiety (Kral et al., 2004), espe-cially when they are unaware that the portion sizes served to them havebeen substantially increased (Rolls et al., 2004). Satiety signals are not

102 FOOD MARKETING TO CHILDREN AND YOUTH
triggered as effectively with high energy-dense foods (Drewnowski, 1998),and large portions of them consumed on a regular basis are particularlyproblematic for achieving energy balance and weight management in olderchildren and adults.
In contrast to 15–25 years ago, quick serve restaurants and full serverestaurants use larger portion sizes in their marketing promotions. Restau-rants are using larger dinner plates and quick serve restaurants are usinglarger containers for drinks and french fries (Young and Nestle, 2002). Inan analysis, Young and Nestle (2002) found that the containers for virtu-ally all foods and beverages prepared for immediate consumption haveincreased over time and now appear to be typical and the norm. Given thesefindings, there is a need for greater attention to food portion size andconsuming recommended serving sizes, such as those in the Dietary Guide-lines for Americans (DHHS and USDA, 2005).
Finding: The availability and marketing of foods and beverages of largerportion sizes has increased steadily over the past three decades in manyvenues.
Consumer Socialization and Behavior
Consumer socialization refers to the “processes by which children andadolescents acquire skills, knowledge, and attitudes relevant to their func-tioning as consumers in the marketplace” (Ward, 1974). Consumer social-ization occurs in the context of cognitive, social and developmental changesas children progress through childhood and adolescence and become so-cialized into their roles as consumers. Over the past 25 years, a large bodyof consumer research has accumulated on children’s knowledge of prod-ucts, brands, advertising, pricing, shopping skills, decision-making skillsand abilities, parental influence and negotiation approaches, and socialaspects of the child consumer role. American children are avid consumersand become socialized into this role from an early age (John, 1999). Chil-dren’s consumer socialization and behavior influences food choices, bothby direct purchases and by the substantial influence children have on fam-ily purchases.
A child’s first request for a product occurs at about 24 months, and75 percent of the time, this request occurs in a supermarket. McNeal (1999)found that the most common first in-store request is ready-to-eat breakfastcereal (47 percent), followed by snacks (30 percent), and toys (21 percent).Requests are often made for a branded product. Isler et al. (1987) examinedthe location, types, and frequency of products that children ages 3–11 yearsrequested of their mothers over 30 days. Food accounted for more than half(55 percent) of total requests made by children and included snack and

FACTORS SHAPING FOOD AND BEVERAGE CONSUMPTION 103
dessert foods (24 percent), candy (17 percent), cereal (7 percent), quickserve restaurant foods (4 percent), and fruit and vegetables (3 percent) (Isleret al., 1987). Nearly two-thirds (65 percent) of all cereal requests were forpresweetened breakfast cereals. Research indicates that parents honorchildren’s requests for food about half of the time: carbonated soft drinks(60 percent), cookies (50 percent), and candy (45 percent) (McNeal, 1999).Dual-income families may be more likely to accommodate children’s pur-chase requests (McNeal, 1999).
Adolescents also have a strong influence on grocery store purchases. Inone national market research study, more than 60 percent of adolescentsreported that they influence their parents’ purchase of fast foods (65 per-cent), pizza (63 percent), and carbonated soft drinks (60 percent) (Zollo,1999; Chapter 4). Adolescents also shop for the family groceries. A recentstudy with 4,746 youth found that more than half (52 percent) of adoles-cent girls and boys do some food shopping each week for their family(Hanson et al., 2006). Girls, younger adolescents, youth from low-incomefamilies, and ethnic minority youth were more likely to report assistingtheir parents with food shopping.
Parents acknowledge the influence that children have on their foodpurchases. In a national market survey of 930 adult family meal planners,38 percent of parents reported that children always or often dominate din-ner grocery decisions, 52 percent said they sometimes influence dinner gro-cery decisions, and only 10 percent reported that their children never havean influence (National Pork Producers Council, 2000). Parents reportedthat their children always or often influenced grocery purchase decisionsfor snacks (75 percent), breakfast foods (72 percent), desserts (47 percent),and dinner (38 percent) (Chapter 4). Another market study on consumerdecision-making found that parents are two to three times more likely toname a child rather than themselves, as the family expert for selection offast foods, snack foods, and new breakfast cereals (USA Weekend and TheRoper Organization, 1989).
Children’s consumer socialization research has also examined brandawareness. Children as young as ages 2–3 years can recognize familiarpackages in the stores and familiar spokescharacters on products such asfood, toys, and clothing (John, 1999). By preschool, children begin to recallbrand names from seeing them advertised on television or featured onproduct packages, especially if the brand names are associated with salientcues such as cartoon spokescharacters, colors (e.g., packages), or pictures(John, 1999). Brand awareness develops first for child-oriented productcategories such as cereals, snacks, and toys. By the time they enter the firstgrade children are familiar with roughly 200 brands, the average 10-year-old recognizes 300–400 brands, and an adult recognizes about 1,500 brands(McNeal, 1999). When children make requests for foods at the supermar-

104 FOOD MARKETING TO CHILDREN AND YOUTH
ket, more than 90 percent are by brand name and of these, 82 percent arefor national brands (McNeal, 1999).
Although brand choice can be important to teenagers, they are likely toexperiment with numerous brands. Teens are much more brand loyal whenbuying personal-hygiene products than when buying food or apparel. Offood products, carbonated soft drinks and quick serve restaurants have thehighest brand loyalty among teenagers (Zollo, 1999). Because of this fact,many food and beverage marketers have intensified their efforts to developbrand relationships with young consumers (Zollo, 1999; Chapter 4). Themarketing literature clearly emphasizes that in order to develop brand loy-alty, marketing must start with young children (McNeal, 1999; Chapter 4).
Finding: Children are aware of food brands as young as 2–3 years of ageand preschoolers demonstrate brand recognition when cued by spokes-characters and colored packages. The majority of children’s food requestsare for branded products. Brand loyalty is highest in teens for carbonatedsoft drinks and quick serve restaurants.
Lifestyle Characteristics
Time and Convenience
Perceived time constraints and convenience strongly influence the foodchoices of children, adolescents, and adults (Glanz et al., 1998; Neumark-Sztainer et al., 1999). In focus groups with adolescents from low-incomefamilies in California, convenience was a major driving factor in determin-ing food choices (California Project LEAN and Food on the Run Cam-paign, 1998). In another study using focus groups, adolescents discussedwanting to sleep longer in the morning instead of taking the time to eat orprepare breakfast, not wanting to wait in a long lunch line, eating at quickserve restaurants because the food is served quickly, and choosing foods athome that can be prepared quickly (Neumark-Sztainer et al., 1999). Lackof time is also perceived as a major barrier to eating more healthfully.Adolescents often believe they are too busy to worry about food and eatingwell. Common remarks were “People our age are so busy that we don’thave enough time to change bad habits” and “We don’t have thetime . . . too many pressures” (Story and Resnick, 1986).
Cost of Food
Studies of adults have found that taste is considered to be the mostimportant influence on food selection, followed by cost (Glanz et al., 1998).Adolescents also appear to be price sensitive (California Project LEAN and

FACTORS SHAPING FOOD AND BEVERAGE CONSUMPTION 105
Food on the Run Campaign, 1998; French et al., 1997a,b, 1999, 2001a;Neumark-Sztainer et al., 1999). In one study, adolescents rated cost as thethird most important reason in selecting vending snacks after taste andhunger (French et al., 1999).
Several studies have empirically demonstrated large effects of pricereduction on sales of fresh fruits and vegetables and lower fat vendingsnacks in high school settings (French et al., 1997a,b, 2001a). A 50 per-cent price reduction on fresh fruit and vegetables increased weekly salestwo- to four-fold during a 3-week period in two high school cafeteria a lacarte areas (French et al., 1997b). In a large study involving 12 highschools and 12 worksites, price reductions on low-fat vending machinesnacks of 10, 25, and 50 percent, increased sales of these items by 9 per-cent, 39 percent, and 93 percent, respectively (French et al., 2001a). Theresults of these studies clearly show the powerful effect of price on ado-lescent’s food choices.
FAMILY AND SOCIAL INFLUENCES
Children’s and adolescents’ eating behaviors are strongly influenced bytheir social environments, especially the home and family environment.Interpersonal influences can affect eating behaviors through mechanismssuch as food availability, modeling, reinforcement, social support, and per-ceived norms.
Family
The family is a major influence on children’s and adolescents’ eatingbehavior and dietary intake. The family mediates dietary patterns in threeprimary ways: (1) the family is a provider of the foods that are availableand accessible in the home; (2) the family provides the meal structure, whenmeals occur, and what is offered; and (3) the family transmits food atti-tudes, food preferences, brand preferences, and values that may affect life-time eating habits. The home is where the majority of eating occasions andcalorie intake occur for both children and adolescents. National CSFII1994–1996 data indicate that children and adolescents ages 2–19 yearsconsumed 70 percent of their meals and 80 percent of their snacks at homeand obtained 68 percent of total calories from home (Lin et al., 1999).Younger children were more likely to eat meals and snacks at home andobtain a greater proportion of calories at home compared to adolescents;for children ages 2–5 years, 76 percent of total daily calories were eaten athome compared to 67 percent for youth ages 6–11 years and 65 percent foradolescents ages 12–19 years (Lin et al., 1999; Chapter 2).
106 FOOD MARKETING TO CHILDREN AND YOUTH
Maternal Employment
American families have undergone profound social changes in familystructure and maternal employment over the past 40 years. In 1960, only9 percent of children lived in single-parent households. In 2004, 28 percentof children lived in single-parent households, and the majority of thoseparents were mothers (U.S. Census Bureau, 2005). Also, maternal employ-ment has grown significantly in the past 30 years. From 1970 to 2000, theoverall maternal labor-force participation rate rose from 38 to 68 percent(NRC and IOM, 2003). A 2003 study showed that 60 percent of motherswith preschool children (younger than age 6 years) and 75 percent of moth-ers with children ages 6–17 years were employed in the U.S. labor force(DHHS, 2003). Of these employed mothers, 70 and 78 percent work full-time and part-time, respectively (DHHS, 2003). Trends of fewer familymeals, the increasing popularity of fast food and eating out, and the in-creased demand for convenience and prepared foods are likely related toshifts in family composition and work schedules. Family food preparationtraditionally has been largely the work of women, and although more ofthem are working outside of the home, they continue to have the greatestresponsibility for home food production (Harnack et al., 1998).
Few studies have investigated the relationship between mothers’ workstatus and children’s diets. Studies using data from the late 1980s foundthat maternal employment had no significant effect on the quality of thediets of preschool children (Johnson et al., 1992, 1993). A recent studyexplored the effects of mothers’ work on their children’s nutritional statususing CSFII data from 1994–1996 and 1998 (Crepinsek and Burstein,2004). Children ages 1–17 years with full-time working mothers had loweroverall Healthy Eating Index (HEI) scores (indicative of poorer diet qual-ity), lower intakes of iron and fiber, and higher intakes of carbonated softdrinks and fried potatoes, and were more likely to skip morning meals thanchildren of nonworking mothers. Working mothers were also more likelyto rely on away-from-home food sources. These differences remained aftercontrolling for family household characteristics, such as income and thenumber of adults in the household. Children whose mothers worked part-time had more positive eating patterns than those whose mothers workedfull-time (Crepinsek and Burstein, 2004).
A recent study assessed the effect of maternal employment on child-hood obesity using matched mother–child data from the National Longitu-dinal Survey of Youth (Anderson et al., 2003). The results indicate that themore hours the mother worked per week, the more likely a child was to beobese. Analyses by subgroups showed that higher socioeconomic statusmothers who worked more hours per week over the child’s life were themost likely to have an obese child. Potential mechanisms through which

FACTORS SHAPING FOOD AND BEVERAGE CONSUMPTION 107
children’s eating patterns and physical activity may be affected by workingparents include less time to prepare family meals, more reliance on eatingout or buying fast foods for consumption at home, and less supervision,which may lead to children preparing high-calorie and low-nutrient foodsand beverages after school or spending more time indoors (Anderson et al.,2003).
Household Socioeconomic Status
In 2003, 11.6 million, or 16 percent, of children under the age of18 years lived in families with incomes below the federal poverty level(Federal Interagency Forum on Child and Family Statistics, 2004). Evidenceshows that dietary intakes and dietary patterns in families vary dependingon economic circumstances. A recent study analyzed 24-hour recall datafrom the National Health and Nutrition Examination Survey III (1988–1994) (Fox and Cole, 2004). Three groups of children (ages 5–18 years)were compared based on household income: income at or below 130 per-cent of poverty (lowest income), income between 131 and 185 percent ofpoverty (low income), and income above 185 percent of poverty (higherincome). Children in the lowest income group were more likely than chil-dren in the higher income group to have consumed fewer than three mealsin the preceding 2 days (39 percent versus 34 percent) and were less likelyto eat breakfast every day (44 percent versus 48 percent). Overall, therewere no differences between income groups in mean usual calorie intake.However, children in the lowest income group obtained a greater percent-age of calories from fat compared to the higher income group. There wereno significant differences among income groups on mean HEI scores; thediets of 78 percent of all children showed a need for improvement, and only6 percent of children had “good” diets (Cole and Fox, 2004; Chapter 2).
Other studies have found socioeconomic status effects. National datafrom the CSFII 1989–1991 data found that lower calorie intakes werefound among children from less affluent households. In addition, childrenfrom lower income households were less likely to meet the recommenda-tions for fruit and dairy intakes (Munoz et al., 1997). Other studies havealso shown socioeconomic status differences. Adolescents in lower incomehouseholds were more likely to consume insufficient fruits and vegetables(Lowry et al., 1996; Neumark-Sztainer et al., 1996). The National Growthand Health Study with 9- to 10-year-old girls found that percentage ofcalories from fat was inversely related to family income and parental educa-tion levels (Crawford et al., 1995). However, food insecurity has not beenclearly associated with obesity in children or adolescents with the exceptionof white adolescent girls (Chapter 2).
Food costs may be one barrier to the adoption of healthier diets, espe-
108 FOOD MARKETING TO CHILDREN AND YOUTH
cially by low-income households. Calorie-dense foods, some of which arehigh in refined grains, added sugars and added fat, provide calories at a farlower cost than do lean meats, fish, and fresh vegetables and fruits(Drewnowski, 2004). Surprisingly, there are little data on what it costs toeat a healthful diet in the United States. A recent USDA analysis estimatedan annual retail price per pound for 69 types of fruits and 85 types ofvegetables (Reed et al., 2004). More than half of the fruits and vegetableswere estimated to cost 25 cents or less per serving. It was estimated thatthree servings of fruits and four servings of vegetables would cost only 64cents per day. After adjusting for waste and serving size, 63 percent of fruitsand 57 percent of vegetables were least expensive in their fresh form (Reedet al., 2004). Based on this study, it appears that consuming fresh fruits andvegetables may be very affordable. More studies need to be conducted onthe costs and perceived trade-offs of eating a healthful diet.
Food Availability
Household food availability and accessibility have been identified asstrong correlates of food intake in children and adolescents. Availabilityrefers to whether foods are present in the home, and accessibility refers towhether these are available in a form, location, or time that facilitates theirconsumption, such as precut vegetables in a plastic bag on a front shelf inthe refrigerator or a bowl of fruit on a table (Cullen et al., 2003). Usingstructural equation modeling, Neumark-Sztainer et al. (2003) found thatthe strongest correlates of fruit and vegetable intake among adolescentswere home availability of fruits and vegetables and taste preferences. Homeavailability was mediated by parental social support for healthful eating,family meal patterns, and household food security (access to an affordablefood supply). Even when taste preferences for fruits and vegetables werelow, if fruits and vegetables were available in a household, intakes in-creased. Availability of carbonated soft drinks in the home has also beenfound to be strongly associated with carbonated soft drink consumptionamong 8- to 13-year-olds (Grimm et al., 2004).
Family Meals
Recent studies suggest that family meals exert a strong influence on thedietary intake of children and adolescents. Three large population-basedstudies have all found that increasing the frequency of family meals isassociated with more healthful dietary intake patterns in children (Gillmanet al., 2000; Neumark-Sztainer et al., 2003; Videon and Manning, 2003).
Increasing the frequency of family dinner has been associated amongchildren ages 9–14 years with consumption of more fruits and vegetables;

FACTORS SHAPING FOOD AND BEVERAGE CONSUMPTION 109
less fried foods and carbonated soft drinks; less saturated fats and trans fat;more fiber, calcium, folate, and iron; and more vitamins B6, B12, C, and E(Gillman et al., 2000). The frequency of family meals and associations withdietary intake were also examined in 4,746 middle and high school students(Videon and Manning, 2003). Frequency of family meals was associatedpositively with intakes of several vitamins and minerals, fruits, vegetables,grains, and calcium-rich foods.
Parental Intakes
Parental diet has been shown to be a strong predictor of children’sintake in several studies. The strongest predictor of 2- to 6-year-old chil-dren’s fruit and vegetable consumption was parental fruit and vegetableconsumption (Cooke et al., 2003; Wardle et al., 2005). In another study,8- to 13-year-old youth whose parents regularly consumed carbonated softdrinks were nearly three times more likely to consume carbonatedsoft drinks five or more times a week compared with those whose parentsdid not regularly consume carbonated soft drinks (Grimm et al., 2004).One study found mother–daughter similarities in milk and carbonated softdrinks consumption (Fisher et al., 2000) and in fruit and vegetable intake(Fisher et al., 2002). In another study of adolescents, parental intakes werepositively associated with intake of fruits, vegetables, and dairy products ingirls and dairy products in boys (Hanson et al., 2005).
The relationship between parent and child intake may be due to acombination of factors including role modeling effects, food availability inthe home, or genetic influences (Birch, 1999; Cooke et al., 2003; Neumark-Sztainer et al., 2003). As mentioned earlier, genetic influences on foodpreferences and intakes among family members are weak. There is evidencethat supports the influence of parental role modeling on children’s eatingbehaviors (Brown and Ogden, 2004). This influence may be direct throughwhat parents actually eat or indirect through transmission of eating-relatedattitudes. The influence of parental role modeling on children’s eating isconsistent with Social Learning Theory (Bandura, 1977) and the impor-tance of observational learning and modeling (Brown and Ogden, 2004).These findings suggest the importance of making parents and caregiversaware of the critical role they play in children developing healthful eatingbehaviors. Parents and caregivers can act as role models to encourage thetasting of new foods and model healthful eating behaviors.
Child Feeding Practices
Another factor that may influence a child’s food preference and dietaryintake is child feeding practices used by parents. In a series of experimental

110 FOOD MARKETING TO CHILDREN AND YOUTH
studies with young children, feeding practices commonly used by parents—such as restricting foods considered to be less nutritious, pressuring chil-dren to eat, or using foods as rewards—have been shown to inadvertentlypromote behaviors counter to their intentions (Birch, 1999; Birch andFisher, 1998). For example, restricting access to palatable foods promoteschildren’s preference for and intake of these “forbidden foods” (Birch,1999). Forcing or pressuring children to eat certain foods decreases thepreference for that food (Birch, 1999). Rewarding children for eating adisliked food (e.g., vegetables) led to a decline in the preference of thatfood. On the other hand, if children are given both sweet and nonsweetfoods as rewards for approved behavior, the preference for those foods isenhanced. In American society, high-fat and sweet food items are usedrepeatedly in positive child contexts for rewards, treats, and celebrations,thus further reinforcing the preference for these foods. Birch (1999) alsofound that when children were offered food items that were initially neitherliked nor disliked, but were then used as rewards or associated with positiveparental attention, the preference for these foods increased. This has impli-cations for child feeding strategies; for example, using vegetables such ascarrots as rewards for young children.
Peers
Children and adolescents spend a substantial amount of time with theirpeers and friends through child-care or school settings, after-school pro-grams, sports activities, or recreation time. The social influence of the peergroup affecting food preferences and food choices is not well explored, andthe few studies done have not found consistent results. Birch (1999) foundthat preschool children began to like and eat certain vegetables they previ-ously disliked when they saw their peers eating those foods. This reinforcesthe importance of peer modeling and observational learning.
Feunekes et al. (1998) examined resemblances in high-fat foods andfood intakes within social networks of adolescents, their closest friends,and their parents. Although there were significant associations betweenparent and adolescent intakes (76–87 percent of the items on the foodfrequency), only 19 percent of the foods were correlated for adolescentsand their friends. These tended to be for snack foods. A recent study exam-ined the resemblances in food preferences between good friends in threethird-grade classrooms (Rozin et al., 2004). They found that friendship hadno effect on food preferences. It may be that preferences are mediatedthrough role modeling and that a major social influence on food prefer-ences is the preferences of an admired child who is older or media rolemodels (Rozin et al., 2004). Social influences on food intake and the mod-eling of eating behaviors of admired peers, older youth, and media or

FACTORS SHAPING FOOD AND BEVERAGE CONSUMPTION 111
celebrity role models need to be explored. Such effects would have implica-tions for designing interventions to improve eating behaviors of childrenand adolescents.
INSTITUTIONAL, NEIGHBORHOOD, ANDCOMMUNITY INFLUENCES
Child-Care Facilities
Child care is now the norm for American children. Approximately80 percent of children ages 5 years and younger with employed mothers arein a child-care arrangement for an average of almost 40 hours per week,and 63 percent of children ages 6–14 years spend an average of 21 hoursper week in the care of someone other than a parent before and after school(NRC and IOM, 2003). Nationwide, 32 percent of young children receivecenter-based care, 16 percent are in family child care, and 6 percent arecared for by a nanny or babysitter in the child’s home (Capizzano et al.,2000). Children in full-time child care can receive up to two meals andsnacks per day through federal meal programs.
The Child and Adult Care Food Program (CACFP) is a federal programproviding meals and snacks to lower income children in child-care centers,the Head Start Program, family child-care homes, and after-school pro-grams. The program serves an average of 2.9 million children per day andprovides roughly 1.7 billion meals and snacks to children annually (FRAC,2005). Child- and adult-care providers who participate in CACFP are reim-bursed at fixed rates for each meal and snack served. Given that children infull-time child care could receive up to two meals and snacks per daythrough these programs, child-care settings could have a substantial impacton children’s dietary intakes. However, there is little research that hasassessed the nutritional quality of foods in child-care settings. Few data areavailable about the types and quantities of foods and snacks served tochildren in child-care settings and their impact on dietary intake. The USDAhas established minimum requirements for the meals and snacks offered byparticipating child-care providers, but they are not required to meet specificnutrient-based standards such as those required for the National SchoolLunch Program (NSLP) and School Breakfast Program (SBP). Research isalso scarce on the impact that the CACFP program has on participants’dietary intakes, and the limited amount of research that is available is notdescriptive. A national study on CACFP-participating child-care sites foundthat the meals and snacks provided 61–71 percent of children’s daily energyneeds and more than two-thirds of the Recommended Dietary Allowance(RDA) for key nutrients. Meals and snacks exceeded the Dietary Guidelinesfor Americans for saturated fat (Fox et al., 1997).

112 FOOD MARKETING TO CHILDREN AND YOUTH
Furthermore, there is a child-care system that extends beyond CACFPand includes formal and informal care of children outside of the home. Allof these child-care settings have the potential to influence the diets of chil-dren but, as with CACFP, there is limited research on the dietary intake ofchildren in these settings.
Schools
The school food environment can have a large impact on children’sand adolescents’ dietary intake. National data show that foods eatenfrom the school cafeteria comprise 19–50 percent of students’ total dailycalorie intake during a school day (Burghardt et al., 1993; Gleason andSuitor, 2001).
Nearly all public schools and 83 percent of all public and privateschools combined participate in the NSLP (Burghardt et al., 1993; Foxet al., 2004). About three-quarters of these schools also provide breakfastthrough the SBP, which is offered in approximately 78 percent of the schoolsthat offer the NSLP (Fox et al., 2004). On an average school day, about60 percent of children in eligible schools participate in the NSLP programand about 37 percent in the SBP (Fox et al., 2004). NSLP meals are plannedto provide approximately one-third of the RDA for specific nutrients andSBP meals are planned to provide a quarter of the RDA for key nutrients.Since 1995, schools participating in the NSLP and SBP have been requiredby the USDA to offer meals that meet the standards established by theDietary Guidelines for Americans. Based on national CSFII 1994–1996data, school meal programs make an important contribution to school-aged children’s diets (Gleason and Suitor, 2001). Children who participatedin the NSLP showed higher mean intakes of food calories and many micro-nutrients, both at lunch and over 24 hours, compared to nonparticipants.SBP participation was also associated with higher intakes of calories andseveral key nutrients (Gleason and Suitor, 2001). Although schools havemade progress in improving meals through the NSLP and SBP, especially indecreasing fat content, they still have improvements to make to enhance thequality of the food served (Chapter 6).
Just over a decade ago, the NSLP was the primary provider of foodduring the school day to middle and high school students (Gleason andSuitor, 2001). Today, it represents a much smaller part of the food environ-ment. Students, especially in middle and high schools are faced with a vastarray of high-calorie (e.g., high-fat, high-sugar) food and beverage choices.These competitive foods include those sold a la carte in a cafeteria, vendingmachines, or school stores. Presently, there are no federal nutrition guide-lines for competitive foods, unlike the USDA nutrition standards for feder-ally funded school meals (Chapter 6). Over the last five years the availabil-

FACTORS SHAPING FOOD AND BEVERAGE CONSUMPTION 113
ity of competitive foods in middle schools has increased from 83 percent to97 percent (GAO, 2005). A recent national study found that most highschools offered high-fat cookies or cakes (80 percent) or fried potatoes(62 percent) in a la carte areas, and that 95 percent had vending machinesoffering carbonated soft drinks, candy, or snacks. Twenty percent of middleand high schools had contracts with quick serve restaurants (Wechsleret al., 2001). In addition, the GAO (2005) recently reported that saltysnacks, sweet-baked foods, carbonated soft drinks, and candy were avail-able in at least one-third of high schools and middle schools with competi-tive foods, although alternative foods were commonly available in all ofthese schools (e.g., water, milk, juice, fruit, yogurt).
The majority of a la carte foods offered in cafeterias or vending ma-chines are relatively high in fat and sugar and low in nutrients (Frenchet al., 2003b). Kubik et al. (2003) examined the associations between 598young adolescents’ dietary behaviors and school vending machines and ala carte programs. The availability of a la carte items was inversely associ-ated with fruit and vegetable consumption and positively associated withtotal fat and saturated fat intake. Snack vending machines were negativelyassociated with fruit consumption (Kubik et al., 2003). In a longitudinalstudy, Cullen and Zakeri (2004) found that middle school students whohad access to school snack bars consumed fewer fruits and nonstarchyvegetables, less milk, and more sweetened beverages compared to the pre-vious school year when they were in elementary school and only had ac-cess to lunch meals served at school. These studies demonstrate that thewidespread availability of high-calorie (e.g., high-fat, high-sugar) and low-nutrient foods and beverages in schools negatively impacts the diets ofchildren and adolescents. A combination of interventions and policies areneeded to reduce access to high-calorie and low-nutrient foods and bever-ages in schools and to promote more healthful options.
Quick Serve and Full Serve Restaurants
One of the most important food-related lifestyle changes of the pasttwo decades is the increase of consumption of food prepared away fromhome. Data from the CSFII indicate that Americans consume about a thirdof calories from food prepared away from home, up from less than a fifth in1977–1978 (Guthrie et al., 2002). Americans now spend 47 percent oftheir food dollars on meals and snacks obtained away from home (Stewartet al., 2004). Total away-from-home food expenditures amounted to $415billion in 2002; accounting for inflation, this is a 23 percent increase since1992 (Stewart et al., 2004). In 2002, full serve restaurants and quick serverestaurants captured the majority of the away-from-home food dollars,with 40 percent and 38 percent of total sales, respectively in 2002 (Stewart

114 FOOD MARKETING TO CHILDREN AND YOUTH
et al., 2004). Consumer spending at full serve restaurants and quick serverestaurants is expected to increase even more over the next decade, with thelarger increase at full serve restaurants (Stewart et al., 2004). Meals andsnacks consumed away from home contain more calories and total fat andsaturated fat than at-home foods (Guthrie et al., 2002; Lin et al., 1996;Chapter 2).
Quick serve restaurants are especially popular among families withchildren and adolescents because they offer convenience and relatively lowcost for the meals purchased. Children and adolescents consume the largestproportion of calories away from home at quick serve restaurants (Guthrieet al., 2002). Consumption of fast food by children ages 2–17 years in-creased five-fold from the late-1970s to the mid-1990s, from 2 percent oftotal calorie intake to 10 percent (Guthrie et al., 2002). CSFII (1994–1996and 1998) data using 24-hour diet recalls indicate that on a typical day,30 percent of children ages 4–19 years reported consuming fast food (Bow-man et al., 2004). Consumption was prevalent in both sexes, all racial/ethnic groups, and all regions of the country; increased consumption wasindependently associated with male gender, older age, higher householdincomes, non-Hispanic/Latino black individuals, and residing in the south-ern region of the United States. In a recent study, Austin et al. (2005)examined the median distance of quick serve restaurants around schools inthe Chicago area. They reported that these restaurants were clusteredaround schools, 3 to 4 times as many quick serve restaurants were withinwalking distance of the school than would be expected if the restaurantswere distributed evenly throughout the city.
Fast food consumption can have a negative impact on the nutritionalquality of children’s and adolescents’ diets. CSFII data show that childrenwho consumed fast food, compared with those who did not, consumedmore total calories (187 additional calories) and total fat, more carbonatedsoft drinks, less milk, and fewer fruits and nonstarchy vegetables. In asurvey of 4,746 multiethnic adolescents, French et al. (2001b) found thatthe frequency of quick serve restaurants use was positively associated withtotal calories, percentage of calories from fat, and daily servings of carbon-ated soft drinks and french fries, and negatively associated with daily serv-ings of fruit, vegetables, and milk. Another study (Zoumas-Morse et al.,2001) found that while restaurant meals accounted for only 6 percent of allreported eating occasions, the calorie content of those meals was 55 percenthigher than the average calorie intake of meals eaten at home.
Limited research has examined the relationships among income, race/ethnicity, and quick serve restaurants relative to neighborhood socio-demographic characteristics. Morland et al. (2002b) examined this rela-tionship in a four-state multiethnic study and found no consistentrelationship between wealth (as measured by median home values) and

FACTORS SHAPING FOOD AND BEVERAGE CONSUMPTION 115
eating at quick serve restaurants. They also found no difference betweenthe numbers of quick serve restaurants in African American and whiteneighborhoods. Block et al. (2004) reported contrasting results in a studyusing geocoding in New Orleans, Louisiana. They found that predomi-nantly African American neighborhoods have 2.4 quick serve restaurantsper square mile compared to 1.5 restaurants in predominantly whiteneighborhoods. However, population density was not controlled for in theanalysis. More studies are needed to examine the geographic associationbetween neighborhood quick serve restaurants density and low-incomeand ethnic and racial neighborhoods.
A recent study by Lewis et al. (2005) examined availability and foodoptions at 659 restaurants in less affluent and more affluent areas in LosAngeles County to compare residents’ access to healthful meals preparedand purchased away from home. Poorer neighborhoods with a higher popu-lation of African American residents had fewer healthful options available,both in food selection and in food preparation, and the neighborhoodrestaurants heavily promoted the less healthful food options. The resultsindicate that the food environment in poorer neighborhoods makes it diffi-cult for residents to eat healthful foods away from home.
Because Americans are eating out more frequently, eating more fruitsand vegetables is a challenge. Food eaten away from home accounts for lessthan a half a serving of fruit, and one-and-a-quarter servings of vegetables.Fried potatoes make up approximately 35 percent of vegetables eaten awayfrom home, compared with 10 percent of at-home vegetable consumption(Guthrie et al., 2005).
Neighborhood Characteristics and Food Retail Outlets
Neighborhood grocery stores or supermarkets are important contribu-tors to the eating patterns and nutrient intakes of residents. Studies showthat more affluent neighborhoods have greater access to supermarkets andhealthful foods than low-income neighborhoods. Direct links have beenobserved between access to supermarkets and healthier dietary intake(Cheadle et al., 1991; Glanz and Yaroch, 2004; Laraia et al., 2004). How-ever, nearly all of this research has been conducted with adults, not withchildren or adolescents. A recent study found that adult fruit and veg-etable intake increased with each additional supermarket in a census tract;African Americans’ fruit and vegetable intake increased by 32 percent foreach additional supermarket and whites’ intake increased by 11 percent(Morland et al., 2002a).
Supermarkets offer the greatest variety of food at the lowest cost.However, supermarkets are less prevalent in low-income neighborhoods(Horowitz et al., 2004; Morland et al., 2002b). In a multiethnic study using
116 FOOD MARKETING TO CHILDREN AND YOUTH
census tract data across four states in different regions of the United States,Morland et al. (2002b) found that low-income neighborhoods had threetimes fewer supermarkets but comparable numbers of small grocers andconvenience stores as middle- and upper-income neighborhoods. Zenk et al.(2005) evaluated the spatial accessibility of large chain supermarkets inrelation to neighborhood racial composition and poverty in metropolitanDetroit using a geographic information system. Distance to the nearestsupermarket was similar among the least impoverished neighborhoods,regardless of racial composition. However, the most impoverished neigh-borhoods in which African Americans lived were an average of 1.1 milesfarther from the nearest supermarket than were white neighborhoods.Laraia et al. (2004) found that pregnant women living greater than 4 milesfrom a supermarket were more than twice as likely to have poorer qualitydiets compared to women living within 2 miles of a supermarket, even aftercontrolling for individual socioeconomic status characteristics and the avail-ability of grocery and convenience stores. In a much smaller study, childfruit and vegetable consumption was not significantly associated with avail-ability in grocery stores (Edmonds et al., 2001).
Food retail stores in low-income neighborhoods may also offer a differ-ent mix of food. Horowitz et al. (2004) compared the selections in foodstores in two adjacent New York City neighborhoods; a low-income minor-ity neighborhood in East Harlem and an affluent, predominantly whiteneighborhood on the Upper East Side. Five types of products were assessed:fresh fruits, fresh green vegetables or tomatoes, high-fiber bread, low-fatmilk, and diet carbonated soft drinks. Only 18 percent of East Harlemstores stocked these foods, compared with 58 percent of stores on theUpper East Side. Only 9 percent of East Harlem bodegas (small storesserving Hispanics/Latinos) carried all items versus 48 percent of Upper EastSide bodegas. Collectively, these studies suggest the importance of the localneighborhood food environment for influencing diet quality.
MACROSYSTEM INFLUENCES
Individual food choices depend greatly on sociocultural, marketing,and economic systems that govern food production, distribution, and con-sumption. The federal nutrition assistance programs and government poli-cies can also impact the diets of participants.
Culture and Values
Cultural factors influence food behavior. Values and beliefs are coreaspects of any culture and shape perceptions of food, health, and well-being. In addition to shared belief and value systems, hallmarks of culture

FACTORS SHAPING FOOD AND BEVERAGE CONSUMPTION 117
include language, social relationships, institutions, clothing, music, andfoods. Culture embodies a socially grounded way of learning that shapesthe way an individual thinks, feels, and acts (IOM, 2002). Cultural behav-iors, values, and beliefs are learned in childhood, are transmitted from onegeneration to the next, and are often deeply held. Individuals learn to makesense of the outside world within a cultural framework and cultural pro-cesses. Within every culture, intracultural variation exists that cuts acrossethnic, regional, geographic, gender, and generational domains. There isalso much shared across seemingly diverse cultures. For example, mediaexposure (e.g., television) increases similarity across cultures. Likewise, thereare examples of large quick serve restaurants and food and beverage com-panies that have restaurants and distribute their products in many countriesaround the world today and therefore may promote common food prefer-ences among people worldwide. The growing ethnic diversity in the UnitedStates and the continuous influx of new immigrants has also contributed toexposure to new foods and preparation methods and to shifts in foodpreferences, as well as an expansion of the American food repertoire.
Food behaviors are learned through enculturation, which is the processby which culture is transmitted from one generation to the next. Cultureinfluences a child’s eating behaviors both directly and indirectly. Directinfluence occurs through parents, care providers, siblings, or peers. Indirectacquisition occurs through observed social norms or through marketingand the media (e.g., advertising, television, videos, movies, Internet) (Chap-ter 4).
Cultural values and traditions can also mediate or moderate body im-age and how obesity is perceived. Physical appearance and how one looks isan important issue in the lives of children and adolescents. Perception ofoverall appearance including body image is an important component ofglobal self-esteem among children and adolescents (Levine and Smolak,2002; Smolak and Levine, 2001). How much one weighs, usually an out-come of eating patterns, strongly influences physical appearance and self-image, especially for girls. Girls’ concern about physical appearance is oftenlinked to their weight or body shape, and weight concerns and the desire tobe thin appear to be developing at earlier ages. Research suggests that about20 percent of 5-year-old girls (Davison et al., 2000), 30–45 percent of 8- to13-year-old girls (Field et al., 1999a; Schreiber et al., 1996), and roughly40–70 percent of adolescent girls (Levine and Smolak, 2002; Story et al.,1995) report concerns about their weight and a desire to be thinner. Thewidespread nature of weight and body shape dissatisfaction in adolescentgirls is characterized as “normative discontent” (Levine and Smolak, 2002).
In a study of multiethnic girls in middle and high school, only a quarter(27 percent) had high body satisfaction (Kelly et al., 2005). High bodysatisfaction was most common among African American girls (47 percent)

118 FOOD MARKETING TO CHILDREN AND YOUTH
and underweight girls (39 percent). Hispanic/Latina, Asian, and AmericanIndian girls report body dissatisfaction as frequently as or more frequentlythan white girls (Robinson et al., 1996; Story et al., 1995).
Children and adolescents who have higher levels of body dissatisfactionand body image concerns report lower global self-worth and poorer self-esteem (Ricciardelli and McCabe, 2001; Smolak and Levine, 2001). Dissat-isfaction with weight and shape and a poor body image is linked to dieting,less healthful weight control methods, depression, anxiety and eating disor-ders (Davison et al., 2003; Ohring et al., 2002; Stice and Whitenton, 2002).Body dissatisfaction tends to be higher in boys and girls who are heavier,although it is not restricted to those who are obese (Davison et al., 2003;Levine and Smolak, 2002; Ricciardelli and McCabe, 2001).
Gender differences in body satisfaction become apparent in late child-hood. Girls have a higher prevalence of body dissatisfaction than boys andchoose thinner “ideal” images for themselves (Cohane and Pope, 2001).Few studies have been conducted with boys, but recent studies report sub-stantial numbers of adolescent boys who have weight concerns and aredissatisfied with their bodies (Labre, 2002; McCabe and Riccariardelli,2004; Story et al., 1995). Preadolescent boys are largely satisfied with theirbodies, with about one-third wanting to be thinner (McCabe andRicciardelli, 2004). Adolescent boys tend to be equally divided betweenwanting to lose weight and gain weight (Cohane and Pope, 2001; McCabeand Ricciardelli, 2004). Recent reviews suggest that as the male body idealhas become increasingly muscular, body dissatisfaction has increased amongadolescent males (Labre, 2002).
A major source of body dissatisfaction among girls and boys are theperceived societal pressures for them to conform to the sociocultural idealfor beauty and attractiveness (Levine and Smolak, 2002; McCabe andRicciardelli, 2004). Sociocultural standards for males emphasize strengthand muscularity and this standard appears to be consistent across a broadrange of cultural groups (McCabe and Ricciardelli, 2004). Socioculturalideals of beauty for girls emphasize thinness, although this is less pro-nounced for African American girls (Levine and Smolak, 2002). AfricanAmerican girls are more satisfied with their bodies than white, Hispanic/Latina or American Indian girls (Kelly et al., 2005). Nichter (2000) con-ducted serial in-depth interviews with middle school and high school girlsand found that African American girls were much more likely to be satisfiedwith their bodies than were the white girls. African American girls ex-pressed that beauty was a matter of projecting attitude and moving withconfidence and style rather than being thin (Nichter, 2000).
Cross-sectional surveys find that greater exposure to teen media isassociated with higher weight concern (Field et al., 1999b; McCabe et al.,2002). It is hypothesized that mass media—with the pervasive emphasis on

FACTORS SHAPING FOOD AND BEVERAGE CONSUMPTION 119
an ideal body shape that is often unrealistically thin—is associated withinternalization of the slender beauty ideal, and resulting increases in bodydissatisfaction among girls (Levine and Smolak, 2002). However, superim-posed on the backdrop of a “thin-ideal” for girls is the wide range of otherinfluences on girls’ lives, including cultural factors and the subculture of herfamily and friends, her personal attitudes and related experiences. Thesefactors may serve to reinforce sociocultural pressures or may act as a pro-tective buffer and promote high body satisfaction.
The eating behaviors and physical inactivity associated with obesityhave become the social norm in many communities across the United States(IOM, 2005a). Understanding the audience and the cultural and socialcontext is the first step in designing successful health-promotion interven-tions (IOM, 2002). In order to be effective, nutrition and health-promotionand disease-prevention interventions need to be sensitive to salient culturalvalues. As individuals, families, institutions, and organizations across theUnited States make behavioral changes, social norms are also likely tochange, so that healthful eating and regular physical activity will be theaccepted and encouraged standard (IOM, 2005a).
Food Production, Processing, and Distribution Systems
The U.S. food system is a vital part of the American economy. In2000, the food marketing system accounted for 7.7 percent of the U.S.gross domestic product and employed more than 12 percent of theU.S. labor force (Martinez, 2002). An increasing share of what consum-ers spend on food goes to marketing services added after the productleaves the farm. In 2000, more than 80 percent of the U.S. food dollarwent toward value-added services and materials—processing, distribu-tion, labor, packaging, and transportation. An efficient food system hasresulted in an abundant and affordable food supply. Income growth hasoutpaced increases in food expenditures, leading to continuous reduc-tions in the share of income spent on food (Martinez, 2002). Americansnow spend less of their income on food than ever before. In 2003, expen-ditures for food accounted for 13.1 percent of disposable income, with7.7 percent spent for foods at home and 5.4 percent for foods acquiredaway from home (U.S. Department of Labor and U.S. Bureau of LaborStatistics, 2005; Chapter 4).
The American food supply arises from a combination of domestic agri-cultural production and imported foodstuffs. What is actually producedand imported depends on business practices in purchasing, processing, dis-tributing, and marketing food, and these practices are influenced by gov-ernment policy and regulation. Consumer and institutional food purchases,in turn, create the markets to which businesses respond.

120 FOOD MARKETING TO CHILDREN AND YOUTH
An analysis of the American food supply as it existed in 1996 did notmatch dietary recommendations according to the Food Guide Pyramid. TheAmerican food supply contained more grains, fats, and sugars than recom-mended, and less fruit, vegetables, dairy, and meat (Kantor, 1998). It is notclear that this imbalance between the actual food supply and healthful dietscan be largely attributed to consumer demand because American agricul-ture is not purely market-driven. Government policies provide selectivesubsidies for some types of agriculture, make public lands available foractivities such as cattle grazing, impose selective import restrictions andtariffs, and constrain agricultural practices for environmental and healthpurposes (Chapter 6). Consequently, some foods are relatively inexpensiveand available in great supply, whereas others are more expensive and notwidely available.
Many foods do not require intense processing and preparation. Theseinclude vegetables, fruits, nuts, meats, and dairy. These foods often haveshort shelf lives and require refrigeration. Branding is a marketing featurethat provides a name or symbol that legally identifies a company or itsproduct and serves as a differentiation in the marketplace (Roberts, 2004).Traditionally, these foods are not strongly associated with particular brands.More recently, branding has emerged as an important differentiation forthese product categories in the marketplace. As generic foodstuffs, they arealso not heavily advertised and marketed when compared to company-specific product brands.
In contrast, many manufactured foods require considerable processingbefore they are distributed. These foods include prepared entrees, bakedgoods, salty snacks, confectioneries, and carbonated soft drinks. Many ofthese foods are processed and manufactured to have long shelf lives andfrequently do not require refrigeration. These processed foods are morelikely to be strongly branded and heavily marketed and advertised. Theimbalance between the food supply and the USDA food guidance systemroughly approximates the differences between generic unprocessed foodsand branded processed foods. The latter are much more likely to containadded sugars, sodium, fats, and oils and are also most heavily promotedthrough marketing communication efforts (Chapter 4). Branding does notdetermine the healthfulness of a food. Rather, the degree of processing,added sugar, fat, or salt, and nutrient content will determine the healthful-ness of foods and beverages.
Food Marketing, Media, and Advertising
One socializing force that potentially impacts children’s eating behav-ior is the media. Today’s youth live in a media-saturated environment

FACTORS SHAPING FOOD AND BEVERAGE CONSUMPTION 121
(Rideout et al., 1999; Roberts et al., 2005). Advertising and other forms ofmarketing permeate nearly all media platforms to which youth are exposed(Brown and Witherspoon, 2002). Children and adolescents are currentlyexposed to an increasing and unprecedented amount of advertising, mar-keting, and commercialism through a wide range of vehicles and venues(Chapter 4). Over the past 35 years, there has been growth in a marketingresearch enterprise specifically focused on catering to the preferences anddesires of children and youth.
Federal Food Assistance Programs
The nation’s domestic federal nutrition assistance programs provide animportant source of food for many low-income children and adults. One infive Americans receive food assistance from at least one of the 15 nutritionassistance programs over the course of a year (USDA, 2005; Chapter 6).The USDA administers these programs that are designed to provide chil-dren and low-income households with access to food and a more nutritiousdiet, to provide nutrition education, and to assist America’s farmers bygiving them an outlet for distributing foods purchased under farmer assis-tance programs (Levedahl and Oliveira, 1999). Even with these programs,some low-income households may still not get adequate amounts of high-quality food (Levedahl and Oliveira, 1999).
Expenditures for USDA’s 15 nutrition assistance programs totaled $46billion in 2004. Five programs accounted for 94 percent of USDA’s totalexpenditures for food assistance—the Food Stamp Program (FSP); NSLP;SBP; Special Supplemental Nutrition Program for Women, Infants and Chil-dren (WIC); and CACFP. The FSP is the principal food assistance program,serving 1 in 12 Americans, or nearly 24 million low-income people permonth, more than half of whom are children (USDA, 2005). The FSPprovides recipients with a monthly allotment of coupons that can be re-deemed for food at authorized food retail stores. Few restrictions are placedon what foods recipients can purchase. Recently, there have been targetedefforts to strengthen and reshape nutrition education in the FSP to helpmotivate consumers to choose healthful foods.
The WIC program provides 8 million participants with supplementalfood packages each month. Participants include at-risk, low-income preg-nant, breastfeeding, and postpartum women, as well as children up to age5 years, who constitute 76 percent of all WIC participants (IOM, 2005b).Half of U.S. infants and one in four young children participate in WIC. AnIOM committee recently reviewed the WIC food packages and providedcomprehensive recommendations to improve its contents, such as addingmore fruits and vegetables; adding more high-calcium food choices such as
122 FOOD MARKETING TO CHILDREN AND YOUTH
yogurt, soymilk, and tofu; and expanding culturally acceptable food op-tions (IOM, 2005b).
The Child Nutrition Programs, which include the NSLP, SBP, CACFP,and the Summer Food Programs, target children enrolled in public andnonprofit private schools, child-care institutions, and summer recreationprograms. The NSLP discussed earlier is the largest of these programs,serving almost 29 million children every school day. Nearly half (49 per-cent) of the school lunches served are provided free to students and another10 percent are provided at a reduced price (USDA, 2005). In recent years,there has been an increased emphasis on providing more nutritious foodthrough these programs (Levedahl and Oliveira, 1999). Concern has cen-tered on improving the quality of foods served in these programs, increas-ing the availability of fruits and vegetables, and improving the nutritionalquality of commodity foods. Recently, efforts have been made to pilotprograms to promote fresh fruits and vegetables in schools. The 2002 FarmBill provided funds for the Fruit and Vegetable Pilot Program (FVPP) in 25schools in four states and one Indian reservation (ERS, 2002). The recentChild Nutrition and WIC Reauthorization Act expanded the program tofour more states and two more Indian reservations (Committee on Educa-tion and the Workforce, 2004).
Although the USDA’s nutrition assistance programs vary greatly insize, target populations, and delivery mechanisms, they all provide childrenof low-income households with food, the means to purchase food, andnutrition education. Although the food assistance programs have beenshown to increase the quantity of food consumed by participants, the effectof these programs on improving the quality of their diets has been moredifficult to ascertain (Levedahl and Oliveira, 1999). Although a number ofstudies have attempted to quantify the effects of the nutrition assistanceprograms, there has been no comprehensive assessment of the effects of theprograms on the diet and health outcomes of participants. A recent USDA-funded study reviewed research on the impact of the USDA’s nutritionassistance programs on participants’ health and diet outcomes. The mainconclusion is that findings must be interpreted with caution due to thelimitations of the studies (Fox et al., 2004). For targeted programs such asWIC, the NSLP, and SBP, nutrient intake is generally increased. The FSPincreases household food intake, although whether nutritional quality ishigher is unclear (Fox et al., 2004). There is a need for a well-designedcomprehensive study on how nutrition and health status are impacted byparticipation in nutrition assistance programs.
Nutrition assistance programs serve a large proportion of low-incomechildren who need these programs to meet their daily calorie and nutri-tional needs. These children should have access to nutrient-rich foods thatare ethnically and culturally appropriate. The USDA could explore innova-

FACTORS SHAPING FOOD AND BEVERAGE CONSUMPTION 123
tive pilot programs to increase access to healthful foods or provide incen-tives for the purchase of these items. Examples include further expandingthe FVPP to more schools; supporting farm-to-school programs, schoolgardens, and WIC gardens, ensuring that food stamp recipients have accessto supermarkets, farmers’ markets, and other venues to provide fresh, high-quality, and affordable produce, and other healthful foods, fruit and veg-etable vouchers, or bonus coupons for food stamp users (IOM, 2005a;Chapter 6).
Government Regulations and Policies
Government policies and regulations related to food and agriculturecan directly and indirectly affect the supply or prices of food, the nutritionalcomposition of foods, food safety, the information consumers receive aboutfood, and consumer confidence in the food supply, all of which can influ-ence consumer food choices (Ralston, 1999). As discussed in more depth inChapter 6, the effects of policies and regulations, such as subsidies andtaxation, on food choices depends on how the policy affects the cost ofproducing commodities, how those costs relate to final retail prices, howresponsive consumers are to price changes, and how the policy directlyinfluences consumer preference for the product (Ralston, 1999).
A highly productive and efficient agriculture production system con-tributes to an ample supply of food in the United States. However, there hasbeen little examination of how agricultural and economic public policiesand the resulting food and agricultural environment affect food choice orobesity (Tillotson, 2004), including how the types and quantities of foodsavailable through the federal food and nutrition assistance programs influ-ence healthy diets for children and youth.
SUMMARY
The committee’s review of the elements shaping the food and beverageconsumption of children and adolescents underscores the importance ofusing an ecological perspective to understand the interactions among fac-tors that influence food preferences and eating behaviors. Multiple influ-ences—individual and developmental factors, family and social elements,institutions, communities, and macrosystems—interact to shape the foodand beverage consumption patterns of children and youth. This ecologicalperspective can be used to develop more effective strategies and programsto improve dietary behaviors.
Nutrition knowledge of children and youth by itself does not necessar-ily motivate their food choices and dietary behaviors. Food preferencesdevelop as early as ages 2–3 years and are shaped by a child’s early experi-
124 FOOD MARKETING TO CHILDREN AND YOUTH
ences, positive or negative conditioning, exposure to foods, and a biologicalpredisposition to prefer sweet, high-fat, and salty foods. Thus, the challengeof helping young people adopt healthful eating behaviors will require mul-tifaceted and coordinated efforts aimed at the individual and family, thephysical environment such as schools and neighborhoods, the macrosystemsuch as the food marketing system, and government policies and regula-tions. These efforts need to focus on changing individual behaviors, thesocial environment, and social norms around eating behaviors. Individualchange is more likely to be facilitated and sustained in an environment thatsupports healthful food choices. Special attention needs to be focused onensuring that low-income and ethnic minority children and youth haveaccess to healthful and nutritious foods and beverages.
REFERENCES
Anderson PM, Butcher KF, Levine PB. 2003. Maternal employment and overweight children.J Health Econ 22(3):477–504.
Austin SB, Melly SJ, Sanchez BN, Patel A, Buka S, Gortmaker SL. 2005. Clustering of fast-food restaurants around schools: A novel application of spatial statistics to the study offood environments. Am J Public Health 95(9):1575–1581.
Axelson ML, Federline TL, Brinberg D. 1985. A meta-analysis of food- and nutrition-relatedresearch. J Nutr Ed 17(2):51–54.
Bandura A. 1977. Social Learning Theory. Englewood Cliffs, NJ: Prentice-Hall, Inc.Baranowski T, Domel S, Gould R, Baranowski J, Leonard S, Treiber F, Mullis R. 1993.
Increasing fruit and vegetable consumption among 4th and 5th grade students: Resultsfrom focus groups using reciprocal determinism. J Nutr Ed 25(3):114–120.
Baranowski T, Pery CL, Parcel GS. 2002. How individuals, environments, and health be-havior interact. In: Glanz K, Rimer BK, Lewis FM, eds. Health Behavior and HealthEducation. Theory, Research, and Practice. 3rd ed. San Francisco, CA: Jossey-Bass.Pp. 165–184.
Barr SI. 1994. Associations of social and demographic variables with calcium intakes of highschool students. J Am Diet Assoc 94(3):260–269.
Barr SI. 1995. Dieting attitudes and behavior in urban high school students: Implications forcalcium intake. J Adolesc Health 16(6):458–464.
Beauchamp GK, Moran M. 1982. Dietary experience and sweet taste preference in humaninfants. Appetite 3(2):139–152.
Bell EA, Rolls BJ. 2001. Regulation of energy intake: Factors contributing to obesity. In:Bowman BA, Russell RM, eds. Present Knowledge in Nutrition. 8th ed. Washington,DC: International Life Sciences Institute Press. Pp. 31–40.
Benton D. 2004. Role of parents in the determination of the food preferences of children andthe development of obesity. Int J Obes Relat Metab Disord 28(7):858–869.
Birch LL. 1999. Development of food preferences. Annu Rev Nutr 19:41–62.Birch LL, Fisher JO. 1998. Development of eating behaviors among children and adolescents.
Pediatrics 101(3 Pt 2):539–549.Block JP, Scribner RA, DeSalvo KB. 2004. Fast food, race/ethnicity, and income: A geo-
graphic analysis. Am J Prev Med 27(3):211–217.

FACTORS SHAPING FOOD AND BEVERAGE CONSUMPTION 125
Bowman SA, Gortmaker SL, Ebbeling CB, Pereira MA, Ludwig DS. 2004. Effects of fast-foodconsumption on energy intake and diet quality among children in a national householdsurvey. Pediatrics 113(1):112–118.
Brown JD, Witherspoon EM. 2002. The mass media and American adolescents’ health. JAdolesc Health 31(6 suppl):153–170.
Brown R, Ogden J. 2004. Children’s eating attitudes and behaviour: A study of the modellingand control theories of parental influence. Health Ed Res 19(3):261–271.
Burghardt J, Gordon A, Chapman N, Gleason P, Fraker T. 1993. The School NutritionDietary Assessment Study: School Food Service, Meals Offered, and Dietary Intakes.Washington, DC: U.S. Department of Agriculture.
California Project LEAN and Food on the Run Campaign. 1998. A Focus Group Report onAdolescent Behaviors, Perceptions, Values and Attitudes on Health, Nutrition and Physi-cal Activity. A Qualitative Exploration. Sacramento, CA: California Department ofHealth/Public Health Institute.
Capizzano J, Adams G, Sonenstein F. 2000. Child care arrangements for children under five:Variation across states. In: New Federalism. National Survey of America’s Families.Report No. B-7. Washington, DC: The Urban Institute.
Cartwright M, Wardle J, Steggles N, Simon AE, Croker H, Jarvis MJ. 2003. Stress anddietary practices in adolescents. Health Psychol 22(4):362–369.
Cheadle A, Psaty BM, Curry S, Wagner E, Diehr P, Koepsell T, Kristal A. 1991. Community-level comparisons between the grocery store environment and individual dietary prac-tices. Prev Med 20(2):250–261.
Cohane GH, Pope HG Jr. 2001. Body image in boys: A review of the literature. Int J EatDisord 29(4):373–379.
Cole N, Fox MK. 2004. Nutrition and Health Characteristics of Low-Income Participants.Volume II, WIC Program Participants and Nonparticipants. Report No. E-FAN-04-014-2. Washington, DC: Economic Research Service, U.S. Department of Agriculture.
Committee on Education and the Workforce. 2004. Child Nutrition and WIC Reauthoriza-tion Act Bill Summary. [Online]. Available at: http://edworkforce.house.gov/issues/108th/education/childnutrition/billsummaryfinal.htm [accessed August 22, 2005].
Cooke LJ, Wardle J, Gibson EL, Saponchnik M, Sheiham A, Lawson M. 2003. Demographic,familial and trait predictors of fruit and vegetable consumption by pre-school children.Pub Health Nutr 7(2):295–302.
Crawford PB, Obarzanek E, Schreiber GB, Barrier P, Goldman S, Frederick MM, Sabry ZI.1995. The effects of race, household income, and parental education on nutrient intakesof 9- and 10-year-old girls. NHLBI Growth and Health Study. Ann Epidemiol 5(5):360–368.
Crepinsek MK, Burstein NR. 2004. Maternal Employment and Children’s Nutrition. VolumeI, Diet Quality and the Role of the CACFP. Report No. E-FAN-04-006-1. Washington,DC: Economic Research Service, U.S. Department of Agriculture.
Cullen KW, Zakeri I. 2004. Fruits, vegetables, milk, and sweetened beverages consumptionand access to a la carte/snack bar meals at school. Am J Public Health 94(3):463–467.
Cullen KW, Baranowski T, Owens E, Marsh T, Rittenberry L, de Moor C. 2003. Availability,accessibility, and preferences for fruit, 100% fruit juice, and vegetables influence chil-dren’s dietary behavior. Health Ed Behav 30(5):615–626.
Davison KK, Markey CN, Birch LL. 2000. Etiology of body dissatisfaction and weight con-cerns among 5-year-old girls. Appetite 35(2):143–151.
Davison KK, Markey CN, Birch LL. 2003. A longitudinal examination of patterns in girls’weight concerns and body dissatisfaction from ages 5 to 9 years. Int J Eat Disord33(3):320–332.

126 FOOD MARKETING TO CHILDREN AND YOUTH
de Castro JM, Plunkett S. 2002. A general model of intake regulation. Neurosci BiobehavRev 26(5):581–595.
DHHS (U.S. Department of Health and Human Services). 2003. Child Health USA 2002.Rockville, MD: DHHS.
DHHS and USDA (U.S. Department of Agriculture). 2005. Dietary Guidelines for Americans2005. [Online]. Available: http://www.healthierus.gov/dietaryguidelines [accessed Janu-ary 12, 2005].
Drewnowski A. 1997. Taste preferences and food intake. Annu Rev Nutr 17:237–253.Drewnowski A. 1998. Energy density, palatability, and satiety: Implications for weight con-
trol. Nutr Rev 56(12):347–353.Drewnowski A. 2004. Obesity and the food environment: Dietary energy density and diet
costs. Am J Prev Med 27(3 suppl):154–162.Drewnowski A, Hann C. 1999. Food preferences and reported frequencies of food consump-
tion as predictors of current diet in young women. Am J Clin Nutr 70(1):28–36.Drewnowski A, Levine AS. 2003. Sugar and fat—from genes to culture. J Nutr 133(3):
829S–830S.Edmonds J, Baranowski T, Baranowski J, Cullen KW, Myres D. 2001. Ecological and socio-
economic correlates of fruit, juice, and vegetable consumption among African-Americanboys. Prev Med 32(6):476–481.
ERS (Economic Research Service). 2002. Farm Policy. Title IV Nutrition Programs. [Online].Available at: http://www.ers.usda.gov/Features/farmbill/titles/titleIVnutritionprograms.htm [accessed August 22, 2005].
Federal Interagency Forum on Child and Family Statistics. 2004. America’s Children in Brief:Key National Indicators of Well-being, 2004. Washington, DC: U.S. Government Print-ing Office.
Feunekes GI, de Graaf C, Meyboom S, van Staveren WA. 1998. Food choice and fat intakeof adolescents and adults: Associations of intakes within social networks. Prev Med27(5 Pt 1):645–656.
Field AE, Camargo CA Jr, Taylor CB, Berkey CS, Frazier AL, Gillman MW, Colditz GA.1999a. Overweight, weight concerns, and bulimic behaviors among girls and boys. J AmAcad Child Adolesc Psychiatry 38(6):754–760.
Field AE, Cheung L, Wolf AM, Herzog DB, Gortmaker SL, Colditz GA. 1999b. Exposure tothe mass media and weight concerns among girls. Pediatrics 103(3):E36.
Fisher JO, Mitchell DC, Smiciklas-Wright H, Birch LL. 2000. Maternal milk consumptionpredicts the tradeoff between milk and soft drinks in young girls’ diets. J Nutr 131(2):246–250.
Fisher JO, Mitchell DC, Smiciklas-Wright H, Birch LL. 2002. Parental influences on younggirls’ fruit and vegetable, micronutrient, and fat intakes. J Am Diet Assoc 102(1):58–64.
Fox MK, Cole N. 2004. Nutrition and Health Characteristics of Low-Income PopulationsVolume III, School Age Children. Report No. E-FAN-04-014-3. Washington, DC: Eco-nomic Research Service, U.S. Department of Agriculture.
Fox MK, Glantz FB, Geitz L, Burstein N. 1997. Early Childhood and Child Care Study.Nutritional Assessment of the CACFP: Final Report. Volume II. Cambridge, MA: AbtAssociates, Inc.
Fox MK, Hamilton W, Lin BH. 2004. Effects of Food Assistance and Nutrition Programs onNutrition and Health. Volume 4. Food Assistance and Nutrition Research ProgramReport No 19-4. Washington, DC: U.S. Department of Agriculture.
FRAC (Food Research and Action Center). 2005. Federal Food Programs. Child and AdultCare Food Program. [Online] Available: http://www.frac.org/html/federal_food_programs/programs/cacfp.html [accessed August 19, 2005].

FACTORS SHAPING FOOD AND BEVERAGE CONSUMPTION 127
French SA, Perry CL, Leon GR, Fulkerson JA. 1995. Dieting behaviors and weight changehistory in female adolescents. Health Psychol 14(6):548–555.
French SA, Jeffery RW, Story M, Hannan P, Snyder MP. 1997a. A pricing strategy to pro-mote low-fat snack choices through vending machines. Am J Public Health 87(5):849–851.
French SA, Story M, Jeffery RW, Snyder P, Eisenberg M, Sidebottom A, Murray D. 1997b.Pricing strategy to promote fruit and vegetable purchase in high school cafeterias. J AmDiet Assoc 97(9):1008–1010.
French SA, Story M, Hannan P, Breitlow KK, Jeffery RW, Baxter JS, Snyder MP. 1999.Cognitive and demographic correlates of low-fat vending snack choices among adoles-cents and adults. J Am Diet Assoc 99(4):471–475.
French SA, Jeffery RW, Story M, Breitlow KK, Baxter JS, Hannan P, Snyder MP. 2001a.Pricing and promotion effects on low-fat vending snack purchases: The CHIPS Study.Am J Public Health 91(1):112–117.
French SA, Story M, Neumark-Sztainer D, Fulkerson JA, Hannan P. 2001b. Fast food restau-rant use among adolescents: Associations with nutrient intake, food choices and behav-ioral and psychosocial variables. Int J Obes Relat Metab Disord 25(12):1823–1833.
French SA, Lin BH, Guthrie JF. 2003a. National trends in soft drink consumption amongchildren and adolescents age 6 to 17 years: Prevalence, amounts, and sources, 1977/1978 to 1994/1998. J Am Diet Assoc 103(10):1326–1331.
French SA, Story M, Fulkerson JA, Gerlach AF. 2003b. Food environment in secondaryschools: A la carte, vending machines, and food policies and practices. Am J PublicHealth 93(7):1161–1167.
Fulkerson JA, French SA, Story M. 2004a. Adolescents’ attitudes about and consumption oflow-fat foods: Associations with sex and weight-control behaviors. J Am Diet Assoc104(2):233–237.
Fulkerson JA, Sherwood NE, Perry CL, Neumark-Sztainer D, Story M. 2004b. Depressivesymptoms and adolescent eating and health behaviors: A multifaceted view in a popula-tion-based sample. Prev Med 38(6):865–875.
GAO (U.S. Government Accountability Office). 2005. School Meal Programs. CompetitiveFoods are Widely Available and Generate Substantial Revenues for Schools. Report No.GAO-05-563. Washington, DC: GAO.
Gibson EL, Wardle J, Watts CJ. 1998. Fruit and vegetable consumption, nutritional knowl-edge and beliefs in mothers and children. Appetite 31(2):205–228.
Gillman MW, Rifas-Shiman SL, Frazier AL, Rockett HR, Camargo CA Jr, Field AE, BerkeyCS, Colditz GA. 2000. Family dinner and diet quality among older children and adoles-cents. Arch Fam Med 9(3):235–240.
Glanz K, Yaroch AL. 2004. Strategies for increasing fruit and vegetable intake in grocery storesand communities: Policy, pricing, and environmental change. Prev Med 39(suppl2):S75–S80.
Glanz K, Basil M, Maibach E, Goldberg J, Snyder D. 1998. Why Americans eat what they do:Taste, nutrition, cost, convenience, and weight control concerns as influences on foodconsumption. J Am Diet Assoc 98(10):1118–1126.
Gleason P, Suitor C. 2001. Children’s Diets in the Mid-1990s: Dietary Intake and Its Rela-tionship with School Meal Participation. Report No. CN-01-CD1. Alexandria, VA: U.S.Department of Agriculture, Food and Nutrition Service, Office of Analysis, Nutritionand Evaluation.
Grimm GC, Harnack L, Story M. 2004. Factors associated with soft drink consumption inschool-aged children. J Am Diet Assoc 104(8):1244–1249.
128 FOOD MARKETING TO CHILDREN AND YOUTH
Grunbaum JA, Kann L, Kinchen S, Ross J, Hawkins J, Lowry R, Harris WA, McManus T,Chyen D, Collins J. 2004. Youth risk behavior surveillance—United States, 2003.MMWR Surveill Summ 53(2):1–96.
Guthrie JF, Lin BH, Frazao E. 2002. Role of food prepared away from home in the Americandiet, 1977–78 versus 1994–96: Changes and consequences. J Nutr Ed Behav 34(3):140–150.
Guthrie JF, Lin BH, Reed J, Stewart H. 2005. Understanding economic and behavioral influ-ences on fruit and vegetable choices. Amber Waves 3(2):36–41.
Hanson NI, Neumark-Sztainer D, Eisenberg ME, Story M, Wall M. 2005. Associations be-tween parental report of the home food environment and adolescent intakes of fruits,vegetables and dairy foods. Public Health Nutr 8(1):77–85.
Hanson NI, Story M, Eisenberg M, Neumark-Sztainer D. 2006. Food preparation and pur-chasing roles among adolescents: Associations with sociodemographic characteristicsand diet quality. J Am Diet Assoc 106(2).
Harnack L, Story M, Martinson B, Neumark-Sztainer D, Stang J. 1998. Guess who’s cook-ing? The role of men in meal planning, shopping, and preparation in US families. J AmDiet Assoc 98(9):995–1000.
Horacek TM, Betts NM. 1998. Students cluster into 4 groups according to the factors influ-encing their dietary intake. J Am Diet Assoc 98(12):1464–1467.
Horowitz CR, Colson KA, Hebert PL, Lancaster K. 2004. Barriers to buying healthy foodsfor people with diabetes: Evidence of environmental disparities. Am J Public Health94(9):1549–1554.
IOM (Institute of Medicine). 2002. Speaking of Health. Assessing Health CommunicationStrategies for Diverse Populations. Washington, DC: The National Academies Press. Pp.224–254.
IOM. 2005a. Preventing Childhood Obesity: Health in the Balance. Washington, DC: TheNational Academies Press.
IOM. 2005b. The WIC Food Packages: Time for a Change. Washington, DC: The NationalAcademies Press.
Isler L, Popper ET, Ward S. 1987. Children’s purchase requests and parental responses:Results from a diary study. J Advertising Res 27(5):28–39.
John D. 1999. Consumer socialization of children: A retrospective look at twenty-five yearsof research. J Consum Res 26(3):183–213.
Johnson RK, Crouter AC, Smiciklas-Wright H. 1993. Effects of maternal employment onfamily food consumption patterns and children’s diets. J Nutr Ed 25(3):130–133.
Johnson RK, Smiciklas-Wright H, Crouter AC, Willits FK. 1992. Maternal employment andthe quality of young children’s diets: Empirical evidence based on the 1987–1988 Na-tionwide Food Consumption Survey. Pediatrics 90(2 Pt 1):245–249.
Kantor LS. 1998. A Dietary Assessment of the US Food Supply: Comparing Per Capita FoodConsumption with Food Guide Pyramid Serving Recommendations. Agricultural Eco-nomic Report No. 772. Washington, DC: U.S. Department of Agriculture.
Keller KL, Tepper BJ. 2004. Inherited taste sensitivity to 6-n-propylthiouracil in diet andbody weight in children. Obes Res 12(6):904–912.
Keller KL, Peitrobelli A, Must S, Faith MS. 2002. Genetics of eating and its relation toobesity. Curr Atheroscler Rpt 4(3):176–182.
Kelly AM, Wall M, Eisenberg ME, Story M, Neumark-Sztainer D. 2005. Adolescent girlswith high body satisfaction: Who are they and what can they teach us. J Adolesc Health37:391–396.
Klump KL, McGue M, Iacono WG. 2000. Age differences in genetic and environmentalinfluences on eating attitudes and behaviors in preadolescent and adolescent femaletwins. J Abnorm Psychol 109(2):239–251.

FACTORS SHAPING FOOD AND BEVERAGE CONSUMPTION 129
Kral TV, Roe LS, Rolls BJ. 2004. Combined effects of energy density and portion size onenergy intake in women. Am J Clin Nutr 79(6):962–968.
Kubik MY, Lytle LA, Hannan PJ, Perry CL, Story M. 2003. The association of the schoolfood environment with dietary behaviors of young adolescents. Am J Public Health93(7):1168–1173.
Labre MP. 2002. Adolescent boys and the muscular male body ideal. J Adolesc Health30(4):233–242.
Laraia BA, Siega-Riz AM, Kaufman JS, Jones SJ. 2004. Proximity of supermarkets is posi-tively associated with diet quality index for pregnancy. Prev Med 39(5):869–875.
Levedahl JW, Oliveira V. 1999. Dietary impacts of food assistance programs. In: Frazao E,ed. America’s Eating Habits: Changes and Consequences. Agriculture Information Bul-letin No. 750. Washington, DC: U.S. Department of Agriculture.
Levine MP, Smolak L. 2002. Body image development in adolescence. In: Cash TF, PruzinskyT, eds. Body Image: A Handbook of Theory, Research, and Clinical Practice. NewYork: Guilford Press. Pp. 74–82.
Lewis LB, Sloane DC, Nascimento LM, Diamant AL, Guinyard JJ, Yancey AK, Flynn G.2005. African Americans’ access to healthy food options in South Los Angeles restau-rants. Am J Public Health 95(4):668–673.
Lin BH, Guthrie J, Blaylock J. 1996. The Diets of America’s Children: Influences of DiningOut, Household Characteristics, and Nutrition Knowledge. Agricultural Economic Re-port No. 746. Washington, DC: U.S. Department of Agriculture.
Lin BH, Guthrie J, Frazao E. 1999. Quality of children’s diets at and away from home: 1994–96. Food Rev 22(1):2–10.
Lowry R, Kann L, Collins JL, Kolbe LJ. 1996. The effect of socioeconomic status on chronicdisease risk behaviors among US adolescents. J Am Med Assoc 276(10):792–797.
Lytle LA, Seifert S, Greenstein J, McGovern P. 2000. How do children’s eating patterns andfood choices change over time? Results from a cohort study. Am J Health Promot14(4):222–228.
Mannino ML, Lee Y, Mitchell DC, Smiciklas-Wright H, Birch LL. 2004. The quality of girls’diets declines and tracks across middle childhood. Int J Behav Nutr Phys Act 1(1):5.
Martinez SW. 2002. Introduction. In: Harris JM, Kaufman PR, Martinez SW, Price C. TheU.S. Food Marketing System, 2002. Competition, Coordination, and Technological In-novations into the 21st Century. Agricultural Economic Report No. 811. Washington,DC: U.S. Department of Agriculture.
McCabe MP, Ricciardelli LA. 2004. Body image dissatisfaction among males across thelifespan: A review of past literature. J Psychosom Res 56(6):675–685.
McCabe MP, Ricciardelli LA, Finemore J. 2002. The role of puberty, media and popularitywith peers on strategies to increase weight, decrease weight and increase muscle toneamong adolescent boys and girls. J Psychosom Res 52(3):145–153.
McNeal J. 1999. The Kids Market: Myth and Realities. Ithaca, NY: Paramount MarketPublishing.
Mennella JA, Jagnow CP, Beauchamp GK. 2001. Prenatal and postnatal flavor learning byhuman infants. Pediatrics 107(6):e88.
Mennella JA, Griffin CE, Beauchamp GK. 2004. Flavor programming during infancy. Pediat-rics 113(4):840–845.
Mennella JA, Pepino MY, Reed DR. 2005. Genetic and environmental determinants of bitterperception and sweet preferences. Pediatrics 115(2):e216–e222.
Morland K, Wing S, Diez Roux A. 2002a. The contextual effect of the local food environ-ment on residents’ diets: The atherosclerosis risk in communities study. Am J PublicHealth 92(11):1761–1767.

130 FOOD MARKETING TO CHILDREN AND YOUTH
Morland K, Wing S, Diez Roux A, Poole C. 2002b. Neighborhood characteristics associatedwith the location of food stores and food service places. Am J Prev Med 22(1):23–29.
Munoz KA, Krebs-Smith SM, Ballard-Barbash R, Cleveland LE. 1997. Food intakes of USchildren and adolescents compared with recommendations. Pediatrics 100(3 Pt 1):323–329.
National Pork Producers Council. 2000. The Kitchen Report III. Des Moines, IA: NationalPork Producers Council. Pp. 1–10.
Neumark-Sztainer D, Story M, Resnick MD, Blum RW. 1996. Correlates of inadequate fruitand vegetable consumption among adolescents. Prev Med 25(5):497–505.
Neumark-Sztainer D, Story M, Perry C, Casey MA. 1999. Factors influencing food choices ofadolescents: Findings from focus-group discussions with adolescents. J Am Diet Assoc99(8):929–937.
Neumark-Sztainer D, Rock CL, Thornquist MD, Cheskin LJ, Neuhouser ML, Barnett MJ.2000. Weight-control behaviors among adults and adolescents: Associations with di-etary intake. Prev Med 30(5):381–391.
Neumark-Sztainer D, Wall M, Perry C, Story M. 2003. Correlates of fruit and vegetableintake among adolescents. Findings from Project EAT. Prev Med 37(3):198–208.
Neumark-Sztainer D, Hannan PJ, Story M, Perry CL. 2004. Weight-control behaviors amongadolescent girls and boys: Implications for dietary intake. J Am Diet Assoc 104(6):913–920.
Nichter M. 2000. Fat Talk: What Girls and Their Parents Say About Dieting. Cambridge,MA: Harvard University Press.
Nielsen SJ, Popkin BM. 2003. Patterns and trends in food portion sizes, 1977–1998. J AmMed Assoc 289(4):450–453.
NRC and IOM (National Research Council and Institute of Medicine). 2000. From Neuronsto Neighborhoods: The Science of Early Childhood Development. Shonkoff JP, PhillipsDA, eds. Washington, DC: National Academy Press.
NRC and IOM. 2003. Working Families and Growing Kids: Caring for Children and Adoles-cents. Washington, DC: The National Academies Press.
Ohring R, Graber JA, Brooks-Gunn J. 2002. Girls’ recurrent and concurrent body dissatisfac-tion: Correlates and consequences over 8 years. Int J Eat Disord 31(4):404–415.
Perusse L, Tremblay A, Leblanc C, Cloninger CR, Reich T, Rice J, Bouchard C. 1988. Famil-ial resemblance in energy intake: Contribution of genetic and environmental factors. AmJ Clin Nutr 47(4):629–635.
Ralston K. 1999. How Government Policies and Regulations Can Affect Dietary Choices. In:Frazao E, ed. America’s Eating Habits: Changes and Consequences. Agriculture Infor-mation Bulletin No. 750. Washington, DC: U.S. Department of Agriculture.
Reed DR, Bachmanov AA, Beauchamp GK, Tordoff MG, Price RA. 1997. Heritable variationin food preferences and their contribution to obesity. Behav Genet 27(4):373–387.
Reed J, Frazao E, Itskowitz R. 2004. How Much Do Americans Pay for Fruits and Veg-etables? Agriculture Information Bulletin 790. Washington, DC: Economic ResearchService, U.S. Department of Agriculture.
Ricciardelli LA, McCabe MP. 2001. Children’s body image concerns and eating disturbance:A review of the literature. Clin Psychol Rev 21(3):325–344.
Rideout V, Foehr UG, Roberts DF, Brodie M. 1999. Kids and Media at the New Millennium.Menlo Park, CA: Henry J. Kaiser Family Foundation.
Roberts DF, Foehr UG, Rideout V. 2005. Generation M: Media in the Lives of 8–18 YearOlds. Menlo Park, CA: Henry J. Kaiser Family Foundation.
Roberts K. 2004. The Future Beyond Brands: Lovemarks. New York: PowerHouse Books.

FACTORS SHAPING FOOD AND BEVERAGE CONSUMPTION 131
Robinson TN, Killen JD, Litt IF, Hammer LD, Wilson DM, Haydel KF, Hayward C, TaylorCB. 1996. Ethnicity and body dissatisfaction: Are Hispanic and Asian girls at increasedrisk for eating disorders? J Adolesc Health 19(6):384–393.
Rolls BJ. 2003. The supersizing of America: Portion size and the obesity epidemic. NutrToday 38(2):42–53.
Rolls BJ, Engell D, Birch LL. 2000. Serving portion size influences 5-year-old but not 3-year-old children’s food intakes. J Am Diet Assoc 100(2):232–234.
Rolls BJ, Roe LS, Kral TV, Meengs JS, Wall DE. 2004. Increasing the portion size of apackaged snack increases energy intake in men and women. Appetite 42(1):63–69.
Rozin P. 2002. Human food intake and choice: Biological, psychological and cultural per-spectives. In: Anderson H, Blundell J, Chiva M, eds. Food Selection From Genes toCulture. Levallois-Perret, France: Danone Institute. Pp. 7–25.
Rozin P, Millman L. 1987. Family environment, not heredity, accounts for family resem-blances in food preferences and attitudes: A twin study. Appetite 8(2):125–134.
Rozin P, Riklis J, Margolis L. 2004. Mutual exposure or close peer relationships do not seemto foster increased similarity in food, music, or television program preferences. Appetite42(1):41–48.
Schreiber GB, Robins M, Striegel-Moore R, Obarzanek E, Morrison JA, Wright DJ. 1996.Weight modification efforts reported by black and white preadolescent girls: NationalHeart, Lung, and Blood Institute Growth and Health Study. Pediatrics 98(1):63–70.
Schwartz GJ. 2004. Biology of eating behavior in obesity. Obes Res 12(suppl 2):102S–106S.Shannon C, Story M, Fulkerson JA, French SA. 2002. Factors in the school cafeteria influenc-
ing food choices by high school students. J Sch Health 72(6):229–234.Skinner JD, Carruth BR, Wendy B, Ziegler PJ. 2002. Children’s food preferences: A longitudi-
nal analysis. J Am Diet Assoc 102(11):1638–1647.Smolak L, Levine MP. 2001. Body image in children. In: Thompson JK, Smolak L, eds. Body
Image, Eating Disorders, and Obesity in Youth: Assessment, Prevention, and Treat-ment. Washington, DC: American Psychological Association. Pp. 41–66.
Stewart H, Blisard N, Bhuyan S, Nayga RM. 2004. The Demand for Food Away FromHome. Full-Service or Fast Food? Agricultural Economic Report No. 829. Washington,DC: U.S. Department of Agriculture.
Stice E, Whitenton K. 2002. Risk factors for body dissatisfaction in adolescent girls: A longi-tudinal investigation. Dev Psychol 38(5):669–678.
Story M, Resnick MD. 1986. Adolescents’ view on food and nutrition. J Nutr Ed 18(4):188–192.
Story M, French SA, Resnick MD, Blum RW. 1995. Ethnic/racial and socioeconomic differ-ences in dieting behaviors and body image perceptions in adolescents. Int J Eat Disord18(2):173–179.
Story M, Neumark-Sztainer D, Sherwood N, Stang J, Murray D. 1998. Dieting status and itsrelationship to eating and physical activity behaviors in a representative sample of USadolescents. J Am Diet Assoc 98(10):1127–1135, 1255.
Story M, Holt K, Sofka D, eds. 2002a. Bright Futures in Practice: Nutrition. Arlington, VA:National Center for Education in Maternal and Child Health.
Story M, Neumark-Sztainer D, French S. 2002b. Individual and environmental influences onadolescent eating behaviors. J Am Diet Assoc 102(3):S40–S51.
Tillotson JE. 2004. America’s obesity: Conflicting public policies, industrial economic devel-opment, and unintended human consequences. Annu Rev Nutr 24:617–643.
Troiano RP, Briefel RR, Carroll MD, Bialostosky K. 2000. Energy and fat intakes of childrenand adolescents in the United States: Data from the National Health and NutritionExamination surveys. Am J Clin Nutr 72(5 suppl):1343S–1353S.
132 FOOD MARKETING TO CHILDREN AND YOUTH
U.S. Census Bureau. 2005. Living Arrangements of Children Under 18 Years Old: 1960 toPresent. [Online]. Available: http://www.census.gov/population/socdemo/hh-fam/ch1.pdf[accessed August 18, 2005].
U.S. Department of Agriculture (USDA). 2005. The Food Assistance Landscape, March 2005.Food Assistance and Nutrition Research Report No. 28-6. Washington, DC: USDA.
U.S. Department of Labor and U.S. Bureau of Labor Statistics. 2005. Consumer Expendituresin 2003. Report 986. Washington, DC: U.S. Department of Labor.
USA Weekend and The Roper Organization. 1989. A USA Weekend/Roper Report on Con-sumer Decision-Making in American Families. New York: The Roper Organization.
Videon TM, Manning CK. 2003. Influences on adolescent eating patterns: The importance offamily meals. J Adolesc Health 32(5):365–373.
Wansink B. 2004. Environmental factors that increase the food intake and consumptionvolume of unknowing consumers. Annu Rev Nutr 24:455–479.
Ward S. 1974. Consumer socialization. J Consum Res 1(2):1–14.Wardle J, Huon G. 2000. An experimental investigation of the influence of health informa-
tion on children’s taste preferences. Health Ed Res 15(1):39–44.Wardle J, Cooke LJ, Gibson EL, Sapochnik M, Sheiham A, Lawson M. 2003a. Increasing
children’s acceptance of vegetables; a randomized trial of parent-led exposure. Appetite40(2):155–162.
Wardle J, Herrera ML, Cooke L, Gibson EL. 2003b. Modifying children’s food preferences:The effects of exposure and reward on acceptance of an unfamiliar vegetable. Eur J ClinNutr 57(2):341–348.
Wardle J, Carnell S, Cooke L. 2005. Parental control over feeding and children’s fruit andvegetable intake: How are they related? J Am Diet Assoc 105(2):227–232.
Wechsler H, Brener ND, Kuester S, Miller C. 2001. Food service and foods and beveragesavailable at school: Results from the School Health Policies and Programs Study 2000. JSch Health 71(7):313–324.
Woodward DR, Boon JA, Cumming FJ, Ball PJ, Williams HM, Hornsby H. 1996. Adoles-cents’ reported usage of selected foods in relation to their perceptions and social normsfor those foods. Appetite 27(2):109–117.
Young LR, Nestle M. 2002. The contribution of expanding portion sizes to the US obesityepidemic. Am J Public Health 92(2):246–249.
Zenk SN, Schulz AJ, Israel BA, James SA, Bao S, Wilson ML. 2005. Neighborhood racialcomposition, neighborhood poverty, and the spatial accessibility of supermarkets inmetropolitan Detroit. Am J Public Health 95(4):660–667.
Zollo P. 1999. Wise Up to Teens: Insight into Marketing and Advertising to Teenagers. 2nded. Ithaca, NY: New Strategist Publications, Inc.
Zoumas-Morse C, Rock CL, Sobo, EJ, Neuhouser ML. 2001. Children’s patterns of macro-nutrient intake and associations with restaurant and home eating. J Am Diet Assoc101(8):923–925.

133
4
Food and Beverage Marketingto Children and Youth
INTRODUCTION
This chapter considers how food and beverage products are developedand marketed to appeal to the preferences of children and youth and tostimulate sales. It provides definitions of certain commonly used marketingterms and approaches; provides an overview of various target markets suchas tweens, teens, and ethnic minorities; and offers a description of themarketing research enterprise directed at children and youth. An overviewis provided of the marketing environment, including a profile of food andbeverage companies and retailers, full serve and quick serve restaurants,and trade associations. It discusses food, beverage, and meal product devel-opment, the implications of the evolving purchasing power of Americanchildren and youth, and the general marketing strategies, tactics, and mes-saging used by industry. The chapter also reviews children’s and adoles-cents’ media use patterns and advertising exposure, and discusses the rangeof marketing vehicles and venues used by companies to reach them withadvertising and marketing messages. A discussion of company and industryguidelines and policies, including self-regulatory programs, health and well-ness advisory councils, public–private partnerships, and coalitions concludesthe chapter.
To explore this domain, the committee drew from several differenttypes of reviews, reports and materials, including supplementing the peer-reviewed literature with information from industry and marketing sources.Thus, the evidentiary sources cited in this chapter include articles published

134 FOOD MARKETING TO CHILDREN AND YOUTH
in marketing, advertising, or industry trade journals; commissioned papersexamining the current and future food and beverage marketing trends af-fecting children and youth; government, company, and trade organizationwebsites; annual reports of companies;1 foundation or nonprofit organiza-tion reports and briefs; popular magazines and books relevant to advertis-ing and marketing; and news releases. Sources also included materials frompresentations, testimony, and documents provided during and followingthe January 2005 public workshop held to consider industry perspectivesand activities. To assess the degree to which new food and beverage prod-ucts have been targeted to children and youth across various product cat-egories, the committee also conducted an analysis of trends in the prolifera-tion of children’s products using ProductScan®, a large commercial databaseof products (Marketing Intelligence Service, 2005) that has tracked newproduct introductions in the U.S. marketplace since 1980 (Williams, 2005b).
Because marketing research could enhance understanding on the rela-tionships of marketing strategies to children’s food and beverage consump-tion patterns and diets and diet-related health outcomes, as well as thedesign of strategies to improve the healthfulness of messages, several mar-ket research firms were contacted for information. Some—The GeppettoGroup, The Strottman Group, KidShop/KidzEyes, and Yankelovich Part-ners—provided child- and youth-specific data for the committee’s consider-ation and use. Others were unable to provide information, either because oftime constraints, economic considerations, or on the basis that the datawere proprietary and not intended for public use. A summary of the mar-keting research information considered by the committee is included inAppendix E, Table E-1.
MARKETING TERMINOLOGY AND APPROACHES
Marketing professionals use a variety of strategies to influence con-sumer preferences, stimulate consumer demand, promote frequency of pur-chases, build brand awareness and brand loyalty, encourage potential orexisting customers to try new products, and increase sales. From a market-ing perspective, businesses engage in a variety of activities that are designedto meet customers’ needs and to create the context where consumers per-ceive value in exchange for their money. Marketing is defined by the Ameri-can Marketing Association (AMA) as “an organizational function and a set
1Many companies and marketing firms discussed in this chapter are incorporated (Inc.).For ease of reading, the Inc. has been removed after a company name in the text, tables, andreference citations. The discussion of trade names or commercial products in this report issolely for the purpose of providing specific information or illustrative examples and does notimply endorsement by the Institute of Medicine.

FOOD AND BEVERAGE MARKETING TO CHILDREN AND YOUTH 135
of processes for creating, communicating, and delivering value to customersand for managing customer relationships in ways that benefit an organiza-tion and its stakeholders” (AMA, 2005a). Conducting marketing researchis a fundamental activity of the marketing process, providing informationthat helps identify opportunities and problems, refine strategies, and moni-tor performance (AMA, 2005a).
The four traditional components of marketing are as follows:
• Product (e.g., features, quality, quantity, packaging)• Place (e.g., location, outlets, distribution points used to reach tar-
get markets)• Price (e.g., strategy, determinants, levels)• Promotion (e.g., advertising, consumer promotion, trade promo-
tion, public relations)
Figure 4-1 shows one approach to a graphic representation of the ele-ments that influence a marketing strategy: defining the target market, deter-mining the marketing mix to meet the needs of that market, and assessing
FIGURE 4-1 Elements of a marketing strategy and its environmental framework.SOURCE: Based on Boone and Kurtz (1998). From Contemporary Marketing, 9E9th edition by Boone. ©1998. Reprinted with permission of South-Western, a divi-sion of Thomson Learning: www.thomsonrights.com.
Marketing Mix Variables
TargetMarket
Product Place
Price Promotion
Competitive
Social-Cultural
Political-Legal
Economic Technological

136 FOOD MARKETING TO CHILDREN AND YOUTH
the relevant competitive, social-cultural, technological, economic, political-legal, and environmental factors (Boone and Kurtz, 1998).
Branding
A key aim of marketing is product branding—providing a name orsymbol that legally identifies a company, a single product, or a product lineto differentiate it from other companies or products in the marketplace(Roberts, 2004). Elements of branding strategy may be characterized onseveral dimensions: (1) brand differentiation, to distinguish one brand fromanother in the same product line; (2) building brand image (or brand pres-ence) to raise consumers’ awareness about a brand and the competition;(3) developing brand equity (also referred to as brand relevance and brandperformance), to build brand familiarity and perceived quality with theintent to meet a customer’s expectations and purchase intent, which is theextent to which a consumer intends to continue purchasing a specific brand;(4) assessing brand momentum (or brand advantage) to determine whethercustomers think a brand is improving or whether their interest in a specificbrand is declining; and (5) building and sustaining brand loyalty (also re-ferred to as brand bonding), which is the degree to which consumers willconsistently purchase the same brand within a product category (Brand-Week, 2005; Survey Value, 2005).
In effect, the purpose of branding is to promote product sales by tak-ing a product and identifying it with a lifestyle to which consumers aspire(Roberts, 2004). With food and beverage products, product developmentcan be part of the branding process, as with many prepared entrees,baked goods, savory snacks, confectionery, and carbonated soft drinks(CSDs)2. Nonprocessed foods such as vegetables and fruits are more diffi-cult challenges for brand differentiation, and are generally less promotedthan processed food brands. This may be beginning to change, however,as there is a developing trend toward branding produce and promotinginnovative features such as new shapes or colors, special varieties (e.g.,baby or seedless watermelon, champagne grapes) and ethnic fruits andvegetables that help to build consumer awareness, sales, and profits (Pol-lack Associates, 2004).
Processed foods are highly branded and lend themselves to major ad-vertising (Gallo, 1999). More than 80 percent of U.S. grocery products
2Carbonated soft drinks is a common marketing term used to refer to a category of cold,nonalcoholic, sweetened beverages that uses the process of carbonation to enhance its tasteand texture. The complete term, carbonated soft drinks, is used in other chapters of thisreport instead of CSDs due to the lack of familiarity of this term among nonmarketingaudiences.

FOOD AND BEVERAGE MARKETING TO CHILDREN AND YOUTH 137
are branded whereas only 19 percent of fruits and vegetables are nation-ally branded (Harris, 2002). Results from a Grocery Manufacturers Asso-ciation (GMA) survey of 800 consumers found that Americans across alldemographic groups consider a product’s brand before making a finalpurchase selection, and consumers will pay a higher price for perceivedquality in premium branded products and will go to a different store if apreferred brand is not available (GMA, 2002; Pollack Associates, 2004).Key factors that influenced their brand selection include experience(36 percent indicated that prior family exposure influences brand choice)and peer endorsement (13 percent) (GMA, 2002). Branding has become anormalized part of life for American children and adolescents (Schor,2004), as marketers seek to develop positive and sustained brand rela-tionships with young consumers and their parents in order to createbrand recognition and foster brand loyalty, brand advantage, and brandequity (McDonald’s Corporation, 1996; McNeal, 1999; Mooreet al., 2002).
Advertising
Advertising is the most visible form of marketing. It is paid publicpresentation and promotion of ideas, goods, or services by a sponsor (Kotlerand Armstrong, 2004), intended to bring a product to the attention ofconsumers through a variety of media channels such as broadcast and cabletelevision, radio, print, billboards, the Internet, or personal contact (Booneand Kurtz, 1998). Marketers recognize its value by itself, and also view it ascontributing to the success of other strategies by (1) building brand aware-ness and brand loyalty among potential consumers, and (2) creating per-ceived value by persuading consumers that they are getting more than theproduct itself (e.g., social esteem, peer respect).
Consumer Promotion
Consumer promotion, also called sales promotion, represents the pro-motional efforts that are designed to have an immediate impact on sales.Consumer promotion includes media and nonmedia marketing communi-cations targeted directly to the consumer that are used for a predeterminedand limited time to increase consumer demand, stimulate market demand,or improve product availability. Examples of sales promotion include cou-pons, discounts and sales, contests, point-of-purchase displays, rebates, andgifts and incentives (Boone and Kurtz, 1998).
Trade Promotion
Trade promotion is a broad category of marketing that targets interme-
138 FOOD MARKETING TO CHILDREN AND YOUTH
diaries, such as grocery stores, convenience stores, and other food retailoutlets. Trade promotion strategies include provision of in-store displays,agreements for shelf space and positioning, free merchandise, buy-backallowances,3 and merchandise allowances,4 as well as sales contests to en-courage wholesalers or retailers to give unusual attention to selling more ofa specific product or lines (Boone and Kurtz, 1998). Companies usuallyspend as much of their marketing budgets on trade promotion as on expen-ditures for advertising and all other consumer-oriented sales promotion,combined (Boone and Kurtz, 1998; GMA Forum, 2005).
Market Segmentation and Target Markets
Identifying and reaching unique target markets is important for busi-nesses to promote sales in a competitive marketplace. Target markets maybe segmented by demographic characteristics (e.g., age, gender, income,race or ethnicity), psychographic features (e.g., values, attitudes, beliefs,lifestyles), behavioral patterns (e.g., brand loyalty, usage rates, price sensi-tivities), and geographic characteristics (e.g., region, population density)(Neal, 2005; QuickMBA, 2004). As the ethnic, racial, and cultural compo-sition of the U.S. population changes and boundaries among groups be-come less distinct through intermarriage and cultural adaptation, the crite-ria that marketers have used to target specific groups of consumers maychange (Grier and Brumbaugh, 2004).
Companies often alter the types of products and services marketed(marketing mix) for customers in each market segment in order to meet thedemand for products and services and to maximize sales. Marketers maychange only one element of the marketing mix (e.g., promotional approach),or tailor each element of the marketing mix to a specific population seg-ment—the product and how it is packaged, the pricing strategies, theplace(s) or channel(s) through which the product is distributed and madeavailable to consumers in a target market, and the promotional strategies(Neal, 2005; QuickMBA, 2004).
Children and youth represent an important demographic market be-cause they are potential customers, they influence purchases made by par-ents and households, and they constitute the future adult market (McNeal,1998; Moore et al., 2002). Table 4-1 summarizes the U.S. Census Bureau
3A form of sales promotion in which retailers are offered an incentive to restock their storeor warehouse with the product to the level in place prior to a count and recount promotionoffer.
4Introductory offers and periodic discounts offered by a company to promote and intro-duce the company’s line of branded products.

FOOD AND BEVERAGE MARKETING TO CHILDREN AND YOUTH 139
TABLE 4-1 Marketing Categories by Population Sizes
Group Age Range Population Size
Infants and Toddlers 0–2 yearsGirls 5,575,564Boys 5,841,112
Children 3–8 yearsGirls 11,734,700Boys 12,306,607
Tweensa 9–12 yearsGirls 8,159,391Boys 8,572,920
Teensb 13–19 yearsGirls 13,758,399Boys 14,524,572
aIn this report, the committee characterized infants and toddlers as under age2 years, younger children as ages 2–5 years, older children as ages 6–11 years,and teens as ages 12–18 (Chapter 1). These age categories and terms differslightly from what is described in this chapter. Marketers distinguish the tweenmarket segment from children and teens, defining it as young people who haveattitudes and behaviors that are “in between” the ages of 8–12 years or 9–14 years (Siegel et al., 2001; The Intelligence Group/Youth Intelligence, 2005).
bThe U.S. Census Bureau defines teens as young people ages 13–19 years.SOURCE: U.S. Census Bureau (2000).
age categories that differ from the age categories used in this report (Chap-ter 1 and Chapter 5) and commonly used by marketers. The Census Bureauage categories include infants and toddlers (ages 0–2 years), younger andolder children (ages 3–8 years), tweens (ages 9–12 years), and youngerand older teens (ages 13–19 years).
Children and youth under the age of 19 years comprise more than afourth of the U.S. population. From 1990–2003, this population increasedby 14 percent (U.S. Census Bureau, 2001, 2004). Ethnic minorities repre-sent attractive targets for food and beverage marketers due to their size,growth, and purchasing power (Williams, 2005a). Marketers segment tar-get audiences by age, gender, and race/ethnicity to build brand awarenessand brand loyalty early in life that will be sustained into adulthood. Afri-can American consumers have been targeted by both mainstream andAfrican American-owned marketers, often using very different marketingstyles (Williams and Tharp, 2001). Food and beverage companies marketto African American family preferences. An analysis of 2004 Nielsen Moni-tor-Plus data of food and beverage advertising that appeared in AfricanAmerican media showed significant spending by food and beverage com-panies for high-calorie and low-nutrient foods and beverages.

140 FOOD MARKETING TO CHILDREN AND YOUTH
In six magazines targeted to African Americans (e.g., Jet, Ebony, BlackEnterprise, Essence, Vibe, and Savoy), the top three categories advertisedwere regular CSDs ($1.8 million), cookies and crackers ($1.6 million), andfruit juices and fruit-flavored drinks ($1.5 million). Advertising spendingfor the top three food and beverage categories on Black EntertainmentTelevision (BET) were regular CSDs ($10.8 million), candy andgum ($8.8 million), and fruit juices and fruit-flavored drinks ($5.3 mil-lion) (Williams, 2005a). Magazine Publishers of America estimates that15 percent of teens ages 12–19 years are African American, and are amajor influence on youth culture, spending 6 percent more per month thanthe average U.S. teen, which is estimated at $428 monthly (MPA, 2004b).
In 2004, the industry advertising and marketing expenditures wereestimated at $260.9 million to reach consumers through Hispanic/Latino-oriented broadcast television networks, cable television, and Spanish-language newspapers and magazines (Endicott et al., 2005). Among thefood, beverage, and retailer companies, PepsiCo spent $68.5 million,McDonald’s Corporation spent $65.8 million, Wal-Mart Stores spent$55.9 million, Yum! Brands spent $30.8 million, The Coca-Cola Com-pany spent $27.7 million, the Kellogg Company spent $25.2 million, andWendy’s International spent $20.4 million to advertise brands to reachHispanic/Latino consumers (Endicott et al., 2005). An example of an eth-nically targeted marketing effort to Hispanics/Latinos is PepsiCo’s Frito-Lay™ Flaming Hot Corn Chips advertising campaign (MPA, 2004c).
The Hispanic/Latino teen market is the fastest growing ethnic youthsegment in the United States. This market currently represents 4.6 millionyoung consumers, or 20 percent of all U.S. teens. Market researchers fore-cast that the Hispanic/Latino youth population is expected to grow sixtimes faster than the rest of the teen market by 2020 (MPA, 2004c). Mar-keters view the Hispanic/Latino youth market as providing a variety ofbusiness opportunities across many types of products and services (Valdés,2000). In 1998, the total annual purchasing power of Hispanic/Latino teenswas estimated at $19 billion—4 percent higher than non-Hispanic/Latinoteens (MPA, 2004c). This so-called Generation Ñino includes tweens, teens,and young people who are bilingual and bicultural as they retain theirHispanic/Latino identity and navigate comfortably in this culture and Amer-ican cultures (Valdés, 2000).
Cultural influences among different racial/ethnic groups are also pos-sible. For example, “hip-hop” youth culture originated among AfricanAmerican youth in the inner city, and is now embraced by a generation ofAfrican American, white, Hispanic/Latino, and Asian youth (Williams andTharp, 2001). “Urban culture” is a term used to describe a target marketthat has a particular lifestyle. Urban culture transcends both racial andethnic boundaries by bringing together a lifestyle of fashion, attitudes,

FOOD AND BEVERAGE MARKETING TO CHILDREN AND YOUTH 141
street language, and music from all backgrounds (Williams and Tharp,2001). MTV has been a leading entertainment network partnering withPepsiCo and The Coca-Cola Company to launch advertising campaignsfeaturing hip-hop culture such as break dancing to market CSDs and urbanculture to teens (Holt, 2004; PBS Frontline, 2001).
With respect to economic segmentation, there is some descriptive evi-dence suggesting that ethnic minorities living in poorer neighborhoods havefewer healthier options and neighborhood restaurants heavily promote lesshealthful foods (Lewis et al., 2005; Chapter 3). Despite concerns expressedthat marketers disproportionately target racial/ethnic minorities with high-calorie, low-nutrient foods and beverages, there is a need for greater empiri-cal evidence to support the claim (Grier, 2005; Samuels et al., 2003). Thecommittee was not able to find available evidence to assess whether marketsegmentation has been a significant influence on children’s food and bever-age product development.
Embedded Marketing Strategies
Embedded marketing strategies blend commercial content with pro-gramming or editorial content, or other lifestyle experiences, to add brandexposure and avoid resistance to direct advertising. Product placement, orbrand placement, is an embedded marketing technique that refers to theinclusion of a corporate or brand name, product package, signage, or othertrademark either visually or verbally in television programs, films, videogames, magazines, books, and music, or across a range of these mediasimultaneously (Babin and Carder, 1996; Nebenzahl and Secunda, 1993;PQMedia, 2005). Product placement is generally arranged in return for afee payment, although occasionally other quid pro quo accommodationsare involved (Balasubramanian, 1994; PQMedia, 2005).
Another form of embedded marketing technique used by marketers isknown as viral marketing, representing the “buzz,” “word of mouth,” or“street marketing” that occurs when individuals talk about a product toone another, either in conversations or virtual communication via an elec-tronic platform such as the Internet (Henry, 2003; Holt, 2004; Kaikati andKaikati, 2004). Viral branding and marketing focus on the paths of publicinfluence, including diffusion of innovation, word of mouth, and publicrelations (Holt, 2004).
Measured Media and Unmeasured Media
Marketers pay to advertise and promote branded products through avariety of media channels, termed measured and unmeasured media in themarketing literature. Measured media spending refers to the categories that
142 FOOD MARKETING TO CHILDREN AND YOUTH
are tracked by media research companies such as Nielsen, TNSMI/CMR,and Forrester. Commonly tracked measured media spending categories in-clude television (e.g., network, spot, cable, syndicated, Spanish-languagenetwork), radio (e.g., network, national spot, local), magazines (e.g., local,Sunday magazine), business publications, newspapers (e.g., local, national),outdoor, the Yellow Pages, and the Internet (Brown et al., 2004, 2005).
Unmeasured media spending refers to the difference between a com-pany’s reported or estimated advertising costs and its measured mediaspending. Unmeasured media spending includes activities such as sales pro-motions, coupons, direct mail, catalogs, and special events, and it is notsystematically tracked (Brown et al., 2004, 2005). Marketers use a varietyof techniques to assess the effects of advertising in measured media onconsumers. They measure the cost of advertising or promotion, usuallyexpressed in terms of consumer exposure to advertising messages or “im-pressions,” representing a message seen by one viewer. Thus, consumerswho report that they remember or recall an advertisement have “retainedimpressions” of the specific advertisement. Marketers also track consum-ers’ recall, retention, processing of messages, and purchase intent or pur-chase behavior. A second measure of the impact of an advertisement usedby marketers is the increase in sales as a result of the advertising or promo-tional campaign. Because several factors may influence sales in the market-place, it may be difficult to isolate the effect of advertising on sales of aparticular product during a given time period. Thus, companies and mar-keters use other measures to guide their decisions, including communica-tions research, an analysis of purchase dynamics (e.g., trial purchase, repeatpurchase, frequency of purchase), and tracking consumer awareness andattitudes regarding specific product categories and specific brands (CollierShannon Scott and Georgetown Economic Services, 2005c).
Once the purchase behavior of the exposed and unexposed groupsare evaluated for a pre- and post-period, marketers determine brand pen-etration (the percentage of households that purchased an advertised prod-uct), volume (the average number or weight of an advertised product forevery 100 households), dollars spent (the average dollars spent on theadvertised product for every 100 households), and the dollar share (thepercentage of sales that the advertised brand represents of total categorysales) (MPA, 1999).
Marketing Research
Substantial investments have been made in marketing research directedto U.S. children and youth, and this research has grown into a majormarketing tool over the past 30 years (Austin and Rich, 2001; McNeal,

FOOD AND BEVERAGE MARKETING TO CHILDREN AND YOUTH 143
1999; Schor, 2004). Its evolution and focus on youth has been rapid. Com-panies and private marketing research and public relations firms currentlyconduct marketing research that involves children and adolescents of allages in the stages of product development, market testing, and the design ofmessages that are delivered to them (Schor, 2004). Examples of selectedmarketing research firms and marketing reports that the committee consid-ered through its data-gathering process are listed in Appendix E, Table E-1.
Marketing research firms use a variety of methods, such as conveniencesurveys, opinion polls, focus groups, participant observation, photography,and ethnographic studies to collect information about their target markets(e.g., age and income of consumers, purchasing power, spending patterns,consumer attitudes and opinions)—including, in some cases, market re-search focus groups with early- and preschool age children (Austin andRich, 2001; Buzz Marketing Group, 2004; Friend and Stapylton-Smith,1999; Nestle, 2002; PBS Frontline, 2001; Peleo-Lazar, 2005; Schor, 2004;Teinowitz and McArthur, 2005; Yankelovich, 2005). Cultural anthropolo-gists and psychologists have become regular resources for marketingresearch firms to study the culture of children and youth, and to researchhow children and teens process information and respond to advertising(Montgomery and Pasnik, 1996; Schor, 2004).
Some marketing research is developed for public use but most is propri-etary. Public research is conducted primarily by academic institutions andmay be financed by public or private funds. Proprietary research is con-ducted for commercial purposes by private companies, marketing researchand public relations firms, or companies that are associated with the mar-keting industry, and is not publicly available. Appendix E, Table E-1 pro-vides examples of the types of proprietary research focused specifically onthe eating habits and lifestyles of children and youth and the companies ormarketing research firms that collect and sell these data. Because the major-ity of nonacademic research conducted by marketing research firms, publicrelations firms, and companies is proprietary, these data are unavailable tohelp assess the direct relationship between advertising and sales (Nestleet al., 1998), as well as the impact of advertising and other forms of mar-keting on children’s and adolescents’ food choices and diet (Swinburn et al.,2004; Chapter 5).
Finding: Marketing research can provide important insights about howmarketing techniques might help improve the diets of children and youth.Yet, much of the relevant marketing research on the profile and impact offood and beverage marketing to children and youth is currently unavailableto the public, including for use in designing and targeting efforts to improvethe diets of children and youth.
144 FOOD MARKETING TO CHILDREN AND YOUTH
MARKETING ENVIRONMENT
Companies, Retailers, Restaurants, and Trade Associations
Food and Beverage Companies
Two federal government series reports provide estimates of food ex-penditures in the United States: The Economic Research Service (ERS)Food Expenditure Series published by the U.S. Department of Agriculture(USDA), which provides actual food sales information obtained from to-tal food sales of retail establishments that sell food items, based on foodsales in the Bureau of the Census Retail Trade Reports; and the U.S.Bureau of Labor Statistics (BLS) Consumer Expenditure Survey, which isbased on annual household expenditure surveys that measure foodpurchases of the consuming units or households surveyed (ERS/USDA,2005a). Food and beverage expenditures have grown at approximately6.4 percent per year for the past 40 years5 (ERS/USDA, 2004, 2005b).Sales for total U.S. food and beverage consumption were $895.4 billionin 2004 (ERS/USDA, 2005b). The BLS survey reports the distribution offood expenditures for food categories by selected demographic categories.Consumer expenditures for food in 2002 accounted for 13.2 percent of ahousehold’s disposable income, with 7.6 percent spent for foods at homeand 5.6 percent for foods acquired away from home (U.S. Department ofLabor, 2004; Table 4-2).
Many factors have contributed to the growth of the modern Americanfood industry, including agricultural improvement, new food processingtechnologies, expanded transportation facilities, and evolving communica-tion systems (Tillotson, 2004). Historically, the growth of the processed-food retail sector in the United States has been important both for sup-porting economic growth and feeding an evolving, nonagricultural society(Tillotson, 2004).
The majority of the top 25 global food and beverage companies arealso leading producers of child- or youth-specific branded food and bever-age products (Food Engineering, 2004). These companies include NestléS.A., Kraft Foods, Cargill, PepsiCo, The Coca-Cola Company, CadburySchweppes, Mars, ConAgra, General Mills, and the Kellogg Company(Williams, 2005b). Worldwide revenues for leading food and beverage com-panies in 2003 and 2004 are shown in Table 4-3.
5The USDA differentiates food sales from food expenditures. The latter includes noncashsales in the ERS food expenditure series. The Bureau of Labor Statistics Consumer Price Indexfor Food grew at a rate of 4.6 percent from 1967 to 2004 so more than half of the growth infood sales was due to higher prices. Total food expenditures for 2004 have not yet beencompleted.

FOOD AND BEVERAGE MARKETING TO CHILDREN AND YOUTH 145
TABLE 4-2 Average Annual Expenditures of Households and PercentDistribution of Total Food Expenditures, 2002
Total Expenditure($) Thousands
By Percent of TotalCategory Total Category Food-at-Home Expenditures
Food at home 3,099Cereals and bakery products 450 14Meats, poultry, fish, and eggs 798 26Dairy products 328 11Fruits and vegetables 552 18Other food at home 970 31
Food away from home 2,276 n/aTotal Food 5,375
NOTE: Food represents 13.2 percent of total expenditures (made up of 7.6 percent for foodat home and 5.6 percent for food away from home).SOURCE: U.S. Department of Labor (2004).
TABLE 4-3 Selected Leading Food and Beverage Companies’ GlobalRevenues, 2003 and 2004
2003 Revenues 2004 RevenuesCompany ($ billion) ($ billion)
Nestlé S.A. 69.0 72.6Cargill 59.9 62.9Kraft Foods 31.0 32.2PepsiCo 27.0 29.3The Coca-Cola Company 17.3 18.2Mars 17.0* 18.0*ConAgra Foods 19.8 14.5General Mills 10.5 11.1Kellogg Company 8.8 9.6The Hershey Company 4.2 4.4TOTAL 264.5 272.8
NOTE: Cargill primarily provides food ingredients and value-added services to food andbeverage manufacturers. *Mars, including Masterfoods, does not publicly release its annualrevenues.SOURCES: Business Wire (2005), DataMonitor (2004, 2005), Kraft Foods (2004), TheHershey Company (2005).
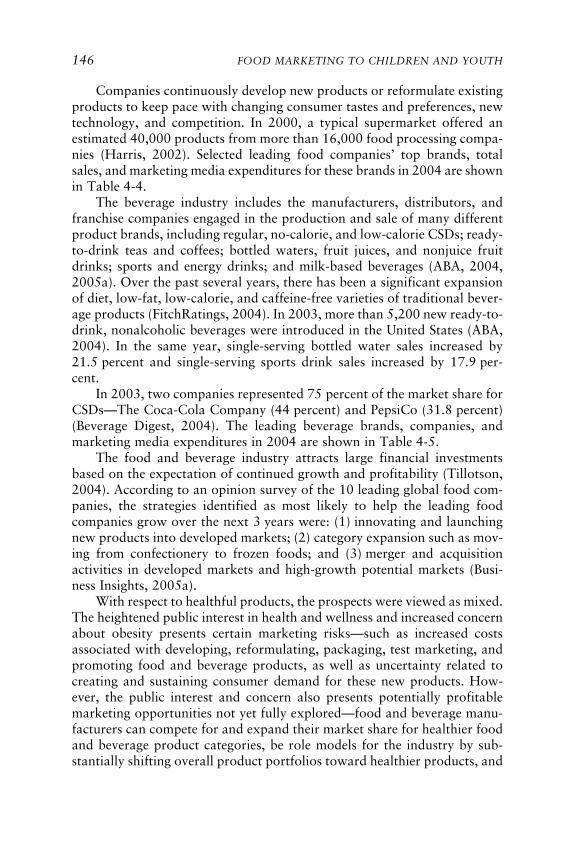
146 FOOD MARKETING TO CHILDREN AND YOUTH
Companies continuously develop new products or reformulate existingproducts to keep pace with changing consumer tastes and preferences, newtechnology, and competition. In 2000, a typical supermarket offered anestimated 40,000 products from more than 16,000 food processing compa-nies (Harris, 2002). Selected leading food companies’ top brands, totalsales, and marketing media expenditures for these brands in 2004 are shownin Table 4-4.
The beverage industry includes the manufacturers, distributors, andfranchise companies engaged in the production and sale of many differentproduct brands, including regular, no-calorie, and low-calorie CSDs; ready-to-drink teas and coffees; bottled waters, fruit juices, and nonjuice fruitdrinks; sports and energy drinks; and milk-based beverages (ABA, 2004,2005a). Over the past several years, there has been a significant expansionof diet, low-fat, low-calorie, and caffeine-free varieties of traditional bever-age products (FitchRatings, 2004). In 2003, more than 5,200 new ready-to-drink, nonalcoholic beverages were introduced in the United States (ABA,2004). In the same year, single-serving bottled water sales increased by21.5 percent and single-serving sports drink sales increased by 17.9 per-cent.
In 2003, two companies represented 75 percent of the market share forCSDs—The Coca-Cola Company (44 percent) and PepsiCo (31.8 percent)(Beverage Digest, 2004). The leading beverage brands, companies, andmarketing media expenditures in 2004 are shown in Table 4-5.
The food and beverage industry attracts large financial investmentsbased on the expectation of continued growth and profitability (Tillotson,2004). According to an opinion survey of the 10 leading global food com-panies, the strategies identified as most likely to help the leading foodcompanies grow over the next 3 years were: (1) innovating and launchingnew products into developed markets; (2) category expansion such as mov-ing from confectionery to frozen foods; and (3) merger and acquisitionactivities in developed markets and high-growth potential markets (Busi-ness Insights, 2005a).
With respect to healthful products, the prospects were viewed as mixed.The heightened public interest in health and wellness and increased concernabout obesity presents certain marketing risks—such as increased costsassociated with developing, reformulating, packaging, test marketing, andpromoting food and beverage products, as well as uncertainty related tocreating and sustaining consumer demand for these new products. How-ever, the public interest and concern also presents potentially profitablemarketing opportunities not yet fully explored—food and beverage manu-facturers can compete for and expand their market share for healthier foodand beverage product categories, be role models for the industry by sub-stantially shifting overall product portfolios toward healthier products, and
147T
AB
LE
4-4
Sele
cted
Lea
ding
Com
pani
es’
Top
Foo
d B
rand
s, T
otal
Sal
es,
and
Mar
keti
ng M
edia
Exp
endi
ture
s by
Cat
egor
y, 2
004
Tot
al S
ales
Mar
keti
ng M
edia
Bra
ndC
ompa
ny N
ame
Hea
dqua
rter
s($
mill
ions
)E
xpen
ditu
res
($ m
illio
ns)
Rea
dy-t
o-E
at C
erea
lsC
heer
ios
Gen
eral
Mil
lsM
inne
apol
is,
MN
289.
734
.5Fr
oste
d Fl
akes
Kel
logg
NA
Com
pany
Bat
tle
Cre
ek,
MI
243.
310
.0H
oney
Nut
Che
erio
sG
ener
al M
ills
Min
neap
olis
, M
N23
9.6
38.3
Hon
ey B
unch
es o
f O
ats
Kra
ft F
oods
Tar
ryto
wn,
NY
222.
817
.8C
inna
mon
Toa
st C
runc
hG
ener
al M
ills
Min
neap
olis
, M
N16
4.9
24.9
Cer
eal
Bar
sC
hew
y G
rano
laQ
uake
r O
ats
Chi
cago
, IL
125.
72.
8N
atur
e V
alle
yC
ampb
ell
Mit
hun
Min
neap
olis
, M
N10
7.6
7.1
Nut
ri-G
rain
Kel
logg
NA
Com
pany
Bat
tle
Cre
ek,
MI
102.
523
.3R
ice
Kri
spie
s T
reat
sK
ello
gg N
A C
ompa
nyB
attl
e C
reek
, M
I70
.5
n/a
Cra
cker
sR
itz
Kra
ft F
oods
Gle
nvie
w,
IL23
2.4
12.9
Pepp
erid
ge F
arm
Gol
dfis
hC
ampb
ell
Soup
Com
pany
Cam
den,
NJ
167.
89.
1Pr
emiu
m S
alti
nes
Kra
ft F
oods
Eas
t H
anov
e r,
NJ
157.
5
n
/aC
hee z
-It
Savo
ryK
e llo
gg N
A C
ompa
nyB
attl
e C
ree k
, M
I13
9.8
22.2
Whe
at T
hins
Kra
ft F
oods
Eas
t H
anov
e r,
NJ
126.
221
.9T
risc
uit
Kra
ft F
oods
Eas
t H
anov
e r,
NJ
108.
216
.3Sa
lty
Snac
ksL
ay’s
Peps
iCo
Purc
hase
, N
Y74
3.1
23.7
Dor
itos
Peps
iCo
Purc
hase
, N
Y65
7.0
9.7
Tos
tito
sPe
psiC
oPu
rcha
se,
NY
417.
01.
3C
hee t
osPe
psiC
oPu
rcha
se,
NY
380.
32.
4W
avy
Lay
’sPe
psiC
oPu
rcha
se,
NY
278.
3n
/a
c on
tin
ue s

148
Ref
rige
rate
d O
rang
e Ju
ice
Tro
pica
na P
ure
Prem
ium
Peps
iCo
Purc
hase
, N
Y1,
149.
831
.9M
inut
e M
aid
The
Coc
a-C
ola
Com
pany
Atl
anta
, G
A40
2.8
28.1
Flor
ida’
s N
atur
alC
itru
s W
orld
Lak
e W
ales
, FL
234.
220
.7R
efri
gera
ted
Yog
urt
Yop
lait
Gen
eral
Mil
lsM
inne
apol
is,
MN
283.
536
.0Y
opla
it L
ight
Gen
eral
Mil
lsM
inne
apol
is,
MN
174.
4 n
/aD
anno
n L
ight
Dan
non
Com
pany
Tar
ryto
wn,
NY
164.
13.
9L
unch
eon
Mea
tsO
scar
May
erK
raft
Foo
dsM
adis
on,
WI
808.
818
.0H
ills
hire
Far
m D
eli
Sara
Lee
Cor
pora
tion
Chi
cago
, IL
244.
020
.1B
uddi
gC
arl
Bud
dig
& C
ompa
nyH
omew
ood,
IL
138.
00.
1M
eat
Alt
erna
tive
sM
orni
ngst
ar F
arm
sK
ello
gg N
A C
ompa
nyB
attl
e C
reek
, M
I73
.78.
9B
oca
Bur
ger
Kra
ft F
oods
Mad
ison
, W
I53
.11.
7M
orni
ngst
ar F
arm
s G
rill
e rs
Ke l
logg
NA
Com
pany
Bat
tle
Cre
e k,
MI
28.2
n/a
SOU
RC
E:
Rep
rint
ed w
ith
perm
issi
on,
from
Bra
ndW
eek
(200
5).
©B
rand
wee
k R
esea
rch
2005
/ S
ourc
es:
Info
rmat
ion
Res
ourc
es,
Inc.
(sa
les)
; T
NS
(med
ia).
Sal
es d
ata
refl
ect
U.S
. su
perm
arke
ts,
drug
stor
es,
and
mas
s m
erch
andi
sers
, ex
clud
ing
Wal
Mar
t.
TA
BL
E 4
-4C
onti
nued
Tot
al S
ales
Mar
keti
ng M
edia
Bra
ndC
ompa
ny N
ame
Hea
dqua
rter
s($
mill
ions
)E
xpen
ditu
res
($ m
illio
ns)

149T
AB
LE
4-5
Lea
ding
Bev
erag
e B
rand
s, T
otal
Sal
es,
and
Mar
keti
ng M
edia
Exp
endi
ture
s by
Cat
egor
y, 2
004
Tot
al S
ales
Mar
keti
ng M
edia
Bra
ndC
ompa
ny N
ame
Hea
dqua
rter
s(m
illio
ns o
f ca
ses)
*E
xpen
ditu
res
($ m
illio
ns)
Car
bona
ted
Soft
Dri
nks
Cok
e C
lass
icT
he C
oca-
Col
a C
ompa
nyA
tlan
ta,
GA
1,83
2.7
123.
4Pe
psi
Peps
iCo
Purc
hase
, N
Y1,
179.
510
4.0
Die
t C
oke
The
Coc
a-C
ola
Com
pany
Atl
anta
, G
A99
8.0
22.8
Mou
ntai
n D
ewPe
psiC
oPu
rcha
se,
NY
648.
052
.5D
iet
Peps
iPe
psiC
oPu
rcha
se,
NY
625.
032
.9Sp
rite
The
Coc
a-C
ola
Com
pany
Atl
anta
, G
A58
0.5
43.9
Dr
Pepp
erC
adbu
ry S
chw
eppe
sL
ondo
n, U
.K.
574.
168
.8C
affe
ine
Free
Die
t C
oke
The
Coc
a-C
ola
Com
pany
Atl
anta
, G
A17
0.0
n/
aD
iet
Dr
Pepp
erC
adbu
ry S
chw
eppe
sL
ondo
n, U
.K.
140.
124
.6Si
erra
Mis
tPe
psiC
oPu
rcha
se,
NY
138.
841
.4
Tot
al S
ales
Mar
keti
ng M
edia
Bra
ndC
ompa
ny N
ame
Hea
dqua
rter
s($
mill
ions
)E
xpen
ditu
res
($ m
illio
ns)
New
Age
/Spo
rts/
Wat
erG
ator
ade
Peps
iCo
Purc
hase
, N
Y2,
648.
912
7.6
Aqu
afin
aPe
psiC
oPu
rcha
se,
NY
1,06
1.1
21.4
Das
ani
The
Coc
a-C
ola
Com
pany
Atl
anta
, G
A92
5.1
17.5
Lip
ton
Peps
iCo
Purc
hase
, N
Y66
8.3
0.2
Red
Bul
lR
e d B
ull
NA
Sant
a M
onic
a, C
A59
4.5
31.6
Snap
ple
Cad
bury
Sch
wep
pes
Lon
don,
U.K
.53
1.1
10.5
Min
ute
Mai
d Si
ngle
Se r
veT
he C
oca-
Col
a C
ompa
nyA
tlan
ta,
GA
503.
435
.7Po
we r
ade
The
Coc
a-C
ola
Com
pany
Atl
anta
, G
A46
0.2
10.5
Pola
nd S
prin
gN
e stl
é W
ate r
sG
ree n
wic
h, C
T45
0.3
3.1
Ari
Zon
aFe
roli
toV
ulta
ggio
, N
Y36
9.0
n/
a
SOU
RC
E: R
epri
nted
wit
h pe
rmis
sion
, fro
m B
rand
Wee
k (2
005)
. ©B
rand
wee
k R
esea
rch
2005
/ So
urce
s: B
ever
age
Dig
est
(sal
es in
mill
ions
of
case
s);
TN
S (m
edia
). *
Tot
al s
ales
in
dolla
rs w
ere
not
repo
rted
.
150 FOOD MARKETING TO CHILDREN AND YOUTH
serve as socially responsible corporate stakeholders in the response to child-hood obesity. In making positive changes that expand consumers’ selectionof healthier foods and beverages, despite the challenges of market forcesand the marketplace, companies may also be seeking to avoid the risk ofeither stronger government regulation or litigation possibilities that havebeen identified by industry analysts (FitchRatings, 2004; JP Morgan, 2003;UBS Warburg, 2002).
Food and Beverage Retailers
In 2004, Americans visited supermarkets an average of 2.2 times perweek (FMI, 2004). A supermarket is defined as any full-line, self-servicegrocery store generating a sales volume of $2 million or more annually(FMI, 2004). Supermarket sales in 2004 totaled $457.4 billion (FMI, 2004).Several supermarket designs exist in the United States including conven-tional, superstore, combination food and drug, warehouse clubs, economylimited-assortment store,6 and hypermarket7 (Kaufman, 2002). A variety ofprinciples shape the marketing strategies of food retailers: penetration, toattract the maximum number of households; frequency, to engage shoppersso they will make repeat shopping trips; and spending, to encourage con-sumers to purchase more during each trip (ACNielsen, 2004). Carbonatedbeverages, candy, and snack foods were identified as top food categoriesthat drove penetration and frequency in 2003 (ACNielsen, 2004; Kelleyet al., 2004).
A recent consumer survey conducted by the Food Marketing Institutefound that women are the primary grocery shoppers in two-thirds of house-holds, and only 16 percent have a shared responsibility between womenand men. According to the survey, the most common reasons why shoppersreport not eating a healthful diet is the desire for convenience foods (whichthey believe are not as healthful as home-prepared meals), perceived cost,and confusion about what constitutes healthful choices (FMI, 2003). Thesurvey found that younger shoppers are especially interested in preparedfoods, partly because they report that food preparation is more difficultfor them.
6Economy limited-assortment stores are lower priced supermarkets that typically sell alimited number of brands and sizes, many of which are private-label brand goods, at lowerprices than traditional supermarkets. They are not full-service supermarkets, and they gener-ally require customers to bring their own bags and bag their own purchases.
7Hypermarkets combine a supermarket and a department store, resulting in an extremelyspacious retail facility that carries an enormous range of products under one roof, includingfull lines of fresh groceries and apparel.

FOOD AND BEVERAGE MARKETING TO CHILDREN AND YOUTH 151
Shopping frequency in traditional retail outlets, such as grocery stores,declined from 1993 to 2001 (Deutche Bank Securities, 2004) but increasedin superstores (e.g., Wal-Mart), warehouse clubs (e.g., B.J’s, Costco,Sam’s), and nontraditional outlets such as convenience stores and drugstores, which are among the fastest growing venues where shoppers pur-chase food (ACNielsen, 2004; Deutche Bank Securities, 2004). Food mer-chandising at drug stores has increased in recent years with the more aislesoffering seasonally available, limited assortments of food. In 2003, foodand beverages led drug store sales at 27 percent of total sales. Candy wasthe third largest category of food sold in drug stores, based on total sales,followed by carbonated beverages (ACNielsen, 2004).
Full Serve and Quick Serve Restaurants
People are getting their meals from outside the home more often. In2002, approximately half (46 percent) of Americans’ food dollar was spenton away-from-home foods that were either fully prepared and eaten eitheroutside the home or brought into the home for consumption, up from27 percent of Americans’ food dollar in 1962 (Variyam, 2005b; Table 4-2).With increases in household incomes and the proportion of two-working-parent families, a larger share of food spending is devoted to prepared andout-of-home foods and meals (Jekanowski, 1999; Kaufman, 2002; Variyam,2005a). The share of Americans’ daily caloric intake from away-from-home foods increased from 18 percent in 1977–1978 to 32 percent in 1994–1996 (Variyam, 2005b).
Restaurants have become part of the American lifestyle. The restaurantindustry estimates that the full serve restaurant and quick serve restaurant(QSR)8 or fast food restaurant sector will provide approximately 70 billionmeals or snacks to U.S. consumers in 2005 (NRA, 2005). More than900,000 commercial restaurants are projected to generate an estimated$476 billion in annual sales in 2005, up from $42.8 billion in 1970 (NRA,2005). Consumer per-capita spending at fast food outlets such as QSRs areexpected to rise by 6 percent between 2000 and 2020 (Stewart et al., 2004).In 2004, the leading 10 QSR chains accounted for $73.4 billion in sales(Table 4-6).
8Quick serve restaurants is a common industry and marketing term used to refer to acategory of restaurants characterized by food that is supplied quickly after ordering and withminimal service. Food and beverages purchased may be consumed at the restaurant or servedas take-out. The complete term, quick serve restaurants, is used in other chapters of thisreport instead of QSRs due to the lack of familiarity of this term among nonmarketingaudiences.

152
TA
BL
E 4
-6L
eadi
ng Q
SR C
hain
s by
Tot
al S
ales
and
Mar
keti
ng M
edia
Exp
endi
ture
s, 2
004
Tot
al S
ales
Mar
keti
ng M
edia
Bra
ndSe
gmen
tC
ompa
ny N
ame
Hea
dqua
rter
s($
bill
ions
)E
xpen
ditu
res
($ m
illio
ns)
McD
onal
d’s
Bur
ger
McD
onal
d’s
Cor
pora
tion
Oak
Bro
ok,
IL24
.452
8.8
Wen
dy’s
Bur
ger
Wen
dy’s
Int
erna
tion
alD
ubli
n, O
H7.
733
1.3
Bur
ger
Kin
gB
urge
rB
urge
r K
ing
Cor
pora
tion
Mia
mi,
FL
7.7
287.
1Su
bway
Sand
wic
hD
octo
r’s
Ass
ocia
tes
Mil
ford
, C
T6.
328
7.1
Tac
o B
ell
Mex
ican
Yum
! B
rand
s, T
aco
Bel
l C
orpo
rati
onIr
vine
, C
A5.
719
4.4
Pizz
a H
utPi
zza/
past
aY
um!
Bra
nds,
Piz
za H
utD
alla
s, T
X5.
318
5.2
KFC
Chi
cken
Yum
! B
rand
s, K
FC C
orpo
rati
onL
ouis
vill
e, K
Y4.
921
2.1
Star
buck
sSn
ack
Star
buck
sSe
attl
e, W
A4.
826
.4D
unki
n’ D
onut
sSn
ack
Dun
kin’
Bra
nds
Can
ton,
MA
3.4
61.8
Dom
ino’
s Pi
z za
Piz z
a/pa
sta
Dom
ino’
s Pi
z za
Ann
Arb
or,
MI
3.2
130.
8
SOU
RC
E:
Rep
rint
ed w
ith
perm
issi
on,
from
Bra
ndW
eek
(200
5).
©B
rand
wee
k R
esea
rch
2005
/ S
ourc
es:
Tec
hnom
ic (
sale
s);
TN
S (m
edia
).

FOOD AND BEVERAGE MARKETING TO CHILDREN AND YOUTH 153
Trade Associations
Trade associations represent their industry members in several capaci-ties including government relations, regulatory guidance, media interac-tions, and nutrition institutions. These organizations often compile data onannual industry sales and consumer trends pertaining to their segments,educate manufacturers on technological advances and retailing practices,offer standards and guidelines for practice, and provide their member com-panies with technical research and support. A variety of trade associationsrepresent different segments of the food and beverage industry, retail andwholesale sectors, and the restaurant industry (Table 4-7).
Growing Purchasing Power of Children and Youth
Children and youth collectively represent a powerful economic anddemographic segment. They are a primary market, spending discretionaryincome on a variety of products that they acquire from allowances andother sources. Children and youth are also an influence market, determin-ing a large proportion of what is spent by parents and households. Finally,children and youth are the future market, representing tomorrow’s adultcustomers for branded products and services (McNeal, 1999; MPA, 2004a).
With discretionary income from allowances and other sources includ-ing gifts from parents, relatives, and friends, household chores, and outside
TABLE 4-7 Major Trade Associations Representing U.S. and GlobalFood and Beverage Manufacturers and Distributors
Association Segment Represented
American Bakers Association Wholesale baking industryAmerican Beverage Association Beverage manufacturers, marketers,
distributors, franchise companies of non-alcoholic beverages
Food Products Association Food and beverage manufacturersGrocery Manufacturers Association Branded food, beverage, and consumer
product companiesInternational Dairy Foods Association Dairy food manufacturers, marketers,
distributors, and industry suppliersNational Confectioners Association Confectionery and candy manufacturers and
suppliersNational Restaurant Association Full serve restaurants and QSRsSnack Food Association Snack manufacturers and suppliersUnited Fresh Fruit & Vegetable Growers, shippers, processors, brokers,
Association wholesalers and distributors of produce
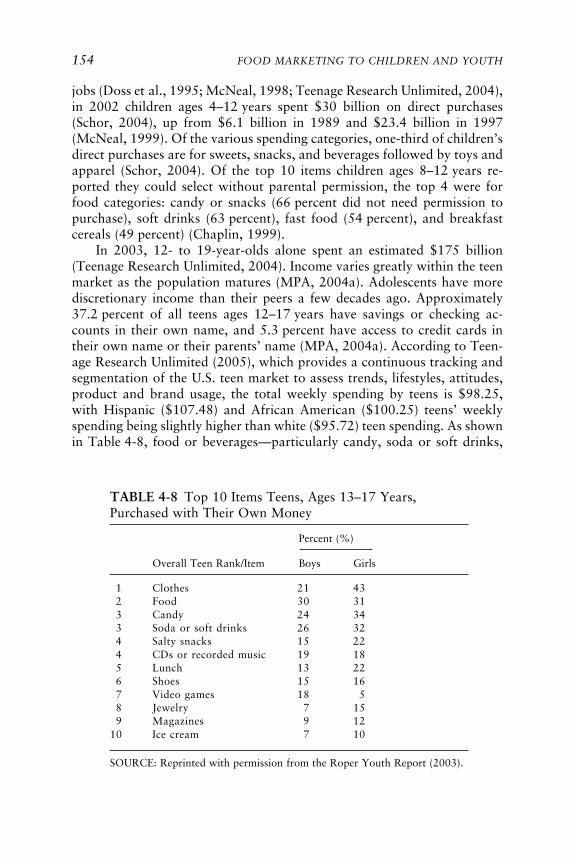
154 FOOD MARKETING TO CHILDREN AND YOUTH
jobs (Doss et al., 1995; McNeal, 1998; Teenage Research Unlimited, 2004),in 2002 children ages 4–12 years spent $30 billion on direct purchases(Schor, 2004), up from $6.1 billion in 1989 and $23.4 billion in 1997(McNeal, 1999). Of the various spending categories, one-third of children’sdirect purchases are for sweets, snacks, and beverages followed by toys andapparel (Schor, 2004). Of the top 10 items children ages 8–12 years re-ported they could select without parental permission, the top 4 were forfood categories: candy or snacks (66 percent did not need permission topurchase), soft drinks (63 percent), fast food (54 percent), and breakfastcereals (49 percent) (Chaplin, 1999).
In 2003, 12- to 19-year-olds alone spent an estimated $175 billion(Teenage Research Unlimited, 2004). Income varies greatly within the teenmarket as the population matures (MPA, 2004a). Adolescents have morediscretionary income than their peers a few decades ago. Approximately37.2 percent of all teens ages 12–17 years have savings or checking ac-counts in their own name, and 5.3 percent have access to credit cards intheir own name or their parents’ name (MPA, 2004a). According to Teen-age Research Unlimited (2005), which provides a continuous tracking andsegmentation of the U.S. teen market to assess trends, lifestyles, attitudes,product and brand usage, the total weekly spending by teens is $98.25,with Hispanic ($107.48) and African American ($100.25) teens’ weeklyspending being slightly higher than white ($95.72) teen spending. As shownin Table 4-8, food or beverages—particularly candy, soda or soft drinks,
TABLE 4-8 Top 10 Items Teens, Ages 13–17 Years,Purchased with Their Own Money
Percent (%)
Overall Teen Rank/Item Boys Girls
1 Clothes 21 432 Food 30 313 Candy 24 343 Soda or soft drinks 26 324 Salty snacks 15 224 CDs or recorded music 19 185 Lunch 13 226 Shoes 15 167 Video games 18 58 Jewelry 7 159 Magazines 9 12
10 Ice cream 7 10
SOURCE: Reprinted with permission from the Roper Youth Report (2003).

FOOD AND BEVERAGE MARKETING TO CHILDREN AND YOUTH 155
and salty snacks/chips—were ranked among the top 4 items that teens ages13–17 years last bought with their own money in 2003 (Roper YouthReport, 2003). Another marketing research study reports that younger andolder children purchase candy most frequently with their own money whileteens also frequently purchase gum, drinks, and other snacks in addition tocandy (Yankelovich, 2003).
Shopping malls represent the most frequent shopping place for adoles-cents. Boys and girls ages 14–17 years who shop at malls spend a reported$46.80 per visit. They visit malls more frequently than any other age groupat a rate of once weekly, and also spend the most time per visit whencompared to other places (MPA, 2004a). Teens also shop in many othervenues including discount stores, convenience stores, and grocery stores.Girls shop more frequently than boys at almost every shopping venue(MPA, 2004a).
Children and adolescents also influence household purchase decisions.The purchase influence of children and adolescents increases with age andis currently estimated at $500 billion annually for 2- to 14-year-olds (U.S.Market for Kids’ Foods and Beverages, 2003). In 1993, children and youthtogether wielded a purchase influence of $295 billion. Of this amount,children ages 3–11 years exerted a purchase influence totaling $125 billionand youth ages 12–17 years represented a purchase influence of $170 bil-lion (Stipp, 1993). In recent years, there has been a substantial increase inthe number of children and their parents who report that young consumersages 8–17 years are playing more prominent roles in household purchasingdecisions ranging from food to entertainment to media (Roper Youth Re-port, 2003).
Both parents and their children report that young people have thehighest purchase influence on food, when compared to other nonfoodspending categories such as music, electronics, and home decor (RoperYouth Report, 2003). In 2003, 78 percent of children and youth ages 8–17 years reported that they influenced family food purchases and 84 per-cent of their parents concurred (Roper Youth Report, 2003). Children andyouth, ages 6–17 years report that they help their parents select snackfoods, breakfast cereal, soft drinks, candy, cookies, and even the QSRswhere they eat (Yankelovich, 2003). Marketing research has found thatnearly three-quarters (73 percent) of mothers of children and teens ages 6–17 years state that their children have influence over the types of brandsand groceries they buy for the family (Yankelovich, 2003). Marketing re-search also suggests that parents believe that their children’s preferences areimportant in determining where food is purchased, as 21 percent of parentsin one survey report that their child’s preference for certain snack foods isan important factor in deciding where to shop (Yankelovich, 2003).
156 FOOD MARKETING TO CHILDREN AND YOUTH
New Product Development Targeted to Children and Youth
New product development is a central focus of innovation in the foodand beverage industry. A recent survey of 30 U.S. food and beverage com-panies found that 71 percent had reformulated products and 29 percenthad introduced new products across 3,000 product categories since 2002(GMA, 2004). Many of these were targeted to children. Annual sales offood and beverages to children and youth were more than $27 billion in2002 (U.S. Market for Kids’ Foods and Beverages, 2003). In 2004, prod-uct introductions targeted to children appeared to account for more than10 percent of all new food and beverage products according to an analysisof the ProductScan® database (Harris, 2005). Candy was the largest cat-egory (46 percent) and others included snacks (8 percent), cookies (6 per-cent), cereals (5 percent), and beverages (5 percent). Nearly half of thenew beverage products were fruit and fruit-flavored drinks. About 15 per-cent of all new children’s foods and beverages between 2000 and 2004were whole-grain, low-fat, and low-sugar products, up from 9 percent forthe previous 5 years (Harris, 2005).
Proliferation of Children’s Products
The committee analyzed the 50 food categories and 16 beverage cat-egories contained in the ProductScan® database for trends in new productintroductions targeted to children (Williams, 2005b). ProductScan® is anonline global database that has tracked new consumer products and pack-aged goods introductions into the U.S. marketplace since 1980 (MarketingIntelligence Service, 2005). In the ProductScan® database, a new product isdefined as a packaged, branded item that constitutes a new brand, line,variety, package type, package size or formulation, introduced to the retailshelf within the previous 90 days (Williams, 2005b).
Since 1994, the ProductScan® database has been structured to allowidentification of products specifically targeted to children (ages 4–12 years)and to teens (ages 13–19 years). Searching the full 1980–2004 databaseusing the keyword “children,” suggests generally that new products tar-geted to children during 1980–1994 were significantly fewer than from1994 to the present (Williams, 2005b). However, the age specificity of thesearch capacity has been improved for recent years. Figure 4-2a shows theyear-by-year new product introductions in the ProductScan® database from1994 to 2004 for all food products targeted to the total market and Fig-ure 4-2b shows the year-by-year new product introductions in the Product-Scan® database from 1994 to 2004 to children and youth. The number ofnew food and beverage products targeted to children and adolescents by
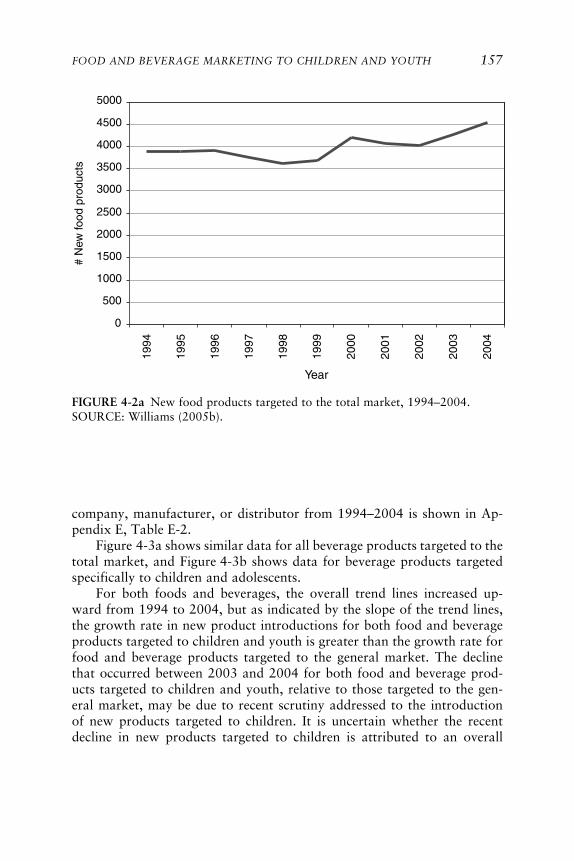
FOOD AND BEVERAGE MARKETING TO CHILDREN AND YOUTH 157
FIGURE 4-2a New food products targeted to the total market, 1994–2004.SOURCE: Williams (2005b).
company, manufacturer, or distributor from 1994–2004 is shown in Ap-pendix E, Table E-2.
Figure 4-3a shows similar data for all beverage products targeted to thetotal market, and Figure 4-3b shows data for beverage products targetedspecifically to children and adolescents.
For both foods and beverages, the overall trend lines increased up-ward from 1994 to 2004, but as indicated by the slope of the trend lines,the growth rate in new product introductions for both food and beverageproducts targeted to children and youth is greater than the growth rate forfood and beverage products targeted to the general market. The declinethat occurred between 2003 and 2004 for both food and beverage prod-ucts targeted to children and youth, relative to those targeted to the gen-eral market, may be due to recent scrutiny addressed to the introductionof new products targeted to children. It is uncertain whether the recentdecline in new products targeted to children is attributed to an overall
0
500
1000
1500
2000
2500
3000
3500
4000
4500
5000
1994
1995
1996
1997
1998
1999
2000
2001
2002
2003
2004
# N
ew fo
od p
rodu
cts
Year

158 FOOD MARKETING TO CHILDREN AND YOUTH
FIGURE 4-2b New food products targeted to children and adolescents, 1994–2004.SOURCE: Williams (2005b).
decrease in all new products, or whether it represents a selective reductionin certain categories, such as those products deemed to be less healthfulfor children and youth. Overall, in the period 1994–2004, there were3,936 new food products and 511 new beverage products targeted to chil-dren and youth (Williams, 2005b). Products high in total calories, sugar,or fat and low in nutrients dominated the profile of new foods and bever-ages targeted to children and youth, as indicated in Tables 4-9 and 4-10.
For example, for food products, the categories of candies, snacks, cook-ies, and ice cream accounted for 58 percent of all new products targeted tochildren in 1994–2004, compared to 27 percent of all new products tar-geted to the general market. For beverage products, the categories of fruitand fruit-flavored drinks accounted for 40 percent of all new productstargeted to children, compared to 22 percent of all new products targetedto the general market. These results concur with those reported by Harris(2005). On the other hand, one industry analysis has forecasted that health-ful food and beverage products for children will be among the most activeand profitable new product categories for industry over the next 5 yearsfrom 2005 to 2009 (Business Insights, 2005b).
0
100
200
300
400
500
600
1994
1995
1996
1997
1998
1999
2000
2001
2002
2003
2004
# N
ew fo
od p
rodu
cts
Year

FOOD AND BEVERAGE MARKETING TO CHILDREN AND YOUTH 159
FIGURE 4-3a New beverage products targeted to the total market, 1994–2004.SOURCE: Williams (2005b).
FIGURE 4-3b New beverage products targeted to children and adolescents, 1994–2004.SOURCE: Williams (2005b).
0
200
400
600
800
1000
1200
1400
1994
1995
1996
1997
1998
1999
2000
2001
2002
2003
2004
# N
ew b
ever
age
prod
ucts
Year
0
10
20
30
40
50
60
70
80
90
100
1994
1995
1996
1997
1998
1999
2000
2001
2002
2003
2004
# N
ew b
ever
age
prod
ucts
Year

160 FOOD MARKETING TO CHILDREN AND YOUTH
TABLE 4-9 Top Food Categories for New ProductsTargeted to Children and Adolescents, 1994–2004
Category Number of New Products
Candies—nonchocolate 1,407Chewing gum 354Snacks 265Candies—chocolate 236Cereals 231Cookies 225Meals 171Ice cream & frozen yogurt 168Pasta 98Yogurt 77Crackers 71Snack bars 70Pastry 66Desserts 55Cheese 50Mixes 49Fruits 41Sweet toppings 27Cakes 25Chips 25Popcorn 25Soup 21Bread products 20Jams 20Poultry 16Nut butters 13Vegetables 11Meat 11Sauces & gravies 11Meat substitutes 10Catsup 10Meal replacements 9Fish 8Staples 8Baby food 6Rice 4Salad dressings 4Spices 3Nuts & seeds 2Dairycase foods 2Mustard 2Sauces 2Salads 1Entrée mixes 1
continues

FOOD AND BEVERAGE MARKETING TO CHILDREN AND YOUTH 161
Finding: Children and youth ages 4–17 years have increasing discretionaryincome and purchasing capacity, are being targeted more directly by mar-keters, and frequently spend their discretionary income on high-calorie andlow-nutrient foods and beverages.
Children’s Versions of Classic Products
In addition to the development of new products oriented to childrenand youth, food and beverage companies have devoted considerable at-tention to enhancing the appeal of existing products to a younger market,using novel package designs, names, and co-branding with recognizablecartoon or fictional characters (Mintel International Group Ltd., 2003).For example, Heinz introduced Heinz EZ Squirt™, a “kid-friendly”
TABLE 4-10 Top Beverage Categories for NewProducts Targeted to Children, 1994–2004
Category Number of New Products
Fruit drinks 203Milk, nondairy milk, & yogurt drinks 96Beverage mixes & flavorings 60Carbonated soft drinks 39Bottled water 34Sports beverages 34Health drinks 10Baby beverages 10Vegetable drinks 3Miscellaneous drinks 22Total 511
SOURCE: Williams (2005b).
Margarine, butter, & spreads 1Oil, shortening, & cooking sprays 1Pickles, olives, & condiments 1Dips & salad toppings 1Miscellaneous foods 1Total 3,936
SOURCE: Williams (2005b).
TABLE 4-9 Continued
Category Number of New Products

162 FOOD MARKETING TO CHILDREN AND YOUTH
ketchup, available in “Blastin’ Green” and “Funky Purple” colors, andsubstantially increased the company’s market share in 2003 (McGinn,2003). However, like many products, they proved to have a short-livednovelty appeal and were withdrawn from the market soon after theirintroduction.
By contrast, conventional wisdom suggested that children would notlike yogurt due to its generally sour flavor. Yogurt has demonstrated aninteresting evolution both in product and child taste adaptation. Wholenew products have been introduced that appeal to children’s preferences forsweet tastes. Dannon pioneered children’s yogurt with Dannon Sprinklin’s®,a version of its regular yogurt flavors with candy sprinkles encased on thecap that children could add to the yogurt (Dannon, 2005). Dannon laterdeveloped a drinkable yogurt called Danimals®, and Frusion® smoothies, a10-ounce bottle of real fruit and low-fat yogurt within its child productportfolio. Both of these brands offer sweeter yogurt taste and portability forchildren (Dannon, 2005). General Mills followed with several innovationsin the yogurt category that intended to make yogurt appealing to children.The first of these products was a line extending its Trix® cereal into itsYoplait® yogurt line with a mixed fruit and sweetened formulation oftraditional yogurt (General Mills, 2005a). General Mills changed the yo-gurt packaging format with the launch of Go-Gurt®, which comes in longtubes, and Go-Gurt® smoothies that are sold in small plastic bottle-shapedcontainers (General Mills, 2005b). Other companies that have developedand market dairy-based products for children include Kraft Foods, whichdeveloped Twist-ums™ string cheese sticks, and The Coca-Cola Company,which manufactures Swerve™, a milk-based beverage product consisting of51 percent skim milk (The Coca-Cola Company, 2005a).
Convenience and Portability
Convenience and portability have become guiding principles in thefood company business. Swanson & Sons began this trend when the com-pany created the first TV dinner in 1953 (Lauro, 2002). The dinners weremarketed as quick meals that required minimal preparation time. The mealscame in various forms and generally included meat, a starch, a vegetable,and dessert. In the 1960s, Swanson removed the words “TV dinner” fromthe packaging and has since introduced lighter meals in microwave-safetrays for consumers. Swanson TV dinners still remain in the public memoryas the dinner phenomenon of the 1950s generation that grew up withtelevision (Pinnacle Foods Corporation, 2003).
Easy preparation of meals has allowed children greater flexibility andindependence in preparing their own meals. The concept of the TV dinnerevolved into child-targeted variations of the dinner meal in the 1980s.
FOOD AND BEVERAGE MARKETING TO CHILDREN AND YOUTH 163
ConAgra Foods launched Kid Cuisine® as a line of frozen food entréesintended especially for children and young teens (ConAgra Foods, 2004).Using various character appeals, first a cartoon chef and later an ani-mated penguin, Kid Cuisine® offered meals similar to Swanson TV din-ners. ConAgra Foods markets 11 different varieties of the Kid Cuisine®
meal, from chicken breast nuggets to alien invasion pepperoni pizza(ConAgra Foods, 2004).
Marketing research conducted by Nickelodeon suggests that nearlythree-quarters of children and youth report that they decide on their ownwhat they eat for breakfast most or all of the time (Smalls, 2005b). Break-fast options have undergone substantial innovations over the past 40 yearsfrom ready-to-eat (RTE) sweetened breakfast cereals to breakfast bars andpastries. The breakfast pastry category was pioneered by the Kellogg Com-pany with the introduction of Pop-Tarts® in 1963, allowing children toprepare their own breakfasts by putting a flat pastry into the toaster, anapproach since adopted by a number of companies. The company hasdoubled sales in the United States from 1 billion in the early 1990s to anestimated 2 billion Pop-Tarts® annually (Prichard, 2003). Other breakfastinnovations with child appeal include a number of breakfast bars by vari-ous companies with ingredients ranging from cereal, fruit, and milk tochocolate and cookies.
A new lunch combination category was specifically designed for chil-dren by Kraft Foods in 1988 when the Oscar Mayer Lunchables® waslaunched (Kraft Foods, 2005a). This line of convenience foods was the firstprepackaged, RTE lunch that offered meat, cheese, and crackers, now inthree sizes of packages—the largest with 40 percent more food (Kraft Foods,2005a). Sports drink beverages have also become popular over the pastthree decades. Gatorade® Thirst Quencher was created in 1965 at theUniversity of Florida to help athletes stay hydrated during active sports(Gatorade, 2004), and now represents a category of products marketedwidely as a product for children and youth.
Finding: Child-targeted food and beverage products have steadily increasedover the past decade, and are typically high in total calories, sugars, salt,fat, and low in nutrients.
MARKETING STRATEGIES, TACTICS, AND MESSAGING
Advertising and Marketing of Foods and Beverages in the United States
The scope of marketing expenditures in the United States is very large.Gross marketing expenditures in 2004 for all products, including food,beverages, and other manufactured items, totaled $264 billion, including
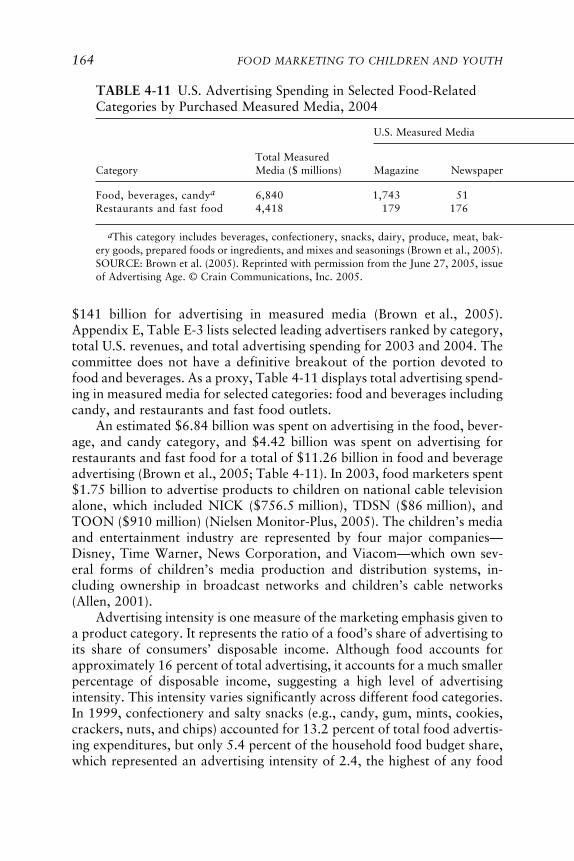
164 FOOD MARKETING TO CHILDREN AND YOUTH
$141 billion for advertising in measured media (Brown et al., 2005).Appendix E, Table E-3 lists selected leading advertisers ranked by category,total U.S. revenues, and total advertising spending for 2003 and 2004. Thecommittee does not have a definitive breakout of the portion devoted tofood and beverages. As a proxy, Table 4-11 displays total advertising spend-ing in measured media for selected categories: food and beverages includingcandy, and restaurants and fast food outlets.
An estimated $6.84 billion was spent on advertising in the food, bever-age, and candy category, and $4.42 billion was spent on advertising forrestaurants and fast food for a total of $11.26 billion in food and beverageadvertising (Brown et al., 2005; Table 4-11). In 2003, food marketers spent$1.75 billion to advertise products to children on national cable televisionalone, which included NICK ($756.5 million), TDSN ($86 million), andTOON ($910 million) (Nielsen Monitor-Plus, 2005). The children’s mediaand entertainment industry are represented by four major companies—Disney, Time Warner, News Corporation, and Viacom—which own sev-eral forms of children’s media production and distribution systems, in-cluding ownership in broadcast networks and children’s cable networks(Allen, 2001).
Advertising intensity is one measure of the marketing emphasis given toa product category. It represents the ratio of a food’s share of advertising toits share of consumers’ disposable income. Although food accounts forapproximately 16 percent of total advertising, it accounts for a much smallerpercentage of disposable income, suggesting a high level of advertisingintensity. This intensity varies significantly across different food categories.In 1999, confectionery and salty snacks (e.g., candy, gum, mints, cookies,crackers, nuts, and chips) accounted for 13.2 percent of total food advertis-ing expenditures, but only 5.4 percent of the household food budget share,which represented an advertising intensity of 2.4, the highest of any food
TABLE 4-11 U.S. Advertising Spending in Selected Food-RelatedCategories by Purchased Measured Media, 2004
U.S. Measured Media
Total MeasuredCategory Media ($ millions) Magazine Newspaper
Food, beverages, candya 6,840 1,743 51Restaurants and fast food 4,418 179 176
aThis category includes beverages, confectionery, snacks, dairy, produce, meat, bak-ery goods, prepared foods or ingredients, and mixes and seasonings (Brown et al., 2005).SOURCE: Brown et al. (2005). Reprinted with permission from the June 27, 2005, issueof Advertising Age. © Crain Communications, Inc. 2005.
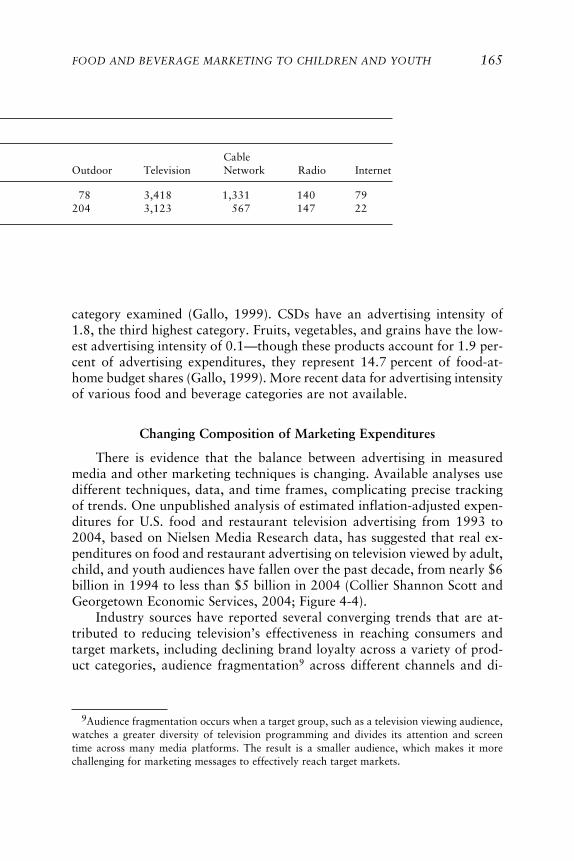
FOOD AND BEVERAGE MARKETING TO CHILDREN AND YOUTH 165
CableOutdoor Television Network Radio Internet
78 3,418 1,331 140 79204 3,123 567 147 22
category examined (Gallo, 1999). CSDs have an advertising intensity of1.8, the third highest category. Fruits, vegetables, and grains have the low-est advertising intensity of 0.1—though these products account for 1.9 per-cent of advertising expenditures, they represent 14.7 percent of food-at-home budget shares (Gallo, 1999). More recent data for advertising intensityof various food and beverage categories are not available.
Changing Composition of Marketing Expenditures
There is evidence that the balance between advertising in measuredmedia and other marketing techniques is changing. Available analyses usedifferent techniques, data, and time frames, complicating precise trackingof trends. One unpublished analysis of estimated inflation-adjusted expen-ditures for U.S. food and restaurant television advertising from 1993 to2004, based on Nielsen Media Research data, has suggested that real ex-penditures on food and restaurant advertising on television viewed by adult,child, and youth audiences have fallen over the past decade, from nearly $6billion in 1994 to less than $5 billion in 2004 (Collier Shannon Scott andGeorgetown Economic Services, 2004; Figure 4-4).
Industry sources have reported several converging trends that are at-tributed to reducing television’s effectiveness in reaching consumers andtarget markets, including declining brand loyalty across a variety of prod-uct categories, audience fragmentation9 across different channels and di-
9Audience fragmentation occurs when a target group, such as a television viewing audience,watches a greater diversity of television programming and divides its attention and screentime across many media platforms. The result is a smaller audience, which makes it morechallenging for marketing messages to effectively reach target markets.

166 FOOD MARKETING TO CHILDREN AND YOUTH
verse media platforms, increased advertising costs, rising price elasticity,and increased trade promotion spending by food and beverage manufactur-ers that is accompanied by decreased spending for advertising and con-sumer promotion (Deutche Bank Securities, 2004; Smith et al., 2005). In-dustry and marketing sources suggest that food and beverage companiesand restaurants have been progressively reducing their television advertis-ing budgets, reinvesting in other communication channels, and using inte-grated marketing strategies to reach consumers more effectively (CollierShannon Scott and Georgetown Economic Services, 2005b; Deutche BankSecurities, 2004). An independent analysis that could confirm these trendswas not available to the committee.
A recent trade promotion spending and merchandising study, based on400 responses from an array of retailers and manufacturers across all con-nected sectors (Cannondale Associates, 2005), estimated the general distri-bution of companies’ marketing expenditures for trade promotion, account-specific marketing, consumer promotion, and advertising from 1997 to2004 (GMA Forum, 2005) (Figure 4-5). In general, for all companies, tradepromotion was approximately 44 percent of marketing expenditures in1997 and 48 percent in 2004. Advertising expenditures increased slightlyfrom 23 percent in 1997 to 26 percent in 2004 (GMA Forum, 2005). Mar-keting budget allocations may differ based on the type of company and thesize of the company, with food companies generally allocating more for
FIGURE 4-4 Estimated inflation-adjusted expenditures on food, beverages, andrestaurant advertising on television, 1993–2004.NOTE: Based on an analysis of Nielsen Media Research data.SOURCE: Collier Shannon Scott and Georgetown Economic Services (2005b).
0
1
2
3
4
5
6
7
1993 1994 1995 1996 1997 1998 1999 2000 2001 2002 2003 2004
Year
Exp
endi
ture
s in
Bill
ions
of D
olla
rs

FOOD AND BEVERAGE MARKETING TO CHILDREN AND YOUTH 167
trade promotion than other types of companies. One analysis indicates thatfood companies devote 55 percent of their marketing budgets for tradepromotion, 25 percent for consumer promotion (including account-specificmarketing), and 20 percent for advertising (GMA Forum, 2005).
Although expenditures on traditional television advertising for foodand beverage products have slowed over the past decade, television stillremains the primary promotional medium when compared to other mea-sured media categories (Brown et al., 2005; Table 4-11). It appears thatmore food, beverage, and restaurant advertising dollars are shifting fromtelevision into unmeasured media sales promotion (e.g., product placement,character licensing, in-school marketing, special event marketing) (CollierShannon Scott and Georgetown Economic Services, 2004, 2005b;PQMedia, 2005). For example, the investment in the value of all productplacement increased from $190 million in 1974 to $3.46 billion in 2004,reflecting a trend away from traditional advertising to alternative market-ing strategies (PQMedia, 2005; Figure 4-6). From 1974 to 2004, all prod-uct placement (including food and beverages) in television increased from$71 million to $1.88 billion. During the same period, as reported by
FIGURE 4-5 Allocation of all companies’ marketing expenditures (including foodcompanies), 1997–2004.NOTE: See pages 137-138 for a description of marketing categories.SOURCE: Reprinted with permission, from GMA Forum (2005).
Advertising
Consumer Promotion
Account-Specific
Marketing
Trade Promotion
44 4753 49 51 49 48
99
7 11 10 10 10
24 1917 16 15 17 16
23 25 23 24 24 24 26
0%
50%
100%
1997 1998 1999 2000 2001 2002 2004
Year
Per
cent
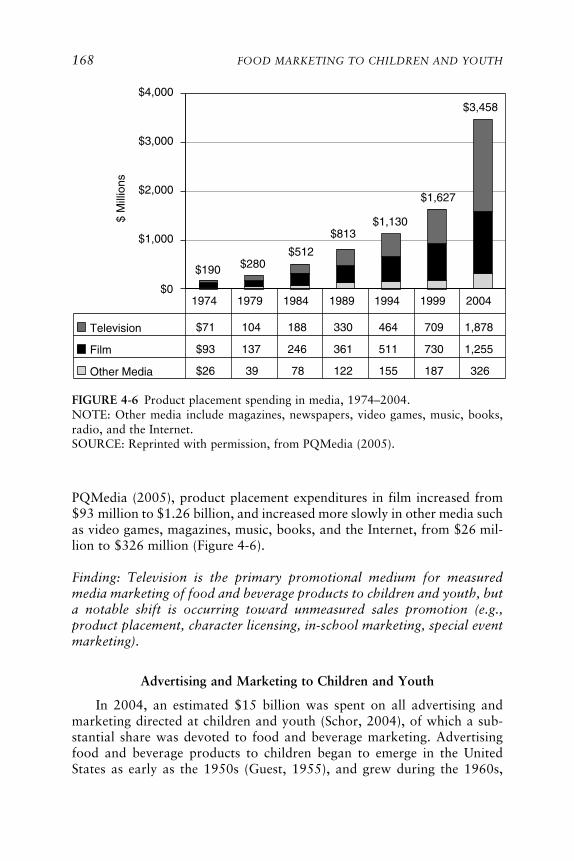
168 FOOD MARKETING TO CHILDREN AND YOUTH
PQMedia (2005), product placement expenditures in film increased from$93 million to $1.26 billion, and increased more slowly in other media suchas video games, magazines, music, books, and the Internet, from $26 mil-lion to $326 million (Figure 4-6).
Finding: Television is the primary promotional medium for measuredmedia marketing of food and beverage products to children and youth, buta notable shift is occurring toward unmeasured sales promotion (e.g.,product placement, character licensing, in-school marketing, special eventmarketing).
Advertising and Marketing to Children and Youth
In 2004, an estimated $15 billion was spent on all advertising andmarketing directed at children and youth (Schor, 2004), of which a sub-stantial share was devoted to food and beverage marketing. Advertisingfood and beverage products to children began to emerge in the UnitedStates as early as the 1950s (Guest, 1955), and grew during the 1960s,
FIGURE 4-6 Product placement spending in media, 1974–2004.NOTE: Other media include magazines, newspapers, video games, music, books,radio, and the Internet.SOURCE: Reprinted with permission, from PQMedia (2005).
$0
$1,000
$2,000
$3,000
$4,000
Television $71 104 188 330 464 709 1,878
Film $93 137 246 361 511 730 1,255
Other Media $26 39 78 122 155 187 326
1974 1979 1984 1989 1994 1999 2004
$190 $280$512
$813$1,130
$1,627
$3,458$
Mill
ions

FOOD AND BEVERAGE MARKETING TO CHILDREN AND YOUTH 169
with the growth of the baby boomers as an untapped consumer market(McNeal, 1964, 1999). Over the decade of the 1990s, there was an esti-mated 20-fold increase in expenditures on advertisements that targetedchildren (Strasburger, 2001). Currently, advertising and marketing reachyoung consumers through many settings (e.g., schools, child care, grocerystores, shopping malls, theaters, sporting events, sponsored events, kids’clubs) and media (e.g., network and digital television, cable television,radio, magazines, books, the Internet, video games, and advergames).Marketing is both direct, targeted to children and youth, and indirect,targeted to mothers who are the gatekeepers of the household (Powell,2005). Companies often design dual-marketing strategies to reach childrenand youth with attractive product packaging and marketing communica-tions that promote messages emphasizing taste, convenience, and funwhereas mothers are more often targeted with messages about the nutri-tional qualities such as the wholesomeness or health benefits of brandedproducts (Schor, 2004).
The expenditures on food, beverage, and restaurant marketing are sub-stantial. The advertising component alone amounted to industry expendi-tures of more than $11 billion in 2004, a sizable portion of which targetsyoung people (Brown et al., 2005; Table 4-11). Of this, an estimated $5 to$6.5 billion was spent on televised food, beverage, and restaurant advertise-ments (Brown et al., 2005; Collier Shannon Scott and Georgetown Eco-nomic Services, 2004, 2005a), including about $1 billion to advertise di-rectly to young consumers, primarily through television (McNeal, 1999).Additionally, more than $4.5 billion a year is spent on promotions such aspremiums and coupons, $2 billion is spent on youth-targeted public rela-tions including event marketing and school-based marketing, and $3 billionannually is spent on food product packaging designed for children andyouth (McNeal, 1999). In all, an estimated more than $10 billion per yearis now expended to market food, beverage, and restaurant products tochildren and youth (Brownell and Horgen, 2004).
Product Appeals
Fun, taste, and product performance are the predominant appeals usedin children’s food and beverage television advertising (Tseng, 2001). Televi-sion commercials use music and familiar songs and jingles to enhance theperceived quality of a brand and to serve as a vehicle for children to remem-ber the name of a product (Scammon and Christopher, 1981; Schor, 2004).Child actors portrayed in food and beverage commercials have traditionallybeen depicted as having fun with their peers when they consume the adver-tised product (CSPI, 2003). Audiovisual production techniques accentuateand enhance positive feelings about products by using action, rapid pacing,
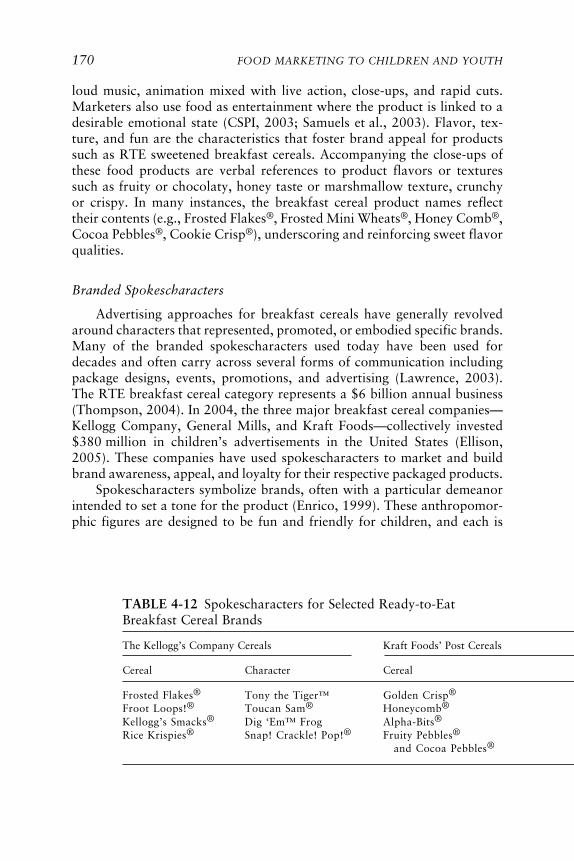
170 FOOD MARKETING TO CHILDREN AND YOUTH
loud music, animation mixed with live action, close-ups, and rapid cuts.Marketers also use food as entertainment where the product is linked to adesirable emotional state (CSPI, 2003; Samuels et al., 2003). Flavor, tex-ture, and fun are the characteristics that foster brand appeal for productssuch as RTE sweetened breakfast cereals. Accompanying the close-ups ofthese food products are verbal references to product flavors or texturessuch as fruity or chocolaty, honey taste or marshmallow texture, crunchyor crispy. In many instances, the breakfast cereal product names reflecttheir contents (e.g., Frosted Flakes®, Frosted Mini Wheats®, Honey Comb®,Cocoa Pebbles®, Cookie Crisp®), underscoring and reinforcing sweet flavorqualities.
Branded Spokescharacters
Advertising approaches for breakfast cereals have generally revolvedaround characters that represented, promoted, or embodied specific brands.Many of the branded spokescharacters used today have been used fordecades and often carry across several forms of communication includingpackage designs, events, promotions, and advertising (Lawrence, 2003).The RTE breakfast cereal category represents a $6 billion annual business(Thompson, 2004). In 2004, the three major breakfast cereal companies—Kellogg Company, General Mills, and Kraft Foods—collectively invested$380 million in children’s advertisements in the United States (Ellison,2005). These companies have used spokescharacters to market and buildbrand awareness, appeal, and loyalty for their respective packaged products.
Spokescharacters symbolize brands, often with a particular demeanorintended to set a tone for the product (Enrico, 1999). These anthropomor-phic figures are designed to be fun and friendly for children, and each is
TABLE 4-12 Spokescharacters for Selected Ready-to-EatBreakfast Cereal Brands
The Kellogg’s Company Cereals Kraft Foods’ Post Cereals
Cereal Character Cereal
Frosted Flakes® Tony the Tiger™ Golden Crisp®
Froot Loops!® Toucan Sam® Honeycomb®
Kellogg’s Smacks® Dig ‘Em™ Frog Alpha-Bits®
Rice Krispies® Snap! Crackle! Pop!® Fruity Pebbles®
and Cocoa Pebbles®

FOOD AND BEVERAGE MARKETING TO CHILDREN AND YOUTH 171
General Mills’ Cereals
Character Cereal Character
Sugar Bear Trix® The Trix® RabbitCrazy Craver Cocoa Puffs® Sonny the Cuckoo BirdAlpha-Bit Characters Lucky Charms® Lucky the LeprechaunFred Flintstone and Count Chocula® Count Chocula®
Barney Rubble
associated with the company’s branded breakfast cereal. Table 4-12 showsspokescharacters for selected RTE cereal brands. Some of the charactershave undergone physical transformations over the decades. For example,Tony the Tiger™ was created in 1951 to promote Kellogg’s Sugar FrostedFlakes® that was later changed to Frosted Flakes®. More recently, he hasbeen designed as slimmer and more muscular as Americans became morehealth conscious (Enrico, 1999). In 2005, the Tony the Tiger™ mascot waslaunched to reach 2- to 5-year-olds through a $20 million television andprint campaign targeted to mothers as the household gatekeepers with areformulated cereal as a “food to grow by” and to help active children“earn their stripes” (Thompson, 2004).
Real-life branded spokescharacters have also been used by companiesto market their image and branded products. A clown named RonaldMcDonald was created in 1963 and used as a spokescharacter to appeal tochildren, with the intent of associating him with a fun experience and thefood offered at McDonald’s (Enrico, 1999; Ritzer, 2004). Selected as thesecond most famous advertising image of the 20th century, after the Marl-boro Man, Ronald McDonald’s face is recognized by nearly 96 percent ofAmerican children, and is used to sell fast food for the QSR internationallyin more than 25 languages (Enrico, 1999).
Employing the same type of advertising used for RTE breakfast cereals,manufacturers of bakery products such as snack cakes, cupcakes, andTwinkies used spokescharacters in enjoyable adventures. For example,Hostess uses Happy Hoho® and Captain Cupcake® (Hostess, 2005) andNestlé uses the Nesquik Bunny™ to promote its chocolate-flavored bever-age directly to children (Nestlé, 2004). Kool-Aid®, created in the 1920s,was promoted by two spokescharacters, the Smiling Face Kool-Aid® Pitcher,and in 1975, the Kool-Aid® Man (Hastings Museum of Natural and Cul-tural History, 2004; Kraft Foods, 2005b).

172 FOOD MARKETING TO CHILDREN AND YOUTH
Character Merchandising, Co-Branding, Cross-Promotions
Character merchandising, co-branding, and cross-promotions are tech-niques used to further the reach of brands by building brand awarenessand brand loyalty. Character merchandising refers to the licensing of popu-lar fictional characters, such as Harry Potter™, Spiderman®, Scooby-Doo®,SpongeBob Square Pants®, Winnie the Pooh®, Rugrats®, and Elmo® topromote the sale of many types of products (CSPI, 2003; Mintel Interna-tional Group Ltd., 2003). Licensing is a contractual arrangement that al-lows copyright holders to loan their intellectual property to another com-pany in exchange for payment (Allen, 2001). Co-branding is a techniquewhere two companies partner to create one product. It is used to reach newcustomers and to extend a company’s name and trademark to new areas ofthe consumer market (Pollack Associates, 2003). Cross-promotion is a tech-nique in which a manufacturer sells a new product related to an existingproduct a consumer already uses or which the marketer has available.Cross-promotions have been mutually profitable and beneficial for compa-nies that build business relationships across products and media.
In the children’s media industries, companies may license the charactersand images of their media products to other companies for a fee. Thecharacters are taken from a variety of media sources including film car-toons, toy creations, live-action feature films, comic and fiction books,newspaper strip cartoons, video games, and advergames (Mintel Interna-tional Group Ltd., 2003). The toy industry has benefited greatly fromcharacter licensing of children’s movies and television. Other industries thathave generated profits from character merchandising are snack food com-panies, QSRs, and clothing manufacturers that incorporate popular charac-ters into their products to increase the likelihood that children or theirparents will buy their products (Allen, 2001).
Certain licensed characters, such as Spiderman® and Scooby-Doo®, aredesigned to appeal to children and parents who remember them from theirown childhoods (Mintel International Group Ltd., 2003). Many of thecharacters are found in multiple forms of media, such as Harry Potter™, afictional character from a book, who also appears in live-action films andcomputer games (Mintel International Group Ltd., 2003). Different charac-ters are used for various age groups depending on a child’s cognitive abili-ties and the appeal of the character to children and to parents. For example,mothers tend to have a preference for gentle, one-dimensional, friendly, andsafe characters such as Barney™, Mickey Mouse™, and Teletubbies™(Hind, 2003; Lawrence, 2003). Marketers seek to establish positive rela-tionships among a brand, the parent, and a very young child by developingprograms with branded stories, in order to promote an ongoing relation-ship with the spokescharacter that endorses the brand and that also pro-vides input to marketers for new product development targeted to youngchildren (Hind, 2003).

FOOD AND BEVERAGE MARKETING TO CHILDREN AND YOUTH 173
By the time children reach the age of 6–7 years, they prefer humorousand sometimes more aggressive characters, such as Looney Tunes’ RoadRunner (Lawrence, 2003). As they get older, tweens ages 8–13 years prefermore complicated characters such as The Simpsons™. As their lifestyleinterests broaden to include music and sports celebrities, cartoon charactersbecome less important and certain brands are less appealing when com-pared to teen or adult brands (Lawrence, 2003). Based on these trends, it isapparent that different developmental stages carry the prospect of differentresponses to marketing by children and youth.
Character licensing has been a prominent means of cross-promotingand increasing product interest and brand awareness in foods and bever-ages either as versions of the product (e.g., SpongeBob SquarePants® Mac‘n Cheese), or as premiums (toys, prizes, or giveaways) associated withtraditional products. Some companies develop business relationships withfood and beverage companies and purchase registered trademarks, such asGeneral Mills’ Cheerios® and Kraft Foods’ Oreos®, and use them under alicense agreement to co-brand and market products such as books or toysto children under the age of 6 years. Children’s books such as Kellogg’sFroot Loops!® Counting Fun Book (Barbieri McGrath, 2000), The Oreo™Cookie Counting Book (Lukas, 2000), The M&M’s® Brand ChocolateCandies Counting Board Book (Barbieri McGrath, 1997), and theCheerios® Play Book (Wade, 1998) are examples of licensing brands andco-branding aimed at young children. Products that have used cartooncharacters on packaging to promote foods include Nabisco’s Dora theExplorer® crackers and cookies, Edy’s Fish ‘N Chips® ice cream featuringDisney’s Finding Nemo characters, Kellogg’s Spiderman® Pop-Tarts®, andKraft Macaroni and Cheese® with noodle shapes in SpongeBobSquarePants®, Rugrats®, and Scooby-Doo® varieties.
Licensed characters have only recently been used to market healthfulfood and beverage products that are designed for consumption by pre-schoolers. Sesame Street has licensed several of its characters to companiesfor products such as Apple & Eve Sesame Street Juices® (Apple & Eve,2005), Earth’s Best® line of organic breakfast foods and snacks (Earth’sBest, 2005), and IN ZONE Brands’ Tummy Tickler 100 percent fruit juices(IN ZONE Brands, 2004). IN ZONE Brands has also licensed the use ofseveral other cartoon characters targeted at younger children including Bobthe Builder™, Clifford the Big Red Dog™, Barney™, and Snoopy™ inprograms such as Baby Looney Tunes™, Dragon Tales™, and Land BeforeTime® (IN ZONE Brands, 2004). The Fluid Milk Processor PromotionBoard has used cartoon characters such as Garfield the cat, Superman™,Rugrats®, and Blue’s Clues™ characters to promote the consumption ofmilk in children to promote bone health (Graetzer, 2005).
Cascadian Farm® promotes a high-fiber and reduced-sugar RTEbreakfast cereal featuring Clifford the Big Red Dog™ (Cascadian Farm,

174 FOOD MARKETING TO CHILDREN AND YOUTH
2003). Cascadian Farm built on its marketing of Clifford Crunch cerealto create “Clifford’s Guide to the Guidelines.” This online resource is anexample of how some companies are reaching out to engage parents byproviding tools for them to create healthful diets for their children. Theguide was designed to help parents understand and follow the 2005 U.S.Department of Health and Human Services (DHHS)/USDA DietaryGuidelines for Americans when planning their children’s meals (GeneralMills, 2005c; Chapters 2 and 3). Recently, Nickelodeon announced thatit has begun licensing its popular cartoon spokescharacters, SpongeBobSquarePants® and Dora the Explorer®, to produce companies for promot-ing fruits and vegetables such as carrots and spinach, although it will stillbe used on less healthful branded processed food products (Smalls,2005b). In addition, Sunkist® has recently collaborated with SesameWorkshop™ to encourage children and youth to choose citrus fruits as ahealthful snack alternative, using Sesame Street’s Cookie Monster®
(Sunkist, 2005). Long-term evaluations of the use of licensed charactersare needed to assess the characters’ appeal and influence on children’sfood preferences and consumption habits.
Food and beverage companies also use the highly profitable market ofchildren’s toys, books, and clothing to co-brand their products. In the toymarket, Mattel’s Barbie® doll has a variety of food-related dolls includingMcDonald’s Fun Time™ Barbie (Mattel, 2001) and The Coca-Cola®
Barbie® series (Mattel, 2005). Each of the dolls comes with the foodcompany’s logo and miniature examples of the company’s products (CSPI,2003; Samuels et al., 2003; Mattel, 2005). Hasbro offers several Play-Doh® play sets for children featuring familiar food brands such as LittleDebbie®, Chuck E. Cheese®, and Lunchables®. Easy-Bake Oven® play setsfrom Hasbro provide children with real-life examples of branded foods.Examples feature Chips Ahoy®, Oreos®, Pizza Hut®, and M&M’s® (Storyand French, 2004).
Marketing tie-ins with children’s movies and fast food are becomingmore common (Lippman and McKay, 2001). For the first three HarryPotter™ movies, The Coca-Cola Company spent $287 million on a co-branding campaign (Walley, 2002), which guaranteed tie-ins with themovie and the character of Harry Potter™ in any promotional materialthrough product packaging, games, the website, and in-store displays(Lippman and McKay, 2001). In partnership with DreamWorks entertain-ment company, Baskin-Robbins ran Sinbad-themed television spots en-dorsing its deep blue menace sundae and Sinbad’s triple punch sherbet(PRIMEDIA Business Magazines & Media, 2004), and Masterfoods’M&M’s® new color-changing candies, M&M’s® Magic Minis, had Sinbadthemes (PRIMEDIA Business Magazines & Media, 2004).
Two QSR chains, McDonald’s Corporation and Burger King, maintain

FOOD AND BEVERAGE MARKETING TO CHILDREN AND YOUTH 175
exclusive contracts with movie production companies. Burger King part-ners with DreamWorks and Nickelodeon for co-branding (Ordonez, 2001).In 1996, McDonald’s Corporation signed a 10-year contract with Disney(McDonald’s Corporation, 1996). It has also started a new multicategorylicensing initiative called McKIDS™ that unifies its branded product lineincluding toys, interactive videos, books, and DVDs to reflect active life-styles (McDonald’s Corporation, 2003). In 2005, the McKIDS™ line ofproducts will offer branded bikes, scooters, skateboards, outdoor playequipment, and interactive DVDs.
Finding: The use of child-oriented licensed cartoon and other fictional orreal-life spokescharacters has been a prevalent practice used to promotelow-nutrient and high-calorie food and beverage products. Use of suchcharacters to promote more healthful foods, particularly for preschoolers,is relatively recent.
Celebrity Endorsement
Manufacturers of CSDs have become highly competitive to capture theyouth market, and youth appeal is being built into advertising targeted tobroader audiences and specifically to adolescents. Celebrity endorsementsof CSDs, such as the popular cola wars advertisement between BritneySpears, who advertised Pepsi®, and Christina Aguilera, who endorsed Coca-Cola®, links a brand to a fan base (TTT West Coast, 2002), and aredesigned to appeal to older children, tweens, and teens in the course of theirexposure to advertising in adult and prime-time programming. Celebrityendorsement is also used for products from categories viewed as morehealthful. Since 1994, the Fluid Milk Processor Promotion Board has spon-sored the popular “Milk Mustache” celebrity advertising campaign thathas featured entertainers and athletes promoting the benefits of milk andmilk product consumption to promote bone health and to prevent os-teoporosis, especially targeted to teens (Graetzer, 2005).
Premiums and Premium Advertising
Premium offers, such as toys or giveaways, are commonly used inchildren’s food marketing. The Coca-Cola Company, which consideredyouth an important market for its drink by the early 1930s, was one of thefirst companies to use premiums to market to children and teens, whichincluded special offers and premiums such as yo-yos, marbles, jump ropes,kites, whistles, wagons, and scooters provided by local bottlers (Petretti,1992). Premiums are often used in RTE breakfast cereal marketing. Thepractice of providing product “news” on a cereal package was used as an
176 FOOD MARKETING TO CHILDREN AND YOUTH
added incentive to make the food product desirable with the premiumcentrally featured in an advertisement. The most successful RTE breakfastcereal premiums were “collectibles,” such as action figures from a movie;children were encouraged to buy the same brand to acquire an entire collec-tion. Premiums have included beauty kits (e.g., Brach’s Rapunzel fruitsnacks), trading cards (e.g., Nabisco Ritz crackers), dolls (e.g., Kellogg’sRice Krispies), and an E.T. Finger Flashlight (e.g., Kraft Food’s Oreo O’scereal) (CSPI, 2003). At many QSR chains, meals are created and marketedas child-specific portion-sized meals that contain premiums and premiumadvertising inside the container to attract children and their parents toQSRs (Schlosser, 2001). In some cases, children are encouraged to purchasea product several times to obtain a toy or the other premium (CSPI, 2003).A variety of marketing opportunities promote collectible brands that in-crease in value over time (Neopets®, 2003). McDonald’s Corporation cel-ebrated its 25th anniversary of the Happy Meal by providing Ty TeenieBeanie Babies® as a collectible premium (McDonald’s Corporation, 2004).
Media Use and Advertising Exposure
Information and data about the types and roles of the multiple mediaare changing rapidly, without common databases or categories. This meansthat there will inevitably be some uncertainty and some inconsistency inthe ways available data may be interpreted. The descriptions that followare intended to provide a general sense of the trends, in the face of theuncertainty.
Media Use Patterns
Television. Television advertising has been the largest media carrier offood and beverage marketing to children and adolescents. At the end of the1950s, 87 percent of American households had televisions, which were theprimary venues for advertising to children and parents (Alexander et al.,1998). Today, nearly all children ages 2–18 years live in households with atelevision—60 percent have three or more television sets (Roberts et al.,1999). Approximately 60 percent of all meals that the average family eatstogether are consumed while the television is on (Roberts et al., 2005).One-third (36 percent) of young children under age 6 years have a televi-sion in their own bedrooms (Rideout et al., 2003), as do two-thirds of those8 years and older (Roberts et al., 1999; Roberts et al., 2005). Children andyouth who have a television in their own bedrooms tend to watch moretelevision than children who do not, and their parents have fewer rulesabout their children watching television (Roberts et al., 2005).
Television becomes a part of children’s lives from infancy onward

FOOD AND BEVERAGE MARKETING TO CHILDREN AND YOUTH 177
(Rideout et al., 2003). Studies suggest that even 1- and 2-year-old childrenwatch television regularly (Barr and Hayne, 1999; Meltzoff, 1988), andbetween the ages of 2 and 4, children view approximately 2 hours of televi-sion a day (Rideout et al., 2003). By elementary school, television viewingincreases to more than 3 hours a day of “live” broadcasts, or more ifvideotaped watching is included (Comstock and Scharrer, 1999; Robertsand Foehr, 2005; Roberts et al., 2005). After age 14, “live” televisionviewing drops slightly to about 2.5 hours a day during late adolescence(ages 15–18) (Roberts and Foehr, 2005).
Although television viewing remains the vehicle through which chil-dren and youth spend a significant amount of their discretionary recre-ational time, they are also now using other types of electronic media, in-cluding video games, DVDs, computers, and wireless devices that provideaccess to the Internet (Rideout et al., 2003, 2005; Roberts et al., 1999,2005; Rubin, 2004). In fact, it appears that, when given a choice, childrenand adolescents choose the Internet over television by a two-to-one margin(Gardner, 2000).
Computer use. Computer use begins early in life and increases rapidly.An estimated 21 percent of children under age 2, 58 percent of 3- to 4-year-olds, and 77 percent of 5- to 6-year-old children use a computer (Calvertet al., 2005; U.S. Department of Education, 2003). By the time they are 3 to4 years old, many children can turn on a computer, point and click with acomputer mouse, load a CD-ROM, and use or “surf” the Internet (Calvertet al., 2005).
From 2000 to 2005, the percentage of 8- to 18-year-olds who havecomputers in their homes increased from 73 percent to 86 percent, andthree-quarters of them have Internet connections at home (Roberts et al.,2005). Between 1998 and 2001, the percentage of teens ages 14–18 yearsusing the Internet increased from 51 percent to 75 percent, and the percent-age of tweens ages 10–13 years using the Internet increased from 39 per-cent to 65 percent (U.S. Department of Commerce, 2002). One estimatesuggests that more than 34 million children and youth ages 3 to 17 years inthe United States use the Internet, representing 20 percent of the totalInternet user population (Rubin, 2004). However, there is a difference inaccess and use of computers and the Internet, based on demographics andsocioeconomic status. Among children ages 6 months to 6 years, Hispanics/Latinos are less likely to have used a computer than African Americans orwhites (Calvert et al., 2005). Use of both computers and the Internet ishigher among whites and Asians than African American and Hispanic/Latino children (U.S. Department of Education, 2003). Children and youthages 5 to 17 years who live with more highly educated parents or in house-holds with higher family incomes are more likely to use computers and the
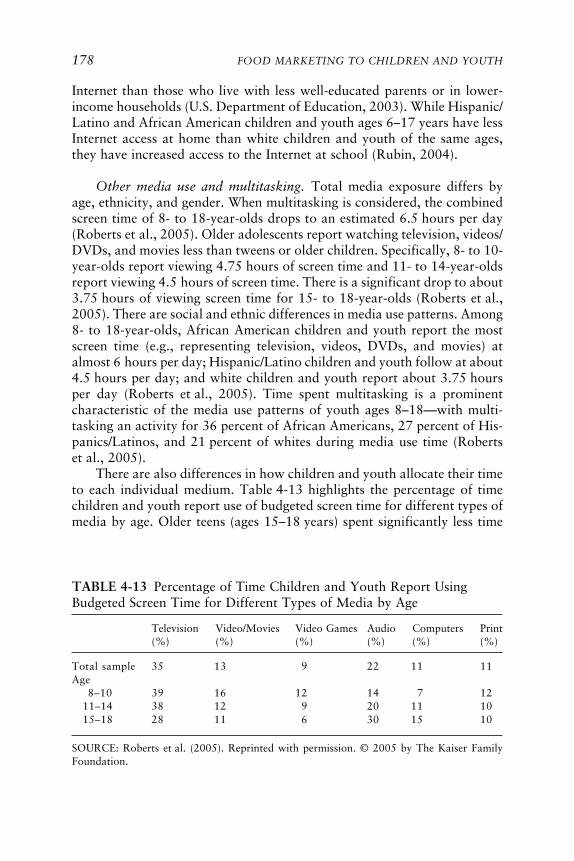
178 FOOD MARKETING TO CHILDREN AND YOUTH
Internet than those who live with less well-educated parents or in lower-income households (U.S. Department of Education, 2003). While Hispanic/Latino and African American children and youth ages 6–17 years have lessInternet access at home than white children and youth of the same ages,they have increased access to the Internet at school (Rubin, 2004).
Other media use and multitasking. Total media exposure differs byage, ethnicity, and gender. When multitasking is considered, the combinedscreen time of 8- to 18-year-olds drops to an estimated 6.5 hours per day(Roberts et al., 2005). Older adolescents report watching television, videos/DVDs, and movies less than tweens or older children. Specifically, 8- to 10-year-olds report viewing 4.75 hours of screen time and 11- to 14-year-oldsreport viewing 4.5 hours of screen time. There is a significant drop to about3.75 hours of viewing screen time for 15- to 18-year-olds (Roberts et al.,2005). There are social and ethnic differences in media use patterns. Among8- to 18-year-olds, African American children and youth report the mostscreen time (e.g., representing television, videos, DVDs, and movies) atalmost 6 hours per day; Hispanic/Latino children and youth follow at about4.5 hours per day; and white children and youth report about 3.75 hoursper day (Roberts et al., 2005). Time spent multitasking is a prominentcharacteristic of the media use patterns of youth ages 8–18—with multi-tasking an activity for 36 percent of African Americans, 27 percent of His-panics/Latinos, and 21 percent of whites during media use time (Robertset al., 2005).
There are also differences in how children and youth allocate their timeto each individual medium. Table 4-13 highlights the percentage of timechildren and youth report use of budgeted screen time for different types ofmedia by age. Older teens (ages 15–18 years) spent significantly less time
TABLE 4-13 Percentage of Time Children and Youth Report UsingBudgeted Screen Time for Different Types of Media by Age
Television Video/Movies Video Games Audio Computers Print(%) (%) (%) (%) (%) (%)
Total sample 35 13 9 22 11 11Age
8–10 39 16 12 14 7 1211–14 38 12 9 20 11 1015–18 28 11 6 30 15 10
SOURCE: Roberts et al. (2005). Reprinted with permission. © 2005 by The Kaiser FamilyFoundation.

FOOD AND BEVERAGE MARKETING TO CHILDREN AND YOUTH 179
watching television or videos and significantly more time using computersor listening to audio media (e.g., radio, CD players, MP3 players, multi-media) than children and young teens. While older teens also spent moretime on computers, they spent less time using video games than childrenages 8–10 years (Roberts et al., 2005). Use of newer types of media, par-ticularly computers, the Internet, and video games, appears to occur with-out a reduction in the time devoted to more traditional forms of media suchas television, print, and music (Roberts et al., 2005). Video games are aprimary activity of the 22.4 million 2- to 18-year-old children, tweens, andteens who use the Internet (Byrnes, 2000). The video game industry is nowestimated to be between a $7–10 billion market (Entertainment SoftwareAssociation, 2005; McCarthy, 2005). Console and personal computer-basedvideo games surpassed movie-ticket box office sales worldwide in 2002(Mack, 2004).
Youth are particularly adept at using wireless devices and incorporat-ing them into their lifestyles. They provide social connectivity and enter-tainment, as a way to build relationships, convenience and multitaskingcapabilities, and fill in gaps of free time or boredom (Cheskin, 2001).Children ages 10 and older are projected to be one of the fastest growingmarkets for wireless voice and data services (Williamson, 2001). A 2001survey of youth ages 12 and older reported that 63 percent owned at leastone mobile device—58 percent owned a mobile phone, 13 percent owned abeeper or one-way pager, and 6 percent owned a hand-held personal digitalassistant (PDA) (Upoc, 2002). African American and Hispanic/Latino youthmarkets have very high mobile device penetration rates—59 percent of 12-to 24-year-olds from these ethnic groups own a mobile phone and 11 per-cent own a two-way pager (Upoc, 2002). The fastest growing group ofusers of mobile data is children ages 10–14 years (Thomas, 2004). Cellphones may be increasingly attractive to marketers because they offer directcommunication with young consumers, either through voice or touch-keyinteractive programs, and they bypass parental monitoring.
Television Advertising Exposure: Amount and Content
Estimates of the amount and trends in television advertising exposure,like all media use, vary substantially and use different data sources andanalytic techniques. Some estimates show higher levels of exposure andtrends that are flat or moderately increasing. Other assessments generallyshow lower levels of exposure, and trends that are decreasing. All analysesshow substantial exposure to television advertising by children and youth.
Most of the available research about children’s media use and advertis-ing exposure is derived from studies of television viewing (Chapter 5). Al-though new media options are evolving at an unprecedented rate, the larg-

180 FOOD MARKETING TO CHILDREN AND YOUTH
est recent studies of children’s media use concur that television remains theprimary venue for reaching children and adolescents with marketing mes-sages, especially younger children (Rideout et al., 2005; Roberts et al.,2005). Television receives the majority of advertising budgets as a mea-sured media category because it reaches a larger proportion of a targetedaudience compared to the newer interactive media (Stanley, 2004).
Since the Federal Trade Commission (FTC) first considered televisionadvertising to children in 1978, researchers have tried to estimate accu-rately the extent of commercial content to which children are typicallyexposed. The methodology by which most estimates have been derivedconsists of integrating evidence about children’s normative viewing pat-terns with evidence about the amount of commercial time contained inchildren’s programming or overall television programming (including adultprime-time television viewing). There are varying estimates of the totalnumber of commercials that are viewed by children. The data presented inthis section provide a background to these estimates and support the viewthat children are heavily exposed to commercials. What is not reflected inthe available data are children’s long-term exposure to other forms ofmarketing techniques in television programming such as product placementin children’s programs, product placement in adult television shows thatchildren may co-view with their parents, and product placement in videosand DVDs viewed by children and adolescents.
Television advertising to children began in the 1950s when persuasivemessages were placed on youth-oriented programs such as Howdy Doody,The Mickey Mouse Club, and Roy Rogers (Alexander et al., 1998). Satur-day morning emerged as a time for children’s programming on all threemajor networks—ABC, CBS, and NBC. The significance of Saturday morn-ing programming was that it was the first time that mass media program-ming was specifically dedicated to the child audience. The emergence of ablock of programs dedicated to children allowed marketers to target chil-dren with advertisements designed for and directed specifically at them. Asearly as the 1950s, the hosts of television programs were marketing prod-ucts within these programs (Alexander et al., 1998). Television became avenue for 30-second commercials that had memorable jingles and livelyspokescharacters that advertised food products such as RTE sweetenedbreakfast cereals (Kotz and Story, 1994). Other food products that wereoften marketed during youth television programming included candy,snacks, cookies, and sweetened CSDs. Few television commercials pro-moted food options such as fruits and vegetables or reduced-calorie andnoncaloric beverages (Barcus, 1981; Kunkel and Gantz, 1992).
Children and adolescents have television viewing choices today that didnot exist more than 35 years ago including syndicated and cable television.Nickelodeon (2005) is an example of the numerous children’s program-

FOOD AND BEVERAGE MARKETING TO CHILDREN AND YOUTH 181
ming networks that exist today. Other networks such as ABC Family,Discovery Kids, Cartoon Network, Fox Kids, and the Disney Channel tar-get this age group by providing children and teens with a variety of pro-gramming options. Radio is another medium through which marketersreach to children and youth. Disney has made this medium a viable channelfor advertising both to children and parents, who often listen to the radiotogether in the car. Radio Disney also offers promotions and contests thatinvolve audiences in more active interactions with products advertised (Ra-dio Disney, 2005).
The Federal Communications Commission’s (FCC) regulation of com-mercial time through the Children’s Television Act of 1990 limited com-mercial time on children’s programs to 10.5 minutes per hour on weekendsand 12 minutes per hour on weekdays. However, food is the most fre-quently marketed product in television advertisements during children’stelevision programming, and accounts for 50 percent of the total advertise-ments viewed (Coon and Tucker, 2002; Gamble and Cotugna, 1999; Kotzand Story, 1994). Some estimates suggest that children view a food adver-tisement every 5 minutes of television viewing time (Kotz and Story, 1994).
Estimates of annual exposure to television advertising from nearly threedecades ago indicated that an average viewer (child or adult) would beexposed to more than 20,000 television commercials per year (Adler et al.,1977). Subsequent data gathered between 1983 and 1987 indicated that theaverage child, watching roughly 4 hours of television per day, would seemore than 30,000 commercials per year for all products, including foodand beverages (Condry et al., 1988). Based on advertising content datagathered in 1990, and extrapolation using children’s viewing patterns, somehave estimated that children currently view as many as 40,000 commercialson television and cable per year (Kunkel and Gantz, 1992; Kunkel, 2001).The increasing estimates stem primarily from the growing trend of airing15-second commercials, rather than longer 30- or 60-second commercials,as was common in the past (TV Bureau of Advertising, 2005). Taras andGage (1995), for example, observed an increase of 11 percent in the num-ber of commercials aired per hour of children’s programming between1987 and 1993, despite the fact that the total amount of advertising timeremained relatively stable.
Given an apparent, albeit small, drop in children’s time spent watchingtelevision in recent years (Zywicki et al., 2004), this estimate merits addi-tional examination. Two preliminary unpublished analyses of primary datahave been made public and suggest a possible reversal of the childhoodadvertising exposure trend. The first analysis is based on 4 weeks of NielsenMonitor-Plus/Nielsen Media Research data for 1977 and 2004 examiningchildren’s programs and adult prime-time programs, advertisements, andaudiences (e.g., children ages 2–11 and 12–17 years) (Ippolito, 2005). The
182 FOOD MARKETING TO CHILDREN AND YOUTH
first analysis reports that children ages 2–11 years viewed a total of 22,000advertisements for all products in 1977 versus 23,530 in 2004 (Ippolito,2005). These figures include paid advertisements, which decreased from20,000 in 1977 to 17,507 in 2004, and promotional advertisements andpublic service announcements (PSAs), which increased from 2,000 in 1977to 6,023 in 2004 (Ippolito, 2005).10 The second analysis is also based onNielsen Media Research data and measured total food, beverage, and res-taurant commercials viewed per child from 1993 to 2004 (Collier ShannonScott and Georgetown Economic Services, 2005b). This unpublished analy-sis reports that the number of food and beverage advertisements seen bychildren in programs where children are at least half the audience declinedapproximately 13 percent over this period.
Advertising on television overall has been about 11.5 minutes per hoursince the mid-1980s (Cobb-Walgren, 1990). An industrywide survey con-ducted by MindShare, a widely recognized advertising firm, confirms thatthe level remained virtually unchanged in 2001, with an average of 11minutes and 24 seconds per hour devoted to commercial messages (Downey,2002). Thus, the data reviewed strongly support that U.S. children andyouth are currently exposed to a large amount of commercial advertisingon television.
For several reasons, it is difficult to identify with precision the totalamount of time children are exposed to television advertising. There areboth age-related and individual differences in the relative mix of program-ming types and times that children may view, as well as variability in theamount of commercial content presented across channel types, programgenres, and times of day. There is also a lack of clarity about the preciseamount of time currently devoted to advertising on children’s program-ming. One study in the 1970s measured the time as approximately 12 min-utes per hour (Barcus, 1981), but a study in the late 1980s measured only8.3 minutes per hour (Condry and Scheibe, 1989). Although the FCC regu-lations of commercial programming through the Children’s Television Actof 1990 provide maximum limits, there is some indication that the FCC’spolicies are not always followed. For example, in 2004, the FCC finedNickelodeon $1 million for violating the per-hour time limit 591 times for
10The major broadcast networks (e.g., ABC, CBS, Fox, and NBC) donate an average of 17seconds an hour to PSAs out of an average of 17 minutes and 38 seconds an hour ofnonprogramming content. This represents a total of 48 minutes per week per network. In2001, the Advertising Council estimated that it received nearly $400 million in donated onlineadvertising space (Rideout and Hoff, 2002). Industry estimates of PSA expenditures are higher.In 2003, U.S. advertisers report spending more than $1.7 billion on PSAs—$1.6 billion fortelevision and $100 million for cable networks (Brown et al., 2004).

FOOD AND BEVERAGE MARKETING TO CHILDREN AND YOUTH 183
advertising in children’s programming (Broadcasting and Cable, 2004), andenforcement actions against other channels for excessive advertising timehave occurred in the past.
Marketing of food products has been a common practice on children’sprogramming since the early days of television. In a study examining24 children’s programs from the 1950s, 45 percent of all commercialsobserved were for sweetened breakfast cereals, confectionery, or snacks(Alexander et al., 1998). Starting in the 1970s, content analysis researchersbegan to produce a relatively clear picture of the overall profile of productstypically presented in children’s television advertising. Patterns in the distri-bution of product types promoted in commercials during children’s showsdemonstrate strong stability since regular measurement began approxi-mately 30 years ago (Kunkel and McIlrath, 2003). In general, about half ofall commercials during children’s television programming have consisted offood and beverage products, primarily comprised of RTE sweetened break-fast cereals, candy, CSDs and sweetened drinks, and QSRs (Gamble andCotugna, 1999). This pattern can be seen in Table 4-14, which comparesfindings from three of the largest studies of children’s advertising, one eachconducted in the 1970s, 1980s, and 1990s.
Although there has been a decline in the percentage of commercials forthe food product categories from the 1970s to the 1990s (Ippolito, 2005),food product commercials predominate in the advertising directed to chil-dren. From a chronological perspective, Cotugna (1988) reports that 71 per-cent of all such commercials are food advertisements; Kotz and Story (1994)report 56.5 percent; Taras and Gage (1995) report 48 percent; Gamble andCotugna (1999) report 63 percent; and Byrd-Bredbenner (2002) reports78 percent. The samples for these smaller studies are typically in the range
TABLE 4-14 Common Types of Food Advertising as a Proportion of AllCommercials in Children’s Television Programming
Barcus Condry et al. Kunkel andProduct Type (1977) (1988)a Gantz (1992)b
Cereals 25% 25% 22%Candies/snacks/beverages 29% 17% 18%Fast food/restaurants 10% 10% 6%Total of primary food categories 64% 52% 46%
aPercentages were derived by combining data reported for advertising sampled in 1983,1985, and 1987.
bKunkel and Gantz (1992) report data for broadcast networks that yielded a total of72 percent for these three categories, but their overall totals included advertising on indepen-dent broadcast and cable channels, which were not surveyed by the previous studies.

184 FOOD MARKETING TO CHILDREN AND YOUTH
of 10–20 hours each, which may account in part for the range of outcomes;nonetheless the pattern is clear that food commercials predominate in tele-vision advertising directed to children.
On the other hand, there continues to be some uncertainty about thetrends for the actual numbers of television commercials seen by children.An analysis of Nielsen Media Research data conducted for the Associationof National Advertisers (ANA) and GMA reports that the number of food,beverage, and restaurant commercial impressions viewed annually by chil-dren ages 2–11 years has declined from 5,909 in 1994 (or roughly 16commercials a day) to 5,152 in 2004 (or roughly 14 commercials a day)(Collier Shannon Scott and Georgetown Economic Services, 2005b). This isthe first study to indicate any reduction in the number of television com-mercials seen by children. Preliminary findings of an unpublished studysimilar to the ANA/GMA study were presented publicly at a joint work-shop sponsored by the DHHS and the FTC. That comparison covers alonger period, from 1977 to 2004, and reports a larger decline with 34 per-cent fewer food and beverage advertisements in programs watched mainlyby children (Ippolito, 2005). Others have found either stability or increasesin the number of food and beverage commercials appearing in children’sprogramming during this same period (Byrd-Bredbenner, 2002; Gambleand Cotugna, 1999; Story and French, 2004; Taras and Gage, 1995).
With respect to commercial content, the content analysis research indi-cates that the nutritional characteristics of the food advertised in children’sprogramming are generally for high-calorie (e.g., high sugar or high fat)and low-nutrient foods and beverages. Applying nutritional categories, Kotzand Story (1994) found that 44 percent of all food advertising in a sampleof children’s television programming were in the “fats, oils, and sweets”food group, the category of foods recommended to be the smallest propor-tion of one’s overall food consumption in the USDA food guidance system.Taras and Gage (1995) indicate that 85 percent of advertised RTE break-fast cereals were high in sugar, as were 100 percent of advertised candy andsweets. In a more recent analysis of food advertisements viewed by chil-dren, Harrison and Marske (2005) found that 83 percent were for conve-nience or fast foods and sweets. Another analysis showed that sugar andcorn syrup are the most common ingredients in food products marketed tochildren (Gamble and Cotugna, 1999). Virtually all studies find limitedcommercial advertising of healthful food and beverage products to childrenand youth such as for fruits or vegetables.
Young viewers are also often exposed to general audience orientedshows and the advertising that accompanies them. For example, far greaternumbers of children watch such programs as The Simpsons on Sundayevenings than view any Saturday morning children’s show, despite the fact

FOOD AND BEVERAGE MARKETING TO CHILDREN AND YOUTH 185
that the latter group has a much higher concentration of children in theaudience although smaller numbers overall.
Similar findings for general audience programming that may be seen bychildren are reported by Kuribayashi et al. (2001), who compared commer-cials on Saturday morning children’s shows to Saturday evening adult pro-grams. These researchers categorized foods as “unhealthy” if they con-tained significant amounts of fat (30 percent or more), sodium (360 mg),cholesterol (35 mg), or sugar (33 percent of calories). Applying this defini-tion, the researchers found that 78 percent of food advertising duringevening programming was for less healthful food products, compared to97 percent for the children’s programs.
There are limited data for determining the types of food and beverageadvertisements seen by children and youth of different racial and ethnicgroups. Two content analysis studies found that food advertisements airedon prime-time television programs directed to African American house-holds feature more high-calorie and low-nutrient food and beverage prod-ucts than prime-time programs intended for white audiences (Hendersonand Kelly, 2005; Tirodkar and Jain, 2003). There has been limited fund-ing to support research to study the relationship between English-languageand Spanish-language television viewing and Hispanic/Latino children andyouth in the United States (Subervi-Velez and Colsant, 1993), despite avariety of Hispanic-oriented media (Endicott et al., 2005). There were nocontent analyses of food and beverage advertisements directed at Hispanic/Latino children and youth available to the committee. This is an impor-tant area for future research.
Finding: Children are exposed to extensive advertising for high-calorie andlow-nutrient foods and beverages and very limited advertising of healthfulfoods and beverages during their daily television viewing.
Print Media
Children and teens read a variety of magazines, ranging from fashion,sports, and entertainment to automotive and electronic games (MPA,2004a). Some of the more popular children’s magazines are NickelodeonMagazine, Sports Illustrated for Kids, and Disney Adventures (CSPI,2003), and some popular teen magazines include Teen People, Seventeen,CosmoGirl, Dirt Rider, and Boys’ Life (MPA, 2004a). Advertisers use themagazines as vehicles to market to teens according to life stage, interests,and gender (MPA, 2004a). Certain teen magazines focus on celebritiesand the entertainment industry, and teen publications carry advertise-ments as well as product placement (KFF, 2004). A recent survey con-

186 FOOD MARKETING TO CHILDREN AND YOUTH
ducted by Neopets® (2003) showed that more than 30 percent of teens’purchases were directly influenced by magazine advertisements for music,games, makeup, and clothes. According to that survey, magazines haveeven more influence on entertainment choices, persuading 37 percent ofteens to see a movie in the theater and 36 percent to purchase a video orDVD (Neopets®, 2003). Recently, teen magazines have started to use theInternet to recruit individuals to inform the magazine staff about emergingtrends in youth culture (KFF, 2004). For example, Teen People accesses anetwork of 9,000 “trendspotters” across the United States who keep theeditorial staff up to date on teen issues and concerns (KFF, 2004).
Other Marketing Strategies
Newer marketing approaches directed at children are beginning to ap-pear in Internet applications and video games, including advergames. In anera of television advertisement-skipping technologies such as TiVo andaudience fragmentation, the placement of products in venues (e.g., televi-sion, films, music, the Internet) that are not readily recognizable by con-sumers as marketing venues has become a growing practice, with productsintegrated seamlessly into programming content (Balasubramanian, 1994;Gardner, 2000; Mazur, 1996; PQMedia, 2005). There are also event andloyalty marketing such as kids’ clubs, school-based marketing, and promo-tions and public relations. Interactive technologies, particularly the Internet,and the more recent wireless technologies such as cell phones, are emergingin new interactive marketing plans (Calvert, 2003).
Systematic and reliable estimates are not readily available for howmuch marketers are spending in the newer media channels, but the amountsare substantially less than for traditional television advertising. For ex-ample, Wild Planet Toys spent only $50,000 for a 4-month online promo-tion rather than a $2 million traditional television advertising campaign(Gardner, 2000). Similarly, Nabisco spent less than one percent of its ad-vertising and marketing budget at its online site, and produced games thatcould later be exported (Gardner, 2000). Advertising in and around onlinegames is still relatively rare but is expected to grow rapidly, expanding froma $77 million dollar budget in 2002 to an estimated $230 million dollars in2007 (Mack, 2004).
Outdoor media include the use of billboards, buses, and projectedimages. This type of outdoor promotion goes well beyond the traditionalroadside billboard. Companies and brands are finding new mechanisms formarketing such as hot air balloons, sides of buses, and “wrapping” build-ings and cars with promotional material and signage to generate attentionand interest among young people. In 1998, a study conducted by the J.Walter Thompson Media Research Group concluded that outdoor venues

FOOD AND BEVERAGE MARKETING TO CHILDREN AND YOUTH 187
can have a significant impact on children, especially when familiar brandsor familiar characters are used. In the study, a campaign by the Fox KidsNetwork found that awareness of the network among children rose by27 percent as a result of using billboards (Freitas, 1998).
Event and Loyalty Marketing
Event sponsorships can occur in a variety of settings including schools,shopping malls, and county fairs. The practice enables children to have afun experience with brands and often to sample new brands (CSPI, 2003).Kids’ clubs organized by specific companies represent a vehicle for thesecompanies to target the child and teen markets. Kids’ clubs distribute cou-pons and catalogs after learning vital demographic and consumer profileinformation through “member” registration (Consumers Union, 1990).Baskin-Robbins offers a birthday club program for children, offering a freecoupon for a kid-size scoop of ice cream on the child’s birthday (Baskin-Robbins, 2005). Kids’ clubs and birthday clubs target children through e-mail and direct mail to the home mailbox. Coupons and catalogs are formsof advertising and promotional efforts to encourage children to purchaseitems (CSPI, 2003; Consumers Union, 1990).
School-Based Marketing
Commercial activities in schools appear to be increasing, although pub-lished documentation is limited. In one survey of high school principals,half—51.1 percent—believed that corporate involvement in their schoolhad increased within the previous 5 years (Di Bona et al., 2003), the largestinvolvement being in the form of incentive programs (41.4 percent). Suchchanges have been noted by the press. An analysis of media references toschool commercialism has found significant increases over the past 6 years(Molnar, 2003). These trends have raised particular concerns due to theextent of the activities and the vulnerabilities of children (Palmer et al.,2004). Reasons for the increase of in-school marketing to children andadolescents include the desire to increase sales and generate product loy-alty, the ability to reach large numbers of children and adolescents in acontained setting, and the financial vulnerability of schools due to chronicfunding shortages (Story and French, 2004).
In-school commercial activities related to food and beverages includeproduct sales, direct advertising, indirect advertising, and marketing re-search on students (GAO, 2000; Palmer et al., 2004; Story and French,2004). Direct advertising seeks to gain students’ discretionary moneythrough a diversity of in-school venues, while indirect advertising andmarketing conveys a favorable industry image to students which may in-

188 FOOD MARKETING TO CHILDREN AND YOUTH
fluence their brand preferences, brand loyalty, and purchasing behaviors(GAO, 2000). Examples of marketing practices used in schools are shownin Table 4-15.
Multimillion-dollar contracts between manufacturers and school sys-tems have become common. One of the most controversial contract prac-tices is the “pouring contract” or “pouring rights” with school districts forthe exclusive use of particular brands of beverages (Nestle, 2000). Many ofthese contracts are negotiated on a districtwide basis and offer a specifiedamount for signing a multiyear contract, with additional funds tied tosuccess in meeting specified sales quotas (Nestle, 2000). In 1998, more than100 schools or school districts had signed exclusive contracts to sell eitherCoke® or Pepsi®, and by 2000, there were an estimated 180 “pouringrights” contracts in 33 states (Nestle, 2000). In 2001, The Coca-Cola En-terprises had signed 20 exclusive multiyear contracts (McKay, 2001). Re-cent media attention about food and beverage marketing practices to chil-dren has led companies to change their school programs. The Coca-ColaCompany and its bottlers have publicly stated that they have collaboratedwith leaders from major educational institutions to develop model guide-lines for school beverage sales and partnerships (Short, 2005; The Coca-Cola Company, 2003). In 2005, the American Beverage Association (ABA)developed new school vending policy guidelines restricting the sale of bev-erages in elementary, middle, and high schools (ABA, 2005b), discussedlater in the chapter.
Contract arrangements are also made with QSR chains to sell food onthe school premises, a form of competitive foods to the National SchoolLunch Program (Chapters 3 and 6). Additional ways to raise funds forschools include cash and credit rebate programs in which stores or otherbusinesses agree to donate a percentage of revenues generated by sales inthe form of either cash or supplies and equipment. More traditional schoolfundraising activities include the sales of items such as candy by students ortheir parents (GAO, 2000).
Direct advertising seeks to gain the students’ purchasing dollars througha diverse range of in-school marketing venues (e.g., billboards, posters,book covers, school buses, and kiosks). It also includes media-based adver-tising which goes directly into school classrooms, hallways, lunchrooms,and computer labs. Channel One has been the leading example of directadvertising in the classroom during school hours, providing schools freetelevision equipment and satellite access in return for reaching approxi-mately 8 million secondary students in 370,000 classrooms (Atkinson,2005; GAO, 2000). Channel One was introduced in 1990 as a 10-minuteoriginally produced news program that had content written specifically forteenage students and presented by young adult anchors and correspon-dents, accompanied by 2 minutes of commercials (Greenberg and Brand,

FOOD AND BEVERAGE MARKETING TO CHILDREN AND YOUTH 189
TABLE 4-15 Marketing Practices in U.S. Schools
Activities Examples
Product SalesFood/beverage sales • Exclusive contracts or other arrangements between
benefiting a district, school districts, or schools and bottlers to sell softschool, or student activity drinks in schools or on school grounds
Branded fast food • Contracts or other arrangements between districtsor schools and fast food companies to sell food inschools or on school grounds
Cash or credit rebate • Programs that award cash or equipment to schoolsprograms in proportion to the value of store receipts or
coupons collected by the schools (e.g., cereal boxtops, food product labels)
Fundraising activities • Short-term sales of candy, pizza, cookie dough, andother products by parents, students, or both tobenefit a specific student population or club
Direct AdvertisingAdvertising in schools, in • Billboards and signs in school corridors, sports
school facilities, and on facilities, or busesschool buses • Product displays
• Corporate logos or brand names on schoolequipment, such as marquees, message boards,scoreboards, and backboards
• Advertisements, corporate logos, or brand names onposters, book covers, and student assignment books
Advertisements in school • Advertisements in sports programs, yearbooks,publications school newspapers, and school calendars
Media-based advertising • Televised advertisements aired by Channel One orcommercial stations
• Screen-saver advertisements, corporate logos, orbrand names on computers
Samples • Free snack foods or beveragesIndirect Advertising
Industry-sponsored • Teaching materials and nutrition education kitseducational materials from food companies that incorporate the sponsor’s
products or promote the sponsor’s brand• Nutrition information produced by trade
associations (e.g., dairy, meat, egg, sugarassociation)
Industry-sponsored • Pizza Hut’s Book-It program, McDonald’s McSpellItcontests and incentives Club
Industry grants or gifts • Industry gifts to schools that generate commercialbenefits to the donor
Marketing ResearchSurveys or polls • Student questionnaires or taste testsInternet panels • Use of the Internet to poll students’ responses to
computer-delivered questionsInternet tracking • Tracking students’ Internet behavior and responses
to questions at one or more websites
SOURCES: GAO (2000); Story and French (2004).

190 FOOD MARKETING TO CHILDREN AND YOUTH
1993). A content analysis of commercials that aired on Channel One in theearly 1990s revealed that in the commercials examined, 86 percent were forproducts (including candy, gum, and chips) and 14 percent were for PSAs(Wulfemeyer and Mueller, 1992). Its advertising revenue decreased from$50.2 million in 2002 to $39.1 million in 2004, in part due to decisions bycompanies such as Kraft Foods and the Kellogg Company to eliminate in-school marketing (Atkinson, 2005).
Indirect advertising in schools encompasses a range of activities. One ofthe most controversial forms of indirect advertising is industry-sponsorededucational materials (SEMS), which are materials donated by corpora-tions to supplement the curriculum. In its evaluation of 77 SEMS, Con-sumers Union found nearly 80 percent to be either biased or topicallyincomplete (Consumers Union, 1995). Other common forms of indirectadvertising include the following: industry-sponsored contests or incentives(e.g., providing coupons for free pizza for reading a specified number ofbooks); inclusion of brand-name products as examples in textbooks; provi-sion of industry-sponsored teacher training; donation of hardware for com-puter labs; or branded scoreboards for gymnasiums or athletic fields.
The National Association of Secondary School Principals (NASSP) hasdeveloped guidelines for school beverage partnerships that apply to middleschools and high schools that address vending machine policies, use oflogos and signage on school grounds, visibility of company logos, andproduct promotions and fundraising in schools (NASSP, 2005). Addition-ally, many state and local school districts have enacted legislation regardingthe availability and nutritional quality of beverages sold in public schools(Chapter 6).
Finding: The competitive multifaceted marketing of high-calorie and low-nutrient food and beverage products in school settings is widely prevalentand appears to have increased steadily over the past decade.
New Venues and Vehicles
New and innovative marketing approaches that are used in the adultmarketplace are now being adapted for children and youth (Kaikati andKaikati, 2004), including marketing research. Emerging marketing prac-tices often blur the line between product and content through practices suchas product placement in movies, television programs, websites, or games;viral marketing; information collection from youth as they spend time onInternet websites; interactions with online dialogues; and video news re-leases (Gardner, 2000; Mazur, 1996). At home and in public, children andyouth are surrounded by a mobile, fast-paced, high-tech world, which theyfind comfortable, easy to navigate, and populated with branded characters.

FOOD AND BEVERAGE MARKETING TO CHILDREN AND YOUTH 191
Many websites collect aggregate data from the children who visit them;however the Children’s Online Privacy Protection Act (COPPA) requiresparental permission before children ages 12 and younger can provide per-sonal data that may be used in future advertisements directed to them(Montgomery, 2001; Chapter 5).
The Internet and Websites
The Internet is a form of measured media that provides many opportu-nities for marketers to reach children and adolescents about food choices.Online interactive technology provides the means for companies to attractand develop one-to-one relationships with youth through websites forgames, contests, discounts, and prizes. Many websites require registrationto visit; therefore, all personal information such as a child’s or teen’s e-mailaddress, home address, age, and phone number are stored. Children can besent promotional items, such as newsletters and coupons, to their e-mailaddress for redemption. “Cookies” can also be placed on individual com-puters to trace the online activities of a child or adolescent. The trackingmakes it relatively easy for marketers to connect advertising messages toyouth at popular websites. Online advertising to older children and teens isbecoming more common on sites where they purchase MP3 music files todownload onto their digital music players. Websites with e-mail, chatrooms, and instant messaging capabilities are also very popular amongadolescents and with marketers for targeting purposes. Nearly three-fourthsof online teens use instant messaging (Lenhart et al., 2001).
With the advent of personal video recorders and TiVo that can limitexposure to, and the cost-effectiveness of, traditional commercials, creativealternatives are spawned. For example, many branded products marketedto youth maintain websites that are created to supplement traditional formsof mass media advertising, and they are much less expensive to create andsustain. These “branded environments” are popular with older children,tweens, and teens, and use a range of online activities to keep them on thewebsite (Montgomery, 2001). Many popular youth television programsencourage children and youth to visit the website advertised during the end-of-show credits to provide an additional experience with the audience wherethey find tailored messages. These websites use attractive language, humorthat appeals to teens, and interactive games that are likely to increase theirappeal to underage youth (Williams et al., 1997). The video news release, inwhich companies circulate stories about its products, is another form ofvirtual advertising that is used on television by many news organizations(Mazur, 1996). This kind of technique is less expensive than traditionaladvertisements and not labeled as an advertisement for the public, whichviews it as a news program.

192 FOOD MARKETING TO CHILDREN AND YOUTH
Product Placement Across Multiple Forms of Media
Product placement is a marketing strategy aimed at placing productsin a visible setting outside a typical marketing context (PQMedia, 2005).Movie placement is a good example. Food product placement made itsmost prominent debut when Steven Spielberg’s ET character ate Reese’sPieces® candy in the movie ET, and short-term national sales of the candyincreased by 66 percent (Mazur, 1996).The role of product placement intelevision has become more popular over the past 5 years as an integralcomponent of a larger marketing strategy (PQMedia, 2005). Productplacements are increasingly being used across various media vehicles si-multaneously including network and cable television programs; films; ra-dio lyrics; pop, hip-hop, and rap music; videos and DVDs; comic strips;books; plays; video games; and advergames (Gupta and Gould, 1997;Holt, 2004; Mortimer, 2002). Marketers recognize the importance ofproduct placement with children and youth who have grown up usingtechnology and turn to other media outlets than television for entertain-ment and information.
Product placement is part of a broader segment of marketing servicescalled branded entertainment (PQMedia, 2005). Although a product isvisible in television shows or films, it is often not the focus, and fitsseamlessly into the context of a story or program. Product integration is aspecial type of product placement where an advertised product is central tothe program’s content (PQMedia, 2005). Product placement is designed bymedia production agents to provide realism to movie and television sceneswhile attempting to influence viewers through increased brand awarenessand product endorsement (Karrh, 1994).
Product placement in prime-time television programs and movies. Al-though product placement is prohibited by law in programs directed atchildren (Linn, 2004), it is common in prime-time television programming.There has been limited research investigating the frequency of placement ofbranded food and beverage products in television programming. One ex-amination of their frequency on prime-time television programming foundthat nearly 3,000 brand appearances occurred in 154 prime-time programsover a week of programming aired in 1997 on the four major networks—ABC, NBC, CBS, and Fox (Avery and Ferraro, 2000). Some evidence showsthat the amount of money spent on product placement for food and bever-age products may be substantial. For example, The Coca-Cola Companypaid $20 million for product placement on American Idol, a televisionprogram that is heavily viewed by tweens and teens (Linn, 2004).
Product placements are abundant in children’s and teens’ movies. In the2002 film, Spiderman®, the action hero used his web-spinning capabilities

FOOD AND BEVERAGE MARKETING TO CHILDREN AND YOUTH 193
to retrieve a can of Dr. Pepper® to quench his thirst. Heinz Ketchup® wasfeatured in the movie, Scooby Doo. Another popular movie among chil-dren, Spy Kids 2, had a character opening a lunch box which included itemssuch as a Big Mac®, french fries, and a CSD with the golden arches of theMcDonald’s Corporation prominently displayed. There has also been lim-ited research on the effect of product placement in television or films onconsumer behavior. In one study, children were shown amended versions ofa brief film clip from a popular movie, half with a prominent branded CSDand half without the branded CSD. Those who had viewed the branded clipselected the branded beverage more frequently after the viewing (Auty andLewis, 2004).
Product placement in music. The inclusion of branded beverage prod-ucts into popular songs is emerging as a new type of product placement.Certain media and entertainment companies actively seek brand-spot place-ments on their CDs and DVDs while a growing number of industry spon-sors seek product placements in hip-hop lyrics and music videos (Holt,2004; Kaikati and Kaikati, 2004).
Product placement in video games and advergames. Product place-ment is also a growing phenomenon on the Internet. Companies typicallyretain a product placement agency for an annual fee, then pay additionalfees for actual placements, with the cost dependent on whether the prod-uct just appears or if the product is actually used and labeled (Mazur,1996). Video game manufacturers previously paid companies for use oftheir logos and brands in video games. Now the practice is reversing asvideo game revenues rival those for movies. It is estimated that industrysponsors will spend $750 million to embed products in electronic gamesincluding advergames and video games. Online advergaming revenue (in-cluding both traditional advertising and advertising within games) is esti-mated to increase from $134 million in 2002 to $774 million by 2006(Fattah and Paul, 2002).
Although it is difficult to assess the impact that advergames (see below)may have on consumers’ brand loyalty, a distinct advantage of embeddingproducts within video games is brand repetition. The average online gamerspends 5 to 7 minutes on an advergaming site, which is an estimated 14times the amount of time spent watching a television commercial (Fattahand Paul, 2002). Additionally, the nature of the interaction with productbrands online compared with a television commercial is very different. Anonline user is an active receiver of marketing messages, whereas a televisionviewer may look away or leave a room during a television commercial(Fattah and Paul, 2002; CSPI, 2003). Companies survey consumers to de-termine positive brand impressions and branded product recall. Product

194 FOOD MARKETING TO CHILDREN AND YOUTH
recall demonstrates the effectiveness of this embedding. When players wereinterviewed, they generally did not find the product embedding intrusive oroffensive (Fattah and Paul, 2002; Kaikati and Kaikati, 2004).
Food marketers are increasingly building brand awareness and loyaltythrough product placement through video games on CD-ROMs, consoles,or the Internet (Freeman, 1998). A successful game, regardless of the plat-form, is equivalent to a successful product because the consumer is en-gaged, interested, and focused on the product (Mack, 2004). Games offerthe capacity to foster and enhance chat room “buzz” and “word of mouth,”thereby compounding its promise as a marketing technique. Brands areplaced in realistic situations within the video game to simulate their real-world use, to enhance branding, and to increase interest in specific products(Mack, 2004).
Traditional console or hand-held games are a more expensive venue forproduct placement than are online venues. In a console game, planningmust be done in advance, and once it appears on the market, the productplacement cannot be changed. Although slower than console games, simpleflash animation games, available only on the Internet, can be created andupdated rather quickly as one online version can simply replace an earlierversion (Mack, 2004).
Advergames are Internet-based video games with a subtle or overtcommercial message (Eisenberg et al., 2002). A recent unpublished analysisof Nielsen Media Research and Nielsen//NetRatings data examined theexposure of children ages 2–11 years to Internet entertainment sponsoredby 23 food and restaurant companies. Findings suggested that entertain-ment content on food and restaurant websites accounted for a very smallamount (0.025 percent) of the combined total Internet and television im-pressions for these companies (Collier Shannon Scott and Georgetown Eco-nomic Services, 2005b).
However, advergames are a way to build brand awareness and brandloyalty, ensuring that immersive branding occurs through extended periodsof time of exposure versus an “impression,” so that children and teens maydevelop favorable views and memories of specific branded products (Cal-vert, 2003). Food marketers are building brand awareness and loyalty withadvergames such as “Big G All-Stars vs. Major League Baseball,” a CD-ROM game in which cereal characters from General Mills play againstmajor league baseball teams (Freeman, 1998). The Hostess Company has awebsite featuring interactive advergames with the Twinkie® brand intendedfor children ages 7 to 11 years. Although the website does not sell productsor provide information about the products, it serves to imprint the brandname and build brand loyalty among children (Hunter, 2002). Advergaminghas also reached toddlers and infants with familiar rhymes within carefullydesigned Internet-based games (Friedman, 2001).
FOOD AND BEVERAGE MARKETING TO CHILDREN AND YOUTH 195
While gaming has generally been favored by boys more than girls(Subramanyam et al., 2001), most companies now attempt to attract bothgenders through a branded advergame that revolves around action or roleplay (Mack, 2004). Websites that are popular with tween girls, such asNeopets.com®, use marketing techniques such as product placement andimmersive advertising, which integrates sponsors’ products or services intoactivities available on a website (Fonda and Roston, 2004; Neopets®, 2005).In the land of Neopia®, children create pets with cuddly names and the playwith them (Snider, 2002). In the Neopia® food shop, young children can“spend” their Neopoints to purchase Uh Oh Oreo® cookies, Nestlé Swee-Tarts®, and Laffy Taffy® candy. They can gain Neopoints by viewing cerealadvertisements and Disney movie trailers and participate in marketing sur-veys. Tie-ins to new CDs and other products are also featured. Neopets®
advertisers include Discovery Kids Channel, Disney, Frito-Lay, GeneralMills, Hasbro, Kellogg Company, Kraft Foods, Mars, McDonald’s Corpo-ration, Nabisco, Nestlé, Universal Studios, and Warner Brothers (Neopets®,2005). Although Neopets® was initiated in 2000, the company describesitself as “the world’s largest and fastest growing youth entertainment net-work on the Internet” (Neopets®, 2005). Neopets® describes itself as hav-ing pioneered the technique called “immersive advertising,” whichseamlessly integrates sponsors’ products or services into activities availableon the Neopets.com® website (Neopets®, 2005). Neopets® reports that ithas 30 million members, 39 percent under 13 years of age, and 40 percentbetween 13–17 years of age (Neopets®, 2005). Postopia.com® is anotherwebsite. Hosted by Viacom International, the parent company of Nickel-odeon, it features Kraft Foods’ food and beverage brands (Viacom Interna-tional, 2005). Another website, Candystand.com®, is hosted by variouscompanies that make confectionery such as Life Savers® and provides ar-cade games, card games, and downloads (Skyworks Technologies, 2004).
Digital Television
A new marketing technique called “interactive product placement”merges television and the Internet through channels such as digital televi-sion and Web television. With these technologies becoming more available,products are expected to become featured as part of program stories andwill be available for purchase by clicking a mouse that is connected to atelevision screen (Montgomery, 2001). This type of interactive media thatallows the purchase of merchandise through television using a remote con-trol is also called “t-commerce” or “embedded commerce,” and is currentlyavailable on websites of television programs. A new form of technology willprovide a one-click ordering opportunity from the television screen for allproducts including food and beverage products (Children Now, 2005;
196 FOOD MARKETING TO CHILDREN AND YOUTH
Tarpley, 2001). This type of technology may also allow marketers to trackand store users’ personal data for marketing purposes (Children Now,2005).
Viral Marketing
Viral marketing is a form of “under the radar” marketing (sometimescalled “stealth marketing” in popular vernacular), which represents the“buzz” or “word of mouth,” which occurs when people talk about a prod-uct to one another, either with real words or through virtual communica-tion through an electronic platform (Henry, 2003; Kaikati and Kaikati,2004). Viral marketing may be effective with teens, particularly if dis-counts, desirable products, and free premiums are provided (Schor, 2004).Buzz or viral marketing functions in the electronic marketplace throughtrendsetters who “seed” messages, brand preferences, and incentives (e.g.,gift coupons for websites, product samples) (Gladwell, 2000). In someinstances, the trendsetters may receive training and be aware of their role.In other instances, it is entirely web-based communication, creating a“blogging network.” The buzz tools are Internet chat rooms, news groups,and “blogs” (e.g., personal online journals; the term is short for “weblogs”) (Kaikati and Kaikati, 2004).
With viral marketing, a company may hire young actors who sign aconfidentiality agreement and then interact with unsuspecting consumers ina popular or public gathering spot. Music industry marketers have used theapproach by sending pairs of young, trend-conscious consumers into storesto talk about a new CD or DVD to each other, knowing that they areoverheard by unsuspecting customers (Kaikati and Kaikati, 2004). Althoughthe strategies vary in venues and demographics, they share the same basicapproach and goals, which are to arouse curiosity and encourage consum-ers to develop a focused interest in a specific product they may otherwisenot have considered purchasing (Kaikati and Kaikati, 2004). Buzz market-ing is often a component of an integrated media and marketing mix (Henry,2003). The potential utility of viral marketing for food and beverage pro-motion is just emerging, in particular for CSDs, but its effectiveness is notyet known (Holt, 2004).
Mobile Marketing
Cellular telephones are now ubiquitous in the United States. Most cellphones are now able to process data services such as text messaging, infor-mation, Internet access, and entertainment. The Mobile Marketing Asso-ciation has established a voluntary code of conduct for wireless marketingcampaigns. One of the code’s requirements is that consumers must select

FOOD AND BEVERAGE MARKETING TO CHILDREN AND YOUTH 197
all marketing programs or be able to easily decline certain programs; how-ever, not all marketers have followed the standards (Joyce, 2004). Al-though marketing through a cell phone can be legally achieved only with arecipient’s consent, technological developments with cell phones and mar-keting efforts to older children and youth may significantly change thispremise in the future. For example, The Coca-Cola Company launched amarketing campaign in Germany that allows consumers to send text mes-sage codes found under bottle caps in return for receiving a branded cell-phone game (Red Herring, 2005). Young consumers are also enthusiasticadopters of text messaging and other mobile features such as transmittingelectronic games on the Internet between friends (Calvert, 2003). Manymarketers believe that the relative ease with which teens and tweens usemobile technology offers a large, untapped potential market (Preschel,2005; Thomas, 2004).
In 2005, Nickelodeon and Verizon Wireless launched the Nick Mobile,which brings Nickelodeon video content to users of Verizon Wireless’s VCAST wireless phones (Verizon Wireless, 2005). A selection of 1- to 3-minute Nickelodeon videos that have recognizable characters from Dorathe Explorer, Blue’s Clues, and LazyTown are available to view on cellphones (Verizon Wireless, 2005), and these videos may contain embeddedfood and beverage products.
Cell phones are also equipped with global positioning satellite trackingcapabilities and will be able to provide businesses and companies with theability to “find” consumers anywhere and tailor advertising messages tothem. For example, it is possible that an individual walking the streets of amajor city may someday receive advertisements by cell phone instantlywhen passing by a store. Cell phones may also be used to allow youngconsumers to purchase products without using cash (Calvert, 2003), al-ready occurring outside the United States. For example, consumers in Japanare able to use their mobile phones to purchase products from Coca-Cola™’s “Cmode” vending machines (Red Herring, 2005).
Adult cell phone users are able to download store merchandise cou-pons, instant-win games, and sweeps, and these features could potentiallybe used when marketing to children. Current mobile phone owners ages 12and older were surveyed about their willingness to accept and use wirelesscoupons or special offers. Of those polled, 79 percent of African Americansages 12–34 years and 61 percent of Hispanics/Latinos ages 12–34 yearswere somewhat or very likely to use wireless coupons or special offers(Upoc, 2002).
Finding: Food and beverage marketing is increasingly delivered throughintegrated vehicles other than the traditional television advertising (e.g.,Internet, event sponsorships, outdoor media, kid’s clubs, video games,

198 FOOD MARKETING TO CHILDREN AND YOUTH
advergames, product placement, music, and schools) that are especiallyappealing to children and youth.
COMPANY AND INDUSTRY GUIDELINES AND POLICIES
Self-Regulation: Children’s Advertising Review Unit
Mindful of the need for responsible practices in marketing food andbeverage products to children and youth, the industry has developed itsown program of self-regulation that has two basic elements: (1) a code ofpractice, representing a set of ethical guidelines that provide oversight forthe content of advertising activities, and (2) a process for implementing,reviewing, and enforcing the code of practice. The purpose of industryself-regulation is to ensure that advertising messages directed to youngchildren are truthful, accurate, and sensitive to this audience, thereby“preserving their freedom to direct their messages to young children”(CARU, 2003b). To administer the industry program of self-regulation,the Children’s Advertising Review Unit (CARU) was formed in 1974 topromote “responsible children’s advertising.” CARU is part of an alliancewith the major advertising trade associations through the National Ad-vertising Review Council (NARC), which is the body that establishes thepolicies and procedures for CARU. NARC members include the Associa-tion of National Advertisers (ANA), the American Association of Adver-tising Agencies (AAAA), the American Advertising Federation (AAF), andthe Council of Better Business Bureaus (CBBB) (CARU, 2003a).
CARU’s board consists of academic and business members. It isfinanced entirely by the business community, and receives support fromthe various sectors that advertise to children, including advertising agen-cies, toy and video game manufacturers, food and beverage companies,QSRs, and Internet providers (CARU, 2003b). CARU is the investigativearm of the advertising industry’s voluntary self-regulation program forchildren and youth. Cases are brought to the attention of these two entitiesfrom competitive challenges from other advertisers, and also from self-monitoring traditional and newer media, including the Internet (CARU,2003b).
CARU’s Self-Regulatory Guidelines for Children’s Advertising includeseven basic principles for responsible advertising directed to children underthe age of 12 years that relate to specific advertising techniques, such asadvertising that involves endorsement and promotion by program or spokes-characters (Box 4-1). The CARU guidelines are adopted voluntarily andemphasize nondeceptive communication for children; however, CARU doesnot have oversight of product content or services being advertised (CARU,2003a).

FOOD AND BEVERAGE MARKETING TO CHILDREN AND YOUTH 199
BOX 4-1CARU’s Principles in Advertising to Children
1. Advertisers should always take into account the level of knowledge, sophistica-tion and maturity of the audience to which their message is primarily directed.Younger children have a limited capacity for evaluating the credibility of infor-mation they receive. They also may lack the ability to understand the nature ofthe personal information they disclose on the Internet. Advertisers, therefore,have a special responsibility to protect children from their own susceptibilities.
2. Realizing that children are imaginative and that make-believe play constitutesan important part of the growing up process, advertisers should exercise carenot to exploit unfairly the imaginative quality of children. Unreasonable expec-tations of product quality or performance should not be stimulated either direct-ly or indirectly by advertising.
3. Products and content which are inappropriate for children should not be adver-tised or promoted directly to children.
4. Recognizing that advertising may play an important part in educating the child,advertisers should communicate information in a truthful and accurate mannerand in language understandable to young children with full recognition that thechild may learn practices from advertising which can affect his or her healthand well-being.
5. Advertisers are urged to capitalize on the potential of advertising to influencebehavior by developing advertising that, wherever possible, addresses itself topositive and beneficial social behavior, such as friendship, kindness, honesty,justice, generosity and respect for others.
6. Care should be taken to incorporate minority and other groups in advertise-ments in order to present positive and pro-social roles and role models wherev-er possible. Social stereotyping and appeals to prejudice should be avoided.
7. Although many influences affect a child’s personal and social development, itremains the prime responsibility of the parents to provide guidance for children.Advertisers should contribute to this parent–child relationship in a constructivemanner.
SOURCE: CARU (2003a).
CARU’s guidelines are formally supported by many food, beverage,and QSR member companies, including General Mills, Kellogg Company,Kraft Foods, McDonald’s Corporation, Nestlé, and PepsiCo (CARU,2003b). Many companies and trade associations representing the food andbeverage industry have adopted some of these principles in their own setsof standards, such as accurate and age-appropriate advertising, acknowl-edgment of children’s imaginations, and attention to the fact that childrenare often unable to distinguish a commercial from information. For ex-

200 FOOD MARKETING TO CHILDREN AND YOUTH
ample, in January 2005, Kraft Foods publicly clarified existing policies andannounced changes in the company’s product portfolio and advertisingpolicies to children under 12 years of age. The company stated that it doesnot advertise to children ages 6 years and younger on television, radio, andprint media; it discontinued advertising and promotion in schools, includ-ing Channel One; and it had developed nutrition standards for all productssold through vending machines in schools (Friedmann, 2005).
An independent assessment of company compliance with the CARUguidelines across a sample of 10,000 advertisements directed to children inthe early 1990s found a high overall rate of adherence (Kunkel and Gantz,1993). An assessment conducted by NARC (2004) suggested that within itsdesignated technical purview, the CARU guidelines have been generallyeffective in enforcing voluntary industrywide standards for traditional ad-vertising, and that the number of advertisements that contain words andimages that directly encourage excessive food consumption in children hasbeen reduced. Implicit in these findings, however, is their limited scope. Theguidelines do not address issues related to the volume of food advertisingtargeted to children, the broader marketing environment, or the many alter-native integrated marketing approaches that are rapidly increasing as pri-mary strategies for reaching children and youth.
There has been growing concern among consumer advocacy groupsabout CARU’s ability to monitor children’s food and beverage advertisingand newer forms of marketing across several types of media. In response tothis concern, the Grocery Manufacturers Association (GMA, 2005a) re-cently proposed several changes to enhance CARU’s resources, transpar-ency, and enforcement capacity to strengthen the CARU self-regulatorysystem (GMA, 2005d). GMA’s proposal includes provisions that would(1) expand CARU’s advisory board to support the monitoring and reviewprocess; (2) allow CARU to work with advertisers to develop approachesthat would encourage constructive and consistent healthy lifestyle mes-sages; (3) strengthen voluntary pre-dissemination review of advertisements;(4) expand CARU’s guidelines to address advertising contained in commer-cial computer games, video games, and interactive websites where childrenand teens are exposed to advergames; (5) prohibit paid product placementon children’s programming; and (6) use third-party licensed characters ap-propriately in children’s advertising. GMA also proposed two recommen-dations for the government. The first calls on the private sector to build acloser relationship with the FTC and DHHS to strengthen the voluntaryself-regulatory system. The second is for the government to support theprivate-sector initiatives. GMA suggested that the DHHS develop an awardsprogram that would recognize companies for promoting healthy lifestylesin such areas as consumer communications, employee health and wellness,

FOOD AND BEVERAGE MARKETING TO CHILDREN AND YOUTH 201
community activities, product development, and public–private partner-ships (GMA, 2005d).
Finding: Efforts by the Children’s Advertising Review Unit have influencedcertain elements of traditional advertising within its designated purview,but these standards do not address the impact of the volume of advertising,the appeal of its association with other elements of the popular culture forchildren and youth, or the influences of rapidly increasing marketing ap-proaches. Furthermore, there is a need for a more formal evaluation of theeffectiveness of its impact and enforcement capacity.
Food and Beverage Companies
Individual companies, and industry collectively, are motivated to makechanges in their product portfolios toward more healthful choices in themarketplace for a variety of reasons, including expanding their marketshare, displaying social responsibility, avoiding regulation, and avoidinglitigation. In terms of expanding market share, some companies are takingadvantage of consumer interest in nutrition and health by developing andpromoting new food and beverage products, and reformulating existingproducts, to meet specific nutritional guidelines. Several are also creatingnew packaging to reduce portion sizes of certain products, supporting com-munity health and wellness initiatives, promoting nutrition education andphysical activity in schools, initiating consumer research to develop moreeffective ways to convey nutrition information, and delivering informationabout more healthful company products to consumers. By manifesting so-cial responsibility through the marketing of healthier products, companiesanticipate strengthening both their market position and their credibilitywith consumers. Although hardly a mainstream practice, some early posi-tive signs suggest the possibility for leading companies to serve as rolemodels for the entire industry sectors (e.g., food and beverage companies,restaurants, entertainment sector).
Recent statements made by theAmerican Council for Fitness and Nutri-tion and GMA have acknowledged that the food and beverage industry canplay a positive role in assisting children, youth, their families, and commu-nities to lead more healthful lives (ACFN, 2004; GMA, 2005b). GMA’spublic statements also underscore a commitment to reverse the obesitytrend in the United States, and acknowledges that the solution will involvea long-term investment as well as multiple and integrated strategies acrossmany sectors (GMA, 2005b).
There is some indication that several of the leading food and beveragecompanies are reformulating some popular brands to eliminate or reduce

202 FOOD MARKETING TO CHILDREN AND YOUTH
trans fats and saturated fats as well as to develop reduced sugar, low-fat, orfat-free choices, and higher nutrient products, and to shift overall productportfolios toward healthier options on a small scale (Collier Shannon Scottand Georgetown Economic Services, 2005c; Friedmann, 2005; GMA, 2004;PepsiCo, 2004a; Powell, 2005; Taaffe, 2005). The shift in product portfo-lios has been stimulated in part by competition. Some companies have setinternal goals to ensure that increasing portions of their revenues comefrom either new or reformulated products in response to consumers’ grow-ing interest in healthful options and concern about less healthful products.Several large companies have targeted their product research and develop-ment for all age groups. Consumer demand will assist in the developmentand reformulation of existing company products to more nutritious foodsand beverages. A major challenge for these companies is to develop market-ing plans and communication strategies that complement efforts under-taken by government and nonprofit groups to educate consumers about thedistinguishing nutrition and health-related features of their particular brandswithin the context of general nutrition education, and how these messagesfit into a healthful diet balanced with physical activity.
One strategy employed by several companies seeking to market morespecifically on health grounds, has been the development of proprietarylogos or icons that communicate the nutritional qualities of their brandedproducts. PepsiCo uses the SmartSpot™ logo, Kraft Foods uses the SensibleSolution™ logo, General Mills promotes 14 different Goodness Cornericons, and the Kellogg Company promotes its Healthy Beginnings Programand its Breakfast Nook logo on packages to identify their products andconvey nutritional content information to consumers (Collier Shannon Scottand Georgetown Economic Services, 2005c; Friedmann, 2005; Powell,2005; Taaffe, 2005). Typically, such products are given “healthier” iconsby the companies if they provide key nutrients at targeted levels, meet FDAspecifications for “reduced,” “low” or “free” in calories, fat, saturated fat,sugar, or sodium, or contribute to some functional benefit such as promot-ing heart health or hydration. While representing important steps towarddrawing attention to more nutritious products, the array of categories,icons, and other graphics, as well as the different standards employed mayintroduce some confusion, particularly for young consumers, raising theneed for standard and consistent approaches.
An example of work to embed an icon initiative in a larger effort isKraft Foods’ announcement of marketing changes to enhance the visibilityof the healthier choices in its product line. Emphasizing the Sensible Solu-tion™ labeling icon that provides a “flag” on food and beverage productsthat meet specific “better-for-you” criteria, Kraft announced a shift in themix of products it advertises in television, radio, and print media viewed

FOOD AND BEVERAGE MARKETING TO CHILDREN AND YOUTH 203
primarily by children ages 6–11 years during children’s programming. Thecompany has committed to advertising, over the course of 2005, only thoseproducts that meet its Sensible Solution™ criteria. In this plan, productsnot meeting these criteria (e.g., Kool-Aid® beverages, Oreos®, and ChipsAhoy!® cookies, and many types of Post breakfast cereals and Lunchables®)would no longer be advertised and would be progressively phased out inmarketing communications in 2006 (Kraft Foods, 2005c). The companyalso announced that only the products that meet the Sensible Solution™criteria will appear on company websites that primarily reach children ages6–11 years, and it released a new line of Nabisco 100 percent whole graincookies and crackers (Kraft Foods, 2005d). Still to be addressed are issuessuch as advertising to youth, ages 12–17 years, and application of themarketing guidelines to the use of fictional or cartoon spokescharacters onproduct packages, contests, premiums, and advergames on the Internet(CSPI, 2005).
In a narrower example, PepsiCo has announced an initiative focused onschools, in which it will provide 100 percent SmartSpot™ products andless-than-150-calorie single-serve packages in elementary school vendingmachines (Taaffe, 2005). For middle and high schools, it will provide50 percent SmartSpot™ products that meet company-designated nutritioncriteria of “good for you” or “better for you”, and 50 percent “fun-for-you” products (that do not have any nutritional qualities) (Taaffe, 2005).
In addition to branded products, there are potential opportunities forpackaging innovations for usually unbranded products to meet the de-mands of consumer convenience while meeting the goals laid out in theDietary Guidelines for Americans. Fresh and dried fruits, vegetables, andwhole grains have not been marketed extensively, perhaps because most arenot branded products (Gallo, 1999). Due to the increasing concern aboutchildhood obesity, new product and packaging innovations are expandingthe availability of fruits, vegetables, and whole grain products to childrenand adolescents. The introduction of time-saving products such as bagged,prewashed lettuce and salad ingredients and “snack pack” shaved babycarrots have provided adult consumers and their children with convenientpreparations and take-out options (Guthrie et al., 2005).
Finding: The consistency, accuracy, and effectiveness of the proprietarylogos or icons introduced by several food companies as positive steps tocommunicate the nutritional qualities of some of their branded products toconsumers have not been evaluated. Without an empirically validatedindustrywide rating system and approach, efforts to use such graphic por-trayals on food labels may fall short of their potential as guides to betterfood and beverage choices by children, youth, and their parents.

204 FOOD MARKETING TO CHILDREN AND YOUTH
Full Serve and Quick Serve Restaurants
Some QSRs are also exploring ways they might market healthier prod-ucts. For example, the largest QSR, McDonald’s, announced both that itwould seek to transform Ronald McDonald into a spokesperson advocat-ing physical activity, and to introduce and promote some healthier foodand beverage options that are lower in total calories and fat at its QSRfranchises. Happy Meals now offer the choice of apple dippers (fresh,peeled apple slices) served with a low-fat caramel dipping sauce as analternative to french fries, and beverages include apple juice and low-fatwhite and chocolate milk served in child-friendly containers (McDonald’sCorporation, 2004). The company has also begun offering a range of pre-mium salads that are lower in calories than burgers, french fries, and CSDs(McDonald’s Corporation, 2005a; Warner, 2005). Additionally, McDon-ald’s has announced that it will add nutritional information on its foodpackaging starting in 2006 (Barrionuevo, 2005). On the other hand, Mc-Donald’s also points out that their initiative is contingent upon consumerdemand. An additional challenge is the special handling and packaging thatthe new offerings require due to a shorter shelf life (Plunkett ResearchLtd., 2005).
The SUBWAY® chain restaurants developed the F.R.E.S.H. Steps ini-tiative that was inspired by children and adults requesting healthier meals.The initiative was advertised as helping children and their parents to pledgeto living more healthfully by being physically active and eating a variety ofnutritious choices. The restaurant also offers voluntary nutrition informa-tion about their menu options, and lower-calorie options through theSUBWAY® Kids’ Pak® meal that has less fat, saturated fat, and cholesterolthan the burger and french fries. The sandwiches can be custom made tochildren’s needs (Subway, 2005).
While the healthier menu options are gaining media attention, mostQSRs continue to offer choices that are predominantly high in total calo-ries, saturated fat, sugar, and salt. For example, Ruby Tuesday’s operates afast-growing chain of family-style restaurants known for their salad bar,sandwiches, soups, burgers, and platters. In 2003, the restaurant chaindeveloped a program to provide consumers with nutrition informationto make healthier choices at point-of-purchase. However, like other QSRand casual dining restaurant chains, they are gradually reintroducing high-calorie, high-fat choices on their menus because customers are not orderingthe healthier low-calorie selections (Pressler, 2005). Many QSRs point outthat since consumer demand is the true test of a healthier food and beverageinitiative, their success is dependent upon a broader-based sustained soci-etal effort focused on healthier choices.
FOOD AND BEVERAGE MARKETING TO CHILDREN AND YOUTH 205
Finding: Certain food and beverage companies and quick serve restau-rants with products prominently consumed by children are actively ex-ploring more balanced and health-promoting product development andmarketing strategies. Prevailing industry practices, guidelines, and effortsremain limited.
Food and Beverage Retailers
Supermarkets and other venues such as convenience stores, drug stores,superstores, and warehouse clubs all influence consumers’ choices throughtheir display of healthful foods, beverages, and meals. Activities and changesimplemented by some food retailers include offering products that arehealthier, less costly, and packaged in smaller portions; promoting healthierproducts for children through special displays, shelf markers, cross-merchandising, incentives and premiums, in-store product samples, andrelated activities and events; and sponsoring school nutrition tours, Weband nutrition information on health and weight management, menu plan-ning for children, and in-store health checkups including determinations ofchildren’s Body Mass Index levels (Childs, 2005). Nonetheless, a typicalretailer is more likely to flag such items as CSDs, ice cream, and cookies intheir promotions (Information Resources, 2005).
It has been suggested that retailers have both profit and public relationsincentives to help consumers purchase and consume a healthful diet and todemonstrate that industry can be responsive to public concerns (IOM,2005). Public-sector initiatives at the federal, state, and local levels mightalso facilitate activities undertaken by food retailers that support healthfuldiets, including public recognition, company awards for excellence, compe-titions, and performance-based tax breaks.
Finding: The food retail sector has taken some steps to promote healthfulproducts to young consumers and their families, but there are abundantopportunities to do more to promote child-oriented foods and beveragesthat are healthful, visually accessible, and economically affordable.
Trade Associations
Trade associations represent the interests of food and beverage compa-nies, restaurants, the entertainment industry, and the advertising and mar-keting sector. The GMA has taken steps to survey its member companieswith regard to product development, product packaging innovations, pro-viding consumer information resources, public–private partnerships, andthe promotion of healthful lifestyles, employee wellness, and public health

206 FOOD MARKETING TO CHILDREN AND YOUTH
initiatives (GMA, 2004). GMA has also developed guidelines for competi-tive foods and beverage provisions in schools and advertising to children,emphasizing products in schools that meet the Dietary Guidelines for Ameri-cans; adhere to an age-appropriate product mix as determined by schoolsystems; and ensure school administrators’ control over vending machines,including choices of food offerings, locations, and times of operation (GMA,2005b,c; Chapter 6). Although the GMA also has an active Food and HealthStrategy Group and it endorses stronger CARU guidelines, as noted earlierin this chapter, it has not yet developed or institutionalized formal companyguidelines, best practices, competitions, incentives, or recognition programsthat encourage and reward its members to develop and promote healthierfood and beverage products. Government agencies could provide technicalassistance to help ensure the consistency of these efforts with sound nutri-tion principles, as well as to help in monitoring compliance and publicizingresults.
The largest food and beverage trade association, the Food ProductsAssociation (FPA, formerly the National Food Processors Association), usesits scientific and laboratory capacity to provide technical support to mem-ber companies in their efforts to improve the safety and nutritional qualityof their products, as well as to help them in the application of relevantpolicies—such as the Dietary Guidelines, MyPyramid, and food labelingrequirements—to their product lines. FPA has also implemented variousfood and nutrition labeling education initiatives to help families and educa-tors assist in making wise food choices, and FoodFit.com, a website de-voted to promoting and enhancing the health of consumers through health-ful eating and active living. It places an emphasis on advocacy for nutritionand health claims on food products to benefit consumer food choices, andhas, in this respect, the potential to facilitate public–private collaborationon industrywide standards and graphic representation for products thatsupport healthful diets (FPA, 2005).
The American Marketing Association (AMA) has developed its ownguidelines regarding how its members conduct promotional activities. TheAMA has stated that it is committed to clear communication and fulldisclosure of product risks, and its ethical guidelines for members empha-size that marketers must do no harm; marketers must foster trust in themarketing system; and marketers must embrace, communicate, and prac-tice the fundamental ethical values that will improve consumer confidencein the integrity of the marketing exchange system (AMA, 2005b). UnlikeCARU, the AMA guidelines are designed to govern the marketing practicesof professionals rather than to encourage self-regulation by the food andbeverage industry.
The American Beverage Association, representing distributors, bottlers,and vending machine companies, developed school vending policy guide-

FOOD AND BEVERAGE MARKETING TO CHILDREN AND YOUTH 207
lines in 2005 to limit the availability of CSDs in schools, and increase theavailability of lower calorie and higher nutrient beverages.
Under the new voluntary industry-supported policy: (1) elementaryschools would only make available water and 100 percent juice; (2) middleschools would only provide low-calorie or noncaloric beverages such aswater, noncaloric CSDs, low-calorie juice drinks, 100 percent juice, andsports drinks during school hours and no full-calorie CSDs or full-caloriejuice drinks with 5 percent or less juice until after school hours; and (3) highschools would provide a variety of beverage choices including bottled wa-ter, 100 percent juice, sports drinks, and juice drinks, with no more than50 percent of the vending selections dedicated to CSDs (ABA, 2005b). Theguidelines are supported by 20 companies comprising 85 percent of theU.S. school vending beverage sales by bottlers. Because the implementationof the policy is voluntary, determination of its effectiveness will depend onmonitoring.
Media and Entertainment Industries
The media and entertainment industries have a powerful impact andimportant potential to change the social norms around food choices andphysical activity behaviors. The news and entertainment media can poten-tially reach children, teens, and their parents through print, broadcast (tele-vision and radio), cable, music, and Internet-based programming that in-corporates healthy dietary messages, images, and placements. Throughnews reporting, the media also has potential to strengthen their capacity toserve as interpretive and monitoring authorities with respect to the mean-ing of emerging findings in nutrition, the truthfulness of various nutritionclaims, and the implications of developments for the nutrition and physicalactivity status of children and youth. Although various consumer groupshave suggested certain criteria for media and entertainment practices re-lated to food and nutrition, including the use of cartoon spokescharacterlicensing and celebrity endorsements, the entertainment industry has notyet developed specific guidelines for their licensing companies. Similarly,the interactive video game industry as yet lacks standards that might guidefood and beverage encouragement in the games used by children and teens(Walsh et al., 2004).
Several steps are under consideration by certain companies reachinglarge numbers of children. Nickelodeon, for example, supports balancedprogramming, which means that advertisements for food products shoulddepict food and beverages within a healthful lifestyle. In 2005, Nickelodeonhas reportedly implemented a companywide policy to discontinue adver-tisements that do not meet these standards (Smalls, 2005a). Nickelodeon is

208 FOOD MARKETING TO CHILDREN AND YOUTH
also changing the way their characters and brands can be used, limitingpromotions that contradict messages that do not promote healthful life-styles, and eliminating the use of food in promotional activities includingprizes in game shows and sweepstakes (Smalls, 2005a).
Health and Wellness Advisory Groups
A number of food and beverage companies, including Kraft Foods,PepsiCo, and McDonald’s Corporation, have established advisory groupsas a step to respond to a variety of marketing concerns. These advisorygroups are intended to help the companies to develop strategies to pro-mote more healthful food and beverage product options to consumers thatare also economically viable. Examples include PepsiCo’s Blue Ribbon Ad-visory Board (PepsiCo, 2004b), McDonald’s Corporation’s Global Advi-sory Council on Balanced Lifestyles (McDonald’s Corporation, 2005b),and Kraft Foods’ Worldwide Health & Wellness Advisory Council (KraftFoods, 2005e). Members are intended to offer expertise in health andwellness disciplines that include nutrition, obesity, physical activity, publichealth, human behavior, and the impact of media on child development,and they are to assist the companies in developing policies, standards, andmeasures for implementing specific health-related initiatives. The long-term impact of these advisory groups is undetermined.
Public–Private Partnerships
Developing and sustaining partnerships that foster community-basedhealth and wellness programs is an important component of promotingmarketing of more healthful products to children and youth. A number offood, beverage, and restaurant companies have developed partnerships withsports, educational institutions, or scientific institutions to promoteand encourage children and youth to lead more active lifestyles (CollierShannon Scott and Georgetown Economic Services, 2005c). There are mul-tiple examples. PepsiCo has developed a partnership with the University ofNorth Carolina to promote a $4 million campaign called Get Kids in Ac-tion to reduce and prevent childhood obesity; a partnership with Americaon the Move called Balance First to disseminate lesson plans that teach theconcept of energy balance in elementary and middle schools, with the goalof reaching 2.5 million U.S. students; and a partnership with the SchoolNutrition Association to develop wellness solutions in schools. GeneralMills has developed a partnership with the President’s Council on PhysicalFitness and the American Dietetic Association to promote The ChampionsProgram. Kraft Foods has a partnership with the Latino Children’s Instituteto promote Salsa Sabor y Salud. The Coca-Cola Company has developed
FOOD AND BEVERAGE MARKETING TO CHILDREN AND YOUTH 209
Live It!, a health and fitness school partnership initiative advertised ashelping sixth graders build healthier lifestyles (The Coca-Cola Company,2005b). The impact and reach of these programs is undetermined.
Industry Coalitions
Many in the food and beverage industry are actively involved in variouscoalitions to promote healthier choices and lifestyles for U.S. children,youth, and their parents, and they have widely differing perspectives andstrategies. The American Council for Fitness and Nutrition (ACFN) is anonprofit coalition formed by more than 90 food and beverage companies,trade associations, and professional health and nutrition societies, includ-ing the American Dietetic Association and the American Association ofDiabetes Educators, with the goal of promoting comprehensive and achiev-able solutions to the growing obesity rates in the United States (ACFN,2004). ACFN members work in support of the CARU guidelines and initia-tives that emphasize motivation rather than economic and regulatory incen-tives in child nutrition (ACFN, 2004).
The Advertising Council, a nonprofit member of the ANA, formed theCoalition for Healthy Children in 2005, also including the food, beverage,restaurant, and advertising industries. This coalition works to engage mem-bers to address childhood obesity by harnessing key messages into theirinternal communications programs as well as their advertising, packaging,websites, community-based programs, and marketing events with consis-tent key messages (Ad Council, 2005).
The Alliance for American Advertising (AAA) consists of a variety offood and beverage companies, and advertising and media associations, thatworks to discourage government regulation of advertising, and supports itsmembers’ ability to advertise to all people, including children (ANA, 2004).Members of the coalition include the American Advertising Federation,American Association of Advertising Agencies, ANA, General Mills, Kel-logg Company, Kraft Foods, PepsiCo, GMA, and the Snack Food Associa-tion (Office of the Clerk, U.S. House of Representatives, 2004). The ANAdescribes the coalition members as supporting CARU’s self-regulatory ap-proach to advertising, public education approaches for addressing thecauses of obesity, and supporting effective ways to reverse the obesitytrend (ANA, 2004).
SUMMARY
Food and beverage products are among the products most heavilymarketed to children and youth in the United States. The increased pur-chasing power, and influence of young people has drawn more and more

210 FOOD MARKETING TO CHILDREN AND YOUTH
industry attention, creativity, and resources to the production and market-ing of food and beverages for children and youth. Product branding hasbecome a normalized part of the lives and culture of American children andyouth, and the majority of food and beverage marketing practices promotebranded products instead of unbranded food groups. Marketers use a rangeof strategies to build brand awareness and brand loyalty early in life that isintended to be sustained into adulthood.
The growth rate in recent years in new product introductions for bothfood and beverage products targeted to children and adolescents, is greaterthan the growth rate for food and beverage products targeted to the gen-eral market. The majority of these new food and beverage products werebranded products that are high in total calories, sugar, salt, fat, and low innutrients.
Television remains the primary promotional medium for measuredmedia marketing of food and beverage marketing to children and youth,but a shift is occurring toward other sales promotion such as productplacement, character licensing, the Internet, advergames, in-school mar-keting, and special events marketing. Viral marketing and product place-ment that traverse many types of media are newer marketing strategiesbeing used more commonly to reach consumers. Commercial and non-commercial content are becoming more indistinguishable, sophisticated,and blended, presenting a special challenge, given the limited capacity ofyounger children to process these messages cognitively. Guidelines devel-oped by the National Advertising Review Council and administered by theChildren’s Advertising Review Unit have contributed to the enforcementof industrywide standards for traditional advertising. However, thesestandards have not kept pace with the expanded forms of marketingcommunication.
The heightened public interest in health and wellness and increasedconcern about obesity presents certain marketing risks—such as increasedcosts associated with developing, reformulating, packaging, test marketing,and promoting food and beverage products, as well as uncertainty relatedto creating and sustaining consumer demand for these new products—aswell as potentially profitable yet unexplored marketing opportunities. Foodand beverage manufacturers can compete for and expand their marketshare for healthier food and beverage product categories, be role models forthe industry by substantially shifting overall product portfolios towardhealthier products, and serve as socially responsible corporate stakeholdersin the response to childhood obesity. In making positive changes that ex-pand consumers’ selection of healthier foods and beverages, despite thechallenges of market forces and the marketplace, companies may avoid therisk of either government regulation or litigation.
Leading food, beverage, and restaurant companies have taken certain,

FOOD AND BEVERAGE MARKETING TO CHILDREN AND YOUTH 211
limited constructive steps to develop more balanced and health promoting-strategies, such as reformulating or developing new products, changingproduct packaging to reduce portion sizes, establishing health and wellnesscouncils, developing public–private partnerships to promote energy balanceeducation in schools, and supporting community-based health and wellnessinitiatives. Still, the food and beverage industry, restaurants, entertainmentand media companies, the food retail sector, and trade associations remainfar short of their full potential to do much more to develop and consistentlypromote healthful food, beverage, and meal options to children and youth.
REFERENCES
ABA (American Beverage Association). 2004. It’s a “Bevolution”: National Soft Drink Asso-ciation Changes Name to American Beverage Association to Reflect Wide Range ofBeverages Industry Produces. [Online]. Available: http://www.ameribev.org/pressroom/111104namechange.asp [accessed June 12, 2005].
ABA. 2005a. What is ABA? [Online]. Available: http://www.ameribev.org/about/ [accessedJune 12, 2005].
ABA. 2005b. Beverage industry announces new school vending policy: Plan calls for lower-calorie and/or nutritious beverages in schools and new limits on soft drinks. NewsRelease. August 16. [Online]. Available: http://www.ameribev.org/pressroom/2005_vending.asp [accessed September 20, 2005].
ACFN (American Council for Fitness and Nutrition). 2004. Tipping the Scales on Obesity:Meeting the Challenges of Today for a Healthier Tomorrow. [Online]. Available: http://www.acfn.org/resources/TTS.pdf [accessed July 12, 2005].
ACNielsen. 2004. Consumer Insight. Eighth Annual ACNielsen Consumer and Market TrendsReport. Schaumburg, IL: ACNielsen.
Ad Council. 2005. Ad Council announces collaboration to combat childhood obesity “coali-tion for healthy children.” News Release. July 13. [Online]. Available: http://www.adcouncil.org/about/news_071305/ [accessed September 20, 2005].
Adler R, Friedlander B, Lesser G, Meringoff L, Robertson T, Rossiter J, Ward S. 1977.Research on the Effects of Television Advertising to Children: A Review of the Litera-ture and Recommendations for Future Research. Washington, DC: U.S. GovernmentPrinting Office.
Alexander A, Benjamin L, Hoerrner K, Roe D. 1998. We’ll be back in a moment: A contentanalysis of advertisements in children’s television in the 1950s. Journal of Advertising27(3):1–9.
Allen JC. 2001. The economic structure of the commercial electronic children’s media indus-tries. In: Singer D, Singer J, eds. Handbook of Children and the Media. Thousand Oaks,CA: Sage Publications.
AMA (American Marketing Association). 2005a. Marketing Definitions. [Online]. Available:http://www.marketingpower.com/content4620.php [accessed May 23, 2005].
AMA. 2005b. Ethical Norms and Values for Marketers. [Online]. Available: http://www.marketingpower.com/content435.php [accessed July 10, 2005].
ANA (Association of National Advertisers). 2004. ANA Compendium of Legislative, Regula-tory and Legal Issues. [Online]. Available: http://www.ana.net/govt/2004_compendium.pdf [accessed June 29, 2005].
Apple & Eve. 2005. Just for Kids. [Online]. Available: http://www.appleandeve.com.kids.asp[accessed June 20, 2005].

212 FOOD MARKETING TO CHILDREN AND YOUTH
Atkinson C. 2005. Channel One hits bump, losing ads and top exec. Advertising Age 76(11):3–38.
Austin SB, Rich M. 2001. Consumerism: its impact on the health of adolescents. Adolesc Med12(3):389–409.
Auty S, Lewis C. 2004. Exploring children’s choice: The reminder effect of product place-ment. Psychol Marketing 21(9):697–714.
Avery R, Ferraro R. 2000. Verisimilitude or advertising? Brand appearances on prime-timetelevision. J Consum Affairs 34(2):217–244.
Babin LA, Carder ST. 1996. Viewers’ recognition of brands placed within a film. Int J Ad15(2):140–151.
Balasubramanian SK. 1994. Beyond advertising and publicity: Hybrid messages and publicpolicy issues. J Advertising 23(4):29–46.
Barbieri McGrath B. 1997. The M&M’s Brand Chocolate Candies Counting Board Book.Watertown, MA: Charlesbridge Publishing.
Barbieri McGrath B. 2000. Kellogg’s Froot Loops! Counting Fun Book. New York: Harper-festival.
Barcus FE. 1977. Children’s Television: An Analysis of Programming and Advertising. NewYork: Praeger.
Barcus F. 1981. The nature of television advertising to children. In: Palmer E, Dorr D, eds.Children and the Faces of Television. New York: Academic Press. Pp. 273–285.
Barr R, Hayne H. 1999. Developmental changes in imitation from television during infancy.Child Dev 70(5):1067–1081.
Barrionuevo A. 2005. McDonald’s to add facts on nutrition to packaging. NY Times.October 25.
Baskin-Robbins. 2005. Baskin-31-Robbins® Birthday Club. [Online]. Available: http://www.baskinrobbins.com/BDayClub/ [accessed June 7, 2005].
Beverage Digest. 2004. Special Issue: Top-10 U.S. Carbonated Soft Drink Companies andBrands for 2003. [Online]. Available: http://www.beverage-digest.com/pdf/top-10_2004.pdf [accessed June 10, 2005].
Boone LE, Kurtz DL. 1998. Contemporary Marketing Wired. 9th ed. Orlando, FL: TheDryden Press.
BrandWeek. 2005. A Special Report: Superbrands. Plus: America’s Top 2000 Brands. [On-line]. Available: http://www.brandweek.com [accessed August 8, 2005].
Broadcasting and Cable. 2004. Breaking . . . ABC family, Nick fined by FCC. Broadcasting& Cable October 25. P. 394.
Brown K, Endicott RC, Macdonald S, Schumann M, Macarthur G, Sierra J, Matheny L,Green A, Ryan M. 2004. 100 leading national advertisers. Advertising Age June 28. Pp.1–83.
Brown K, Endicott RC, Macdonald S, Schumann M, Macarthur G, Sierra J, Matheny L,Green A, Ryan M. 2005. 50th annual 100 leading national advertisers. Advertising AgeJune 27. Pp. 1–84. [Online]. Available: http://www.adage.com/images/random/lna2005.pdf [accessed September 16, 2005].
Brownell KD, Horgen KB. 2004. Food Fight: The Inside Story of the Food Industry,America’s Obesity Crisis, and What We Can Do About It. New York: The McGraw-Hill Companies.
Business Insights. 2005a. The Top 10 Global Leaders in Food. Brochure. [Online]. Avail-able: http://www.globalbusinessinsights.com/etwodir/mailings/rc412/rc412pdfs/rc412j-brochure.pdf [accessed June 3, 2005].
Business Insights. 2005b. New Profit Opportunities in Health and Nutrition to 2009. [On-line]. Available: http://www.globalbusinessinsights.com/etwodir/mailings/rc445/rc445pdfs/rc445e-brochure.PDF [accessed August 29, 2005].
FOOD AND BEVERAGE MARKETING TO CHILDREN AND YOUTH 213
Business Wire. 2005. Mars, Incorporated Announces New Nutrition-Focused Business.June 30.
Buzz Marketing Group. 2004. Blue Fusion Releases National Youth Survey on the BrandLoyalty of Teens. Press Release. [Online]. Available: http://buzzmg.com/pressrelease/040217.pdf [accessed July 12, 2005].
Byrd-Bredbenner C. 2002. Saturday morning children’s television advertising: A longitudinalcontent analysis. Fam Consum Sci Res J 30(3):382–403.
Byrnes N. 2000. Babes in virtual toyland. Business Week 3672:62–64.Calvert SL. 2003. Future faces of selling to children. In: Palmer EL, Young BM, eds. The
Faces of Televisual Media. Mahwah, NJ: Lawrence Erlbaum Associates. Pp. 347–357.Calvert SL, Rideout VJ, Woolard JL, Barr RF, Strouse GA. 2005. Age, ethnicity, and socio-
economic patterns in early computer use. A national survey. Am Behav Scientist 48(5):590–607.
Cannondale Associates. 2005. Cannondale Study Identifies Trade Promotion Best Practices.Press Release. November 25. [Online]. Available: http://www.cannondaleassoc.com/up-load/61525-39.doc [accessed July 28, 2005].
CARU (Children’s Advertising Review Unit). 2003a. Self-Regulatory Guidelines for Children’sAdvertising. 7th ed. New York: Council of the Better Business Bureaus.
CARU (Children’s Advertising Review Unit). 2003b. About the Children’s Advertising Re-view Unit (CARU). [Online]. Available: http://www.caru.org/ [accessed November 10,2005].
Cascadian Farm. 2003. Cascadian Farm® Products. [Online]. Available: http://www.cascadianfarm.com/cfarm/products/product_detail.asp?category=8 [accessed June 20,2005].
Chaplin H. 1999. Food fight. Am Demographics 21(6):64–65.Cheskin. 2001. The Wireless Future: A Look at Youth Unplugged. [Online]. Available: http:
//www.cheskin.com/docs/Sites/1/wirelessexecsumm.pdf [accessed September 11, 2005].Children Now. 2005. Interactive Advertising and Children: Issues and Implications. [Online].
Available: http://www.childrennow.org/assets/pdf/issues_media_dtv_brief1.pdf [accessedOctober 11, 2005].
Childs N. 2005. Selected opportunities for food retailers to address childhood obesity. Presen-tation at the DHHS-FTC Workshop about Perspectives on Marketing, Self-Regulation,and Childhood Obesity. July 14–15. [Online]. Available: http://www.ftc.gov/bcp/work-shops/foodmarketingtokids/index.htm [accessed September 23, 2005].
Cobb-Walgren CJ. 1990. The changing commercial climate. Current Issues and Research inAdvertising 13(1-2):343–368.
Collier Shannon Scott, PLLC, Georgetown Economic Services, LLC. 2004. Television Adver-tising for Food and Restaurants: Total Expenditures and Number of Commercials Seenby Children. A Report to The Grocery Manufacturers of America and The Associationof National Advertisers. October 1.
Collier Shannon Scott, PLLC, Georgetown Economic Services, LLC. 2005a. Report Method-ology Presented to the IOM Committee on Food Marketing and the Diets of Childrenand Youth for Television Advertising for Food and Restaurants: Total Expenditures andNumber of Commercials Seen by Children. April 11.
Collier Shannon Scott, PLLC, Georgetown Economic Services, LLC. 2005b. Television Ad-vertising and Internet Viewing of Food and Restaurant Messages: Total TV Ad Expendi-tures, Total Screen Time, TV Commercials and Web Pages Seen by Children. May 13.
Collier Shannon Scott, PLLC, Georgetown Economic Services, LLC. 2005c. Issues in Adver-tising and Promotion of Food and Health—IOM Panelists’ Response to IOM Ques-tions. May 12.

214 FOOD MARKETING TO CHILDREN AND YOUTH
Comstock G, Scharrer E. 1999. Television: What’s On, Who’s Watching, and What It Means.San Diego, CA: Academic Press.
ConAgra Foods. 2004. Kid Cuisine Product Fact Sheet. [Online]. Available: http://www.conagrafoods.com/brands/kid_cuisine.jsp [accessed May 8, 2005].
Condry J, Bence P, Scheibe C. 1988. Nonprogram content of children’s television. J Broad-casting Electronic Media 32(3):255–270.
Condry J, Scheibe C. 1989. Nonprogram content of television: Mechanisms of persuasion. In:Condry J, ed. The Psychology of Television. Hillsdale, NJ: Lawrence Erlbaum Associ-ates. Pp. 173–231.
Consumers Union. 1990. Selling America’s Kids: Commercial Pressures on Kids of the 90s.[Online]. Available: http://www.consumersunion.org/other/sellingkids/ [accessed Septem-ber 19, 2005].
Consumers Union. 1995. Captive Kids: Commercial Pressures on Kids at School. Yonkers,NY: Consumers Union Education Series. P. 29.
Coon K, Tucker K. 2002. Television and children’s consumption patterns: A review of theliterature. Minerva Pediatrician 54(5):423–436.
Cotugna N. 1988. TV ads on Saturday morning children’s programming—What’s new? JNutr Ed 20(3):125–127.
CSPI (Center for Science in the Public Interest). 2003. Pestering Parents: How Food Compa-nies Market Obesity to Children. Washington, DC: CSPI. [Online]. Available: http://www.cspinet.org/new/200311101.html [accessed September 19, 2005].
CSPI. 2005. Kraft advertising-to-kids policy applauded. News Release. January 12. [Online].Available: http://cspinet.com/new/200501125.html [accessed September 22, 2005].
Dannon. 2005. Our Products. [Online]. Available: http://www.dannon.com/dn/dnstore/cgi-bin/ProdSubEV_Cat_240859_NavRoot_200.htm [accessed June 5, 2005].
DataMonitor. 2004. Company Overviews. [Online]. Available: http://www.DataMonitor.com[accessed July 19, 2005].
DataMonitor. 2005. Company Overviews. [Online]. Available: http://www.DataMonitor.com[accessed October 27, 2005].
Deutche Bank Securities. 2004. Why TV Advertising Doesn’t Work for Mature Brands. May18. Pp. 1–18.
Di Bona J, Chaudhuri R, Jean-Baptiste J, Menachem P, Wurzburg M. 2003. Commercialismin North Carolina high schools: A survey of principals’ perceptions. Peabody Journal ofEducation 78(2):41–62.
Doss VS, Marlowe J, Godwin DD. 1995. Middle-school children’s sources and uses of money.J Consum Affairs 29(1):219–241.
Downey K. 2002. Clutter Rises Even in Weak Ad Economy. April 5. [Online]. Available:http://www.medialifemagazine.com/news2002/apr02/apr01/5_fri/news2friday.html [ac-cessed July 11, 2005].
Earth’s Best. 2005. Let’s Make a Great Start to a Lifetime of Good Health. [Online]. Avail-able: http://www.earthsbest.com/sesame_street/ [accessed June 20, 2005].
Eisenberg D, McDowell J, Berestein L, Tsiantar D, Finan E. 2002. It’s an ad, ad, ad, adworld. Time 160(10):38–41.
Ellison S. 2005. Divided, companies fight for right to plug kids’ food. The Wall Street JournalJanuary 26. P. B-1.
Endicott RC, Brown K, MacDonald S, Schumann M, Ryan M, Sierra J, Wentz L. 2005.Hispanic Pact Pack. Advertising Age (Supplement) July 18. Pp. 1–51. [Online]. Avail-able: http://www.adage.com/images/random/hispfactpack05.pdf [accessed September16, 2005].
Enrico D. 1999. Top 10 advertising icons. The Advertising Century: Special Issue. AdvertisingAge vol 43. [Online]. Available: http://www.adage.com/century/century.html [accessedApril 11, 2005].

FOOD AND BEVERAGE MARKETING TO CHILDREN AND YOUTH 215
Entertainment Software Association. 2005. Computer and Video Game Software Sales ReachRecord $7.3 Billion in 2004. [Online]. Available: http://www.theesa.com/archives/2005/02/computer_and_vi.php [accessed March 10, 2005].
ERS/USDA (Economic Research Service/United States Department of Agriculture). 2004. FoodCPI, Prices, and Expenditures. Food and Alcoholic Beverages: Total Expenditures.[Online]. Available: http://www.ers.usda.gov/Briefing/CPIFoodAndExpenditures/Data/table1.htm [accessed June 17, 2005].
ERS/USDA. 2005a. Food CPI, Prices, and Expenditures. [Online]. Available: http://www.ers.usda.gov/Briefing/CPIFoodAndExpenditures/ [accessed October 27, 2005].
ERS/USDA. 2005b. Food expenditures. In: Agricultural Outlook: Statistical Indicators. [On-line]. Available: http://www.ers.usda.gov/Publications/Agoutlook/AOTables/ [accessedJuly 7, 2005].
Fattah H, Paul P. 2002. Gaming gets serious. Am Demographics. 24(5):38–44.FitchRatings. 2004. Can Coca-Cola Products Be Replaced? The Future of the Beverage In-
dustry and the Effect of Consumer Dietary Trends. November 16.FMI (Food Marketing Institute). 2003. Shopping for Health: Whole Health for the Whole
Family. Washington, DC: FMI and Prevention Magazine.FMI. 2004. Supermarket Facts: Industry Overview 2004. [Online]. Available: http://www.
fmi.org/facts_figs/superfact.htm [accessed May 3, 2005].Fonda D, Roston E. 2004. Pitching it to kids. Time 163(26):52–54.Food Engineering. 2004. The World’s Top 100 Food and Beverage Companies. [Online].
Available: http://www.foodengineeringmag.com/FILES/HTML/PDF/Top100chart.pdf[accessed July 12, 2005].
FPA (Food Products Association). 2005. [Online]. Available: http://www.fpa-food.org/ [ac-cessed November 19, 2005].
Freeman L. 1998. Selling kids (building brand loyalty among children). Food and BeverageMarketing 17(6).
Freitas S. 1998. Reflecting America’s Changing Face. Advertising Age 69(29):A6.Friedman W. 2001. Nestle goes gaming. Advertising Age 72(43):50.Friedmann L. 2005. Marketing Strategies That Foster Healthy Food and Beverage Choices in
Children and Youth. Presentation at a Workshop for the Committee on Food Marketingand the Diets of Children and Youth. Washington, DC, January 27.
Friend B, Stapylton-Smith M. 1999, April. Through the Eyes of Children. Presentation at theESOMAR Marketing in Latin America Conference. Santiago, Chile.
Gallo AE. 1999. Food advertising in the United States. In: Frazao E, ed. America’s EatingHabits: Changes & Consequences. Washington, DC: U.S. Department of Agriculture.
Gamble M, Cotugna N. 1999. A quarter century of TV food advertising targeted at children.Am J Health Behav 23:261–267.
GAO (U.S. General Accounting Office). 2000. Commercial Activities in Schools. GAO/HEHS-00-156. Washington, DC: GAO. [Online]. Available: http://www.gao.gov/archive/2000/he00156.pdf [accessed May 3, 2005].
Gardner E. 2000. Understanding the net’s toughest customer. Internet World 6(3):66–72.Gatorade. 2004. The Gatorade Story. [Online]. Available: www.gatorade.com [accessed No-
vember 10, 2005].General Mills. 2005a. Brands: Yoplait and Columbo. [Online]. Available: http://www.
generalmills.com/corporate/brands/product.aspx?catID=55# [accessed June 5, 2005].General Mills. 2005b. New Go-GURT Smoothie Introduced By Yoplait. [Online]. Available:
http://www.generalmills.com/corporate/health_wellness/in_the_news_detail.aspx?itemID=8156&catID=7586§ion=news [accessed June 12, 2005].
216 FOOD MARKETING TO CHILDREN AND YOUTH
General Mills. 2005c. Cascadian Farm Unveils Guide to the Guidelines to Educate ParentsAbout Kid Nutrition. Clifford the Big Red Dog Goes to Washington D.C. to Bring Funto the Breakfast Table. [Online]. Available: http://www.generalmills.com/corporate/health_wellness/in_the_news_detail.aspx?itemID=9695&catID=7586§ion=news [ac-cessed June 20, 2005].
Gladwell M. 2000. The Tipping Point: How Little Things Can Make a Big Difference. Bos-ton, MA: Back Bay Books.
GMA (Grocery Manufacturers of America). 2002. New survey shows national brand loyaltyhigh among american consumers. News Release. [Online]. Available: http://www.gmabrands.com/news/docs/NewsRelease.cfm?DocID=971& [accessed July 12, 2005].
GMA. 2004. GMA Members: Part of the Solution. October 2004.GMA. 2005a. Grocery Manufacturers Association. [Online]. Available: http://www.
gmabrands.com/ [accessed July 22, 2005].GMA. 2005b. GMA Board Statement and Guiding Principles for the Food and Beverage
Industry on Diet, Physical Activity and Health. Washington, DC: GMA.GMA. 2005c. Industry Position Statement on School Wellness Policy. Washington, DC: GMA.GMA. 2005d. GMA statement regarding proposals to strengthen advertising self-regulation.
News Release. July 15. [Online]. Available: http://www.gmabrands.com/news/docs/NewsRelease.cfm?DocID=1542& [accessed July 22, 2005].
GMA Forum. 2005. Cannondale Trade Promotion Study 2005. Saying No to the Status Quo.Second Quarter. Pp. 72–84.
Graetzer K. 2005. Comments of the MilkPEP Board Concerning Advertising and MarketingStrategies Effective in Fostering Healthy Food Choices in Children and Youth. IOMCommittee on Food Marketing and the Diets of Children and Youth. June 2.
Greenberg BS, Brand JE. 1993. Television news and advertising in schools: The “ChannelOne” controversy. J Commun 43(1):143–151.
Grier SA. 2005. The Past, Present, and Future of Marketing of Foods to Children. Presenta-tion at the DHHS-FTC Workshop about Perspectives on Marketing, Self-Regulation,and Childhood Obesity. July 14–15. [Online]. Available: http://www.ftc.gov/bcp/work-shops/foodmarketingtokids/index.htm [accessed July 27, 2005].
Grier SA, Brumbaugh AM. 2004. Consumer distinctiveness and advertising persuasion. In:Williams JD, Lee W-N, Haugtvedt CP, eds. Diversity in Advertising. Hillsdale, NJ:Lawrence Erlbaum Associates, Inc.
Guest LP. 1955. Brand loyalty—twelve years later. J Appl Psychol 39:405–408.Gupta P, Gould S. 1997. Consumers’ perceptions of the ethics and acceptability of product
placement in movies: Product category and individual differences. J Current Issues andRes Ad 19(1):37–50.
Guthrie JF, Lin BH, Reed J, Stewart H. 2005. Understanding economic and behavioral influ-ences on fruit and vegetable choices. Amber Waves 3(2):36–41. [Online]. Available:http://www.ers.usda.gov/AmberWaves/April05/pdf/april05_feature_fruitsandvegetables.pdf [accessed April 14, 2005].
Harris JM. 2002. Food manufacturing. In: Harris J, Kaufman P, Martinez S, Price C. 2002.The U.S. Food Marketing System, 2002. Agricultural Economic Report No. (AER811).Washington, DC: Economic Research Service, U.S. Department of Agriculture. Pp. 3–11. [Online]. Available: http://www.ers.usda.gov/publications/aer811/aer811.pdf [ac-cessed May 2, 2005].
Harris JM. 2005. Companies continue to offer new foods targeted to children. AmberWaves 3(3):4. [Online]. Available: http://www.ers.usda.gov/AmberWaves/June05/pdf/FindingsDHJune05.pdf [accessed June 6, 2005].
Harrison K, Marske AL. 2005. Nutritional content of foods advertised during the televisionprograms children watch most. Am J Public Health 95(9):1568–1574.

FOOD AND BEVERAGE MARKETING TO CHILDREN AND YOUTH 217
Hastings Museum of Natural and Cultural History. 2004. Hey Kool-Aid®! [Online]. Avail-able: http://www.hastingsmuseum.org/koolaid/history.htm [accessed June 11, 2005].
Henderson VR, Kelly B. 2005. Food advertising in the age of obesity: Content analysis offood advertising on general market and African American television. J Nutr Educ Behav37:191–196.
Henry A. 2003. How buzz marketing works for teens. Advertising & Marketing to Children.World Advertising Research Center. Pp. 3–10.
Hind A. 2003. Brands for the under-3s: Teletubbies, a case study. Advertising & Marketingto Children. World Advertising Research Center. Pp. 25–33.
Holt DB. 2004. How Brands Become Icons: The Principles of Cultural Branding. Boston,MA: Harvard Business School Press.
Hostess. 2005. Planet Twinkie. [Online]. Available: http://www.twinkies.com/index.asp [ac-cessed May 8, 2005].
Hunter BT. 2002. Marketing foods to kids: Using new avenues. Consumers’ ResearchPp. 23–25.
Information Resources. 2005. Time and Trends: A Snapshot of Trends Shaping the CPGIndustry. [Online]. Available: http://www.gmabrands.com/publications/gmairi/2005/may/may.pdf [accessed June 20, 2005].
IN ZONE Brands. 2004. Tummy Tickler Products. [Online]. Available: http://www.tummytickler.com/products.htm [accessed June 20, 2005].
IOM (Institute of Medicine). 2005. Preventing Childhood Obesity: Health in the Balance.Washington, DC: The National Academies Press.
Ippolito PM. 2005. TV Advertising to Children 1977 v. 2004. Presentation at the DHHS-FTCWorkshop about Perspectives on Marketing, Self-Regulation, and Childhood Obesity.July 14–15. [Online]. Available: http://www.ftc.gov/bcp/workshops/foodmarketingtokids/index.htm [accessed July 27, 2005].
Jekanowski MD. 1999. Causes and consequences of fast food sales growth. Food Review.22(1):11–16.
Joyce K. 2004. MMA in the News. PROMO Magazine. [Online]. Available: http://mmaglobal.com/modules/news/print.php?storyid=26 [accessed July 26, 2005].
JP Morgan. 2003. Food Manufacturing. Obesity: The Big Issue. European Equity Research.April 16.
Kaikati AM, Kaikati JG. 2004. Stealth marketing: How to reach consumers surreptitiously.University of California, Berkeley: California Management Review 46(4):6–22.
Karrh JA. 1994. Effects of brand placements in motion pictures. In: King AW, ed. Proceed-ings of the 1994 American Academy of Advertising. Athens, GA: American Academy ofAdvertising.
Kaufman PR. 2002. Food retailing. In: Harris J, Kaufman P, Martinez S, Price C. The U.S.Food Marketing System. Agricultural Economic Report No. (AER811). Washington,DC: Economic Research Service, U.S. Department of Agriculture. [Online]. Available:http://www.ers.usda.gov/publications/aer811/aer811.pdf [accessed May 2, 2005].
Kelley B, Graham L, Quinn T, Sears B. 2004. Changes in the Confectionery Industry. 2004All Candy Expo®. [Online]. Available: http://www.allcandyexpo.com/industry_forum.cfm [accessed June 16, 2005].
KFF (Kaiser Family Foundation). 2004. Tweens, Teens and Magazines Fact Sheet. [Online].Available: http://www.kff.org/entmedia/loader.cfm?url=/commonspot/security/getfile.cfm&PageID=47098 [accessed May 3, 2005].
Kotler P, Armstrong G. 2004. Principles of Marketing. 10th Edition. Upper Saddle River, NJ:Pearson Education/Prentice Hall.
Kotz K, Story M. 1994. Food advertisements during children’s Saturday morning televisionprogramming: Are they consistent with dietary recommendations? J Am Diet Assoc94(11):1296–1300.

218 FOOD MARKETING TO CHILDREN AND YOUTH
Kraft Foods. 2004. Form 10-K Annual Report for the Fiscal Year Ended December 31, 2004.[Online]. Available: http://kraft.com/pdfs/KraftAR04_10K.pdf [accessed June 6, 2005].
Kraft Foods. 2005a. Our Products: Lunchables®. [Online]. Available: http://www.kraftfoods.com/om/bn/c_Products/Lunchables.htm [accessed June 3, 2005].
Kraft Foods. 2005b. Kool-Aid Man. [Online]. Available: http://www.kraft.com/100/innova-tions/koolaidman.html [accessed June 11, 2005].
Kraft Foods. 2005c. Kraft Foods announces marketing changes to emphasize more nutri-tious products. [Online]. News Release. January 12. Available: http://www.kraft.com/newsroom/01122005.html [accessed September 21, 2005].
Kraft Foods. 2005d. Kraft Foods announces healthy lifestyle initiatives at California summiton health, nutrition and obesity. News Release. January 12. [Online]. Available: http://www.kraft.com/newsroom/09152005.html [accessed September 22, 2005].
Kraft Foods. 2005e. Obesity Initiatives. [Online]. Available: http://www.kraft.com/obesity/advisory.html [accessed November 15, 2005].
Kunkel D. 2001. Children and television advertising. In: Singer D, Singer J, eds. Handbook ofChildren and the Media. Thousand Oaks, CA: Sage.
Kunkel D, Gantz W. 1992. Children’s television advertising in the multi-channel environ-ment. J Commun 42(3):134–152.
Kunkel D, Gantz W. 1993. Assessing compliance with industry self-regulation of televisionadvertising to children. J Applied Communication 21(2):148–162.
Kunkel D, McIlrath M. 2003. Message content in advertising to children. In: Palmer E,Young B, eds. Faces of Televisual Media: Teaching, Violence, Selling to Children. Mah-wah, NJ: Erlbaum Associates. Pp. 287–300.
Kuribayashi A, Roberts MC, Johnson RJ. 2001. Actual nutritional information of productsadvertised to children and adults on Saturday. Children’s Health Care 30(4):309–322.
Lauro PW. 2002. Swanson focuses on its new, fashionable TV dinner. The New York TimesOctober 30. [Online]. Available: http://inventors.about.com/od/inventionsalphabet/a/tv_dinner.htm [accessed May 8, 2005].
Lawrence D. 2003. The role of characters in kids marketing. Advertising & Marketing toChildren. World Advertising Research Center. 4(3):43–48.
Lenhart A, Rainie L, Lewis O. 2001. Teenage Life Online: The Rise of the Instant-MessagingGeneration and the Internet’s Impact on Friendships and Family Relationships. PewInternet & American Life Project. [Online]. Available: http://www.pewinternet.org/pdfs/PIP_Teens_Report.pdf [accessed July 9, 2005].
Lewis LB, Sloane DC, Nascimento LM, Diamant AL, Guinyard JJ, Yancey AK, Flynn G.2005. African Americans’ access to healthy food options in South Los Angeles restau-rants. Am J Public Health 95(4):668–673.
Linn S. 2004. Food marketing to children in the context of a marketing maelstrom. J PublicHealth Policy 25(3/4):24–35.
Lippman J, McKay B. 2001. Warner Bros. choose Coke to bestow marketing magic on HarryPotter film. Wall Street Journal. P. A3.
Lukas C. 2000. The Oreo Cookie Counting Book. New York: Little Simon.Mack A. 2004. Gaming scores with advertisers. Media Week 14(26):18–20.Marketing Intelligence Service. 2005. ProductScan® Online Database of New Products.
[Online]. Available: http://www.productscan.com [accessed April 30, 2005].Mattel. 2001. Barbie® Doll Puts on Another Famous Uniform to Serve Up Smiles. [On-
line]. Available: http://www.shareholder.com/mattel/news/20010501-43068.cfm [ac-cessed June 5, 2005].
Mattel. 2005. Barbie® Collector. [Online]. Available: http://www.barbiecollector.com [ac-cessed June 5, 2005].
Mazur L. 1996. Marketing madness. Environ Magazine 7(3):36–41.
FOOD AND BEVERAGE MARKETING TO CHILDREN AND YOUTH 219
McCarthy M. 2005. Disney plans to mix ads, videogames to target kids, teens. USA Today.[Online]. Available: http://usatoday.com/money/media/2005-01-17-disney-advergaming_x.htm [accessed March 15, 2005].
McDonald’s Corporation. 1996. The power of our global brand. In: 1996 Summary AnnualReport. [Online]. Available at: http://www.mcdonalds.com/corp/invest/pub/annual_rpt_archives/1996_annual.html [accessed April 11, 2005].
McDonald’s Corporation. 2003. McDonald’s™ introduces new McKIDS™ multi-category,worldwide licensing program. News Release. [Online]. Available: http://www.media.mcdonalds.com/secured/news/pressreleases/2003/Press_Release11132003.html [accessedJuly 10, 2005].
McDonald’s Corporation. 2004. McDonald’s® Celebrates 25 Years of Happy Meals with theReturn of Ty Teenie Beanie Babies®. [Online]. Available: http://www.mcdonalds.com/usa/news/2004/conpr_07222004.html [accessed July 5, 2005].
McDonald’s Corporation. 2005a. McDonald’s Press Release. [Online]. Available: http://www.mcdonalds.com/usa/news/current/conpr_05042005.html [accessed July 8, 2005].
McDonald’s Corporation. 2005b. Global Advisory Council on Balanced Lifestyles.[Online]. Available: http://www.mcdonalds.com/corp/values/socialrespons/resrecog/expert_advisors0/advisory_council_on.html [accessed July 8, 2005].
McGinn D. 2003. Pitching to kids. Boston Globe. [Online]. Available: www.boston.com/globe/magazine/2003/0416/kids.html [accessed February 20, 2005].
McKay B. 2001. Coke finds its exclusive contracts aren’t so easily given up. Wall StreetJournal (Eastern Edition) June 26. Pp. B1, B4.
McNeal JU. 1964. Children as Consumers. Austin: Bureau of Business Research, Universityof Texas at Austin.
McNeal JU. 1998. Tapping the three kids’ markets. Am Demographics 20(4):37–41.McNeal JU. 1999. The Kids Market: Myth and Realities. Ithaca, NY: Strategist.Meltzoff A. 1988. Imitation of televised models by infants. Child Development 59(5):
1221–1229.Mintel International Group Ltd. 2003. Character Merchandising in Food and Drink–UK.
[Online]. Brief summary of full report. Available: http://www.the-infoshop.com/study/mt17377_food_drink.html [accessed June 6, 2005].
Molnar, A. 2003. No Student Left Unsold: The Sixth Annual Report on Trends in School-house Commercialism 2002–2003. [Online]. Available: http://www.asu.edu/educ/epsl/CERU/CERU_Annual_Report.htm [accessed November 19, 2005].
Montgomery K. 2001. Digital kids: The new online children’s consumer culture. In: SingerDG, Singer JL, eds. Handbook of Children and the Media. Thousand Oaks, CA: SagePublications. Pp. 625–650.
Montgomery K, Pasnik S. 1996. Web of Deception. Washington, DC: Center for MediaEducation.
Moore ES, Wilkie WL, Lutz RJ. 2002. Passing the torch: Intergenerational influences as asource of brand equity. J Marketing 66(2):17–37.
Mortimer, R. 2002. Box office brand bonanzas. Brand Strategy 166:25.MPA (Magazine Publishers of America). 1999. Highlights of Sales Scans. [Online]. Available:
http://www.magazine.org/content/Files/Sales%5FScan%5FHighlights.pdf [accessed June20, 2005].
MPA. 2004a. Teen Market Profile. [Online]. Available: http://www.magazine.org/content/files/teenprofile04.pdf [accessed April 24, 2005].
MPA. 2004b. African American Market Profile. [Online]. Available: http://www.magazine.org/content/files/market_profile_black.pdf [accessed June 18, 2005].
MPA. 2004c. Hispanic/Latino Market Profile. [Online]. Available: http://www.magazine.org/content/Files/MPAHispMktPro.pdf [accessed June 17, 2005].

220 FOOD MARKETING TO CHILDREN AND YOUTH
NARC (National Advertising Review Council). 2004. Guidance for Food Advertising Self-Regulation. New York: NARC. [Online]. Available: http://www.narcpartners.org/NARC_White_Paper_6-1-04.pdf [accessed April 10, 2005].
NASSP. 2005. NASSP Guidelines for Beverage-Provider Business Agreements. [Online]. Avail-able: http://www.principals.org [accessed October 27, 2005].
Neal WD. 2005. Principles of Market Segmentation. [Online]. Available: http://www.marketingpower.com/content1006.php# [accessed June 14, 2005].
Nebenzahl ID, Secunda E. 1993. Consumers’ attitudes toward product placement in movies.Int J Ad 12(1):1–11.
Neopets®. 2003. Youth Study 2003. [Online]. Available: http://demo.neopets.com/presskit/articles/research/ym2003.html [accessed July 7, 2005].
Neopets®. 2005. Corporate Fact Sheet. [Online]. Available: http://demo.neopets.com/presskit/compinfo.html [accessed July 3, 2005].
Nestlé. 2004. Nesquik. [Online]. Available: http://www.nestle.com/Our_Brands/Beverages/Nesquik/ [accessed June 6, 2005].
Nestle M. 2000. Soft drink “pouring rights”: Marketing empty calories. Public Health Re-ports 115(4):308–319.
Nestle M. 2002. Food Politics: How the Food Industry Influences Nutrition and Health.Berkeley, CA: University of California Press.
Nestle M, Wing R, Birch L, DiSogra L, Drewnowski A, Middleton S, Sigman-Grant M, SobalJ, Winston M, Economos C. 1998. Behavioral and social influences on food choice.Nutr Rev 56(5):S50–S74.
Nickelodeon. 2005. All Nick TV Shows. [Online]. Available: http://www.nick.com/all_nick/[accessed May 28, 2005].
Nielsen Monitor-Plus. 2005. National Cable Television Advertising Spending (NAN, NICK,TOON, TDSN), Full Day. January 1, 2003–December 31, 2004.
NRA (National Restaurant Association). 2005. Restaurant Industry Fact Sheet 2005. [Online].Available: http://www.restaurant.org/pdfs/research/2005factsheet.pdf [accessed June 15,2005].
Office of the Clerk, U.S. House of Representatives. 2004. Alliance for American AdvertisingHouse ID Numbers. [Online]. Available: http://clerk.house.gov/pd/houseID.html?reg_id=37455 [accessed July 27, 2005].
Ordonez J. 2001. Burger King pairs with DreamWorks and Nickelodeon. Wall Street Journal.P. B2.
Palmer E, Cantor J, Kunkel D, Dowrick P, Linn S, Wilcox B. 2004. Psychological Implica-tions of Commercialism in Schools. Washington, DC: American Psychological Associa-tion Task Force on Advertising and Children.
PBS (Public Broadcasting System) Frontline. 2001. Merchants of Cool. [Online]. Available:http://www.pbs.org/wgbh/pages/frontline/shows/cool/etc/script.html [accessed June 5,2005].
Peleo-Lazar M. 2005. McDonald’s Presentation at the IOM Workshop on Strategies ThatFoster Healthy Food and Beverage Choices in Children and Youth. Committee on FoodMarketing and the Diets of Children and Youth. Washington, DC, January 27.
PepsiCo. 2004a. Sustainable Advantage. Annual Report 2004. [Online]. Available: http://www.pepsico.com/investors/annual-reports/2004/247528PepsicoLR.pdf [accessed July 3,2005].
PepsiCo. 2004b. Blue Ribbon Advisory Board. [Online]. Available: http://www.smartspot.com/commitment_to_health/420.php [accessed July 8, 2005].
Petretti A. 1992. Coca-Cola Collectibles Price Guide. 8th Edition. Hackensack, NJ: NostalgiaPublications.

FOOD AND BEVERAGE MARKETING TO CHILDREN AND YOUTH 221
Pinnacle Foods Corporation. 2003. Swanson 50th Anniversary Celebration. [Online]. Avail-able: http://www.swansonmeals.com/50th/ [accessed May 6, 2005].
Plunkett Research Ltd. 2005. Food Industry Almanac 2005. Brief Summary. [Online]. Avail-able: http://www.mindbranch.com/products/R207-0054.html [accessed September 21,2005].
Pollack Associates. 2003. Special Report: 2003. Supermarkets: Brands & Private Label.New York, NY. [Online]. Available: http://www.supermarketalert.com/pdf%20docs/3BrandsPriLabel.pdf [accessed September 16, 2005].
Pollack Associates. 2004. Special Report: 2004. Private Label & Branding. New York.[Online]. Available: http://www.supermarketalert.com/pdf%20docs/04specrptsfr03/4prilabel-web.pdf [accessed September 16, 2005].
Powell K. 2005. Fostering Healthy Choices. Presentation at the IOM Workshop on Strategiesthat Foster Healthy Food and Beverage Choices in Children and Youth. Committee onFood Marketing and the Diets of Children and Youth. Washington, DC, January 27.
PQMedia. 2005. Product Placement Spending in Media 2005: Executive Summary. [On-line]. Available: http://www.pqmedia.com/product-placement-spending-in-media.html[accessed June 10, 2005].
Preschel S. 2005. Backpacks, Lunch Boxes and Cells? . . . Nearly Half of U.S. Teens andTweens Have Cell Phones, According to NOP World mKids Study. New York. [Online].Available: http://www.nopworld.com/new.asp?go=news_item&key=151 [accessed July26, 2005].
Pressler MW. 2005. Hold the health, serve that burger: Restaurant chains find low-fat meanslean sales. Washington Post. August 18.
Prichard J. 2003. Kellogg’s popular, pioneering Pop-Tarts turn 40 this year. The DetroitNews. [Online]. Available: http://www.detnews.com/2003/business/0304/06/business-128483.htm [accessed June 5, 2005].
PRIMEDIA Business Magazines & Media. 2004. DreamWorks Brings Back Partners forSinbad DVD. [Online]. Available: http://promomagazine.com/deals/marketing_dreamworks_brings_back/ [accessed July 7, 2005].
QuickMBA. 2004. Market Segmentation. [Online]. Available: http://www.quickmba.com/marketing/market-segmentation/ [accessed June 14, 2005].
Radio Disney. 2005. Radio Disney. [Online]. Available: http://radio.disney.go.com/music/projectfamily/ [accessed July 7, 2005].
Red Herring. 2005. Brand-name companies have caught on to the interactive power of mo-bile phone marketing. Is it a new advertising medium, or just glorified spam? [Online].Available: http://www.redherring.com/PrintArticle.aspx?a=12506§or=Industries [ac-cessed July 26, 2005].
Rideout V, Hoff T. 2002. Shouting to Be Heard: Public Service Advertising in a New MediaAge. Menlo Park, CA: Henry J. Kaiser Family Foundation.
Rideout VJ, Vandewater EA, Wartella EA. 2003. Zero to Six: Electronic Media in the Lives ofInfants, Toddlers and Preschoolers. Menlo Park, CA: Henry J. Kaiser Family Foundation.
Rideout V, Roberts DF, Foehr UG. 2005. Executive Summary: Generation M: Media in theLives of 8–18 Year Olds. Menlo Park, CA: Henry J. Kaiser Family Foundation.
Ritzer G. 2004. The McDonaldization of Society. Thousand Oaks, CA: Sage Publications,Inc.
Roberts D, Foehr U. 2005. Kids and Media in America. Cambridge, UK: Cambridge Univer-sity Press.
Roberts D, Foehr U, Rideout V, Brodie M. 1999. Kids and Media @ the New Millennium: AComprehensive National Analysis of Children’s Media Use. Menlo Park, CA: KaiserFamily Foundation.

222 FOOD MARKETING TO CHILDREN AND YOUTH
Roberts DF, Foehr UG, Rideout V. 2005. Generation M: Media in the Lives of 8–18 YearOlds. Menlo Park, CA: Henry J. Kaiser Family Foundation.
Roberts K. 2004. Lovemarks: The Future Beyond Brands. New York: PowerHouse Books.Roper Youth Report. 2003. American Youth Wielding More Household Buying Power. New
York. [Online]. Available: http://www.nopworld.com/news.asp?go=news_item&key=59 [accessed April 11, 2005].
Rubin R. 2004. Kids vs. Teens: Money and Maturity Guide Online Behavior. eMarketer.[Online]. Available: http://www.emarketer.com/Report.aspx?kids_may04 [accessed No-vember 21, 2005].
Samuels SE, Craypo L, Dorfman L, Purciel M, Standish MB. 2003. Food and BeverageIndustry Marketing Practices Aimed at Children: Developing Strategies for PreventingObesity and Diabetes. A report on the proceedings from a meeting sponsored by TheCalifornia Endowment held in San Francisco in June 2003.
Scammon DL, Christopher CL. 1981. Nutrition education with children via television: Areview. J Advertising 19(2):26–36.
Schlosser E. 2001. Fast Food Nation. New York: Houghton Mifflin Company.Schor JB. 2004. Born to Buy: The Commercialized Child and the New Consumer Culture.
New York: Scribner.Short D. 2005. When science met the consumer: The role of industry. Am J Clin Nutr
82(suppl):256S–258S.Siegel DL, Coffey TJ, Livingston G. 2001. The Great Tween Buying Machine. Ithaca, NY:
Paramount Market Publishing, Inc.Skyworks Technologies. 2004. Life Savers Candystand. [Online]. Available: http://candystand.
com [accessed July 10, 2005].Smalls M. 2005a. Moving the Needle. Presentation at the IOM Workshop on Strategies that
Foster Healthy Food and Beverage Choices in Children and Youth. Committee on FoodMarketing and the Diets of Children and Youth. Washington, DC, January 27.
Smalls M. 2005b. Current Media Efforts to Foster Healthier Choices for Children. Presenta-tion at the DHHS-FTC Workshop about Perspectives on Marketing, Self-Regulation,and Childhood Obesity. July 14–15. [Online]. Available: http://www.ftc.gov/bcp/work-shops/foodmarketingtokids/index.htm [accessed July 27, 2005].
Smith JW, Clurman A, Wood C. 2005. Coming to Concurrence: Addressable Attitudes andthe New Model for Marketing Productivity. Evanston, IL: Racom Communications.
Snider M. 2002. Hey kids! Let’s play adver-games! Maclean’s 115(51):36–37.Stanley T. 2004. Marketers aim for parents via TV. Advertising Age 75(40):75.Stewart H, Blisard N, Bhuyan S, Nayga RM Jr. 2004. The Demand for Food Away from
Home. Full Service or Fast Food? Agricultural Economic Report No. 829. Washington,DC: Economic Research Service, U.S. Department of Agriculture. [Online]. Available:http://www.ers.usda.gov/publications/aer829/aer829.pdf [accessed September 17, 2005].
Stipp H. 1993. New ways to reach children. Am Demographics 15(8):50–56.Story M, French S. 2004. Food advertising and marketing directed at children and adolescents
in the US. Int J Behav Nutr Phys Act 1(1):3–20. [Online]. Available: http://www.ijbnpa.org/content/1/1/3 [accessed April 11, 2005].
Strasburger VC. 2001. Children and TV advertising: Nowhere to run, nowhere to hide. J DevBehav Pediatr 22(3):185–187.
Subervi-Velez FA, Colsant S. 1993. The television world of Latino children. In: Berry GL,Asamen JK. Children & Television: Images in a Changing Sociocultural World. NewburyPark, CA: Sage Publications.
Subramanyam K, Greenfield P, Kraut R, Gross E. 2001. The impact of computer use onchildren’s and adolescents’ development. J Appl Dev Psychol 22(1):7–30.
Subway. 2005. F.R.E.S.H. Steps Initiative. [Online]. Available: http://www.subway.com/subwayroot/MenuNutrition/index.aspx [accessed October 27, 2005].

FOOD AND BEVERAGE MARKETING TO CHILDREN AND YOUTH 223
Sunkist. 2005. “C” is for Citrus as Sunkist and Sesame Workshop Announce Healthy Habitsfor Life Partnership. [Online]. Available: http://www.sunkist.com/press/release.asp?id=72[accessed November 18, 2005].
Survey Value. 2005. Brand Loyalty. [Online]. Available: http://www.surveyvalue.com [ac-cessed July 12, 2005].
Swinburn BA, Caterson I, Seidell JC, James WPT. 2004. Diet, nutrition and the prevention ofexcess weight gain and obesity. Pub Health Nutr 7(1A):123–146.
Taaffe E. 2005. PepsiCo Health & Wellness: Capturing Growth at the Intersection. Presenta-tion at the IOM Workshop on Strategies that Foster Healthy Food and Beverage Choicesin Children and Youth. Committee on Food Marketing and the Diets of Children andYouth. Washington, DC, January 27.
Taras HL, Gage M. 1995. Advertised foods on children’s television. Arch Pediatr AdolescMed 149(6):649–652.
Tarpley T. 2001. Children, the Internet, and other new technologies. In: Singer D, Singer J,eds. Handbook of Children and the Media. Thousand Oaks, CA: Sage.
Teenage Research Unlimited. 2004. The TRU Study. [Online]. Available: http://www.teenresearch.com/PRview.cfm?edit_id=168 [accessed May 3, 2005].
Teenage Research Unlimited. 2005. Weekly spending. TRU Study Update. [Online]. Avail-able: http://www.teenresearch.com/view.cfm?page_id=87&txt=txt1.cfm&pic=tru1.cfm[accessed September 24, 2005].
Teinowitz I, MacArthur K. 2005. McDonald’s ads target children as young as 4. Governmentfood marketing hearing told of elementary school programs. Advertising Age.com.January 28.
The Coca-Cola Company. 2003. Model Guidelines for School Beverage Partnerships. Atlanta,GA: Coca-Cola Company. [Online]. Available: http://www2.coca-cola.com/ourcompany/hal_school_beverage_guidelines.pdf [accessed July 7, 2005].
The Coca-Cola Company. 2005a. Brand Fact Sheets. [Online]. Available: http://www.virtualvender.coca-cola.com [accessed November 10, 2005].
The Coca-Cola Company. 2005b. Live It! Press Release. [Online]. Available: http://www2.coca-cola.com/presscenter/nr_20050526_americas_liveit.html [accessed October 19,2005].
The Hershey Company. 2005. Company Profile. Available: http://www.thehersheycompany.com/about/profile.asp [accessed October 31, 2005].
The Intelligence Group/Youth Intelligence. 2005. Nickelodeon/Youth Intelligence Tween Re-port 2004. [Online]. Available: http://www.youthintelligence.com/cassandra/cassarticle.asp?cassArticleId=3 [accessed September 16, 2005].
Thomas D. 2004. Teens Driving Mobile Data Market. Operators Should Target Kids, NotBusiness Users, Says Research. Vnunet.com. [Online]. Available: http://www.vnunet.com/articles/print/2125293 [accessed July 26, 2005].
Thompson S. 2004. Kellogg pounces on toddlers. Advertising Age. December 6. P. 1.Tillotson JE. 2004. America’s obesity: Conflicting public policies, industrial economic devel-
opment, and unintended human consequences. Annu Rev Nutr 24:617–643.Tirodkar MA, Jain A. 2003. Food messages on African American television shows. Am J
Public Health 93(3):439–441.Tseng ES. 2001. Content analysis of children’s television advertising today. Austin, TX:
The University of Texas at Austin. Unpublished manuscript. [Online]. Available:http://www.ciadvertising.org/student_account/fall_01/adv392/estseng/ContentAnalysis/ContentAnalysis.html-72k [accessed February 22, 2005].
TTT West Coast. 2002. Cola wars: Britney vs. Christina. News Release. March 29. [Online].Available: http://extratv.warnerbros.com/reframe.html?http://extratv.warnerbros.com/dailynews/pop/03_01/03_29a.html [accessed July 9, 2005].

224 FOOD MARKETING TO CHILDREN AND YOUTH
TV Bureau of Advertising. 2005. [Online]. Available: http://www.tvb.org/nav/build_frameset.asp?url=/rcentral/index.asp [accessed October 27, 2005].
UBS Warburg. 2002. Absolute Risk of Obesity. Global Equity Research. November 27.Upoc. 2002. Snapshot of the U.S. Wireless Market. [Online]. Available: http://www.
genwireless.com/downloads/mobilestatssummary020802.ppt [accessed June 29, 2005].U.S. Census Bureau. 2000. Sex by Single Years of Age (PCT12). [Online]. Available: http://
www.census.gov/census2000/states/us.html [accessed August 26, 2005].U.S. Census Bureau. 2001. National Intercensal Estimates (1990–2000). [Online]. Avail-
able: http://www.census.gov/popest/archives/EST90INTERCENSAL/US-EST90INT-04.html [accessed March 7, 2005].
U.S. Census Bureau. 2004. Annual Estimates of the Population by Sex and Selected AgeGroups for the United States: April 1, 2000 to July 1, 2003. [Online]. Available at:http://www.census.gov/popest/national/asrh/NC-EST2003/NC-EST2003-02.pdf [ac-cessed March 7, 2005].
U.S. Department of Commerce. 2002. A Nation Online: How Americans Are ExpandingTheir Use of the Internet. [Online]. Available: http://www.ntia.doc.gov/ntiahome/dn/html/anationonline2.htm [accessed April 9, 2005].
U.S. Department of Education. 2003. Computer and Internet Use by Children and Adoles-cents in 2001. NCES 2004-014. Washington, DC: National Center for EducationStatistics.
U.S. Department of Labor. 2004. Consumer Expenditures in 2002. Report 974. Washington,DC: U.S. Department of Labor. [Online]. Available: http://www.bls.gov/cex/csxann02.pdf [accessed October 26, 2005].
U.S. Market for Kids’ Foods and Beverages. 2003. 5th edition. Report summary. [Online].Available: http://www.marketresearch.com/researchindex/849192.html#pagetop [ac-cessed May 3, 2005].
Valdés MI. 2000. Marketing to American Latinos: A Guide to the In-Culture Approach. Part1. Ithaca, NY: Paramount Market Publishing, Inc.
Variyam JN. 2005a. The price is right. Amber Waves. February. Pp. 20–27.Variyam JN. 2005b. Nutrition Labeling in the Food-Away-From-Home Sector. Economic
Research Report No. 4. Washington, DC: Economic Research Service, U.S. Departmentof Agriculture. [Online]. Available: http://www.ers.usda.gov/publications/err4/err4.pdf[accessed April 30, 2005].
Verizon Wireless. 2005. Nickelodeon and Verizon Wireless launch Nick Mobile on VCAST, bringing kid TV favorites to Verizon Wireless V CAST phones. News Release.[Online]. Available: http://news.vzw.com/news/2005/05/pr2005-05-05.html [accessedJuly 11, 2005].
Viacom International. 2005. Welcome to Postopia! [Online]. Available: http://www.postopia.com [accessed July 9, 2005].
Wade L. 1998. The Cheerios® Play Book. New York: Little Simon.Walley W. 2002. Taubin has Warner executives raving, “I’m Just Wild about Harry.” Adver-
tising Age 73(12):S10.Walsh D, Gentile D, Gieske J, Walsh M, Chasco E. 2004. Mediawise Video Game Report
Card. [Online]. Available: http://www.mediafamily.org/research/2004_VGRC.pdf [ac-cessed July 7, 2005].
Warner M. 2005. You want any fruit with that Big Mac? The New York Times. February 20.Williams J. 2005a. Advertising of Food and Beverage Products to Children, Teen, and Adult
Multicultural Markets. University of Texas at Austin Working Paper.Williams J. 2005b. Product Proliferation Analysis for New Food and Beverage Products
Targeted to Children 1994–2004. University of Texas at Austin Working Paper.

FOOD AND BEVERAGE MARKETING TO CHILDREN AND YOUTH 225
Williams JD, Tharp MC. 2001. African Americans: Ethnic roots, cultural diversity. In: TharpMC, ed. Marketing and Consumer Identity in Multicultural America. Thousand Oaks,CA: Sage Publications. Pp. 165–211.
Williams W, Montgomery K, Pasnik S. 1997. Alcohol and Tobacco on the Web: New Threatsto Youth. Washington, DC: The Center for Media Education.
Williamson. 2001. Creating a Better Brighter Smarter Internet. Interactive Week 8(39):26–29.Wulfemeyer KT, Mueller B. 1992. Channel One and commercials in classrooms: Advertising
content aimed at students. Journalism Quarterly 69(3):724–742.Yankelovich. 2003. Youth Monitor™. Youth Today: Shaping Tomorrow. Chapel Hill, NC:
Yankelovich Partners, Inc.Yankelovich. 2005. Youth Monitor™. [Online]. Available: http://www.yankelovich.com/prod-
ucts/youth2005_ps.pdf [accessed May 3, 2005].Zywicki TJ, Holt D, Ohlhausen M. 2004. Obesity and Advertising Policy. George Mason
Law and Economics Research Paper No. 04-45. [Online]. Available: http://papers.ssrn.com/sol3/papers.cfm?abstract_id=604781 [accessed June 7, 2005].

226
5
Influence of Marketing on theDiets and Diet-Related Health
of Children and Youth
INTRODUCTION
This chapter identifies and assesses the research on the influence offood and beverage marketing on the diets and the diet-related health of U.S.children and youth. The work of this chapter should be understood withinthe context of what is known about these two areas. Chapter 1 describesthe breadth and complexity of these factors as well as their multidirectionalquality. Chapter 2 discusses the strong evidence that the food and beverageconsumption patterns of U.S. children and youth do not meet recommenda-tions for a health-promoting diet and that an estimated 16 percent areobese. Increasing numbers of children and youth also have a variety ofphysical and psychosocial problems associated with diet and weight.
Chapter 3 discusses the various factors that influence young people’sfood and beverage consumption habits. Chapter 4 reviews the ways inwhich young people are targeted for food and beverage marketing of bothproduct categories and new product lines. A substantial proportion of suchmarketing is for high-calorie and low-nutrient foods and beverages. Thecorporate investment in advertising and other marketing practices is aimedat promoting consumer purchases—which are presumably related to con-sumption of the product advertised and the dietary practices and diet-related health profiles of today’s children and youth.
This chapter reviews and assesses the evidence that explores variousaspects of marketing’s influence on the diets and diet-related health of ouryoung people. The three core sections in the middle of the chapter present

INFLUENCE OF MARKETING ON DIETS AND DIET-RELATED HEALTH 227
the results of a systematic evidence review of peer-reviewed literature in thearea. They include enough of the technical and analytic detail to supportthe committee’s findings about the contributions of marketing. Prior tothese three sections are several that explain how the systematic evidencereview was conducted, and following them are sections that address relatedelements such as comparison with other recent reviews and needed re-search. Throughout the chapter, care is taken to consider the role of mar-keting as one of multiple factors influencing diet and diet-related health.
The chapter begins with a description of the systematic evidence reviewundertaken to assess the influence of marketing on the diet and diet-relatedhealth of children and youth, including how it was organized, the criteriaused for including evidence, the dimensions addressed, the coding process,the nature of the evidence examined, and the process used to review thisevidence. This is followed by three sections that present the results of thesystematic evidence review relevant to three relationships: (1) the relation-ship between marketing and precursors of diet, (2) the relationship betweenmarketing and diet, and (3) the relationship between marketing and diet-related health. The role of factors with the potential to moderate these threerelationships is then discussed. Finally, the systematic evidence review andits findings are considered in relationship to the results of other recentreports, and areas for future research are identified. A summary of the keyfindings concludes the chapter.
SYSTEMATIC EVIDENCE REVIEW
The committee conducted a systematic evidence review in order toinvestigate and summarize the empirical evidence that is directly relevantto the core question: What is the influence of food and beverage marketingon the diets and diet-related health of children and youth? The committee’sreview included 123 published empirical studies identified from a set ofnearly 200 in the published literature. Systematic evidence reviews arequalitatively different from meta-analyses or traditional narrative reviews(Petticrew, 2001). Systematic evidence reviews do not involve the statisti-cal synthesis of a set of studies, the technique of meta-analyses, but ratherattempt to reduce the inevitable bias from narrative reviews by developingexplicit and systematic criteria for study inclusion and for assessing thelevel of evidentiary support provided by each study. As a result, systematicevidence reviews sometimes include far fewer studies than traditional nar-rative reviews, but they also typically include more than just randomizedcontrolled trials. For example, this review includes not only many con-trolled experimental studies, but also many observational studies—bothcross-sectional and longitudinal—on the influence of food and beveragemarketing on the diets and diet-related health of children and youth.

228 FOOD MARKETING TO CHILDREN AND YOUTH
In addition to supporting a rigorous assessment of a comparativelylarge body of research, a systematic evidence review is well suited forfinding and describing any major gaps in the existing evidence base. Theinfluence of television advertising intended for children, for example, hasbeen studied fairly extensively by academic researchers. However, the influ-ence of Internet marketing techniques, such as advergaming—developedspecifically for older children and growing rapidly, unlike television adver-tising—has not been the subject of a single peer-reviewed, published aca-demic study. A section at the end of the chapter presents recommendedresearch directions derived largely from the committee’s systematic evi-dence review process.
The Analytic Framework
A five-element causal framework (Figure 5-1) was used in assessing theresearch evidence that related marketing to the diets and diet-related healthof children and youth. These elements relate to the marketing-associatedelements of the overall ecological schematic presented in Chapter 1.
The arrows in this framework are meant to represent potential causalmechanisms by which marketing might affect diet and diet-related health.1
At the outset, the framework was created from the committee’s identifica-tion of likely variables, relationships, and processes if food and beveragemarketing were to have an effect on young people’s diet and diet-relatedhealth. For each of the major elements in the framework, multiple variableswere identified to support the widest possible search for relevant research.As research was identified and reviewed, the framework was revised tobetter reflect what has been studied.
In the resulting framework, the initiating or exogenous factors aremarketing variables. Marketing variables involve the product, such as dif-ferences in product formulation, packaging, or portion size; place, such asplacement of items at eye level on supermarket shelves or availability invending machines, convenience stores, or quick serve restaurants; price,such as the price of healthful food in a school vending machine versus theprice for less healthful options; and promotion, such as television or bill-board advertising. The systematic evidence review focused on marketingintended for young people ages 18 years and younger rather than on theparents of these young people. At the same time, research was includedwhen it addressed marketing techniques that could engage either or both
1The problems of causal inference are discussed in the section on Causal Inference Validitybelow.
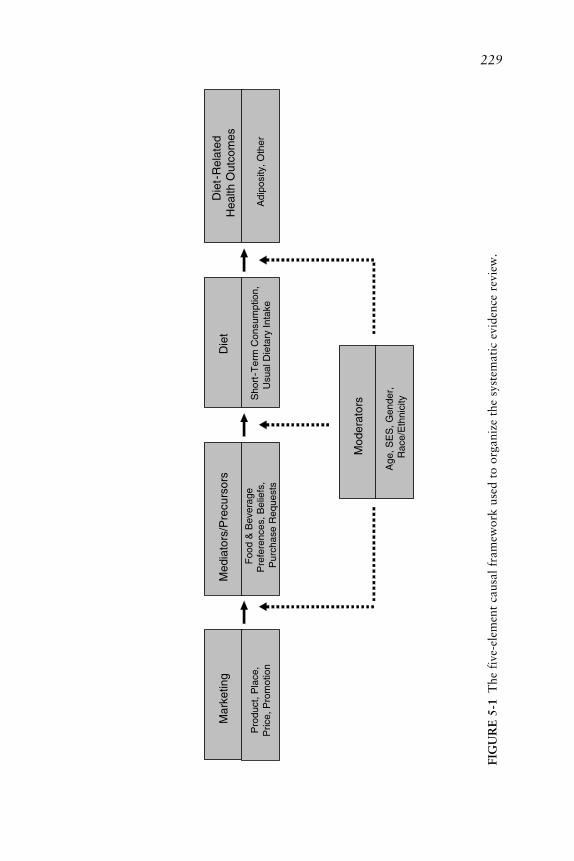
229
Med
iato
rs/P
recu
rsor
s
Foo
d &
Bev
erag
e P
refe
renc
es, B
elie
fs,
Pur
chas
e R
eque
sts
Die
t
Sho
rt-T
erm
Con
sum
ptio
n,U
sual
Die
tary
Inta
ke
Die
t -R
elat
edH
ealth
Out
com
es
Adi
posi
ty, O
ther
Mod
erat
ors
Age
, SE
S, G
ende
r,R
ace/
Eth
nici
ty
Mar
ketin
g
Pro
duct
, Pla
ce,
Pric
e, P
rom
otio
n
FIG
UR
E 5
-1T
he f
ive-
elem
ent
caus
al f
ram
ewor
k us
ed t
o or
gani
ze t
he s
yste
mat
ic e
vide
nce
revi
ew.
230 FOOD MARKETING TO CHILDREN AND YOUTH
young people and their parents (e.g., product placement in a popular moviethat both young people and parents would watch) if the research reportedresults for young people.
Marketing might affect diet through a variety of mediators or precur-sors of diet. In general, a mediator/precursor is a factor through whichcausal influence passes. For example, if watching television increases obe-sity, this influence might be mediated by decreasing physical activity, or itmight be mediated by increasing calorie intake, or by both. In the causalframework in Figure 5-1, mediators/precursors of diet are intended to cap-ture the factors that could be directly affected by marketing and that inturn might have a direct effect on diet, but which themselves do not involvedirectly obtaining or consuming food. For example, television advertise-ments for sweetened cereals aimed at young children are effective whenthey cause the child to make a request to the person who purchases foodfor the family. Thus a common mediator to consuming food or beverageproducts at home is food purchase requests. Other marketing approachesaim to change purchasing behavior through influencing beliefs about whatis “cool” to drink, what provides energy, or what constitutes a balancedbreakfast. Still other marketing efforts seek to influence a child’s prefer-ences for a product through its association with a well-known character,such as Darth Vader or Tony the Tiger®. Of the studies the committeereviewed on the relationship between a specific marketing factor and aprecursor to diet, the great bulk involved food or beverage preferences,beliefs, or purchase requests. Thus the second element in the causal frame-work consists of a family of factors identified as precursors of diet. Thosefactors primarily include food and beverage preferences, beliefs, or pur-chase requests.
The third element in the causal framework is diet. For the committee’stask, diet refers to the distribution and amount of food consumed on aregular basis. Unfortunately, not all studies measured diet comprehensivelyin this way. Many measured some short-term dietary behavior, such as thenumber of pieces of fruit or candy consumed in a child-care setting duringan afternoon following an exposure to television advertising for fruit orcandy that morning. Short-term effects on consumption may or may nottranslate into longer term effects on a young person’s dietary patterns.Thus, it is important to distinguish studies that considered short-term di-etary effects from those that attempted to relate marketing to a more com-prehensive measure of diet. Experimental studies tended to focus on short-term consumption following some controlled exposure; cross-sectional andlongitudinal studies employed broader measures of usual dietary intake,though they rarely assessed diet comprehensively.
The fourth element in the framework is diet-related health such asobesity, the metabolic syndrome, or type 2 diabetes. Nearly all the empiri-

INFLUENCE OF MARKETING ON DIETS AND DIET-RELATED HEALTH 231
cal research relating some marketing factor to diet-related health consid-ered some version of the relationship between direct or indirect measures ofbody fat (adiposity) and television viewing. For simplicity, the term adipos-ity is used in this chapter to encompass the range of measures in the re-search reviewed.
The fifth element in the framework is moderators, variables that mightalter the cause and effect relationships described in the path from marketingto diet-related health. In this domain, the committee identified age, gender,race/ethnicity, socioeconomic status, as well as whether a young person hasthe opportunity to make independent food purchases, can understand thepersuasive intent of advertising, and has accurate nutritional knowledge asa potential moderator.
In general, a moderator is a factor that changes the nature of the causalrelationship between two other factors. In the most extreme and simplecase, the state of a flashlight’s batteries moderates the influence of theswitch on the state of the light. When the batteries are charged, the state ofthe switch fully determines the state of the light. When the batteries aredead, the switch has no effect whatsoever on the light. In another example,genetic or congenital factors moderate the influence of certain drugs ontheir intended outcome. For example, the effect of penicillin is quite differ-ent among those not allergic. Similarly, certain factors might moderate theeffect of marketing on precursors, diet, or diet-related health. For example,the influence of television advertisements on food and beverage preferencesmight be moderated by cognitive development, as indexed by age. Childrenunder about age 8 generally do not understand the persuasive intent ofadvertising or the implications of persuasive intent for the nature of theadvertising they encounter (Blosser and Roberts, 1985; Donohue et al.,1978; Robertson and Rossiter, 1974; Ward et al., 1977). Presumably, theyare more readily influenced by advertising and other forms of marketingthan are children older than about 8 years. Income or socioeconomic statusmight also moderate the effects of marketing on diet. For those in a low-income family, for example, the effect of price might be much stronger thanit is for those in a high-income family. Because foods such as fruits andvegetables cost more per calorie than do French fries or cheeseburgers,socioeconomic status may be an important moderator of the influence offruit and vegetable marketing strategies. In another example, gender maymoderate teens’ reactions to marketing for sweet or high-fat foods andbeverages. By early adolescence, many girls are concerned about their weight(Story et al., 1995) and, assuming that teens know that consuming sweetsand high-fat foods leads to weight gain, they might be more resistant to themarketing of those foods than adolescent boys.
The arrows in the framework are not meant to reflect quantitative

232 FOOD MARKETING TO CHILDREN AND YOUTH
strength, only the possibility of a causal element, and are primarily meantto provide a guide with which to review the relevant research. Nor is theframework meant to be exhaustive. The causal relationships flow only inone direction: from marketing through precursors and so on to diet anddiet-related health. Clearly, however, the variables included in the frame-work might also relate bidirectionally. For example, consumer preferencesfor sweets or high-fat foods can clearly influence marketing strategies,among other things, influencing product formulation or the product quali-ties emphasized in advertising. Or, as another example, public concernabout diet-related health outcomes such as nutritional inadequacies or obe-sity can impact product formulation and advertising claims, such as empha-sizing fortified, low-fat, or whole-grain products. Such bidirectional rela-tionships require more academic research, and their existence underlinesthe dynamic complexities noted in ecological perspective presented in Chap-ter 1.
The framework, then, provides both a causal perspective for the com-mittee’s examination of evidence on the influence of marketing on youngpeople’s diet and diet-related health, and a structure for organizing theempirical research on this topic. Many studies have examined the relation-ship between a marketing factor and a mediator/precursor. Many othersignored mediators/precursors and examined the relationship between amarketing factor and a measure of diet, and still others ignored precursorsand diet, but examined the relationship between a marketing factor andsome aspect of diet-related health. The analysis of the evidence presentedlater in this chapter is organized along these lines: evidence for a causalconnection between marketing and mediator/precursor factors first, thenevidence for a causal connection between marketing and diet, and finally,evidence for a causal connection between marketing and diet-related health.
Identification of Research for the Review
Unlike narrative reviews, a systematic evidence review includes explicitcriteria for which studies to include and which to exclude. In establishingthese criteria, the committee sought to create a body of evidence that wouldbe both extensive and directly relevant to its charge of assessing the effectsof food and beverage marketing on the diets and diet-related health ofchildren and youth. The committee identified four distinct foci of existingresearch: industry and marketing sources and peer-reviewed literature; mar-keting and television advertising; television advertising and media use; andmarketing of products other than foods and beverages. These had implica-tions for the criteria used to determine what research was included in thesystematic evidence review.

INFLUENCE OF MARKETING ON DIETS AND DIET-RELATED HEALTH 233
Industry and Marketing Sources and Peer-Reviewed Literature
Marketing research is carried out by many different people and organi-zations for many different purposes. For ease of discussion, the committeecharacterized them broadly into two categories: industry and marketinginformation and peer-reviewed literature. There are some notable differ-ences between them. A large amount of industry and marketing informa-tion related to foods and beverages promotion to children and youth is notpublicly available, but peer-reviewed literature is in the public domain.Additionally, industry and marketing sources usually focus on specificproducts or brands, often in comparison to other product categories orbrands, whereas peer-reviewed literature is usually directed at understand-ing the marketing process and related effects across a wide range of prod-uct categories.
Marketing and Television Advertising
A large amount of the research about the effect of marketing on youngpeople’s diet and diet-related health examines food and beverage advertis-ing on television. This might be explained by three realities:
1. Advertising is the most visible and measurable component of pro-motion, one of the classic four marketing practices, the others being prod-uct, place, and price;
2. Advertising consumes a substantial and specific portion of a firm’smarketing budget; and
3. Of all food and beverage advertising encountered by children andadolescents, the majority occurs when they are viewing broadcast televisionand cable television programs.
Understanding the effects of televised advertising in today’s food andbeverage marketing on young people’s diets and diet-related health contrib-utes substantially to understanding the effects of broader marketing. Fullerunderstanding would come with research on other types of promotion inaddition to advertising, other venues for advertising in addition to televi-sion and cable television, and other types of marketing in addition to pro-motion (i.e., product, place, and price). The marketing arena is complexand ever changing (see Chapter 4). Considerable work is still needed todevelop a full understanding of marketing’s current role, its likely futurerole, and important options for enhancing its positive role in influencingyoung people’s diet and diet-related health. For the systematic evidencereview, the committee established criteria that included all forms of market-
234 FOOD MARKETING TO CHILDREN AND YOUTH
ing in all venues and vigorously searched for research about marketingother than television advertising.
Television Advertising and Media Use
A number of research studies deliberately use overall amount of televi-sion viewing time (primarily at home) as a measure of overall exposure totelevision advertising, on the assumption that advertising is a part of virtu-ally all television viewing. Measuring home viewing assesses naturally oc-curring behavior and aggregates it over the many hours a day every day thatmost young people are watching television. Along with these benefits ofmeasuring overall viewing come various measurement and inference chal-lenges. In assessing the evidence on marketing’s effects, attention was givento the extent to which the measurement and inference problems were ad-dressed when overall television viewing was used intentionally to assessoverall exposure to television advertising.
A number of other studies consider overall amount of television view-ing per se as an independent variable, particularly in relationship to adipos-ity. Many are not explicit about the exact mechanisms by which televisionviewing relates to adiposity or they discuss several different possibilities,often but not always including exposure to advertising for foods and bever-ages. For example, some of the studies specify that a measure of televisionviewing is meant to reflect absence of physical activity. The committeeestablished criteria by which all such studies could be included in the evi-dence base. In these studies, if a relationship was found between televisionviewing and the outcome of interest, such as adiposity, the reason for therelationship had several plausible explanations for it. Exposure to advertis-ing is one. The committee’s task was to determine for each study of thistype whether there was good support for arguing that the relationship oftelevision viewing to the outcome was, indeed, attributable in some degreeto exposure to advertising during viewing.
Marketing of Products Other Than Foods and Beverages
There is a substantial body of research on the effect of marketingproducts other than foods and beverages to children and youth. In gen-eral, this research indicates that marketing can influence young people’sbeliefs, actions, and preferences. Much of the research has focused ontelevision advertising for toys, but it has also included work on advertisingfor cigarettes and alcohol, as well as other products and services. A discus-sion of some of this body of research is included elsewhere in the report,but it was not formally evaluated by the committee for the systematic

INFLUENCE OF MARKETING ON DIETS AND DIET-RELATED HEALTH 235
evidence review because it does not directly assess the effects of food andbeverage marketing.
Final Criteria for Research Included in the Systematic Evidence Review
Based on considerations such as these, the committee’s review waslimited to publicly available, scientific studies involving quantitative dataon the relationship between (1) a variable involving marketing relevant toyoung people ages 18 years and younger, and (2) either a variable involvinga mediator/precursor, or a variable involving diet, or a variable involvingdiet-related health.2 Studies that only considered the effect of a moderatorvariable and had no data pertinent to the relationship between a marketingvariable and a precursor, diet, or diet-related health variable were notincluded. For example, if a study examined the effect of income on attitudestoward fruit and vegetables and had no measure of a marketing variablesuch as price or placement, then it was not included. Any study that met theinclusion criteria and employed measures that could be interpreted as as-sessing a marketing variable was included, whether or not the researchersintended the measure to represent that variable. For example, studies wereincluded that used amount of television exposure as the independent vari-able, or that used attending a high school with Channel One programs (aspecially produced high school news program that includes food and bever-age advertisements) and examined precursors, diet, or diet-related health.
The criteria for a study to be included in the committee’s systematicevidence review were therefore as follows:
1. Only peer-reviewed, published research that included a full de-scription of methods and results or that directed the reader to anotherpublicly available report that provided the full description of methods. Thisresearch could have appeared in print books and journals or e-books and e-journals.
2. Only research reports written entirely in English.3. Any country as the location for the research.4. Any publication date.5. Only original research, no review articles.6. Only research that reported a quantitative relationship between a
variable involving marketing relevant to young people (as opposed to par-ents only) and a variable involving a mediator/precursor, or diet, or diet-related physical health outcome for young people (as opposed to parents).
2Diet-related health was defined as physical health not psychosocial health.

236 FOOD MARKETING TO CHILDREN AND YOUTH
7. Any research that used an independent variable that could be inter-preted as a measure for some aspect of marketing.
Only published, peer-reviewed research literature was used in this re-view. There are certain constraints in this respect that apply to any litera-ture review of this sort. It is possible, for example, that investigators havenot submitted for publication the results of studies in which the relationshipbetween food and beverage marketing and a pertinent outcome was notstatistically significant. In addition, peer reviewers and journal editors mayhave had a bias to favorably review only those studies in which the resultsare statistically significant. If so, then the published studies represent only asample of all studies that have been done, and this sample is biased in thedirection of statistically significant relationships between food and bever-age marketing and the outcome of interest. However, if such a bias doesexist, the direction of that bias should not be assumed as either an increaseor decrease in the influence of marketing on the measured precursors, diet,or diet-related health.
Although a publication bias is possible in the research reviewed below,the committee considered the bias, if it exists, to be small. As will bedisplayed, nonsignificant results have been published in numerous and di-verse sources. Moreover, an early examination of unpublished theses, dis-sertations, and conference papers revealed relatively few nonsignificant find-ings. Given the importance of the issues, the committee considered itunlikely that well-conceived and well-executed studies were not submittedor were rejected on the grounds that the results were not statisticallysignificant.
Finding the Research
Using the guidelines described above and the many possible variablesidentified with the initial proposed causal framework, extensive and itera-tive searches for relevant literature were conducted. Briefly, the quest in-cluded an online bibliographic search of several databases, outreach toexperts in relevant fields, examining published literature reviews, recourseto committee members’ personal and university libraries, and pursuingreferences cited in articles that were being coded for the systematic evidencereview.
A two-stage process determined whether each item was included in thefinal systematic evidence review. One or more committee members read thetitles and abstracts of more than 200 items and removed any that clearlydid not meet one or more of the inclusion criteria. Many review articles,opinion pieces, studies involving adults only, and studies that did not in-

INFLUENCE OF MARKETING ON DIETS AND DIET-RELATED HEALTH 237
clude a marketing “causal” variable and an “effect” variable that repre-sented a precursor to diet, diet, or diet-related health were removed. Theremaining studies were assigned to two people (drawn from committeemembers and university students commissioned to assist in this process) forcomplete coding. If the two coders subsequently agreed the item did notmeet the inclusion criteria, it was discarded. In the end, the systematicevidence review included 155 research results from 123 studies.
To place this collection of evidence in context, it is helpful to comparethis systematic evidence review of the effects of food and beverage market-ing on children and youth with the previous most extensive effort. Thatwork, commissioned by the U.K. Food Standards Agency, reflected similargoals and identified 55 articles or entries describing 51 relevant studies forsystematic review (Hastings et al., 2003). Building on the base of that work,and applying even more stringent criteria for the publication quality of thestudies reviewed, we have been able to identify and assess an even largerbody of evidence. Hence, this committee’s review of the evidence representsthe most comprehensive and rigorous assessment to date of food and bever-age marketing’s influence on children and youth.
Dimensions of the Review
Each research study that met the committee’s inclusion criteria wasreviewed and then “coded” on several dimensions that were used in thesystematic evidence review for the relationships between the followingfactors:
1. Marketing and a precursor to diet2. Marketing and diet3. Marketing and a diet-related health outcome
If more than one relationship was examined in a published study, aseparate entry in the evidence table was created for each such relationship.In some cases this resulted in multiple results for one study. For example,one study examined four matched schools, two of which had Channel Oneand two of which did not (Greenberg and Brand, 1993). Outcomes mea-sured included the students’ news knowledge, their attitudes toward foodsand beverages advertised by Channel One, and their purchases of foods andbeverages advertised by Channel One. For the committee’s purposes, stu-dent news knowledge was dropped from further consideration, and twoentries for the evidence table were created: one representing results for aprecursor study of the relationship between Channel One television adver-tising and food and beverage preferences, and one representing results for a

238 FOOD MARKETING TO CHILDREN AND YOUTH
diet study of the relationship between Channel One television advertise-ments and usual dietary intake as measured by recent food and beveragepurchases.
There were also three other circumstances under which a single publi-cation could contribute more than one result to the evidence table. If apublication reported more than one complete study, each study was repre-sented by at least one result in the evidence table even if each study ad-dressed the same relationship. If a publication employed two or more en-tirely different samples to test the same question (not to test whether thesamples were different), each sample was entered separately into the evi-dence table. Finally, if a publication utilized different research methods(e.g., both cross-sectional and longitudinal in a panel design) to test thesame question, results from each method were entered separately into theevidence table.
Other variations that could have been treated as separate entries in theevidence table were instead incorporated into a single entry. If multiplemeasures were used in a study to examine a putative result of marketing,then the different measures were described, but only one result—precursorto diet, diet, or health (diet-related health outcome)—was entered into theevidence table. For example, if both skinfold thickness and body massindex (BMI) were used as measures assessing an influence of televisionadvertising, then the entry into the evidence table was “health.” If theresearch participants came from different age groups from among infantsand toddlers, younger children, older children, and teens, the groups weredescribed within one result. If outcomes varied for different subgroups ordifferent measures, they were also described within one result. In assessingthe research evidence, it was at times appropriate to consider differencessuch as these; for example, the relationship of advertising to diet should beexamined separately for children and teens. In these cases, the number ofitems considered in the data tables will be larger than the total number ofresults in the systematic evidence review table.
Each result in the evidence table was identified by author(s) and publi-cation date of the item in which the result appeared. Its basic characteristicswere then coded, three ratings were judged, a mini-abstract was written,and any coder comments were added. Coding the basic characteristics andrating the relevance of the research to the committee’s purposes are de-scribed in the next two sections.
Coding the Basic Characteristics
The marketing factor studied was recorded as the “cause” variable, andthe precursor, diet, or diet-related health factor studied was recorded as the“effect” variable. For example, in Bao and Shao’s (2002) study of the effect

INFLUENCE OF MARKETING ON DIETS AND DIET-RELATED HEALTH 239
of radio advertisements for the Cheerwine beverage, “radio advertisements”was recorded as the cause variable, and in the Storey et al. (2003) study ofthe effect of television viewing on obesity, “obesity” was recorded as theeffect variable. If the putative cause variable was television advertising andit was measured by overall television viewing, a special note was made inthe coding.
The methods by which the cause and effect variables were measuredwere also recorded. For example, in Yavas and Abdul-Gader (1993), thecause variable was television advertisements, and its measure was “self-reported average number of advertisement breaks seen each evening.” Itseffect variable was food purchase requests, and its measure was “self-reported frequency of advertised product requested (Likert-scale).” In theStorey et al. (2003) study of the effect of television viewing on obesity,obesity was measured by BMI calculated from self-reported height andweight, whereas in the Stettler et al. (2004) study, obesity was measured byBMI calculated from physical measures of height and weight taken by atrained technician and by skinfold thickness measured by the technician invarious parts of the body. During assessment of the evidence from the bodyof research in the systematic evidence review, the cause and effect variableswere placed into a small number of conceptual categories, and these wereadded into the final evidence table.
The kind of research study design was coded. For example, some stud-ies were experiments, a few were natural experiments, many were cross-sectional (observational) studies, and some were longitudinal studies. Alsocoded were the sample size of the study, the age group(s) of the youngpeople studied, and whether the relationship between the marketing vari-able and the effect variables was statistically significant at the 0.05 level orbetter. For all statistically significant results, the relationship was in theexpected direction and so not explicitly coded.
Rating the Relevance of the Evidence
Relevance of the evidence for the committee’s tasks was assessed ashigh, medium, or low on three key dimensions: (1) the strength of theevidence for a causal relationship between a marketing variable and anoutcome precursor, diet, or diet-related health variable (causal inferencevalidity), (2) the quality of the measures used in the study, and (3) thedegree to which the results in the study generalize to everyday life (ecologi-cal validity).
These criteria are not meant to assess the scholarly quality of the re-search reviewed. It was assumed that the peer-review process screened forthis in order for the work to be published. A large, longitudinal study oftelevision viewing and obesity might be designed and executed with impec-

240 FOOD MARKETING TO CHILDREN AND YOUTH
cable care, but because the researchers were interested in establishing anassociation rather than a cause–effect relationship, its relevance to thecommittee’s purpose—which prioritizes the ability to make causal infer-ences—would result in a low rating on causal inference validity. Similarly,a carefully designed and conducted experiment on advertising and children’sproduct evaluation for two competing brands might be rated high on causalinference validity but, because the experiment was conducted in laboratoryconditions quite different from everyday life, it might be rated low onecological validity. Clearly, such low ratings do not reflect the quality of theresearch conducted; they reflect the relevance of the research to the commit-tee’s charge to assess the effects of food and beverage marketing on youngpeople’s diet and diet-related health. The two relevance ratings, which willbe explained next, both required consideration of the nature and quality ofthe measures. Measure quality was, therefore, also rated, using the samehigh, medium, low system used for the two relevance ratings, and it alsowill be explained below.
Causal Inference Validity Rating. Philosophers, statisticians, economists,epidemiologists, and other social scientists have not yet achieved consensuson the definition of causation, and this debate is likely to go on for sometime.3 Agreement is much more substantial, however, on the issue of causalinference, that is inferring from statistical studies the existence or absenceof a causal relationship between two particular quantities, such as hours oftelevision watched and calories expended from vigorous physical activity.4
3There are two major schools of thought on causation in the statistical literature, a counter-factual account mostly due to Rubin (1974), and an intervention/manipulability account dueto Spirtes et al. (2000) and Pearl (2000). In the counterfactual account, one makes explicit thedifference between the observed value of a response variable and the value that would havebeen observed had an alternative value for treatment been assigned to a given individual. Theassumptions required to make the inference from the data actually observed to the data onewould have seen had every individual been assigned every possible treatment condition is, inthis perspective, the problem of causal inference. See Sobel (1996) for an excellent introduc-tion to the topic from this perspective. In the intervention account, one variable X is a directcause of another Y relative to a system of variables including Z just in case there is some set ofvalues one could hold Z fixed at such that the probability of Y conditional on setting (inter-vening or manipulating) X = x1 is different from the probability of Y conditional on setting X= x2, x1 ≠ x2. In this paradigm, one models a causal system with a directed graph in whicheach edge X → Y represents that X is a direct cause of Y relative to the other variables Z inthe system under study, and many of the problems of causal reasoning can be characterizedqualitatively using such nonparametric graphical formulations. See Spirtes et al. (2004) for anaccount of causal inference from this perspective.
4See, for example, Glymour and Cooper (1999), Holland (1986), Pearl (2000),Robins (1988), Rosenbaum (2002), Rubin (1974), Sobel (1996), Spirtes et al. (2000, 2004),Wasserman (2004).
INFLUENCE OF MARKETING ON DIETS AND DIET-RELATED HEALTH 241
Put another way, accounts of causal inference tend to stress the same pointsregardless of the precise definition of causation utilized.
The evidence for interpreting an association as causal is entirely distinctfrom the evidence used to judge whether an association is statistically sig-nificant. For example, the evidence required for concluding that a statisticalassociation exists between exposure to television advertising and caloriesconsumed is distinct from the evidence required for concluding that anincrease of exposure to television advertising causes an increase in caloriesconsumed. To underscore this distinction, the committee explicitly createdtwo dimensions for each study in the evidence review: one to record whetherthe statistical evidence for an association was significant, and another torecord the evidence for concluding the existence of a causal relation.
The evidence for the existence of a causal relation is a function of thestudy design, the measures used, and the background knowledge that iscredible. The classic design for inferring causation is the randomized ex-perimental trial. Treatment is assigned randomly, and the outcome is mea-sured by some device or person blind to the treatment assigned. If dropoutwas low, or was independent of treatment, and the outcome was measuredvalidly, then the study provides strong evidence for causality. Experimentalstudies on the influence of food and beverage marketing were rated high oncausal inference validity if treatment was assigned randomly, dropout wasnot a factor, and the measures used were valid.
In an observational study, that is, a study in which the treatment, orcause variable, was not assigned but rather just passively observed, anassociation between a putative cause X and a putative effect Y might beexplained in three ways: (1) X is a cause of Y, (2) some third factor (con-founder) is a common cause of both, or (3) Y is a cause of X. The overallassessment of causal inference validity for such studies rides on how con-vincingly the study eliminates possibilities 2 and 3.
Time order between the putative cause and effect is the most commonreason for eliminating the third possibility, and statistically adjusting, orcontrolling, for potential confounders is the most common methodologyfor eliminating the second possibility. To have confidence that statisticalcontrols are adequate, it is important to know both that all importantconfounders were included in the study and, just as importantly, that allimportant confounders were measured with high validity, reliability, andprecision (see below for explanation). Thus, observational studies wererated high on causal inference validity if the measures of the cause andeffect were valid, if all plausible confounders were included and measuredvalidly, reliably, and precisely; and if some reason could be given to elimi-nate the possibility that the observed association was not due to causationopposite to that predicted, that is, the putative effect causing the puta-tive cause.

242 FOOD MARKETING TO CHILDREN AND YOUTH
To summarize, causal inference validity of each result in the evidencetable was scored as high, medium, or low on the basis of the study design,the quality of the measures employed, the drop out rate, the statisticalcontrols used, and the background knowledge available. Because somestudies did not aim to make a case for causality, and others faced extremelydifficult measurement challenges, judgments about causal inference validitydo not and should not coincide with judgments about the scholarly qualityof a study. More detail on the criteria used for rating causal inferencevalidity is provided in the codebook (see Appendix F-1).
Measure Quality Rating. Clearly, measurement figures heavily in thesejudgments. So heavily, in fact, that the quality of measures was explicitlyrated as high, medium, or low for each result entered into the evidencetable. The measures used in each study were rated taking into considerationthree dimensions: validity, reliability, and precision. Validity refers to theextent to which a measure directly and accurately measured what it in-tended to measure. For example, examining grocery store receipts is a validmeasure of food purchased over a week, whereas asking someone to list thefood he or she intends to buy over the next week is not. Reliability assessesthe extent to which the same measurement technique, applied repeatedly, islikely to yield the same results when circumstances remain unchanged. Forexample, measuring a 6-year-old’s cumulative exposure to lead by taking asingle blood sample is highly unreliable; such measurements fluctuate mark-edly from day to day. Chemically determining the concentration of lead indiscarded baby teeth is much more reliable (ATSDR, 2002). Precision refersto the fineness or coarseness of a measure. For example, measuring familyincome in number of dollars is precise, but measuring it as low, medium, orhigh is not.
Ecological Validity Rating. Ecological validity refers to the extent to whicha study’s results are likely to generalize to the naturally occurring world ofmarketing and young people’s diets and diet-related health. An investiga-tion’s research setting might be quite dissimilar to the natural system beingstudied. For example, a study in which 6-year-olds are removed from classand taken to a trailer near their school, shown 7 minutes of commercials,and then asked to make a series of binary choices from photographs ofitem-pairs is low in ecological validity. A study in which mother–child pairsare surreptitiously observed in the supermarket and each food purchaserequest is recorded is more ecologically valid. Also high in ecological valid-ity are studies in which daily television viewing is measured from the use ofviewing diaries or program check-off lists. The measure quality may not behigh but the ecological validity is high because everyday behavior over aperiod of time is being measured.

INFLUENCE OF MARKETING ON DIETS AND DIET-RELATED HEALTH 243
Research on marketing and behavior involves a tension between causalinference validity and ecological validity. Studies that carefully isolate asmall number of causal factors in a laboratory setting tend to be high oncausal inference validity, but low on ecological validity. Studies that ob-serve young people in their natural environment tend to be high on ecologi-cal validity but low on causal inference validity. Rarely do studies scorehigh on both measures.
The Coding Process
Using these dimensions for recording characteristics and for ratingmeasure quality and relevance, the committee constructed an initial code-book and an evidence table. Several iterations of trial coding removedambiguities from the codebook, calibrated and refined the evaluative crite-ria employed, and guided final choices about the set of coding dimensions.The final codebook is available in Appendix F-1.
Two coders were assigned to each article identified as relevant to thecommittee’s purposes. They worked independently and resolved disagree-ments by discussion. If consensus was not readily obtained, other commit-tee members were consulted. After agreement, both coders’ comments onthe article along with an abstract for the piece were included, and the finalcoding results were compiled into an evidence table that could be sorted onany categorical coding dimension (a condensed version of the evidencetable is available in Appendix F-2). Coders were drawn from committeemembers and selected university students commissioned to assist in thisprocess. All received training to ensure consistency in perspectives andprocess. In general, coders agreed with each other. Later reviews of theevidence table suggested that both the recording and rating functions wereexecuted consistently by all coders.
Characteristics and Relevance of Researchin the Systematic Evidence Review
The systematic evidence review is based on results from published origi-nal research about the relationship of commercial food and beverage mar-keting to diet indirectly through mediators (or precursors), to diet directly,and to diet-related health directly. The descriptive and evaluative character-istics for all the results included in the systematic evidence review are pre-sented in Tables 5-1 and 5-2, respectively, according to whether the resultpertained to the relationship of marketing to precursor, marketing to diet,or marketing to diet-related health.
Overall, the results are drawn from many different studies rather thanfrom a few. In total, 123 different published reports of original research

244 FOOD MARKETING TO CHILDREN AND YOUTH
TABLE 5-1 Descriptive Characteristics of Research in the SystematicEvidence Review for the Relationship of Marketing to Precursors of Diet,Marketing to Diet, and Marketing to Diet-Related Health
Marketing Marketingand Precursors Marketing and Diet-Related
Characteristic of Diet and Diet Health
Total Results* 45 36 74Decade Published
1970 6 0 01980 21 10 41990 10 13 252000 8 13 45
Research DesignExperimental 25 10 1Natural experiment 1 3 0Longitudinal 2 2 17Cross-sectional 17 21 56
Age GroupInfants and toddlers (under 2) 0 0 1Younger children (2–5) 23 12 17Older children (6–11) 28 22 58Teens (12–18) 6 10 33
Sample Size0–49 8 4 150–99 10 6 6100–499 24 16 21500–999 1 2 111,000 or more 2 8 35
Type of MarketingTV ads: experimental treatment 24 9 0TV ads: observed in natural setting 0 0 2TV ads: TV viewing only 15 22 56TV ads: TV campaign 2 1 0TV ads: TV viewing and 0 2 16
other media useAll other marketing 4 2 0
Type of OutcomePreferences 27 0 0Purchase requests 14 0 0Beliefs 13 0 0Short-term consumption 0 9 0Usual dietary intake 0 27 0Adiposity 0 0 73Other 1 0 2
NOTE: Other types of marketing for precursors of diet were print ads, radio ads, multimediacampaign, and price and promotion. Other types of marketing for diet were product place-ment in film, and price and promotion. Other outcomes for precursors of diet were perceivedintent and credibility of ads. Other outcomes for diet-related health were cholesterol levelsand cardiovascular fitness.
*One result in the evidence table could be about more than one age group or type ofmarketing.

INFLUENCE OF MARKETING ON DIETS AND DIET-RELATED HEALTH 245
contributed 155 different results to the systematic evidence review. Onaverage, then, each publication accounted for 1.26 results in the evidencetable. Across all three relationships, no single publication accounted formore than two results in the evidence table. When analyses delved intopossible differences by age or by type of outcome, one publication couldcontribute more than two data points if it involved more than one agegroup or type of outcome. As will be discussed later, there is a clear need formore research in several areas. However, any finding that can be drawnfrom the research that has been done to date is based on a diverse set ofstudies conducted by different researchers. This fact enhances the credibil-ity of the results.
The research spans four decades. During that time, issues addressedearly on have also been addressed recently. The first few publications ap-peared in the 1970s, many appeared in the 1980s and 1990s, and manymore have appeared halfway through the 2000s. For any of the threerelationships for which findings can be drawn based on early research,there is also recent research that supports the finding and thereby reducesconcern that earlier results on any of the three relationships might be differ-ent now due to societal changes (e.g., in the nature of food products or ofbeverage advertising).
All three main types of research designs have been used to study the
TABLE 5-2 Evaluative Characteristics of Research in the SystematicEvidence Review for the Relationship of Marketing to Precursors of Diet,Marketing to Diet, and Marketing to Diet-Related Health
Marketing Marketingand Precursors Marketing and Diet-Related
Characteristic of Diet and Diet Health
Total Results 45 36 74Quality of Measures
High 5 10 0Medium 27 14 32Low 13 12 42
Causal Inference ValidityHigh 11 11 1Medium 20 9 18Low 14 16 55
Ecological ValidityHigh 13 24 63Medium 19 10 9Low 13 2 2

246 FOOD MARKETING TO CHILDREN AND YOUTH
direct relationship of marketing to precursors, diet, and diet-related health.For any one relationship, at least two experimental, cross-sectional, andlongitudinal research designs have been employed in sufficient numbers sothat the usual limitations of one design are generally counterbalanced bythe usual strengths of another design. This is true particularly in terms ofthe ability to determine cause and effect relationships (causal inferencevalidity) and to relate research results to phenomena in everyday life (eco-logical validity).
Overall, quality and relevance are reasonably good for the researchincluded in the systematic evidence review. Earlier in this chapter the use ofhigh, medium, and low ratings of measure quality, ability to infer causality,and similarity to everyday life was described. These three ratings were madefor every result for each of the three relationships examined. Consideringthe three rating scales and three relationships together, with one exception,the number of medium and high ratings is greater than or about the same asthe number of low ratings. The one exception is the causal inference valid-ity rating for research on the relationship of marketing to diet-related health.About three-quarters of the results had low causal inference validity. Thus,it was much harder to arrive at findings about the relationship of marketingto diet-related health than it was to arrive at findings for the relationship ofmarketing to precursors of diet or to diet itself.
In social science research in general, it is difficult—but not impos-sible—to achieve in the same study high ability both to determine causeand effect relationships and to relate results to everyday life. It is true aswell in the specific area of the relationship of marketing to the precursorsof diet, the diets of young people, and their diet-related health. In fact, just5 (3 percent) of the 155 results had high ratings for both causal inferencevalidity and ecological validity. Three different high relevance studies(French et al., 2001a; Gorn and Goldberg, 1982; Greenberg and Brand,1993) each contributed one result about the relationship between market-ing and diet, and one (Robinson, 1999) contributed one result about therelationship between marketing and diet and one result about the relation-ship between marketing and diet-related health. Because of this pattern ofrather inverse relevance ratings for causal inference validity and ecologicalvalidity, which is characteristic of research addressing many different so-cial issues, findings must be carefully drawn from all available research,weighing the contribution of each result and the characteristics and rel-evance of the research in which it was reported.
Research samples ranged in size from a low in the 30s to a high of morethan 15,000, with the majority either in the low 100s or more that 1,000.Overall, older children were the most frequently studied, but different agegroups were studied for the three relationships. For the relationship ofmarketing to precursors of diet, most of the research involved younger

INFLUENCE OF MARKETING ON DIETS AND DIET-RELATED HEALTH 247
(ages 2–5 years) and older children (ages 6–11 years), with some work withteens (ages 12–18 years). For the relationship of marketing to diet, most ofthe work involved older children, with quite a bit of work equally withyounger children and teens. For the relationship of marketing to diet-related health, most of the work involved older children, then teens, andthen younger children. The one study with infants and toddlers (under2 years) was in this last area, diet-related health. Because of these variationsin the ages of research participants and the possibility that age might mod-erate the relationships between marketing and precursors, diet, or diet-related health, findings were limited to those age groups for which enoughresearch had been conducted.
Nearly all the research was about television advertising, which is themost prominent and frequent type of marketing young people encounter.Just 6 results (Auty and Lewis, 2004; Bao and Shao, 2002 [2 results];French et al., 2001a; Macklin, 1990; Norton et al., 2000) of the 155 totalwere about any other type of marketing. The main types of outcomes werefood and beverage preferences, purchase requests, and beliefs for the pre-cursors of diet; short-term consumption and usual dietary intake for diet;and adiposity for diet-related health.
Overall the research included in the systematic evidence review was ofsufficient size, diversity, and quality to support the derivation of severalfindings about the influence of marketing, specifically television advertis-ing, on the precursors of children’s and teens’ diet, on their current diet, andon their diet-related health. Following a discussion of how the results in theevidence table were interpreted, the evidence and findings from it will bepresented in three sections, first for the precursors of diet, then for diet, andfinally for diet-related health.
Interpretation of the Results
Many factors were brought into play in deriving findings from thesystematic evidence review. The quantity, variety, and statistical signifi-cance of results and the research from which they came influenced whetherany finding was drawn and how definitive it was held to be. Pertinentresults needed to be available from several different studies conducted bydifferent researchers using different research populations and measures. Apreponderance of pertinent results had to support the finding. In addition,any consistent differences between results supporting and not supportingthe finding had to be taken into account. If a cogent explanation could beprovided for results supporting and not supporting the finding, then thefinding would need to be qualified accordingly.
Because of the committee’s charge, particular attention was given toassessing cause and effect relationships and to establishing the degree to

248 FOOD MARKETING TO CHILDREN AND YOUTH
which such relationships are likely also to occur in everyday life in theUnited States. Useful findings might describe relationships between market-ing and precursors, diet, or diet-related health, without being certain thatone causes the other. Useful findings also might describe cause and effectrelationships, without being certain that they would occur in everyday life.The most useful findings will describe the ways in which various aspects ofmarketing influence various aspects of precursors of diet, diet, or diet-related health, and do so with some confidence that these effects occur inthe everyday lives of our young people.
In deriving findings from the systematic evidence review, the committeeused a three-step process. First, it determined whether there were enoughresearch results from which to derive a finding about a particular topic. Forexample, regarding the influence of televised food and beverage advertisingon children’s and teens’ short-term consumption, the committee concludedthere was enough evidence for both younger and older children, but “anabsence of evidence” for teens. Second, for those topics for which there wassufficient evidence, the committee drew on all aspects of the evidence todecide whether there was a relationship between the marketing variableand the outcome variable. For example, there was sufficient evidence toreach findings about the relationship of televised food and beverage adver-tising on children’s and teens’ usual dietary intake. For younger and olderchildren, on balance, the evidence supported the finding that advertisinginfluenced intake, whereas for teens, on balance, the evidence supported thefinding that advertising did not influence intake. Third, the committeeprovided a sense of the strength of the research support for the finding,using the terms “strong,” “moderate,” and “weak.” For example, for thefindings regarding advertising’s influence on usual dietary intake, there wasmoderate evidence for such influence for younger children (ages 2–5 years),weak evidence for such influence for older children (ages 6–11 years), andweak evidence against such influence for teens (ages 12–18 years).
A rather large number of results in the systematic evidence reviewmeasured everyday television viewing as a means of assessing exposure tofood and beverage advertising on television. This was a deliberate measure-ment choice by many of the researchers who conducted the studies includedin the systematic evidence review for the relationship of marketing to pre-cursors of diet and for the relationship of marketing to diet. In cases re-viewing the relationship of marketing to diet-related health, researchersgenerally did not use television viewing to measure exposure to televisedadvertising. In such studies, television viewing was treated as a measure ofseveral different possible variables, of a sedentary lifestyle, of time awayfrom physical activity, and the like. Nonetheless, the research design, meth-ods, and analyses were essentially the same as those in many studies testing

INFLUENCE OF MARKETING ON DIETS AND DIET-RELATED HEALTH 249
marketing’s influence on precursors of diet and on diet. For this reason, thecommittee included all such research in the systematic evidence review,whether or not the researchers intended their work to be about televisionadvertising.
The committee’s decision to accept that measures of television viewingcould be interpreted as assessing young people’s advertising exposure hadtwo important ramifications. First, studies that relied on estimates of timespent watching television as an indicator of advertising exposure could notfare very well in terms of the rated measurement quality. This stems fromseveral factors, including the possibility that part of any person’s totaltelevision time was devoted to viewing mostly noncommercial program-ming (e.g., public broadcasting) or that some people may leave the roomduring commercials, successfully avoiding exposure to the ads. Despitethese possibilities, broad-based estimates of time spent watching televisionfunction reasonably well to identify an individual’s relative exposure tocommercial messages, as advertising permeates the large majority of televi-sion viewed by most individuals, in particular young people.
A second important ramification of having included these studies in thesystematic evidence review is that the committee must accept the burden ofcarefully considering alternative explanations for any association foundbetween television advertising, measured by television viewing, and precur-sors of diet, diet, or diet-related health. This burden increases as one movesfrom precursors such as requests for foods known to be advertised onprogramming popular with children, to aspects of diet such as short-termchoices for snacks known to be advertised on television, to health issuesrelated to the quality of a young person’s usual diet.
To arrive at findings when television viewing was the measure ofexposure to televised food and beverage advertising, plausible alternativeexplanations had to be generated for each outcome variable and the possi-bility of ruling out these alternatives examined. This was easier when thesame relationship was studied with experimental methods as well as cross-sectional methods. Longitudinal methods were also informative. In addi-tion, research that included methodological and statistical controls foralternative explanations was useful. In the absence of very well-controlledstudies or a body of research that includes experimental as well as cor-relational methods, however, it was hard to draw many findings fromresearch using television viewing as the measure of exposure to televisionadvertising.
Finally, in interpreting the results, the committee kept in mind that dietand diet-related health are complex and multiply determined. There was noexpectation that marketing would be the only influence on diet or diet-related health, nor did it seem likely that marketing would be the majordeterminant of diet or diet-related health. Moreover, people are forgetful

250 FOOD MARKETING TO CHILDREN AND YOUTH
and changeable enough that any limited marketing experience was notexpected to have more than a limited influence. With these realities in mind,the committee looked for all possible effects, including powerful and long-lasting effects on diet and diet-related health, but it also considered smalleffects and short-term effects both reasonable and meaningful.
Overall, the research results included in the systematic evidence reviewwere of sufficient quality, diversity, and scope to support certain findingsabout the influence of marketing, including the overall finding that foodand beverage marketing influences the preferences and purchase requests ofchildren, influences consumption at least in the short term, is a likely con-tributor to less healthful diets, and may contribute to negative diet-relatedhealth outcomes and risks.
Presentation of the Systematic Evidence Review Analysis
The next three sections review in detail the evidence related to each ofthe three specific relationships. They have a similar structure. To begin, theevidentiary base for the relationship between marketing and the relevantoutcome (precursors, then diet, then diet-related health) is considered interms of the descriptive and evaluative characteristics of all significant andnonsignificant results for that relationship. Because the evidence forall three relationships is almost entirely about one form of marketing—advertising distributed via television and cable television—and a limited setof outcomes, any result about a different form of marketing or an infre-quently studied outcome is then removed from the evidentiary base, and themain analysis of the results proceeds. This analysis takes into account theage of the research participants, the kind of outcome, and the causal infer-ence validity for each significant and nonsignificant result. Each sectionends with a summary of the important findings drawn from the availableresearch about the target relationship.
In presenting the results of the systematic evidence review for the threerelationships, the committee has sought to meet the likely interests of read-ers with varying levels of expertise in social science research. Many datatables are presented. The main points to be drawn from the tables are alsodescribed in terms that should be meaningful to all readers. Examples fromthe research are offered to bring life to the work. The text, particularly theintroduction and findings for each of the three sections, should be useful forevery reader. For some, the middle sections, the data tables, the summaryevidence table (available in Appendix F-2), and references should provideenough of the analytic methods and results to support an independentassessment of the committee’s work.

INFLUENCE OF MARKETING ON DIETS AND DIET-RELATED HEALTH 251
SYSTEMATIC EVIDENCE REVIEW OF THE RELATIONSHIPBETWEEN MARKETING AND PRECURSORS OF DIET
This section considers the evidence relevant to the effect of marketingon precursors of diet. In order for food and beverage marketing to influenceyoung people’s diets, one or more of several things need to occur as theresult of marketing. Young people need to become aware of the product orbrand or service. They need to develop some sense that consuming the foodor beverage is desirable, perhaps because they expect it will taste good, givethem energy, cost just a little, be easy to acquire or consume, be fun tohandle, be sold in a fun environment, have a toy in the package, help themfit in with their peers, promote strong bones and teeth, please their parents,or provide some other benefit. They may need to influence their parents,older siblings or friends, or caretakers to purchase the product or brand orto go to the restaurant. In the five-element causal framework (see Figure 5-1), these relationships between marketing and the precursors of diet initiatethe path from marketing to diet and diet-related health, the primary out-comes of interest to the committee.
Evidentiary Base
For the systematic evidence review of the relationship between market-ing and precursors of diet, the evidence table includes 45 results from 42different published research reports. The earliest study was published in1974 and the latest in 2005. Table 5-3 summarizes the descriptive charac-teristics of those studies that reported a statistically significant relationshipbetween any form of marketing and any mediator or precursor, and ofthose that reported a nonsignificant relationship. All significant results showthat more exposure to marketing is associated with greater preference ormore purchase requests for what was advertised or more beliefs like thatpresented via marketing. Virtually all studies in the systematic evidencereview focused on marketing of high-calorie and low-nutrient foods andbeverages, either due to researcher selection for an experiment or due to thepredominant marketing of such products in naturalistic studies. Thus, mostof the systematic evidence review focuses on the effects of marketing high-calorie and low-nutrient foods and beverages. No information is includedthat demonstrates whether the findings would apply to the marketing ofmore healthful foods and beverages (see Chapter 6 for a discussion of socialmarketing campaigns).
All but four of the results involved television advertising, occasionallyusing commercials the researchers had made, often using commercials takenoff the air, and sometimes using a measure of likely exposure to commer-cials as a result of everyday television viewing. For more recent studies,television might include material available via cable television rather than

252 FOOD MARKETING TO CHILDREN AND YOUTH
TABLE 5-3 Descriptive Characteristics of Research on theInfluence of Commercial Marketing on the Precursors, orMediators to Young People’s Diets
Significant NonsignificantCharacteristic Results Results
Total Results* 35 10Decade Published
1970 5 11980 13 81990 9 12000 8 0
Research DesignExperimental 18 7Natural experiment 1 0Longitudinal 2 0Cross-sectional 14 3
Age Group*Younger children (2–5) 17 6Older children (6–11) 21 7Teens (12–18) 6 0
Sample Size0–49 7 150–99 7 3100–499 18 6500–999 1 01,000 or more 2 0
Type of MarketingTV ads: experimental treatment 18 6TV ads: TV viewing only 12 3TV ads: TV campaign 2 0Print ads 0 1Radio ads 1 0Multimedia campaign 1 0Price and promotion 1 0
Type of Precursor*Preferences 19 8Purchase requests 13 1Beliefs 10 3Intent and credibility of advertising 1 0
*One result in the evidence table could be about more than one age groupor type of precursor. For these two characteristics the column totals can bemore than the number of results.
broadcast systems. The remaining four results addressed the influence ofprint advertising (Macklin, 1990), radio advertising (Bao and Shao, 2002),a multimedia advertising campaign (Bao and Shao, 2002), and price andpromotion (Norton et al., 2000). Twenty-three of the results were about

INFLUENCE OF MARKETING ON DIETS AND DIET-RELATED HEALTH 253
younger children (ages 2–5), 28 about older children (ages 6–11), and 6about teens (ages 12–18).
Twenty-seven of the results examined the effects of food and beveragemarketing on young people’s preferences. Most were experiments; somewere cross-sectional designs. As an example of an experiment, Borzekowskiand Robinson (2001) showed two short cartoons to preschoolers, half ofwhom also saw about 2.5 minutes of educational material between the twocartoons and the other half of whom saw 2.5 minutes of ads. All materialhad been broadcast previously on television. The advertisements were forjuice, sandwich bread, donuts, candy, a fast food chicken entrée, snackcakes, breakfast cereal, peanut butter, and a toy. Immediately after viewing,children who saw the advertisements preferred the advertised brand over analternate similar product with similar packaging, even if the advertisedbrand (of donut) was unfamiliar and the alternate was a local favorite.Advertisements varied in effectiveness, and advertisements run twice weremore effective. The advertising effects were the same for boys and girls,children whose home language was English or Spanish, and children withvarying levels of access to media. Parents also reported that television ad-vertising influenced their children’s preferences and purchase requests.
Fourteen of the results examined the effects of food and beverage mar-keting on young people’s purchase requests. Somewhat more than half werecross-sectional designs; the rest were experiments. As an example of across-sectional design, Isler et al. (1987) had mothers of 250 children be-tween ages 3 and 11 years keep detailed diaries for 4 weeks. Weekly in-person or telephone checks were made. For younger and older children,there were small, statistically significant relationships between the amountof television watched and the total number of requests and between theamount of television watched and the number of requests for cereal andcandy; relationships were not significant for fast foods and snack foods, norfor foods such as fruits and vegetables that are advertised infrequently ontelevision. In an experimental study, Stoneman and Brody (1982) had youngchildren view a 20-minute television cartoon with or without advertise-ments for two candy bars, one chocolate drink mix, one brand of grapejelly, and two salty snack chips. Mothers separately viewed the cartoonswithout advertisements and did not know whether their children wereseeing advertisements with the cartoons. Mothers and children then partici-pated in a “separate study” of family shopping for weekly groceries in amini-grocery store. A “clerk,” who was unaware of the nature of the re-search, surreptitiously recorded what happened. Children who had seen thecommercials more often asked for products, whether or not advertised,pointed to them, grabbed them off the shelf, or put them into the grocerycart; they also did so more often for the advertised products. Mothers ofthese children also more often said no, put items back, and offered alterna-

254 FOOD MARKETING TO CHILDREN AND YOUTH
tives to children’s requests. The article does not say whether children whohad seen the commercials ultimately took home more requested productsthemselves.
Thirteen of the results examined the effects of food and beverage mar-keting on young people’s beliefs about foods and beverages. The majoritywas experiments, a few were cross-sectional designs, and one was a longitu-dinal panel study. As an example of a cross-sectional study, Signorielli andStaples (1997) administered questionnaires to about 400 fourth and fifthgraders. Children who viewed more television knew less about which foodsand beverages were healthier, and the significant relationship remainedwhen the effects of gender, race/ethnicity, reading level, parents’ education,and parents’ occupation were all also taken into account. More recently,Harrison (2005) carried out a similar study except that children were mea-sured twice, 6 weeks apart, for beliefs about healthier food choices offeredas pairs. There were two diet food items (fat-free ice cream versus cottagecheese and Diet Coke versus orange juice, with the italicized choice beinghealthier) and four nondiet food items (celery versus carrots, rice cakesversus wheat bread, jelly versus peanut butter, and lettuce versus spinach).Taking into account at time 1, grade, and gender, the more children watchedtelevision at time 1 the less accurate their choices at time 2 for diet foods(both pairs have items likely to be advertised on television) but not for non-diet foods (only one of four pairs has items likely to be advertised ontelevision).
Table 5-4 summarizes the evaluative characteristics of the 45 resultsincluded in the evidentiary base for the relationship between marketing andprecursors of diet. Measurement quality was high for 5 results, medium for27, and low for 13. Eleven of 45 were of high relevance to inferring a causalconnection from marketing to the precursors of diet, 20 were of mediumrelevance, and 14 were of low relevance. The ability to generalize fromthese studies (ecological validity) was generally good. Thirteen studies wereof high ecological validity, 19 medium, and 13 low. A closer examinationof the distribution of significant and nonsignificant results according to therelevance of the research, specifically the ability to make a clear causalinference and the ecological validity, also revealed no difference in rel-evance between the studies reporting significant results and those reportingnonsignificant results (see Table 5-5). As the relevance of the research in-creased (high or medium ratings compared to low), the proportion of sig-nificant results remained high, providing further confidence in evidence-based findings for the influence of marketing on young people’s preferencesfor, purchase requests of, and beliefs about foods and beverages.

INFLUENCE OF MARKETING ON DIETS AND DIET-RELATED HEALTH 255
TABLE 5-5 Relevance Ratings of Research on theInfluence of Commercial Marketing on Precursors, orMediators, to Young People’s Diets
Causal Inference Ecological Significant NonsignificantValidity Validity Results Results
Total Results 35 10High High 0 0
Medium 5 1Low 4 1
Medium High 4 0Medium 5 3Low 6 2
Low High 7 2Medium 4 1Low 0 0
TABLE 5-4 Evaluative Characteristics of Research on theInfluence of Commercial Marketing on the Precursors, orMediators, of Young People’s Diets
Significant NonsignificantCharacteristic Results Results
Total Results 35 10Quality of Measures
High 5 0Medium 21 6Low 9 4
Causal Inference ValidityHigh 9 2Medium 15 5Low 11 3
Ecological ValidityHigh 11 2Medium 14 5Low 10 3
Relationships Between Television Advertising and Precursors of Diet
Given the descriptive characteristics of research about the relationshipof marketing to the precursors of diet, any findings about this relationshipmust be findings about the relationship of television advertising to food andbeverage preferences, purchase requests, and beliefs among children andteens. To create a dataset that only examined these relationships, four

256 FOOD MARKETING TO CHILDREN AND YOUTH
results (from three articles: Bao and Shao, 2002; Macklin, 1990; Nortonet al., 2000) were removed. The overall patterns of descriptive and evalua-tive characteristics and relevance ratings of the remaining 41 results did notchange when results involving marketing other than television advertisingand precursors other than preferences, requests, and beliefs were removed.
Tables 5-6, 5-7, and 5-8 present the distribution of significant and non-significant findings for the relationships of television advertising to foodand beverage preferences, purchase requests, and beliefs, respectively. Foreach outcome, the distribution is examined according to the age of the
TABLE 5-6 Distribution of Significant and Nonsignificant Results byCausal Inference Validity for the Relationship of Television Advertisingto the Food and Beverage Preferences of Younger Children, OlderChildren, and Teens
Younger Children Older Children Teens(2–5 years) (6–11 years) (12–18 years)
Causal Non- Non- Non-Inference Significant significant Significant significant Significant significantValidity Results Results Results Results Results Results
Total Results 7 4 12 5 2 0High 2 1 6 2 0 0Medium 5 2 6 2 2 0Low 0 1 0 1 0 0
TABLE 5-7 Distribution of Significant and Nonsignificant Results byCausal Inference Validity for the Relationship of Television Advertisingto the Food and Beverage Purchase Requests of Younger Children, OlderChildren, and Teens
Younger Children Older Children Teens(2–5 years) (6–11 years) (12–18 years)
Causal Non- Non- Non-Inference Significant significant Significant significant Significant significantValidity Results Results Results Results Results Results
Total Results 9 0 6 0 1 0High 2 0 0 0 0 0Medium 2 0 2 0 0 0Low 5 0 4 0 1 0
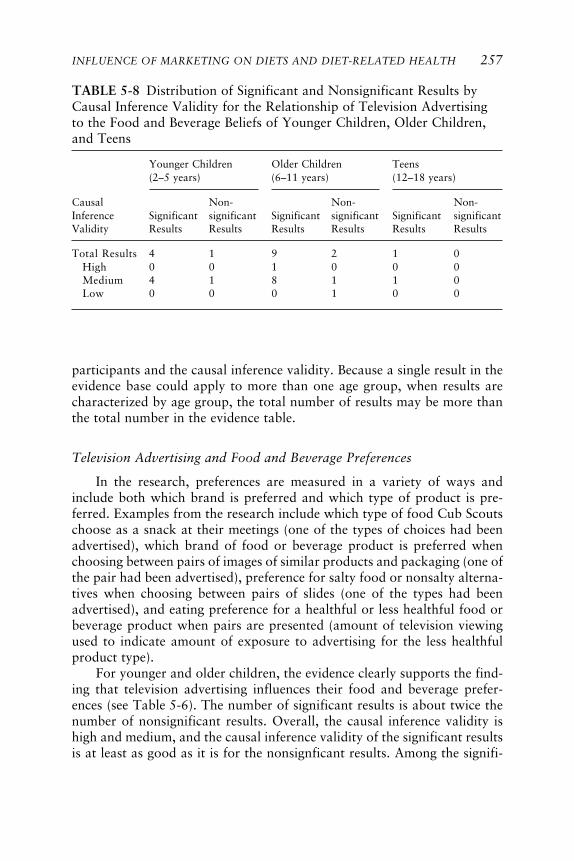
INFLUENCE OF MARKETING ON DIETS AND DIET-RELATED HEALTH 257
participants and the causal inference validity. Because a single result in theevidence base could apply to more than one age group, when results arecharacterized by age group, the total number of results may be more thanthe total number in the evidence table.
Television Advertising and Food and Beverage Preferences
In the research, preferences are measured in a variety of ways andinclude both which brand is preferred and which type of product is pre-ferred. Examples from the research include which type of food Cub Scoutschoose as a snack at their meetings (one of the types of choices had beenadvertised), which brand of food or beverage product is preferred whenchoosing between pairs of images of similar products and packaging (one ofthe pair had been advertised), preference for salty food or nonsalty alterna-tives when choosing between pairs of slides (one of the types had beenadvertised), and eating preference for a healthful or less healthful food orbeverage product when pairs are presented (amount of television viewingused to indicate amount of exposure to advertising for the less healthfulproduct type).
For younger and older children, the evidence clearly supports the find-ing that television advertising influences their food and beverage prefer-ences (see Table 5-6). The number of significant results is about twice thenumber of nonsignificant results. Overall, the causal inference validity ishigh and medium, and the causal inference validity of the significant resultsis at least as good as it is for the nonsignficant results. Among the signifi-
TABLE 5-8 Distribution of Significant and Nonsignificant Results byCausal Inference Validity for the Relationship of Television Advertisingto the Food and Beverage Beliefs of Younger Children, Older Children,and Teens
Younger Children Older Children Teens(2–5 years) (6–11 years) (12–18 years)
Causal Non- Non- Non-Inference Significant significant Significant significant Significant significantValidity Results Results Results Results Results Results
Total Results 4 1 9 2 1 0High 0 0 1 0 0 0Medium 4 1 8 1 1 0Low 0 0 0 1 0 0

258 FOOD MARKETING TO CHILDREN AND YOUTH
cant results are studies measuring the immediate influence of televisionadvertising on preferences and studies measuring longer term influence, aswell as studies indicating that more exposure to advertising is associatedwith greater influence and that affected preferences are for product types aswell as specific brands. Although the results for teens are like those forchildren, the total number is insufficient to support any finding.
Finding: There is strong evidence that television advertising influences thefood and beverage preferences of children ages 2–11 years. There is insuffi-cient evidence about its influence on the preferences of teens ages 12–18 years.
Television Advertising and Food and Beverage Purchase Requests
In the research, purchase requests are measured in a variety of waysand include both which brand is requested and which type of product isrequested. Examples from the research include unobtrusive observations ofmothers and children in a real or simulated grocery store and the childrenasking for a product type or putting it into the grocery cart, children’sreports of whether they would ask their mothers to buy the advertisedbrand of cereal, parents’ reports in interviews or questionnaires of children’spurchase requests, and a 4-week diary by the mother of her child’s productrequests.
For younger and older children, the evidence clearly supports the find-ing that television advertising influences their food and beverage purchaserequests (see Table 5-7). There are only significant results in the evidentiarybase. The causal inference validity for younger children is high, medium,and low; for older children, medium and low. Among the significant resultsare studies measuring the immediate influence of television advertising onpurchase requests and studies measuring longer term influence, as well asstudies indicating that more exposure to advertising is associated withgreater influence and that affected purchase requests are for product typesas well as specific brands.
Finding: There is strong evidence that television advertising influences thefood and beverage purchase requests of children ages 2–11 years. There isinsufficient evidence about its influence on the purchase requests of teensages 12–18 years.
Television Advertising and Food and Beverage Beliefs
In the research, food and beverage beliefs is measured in a variety ofways. Examples include judgments of the fruit content of six cereals and six

INFLUENCE OF MARKETING ON DIETS AND DIET-RELATED HEALTH 259
beverages, rankings of three cereals according to how good they are forchildren, expectations of the taste of advertised food products, judgmentsabout the healthfulness of various foods and beverages, nutritional reason-ing, knowledge of the variety of flavors for a product, descriptions of ahealthful breakfast, and identification of healthful breakfasts from a rangeof options. In most of these studies the beliefs measured are those conveyedby advertisements for products such as breakfast cereals (what constitutes ahealthful breakfast) and sugared fruit drinks (how much fruit juice is in thedrink). In many cases, but certainly not all, the knowledge gained may beinaccurate or misleading in the view of nutrition experts. For this reason,the term beliefs rather than knowledge is used for this precursor of diet.
For younger and older children, the evidence clearly supports the find-ing that television advertising influences their belief about food and bever-age composition, the healthfulness of different foods and beverages, andother aspects of nutrition (see Table 5-8). The number of significant resultsis much greater than the number of nonsignificant results. Overall, thecausal inference validity is medium for all results except one that is high andone that is low, and the causal inference validity of the significant results isat least as good as it is for the nonsignificant results. Among the significantresults are studies measuring the immediate influence of television advertis-ing on beliefs and studies measuring longer-term influence. The one resultfor teens is like those for children, but insufficient to support any finding.
Finding: There is moderate evidence that television advertising influencesthe food and beverage beliefs of children ages 2–11 years. There is insuffi-cient evidence about its influence on the beliefs of teens ages 12–18 years.
Television Advertising and Preferences, Requests, and Beliefs
The committee’s findings about the influence of television advertisingon food and beverage preferences, purchase requests, and beliefs are sup-ported (1) in research involving short-term exposure to television advertis-ing and immediate subsequent testing of the dependent variable and (2) inresearch involving intermediate-term exposure and intermediate lengths(e.g., 1 week) of subsequent testing of the dependent variable. The researchinvolving long-term exposure does so by measuring television viewing out-side the research setting. The great majority of the results when televisionviewing was the measure of exposure to television advertising report apositive relationship between viewing and preferences, purchase requests,or beliefs, the same type of relationship found in studies using other moredirect (often experimental) but short-term measures of exposure to televi-sion advertising. When exposure to television advertising is measured byreported viewing outside the research context, the measurement appropri-

260 FOOD MARKETING TO CHILDREN AND YOUTH
ately segregates television viewing from video game playing and computeruse; not enough is known about their advertising and what is known sug-gests that it is different from television advertising. If cable television view-ing is included, that is reasonable given that nearly everything a child orteen would view on cable would also have advertising like that found ontelevision. The consistency of results from a combination of experimentaland correlational designs and from researcher-controlled, short-term expo-sure to advertising and naturally occurring, long-term exposure from homeviewing provides a strong case for concluding that television advertisinginfluences children’s food and beverage preferences, purchase requests, andbeliefs. The very small amount of evidence for teens is consistent with thesefindings.
What, then, are the implications of these results for diet? The littleavailable research indicates that nutritional beliefs do not have much influ-ence on the preferences or behavior of children and teens (e.g., Murphyet al., 1995; Signorielli and Lears, 1992; Signorielli and Staples, 1997).However, there is good evidence that purchase requests exert some influ-ence on parental purchases, bringing the requested product into the home(e.g., Galst and White, 1976; Taras et al., 1989, 2000; Ward and Wackman,1972). It is reasonable to believe that the young person then consumes theproduct at least once. If the product itself or the brand is not liked, thenrepeat purchase is unlikely. If it is liked, then repeat purchase is possible. Ifthe product continues to be advertised, then the young person will haverepeat opportunities to be influenced to request the product. As reviewedelsewhere in the committee’s report (see Chapter 3), preferences influencediet. Preferences include biologically based preferences for sweet, salty, andfatty foods and beverages as well as preferences developed from exposure,repetitive consumption, and association with pleasant circumstances, ad-mired models, and the like. In the systematic evidence review, preference ismeasured in many ways. Other research indicates that the more distalmeasurement methods (e.g., preference expressed on a smiley-face ratingscale) are reasonable indicators of preferences expressed more directly (e.g.,choosing the food or beverage to eat) (e.g., Fisher and Birch, 1995). Thus,it is likely that the influence that television advertising has on children’s andteens’ preferences and purchase requests would lead to some influence ontheir diets. Given the nutritional characteristics of the foods and beveragesadvertised on television (see Chapter 4), their diets would be adverselyimpacted to some degree. What would happen if healthier foods and bever-ages were advertised instead is an open question.
Finding: Given the findings from the systematic evidence review of theinfluence of marketing on the precursors of diet, and given the evidencefrom content analyses that the preponderance of television food and bever-

INFLUENCE OF MARKETING ON DIETS AND DIET-RELATED HEALTH 261
age advertising relevant to children and youth promotes high-calorie andlow-nutrient products, it can be concluded that television advertising influ-ences children to prefer and request high-calorie and low-nutrient foodsand beverages.
SYSTEMATIC EVIDENCE REVIEW OF THE RELATIONSHIPBETWEEN MARKETING AND DIET
This section considers the evidence relevant to the influence of market-ing on diet. In the previous section, results in which the outcome variablewas a precursor to diet (e.g., food and beverage preferences, food andbeverage purchase requests, or food and beverage beliefs) were considered.This section considers results in which the outcome is some dietary behav-ior. The difference is important because the causal connection from theprecursors of diet discussed in the previous section and dietary behavior issometimes unclear. For example, several of the results discussed in theprevious section measure food or beverage preferences by asking partici-pants5 to choose between photographs of two foods or beverages. Otherresults measure food or beverage purchase requests by asking young peoplewhat they will request their mother to purchase during the next visit to thesupermarket. In either case, differences between individuals on these mea-surements might or might not translate into differences in actual food orbeverage consumption or differences in diet. Self-reported intentions aboutfuture behavior are not generally reliable. In some cases, however, researchhas been carried out on the effect of a precursor to diet on diet itself. Forexample, Galst and White (1976) studied the effect of attentiveness totelevision on food and beverage purchase requests, and they also studiedthe proportion of food and beverage purchase requests acceded to by par-ents in the supermarket.
Evidentiary Base
The committee categorized a result on the effect of marketing on diet asrelevant if it reported on a quantitative relationship between some exposureto marketing and some dietary behavior. There were 36 such results from33 different published reports, and Table 5-9 breaks down their character-istics by several dimensions. Research has been active in this area from the1980s through the present, involving a variety of study designs, age groups,and sample sizes. Twelve results focused on younger children (ages 2–
5The term “participant” is used throughout this chapter to describe subjects participatingin research studies.

262 FOOD MARKETING TO CHILDREN AND YOUTH
TABLE 5-9 Descriptive Characteristics of Research on theInfluence of Commercial Marketing on Young People’s Diet
Significant NonsignificantCharacteristic Results Results
Total Results* 30 6Decade Published
1970 or earlier 0 01980 8 21990 10 32000 12 1
Research DesignExperimental 7 3Natural experiment 2 1Longitudinal 2 0Cross-sectional 19 2
Age GroupYounger children (2–5) 12 0Older children (6–11) 18 4Teens (12–18) 7 3
Sample Size0–49 4 050–99 6 0100–499 13 3500–999 1 11,000 or more 6 2
Type of MarketingTV ads: experimental treatment 6 3TV ads: TV viewing only 29 3TV ads: TV campaign 1 0TV ads: TV viewing and other 2 0
media useProduct placement in film 1 0Price and promotion 1 0
Type of Diet OutcomeShort-term consumption 7 2Usual dietary intake 23 4
*One result in the evidence table could be about more than one age groupor type of diet outcome. For these two characteristics the column totals canbe more than the number of results.
5 years), 22 on older children (ages 6–11 years), and 10 on teens (ages 12–18 years). As it turns out, the results vary with age, so the discussion belowfirst presents gross findings and then separate the results according to age.
Clearly the dominant type of marketing studied involves television.Only 2 of the 36 results did not involve television: one by Auty and Lewis

INFLUENCE OF MARKETING ON DIETS AND DIET-RELATED HEALTH 263
(2004) on the effects of product placement in films, and one by French et al.(2001a) on the effect of vending machine prices on the consumption of low-fat snacks.
Nine of the 36 results describe experiments that probe the short-termeffects of exposure to different forms of television advertising by measuringa choice involving consumption shortly after exposure. For example, inGalst (1980), over a 4-week period children ages 3–6 years were allowed toselect a snack each day after, and researchers recorded which and howmany sugar-added versus no-sugar-added snacks the child consumed eachday. For the last 4 weeks children also watched children’s television pro-grams and two factors were varied: (1) whether the television programincluded commercials for food and beverage products with added sugarcontent, or included commercials for fruit or milk and pro-nutritional pub-lic service announcements (PSAs); and (2) whether a female graduate stu-dent made comments (negative comments about products with added sugarwhen they were advertised or positive comments about healthy foods andbeverages and PSAs), or remained silent. An untreated control group wasalso included. Children in all five groups selected sugared snacks the major-ity of the time, and the groups were not statistically distinguishable by theend of the experiment (week 6). At intermediate times, it did appear thatthe graduate student’s comments, and less so commercials for healthy foodand PSAs, were somewhat effective at reducing sugared snack intake.
The remaining 27 results probe the usual dietary habits of young peoplealong with their usual exposure to marketing. For example, Bolton (1983)asked 262 parent and child pairs to keep 16-day diaries on television expo-sure from which they calculated exposure to advertising, and 7-day dietaryintake diaries from which they calculated snacking frequency and nutrientintake. The study found that exposure to television advertising was associ-ated with an increased number of snacks, but that variations in parentalsnacking behavior (but not parental supervision) explained much more ofthe variation in the children’s snacking behavior than did variations intelevision advertising exposure.
Table 5-10 summarizes the evaluative characteristics of the 36 results.Ten of 36 were rated high for measure quality, 14 were of medium quality,and 12 of low quality. Eleven of 36 were of high relevance to inferring acausal connection (mostly the experimental studies), 9 were of mediumrelevance, and 16 of low relevance (mostly the cross-sectional studies ofoverall television viewing). The ability to generalize from these results (eco-logical validity) was generally very good. Twenty-four results were of highecological validity (the bulk of them cross-sectional studies using overalltelevision viewing as the measure of exposure to advertising), 10 weremedium, and 2 were low.
Because all but two of the 36 results were about the influence of televi-

264 FOOD MARKETING TO CHILDREN AND YOUTH
TABLE 5-10 Evaluative Characteristics of Research on theInfluence of Commercial Marketing on Young People’s Diet
Significant NonsignificantCharacteristic Results Results
Total Results 30 6Quality of Measures
High 8 2Medium 11 3Low 11 1
Causal Inference ValidityHigh 8 3Medium 7 2Low 15 1
Ecological ValidityHigh 20 4Medium 8 2Low 2 0
sion advertising, the remaining assessment of the evidence was carried outwith those two results (Auty and Lewis, 2004; French et al., 2001a) re-moved. These 34 results were then divided into (1) those concerned withthe influence on short-term consumption and (2) those concerned with theinfluence on usual dietary intake.
TABLE 5-11 Relevance Ratings of Research on theInfluence of Television Advertising on Young People’sShort-Term Consumption
Causal Inference Ecological Significant NonsignificantValidity Validity Results Results
Total Results 6 2High High 1 0
Medium 4 1Low 1 0
Medium High 0 0Medium 0 1Low 0 0
Low High 0 0Medium 0 0Low 0 0

INFLUENCE OF MARKETING ON DIETS AND DIET-RELATED HEALTH 265
Influence of Television Advertising on Short-Term Consumption
The evidence on the overall influence of television advertising on short-term consumption is summarized in Table 5-11. Seven of the eight resultsare of high causal inference validity, with six having a significant influence.As we discussed in previous sections, for each causal relationship underconsideration, the committee categorized the research reviewed as provid-ing either: (1) strong, moderate, or weak evidence in favor of the existenceof a causal relationship, (2) no evidence either way, or (3) strong, moder-ate, or weak evidence in favor of the lack of (nonexistence of) a causalrelationship.
Influence of Television Advertising on Usual Dietary Intake
The evidence on the overall influence of television advertising on usualdietary intake is summarized in Table 5-12. Among the results with highcausal inference validity, none showed a significant effect and two showedno effect. Conversely, among the results rated medium on the ability toinfer causation, seven of eight found a significant effect. Although 15 of 16results with low causal inference validity found a significant statistical asso-ciation between exposure to television advertising and usual dietary intakethese results provide little support for interpreting the association as causal.The great bulk of them are from cross-sectional studies in which televisionviewing and dietary habits are measured by diary or survey, both of whichinvolve measurement difficulties, and in most of these studies little effort
TABLE 5-12 Relevance Ratings of Research on theInfluence of Television Advertising on Young People’sUsual Dietary Intake
Causal Inference Ecological Significant NonsignificantValidity Validity Results Results
Total Results 22 4High High 0 2
Medium 0 0Low 0 0
Medium High 5 1Medium 2 0Low 0 0
Low High 13 1Medium 1 0Low 1 0
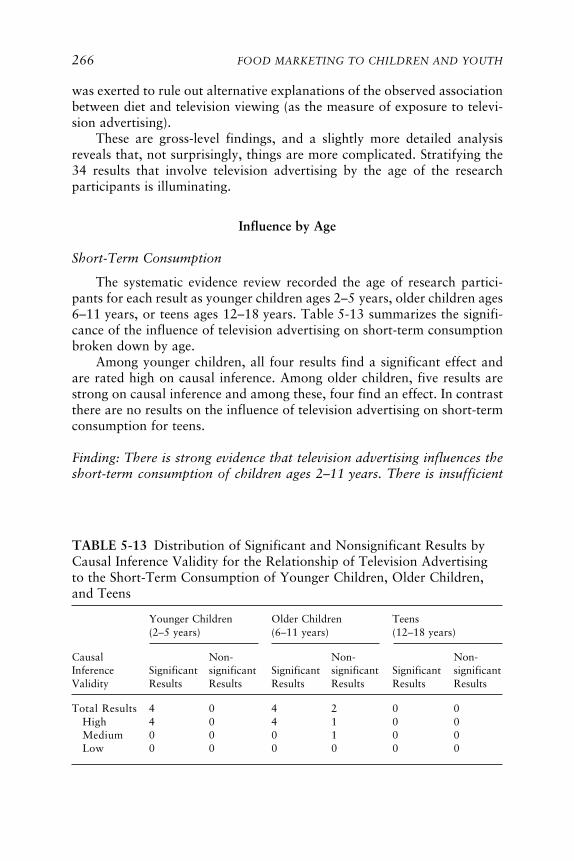
266 FOOD MARKETING TO CHILDREN AND YOUTH
was exerted to rule out alternative explanations of the observed associationbetween diet and television viewing (as the measure of exposure to televi-sion advertising).
These are gross-level findings, and a slightly more detailed analysisreveals that, not surprisingly, things are more complicated. Stratifying the34 results that involve television advertising by the age of the researchparticipants is illuminating.
Influence by Age
Short-Term Consumption
The systematic evidence review recorded the age of research partici-pants for each result as younger children ages 2–5 years, older children ages6–11 years, or teens ages 12–18 years. Table 5-13 summarizes the signifi-cance of the influence of television advertising on short-term consumptionbroken down by age.
Among younger children, all four results find a significant effect andare rated high on causal inference. Among older children, five results arestrong on causal inference and among these, four find an effect. In contrastthere are no results on the influence of television advertising on short-termconsumption for teens.
Finding: There is strong evidence that television advertising influences theshort-term consumption of children ages 2–11 years. There is insufficient
TABLE 5-13 Distribution of Significant and Nonsignificant Results byCausal Inference Validity for the Relationship of Television Advertisingto the Short-Term Consumption of Younger Children, Older Children,and Teens
Younger Children Older Children Teens(2–5 years) (6–11 years) (12–18 years)
Causal Non- Non- Non-Inference Significant significant Significant significant Significant significantValidity Results Results Results Results Results Results
Total Results 4 0 4 2 0 0High 4 0 4 1 0 0Medium 0 0 0 1 0 0Low 0 0 0 0 0 0

INFLUENCE OF MARKETING ON DIETS AND DIET-RELATED HEALTH 267
evidence about its influence on the short-term consumption of teens ages12–18 years.
These studies all consider the effect of television advertising, and thereare enough results to support some findings. The one study on the influenceof product placement will simply be described, because it is pertinent to thecommittee’s concerns and well done. In an experiment in which childrenages 6–7 years and 11–12 years saw clips from a popular Hollywood movie,Auty and Lewis (2004) found, consistent with the television results, thatproduct placement of a branded carbonated soft drink had a short-termeffect on the children’s choice of beverage for refreshment during a laterinterview.
Usual Dietary Intake
A review of the evidence also considered differences in usual dietaryintake by age and by how exposure to television advertising was measured.Some studies measured exposure to television advertising solely by measur-ing overall television viewing, the assumption being in these circumstancesthat exposure to television advertising and overall television viewing arehighly correlated. Other studies also employed some explicit measure re-lated to advertising, in some cases particular advertisements. For example,in Boynton-Jarrett et al. (2003), only overall television viewing was mea-sured and its relationship to fruit and vegetable intake was assessed. Incontrast, Hitchings and Moynihan (1998) measured the relationship be-tween recall of advertisements for seven targeted food groups and items
TABLE 5-14 Distribution of Significant and Nonsignificant Results byCausal Inference Validity for the Relationship of Television Advertisingto the Usual Dietary Intake of Younger Children, Older Children, andTeens Where a Direct Measure of Television Advertising Was Included
Younger Children Older Children Teens(2–5 years) (6–11 years) (12–18 years)
Causal Non- Non- Non-Inference Significant significant Significant significant Significant significantValidity Results Results Results Results Results Results
Total Results 3 0 4 1 0 2High 0 0 0 1 0 1Medium 1 0 2 0 0 0Low 2 0 2 0 0 1

268 FOOD MARKETING TO CHILDREN AND YOUTH
eaten as recorded by a 3-day diary. Twenty-two of such results used onlyoverall television viewing as a measure of advertising exposure. In 10 otherresults, exposure to television advertising was measured in some more ex-plicit way. Given the difference in how directly advertising exposure ismeasured, the two sets of studies will be examined separately. Both areinformative about the influence of exposure to television advertising onusual dietary intake.
Tables 5-14 and 5-15 present the results on usual dietary intake, bro-ken down by age. Table 5-14 presents the results that involve a directmeasure of television advertising, and Table 5-15 presents results in whichexposure to advertising was measured solely by overall television viewing.
For younger children, the evidence from both Tables 5-14 and 5-15 isentirely consistent. All results show a significant influence, but none arerated high on causal inference. The committee interpreted this to indicatethat there is moderate evidence that television advertising influences theusual dietary intake of younger children ages 2–5 years.
For older children, the evidence is not entirely consistent, but seems tofavor an effect. Evidence for the lack of an effect is strongest from Robinson(1999), the only result in this group rated high on causal inference. Robinsonstaged a large interventional study in which the treatment group was ex-posed to classes and time management aids aimed at reducing television,video, and video game usage among third and fourth graders. Participantsin the intervention group did reduce media use and had substantially lowerBMIs by the end of the study, but their consumption of highly advertisedfoods and beverages was indistinguishable from that of the untreated con-
TABLE 5-15 Distribution of Significant and Nonsignificant Results byCausal Inference Validity for the Relationship of Television Advertisingto the Usual Dietary Intake of Younger Children, Older Children, andTeens Where Television Advertising Was Measured Only by TelevisionViewing
Younger Children Older Children Teens(2–5 years) (6–11 years) (12–18 years)
Causal Non- Non- Non-Inference Significant significant Significant significant Significant significantValidity Results Results Results Results Results Results
Total Results 5 0 9 1 6 1High 0 0 0 0 0 0Medium 2 0 3 1 1 1Low 3 0 6 0 5 0

INFLUENCE OF MARKETING ON DIETS AND DIET-RELATED HEALTH 269
trol groups. In this case, the effect through media may have been notthrough television, but rather through the reduction in video and videogame use, both of which are likely to involve much less exposure to foodand beverage advertising. The Robinson study notwithstanding, the com-mittee interprets these results collectively to indicate that there is weakevidence that television advertising influences the usual dietary intake ofolder children ages 6–11 years. It is worth noting that among all of thestudies with medium causal inference validity (including with both youngerand older children, as just described), the usual diet measures were gener-ally either brand choice or snacking frequency.
The results for the influence of television advertising on the usual di-etary intake of teens ages 12–18 years are much less compelling. First, ofthe two results that involve a more direct measure of television advertising(Table 5-14), both found no effect. Second, of the three results rated eitherhigh or medium on causal inference validity in Tables 5-14 and 5-15, onefound an effect and two did not.
Finally, although the five remaining results found a significant effect,they are all rated low on causal inference validity because they are fromcorrelational studies that failed to rule out alternative explanations. Fur-thermore, they all reported very small effects, and often include substantialcaveats or limitations. For example, Crespo et al. (2001) found no effect forboys. French et al. (2001b) found that the television viewing measure wasassociated with fast food consumption, which the committee counted as asignificant effect, but they also found that fast food consumption amongteens was independent of BMI. Gracey et al. (1996) found no associationbetween television watching and food variety score or BMI. On balance,the committee interprets these studies to indicate that there is weak evi-dence that television advertising does not influence the usual dietary intakeof teens ages 12–18 years. This is not to say that marketing has no influenceon teens. Although the evidence reviewed is limited, from the committee’sreview and from other evidence it seems plausible that food and beveragemarketing has a greater influence on the diet of teens through price thanthrough advertising, whereas the opposite is true for younger children.
It should be noted that the finding for teens refers only to the influenceof television advertising. It does not include the interventional study byFrench et al. (2001a) which found a significant effect of vending machineprices and a very small effect of product packaging on teens’ purchase oflow-fat snacks. This study on the effects of price is persuasive and method-ologically sound, and rates high on causal inference validity. However, it isthe only study in the systematic evidence review that examines the effect ofprice on diet, and the committee was unwilling to come to any findingbased on a single study. It is worth noting, however, that other research onthe influence of price on teen consumption of alcohol and tobacco supports

270 FOOD MARKETING TO CHILDREN AND YOUTH
the hypothesis that price may be a major determinant of teen behavior(Harwood et al., 2003; Ross and Chaloupka, 2003; Waller et al., 2003a).
Finding: There is moderate evidence that television advertising influencesthe usual dietary intake of younger children ages 2–5 years and weak evi-dence that it influences the usual dietary intake of older children ages 6–11 years. There is also weak evidence that it does not influence the usualdietary intake of teens ages 12–18 years.
If marketing influences the diets and diet-related health of children andyouth, it will do so through children’s and teens’ preferences for specificfoods and beverages, requests made to their parents to purchase foods or tovisit restaurants, and their beliefs, attitudes, and values about foods. Thecommittee’s systematic evidence review found strong evidence that foodand beverage marketing does influence the preferences and purchase re-quests of children. Of 22 results on the effect of marketing on food orbeverage preferences, 15 found an effect. Of 17 results on the effect ofmarketing on food or beverage purchase requests, 15 found an effect, andof the 8 studies on the effect of marketing on food or beverage beliefs, 5found an effect.
The committee found evidence that purchase requests are also oftensuccessful. For example, Galst and White (1976) found that, overall, chil-dren observed in the grocery store with their parents were successful incausing purchases 45 percent of the time. Taras et al. (2000) found a sig-nificant correlation between highly advertised food or beverage products(as determined from advertising data) and parental recall of a young child’srequest for food or beverage purchases and a parent’s yielding to thosepurchase requests. In earlier work (Taras et al., 1989) they similarly foundstrong agreement between the relative proportion of foods or beveragespurchased by mothers and those requested by children ages 3–8 years.Other studies (e.g., Borzekowski and Poussaint, 1998; Brody et al., 1981;Donkin et al., 1993) agree that food or beverage purchase requests areoften successful; thus there is evidence for a causal link from marketingthrough purchase requests to diet.
As reviewed elsewhere in this report (Chapter 3), food and beveragepreferences—along with availability and accessibility—are among the stron-gest predictors of children’s and teens’ dietary intake. For example, childrenages 3–5 years who indicated strong preferences for high-fat foods (forfoods served at lunch) had high total fat intake; these children’s fat prefer-ences were associated with parental adiposity (Fisher and Birch, 1995). In astudy of one group of American Indians children ages 4–9 years, foodpreferences were the strongest predictor of food behavior (as assessed byquestionnaire) and explained 71 percent of the variation in the behavior
INFLUENCE OF MARKETING ON DIETS AND DIET-RELATED HEALTH 271
score (Harvey-Berino et al., 1997). Preference for and frequency of con-sumption of 64 foods and beverages as self-reported by African Americangirls, ages 8–10 years, were moderately correlated; however, correlationswith BMI were not significant (Sherwood et al., 2003). In children ages 8–13 years, preference for the taste of carbonated soft drinks was the stron-gest predictor of carbonated soft drink consumption (both measures self-reported), with those who reported the strongest taste preference 4.5 timesmore likely to consume carbonated soft drinks five or more times per weekthan those with a lower taste preference (Grimm et al., 2004). Carbonatedsoft drink consumption also was related to the frequency of consumptionby parents.
The strongest correlates of fruit and vegetable intake among adoles-cents, mean age 14.9 years, were taste preferences and home availability(Neumark-Sztainer et al., 2003). Interestingly, even when taste preferencesfor fruits and vegetables were low, intake increased if they were available.Similarly, in fourth through sixth graders, for children with high prefer-ences for fruit, fruit juice, and vegetables, availability was the only signifi-cant predictor of intake, whereas availability and accessibility were signifi-cantly related to consumption for children with low preferences (Cullenet al., 2003).
Although it is clear that preference influences diet, measures of prefer-ence in studies on the relationship between preference and consumptionmay not be the same as measures of preference in studies on the influence ofmarketing on preference. In those studies, it is hard to separate recall andrecognition effects prompted by advertising from real preference. In Green-berg and Brand (1993), for example, marketing had a demonstrable effecton measured preference for a product, but no effect on typical consump-tion. That caveat aside, the evidence indicates that there is a link frommarketing through preference to diet.
Nutritional beliefs do not appear to have a strong or consistent as-sociation with the preferences or diets of children and teens (as reviewed inChapter 3). For example, focus group interviews with kindergarten stu-dents revealed they understood the general relationships among foodchoices, exercise, body fat, and health (Murphy et al., 1995). They werealso able to name foods high in salt, fat, and sugar and thought consump-tion of sugar should be limited, but their self-reported food and beveragepreferences were not consistent with dietary recommendations to moderatefoods high in these nutrients. In the study cited of American Indian chil-dren, nutrition beliefs explained 40 percent of the variance in dietary be-havior; however, although beliefs scores increased with age, they did nottranslate into changes in eating behavior and nutrient intakes (Harvey-Berino et al., 1997). Conversely, among another group of adolescents,health and nutrition attitudes were associated with taste preferences for

272 FOOD MARKETING TO CHILDREN AND YOUTH
fruits and vegetables, and preferences in turn were associated with fruit/vegetable intake (Neumark-Sztainer et al., 2003).
SYSTEMATIC EVIDENCE REVIEW OF THE RELATIONSHIPBETWEEN MARKETING AND DIET-RELATED HEALTH
This section considers the evidence relevant to the influence of market-ing on diet-related health. For marketing to influence young people’s diet-related health, it must influence their diet, as depicted in the five-elementcausal framework (see Figure 5-1) that guided the systematic evidence re-view. Elsewhere in this report (see Chapter 2 and Appendix D), evidencethat links diet to health has been presented. Here, consonant with thecommittee’s charge, research that includes marketing as a possible causalfactor and diet-related health as an outcome is reviewed and assessed. Suchresearch could address any of the four major marketing elements (product,place, price, and promotion) as an influence on juvenile health outcomessuch as weight, obesity, cholesterol, and type 2 diabetes. In point of fact,some research has included marketing as a consideration, but little researchhas intentionally focused on any aspect of the relationship of marketing todiet-related health. As noted previously, the committee acknowledges thatvarious factors in addition to food and beverage marketing might affect thisrelationship, but these are not the direct subject of the committee’s inquiryand therefore the focus here is on the specific relationship of marketing todiet-related health.
The committee identified a substantial body of research that is relevantto understanding the relationship of marketing to diet-related health. Thesestudies examined the relationship between television viewing and diet-related health, almost always juvenile adiposity. Sixty-five articles that ex-amined this relationship were identified and included in the systematicevidence review. All but one study (Robinson, 1999) employed a correla-tional design, gathering data at either one or two points in time to examinethe relationship between amount of television viewing and diet-relatedhealth. One study (Wong et al., 1992) examined cholesterol levels; onestudy (Guillaume et al., 1997) examined cardiovascular fitness and adipos-ity; all the rest examined adiposity. Most studies also measured some pos-sible moderating variables such as age, race/ethnicity, or socioeconomicstatus or some possible alternative explanatory variables such as activitylevel or snacking while viewing television. Nearly all employed variousstatistical controls to better elucidate the underlying causal mechanismsaccounting for any significant association of television viewing and diet-related health.
After careful consideration, the committee judged that it was reason-able to include these studies in the systematic evidence review for the rela-
INFLUENCE OF MARKETING ON DIETS AND DIET-RELATED HEALTH 273
tionship of marketing to diet-related health. Studies that intentionally usedtelevision viewing as a measure of exposure to marketing (advertising) andemployed similar correlational designs had already been included in thesystematic evidence review for the relationship of marketing to precursorsof diet and for the relationship of marketing to diet. Moreover, televisionviewing is well related to exposure to food and beverage advertising be-cause, as explicated in Chapter 4, food and beverage marketing messagesare common across the television landscape, particularly in programmingwith the highest concentrations of youth in the audience. For this reason,any correlation reported between young people’s time watching televisionand precursors of diet, diet, or diet-related health may be caused by expo-sure during television viewing time to commercial messages for food andbeverage products, which are likely to be high in calories and low innutrients.
It becomes more difficult to infer causality in an individual study and toarrive at findings about causality from a group of studies as the outcomemoves from precursor to diet to health. The increasing difficulty arises fromtwo conditions. First, due to the decreasing proportion of experimentalstudies in the evidence for precursor, diet, and health outcomes, respec-tively, the ability to use the correlational studies to confirm results fromexperimental studies and arrive at findings about causality decreases fromprecursor to diet to health outcomes. Second, as one moves from precursorto diet to health outcomes, there is a substantial increase in the number ofplausible alternative explanations for any correlation between the outcomeand advertising exposure as measured by television viewing. Accordingly,for any given study that employs television viewing as a measure of expo-sure to television advertising, as one moves from precursor to diet to healthit becomes increasingly difficult to infer causality.
In drawing on the available research to assess the influence of exposureto television advertising on adiposity, as measured by television viewing,three challenges were paramount, given the fact that all but one of thestudies were correlational. One challenge is the fact that television viewingmay represent or be highly associated with several other factors that couldinfluence adiposity. In addition to exposure to commercial food and bever-age advertising, a measure of television viewing may indicate or be closelyassociated with physical activity, snacking, propensity to engage in othersedentary activities (e.g., reading, videogaming), reduced metabolic rate,exposure to food and beverage consumption within programs, and bluntingof physiological cues to satiety. A second challenge, given the correlationaldesign of these studies, is the possibility of reverse causation. Perhaps heavieryoung people watch more television because it demands less of them physi-cally. A third challenge is the possibility that television viewing and weightstatus are unrelated to each other, but well related to a third variable that
274 FOOD MARKETING TO CHILDREN AND YOUTH
influences each of them independently. For example, adiposity and televi-sion viewing each vary to some degree according to socioeconomic statusand racial/ethnic group, and these two independent relationships couldunderlie an apparent relationship between adiposity and television viewing.
As it turned out, there was a fourth challenge as well. Many studiesmeasured a wide variety of variables that could have been included in theanalyses. Reporting, however, was not always explicit enough to knowwhich were actually included in the analyses. For example, the statement“demographic variables were entered first into the regression model” andthe statistical reporting were not always sufficient to explain whether all orsome, and if some, which, of the measured demographic variables wereentered. Because the ability to draw causal inferences from correlationaldata depends heavily on the ability to rule out alternative explanations,difficulties in determining which alternative explanations had been testedlimited the utility of some research.
There are several implications in the committee’s decision to acceptthat measures of television viewing can be used as an indication of youngpeople’s exposure to advertising. First, because exposure to television ad-vertising is not measured directly, measurement strength will always berated low or medium, even for exceptionally good measurement of televi-sion viewing per se. As a corollary, in the relevance rating system, causalinference validity will always be rated medium or low due to the relativelyweak measurement of exposure to advertising, the target causal variable inthis systematic evidence review. Finally, in assessing the evidence, there is asubstantial burden to consider alternative explanations, and strong findingsabout causality are unlikely.
Evidentiary Base
Sixty-five articles with relevant empirical data were identified and in-cluded in the systematic evidence review, yielding 74 distinct results (seeTable 5-16). These studies began to appear in the 1980s, became morefrequent in the 1990s, and have continued to accelerate in volume since2000, with 45 results published in the literature in roughly the past 5 years.
Older children (ages 6–11 years) were most often the focus of study (58results), with teens (ages 11–18 years, 33 results) and younger children(ages 2–5 years, 17 results) also receiving some attention. Just one resultinvolved infants and toddlers (under age 2 years) as part of the researchsample of children, and it is the only such result in the entire systematicevidence review. The use of large data sets was common, with nearly half ofall results derived from samples of 1,000 or more children or teens. Muchof the research relied on secondary analyses of nationally representativesurvey data from ongoing studies such as the National Health and Nutri-tion Examination Survey (NHANES).

INFLUENCE OF MARKETING ON DIETS AND DIET-RELATED HEALTH 275
TABLE 5-16 Descriptive Characteristics of Research on theInfluence of Commercial Marketing on Young People’sDiet-Related Health
Significant NonsignificantCharacteristic Results Results
Total Results* 51 23Decade Published
1980 3 11990 14 112000 34 11
Research DesignExperimental 1 0Natural experimental 0 0Longitudinal 12 5Cross-sectional 38 18
Age Group*Infants and toddlers (under 2) 0 1Younger children (2–5) 11 6Older children (6–11) 44 14Teens (12–18) 23 10
Sample Size0–49 0 150–99 4 2100–499 13 8500–999 6 51,000 or more 28 7
Type of MarketingTV ads: observed in natural 0 2
settingTV ads: TV viewing only 41 15TV ads: TV viewing and other 10 6
media useType of Diet-Related HealthOutcome*
Adiposity 50 23Other 2 0
NOTE: The two “Other” outcomes were cholesterol levels and cardiovas-cular fitness.
*One result in the evidence table could be about more than one age groupor type of diet-related health outcome. For these two characteristics thecolumn totals can be more than the number of results.
This body of research almost exclusively provides evidence about therelationship of television advertising exposure to adiposity. Seventy-threeof the 74 results assessed adiposity as the diet-related health outcome; one(Guillaume et al., 1997) also assessed cardiovascular fitness, and one onlyassessed cholesterol levels (Wong et al., 1992). Typically, adiposity was

276 FOOD MARKETING TO CHILDREN AND YOUTH
measured by BMI, but skinfold thickness measures and designations suchas obese or super obese were also used. In some of the longitudinal studies,change in BMI or other adiposity measures was assessed. All 74 resultsinvolved viewing of television advertising as the putative causal variable; 58involved television advertising alone (or with other media measured sepa-rately), and the remaining 16 involved television advertising and someother media use—videos, music videos, video games, computer games, andcomputers—combined with television use such that it could not be sepa-rately assessed. This was particularly common in studies in which research-ers sought to test hypotheses about the relationship between adiposity andtelevision viewing as a form of sedentary activity. For all 74 results, expo-sure to television advertising was measured by overall television viewing inyoung people’s daily lives outside of school, either television viewing byitself or combined with time spent with other media and technology. All buttwo results involved self-report and/or parent-report of media use; for theother two, children’s everyday behavior was directly observed.
For the committee’s purposes, among all the media and technology thatyoung people use, only engagement with television can reasonably serve asan indication of exposure to food and beverage marketing. Although mar-keting is frequently part of all media and technology, only for television isthere enough good evidence about the nature and extent of food and bever-age marketing to instill confidence that amount of television viewing is areasonable measure of exposure to advertising for foods and beverages, themajority of which promote high-calorie and low-nutrient products (seeChapter 4). For this reason, in those studies that measured use of othermedia in addition to measuring television viewing, the committee’s focuswas on the evidence about a relationship between television viewing andadiposity.
The studies that combined television use with other media use, withoutreporting them separately, were included in the systematic evidence review.This is because research on out-of-school use of media and technology hasrepeatedly demonstrated that, on average, young people spend much moretime with television than with any other medium or technology. The KaiserFamily Foundation report on media use by a national sample of 8- to 18-year-olds found that, on a combined basis, just over 3 hours a day werespent on television viewing (broadcast, cable, and prerecorded), almost1 hour a day watching videos/DVDs, and about 0.75 hours a day playingconsole and hand-held video games (Roberts et al., 2005). At times, mediause overlapped; total media time could be less than the sum for each me-dium separately. The average usage times included all research participants.In fact, most (81 percent) watched television on a typical day, and fewerwatched videos/DVDs (42 percent) or played console video games (41 per-cent) or hand-held video games (35 percent). There were some differencesin media use by age, gender, and race/ethnicity, but the general findings do
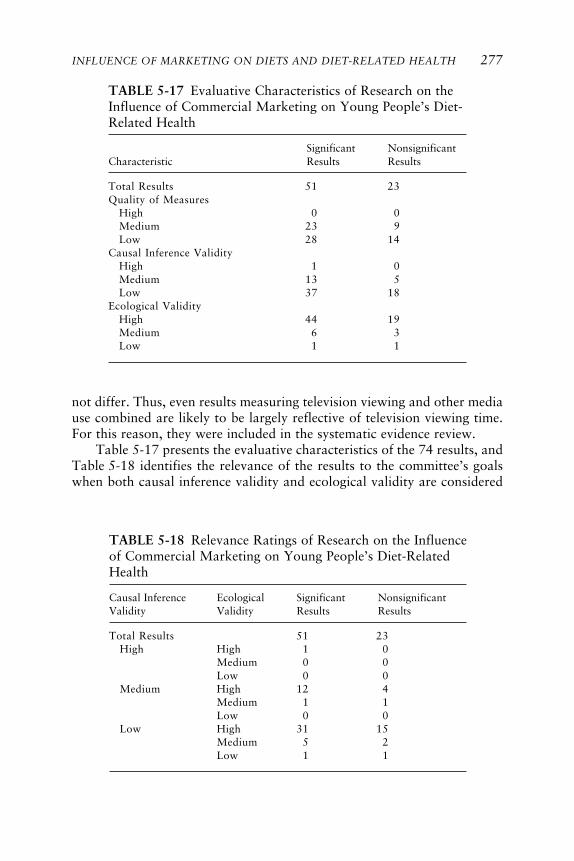
INFLUENCE OF MARKETING ON DIETS AND DIET-RELATED HEALTH 277
TABLE 5-17 Evaluative Characteristics of Research on theInfluence of Commercial Marketing on Young People’s Diet-Related Health
Significant NonsignificantCharacteristic Results Results
Total Results 51 23Quality of Measures
High 0 0Medium 23 9Low 28 14
Causal Inference ValidityHigh 1 0Medium 13 5Low 37 18
Ecological ValidityHigh 44 19Medium 6 3Low 1 1
TABLE 5-18 Relevance Ratings of Research on the Influenceof Commercial Marketing on Young People’s Diet-RelatedHealth
Causal Inference Ecological Significant NonsignificantValidity Validity Results Results
Total Results 51 23High High 1 0
Medium 0 0Low 0 0
Medium High 12 4Medium 1 1Low 0 0
Low High 31 15Medium 5 2Low 1 1
not differ. Thus, even results measuring television viewing and other mediause combined are likely to be largely reflective of television viewing time.For this reason, they were included in the systematic evidence review.
Table 5-17 presents the evaluative characteristics of the 74 results, andTable 5-18 identifies the relevance of the results to the committee’s goalswhen both causal inference validity and ecological validity are considered

278 FOOD MARKETING TO CHILDREN AND YOUTH
together. As anticipated given the research methods and the use of televi-sion viewing as a measure of exposure to advertising, the quality of themeasures was medium or low, never high, and, with the one experiment asan exception, causal inference validity was never high and most often waslow. On the other hand, with two exceptions, ecological validity was neverlow and was most often high because the research methods and measurespermitted assessment of everyday life phenomena. Also as anticipated, eco-logical validity tended to be higher when causal inference validity waslower (see Table 5-18). The results for the relationship of marketing to diet-related health do support generalization to everyday life, but do not make iteasy to determine cause and effect.
The preponderance of results (51 of 74, 69 percent) reported a signifi-cant association between marketing and diet-related health. Examinationof the data in Tables 5-16, 5-17, and 5-18 indicated that there is no appar-ent difference in the characteristics of the research producing significantand nonsignificant results. Further exploration of possible differences basedon breakdowns using multiple variables did not change this finding. More-over, the two relevance ratings (see Table 5-17) indicated that the signifi-cant results were from research that was at least as relevant as the researchthat produced the nonsignificant results: For causal inference validity,28 percent of the significant results were rated medium (one was high)compared to 22 percent of the nonsignificant results, and for ecologicalvalidity, 86 percent of the significant results were rated high compared to83 percent of the nonsignificant results. This general pattern did not changewhen causal inference validity and ecological validity were considered to-gether (see Table 5-18).
Relationship Between Television Advertising and Adiposity
As Table 5-16 shows, available evidence about the relationship of mar-keting and diet-related health is almost entirely evidence about the relation-ship of television advertising exposure and adiposity among children andteens. In contrast to the evidence about the relationship of marketing toprecursors of diet, or to diet itself, in which two or three different types ofoutcomes have been studied, there is only one outcome that has been stud-ied to any degree: adiposity. Also, only one type of marketing has beenstudied: exposure to television advertising. To determine what can be con-cluded about the relationship of television advertising exposure to adiposityin children and teens, one result (Wong et al., 1992) that was not aboutadiposity was omitted from further consideration. Of the 73 results remain-ing in the evidence table, the infant/toddler sample in the Vandewater et al.(2004) study and the cardiovascular fitness outcome in the Guillaume et al.(1997) result were both removed from further consideration.

INFLUENCE OF MARKETING ON DIETS AND DIET-RELATED HEALTH 279
Clearly, the descriptive and evaluative characteristics of the evidencebase about the relationship between television advertising exposure andadiposity remain nearly the same as for the entire sample. Further examina-tion of this evidence, considering the age of the participants (see Table 5-19), indicated that the preponderance of significant associations is aboutthe same (around 75 percent) for younger children, older children, andteens, regardless of the way in which exposure to advertising was measured.Moreover, the causal inference validity status of the significant and non-significant results did not change from that for the whole sample and doesnot seem to vary by age.
Finding: Statistically, there is strong evidence that exposure to televisionadvertising is associated with adiposity in children ages 2–11 years andteens ages 12–18 years.
As discussed elsewhere, evidence of association is not evidence of cau-sation, and the committee’s interest is in causation and relevance to every-
TABLE 5-19 Distribution of Significant and Nonsignificant Results byMeasure of Exposure to Advertising for the Relationship of TelevisionAdvertising to the Adiposity of Younger Children, Older Children, andTeens (For Each Cell, Number of Results with Medium Causal InferenceValidity Is Indicated in Parentheses)
Younger Children Older Children Teens(2–5 years) (6–11 years) (12–18 years)
Measure of Non- Non- Non-Advertising Significant significant Significant significant Significant significantExposure Results Results Results Results Results Results
Total Results 11 (4) 6 (2) 44 (14*) 14 (3) 23 (7) 10 (3)TV ads: 0 (0) 2 (0) 0 (0) 1 (0) 0 (0) 0 (0)
observedin naturalsetting
TV ads: 11 (4) 4 (2) 35 (11*) 8 (3) 18 (5) 8 (3)TV viewingonly
TV ads: 0 (0) 0 (0) 9 (3) 5 (0) 5 (2) 2 (0)TV viewingand othermedia use
*One causal inference validity rating is high, not medium.

280 FOOD MARKETING TO CHILDREN AND YOUTH
day life. To assess the likelihood that the positive association betweenexposure to television advertising and adiposity reflected a causal influencefrom advertising to adiposity, the committee examined three issues: (1) whe-ther the association could be explained by adiposity affecting exposure totelevision advertising; (2) whether the association could be explained byother variables that the advertising exposure measure (television viewing)could also represent; and (3) whether the association could be explained bya third variable that influenced both the advertising exposure measure andadiposity.
Whether Advertising Exposure Predicts Adiposity or Vice Versa
If the significant association found between advertising exposure andadiposity represents a causal relationship, then the question becomes whichinfluences the other. Because advertising exposure was measured by televi-sion viewing, the obtained association could logically be explained as “adi-posity influences exposure to television advertising (as measured by televi-sion viewing)” or “exposure to television advertising (as measured bytelevision viewing) influences adiposity.” Of the 73 results that examinedthe relationship between children’s and teens’ exposure to television adver-tising and their adiposity, 1 was experimental and the remaining 72 werecorrelational; 17 of these 72 correlational studies employed a longitudinaldesign (all panel studies). The experimental and longitudinal studies pro-vide the best evidence as to the direction of any causal relationship thatmight exist between advertising exposure and adiposity.
The one experimental study (Robinson, 1999) was a well-conceivedand well-conducted randomized controlled trial intervention. Nearly 200third and fourth graders and their teachers and parents participated. Over aperiod of 6 months, children in the experimental intervention engaged in an18-lesson classroom curriculum to reduce television, videotape, and videogame use. The intervention effort was concentrated into the first 2 months,and part of the intervention sought to bring parents into the process. Theanalytic framework compared the intervention and control groups on avariety of outcome measures, while covarying on age, gender, and pretestscore for the specific outcome measure. As compared to the control group,the intervention group had significantly less increase in BMI and in three offour other measures of adiposity. Also, for both child and parent measures,for the intervention group compared to the control group, there was ahighly significant reduction (4–6 hours a week) in television viewing and asignificant reduction (about one a week) in meals eaten in front of thetelevision set. In addition, children in the intervention group compared tothe control group reported relative reductions in servings of high-fat foods,although the differences were not significant (p = 0.12). There were no

INFLUENCE OF MARKETING ON DIETS AND DIET-RELATED HEALTH 281
group differences in frequency of snacking while viewing, servings of highlyadvertised foods, other sedentary behaviors, and various measures of physi-cal activity. Clearly the variety of findings for the intervention group com-pared to the control group offer interpretive challenges as to what variablesare influencing adiposity and how they work together in everyday life.However, if a causal claim were to be made with respect to the link betweenadiposity and television advertising, the direction of influence would befrom television advertising (as measured by television viewing) to adiposity.
The longitudinal studies also provided a good test of the direction ofany causal relationship when they assessed advertising exposure beforeassessing adiposity or related prior exposure to change in adiposity. Logi-cally, if a statistically significant association is found between advertisingexposure at one time and adiposity at a later time, then any causal relation-ship that might exist would be described as “advertising exposure at time 1influences adiposity at time 2” not as “adiposity at time 2 influences adver-tising exposure at time 1.” Two of the 17 longitudinal studies measuredexposure to television advertising at the time of the last measure of adipos-ity and then related exposure to some aspect of the longitudinal course ofadiposity. Among the 15 longitudinal studies in which advertising exposurewas measured prior to adiposity, the evidence for an association betweenadvertising exposure and adiposity is strong, with 12 (80 percent) reportinga significant relationship.
Based on the 1 result of the experimental study and the 15 results of thelongitudinal studies, it is unlikely that any causal relationship that might befound between advertising exposure, as measured by television viewing,and adiposity would be explained primarily by the fact that heavier youngpeople watch more television. The committee interprets the evidence asruling out any reverse causation explanation. The evidence is strong andfavors the finding that, if the relationship between television advertisingand adiposity were causal, the direction would be that exposure to televi-sion advertising predicts adiposity rather than that adiposity predicts expo-sure to television advertising.
Whether Alternative Explanations Account for the Positive AssociationBetween Exposure to Television Advertising and Adiposity
To conclude that the significant association found between televisionadvertising exposure and adiposity reflects a causal relationship, plausiblealternative explanations must be examined and, to a convincing degree,must be shown not to account for the significant positive association. Toexamine alternative explanations, the evidentiary base was restricted tocorrelational studies with a medium rather than a low causal inferencevalidity rating (recall that there was only one experimental study in the

282 FOOD MARKETING TO CHILDREN AND YOUTH
entire body of evidence and that was the only result with a high causalinference validity rating). A higher causal inference validity rating for corre-lational studies indicates more likelihood of being able to rule out variousalternative explanations of findings. Consequently, studies rated mediumare likely to provide information pertinent to deciding whether exposure totelevision advertising influences adiposity over and above, or instead of,plausible alternative explanations. There were 16 different correlationalstudies rated medium on causal inference validity; they yielded 17 differentresults.
Of the 17 results, 12 (71 percent) reported a significant relationshipbetween exposure to television advertising, as measured by television view-ing, and adiposity. The descriptive characteristics of the 12 significant and5 nonsignificant results are presented in Table 5-20 and the evaluativecharacteristics are in Table 5-21. Overall, the characteristics are similar to
TABLE 5-20 Descriptive Characteristics of Cross-Sectionaland Longitudinal Research on the Influence of Exposure toTelevision Advertising on Young People’s Adiposity, forResults with Medium Causal Inference Validity
Significant NonsignificantCharacteristic Results Results
Total Results* 12 5Decade Published
1980 1 01990 2 12000 9 4
Research DesignLongitudinal 8 3Cross-Sectional 4 2
Age Group*Younger children (2–5) 3 2Older children (6–11) 12 3Teens (12–18) 6 3
Sample Size100–499 2 1500–999 2 11,000 or more 8 3
Type of MarketingTV ads: TV viewing only 9 5TV ads: TV viewing and other 3 0
media use
*One result in the evidence table could be about more than one age group,and so the column total can be more than the number of results.

INFLUENCE OF MARKETING ON DIETS AND DIET-RELATED HEALTH 283
those of the full set of evidence (74 results, see Tables 5-16 and 5-17), andthey too provide no indication of any consistent difference that wouldexplain why some results were significant and some were not. Moreover,additional exploration, such as by age group, produced no indication ofany consistent difference. Because these 17 results are exclusively fromstudies in which the methods and statistical analyses provide a mediumdegree of ability to infer causality and because 71 percent of the resultsfavor a relationship, it is possible that the positive association reflects acausal relationship, but more analysis is needed before any finding couldbe drawn.
To pursue further the question of whether television advertising influ-ences adiposity, the variables other than television viewing that wereincluded in the 16 studies (17 results) with medium causal inference valid-ity were identified. These variables could be roughly categorized as (1)television-related nonadvertising variables that the advertising measure,television viewing, could be assessing, (2) third variables that would ac-count independently for both television viewing and adiposity, or (3) otheradiposity-related variables. The 16 studies (17 results) varied considerablyin which variables were included, and authors were only sometimes ex-plicit about how they thought these variables functioned in assessing thefactors influencing juvenile adiposity. For this reason, results will be exam-ined simultaneously for all three types of variables (television-relatednonadvertising, third, and other adiposity-related).
In addition to exposure to television advertising, several variables couldbe indexed by television viewing and are suspected of influencing, or known
TABLE 5-21 Evaluative Characteristics of Cross-Sectionaland Longitudinal Research on the Influence of Exposure toTelevision Advertising on Young People’s Adiposity, forResults with Medium Causal Inference Validity
Significant NonsignificantCharacteristic Results Results
Total Results 12 5Quality of Measures
High 0 0Medium 9 3Low 3 2
Ecological ValidityHigh 11 4Medium 1 1Low 0 0

284 FOOD MARKETING TO CHILDREN AND YOUTH
to influence, adiposity directly or indirectly, and might explain the positiveassociation between viewing and adiposity. Only the last is the commit-tee’s focus.
• Television viewing might take up time that otherwise would begiven to greater physical activity, and more physical activity could lead tohigher calorie expenditure, which could lead to lesser adiposity.
• Television viewing might be an indicator of a preference for a moresedentary lifestyle, and more sedentary activity could lead to lower energyexpenditure, which could lead to greater adiposity.
• Television viewing might be a context for snacking, and moresnacking could lead to higher calorie intake, which could lead to greateradiposity.
• Television viewing might blunt one’s sensitivity to satiety cues, andgreater insensitivity to satiety cues could lead to greater calorie intake wheneating during viewing, which could lead to greater adiposity.
• Television viewing might reduce one’s metabolic level, and a lowermetabolic level could lead to less efficient processing of calorie intake,which could lead to greater adiposity.
• Television viewing might be an indicator of exposure to depictionsof eating and drinking within the program (either scripted or product place-ment), and more exposure to these depictions could increase preferences,purchase requests, and other precursors of diet which then increase calorieintake and could lead to greater adiposity.
• Television viewing might be an indicator of exposure to food andbeverage advertising, and more exposure to this advertising could increasepreferences, purchase requests, and other precursors of diet, which thenincrease dietary intake and could lead to greater adiposity.
Realistically, several of these variables and pathways may operate si-multaneously to influence adiposity. The question for the committee iswhether exposure to television advertising is among them, not whetherexposure to television advertising is the sole influence or the most impor-tant influence. None of the 17 results that tested enough variables to receivea medium causal inference validity rating covered all seven plausible expla-nations using measures other than television viewing. Not one includeddirect measures of satiety cues, metabolic rate, consumption depictions, ortelevision advertising. For each of the other plausible explanations, at leastone study tested one or more of them using measures other than televisionviewing.
In addition to examining what happens to television advertising as apotential causal variable when measures of television-related nonadver-tising variables are included in the analysis, the possibility that the appar-
INFLUENCE OF MARKETING ON DIETS AND DIET-RELATED HEALTH 285
ent relationship is due to a third variable, independently related both toadvertising exposure (as measured by viewing) and to adiposity, also mustbe examined. The most likely third variables are age, gender, race/eth-nicity, and socioeconomic status. Each has been shown to have some rela-tionship to television viewing, and hence to exposure to advertising, andeach has been shown to have some relationship to adiposity. For example,television viewing tends to be inversely related to socioeconomic statusand adiposity also tends to be inversely related to socioeconomicstatus. Socioeconomic status, then, could account for the obtained positiveassociation between television viewing and adiposity. If so, when socio-economic status is included as a variable, the positive association betweenthe advertising measure (television viewing) and adiposity should disap-pear or markedly diminish. Existing evidence about the relationship ofage, gender, race/ethnicity, and socioeconomic status to television viewingand to adiposity suggests that only some of the four are likely third vari-ables. Nonetheless, they should each be examined in order to see whetherthe positive association between television viewing and adiposity existswhen potential third variable explanations have been taken into account.If the association remains, the claim that television advertising influencesadiposity cannot be rejected on the basis of existing evidence about thatthird variable explanation.
To examine further whether exposure to television advertising wascausally connected to adiposity, each of the 17 results with medium causalinference validity was reexamined. Using the statistical analysis that in-cluded television viewing (the measure of exposure to television advertis-ing) and the largest possible number of television-related nonadvertising,third, and other adiposity-related variables, such variables that were in-cluded in that analysis were identified. Also recorded was whether televi-sion advertising was significant in this analysis.
These counts were used in two different ways. First (see Table 5-22),for each of the five television-related nonadvertising variables and fourthird variables found to be included in the analyses, a comparison wasmade of the number of results in which television viewing was a significantpredictor, and the number in which it was not a significant predictor, whenthat variable was included with television viewing in the statistical analysiswith the largest possible number of variables in it. The same was done fortwo other adiposity-related variables—parental adiposity and initial childadiposity—that were included in enough of the statistical analyses to makecomparisons possible. Second (see Table 5-23), a count was made of thetotal number of television-related nonadvertising variables, of third vari-ables, and of other adiposity-related variables included in the statisticalanalysis with the largest possible number of variables in it. Also countedwas the total number of variables of any type in this statistical analysis. The

286T
AB
LE
5-2
2T
elev
isio
n-R
elat
ed N
onad
vert
isin
g, T
hird
, an
d O
ther
Adi
posi
ty-R
elat
ed V
aria
bles
Inc
lude
d in
Stat
isti
cal
Tes
ts o
f th
e R
elat
ions
hip
of T
elev
isio
n A
dver
tisi
ng,
Mea
sure
d by
Tel
evis
ion
Vie
win
g, a
nd A
dipo
sity
, fo
rC
ross
-Sec
tion
al a
nd L
ongi
tudi
nal
Stud
ies
wit
h M
ediu
m C
ausa
l In
fere
nce
Val
idit
y R
atin
gs (
Cel
l E
ntri
es A
re N
umbe
rof
Res
ults
wit
h T
hat
Var
iabl
e In
clud
ed i
n th
e St
atis
tica
l A
naly
sis
wit
h T
elev
isio
n V
iew
ing)
Cro
ss-S
ecti
onal
Met
hods
Lon
gitu
dina
l M
etho
dsT
otal
for
Bot
h M
etho
ds
Non
-N
on-
Non
-Si
gnif
ican
tsi
gnif
ican
tSi
gnif
ican
tsi
gnif
ican
tSi
gnif
ican
tsi
gnif
ican
tR
esul
tsR
esul
tsR
esul
tsR
esul
tsR
esul
tsR
esul
tsV
aria
bles
(n =
4)
(n =
2)
(n =
8)
(n =
3)
(n =
12)
(n =
5)
Tel
evis
ion-
Rel
ated
Non
adve
rtis
ing
Var
iabl
esPh
ysic
al a
ctiv
ity
31
42
73
Mil
d or
sed
enta
ry a
ctiv
ity
00
30
30
Oth
er m
edia
use
10
11
21
Snac
king
con
text
10
10
20
Die
t3
14
17
2T
hird
Var
iabl
esA
ge4
24
38
5G
ende
r4*
27*
3*11
5R
ace /
e thn
icit
y3
26*
*2
94
Stat
use s
42
72
114
Oth
e r A
dipo
sity
-Re l
ate d
Var
iabl
e sPa
rent
adi
posi
ty0
05
15
1In
itia
l ad
ipos
ity
n/a
n/a
62
n/a
n/a
1–10
oth
e r v
aria
ble s
*3
17
310
4
*One
res
ult
is f
rom
a s
tudy
of
girl
s on
ly.
**O
ne r
esul
t is
fro
m a
stu
dy o
f no
n-H
ispa
nic
Cau
casi
ans
only
.

287T
AB
LE
5-2
3N
umbe
r of
Var
iabl
es T
otal
and
by
Typ
e In
clud
ed i
n St
atis
tica
l T
ests
of
the
Rel
atio
nshi
p of
Tel
evis
ion
Adv
erti
sing
, M
easu
red
by T
elev
isio
n V
iew
ing,
and
Adi
posi
ty,
for
Cro
ss-S
ecti
onal
and
Lon
gitu
dina
l St
udie
s w
ith
Med
ium
Cau
sal
Infe
renc
e V
alid
ity
Rat
ings
(C
ell
Ent
ries
Are
Num
ber
of R
esul
ts w
ith
the
Indi
cate
d N
umbe
r of
Var
iabl
es [
Lef
t C
olum
n] I
nclu
ded
in t
he S
tati
stic
al A
naly
sis
wit
h T
elev
isio
n V
iew
ing)
Cro
ss-S
ecti
onal
Met
hods
Lon
gitu
dina
l M
etho
dsT
otal
for
Bot
h M
etho
ds
Non
-N
on-
Non
-Si
gnif
ican
tsi
gnif
ican
tSi
gnif
ican
tsi
gnif
ican
tSi
gnif
ican
tsi
gnif
ican
tR
esul
tsR
esul
tsR
esul
tsR
esul
tsR
esul
tsR
esul
tsV
aria
bles
(n =
4)
(n =
2)
(n =
8)
(n =
3)
(n =
12)
(n =
5)
Tel
evis
ion-
Rel
ated
Non
adve
rtis
ing
Var
iabl
esin
Tes
t (5
max
imum
)0
01
21
22
11
01
12
12
21
30
51
31
02
13
1T
hird
Var
iabl
es i
n T
est
(4 m
axim
um)
10
00
00
02
00
10
10
31
06
27
24
32
11
43
Oth
e r A
dipo
sity
-Re l
ate d
Var
iabl
e s i
n T
e st
04
21
15
31
(max
imum
cro
ss-s
e cti
onal
)0
03
13
12
(max
imum
lon
gitu
dina
l)n/
an/
a4
1n/
an/
aT
otal
Var
iabl
e s i
n T
e st
(21
max
imum
)3–
40
10
00
15–
61
00
11
17–
82
12
14
29–
100
03
03
011
–12
10
20
30
140
00
10
121
00
10
10

288 FOOD MARKETING TO CHILDREN AND YOUTH
number of results for which television advertising was significant and non-significant was compared as the number of television-related nonadvertising,third, other adiposity-related, and all variables in the analysis increased.
In each approach, if television viewing is significant in the preponder-ance of the results, then the claim that television advertising influencesadiposity cannot be rejected. This is so because the statistical analysestested whether the positive association between the television advertisingmeasure and adiposity was explained by the television-related nonadvertis-ing, third, and other adiposity-related variables. If the association wereexplained by any one or number of these variables (and assuming thevariables were well measured), then there would be no significant associa-tion between the advertising measure (television viewing) and adipositywhen the explanatory variables were included with television viewing in theanalysis predicting adiposity.
The evidence presented in Table 5-22 indicates the extent to which thestatistically significant positive association between exposure to televisionadvertising, as measured by television viewing, and adiposity is accountedfor by a television-related nonadvertising, third, or other adiposity-relatedvariable. For alternative interpretations of what television viewing mea-sures (nonadvertising variables in the table), there are either no results (forsatiety cues, metabolic rate, and consumption depictions) or too few results(mild or sedentary activity and snacking context) to directly address thequestion. For physical activity and diet, when each was measured by some-thing other than television viewing and included in the statistical analysis,the positive, statistically significant association between the television view-ing measure and adiposity remained for 54 percent and 78 percent of theresults, respectively. As described earlier, depending on how diet is mea-sured it could be an indicator of snacking frequency and context, sensitivityto satiety cues, exposure to consumption depictions, or exposure to televi-sion advertising. The diet measures used in the 17 studies are sufficientlyvaried that their meaning and the implications of findings involving differ-ent measures cannot be further unraveled. For other media use, whichcould indicate mild or sedentary activity preference, time taken away fromphysical activity, or exposure to some uncertain amount of food and bever-age marketing or consumption depiction, the association between televisionviewing and adiposity was significant for 67 percent of the results. Overall,then, for the television-related nonadvertising variable interpretations ofthe television viewing measure that can be assessed, there is some evidencethat the positive association between advertising exposure, as measured bytelevision viewing, and adiposity remains when these alternatives are takeninto account. Thus, the claim that television advertising influences adipos-ity cannot be rejected on the basis of current evidence about nonadvertisinginterpretations of the television viewing measure.
INFLUENCE OF MARKETING ON DIETS AND DIET-RELATED HEALTH 289
It should be noted that the evidence presented here does not offer anyindication as to whether the plausible television-related nonadvertising vari-ables do, indeed, explain the positive association between television view-ing and adiposity. Table 5-22 only shows how the advertising exposureinterpretation holds up when these plausible alternative explanations areconsidered simultaneously. If any television-related nonadvertising variable(which it is argued is measured by television viewing) were to be consideredcausal, then there would need to be evidence that the television-related non-advertising variable is well correlated with television viewing, that it influ-ences adiposity, and that it does so when advertising, other television-related nonadvertising, third, and other adiposity-related variables aresimultaneously taken into account. None of that evidence is assessed here.A general review of the research literature and of the analyses conducted inthe 16 articles analyzed here suggested there is limited evidence, and it isnot highly supportive of a claim that any of the television-related non-advertising variables both is indexed by television viewing and also inde-pendently influences adiposity. By the same token, because the measure-ment of many of the key variables is problematic, the inability to find arelationship does not rule out its existence.
The same points can be made for the third variable explanations, whichare described next. For third variable explanations of the positive associa-tion between television advertising, as measured by television viewing, andadiposity, the evidence is clear (see Table 5-22). Neither age nor gender norrace/ethnicity nor socioeconomic status explains the association. These vari-ables were included in most analyses. When they were, the positive associa-tion between exposure to television advertising, as measured by televisionviewing, and adiposity was statistically significant in the great majority ofthe results.
For most other adiposity-related variables that might explain the posi-tive association between television advertising exposure and adiposity, orproduce meaningful variations in the association, in general there is notenough evidence to assess any role they might play. Among the 16 studies(17 results), the number of these other adiposity-related variables includedin analyses with television viewing ranged from 1 to 10. Examples areregion, population density, parental smoking, maternal marital status, ma-ternal diabetes, child’s birth weight, and child’s initial adiposity.
Two other adiposity-related variables were included in enough analysesthat it is possible to assess whether the television advertising–adiposityrelationship exists when they are taken into account. For parental adipos-ity, which is known to be associated with child adiposity, the number ofsignificant results for the television viewing measure of advertising expo-sure is still large compared to the number of nonsignificant results. Thesame is true for the child’s initial adiposity, which could only be included in

290 FOOD MARKETING TO CHILDREN AND YOUTH
analyses in longitudinal studies. Prior adiposity is probably the strongestpredictor of current or future adiposity. Nonetheless, when early adiposityis taken into account, the positive association between television viewingand adiposity is statistically significant. Because television viewing is signifi-cantly associated with adiposity when a variety of other adiposity-relatedvariables, including parental and initial child adiposity, are included in theanalyses, the claim that television advertising influences adiposity cannot berejected on the basis of the current evidence.
The second approach to testing the claim is presented in Table 5-23.Here the number of results for which television advertising was significantand nonsignificant is compared as the number of television-related non-advertising, third, other adiposity-related, and all variables in the analysisincreased. Again, the counts are taken from the statistical analysis thatpredicted adiposity, included television viewing (the measure of advertisingexposure) as a predictor, and had the largest number of television-relatednonadvertising, third, and other adiposity-related variables in the analysis.For the television-related nonadvertising variables, as more variables ofthat type were included, from none to three, the percentage of significantresults tended to increase. For third variables, as the number of variablesincreased from one to four, the percentage of significant results decreasedfrom 100 percent to 57 percent with all four third variables included in theanalysis. For other adiposity-related variables, as the number of variablesincreased from none to two, the percentage of significant results increasedsomewhat. For the total number of variables, no matter what type, exceptfor the two studies with the largest number of variables (14, 21) in whichtelevision viewing was respectively not significantly and significantly asso-ciated with adiposity, as the number of variables in the analysis increasedfrom 3 to 12, the percentage of significant results also increased. Overall,then, because in most cases television viewing remained significantly associ-ated with adiposity for the majority of results when more variables wereincluded in the analyses, the claim that television advertising influencesadiposity cannot be rejected on the basis of the evidence at hand.
In summary, the 17 results from cross-sectional and longitudinal stud-ies with medium causal inference validity provided useful—but not con-clusive—information about the likelihood that the positive associationreflected a causal relationship of exposure to television advertising on adi-posity. The majority of studies that provided evidence about plausible alter-native explanations of the statistically significant positive association be-tween exposure to television advertising and adiposity did not convincinglydemonstrate that this association was explained by these alternative vari-ables and not explained by exposure to television advertising. However, itis an unwarranted inference that alternative explanations can therefore be

INFLUENCE OF MARKETING ON DIETS AND DIET-RELATED HEALTH 291
ruled out. This is partly due to the difficulty of exhaustively including allplausible alternative explanations in any given study and partly due to thedifficulty of accurately and precisely measuring each alternative.
If, for example, television viewing had a causal influence on adipositysolely through decreasing physical activity, and no third factor or otheralternative variable mattered—including exposure to television advertis-ing—then television viewing and adiposity would be associated, but thisassociation would disappear after statistically controlling for physical activ-ity. If physical activity were measured with error, however, then the asso-ciation between television viewing and adiposity would not disappear aftercontrolling for physical activity using the imprecise measure of it. It isdifficult to measure dietary intake, physical activity, and other factors thatare plausible alternative explanations for the connection between televisionviewing and adiposity, and such measurement is rarely done with highvalidity, precision, and reliability. Thus, even though the association be-tween exposure to television advertising and adiposity continued to besignificant in the majority of studies that statistically adjusted for alterna-tive or third variables, it is still possible that this is due to measurementerror and not due to the association reflecting a causal influence of televi-sion advertising on adiposity.
Although current evidence does not allow a definite finding on thismatter, it does suggest that any causal relationship that might exist wouldconstitute a relatively small influence of exposure to television advertisingon young people’s adiposity. Two types of evidence support this inference.One is that the research examined typically explained a small rather thanlarge amount of the overall variability in adiposity among the young peoplebeing studied. For example, Storey et al. (2003) examined multivariatemodels of the relationship between demographic and lifestyle variables andadiposity using data from two national surveys. For data from the Continu-ing Survey of Food Intake for Individuals (CSFII) 1994–1996 and 1998,analyses that took into account diet, age, gender, race/ethnicity, socioeco-nomic status, and two other adiposity-related variables, in addition to tele-vision viewing, accounted for 8.5 percent of the variability in children’sadiposity and 11.4 percent of the variability in teens’ adiposity. For datafrom the NHANES III, analyses that took into account physical activity,diet, age, gender, race/ethnicity, socioeconomic status, and two other adi-posity-related variables accounted for just about the same amount of vari-ability in children’s and teens’ adiposity. Other research in the evidencebase provided varying estimates, but none indicated that all the variablesstudied together accounted for most of the variability in young people’sadiposity. Better prediction might come about through the inclusion ofmore of the influential variables and better measurement of them, but

292 FOOD MARKETING TO CHILDREN AND YOUTH
current evidence indicates that the explanatory variables at hand, includingexposure to television advertising, altogether do not account for a substan-tial amount of the variability in juvenile adiposity.
Given that exposure to television advertising is just one of the likelyinfluences on adiposity that is included in these analyses, if this exposurehas a direct causal and independent influence on adiposity, it will be smallerstill than the influence of all variables together. In fact, those studies thathave provided estimates of that influence suggest that it would be small. Forexample, Storey et al. (2003) estimated that for every additional hour ofdaily television viewing, children’s and teens’ BMI could increase by about0.2, and Dietz and Gortmaker (1985) estimated that the prevalence ofteenage obesity could increase by about 2 percent of teens. Although anycausal influence of television advertising on adiposity is likely to be verysmall, it is not necessarily inconsequential. In a national population ofabout 75 million young people under age 18 years (U.S. Census Bureau,2005), 2 percent is 1.5 million young people. With these factors in mind, ifexposure to television advertising directly influences childhood adiposity,the influence would be consequential when aggregated over the entire popu-lation of American children and teens.
In summary, as was the case when examining the influence of market-ing on precursors of diet and on diet itself, most of the research relevant tomarketing’s influence on diet-related health is about the effects of televisionadvertising of foods and beverages. The one diet-related health outcomethat has been studied to any degree is adiposity. Most of the research abouttelevision advertising and adiposity has not focused explicitly on exposureto television advertising as the causal variable, but it is amenable to use forthe committee’s purposes because it measures television viewing, which iswell correlated with exposure to television advertising (Chapter 4).
Finding: The association between adiposity and exposure to television ad-vertising remains after taking alternative explanations into account, but theresearch does not convincingly rule out other possible explanations for theassociation; therefore, current evidence is not sufficient to arrive at anyfinding about a causal relationship from television advertising to adiposityamong children and youth. It is important to note that even a small influ-ence, aggregated over the entire population of American children and youth,would be consequential in impact.
This finding is based entirely on the available research that permitsexamination of the relationship between exposure to television advertisingand adiposity. When this research is considered in the context of the re-search reviewed earlier on the relationship of television advertising to pre-cursors of diet and to diet itself, there is some basis for concluding that

INFLUENCE OF MARKETING ON DIETS AND DIET-RELATED HEALTH 293
there may be a causal connection. Moreover, as depicted in the analyticframework (see Figure 5-1) and assessed in earlier parts of this chapter,there is reason to believe that marketing influences the precursors of diet,and these precursors are associated to some degree with diet. The relation-ships between dietary deficiencies and excesses and adverse health out-comes are summarized in Chapter 2 and Appendix D.
MODERATORS OF MARKETING INFLUENCE
The systematic evidence review indicates that television advertising isrelated to the precursors of diet (e.g., food preferences), diet, and diet-related health (particularly adiposity). The question addressed in this sec-tion is whether these relationships are moderated by age, gender, race/ethnicity, or socioeconomic status. The systematic evidence review com-pared the pattern of results between different age groups across differentstudies. In this section, a narrative review considers the comparisons thatwere made within each study.
Statistically speaking, a moderator effect occurs when a relationshipbetween two variables differs according to levels of a third variable inwhich case that third variable is a moderator of the relationship betweenthe first two variables. As an example, suppose that food advertising influ-enced food preference in younger children (ages 2 to 5 years), but not inolder children and teens. In this hypothetical example, age would be amoderator of the effect of advertising on food preference.
Each study in the systematic evidence review was examined for mod-erator effects. In many studies, however, investigators did not test formoderator effects. For example, a study might test the relationship be-tween the amount of television viewing and adiposity in Hispanic/Latinoand white children. Finding that Hispanic/Latino children had greater adi-posity than white children, the study might enter race/ethnicity as a statis-tical control variable, examining the relationship between television view-ing and adiposity after adjusting for the relationship between race/ethnicityand adiposity. Such an approach does not explicitly test whether race/ethnicity is a moderator variable, that is, whether the strength of therelationship between television viewing and adiposity differs between whiteand Hispanic/Latino children. To test for a moderator effect, the studymust, in one way or another, determine whether the statistical relation-ships differ at different levels of the moderator variable.
In the review of moderators, if a study explicitly tested interactioneffects, or if the study explicitly determined whether subgroups of the largersample did or did not show differing effects, the study was considered astesting for moderator effects. The variables reviewed as potential modera-tors were age, gender, race/ethnicity, and socioeconomic status. Because
294 FOOD MARKETING TO CHILDREN AND YOUTH
moderator effects were not subjected to the same stringent analyses donefor the effects described earlier in this chapter as part of the systematicevidence review, the following should be considered a narrative review ofmoderator effects.
Age
The systematic evidence review examined whether, across studies, therewere age group differences in the influence of television food and beverageadvertising. It found that there were no differences in effects on young andolder children and that in both age groups, there were relationships be-tween food and beverage advertising and precursors of diet, diet, and diet-related health. Findings with respect to teens were not as clear because oflack of evidence or, in the case of diet, lack of effect. In the present section,studies are reviewed that analyzed for moderating effects of age.
Eight studies tested the relationship between advertising and precursorsof diet from younger to older children, with six finding that age did notmoderate the influence of television advertising. Of the two studies thatfound an effect of age as a moderator, one (Faber et al., 1984) found thatyounger children were more likely to recall a health message that was basedon fear than were older children and teens. The other study (Kunkel, 1988)found that younger children were more influenced by cereal commercialsthan were older children, although this difference disappeared when theadvertisements were presented in a host-selling format (use of the samecharacters in commercials as are featured in the adjacent program content),a tactic that is prohibited on broadcast television by the U.S. Federal Com-munications Commission (FCC, 1974). Overall, age has not been found tobe a consistent moderator of advertising effects on precursors of diet. Thisfinding is consistent with that of the systematic evidence review.
A review of the studies on the influence of advertising on diet leads toa similar finding. Of four studies that tested age as a moderator fromyounger to older children and that involved experimental use of televisionadvertising or product placement, none found that age was a significantmoderator, although all found the advertising and product placement toinfluence food and beverage choices. Two studies examined diet in relationto amount of television viewing as a measure of advertising exposure, oneusing teens and one using older children. Neither found age differences ineffects within the teen years or within the older children. Again, there is noevidence that age is a consistent moderator of the effects of televisionadvertising and again, there is little evidence with respect to teens, espe-cially in comparison to younger ages.
When the relationship of adiposity and television viewing as a measureof advertising exposure was considered, it was found that seven studies

INFLUENCE OF MARKETING ON DIETS AND DIET-RELATED HEALTH 295
tested age as a moderator. Of these, five found age to be a nonsignificantmoderator, one found a larger relationship of television viewing to adipos-ity in children ages 9 to 18 years than in children ages 5 to 8 years (Grayand Smith, 2003), and one found a larger relationship in 8-year-olds than in12-year-olds (Maffeis et al., 1998). In other words, although there is aconsistent relationship indicating that advertising exposure, as measured byamount of television viewing, is associated with adiposity in children, thereis no evidence that this relationship is consistently moderated by age. Thisconclusion is consistent with that of the systematic evidence review.
In nearly all the studies considered above, tests of age as a moderatorhave not been theoretically motivated. In particular, none of the studieshave considered the possibility that understanding of the persuasive intentbehind advertising may be important. In general, of course, such under-standing would be less in younger children. As discussed below, the mostappropriate comparisons would consider children younger and older thanage 8 years in order to test the premise that understanding of persuasiveintent may be an important moderator of advertising effects.
Persuasive Intent
Related to the moderator of age, but worthy of separate mention is theissue of the understanding of persuasive intent. This topic has been a part ofpublic policy discussions about the legitimacy of advertising to children. Atwhat point do children perceive advertising as a message category that isseparate and distinct from television programming? When do they begin toapply a degree of skepticism to their understanding of advertising claimsand appeals? Researchers have examined age-related developmental differ-ences in children’s comprehension of the nature and purpose of televisionadvertising quite extensively, affording strong confidence in the conclusionsthat can be drawn across studies.
Children must acquire two basic information processing skills to achievemature comprehension of advertising messages: capacity to discriminatecommercial from noncommercial content and ability to attribute persuasiveintent to advertising, adjusting their interpretation of commercial messagesaccordingly (Gunter et al., 2005; John, 1999; Kunkel, 2001; Young, 1990).Each of these capabilities develops over time, as a result of cognitive growthand development more than the accumulation of exposure to media content(Kunkel, 2001).
Program/Commercial Discrimination
Estimates of the age at which children can consistently discriminateadvertisements as separate and distinct from adjacent programming range

296 FOOD MARKETING TO CHILDREN AND YOUTH
from as young as age 3 years to as old as age 6 years (Gunter et al., 2005).The variability depends on the nature of the measurement strategy used bythe researcher as well as the difficulty of the particular task, which can beaffected by the advertising and programming selected for testing. For ex-ample, when both programs and advertisements employ similar animationformats, drawing perceptual distinctions may be more challenging thanwhen one format is animated and another uses live action. In general, mostreviews of research agree that children can discriminate perceptually be-tween television programming and advertising consistently by the ages of 4to 5 years (John, 1999; Kunkel, 2001; Kunkel et al., 2004).
No studies could be located that examined development of skills toidentifying advertising in print media. Presumably this is because therewould be little variance at such a task by the time children’s literacy skillshad matured to the point where they would likely encounter print advertis-ing in their natural environment. As was noted in Chapter 4, advertising tochildren is growing substantially on the Internet. In this context, however,researchers have yet to evaluate children’s ability to recognize commercialcontent. Given widespread recognition that the boundaries between com-mercial and noncommercial content are more blurred on the Internet thanin traditional print, radio, or television media, there is some reason toexpect a delay in the development of children’s ability to recognize advertis-ing on the Internet as compared to other media. This is an issue that shouldbe addressed by future research.
Comprehension of Advertising’s Persuasive Intent
Television advertising intends to persuade. Older children and adultsrecognize this concept and often use it to “discount” self-interested claimsand appeals included in commercial messages. In contrast, young childrendo not yet comprehend the persuasive intent of advertising and hence maybe more susceptible to its influence. It is important to consider the age atwhich children develop the ability to attribute persuasive intent to advertis-ing, because such knowledge should logically moderate the effects of com-mercial persuasion.
The most rudimentary aspect of children’s comprehension of persua-sive intent in advertising is the recognition that a commercial wants theviewer to buy the product. In fact, however, merely understanding that anadvertisement “intends to sell” does not represent all or even most elementsof mature comprehension of persuasive intent. The best explication of ma-ture comprehension of the persuasive intent of advertising was offered byRoberts (1983). Roberts posited four key elements that must be under-stood: (1) The source of the message has other interests and perspectives

INFLUENCE OF MARKETING ON DIETS AND DIET-RELATED HEALTH 297
than the receiver; (2) the source intends to persuade; (3) persuasive mes-sages are biased; and (4) biased messages demand different interpretivestrategies than unbiased messages. In summary, children who have devel-oped a mature ability to recognize persuasive intent in advertising recognizethe inherent bias, exaggeration, and self-interest of commercial messages,and can apply that knowledge in shaping their reactions to advertising.
The ability to recognize persuasive intent in advertising clearly requiresthe child to take the perspective of another into account. Young childrentend to be highly egocentric, and to have difficulty considering the perspec-tive of another person (Flavell, 1977; Kurdek and Rodgon, 1975; Selman,1971). Accordingly, children’s ability to produce persuasive messages thatreflect sensitivity to a listener’s perspective is highly constrained in thepreschool and early elementary years (Kline and Clinton, 1998; Weiss andSachs, 1991). It is not surprising, then, to find that young children underthe ages of approximately 7–8 years also have great difficulty recognizingthe persuasive intent that necessarily underlies all television advertising.
Numerous empirical studies (e.g., Blosser and Roberts, 1985; Donohueet al., 1978; Robertson and Rossiter, 1974; Ward et al., 1977) indicatethat at least half or more of children under the ages of 7–8 years aregenerally unable to recognize the persuasive intent of television advertis-ing, even when this skill is measured in only its most rudimentary form ofselling intent (i.e., a commercial intends to sell a product). Although muchof this research was conducted several decades ago in response to FederalTrade Commission concern with the issue, more recent studies of the topic(Bjurstrom, 1994; Gunter et al., 2005; Oates et al., 2002; Chapter 1) cor-roborate the identical patterns identified in the earlier research.
In summary, the ability to recognize persuasive intent in televisionadvertising begins to appear in its most basic form at approximately ages 7–8 years, but it is not consolidated and consistently applied until later years.Indeed, several studies have demonstrated that even when older childrenand adolescents possess mature knowledge about advertising’s persuasiveintent, such understanding is not consistently applied to effectively defendagainst commercial claims, appeals, and persuasive outcomes (Brucks et al.,1988; Derbaix and Bree, 1997; Linn et al., 1982). Moreover, although theage at which children understand persuasive intent in advertising has beenwell established for television, the issue has not yet been scrutinized on theInternet. Given the greater overall blurring of boundaries between commer-cial and noncommercial messages on the Internet, there is reason to expectthat such ability may be delayed in surfacing as compared to the develop-mental patterns established as normative for television. This is a topic thatshould be addressed by future research.

298 FOOD MARKETING TO CHILDREN AND YOUTH
Finding: Most children ages 8 years and under do not effectively compre-hend the persuasive intent of marketing messages, and most children ages4 years and under cannot consistently discriminate between television ad-vertising and programming. The evidence is currently insufficient to deter-mine whether or not this meaningfully alters the ways in which food andbeverage marketing messages influence children.
Gender
Unlike age, there are no general theoretical reasons to suppose thatboys may be differentially affected by food and beverage advertising ascompared to girls. Eight studies that examined television advertising andprecursors of diet tested gender as a potential statistical moderator. Ofthese, six studies found that gender was not significant as a moderator.Of the two finding that gender was a significant moderator, both (Millerand Busch, 1979; Pine and Nash, 2003) found that girls’ product preferencewas more influenced by advertising than was boys’. Five studies usedamount of television viewing to measure advertising exposure and testedgender as a moderator of precursors of diet: four found no significantdifferences, and one (Signorielli and Lears, 1992) found that boys weremore influenced by television in eating intention than were girls.
One study tested gender differences in the influence of television adver-tising on young children’s food consumption (Jeffrey et al., 1982). It foundthat boys were more influenced by advertising for low-nutrition productsthan were girls. When amount of television viewing was the measure ofadvertising exposure in relation to diet, six studies tested gender effects.Two found gender to be not significant as a moderator, two found effects tobe larger in boys, and two found effects to be larger in girls.
Twenty-five studies that examined the amount of television viewing (asa measure of exposure to advertising) in relation to adiposity tested gendermoderator effects. Of these, 14 found gender to be not significant as amoderator, and 8 found that girls showed larger effects than did boys.Three studies showed larger effects in boys than girls.
Although the majority of studies found that gender was not significantas a moderator, there was some slight trend for greater effects in girls thanin boys. This was particularly true for the relationship between when adver-tising exposure was measured by amount of television viewing and adipos-ity was the outcome variable. Because adiposity was nearly always mea-sured as BMI, some caution is needed in interpreting this relationship.There is some evidence that BMI may be a more appropriate measure ofadiposity in girls, especially adolescents, than in boys (Sardinha et al., 1999).

INFLUENCE OF MARKETING ON DIETS AND DIET-RELATED HEALTH 299
Nevertheless, girls may be more vulnerable than are boys to the health-related effects of television advertising (as measured by television viewing).
Race and Ethnicity
Overall, only a few studies have examined whether race and ethnicitymoderates the effects of television advertising. None of these studies haveemployed products or advertising that were identified as targeting a par-ticular racial or ethnic group. Three studies tested race and ethnicity as amoderator of the influence of advertising on precursors of diet. Two (Millerand Busch, 1979; Stoneman and Brody, 1981) found that white childrenwere more influenced by advertising than were African American children.One (Barry and Hansen, 1973) found that African American children weremore influenced than were white children. One study (Borzekowski andRobinson, 2001) found no difference between home English and Spanishspeakers in the influence of advertising.
Two studies examined race and ethnicity in considering television ad-vertising, measured by amount of television viewing, in relation to precur-sors of diet. One (Signorielli and Lears, 1992) found that minorities (Afri-can American, Hispanic/Latino) were more influenced than were whites.Another study found no race differences (Carruth et al., 1991).
Three studies tested moderating influences of race and ethnicity onthe influence of television advertising on diet. Robinson (1999) foundethnicity to be nonsignificant, Robinson and Killen (1995) found that Afri-can American and white girls were less influenced by television advertisingthan were Hispanic/Latina girls and all boys, and Signorielli and Lears(1992) found that minorities were more influenced than were whites. Twostudies examined home language as a moderator, with one finding nosignificant effect among English- and Spanish-speaking Hispanic/LatinoAmericans (Borzekowski and Poussaint, 1998), and another finding that inQuebec, English speakers were more influenced by American commercialtelevision than French speakers were (Goldberg, 1990).
With respect to the relationship between amount of television advertis-ing exposure, as measured by overall television viewing, and adiposity,seven studies examined race and ethnicity with two finding nonsignificantmoderator effects. One study found greater effects in whites than in minori-ties, one found greater effects in whites than in American Indians, onefound greater effects in African Americans and in American Indians than inwhites, and one found greater effects in African Americans than whites.
Overall, when tested, moderator effects of race/ethnicity, or home lan-guage were frequently found, but they were not consistent across studies. Inparticular, there is no consistent evidence that whites are more or lessaffected by food and beverage advertising than are minorities.

300 FOOD MARKETING TO CHILDREN AND YOUTH
Socioeconomic Status
Although studies frequently reported the socioeconomic status of theirresearch participants, and frequently used it as a control variable in analy-ses, only a few studies examined socioeconomic status as a moderator ofeffects. One study tested amount of exposure to television advertising,measured by overall viewing, in relation to precursors of diet, with nosignificant socioeconomic status moderator effect (Reid et al., 1980). Twostudies examined amount of advertising exposure, with a television view-ing measure in relation to diet, with one study of young children findingsocioeconomic status to be a nonsignificant moderator (Borzekowski andPoussaint, 1998) and another finding that low-income older children weremore influenced by television than were high-income older children(Goldberg, 1990). With respect to adiposity and television advertisingexposure (measured by viewing), one study (Muller et al., 1999) foundthat low-socioeconomic-status children showed a greater effect than didmiddle- and high-socioeconomic-status children. In sum, there is no con-sistent effect of socioeconomic status in moderating the influence of foodand beverage advertising on television. That said, few studies have testedthe moderating effect of socioeconomic status.
Summary of Moderator Effects
Moderator effects have not been tested frequently, and when they have,the most frequent finding is that they are not significant. When differencesoccur, there appears to be a somewhat greater influence of television adver-tising on girls than on boys. Age is rarely a significant moderator, and whenit is, the effects are not consistent across studies. A theoretically importantmoderator, understanding of the persuasive intent of advertising, has notbeen studied in relation to advertising influence on precursors of diet, diet,or diet-related health, although before certain ages children are not able todiscriminate between television advertising and programming or to com-prehend the persuasive intent of marketing messages. Overall, the evidenceconcerning moderator effects is insufficient to come to any findings on age,race/ethnicity, or socioeconomic status as moderators of the effects of tele-vision food and beverage advertising.
RELATIONSHIP TO OTHER RECENT ASSESSMENTS
In addition to the U.S. attention to this topic, several related reviewsof research on food and beverage marketing and childhood obesity havebeen produced in recent years in other countries and through internationalorganizations. Among these are a systematic evidence review sponsored by

INFLUENCE OF MARKETING ON DIETS AND DIET-RELATED HEALTH 301
the United Kingdom’s Food Standards Agency (Hastings et al., 2003); anarrative research review conducted by the United Kingdom’s Office ofCommunications (Ofcom), the new regulator for the UK communicationsindustries (Ofcom, 2004); a collaborative analysis of research from 20European countries sponsored by the European Commission and adminis-tered through the European Heart Network (Matthews et al., 2005); anda series of related reports published by the World Health Organization(WHO) examining the possible linkages between marketing and child-hood obesity (WHO and FAO, 2003), as well as the international regula-tory environment for addressing such concerns (Hawkes, 2004).
These international reports all concur on a number of fundamentalconclusions. First, they all find that advertising directed to children, par-ticularly on television, is heavily populated by commercials for foods thatpose adiposity and related health risks for children when consumed inabundance, although each report prefers different language for labelingsuch commodities. For example, the Ofcom (2004) report terms such foodproducts “high in fat, salt, and sugar” and uses the acronym HFSS in aneffort to be sensitive to the argument that there are no less healthful foods,whereas the European Heart Network’s report explicitly rejects such argu-ment and uses the term “unhealthy foods” to describe the dominant cat-egory of edibles marketed to children (Matthews et al., 2005). Second, allthese reports agree that food marketers spend significant resources toadvertise to children, and that children consequently have heavy exposureto such advertising. And third, they all agree (ones that address this topic)that children under age 8 years have limited ability to recognize persuasiveintent in commercials, leading to the expectation that food advertising toyoung children may be particularly effective (Hastings et al., 2003; Ofcom,2004; WHO and FAO, 2003).
On the critical question of the direct evidence linking marketing tochildren’s food consumption and to childhood obesity, the research reviewstake somewhat different paths to end up at similar points, reaching conclu-sions consonant with those established by this committee’s own analysispresented earlier in this chapter. Most of the reports employ a traditionalnarrative approach in which the relevant research is reviewed and evaluatedin interpretive fashion. Some, such as the Ofcom (2004) report, buttresstheir analysis with commissioned literature review papers prepared by me-dia effects experts (Livingstone, 2004; Livingstone and Helsper, 2004).
The key conclusion of the Ofcom report holds that television “. . . ad-vertising has a modest, direct effect on children’s food choices” (Ofcom,2004, P. 23). It notes further that indirect effects are likely to be larger, butthat there is insufficient evidence at the present time to determine their sizerelative to other factors. The WHO and FAO (2003) report concludes thatthe heavy marketing of high-calorie and low-nutrient foods and fast food

302 FOOD MARKETING TO CHILDREN AND YOUTH
outlets represents a probable increased risk for childhood obesity.This report is supported by selected background reviews (Hawkes, 2002;Swinburn et al., 2004), including an international analysis of the market-ing activities of food and beverage industries. The European Heart Net-work report (Matthews et al., 2005) does not directly engage the advertis-ing effects literature, opting instead to conclude that television “advertisingof unhealthy food to children should be prohibited” (P. 14) based solely onthe evidence of its pervasiveness in the children’s advertising environmentand implicit assumptions about its efficacy. In its recently published reportPreventing Childhood Obesity, the British Medical Association (2005)concludes that “marketing is effective in influencing food choices made bychildren and parents” (P. 27) and similarly recommends an outright banon food advertising to children because many children lack the capabilityto “make informed judgments about the advertisements they see” (P. 27).
As noted earlier, the Hastings et al. (2003) study conducted for theUnited Kingdom Food Standards Agency is the analysis most directly com-parable to the investigation this committee has pursued and reported earlierin this chapter. There were some differences between the two, in scope, indepth, and in the nature of the evidence base. For example, our committeechose not to undertake a separate systematic evidence review of the natureand extent of food advertising to children, relying instead on the extensiveinformation and consensus from work done elsewhere. On the other hand,our committee considered a substantially more extensive body of peer-reviewed evidence for its systematic review of the evidence on the influenceof food marketing on children. Despite the differences, the findings pre-sented in this chapter are fundamentally similar and certainly complemen-tary to the conclusions derived from the Hastings et al. (2003) systematicevidence review. Our more extensive base of research evidence has affordedus the ability to draw somewhat more detailed conclusions than those ofHastings et al. (2003), reflecting a natural step forward in the progress ofscience that is a function of the increased accumulation of evidence acrossstudies. Especially clear from any perspective, is the substantial need forfurther investigation in this area.
RECOMMENDATIONS FOR FUTURE RESEARCH
The systematic evidence review found that there are several importantgaps in the existing research relating marketing to diet and diet-relatedhealth. First and foremost, the great preponderance of research done todate has narrowly focused on, in marketing, television and television adver-tising, and in diet-related health, obesity. There has been almost no researchon the influence of other forms of food and beverage marketing as theyrelate to diet and diet-related health. Even within the domain of television,

INFLUENCE OF MARKETING ON DIETS AND DIET-RELATED HEALTH 303
most of the research that relates television viewing to diet and to diet-related health does not distinguish exposure to food and beverage advertis-ing from exposure to television in general. This lack of relevant researchseverely constrains the findings that can be drawn about the influence offood and beverage marketing on the diet and diet-related health of Ameri-can children and youth. For example, of the 36 results involving the effectof marketing on diet, only 2 did not involve television: one by Auty andLewis (2004) on the effects of product placement in films, and one byFrench et al. (2001a) on the effect of vending machine prices and signage onthe consumption of low-fat snacks. Of the 74 results involving the influenceof marketing on diet-related health, all involved television.
Second, although the research in this area depends crucially on accu-rately measuring dietary intake, physical activity, family habits, and otherfactors involved in the relationships among marketing, diet, and diet-related health, commonly used measures are known to be problematic andare seriously impeding the science in this area. Extremely little is knownabout how much error infects these measures, and being able to reliablytease apart and quantify the different mechanisms by which controllablefactors such as marketing, media use, or physical activity might influencediet and diet-related health depends crucially on such knowledge. For ex-ample, broad consensus exists that if television viewing affects obesity, thenit must be either through physical activity or through dietary intake. Proc-tor et al. (2003) found a significant association between television viewingand obesity, but they could not eliminate this association even after control-ling for both physical activity and diet. The only plausible explanation forthis discrepancy is measurement error for either physical activity or diet orboth. Similarly, Robinson (1999) found that an intervention that reducedthe amount of television viewing, video watching, and game playing re-sulted in a significant decrease in obesity, but he also found that, as mea-sured, there was no decrease in high-fat food intake, moderate to vigorousphysical activity, consumption of highly advertised foods, or cardio respira-tory fitness. Likewise, data on dietary intake trends for children over thepast 30 years are inconsistent, yielding different findings from differentmeasures and yielding findings that are often difficult to interpret (seeChapter 2). As discussed above in the finding to the consideration of studiesrelating marketing to diet-related health, eliminating alternative explana-tions of an association in cross-sectional studies requires accurate measure-ment of alternative mechanisms.
New Forms of Research
The committee therefore recommends that resources be made availableto support new research on food marketing and its influence on diet and

304 FOOD MARKETING TO CHILDREN AND YOUTH
diet-related health and research on improving measurement strategies forfactors involved centrally in this research. Much of this research must beinterdisciplinary and fairly large scale in nature, although some highly fo-cused small-scale research is also desirable. More specifically, the commit-tee suggests several specific forms of research that would improve ourknowledge in this area.
Broader Research
• Marketing other than television There should be extensive experi-mental and observational investigations of the influence of food market-ing practices other than television advertising. These include print adver-tising, billboard advertising, Internet advertising, advergaming, contestsand sweepstakes, kids’ clubs, product placement in movies and computergames, and product placement strategies at points of purchase.
• Health other than obesity There should be more research focusedon food marketing in relationship to overall diet as well as health outcomes,in addition to obesity, including blood lipid profiles, blood pressure, bloodsugar, vitamin and mineral status, and others in addition to adiposity.
Measurement
• Improved measurement There should be research focused on un-derstanding, reducing, and quantifying measurement error for dietary in-take, physical activity, exposure to marketing, and other factors crucial tothis research.
Intervention Research
• Healthful diet promotion Research should be conducted on inter-vention strategies promoting healthful diets that incorporate the most effec-tive and powerful techniques employed by food and beverage marketers.Research should evaluate these strategies in the context of less healthy foodand beverage choices and advertising for less healthy foods and beveragesthat remain available to young people.
Longitudinal Research
• The National Children’s Study The proposed, longitudinal studyof 100,000 American children from prenatal development to age 21 yearsshould include measures of exposure to food and beverage marketing, diet,energy expenditure, and diet-related health. More than any other panelstudy, the National Children’s Study has the potential to determine the

INFLUENCE OF MARKETING ON DIETS AND DIET-RELATED HEALTH 305
relative importance of food and beverage marketing, as compared to otherfactors in children’s lives, to diet-related health.
Separating Mechanisms
• Marketing compared to media use There is now evidence thatreducing television, video games, and video watching reduces BMI. If mar-keting has an influence, then reducing television viewing should have moreof an influence than reducing video game playing or video watching, as thelatter involve less marketing and often no marketing of foods and bever-ages. More research is needed on teasing apart effects from just participat-ing in media and effects from the marketing occurring in that media.
• Snacking and marketing There is some evidence that snackingwhile watching television may play a role in obesity. Detailed observationaland experimental research should study this phenomenon. For example, issnacking stimulated by food advertising or depictions of eating and drink-ing during television programming? Do people consume more while watch-ing television because they are distracted from monitoring internal satietysignals? Or does engagement in other kinds of activities than televisionviewing distract people from internal hunger signals?
• Parents of young children Food preferences and eating habits areto a substantial extent established in early childhood. Research is needed onparents’ knowledge of healthful nutrition for children and on feeding prac-tices during infancy and the preschool years. A special focus should be puton first-time parents and the degree to which their feeding practices areshaped by food and beverage marketing.
• Persuasive intent Children’s understanding of the persuasive intentof television advertising has been suggested as a likely moderator of effects,but no systematic research has yet been pursued to elucidate this relation-ship. Such investigation is warranted to better understand whether thedeveloping child’s ability to comprehend the inherent bias and exaggerationof advertising is important in helping children to defend more effectivelyagainst commercial persuasion. Given the migration of child-directed foodand beverage to other forms of marketing across a diverse range of newmedia and advertising contexts, it may be equally valuable to investigatethe possible moderating effect of persuasive intent attribution in mediacontexts other than television. Such evidence may be particularly importantbecause many of these new forms of marketing are less transparent andregulated than is television advertising. Given the greater blurring of bound-aries between commercial and noncommercial content on new media suchas the Internet (Chapter 4), the age of effective comprehension of persua-sive intent of these new forms may be considerably older than that fortelevision advertising.

306 FOOD MARKETING TO CHILDREN AND YOUTH
Family Studies
• Modern family life In-depth family studies should be undertakento understand how marketing influences food and beverage purchases, foodand beverage availability in the home, meal preparation, and snacks. Thesestudies should take into account the time and financial pressures on themodern American family.
In the process of carrying out the systematic evidence review, the com-mittee identified several areas in which additional research was needed inorder to address various elements of the committee’s charge. It also realizedthat changes to research methods could increase the relevance of the re-search to the committee’s purposes. These areas and changes have beendescribed in this section.
Finding: New research is needed on food and beverage marketing and itsimpact on diet and diet-related health and on improving measurementstrategies for factors involved centrally in this research. Much of this re-search must be interdisciplinary and fairly large-scale in nature, althoughsome highly-focused small-scale research is also desirable. Among the spe-cific research needed are studies of newer promotion techniques, newervenues, and healthier products and portion sizes.
SUMMARY
This chapter has focused on the identification and assessment of theresearch evidence about the influence of food and beverage marketing onthe diets and diet-related health of children and youth. The committeeconducted a wide search, including online databases, literature reviews, andoutreach to experts, to identify a set of relevant and important researchevidence. An explicit selection process identified studies to be included inthe review. Using a causal framework and a systematic evidence reviewprocess, the committee assessed the available evidence on the influence offood and beverage marketing on young people’s diets and diet-relatedhealth.
The committee found a large body of peer-reviewed, published research(155 results from 123 studies). The research spans more than three decades,from the 1970s to the present. Results from earlier research are broadlyconsistent with more recent research in the same area. All three mainresearch designs—experimental, cross-sectional, and longitudinal—wereemployed, such that the usual limitations associated with a particularapproach are counterbalanced by other approaches. All but 6 of the 155results had television advertising as the marketing variable.

INFLUENCE OF MARKETING ON DIETS AND DIET-RELATED HEALTH 307
In general, quality ratings were reasonably good across the spectrum ofcategories included in the systematic evidence review; with one exception,the numbers of high- and medium-quality ratings were equal to or greaterthan the numbers of low ratings for measure quality, causal inference valid-ity, and ecological validity. As anticipated, many results from cross-sectional observational and longitudinal studies were rated low on causalinference validity, and many results from experiments were rated low onecological validity—typical for the respective designs employed. The re-search results included in the systematic evidence review were of sufficientquality, diversity, and scope to support several findings about the influenceof marketing. The overall finding from the research was that food andbeverage marketing influences the preferences and purchase requests ofchildren, influences consumption at least in the short term, is a likely con-tributor to less healthful diets, and may contribute to negative diet-relatedhealth outcomes and risks. The overall finding is drawn from a systematicevidence review of research in three areas, and the findings from these threeareas provide more specific information in support of the general finding.
With respect to the specific influence of food and beverage marketingon the precursors (e.g., food preferences and purchase requests) ofyoung people’s diet, a systematic evidence review supported the followingfindings:
• There is strong evidence that television advertising influences thefood and beverage preferences of children ages 2–11 years. There is insuffi-cient evidence about its influence on the preferences of teens ages 12–18 years.
• There is strong evidence that television advertising influences thefood and beverage purchase requests of children ages 2–11 years. There isinsufficient evidence about its influence on the purchase requests of teensages 12–18 years.
• There is moderate evidence that television advertising influencesthe food and beverage beliefs of children ages 2–11 years. There is insuffi-cient evidence about its influence on the beliefs of teens ages 12–18 years.
• Given the findings from the systematic evidence review of the influ-ence of marketing on the precursors of diet, and given the evidence fromcontent analyses that the preponderance of television food and beverageadvertising relevant to children and youth promotes high-calorie and low-nutrient products, it can be concluded that television advertising influenceschildren to prefer and request high-calorie and low-nutrient foods andbeverages.

308 FOOD MARKETING TO CHILDREN AND YOUTH
With respect to the specific influence of food and beverage marketingon young people’s diets, a systematic evidence review supported the follow-ing findings:
• There is strong evidence that television advertising influences theshort-term consumption of children ages 2–11 years. There is insufficientevidence about its influence on the short-term consumption of teens ages12–18 years.
• There is moderate evidence that television advertising influencesthe usual dietary intake of younger children ages 2–5 years and weak evi-dence that it influences the usual dietary intake of older children ages 6–11 years. There is also weak evidence that it does not influence the usualdietary intake of teens ages 12–18 years.
With respect to the specific influence of food and beverage marketingon young people’s diet-related health, a systematic evidence review reliedon research investigating the relation between amount of television view-ing, among other variables, and diet-related health. Amount of televisionviewing is highly correlated with amount of exposure to television advertis-ing and is frequently used as a measure of advertising exposure. The commit-tee’s purposes are served by reviewing research about television viewingand diet-related health, but findings about advertising effects are difficultbecause of measurement quality, alternative explanations of findings, andother factors. With these caveats noted, the systematic evidence reviewsupported the following findings:
• Statistically, there is strong evidence that exposure to televisionadvertising is associated with adiposity in children ages 2–11 years andteens ages 12–18 years.
• The association between adiposity and exposure to television ad-vertising remains after taking alternative explanations into account, but theresearch does not convincingly rule out other possible explanations for theassociation; therefore, current evidence is not sufficient to arrive at anyfinding about a causal relationship from television advertising to adiposity.It is important to note that even a small influence, aggregated over theentire population of American children and youth, would be consequentialin impact.
In addition to conducting a systematic evidence review of the researchexamining the relationships of marketing to the precursors of diet, to diet,and to diet-related health, the committee conducted a narrative review ofthis research and other relevant research in order to understand the role of
INFLUENCE OF MARKETING ON DIETS AND DIET-RELATED HEALTH 309
moderators in altering the marketing relationships. The committee foundthe literature too small altogether and too varied in topic to support anyconclusions about the ways in which differences in age, gender, race/ethnicity (including home language), and socioeconomic status may alter(moderate) the influence of marketing on these precursors. However, withrespect to age, the committee found that:
• Most children ages 8 years and under do not effectively compre-hend the persuasive intent of marketing messages, and most children ages4 years and under cannot consistently discriminate between television ad-vertising and programming. The evidence is currently insufficient to deter-mine whether or not this meaningfully alters the ways in which food andbeverage marketing messages influence children.
Finally, both the systematic evidence review and the narrative reviewrevealed areas in which new research is needed, as well as the characteristicsof research that is most likely to be helpful to committees addressing chargessuch as ours. Specific recommendations for future research are offered in apreceding section. The committee’s overall finding is as follows:
• New research is needed on food and beverage marketing and itsimpact on diet and diet-related health and on improving measurementstrategies for factors involved centrally in this research. Much of this re-search must be interdisciplinary and fairly large-scale in nature, althoughsome highly-focused small-scale research is also desirable. Among the spe-cific research needed are studies of newer promotion techniques, newervenues, and healthier products and portion sizes.
REFERENCES
*Andersen RE, Crespo CJ, Bartlett SJ, Cheskin LJ, Pratt M. 1998. Relationship of physicalactivity and television watching with body weight and level of fatness among children:Results from the Third National Health and Nutrition Examination Survey. J Am MedAssoc 279(12):938–942.
*Anderson DR, Huston AC, Schmitt KL, Linebarger DL, Wright JC. 2001. Early childhoodtelevision viewing and adolescent behavior: The recontact study. Mon Soc Res ChildDev 66(1):I–VIII, 1–147.
*Armstrong CA, Sallis JF, Alcaraz JE, Kolody B, McKenzie TL, Hovell MF. 1998. Children’stelevision viewing, body fat, and physical fitness. Am J Health Promot 12(6):363–368.
ATSDR (Agency for Toxic Substances and Disease Registry). 2002. Analytical Methods.[Online]. Available at: http://www.atsdr.cdc.gov/toxprofiles/tp13-c6.pdf [accessed Octo-ber 14, 2005].
*These references are studies included in the systematic evidence review.

310 FOOD MARKETING TO CHILDREN AND YOUTH
*Auty S, Lewis C. 2004. Exploring children’s choice: The reminder effect of product place-ment. Psychol Market 21(9):697–713.
*Bao Y, Shao AT. 2002. Nonconformity advertising to teens. J Ad Res 42(3):56–65.*Barry TE, Gunst RF. 1982. Children’s advertising: The differential impact of appeal strat-
egy. Current Issues Res Ad 5:113–125.Barry TE, Hansen RW. 1973. How race affects children’s TV commercials. J Ad Res 13(5):
63–67.*Berkey CS, Rockett HR, Field AE, Gillman MW, Frazier AL, Camargo CA Jr, Colditz GA.
2000. Activity, dietary intake, and weight changes in a longitudinal study of preadoles-cent and adolescent boys and girls. Pediatrics 105(4):E56.
*Berkey CS, Rockett HR, Gillman MW, Colditz GA. 2003. One-year changes in activity andin inactivity among 10- to 15-year-old boys and girls: Relationship to change in bodymass index. Pediatrics 111(4 Pt 1):836–843.
Bjurstrom E. 1994. Children and Television Advertising. Report No. 1994/95:8. Stockholm,Sweden: Swedish Consumer Agency.
Blosser BJ, Roberts DF. 1985. Age differences in children’s perceptions of message intent.Responses to TV news, commercials, educational spots, and public service announce-ments. Commun Res 12(4):455–484.
*Bogaert N, Steinbeck KS, Baur LA, Brock K, Bermingham MA. 2003. Food, activity andfamily—environmental vs. biochemical predictors of weight gain in children. Eur J ClinNutr 57(10):1242–1249.
*Bolton RN. 1983. Modeling the impact of television food advertising on children’s diets.Current Issues and Research in Advertising 6(1):173–199.
*Borzekowski DLG, Poussaint AF. 1998. Latino American Preschoolers and the Media. Phila-delphia, PA: Annenberg Public Policy Center of the University of Pennsylvania.
*Borzekowski DL, Robinson TN. 2001. The 30-second effect: An experiment revealing theimpact of television commercials on food preferences of preschoolers. J Am Diet Assoc101(1):42–46.
*Boynton-Jarrett R, Thomas TN, Peterson KE, Wiecha J, Sobol AM, Gortmaker SL. 2003.Impact of television viewing patterns on fruit and vegetable consumption among adoles-cents. Pediatrics 112(6 Pt 1):1321–1326.
British Medical Association. 2005. Preventing Childhood Obesity. London, UK: British Medi-cal Association.
*Brody GH, Stoneman Z, Lane TS, Sanders AK. 1981. Television food commercials aimed atchildren, family grocery shopping, and mother–children interactions. Family Relations30:435–439.
Brucks M, Armstrong GM, Goldberg ME. 1988. Children’s use of cognitive defenses againsttelevision advertising: A cognitive response approach. J Consum Res 14:471–482.
*Burke V, Beilin LJ, Simmer K, Oddy WH, Blake KV, Doherty D, Kendall GE, Newnham JP,Landau LI, Stanley FJ. 2005. Predictors of body mass index and associations with car-diovascular risk factors in Australian children: A prospective cohort study. Int J ObesRelat Metab Disord 29(1):15–23.
*Cantor J. 1981. Modifying children’s eating habits through television ads: Effects of humor-ous appeals in a field setting. J Broadcasting 23(1):37–47.
*Carruth BR, Goldberg DL, Skinner JD. 1991. Do parents and peers mediate the influence oftelevision advertising on food-related purchases? J Adolesc Res 6(2):253–271.
*Christenson PG. 1982. Children’s perceptions of TV commercials and products. The effectsof PSAs. Commun Res 9(4):491–524.
*Clancy-Hepburn K, Hickey AA, Nevill G. 1974. Children’s behavior responses to TV foodadvertisements. J Nutr Ed 6(3):93–96.

INFLUENCE OF MARKETING ON DIETS AND DIET-RELATED HEALTH 311
*Clarke TK. 1984. Situational factors affecting preschoolers’ responses to advertising. J AcadMarketing Sci 12(4):25–40.
*Coon KA, Goldberg J, Rogers BL, Tucker KL. 2001. Relationships between use of televisionduring meals and children’s food consumption patterns. Pediatrics 107(1):e7.
*Crespo CJ, Smit E, Troiano RP, Bartlett SJ, Macera CA, Andersen RE. 2001. Televisionwatching, energy intake, and obesity in US children: Results from the third NationalHealth and Nutrition Examination Survey, 1988–1994. Arch Pediatr Adolesc Med155(3):360–365.
*Crooks DL. 2000. Food consumption, activity, and overweight among elementary schoolchildren in an Appalachian Kentucky community. Am J Phys Anthropol 112(2):159–170.
Cullen KW, Baranowski T, Owens E, Marsh T, Rittenberry L, de Moor C. 2003. Availability,accessibility, and preferences for fruit, 100% fruit juice, and vegetables influence chil-dren’s dietary behavior. Health Ed Behav 30(5):615–626.
*Dawson BL, Jeffrey DB, Walsh JA. 1988. Television food commercials’ effect on children’sresistance to temptation. J Appl Soc Psychol 18(16):1353–1360.
*Deheeger M, Rolland-Cachera MF, Fontvieille AM. 1997. Physical activity and body com-position in 10 year old French children: Linkages with nutritional intake? Int J ObesRelat Metab Disord 21(5):372–379.
*Dennison BA, Erb TA, Jenkins PL. 2002. Television viewing and television in bedroomassociated with overweight risk among low-income preschool children. Pediatrics 109(6):1028–1035.
Derbaix C, Bree J. 1997. The impact of children’s affective reactions elicited by commercialson attitudes toward the advertisement and the brand. Int J Res Marketing 14:207–229.
*Dietz WH Jr, Gortmaker SL. 1985. Do we fatten our children at the television set? Obesityand television viewing in children and adolescents. Pediatrics 75(5):807–812.
*Donkin AJM, Neale RJ, Tilston C. 1993. Children’s food purchase requests. Appetite21(3):291–294.
*Donohue TR. 1975. Effect of commercials on black children. J Advertising Res 15(6):41–47.Donohue TR, Meyer TP, Henke LL. 1978. Black and white children: Perceptions of TV
commercials. J Marketing 42(4):34–40.*Dowda M, Ainsworth BE, Addy CL, Saunders R, Riner W. 2001. Environmental influences,
physical activity, and weight status in 8- to 16-year-olds. Arch Pediatr Adolesc Med155(6):711–717.
*duRant RH, Baranowski T, Johnson M, Thompson WO. 1994. The relationship amongtelevision watching, physical activity, and body composition of young children. Pediat-rics 94(4 Pt 1):449–455.
*duRant RH, Thompson WO, Johnson M, Baranowski T. 1996. The relationship amongtelevision watching, physical activity, and body composition of 5- or 6-year-old chil-dren. Pediatric Exerc Sci 8:15–26.
*Dwyer JT, Stone EJ, Yang M, Feldman H, Webber LS, Must A, Perry CL, Nader PR, ParcelGS. 1998. Predictors of overweight and overfatness in a multiethnic pediatric popula-tion. Child and Adolescent Trial for Cardiovascular Health Collaborative ResearchGroup. Am J Clin Nutr 67(4):602–610.
*Eisenmann JC, Bartee RT, Wang MQ. 2002. Physical activity, TV viewing, and weight inU.S. youth: 1999 Youth Risk Behavior Survey. Obes Res 10(5):379–385.
*Faber RJ, Meyer TP, Miller MM. 1984. The effectiveness of health disclosures withinchildren’s television commercials. J Broadcasting 28(4):463–476.
FCC (U.S. Federal Communications Commission). 1974. Children’s television programs: Re-port and policy statement. Federal Register 39:39396–39409.
Fisher JO, Birch LL. 1995. Fat preferences and fat consumption of 3-year-old to 5-year-oldchildren are related to parental adiposity. J Am Diet Assoc 95(7):759–764.
Flavell JH. 1977. Cognitive Development. Englewood Cliffs, NJ: Prentice-Hall.

312 FOOD MARKETING TO CHILDREN AND YOUTH
*Fontvieille AM, Kriska A, Ravussin E. 1993. Decreased physical activity in Pima Indiancompared with Caucasian children. Int J Obes Relat Metab Disord 17(8):445–452.
*Francis LA, Lee Y, Birch LL. 2003. Parental weight status and girls’ television viewing,snacking, and body mass indexes. Obes Res 11(1):143–151.
*French SA, Jeffery RW, Story M, Breitlow KK, Baxter JS, Hannan P, Snyder MP. 2001a.Pricing and promotion effects on low-fat vending snack purchases: The CHIPS Study.Am J Public Health 91(1):112–117.
*French SA, Story M, Neumark-Sztainer D, Fulkerson JA, Hannan P. 2001b. Fast foodrestaurant use among adolescents: Associations with nutrient intake, food choices andbehavioral and psychosocial variables. Int J Obes Relat Metab Disord 25(12):1823–1833.
*Galst JP. 1980. Television food commercials and pro-nutritional public service announce-ments as determinants of young children’s snack choices. Child Dev 51:935–938.
*Galst JP, White MA. 1976. The unhealthy persuader: The reinforcing value of television andchildren’s purchase-influencing attempts at the supermarket. Child Dev 47:1089–1096.
*Giammattei J, Blix G, Marshak HH, Wollitzer AO, Pettitt DJ. 2003. Television watchingand soft drink consumption: Associations with obesity in 11- to 13-year-old schoolchil-dren. Arch Pediatr Adolesc Med 157(9):882–886.
Glymour CN, Cooper GF. 1999. Causation, Computation, and Discovery. Menlo Park, CA:AAAI Press.
*Goldberg ME. 1990. A quasi-experiment assessing the effectiveness of TV advertising di-rected to children. J Marketing Res 27(4):445–454.
*Goldberg ME, Gorn GJ, Gibson W. 1978. TV messages for snack and breakfast foods: Dothey influence children’s preferences? J Consum Res 5:73–81.
*Gordon-Larsen P, Adair LS, Popkin BM. 2002. Ethnic differences in physical activity andinactivity patterns and overweight status. Obes Res 10(3):141–149.
*Gorn GJ, Florsheim R. 1985. The effects of commercials for adult products on children. JConsumer Res 11(4):962–967.
*Gorn GJ, Goldberg ME. 1980. Children’s responses to repetitive television commercials. JConsum Res 6:421–424.
*Gorn GJ, Goldberg ME. 1982. Behavioral evidence of the effects of televised food messageson children. J Consum Res 9:200–205.
*Gortmaker SL, Must A, Sobol AM, Peterson K, Colditz GA, Dietz WH. 1996. Televisionviewing as a cause of increasing obesity among children in the United States, 1986–1990. Arch Pediatr Adolesc Med 150(4):356–362.
*Gracey D, Stanley N, Burke V, Corti B, Beilin LJ. 1996. Nutritional knowledge, beliefs, andbehaviours in teenage school students. Health Ed Res 11(2):187–204.
*Graf C, Koch B, Dordel S, Schindler-Marlow S, Icks A, Schuller A, Bjarnason-Wehrens B,Tokarski W, Predel HG. 2004. Physical activity, leisure habits and obesity in first-gradechildren. Eur J Cardiovasc Prev Rehabil 11(4):284–290.
*Gray A, Smith C. 2003. Fitness, dietary intake, and body mass index in urban NativeAmerican youth. J Am Diet Assoc 103(9):1187–1191.
*Greenberg BS, Brand JE. 1993. Television news and advertising in schools: The ChannelOne controversy. J Commun 43(1):143–151.
Grimm GC, Harnack L, Story M. 2004. Factors associated with soft drink consumption inschool-aged children. J Am Diet Assoc 104(8):1244–1249.
*Grund A, Dilba B, Forberger K, Krause H, Siewers M, Rieckert H, Muller MJ. 2000.Relationships between physical activity, physical fitness, muscle strength and nutritionalstate in 5- to 11-year-old children. Eur J Appl Physiol 82(5-6):425–438.
*Guillaume M, Lapidus L, Bjorntorp P, Lambert A. 1997. Physical activity, obesity, andcardiovascular risk factors in children. The Belgian Luxembourg Child Study II. ObesRes 5(6):549–556.

INFLUENCE OF MARKETING ON DIETS AND DIET-RELATED HEALTH 313
Gunter B, Oates C, Blades M. 2005. Advertising to Children on TV. Content, Impact, andRegulation. Mahwah, NJ: Lawrence Erlbaum Associates.
*Halford JC, Gillespie J, Brown V, Pontin EE, Dovey TM. 2004. Effect of television adver-tisements for foods on food consumption in children. Appetite 42(2):221–225.
*Harrison K. 2005. Is ‘fat free’ good for me? A panel study of television viewing and children’snutritional knowledge and reasoning. Health Commun 17(2):117–132.
Harvey-Berino J, Hood V, Rourke J, Terrance T, Dorwaldt A, Secker-Walker R. 1997. Foodpreferences predict eating behavior of very young Mohawk children. J Am Diet Assoc97(7):750–753.
Harwood EM, Erickson DJ, Fabian LE, Jones-Webb R, Slater S, Chaloupka FJ. 2003. Effectsof communities, neighborhoods and stores on retail pricing and promotion of beer. JStud Alcohol 64(5):720–726.
Hastings G, Stead M, McDermott L, Forsyth A, MacKintosh A, Rayner M, Godfrey C,Caraher M, Angus K. 2003. Review of Research on the Effects of Food Promotion toChildren. Glasgow, UK: Center for Social Marketing, University of Strathclyde.
Hawkes C. 2002. Marketing activities of global soft drink and fast food companies in emerg-ing markets: A review. In: Uusitalo U, ed. Globalization, Diets, and Non-CommunicableDiseases. Geneva: World Health Organization.
Hawkes C. 2004. Marketing Food to Children: The Global Regulatory Environment. Geneva:World Health Organization.
*Hernandez B, Gortmaker SL, Colditz GA, Peterson KE, Laird NM, Parra-Cabrera S. 1999.Association of obesity with physical activity, television programs and other forms ofvideo viewing among children in Mexico City. Int J Obes Relat Metab Disord 23(8):845–854.
*Heslop LA, Ryans AB. 1980. A second look at children and the advertising of premiums. JConsumer Res 6(4):414–420.
*Hitchings E, Moynihan PJ. 1998. The relationship between television food advertisementsrecalled and actual foods consumed by children. J Hum Nutr Diet 11:511–517.
Holland P. 1986. Statistics and Causal Inference. J Am Statistical Assoc 81:945–970.*Horn OK, Paradis G, Potvin L, Macaulay AC, Desrosiers S. 2001. Correlates and predictors
of adiposity among Mohawk children. Prev Med 33(4):274–281.*Hoy MG, Young CE, Mowen JC. 1986. Animated host-selling advertisements: Their impact
on young children’s recognition, attitudes, and behavior. J Pub Policy Marketing 5:171–184.
*Isler L, Popper ET, Ward S. 1987. Children’s purchase requests and parental responses:Results from a diary study. J Advert Res 27(5):28–39.
*Janz KF, Levy SM, Burns TL, Torner JC, Willing MC, Warren JJ. 2002. Fatness, physicalactivity, and television viewing in children during the adiposity rebound period: theIowa Bone Development Study. Prev Med 35(6):563–571.
*Jeffrey DB, McLellarn RW, Fox DT. 1982. The development of children’s eating habits: Therole of television commercials. Health Ed Q 9(2 suppl 3):174–189.
John D. 1999. Consumer socialization of children: A retrospective look at twenty-five yearsof research. J Consumer Res 26(3):183–213.
*Kant AK, Graubard BI. 2003. Predictors of reported consumption of low-nutrient-densityfoods in a 24-h recall by 8–16 year old US children and adolescents. Appetite 41(2):175–180.
*Katzmarzyk PT, Malina RM, Song TM, Bouchard C. 1998. Television viewing, physicalactivity, and health-related fitness of youth in the Quebec Family Study. J Adolesc Health23(5):318–325.
*Kaur H, Choi WS, Mayo MS, Harris KJ. 2003. Duration of television watching is associatedwith increased body mass index. J Pediatr 143(4):506–511.

314 FOOD MARKETING TO CHILDREN AND YOUTH
*Klein-Platat C, Oujaa M, Wagner A, Haan MC, Arveiler D, Schlienger JL, Simon C. 2005.Physical activity is inversely related to waist circumference in 12-y-old French adoles-cents. Int J Obes Relat Metab Disord 29(1):9–14.
Kline SL, Clinton BL. 1998. Developments in children’s persuasive message practices. Com-mun Ed 47(April):120–136.
*Krassas GE, Tzotzas T, Tsametis C, Konstantinidis T. 2001. Determinants of body massindex in Greek children and adolescents. J Pediatr Endocrinol Metab 14(suppl 5):1327–1333.
*Kunkel D. 1988. Children and host-selling television commercials. Commun Res 15(1):71–92.
Kunkel D. 2001. Children and television advertising. In: Singer DG, Singer JL, eds. Hand-book of Children and the Media. Thousand Oaks, CA: Sage Publications. Pp. 375–393.
Kunkel D, Wilcox BL, Cantor J, Palmer E, Linn S, Dowrick P. 2004. Report of The APATask Force on Advertising and Children. Section: Psychological Issues in the Increas-ing Commercialization of Childhood. [Online]. Available at: http://www.apa.org/re-leases/childrenads.pdf [accessed September 3, 2004].
Kurdek LA, Rodgon MM. 1975. Perceptual, cognitive, and affective perspective taking inkindergarten through sixth-grade children. Dev Psychol 11(5):643–650.
*Levin S, Martin MW, Riner WF. 2004. TV viewing habits and body mass index amongSouth Carolina Head Start children. Ethn Dis 14(3):336–339.
*Lewis MK, Hill AJ. 1998. Food advertising on British children’s television: A content analy-sis and experimental study with nine-year olds. Int J Obes Relat Metab Disord 22(3):206–214.
*Lin BH, Huang CL, French SA. 2004. Factors associated with women’s and children’s bodymass indices by income status. Int J Obes Relat Metab Disord 28(4):536–542.
Linn MC, de Benedictis T, Delucchi K. 1982. Adolescent reasoning about advertisements:Preliminary investigations. Child Dev 53:1599–1613.
Livingstone S. 2004. Appendix 1. A commentary on the research evidence regarding theeffects of food promotion on children. In: Office of Communications (Ofcom). Child-hood Obesity—Food Advertising in Context. Children’s Food Choices, Parents’ Under-standing and Influence, and the Role of Food Promotion. London, UK: Ofcom.
Livingstone S, Helsper E. 2004. Appendix 2. Advertising foods to children: Understandingpromotion in the context of children’s daily lives. In: Office of Communications (Ofcom).Childhood Obesity—Food Advertising in Context. Children’s Food Choices, Parents’Understanding and Influence, and the Role of Food Promotion. London, UK: Ofcom.
*Locard E, Mamelle N, Billette A, Miginiac M, Munoz F, Rey S. 1992. Risk factors of obesityin a five year old population. Parental versus environmental factors. Int J Obes RelatMetab Disord 16(10):721–729.
*Macklin MC. 1990. The influence of model age on children’s reactions to advertising stimuli.Psychol Marketing 7(4):295–310.
*Macklin MC. 1994. The effects of an advertising retrieval cue on young children’s memoryand brand evaluations. Psychol Marketing 11(3):291–311.
*Maffeis C, Talamini G, Tato L. 1998. Influence of diet, physical activity and parents’ obesityon children’s adiposity: A four-year longitudinal study. Int J Obes Relat Metab Disord22(8):758–764.
*Manios Y, Yiannakouris N, Papoutsakis C, Moschonis G, Magkos F, Skenderi K, ZampelasA. 2004. Behavioral and physiological indices related to BMI in a cohort of primaryschoolchildren in Greece. Am J Hum Biol 16(6):639–647.
*Matheson DM, Killen JD, Wang Y, Varady A, Robinson TN. 2004. Children’s food con-sumption during television viewing. Am J Clin Nutr 79(6):1088–1094.
Matthews A, Cowburn G, Rayner M, Longfield J, Powell C. 2005. The Marketing of Un-healthy Food to Children in Europe. A Report of Phase 1 of ‘The Children, Obesity andAssociated Avoidable Chronic Diseases’ Project. Brussels: European Heart Network.

INFLUENCE OF MARKETING ON DIETS AND DIET-RELATED HEALTH 315
*McMurray RG, Harrell JS, Deng S, Bradley CB, Cox LM, Bangdiwala SI. 2000. The influ-ence of physical activity, socioeconomic status, and ethnicity on the weight status ofadolescents. Obes Res 8(2):130–139.
*Miller JH, Busch P. 1979. Host selling vs. premium TV commercials: An experimentalevaluation of their influence on children. J Market Res 16(3):323–332.
*Morton HN. 1990. A survey of the television viewing habits, food behaviours, and percep-tion of food advertisements among south Australian year 8 high school students. JHome Econ Assoc Australia 22(2):34–36.
*Muller MJ, Koertzinger I, Mast M, Langnase K, Grund A. 1999. Physical activity and diet in5 to 7 years old children. Pub Health Nutr 2(3A):443–444.
Murphy AS, Youatt JP, Hoerr SL, Sawyer CA, Andrews SL. 1995. Kindergarten students’food preferences are not consistent with their knowledge of the Dietary Guidelines. J AmDiet Assoc 95(2):219–223.
Neumark-Sztainer D, Wall M, Perry C, Story M. 2003. Correlates of fruit and vegetableintake among adolescents. Findings from Project EAT. Prev Med 37(3):198–208.
*Norton PA, Falciglia GA, Ricketts C. 2000. Motivational determinants of food preferencesin adolescents and pre-adolescents. Ecology Food Nutr 39(3):169–182.
Oates C, Blades M, Gunter B. 2002. Children and television advertising: When do theyunderstand persuasive intent? J Consum Behav 1(3):238–245.
*Obarzanek E, Schreiber GB, Crawford PB, Goldman SR, Barrier PM, Frederick MM, LakatosE. 1994. Energy intake and physical activity in relation to indexes of body fat: TheNational Heart, Lung, and Blood Institute Growth and Health Study. Am J Clin Nutr60(1):15–22.
Ofcom (Office of Communications). 2004. Childhood Obesity—Food Advertising in Con-text. Children’s Food Choices, Parents’ Understanding and Influence, and the Role ofFood Promotion. London, UK: Ofcom.
*O’Loughlin J, Gray-Donald K, Paradis G, Meshefedjian G. 2000. One- and two-year predic-tors of excess weight gain among elementary schoolchildren in multiethnic, low-income,inner-city neighborhoods. Am J Epidemiol 152(8):739–746.
*Palmer EL, McDowell CN. 1981. Children’s understanding of nutritional information pre-sented in breakfast cereal commercials. J Broadcasting 25(3):295–301.
*Pate RR, Ross JG. 1987. Factors associated with health-related fitness. The National Chil-dren and Youth Fitness Study II. J Physical Ed Recreat Dance 58:93–95.
Pearl J. 2000. Causality: Models, Reasoning, and Inference. New York: Cambridge UniversityPress.
*Peterson PE, Jeffrey DB, Bridgwater CA, Dawson B. 1984. How pronutrition televisionprogramming affects children’s dietary habits. Dev Psychol 20(1):55–63.
Petticrew M. 2001. Systematic reviews from astronomy to zoology: Myths and misconcep-tions. Br Med J 322(7278):98–101.
*Pine KJ, Nash A. 2003. Barbie or Betty? Preschool children’s preference for branded prod-ucts and evidence for gender-linked differences. Dev Behav Pediatr 24(4):219–224.
*Proctor MH, Moore LL, Gao D, Cupples LA, Bradlee ML, Hood MY, Ellison RC. 2003.Television viewing and change in body fat from preschool to early adolescence: TheFramingham Children’s Study. Int J Obes Relat Metab Disord 27(7):827–833.
*Reid LN, Bearden WO, Teel JE. 1980. Family income, TV viewing and children’s cerealratings. Journalism Q 57(2):327–330.
*Reilly JJ, Armstrong J, Dorosty AR, Emmett PM, Ness A, Rogers I, Steer C, Sherriff A.2005. Early life risk factors for obesity in childhood: Cohort study. Br Med J 330(7504):1357–1364.
*Resnik A, Stern BL. 1977. Children’s television advertising and brand choice: A laboratoryexperiment. J Advertisng 6:11–17.

316 FOOD MARKETING TO CHILDREN AND YOUTH
*Ritchey N, Olson C. 1983. Relationships between family variables and children’s preferencefor and consumption of sweet foods. Ecology Food Nutr 13:257–266.
Roberts DF, Foehr UG, Rideout V. 2005. Generation M: Media in the Lives of 8–18 YearOlds. Menlo Park, CA: Henry J. Kaiser Family Foundation.
Roberts P. 1983. Children and commercials: Issues, evidence, interventions. Prevention HumServices 2:19–35.
Robertson TS, Rossiter JR. 1974. Children and commercial persuasion: An attribution theoryanalysis. J Consumer Res 1(1):13–20.
Robins JM. 1988. Confidence intervals for causal parameters. Stat Med 7(7):773–785.*Robinson TN. 1999. Reducing children’s television viewing to prevent obesity. A random-
ized controlled trial. J Am Med Assoc 282(16):1561–1567.*Robinson TN, Killen JD. 1995. Ethnic and gender differences in the relationships between
television viewing and obesity, physical activity, and dietary fat intake. J Health Educ26(2):S91–S98.
*Robinson TN, Hammer LD, Killen JD, Kraemer HC, Wilson DM, Hayward C, Taylor CB.1993. Does television viewing increase obesity and reduce physical activity? Cross-sec-tional and longitudinal analyses among adolescent girls. Pediatrics 91(2):273–280.
Rosenbaum PR. 2002. Observational Studies. 2nd ed. New York: Springer.Ross H, Chaloupka FJ. 2003. The effect of cigarette prices on youth smoking. Health Econ
12(3):217–230.*Ross RP, Campbell T, Huston-Stein A, Wright JC. 1981. Nutritional misinformation of
children: A developmental and experimental analysis of the effects of televised foodcommercials. J Appl Dev Psychol 1:329–347.
Rubin D. 1974. Estimating causal effects of treatments in randomized and nonrandomizedstudies. J Ed Psychol 66:688–701.
Sardinha LB, Going SB, Teixeira PJ, Lohman TG. 1999. Receiver operating characteristicanalysis of body mass index, triceps skinfold thickness, and arm girth for obesity screen-ing in children and adolescents. Am J Clin Nutr 70(6):1090–1095.
Selman R. 1971. Taking another’s perspective: Role taking development in early childhood.Child Dev 42:1721–1734.
*Shannon B, Peacock J, Brown MJ. 1991. Body fatness, television viewing and calorie-intakeof a sample of Pennsylvania sixth grade children. J Nutr Educ 23(6):262–268.
*Sherwood NE, Story M, Neumark-Sztainer D, Adkins S, Davis M. 2003. Development andimplementation of a visual card-sorting technique for assessing food and activity prefer-ences and patterns in African American girls. J Am Diet Assoc 103(11):1473–1479.
*Signorielli N, Lears M. 1992. Television and children’s conceptions of nutrition: Unhealthymessages. Health Commun 4(4):245–257.
*Signorielli N, Staples J. 1997. Television and children’s conceptions of nutrition. HealthCommun 9(4):289–301.
Sobel ME. 1996. An introduction to causal inference. Sociol Methods Res 24(3):353–379.Spirtes P, Glymour CN, Scheines R. 2000. Causation, Prediction, and Search. 2nd ed. Cam-
bridge, MA: MIT Press.Spirtes P, Scheines R, Glymour C, Richardson T, Meek C. 2004. Causal inference. In: Kaplan
D, ed. The Sage Handbook of Quantitative Methodology in the Social Sciences. Thou-sand Oaks, CA: Sage Publications. Pp. 445–475.
*Stettler N, Signer TM, Suter PM. 2004. Electronic games and environmental factors associ-ated with childhood obesity in Switzerland. Obes Res 12(6):896–903.
*Stoneman Z, Brody GH. 1981. Peers as mediators of television food advertisements aimed atchildren. Dev Psychol 17(6):853–858.

INFLUENCE OF MARKETING ON DIETS AND DIET-RELATED HEALTH 317
*Stoneman Z, Brody GH. 1982. The indirect impact of child-oriented advertisements onmother–child interactions. J Appl Dev Psychol 2:369–376.
*Storey ML, Forshee RA, Weaver AR, Sansalone WR. 2003. Demographic and lifestyle fac-tors associated with body mass index among children and adolescents. Int J Food SciNutr 54(6):491–503.
Story M, French SA, Resnick MD, Blum RW. 1995. Ethnic/racial and socioeconomic differ-ences in dieting behaviors and body image perceptions in adolescents. Int J Eat Disord18(2):173–179.
*Sugimori H, Yoshida K, Izuno T, Miyakawa M, Suka M, Sekine M, Yamagami T, Kagami-mori S. 2004. Analysis of factors that influence body mass index from ages 3 to 6 years:A study based on the Toyama cohort study. Pediatr Int 46(3):302–310.
Swinburn BA, Caterson I, Seidell JC, James WP. 2004. Diet, nutrition and the prevention ofexcess weight gain and obesity. Pub Health Nutr 7(1A):123–146.
*Tanasescu M, Ferris AM, Himmelgreen DA, Rodriguez N, Perez-Escamilla R. 2000. Bio-behavioral factors are associated with obesity in Puerto Rican children. J Nutr 130(7):1734–1742.
*Taras HL, Sallis JF, Patterson TL, Nader PR, Nelson JA. 1989. Television’s influence onchildren’s diet and physical activity. Dev Behav Pediatr 10(4):176–180.
*Taras H, Zive M, Nader P, Berry CC, Hoy T, Boyd C. 2000. Television advertising andclasses of food products consumed in a paediatric population. Int J Ad 19:487–493.
*Toyran M, Ozmert E, Yurdakok K. 2002. Television viewing and its effect on physicalhealth of schoolage children. Turk J Pediatr 44(3):194–203.
*Tremblay MS, Willms JD. 2003. Is the Canadian childhood obesity epidemic related tophysical inactivity? Int J Obes Relat Metab Disord 27(9):1100–1105.
*Trost SG, Kerr LM, Ward DS, Pate RR. 2001. Physical activity and determinants of physicalactivity in obese and non-obese children. Int J Obes Relat Metab Disord 25(6):822–829.
*Tucker LA. 1986. The relationship of television viewing to physical fitness and obesity.Adolescence 21(84):797–806.
U.S. Census Bureau. 2005. Table 2: Annual Estimates of the Population by Selected AgeGroups and Sex for the United States: April 1, 2000 to July 1, 2004 (NC-EST2004-02).[Online]. Available at: http://www.census.gov/popest/national/asrh/NC-EST2004/NC-EST2004-02.xls [accessed October 21, 2005].
*Utter J, Neumark-Sztainer D, Jeffery R, Story M. 2003. Couch potatoes or French fries: Aresedentary behaviors associated with body mass index, physical activity, and dietarybehaviors among adolescents? J Am Diet Assoc 103(10):1298–1305.
*Vandewater EA, Shim MS, Caplovitz AG. 2004. Linking obesity and activity level withchildren’s television and video game use. J Adolesc 27(1):71–85.
*Wake M, Hesketh K, Waters E. 2003. Television, computer use and body mass index inAustralian primary school children. J Paediatr Child Health 39(2):130–134.
Waller BJ, Cohen JE, Ferrence R, Bull S, Adlaf EM. 2003a. The early 1990s cigarette pricedecrease and trends in youth smoking in Ontario. Can J Public Health 94(1):31–35.
*Waller CE, Du S, Popkin BM. 2003b. Patterns of overweight, inactivity, and snacking inChinese children. Obes Res 11(8):957–961.
Ward S, Wackman D. 1972. Television advertising and intrafamily influence: Children’spurchase influence attempts and parental yielding. In: Rubinstein EA, Comstock GA,Murray JP, eds. Television and Social Behavior, vol IV: Television in Day-to-Day Life:Patterns of Use. Washington DC: National Institute of Mental Health. Pp. 516–525.
Ward S, Wackman DB, Wartella E. 1977. How Children Learn to Buy: The Development ofConsumer Information-Processing Skills. Beverly Hills, CA: Sage Publications.
Wasserman L. 2004. All of Statistics. A Concise Course in Statistical Inference. New York:Springer.
318 FOOD MARKETING TO CHILDREN AND YOUTH
Weiss DM, Sachs J. 1991. Persuasive strategies used by preschool children. Discourse Pro-cesses 14:55–72.
WHO and FAO (World Health Organization and Food and Agriculture Organization). 2003.Diet, Nutrition, and the Prevention of Chronic Diseases. WHO Technical Report SeriesNo. 916. Geneva, Switzerland: WHO.
*Wolf AM, Gortmaker SL, Cheung L, Gray HM, Herzog DB, Colditz GA. 1993. Activity,inactivity, and obesity: Racial, ethnic, and age differences among schoolgirls. Am JPublic Health 83(11):1625–1627.
*Wong ND, Hei TK, Qaqundah PY, Davidson DM, Bassin SL, Gold KV. 1992. Televisionviewing and pediatric hypercholesterolemia. Pediatrics 90(1):75–79.
*Woodward DR, Cumming FJ, Ball PJ, Williams HM, Hornsby H, Boon JA. 1997. Doestelevision affect teenagers’ food choices? J Human Nutr Diet 10:229–235.
*Yavas U, Abdul-Gader A. 1993. Impact of TV commercials on Saudi children’s purchasebehaviour. Marketing Intelligence Planning 11(2):37–43.
Young BM. 1990. Television Advertising and Children. Oxford, UK: Clarendon Press.*Zive MM, Frank-Spohrer GC, Sallis JF, McKenzie TL, Elder JP, Berry CC, Broyles SL,
Nader PR. 1998. Determinants of dietary intake in a sample of white and Mexican-American children. J Am Diet Assoc 98(11):1282–1289.

319
6
Public Policy Issuesin Food and Beverage Marketing
to Children and Youth*
*Endnotes for Chapter 6 can be found on page 478–480 in Appendix G.
INTRODUCTION
Public policies at the federal, state, and local levels are central to thepromotion, protection, and enhancement of the diets and health of U.S.children and youth. Public policy and activities that shape dietary guidance,nutrition education, food labeling, regulation of food marketing, food ser-vices, and food production and distribution, are all important determinantsof the nutritional environments of children and youth. This chapter beginswith an overview of education and information-related policies, includingdietary guidelines, nutrition education programs and campaigns, and foodlabeling to guide healthful choices for children, youth, and their families. Itthen reviews several of the policies related to the role of schools in children’sdiets, and follows with the description of the experience to date with socialmarketing campaigns to improve health-related behaviors. The chapter de-votes substantial attention to legal considerations in regulation of advertis-ing and marketing, including the constitutional protection of commercialfree speech in the United States. The chapter also examines other potentiallegislative actions that may create industry incentives or support agricul-tural subsidies to produce and market more healthful foods, as well astaxation to reduce the demand for less healthful foods. The chapter con-

320 FOOD MARKETING TO CHILDREN AND YOUTH
cludes with a review of the international policy environment for policiesrelevant to food and beverage marketing to children and youth.
EDUCATION AND INFORMATION PROGRAMS AND POLICIES
Numerous education and information programs and policies are spon-sored by government at every level and in many venues. At the federal level,these efforts are anchored in the principles set out in the Dietary Guidelinesfor Americans, previously introduced in Chapter 2. This section describesseveral nutrition education and promotion efforts offered through the U.S.Department of Agriculture (USDA), Department of Education, and theDepartment of Health and Human Services (DHHS). It also describes fed-eral nutrition labeling policies designed to facilitate healthful food choicesat the point of purchase.
Dietary Guidelines for Americans and MyPyramid
The policy touchstones for federal education and information pro-grams on nutrition are the Dietary Guidelines for Americans and its graphicrepresentation, MyPyramid. Jointly developed by the DHHS and USDA,the Guidelines were designed to move federal nutrition policy to a moreexplicit focus on chronic disease prevention. They are now legislativelymandated, revised every 5 years, and draw from the recommendations of anonfederal Dietary Guidelines Advisory Committee, constituted to reviewthe most current scientific evidence and medical knowledge. The sixth edi-tion of the Dietary Guidelines for Americans was released in 2005 andprovide specific recommendations for physical activity, consumption offood groups, fats, carbohydrates, sodium and potassium, alcoholic bever-ages, and food safety (DHHS and USDA, 2005). Described in Chapter 2,the Dietary Guidelines provide the basis for the educational components ofall 15 federal nutrition programs administered by the USDA. The USDAintroduced the Food Guide Pyramid in 1992, in cooperation with theDHHS, as a graphic representation of selected Dietary Guidelines to helpconsumers better understand and select a balanced diet that promotedhealth and prevented chronic diseases. In 2005, the USDA took an addi-tional step to personalize the guidance through an interactive food guidancesystem, MyPyramid, released to replace the existing Food Guide Pyramid(USDA, 2005f). MyPyramid offers recommendations tailored to the ageand needs of the individual. This initiative includes an online educationaltool to obtain information on an individual’s diet quality, related nutritionmessages, and links to nutrition information (USDA, 2005f). A child-friendly version of MyPyramid was released to reach children ages 6–11 years with targeted messages about the importance of healthful eating

PUBLIC POLICY ISSUES IN FOOD AND BEVERAGE MARKETING 321
and physical activity, and an interactive computer game to apply thesemessages (USDA, 2005e; Chapter 2). MyPyramid is described in more de-tail in Chapter 2.
Federal Nutrition Education and Promotion Programs
A number of federal programs include important efforts to educateconsumers of various ages about improving nutritional practices. Manytarget children, youth, or their care providers about the importance of anutritionally balanced diet and regular physical activity. They can be foundin agencies ranging from the DHHS and USDA, to the Departments ofEducation, Defense, and Interior. Some examples are described here.
The federal government’s largest nutrition education work is spon-sored by the USDA, which embeds education throughout its various foodprograms, and overall, devoted approximately $715 million to nutritioneducation and promotion in FY2005 (personal communication, SidClemens, Office of Budget and Program Analysis, USDA, November 1,2005). The USDA Center for Nutrition Policy and Promotion is the focalpoint for leadership within the USDA on nutrition policy and dietary guid-ance in programs throughout the agency. The USDA administers 15 nutri-tion assistance programs that totaled $46 billion in 2004, including theFood Stamp Program (FSP), the Special Supplemental Program for Women,Infants, and Children (WIC), and the Child Nutrition Programs (USDA,2005i). All have nutrition education components. For example, the WICprogram, serving 8 million participants, provides both individualized andgroup nutrition education. Many state WIC agencies include nutrition edu-cation classes, fact sheets, newsletters, individual counseling guides, andlesson plans for schools (IOM, 2005c).
The FSP also offers a nutrition education component through selectedstates, although it operates on a smaller scale and reaches fewer low-incomeaudiences than the WIC program. The activities of the Food Stamp Nutri-tion Education Program vary by state and provide practical nutrition infor-mation to low-income families and children. Some of these programs aredeveloped and implemented in cooperative relationships between local FSPand state land-grant universities or nonprofit organizations (USDA, 2005d).The USDA Expanded Food and Nutrition Education Program (EFNEP)works collaboratively with county services and other local agencies to reachlow-income families, children, and youth (Cooperative State Research, Edu-cation, and Extension Service, 2005). Additionally, the USDA Food andNutrition Service has developed the Eat Smart, Play Hard™ Campaign thatprovides practical suggestions based on the Dietary Guidelines for Ameri-cans to motivate children and their care providers to eat healthful foods andbe physically active every day (USDA, 2005a).

322 FOOD MARKETING TO CHILDREN AND YOUTH
There are several federal partnerships that promote nutrition andhealthful diets. In 2004, the USDA Food and Nutrition Service partneredwith the Department of Education to launch the HealthierUS SchoolChallenge that encourages schools and parents to promote healthful life-styles for children. The school challenge is an extension of the DHHS-coordinated Steps to a HealthierUS initiative, and is designed to buildupon and expand the USDA Team Nutrition program that providesschools with nutrition education materials for children and families; tech-nical assistance for school food service directors, managers, and staff; andmaterials to build community-based support for healthful eating andphysical activity. The initiative also enhances the USDA’s effort to im-prove the nutritional quality of school food service through the SchoolMeals Initiative that establishes nutritional requirements for federally re-imbursed school meals (USDA, 2004a).
The national Steps to a HealthierUS initiative focuses on lowering theincidence of obesity and type 2 diabetes in disproportionately affected at-risk populations, especially African Americans, Hispanics/Latinos, Ameri-can Indians, Alaska Natives, Asian Americans, and Pacific Islanders (DHHS,2005e). As a component of this initiative, the DHHS partnered with the AdCouncil to create Small Step (DHHS, 2005c) and Small Step Kids! (DHHS,2005d), which target parents, teens, and children and include public serviceannouncements (PSAs), a public relations campaign, a health care provider’stoolkit, and consumer materials. The child-targeted component includesgames and activities, television advertisements, and links to other materials.
The DHHS Centers for Disease Control and Prevention (CDC), throughits Division of Nutrition and Physical Activity (DNPA), currently sponsorsthe national 5 a Day for Better Health program (previously administered bythe National Cancer Institute [NCI]) (DHHS, NIH, NCI, 2005), whichencourages consumers to eat a variety of fruits and vegetables every day(CDC, 2005a). The DNPA also sponsors the national Powerful Bones,Powerful Girls™ Campaign to promote awareness of bone health (CDC,2005e), and the national Youth Media Campaign, VERB™, a social mar-keting effort to encourage tweens, ages 9–13 years, to be physically activeevery day (CDC, 2005g). In 2005, CDC created a National Center forHealth Marketing to provide national leadership in health marketing sci-ence and its application for public health improvement (CDC, 2005b).
Also in the DHHS, the National Institute of Child Health and HumanDevelopment (NICHD) sponsors the Milk Matters Calcium EducationCampaign targeted to tweens and teens ages 11–15 years to promote thedaily consumption of low-fat or fat-free milk along with calcium-rich foods(NIH, 2005a). Other institutes of the National Institutes of Health (NIH)also partner with national organizations and local communities in the na-tional education initiative, We Can! (Ways to Enhance Children’s Activity

PUBLIC POLICY ISSUES IN FOOD AND BEVERAGE MARKETING 323
& Nutrition), which is a collaboration among four institutes: the NationalHeart, Lung, Blood Institute; the National Institute of Diabetes and Diges-tive and Kidney Diseases; the NICHD; and the NCI. We Can! is designed toprevent obesity in children and tweens, ages 8–13 years, by providing re-sources and community-based programs to parents, caregivers, children,and youth that encourage healthful dietary choices, increasing physicalactivity, and reducing sedentary behaviors (NIH, 2005b).
Other nutrition-related education programs at the DHHS includework of the Surgeon General and of the Head Start program. The Sur-geon General has launched an initiative called, Children and HealthyChoices—50 Schools in 50 States, taking him to at least one school ineach of the 50 states, the District of Columbia, and Puerto Rico to dis-cuss the benefits of healthy choices with school-aged students, includingthe importance of a nutritious diet and regular physical activity (DHHS,2005b). In addition, through the Administration for Children and Fami-lies, the Head Start program grantees deliver a range of services relatedto comprehensive nutrition and nutrition education that foster healthydevelopment and school readiness in low-income preschool children,ages 3–5 years, across the nation (DHHS, 2005a).
Nutrition Labeling
An important means of conveying nutrition information—and of edu-cating about nutrition—is the food label itself. Both the USDA and DHHShave responsibilities for food labeling, but most of the food supply is over-seen by the DHHS’s Food and Drug Administration (FDA). Information onthe food label is intended to enable consumers to compare products andmake informed choices about foods and beverages that best meet theirnutritional needs. Standards for the implementation of the labeling guide-lines were established by the Nutrition Labeling and Education Act of 1990(NLEA) (P.L. 101–535, 1990), which mandated that labeling informationshould be communicated so that consumers could readily observe and com-prehend such information and understand its relative significance in thecontext of a total daily diet (FDA, 1993). The NLEA requires nutritionalinformation to be displayed on nearly all packaged foods as to serving size,the number of servings per container, the total number of calories derivedfrom any source and derived from fat, and the amount of total fat, satu-rated fat, cholesterol, sodium, total carbohydrates, complex carbohydrates,sugars, dietary fiber, total protein, vitamins A, C, E, and iron per serving(21 U.S.C. 343(q)(1)(A)-(E), 2004).
Full serve and quick serve restaurants are currently exempt from thegeneral nutritional labeling standards and requirements of the NLEA (FDA,1993; 21 U.S.C 343 (q)(5)(A)(i), 2004). However, they are required to meet

324 FOOD MARKETING TO CHILDREN AND YOUTH
some nutritional labeling requirements if they identify an item on theirmenu as “healthy” (Food Labeling Rule, 21 C.F.R. § 101.65, 2004).
The Nutrition Facts panel was developed to provide a set of consis-tently formatted information items that are displayed on food productlabels to help consumers better understand how various foods could beintegrated into a healthful diet (IOM, 2005a). Additionally, the NLEAmandates the FDA to enforce food manufacturers’ compliance with estab-lished guidelines for nutrient and health claims on a product package indi-cating that a relationship exists between a food and a protection from adisease or health-related condition (IOM, 2003). The FDA’s Calories Countcampaign is an example of an initiative to encourage better industry use ofthe food label for nutrition education to consumers. In addition to theCalories Count campaign, the FDA is proposing to target the prominenceof calories on the product label, address the issue of serving size for prod-ucts that can be reasonably consumed at one time, update the referenceamounts to reflect those that are customarily consumed, and examine ap-proaches for recommending smaller portion sizes. These changes derivefrom extensive stakeholder consultation and consumer research that areintended to help consumers to purchase foods that may be integrated into ahealthful diet and to highlight the importance of total calorie intake as aprime factor of concern (FDA, 2005c).
Research conducted by the FDA and the Food Marketing Institute hasshown that about half of U.S. adult consumers use food labels when pur-chasing a food item for the first time (FMI, 1993, 2001), in particular toassess whether a product is high or low in a nutrient, especially fat, and todetermine total calories (IOM, 2003). On the other hand, there is littleevidence that the information on food labels, at least as currently struc-tured, has a significant impact overall on eating or food purchasing behav-iors (Wansink and Huckabee, 2005; Chapter 3). There are ample prospectsfor enhancing the utility of the label information as a guide to healthierfood choices, including choices made by and for children and youth. In itsreport on preventing childhood obesity, the Institute of Medicine (IOM)recommended that the FDA and other groups conduct consumer researchon the use of the nutrition label, on restaurant menu labeling, and on howto revise the Nutrition Facts panel to better design and display the totalcalorie content for products such as vending machine items, single-servesnack foods, and ready-to-eat (RTE) foods that are typically consumed atone eating occasion (FDA, 2005a,b; IOM, 2005a).
The importance of integrating and improving strategies for using thefood label as an educational tool is underscored by the recent food com-pany initiatives described in Chapter 4 to use proprietary logos or iconsthat communicate the nutritional qualities of their branded products. Whilerepresenting an important step to draw attention to more nutritious prod-

PUBLIC POLICY ISSUES IN FOOD AND BEVERAGE MARKETING 325
ucts, the array of categories, icons, and other graphics, as well as thedifferent standards employed by these companies may introduce some con-fusion, particularly for young consumers, thereby raising the need for de-veloping and regulating standard and consistent approaches. The FDA hasnot yet fully explored its potential role for providing leadership and exper-tise to food companies in order to develop and enforce an industrywiderating system and graphic representation on food labels that is appealing tochildren and youth to convey the nutritional quality of foods and beverages.
Finding: A number of positive steps have been taken by the Food and DrugAdministration to improve food and beverage labeling as a means of con-veying helpful information to enable healthier choices, including explora-tion of ways to expand the provision of such information on menus andpackaging in quick serve and full serve family restaurants. Still, the reachand effectiveness of such efforts—by FDA, industry, and the two together—are far short of what they could or should be to provide children, youth,and their parents with the information they need, using consistent stan-dards and graphics that are easily understood and engaging.
NUTRITION IN SCHOOLS
Schools present an important means of reaching the nation’s childrenand youth with programs and approaches for healthier diets. School-basedinterventions seek to provide the more than 50 million elementary andsecondary students in the United States with nutrition education, healthyfood services, food environments that support healthy choices, and familyinvolvement for healthier lives. The CDC’s Division of Adolescent andSchool Health collaborates with the Department of Education, the USDA,and other federal and state agencies to provide leadership on school healthand environments, including nutrition education (with the CDC DNPA)and the nutrition environment of schools.
Nutrition Education in Schools
A beginning point for addressing nutrition in schools is the way it isengaged in the curriculum. A comprehensive survey conducted by theDepartment of Education among 1,000 school principals in a nationallyrepresentative sample of U.S. public elementary, secondary, and highschools showed that nearly all public schools provide nutrition educationin the curriculum, primarily concentrated in the health curriculum (84 per-cent), science classes (72 percent), and school health programs (68 per-cent) (NCES, 1996). The topics covered in more than 90 percent of allschools surveyed included the relationship between diet and health, identi-

326 FOOD MARKETING TO CHILDREN AND YOUTH
fying and selecting healthful foods, nutrients and their food sources, theDietary Guidelines for Americans, and the Food Guide Pyramid. The sur-vey found that 97 percent of schools reported receiving nutrition materialsfor lesson plans from at least one source outside of the school, most oftenfrom a professional or trade association (87 percent) and the food industry(86 percent). Of the materials from sources outside the school, schoolsreported the highest classroom usage for those received from the foodindustry or commodity groups, professional or trade associations, theUSDA, and state education agencies. The survey also found that the schoolcurriculum focused primarily on increasing students’ knowledge about nu-trition, with less emphasis on influencing students’ motivation, attitudes,and eating behaviors (NCES, 1996).
Although this survey showed that school-based nutrition education hasbeen an active area, the quality of the nutritional messages received bystudents had not been evaluated (NCES, 1996). One evaluation found thatbehavior change in students is more likely if a comprehensive approach tonutrition education provides messages by multiple persons through a vari-ety of communication channels, including the classroom, school cafeteria,home, and community (USDA, 2004b). Building on this insight, the ChildNutrition and WIC Reauthorization Act of 2004 (P.L. 108–265), requiresschool districts participating in the National School Lunch Program (NSLP)or School Breakfast Program (SBP) to establish a local school wellnesspolicy by 2006 (USDA, 2004c,d). USDA’s Team Nutrition has developedimplementation guidance that emphasizes overall goals designed to pro-mote student wellness for nutrition education, physical activity, and otherschool-based activities; nutrition guidelines for all foods available on everyschool campus during the school day; guidelines for reimbursable schoolmeals that are no less restrictive than regulations and guidance issued by theUSDA Secretary under the Child Nutrition Act; designation of a responsibleperson to ensure that school meals meet the local school wellness policycriteria; and broadly involving key stakeholders in the development of theschool wellness policy (USDA, 2004c).
Media Literacy in Schools
Education in media literacy is another type of school-based educationalinitiative with potential to help improve the diets of children and youth.Media literacy refers to the ability of children and youth to develop aninformed and critical understanding of the nature, technique, and impact ofwhat they see, hear, and read in print, broadcast, and electronic mediaincluding books, newspapers, magazines, television, radio, movies, music,advertising, video games, the Internet, and emerging technologies. The goalsof media literacy education are to (1) assist students to be critical media

PUBLIC POLICY ISSUES IN FOOD AND BEVERAGE MARKETING 327
consumers, (2) enhance their media experiences, (3) reduce the potentialadverse effects of media, and (4) promote potential benefits of media use(Brown, 2001; Buckingham, 2005; KFF, 2003). One of the challenges todeveloping a program of media literacy education lies in its timing acrossthe kindergarten through 12 spectrum, as a result of the fact that mostchildren ages 8 years and younger do not effectively comprehend the per-suasive intent of marketing messages, and most children ages 4 years andyounger cannot consistently discern between television advertising and in-formational content—hence training in the use of those powers of discern-ment requires that students have reached a certain developmental stage(Chapter 5).
The first large-scale experimental study measuring the acquisition ofmedia literacy skills in the United States found that incorporating an analy-sis of media messages into the school curriculum could enhance the devel-opment of media literacy skills (Hobbs and Frost, 2003; KFF, 2003). Onthe other hand, since no national media literacy campaign has yet beenimplemented through a school-wide curriculum in the United States, sys-tematic evaluations are not currently available to assess the effectiveness ofa broad program of media literacy education, including whether medialiteracy skills learned in the classroom might transfer to media exposureoutside the school setting. Additionally, there is a need to incorporate skillsthat move beyond the critical evaluation of television programming intoemerging forms of media such as the Internet and mobile marketing; viralmarketing; product placement across print, broadcast, electronic media andmusic; and marketing venues such as schools (Chapter 4).
School Food Services
Ensuring that school food services, including what is offered in schoolcafeterias, reflect sound nutrition principles, is key. These services are de-signed and implemented at the school district level, but many fall within thepurview of the federal Child Nutrition Programs. The Child NutritionPrograms, which include the NSLP, SBP, Child and Adult Care Food Pro-gram (CACFP), and the Summer Food Programs, target low-income chil-dren enrolled in public and nonprofit private schools, child-care institu-tions, and summer recreation programs (Chapter 3). The NSLP is intendedto provide nutritionally balanced, reduced-cost or free meals to nearly29 million children enrolled in public and nonprivate schools every schoolday (USDA, 2005b). Nearly half (49 percent) of the school lunches servedthrough the NSLP are provided free to students and another 10 percent areprovided at a reduced price (USDA, 2005i). The program also providesreimbursements for snacks given to children in after-school educational andenrichment programs.

328 FOOD MARKETING TO CHILDREN AND YOUTH
Participating school districts, independent schools, and institutions re-ceive cash subsidies and donated commodities from the USDA in exchangefor serving reduced-cost or free lunches to eligible children that adhere tothe guidelines of the NSLP (7 C.F.R. § 210.10, 2005): no more than 30 per-cent of calories from fat, no more than 10 percent from saturated fat.Federal regulations also require that school lunches provide one-third of theRecommended Daily Allowance (RDA) for protein, calcium, iron, vitaminA, vitamin C, and calories. While the lunches at participating schools mustsatisfy these federal requirements, local school authorities have discretionto choose what specific foods are served and how they are prepared (USDA,2005b). A U.S. General Accountability Office report found that dietary fataccounted for 34 percent of calories in the lunches served in the NSLPduring the 1998–1999 school year. Although this represents a 4 percentdecline from 1991–1992, it still exceeds the USDA-mandated 30 percent(GAO, 2003). The SBP has similar nutritional requirements as the NSLP. Inaddition to the limits on calories that must be obtained from fat, the SBPmust provide children with one-fourth of the RDA for protein, calcium,iron, vitamin A, vitamin C, and calories (USDA, 2005c).
The CACFP is a federal nutrition program providing meals and snacksto low-income children in child-care centers, Head Start programs, familychild-care homes, and after-school programs. Child- and adult-care provid-ers who participate in CACFP are reimbursed at fixed rates for each mealand snack served. The USDA has established minimum requirements forthe meals and snacks offered by participating child-care providers, but theyare not required to meet specific nutrient-based standards such as thoserequired for the NSLP and SBP (USDA, 2002a; Chapter 3).
USDA has also developed the Child Nutrition Labeling Program(CNLP) which is a voluntary technical assistance program designed toassist schools and institutions participating in the NSLP, SBP, and theCACFP by determining the contribution a commercial product makes to-ward the meal pattern requirements (USDA, 2005g). The CNLP requiresan evaluation of product formulation of those products sold and used inthese programs, and in order to carry the Child Nutrition label, it mustbe produced under federal inspection by the USDA (USDA, 2005g,h).
Promoting Fruits and Vegetables in Schools
Increasing the availability of fruits and vegetables to children in schoolshas been a priority and an important means of improving the quality offoods served in the federal nutrition assistance programs. Several pilotprograms have been developed at the school, district, state, and federal levelto explore strategies to increase fruit and vegetable consumption amongstudents in schools. The 2002 Farm Bill provided $6 million for the Fruit

PUBLIC POLICY ISSUES IN FOOD AND BEVERAGE MARKETING 329
and Vegetable Pilot Program to distribute fresh and dried fruits and freshvegetables to elementary and secondary school children in four states andone Indian reservation (Branaman, 2003; ERS, 2002). One hundred schoolsin four states (e.g., Indiana, Iowa, Michigan, and Ohio) and seven schoolsin New Mexico’s Zuni Indian Tribal Organization participated in the pilotduring the 2002–2003 school year (Buzby et al., 2003). The participatingschools could choose when and how to distribute the fresh produce tostudents, but the program requested that the fruits and vegetables be madeavailable to students outside the regular school meal periods. Quantitativeoutcome data were not collected, but a qualitative process evaluation sug-gested satisfaction in many schools and food service staff (Buzby et al.,2003). The recent Child Nutrition and WIC Reauthorization Act expandedthe program to four more states and two additional Indian reservations(Committee on Education and the Workforce, 2004; Chapter 3).
The Department of Defense’s Fresh Produce Program has been workingwith schools in several states to provide fresh fruits and vegetables for theschool meal programs. Schools have also begun to incorporate producefrom school gardens (Morris and Zidenberg-Cherr, 2002), school saladbars (USDA, 2002b), and farmers’ markets (Azuma and Fisher, 2001) intothe school meals programs in an effort to increase student participation andspecifically to increase their fruit and vegetable consumption. Evaluationsof these programs are essential to assess the effects of these changes onstudents’ dietary behaviors.
Competitive Foods in Schools
School food services, and special fruit and vegetable programs are notthe only food and beverage products available to students. Recent attentionhas been drawn to other sources of “competitive” foods that are often highcalorie and low nutrient and viewed as potentially displacing more health-ful foods. Competitive foods include items sold through snack shops, stu-dent stores, vending machines, a la carte lines, and school fundraisers.
The sale of competitive foods in schools is often used to support aca-demic or other types of programs. Public schools that are under financialpressure are more likely to make competitive foods available to their stu-dents through exclusive “pouring rights” contracts and snack food sales(Anderson and Butcher, 2005). Competitive foods are widely available inschools and generate substantial revenues, especially for middle and highschools throughout the United States (GAO, 2005). In 2003–2004, anestimated 30 percent of high schools generating the most revenue fromcompetitive foods raised more than $125,000 per school (GAO, 2005;Chapter 3). An analysis of a sample of schools in 27 states and 11 largeurban areas found that the 80 to 90 percent of secondary schools allowed

330 FOOD MARKETING TO CHILDREN AND YOUTH
students to purchase snack foods or beverages from vending machines,snack bars, cafeterias, or school stores (CDC, 2005c).
There are presently no comprehensive federal competitive foods stan-dards to guide the type of products that are available and marketed in U.S.schools and other venues (e.g., child-care settings), and in the FY2005Consolidated Appropriations, Congress directed the Institute of Medicineto conduct a study that is currently underway to develop comprehensiverecommendations for appropriate nutritional standards for competitivefoods (Hartwig, 2004; IOM, 2005b). Some foods have been designatedfoods of minimal nutritional value (FMNV) that are precluded from beingsold in cafeterias or food service areas during school meal times. Under thecompetitive foods regulations, any non-FMNV sold outside of the NSLPmay be sold anywhere on the school grounds at any time, although indi-vidual local-, district-, and state-level governments can establish their ownlocal policies for competitive foods (USDA, 2002c). Because most competi-tive foods tend to be lower in nutritional value and higher in calories, fat,salt, and added sugars such as carbonated soft drinks, salty snacks, andcandy (GAO, 2005), they are increasingly facing closer scrutiny at the stateand local levels.
A variety of legislative initiatives pertaining to the availability, market-ing, and sales of foods and beverages in schools have been enacted orproposed at the state, district, and local levels. Examples are numerous.Three large school districts in California (e.g., Berkeley, Oakland, and LosAngeles) have passed statutes for creating nutritional standards. TheLos Angeles Unified School District enacted a comprehensive act mandat-ing nonfood fundraising activities, prohibiting the sale of FMNV in vendingmachines after the end of the school day, and eliminating branded fast foodproduct contracts (Vallianatos, 2005). Statewide legislation was passed inCalifornia that will enact several restrictions to raise nutritional standardsfor competitive foods sold in all California schools by 2007 and ban thesale of carbonated soft drinks on all California school campuses by 2009(Gledhill, 2005).
Seattle Public Schools in Washington State have created guidelines forcompetitive food portion sizes and required that all beverages except milkbe priced higher than water for the same serving size (Vallianatos, 2005).Other school districts have also enacted statutes calling for the prohibitionof candy sales during the school day (Olympia, WA) and prohibiting cer-tain foods during school hours and for fundraising (New York City De-partment of Education) (Vallianatos, 2005). The Flagstaff Unified SchoolDistrict in Arizona improved school meals in elementary and secondaryschools by adding more fruit, vegetables, and salad bars (CSPI, 2003). Inthe Shrewsbury School District in Massachusetts, high schools now closetheir snack bars which sell candy and snacks of minimal nutritional value

PUBLIC POLICY ISSUES IN FOOD AND BEVERAGE MARKETING 331
during the lunch periods (CSPI, 2005). More than half of the 10 largestschool districts in the United States have policies that are more restrictivetoward competitive foods in schools than federal and state regulations(GAO, 2004).
In 2003, only two states (e.g., Arkansas and California) enacted lawsregarding vending machines in schools, the following year four additionalstates (e.g., Colorado, Louisiana, Tennessee, and Washington) followedwith their own legislation (NCSL, 2005). As of mid-2005, 19 states hadlimited the availability of competitive foods beyond federal requirements,11 states had nutritional standards for competitive foods in schools, and 6states (e.g., Arkansas, Kentucky, South Carolina, South Dakota, Tennessee,and Texas) had established nutritional standards for school lunches, break-fasts, and snacks that are stricter than the USDA requirements (TFAH,2005). Most include criteria for nutritional standards for foods and bever-ages sold on school grounds before, during, or after school hours, andregulations for vending machine sales, competitive foods sales, fundraisingfood sales, and availability of foods and beverages during school events oractivities. Most also restrict the availability of competitive foods by eitherlimiting their access during school meal periods, the entire day, or certaintimes. Examples of specific provisions include banning carbonated softdrinks from elementary or middle schools; requiring elementary schools toonly serve food and beverages that meet certain nutrition standards; requir-ing middle schools to turn off vending machines not meeting nutritionalstandards until after the lunch period is over; banning the sales of FMNV inschools; and banning the sale of all competitive foods in elementary schoolsand limiting them in secondary schools (CSPI, 2003; TFAH, 2005).
In addition to statutes already passed, legislation is pending in otherstates that would address certain of these provisions, as well as others,including those such as setting standards for portion sizes of foods sold inschools; requiring healthy choices at all school activities; eliminating friedfoods from cafeterias; requiring nutritional standards for foods sold atfundraising events; requiring school cafeterias to serve more fresh fruits andvegetables; and financially penalizing schools for each meal lost to competi-tive food sales.
The prospects for such legislation are uncertain, but the proposalsreflect growing public sentiment for action. A Wall Street Journal Onlineand Harris Interactive (2005) poll found that 84 percent of respondentsfavored stricter public school regulation of less healthful foods and bever-ages. Many local school districts seem to prefer to develop their own poli-cies, in advance of state or federal initiatives (RWJF, 2003), encouraged inpart, not only by the public concern, but by findings from some sites thatmany schools have been able to implement healthful food and beveragepolicies without losing revenue (CSPI, 2005). Traditional competitive foods

332 FOOD MARKETING TO CHILDREN AND YOUTH
have been replaced with more healthful and low-calorie choices includingwater, low-fat milk, 100 percent fruit juices, soy drinks, cereal bars, andyogurt products (GAO, 2004; NCSL, 2005).
In an effort to educate and guide parents, school administrators, andlegislators through the policy change and implementation process, the USDAhas developed the Changing the Scene—Improving the School NutritionEnvironment tool kit that seeks to help decision makers take a broadapproach, addressing the entire school nutrition environment from a com-mitment to nutrition and physical activity, pleasant eating experiences,quality school meals, other healthful food options, nutrition education, andmarketing the issue to the public (USDA, 2000). Other nonprofit groupshave also developed resource materials for school districts and states toassist in the development of child nutrition legislation (CSPI, 2004).
Finding: National standards do not exist for the use or marketing of com-petitive foods and beverages in school settings or after-school venues suchas child-care settings. Cooperative initiatives by the U.S. Department ofAgriculture and the Department of Education has been limited in shapingpolicies and approaches related to healthier food and beverage promotionin schools.
SOCIAL MARKETING
One charge to the committee was assessing the lessons learned fromvarious social marketing efforts that might be applied in the adoption of asocial marketing strategy to improve the nutritional status of children andyouth. Public health practitioners have used social marketing programs toinfluence a range of consumer behaviors such as reducing fat intake, in-creasing fruit and vegetable consumption, increasing physical activity, andpromoting breastfeeding (Grier and Bryant, 2005; Ngo, 1993). To assist inthis work, the committee commissioned a review of the application of thesocial marketing approach.
The Concepts
Social marketing applies commercial marketing concepts and tech-niques—exchange theory, audience segmentation, consumer orientation,competition, and an integrated marketing mix—to promote voluntary be-havior change in specific groups or target audiences based on their so-ciodemographic, behavioral, and psychological characteristics (Grier andBryant, 2005; Lefebvre, 1992; Lefebvre et al., 1995). The basic elementsthat influence a commercial marketing strategy include defining the targetmarket, determining the marketing mix to meet the needs of the target

PUBLIC POLICY ISSUES IN FOOD AND BEVERAGE MARKETING 333
market, and assessing the environmental factors that influence the market-ing mix and the target market (Boone and Kurtz, 1998; Chapter 4). Socialmarketing engages a similar approach.
Media can be a key element to increase awareness and motivation in asocial mobility effort (Contento et al., 1995), and PSAs offer a good ex-ample of the media component of social marketing. The concept of PSAs asa form of advertising was first introduced by The Advertising Council, thenonprofit arm of the advertising industry. The Advertising Council hasdeveloped a specific set of criteria for PSAs that has been used in socialmarketing promotional activities (Ad Council, 2005) including sponsorshipby nonprofit organizations or government agencies; noncommercial, non-partisan, and nondenominational; of national importance; and aired usingdonated advertising time and space.
But social marketing is more than a communication activity. Effectivesocial marketing programs utilize multiple reinforcing communication chan-nels along with public policy and environmental changes to influence con-sumer behaviors (Andreasen, 1995). The combined strategies used in socialmarketing programs include mass media campaigns, school-based interven-tions, community-based programs, interpersonal communications, and pub-lic policy. Such programs encompass a variety of activities including PSAs,posters, pamphlets, promotions, and legislation (Lefebvre et al.,1995).
The notion of “exchange” is important in social marketing, as it is inany marketing effort that seeks to offer a behavior or choice for somethingthat offers more value. Social marketers recognize that consumers havetangible and intangible costs associated with changing behaviors, such astrade-offs with time and inconvenience, and understand that all individualsinvolved in an exchange must receive valued benefits in return for behav-ioral changes. Thus, an effective social marketing program identifies themotives or drivers of behavior, structures these motives as part of thebenefits offered, and develops choices for consumers that provide a com-parative advantage (Andreason, 2002).
Just as commercial marketers distinguish target audiences based ondifferent features such as age and race/ethnicity, social marketing differen-tiates populations into subgroups, segments, or target audiences of indi-viduals who share lifestyle orientations, desires, behaviors, and values thatmake them likely to respond similarly to public health interventions. Socialmarketers also distinguish target audiences based on current behaviors (e.g.,dietary, physical activity, sedentary, smoking habits), future intentions,readiness to change, product or brand loyalty, and personal characteristics(Grier and Bryant, 2005).
Commercial marketers regard the competition as products and compa-nies that strive to satisfy similar desires and needs among consumers in themarketplace (Chapter 4). Social marketers view competition as the behav-

334 FOOD MARKETING TO CHILDREN AND YOUTH
ioral options that compete with public health recommendations, messages,and services. A commercial marketing framework explores how the ben-efits of a product compare with the product of other companies; whereas asocial marketing framework offers a trade-off that characterizes advantagein terms of better health, wellness, productivity, and psychological outlook(Grier and Bryant, 2005).
Marketing mix is another central concept used by social marketers thatis adapted from commercial marketing practices. The four basic compo-nents of marketing—product, place, price, and promotion—are also centralto the planning, implementation, and evaluation of a social marketing pro-gram. In a social marketing approach, the product is the array of benefitsassociated with the desired behavior for a target audience; price representsthe cost or sacrifice exchanged for the promised benefit that balances theperceived or actual benefits to a consumer; place refers to the distributionof products and the location of sales and services where the target audienceeither performs the behavior or accesses programs or services; and promo-tion—often the most visible component of marketing—refers to the meansof communicating and reinforcing messages (Grier and Bryant, 2005; Wonget al., 2004).
Commercial marketers devote considerable resources to conduct mar-keting research, as do social marketers. Conducting formative research isessential for a social marketing program to gain an accurate understandingof a target audience’s desires, behaviors, values, and lifestyles. Of specialinterest are the perceptions of the products, costs, benefits, and other fac-tors relevant to changing behaviors and maintaining those changes. Addi-tionally, a sustained commitment to the ongoing monitoring and evaluationof a social marketing program is essential at the beginning of the planningprocess to allow for modifications and refinements over the course of theprogram (Grier and Bryant, 2005). Part of the research includes assessmentof the broader environment. In particular, attention to the policy contextwithin which a social marketing program functions is a critical componentthat may influence the success of a social marketing program (Dorfmanet al., 2005; Kraak and Pelletier, 1998).
Social Marketing Programs That PromotePhysical Activity and Nutrition
Several nationwide social marketing programs seek to promote physi-cal activity and nutrition. One such effort, the 5 a Day for Better Healthprogram, was begun in the late 1980s by the NCI to promote the consump-tion of at least five servings of fruits and vegetables daily. This program wasadopted as the 5 a Day for Better Health Campaign in California and

PUBLIC POLICY ISSUES IN FOOD AND BEVERAGE MARKETING 335
expanded nationally as a large-scale partnership between NCI and theProduce for Better Health Foundation (PBH). Partners have included theproduce industry, trade organizations, supermarkets and foodservice out-lets, voluntary and nonprofit organizations, all 50 state health departmentsand other government agencies including the USDA and CDC (PBH,2005a). An evaluation of the various stages of the California 5 a Dayprogram found incremental increases in the reported number of daily ser-vices of fruits and vegetables, which could also be attributed to seculartrends (Foerster et al., 1995), demographic shifts (Stables et al., 2002), orother factors (Keihner et al., 2005). On the other hand, program advocatesemphasize that the resources invested in the national and state 5 a Day forBetter Health Campaign (e.g., approximately $9.55 million in 2004 oncommunications for both the national and California programs) are farsmaller than needed to counter the marketing expenditures promoting high-calorie and low-nutrient foods and beverages (CPEHN and ConsumersUnion, 2005; Chapter 4).
As an active partner of the 5 a Day for Better Health campaign, thePBH also has developed a broader national action plan that proposes anintegrated framework built on the 5 a Day concept to use marketing, publichealth, and communication strategies at national, state, and local levels, aswell as public–private partnerships, to encourage children and adult con-sumers to access, prepare, and consume fruits and vegetables to supporthealth (PBH, 2005b). Anticipated PBH public–private partnerships includevendors, produce suppliers, and food retailers that have developed educa-tional materials and programs for children and youth; food service provid-ers, full serve and quick serve restaurants; and children’s television pro-gramming (PBH, 2005b).
Social marketing programs have also been used to encourage consum-ers to reduce dietary fat intake. In the late 1980s, the nationwide socialmarketing program, Project LEAN (Low-Fat Eating for American Now),was designed by the Henry J. Kaiser Family Foundation to encourage con-sumers to reduce their dietary fat consumption to 30 percent of total calo-ries. The program used PSAs, publicity, and point-of-purchase programs inrestaurants, supermarkets, and school and worksite cafeterias to increasethe availability and accessibility of low-fat foods, promote the awareness oftotal fat and calorie intake, and foster collaboration between national orga-nizations (Samuels, 1993). It was the first national nutrition social market-ing effort undertaken by an organization outside the government, but wasnot able to marshal large-scale support or implement the advertising con-cepts developed for the campaign, and could not demonstrate sustainedchanges in dietary habits.
More recently, the CDC’s youth media campaign, VERB™—It’s What
336 FOOD MARKETING TO CHILDREN AND YOUTH
You Do, was launched nationally in 2002 as a 5-year, multiethnic socialmarketing campaign to increase and maintain physical activity among21 million U.S. tweens ages 9–13 years (CDC, 2005g; Wong et al., 2004).Parents and other intermediaries that influence tweens (e.g., teachers, youthprogram leaders) have been secondary target audiences of the VERB™campaign. An initial literature review and formative research was con-ducted on the target group to inform the program design. The researchshowed that tweens would respond positively to messages that promotedmoderate physical activity in a socially inclusive environment and thatemphasized self-efficacy, self-esteem, and belonging to their peer group(Potter et al., 2004).
VERB™ is an example of behavioral branding (e.g., brands that en-courage a behavior or lifestyle), similar to the American Legacy Founda-tion’s truth® campaign (Evans et al., 2005b). The relationship between abrand and a consumer can be strong and long-lasting, with brands servingas symbolic instruments that allow groups of individuals to project a spe-cific self-image (Evans et al., 2005b; Keller, 1998; Chapter 4). The develop-ers of the VERB™ campaign partnered with advertising agencies experi-enced in youth marketing to create a recognizable brand awareness thatencouraged children to associate VERB™ with physical activity. The pri-mary goal during the first year of promoting the campaign was brandawareness, and all forms of media (e.g., print, broadcast and cable, elec-tronic) were used to reach tweens of various racial/ethnic groups (Wonget al., 2004).
VERB™ expanded its promotional activities to enhance its reach. In2005, through this campaign, the CDC launched a marketing strategy toconnect tweens with places and events in their local areas where they canengage in various physical activities during the summer (CDC, 2005f). Thecampaign features television spots and celebrity promotions for the cam-paign website where tweens can participate in online games, monthly con-tests, and athlete trivia. The VERB™ campaign also uses the newer mobilemarketing strategies (Chapter 4) to reach tweens ages 13 years and older toencourage them to sign-up to receive text messages about activity tourssponsored by the campaign near their cities.
Evaluation of the VERB™ campaign is still in progress, althoughpreliminary tracking suggests positive results in protecting against declin-ing activity levels. Those who saw the VERB™ campaign messages had ahigher level of awareness and maintained the same levels of physical ac-tivity in 2003 that they had in 2002. Attitudes and behaviors towardphysical activity changed modestly over the period of the first-year evalu-ation, with more positive attitude changes than behavioral improvement(Huhman et al., 2005).
PUBLIC POLICY ISSUES IN FOOD AND BEVERAGE MARKETING 337
Social Marketing Programs to ReduceYouth Tobacco and Drug Use
Social marketing programs have also been used by the federal govern-ment and private groups over the past two decades to influence youthbehaviors to reduce youth tobacco, underage alcohol consumption, andillicit drug use (IOM, 2005a). In the alcohol arena, youth are exposed to avariety of advertisements and other forms of marketing that promote alco-hol consumption (NRC and IOM, 2003). Social marketing campaigns tar-geted to youth to reduce the rates of underage drinking have shown somepositive results. For example, one study found that a social marketingcampaign focused on correcting perceived social norms about drinking on acollege campus among students reduced students’ drinking rates (Matternand Neighbors, 2004).
Better studied efforts may be found in those related to reducing youthdrug use. The Partnership for a Drug-free America is a coalition of commu-nication, health, medical, and educational professionals that has receiveddonated media time valued at more than $3 billion to support antidrugadvertisements that are positioned to air during large-audience viewingprime-time television (PDFA, 2005). Similarly, The National Youth Anti-Drug Media Campaign, sponsored by the Office of National Drug ControlPolicy, has sought to focus youth attention on active alternatives to usingillicit drugs, alcohol, and tobacco (ONDCP, 2005). Evaluations of the $1billion campaign (ONDCP, 2003) from 1999–2001 reported that whilethere was some effect on parental behavior, there was limited ability toattribute declines in youth drug use to the advertisements (NIDA, 2002).The most recent evaluation of the campaign in 2003 did not show a reduc-tion in youth marijuana consumption (Hornik et al., 2003).
A particularly interesting example of the social marketing approach toyouth behavior change can be found in the truth® campaign of the Ameri-can Legacy Foundation, an effort to use branding to achieve a social good(similar to the VERB™ campaign). In 2000, the American Legacy Founda-tion launched truth®—a national, multimedia tobacco control social mar-keting campaign targeting youth, ages 12–17 years, to discourage tobaccouse (Farrelly et al., 2005). The truth® brand represents an aspirationalantismoking brand for teens that builds a positive image of youth as non-smokers, cool and edgy, and rebellious against the tobacco industry. Thetruth® brand is a component of the social marketing campaign that encour-ages a set of behavioral objectives including encouraging youth to developpositive beliefs about not smoking by developing a brand that competeswith cigarette brands; establishing high levels of brand awareness and brandrecognition and value for the truth® brand; encouraging youth to adoptthese positive beliefs and reduce the likelihood of smoking; and encourag-

338 FOOD MARKETING TO CHILDREN AND YOUTH
ing youth to adopt and pass on values of the truth® brand to their peers(Evans et al., 2005b).
The messages of the truth® campaign describe the tobacco industry’sintentional attempts to market a harmful product to teens and its denial ofthe addictive and unhealthful effects of cigarettes, and were designed toempower youth to take action by joining the statewide youth antitobaccogroup (Niederdeppe et al., 2004). The campaign employed several activi-ties, including a variety of television PSAs, billboards, print advertise-ments, and posters. An evaluation of the truth® brand has demonstratedthat brand recognition and value may be a mediator for the relationshipbetween the truth® campaign exposure and intermediate outcomes (e.g.,antitobacco commitment) associated with reduced smoking (Evans et al.,2005b). Field marketing has been identified as a necessary component toenhance relevance of the truth® campaign to youth (Eisenberg et al., 2004).Two separate evaluations of the campaign suggest that it has contributedto a decline in youth tobacco use in Florida (Niederdeppe et al., 2004), andthat it also has accounted for a significant portion of the recent nationaldecline in youth smoking prevalence rates among students in grades 8, 10,and 12, which declined from 25.3 percent to 18 percent between 1999–2002 (Farrelly et al., 2005).
Challenges and Opportunitiesfor Social Marketing Programs
Experience to date suggests that, in the near term, it is easier to createawareness in a social marketing campaign than it is to impact the attitudesand behaviors. Attitude changes may require sustained efforts over monthsand behavioral changes on a significant scale will take even longer. Main-taining those behavioral changes is an additional challenge, a lesson espe-cially applicable to eating and physical activity, which are complex behav-iors. An evaluation of populationwide communication initiatives on healthmatters has shown that in general, attitude and behavioral changes mayoccur more quickly if campaigns have the following characteristics: expo-sure to the campaign materials is high; messages are disseminated throughmultiple channels; campaign content is based on a valid change theory; thecampaign conveys new information; the behavior is easy to perform; thetarget audience has opportunities to perform the behavior; services areavailable to support the new behavior; and family, friends, and social net-works support the behavior (CDC, 2005d).
The complexity inherent in any effort that seeks at once to address themultiple factors that influence health, while striking a balance betweenefforts directed at the individual and the social-environmental context inwhich people live, requires very careful planning. Like commercial market-

PUBLIC POLICY ISSUES IN FOOD AND BEVERAGE MARKETING 339
ing, it is clear that social marketing efforts need to be based on insightfulformative research. Many programs or campaigns have claimed to usesocial marketing principles, but have lacked formative research, planning,and evaluation to effectively launch and sustain a successful social market-ing program. To facilitate the development of the VERB™ campaign, andto provide direction for its evaluation, the CDC used both consumer re-search and a logic model that linked expected program inputs and activitieswith anticipated program outcomes and benefits (Huhman et al., 2004).This research is necessary not only for the design of an effective mediaadvocacy and communication component but for careful design of theother related change agents in the policy, legal, and regulatory environ-ments (Andreasen, 2002; Dorfman et al., 2005; Wallack et al., 1993).
The character of social marketing efforts varies with the nature of thetarget change. The more complex are the changes sought, the broader theenvironmental scope that must be engaged. For example, a community-based campaign—the 1% or Less campaign—was successful in using paidadvertising and community education to encourage a shift from higher-fatto low-fat milk (Wootan et al., 2005), but efforts targeting the multiplebehaviors and choices necessary to address this complex set of factorsassociated with childhood obesity must be layered with multiple strategies,engaging a broader environment.
Partnerships can be a key resource in these complicated circumstances,as reflected in the work of PBH (2005b), and national and state WICprogram efforts (IOM, 2005c; Social Marketing Institute, 2005), whichencouraged partners at the community level to provide the infrastructurenecessary to manage complex community and regional activities. Accord-ingly, community involvement is key in program design for efforts whosesuccess depends on change at the community level (Backer and Rogers,1993). This is particularly true for the design of efforts to reach racial/ethnic minority audiences whose values, world views, orientations, andpriorities must be identified and engaged throughout the planning process(Williams and Kumanyika, 2002).
A central challenge to large-scale social marketing efforts is discerningtheir impact. The reach and results of these campaigns are often diminishedby ongoing secular trends (Hornick et al., 2003). Programs whose impactwere likely important, but which were difficult to identify because of boththe complexities of the interactions and the background of secular change,include some of the large-scale cardiovascular prevention trials of the 1970sand 1980s, and several large-scale multifactorial interventions for youth(Killen et al., 1988; Perry and Silvis, 1987). The challenge of crafting areliable evaluation for these efforts may be even more difficult than design-ing the intervention itself.
340 FOOD MARKETING TO CHILDREN AND YOUTH
Finding: Evidence for the effectiveness of social marketing programs topromote healthful behaviors is promising but mixed. Programs with themost positive results have had higher funding, been more sustained, beenshaped by formative research, deployed an integrated marketing approach,and used ongoing monitoring and evaluation. These characteristics are thelikely requirements for achievement of successful social marketing pro-grams to improve the diets of children and youth.
LEGAL REGULATION OF ADVERTISING AND MARKETING
Implicit in the question of whether food and beverage marketing in-fluences the health behaviors and outcomes of children and youth is thequestion of whether advertising should be legally regulated. Indeed, suchproposals have been formally advanced here and abroad. Because of theprominence and complexity of this matter, the committee undertook adetailed analysis of the issues, precedents, and considerations. Typical tosuch analyses, the review is extensively documented in endnotes that can befound in Appendix G.
Public support for regulation of food and beverage advertising is mixed,but may be increasing. A Princeton Survey in 2004 found that 37 percent ofparents favored restricting “junk food” advertisements during children’stelevision shows, but 56 percent opposed such restrictions (Rideout, 2004).A national survey by RTI International in 2005 found that 57 percent ofrespondents believed that watching two or more hours of television dailycontributed substantially to childhood obesity, with 91 percent believingthat parents bore “a lot” of responsibility, followed by television advertis-ers at 45 percent (Evans et al., 2005a). A Wall Street Journal Online andHarris Interactive Internet Poll conducted in 2005 reported that 68 percentof those surveyed believed that government should be able to take compa-nies to court if they mislead children and their parents about the nutritionalvalue of the foods they sell, and 55 percent believed that the governmentshould take a more active role in regulating the types of marketing andadvertising practices that the food industry directs toward children (TheWall Street Journal Online and Harris Interactive, 2005).
From an historical perspective, legal regulation in the United Statesmust be understood against the background of the common law, created bycourts in the course of deciding litigated cases. Persons injured by consumerproducts could traditionally sue at common law for redress of injury or forcompensation for the violation of contractual obligations. As a consequenceof this history, litigation in the food domain has traditionally been used toprotect those who have been harmed by food products. Common law stan-dards that governed such lawsuits are now typically supplemented by ex-

PUBLIC POLICY ISSUES IN FOOD AND BEVERAGE MARKETING 341
plicit statutes. Litigation proceeds based upon the distinct standards of the50 states, which are in a process of continuous evolution.
The private right of citizens to take legal action has played an instru-mental role in protecting consumers from harmful practices and products inthe United States. By compensating injured consumers, litigation not onlyraises public awareness about an issue or concern that may be detrimentalto public health or society, it also creates incentives for an industry toengage in voluntary self-regulation and to limit or prevent harmful prac-tices to consumers (Daynard et al., 2004).
The environment in which consumers’ choices are shaped and informedis an important influence on their diet and health. But efforts to regulate themarketing of commercial products and services can be highly controversial.The constitutional policy of the First Amendment is that truthful and non-misleading advertising serves the public good by promoting informed deci-sion making, and that truthful advertising also stimulates healthy competi-tion that encourages industry innovation (Zywicki et al., 2004). Like allspeech, advertising may nevertheless at times be regulated, especially if it ismisleading or untruthful. Advertising to children raises special issues be-cause they are too young to be regarded as fully autonomous decision-makers. There is cause for concern if advertising encourages children andyouth to adopt eating behaviors that may have lifelong adverse effects ontheir health (Yach et al., 2005).
Legal Regulation of Food
Plaintiffs seeking redress for injuries caused by food products can allegethat a defendant has negligently prepared or served food (Clime v. DeweyBeach Enterprises, Inc., 1993); that a defendant has served food that isunreasonably dangerous, defective, or is otherwise in violation of an im-plied warranty of sale that food will be fit for the ordinary purposes forwhich it is served (Cain v. Sheraton Perimeter Park South Hotel, 1991); orthat a defendant has engaged in deceptive or fraudulent advertising regard-ing food (People v. Block & Kleaver, Inc., 1980). Because all such lawsuitstend to turn on the customary and reasonable expectations of consumers,they are awkward vehicles for legal efforts to regulate high-calorie and low-nutrient foods and beverages that contribute to obesity. A federal districtcourt recently observed in rejecting claims brought by two obese adoles-cents that the contents of McDonald’s Corporation products rendered theminherently dangerous:
“It is well-known that fast food in general, and McDonald’s products inparticular, contain high levels of cholesterol, fat, salt, and sugar, and thatsuch attributes are bad for one. . . . If a person knows or should knowthat eating copious orders of supersized McDonald’s products is unhealthy

342 FOOD MARKETING TO CHILDREN AND YOUTH
and may result in weight gain (and its concomitant problems) because ofthe high levels of cholesterol, fat, salt and sugar, it is not the place of thelaw to protect them from their own excesses” (Pelman v. McDonald’sCorporation, 2003).1
Even the possibility that such litigation might develop, however,prompted tort reform legislation—the Personal Responsibility in FoodConsumption Act (H.R. 339, 108th Congress, 1st Session, 2004)—stillunder consideration in Congress (H.R. 554, 109th Congress, 1st Session,2005). The goal of the bill is “[t]o prevent legislative and regulatory func-tions from being usurped by civil liability actions brought or continuedagainst food manufacturers, marketers, distributors, advertisers, sellers,and trade associations for claims of injury relating to a person’s weightgain, obesity, or any health condition associated with weight gain or obe-sity.” The bill sought “to prevent frivolous lawsuits against the manufac-turers, distributors, or sellers of food or non-alcoholic beverage productsthat comply with applicable statutory and regulatory requirements.” Ineffect, the bill seeks to exclude normal litigation as a means for legallyregulating food to ameliorate harms associated with obesity. More than19 states have considered or are considering similar tort reform bills forobesity-related claims (Daynard et al., 2004; TFAH, 2005). Louisiana,which has one of the highest adult overweight and obesity prevalencerates in the United States (CDC, 2002), is one state that has passed legis-lation to protect restaurants from obesity-related lawsuits (Daynard et al.,2004).
Legal Regulation of Advertising and Marketing
The legal regulation of food is frequently directed not merely at defectsor dangers in the food itself, but also at the ways in which food is marketed.Common law and related statutory causes of actions have traditionallyprovided redress for harms caused by the fraudulent selling of food such asmisbranded meat (United States v. Jorgensen, 1998), misleading or decep-tive advertising related to food (National Bakers Services, Inc. v. FTC,1964), and failure to warn with regard to dangerous food. The precise legalstandards vary in the 50 states, and also change over time.
The regulation of consumer advertising is a central task of the FederalTrade Commission (FTC). The FTC is authorized to regulate “unfair ordeceptive acts or practices in or affecting commerce” (15 U.S.C. § 45(a)(1),2002),2 and in particular, any “false advertisement . . . in or having aneffect upon commerce, by any means, for the purpose of inducing, or whichis likely to induce, directly or indirectly the purchase of food . . . .” (15U.S.C. § 52(a)(1), 2002).3 “[A]n advertisement is deceptive under the Act if

PUBLIC POLICY ISSUES IN FOOD AND BEVERAGE MARKETING 343
it is likely to mislead consumers, acting reasonably under the circumstances,in a material respect. . . . In implementing this standard, the FTC examinesthe overall net impression of an advertisement and engages in a 3-partinquiry: (1) What claims are conveyed in an advertisement? (2) Are theclaims false or misleading? (3) Are the claims material to prospective con-sumers” (Kraft, Inc. v. FTC, 1992)? The FTC regulates unfair and decep-tive advertisements for food products (see, e.g., Nestlé Food Company,1992; The Isaly Klondike Company, 1993).4 Unlike courts, which are em-powered only to resolve particular controversies, the FTC can promulgategeneral rules defining unfair, misleading, or false advertising (16 C.F.R.§ 410.1, 2005; 16 C.F.R. § 239.1–5, 2005). In determining the acceptabil-ity of advertising to children, the law—in both its judicial and administra-tive manifestations—recognizes the special status and cognitive limitationsof children. Advertisements that are acceptable if addressed to an adult,might be deceptive, unfair, or misleading when directed to a child (Bunch v.Hoffinger Industries, Inc., 2004; Swix v. Daisy Manufacturing Company,2004).5 When an act or a practice is targeted to a specific audience such aschildren, the FTC will determine whether it is unfair or deceptive by refer-ence to its effect on a reasonable member of that group (Federal TradeCommission Unfairness Policy Statement, appended to International Har-vester Company, 104 F.T.C. 949, 1984). The FTC thus evaluates the legal-ity of advertisements or sales practices directed to children in terms of howthey are perceived by an ordinary child. The FTC has required those whosought to use television commercials containing characters such as SantaClause or the Easter Bunny to promote 1-900 telephone numbers allowingchildren to speak with the fictional characters and to win prizes, to disclosea range of relevant information “in a manner understandable to children”(see Audio Communications, Inc., 114 F.T.C. 414, 1991; Phone Programs,Inc., 115 F.T.C. 977, 1992). Congress followed up on the FTC’s efforts inthis area by enacting the Telephone Disclosure and Dispute Resolution Act(P.L. 102–556, 106, 1992; codified at 15 U.S.C. § 5701 et seq., 2004),which, among other requirements, mandated that the FTC promulgate ruleswhich prohibited marketers from directing advertisements for pay-per-callservices at children under the age of 12 years, unless the service was for abona fide educational service (15 U.S.C. § 5711(a)(1)(d), 2002).
In 1978 the FTC sought commentary on a proposed rule that wouldban television advertisements addressed to children too young to under-stand the selling purpose of advertising and also ban television advertise-ments for food products posing the most serious dental health risks whichare directed to, or seen by, audiences with a significant proportion of olderchildren (Ratner et al., 1978). The proposed rulemaking, known as “kid-vid,” proved intensely controversial (Beales, 2004), evoking criticism from

344 FOOD MARKETING TO CHILDREN AND YOUTH
Congress (FTC Improvements Act of 1980, P.L. 96–252, 1980),6 and re-sulted in a 1981 FTC staff recommendation that the FTC terminate theproposed rulemaking (Elliott et al., 1981).
There is an important legal distinction between regulations of food andregulations of advertising for food. The former poses few constitutionalquestions, whereas the latter directly raises issues of freedom of expression.Although the Supreme Court had held in 1942 that “the Constitutionimposes no . . . restraint on government” regulation of “purely commercialadvertising,” (Valentine v. Chrestensen, 1942), it reversed course in 1976(Virginia State Board of Pharmacy v. Virginia Citizens Consumer Council,Inc., 1976) and created what is now known as “commercial speech doc-trine,” a complex web of rules restricting government regulations of privateadvertising. The precise nature of these rules remains contested and com-plex, but the doctrine which the Court uses most frequently to resolveconstitutional issues of commercial speech is the Central Hudson test:
In commercial speech cases, then, a four-part analysis has developed. Atthe outset, we must determine whether the expression is protected by theFirst Amendment. For commercial speech to come within that provision,it at least must concern lawful activity and not be misleading. Next, weask whether the asserted governmental interest is substantial. If both in-quiries yield positive answers, we must determine whether the regulationdirectly advances the governmental interest asserted, and whether it is notmore extensive than is necessary to serve that interest (Central HudsonGas & Electric Corporation v. Public Service Commission, 1980).7
Under the Central Hudson test, government can regulate advertise-ments which are misleading. There is some suggestion in the case law thatadvertisements that are merely potentially misleading, as distinct from in-herently misleading, may not be prohibited altogether, but must instead besubject to milder correctives, such as mandatory disclosure requirementsdesigned to ameliorate potential deception (Peel v. Attorney Registrationand Disciplinary Commission, 1990).8 Because “[t]he determinationwhether an advertisement is misleading requires consideration of the legalsophistication of its audience” (Bates v. State Bar of Arizona, 1977), it islikely that advertisements addressed to children may be deemed misleadingeven if they would not be if addressed to adults (FTC v. R. F. Keppel &Brothers, Inc., 1934).9
The Central Hudson test imposes constitutional restraints on gov-ernment efforts to restrict truthful, non-misleading advertisements in orderto achieve desirable policy objectives like preventing smoking by children(Lorillard Tobacco Company v. Reilly, 2001) or promoting energy con-servation (Central Hudson Gas & Electric Corporation v. Public ServiceCommission, 1980). Government regulations must directly advance a sub-stantial state interest in a manner that is not more “extensive than is neces-

PUBLIC POLICY ISSUES IN FOOD AND BEVERAGE MARKETING 345
sary.” It is typically not difficult to demonstrate that well-designed regula-tion directly advances the interests it is designed to serve. Although thegovernment “‘must demonstrate that the harms it recites are real and thatits restriction will in fact alleviate them to a material degree,’” (GreaterNew Orleans Broadcasting Association v. United States, 1999), the Su-preme Court has generally proved receptive to the practical “theory thatproduct advertising stimulates demand for products, while suppressed ad-vertising may have the opposite effect” (Lorillard Tobacco Company v.Reilley, 2001).10
In recent years, however, the Supreme Court has tended to interpretthe final prong of the Central Hudson test with increasing severity. It hasused the “no more extensive than is necessary” requirement to strikedown many government efforts to regulate truthful, non-misleading ad-vertising (Lorillard Tobacco Company v. Reilly, 2001; Thompson v.Western States Medical Center, 2002). The Court has not been entirelyconsistent in its interpretation of this requirement. Although, on the onehand, the Court has “made it clear that ‘the least restrictive means’ is notthe standard” and that case law instead requires merely “a reasonable ‘fitbetween the legislature’s ends and the means chosen to accomplish thoseends’” (Lorillard Tobacco Company v. Reilly, 2001),11 the Court hasalso, on the other hand, held “that if the Government could achieve itsinterests in a manner that does not restrict speech, or that restrictsless speech, the Government must do so” (Thompson v. Western StatesMedical Center, 2002). What is clear is that a majority of the Court hasgrown decidedly unreceptive to the idea that the state can prohibit “thedissemination of truthful commercial information in order to preventmembers of the public from making bad decisions with the information”(Thompson v. Western States Medical Center, 2002, at 374–375).
Because the focus of the Court’s commercial speech doctrine has beento preserve the flow of accurate information to consumers (First NationalBank of Boston v. Bellotti, 1978),12 the Court has been somewhat moretolerant of regulations regarding the use of trademarks. It has regardedtrademarks as “a form of commercial speech that has no intrinsic meaning”(Friedman v. Rogers, 1979), and hence it has concluded that the use oftrademarks in advertising offers “significant possibility that trade nameswill be used to mislead the public.” Efforts to restrict the use of trademarksmust still survive scrutiny under Central Hudson (Bad Frog Brewery, Inc. v.New York State Liquor Authority, 1998; Transportation Alternatives, Inc.v. City of New York, 2002), but constitutional review will take account ofthe kind and quality of information conveyed by marks and images, as wellas the high potential for marks and images to mislead.
The extent to which Central Hudson will govern restrictions on mar-keting as well as restrictions on advertising is not clear. In Hoffman Estates
346 FOOD MARKETING TO CHILDREN AND YOUTH
v. Flipside, the Court considered a village ordinance that made it illegal forany person to “sell any items, effect, paraphernalia, accessory or thingwhich is designed or marketed for use with illegal cannabis or drugs”without first obtaining a license from the government (Hoffman Estates v.Flipside, Hoffman Estates, Inc., 1982). Despite the fact that the restrictionsof the ordinance were triggered because of “the presence of drug-relateddesigns, logos, or slogans on paraphernalia,” the Court ruled that “thevillage does not restrict speech as such, but simply regulates the commercialmarketing of items that the labels reveal may be used for an illicit purpose.”The Court added that “insofar as any commercial speech interest is impli-cated here, it is only the attenuated interest in displaying and marketingmerchandise in the manner that the retailer desires. We doubt that thevillage’s restriction on the manner of marketing appreciably limits Flipside’scommunication of information.”
In Lorillard Tobacco Company v. Reilly (2001) the Court upheldagainst the First Amendment challenge a Massachusetts law that requiredretailers to place all tobacco products behind a counter and that prohibitedretailers from permitting customers to handle tobacco products before theyhad contact with a salesperson. The Court held that even “[a]ssuming thatpetitioners have a cognizable speech interest in a particular means of dis-playing their products,” the statute survived First Amendment scrutinybecause it sought “to regulate the placement of tobacco products for rea-sons unrelated to the communication of ideas.”
These decisions suggest that the line between regulating advertising andregulating the marketing of products is quite unclear. The Court has inti-mated that the latter may be subject to different and more lenient forms ofconstitutional scrutiny than the former, even if marketing regulations aretriggered by communicative content. Yet lower courts have applied theCentral Hudson test to restrictions on marketing that include telemarketing(Mainstream Marketing Services, Inc. v. FTC, 2004), “winback” marketing(Southwestern Bell Telephone, L.P. v. Moline, 2004), and the use of con-sumer information in marketing (Trans Union, LLC v. FTC, 2002).
The Central Hudson test governs regulations of advertising that applyto the general public. It is probable that the test will not pertain if govern-ment wishes to regulate advertising within specific and limited institu-tional contexts, like prisons or schools, in which the state exercises morecomprehensive managerial control. The Court has held that in such envi-ronments state regulations of speech should be treated with special andconsiderable deference (Burbridge v. Sampson, 1999; Hazelwood SchoolDistrict v. Kuhlmeier, 1988; Jones v. N.C. Prisoners’ Labor Union, Inc.,1977; Thornburgh v. Abbott, 1988; Turner v. Safley, 1987; Williams v.Spencer, 1980).
Because “there is a compelling interest in protecting the physical and

PUBLIC POLICY ISSUES IN FOOD AND BEVERAGE MARKETING 347
psychological well-being of minors” (Sable Communications, Inc. v. FCC,1989) special constitutional rules may also apply to the regulation of adver-tising addressed to children. Although children retain First Amendmentrights, it is also clear that in “at least . . . some precisely delineated areas, achild . . . is not possessed of that full capacity for individual choice which isthe presupposition of First Amendment guarantees” (Ginsberg v. New York,1968). For this reason “material which is protected for distribution toadults is not necessarily constitutionally protected from restriction upon itsdissemination to children.” Specific constitutional concerns may be raised ifstate regulations substantially interfere with the ability of parents to com-municate information to their children (Bolger v. Youngs Drug ProductsCorporation, 1983), but even if “the supervision of children’s reading maybest be left to their parents, the knowledge that parental control or guid-ance cannot always be provided and society’s transcendent interest in pro-tecting the welfare of children justify reasonable regulation of the sale ofmaterial to them”(Ginsberg v. New York, 1968). Schools have broad dis-cretion in restricting speech if that speech poses a material and substantialdisruption (Tinker v. Des Moines Independent School District, 1969), bearsthe imprimatur of the school (Hazelwood School District v. Kuhlmeier,1988),13 or is inconsistent with its basic educational mission (Bethel SchoolDistrict v. Fraser, 1986).
The primary constitutional constraint which the Court has imposed onthe regulation of children’s advertising flows from the idea that “the gov-ernmental interest in protecting children from harmful materials . . . doesnot justify an unnecessarily broad suppression of speech addressed toadults” (Reno v. American Civil Liberties Union, 1997). Thus the Courtruled in a recent case that even if a state has an important interest inregulating the advertising of tobacco to children, it must nevertheless re-spect the fact that “tobacco manufacturers and retailers and their adultconsumers still have a protected interest in communication”(Lorillard To-bacco Company v. Reilly, 2001). Regulation of children’s advertising mustnot only satisfy the final prong of the Central Hudson test, but it must alsorespect the integrity of communications between an advertiser and adults. Itmay not “reduce the adult population . . . to reading only what is fit forchildren” (Butler v. Michigan, 1957). As the Court recently said in thecontext of striking down restrictions on commercial mail designed, in part,to limit children’s access to certain information: “The level of discoursereaching a mailbox simply cannot be limited to that which would be suit-able for a sandbox” (Bolger v. Youngs Drug Products Corp., 1983;Lorillard Tobacco Company v. Reilly, 2001).
There are also distinct constitutional rules that apply to federal regula-tion of the broadcast media. Although “broadcasting is clearly a mediumaffected by a First Amendment interest” (Red Lion Broadcasting Company

348 FOOD MARKETING TO CHILDREN AND YOUTH
v. FCC, 1969), it is accorded “special treatment” (Action for Children’sTelevision v. FCC, 1995; FCC v. Pacifica Foundation, 1978). This is be-cause broadcast frequencies are said to constitute “a scarce resource” thatbroadcasters hold in trust for the general public (Columbia BroadcastingSystem, Inc. v. Democratic National Committee, 1973; Red Lion Broad-casting Company v. FCC, 1969)14 and because the broadcast media aresaid to constitute a “a uniquely pervasive presence in the lives of all Ameri-cans” that reach into “the privacy of the home,” where they become“uniquely accessible to children, even those too young to read”(FCC v.Pacifica Foundation, 1978). The Court has concluded that “thegovernment’s interest in the ‘well-being of its youth’ and in supporting‘parents’ claim to authority in their own household’ . . . amply justifiesspecial treatment of indecent broadcasting.” In the special case of broadcastmedia, government regulation can infringe on adult communicative rightsin order to ensure the protection of children.
Congress has largely entrusted the regulation of broadcast media tothe Federal Communications Commission (FCC), which possesses a“broad” and “expansive” power “to assure that broadcasters operate inthe public interest” (McConnell v. FEC, 2003; Red Lion BroadcastingCompany v. FCC, 1969). The FCC has promulgated rules to protect theinterests of children. Of particular pertinence are the FCC’s rules enforc-ing the Children’s Television Act, P.L. No. 101–437, 104 Stat. 996(1990),15 which sets advertising limits for children’s programming. TheAct requires television broadcasters to “limit the duration of advertisingin children’s television programming to not more than 10.5 minutes perhour on weekends and not more than 12 minutes per hour on weekdays”(47 U.S.C. § 303a(b), 2002).16 The FCC interpreted children’s program-ming to refer to “programs originally produced and broadcast primarilyfor an audience of children 12 years of age and under,”17 and it craftedrules specifically designed to protect such children, who “constitute theaudience primarily affected by overcommercialization because they arethe persons who have the most difficulty distinguishing between commer-cial and programming material.”18 The FCC also regulates television sta-tions’ broadcast of “program-length commercials,” which it defines as “aprogram associated with a product, in which commercials for that prod-uct are aired” (16 C.F.R. § 308.3(a)(6), 2005).19 The FCC has appliedthese rules to prevent integrated cross-promotion. In one instance, it fineda television station which broadcast an advertisement for “Disney on Ice”during an episode of “Chip and Dale’s Rescue Rangers.” In holding thestation responsible for violating the rule, the FCC noted that the policywas motivated by “a fundamental regulatory concern, that children whohave difficulty enough distinguishing program content from unrelatedcommercial matter, not be all the more confused by a show that inter-

PUBLIC POLICY ISSUES IN FOOD AND BEVERAGE MARKETING 349
weaves program content and commercial matter” (UTV of San Francisco[KBHK-TV], 10 FCC Record 10,986 [Oct. 4, 1995]). The FCC has heldvarious other stations liable for violating this marketing restriction aswell (North Carolina Broadcasting Partners [WCCB-TV], 16 FCC Record5,627 [Mar. 7, 2001]; Gary M. Cocola [KXVO-TV], 15 FCC Record9,192 [May 26, 2000]; Peak Media of Pennsylvania [WWCP-TV], 14FCC Record 13,937 [Aug 27, 1999]).
Because of the special constitutional status of the broadcast media,there is little doubt that these FCC regulations meet First Amendmentstandards, even though they substantially interfere with the ability of adver-tisers to reach adults, who often view children’s programs. The committeeagreed that there was potential benefit from children’s advertising closelyaligned with healthful diets, and if an emphasis on the advertising of health-ful foods and beverages could not be accomplished voluntarily, Congressshould consider and, most felt, enact legislation mandating the shift onboth broadcast and cable television. The customary deliberations of thelegislative process would afford the opportunity for further assessment ofthe execution and implications of such a shift.
Government regulation of the Internet, by contrast, has been held sub-ject to ordinary First Amendment principles (Reno v. American Civil Liber-ties Union, 1997). At the present time, the FTC is the lead federal agency inregulating commercial practices on the Internet. As of 2004, the FTC hadpursued approximately 300 cases that challenged Internet practices involv-ing substantial harms to consumers (North Carolina Broadcasting Partners[WCCB-TV], 16 FCC Record 5,627 [Mar. 7, 2001]; Gary M. Cocola[KXVO-TV], 15 FCC Record 9,192 [May 26, 2000]; Peak Media of Penn-sylvania [WWCP-TV], 14 FCC Record 13,937 [Aug. 27, 1999]). Some ofthese cases involved deceptive or unfair marketing practices deployed inother media as well as the Internet, such as deceptive weight loss practices.Other cases have involved advertising or marketing practices that are uniqueto the Internet, such as the use of spyware (FTC v. D Squared Solutions,LLC, 2003). The FTC has also issued rules regulating websites’ collectionof personal information from children pursuant to its authority under theChildren’s Online Privacy Protection Act (COPPA) (15 U.S.C. §§ 6501–6506, 2002).20 The regulations apply to operators of any websites or onlineservices directed at children and to operators who knowingly collect ormaintain personal information from a child.
The rules impose various requirements on operators, including thatthey post a clear and prominent link to a notice of their privacy policieswith regard to children on the home pages of their websites or onlineservice as well as in each additional area where personal information iscollected from children. These notices must include information about theidentity of the operator, the types of personal information that is being

350 FOOD MARKETING TO CHILDREN AND YOUTH
collected from children, how the operator uses that information, and whe-ther that information is disclosed to third parties. In addition, the regula-tions require that the operators obtain parental permission before theycollect, use, or disclose the personal information of children. Operatorsmust provide parents with a reasonable means to review the personal infor-mation collected from their children and to stop its maintenance or contin-ued collection if they desire. The regulations prohibit an operator fromconditioning a child’s “participation in a game, the offering of a prize, oranother activity on the child’s disclosing more personal information than isreasonably necessary to participate in such activity.” Finally, the regula-tions require operators to establish and continue reasonable procedures toprotect the confidentiality, security, and integrity of personal informationcollected from children (16 C.F.R. 312.8).21
It is likely that restrictions on Internet speech will be subject to the samekind of First Amendment scrutiny as would be deployed were the restric-tions applicable to speech in movies or in newspapers. The nature of thisscrutiny will depend upon whether the communication at issue is catego-rized as “public discourse” (Hustler Magazine v. Falwell, 1988), in whichcase constitutional review will be quite strict, or instead as “commercialspeech,” in which case it will be subject to the more lenient standard of theCentral Hudson test. Regulation of the Internet poses unresolved constitu-tional issues because the constitutional status of much speech on the Internetis at this time highly uncertain.
Increasingly prominent are “advergames,” which contain brandedproducts built directly into a game through video games or Internet-basedgames with the intent to sell products (Chapter 4). Courts are just nowbeginning to rule that video games, if they are sufficiently artistic andcomplex, can be “analytically indistinguishable from other protected me-dia, such as motion pictures or books, which convey information or evokeemotions by imagery, and are protected under the First Amendment”(American Amusement Machine Association v. Kendrick, 2001; Interac-tive Digital Software Association v. St. Louis County, 2003; Video Soft-ware Dealers Association v. Maleng, 2004; Wilson v. Midway Games,2002). If advergames seem to have the primary purpose and effect ofselling products, however, they might be categorized as advertisementsrather than motion pictures or books, and hence subject to the standardsof the Central Hudson test. There is also the question of how courts willcategorize entire websites, such as Postopia.com®, hosted by Viacom Inter-national (compare Ford Motor Company v. Texas Department of Trans-portation, 2001 with Fred Wehrenberg Circuit of Theatres, Inc. v.Moviefone, Inc., 1999). This website features Kraft Foods’ food and bever-age brands that contain both advergames and other types of commercialinformational content (Viacom International, 2005).

PUBLIC POLICY ISSUES IN FOOD AND BEVERAGE MARKETING 351
Finding: Regulations for those who advertise and market food and bever-age products to children will need to evolve as the food industry developsnew techniques for promoting its products. How current law will be ap-plied to rapidly changing areas like the Internet cannot currently be pre-dicted with confidence. However, future regulatory interventions shouldcertainly be taken on the basis of reliable data concerning the impacts onchildren of the marketing and advertising of food and beverage products.Currently, neither the Federal Trade Commission, nor any other respon-sible federal agency, collects or maintains such data.
OTHER POTENTIAL POLICY APPROACHES
The knowledge base supporting the importance of diet in promotinghealth and preventing disease has evolved during the last half century,which occurred after many U.S. agricultural policies had developed andbeen implemented. U.S. agricultural and economic policies have historicallysupported the production of a plentiful and affordable food supply, andhealth-promotion and disease-prevention objectives have not played a cen-tral role in these policies (Tillotson, 2004). Examining the historical contextof the evolution of food and nutrition policies is important to understandthe role they may have played in contributing to the rise in obesity rates andother chronic diseases. This section identifies potential actions that havebeen suggested in various quarters to create industry incentives or supportagricultural subsidies to produce and market more healthful foods, as wellas those to reduce the demand for less healthful foods.
Price Supports and Subsidies
An analysis of the agricultural production in the United States relativeto recommended dietary guidelines showed that the food supply contains asubstantial surplus of sugars and oils; approximately the expected amountsof meat, milk, and grains; and substantially less than what is needed forfruits and vegetables (Duxbury and Welch, 1999). Several agricultural poli-cies and regulations that may affect the food sector and consumer foodchoices and dietary intake are federal farm assistance programs that includeprice- and income-support programs, producer-funded marketing orders,and research and promotion agreements (Ralston, 1999). Price and incomesupport programs have historically affected the market supply of foods.From 1970 to 1985, poultry became a lower-priced alternative to red meat,and consumers switched from more expensive animal-based fats to lower-priced vegetable-based fats and oils (IOM, 1991).
Historically, price supports for milk were readily available based onthe butterfat content of milk rather than the low-fat content of milk. In

352 FOOD MARKETING TO CHILDREN AND YOUTH
1991, the Institute of Medicine (IOM) recommended that the dairy indus-try and companies that sell dairy products work toward changing the milkpricing system to encourage dairy producers to breed and manage theirherds for the production of lower fat milk in accordance with changingconsumer demand (IOM, 1991). Empirical research has shown that thedairy industry could receive economic benefits from the explicit promotionof low-fat milk, but the nutritional benefits of such promotion may beoffset by dietary substitutions for fat from other types of foods (Pelletieret al., 1999).
Using price subsidies to encourage healthful food consumption, such asfruits and vegetables, in the United States has not been well explored butwarrants further research. This type of research into subsidizing the growth,production, and consumption of healthier foods could improve knowledgeabout the feasibility of encouraging subsidies as a policy instrument topromote healthier food choices. An analysis of the U.S. produce productioncompared to the Dietary Guidelines for Americans showed sizable deficitsin vegetable and fruit production in the United States. There are economicopportunities to increase the production of fruits and vegetables in differentregions and to increase the U.S. government purchase of domestic surplusfruits, vegetables, and specialty crops that could be used for schools andother food service establishments (Branaman, 2003; Duxbury and Welch,1999).
Tariff regulations cover a broad array of sectors other than agriculture,including trade policies, such as the North American Free Trade Agreement(NAFTA), restrictions on mergers, and environmental requirements. Theseregulations may affect the price or availability of specific food products.Other government regulations and programs may also affect food choicessuch as changes in welfare assistance regulations, which can increase ordecrease household income and affect consumer food choices. How theseregulations and polices impact individual dietary choices depends on howthe regulations affect retail food prices and how responsive consumers areto the price changes (IOM, 1991). Ingredient costs are a small fraction ofretail prices for many processed foods, but commodity prices are a largerproportion of food retail prices, especially for fresh meat, fish, poultry,eggs, milk, cheese, fruits, and vegetables. Consumers are not very respon-sive to price changes for poultry, eggs, fish, milk, and cheese, but they aremore responsive to the prices of some fresh fruits and vegetables, as well aspork and beef (Ralston, 1999).
Tax Incentives
An imposition of taxes on certain foods and beverages, particularlyones that are salty, high-calorie, high-fat, high in added sugars, and low-

PUBLIC POLICY ISSUES IN FOOD AND BEVERAGE MARKETING 353
nutrient has been suggested by certain public health advocates as a viabledisincentive to discourage the consumption of less healthful foodsand beverages (Brownell and Horgen, 2004; Kuchler et al., 2004, 2005;Swinburn and Egger, 2002). Empirical research is not readily available toassess the effectiveness of taxing certain foods and beverages in order toinfluence dietary choices, but some interesting work using economic modelsis beginning to emerge. For example, one assessment by the Food andResource Economics Institute in Denmark used an econometric model topredict the effect of different tax (e.g., fat, saturated fat, sugar) or subsidy(e.g., fiber) approaches to changing diets. It found that each could have animpact on consumption, but with variable results by nutrient category andby socioeconomic and geographic status. The authors suggest that, for fulleffect, such economic incentives might require combination with other in-terventions, such as related public information campaigns (Smed et al.,2005).
Experience from tobacco policy in the United States has shown thattaxing cigarettes, as a component of a comprehensive state-based program,is a cost-effective means of reducing tobacco use and achieving publichealth gains in adults (Warner, 2005) but does not necessarily discouragetobacco use in youth (DeCicca et al., 2002). The impact of implementingtaxes on certain branded food items or high-calorie and low-nutrient foodand beverage categories would depend on the size of the tax, how easilymanufacturers could move their resources to produce and distribute un-taxed products, and on how consumers would respond to the taxes (Kuchleret al., 2004).
In 2000, 18 states implemented a tax on specifically targeted food andbeverages (e.g., candy, soft drinks, soft drink syrups, gum, ice cream, di-luted juices, chocolate milk, and others) and 7 states had previously im-posed taxes for certain foods, or categories of foods, but the legislation hadbeen repealed (Brownell and Horgen, 2004; Jacobson and Brownell, 2000).The rationale for the repealed laws included lobbying by the soft drink andbottling industries, retailers, distributors, and industry employees; difficul-ties administering the taxes due to lack of clarity for a definition of whichcategories of foods and beverages to tax; and opposition to taxes linked toa general fund that could be used for purposes other than promoting publichealth objectives (Jacobson and Brownell, 2000).
Supporters of taxation have suggested several ways to implement suchpolicies including taxing certain types of foods and beverages (e.g., high insalt, added sugars, fat, and total calories or low in nutrients) or taxingspecific categories of foods and beverages (e.g., snack foods, candy, softdrinks, and fast foods) (Brownell and Horgen, 2004; Yach et al., 2003).The evidence does not exist at this time, however, to support a definiteconclusion about whether imposing a sales tax on less healthful foods

354 FOOD MARKETING TO CHILDREN AND YOUTH
would have a significant effect on reducing sales. Consumers tend to favortaxes when the revenues will be used to fund health education programs(Jacobson and Brownell, 2000). Some have also advocated for simulta-neous subsidization of fruits and vegetables to encourage more healthfuldiet (Brownell and Horgen, 2004; Kuchler et al., 2004). Opponents oftaxation have suggested that taxation of certain categories of foods mayproduce unanticipated consequences for low-income consumers (Brownelland Horgen, 2004) and not produce the desirable effect of changing indi-viduals’ dietary patterns (Kuchler et al., 2004). One study determined thata small tax (1 cent per pound) as suggested in some research would notappreciably alter consumption, but would generate large tax revenues(Kuchler et al., 2004). The IOM (2005a) concluded that there is insuffi-cient evidence to recommend either for or against taxing these foods, andthat taxation or subsidies by themselves have not been substantial enoughto create sustainable changes in people’s eating behaviors. Research into avariety of factors is needed to determine the desirable combination of com-prehensive policy instruments to encourage consumer behavior changes(Yach et al., 2003).
FOOD MARKETING POLICIESOUTSIDE THE UNITED STATES
The rising concern about obesity in children and youth globally has ledto public health responses in many countries and organizations. An esti-mated 85 percent of 73 countries surveyed by the World Health Organiza-tion (WHO) had some form of regulation for television advertising tochildren (Hawkes, 2004) (Appendix G, Table G-1). While television adver-tising may be the most efficient medium for food and beverage promotion,there are also statutory or voluntary regulations for other marketing ap-proaches and channels used to reach children including in-school market-ing, sponsorship, product placement, the Internet, and sales promotion(Appendix G, Table G-2). Options for advertising regulation in variouscountries include partial restrictions on advertising by type of food, targetgroup, portion size, and the times of advertising exposure; establishingupper and lower limits of advertising exposure to children of certain ages;and a complete ban on advertising to children (Hawkes, 2004).
Where advertising legislation has been enacted, such as in Sweden andNorway, and in the Canadian province of Quebec, the regulations becomeless relevant when advertising through broadcast media (especially televi-sion and radio) is transmitted from outside national boundaries. Advertise-ments that are subject to the transmitting countries’ guidelines and regula-tions, rather than those of the receiving countries’ regulations, presents adilemma for countries where the national border does not serve as aneffective barrier to children’s broadcast media and advertising.

PUBLIC POLICY ISSUES IN FOOD AND BEVERAGE MARKETING 355
Many countries use different definitions for children in developing regu-lations and some do not define an upper age limit. In regulations, childrenmay be described as minors, juveniles, or young people, and the target agesmay range from under 12 years to under 18 years (Hawkes, 2004). Similarmarketing regulations can apply to various age groups in different countriesand may create inconsistencies, especially when advertising messages trans-mitted externally from countries such as Sweden and Norway or the prov-ince of Quebec are subject to the transmitting countries’ guidelines andregulations that may be more lenient or define children differently.
To enhance attention, action, and consistency across the internationalcommunity, the WHO developed a Global Strategy on Diet, Physical Activ-ity and Health that provides members states with a range of policy optionsto address less healthful dietary practices and physical inactivity, includingprovisions for marketing, advertising, sponsorship, and promotion. Theseprovisions recommended that food and beverage advertisements should notexploit children’s inexperience or credulity, should discourage messagesthat promote unhealthy dietary practices, and should encourage positivehealth messages. The Global Strategy was endorsed by the 57th WorldHealth Assembly in 2004 (WHO, 2004).
International Chamber of Commerce
The International Chamber of Commerce (ICC) developed a series ofself-regulatory codes of practice that set out ethical standards for differenttypes of marketing, each of which includes a clause for children (Hawkes,2004). The International Code of Advertising Practice covers televisionadvertising. According to Article 14 of the Code, advertisements should notexploit the inexperience or credulity of children and young people (ICC,1997). The International Code of Sales Promotion has a similar clause inArticle 8 and adds that sales promotions should not harm children or youngpeople mentally, morally, or physically, or strain their loyalty with parentsor guardians (ICC, 2002). Article 7 of the International Code on Sponsor-ship presents an almost identical clause (ICC, 2003). The codes are fre-quently reflected in codes of professional associations in many countries.
Europe
The European Heart Network, concerned about the 20 percent ofschool-aged European children who are either obese or at risk for obesity,documented marketing trends for children in 20 European countries. TheNetwork is developing an action plan to address childhood obesity through-out the European Union (EU) that includes protecting children from foodmarketing the network considers to be unhealthy (e.g., foods and beverages

356 FOOD MARKETING TO CHILDREN AND YOUTH
that are high in fat, sugar, salt, and low in nutrients) as one of manyinterventions to address childhood obesity (Matthews et al., 2005).
The EU Television Without Frontiers Directive is coordinated by theEuropean Commission Directorate-General for Education and Culture thatguides policy in Europe (TWFD, 2005). The Directive, most recently re-vised in 1997, upholds the basic freedom and legal right to advertise tochildren, provided a set of minimum criteria are observed. Article 16 of theEU Television Without Frontiers Directive states that “Television advertis-ing shall not cause moral or physical detriment to minors.” Many countriesalso implement regulations that restrict the timing and content of televisionadvertising to children. As many as 25 European countries do not allowchildren’s television programs of less than 30 minutes duration to be inter-rupted by advertising, which complies with Article 11 of the EU TelevisionWithout Frontiers Directive (Hawkes, 2004).
For EU Member States, the EU Television Without Frontiers Directiveregulates sponsorship and product placement as well. Under Article 17, asponsor may not influence the content of sponsored television, a sponsormust be clearly identified as such by its name at the beginning or end of theprogram, and the programs may not encourage the purchase of a sponsor’sproducts. Article 10 prohibits hidden or surreptitious advertising. A totalof 7 EU Member States and 6 other non-EU Member States appear torestrict some forms of product placement, and 4 EU Member States andNorway have explicitly banned product placement in television programs(Hawkes, 2004).
The Broadcasting Commission of Ireland introduced a new code in2001 that bans the use of cartoon characters and celebrities to promotefoods. The Children’s Advertising Code defines certain categories of food,such as fast foods, that must carry a message stating that foods should beeaten in moderation and are part of a balanced diet. Confectionary prod-ucts must have an auditory or visual message stating that sugar-sweetenedproducts can damage teeth (BCI, 2001).
The self-regulatory body in the United Kingdom is the AdvertisingStandards Authority (ASA), an independent entity that investigates non-adherence to the Code of Advertising, Sales Promotions, and Direct Mar-keting that is developed by the Committee on Advertising Practice, anindustry body with representatives from marketing and media that developand enforce the advertising guidelines. Although the code states that child-directed advertising should contain nothing that is likely to result in thephysical, mental, or moral harm of children, it contains no specific rules onfood advertising (Hawkes, 2005).
In 2004, a United Kingdom (U.K.) Department of Trade and Industrybill established a new regulatory body, Ofcom (Office of Communication).As the new communications sector regulator, Ofcom inherited the duties of

PUBLIC POLICY ISSUES IN FOOD AND BEVERAGE MARKETING 357
the five existing regulating bodies it replaced: the Broadcasting StandardsCommission, the Independent Television Commission (ITC), Oftel, theRadio Authority, and the Radiocommunications Agency (Ofcom, 2004).Ofcom uses rules originally published by ITC on the amount and schedul-ing of advertising (Ofcom, 2005), stipulating that advertisements may notbe inserted during programs designed to be broadcast in schools or duringprograms for children of less than half an hour scheduled duration. Ofcomrecently conducted research to examine the effects of food advertising onchildhood obesity and concluded that television advertising has a modestdirect effect on children’s food choices. Ofcom also concluded that chang-ing the rules for the advertising of food products that are high in fat, salt,and sugar as a single approach to combat obesity would be highly unlikelyto succeed (Ofcom, 2004).
Despite the Ofcom conclusions, the U.K. Food Standards Agency hasembarked on a public consultation by a diverse expert committee to de-velop a nutrient profiling model that would use a simple scoring system torate the overall balance of nutrients in foods. The model would supportOfcom’s work to consider possible restrictions on advertising and otherforms of marketing to children for foods that are high in fat, saturated fat,salt, or sugar (FSA, 2005). Additionally, the British Medical Associationrecommended, as a component of its childhood obesity prevention plan, aban on advertising of foods that it considered to be unhealthful, includingcertain sponsorship programs targeted at school children and a ban onunhealthful food and beverage products from school vending machines(BMA, 2005).
The French government has recently passed legislation that mandatoryhealth messages should accompany advertisements on television or radiofor manufactured foods and sweetened beverages that are high in sugar,salt, or artificial colors. Advertisers can be exempted from including theobligatory health messages if they pay 1.5 percent of the expected profit tothe French Health Education Institute to fund nutrition education pro-grams (Carvajal, 2005). The French government’s action is based on thefindings of the Hastings et al. (2003) review, sponsored by the U.K. FoodStandards Agency, which focused on the impact of promotion on the foodchoices of children. The key findings from the review were that food pro-motion affects children’s preferences, purchase behaviors, and consump-tion, not just for different brands but also for different categories of foods(Hastings et al., 2003). The review provided evidence that fostered actionto limit food and beverage promotion directed to children because of theimpact on children’s health.
In Sweden, all television and radio advertising aimed at childrenages 12 and younger during children’s programming was banned in 1991(Bjurstrom, 1994; Hawkes, 2004). The ban was enacted based on the view

358 FOOD MARKETING TO CHILDREN AND YOUTH
that children younger than 12 years cannot clearly distinguish advertisingmessages from program content, and on the principle that children shouldhave the right to grow up in a commercial-free environment, especiallyyoung children who are trusting and do not understand the differencebetween information and the persuasive intent of advertisements or com-mercials (Bjurstrom, 1994). The ban is enforced by the National ConsumerOmbudsman in Sweden and applies only to the Swedish commercial chan-nel but not the Swedish channels broadcast from the United Kingdom(Hawkes, 2004; National Food Administration and National Institute ofPublic Health, 2005). A comprehensive evaluation was not available toassess the effectiveness of the ban on reducing exposure to child-directedtelevision advertising. What is clear is that Swedish children’s exposure toadvertising and other forms of marketing has not been eliminated, as satel-lite television channels originating from the United Kingdom and the UnitedStates to Sweden often provide exposure to commercial television withadvertisements to children (Hawkes, 2004; MacCarthy, 2004; NationalFood Administration and National Institute of Public Health, 2005), whichdemonstrates the challenge of a global economy.
Norway enacted a ban on television advertisements to children ages12 years and younger in 1992 (Hawkes, 2004; Norwegian Ministry ofChildren and Family Affairs, 2005). Although a comprehensive evaluationis not available to assess the effectiveness of the ban on reducing exposureto child-directed television advertising, the Norwegian government has de-veloped The Norwegian Action Plan to Reduce Commercial Pressure onChildren and the Young People (Norwegian Ministry of Children and Fam-ily Affairs, 2005).
Most of the countries that have regulations for in-school marketing arein Europe. Hungary is the only European country with self-regulatory guide-lines that allows advertising only with the permission of the school princi-pal (Hawkes, 2004). France, Greece, Luxembourg, and Portugal have statu-tory restrictions that prohibit in-school marketing. Finland and Germanypermit advertising or marketing materials in schools as long as the schoolor the parents give consent. The governments of Denmark, Ireland, and theNetherlands issued guidelines that require advertisers and marketers tofollow certain principles when targeting schools (Hawkes, 2004; Appen-dix G, Table G-2).
The Internet is a new medium for advertisers to market foods andbeverages to consumers. In 2003, an estimated 13 percent of total spendingon foods, carbonated soft drinks, and fast food advertising was donethrough the Internet in the United Kingdom (Matthews et al., 2005). TheInternet is ranked as the second most important promotional medium thatreaches children and youth after television. Given the high frequency ofadvertising and the novelty of this medium, countries worldwide are in the

PUBLIC POLICY ISSUES IN FOOD AND BEVERAGE MARKETING 359
process of developing guidelines to regulate marketing to children via theInternet. In many European countries, it is presumed that national laws onadvertising and consumer protection are also applicable to advertising us-ing the Internet (Hawkes, 2004). The most stringent regulations have beendeveloped by the Nordic Consumer Ombudsmen for Scandinavian coun-tries, which has implemented guidelines on e-commerce and Internet mar-keting (Nordic Consumer Ombudsmen, 2002). These guidelines prohibitmarketers from obtaining personal information from children and fromurging children to make purchases over the Internet. Marketing is not to bedesigned or integrated as games or activity pages, and the guidelines specifi-cally state that businesses should not send advertising directly to children(Nordic Consumer Ombudsmen, 2002).
Finland is the only country that has regulations in place with gov-ernment oversight regarding broader sales promotion activities (Hawkes,2004). Only three European countries have regulations specific to chil-dren—Finland, Ireland, and the United Kingdom. In Ireland, sales promo-tion codes of practice follow those of the ICC (ASAI, 2001). The BritishCode of Advertising, Sales Promotion, and Direct Marketing states that“promotions addressed to or targeted at children should not encourageexcessive purchases in order to participate” (CAP, 2005).
Other Countries
Both government and self-regulatory mechanisms exist in Canada. TheBroadcast Code for Advertising to Children is statutory and restricts the useof puppets and subliminal messages to encourage children to purchaseproducts. Advertising Standards Canada (ASC), a self-regulating industrybody, is responsible for ensuring adherence to the statutory code. The codestates that advertising directed to children must not exploit their credulityor lack of experience and must not present information that may harm theirphysical, emotional, or moral well-being (ASC, 2004). The Canadian Broad-casting Corporation, the national public broadcaster, does not accept ad-vertising of any kind in programs directed to children younger than 12 yearsof age (CBC, 2005).
In addition to television, Canada regulates in-school and Internet mar-keting. Specifically in the province of Quebec, the Law on State Educationprohibits commercial solicitation in schools. Donations are allowed, how-ever, and commercial funding cannot be used to persuade children to con-sume products. Voluntary guidelines developed by the Canadian TeachersFederation state that school-commercial relationships must share similarobjectives and benefit both students and staff (Hawkes, 2004).
Also in Quebec, the Consumer Protection Act prohibits television ad-vertising directed to children ages 13 and younger and has been in effect

360 FOOD MARKETING TO CHILDREN AND YOUTH
since 1980 (Hawkes, 2004; Quebec Government, 1980). The legislationonly applies to commercial advertising, thus, educational advertising isallowed on television. In addition, the legislation cannot apply to signalsoriginating from outside Quebec that are transmitted by cable televisioncompanies (Quebec Consumer Protection Act, 2005). Because of the tele-vision advertising ban, advertisers have changed commercials to makethem less appealing to children. According to ASC, advertisements aremore likely to be targeted to parents to urge them to purchase products fortheir children. Advertising dollars have also been diverted out of Quebec,thereby decreasing the amount of original French-language Quebec chil-dren’s programming.
A study by Goldberg (1990) suggested that soon after its enactment in1980, the Quebec ban served to reduce children’s exposure to televisioncommercials for sweetened breakfast cereals and consequently reducedchildren’s consumption of these products. Even though children were stillexposed to American commercials, only the English-speaking Canadianchildren could recognize and were more aware of products that were adver-tised, such as toys and sweetened breakfast cereals, and had more of thesein their homes than did French-speaking Canadian children. The French-speaking children were also less likely to urge their parents to purchasethese advertised products (Goldberg, 1990). On the other hand, a morerecent study suggests that despite the advertising ban that has been in effectsince 1980, television food commercials viewed by French-speaking Cana-dian children neither represent a balanced diet nor the foods recommendedby the Canadian government (Lebel et al., 2005).
The Australian obesity prevention action plan supports stricter na-tional regulations on food advertising directed to children, and is consider-ing a ban on advertising during children’s television viewing time (NSWCentre for Public Health Nutrition, 2005). Regulation of television in Aus-tralia is currently a combination of legislation and self-regulation withmore emphasis on the statutory regulation. The Children’s Television Stan-dards (CTS) of the Australian Broadcasting Authority implements regula-tions limiting the amount of advertising to children according to programclassification. Advertisements aired during programs directed at preschoolchildren (‘P’ programs) are prohibited. Advertisements broadcast duringprograms directed at primary school-aged children (‘C’ programs) are lim-ited to 5 minutes every 30 minutes (ABA, 2002). CTS also limits the repeti-tion of advertisements and those featuring children’s television personali-ties. Australia also has voluntary guidelines that were developed by theeducational sector to regulate in-school marketing. Organizations are askednot to seek endorsement of products or services, as a condition of a spon-sorship or participation in a promotion by the Australian Education Coun-cil (Hawkes, 2004).

PUBLIC POLICY ISSUES IN FOOD AND BEVERAGE MARKETING 361
A brief summary is provided for the regulatory and voluntary guide-lines of selected countries in Africa, Asia, Latin America, and the MiddleEast (Appendix G, Table G-1).
Finding: Comprehensive evaluations are not available to assess the effect onchildren’s diets of countrywide bans on child-directed television advertis-ing. Limited evidence suggests that national borders may not serve as effec-tive barriers to children’s broadcast media and advertising where it is com-mon to receive broadcasts from outside the receiving countries.
SUMMARY
Various public policies and programs implemented by government atall levels have the potential to influence the diets of children and youth.Dietary guidance, nutrition education and promotion, school nutrition poli-cies and programs, food labeling, regulation of food marketing, and foodproduction, distribution, and pricing policies, all have the potential to af-fect options and choices, and the milieu within which food and beveragemarketing takes place. Several education and information programs andpolicies are sponsored by government at federal, state, and local levels andin many venues. The policy touchstones for federal education and informa-tion programs on nutrition are the Dietary Guidelines for Americans and itsgraphic representation, MyPyramid. Several federal partnerships promotenutrition and healthful diets as well, including the USDA and U.S. Depart-ment of Education HealthierUS School Challenge, the DHHS Small Stepand Small Step Kids!, the DHHS 5 a Day for Better Health program, andthe DHHS/NIH We Can! childhood obesity prevention collaboration.
Nutrition labeling is one principal means of conveying nutrition infor-mation to the public. The importance of integrating and improving strate-gies for using the food label as an educational tool is emphasized by recentcompany initiatives to use proprietary logos or icons that communicate thenutritional qualities of their branded products. The DHHS Food and DrugAdministration (FDA) is the primary agency responsible for overseeing theuse of food and beverage labels to convey nutrition information and healthclaims, and is key to progress in ensuring the accuracy, consistency andeffectiveness of industry and government initiatives using such graphics andstandards to convey the nutritional qualities of foods and beverages in aform appealing and easily understood by children, youth, and their parents.
School-based interventions that reach the nation’s children and youthinclude nutrition education, school food services, the Fruit and VegetablePilot Program, and the Department of Defense’s Fresh Produce Program.Recent attention has been focused on competitive foods in schools. Thereare currently no comprehensive federal competitive food standards to guide

362 FOOD MARKETING TO CHILDREN AND YOUTH
the type of products that are available and marketed in America’s schoolsand other venues. However, a variety of legislative initiatives pertaining tothe availability, marketing, and sales of competitive foods and beverages inschools have been enacted or proposed at the state, district, and local levels.
Social marketing applies commercial marketing concepts and techniquesto promote voluntary behavior change in specific groups or target audi-ences based on their socio-demographic, behavioral, and psychological char-acteristics. Evidence for the effectiveness of social marketing programs topromote healthful behaviors is promising but mixed. A central challenge tolarge-scale social marketing efforts is discerning their impact. Social mar-keting programs that have had positive results had higher funding, beensustained, been shaped by formative research, used an integrated marketingapproach, and had ongoing monitoring and evaluation.
Like other dimensions of commerce, advertising and marketing is sub-ject to regulation, including marketing that reaches children. Due to theprominence and complexity of this matter, the chapter presents a detailedanalysis of the related issues, precedents, and considerations. The commit-tee agreed that there was potential benefit from children’s advertising closelyaligned with healthful diets, and if an emphasis on the advertising of health-ful foods and beverages could not be accomplished voluntarily, Congressshould consider and, most felt*, enact legislation mandating the shift onboth broadcast and cable television. The customary deliberations of thelegislative process would afford the opportunity for further assessment ofthe execution and implications of such a shift. Other potential policy ap-proaches that have been suggested are reviewed, including creating industryincentives and support for agricultural subsidies to produce and marketmore healthful foods, as well as to reduce the demand for less healthfulfoods.
The rising concern about obesity in children and youth globally has ledto public health responses in many countries that have developed regula-tory and voluntary advertising and marketing guidelines. Similarly, severalinternational organizations, including the World Health Organization, havedeveloped related policies.
*JHB excepted, based on his belief that the level of quantitative evidence on the salutaryimpact of more balanced television advertising on children’s dietary patterns, in combinationwith a reported decline in the role of television advertising in the overall marketing of foodsto children, would be insufficient for such a requirement to overcome the constitutionalprotection of freedom of speech.

PUBLIC POLICY ISSUES IN FOOD AND BEVERAGE MARKETING 363
REFERENCES
44 Liquormart, Inc. v. Rhode Island, 517 U.S. 484 (1996).ABA (Australian Broadcasting Authority). 2002. Children’s Television Standards. Australian
Broadcasting Authority. [Online]. Available: http://www.aba.gov.au/contentreg/codes/television/documents/chstdvarn_03.pdf [accessed November 18, 2005].
Action for Children’s Television v. FCC, 58 F.3d 654, 660 (D.C. Cir. 1995).Ad Council. 2005. What is Public Service Advertising? [Online]. Available: http://www.
adcouncil.org/np/tips_psa_definition/ [accessed June 23, 2005].American Amusement Machine Association v. Kendrick, 244 F.3d 572, 574-78 (7th Cir.
2001).Anderson PM, Butcher KF. 2005. Reading, Writing and Raisinets: Are School Finances Con-
tributing to Childhood Obesity? Working Paper 11177. Cambridge, MA: National Bu-reau of Economic Research.
Andreasen AR. 1995. Marketing Social Change. Changing Behavior to Promote Health, So-cial Development, and the Environment. San Francisco, CA: Jossey-Bass.
Andreasen AR. 2002. Marketing social marketing in the social change marketplace. Journalof Public Policy & Marketing 21(1):3–13.
ASAI (Advertising Standards Authority of Ireland). 2001. Code of Sales Promotion Practice,3rd edition. Dublin, Ireland: ASAI. [Online]. Available: http://www.asai.ie/ [accessedMay 9, 2005].
ASC (Advertising Standards Canada). 2004. Canadian Code of Advertising Standards.Toronto, Canada: ASC.
Audio Communication, Inc. 114 F.T.C. 414 (1991).Azuma A, Fisher A. 2001. Healthy Farms, Healthy Kids: Evaluating the Barriers and Oppor-
tunities for Farm-to-School Programs. Venice, CA: Community Food Service Coalition.Backer TE, Rogers EM. 1993. Organizational Aspects of Communication Campaigns: What
Works? Newbury Park, CA: Sage Publications, Inc.Bad Frog Brewery, Inc. v. New York State Liquor Authority, 134 F.3d 87 (2d Cir. 1998).Bates v. State Bar of Arizona, 433 U.S. 350, 383 (1977).BCI (Broadcasting Commission of Ireland). 2001. Children’s Advertising Code. Dublin, Ire-
land: BCI.Beales JH. 2004. Advertising to Kids and the FTC: A Regulatory Retrospective That Advises
the Present. [Online]. Available: http://www.ftc.gov/speeches/beales/040802adstokids.pdf [accessed April 8, 2005].
Bethel School District v. Fraser, 478 U.S. 675, 685–86 (1986).Bjurstrom E. 1994. Children and Television Advertising. A Critical Study of International
Research Concerning the Effects of TV-Commercials on Children. Report No. 1994/95:8. Stockholm, Sweden: Swedish Consumer Agency.
BMA (British Medical Association). 2005. Preventing Childhood Obesity. London, UK: BMA.Bolger v. Youngs Drug Products Corp., 463 U.S. 60, 74–75 (1983).Boone LE, Kurtz DL. 1998. Contemporary Marketing Wired. 9th ed. Orlando, FL: The
Dryden Press.Branaman B. 2003. Fruits and Vegetables: Issues for Congress. Congressional Research Ser-
vice. The Library of Congress.Brown J. 2001. Media literacy and critical television viewing in education. In: Singer DG,
Singer JL, eds. Handbook of Children and the Media. Thousand Oaks, CA: Sage Publi-cations. Pp. 681–697.
Brownell KD, Horgen KB. 2004. Food Fight: The Inside Story of the Food Industry,America’s Obesity Crisis, and What We Can Do About It. New York: The McGraw-Hill Companies.

364 FOOD MARKETING TO CHILDREN AND YOUTH
Buckingham D. 2005. The Media Literacy of Children and Young People: A Review of theResearch Literature. London, England: Centre for the Study of Children, Youth andMedia Institute of Education, University of London, London Knowledge Lab. [Online].Available: http://www.ofcom.org.uk/advice/media_literacy/medlitpub/?a=87101 [ac-cessed April 12, 2005].
Bunch v. Hoffinger Industries, Inc., 123 Cal. App. 4th 1278, 1298 (Cal. Ct. App. 2004).Burbridge v. Sampson, 74 F. Supp. 2d 940 (C.D. Cal. 1999).Butler v. Michigan, 352 U.S. 380, 383 (1957).Buzby JC, Guthrie JF, Kantor LS. 2003. Evaluation of the USDA Fruit and Vegetable Pilot
Program: Report to Congress. E-FAN-03-006. Washington, DC: USDA.Cain v. Sheraton Perimeter Park South Hotel, 592 So. 2d 218, 220-22 (Ala. 1991).CAP (Committee of Advertising Practice). 2005. The British Code of Advertising, Sales Pro-
motion, and Direct Marketing. [Online]. Available: http://www.cap.org.uk/NR/rdonlyres/A44808F1-1573-482A-A0E5-D8045943DA57/0/The_CAP_Code_Ed11_1Oct2005.pdf[accessed May 9, 2005].
Carvajal D. 2005, October 2. Processed foods? Read this, France says. International HeraldTribune Online [Online]. Available: http://www.iht.com/articles/2005/10/02/business/food03.php [accessed October 24, 2005].
CBC (Canadian Broadcasting Corporation). 2005. Summary of CBC Advertising Standards.[Online]. Available: http://cbc.radio-canada.ca/docs/policies/advertising.shtml [accessedNovember 17, 2005].
CDC (Centers for Disease Control and Prevention). 2002. Behavioral Risk Factor Surveil-lance System Survey Data. Prevalence Data: Risk Factors and Calculated Variables—2002. Atlanta, GA: U.S. Department of Health and Human Services, CDC. [Online].Available: http://apps.nccd.cdc.gov/brfss/list.asp?cat=RF&yr=2002&qkey=4409&state=All/ [accessed April 10, 2005].
CDC. 2005a. 5 A Day. Home. [Online]. Available: http://www.cdc.gov/nccdphp/dnpa/5aday/[accessed October 14, 2005].
CDC. 2005b. About CDC: CDC Organization. [Online]. Available: http://www.cdc.gov/about/cio.htm [accessed October 15, 2005].
CDC. 2005c. Competitive foods and beverages available for purchase in secondary schools—Selected sites, United States, 2004. MMWR 54(37):917–921. [Online]. Available: http://www.cdc.gov/mmwr/preview/mmwrhtml/mm5437a1.htm [accessed October 10, 2005].
CDC. 2005d. Guidance for Evaluating Mass Communication Health Initiatives: Summary ofan Expert Panel Discussion. Office of Communication, CDC. [Online]. Available: http://www.cdc.gov/communication/practice/epreport.pdf [accessed October 19, 2005].
CDC. 2005e. Powerful Bones. Powerful Girls.™ [Online]. Available: http://www.cdc.gov/powerfulbones/ [accessed October 14, 2005].
CDC. 2005f. VERBNow.com. [Online]. Available: http://www.verbnow.com [accessed No-vember 11, 2005].
CDC. 2005g. Youth Media Campaign. VERB™. [Online]. Available: http://www.cdc.gov/youthcampaign/ [accessed July 30, 2005].
Central Hudson Gas & Electric Corporation v. Public Service Commission, 447 U.S. 557,566 (1980).
Clime v. Dewey Beach Enterprises, Inc., 831 F. Supp. 341, 344-46 (D. Del. 1993).Columbia Broadcasting System, Inc. v. Democratic National Committee, 412 U.S. 94, 101-
02 (1973).Committee on Education and the Workforce. 2004. Child Nutrition and WIC Reauthoriza-
tion Act Bill Summary. [Online]. Available: http://edworkforce.house.gov/issues/108th/education/childnutrition/billsummaryfinal.htm [accessed October 20, 2005].

PUBLIC POLICY ISSUES IN FOOD AND BEVERAGE MARKETING 365
Contento I, Balch G, Bronner YL, Lytle LA, Maloney SK, Olson CM, Sharaga SS. 1995. Theeffectiveness of nutrition education and implications for nutrition education policy, pro-grams, and research: A review of research. J Nutr Ed 27(6):276–283.
Cooperative State Research, Education, and Extension Service. 2005. USDA Expanded Foodand Nutrition Education Program. [Online]. Available: http://www.csrees.usda.gov/nea/food/efnep/about.html [accessed November 9, 2005].
CPEHN (California Pan-Ethnic Health Network) and Consumers Union. 2005. Out of Bal-ance: Marketing of Soda, Candy, Snacks and Fast Foods Drowns Out Healthful Mes-sages. Oakland and San Francisco, CA. [Online]. Available: http://www.consumersunion.org/pdf/OutofBalance.pdf [accessed September 15, 2005].
CSPI (Center for Science in the Public Interest). 2003. School Foods Tool Kit. A Guide toImproving School Foods & Beverages. Part III: Case Studies. State Legislation to ImproveSchool Foods and Beverages. [Online]. Available: http://www.cspinet.org/schoolfoodkit/school_foods_kit_part3.pdf [accessed November 10, 2005].
CSPI. 2004. Model School Foods Legislation. [Online]. Available: http://www.cspinet.org/nutritionpolicy/school_food_legislation2.pdf [accessed June 15, 2005].
CSPI. 2005. Schools and School Districts That Have Improved School Foods and Beveragesand Not Lost Revenue. [Online]. Available: http://www.cspinet.org/nutritionpolicy/improved_school_foods_without_losing_revenue2.pdf [accessed November 10, 2005].
Daynard RA, Howard PT, Wilking CL. 2004. Private enforcement: Litigation as a tool toprevent obesity. J Public Health Policy 25(3–4):408–417.
DeCicca P, Kenkel D, Mathios A. 2002. Putting out the fires: Will higher taxes reduce theonset of youth smoking? J Political Economy 110(1):144–169.
DHHS (U.S. Department of Health and Human Services). 2005a. Head Start Bureau: Pro-grams and Services. [Online]. Available: http://www.acf.hhs.gov/programs/hsb/programs/index.htm [accessed October 14, 2005].
DHHS. 2005b. Office of the Surgeon General. [Online]. Available: http://www.surgeongeneral.gov/publichealthpriorities.html#schools [accessed October 5, 2005].
DHHS. 2005c. Small Step. [Online]. Available: http://www.smallstep.gov [accessed October7, 2005].
DHHS. 2005d. Small Step Kids! [Online]. Available: http://www.smallstep.gov/kids/index.cfm[accessed November 1, 2005].
DHHS. 2005e. Steps to a Healthier U.S. Initiative. [Online]. Available: http://www.healthierus.gov/steps/ [accessed November 2, 2005].
DHHS, NIH (National Institutes of Health), NCI (National Cancer Institute). 2005. Eat 5 to9 Servings of Fruits and Vegetables a Day for Better Health. [Online]. Available: http://www.5aday.gov [accessed October 21, 2005].
DHHS, USDA (U.S. Department of Agriculture). 2005. Dietary Guidelines for Americans2005. [Online]. Available: http://www.healthierus.gov/dietaryguidelines [accessed March28, 2005].
Dorfman L, Wilbur P, Lingas EO, Woodruff K, Wallack L. 2005. Accelerating Policy onNutrition: Lessons from Tobacco, Alcohol, Firearms, and Traffic Safety. Berkeley MediaStudies Group. [Online]. Available: http://home.mpowercom.net/~bmsg08/pdfs/BMSG_AccelerationReport.pdf [accessed July 30, 2005].
Duxbury JM, Welch RM. 1999. Agriculture and dietary guidelines. Food Policy 24(2–3):197–209.
Eisenberg M, Ringwalt C, Driscoll D, Vallee M, Gullette G. 2004. Learning from truth®:Youth participation in field marketing techniques to counter tobacco advertising.J Health Commun 9(3):223–231.
366 FOOD MARKETING TO CHILDREN AND YOUTH
Elliott S, Wilkenfeld JP, Guarino ET, Kolish ED, Jennings CJ, Siegal D. 1981. FTC Final StaffReport and Recommendation That the Commission Terminate Proceedings for the Pro-mulgation of a Trade Regulation Rule on Children’s Advertising. TRR No. 215-60.Washington, DC: U.S. Federal Trade Commission.
ERS (Economic Research Service). 2002. Farm Policy. Title IV Nutrition Programs. [Online].Available: http://www.ers.usda.gov/Features/farmbill/titles/titleIVnutritionprograms.htm[accessed August 22, 2005].
Evans WD, Finkelstein EA, Kamerow DB, Renaud JM. 2005a. Public perceptions of child-hood obesity. Am J Prev Med 28(1):26–32.
Evans WD, Price S, Blahut S. 2005b. Evaluating the truth® brand. J Health Commun 10(2):181–192.
Farrelly MC, Davis KC, Haviland ML, Messeri P, Healton CG. 2005. Evidence of a dose-response relationship between “truth” antismoking ads and youth smoking prevalence.Am J Public Health 95(3):425–431.
FCC v. Pacifica Foundation, 438 U.S. 726, 731 n.2 (1978).FDA (U.S. Food and Drug Administration). 1993. Food labeling: Mandatory status of nutri-
tion labeling and nutrient content revisions: Format of nutrition label. Final rule. FederalRegister 58(3):2079–2205.
FDA. 2005a. Advanced notice of proposed rulemaking: Food labeling: Prominence of calo-ries. Federal Register 70(63):17008–17010.
FDA. 2005b. Advanced notice of proposed rulemaking: Food labeling: Serving sizes of prod-ucts that can reasonably be consumed at one eating occasion: updating of referenceamounts customarily consumed: Approaches for recommending smaller portion sizes.Federal Register 70(63).
FDA. 2005c. FDA’s Plan to Tackle Obesity. [Online]. Available: http://www.fda.gov/loseweight/obesity_plan.htm [accessed November 9, 2005].
First National Bank of Boston v. Bellotti, 435 U.S. 765, 783 (1978).FMI (Food Marketing Institute). 1993. Shopping for Health: A Report on Diet, Nutrition,
and Ethnic Foods. Washington, DC: FMI.FMI. 2001. Shopping for Health: Reaching Out to the Whole Health Consumer. Washington,
DC: FMI.Foerster SB, Kizer KW, Disogra LK, Bal DG, Krieg BF, Bunch KL. 1995. California’s “5 a
Day for Better Health!” campaign: An innovative population-based effort to effect large-scale dietary change. Am J Prev Med 11(2):124–131.
Ford Motor Company v. Texas Department of Transportation, 264 F.3d 493 (5th Cir. 2001).Fred Wehrenberg Circuit of Theatres, Inc. v. Moviefone, Inc., 73 F. Supp. 2d 1044 (E.D. Mo.
1999).Friedman v. Rogers, 440 U.S. 1,12 (1979).FSA (Food Standards Agency). 2005. Food Promotions and Children’s Diets—Consultation
on Nutrient Profiling. [Online]. Available: http://www.food.gov.uk/foodindustry/Con-sultations/completed_consultations/completeduk/notprofjuly05 [accessed July 30, 2005].
FTC v. D Squared Solutions, LLC, No. 03-CV-3108 (D. Md. 2003).FTC v. R. F. Keppel & Brothers, Inc., 291 U.S. 304, 309, 313 (1934).GAO (U.S. Government Accountability Office). 2003. School Lunch Program: Efforts Needed
to Improve Nutrition and Encourage Healthy Eating. Report No. GAO-03-506. Wash-ington, DC: U.S. Government Accountability Office.
GAO. 2004. School Meal Programs: Competitive Foods Are Available in Many Schools;Actions Taken to Restrict Them Differ by State and Locality. Washington, DC: GAO.
GAO. 2005. School Meal Programs: Competitive Foods are Widely Available and GenerateSubstantial Revenues for Schools. Report No. GAO-05-563. Washington, DC: GAO.
Ginsberg v. New York, 390 U.S. 629, 640, 649–50 (1968).

PUBLIC POLICY ISSUES IN FOOD AND BEVERAGE MARKETING 367
Gledhill L. 2005, September 16. Governor signs bill to trim obesity in schools. Toughest dietrules in nation for students. The San Francisco Chronicle. P. A1.
Goldberg ME. 1990. A quasi-experiment assessing the effectiveness of TV advertising di-rected to children. J Marketing Res 27(4):445–454.
Greater New Orleans Broadcasting Association v. United States, 527 U.S. 173, 188 (1999).Grier S, Bryant CA. 2005. Social marketing in public health. Annu Rev Public Health 26:
319–339.Hartwig M. 2004. Harkin Enlists Institute of Medicine to Study Foods in Schools. U.S.
Senator Tom Harkin of Iowa, November 24. [Online]. Available: http://harkin.senate.gov/press/print-release.cfm?id=228717 [accessed June 25, 2005].
Hastings G, Stead M, McDermott L, Forsyth A, MacKintosh AM, Rayner M, Godfrey C,Caraher M, Angus K. 2003. Review of Research on the Effects of Food Promotion toChildren. Glasgow, UK: Centre for Social Marketing.
Hawkes C. 2004. Marketing Food to Children: The Global Regulatory Environment. Geneva:World Health Organization.
Hawkes C. 2005. Self-regulation of food advertising: What it can, could and cannot do todiscourage unhealthy eating habits among children. Nutrition Bulletin 30:374–382.
Hazelwood School District v. Kuhlmeier, 484 U.S. 260, 270 (1988).Hobbs R, Frost R. 2003. Measuring the acquisition of media-literacy skills. Reading Res Q
38(3):330–356.Hoffman Estates v. Flipside, Hoffman Estates, Inc., 455 U.S. 489, 491-92 (1982).Hornik R, Maklan D, Cadell D, Barmada CH, Jacobsohn L, Henderson VR, Romantan A,
Niederdeppe J, Orwin R, Sridharan S, Chu A, Morin C, Taylor K, Steele D. 2003.Evaluation of the National Youth Anti-Drug Media Campaign: 2003 Report of Find-ings. Washington, DC: Westat.
Huhman M, Heitzer C, Wong F. 2004. The VERB™ campaign logic model: A tool forplanning and evaluation. Preventing Chronic Disease 1(3):1–6.
Huhman M, Potter LD, Wong FL, Banspach SW, Duke JC, Heitzler CD. 2005. Effects of amass media campaign to increase physical activity among children: Year-1 results of theVERB™ campaign. Pediatrics 116(2):e277–e284.
Hustler Magazine v. Falwell, 485 U.S. 46, 55 (1988).ICC (International Chamber of Commerce). 1997. ICC International Code of Advertising
Practice. Commission on Marketing, Advertising, and Distribution. [Online]. Available:http://www.iccwbo.org/home/statements_rules/rules/1997/advercod.asp [accessed May 9,2005].
ICC. 2002. ICC International Code of Sales Promotion. Commission on Marketing andAdvertising. [Online]. Available: http://www.iccwbo.org/home/statements_rules/state-ments/2002/code_of_sales_promotion.asp [accessed May 9, 2005].
ICC. 2003. ICC International Code on Sponsorship. Commission on Marketing and Ad-vertising. [Online]. Available: http://www.iccwbo.org/home/statements_rules/rules/2003/International%20Code%20on%20Sponsorship.asp [accessed May 9, 2005].
Interactive Digital Software Association v. St. Louis County, 329 F.3d 954, 956–958 (8thCir. 2003).
International Harvester Company, 104 F.T.C. 949, 1070 (1984).IOM (Institute of Medicine). 1991. Improving America’s Diet and Health. Washington, DC:
National Academy Press.IOM. 2003. Dietary Reference Intakes: Guiding Principles for Nutrition Labeling and Fortifi-
cation. Washington, DC: The National Academies Press.IOM. 2005a. Preventing Childhood Obesity: Health in the Balance. Washington, DC: The
National Academies Press.IOM. 2005b. Nutrition Standards for Foods in Schools. [Online]. Available: http://www.
iom.edu/project.asp?id=30181 [accessed October 20, 2005].

368 FOOD MARKETING TO CHILDREN AND YOUTH
IOM. 2005c. The WIC Food Package: Time for a Change. Washington, DC: The NationalAcademies Press.
Jacobson MF, Brownell KD. 2000. Small taxes on soft drinks and snack foods to promotehealth. Am J Public Health 90(6):854–857.
Jones v. N.C. Prisoners’ Labor Union, Inc., 433 U.S. 119, 125 (1977).Keihner A. 2005, May 3. Trends from the California Children’s Healthy Eating and Exercise
Practices Survey (1999–2003): Can Statewide Social Marketing Campaigns Impact Fruitand Vegetable Intake and Physical Activity Among 9- to 11-Year-Old Children? Pre-sented at the 2005 Lecture Series of the University of California Davis Center for Ad-vanced Studies in Nutrition and Social Marketing, Davis, CA.
Keller KL. 1998. Branding perspectives on social marketing. Advances in Consumer Research25:299–302.
KFF (Kaiser Family Foundation). 2003. Key Facts: Media Literacy. Menlo Park, CA: TheHenry J. Kaiser Family Foundation. [Online]. Available: http://www.kff.org/entmedia/Media-Literacy.cfm [accessed April 12, 2005].
Killen JD, Telch MJ, Robinson TN, Maccoby N, Taylor CB, Farquhar JW. 1988. Cardiovas-cular disease risk reduction for tenth graders: A multiple-factor school-based approach.J Am Med Assoc 260(12):1728–1733.
Kraak V, Pelletier D. 1998. How marketers reach young consumers: Implications for nutri-tion education and health promotion campaigns. Fam Econ Nutr Review 11(4):31–41.
Kraft, Inc. v. FTC, 970 F.2d 311, 314 (7th Cir. 1992).Kuchler F, Tegene A, Harris JM. 2004. Taxing snack foods: What to expect for diet and tax
revenues. Agriculture Info Bull No. 747-08. Economic Research Service, U.S. Depart-ment of Agriculture. [Online]. Available: http://www.ers.usda.gov/publications/aib747/aib74708.pdf [accessed July 12, 2005].
Kuchler F, Golan E, Variyam JN, Crutchfield SR. 2005. Obesity policy and the law of unin-tended consequences. Amber Waves 3(3):26–33.
Lebel E, Hamelin AM, Lavallée M, Bedard A, Dubé A. 2005. Publicité télévisée sur lesaliments visant les enfants: Valeurs nutritionnelles et culturelles. Communication 24(1):65–84.
Lefebvre C. 1992. Social marketing and health promotion. In: Bunton R, MacDonald G, eds.Healthy Promotion: Disciplines and Diversity. London, UK: Routledge.
Lefebvre RC, Lurie D, Saunders Goodman L, Weinberg L, Loughrey K. 1995. Social market-ing and nutrition education: Inappropriate or misunderstood? J Nutr Ed 27(3):146–150.
Lorillard Tobacco Company v. Reilly, 533 US 525, 121 (S. Ct. 2404, 2001).MacCarthy C. 2004, June 8. Lean pickings for the anti-ad brigade Sweden is using these
European elections to try to extend its kids advertising ban across the EU. But just howeffective is it? The Financial Times. P.10.
Mainstream Marketing Services, Inc. v. FTC, 358 F.3d 1228 (10th Cir. 2004).Mattern J, Neighbors C. 2004. Social norms campaigns: Examining the relationship between
changes in perceived norms and changes in drinking levels. J Stud Alcohol 65(4):489–493.
Matthews A, Cowburn G, Rayner M, Longfield J, Powell C. 2005. The Marketing of Un-healthy Food to Children in Europe. A Report of Phase 1 of the Children, Obesity andAssociated Avoidable Chronic Diseases Project. Brussels: European Heart Network.
McConnell v. FEC, 540 U.S. 93, 237 (2003).Morris J, Zidenberg-Cherr S. 2002. Garden-enhanced nutrition curriculum improves fourth-
grade school children’s knowledge of nutrition and preferences for some vegetables.J Am Diet Assoc 102(1):91–93.
National Bakers Services, Inc. v. FTC, 329 F.2d 365 (7th Cir. 1964).

PUBLIC POLICY ISSUES IN FOOD AND BEVERAGE MARKETING 369
National Food Administration and National Institute of Public Health. 2005. BackgroundMaterial to the Action Plan for Healthy Dietary Habits and Increased Physical Activity.Stockholm, Sweden: National Food Administration.
NCES (National Center for Education Statistics). 1996. Nutrition Education in Public El-ementary and Secondary Schools. Report No. NCES 96-852. Washington, DC: U.S.Department of Education, Office of Educational Research and Improvement.
NCSL (National Conference of State Legislatures). 2005, March 1. Vending Machines inSchools. [Online]. Available: http://www.ncsl.org/programs/health/vending.htm [ac-cessed June 6, 2005].
Nestlé Food Company, 115 F.T.C. 67 (1992).Ngo J. 1993. Social marketing and fat intake. Eur J Clin Nutr 47(suppl):S91–S95.NIDA (National Institute on Drug Abuse). 2002. Evaluation of the National Youth Anti-
Drug Media Campaign. Westat & the Annenberg School for Communication. [Online].Available: http://www.nida.nih.gov/DESPR/Westat/exec_summ2.html [accessed June28, 2005].
Niederdeppe J, Farrelly MC, Haviland ML. 2004. Confirming “truth”: More evidence of asuccessful tobacco countermarketing campaign in Florida. Am J Public Health 94(2):255–257.
NIH (National Institutes of Health). 2005a. Milk Matters. [Online]. Available: http://www.nichd.nih.gov/milk/ [accessed October 12, 2005].
NIH. 2005b. We Can! [Online]. Available: http://www.nhlbi.nih.gov/health/public/heart/obe-sity/wecan/ [accessed October 10, 2005].
Nordic Consumer Ombudsmen. 2002. Position Statement of the Nordic Consumer Ombuds-men on E-commerce and Marketing on the Internet. [Online]. Available: http://www.konsumentverket.se/Documents/in_english/nordic_statement_ecommerce_2002.pdf [ac-cessed May 10, 2005].
Norwegian Ministry of Children and Family Affairs. 2005. The Norwegian Action Plan toReduce Commercial Pressure on Children and the Young People. [Online]. Available:http://odin.dep.no/bfd/english/doc/handbooks/004061-990036/dok-bn.html [accessedMay 30, 2005].
NRC (National Research Council) and IOM. 2003. Reducing Underage Drinking: A Collec-tive Responsibility. Washington, DC: The National Academies Press.
NSW Centre for Public Health Nutrition. 2005. Best Options for Promoting Healthy Weightand Preventing Weight Gain in NSW. [Online]. Available: http://www.cphn.biochem.usyd.edu.au/resources/FinalHealthyWeightreport160305.pdf [accessed June 23, 2005].
Ofcom (Office of Communications). 2004. Childhood Obesity—Food Advertising in Con-text. Children’s Food Choices, Parents’ Understanding and Influence, and the Role ofFood Promotion. London, UK: Ofcom.
Ofcom. 2005. Rules on the Amount and Distribution of Advertising. Ofcom. [Online]. Avail-able: http://www.ofcom.org.uk/tv/ifi/codes/advertising/rules/rules.pdf [accessed May 10,2005].
ONDCP (Office of National Drug Control Policy). 2003. About the Campaign. CampaignDesign. [Online]. Available: http://www.mediacampaign.org/about/brochure/design.html[accessed November 14, 2005].
ONDCP. 2005. National Youth Anti-Drug Media Campaign. [Online]. Available: http://www.mediacampaign.org/ and http://www.freevibe.com/#/ [accessed June 28, 2005].
PBH (Produce for Better Health Foundation). 2005a. 5 a Day Mission & History. [Online].Available: http://www.5aday.com/html/background/mission.php [accessed November11, 2005].
PBH. 2005b. National Action Plan to Promote Health Through Increased Fruit and Veg-etable Consumption. Wilmington, DE: PBH.

370 FOOD MARKETING TO CHILDREN AND YOUTH
PDFA (Partnership for a Drug-Free America). 2005. [Online]. Available: http://www.drugfree.org/Portal/About/AnnualReport/Download_the_2001-2002_Annual_Report/[accessed November 14, 2005].
Peel v. Attorney Registration and Disciplinary Commission, 496 U.S. 91, 110 (1990).Pelletier DL, Kendall A, Kettel Khan L, Mathios A. 1999. Nutrition and dairy industry
benefits associated with promoting lowfat milk: Evidence from the 1989 CSFII. FamEcon Nutr Rev 12(1):3–13.
Pelman v. McDonald’s Corporation, 237 F. Supp. 2d 512, 532–533 (S.D.N.Y. 2003).People v. Block & Kleaver, Inc., 427 N.Y.S.2d 133 (N.Y. Co. Ct. 1980).Perry CL, Silvis GL. 1987. Smoking prevention: Behavioral prescriptions for the pediatrician.
Pediatrics 79(5):790–799.Phone Programs, Inc. 115 F.T.C. 977 (1992).Posadas de Puerto Rico Associates v. Tourism Company, 478 U.S. 328 (1986).Potter LD, Duke JC, Nolin MJ, Judkins D, Huhman M. 2004. Evaluation of the CDC VERB
Campaign: Findings from the Youth Media Campaign Longitudinal Survey, 2002–2003.Rockville, MD: WESTAT.
Quebec Consumer Protection Act. 2005. Consumer Protection Act. RSQ, Chapter P-40. P-40.1 A. [Online]. Available: http://www2.publicationsduquebec.gouv.qc.ca/home.php#[accessed May 10, 2005].
Quebec Government. 1980. Consumer Protection Act. RSQ, Chapter P-40. P-40 A. [Online].Available: http://www2.publicationsduquebec.gouv.qc.ca/home.php# [accessed June 6,2005].
Ralston K. 1999. How government policies and regulations can affect dietary choices. In:Frazao E, ed. America’s Eating Habits: Changes and Consequences. Agriculture Infor-mation Bulletin No. 750. Washington, DC: U.S. Department of Agriculture.
Ratner EM, Hellegers JF, Stern GP, Ogg RC, Adair S, Zacharias L. 1978. FTC Staff Reporton Television Advertising to Children. Washington, DC: Federal Trade Commission.
Red Lion Broadcasting Company v. FCC, 395 U.S. 367, 386 (1969).Reno v. American Civil Liberties Union, 521 U.S. 844, 875 (1997).Rideout V. 2004. Parents, Media and Public Policy: A Kaiser Family Foundation Survey.
Menlo Park, CA: Henry J. Kaiser Family Foundation.Rubin v. Coors Brewing Company, 514 U.S. 476 (1995).RWJF (The Robert Wood Johnson Foundation). 2003. Active Living: Healthy Schools for
Healthy Kids. Princeton, NJ: RWJF.Sable Communications, Inc. v. FCC, 492 U.S. 115, 126 (1989).Samuels SE. 1993. Project LEAN—Lessons learned from a national social marketing cam-
paign. Public Health Reports 108(1):45–53.Smed S, Jensen JD, Denver S. 2005. Differentiated Food Taxes as a Tool in Health and
Nutrition Policy. Frederiksberg, Denmark: Food and Resource Economics Institute.Social Marketing Institute. 2005. Success Stories. National WIC Breastfeeding Promotion
Project. [Online]. Available: http://www.social-marketing.org/success/cs-nationalwic.html [accessed June 23, 2005].
Southwestern Bell Telephone, L.P. v. Moline, 333 F. Supp. 2d 1073 (D. Kan. 2004).Stables GJ, Subar AF, Patterson BH, Dodd K, Heimendinger J, Van Duyn MA, Nebeling L.
2002. Changes in vegetable and fruit consumption and awareness among US adults:Results of the 1991 and 1997 5 a Day for Better Health Program surveys. J Am DietAssoc 102(6):809–817.
Swinburn B, Egger G. 2002. Preventive strategies against weight gain and obesity. ObesityRev 3(4):289–301.
Swix v. Daisy Manufacturing Company, 373 F.3d 678, 685-87 (6th Cir. 2004).

PUBLIC POLICY ISSUES IN FOOD AND BEVERAGE MARKETING 371
TFAH (Trust for America’s Health). 2005. F as in Fat: How Obesity Policies Are FailingAmerica. [Online]. Available: http://healthyamericans.org/reports/obesity2005/Obesity2005Report.pdf [accessed October 15, 2005].
The Isaly Klondike Company, 116 F.T.C. 74 (1993).The Wall Street Journal Online and Harris Interactive. 2005. Most of the American Public,
Including a Majority of Parents, Believe That Childhood Obesity in the U.S. Is a Ma-jor Problem. [Online]. Available: http://www.harrisinteractive.com/news/newsletters/wsjhealthnews/WSJOnline_HI_Health-CarePoll2005vol4_iss03.pdf [accessed June 15,2005].
Thompson v. Western States Medical Center, 535 U.S. 357, 367-68 (2002).Thornburgh v. Abbott, 490 U.S. 401 (1988).Tillotson JE. 2004. America’s obesity: Conflicting public policies, industrial economic devel-
opment, and unintended human consequences. Annu Rev Nutr 24:617–643.Tinker v. Des Moines Independent School District, 393 U.S. 503 (1969).Trans Union, LLC v. FTC, 295 F.3d 42 (D.C. Cir. 2002).Transportation Alternatives, Inc. v. City of New York, 218 F. Supp. 2d 423 (S.D.N.Y. 2002).Turner v. Safley, 482 U.S. 78 (1987).TWFD (Television Without Frontiers Directive). 2005. The European Commission Regula-
tory Framework. [Online]. Available: http://europa.eu.int/comm/avpolicy/regul/regul_en.htm#2 [accessed October 24, 2005].
United States v. Edge Broadcasting Company, 509 U.S. 418, 434 (1993).United States v. Jorgensen, 144 F.3d 550 (8th Cir. 1998).USDA (U.S. Department of Agriculture). 2000. Changing the Scene—Improving the School
Nutrition Environment. Team Nutrition. [Online]. Available: http://www.fns.usda.gov/tn/Resources/changing.html [accessed June 16, 2005].
USDA. 2002a. Amendments to the child nutrition infant meal patterns. Final rule. FederalRegister 67(102):36779–36788.
USDA. 2002b. School Lunch Salad Bars. Nutrition Assistance Program Report Series. Foodand Nutrition Service. CN-02-SB. Alexandria, VA: USDA.
USDA. 2002c. School Meals: Foods of Minimal Nutritional Value. Appendix B of 7 CFR Part210. [Online]. Available: http://www.fns.usda.gov/cnd/menu/fmnv.htm [accessed June15, 2005].
USDA. 2004a. HealthierUS School Challenge. [Online]. Available: http://www.fns.usda.gov/tn/HealthierUS/index.html [accessed October 6, 2005].
USDA. 2004b. Team Nutrition Demonstration Project 1999–2002. Executive Summary.[Online]. Available: http://www.fns.usda.gov/oane/MENU/Published/NutritionEducation/Files/TNDP99-03.htm [accessed October 6, 2005].
USDA. 2004c. Excerpt from P.L. 108-265 Child Nutrition and WIC Reauthorization Act of2004. [Online]. Available: http://schoolmeals.nal.usda.gov/Training/CO_Middle_School_Marketing/1-2004_Middle_School_Marketing_Memos_and_Notices/WellnessPolicyRequirement.pdf [accessed June 15, 2005].
USDA. 2004d. Local Wellness Policy. Team Nutrition. [Online]. Available: http://www.fns.usda.gov/tn/Healthy/wellnesspolicy.html [accessed June 15, 2005].
USDA. 2005a. Eat Smart, Play Hard™ Campaign. Campaign Overview. [Online]. Avail-able: http://www.fns.usda.gov/eatsmartplayhard/About/overview.html [accessed Octo-ber 4, 2005].
USDA. 2005b. Food and Nutrition Service, Nutrition Program Facts, National SchoolLunch Program. [Online]. Available: http://www.fns.usda.gov/cnd/lunch/AboutLunch/NSLPFactSheet.pdf [accessed March 24, 2005].
USDA. 2005c. Food and Nutrition Service, Nutrition Program Facts, The School BreakfastProgram. [Online]. Available: http://www.fns.usda.gov/cnd/Breakfast/AboutBFast/FactSheet.pdf [accessed November 9, 2005].

372 FOOD MARKETING TO CHILDREN AND YOUTH
USDA. 2005d. Food Stamp Program. [Online]. Available: http://www.fns.usda.gov/fsp [ac-cessed November 9, 2005].
USDA. 2005e. MyPyramid: For Kids. [Online]. Available: http://www.mypyramid.gov/kids/index.html [accessed July 6, 2005].
USDA. 2005f. MyPyramid: Steps to a Healthier You. [Online]. Available: http://www.mypyramid.gov [accessed April 25, 2005].
USDA. 2005g. School Meals: Child Nutrition Labeling. Washington, DC: USDA Food andNutrition Service. [Online]. Available: http://www.fns.usda.gov/cnd/CNlabeling/default.htm [accessed July 13, 2005].
USDA. 2005h. Submission for OMB review: Comment request. Food and Nutrition Service.Child nutrition labeling program. Federal Register 70(82):22293.
USDA. 2005i. The Food Assistance Landscape, March 2005. Food Assistance and NutritionResearch Report No. 28-6. Washington, DC: USDA.
Valentine v. Chrestensen, 316 U.S. 52, 54 (1942).Vallianatos M. 2005. Healthy School Food Policies: A Checklist. A working paper of the
Center for Food and Justice, Urban and Environmental Policy Institute. Urban andEnvironmental Policy Institute. [Online]. Available: http://departments.oxy.edu/uepi/cfj/resources/healthy_school_food_policies_05.pdf [accessed June 14, 2005].
Viacom International. 2005. Welcome to Postopia! [Online]. Available: http://www.postopia.com [accessed July 9, 2005].
Video Software Dealers Association v. Maleng, 325 F. Supp. 2d 1180, 1184-85 (W.D. Wash.2004).
Virginia State Board of Pharmacy v. Virginia Citizens Consumer Council, Inc., 425 U.S. 748(1976).
Wallack L, Dorfman L, Jernigan D, Themba M. 1993. Media Advocacy and Public Health:Power for Prevention. Newbury Park, CA: Sage Publications.
Wansink B, Huckabee H. 2005. De-marketing obesity. California Management Review 47(4):6–18.
Warner KE. 2005. Tobacco policy in the United States: Lessons learned for the obesity epi-demic. In: Mechanic D, Rogut LB, Colby DC, Knickman JR, eds. Policy Challenges inModern Health Care. New Brunswick, NJ: Rutgers University Press. Pp. 99–114.
WHO. 2004. Global Strategy on Diet, Physical Activity, and Health. WHA 57.17. Geneva:WHO. [Online]. Available: http://www.who.int/gb/ebwha/pdf_files/WHA57/A57_R17-en.pdf [accessed May 10, 2005].
Williams v. Spencer, 622 F.2d 1200, 1205 (4th Cir. 1980).Williams JD, Kumanyika SK. 2002. Is social marketing an effective tool to reduce health
disparities? Social Market Q 8(4):14–31.Wilson v. Midway Games, 198 F. Supp. 2d 167, 181 (D. Conn. 2002).Wong F, Huhman M, Heitzler C, Asbury L, Bretthauer-Mueller R, McCarthy S, Londe P.
2004. VERB™—A social marketing campaign to increase physical activity among youth.Preventing Chronic Disease 1(3):1–7.
Wootan MG, Reger-Nash B, Booth-Butterfield S, Cooper L. 2005. The cost-effectiveness of1% or Less media campaigns promoting low-fat milk consumption. Preventing ChronicDisease 2(4):1–10.
Yach D, Hawkes C, Epping-Jordan J, Galbraith S. 2003. The World Health Organization’sFramework Convention on Tobacco Control: Implications for global epidemics of food-related deaths and disease. J Public Health Policy 24(3–4):274–290.
Yach D, McKee M, Lopez AD, Novotny T. 2005. Improving diet and physical activity: 12lessons from controlling tobacco smoking. Br Med J 330(7496):898–900.
Zywicki TJ, Holt D, Ohlhausen M. 2004. Obesity and Advertising Policy. Law and Econom-ics Working Paper Series. George Mason Law and Economics Research Paper No. 04-45.

373
7
Findings, Recommendations, Next Steps
Food and beverage marketing to children and youth has become ubiquitouson the American landscape. Although recent public announcements by somecompanies suggest an interest in change, the preponderance of the foodsand beverages introduced and marketed to children and youth have beenhigh in total calories, added sugars, salt, fat, and low in nutrients.
Multiple influences interact to shape the food preferences and choices,eating behaviors, total calorie intake, diet quality, and health outcomes ofchildren and youth. There is evidence that commercial advertising andmarketing of foods and beverages to children and youth through a growingvariety of channels and media outlets—including the mass media, schools,child-care settings, grocery stores, shopping malls, theaters, sporting events,and even airports—are notable contributors to the environments in whichthe nutritional patterns of children and youth evolve.
This report has summarized the status and trends in the health, diet,and eating patterns of children and youth; reviewed the various factors thatinfluence the food and beverage consumption habits of children and youth;described how food and beverages are developed and marketed to childrenand youth; systematically reviewed the evidence on the influence of foodand beverage marketing on the diets and diet-related health of children andyouth; and described the policy instruments that may be combined to en-hance availability and access to healthful foods and to support healthfulfood and beverage choices and marketing practices affecting children andyouth. This chapter summarizes the findings included throughout the re-port and offers recommendations on ways in which various sectors couldhelp improve the diets and health of children and youth.

374 FOOD MARKETING TO CHILDREN AND YOUTH
Overall, the committee identified five broad conclusions (Box 7-1), de-rived from the individual findings. These serve as the basis for the commit-tee’s recommendations.
HEALTH, DIET, AND EATING PATTERNS OFCHILDREN AND YOUTH
Health-related behaviors such as eating habits and physical activitypatterns develop early in life and often extend into adulthood. A healthfuland balanced diet provides recommended amounts of nutrients and otherfood components to promote normal growth and development, reducechronic disease risk, and foster appropriate energy balance and a healthyweight. In order to develop eating habits that will have health-promotingbenefits that carry them into adulthood, children and adolescents need toconsume more fruits, vegetables, whole grains, and dairy products, andmoderate their intakes of high-calorie and low-nutrient foods and bever-ages. The committee’s review in Chapter 2 of the health, diet, and eatingpatterns of children and youth identified several issues and trends.
• More certain determinations of nutritional requirements for chil-dren and adolescents await the development of better techniques anddata sets.
BOX 7-1Broad Conclusions
• Along with many other intersecting factors, food and beverage marketing influ-ences the diets and health prospects of children and youth.
• Food and beverage marketing practices geared to children and youth are out ofbalance with healthful diets, and contribute to an environment that puts theirhealth at risk.
• Food and beverage companies, restaurants, and marketers have underutilizedpotential to devote creativity and resources to develop and promote food, bever-ages, and meals that support healthful diets for children and youth.
• Achieving healthful diets for children and youth will require sustained, multisec-toral, and integrated efforts that include industry leadership and initiative.
• Public policy programs and incentives do not currently have the support or au-thority to address many of the current and emerging marketing practices thatinfluence the diets of children and youth.

FINDINGS, RECOMMENDATIONS, NEXT STEPS 375
• More accurate methods are needed to assess the dietary intakes ofchildren and youth, including calorie intakes and expenditures.
• Total calorie intake appears to have increased substantially overthe past 25 years for preschool children and adolescent boys and girls, withmore modest changes for children ages 6–11 years.
• Children and youth consume a large proportion of their total calo-ries from foods and beverages that are of high-calorie and low-nutrientcontent.
• Carbohydrate intake has increased substantially among childrenand youth over approximately the past two decades.
• Total fat and saturated fat intakes among children and youth re-main at levels that exceed dietary recommendations.
• Most preschool children consume added sugars well above sug-gested limits, and older children and adolescents consume about double thesuggested limit of added sugars in their diet.
• Mean sodium intake of children and youth has increased over thepast 35 years, and the majority of children and adolescents are consumingsodium in greater amounts than recommended levels.
• Over the past decade, most children and youth have not met thedaily recommended servings for vegetables, fruits, or whole grains.
• Sweetened beverage consumption (e.g., carbonated soft drinks andfruit drinks) by children and adolescents has increased considerably overthe past 35 years and is now a leading source of added sugars, especially inadolescents’ diets. The consumption of milk, a major source of dietarycalcium, has decreased among children and adolescents over the same pe-riod, and most have calcium intakes below the recommended adequateintake level.
• Breakfast consumption by children and adolescents has de-creased considerably over the past 40 years and the occurrence of break-fast consumption declines with age. The frequency of breakfast con-sumption is predictive of lower body mass index (BMI) levels in childrenand adolescents.
• The prevalence of snacking and number of snacking occasions bychildren and youth have increased steadily over the past 25 years. There hasbeen a steady increase in the proportion of calories that children and youthhave received from away-from-home foods over the past 20 years. Ap-proximately one-third or more of their calories are derived from foodspurchased outside of the home, nearly one-half of which is obtained atrestaurants and quick serve restaurants that contain higher fat content thanfood consumed at home.
• Calorie intake by infants and toddlers substantially exceeds theirestimated requirements, although validation is needed on the reliability offood intake reporting by parents and caregivers, as well as on body weightestimates.

376 FOOD MARKETING TO CHILDREN AND YOUTH
• Infants and toddlers are consuming diets disproportionately high insweetened foods and beverages and fried potatoes, and disproportionatelylow in green leafy vegetables.
• Certain subgroups, such as low-income and minority children andadolescent girls, have inadequate dietary intakes of specific micronutrients(e.g., vitamins D and B6, folate, iron, zinc, and magnesium).
FACTORS SHAPING FOOD AND BEVERAGE CONSUMPTIONOF CHILDREN AND YOUTH
Children’s dietary patterns and related health prospects are shaped bythe interplay of many factors—genetics and biology, culture and values,economic status, physical and social environments, and commercial andmedia environments—all of which, apart from genetic predispositions, haveundergone significant transformations over the past three decades. Interac-tions within and among these contexts affect behavior. The committee tookan ecological perspective in assessing the processes and context of the influ-ences shaping children’s eating behaviors, identifying in Chapter 3 severalbroad issues relevant to child and adolescent eating behaviors and food andbeverage choices.
• Food preferences develop as early as 2–3 years of age and areshaped by a child’s early experiences, positive or negative conditioning,exposure to foods, and a biological predisposition to prefer sweet, high-fat,and salty foods.
• The availability and marketing of foods and beverages of largerportion sizes has increased steadily over the past three decades in manyvenues.
• Children are aware of food brands as young as 2–3 years of ageand preschoolers demonstrate brand recognition when cued by spokes-characters and colored packages. The majority of children’s food requestsare for branded products. Brand loyalty is highest in teens for carbonatedsoft drinks and quick serve restaurants.
FOOD AND BEVERAGE MARKETING TOCHILDREN AND YOUTH
In multiple forms, media influences have assumed a central socializingrole for children and youth. As media pervasiveness has grown in influence,so has its use for the marketing of branded food and beverage products.The substantial investment in commercial advertising and marketing offoods and beverages directed to children and youth over the past severaldecades has spawned a sizable and sophisticated marketing research enter-

FINDINGS, RECOMMENDATIONS, NEXT STEPS 377
prise to help companies translate desires and preferences into branded prod-ucts and purchases for and by children and youth, making them a primaryfocus of food and beverage marketing initiatives. Last year an estimatedmore than $10 billion per year was spent for all types of food and beveragemarketing to children and youth in America. The committee’s review offood and beverage marketing to children and youth in Chapter 4 identifiedseveral key findings.
• Marketing research can provide important insights about howmarketing techniques might help improve the diets of children and youth.Yet, much of the relevant marketing research on the profile and impact offood and beverage marketing to children and youth is currently unavailableto the public, including for use in designing and targeting efforts to improvethe diets of children and youth.
• Children and youth ages 4–17 years have increasing discretionaryincome and purchasing capacity, are being targeted more directly by mar-keters, and frequently spend their discretionary income on high-calorie andlow-nutrient foods and beverages.
• Child-targeted food and beverage products have steadily increasedover the past decade, and are typically high in total calories, sugars, salt,fat, and low in nutrients.
• Television is the primary promotional medium for measuredmedia marketing of food and beverage products to children and youth, buta notable shift is occurring toward unmeasured sales promotion (e.g.,product placement, character licensing, in-school marketing, special eventmarketing).
• The use of child-oriented licensed cartoon and other fictional orreal-life spokescharacters has been a prevalent practice used to promotelow-nutrient and high-calorie food and beverage products. Use of suchcharacters to promote more healthful foods, particularly for preschoolers,is relatively recent.
• Children are exposed to extensive advertising for high-calorie andlow-nutrient foods and beverages and very limited advertising of healthfulfoods and beverages during their daily television viewing.
• The competitive multifaceted marketing of high-calorie and low-nutrient food and beverage products in school settings is widely prevalentand appears to have increased steadily over the past decade.
• Food and beverage marketing is increasingly delivered through in-tegrated vehicles other than the traditional television advertising (e.g.,Internet, event sponsorships, outdoor media, kid’s clubs, video games,advergames, product placement, music, and schools) that are especiallyappealing to children and youth.
378 FOOD MARKETING TO CHILDREN AND YOUTH
• Efforts by the Children’s Advertising Review Unit (CARU)—thechildren’s arm of the advertising industry’s self-regulation program forchild-directed advertising and promotion in media—have influenced cer-tain elements of traditional advertising within its designated purview, butthese standards do not address the impact of the volume of advertising, theappeal of its association with other elements of the popular culture forchildren and youth, or the influences of rapidly increasing marketing ap-proaches. Furthermore, there is a need for a more formal evaluation of theeffectiveness of CARU’s impact and enforcement capacity.
• The consistency, accuracy, and effectiveness of the proprietary logosor icons introduced by several food companies as positive steps to commu-nicate the nutritional qualities of some of their branded products to con-sumers have not been evaluated. Without an empirically validated industry-wide rating system and approach, efforts to use such graphic portrayals onfood labels may fall short of their potential as guides to better food andbeverage choices by children, youth, and their parents.
• Certain food and beverage companies and quick serve restaurantswith products prominently consumed by children are actively exploringmore balanced and health-promoting product development and market-ing strategies. Prevailing industry practices, guidelines, and efforts remainlimited.
• The food retail sector has taken some steps to promote healthfulproducts to young consumers and their families, but there are abundantopportunities to do more to promote child-oriented foods and beveragesthat are healthful, visually accessible, and economically affordable.
INFLUENCE OF FOOD AND BEVERAGE MARKETINGON THE DIETS AND DIET-RELATED HEALTH
OF CHILDREN AND YOUTH
The prevalence of obesity in children and youth has occurred in parallelwith significant changes in the U.S. media and marketing environments.This relationship has prompted the committee’s primary inquiry about theinfluence of food and beverage marketing on the diets and health of Ameri-can children and youth. The committee’s review of the published, peer-reviewed literature in Chapter 5 indicates that, among many factors, foodand beverage marketing influences the preferences and purchase requests ofchildren, influences consumption at least in the short term, is a likely con-tributor to less healthful diets, and may contribute to negative diet-relatedhealth outcomes and risks among children and youth. The literature indi-cates a relationship among marketing, dietary precursors, diets, diet-relatedhealth, and, in particular, adiposity (body fatness).
Specifically, the committee’s systematic evidence review found that:

FINDINGS, RECOMMENDATIONS, NEXT STEPS 379
With respect to dietary precursors, food and beverage advertising ontelevision has some influence on the preferences and purchase requests ofchildren and youth:
• There is strong evidence that television advertising influencesthe food and beverage preferences of children ages 2–11 years. There isinsufficient evidence about its influence on the preferences of teens ages 12–18 years.
• There is strong evidence that television advertising influencesthe food and beverage purchase requests of children ages 2–11 years. Thereis insufficient evidence about its influence on the purchase requests of teensages 12–18 years.
• There is moderate evidence that television advertising influ-ences the food and beverage beliefs of children ages 2–11 years. There isinsufficient evidence about its influence on the beliefs of teens ages 12–18 years.
• Given the findings from the systematic evidence review of theinfluence of marketing on the precursors of diet, and given the evidencefrom content analyses that the preponderance of television food and bever-age advertising relevant to children and youth promotes high-calorie andlow-nutrient products, it can be concluded that television advertising influ-ences children to prefer and request high-calorie and low-nutrient foodsand beverages.
With respect to diets, food and beverage advertising on television hassome influence on the dietary intake of children and youth:
• There is strong evidence that television advertising influencesthe short-term consumption of children ages 2–11 years. There is insuffi-cient evidence about its influence on the short-term consumption of teensages 12–18 years.
• There is moderate evidence that television advertising influ-ences the usual dietary intake of younger children ages 2–5 years and weakevidence that it influences the usual dietary intake of older children ages 6–11 years. There is also weak evidence that it does not influence the usualdietary intake of teens ages 12–18 years.
With respect to diet-related health, food and beverage advertising ontelevision is associated with the adiposity (body fatness) of children andyouth:
• Statistically, there is strong evidence that exposure to televisionadvertising is associated with adiposity in children ages 2–11 years andteens ages 12–18 years.
• The association between adiposity and exposure to televisionadvertising remains after taking alternative explanations into account, butthe research does not convincingly rule out other possible explanations forthe association; therefore, the current evidence is not sufficient to arrive at

380 FOOD MARKETING TO CHILDREN AND YOUTH
any finding about a causal relationship from television advertising to adi-posity. It is important to note that even a small influence, aggregated overthe entire population of American children and youth, would be conse-quential in impact.
• Most children ages 8 years and under do not effectively compre-hend the persuasive intent of marketing messages, and most children ages4 years and under cannot consistently discriminate between television ad-vertising and programming. The evidence is currently insufficient to deter-mine whether or not this meaningfully alters the ways in which food andbeverage marketing messages influence children.
• New research is needed on food and beverage marketing and itsimpact on diet and diet-related health and on improving measurementstrategies for factors involved centrally in this research. Much of this re-search must be interdisciplinary and fairly large-scale in nature, althoughsome highly-focused small-scale research is also desirable. Among the spe-cific research needed are studies of newer promotion techniques, newervenues, and healthier products and portion sizes.
PUBLIC POLICY ISSUES IN FOOD AND BEVERAGE MARKETINGTO CHILDREN AND YOUTH
Various public policies and actions at the federal, state, and local levelshave been considered, implemented, or are in process to help improve thediets of children and youth. The committee reviewed efforts by governmentat the federal, state, and local levels to improve education and informationto better inform the nutritional choices for children and youth; initiatives toenhance the influence that schools have on the nutritional status of studentsand their families; and the potential of social marketing as a means ofimproving dietary patterns and practices. It also surveyed the legal contextfor policies and regulations related to advertising and marketing. This re-view in Chapter 6 found a number of opportunities for improvement.
• A number of positive steps have been taken by the Food and DrugAdministration to improve food and beverage labeling as a means of con-veying helpful information to enable healthier choices, including explora-tion of ways to expand the provision of such information on menus andpackaging in quick serve and full serve family restaurants. Still, the reachand effectiveness of such efforts—by the U.S. Food and Drug Administra-tion (FDA), industry, and the two together—are far short of what theycould or should be to provide children, youth, and their parents with theinformation they need, using consistent standards and graphics that areeasily understood and engaging.

FINDINGS, RECOMMENDATIONS, NEXT STEPS 381
• National standards do not exist for the use or marketing of com-petitive foods and beverages in school settings or after-school venues suchas in child-care settings. Cooperative initiative by the U.S. Department ofAgriculture and the Department of Education has been limited in shapingpolicies and approaches related to healthier food and beverage promotionin schools.
• Evidence for the effectiveness of social marketing programs to pro-mote healthful behaviors is promising but mixed. Programs with the mostpositive results have had higher funding, been more sustained, been shapedby formative research, deployed an integrated marketing approach, andused ongoing monitoring and evaluation. These characteristics are the likelyrequirements for achievement of successful social marketing programs toimprove the diets of children and youth.
• Regulations for those who advertise and market food and beverageproducts to children will need to evolve as the food industry develops newtechniques for promoting its products. How current law will be applied torapidly changing areas like the Internet cannot currently be predicted withconfidence. However, future regulatory interventions should certainly betaken on the basis of reliable data concerning the impacts on children of themarketing and advertising of food and beverage products. Currently, nei-ther the Federal Trade Commission, nor any other responsible federalagency, collects or maintains such data.
• Comprehensive evaluations are not available to assess the effect onchildren’s diets of countrywide bans on child-directed television advertis-ing. Limited evidence suggests that national borders may not serve as effec-tive barriers to children’s broadcast media and advertising where it is com-mon to receive broadcasts from outside the receiving countries.
RECOMMENDATIONS
Reflective of the responsibilities of multiple sectors, the committee’srecommendations address actions related to food and beverage production,processing, packaging, and sales; marketing practice standards; media ini-tiatives; parents, caregivers, and families; school environments; and publicpolicy. Recommendations are also offered for research activities necessaryto chart the path of future improvements, and the monitoring capacity totrack improvements in marketing practices and their influence on children’sand youths’ diets and health. These recommendations reflect the currentcontext and information in a rapidly changing environment, and should beimplemented together as a package to support and complement one another.

382 FOOD MARKETING TO CHILDREN AND YOUTH
Food and Beverage Production and Promotion
Central to making progress toward more healthful diets for childrenand youth will be carefully designed and sustained commitments by thefood, beverage, and quick serve restaurant industries to promote the avail-ability, accessibility, affordability, and appeal of nutritious foods and bev-erages.
Recommendation 1: Food and beverage companies should use their cre-ativity, resources, and full range of marketing practices to promote andsupport more healthful diets for children and youth.
To implement this recommendation, companies should• Shift their product portfolios in a direction that promotes new and
reformulated child- and youth-oriented foods and beverages that aresubstantially lower in total calories, lower in fats, salt, and added sug-ars, and higher in nutrient content.
• Shift their advertising and marketing emphasis to child- and youth-oriented foods and beverages that are substantially lower in total calo-ries, lower in fats, salt, and added sugars, and higher in nutrient content(see later recommendations on public policy and monitoring).
• Work with government, scientific, public health, and consumer groupsto develop and implement labels and advertising for an empiricallyvalidated industrywide rating system and graphic representation that isappealing to children and youth to convey the nutritional quality offoods and beverages marketed to them and their families.
• Engage the full range of their marketing vehicles and venues to developand promote healthier appealing and affordable foods and beveragesfor children and youth.
Recommendation 2: Full serve restaurant chains, family restaurants, andquick serve restaurants should use their creativity, resources, and fullrange of marketing practices to promote healthful meals for children andyouth.
To implement this recommendation, restaurants should• Expand and actively promote healthier food, beverage, and meal op-
tions for children and youth.• Provide calorie content and other key nutrition information, as pos-
sible, on menus and packaging that is prominently visible at the pointof choice and use.
FINDINGS, RECOMMENDATIONS, NEXT STEPS 383
Recommendation 3: Food, beverage, restaurant, retail, and marketing in-dustry trade associations should assume transforming leadership roles inharnessing industry creativity, resources, and marketing on behalf ofhealthful diets for children and youth.
To implement this recommendation, trade associations should• Encourage member initiatives and compliance to develop, apply, and
enforce industrywide food and beverage marketing practice standardsthat support healthful diets for children and youth.
• Provide technical assistance, encouragement, and support for members’efforts to emphasize the development and marketing of healthier foods,beverages, and meals for children and youth.
• Exercise leadership in working with their members to improve theavailability and selection of healthful foods and beverages accessible ateye level and reach for children, youth, and their parents in grocerystores and other food retail environments.
• Work to foster collaboration and support with public-sector initiativespromoting healthful diets for children and youth.
Marketing Practice Standards
A reliable barometer of the commitment of the members of the food,beverage, and restaurant industries to promote the nutritional health ofchildren and youth will be the rigor of the standards they set and enforcefor their own marketing practices.
Recommendation 4: The food, beverage, restaurant, and marketing in-dustries should work with government, scientific, public health, and con-sumer groups to establish and enforce the highest standards for the mar-keting of foods, beverages, and meals to children and youth.
To implement this recommendation, the cooperative efforts should• Work through the Children’s Advertising Review Unit (CARU) to
revise, expand, apply, enforce, and evaluate explicit industry self-regulatory guidelines beyond traditional advertising to include evolvingvehicles and venues for marketing communication (e.g., the Internet,advergames, branded product placement across multiple media).
• Assure that licensed characters are used only for the promotion offoods and beverages that support healthful diets for children and youth.
• Foster cooperation between CARU and the Federal Trade Commis-sion in evaluating and enforcing the effectiveness of the expanded self-regulatory guidelines.

384 FOOD MARKETING TO CHILDREN AND YOUTH
Media and Entertainment Initiatives
Because no element of the lives of Americans has a broader reach thanthe media and entertainment industry, their opportunities and responsibili-ties are great to depict and promote healthful diets and eating habits amongchildren and youth.
Recommendation 5: The media and entertainment industry should directits extensive power to promote healthful foods and beverages for childrenand youth.
To implement this recommendation, media, and the entertainment industryshould• Incorporate into multiple media platforms (e.g., print, broadcast, cable,
Internet, and wireless-based programming) foods, beverages, and story-lines that promote healthful diets.
• Strengthen their capacity to serve as accurate interpreters and reportersto the public on findings, claims, and practices related to the diets ofchildren and youth.
Parents, Caregivers, and Families
Parents and families remain the central influence on children’s attitudesand behaviors, and social marketing efforts that aim to improve children’sand youths’ diets therefore must be tied directly to that influence.
Recommendation 6: Government, in partnership with the private sector,should create a long-term, multifaceted, and financially sustained socialmarketing program supporting parents, caregivers, and families in pro-moting healthful diets for children and youth.
To implement this recommendation• Elements should include the full range of evolving and integrated mar-
keting tools and widespread educational and community-based efforts,including use of children and youth as change agents.
• Special emphasis should be directed to parents of children ages birth to4 years and other caregivers (e.g., child-care settings, schools, after-school programs) to build skills to wisely select and prepare healthfuland affordable foods and beverages for children and youth.
• The social marketing program should have a reliable and sustainedsupport stream, through public-appropriated funds and counterpartcooperative support from businesses marketing foods, beverages, andmeals to children and youth.

FINDINGS, RECOMMENDATIONS, NEXT STEPS 385
School Environments
If schools and parents are to remain the strongest allies working topromote and advance the interests of American children and youth, theschool environment must be fully devoted to preparing students for health-ful lifelong dietary patterns.
Recommendation 7: State and local educational authorities, with supportfrom parents, health authorities, and other stakeholders, should educateabout and promote healthful diets for children and youth in all aspects ofthe school environment (e.g., commercial sponsorships, meals and snacks,curriculum).
To implement this recommendation, companies should• Develop and implement nutrition standards for competitive foods and
beverages sold or served in the school environment.• Adopt policies and best practices that promote the availability and
marketing of foods and beverages that support healthful diets.• Provide visible leadership in this effort by public and civic leaders at all
levels such as the National Governors Association, the state and localBoards of Education, and the National Parent Teacher Association, aswell as trade associations representing private-sector businesses such asdistributors, bottlers, and vending machine companies that directlyinterface with the school administration.
Public Policy
A first obligation of public policy is to protect the vulnerable and asecond is to create the conditions for a desirable future. Both call for thecareful use of policy initiatives to foster healthy prospects for children andyouth.
Recommendation 8: Government at all levels should marshal the full rangeof public policy levers to foster the development and promotion of health-ful diets for children and youth.
To implement this recommendation• Government should consider incentives (e.g., recognition, performance
awards, tax incentives) that encourage and reward food, beverage, andrestaurant companies that develop, provide, and promote healthierfoods and beverages for children and youth in settings where theytypically consume them (e.g., restaurants, schools, amusement parks,sports venues, movie theaters, malls, and airports).

386 FOOD MARKETING TO CHILDREN AND YOUTH
• Government should explore combining the full range of possible ap-proaches (e.g., agricultural subsidies, taxes, legislation, regulation, fed-eral nutrition programs) for making fruits and vegetables readily avail-able and accessible to all children, youth, and families.
• The U.S. Department of Agriculture should develop and test new strat-egies for promoting healthier, appealing school meals provided throughthe School Breakfast Program and the National School Lunch Programas well as other federal programs designed for after-school settings(Special Milk Program) and child-care settings (Child and Adult CareFood Program).
• If voluntary efforts related to advertising during children’s televisionprogramming are unsuccessful in shifting the emphasis away from high-calorie and low-nutrient foods and beverages to the advertising ofhealthful foods and beverages, Congress should enact legislation man-dating the shift on both broadcast and cable television.*
Research
Knowledge is the bedrock of effective action and progress, yet currentresources are scant to expand the knowledge base, from all sources, on thechanging ways in which marketing influences the diets and health of chil-dren and youth.
Recommendation 9: The nation’s formidable research capacity should besubstantially better directed to sustained, multidisciplinary work on howmarketing influences the food and beverage choices of children and youth.
To implement this recommendation• The federal research capacity, in particular supported by the agencies
of the U.S. Department of Health and Human Services (e.g., NationalInstitutes of Health, Centers for Disease Control and Prevention,Food and Drug Administration), the U.S. Department of Agriculture,the National Science Foundation, and the Federal Trade Commissionshould be expanded to illuminate the ways in which marketing influ-ences children’s attitudes and behaviors. Of particular importance arestudies related to newer promotion techniques and venues, healthierfoods and beverages and portion sizes, product availability, the im-pact of television advertising on diet and diet-related health, diverseresearch methods that systematically control for alternative explana-
*See text at pages 349 and 262.
FINDINGS, RECOMMENDATIONS, NEXT STEPS 387
tions, stronger measurement, and methods with high relevance to ev-ery day life.
• A means should be developed for commercial marketing data to bemade available, if possible as a publicly accessible resource, for betterunderstanding the dynamics that shape the health and nutrition atti-tudes and behaviors of children and youth at different ages and indifferent circumstances, and for informing the multifaceted social mar-keting program targeting parents, caregivers, and families to promotehealthful diets for children and youth.
Monitoring Progress
The saying goes that “what gets measured gets done.” Yet no singlepublic body exists with responsibility or authority to track the influences ofmarketing on the dietary practices and health status of children and youthin the United States.
Recommendation 10: The Secretary of the U.S. Department of Healthand Human Services (DHHS) should designate a responsible agency,with adequate and appropriate resources, to formally monitor and re-port regularly on the progress of the various entities and activities re-lated to the recommendations included in this report.
To implement this recommendation• The Secretary should consult with other relevant cabinet officers and
agency heads (e.g., U.S. Department of Agriculture, U.S. Department ofEducation, Federal Trade Commission, Federal Communications Com-mission) in developing and implementing the required monitoring andreporting.
• Within 2 years, the Secretary should report to Congress on the progressand on additional actions necessary to accelerate progress.
CLOSING THOUGHTS
The review and recommendations presented in this report are anchoredin the presentation and interpretation of the evidence. This was the centralcharge to the committee, and the effort represents the most comprehensiveand rigorous review of existing scientific literature done to date. It is impor-tant to point out that the committee was not charged with, nor did it engagein addressing some of the broader philosophical, social, and political issuesrelated to food and beverage marketing to children and youth. Perspectivesabout basic responsibilities to shepherd the welfare of those most vulner-able or impressionable, conjecture about insights from studies not yet done

388 FOOD MARKETING TO CHILDREN AND YOUTH
or information not available on the strength of relationships between mar-keting and behavior of children and youth, and social urgency prompted bythe rapidly increasing prevalence of childhood obesity, all are legitimateand important matters for public discussion. But they were not centralfeatures of the committee’s charge or work. Neither was the related, butvital, matter of physical activity, which is so inextricably a part of thechallenge of childhood obesity. What the committee can contribute to theongoing and imperative public policy questions raised by this challenge is toconclude, based upon a thorough and impartial review of existing scientificdata, that the dietary patterns of our children and youth put their health atrisk, that the patterns have been reinforced if not encouraged by prevailingmarketing practices, and that the turnaround required will depend uponaggressive and sustained leadership from all sectors, including the food andbeverage industries. This is a public health priority of the highest order.

Appendixes


A
Acronyms
AAA American Academy of AdvertisingAAAA American Association of Advertising AgenciesAAF American Advertising FederationAAP American Academy of PediatricsABA Australian Broadcasting AuthorityACFN American Council for Fitness and NutritionAI Adequate IntakeAMA American Medical Association; American Marketing
AssociationAMDR Acceptable Macronutrient Distribution RangeANA Association of National AdvertisersASA Advertising Standards AuthorityASC Advertising Standards Canada
BLS U.S. Bureau of Labor StatisticsBMI body mass index
CACFP Child and Adult Care Food ProgramCARU Children’s Advertising Review UnitCBBB Council of Better Business BureausCDC Centers for Disease Control and PreventionCNLP Child Nutrition Labeling ProgramCOPPA Children’s Online Privacy Protection ActCSD carbonated soft drink
391
392 FOOD MARKETING TO CHILDREN AND YOUTH
CSFII Continuing Survey of Food Intakes by IndividualsCSPI Center for Science in the Public InterestCTS Children’s Television Standards
DASH Dietary Approaches to Stop HypertensionDHHS U.S. Department of Health and Human ServicesDNPA Division of Nutrition and Physical ActivityDRI Dietary Reference IntakeDVD digital video disc
EAR Estimated Average RequirementEER estimated energy requirementsEFNEP Expanded Food and Nutrition Education Program
FCC Federal Communications CommissionFDA U.S. Food and Drug AdministrationFGP Food Guide PyramidFITS Feeding Infants and Toddlers StudyFMNV foods of minimal nutritional valueFPA Food Products AssociationFSP Food Stamp ProgramFTC Federal Trade Commission
GAO U.S. Government Accountability OfficeGMA Grocery Manufacturers Association
HDL high-density lipoproteinHEI Healthy Eating Index
ICC International Chamber of CommerceIOM Institute of MedicineITC International Trade CommissionIU International Units
KFF Kaiser Family Foundation
LDL low-density lipoproteinLND low-nutrient dense
NAFTA North American Free Trade AgreementNARC National Advertising Review CouncilNASSP National Association of Secondary School PrincipalsNCI National Cancer InstituteNFCS National Food Consumption SurveyNHANES National Health and Nutrition Examination Surveys

APPENDIX A 393
NICHD National Institute of Child Health and Human DevelopmentNIH National Institutes of HealthNLEA Nutrition Labeling and Education ActNRC National Research CouncilNSLP National School Lunch Program
PBH Produce for Better Health FoundationPSA public service announcement
QSR quick serve restaurant
RDA Recommended Dietary AllowanceREA Recommended Energy AllowancesRTE ready to eat
SBP School Breakfast ProgramSEMS industry-sponsored educational materialsSES Socioeconomic StatusSIP National Family Opinion Research/Beverage Unit’s Share of
Intake Panel
UL Tolerable Upper Intake LevelsUSDA U.S. Department of Agriculture
WHO World Health OrganizationWIC Special Supplemental Nutrition Program for Women, Infants,
and Children

394
B
Glossary
Acceptable Macronutrient Distribution Range Established for macronu-trients and other dietary components as a percentage of total energy intakeassociated with reduced risk of chronic disease while providing recom-mended intakes of other essential nutrients.
Account Specific Marketing Retail promotional programs used to achieveincremental display activity and attain incremental sales volumes of selectbrands, including programs targeted at store personnel, managers, or con-sumers.
Added Sugars Sugars and syrups that are added to foods during process-ing or preparation. These do not include naturally occurring sugars such aslactose in milk or fructose in fruits.
Adequate Intake The recommended average daily intake level based onobserved or experimentally determined approximations or estimates of nu-trient intake by a group (or groups) of apparently healthy people that areassumed to be adequate, and is used when a Recommended Dietary Allow-ance cannot be determined.
Adiposity A term used to describe body fat.
Advergame A branded product that is built directly into a game throughInternet-based materials, video games, or in print materials.
APPENDIX B 395
Advertising A paid public presentation and promotion of ideas, goods, orservices by a sponsor that is intended to bring a product to the attention ofconsumers through a variety of media channels such as broadcast and cabletelevision, radio, print, billboards, the Internet, or personal contact.
Advertising Campaigns A group of advertisements, commercials, and re-lated promotional materials and activities that are designed to be usedduring the same period of time as part of a coordinated marketing plan tomeet specified advertising objectives.
Advertising Intensity The ratio of a food’s share of advertising to its shareof consumers’ disposable income.
Audience Fragmentation When a target group, such as a television view-ing audience, watches a greater diversity of television programming anddivides its attention and screen time across many media platforms.
Away-From-Home Foods Foods categorized according to where they areobtained, such as restaurants and other places with wait service; quick serverestaurants and self-service or take-out eateries; schools, including child-care centers, after-school programs, and summer camp; and other outlets,including vending machines, community feeding programs, and eating atsomeone else’s home.
Baby Boomer The term is most often used to refer to people born duringthe post-World War II baby boom, 1946–1964, which was a period ofincreased birth rates relative to preceding or subsequent generations.
Balanced Diet The overall dietary pattern of foods consumed that provideall the essential nutrients in the appropriate amounts to support life pro-cesses including growth and development in children without promotingexcess body fat accumulation and excess weight gain.
Behavioral Branding A strategy used by social marketing programs tocreate brands that individuals associate with a specific behavior or lifestyle.Examples include the VERB™ campaign, which encourages tweens to asso-ciate VERB™ with physical activity, and the truth® brand, which repre-sents an aspirational antismoking brand for teens that builds a positiveimage of youth as nonsmokers, cool and edgy, and rebellious against thetobacco industry.
Body Mass Index Body mass index (BMI) is an indirect measure of bodyfat calculated as the ratio of a person’s body weight in kilograms to thesquare of a person’s height in meters.

396 FOOD MARKETING TO CHILDREN AND YOUTH
BMI (kg/m2) = weight (kilograms) ÷ height (meters)2
BMI (lb/in2) = weight (pounds) ÷ height (inches)2 × 703
In children and youth, BMI is based on growth charts for age and genderand is referred to as BMI-for-age which is used to assess underweight,overweight, and risk for overweight. According to the Centers for DiseaseControl and Prevention (CDC), a child with a BMI-for-age that is equal toor greater than the 95th percentile is considered to be overweight. A childwith a BMI-for-age that is equal to or between the 85th and 95th percentileis considered to be at risk of becoming overweight. In this report, thedefinition of obesity is equivalent to the CDC definition of overweight, andat risk of becoming obese is equivalent to the CDC definition of at risk forbecoming overweight.
Brand Advantage When marketers determine whether customers think abrand is improving or whether their interest in a specific brand is declining.Also called brand momentum.
Brand Awareness Consumer’s awareness about a brand and the competi-tion for it. Also called brand image.
Brand Equity When marketers build familiarity of a specific brand amongconsumers to enhance perceived quality, meet customers’ expectations, orincrease purchase intent of the brand. Also called brand relevance andbrand performance.
Brand Loyalty The degree to which consumers will consistently purchasethe same brand within a product category. Also called brand bonding.
Brand Preference A consumer preference for a particular brand that re-sults in the continual purchase of it.
Branding A marketing feature that provides a name or symbol that legallyidentifies a company, a single product, or a product line to differentiate itfrom other companies and products in the marketplace.
Buzz Marketing Peer-to-peer marketing.
Buzz Spotters A network of young people—from tweens to teens to youngadults—who observe youth trends and provide this feedback to youthmarketers.
Calorie A kilocalorie is defined as the amount of heat required to change
APPENDIX B 397
the temperature of one gram of water from 14.5 degrees Celsius to 15.5degrees Celsius. In this report, calorie is used synonymously with kilocalo-rie as a unit of measure for energy obtained from foods and beverages.
Carbonated Soft Drinks A common marketing term used to refer to acategory of cold, nonalcoholic, sweetened beverages that uses the process ofcarbonation to enhance its taste and texture.
Caregiver An individual, such as a parent, foster parent, or head of ahousehold, who attends to the needs of a child or adolescent.
CARU The Children’s Advertising Review Unit (CARU) was founded in1974 to promote responsible children’s advertising as a component of thestrategic alliance with major advertising trade associations through theNational Advertising Review Council. CARU is the children’s arm of theadvertising industry’s self-regulation program and evaluates child-directedadvertising and promotional material in all media to advance accuracy,truthfulness, and consistency of advertisements.
Causal Inference In this report, the evidence for a causal relationshipbetween a marketing variable and an outcome precursor, diet, or diet-related health variable.
Causal Relationship A relationship between variables in which a changein one variable produces a change in another variable; changes in onevariable affect another variable; and changes in one variable depend onchanges in another variable.
Celebrity Endorsement Popular celebrities who allow their names to beassociated with a specific product, brand, or company.
Channel One News A 12-minute current events program launched in1990 that provides 2 minutes of commercials. It is viewed by more than8 million adolescents daily in an estimated 12,000 U.S. public schools.
Character Merchandising The use of popular fictional characters to pro-mote the sale of many types of products. The intellectual rights to thecharacter frequently belong to another company. This form of consumerpromotion is also known as out-licensing.
Co-branding A technique where two companies partner to create oneproduct. It is used to reach new customers and to extend a company’s nameand trademark to new areas of the consumer market.

398 FOOD MARKETING TO CHILDREN AND YOUTH
Commercialism The means of communication that creates consumerawareness and induces the desire for products, thereby increasing con-sumer demand and commercial profit.
Community A social entity that can either be spatial, based on wherepeople live in local neighborhoods, residential districts, or municipalities;or relational, based on common ethnic, cultural, or other characteristics orsimilar interests.
Competitive Foods Foods and beverages offered at schools other thanmeals and snacks served through the federally reimbursed National SchoolLunch Program (NSLP), School Breakfast Program (SBP), and the after-school snack programs. Competitive foods include food and beverage itemssold through a la carte lines, snack bars, student stores, vending machines,and school fundraisers.
Consumer Promotion A form of nonpersonal sales promotional effortsthat are designed to have an immediate impact on sales. This form ofpromotion uses media and nonmedia marketing communications for a lim-ited time to increase consumer demand, stimulate market demand, or in-crease product availability. Examples of consumer promotion include cou-pons, discounts and sales, contests, point of purchase displays, rebates, andgifts and incentive items. Also called sales promotion.
COPPA Children’s Online Privacy Protection Act of 1998 that requiresonline operators to seek parental permission before collecting personalinformation from children and to post links to their privacy policy on theirhomepage and every page where personal information is collected.
Correlate To put or bring into causal, complementary, parallel, or recip-rocal relation.
Cross-Promotion A consumer sales promotion technique in which themanufacturer attempts to sell the consumer new or other products relatedto a product the consumer already uses or which the marketer has avail-able.
Deception According to Section 5 of the Federal Trade Commission stat-ute, 15 U.S.C. § 45, a representation, omission, act, or practice that is likelyto mislead consumers to act reasonably under given circumstances or affectconsumers’ conduct or decisions with respect to a product.

APPENDIX B 399
Dietary Guidelines Americans A federal summary of the latest dietaryguidance for the American public based on current scientific evidence andmedical knowledge. The Guidelines are issued jointly by the U.S. Depart-ment of Health and Human Services and U.S. Department of Agricultureand revised every 5 years.
Dietary Reference Intakes A set of four distinct nutrient-based referencevalues that replaced the former Recommended Dietary Allowances in theUnited States. They include Estimated Average Requirements (EARs), Rec-ommended Dietary Allowances (RDAs), Adequate Intakes (AIs), and Toler-able Upper Intake Level (UL).
Digital Divide The socioeconomic gap between groups or communitiesthat have access to computers and the Internet and those who do not haveaccess. It also refers to a gap that exists between groups regarding theirability to use information and communications technology effectively dueto differing levels of literacy and technical skills.
Direct Marketing Sending a promotional message directly to consumersthrough direct mail or telemarketing rather than through a mass mediumsuch as television or the Internet.
Disclaimer A repudiation or denial of responsibility or connection.
Disclosure The act or process of revealing or making something evident.
Discretionary Fat The ability of a person to selectively add dietary fat(e.g., salad dressing, butter, oil) at one’s own discretion, according to di-etary preferences, and which contributes to total calorie intake. This isdistinct from obligatory fat that has been added to foods prior to consump-tion and cannot be removed. It may also represent the amount of fat in aperson’s “energy allowance” or discretionary calories after consuming suf-ficient amounts of high-calorie and low-nutrient foods to meet one’s dailycalorie and nutrient needs while promoting weight maintenance.
Ecological Validity The extent to which an investigation’s research set-ting, stimuli, and response demands are similar to those of naturally occur-ring settings, stimuli, and response characteristics of the behavioral systembeing studied.
Energy Balance A state where calorie intake is equivalent to energy ex-penditure, resulting in no net weight gain or weight loss. In this report,energy balance in children is used to indicate equality between energy in-

400 FOOD MARKETING TO CHILDREN AND YOUTH
take and energy expenditure that supports normal growth and developmentwithout promoting excess weight gain.
Energy Density The amount of calories stored in a given food per unitvolume or mass. Fat stores 9 kilocalories/gram (g), alcohol stores 7 kilo-calories/g, carbohydrate and protein each store 4 kilocalories/g, fiber stores1.5 to 2.5 kilocalories/g, and water has no calories. Foods that are almostentirely composed of fat with minimal water (e.g., butter) are more caloriedense than foods that consist largely of water, fiber, and carbohydrates(e.g., fruits and vegetables).
Energy Expenditure Calories used to support the body’s basal metabolicneeds plus those used for thermogenesis, growth, and physical activity.
Energy Intake Calories ingested as foods and beverages.
Environment The aggregate of social and cultural conditions that influ-ence the life of an individual or community.
Estimated Average Requirement The average daily nutrient intake levelestimated to meet the requirement of half the healthy individuals in aparticular life stage and gender group.
Estimated Energy Requirements The calorie needs calculated for differentgroups based on age, gender, and physical activity level, published by theInstitute of Medicine in 2002, which replaced the Recommended EnergyAllowance (REA).
Exclusive Contracting When a school district enters into an exclusivecontract with a soft drink company to sell only a particular beverage prod-uct on the school premises. Also called pouring rights.
Explicit Learning The ability to acquire knowledge through a fully con-scious and hypothesis-driven mode, such as learning a concept or learninghow to solve a problem.
Fast Food Foods and meals designed for ready availability, use, or con-sumption and sold at eating establishments for quick availability ortake-out.
Flavor The sensory impression of a food or other substance that is deter-mined by the chemical senses of taste and smell. A substance added to foodto give it a particular taste.

APPENDIX B 401
Focus Group A research method whereby a moderator convenes a groupof participants who often have common characteristics (e.g., age, gender,ethnicity) to discuss the attributes of a specific concept or product. It isoften used in the marketing development phase to generate ideas and pro-vide insights into consumer reactions and perceptions.
Food Guide Pyramid An educational tool designed for the public thattranslates and graphically illustrates recommendations from the DietaryGuidelines for Americans and nutrient standards such as the Dietary Refer-ence Intakes into food group-based advice that promotes a healthful dietfor the U.S. population. In 2005, it was replaced by an interactive foodguidance system, MyPyramid.
Gatekeeper Refers to the person who controls decisions, such as a parentfor a child or teen, by controlling the purchasing or decision-making pro-cess. It also refers to the person who controls the flow of information fromthe mass media to a group or other individuals.
Generation X A term used in marketing, the social sciences, and popularculture to describe people born in the 1960s and 1970s.
Generation Y People born between 1981 and 1995 in the United States,also know as Echo Boomers and the Millennium Generation.
Global Brand Value Represents the total monetary worth of a company’scollective brands.
Global Revenues Represent a company’s total sales and earningsworldwide.
Health Represents a state of complete physical, mental and social well-being and not merely the absence of disease or infirmity.
Health Promotion The process of enabling people to increase control overand to improve their health through networks and initiatives that createhealthy environments. To reach a state of complete physical, mental, andsocial well-being, an individual or group must be able to identify and torealize aspirations, to satisfy needs, and to change or cope with the environ-ment. Health is a resource for everyday life, not the objective of living, andis a positive concept emphasizing social and personal resources, as well asphysical capacities.

402 FOOD MARKETING TO CHILDREN AND YOUTH
Healthful Diet For children and adolescents, a healthful diet providesrecommended amounts of nutrients and other food components withinestimated energy requirements (EER) to promote normal growth and de-velopment, a healthy weight trajectory, and energy balance. A healthfuldiet also reduces the long-term risk for obesity and related chronic diseasesassociated with aging, including type 2 diabetes and metabolic syndrome.
Healthy Weight In children and youth, a level of body fat that supportsnormal growth and development and where there are no observed co-morbidities. In adults, a BMI between 18.5 and 24.9 kg/m2.
Host Selling Refers to the same character appearing in a television pro-gram as well as an advertisement placed next to a television show in whichthe character appears.
Implicit Learning The ability to learn under passive, automatic, and un-conscious acquisition of abstract knowledge. This type of learning remainsrobust over time.
Incentive Programs Sponsors that agree to give discounts or free productsif students collect a certain number of coupons or shop at certain stores.
Integrated Marketing A planning process designed to assure that all pro-motional activities, including media advertising, direct mail, sales promo-tion, and public relations, produce a unified, customer-focused promotionmessage that is relevant to a customer and consistent over time.
Interactive Product Placement A technique that merges television and theInternet through channels such as digital television and Web television.
Internet Marketing A promotional activity that occurs on the Internet,which connects consumers to companies’ brands and products for the pur-pose of stimulating sales.
Licensing Agreement A contractual agreement that allows copyright hold-ers to loan their intellectual property to another company in exchange forpayment. In the children’s media industries, companies can license the char-acters and images of their media products to food and beverage companiesfor a fee.
Lifestyle Marketing A promotional activity created around the interests,attitudes, opinions, and ways of life of consumers to connect with how theywant to live.

APPENDIX B 403
Marketing An organizational function and a set of processes for creating,communicating, and delivering value to customers and for managing cus-tomer relationships in ways that benefit an organization and its stakehold-ers. Marketing encompasses a wide range of activities including marketresearch, analyzing the competition, positioning a new product, pricingproducts and services, and promoting them through advertising, consumerpromotion, trade promotions, public relations, and sales.
Marketing Mix Combining the four strategy elements of market decisionmaking—product, placement, price, and promotion—to reach consumers.
Marketing Research Activities that link the consumer, customer, and pub-lic to the marketer through information that is used to identify and definemarketing opportunities and problems; generate, refine, and evaluate mar-keting actions; monitor marketing performance; and improve understand-ing of marketing as a process. Marketing research specifies the informationrequired to address these issues, designs the method for collecting informa-tion, manages and implements the data collection process, analyzes theresults, and communicates the findings and their implications.
Marketplace The set of commercial activities where goods and servicesare bought and sold.
Market Segmentation The division of a market into different groups ofconsumers that have common characteristics.
Measured Media The categories tracked by media research companiesincluding television (e.g., network, spot, cable, syndicated, Spanish-language network), radio (e.g., network, national spot, local), magazines(e.g., local, Sunday magazine), business publications, newspapers (e.g., lo-cal, national), outdoor, direct mail, the Yellow Pages, and the Internet.
Media Advocacy The strategic use of the mass media to advance a socialor public policy initiative.
Media Literacy The ability to access, analyze, evaluate, and produce com-munication in a variety of forms. A media-literate person can understandand think critically about the nature, technique, and impact of the massmedia, including print and broadcast media, the Internet, and newly emerg-ing technologies. Also called media education.
Mediator The mechanism by which one variable affects another variable.

404 FOOD MARKETING TO CHILDREN AND YOUTH
Millennial A person born between 1981 and 1995 in the United States,also know as an Echo Boomer or Generation Y.
Moderator A variable that changes the impact of one variable on another.
Naming Rights An owner of an object sells the rights for someone else toname the object.
National School Lunch Program The National School Lunch Program(NSLP) is a federally funded meal program established in 1946 that oper-ates in public and nonprofit private schools and residential child-care insti-tutions. The NSLP provides nutritionally balanced, reduced-cost, or freelunches to children every school day.
Nutrient Density The amount of nutrients that a food contains per unitvolume or mass. Nutrient density is independent of energy density although,in practice, the nutrient density of a food is often described in relationshipto the food’s energy density. Fruits and vegetables are nutrient dense, butnot energy dense. Compared to foods of high fat content, carbonated softdrinks are not particularly energy dense because these are made up prima-rily of water and carbohydrate, but because they are otherwise low innutrients, their energy density is high for the nutrient content.
Nutrition Facts Panel Standardized detailed nutritional information onthe contents and serving sizes of nearly all packaged foods sold in themarketplace. The panel was designed to provide nutrition information toconsumers and was mandated by the Nutrition Labeling and Education Actof 1990.
Obesity An excess amount of subcutaneous body fat in proportion to leanbody mass. In adults, a BMI of 30 or greater is considered obese. In thisreport, obesity in children and youth refers to the age- and gender-specificBMI that is equal to or greater than the 95th percentile of the CDC BMIcharts. At-risk for obesity in children and youth is defined as a BMI-for-ageand gender that is between the 85th and 95th percentiles of the CDC BMIcurves. In most children, these values are known to indicate elevated bodyfat and to reflect the co-morbidities associated with excessive body fatness.
Obesogenic Environmental factors that may promote obesity and encour-age the expression of a genetic predisposition to gain weight.
Older Children In this report, refers to children ages 6–11 years.

APPENDIX B 405
Overweight Defined by the CDC as a BMI-for-age and gender that isgreater than or equal to the 95th percentile of the 2000 CDC BMI curvesdeveloped for U.S. children and adolescents ages 2 to 20 years. At-risk foroverweight is defined by the CDC as a BMI-for-age and gender that isbetween the 85th and 95th percentiles of the 2000 CDC BMI curves.
Persuasive Intent Refers to the cognitive awareness and demonstratedability of children and youth to recognize and comprehend the inherentbias, exaggeration, and self-interest of commercial messages. They under-stand that a commercial message has other interests and perspectives thanthe receiver of the message; that the purveyor of the persuasive message isguided by commercial self-interest; that persuasive messages are biased; andthat biased messages demand different interpretive strategies than unbiasedmessages.
Pester Power The ability children have to badger their parents into pur-chasing items they would otherwise not buy or performing actions theywould otherwise not do.
Physical Activity Body movement produced by the contraction of skeletalmuscles that result in energy expenditure above the basal level. Physicalactivity consists of athletic, recreational, housework, transport or occupa-tional activities that require physical skills and utilize strength, power,endurance, speed, flexibility, range of motion, or agility.
Portion Size Represents the amount of food an individual is served athome or away from home and chooses to consume for a meal or snack.Portions can be larger or smaller than serving sizes listed on the food labelor the Food Guide Pyramid.
Pouring Rights When a school district enters into an exclusive contractwith a soft drink company to sell only a particular beverage product on theschool premises. Also called exclusive contracting.
Precision Refers to the sensitivity or coarseness of a measure.
Prevention With regard to obesity, primary prevention represents avoid-ing the occurrence of obesity in a population; secondary prevention repre-sents early detection of disease through screening with the purpose of lim-iting its occurrence; and tertiary prevention involves preventing the sequelaeof obesity in childhood and adulthood.

406 FOOD MARKETING TO CHILDREN AND YOUTH
Product Placement A marketing technique that uses a message, brandlogo, or product in a visual or graphic medium in a variety of forms ofmedia entertainment, including television programs, films, music, videos/DVDs, video games, and advergames.
Promotion The means by which a business or company communicateswith its target audience or customers to inform, persuade, or influencecustomers’ purchase decisions.
Proprietary Privately owned and operated; something that is held underpatent, trademark, or copyright by a private person or company.
Public Relations A company’s communications and relationships withvarious groups including customers, employees, suppliers, stockholders,government, general public, and society.
Public Service Announcement An advertisement or commercial that iscarried by an advertising vehicle at no cost as a public service to its readers,viewers, or listeners. A promotional message for a nonprofit organizationor for a social cause printed or broadcast at no charge by the media.
Purchase Influence The array of behaviors related to a child’s or anadolescent’s influence on family purchases.
Quick Serve Restaurant A category of restaurants characterized by foodthat is supplied quickly after ordering and with minimal service. Foods andbeverages purchased may be consumed at the restaurant or served as take-out.
Recommended Dietary Allowance The average daily dietary nutrient in-take level sufficient to meet the nutrient requirement of nearly all (97 to98 percent) healthy individuals in a particular life stage and gender group.
Recommended Energy Allowance The average energy needs of individu-als as presented in the 10th edition of the Recommended Dietary Allow-ances which were updated by the IOM in 2002 and replaced with theestimated energy requirements (EER).
Relationship Marketing A marketing approach that acquires informationabout a customer during the history of that customer’s relationship with acompany. This information is used to market to the customer to promotetrust and loyalty. Five components of relationship marketing are aware-ness, recognition, preferences, commitment, and endorsement.

APPENDIX B 407
Reliability Assesses the extent to which the same measurement technique,applied repeatedly, is likely to yield the same results.
Safety The condition of being protected from or unlikely to cause danger,risk, or injury that either may be perceived or objectively defined.
Sales Promotion Marketing activities other than advertising, personal sell-ing, and publicity that stimulate consumer purchases at the point-of-salesuch as a display, product demonstration, trade show, contest, coupon,premium, prize, toy, or price discount. Also called consumer promotion.
School Breakfast Program A federally administered program that pro-vides cash assistance to states to operate nonprofit breakfast programs inU.S. public schools and residential child-care institutions.
School Meal Initiative For Healthy Children A program launched by theU.S. Department of Agriculture in 1995 to improve the nutritional qualityof school lunches and breakfasts.
Screen Time The number of hours a child or adolescent spends watchingvarious types of electronic media (e.g., broadcast and cable television, videoand/or digital video disc, movie, computer) per day, week, month, or year.
Secular Trend A long-term trend in numbers (up or down).
Sedentary A way of living or lifestyle that requires minimal physical activ-ity and that encourages inactivity through limited choices, disincentives,and/or structural or financial barriers.
Serving A standardized unit of measure used to describe the total amountof foods recommended daily from each of the food groups from the FoodGuide Pyramid or a specific amount of food that contains the quality ofnutrients listed on the Nutrition Facts panel. This may differ from a portionwhich represents the amount of food an individual is served at home oraway from home and chooses to consume for a meal or snack.
Social Marketing The application of commercial marketing principles tothe analysis, planning, implementation, and evaluation of programs de-signed to influence voluntary behavior changes in target audiences in orderto improve their personal welfare and for the benefit of society.
Spam Unwanted, unsolicited e-mail messages that are typically of a com-mercial nature.
408 FOOD MARKETING TO CHILDREN AND YOUTH
Sponsored Educational Materials Materials in which the sponsor assumesresponsibility for the production and usually the content of the materials aswell as the advertising that appears within it.
Stealth Marketing A marketing strategy used to present products or ser-vices that consumers do not identify as an attempt to influence their pur-chase behaviors. Viral marketing is a form of stealth marketing.
Subsidy A monetary grant given by government in support of an activityregarded as being in the public interest. A payment that a governmentmakes to a producer to supplement the market price of a commodity. Asubsidy can keep consumer prices low while maintaining a higher incomefor domestic producers.
Target Market A group of individuals to whom a company markets itsproducts or ideas that are designed to satisfy their specific needs and prefer-ences. Target markets may be segmented by demographic characteristics(e.g., age, gender, income, race or ethnicity), psychographic characteristics(i.e., values, attitudes, beliefs, lifestyles), behavioral patterns (e.g., brandloyalty, product usage rates, price), and geographic characteristics (e.g.,region, population density).
Taste The sense that distinguishes the sweet, sour, salty, and bitter quali-ties of dissolved substances in contact with the taste buds on the tongue.
Teen In this report, refers to young people ages 12–18 years.
Tolerable Upper Intake Level The highest average daily nutrient intakelevel that is likely to pose no risk of adverse health effects to almost allindividuals in the general population. As intake increases above the Toler-able Upper Intake Level (UL), the potential risk of adverse effects mayincrease.
Trade Promotion Promotion activities directed to marketing intermediar-ies, such as grocery stores, convenience stores, and other food retail outlets,and uses strategies that include in-store displays, shelf space and position-ing, free merchandise, buy-back allowances, merchandise allowances, andsales contests to encourage wholesalers or retailers to sell more of a com-pany’s specific product or lines.
Tween In this report, refers to young people ages 9–13 years. Marketersdistinguish the tween market segment from children and teens, defining it

APPENDIX B 409
as young people who have attitudes and behaviors that are “in between”the ages of 8–12 years or 9–14 years.
Unmeasured Media The difference between a company’s reported or esti-mated advertising costs and its measured media spending. Unmeasuredmedia spending includes activities such as sales promotions, coupons, directmail, catalogs, and special events, and it is not systematically tracked.
Validity Refers to the extent to which an instrument directly and accu-rately measures what it is intended to measure.
Variable Anything that is not constant but that can and does change indifferent circumstances.
Viral Marketing A strategy used to build brand awareness and promotepurchases by encouraging people to pass a marketing message to a targetaudience, often through electronic or digital platforms. Customers act asagents to promote and endorse a company’s products, and incentives areoften provided to customers to distribute the promotional messages andoffers.
Virtual Advertisements Digital advertisements that are inserted into pro-grams, into films, or onto stadium walls at sporting events.
Well-being A view of health that takes into account a child’s physical,social, and emotional health.
Younger Children In this report, refers to children ages 2–5 years.

410
C
Literature Review
To conduct a thorough review of the scientific literature, the Institute ofMedicine (IOM) committee and staff conducted online bibliographicsearches of relevant databases, including the following: ABI/INFORM,Academic Search Premier, AGRICOLA, Communication and Mass MediaComplete, EconLit, EMBASE, ERIC, LexisNexis, MEDLINE, NTIS,PsycINFO, Science Direct, Sociological Abstracts, Web of Science, andWorldCat/FirstSearch (Box C-1).
To begin the process of identifying the primary literature in this field,the IOM staff at the beginning of the study conducted general bibliographicsearches on topics related to marketing aimed toward children and youth.These references were categorized and annotated by the staff, and referencelists of key citations were provided to the committee. After examining theinitial search in each of the databases, a comprehensive search strategy wasdesigned in consultation with librarians at the George E. Brown Jr. Libraryof the National Academies. Search terms incorporated relevant MeSH(Medical Subject Headings) terms as well as terms from the EMBASE the-saurus. To maximize retrieval, the search strategy incorporated synony-mous terms on the topics of dietary patterns and factors that shape them;food and/or beverage marketing (e.g., sources, venues, scope, trends, mar-ket segmentations, investment); effects of marketing on diets and health;and public policy issues (e.g., self-regulation, monitoring efforts, legal, so-cial, and economical). The searches were limited to English language andtargeted to retrieve citations related to infants, children, or youth (less than18 years of age). The searches were not limited by date of publication.

APPENDIX C 411
BOX C-1Online Databases
ABI/INFORM contains information on more than 60,000 companies as well asexecutive profiles, reports on market conditions, and in-depth case studies of glo-bal business trends. The database contains content from thousands of journalsthat help researchers track business conditions, trends, management techniques,corporate strategies, and industry-specific topics worldwide.
Academic Search Premier is a large academic multidisciplinary database. It pro-vides full text for nearly 4,700 publications, including full text for more than 3,600peer-reviewed journals. Coverage spans virtually every area of academic studyand offers information dating as far back as 1975. This database is updated on adaily basis via EBSCOhost.
AGRICOLA is a bibliographic database of citations to the agricultural literature.Production of these records in electronic form began in 1970, but the databasecovers materials in all formats, including printed works from the 15th century. Therecords describe publications and resources encompassing aspects of agricultureand allied disciplines, such as agricultural economics; animal and veterinary sci-ences; earth and environmental sciences; entomology; extension and education;farming and farming systems; fisheries and aquaculture; food and human nutrition;forestry; and plant sciences. AGRICOLA indexes more than 2,000 serials as wellas books, pamphlets, conference proceedings, and other resources. This data-base is updated and maintained by the National Agricultural Library.
Communication and Mass Media Complete provides research solutions in ar-eas related to communication and mass media. This database originated with theacquisition and subsequent merging of two popular databases in the fields of com-munication and mass media studies—CommSearch (formerly produced by theNational Communication Association) and Mass Media Articles Index (formerlyproduced by Pennsylvania State University).
EconLit is the American Economic Association’s bibliographic database of eco-nomics literature published in the United States and other countries from 1969 tothe present. EconLit contains citations and abstracts from more than 500 econom-ics journals. Some full-text articles are available. The database also indexes books,book chapters, book reviews, dissertations, essays, and working papers. The da-tabase covers subjects including accounting, consumer economics, monetary pol-icy, labor, marketing, demographics, modeling, economic theory, and planning.EconLit contains more than 350,000 records and is updated monthly.
EMBASE (Excerpta Medica) database is a major biomedical and pharmaceuticalresource containing more than 9 million records from 1974 to the present fromover 4,000 journals; approximately 450,000 records are added annually. Over80 percent of recent records contain full author abstracts. This bibliographic data-base indexes international journals in the following fields: drug research, pharma-cology, pharmaceutics, toxicology, clinical and experimental human medicine,health policy and management, public health, occupational health, environmental
continues

412 FOOD MARKETING TO CHILDREN AND YOUTH
health, drug dependence and abuse, psychiatry, forensic medicine, and biomedi-cal engineering/instrumentation. EMBASE is produced by Elsevier Science.
ERIC (Educational Resources Information Center) is a national education data-base containing nearly 100,000 citations and abstracts published from 1993 to thepresent. ERIC contains more than 1 million citations of research documents, jour-nal articles, technical reports, program descriptions and evaluations, and curricularmaterials in the field of education. ERIC is sponsored by the U.S. Department ofEducation, Office of Educational Research and Improvement.
LexisNexis provides access to full-text information from more than 5,600 sources,including national and regional newspapers, wire services, broadcast transcripts,international news, and non-English-language sources; U.S. federal and state caselaw, codes, regulations, legal news, law reviews, and international legal informa-tion; and business news journals, company financial information, Securities andExchange Commission filings and reports, and industry and market news. It isproduced by Reed Elsevier, Inc.
MEDLINE is the National Library of Medicine’s bibliographic database containingcitations from the mid-1960s to the present. It covers the fields of medicine, nurs-ing, dentistry, veterinary medicine, the health care system, and the preclinical sci-ences. PubMed provides online access to more than 12 million MEDLINE citationsand additional life science journals. MEDLINE contains bibliographic citations andauthor abstracts from more than 4,600 biomedical journals published in the UnitedStates and 70 other countries. PubMed includes links to many sites providing full-text articles and related resources. This database can be accessed at http://www.ncbi.nlm.nih.gov/PubMed.
NTIS serves the United States as a central resource for government-funded scien-tific, technical, engineering, and business-related information available. NTIS of-fers information on more than 600,000 information products covering over 350subject areas from 200-plus federal agencies.
PsycINFO is a bibliographic database of psychological literature with journal cov-erage from the 1800s to the present and book coverage from 1987 to the present.It contains more than 1.9 million records including citations and summaries of jour-nal articles, book chapters, books, and technical reports, as well as citations todissertations, all in the field of psychology and psychological aspects of relateddisciplines. Journal coverage includes full-text article links to 42 American Psycho-logical Association journals including peer-reviewed international journals. Psy-cINFO is produced by APA.
Science Direct is a large electronic collection of science, technology, and medi-cine full-text and bibliographic information.
Sociological Abstracts indexes the international literature in sociology and relat-ed disciplines in the social and behavioral sciences from 1963 to the present. Thisbibliographic database contains citations (from 1963) and abstracts (only after1974) of journal articles, dissertations, conference reports, books, book chapters,and reviews of books, films, and software. Approximately 1,700 journals and 900other serials published in the United States and other countries in more than 30
BOX C-1 Continued

APPENDIX C 413
As the study progressed, additional focused searches were conducted.Topics of these searches included emerging technologies, integrated adver-tising, stealth advertising, and food preference and intake. Additional refer-ences were identified by reviewing the reference lists found in major reviewarticles, key reports, prominent websites (e.g., marketing research and sur-veys), and relevant books. Committee members, workshop presenters, con-sultants, and IOM staff also supplied references. Requests for literaturesuggestions were made to experts in relevant fields. An e-mail request wassent to nearly 50 researchers, academicians, industry professionals, advo-cates, and policy analysts, seeking their advice on important literature thatshould be considered for the committee’s review. Requests were also madeto individuals who attended a public workshop and forum on marketingfoods and beverages to children and youth (Appendix H). Furthermore,public comment on the committee’s task was requested through the Na-tional Academies’ website.
The committee maintained the reference list in a database that could besearched by keywords, staff annotations, or other criteria. Additionally, anInternet-based website was developed from the search of some of the keyresources. Bibliographies were updated throughout the study and as com-mittee members requested the full text of journal articles and other re-sources as needed for their information and analysis. The literature wascategorized into a taxonomy of peer-reviewed articles and marketing firmresearch or commercial reports, as described in Box C-2.
A number of reviews of literature have been published on topics rel-evant to the committee’s work. Studies included in these literature reviewswere considered for inclusion in the committee’s review.
languages are screened yearly and added to the database bimonthly. The Socio-logical Abstracts database contained approximately 600,000 records in 2003. Alimited number of full-text references are available. Sociological Abstracts is pre-pared by Cambridge Scientific Abstracts.
Web of Science provides access to current and retrospective multidisciplinaryinformation from approximately 8,700 high-impact research journals. Web of Sci-ence also provides a unique search method, cited reference searching.
WorldCat/FirstSearch is an online service that gives library professionals andend users access to a wide collection of reference databases. With FirstSearch,materials in a library’s collection are highlighted in results from searches in dozensof databases. Underlying FirstSearch is the WorldCat database, a comprehensiveand up-to-date bibliographic resource.
BOX C-1 Continued

414 FOOD MARKETING TO CHILDREN AND YOUTH
BOX C-2Research Taxonomy
Descriptive studies
• Prevalence of disease, risk, and condition• Dietary intakes and trends, including portion sizes• Dietary intake influences• Other behavioral influences• Product profiles and trends• Purchaser profiles and trends• Television viewing patterns• Commercial marketing activities (all forms)
Television: placement analyses of advertisingTelevision: content analyses of advertisingPrint advertisingToys and charactersInternetVideo games
• Social marketing activities• Economic factors in food availability and choice• Industry profiles and practices• Ethics, guidelines and adherence• Regulatory agencies and actions
United StatesInternational
Surveys
• Children’s and adolescents’ viewsOf advertisingOf food and nutrition
• Parents’ viewsOf advertisingOf food and nutrition
• Marketing surveys

APPENDIX C 415
Observational studies
• Children’s and adolescents’ development and understanding• Relation of diet to disease risk• Children’s food and beverage consumption behaviors
Influence of advertisingInfluence of television contentInfluence of television viewing timeInfluence of product design and packagingInfluence of priceInfluence of school meals/vendingFamily variables/parent—child interactionsPeer influences
• Other behaviors among children and youths• Methodologic studies
Dietary intake estimatesAssessing advertising effects
Intervention studies
• On awareness and food preference• On food and beverage choices
School curriculumTelevision viewing
• On other youth behaviors• Media literacy
Reviews/literature syntheses/recommendations
• Factors in childhood and youth development• Diet and health/children’s health/adolescents’ health• Influence of food marketing on children’s and adolescents’ diets• Lessons from studies on behaviors other than diet• Social marketing• Research recommendations

416
D
Chapter 2 Appendix

417T
AB
LE
D-1
Est
imat
ed E
nerg
y R
equi
rem
ents
for
Pro
pose
d Fo
od I
ntak
e Pa
tter
ns o
f U
.S.
Chi
ldre
n an
d A
dole
scen
ts,
Age
s 2–
18 Y
ears
Boy
sG
irls
Sede
ntar
yL
ow A
ctiv
eA
ctiv
eSe
dent
ary
Low
Act
ive
Act
ive
Tar
get
Sugg
este
dSu
gges
ted
Tar
get
Sugg
este
dSu
gges
ted
Age
EE
RPa
tter
nE
ER
Patt
erns
EE
RPa
tter
nsA
geE
ER
Patt
ern
EE
RPa
tter
nsE
ER
Patt
erns
21,
050
1,00
01,
050
1,00
0–1,
400
1,05
01,
000
–1,4
002
997
1,00
099
71,
100–
1,20
099
71,
000
–1,4
003
1,16
21,
324
1,48
53
1,08
01,
243
1,39
5
41,
215
1,40
01,
390
1,40
0–1,
600
1,56
61,
600
–2,0
004
1,13
31,
200
1,31
01,
400–
1,60
01,
475
1,40
0–1
,800
51,
275
1,46
61,
658
51,
189
1,37
91,
557
61,
328
1,53
51,
742
61,
247
1,45
11,
642
71,
394
1,61
71,
840
71,
298
1,51
51,
719
81,
453
1,69
21,
931
81,
360
1,59
31,
810
91,
530
1,80
01,
787
1,80
0–2,
200
2,04
32,
000
–2,6
009
1,41
51,
600
1,66
01,
600–
2,00
01,
890
1,80
0–2
,000
101,
601
1,87
52,
149
101,
470
1,72
91,
972
111,
691
1,98
52,
279
111,
538
1,81
32,
071
121,
798
2,20
02,
113
2,40
0–2
,800
2,42
82,
800
–3,2
0012
1,61
71,
800
1,90
92,
000
2,18
32,
400
131,
935
2,27
62,
618
131,
684
1,99
22,
281
142,
090
2,45
92,
829
141,
718
2,03
62,
334
152,
223
2,61
83,
013
151,
731
2,05
72,
362
162,
320
2,73
63,
152
161,
729
2,05
92,
368
172,
366
2,79
63,
226
171,
710
2,04
22,
353
182,
383
2,82
33,
263
181,
690
2,02
42,
336
NO
TE
: T
his
tabl
e sh
ows
targ
et a
nd s
ugge
sted
ene
rgy
inta
ke l
evel
s fo
r ea
ch a
ge a
nd g
ende
r gr
oup
for
prop
osed
Foo
d G
uide
Pyr
amid
(FG
P) i
ntak
epa
tter
ns.
The
se t
arge
t an
d su
gges
ted
leve
ls a
re b
ased
on
Est
imat
ed E
nerg
y R
equi
rem
ents
(E
ER
) ca
lcul
ated
by
gend
er,
age,
and
act
ivit
y le
vel
for
c on
tin
ue s

418
refe
renc
e-si
zed
indi
vidu
als
(IO
M, 2
002)
. Sed
enta
ry is
def
ined
as
a lif
esty
le t
hat
incl
udes
onl
y th
e ph
ysic
al a
ctiv
ity
of in
depe
nden
t liv
ing.
Low
act
ive
is d
efin
ed a
s a
lifes
tyle
tha
t in
clud
es a
phy
sica
l act
ivit
y eq
uiva
lent
to
wal
king
abo
ut 1
.5 t
o 3
mile
s pe
r da
y at
3 t
o 4
mile
s pe
r ho
ur, i
n ad
diti
on t
o th
eac
tivi
ties
of
inde
pend
ent
livin
g. A
ctiv
e is
def
ined
as
a lif
esty
le t
hat
incl
udes
a p
hysi
cal a
ctiv
ity
equi
vale
nt t
o w
alki
ng m
ore
than
3 m
iles
daily
at
3 to
4 m
iles
per
hour
, in
addi
tion
to
the
acti
viti
es o
f in
depe
nden
t liv
ing.
Tar
get
patt
erns
are
the
ene
rgy
leve
ls a
ssig
ned
to e
ach
age
and
gend
er g
roup
tha
tar
e us
ed t
o de
term
ine
the
nutr
ient
ade
quac
y of
the
foo
d gu
idan
ce s
yste
m d
aily
foo
d in
take
pat
tern
s fo
r ea
ch g
roup
. One
tar
get
patt
ern
is s
et f
or e
ach
age
and
gend
er g
roup
, and
is a
ppro
pria
te f
or m
ost
sede
ntar
y in
divi
dual
s in
the
gro
up, b
ased
on
the
calc
ulat
ed E
ER
. For
chi
ldre
n ag
es 9
to
13, e
nerg
yle
vels
for
the
tar
get
patt
erns
wer
e se
lect
ed a
t th
e hi
gher
end
of
the
age
rang
e to
allo
w f
or g
row
th s
purt
s du
ring
thi
s pe
riod
. Sug
gest
ed p
atte
rns
are
the
food
gui
danc
e sy
stem
dai
ly f
ood
inta
ke p
atte
rns
that
are
gen
eral
ly a
ppro
pria
te f
or l
ow a
ctiv
e or
act
ive
indi
vidu
als
for
each
age
and
gen
der
grou
p,ba
sed
on t
heir
EE
R.
The
se s
ugge
sted
pat
tern
s ar
e no
t us
ed t
o de
term
ine
nutr
itio
nal
adeq
uacy
of
the
patt
ern
but
to s
ugge
st a
ppro
pria
te f
ood
sele
ctio
ns f
or t
hose
req
uiri
ng m
ore
calo
ries
tha
n th
e ta
rget
pat
tern
s pr
ovid
e.SO
UR
CE
S: I
OM
(20
02–2
005)
; U
SDA
(20
03).
TA
BL
E D
-1C
onti
nued
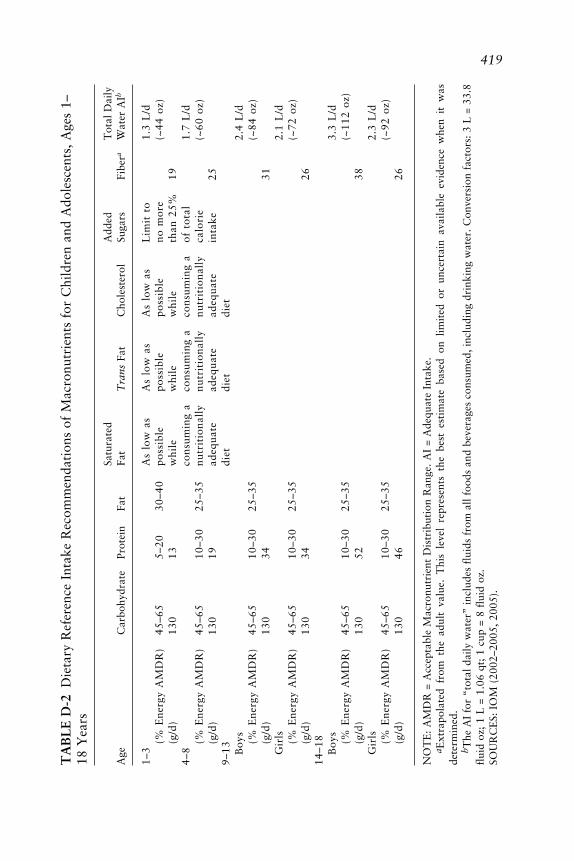
419T
AB
LE
D-2
Die
tary
Ref
eren
ce I
ntak
e R
ecom
men
dati
ons
of M
acro
nutr
ient
s fo
r C
hild
ren
and
Ado
lesc
ents
, A
ges
1–18
Yea
rs
Satu
rate
dA
dded
Tot
al D
aily
Age
Car
bohy
drat
ePr
otei
nFa
tFa
tT
rans
Fat
Cho
lest
erol
Suga
rsFi
bera
Wat
er A
Ib
1–3
As
low
as
As
low
as
As
low
as
Lim
it t
o1.
3 L
/d(%
Ene
rgy
AM
DR
)45
–65
5–20
30–4
0po
ssib
lepo
ssib
lepo
ssib
leno
mor
e(~
44 o
z)(g
/d)
130
13w
hile
whi
lew
hile
than
25%
194–
8co
nsum
ing
aco
nsum
ing
aco
nsum
ing
aof
tot
al1.
7 L
/d(%
Ene
rgy
AM
DR
)45
–65
10–3
025
–35
nutr
itio
nall
ynu
trit
iona
lly
nutr
itio
nall
yca
lori
e(~
60 o
z)(g
/d)
130
19ad
equa
tead
equa
tead
equa
tein
take
259–
13di
etdi
etdi
etB
oys
2.4
L/d
(% E
nerg
y A
MD
R)
45–6
510
–30
25–3
5(~
84 o
z)(g
/d)
130
3431
Gir
ls2.
1 L
/d(%
Ene
rgy
AM
DR
)45
–65
10–3
025
–35
(~72
oz)
(g/d
)13
034
2614
–18
Boy
s3.
3 L
/d(%
Ene
rgy
AM
DR
)45
–65
10–3
025
–35
(~11
2 oz
)(g
/d)
130
5238
Gir
ls2.
3 L
/d(%
Ene
rgy
AM
DR
)45
–65
10–3
025
–35
(~92
oz )
(g/d
)13
046
26
NO
TE
: A
MD
R =
Acc
epta
ble
Mac
ronu
trie
nt D
istr
ibut
ion
Ran
ge.
AI
= A
dequ
ate
Inta
ke.
a Ext
rapo
late
d fr
om t
he a
dult
val
ue.
Thi
s le
vel
repr
esen
ts t
he b
est
esti
mat
e ba
sed
on l
imit
ed o
r un
cert
ain
avai
labl
e ev
iden
ce w
hen
it w
asde
term
ined
.b T
he A
I fo
r “t
otal
dai
ly w
ater
” in
clud
es f
luid
s fr
om a
ll fo
ods
and
beve
rage
s co
nsum
ed, i
nclu
ding
dri
nkin
g w
ater
. Con
vers
ion
fact
ors:
3 L
= 3
3.8
flui
d oz
; 1
L =
1.0
6 qt
; 1
cup
= 8
flui
d oz
.SO
UR
CE
S: I
OM
(20
02–2
005,
200
5).

420
TA
BL
E D
-3D
ieta
ry R
efer
ence
Int
ake
Rec
omm
enda
tion
s of
Mic
ronu
trie
nts
for
U.S
. C
hild
ren
and
Ado
lesc
ents
, A
ges
1–18
Yea
rs Vit
amin
AV
itam
in C
Vit
amin
EV
itam
in B
6aFo
late
Caa,
bIr
onN
aaK
aM
gA
ge(µ
g/d)
(mg/
d)(m
g/d)
(mg/
d)( µ
g/d)
(mg/
d)(m
g/d)
(mg/
d)(m
g/d)
(mg/
d)
1–3
300
156
0.5
150
500
71,
000
3,00
080
4–8
400
257
0.6
200
800
101,
200
3,80
013
09–
13 Boy
s60
045
111.
030
01,
300
81,
500
4,50
024
0G
irls
600
4511
1.0
300
1,30
08
1,50
04,
500
240
14–1
8B
oys
900
7515
1.3
400
1,30
011
1,50
04,
700
410
Gir
ls70
065
151.
240
01,
300
151,
500
4,70
036
0
NO
TE
: B
oth
the
Rec
omm
ende
d D
ieta
ry A
llow
ance
s (R
DA
s) a
nd A
dequ
ate
Inta
kes
(AIs
) m
ay b
e us
ed a
s go
als
for
indi
vidu
al i
ntak
e. R
DA
s ar
ees
tabl
ishe
d to
mee
t th
e ne
eds
of n
earl
y al
l in
divi
dual
s (9
7–98
perc
ent)
in
a gr
oup.
The
AI
for
life
stag
es a
nd g
ende
r gr
oups
oth
er t
han
brea
stfe
din
fant
s is
bel
ieve
d to
cov
er t
he n
eeds
of
all
indi
vidu
als
in a
gro
up.
How
ever
, la
ck o
f da
ta o
r un
cert
aint
y in
the
dat
a pr
eclu
de b
eing
abl
e to
spe
cify
wit
h co
nfid
ence
the
per
cent
age
of i
ndiv
idua
ls c
over
ed b
y th
is i
ntak
e.a I
ndic
ates
an
AI
sinc
e an
RD
A v
alue
cou
ld n
ot b
e de
term
ined
.b E
xtra
pola
ted
from
the
adu
lt v
alue
. T
his
leve
l re
pres
ents
the
bes
t es
tim
ate
base
d on
lim
ited
or
unce
rtai
n av
aila
ble
evid
ence
whe
n it
was
dete
rmin
ed.
SOU
RC
ES:
IO
M (
1997
, 19
98,
2000
, 20
01,
2005
).

APPENDIX D 421
TABLE D-4 Survey of National Dietary Data for U.S. Individuals, 1971–2000
Sample Dietary IntakeSurvey Dates Population Size Methodology
NHANES I 1971– Ages 1–74 years; oversampling 20,749a Single 24-hour1974 of women of childbearing age, dietary recall, no
ages 5 and younger, adults weekend intakesages 60–74, and persons withincome below poverty
NHANES II 1976– Ages 6 months–74 years; 20,322a Single 24-hour1980 oversampling of children ages dietary recall, no
5 years and younger, adults weekend intakesages 60–74 years, and personswith income below poverty
NFCS 1977– All ages; oversampling of low 30,467c Three consecutive1978 incomeb and elderly; 48 states days (single 24-hour
dietary recall and2-day food record)
NHANES III 1988– Ages 2 months and older; 31,311a Single 24-hour1994 oversampling of Mexican dietary recall and
Americans, African Americans, 3-month foodages 2 months–5 years, and frequencyages 60 years and older questionnaire;
second 24-hourrecall on asubsample (~5%)
CSFII 1989– All ages; oversampling of 15,192c Two nonconsecutive1991 low incomeb; 48 states 24-hour dietary
recalls
CSFII 1994– All ages; oversampling of low 15,968c; Two nonconsecutive1996, income; ages 0–9 years; 5,559c 24-hour dietary1998d 50 states recalls
NHANES 1999– All ages; oversampling of 8,604c Single 24-hour2000e Mexican Americans, African dietary recall, and
Americans, ages 12–19 years, second recall on aages 60 years and older, subsample (~10%)pregnant women, and lowincomeb
NOTE: NHANES = National Health and Nutrition Examination Survey. NFCS = National Food Con-sumption Survey. CSFII = Continuing Survey of Food Intakes by Individuals. IU = International Units.
aExamined persons.bLow income is defined as household income at or below 130 percent of the poverty line, the income
cut-off level for eligibility for the Food Stamp Program.cPersons with 1-day intakes.dSupplemental sample of children ages 0–9 years added to the CSFII 1994–1996.eNHANES started a continuous data collection beginning in 1999. The most recent data were available
for 1999–2000. CSFII is now incorporated into NHANES.SOURCE: Adapted from Briefel and Johnson (2004). Reprinted with permission.

422 FOOD MARKETING TO CHILDREN AND YOUTH
TABLE D-5 Mean Intakes and Changesa or Trendsb in Intakes ofSelected Nutrients of Girls and Boys, Ages 6–11 Years and 12–19 Years,as Reported in CSFII 1994–1996, 1998 and Compared to NFCS 1977–1978 and CSFII 1989–1991
Girls Girls Boys BoysNutrient 6–11 yrs 12–19 yrs 6–11 yrs 12–19 yrs
Energy (kcal) 1,825 1,910 2,050 2,766 ↑Protein (% kcal) 13.9 ↓ 14.0 ↓ 14.0 ↓* 14.4 ↓Fat (% kcal) 32.6 ↓* 32.2 ↓* 32.6 ↓** 33.1 ↓**Saturated fat (% kcal)c 12 11 12 12Carbohydrate (% kcal) 54.9 ↑** 55.0 ↑** 54.8 ↑** 53.2 ↑**Fiber (g)c 12 13 14 17Vitamin A (IU) 4,475 4,817 5,242 6,361Vitamin C (mg) 95 95 103 ↑ 119Thiamin (mg) 1.48 ↑ 1.44 ↑ 1.77 ↑* 2.13 ↑Riboflavin (mg) 1.91 1.75 2.28 ↑ 2.58Niacin (mg) 18.1 19.0 ↑ 21.5 ↑ 27.8 ↑*Vitamin B6 (mg) 1.52 1.53 ↑ 1.84 ↑ 2.21 ↑Vitamin B12 (µg) 3.87 ↓* 3.80 ↓ 4.53 ↓ 5.85 ↓Calcium 865 771 984 1,145Phosphorous (mg) 1,138 1,108 1,292 1,633Magnesium (mg) 219 223 249 311Iron (mg) 13.8 ↑ 13.8 ↑** 16.6 ↑** 19.8 ↑*
NOTE: CSFII = Continuing Survey of Food Intakes by Individuals. NFCS = National Food ConsumptionSurvey. IU = International Units.
aSignificant increase (↑) or decrease (↓) in mean intakes (or percentages) between 1977–1978 and 1994–1996, 1998 (p < 0.001).
bSignificant, progressive rise or fall in mean intakes (or percentages) from 1977–1978through 1989–1991 to 1994–1996, 1998; *p < 0.05, **p < 0.01.
cData from 1977–1978 and 1989–1991 are not provided.SOURCES: Adapted from Enns et al. (2002, 2003).

APPENDIX D 423
TABLE D-6 Food Sources of Energy Among U.S. Children andAdolescents, Ages 2–18 Years (CSFII 1989–1991)
Girls Girls Girlsand Boys and Boys and Boys Boys Girls2–18 2–5 6–11 12–18 12–18
Rank Food Group Years Years Years Years Years
% Energy
1 Milk 11.7 15.4 12.4 9.5 8.82 Yeast bread 9.3 8.7 9.1 9.8 9.73 Cakes/cookies/quick
breads/donuts 6.2 5.8 6.4 6.3 6.04 Beef 5.7 4.3 5.4 7.0 6.45 Ready-to-eat cereal 4.5 5.3 4.8 4.1 3.36 Carbonated soft drinks 4.3 2.5 3.2 6.1 6.37 Cheese 3.7 3.3 3.4 3.8 4.48 Potato chips/corn chips/
popcorn 3.1 2.0 2.9 3.3 4.69 Sugars/syrups/jams 3.0 2.6 3.3 3.0 2.9
10 Poultry 2.6 2.8 2.4 2.5 3.2
% Carbohydrate
1 Yeast bread 13.0 12.1 12.7 14.0 13.72 Carbonated soft drinks 8.5 4.9 6.1 12.3 12.33 Milk 7.9 10.2 8.2 6.6 6.14 Ready-to-eat cereal 7.4 8.6 7.9 6.9 5.55 Cakes/cookies/quick
breads/donuts 7.2 6.6 7.4 7.4 7.16 Sugars/syrups/jams 6.0 5.1 6.5 6.1 5.87 Fruit drinks 4.3 5.4 4.4 3.5 3.98 Pasta 3.9 4.4 4.0 3.2 4.19 White potatoes 3.7 3.0 3.8 4.0 4.0
10 Orange/grapefruit juice 2.9 3.0 2.5 3.1 3.5
% Fat
1 Milk 13.8 19.0 15.0 10.7 10.32 Beef 9.7 7.3 9.1 11.7 10.63 Cheese 7.4 7.1 7.0 7.4 8.84 Margarine 6.8 7.5 6.7 7.0 6.05 Cakes/cookies/quick
breads/donuts 6.6 6.4 6.8 6.7 6.26 Potato chips/corn chips/
popcorn 4.9 3.4 4.5 5.1 7.37 Salad dressings/mayonnaise 4.3 2.6 3.7 5.3 6.18 Oils 4.2 3.7 4.3 4.2 4.39 Yeast bread 3.8 3.6 3.8 3.9 3.9
10 Other fats 3.5 2.8 3.5 3.6 4.1
SOURCE: Subar et al. (1998). Reproduced by permission of Pediatrics 102(4 Pt 1):913–923,©1989–1991.

424 FOOD MARKETING TO CHILDREN AND YOUTH
TABLE D-7 Top 10 Foods and Beverages Contributing to Energy Intakein the U.S. Population, NHANES 1999–2000 and NHANES IIIa
% Total Cumulative %Rank Food Energy Total Energy
NHANES 1999–20001 Regular soft drinks 7.1 7.12 Cake, sweet rolls, doughnuts, pastries 3.6 10.63 Hamburgers, cheeseburgers, meat loaf 3.1 13.84 Pizza 3.1 16.85 Potato chips, corn chips, popcorn 2.9 19.76 Rice 2.7 22.47 Rolls, buns, English muffins, bagels 2.7 25.08 Cheese or cheese spread 2.6 27.69 Beer 2.6 30.2
10 French fries, fried potatoes 2.2 32.4
NHANES III 1988–19941 Regular soft drinks 6.0 6.02 Cake, sweet rolls, donuts, pastries 3.9 9.93 Pizza 3.3 13.24 White bread including Italian or French 3.3 16.55 Hamburgers, cheeseburgers, meatloaf 3.1 19.66 Beer 2.7 22.37 Rolls, buns, English muffins, bagels 2.6 24.98 Potato chips, corn chips, popcorn 2.6 27.59 Rice 2.3 29.8
10 French fries, fried potatoes 2.3 32.1
aIncludes both adults and children of both sexes.SOURCE: Adapted from Block (2004). Reprinted from Journal of Food Composition andAnalysis, Vol 17, Block G, Foods contributing to energy intake in the US: Data from NHANESII and NHANES 1999–2000, Pages 439–447, 2004, with permission from Elsevier.

APPENDIX D 425
TABLE D-8 Mean Sodium Intake (mg) for U.S. Children andAdolescents, 1971–2000a
Age/Sex NHANES I NHANES II NHANES III NHANESYears 1971–1974 1976–1980 1988–1994 1999–2000
Both Sexes1–2 1,631 1,828 1,983 2,1483–5 1,925 2,173 2,594 2,5276–11 2,393 2,716 3,164 3,255
Boys12–15 2,923 3,405 4,240 3,85816–19 3,219 4,030 4,904 4,415
Girls12–15 2,094 2,567 3,200 3,03416–19 1,812 2,336 3,160 3,048
aIncludes food sources and sodium used in food preparation but not salt added tofood at the table.SOURCE: Reprinted, with permission, adapted from Briefel and Johnson (2004).
TABLE D-9 Trends in Sweetened Beverage and Milk Consumption byChildren and Adolescents, Ages 2–18 Years
SweetenedMeasurement Years Beveragesa Milk
Percentage of total daily calorie intakeb 1977–1978 4.8 13.21989–1991 6.1 11.21994–1996 8.5 8.81999–2001 10.3 8.3
Percentage of consumers 1977–1978 74.5 94.31989–1991 74.2 90.31994–1996 84.7 84.6
Servingsc 1977–1978 2.02 3.461989–1991 2.2 2.891994–1996 2.55 2.75
Portionsd (fluid ounces) 1977–1978 13.1 15.41989–1991 15.8 14.11994–1996 18.9 13.6
aIncludes soft drinks and fruit drinks.bBased on mean per capita intake.cServings are the number of discrete times an individual consumes an item.dPortions are the amount consumed by an individual at one eating occasion.
SOURCE: Adapted from Nielsen and Popkin (2004). Reprinted from American Journal ofPreventive Medicine, Vol 27, Nielsen SJ, Popkin BM, Changes in beverage intake between1997 and 2001, Pages 205–210, 2004, with permission from American Journal of PreventiveMedicine.

426 FOOD MARKETING TO CHILDREN AND YOUTH
REFERENCES
Block G. 2004. Foods contributing to energy intake in the US: Data from NHANES III andNHANES 1999–2000. J Food Comp Analysis 17(3-4):439–447.
Briefel RR, Johnson CL. 2004. Secular trends in dietary intake in the United States. Annu RevNutr 24:401–431.
Enns CW, Mickle SJ, Goldman JD. 2002. Trends in food and nutrient intakes by children inthe United States. Fam Econ Nutr Rev 14(2):56–68.
Enns CW, Mickle SJ, Goldman JD. 2003. Trends in food and nutrient intakes by adolescentsin the United States. Fam Econ Nutr Rev 15(2):15–27.
IOM (Institute of Medicine). 1997. Dietary Reference Intakes for Calcium, Phosphorus,Magnesium, Vitamin D, and Fluoride. Washington, DC: National Academy Press.
IOM. 1998. Dietary Reference Intakes for Thiamin, Riboflavin, Niacin, Vitamin B6, Folate,Vitamin B12, Pantothenic Acid, Biotin, and Choline. Washington, DC: National Acad-emy Press.
IOM. 2000. Dietary Reference Intakes for Vitamin C, Vitamin E, Selenium and Catotenoids.Washington, DC: National Academy Press.
IOM. 2001. Dietary Reference Intakes for Vitamin A, Vitamin K, Arsenic, Boron, Chro-mium, Copper, Iodine, Iron, Manganese, Molybdenum, Nickel, Silicon, Vanadium, andZinc. Washington, DC: National Academy Press.
IOM. 2002–2005. Dietary Reference Intakes for Energy, Carbohydrate, Fiber, Fat, FattyAcids, Cholesterol, Protein, and Amino Acids. Washington, DC: The National Acad-emies Press.
IOM. 2005. Dietary Reference Intakes for Water, Potassium, Sodium, Chloride, and Sulfate.Washington, DC: The National Academies Press.
Nielsen SJ, Popkin BM. 2004. Changes in beverage intake between 1997 and 2001. Am JPrev Med 27(3):205–210.
Subar AF, Krebs-Smith SM, Cook A, Kahle LL. 1998. Dietary sources of nutrients among USchildren, 1989–1991. Pediatrics 102(4 Pt 1):913–923.
USDA. 2003. Federal Register Notice on Technical Revisions to the Food Guide Pyramid.Table 2: Energy Levels for Proposed Food Intake Patterns. Center for Nutrition Policyand Promotion. [Online]. Available: http://www.cnpp.usda.gov/pyramid-update/FGP%20docs/TABLE%202.pdf [accessed March 28, 2005].

427
E
Chapter 4 Appendix
This table represents examples of selected marketing research firms andmarketing reports that the committee considered through its data-gatheringprocess.
TABLE E-1 Marketing Research Conducted on U.S. Children and Youth
Sources Report Description
Children’s Marketing TeenTrends™, Examined the interests and behavior ofServices (2004a) 2004 tweens and teens ages 12–18 years.
A personal interview was conducted for300 teens.
Children’s Marketing KidTrends2004™, Examined the interests and behavior ofServices (2004b) 2004 older children ages 6–11 years. A personal
interview was conducted for 300 olderchildren.
Harris Interactive Youth Pulse, 2004 Examined the interests and behavior of(2004) older children and teens ages 8–21 years
through a large-scale study of youthlifestyles and attitudes via an onlinequestionnaire.
continues

428 FOOD MARKETING TO CHILDREN AND YOUTH
Just Kid Inc., The Global Kids Surveyed 400 children ages 7–12 years andNickelodeon, and Study, 1996 and their mothers in 12 countries: the UnitedResearch 1998 States, United Kingdom, France, Germany,International (Friend Japan, China, Australia, India, Italy,and Stapylton-Smith, Argentina, Brazil, and Mexico. An1999) interview and questionnaire were used that
provided a detailed picture of theattitudes, beliefs, and consumer dynamicsof children and tweens.
Just Kid Inc. (2001) Kid ID Study, Surveyed 4,000 children ages 8–14 years in2001 schools to examine the emotional,
psychological, and social forces that drivetheir behaviors.
Kidsay (2005) Trend Tracker, Examines the interests and behaviors ofconducted tweens and young teens ages 8–15 years.bimonthly
KidShop/KidzEyes Kid Food Examined the product brand, food(2003) Findings. category, and restaurant preferences of
Brand New 629 tweens ages 8–12 years.Research
Mediamark Research Teen Study Collects data about media exposure by(2005) (Teenmark), more than 4,000 teens ages 12–19 years
conducted through a mailed questionnaire.annually
Mintel International Kids’ and Teens’ Examined eating habits of children agesGroup Ltd. (2004) Eating Habits 6–11 and 12–17 years based on the
U.S., 2004 Simmons Kids and Teens surveys.
Mintel International Kids’ Snacking Examined snacking trends of children agesGroup Ltd. (2003a) U.S., 2003 6–8 and 9–11 years based on a variety of
surveys, including the Simmons KidsStudy.
Mintel International Kids’ Lifestyles Examined the lifestyle trends and attitudesGroup Ltd. (2003b) U.S., 2003 of children ages 6–11 years.
Porter Novelli Combined Provided parent–child dyads of(2004) YouthStyles information to develop understanding
Survey and about the contexts in which youth act andHealthStyles live. The YouthStyles Survey examinedSurvey children’s values, goals, and motivations
combined with behavioral data through amail survey of an estimated 8,000 childrenand youth ages 10–19 years. Provided acombination of behavioral, motivational,and communication data.
TABLE E-1 Continued
Sources Report Description

APPENDIX E 429
Roper Youth Report Roper Youth Examined the purchasing power of young(2003) Report consumers ages 8–17 years. The report is
based on 500 in-depth, personal interviewsof a nationally representative sample ofthe U.S. tween and teen population.
Simmons (2005a) Simmons Kids Examines the media, consumer, andStudy, conducted personal behaviors that drive thetwice annually purchasing decisions of children ages
6–11 years.
Simmons (2005b) Simmons Teens Examines the media, consumer, andStudy, conducted personal behaviors that drive thetwice annually purchasing decisions of 5,000 teens ages
12–17 years based on in-home interviewsand mail surveys.
Simmons (2005c) Simmons Tweenz Examines the media, consumer, andStudy, conducted personal behaviors that drive thetwice annually purchasing decisions of 5,000 tweens ages
8–14 years based on in-home interviewsand mail surveys.
Simmons (2005d) Simmons Youth Examines the information of media,Study, conducted consumer, and personal behaviors thattwice annually drive the purchasing decisions of children
and youth ages 6–17 years.
Strottman Nutrition from a Conducted brand-specific marketingInternational (2005) Kid’s Perspective research for clients from the food,
beverage, and restaurant industries.
Teenage Research TRU Teenage Examined the spending power of 2,000Unlimited (2004) Marketing and teens ages 12–19 years based on mail
Lifestyle Study, questionnaire.2004
The Geppetto Group Case studies of A child and teen advertising agency and(2005) market research marketing consulting company that
conducted for conducts research for clients about thefood and beverage motivations of childhood, kid archetypes,companies psyche of mothers as the family
gatekeeper, understanding tweens’ andteens’ perspectives and lifestyles.
The Intelligence Nickelodeon/ Examined the lifestyles of tweens and teensGroup/Youth Youth Intelligence ages 9–14 years including snacking andIntelligence (2005) Tween Report, lifestyle habits.
2004
TABLE E-1 Continued
Sources Report Description
continues

430 FOOD MARKETING TO CHILDREN AND YOUTH
The NPD Group Snacking in Examined the snacking behaviors of(2004) America Report, 10,000–12,000 children, teens, and adults
2004 from 1997–2003.
Yankelovich (2003) Youth Monitor™, Examines the trends and information onconducted media, brands, goals, technology, family,annually and self-image of 1,200 children ages
6–17 years through in-home personalinterviews.
Yankelovich (2005) Preschool Study Surveyed a nationally representativesample of 650 parents and guardians ofchildren ages 2–5 years to provide insightsinto the attitudes, concerns, andexpectations of parents of preschoolers;healthy eating patterns; shopping habits;children’s preferences; children’s dailyactivities; developmental issues; andtelevision viewing.
Zandl Group (2005) Hot Sheet Examined the attitudes, interests,entertainment, and product preferences of3,000 children, youth, and young adultsages 8–24 years based on open-endedquestionnaires.
TABLE E-1 Continued
Sources Report Description

APPENDIX E 431
TABLE E-2 New Food and Beverage Products Targeted to Children andAdolescents by Company, Manufacturer, or Distributor, 1994–2004
Company / Manufacturer / Distributor Number of New Food Products
General Mills 166Philip Morris 138Kellogg Company 132Nestlé S.A. 105Wrigley 73Unilever 65Hasbro 60Mars 56ConAgra 53Altria Group 52Campbell Soup Company 44Quaker Oats 42Topps 40OddzOn 38Foreign Candy Company 36Hershey Foods 36Imaginings 3 34PepsiCo 29Felfoldi Potpourri Ltd. 27RJR Nabisco 27Philadelphia Chewing Gum Corp. 26
Company / Manufacturer / Distributor Number of New Beverage Products
The Coca-Cola Company 37Philip Morris 30Nestlé S.A. 24In Zone Brands 18Cadbury Schweppes 15Altria Group 12PepsiCo 12Danone 9In Zone Brands 8J. M. Smucker 8
SOURCE: Williams (2005b).

432
TA
BL
E E
-3Se
lect
ed L
eadi
ng C
ompa
nies
Ran
ked
by T
otal
U.S
. R
even
ues
and
Tot
al A
dver
tisi
ng S
pend
ing,
200
4 an
d20
03
Tot
al U
.S.
Rev
enue
sT
otal
U.S
. R
even
ues
Tot
al A
dver
tisi
ngT
otal
Adv
erti
sing
($ m
illio
ns)
($ m
illio
ns)
Spen
ding
Spen
ding
Com
pany
Hea
dqua
rter
s20
0420
03($
mill
ions
) 20
04($
mill
ions
) 20
03
Ent
erta
inm
ent/
Med
iaT
ime
War
ner
New
Yor
k, N
Y33
,572
32,1
233,
283
3,07
3W
alt
Dis
ney
Bur
bank
, C
A24
,012
22,1
242,
241
2,03
6V
iaco
mN
ew Y
ork,
NY
18,8
1217
,488
1,20
71,
151
Food
and
Bev
erag
eA
ltri
a G
roup
a
Kra
ft F
oods
New
Yor
k, N
Y39
,966
38,3
701,
399
1,38
6G
lenv
iew
, IL
Peps
iCo
Purc
hase
, N
Y18
,329
17,3
771,
262
1,21
1G
ene r
al M
ills
Min
neap
olis
, M
N9,
441
9,14
491
395
4K
e llo
gg C
ompa
nyB
attl
e C
ree k
, M
I5,
968
5,60
864
757
7T
he C
oca-
Col
a C
ompa
nyA
tlan
ta,
GA
6,64
36,
344
541
447
Cam
pbe l
l So
up C
ompa
nyC
amde
n, N
J4,
581
4,54
942
543
0C
onA
gra
Om
aha,
NE
13,2
2215
,439
364
561
Food
Re t
ail
Kro
ger
Com
pany
Cin
c inn
ati,
OH
56,4
34b
53,7
91b
686
655
Safe
way
Ple a
sant
on,
CA
31,4
6331
,679
606
536

433Fa
st F
ood/
Qui
ck S
erve
Res
taur
ant
McD
onal
d’s
Cor
pora
tion
Oak
Bro
ok,
IL6,
525c
6,03
9c1,
389
1,37
0Y
um!
Bra
nds
Lou
isvi
lle,
KY
5,76
35,
655
779
753
Bur
ger
Kin
g C
orpo
rati
onM
iam
i, F
L7,
710
7,90
054
252
6W
endy
’s I
nter
nati
onal
Dub
lin,
OH
2,47
52,
197
436
387
NO
TE
: T
he m
ajor
ity
of m
edia
and
spe
ndin
g ca
tego
ries
are
mon
itor
ed b
y T
NS
Med
ia I
ntel
ligen
ce,
form
erly
TN
S M
edia
/Com
peti
tive
Med
iaR
epor
ting
(T
NS
Med
ia I
ntel
ligen
ce,
2005
), a
nd c
erta
in m
easu
red
med
ia c
ateg
orie
s, s
uch
as t
elev
isio
n an
d In
tern
et a
dver
tisi
ng s
pend
ing
and
impr
essi
ons,
are
tra
cked
by
Nie
lsen
Med
ia R
esea
rch
and
Nie
lsen
//Net
Rat
ings
. U
nmea
sure
d m
edia
exp
endi
ture
s ar
e no
t sh
own
in t
he t
able
.a T
he A
ltri
a G
roup
is
the
pare
nt c
ompa
ny f
or K
raft
Foo
ds a
nd i
s se
para
ted
into
tw
o sa
les
divi
sion
s—fo
od a
nd t
obac
co.
In 2
004,
tot
al c
ombi
ned
Nor
th A
mer
ica
sale
s an
d ea
rnin
gs w
ere
$39.
9 bi
llion
. Tot
al d
ivis
ion
sale
s w
orld
wid
e w
ere
$89.
6 bi
llion
rep
rese
ntin
g ap
prox
imat
ely
$32.
2 bi
llion
info
od s
ales
and
$57
bill
ion
in t
obac
co s
ales
. The
com
pany
’s b
rand
s re
pres
ent
five
con
sum
er s
ecto
rs: s
nack
s, b
ever
ages
, che
ese
and
dair
y, g
roce
ry, a
ndco
nven
ienc
e m
eals
(B
row
n et
al.,
2004
, 20
05;
Kra
ft F
oods
, 20
04).
b U.S
. sa
les
not
avai
labl
e. T
his
figu
re r
epre
sent
s to
tal
wor
ldw
ide
sale
s.c M
cDon
ald’
s C
orpo
rati
on w
orld
wid
e sa
les
in 2
004
tota
led
$24.
4 bi
llion
(B
rand
Wee
k, 2
005)
.SO
UR
CE
S: A
dapt
ed f
rom
Bro
wn
etal
. (2
004,
200
5).
Rep
rint
ed w
ith
perm
issi
on f
rom
the
Jun
e 27
, 20
05 i
ssue
of
Adv
erti
sing
Age
. ©
Cra
inC
omm
unic
atio
ns,
Inc.
, 20
05.

434 FOOD MARKETING TO CHILDREN AND YOUTH
REFERENCES
BrandWeek. 2005. A Special Report: Superbrands. Plus: America’s Top 2000 Brands. [On-line]. Available: http://www.brandweek.com [accessed August 8, 2005].
Brown K, Endicott RC, Macdonald S, Schumann M, Macarthur G, Sierra J, Matheny L,Green A, Ryan M. 2004. 100 leading national advertisers. Advertising Age June 28.Pp.1–83.
Brown K, Endicott RC, Macdonald S, Schumann M, Macarthur G, Sierra J, Matheny L,Green A, Ryan M. 2005. 50th annual 100 leading national advertisers. Advertising AgeJune 27. Pp.1–84. [Online]. Available: http://www.adage.com/images/random/lna2005.pdf [accessed September 16, 2005].
Children’s Marketing Services. 2004a. TeenTrends™. [Online]. Available: http://www.kidtrends.com/new/reports.html [accessed May 3, 2005].
Children’s Marketing Services. 2004b. KidTrends™. [Online]. Available: http://www.kidtrends.com/new/reports.html [accessed May 3, 2005].
Friend B, Stapylton-Smith M. 1999. Through the Eyes of Children. Presentation at theESOMAR Marketing in Latin America Conference. Santiago, Chile. April 1999.
Harris Interactive. 2004. Youth Pulse. [Online]. Available: http://www.harrisinteractive.com/expertise/youthpulse.asp [accessed May 3, 2005].
Just Kid Inc. 2001. Kid ID Study. [Online]. Available: http://www.justkidinc.com/whatwedo.html [accessed May 13, 2005].
Kidsay. 2005. Trend Tracker: Lifestyles of the Young and Influential. [Online]. Available:http://www.kidsay.com/html/tracker/get_tracker_body.html [accessed September 17,2005].
KidShop/KidzEyes. 2003. Kid Food Findings. Brand New Research. [Online]. Available:http://www.kidshopbiz.com/ [accessed October 3, 2005].
Kraft Foods. 2004. Form 10-K Annual Report for the Fiscal Year Ended December 31, 2004.[Online]. Available: http://kraft.com/pdfs/KraftAR04_10K.pdf [accessed June 6, 2005].
Mediamark Research. 2005. Teen Study (Teenmark). [Online]. Available: http://www.mediamark.com/mri/techguide/fall2004/tg_tm04.htm [accessed May 3, 2005].
Mintel International Group Ltd. 2003a. Kids’ Snacking US, 2003. [Online]. Available: http://reports.mintel.com/sinatra/mintel/searchexec/type=reports&variants=true&fulltext=kids+snacking/report/repcode=0093&anchor=noaccess0093/ [accessed May 3, 2005].
Mintel International Group Ltd. 2003b. Kids’ Lifestyles US, 2003. [Online]. Available: http://reports.mintel.com/sinatra/mintel/searchexec/type=reports&variants=true&fulltext=kids+lifestyles/report/repcode=2915&anchor=noaccess2915/ [accessed May 3, 2005].
Mintel International Group Ltd. 2004. Kids’ and Teens’ Eating Habits US, 2004. [Online].Available: http://reports.mintel.com/sinatra/mintel/searchexec/type=reports&variants=true&fulltext=kids+and+teens+eating+habits/report/repcode=0240&anchor=noaccess0240/ [accessed May 3, 2005].
Porter Novelli. 2004. YouthStyles and HealthStyles. [Online]. Available: http://pn2.porternovelli.com/services/research/styles/ [accessed September 17, 2005].
Roper Youth Report. 2003. Roper Youth Report. American Youth Wielding More House-hold Buying Power. [Online]. Available: http://www.nopworld.com/news.asp?go=news_item&key=59/ [accessed April 11, 2005].
Simmons. 2005a. Simmons Kids Study. [Online]. Available: http://www.smrb.com/products_kids.html [accessed May 3, 2005].
Simmons. 2005b. Simmons Teens Study. [Online]. Available: http://www.smrb.com/products_teens.html [accessed May 3, 2005].
Simmons. 2005c. Simmons Tweenz Study. [Online]. Available: http://www.smrb.com/products_tweenz.html [accessed May 3, 2005].

APPENDIX E 435
Simmons. 2005d. Simmons Youth Study. [Online]. Available: http://www.smrb.com/products_youth.html [accessed May 3, 2005].
Strottman International. 2005. Nutrition from a Kid’s Perspective. Findings, Implications,and Applications. Presentation to the IOM Committee on Food Marketing and the Dietsof Children and Youth. March 22.
Teenage Research Unlimited. 2004. The TRU Study. [Online]. Available: http://www.teenresearch.com/PRview.cfm?edit_id=168 [accessed May 3, 2005].
The Geppetto Group. 2005. [Online]. Available: http://www.geppettogroup.com/TheGeppettoGroup5b.swf [accessed September 17, 2005].
The Intelligence Group/Youth Intelligence. 2005. Nickelodeon/Youth Intelligence Tween Re-port 2004. [Online]. Available: http://www.youthintelligence.com/cassandra/cassarticle.asp?cassArticleId=3 [accessed September 16, 2005].
The NPD Group. 2004. Snacking in America Report. Press release. January 28. [Online].Available: http://www.npd.com/press/releases/press_040128a.htm [accessed September15, 2005].
TNS Media Intelligence. 2005. Delivering Information at Its Best. [Online]. Available: http://www.tns-mi.com [accessed April 30, 2005].
Yankelovich. 2003. Youth Monitor™. Youth Today: Shaping Tomorrow. Chapel Hill, NC:Yankelovich Partners, Inc.
Yankelovich. 2005. Youth Monitor™. [Online]. Available: http://www.yankelovich.com/prod-ucts/youth2005_ps.pdf [accessed May 3, 2005].
Williams J. 2005b. Product Proliferation Analysis for New Food and Beverage ProductsTargeted to Children 1994–2004. University of Texas at Austin Working Paper.
Zandl Group. 2005. Hot Sheet. [Online]. Available: http://www.zandlgroup.com/hot_sheet.shtml [accessed May 3, 2005].

436
F-1
Evidence Table Codebook
Each research study included in the systematic evidence review was codedon several descriptive and evaluative dimensions. Text description and com-mentary was also provided. This Codebook was used by each coder toensure consistency in the information and judgments entered into the Evi-dence Table. Anything in bold should be entered exactly as described sothat information on that variable can be sorted later.
Reference: Author Name(s)Enter the last name(s) of the author(s) in order. If two authors, enter
both last names separated by a comma. If more than two authors, use“et al.” after the last name of the first author.
Reference: YearEnter the publication year; use all four digits for the year.
Link Number (#)Enter the number of the link (relationship) that is being studied: 1 if the
relationship is between marketing and a precursor (mediator) to diet, 3 ifthe relationship is between marketing and diet, and 5 if the relationship isbetween marketing and diet-related health. If the study has information orsub-studies about more than one link, make each link a separate line in theEvidence Table.
For studies in which television viewing was measured and interpretedas an indicator of exposure to televised advertising, add TV after the linknumber.
APPENDIX F 437
Link? Y/NEnter Y (yes) if the link is significant at p equal to or less than .05; enter
N (no) otherwise. For studies with statistical tests of more than one mea-sure of the cause and/or effect or with statistical tests of various subgroups(e.g., boys and girls)—all for the same link—enter Y if any of the tests weresignificant and describe them all in the abstract. If none are significant,enter N.
Research MethodEnter one of the following six abbreviations (in parentheses). See the
definitions that follow the terms.• Natural experiment (Exp-N)• Randomized trial (Exp)• Panel (L-Pnl)• Cohort (L-Coh)• Trend (L-Trnd)• Cross-sectional (CS)
Experimental Studies• Natural experiment (Exp-N): Treatment assigned serendipitously
but randomly. For example, in the early 1990s in the MilwaukeeSchool Voucher program, there were more students who appliedfor school vouchers than vouchers available. All applicants wereentered in a lottery, with only the winners getting vouchers.
• Randomized trial (Exp): Treatment assigned deliberately and ran-domly.
Nonexperimental (Observational) StudiesLongitudinal Studies:
• Panel (L-Pnl): Measures the same sample of individuals at differentpoints in time.
• Cohort (L-Coh): Similar subjects (age, demographics, etc.) are fol-lowed over time and compared on outcome or descriptive measures(e.g., health). Cohort studies typically involve a sample in whichsome individuals have a property and some do not (e.g., smokersversus nonsmokers).
• Trend (L-Trnd): Samples different groups of people at differentpoints in time from the same population, using the same measures.
Cross-Sectional Studies:• Cross-sectional (CS): Nonexperimental study at a single point in
time.
Cause VariableBriefly describe the marketing variable considered the causal (initiating,

438 FOOD MARKETING TO CHILDREN AND YOUTH
independent) variable in the research. To describe it, use short, simple termssuch as “vending machines in school,” “exposure to food ads,” and “televi-sion viewing.” If there are multiple cause variables, all for the same linknumber, describe them all. Do not create separate lines for each variable. Ifsome are significant and some are not (again all testing the same link in themodel), enter Y in the link-significant column and describe all of the p-values for all the cause variables (testing the same link) in the mini-abstract.Do not describe the specifics of how the variable was measured.
In this column, to the extent possible, use a very short, general descrip-tor, closely tied to (if not the same as) one of the terms in the initiatingvariable box for the link in the Conceptual Framework that is being studied.
Cause Variable MeasureDescribe the way(s) in which the independent variable was measured
(for a nonexperimental study) or implemented in treatment conditions (forexperimental study). Do so only for the link identified in this line of theEvidence Table. As examples, measurement techniques could be “self-report questionnaire,” “parent interview,” “sound-activated videotaping inrooms with television sets,” or “ads taken from cable stations and insertedinto cartoons taken from similar cable stations.”
Cause Variable CategoryBased on a description of the cause variable and how it was measured,
determine which of the following possible categories best describes it. Ifmore than one cause variable (with the same link) or more than one mea-sure of the same cause were used, choose the best description for each.
• TV ads: Experiment• TV ads: Viewing only• TV ads: Observed in natural setting• TV ads: Viewing + other media• TV ads: Campaign• Product placement in film• Print ads• Radio ads• Multimedia campaign• Price and promotion• Other
Effect VariableBriefly describe the variable considered the effect (consequent, depen-
dent) variable in the research. It will be a precursor, diet, or diet-relatedhealth variable. To describe it, use simple terms such as “food preferences,”“belief food is good for you,” “increased drinking of Pepsi.” If there aremultiple effect variables, all for the same link number, describe them all. Do
APPENDIX F 439
not create separate lines for each variable. If some are significant and someare not (again all testing the same link in the model), enter Y in the linksignificant column and describe all of the p-values for all the effect variables(testing the same link) in the mini-abstract. In this column, don’t describethe specifics of how the variable was measured.
In this column, to the extent possible, use a very short, general descrip-tor, closely tied to (if not the same as) one of the terms in the box for thelink in the Conceptual Framework that is being studied.
Effect Variable MeasureDescribe the way(s) in which the dependent variable was measured.
Describe all measures for every variable treated as a dependent variable forthe link identified in this line of the evidence table. As examples, measure-ment techniques could be “self-report questionnaire,” “parent interview,”“observations at school cafeteria,” “total sales,” or “body mass index (BMI)calculated from weight and height measured by health professional.”
Effect Variable CategoryBased on a description of the effect variable and how it was measured,
determine which of the following possible categories best describes it. Ifmore than one effect variable (with the same link) or more than one mea-sure of the same effect were used, choose the best description for each. Inparentheses is the link number for which each effect variable term canbe used.
• Preferences (Link 1)• Requests (Link 1)• Beliefs (Link 1)• Short-term consumption (Link 3)• Usual diet (Link 3)• Adiposity (Link 5)• Other (Links 1, 3, 5)
Sample SizeEnter the sample size as a number. If the number is 1,000 or greater,
use a comma. Choose the number that is included in the analyses not thenumber the researcher started with, if these numbers are different. If there issignificant participant loss, note that in the “Other Comments” column. Ifmore than one sample was studied, make each sample a separate line.
In the mini-abstract, if useful, include more information about thesample; for example, include text description and numbers for differentsectors of the sample (e.g., 100 children/teens and 100 parents, one parentfor each child/teen). You might also decide to mention participant loss/attrition here.

440 FOOD MARKETING TO CHILDREN AND YOUTH
Sample AgeEnter IT, YC, OC, or T if the sample is respectively all infants and
toddlers (under 2 years of age), younger children (2–5 years), older children(6–11 years), or teens (12–18 years). If the sample is largely just one ofthese groups, enter that age group only or enter where the mean of thegroup falls (e.g., “mean 5.7,” “preschool and some kindergarten,” and“age 4 plus/minus 2 years” are all entered as YC). If the sample is describedas more than one of these groups, enter the relevant letters, following theIT, YC, OC, T order (e.g., “OCT” not “TOC” for a sample of teenagersand older children). Do not use commas to separate the letters. If thesample was tested more than once, enter the age group for the sample whenfirst tested. If at the later testing(s), the sample has grown into an older agegroup, add that. If still in the same age group, add nothing. If the article hasno information about the age of the participants, enter No Info.
Indicate in the mini-abstract if the sample age clusters in one part of theindicated age range (e.g., if the sample of “older children” is only 6- and 7-year-olds, indicate this in the mini-abstract).
Note that it is not uncommon to see a child’s age described as “3-11”or “6-1” to denote that the child was 3 years, 11 months, or 6 years,1 month, respectively. When read in context, the reviewer should be able tofigure out whether “3-11” means 3 years, 11 months, or 3 to 11 years.
Measure QualityEnter H, M, or L to indicate high, medium, or low, following the
guidance below. In the “Other Comments” column, include a brief descrip-tion of the rationale for your rating choice. In general, the quality of themeasure of the independent/cause variable is more important than the qual-ity of the measure of the dependent/effect variable in determining this rat-ing. Measurement of the control variables in a non-experimental study isalso important. Finally, if any self-report measure is used, the best ratingpossible is M for overall measurement quality.
There are three primary criteria for evaluating the quality of measuresin a study: validity, reliability, and precision, each of which is explained inmore detail below.
• Validity refers to the extent to which an instrument directly andaccurately measures what it is intended to measure.
• Reliability assesses the extent to which the same measurement tech-nique, applied repeatedly, is likely to yield the same results.
• Precision refers to the fineness or coarseness of a measure.
Validity
Validity refers to the extent to which an operationalized measure di-

APPENDIX F 441
rectly and accurately measures the concept it is intended to measure. Inmeasuring a child’s food preferences in response to an ad, for example, ameasure in which a child’s actual food consumption was recorded is morevalid than a measure in which a child’s self-report of his/her future inten-tions was recorded. The total amount of TV watched is often used as ameasure of the total exposure to advertising, but such a measure is lower invalidity than is a direct measure of advertising exposure. For example, somepeople might channel surf or do chores during ads or they might watchprograms with ads that are unlikely to be relevant to children.
Bias affects validity, but certain kinds of bias are much worse thanothers. A highly reliable bathroom scale that is set 7 pounds light is biased,but its bias is constant, the scale measures what it is supposed to, and thusthe scale still has high validity, especially when measuring change in weightover time. Self-reports of socially undesirable behaviors are usually biased,and the amount of bias usually varies with the amount of social undesirabil-ity (e.g., heavy candy eaters are likely to underreport more severely than arethose who eat less candy).
Reliability
Reliability assesses the extent to which the same measurement tech-nique, applied repeatedly, is likely to yield the same results when it isbelieved that the variable measured has not changed. Measuring a child’sweight with a good bathroom scale is highly reliable, but measuring thechild’s cumulative exposure to environmental lead since birth by measuringthe concentration of lead in drawn blood is not reliable (it varies greatlyfrom day to day). Almost no one can remember every bit of food he or sheconsumed last week, so measures that depend on recall are typically low inreliability (and also typically low on validity).
Reliability is often important in studies involving subjective coding ofobserved behavior. One, we want the same coder to score the same behav-ior in the same way across times (intracoder reliability), and two, we wantdifferent coders to score the same behavior in the same way (intercoderreliability).
Precision
Precision refers to the fineness or coarseness of a measure. For example,recording family income as low, medium, or high is less precise than record-ing the number of dollars in family income, such as $18,500.
Overall Scoring for Measure Quality
Studies that rank high on all three factors—high on validity AND on

442 FOOD MARKETING TO CHILDREN AND YOUTH
reliability AND on precision—would be considered to have H, high mea-sure quality.
Studies that rank high on one or two of the three factors and low onnone would be considered to have M, medium measure quality.
Studies that do not rank high on any of the three factors or that ranklow on at least one would be considered to have L, low measurementquality.
Causality EvidenceEnter H, M, or L to indicate high, medium, or low, following the
guidance below. In the “Other Comments” column, include a brief descrip-tion of the rationale for your rating choice.
The rating of causality evidence is entirely separate from that for eco-logical validity. The idea is to rate the quality of the case that can be madefor interpreting a statistically significant association as causal and not justan association. We separate experimental studies from observational stud-ies in explaining how to do the rating.
Experimental Studies1. Treatment Bias
The essential feature of an experimental study that allows causal infer-ence is that assignment of treatment be independent of any potential con-founder, that is, any property that might also have an influence on theoutcome. When treatment is assigned randomly, treatment bias is (at leastin theory) eliminated. In natural experiments, or experiments without ran-domized assignment of treatment, treatment bias is a real concern.
For example, an experiment comparing an online course on computerprogramming to a human-taught course on the same topic in which partici-pants were allowed to choose the condition would obviously suffer fromtreatment bias, as those with high computing aptitude and/or experienceare more likely to choose the online condition.
The antidote to treatment bias is analogous to what is required inobservational studies: we must measure and statistically control for theconfounding property, perhaps with a pretest. For example, if the online/human study measured computer aptitude prior to the course and thencontrolled for it, treatment bias would not be a large concern.
2. Dropout/Attrition BiasExperiments in which dropout during the trial is associated with a
potential confounder are suspect for causal inference. For example, in theMilwaukee School Voucher evaluation “natural experiment,” in which allparticipants wanted vouchers but only those who won a lottery receivedthem, both groups experienced fairly high dropout rates between the enroll-

APPENDIX F 443
ment period and the post-test. Researchers were concerned that, among thestudents who did not win the lottery, those who dropped out were the oneswith aggressive concerned parents, leaving behind those likely to learn less.
3. MeasurementStudies in which the measures have low validity are suspect for causal
inference. For example, an experiment in which the cause of interest wasadvertising exposure—but only overall TV watching was experimentallymanipulated—suffers from this problem because overall TV exposure is aweak measure of advertising exposure.
4. Experimental Studies—SummaryExperimental studies with no treatment bias, no dropout bias, and
reasonable validity in measurement should be given H, High CausalityEvidence. Studies with serious treatment bias should be given L, Low Cau-sality Evidence.
Observational StudiesIn an observational study, an association between a putative cause X
and an effect Y might be due to any combination of (1) X is a cause of Y,(2) some third factor is a common cause of both, or (3) Y is a cause of X.The overall assessment of causal validity rides on how convincingly thestudy eliminates possibilities 2 and 3.
1. TimeOne common strategy is to use time order to eliminate possibility 3.
The fact that X is measured prior to Y, however, does nothing to eliminatepossibility 2, that there is a confounder that occurs prior to both X and Ythat is responsible for both X and Y and accounts for the apparent associa-tion between X and Y.
2. Confounders/Controls/Omitted Variables/Covariates2a. Inclusion
The most common obstacle to causal inference in observational studiesis the possibility that the statistical association between the putative causeand effect might be spurious, that is, due to an omitted variable that is acause of both. Such factors are commonly referred to as confounders,covariates, third variables, omitted variables, etc.
To be rated H, High on causal inference validity, an observationalstudy must include—that is, measure and statistically control for—all con-founders that are significantly associated with both the cause and effect. Astudy that controls for most significant but not all possible confounders canstill be rated M, Medium on causal inference validity.

444 FOOD MARKETING TO CHILDREN AND YOUTH
2b. MeasuresMeasurement is crucial to causal inference in observational studies, but
not in a simple way. If any of the measures lacks validity, then the case forcausality is weakened.
Although a lack of precision or reliability in the dependent variable willaffect the statistical inference (the standard errors and p-values), it will notbias the coefficient estimate and is of little or no consequence to the causalinference validity.
When the cause, or independent, variable is measured with low reliabil-ity, then the estimate of its effect is biased toward zero, making it harder tofind a significant p-value, and thus in some sense strengthening the case forcausation.
When a covariate, that is, a variable being “controlled for” in theanalysis, is measured with low reliability or precision, however, the esti-mate of the association between cause and effect will be biased.1 In somecases the bias will be toward zero, and in others away from zero. Thedirection of the bias is the same as the case in which the variable is entirelyleft out of the analysis.
3. Observational Studies—SummaryAn observational study should score H, High on Causality Evidence
when (a) the possibility that the response variable is a cause of the indepen-dent variable can be eliminated (perhaps by time), (b) the cause and effectare measured with high validity, and (3) all significant confounders havebeen included and measured with high validity, reliability, and precision.
Ecological ValidityEnter H, M, or L to indicate high, medium, or low, following guidance
below. In the “Other Comments” column, include a brief description of therationale for your rating choice.
Ecological validity refers to the extent to which an investigation’s re-search setting, stimuli, and response demands are similar to those of thenaturally occurring settings, stimuli, and responses characteristic of thebehavioral system being studied.
H, high ecological validity, occurs when the research setting andstimuli/cause and effect/response are similar to those of the system underinvestigation.
1The sign of the bias is the same as the bias that would result if the variable was omittedfrom the analysis entirely, and the size of the bias is proportional to the size of the measure-ment problem. A covariate with a highly imprecise measure will result in more bias than onewith a mildly imprecise measure.
APPENDIX F 445
An example would be an experiment that manipulated the signage onthe vending machines in schools with the measured responses being thepurchases made from the vending machines. Another example would be asurvey in which parents and children reported on the children’s home tele-vision viewing and daily diet.
M, medium ecological validity, occurs when the research setting or thestimuli or the responses are similar to those of the system under investiga-tion.
An example would be an experiment in which children are brought toa university laboratory, shown a children’s TV program with embeddedfood commercials, and then allowed to choose food from a selection offood items. The foods chosen and the amounts eaten are the responses. Inthis case, the setting is not a natural setting for the child, but the stimuli(children’s TV program and commercials) and the responses are at leastmoderately similar to natural stimuli and responses.
L, low ecological validity, occurs when neither the research setting northe stimuli nor the responses are similar to those of the system underinvestigation. An example would be an experiment in which a child isbrought to a university laboratory, hears a description of a television com-mercial, explains the intent underlying the broadcast of the commercial,and chooses a food from several pictures of food. In this case neither thesetting, nor the stimuli, nor the response demands would be characteristicof the behavioral system under investigation.
Mini-AbstractProvide a brief description of the main elements of the study. If the
research was conducted outside the United States, indicate where it wasconducted.
Lead ReviewerEnter the last name of the person designated as lead reviewer.
Other Comments: Lead ReviewerThe lead reviewer adds any comments about unusual results or features
of the research, questions he or she had in reviewing the research or fillingin the Evidence Table, opinions about the overall quality of the work,arguments for why the apparently positive causal relationship should bediscounted, and other information that seems pertinent. Also be sure toinclude the rationales for the Measure Quality, Causality Evidence, andEcological Validity ratings.
Second ReviewerEnter the last name of the person designated as the second reviewer.

446 FOOD MARKETING TO CHILDREN AND YOUTH
Other Comments: Second ReviewerThe second reviewer adds any comments about unusual results or fea-
tures of the research, questions he or she had in reviewing the research orfilling in the Evidence Table, opinions about the overall quality of the work,arguments for why the apparently positive causal relationship should bediscounted, and other information that seems pertinent. Also be sure toinclude the rationales for the Measure Quality, Causality Evidence, andEcological Validity ratings.

F-2
Summary Evidence Table
Relationship Precursors Relationship between marketing and precursorsto diet
Diet Relationship between marketing and dietHealth Relationship between marketing and diet-related
health(TV) Exposure to advertising on television measured by
television viewing
Significance Y Study reported one or more statistically significantrelationships between marketing and an outcomevariable at p less than or equal to 0.05
N Study reported no statistically significant relationshipbetween marketing and an outcome variable
Research Method CS Cross-sectionalExp Randomized trialExp-N Natural experimentL-Pnl Longitudinal—PanelL-Trnd Longitudinal—Trend
Cause Variable The general category that the independent variableCategory was measuring, e.g., “TV ads—Experiment,” “TV
ads—Viewing only,” and “Multimedia campaign”
Effect Variable The general category that the dependent variable wasCategory measuring, e.g., “Preferences,” “Short-term
consumption,” and “Adiposity”
Sample Age IT Infants and toddlers under 2 years of ageYC Younger children ages 2–5 yearsOC Older children ages 6–11 yearsT Teens ages 12–18 years
Measure Quality/ H HighCausality Evidence/ M MediumEcological Validity L Low
447

448 FOOD MARKETING TO CHILDREN AND YOUTH
Reference
ResearchAuthor(s) Year Relationship Significance Method
Andersen et al. 1998 Health (TV) Y CS
Anderson et al. 2001 Health (TV) N L-Pnl
Anderson et al. 2001 Health (TV) Y CS
Armstrong et al. 1998 Health (TV) Y CS
Auty, Lewis 2004 Diet Y Exp
Bao, Shao 2002 Precursors Y ExpBao, Shao 2002 Precursors Y L-Trnd
Barry, Gunst 1982 Precursors N Exp
Berkey et al. 2000 Health (TV) Y L-Pnl
Berkey et al. 2003 Health (TV) Y CS
Bogaert et al. 2003 Health (TV) N L-Pnl
Bolton 1983 Diet (TV) Y CS
Borzekowski, Poussaint 1998 Precursors (TV) Y CS
Borzekowski, Poussaint 1998 Diet (TV) Y CS
Borzekowski, Robinson 2001 Precursors Y Exp
Boynton-Jarrett et al. 2003 Diet (TV) Y L-Pnl
Brody et al. 1981 Precursors Y Exp
Burke et al. 2005 Health (TV) Y L-Pnl
Cantor 1981 Diet Y Exp
Carruth et al. 1991 Diet (TV) N CS
Christenson 1982 Precursors Y Exp
Clancy-Hepburn et al. 1974 Precursors (TV) N CS

APPENDIX F 449
Sample
Cause Variable Effect Variable Measure Causality EcologicalCategory Category Size Age Quality Evidence Validity
TV ads— Adiposity 4,063 OCT L L HViewing only
TV ads— Adiposity 570 YCT M M HViewing only
TV ads— Adiposity 570 T L L HViewing only
TV ads— Adiposity 588 OC L L HViewing +other media
Product Short-term 105 OC H H Mplacement consumptionin film
Radio ads Preferences 180 T L M LMultimedia Preferences 2,276 T L L H
campaignTV ads— Preferences 172 YCOC L M L
ExperimentTV ads— Adiposity 10,769 OCT L M H
Viewing +other media
TV ads— Adiposity 10,896 OCT L L HViewing +other media
TV ads— Adiposity 41 OC L L HViewing only
TV ads— Usual Diet 262 YCOC M M HViewing only
TV ads— Requests 128 YC L L MViewing only
TV ads— Usual Diet 128 YC L L MViewing only
TV ads— Preferences 39 YC H H MExperiment
TV ads— Usual Diet 548 OC L M HViewing only
TV ads— Requests 57 YC M H MExperiment
TV ads— Adiposity 1,430 OC L M HViewing only
TV ads— Short-term 37 YCOC H H MExperiment consumption
TV ads— Usual diet 887 T M L HViewing only
TV ads— Preferences 90 OC M H MExperiment and other
TV ads— Preferences 105 OC L L HViewing only
continues

450 FOOD MARKETING TO CHILDREN AND YOUTH
ReferenceResearch
Author(s) Year Relationship Significance Method
Clarke 1984 Precursors N Exp
Coon et al. 2001 Diet (TV) Y CS
Crespo et al. 2001 Diet (TV) Y CS
Crespo et al. 2001 Health (TV) Y CS
Crooks 2000 Health (TV) N CS
Dawson et al. 1988 Precursors N Exp
Deheeger et al. 1997 Health (TV) Y CS
Dennison et al. 2002 Health (TV) Y CS
Dennison et al. 2002 Health (TV) Y CS
Dietz, Gortmaker 1985 Health (TV) Y CS
Dietz, Gortmaker 1985 Health (TV) Y L-Pnl
Donkin et al. 1993 Precursors (TV) Y CS
Donkin et al. 1993 Diet (TV) Y CS
Donohue 1975 Precursors (TV) Y CS
Dowda et al. 2001 Health (TV) Y CS
duRant et al. 1994 Health (TV) N CS
duRant et al. 1996 Health (TV) N CS
Dwyer et al. 1998 Health (TV) N CS
Eisenmann et al. 2002 Health (TV) Y CS
Faber et al. 1984 Precursors Y Exp
Fontvieille et al. 1993 Health (TV) Y CS
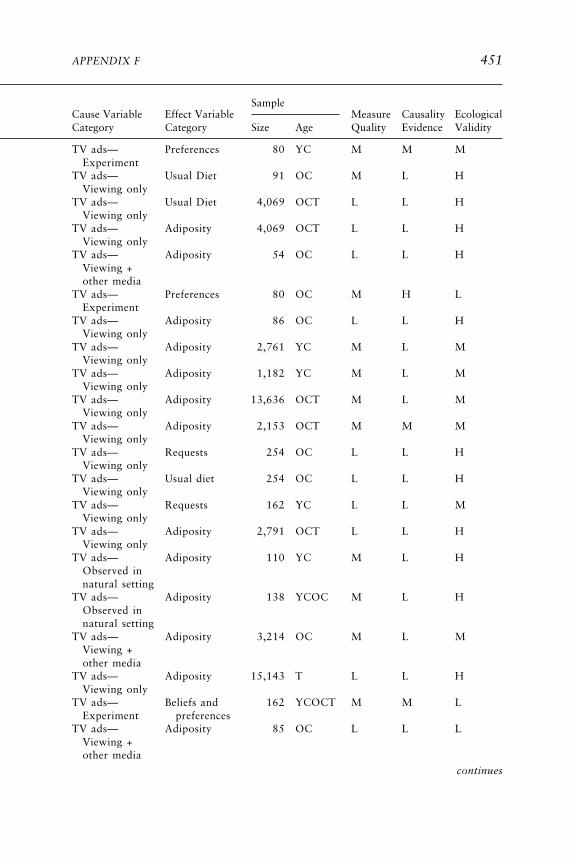
APPENDIX F 451
SampleCause Variable Effect Variable Measure Causality EcologicalCategory Category Size Age Quality Evidence Validity
continues
TV ads— Preferences 80 YC M M MExperiment
TV ads— Usual Diet 91 OC M L HViewing only
TV ads— Usual Diet 4,069 OCT L L HViewing only
TV ads— Adiposity 4,069 OCT L L HViewing only
TV ads— Adiposity 54 OC L L HViewing +other media
TV ads— Preferences 80 OC M H LExperiment
TV ads— Adiposity 86 OC L L HViewing only
TV ads— Adiposity 2,761 YC M L MViewing only
TV ads— Adiposity 1,182 YC M L MViewing only
TV ads— Adiposity 13,636 OCT M L MViewing only
TV ads— Adiposity 2,153 OCT M M MViewing only
TV ads— Requests 254 OC L L HViewing only
TV ads— Usual diet 254 OC L L HViewing only
TV ads— Requests 162 YC L L MViewing only
TV ads— Adiposity 2,791 OCT L L HViewing only
TV ads— Adiposity 110 YC M L HObserved innatural setting
TV ads— Adiposity 138 YCOC M L HObserved innatural setting
TV ads— Adiposity 3,214 OC M L MViewing +other media
TV ads— Adiposity 15,143 T L L HViewing only
TV ads— Beliefs and 162 YCOCT M M LExperiment preferences
TV ads— Adiposity 85 OC L L LViewing +other media
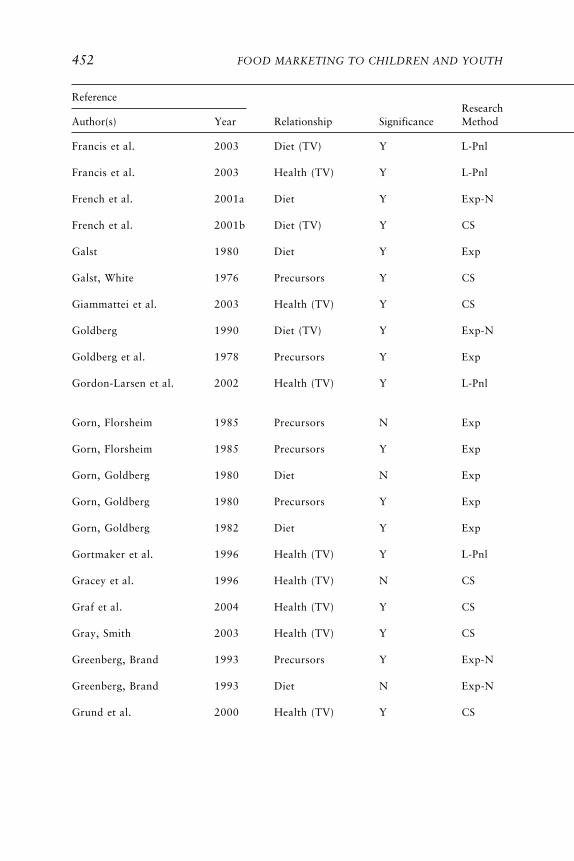
452 FOOD MARKETING TO CHILDREN AND YOUTH
ReferenceResearch
Author(s) Year Relationship Significance Method
Francis et al. 2003 Diet (TV) Y L-Pnl
Francis et al. 2003 Health (TV) Y L-Pnl
French et al. 2001a Diet Y Exp-N
French et al. 2001b Diet (TV) Y CS
Galst 1980 Diet Y Exp
Galst, White 1976 Precursors Y CS
Giammattei et al. 2003 Health (TV) Y CS
Goldberg 1990 Diet (TV) Y Exp-N
Goldberg et al. 1978 Precursors Y Exp
Gordon-Larsen et al. 2002 Health (TV) Y L-Pnl
Gorn, Florsheim 1985 Precursors N Exp
Gorn, Florsheim 1985 Precursors Y Exp
Gorn, Goldberg 1980 Diet N Exp
Gorn, Goldberg 1980 Precursors Y Exp
Gorn, Goldberg 1982 Diet Y Exp
Gortmaker et al. 1996 Health (TV) Y L-Pnl
Gracey et al. 1996 Health (TV) N CS
Graf et al. 2004 Health (TV) Y CS
Gray, Smith 2003 Health (TV) Y CS
Greenberg, Brand 1993 Precursors Y Exp-N
Greenberg, Brand 1993 Diet N Exp-N
Grund et al. 2000 Health (TV) Y CS

APPENDIX F 453
SampleCause Variable Effect Variable Measure Causality EcologicalCategory Category Size Age Quality Evidence Validity
continues
TV ads— Usual diet 173 YCOC M M HViewing only
TV ads— Adiposity 173 YCOC M M HViewing only
Price and Usual diet 55 T H H Hpromotion
TV ads— Usual diet 4,344 T L L HViewing only
TV ads— Short-term 65 YC H H LExperiment consumption
TV ads— Requests 41 YC H L MViewing only
TV ads— Adiposity 319 OC M L HViewing only
TV ads— Usual diet 475 OC M M HViewing only
TV ads— Preferences 81 YCOC M M MExperiment
TV ads— Adiposity 12,759 OCT M M HViewing +other media
TV ads— Preferences 70 OC M M MExperiment
TV ads— Beliefs and 70 OC M M MExperiment preferences
TV ads— Short-perm 151 OC H H MExperiment consumption
TV ads— Beliefs and 151 OC H H MExperiment preferences
TV ads— Short-term 288 OC H H HExperiment consumption
TV ads— Adiposity 746 OCT M M HViewing only
TV ads— Adiposity 391 T L L HViewing only
TV ads— Adiposity 207 OC L L HViewing only
TV ads— Adiposity 155 YCOCT M L HViewing only
TV ads— Preferences 1,647 T M M HExperiment
TV ads— Usual diet 1,647 T M H HExperiment
TV ads— Adiposity 88 YCOC M L HViewing only

454 FOOD MARKETING TO CHILDREN AND YOUTH
ReferenceResearch
Author(s) Year Relationship Significance Method
Guillaume et al. 1997 Health (TV) Y CS
Halford et al. 2004 Diet Y Exp
Harrison 2005 Precursors Y L-Pnl
Hernandez et al. 1999 Health (TV) Y CS
Heslop, Ryans 1980 Precursors N Exp
Hitchings, Moynihan 1998 Diet Y CS
Horn et al. 2001 Health (TV) Y L-Pnl
Horn et al. 2001 Health (TV) Y CS
Hoy et al. 1986 Precursors Y Exp
Isler et al. 1987 Precursors (TV) Y CS
Janz et al. 2002 Health (TV) Y CS
Jeffrey et al. 1982 Diet Y Exp
Jeffrey et al. 1982 Diet Y Exp
Kant, Graubard 2003 Diet (TV) N CS
Katzmarzyk et al. 1998 Health (TV) N CS
Kaur et al. 2003 Health (TV) Y L-Pnl
Kaur et al. 2003 Health (TV) Y CS
Klein-Platat et al. 2005 Health (TV) Y CS
Krassas et al. 2001 Health (TV) Y CS
Kunkel 1988 Precursors Y Exp
Levin et al. 2004 Health (TV) N CS
Lewis, Hill 1998 Precursors Y Exp

APPENDIX F 455
SampleCause Variable Effect Variable Measure Causality EcologicalCategory Category Size Age Quality Evidence Validity
continues
TV ads— Adiposity and 1,028 OC M L HViewing only other
TV ads— Short-term 42 OC H H MExperiment consumption
TV ads— Beliefs 134 OC M M HViewing only
TV ads— Adiposity 461 OCT L L HViewing only
TV ads— Preferences 280 YCOC M H MExperiment
TV ads— Usual diet 44 OC M L LViewing only
TV ads— Adiposity 103 OC L L HViewing only
TV ads— Adiposity 103 OC L L HViewing only
TV ads— Preferences 78 YC M M LExperiment
TV ads— Requests 250 YCOC M L HViewing only
TV ads— Adiposity 464 YCOC M L HViewing only
TV ads— Short-term 47 YC H H MExperiment consumption
TV ads— Short-term 96 YCOC H H MExperiment consumption
TV ads— Usual diet 4,137 OCT L M HViewing only
TV ads— Adiposity 784 OCT L L HViewing only
TV ads— Adiposity 2,223 T L L HViewing only
TV ads— Adiposity 2,223 T L L HViewing only
TV ads— Adiposity 2,714 OC L L HViewing +other media
TV ads— Adiposity 2,468 OCT L L HViewing +other media
TV ads— Beliefs, 152 YCOC M M MExperiment preferences,
and requestsTV ads— Adiposity 148 YC M L L
Viewing onlyTV ads— Preferences 35 OC M H L
Experiment

456 FOOD MARKETING TO CHILDREN AND YOUTH
ReferenceResearch
Author(s) Year Relationship Significance Method
Lin et al. 2004 Health (TV) N CS
Locard et al. 1992 Health (TV) N CS
Macklin 1990 Precursors N Exp
Macklin 1994 Precursors Y Exp
Maffeis et al. 1998 Health (TV) N L-Pnl
Maffeis et al. 1998 Health (TV) Y CS
Manios et al. 2004 Health (TV) Y CS
Matheson et al. 2004 Diet (TV) Y CS
McMurray et al. 2000 Health (TV) N CS
Miller, Busch 1979 Precursors Y Exp
Morton 1990 Precursors Y CS
Muller et al. 1999 Diet (TV) Y CS
Muller et al. 1999 Health (TV) Y CS
Norton et al. 2000 Precursors Y CS
Obarzanek et al. 1994 Health (TV) Y CS
O’Loughlin et al. 2000 Health (TV) N L-Pnl
Palmer, McDowell 1981 Precursors Y CS
Pate, Ross 1987 Health (TV) Y CS
Peterson et al. 1984 Precursors Y Exp
Peterson et al. 1984 Diet N Exp
Pine, Nash 2003 Precursors Y CS
Proctor et al. 2003 Health (TV) Y L-Pnl

APPENDIX F 457
SampleCause Variable Effect Variable Measure Causality EcologicalCategory Category Size Age Quality Evidence Validity
continues
TV ads— Adiposity 1,651 OCT M M HViewing only
TV ads— Adiposity 1,020 YC L L HViewing only
Print ads Beliefs, 36 YC M M Lpreferences,and requests
TV ads— Requests 40 YCOC L M LExperiment
TV ads— Adiposity 112 OCT L L HViewing only
TV ads— Adiposity 112 OCT L L HViewing only
TV ads— Adiposity 198 OC L L HViewing +other media
TV ads— Usual diet 214 OC M L HViewing only
TV ads— Adiposity 2,389 OCT L L HViewing +other media
TV ads— Preferences 363 YCOC M H LExperiment
TV ads— Requests 185 T M L HViewing only
TV ads— Usual diet 1,497 YCOC M L HViewing only
TV ads— Adiposity 1,497 YCOC M L HViewing only
Price and Preferences 35 OCT M L Mpromotion
TV ads— Adiposity 2,379 OC M M HViewing +other media
TV ads— Adiposity 2,634 OC L M HViewing only
TV ads— Beliefs 64 YC M M LViewing only
TV ads— Adiposity 2,372 OC M L MViewing only
TV ads— Beliefs and 106 OC M M MExperiment preferences
TV ads— Short-term 106 OC H M MExperiment consumption
TV ads— Preferences 75 YC M M MCampaign
TV ads— Adiposity 106 YCOC M M HViewing only

458 FOOD MARKETING TO CHILDREN AND YOUTH
ReferenceResearch
Author(s) Year Relationship Significance Method
Reid et al. 1980 Precursors (TV) N CS
Reilly et al. 2005 Health (TV) Y L-Pnl
Resnik, Stern 1977 Precursors Y Exp
Ritchey, Olson 1983 Precursors (TV) N CS
Ritchey, Olson 1983 Diet (TV) Y CS
Robinson 1999 Diet (TV) N Exp
Robinson 1999 Health (TV) Y Exp
Robinson et al. 1993 Health (TV) N CS
Robinson et al. 1993 Health (TV) N L-Pnl
Robinson, Killen 1995 Diet (TV) Y CS
Robinson, Killen 1995 Health (TV) N CS
Ross et al. 1981 Precursors N Exp
Ross et al. 1981 Precursors Y Exp
Shannon et al. 1991 Health (TV) Y L-Pnl
Shannon et al. 1991 Health (TV) N CS
Sherwood et al. 2003 Health (TV) N CS
Signorielli, Lears 1992 Precursors (TV) Y CS
Signorielli, Lears 1992 Diet (TV) Y CS
Signorielli, Staples 1997 Precursors (TV) Y CS
Stettler et al. 2004 Health (TV) Y CS
Stoneman, Brody 1981 Precursors Y Exp
Stoneman, Brody 1982 Precursors Y Exp
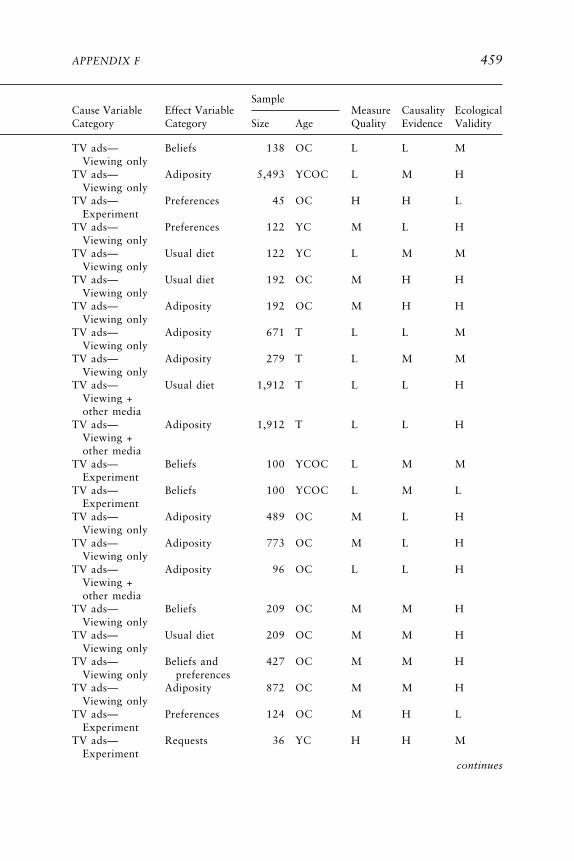
APPENDIX F 459
SampleCause Variable Effect Variable Measure Causality EcologicalCategory Category Size Age Quality Evidence Validity
continues
TV ads— Beliefs 138 OC L L MViewing only
TV ads— Adiposity 5,493 YCOC L M HViewing only
TV ads— Preferences 45 OC H H LExperiment
TV ads— Preferences 122 YC M L HViewing only
TV ads— Usual diet 122 YC L M MViewing only
TV ads— Usual diet 192 OC M H HViewing only
TV ads— Adiposity 192 OC M H HViewing only
TV ads— Adiposity 671 T L L MViewing only
TV ads— Adiposity 279 T L M MViewing only
TV ads— Usual diet 1,912 T L L HViewing +other media
TV ads— Adiposity 1,912 T L L HViewing +other media
TV ads— Beliefs 100 YCOC L M MExperiment
TV ads— Beliefs 100 YCOC L M LExperiment
TV ads— Adiposity 489 OC M L HViewing only
TV ads— Adiposity 773 OC M L HViewing only
TV ads— Adiposity 96 OC L L HViewing +other media
TV ads— Beliefs 209 OC M M HViewing only
TV ads— Usual diet 209 OC M M HViewing only
TV ads— Beliefs and 427 OC M M HViewing only preferences
TV ads— Adiposity 872 OC M M HViewing only
TV ads— Preferences 124 OC M H LExperiment
TV ads— Requests 36 YC H H MExperiment

460 FOOD MARKETING TO CHILDREN AND YOUTH
ReferenceResearch
Author(s) Year Relationship Significance Method
Storey et al. 2003 Health (TV) Y CS
Storey et al. 2003 Health (TV) Y CS
Sugimori et al. 2004 Health (TV) Y L-Pnl
Tanasescu et al. 2000 Health (TV) Y CS
Taras et al. 1989 Diet (TV) Y CS
Taras et al. 2000 Diet Y CS
Taras et al. 2000 Precursors Y CS
Toyran et al. 2002 Precursors Y CS
Toyran et al. 2002 Health (TV) Y CS
Tremblay, Willms 2003 Health (TV) Y CS
Trost et al. 2001 Health (TV) N CS
Tucker 1986 Health (TV) N CS
Utter et al. 2003 Diet (TV) Y CS
Utter et al. 2003 Health (TV) Y CS
Vandewater et al. 2004 Health (TV) N CS
Wake et al. 2003 Health (TV) Y CS
Waller et al. 2003 Health (TV) N CS
Wolf et al. 1993 Health (TV) Y CS
Wong et al. 1992 Health (TV) Y CS
Woodward et al. 1997 Diet (TV) Y CS
Yavas, Abdul-Gader 1993 Precursors Y CS
Zive et al. 1998 Diet (TV) Y CS

APPENDIX F 461
SampleCause Variable Effect Variable Measure Causality EcologicalCategory Category Size Age Quality Evidence Validity
TV ads— Adiposity 3,473 OCT M M HViewing only
TV ads— Adiposity 8,772 OCT M M HViewing only
TV ads— Adiposity 8,170 YCOC L L HViewing only
TV ads— Adiposity 53 OC L L HViewing only
TV ads— Usual diet 66 YCOC L L HViewing only
TV ads— Usual diet 237 YC M L HCampaign
TV ads— Requests 237 YC L L HCampaign
TV ads— Requests 886 OC L L HViewing only
TV ads— Adiposity 886 OC L L HViewing only
TV ads— Adiposity 7,216 OC L L HViewing only
TV ads— Adiposity 187 OC L L HViewing +other media
TV ads— Adiposity 379 T M L HViewing only
TV ads— Usual diet 4,480 T M M MViewing +other media
TV ads— Adiposity 4,480 T M L MViewing +other media
TV ads— Adiposity 2,831 ITYCOC M M HViewing only
TV ads— Adiposity 2,862 OCT L L HViewing only
TV ads— Adiposity 880 OC L L HViewing only
TV ads— Adiposity 552 OCT L L HViewing only
TV ads— Other 1,081 YCOCT M M HViewing only
TV ads— Usual diet 2,082 T L L HViewing only
TV ads— Requests 217 OC M L HViewing only
TV ads— Usual diet 351 YC M L HViewing only

462 FOOD MARKETING TO CHILDREN AND YOUTH
REFERENCES
Andersen RE, Crespo CJ, Bartlett SJ, Cheskin LJ, Pratt M. 1998. Relationship of physicalactivity and television watching with body weight and level of fatness among children:Results from the Third National Health and Nutrition Examination Survey. J Am MedAssoc 279(12):938–942.
Anderson DR, Huston AC, Schmitt KL, Linebarger DL, Wright JC. 2001. Early childhoodtelevision viewing and adolescent behavior: The recontact study. Mon Soc Res ChildDev 66(1):I–VIII, 1–147.
Armstrong CA, Sallis JF, Alcaraz JE, Kolody B, McKenzie TL, Hovell MF. 1998. Children’stelevision viewing, body fat, and physical fitness. Am J Health Promot 12(6):363–368.
Auty S, Lewis C. 2004. Exploring children’s choice: The reminder effect of product place-ment. Psychol Marketing 21(9):697–713.
Bao Y, Shao AT. 2002. Nonconformity advertising to teens. J Ad Res 42(3):56–65.Barry TE, Gunst RF. 1982. Children’s advertising: The differential impact of appeal strategy.
Current Issues and Research in Advertising 5:113–125.Berkey CS, Rockett HR, Field AE, Gillman MW, Frazier AL, Camargo CA Jr, Colditz GA.
2000. Activity, dietary intake, and weight changes in a longitudinal study of preadoles-cent and adolescent boys and girls. Pediatrics 105(4):E56.
Berkey CS, Rockett HR, Gillman MW, Colditz GA. 2003. One-year changes in activity and ininactivity among 10- to 15-year-old boys and girls: Relationship to change in body massindex. Pediatrics 111(4 Pt 1):836–843.
Bogaert N, Steinbeck KS, Baur LA, Brock K, Bermingham MA. 2003. Food, activity andfamily—environmental vs. biochemical predictors of weight gain in children. Eur J ClinNutr 57(10):1242–1249.
Bolton RN. 1983. Modeling the impact of television food advertising on children’s diets.Current Issues and Research in Advertising 6(1):173–199.
Borzekowski DLG, Poussaint AF. 1998. Latino American Preschoolers and the Media. Phila-delphia, PA: Annenberg Public Policy Center of the University of Pennsylvania.
Borzekowski DL, Robinson TN. 2001. The 30-second effect: An experiment revealing theimpact of television commercials on food preferences of preschoolers. J Am Diet Assoc101(1):42–46.
Boynton-Jarrett R, Thomas TN, Peterson KE, Wiecha J, Sobol AM, Gortmaker SL. 2003.Impact of television viewing patterns on fruit and vegetable consumption among adoles-cents. Pediatrics 112(6 Pt 1):1321–1326.
Brody GH, Stoneman Z, Lane TS, Sanders AK. 1981. Television food commercials aimed atchildren, family grocery shopping, and mother–children interactions. Family Relations30:435–439.
Burke V, Beilin LJ, Simmer K, Oddy WH, Blake KV, Doherty D, Kendall GE, Newnham JP,Landau LI, Stanley FJ. 2005. Predictors of body mass index and associations with car-diovascular risk factors in Australian children: A prospective cohort study. Int J ObesRelat Metab Disord 29(1):15–23.
Cantor J. 1981. Modifying children’s eating habits through television ads: Effects of humor-ous appeals in a field setting. J Broadcasting 23(1):37–47.
Carruth BR, Goldberg DL, Skinner JD. 1991. Do parents and peers mediate the influence oftelevision advertising on food-related purchases? J Adolesc Res 6(2):253–271.
Christenson PG. 1982. Children’s perceptions of TV commercials and products. The effectsof PSAs. Commun Res 9(4):491–524.
Clancy-Hepburn K, Hickey AA, Nevill G. 1974. Children’s behavior responses to TV foodadvertisements. J Nutr Ed 6(3):93–96.

APPENDIX F 463
Clarke TK. 1984. Situational factors affecting preschoolers’ responses to advertising. J AcadMarketing Sci 12(4):25–40.
Coon KA, Goldberg J, Rogers BL, Tucker KL. 2001. Relationships between use of televisionduring meals and children’s food consumption patterns. Pediatrics 107(1):e7.
Crespo CJ, Smit E, Troiano RP, Bartlett SJ, Macera CA, Andersen RE. 2001. Televisionwatching, energy intake, and obesity in US children: Results from the third NationalHealth and Nutrition Examination Survey, 1988–1994. Arch Pediatr Adolesc Med155(3):360–365.
Crooks DL. 2000. Food consumption, activity, and overweight among elementary schoolchildren in an Appalachian Kentucky community. Am J Phys Anthropol 112(2):159–170.
Dawson BL, Jeffrey DB, Walsh JA. 1988. Television food commercials’ effect on children’sresistance to temptation. J Appl Soc Psychol 18(16):1353–1360.
Deheeger M, Rolland-Cachera MF, Fontvieille AM. 1997. Physical activity and body compo-sition in 10 year old French children: Linkages with nutritional intake? Int J Obes RelatMetab Disord 21(5):372–379.
Dennison BA, Erb TA, Jenkins PL. 2002. Television viewing and television in bedroom asso-ciated with overweight risk among low-income preschool children. Pediatrics 109(6):1028–1035.
Dietz WH Jr, Gortmaker SL. 1985. Do we fatten our children at the television set? Obesityand television viewing in children and adolescents. Pediatrics 75(5):807–812.
Donkin AJM, Neale RJ, Tilston C. 1993. Children’s food purchase requests. Appetite 21(3):291–294.
Donohue TR. 1975. Effect of commercials on black children. J Advert Res 15(6):41–47.Dowda M, Ainsworth BE, Addy CL, Saunders R, Riner W. 2001. Environmental influences,
physical activity, and weight status in 8- to 16-year-olds. Arch Pediatr Adolesc Med155(6):711–717.
duRant RH, Baranowski T, Johnson M, Thompson WO. 1994. The relationship amongtelevision watching, physical activity, and body composition of young children. Pediat-rics 94(4 Pt 1):449–455.
duRant RH, Thompson WO, Johnson M, Baranowski T. 1996. The relationship amongtelevision watching, physical activity, and body composition of 5- or 6-year-old chil-dren. Pediatric Exerc Sci 8:15–26.
Dwyer JT, Stone EJ, Yang M, Feldman H, Webber LS, Must A, Perry CL, Nader PR, ParcelGS. 1998. Predictors of overweight and overfatness in a multiethnic pediatric popula-tion. Child and Adolescent Trial for Cardiovascular Health Collaborative ResearchGroup. Am J Clin Nutr 67(4):602–610.
Eisenmann JC, Bartee RT, Wang MQ. 2002. Physical activity, TV viewing, and weight in U.S.youth: 1999 Youth Risk Behavior Survey. Obes Res 10(5):379–385.
Faber RJ, Meyer TP, Miller MM. 1984. The effectiveness of health disclosures within chil-dren’s television commercials. J Broadcasting 28(4):463–476.
Fontvieille AM, Kriska A, Ravussin E. 1993. Decreased physical activity in Pima Indiancompared with Caucasian children. Int J Obes Relat Metab Disord 17(8):445–452.
Francis LA, Lee Y, Birch LL. 2003. Parental weight status and girls’ television viewing,snacking, and body mass indexes. Obes Res 11(1):143–151.
French SA, Jeffery RW, Story M, Breitlow KK, Baxter JS, Hannan P, Snyder MP. 2001a.Pricing and promotion effects on low-fat vending snack purchases: The CHIPS Study.Am J Public Health 91(1):112–117.
French SA, Story M, Neumark-Sztainer D, Fulkerson JA, Hannan P. 2001b. Fast food restau-rant use among adolescents: Asociations with nutrient intake, food choices and behav-ioral and psychosocial variables. Int J Obes Relat Metab Disord 25(12):1823–1833.

464 FOOD MARKETING TO CHILDREN AND YOUTH
Galst JP. 1980. Television food commercials and pro-nutritional public service announce-ments as determinants of young children’s snack choices. Child Dev 51:935–938.
Galst JP, White MA. 1976. The unhealthy persuader: The reinforcing value of television andchildren’s purchase-influencing attempts at the supermarket. Child Dev 47:1089–1096.
Giammattei J, Blix G, Marshak HH, Wollitzer AO, Pettitt DJ. 2003. Television watching andsoft drink consumption: Associations with obesity in 11- to 13-year-old schoolchildren.Arch Pediatr Adolesc Med 157(9):882–886.
Goldberg ME. 1990. A quasi-experiment assessing the effectiveness of TV advertising di-rected to children. J Marketing Res 27(4):445–454.
Goldberg ME, Gorn GJ, Gibson W. 1978. TV messages for snack and breakfast foods: Dothey influence children’s preferences? J Consum Res 5:73–81.
Gordon-Larsen P, Adair LS, Popkin BM. 2002. Ethnic differences in physical activity andinactivity patterns and overweight status. Obes Res 10(3):141–149.
Gorn GJ, Florsheim R. 1985. The effects of commercials for adult products on children. JConsumer Res 11(4):962–967.
Gorn GJ, Goldberg ME. 1980. Children’s responses to repetitive television commercials. JConsum Res 6:421–424.
Gorn GJ, Goldberg ME. 1982. Behavioral evidence of the effects of televised food messageson children. J Consum Res 9:200–205.
Gortmaker SL, Must A, Sobol AM, Peterson K, Colditz GA, Dietz WH. 1996. Televisionviewing as a cause of increasing obesity among children in the United States, 1986–1990. Arch Pediatr Adolesc Med 150(4):356–362.
Gracey D, Stanley N, Burke V, Corti B, Beilin LJ. 1996. Nutritional knowledge, beliefs, andbehaviours in teenage school students. Health Ed Res 11(2):187–204.
Graf C, Koch B, Dordel S, Schindler-Marlow S, Icks A, Schuller A, Bjarnason-Wehrens B,Tokarski W, Predel HG. 2004. Physical activity, leisure habits and obesity in first-gradechildren. Eur J Cardiovasc Prev Rehabil 11(4):284–290.
Gray A, Smith C. 2003. Fitness, dietary intake, and body mass index in urban Native Ameri-can youth. J Am Diet Assoc 103(9):1187–1191.
Greenberg BS, Brand JE. 1993. Television news and advertising in schools: The Channel Onecontroversy. J Commun 43(1):143–151.
Grund A, Dilba B, Forberger K, Krause H, Siewers M, Rieckert H, Muller MJ. 2000. Rela-tionships between physical activity, physical fitness, muscle strength and nutritionalstate in 5- to 11-year-old children. Eur J Appl Physiol 82(5-6):425–438.
Guillaume M, Lapidus L, Bjorntorp P, Lambert A. 1997. Physical activity, obesity, and car-diovascular risk factors in children. The Belgian Luxembourg Child Study II. Obes Res5(6):549–556.
Halford JC, Gillespie J, Brown V, Pontin EE, Dovey TM. 2004. Effect of television advertise-ments for foods on food consumption in children. Appetite 42(2):221–225.
Harrison K. 2005. Is “fat free” good for me? A panel study of television viewing and children’snutritional knowledge and reasoning. Health Commun 17(2):117–132.
Hernandez B, Gortmaker SL, Colditz GA, Peterson KE, Laird NM, Parra-Cabrera S. 1999.Association of obesity with physical activity, television programs and other forms ofvideo viewing among children in Mexico City. Int J Obes Relat Metab Disord 23(8):845–854.
Heslop LA, Ryans AB. 1980. A second look at children and the advertising of premiums.J Consumer Res 6(4):414–420.
Hitchings E, Moynihan PJ. 1998. The relationship between television food advertisementsrecalled and actual foods consumed by children. J Hum Nutr Diet 11:511–517.
Horn OK, Paradis G, Potvin L, Macaulay AC, Desrosiers S. 2001. Correlates and predictorsof adiposity among Mohawk children. Prev Med 33(4):274–281.

APPENDIX F 465
Hoy MG, Young CE, Mowen JC. 1986. Animated host-selling advertisements: Their impacton young children’s recognition, attitudes, and behavior. J Pub Policy Marketing 5:171–184.
Isler L, Popper ET, Ward S. 1987. children’s purchase requests and parental responses: Re-sults from a diary study. J Advert Res 27(5):28–39.
Janz KF, Levy SM, Burns TL, Torner JC, Willing MC, Warren JJ. 2002. Fatness, physicalactivity, and television viewing in children during the adiposity rebound period: TheIowa Bone Development Study. Prev Med 35(6):563–571.
Jeffrey DB, McLellarn RW, Fox DT. 1982. The development of children’s eating habits: Therole of television commercials. Health Ed Q 9(2 suppl 3):174–189.
Kant AK, Graubard BI. 2003. Predictors of reported consumption of low-nutrient-densityfoods in a 24-h recall by 8–16 year old US children and adolescents. Appetite 41(2):175–180.
Katzmarzyk PT, Malina RM, Song TM, Bouchard C. 1998. Television viewing, physicalactivity, and health-related fitness of youth in the Quebec Family Study. J Adolesc Health23(5):318–325.
Kaur H, Choi WS, Mayo MS, Harris KJ. 2003. Duration of television watching is associatedwith increased body mass index. J Pediatr 143(4):506–511.
Klein-Platat C, Oujaa M, Wagner A, Haan MC, Arveiler D, Schlienger JL, Simon C. 2005.Physical activity is inversely related to waist circumference in 12-y-old French adoles-cents. Int J Obes Relat Metab Disord 29(1):9–14.
Krassas GE, Tzotzas T, Tsametis C, Konstantinidis T. 2001. Determinants of body massindex in Greek children and adolescents. J Pediatr Endocrinol Metab 14(Suppl 5):1327–1333.
Kunkel D. 1988. Children and host-selling television commercials. Commun Res 15(1):71–92.
Levin S, Martin MW, Riner WF. 2004. TV viewing habits and body mass index among SouthCarolina Head Start children. Ethn Dis 14(3):336–339.
Lewis MK, Hill AJ. 1998. Food advertising on British children’s television: A content analysisand experimental study with nine-year olds. Int J Obes Relat Metab Disord 22(3):206–214.
Lin BH, Huang CL, French SA. 2004. Factors associated with women’s and children’s bodymass indices by income status. Int J Obes Relat Metab Disord 28(4):536–542.
Locard E, Mamelle N, Billette A, Miginiac M, Munoz F, Rey S. 1992. Risk factors of obesityin a five year old population. Parental versus environmental factors. Int J Obes RelatMetab Disord 16(10):721–729.
Macklin MC. 1990. The influence of model age on children’s reactions to advertising stimuli.Psychol Market 7(4):295–310.
Macklin MC. 1994. The effects of an advertising retrieval cue on young children’s memoryand brand evaluations. Psychol Marketing 11(3):291–311.
Maffeis C, Talamini G, Tato L. 1998. Influence of diet, physical activity and parents’ obesityon children’s adiposity: A four-year longitudinal study. Int J Obes Relat Metab Disord22(8):758–764.
Manios Y, Yiannakouris N, Papoutsakis C, Moschonis G, Magkos F, Skenderi K, ZampelasA. 2004. Behavioral and physiological indices related to BMI in a cohort of primaryschoolchildren in Greece. Am J Hum Biol 16(6):639–647.
Matheson DM, Killen JD, Wang Y, Varady A, Robinson TN. 2004. Children’s food con-sumption during television viewing. Am J Clin Nutr 79(6):1088–1094.
McMurray RG, Harrell JS, Deng S, Bradley CB, Cox LM, Bangdiwala SI. 2000. The influenceof physical activity, socioeconomic status, and ethnicity on the weight status of adoles-cents. Obes Res 8(2):130–139.

466 FOOD MARKETING TO CHILDREN AND YOUTH
Miller JH, Busch P. 1979. Host selling vs. premium TV commercials: An experimental evalu-ation of their influence on children. J Market Res 16(3):323–332.
Morton HN. 1990. A survey of the television viewing habits, food behaviours, and perceptionof food advertisements among south Australian year 8 high school students. J HomeEcon Assoc Australia 22(2):34–36.
Muller MJ, Koertzinger I, Mast M, Langnase K, Grund A. 1999. Physical activity and diet in5 to 7 years old children. Public Health Nutr 2(3A):443–444.
Norton PA, Falciglia GA, Ricketts C. 2000. Motivational determinants of food preferences inadolescents and pre-adolescents. Ecology Food Nutr 39(3):169–182.
Obarzanek E, Schreiber GB, Crawford PB, Goldman SR, Barrier PM, Frederick MM, LakatosE. 1994. Energy intake and physical activity in relation to indexes of body fat: TheNational Heart, Lung, and Blood Institute Growth and Health Study. Am J Clin Nutr60(1):15–22.
O’Loughlin J, Gray-Donald K, Paradis G, Meshefedjian G. 2000. One- and two-year predic-tors of excess weight gain among elementary schoolchildren in multiethnic, low-income,inner-city neighborhoods. Am J Epidemiol 152(8):739–746.
Palmer EL, McDowell CN. 1981. Children’s understanding of nutritional information pre-sented in breakfast cereal commercials. J Broadcasting 25(3):295–301.
Pate RR, Ross JG. 1987. Factors associated with health-related fitness. The National Chil-dren and Youth Fitness Study II. J Physical Ed Recreat Dance 58:93–95.
Peterson PE, Jeffrey DB, Bridgwater CA, Dawson B. 1984. How pronutrition television pro-gramming affects children’s dietary habits. Dev Psychol 20(1):55–63.
Pine KJ, Nash A. 2003. Barbie or Betty? Preschool children’s preference for branded productsand evidence for gender-linked differences. Dev Behav Pediatr 24(4):219–224.
Proctor MH, Moore LL, Gao D, Cupples LA, Bradlee ML, Hood MY, Ellison RC. 2003.Television viewing and change in body fat from preschool to early adolescence: TheFramingham Children’s Study. Int J Obes Relat Metab Disord 27(7):827–833.
Reid LN, Bearden WO, Teel JE. 1980. Family income, TV viewing and children’s cerealratings. Journalism Q 57(2):327–330.
Reilly JJ, Armstrong J, Dorosty AR, Emmett PM, Ness A, Rogers I, Steer C, Sherriff A. 2005.Early life risk factors for obesity in childhood: Cohort study. Br Med J 330(7504):1357–1364.
Resnik A, Stern BL. 1977. Children’s television advertising and brand choice: A laboratoryexperiment. J Advert 6:11–17.
Ritchey N, Olson C. 1983. Relationships between family variables and children’s preferencefor and consumption of sweet foods. Ecology Food Nutr 13:257–266.
Robinson TN. 1999. Reducing children’s television viewing to prevent obesity. A randomizedcontrolled trial. J Am Med Assoc 282(16):1561–1567.
Robinson TN, Killen JD. 1995. Ethnic and gender differences in the relationships betweentelevision viewing and obesity, physical activity, and dietary fat intake. J Health Educ26(2):S91–S98.
Robinson TN, Hammer LD, Killen JD, Kraemer HC, Wilson DM, Hayward C, Taylor CB.1993. Does television viewing increase obesity and reduce physical activity? Cross-sec-tional and longitudinal analyses among adolescent girls. Pediatrics 91(2):273–280.
Ross RP, Campbell T, Huston-Stein A, Wright JC. 1981. Nutritional misinformation ofchildren: A developmental and experimental analysis of the effects of televised foodcommercials. J Appl Dev Psychol 1:329–347.
Shannon B, Peacock J, Brown MJ. 1991. Body fatness, television viewing and calorie-intakeof a sample of Pennsylvania sixth grade children. J Nutr Educ 23(6):262–268.
Sherwood NE, Story M, Neumark-Sztainer D, Adkins S, Davis M. 2003. Development andimplementation of a visual card-sorting technique for assessing food and activity prefer-ences and patterns in African American girls. J Am Diet Assoc 103(11):1473–1479.

APPENDIX F 467
Signorielli N, Lears M. 1992. Television and children’s conceptions of nutrition: Unhealthymessages. Health Commun 4(4):245–257.
Signorielli N, Staples J. 1997. Television and children’s conceptions of nutrition. HealthCommun 9(4):289–301.
Stettler N, Signer TM, Suter PM. 2004. Electronic games and environmental factors associ-ated with childhood obesity in Switzerland. Obes Res 12(6):896–903.
Stoneman Z, Brody GH. 1981. Peers as mediators of television food advertisements aimed atchildren. Dev Psychol 17(6):853–858.
Stoneman Z, Brody GH. 1982. The indirect impact of child-oriented advertisements onmother–child interactions. J Appl Dev Psychol 2:369–376.
Storey ML, Forshee RA, Weaver AR, Sansalone WR. 2003. Demographic and lifestyle factorsassociated with body mass index among children and adolescents. Int J Food Sci Nutr54(6):491–503.
Sugimori H, Yoshida K, Izuno T, Miyakawa M, Suka M, Sekine M, Yamagami T, KagamimoriS. 2004. Analysis of factors that influence body mass index from ages 3 to 6 years: Astudy based on the Toyama cohort study. Pediatr Int 46(3):302–310.
Tanasescu M, Ferris AM, Himmelgreen DA, Rodriguez N, Perez-Escamilla R. 2000. Bio-behavioral factors are associated with obesity in Puerto Rican children. J Nutr 130(7):1734–1742.
Taras HL, Sallis JF, Patterson TL, Nader PR, Nelson JA. 1989. Television’s influence onchildren’s diet and physical activity. Dev Behav Pediatr 10(4):176–180.
Taras H, Zive M, Nader P, Berry CC, Hoy T, Boyd C. 2000. Television advertising andclasses of food products consumed in a paediatric population. Int J Ad 19:487–493.
Toyran M, Ozmert E, Yurdakok K. 2002. Television viewing and its effect on physical healthof schoolage children. Turk J Pediatr 44(3):194–203.
Tremblay MS, Willms JD. 2003. Is the Canadian childhood obesity epidemic related to physi-cal inactivity? Int J Obes Relat Metab Disord 27(9):1100–1105.
Trost SG, Kerr LM, Ward DS, Pate RR. 2001. Physical activity and determinants of physicalactivity in obese and non-obese children. Int J Obes Relat Metab Disord 25(6):822–829.
Tucker LA. 1986. The relationship of television viewing to physical fitness and obesity.Adolescence 21(84):797–806.
Utter J, Neumark-Sztainer D, Jeffery R, Story M. 2003. Couch potatoes or French fries: Aresedentary behaviors associated with body mass index, physical activity, and dietarybehaviors among adolescents? J Am Diet Assoc 103(10):1298–1305.
Vandewater EA, Shim MS, Caplovitz AG. 2004. Linking obesity and activity level withchildren’s television and video game use. J Adolesc 27(1):71–85.
Wake M, Hesketh K, Waters E. 2003. Television, computer use and body mass index inAustralian primary school children. J Paediatr Child Health 39(2):130–134.
Waller CE, Du S, Popkin BM. 2003. Patterns of overweight, inactivity, and snacking inChinese children. Obes Res 11(8):957–961.
Wolf AM, Gortmaker SL, Cheung L, Gray HM, Herzog DB, Colditz GA. 1993. Activity,inactivity, and obesity: Racial, ethnic, and age differences among schoolgirls. Am JPublic Health 83(11):1625–1627.
Wong ND, Hei TK, Qaqundah PY, Davidson DM, Bassin SL, Gold KV. 1992. Televisionviewing and pediatric hypercholesterolemia. Pediatrics 90(1):75–79.
Woodward DR, Cumming FJ, Ball PJ, Williams HM, Hornsby H, Boon JA. 1997. Doestelevision affect teenagers’ food choices? J Human Nutr Diet 10:229–235.
Yavas U, Abdul-Gader A. 1993. Impact of TV commercials on Saudi children’s purchasebehaviour. Marketing Intelligence Planning 11(2):37–43.
Zive MM, Frank-Spohrer GC, Sallis JF, McKenzie TL, Elder JP, Berry CC, Broyles SL, NaderPR. 1998. Determinants of dietary intake in a sample of white and Mexican-Americanchildren. J Am Diet Assoc 98(11):1282–1289.

468
G
Children and Youth Marketingand Advertising Regulations
and Guidelines in Selected Countries
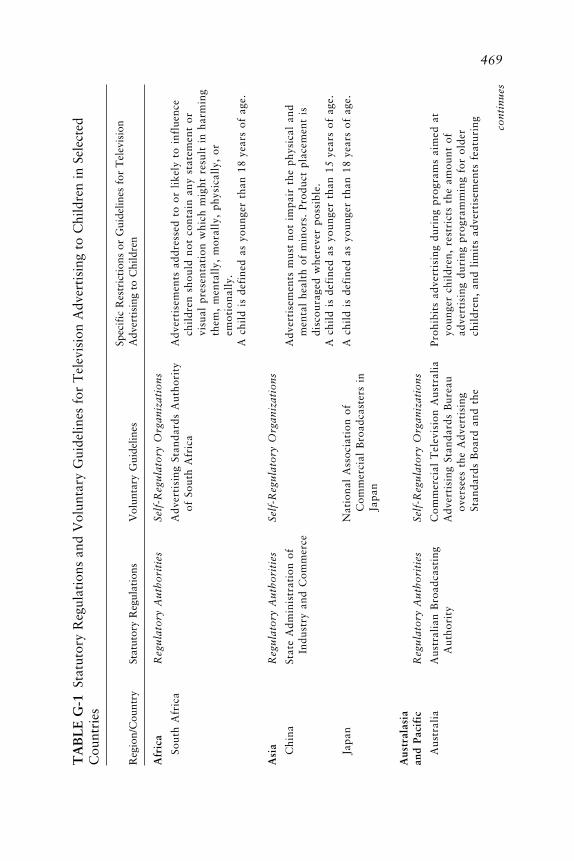
469T
AB
LE
G-1
Stat
utor
y R
egul
atio
ns a
nd V
olun
tary
Gui
delin
es f
or T
elev
isio
n A
dver
tisi
ng t
o C
hild
ren
in S
elec
ted
Cou
ntri
es
Spec
ific
Res
tric
tion
s or
Gui
delin
es f
or T
elev
isio
nR
egio
n/C
ount
rySt
atut
ory
Reg
ulat
ions
Vol
unta
ry G
uide
lines
Adv
erti
sing
to
Chi
ldre
n
Afr
ica
Reg
ula
tory
Au
tho
riti
esSe
lf-R
egu
lato
ry O
rgan
izat
ion
s
Sout
h A
fric
aA
dver
tisi
ng S
tand
ards
Aut
hori
tyA
dver
tise
men
ts a
ddre
ssed
to
or l
ikel
y to
inf
luen
ceof
Sou
th A
fric
ach
ildr
en s
houl
d no
t co
ntai
n an
y st
atem
ent
orvi
sual
pre
sent
atio
n w
hich
mig
ht r
esul
t in
har
min
gth
em,
men
tall
y, m
oral
ly,
phys
ical
ly,
orem
oti
on
ally
.A
chi
ld i
s de
fine
d as
you
nger
tha
n 18
year
s of
age
.
Asi
aR
egu
lato
ry A
uth
ori
ties
Self
-Reg
ula
tory
Org
aniz
atio
ns
Chi
naSt
ate
Adm
inis
trat
ion
ofA
dver
tise
men
ts m
ust
not
impa
ir t
he p
hysi
cal
and
Indu
stry
and
Com
mer
cem
enta
l he
alth
of
min
ors.
Pro
duct
pla
cem
ent
isdi
scou
rage
d w
here
ver
poss
ible
.A
chi
ld i
s de
fine
d as
you
nger
tha
n 15
year
s of
age
.
Japa
nN
atio
nal
Ass
ocia
tion
of
A c
hild
is
defi
ned
as y
oung
e r t
han
18ye
ars
of a
ge.
Com
me r
c ial
Bro
adca
ste r
s in
Jap
an
Aus
tral
asia
and
Pac i
fic
Reg
ula
tory
Au
tho
riti
e sSe
lf-R
e gu
lato
ry O
rgan
izat
ion
s
Aus
tral
iaA
ustr
alia
n B
road
cast
ing
Com
me r
c ial
Te l
e vis
ion
Aus
tral
iaPr
ohib
its
adve
rtis
ing
duri
ng p
rogr
ams
aim
ed a
tA
utho
rity
Adv
e rti
sing
Sta
ndar
ds B
ure a
uyo
unge
r c h
ildr
e n,
rest
ric t
s th
e am
ount
of
ove r
see s
the
Adv
e rti
sing
adve
rtis
ing
duri
ng p
rogr
amm
ing
for
olde
rSt
anda
rds
Boa
rd a
nd t
hec h
ildr
e n,
and
lim
its
adve
rtis
emen
ts f
e atu
ring c o
nti
nu
e s

470
Adv
erti
sing
Cla
ims
Boa
rdch
ildr
en’s
tel
evis
ion
pers
onal
itie
s.A
chi
ld i
s de
fine
d as
14
year
s of
age
and
you
nger
.
New
Zea
land
Adv
erti
sing
Sta
ndar
ds A
utho
rity
No
adve
rtis
emen
ts a
re a
llow
ed t
o be
bro
adca
st o
nN
ew Z
eala
nd T
elev
isio
npr
esch
ool
tele
visi
on o
r Su
nday
mor
ning
s. T
here
is
Bro
adca
ster
s’ C
ounc
illi
mit
ed a
dver
tisi
ng i
n sc
hool
-age
chi
ldre
n’s
tele
visi
on
.Pr
ohib
its
prod
ucts
fro
m b
eing
adv
erti
sed
wit
hin
ate
levi
sion
pro
gram
tha
t co
me
dire
ctly
fro
m a
prog
ram
or
its
lice
nsed
cha
ract
ers.
Rep
etit
ion
ofad
vert
isem
ents
is
lim
ited
per
hou
r an
d pe
rch
ann
el.
Phil
ippi
nes
AdB
oard
Eur
ope
Reg
ula
tory
Au
tho
riti
esSe
lf-R
egu
lato
ry O
rgan
izat
ion
s
EU
aE
U T
e le v
isio
n W
itho
utE
urop
ean
Adv
e rti
sing
Sta
ndar
dsPr
ohib
its
adve
rtis
emen
ts t
o c h
ildr
e n t
hat
(1)
e xpl
oit
Fron
tie r
s D
ire c
tive
All
ianc
e (E
ASA
)th
e ir
ine x
peri
e nc e
or
c re d
ulit
y; (
2)un
ders
tate
the
Inte
rnat
iona
l C
ham
ber
ofde
gre e
of
skil
l or
age
le v
e l r
e qui
red
to u
se o
rC
omm
e rc e
(IC
C)
e njo
y th
e pr
oduc
t; a
nd (
3)c o
ntai
n an
y st
atem
ent
or v
isua
l pr
e se n
tati
on t
hat
c oul
d ha
ve t
he e
ffe c
t of
harm
ing
men
tall
y, m
oral
ly,
or p
hysi
c all
y.T
he I
CC
’s C
omm
issi
on o
n M
arke
ting
and
Adv
e rti
sing
adh
e re s
to
the
Fram
ewor
k fo
rR
e spo
nsib
le F
ood
and
Bev
e rag
e C
omm
unic
atio
ns.
Min
ors
are
defi
ned
unde
r na
tion
al l
aws.
Be l
gium
EU
Te l
e vis
ion
Wit
hout
Jury
for
Eth
ical
Pra
c tic
e s i
nPr
ohib
its
adve
rtis
ing
befo
re a
nd a
fte r
chi
ldre
n’s
Fron
tie r
s D
ire c
tive
Adv
e rti
sing
tele
visi
on p
rogr
ams.
TA
BL
E G
-1C
onti
nued
Spec
ific
Res
tric
tion
s or
Gui
delin
es f
or T
elev
isio
nR
egio
n/C
ount
rySt
atut
ory
Reg
ulat
ions
Vol
unta
ry G
uide
lines
Adv
erti
sing
to
Chi
ldre
n

471T
he M
inis
try
of E
cono
mic
The
Wor
ld F
eder
atio
n of
See
EU
. A
chi
ld i
s de
fine
d as
you
nger
tha
n 12
year
sA
ffai
rs;
Min
istr
y of
Adv
erti
sers
ove
rsee
s th
eof
age
.Pu
blic
Hea
lth;
Hig
hR
espo
nsib
le A
dver
tisi
ng a
ndA
udio
visu
al C
ounc
il;
Chi
ldre
n Pr
ogra
mm
eFl
emis
h M
edia
Co
mm
issa
riat
Cze
ch R
epub
lic
EU
Tel
evis
ion
Wit
hout
Rad
a Pr
o R
ekla
mu
Adv
erti
sing
of
vari
ous
cont
ent
is b
anne
d to
chi
ldre
nFr
onti
ers
Dir
ecti
veth
at s
how
s th
em i
n da
nger
ous
situ
atio
ns.
See
EU
.
Den
mar
kE
U T
elev
isio
n W
itho
utR
ekla
me
Proh
ibit
s fi
gure
s an
d pu
ppet
s th
at a
ppea
r in
Fron
tier
s D
irec
tive
Foru
mch
ildr
en’s
pro
gram
s fr
om a
ppea
ring
in
The
Mar
ket
Cou
rt;
The
adve
rtis
emen
ts.
Con
sum
er O
mbu
dsm
an;
See
EU
.T
he C
onsu
mer
Cou
ncil
;A
chi
ld i
s de
fine
d as
you
nger
tha
n 18
year
s of
age
.T
he R
adio
and
Tel
evis
ion
Adv
erti
sem
ents
Boa
rd;
The
Nat
iona
l Fo
odIn
stit
ute
Finl
and
Con
sum
er P
rote
ctio
n A
ctB
oard
of
Bus
ines
s Pr
acti
ceA
dver
tise
men
ts a
re p
rohi
bite
d th
at a
ttem
pt t
oC
onsu
me r
Om
buds
men
pers
uade
a c
hild
to
buy
a pr
oduc
t th
roug
h a
dire
c to
ffe r
.A
dve r
tise
men
ts a
re p
rohi
bite
d in
whi
c h s
ale s
pit
c he s
are
deli
vere
d by
fam
ilia
r c a
rtoo
n c h
arac
ters
or
c hil
dre
n.
A c
hild
is
defi
ned
as y
oung
e r t
han
12ye
ars
of a
ge.
Fran
c eE
U T
e le v
isio
n W
itho
utB
ure a
u de
Vé r
ific
atio
n de
la
Prov
ide s
se v
e ral
re c
omm
enda
tion
s to
ens
ure
that
Fron
tie r
s D
ire c
tive
Pu
bli
c ité
adve
rtis
ing
doe s
not
exp
loit
the
ine
xpe r
ienc
e or
inno
c enc
e of
chi
ldre
n.Se
e E
U.
c on
tin
ue s

472
Gre
ece
EU
Tel
evis
ion
Wit
hout
Hel
leni
c A
ssoc
iati
on o
fE
nfor
ces
rest
rict
ions
on
adve
rtis
ing
to c
hild
ren
Fron
tier
s D
irec
tive
Adv
erti
sing
Com
mun
icat
ions
duri
ng s
peci
fic
tim
es.
and
Gre
ek A
dver
tise
rs’
See
EU
.A
sso
ciat
ion
Hun
gary
EU
Tel
evis
ion
Wit
hout
Hun
gari
an A
dver
tisi
ngPr
ovid
es g
uide
line
s pe
rtai
ning
to
adve
rtis
ing
mad
eFr
onti
ers
Dir
ecti
veA
ssoc
iati
on c
reat
ed t
hefo
r or
fea
turi
ng c
hild
ren.
Ors
zágo
s R
ádió
és
Hun
gari
an C
ode
ofSe
e E
U.
Tel
evíz
ió T
estü
let
Adv
erti
sing
Eth
ics
(Nat
iona
l R
adio
and
Tel
evis
ion
Com
mis
sion
)
Irel
and
EU
Tel
evis
ion
Wit
hout
Adv
erti
sing
Sta
ndar
ds A
utho
rity
RT
E p
rohi
bits
bro
adca
st s
pons
orsh
ip o
f an
yFr
onti
ers
Dir
ecti
veof
Ire
land
chil
dren
’s p
rogr
ams.
Bro
adca
stin
g C
omm
issi
onR
adio
Tel
efis
Eir
eann
(R
TE
)Se
e E
U.
of I
rela
nd
Ital
yE
U T
e le v
isio
n W
itho
utIs
titu
to d
i A
utod
isc i
plin
aE
nfor
c es
adve
rtis
ing
guid
e lin
e s d
e ve l
oped
for
Fron
tie r
s D
ire c
tive
Publ
icit
aria
(IA
P) (
Inst
itut
epr
ogra
ms
feat
urin
g c h
ildr
e n i
nclu
ding
dur
ing
for
Self
-Re g
ulat
ion
inc a
rtoo
ns a
nd u
sing
car
toon
cha
rac t
e rs
befo
re a
ndA
dve r
tisi
ng)
afte
r th
e te
levi
sion
pro
gram
s in
whi
c h t
hey
app
ear.
Ne t
herl
ands
EU
Dir
e cti
ve o
nT
he A
dve r
tisi
ng F
ound
atio
nB
ans
adve
rtis
ing
of a
lcoh
ol a
nd s
we e
ts o
n te
levi
sion
Com
para
tive
Adv
e rti
sing
to c
hild
ren.
A c
hild
is
defi
ned
as y
oung
e r t
han
12ye
ars
of a
ge.
Nor
way
Nor
weg
ian
Mas
s A
utho
rity
Inst
itut
e d a
ban
on
adve
rtis
ing
to c
hild
ren
youn
ger
The
Con
sum
e r O
mbu
dsm
enth
an 1
2ye
ars
of a
ge i
n 19
92.
TA
BL
E G
-1C
onti
nued
Spec
ific
Res
tric
tion
s or
Gui
delin
es f
or T
elev
isio
nR
egio
n/C
ount
rySt
atut
ory
Reg
ulat
ions
Vol
unta
ry G
uide
lines
Adv
erti
sing
to
Chi
ldre
n

473Pr
ohib
its
broa
dcas
t ad
vert
isin
g be
fore
and
aft
erch
ildr
en’s
pro
gram
s th
roug
h th
e N
orw
egia
nM
arke
ting
Con
trol
Act
.
Swed
enE
U T
elev
isio
n W
itho
utC
ounc
il o
n M
arke
t E
thic
sIn
stit
uted
a b
an o
n ad
vert
isin
g to
chi
ldre
n yo
unge
rFr
onti
ers
Dir
ecti
veth
an 1
2ye
ars
of a
ge i
n 19
91.
The
Con
sum
er O
mbu
dsm
enPr
ohib
its
adve
rtis
ing
duri
ng c
hild
ren’
s pr
ogra
ms
and
on u
sing
tel
evis
ion
char
acte
rs o
r pr
esen
ters
in
adve
rtis
emen
ts.
Uni
ted
Kin
gdom
EU
Tel
evis
ion
Adv
erti
sing
Sta
ndar
ds A
utho
rity
Proh
ibit
s ch
ildr
en’s
tel
evis
ion
pers
onal
itie
s fr
omW
itho
ut F
ront
iers
adve
rtis
ing
befo
re a
spe
cifi
c ti
me
and
incl
udes
Dir
ecti
vela
ngua
ge p
rohi
biti
ng m
erch
andi
sing
wit
hin
Off
ice
of C
omm
unic
atio
nstw
oho
urs
of a
tel
evis
ion
prog
ram
.(O
fcom
)C
reat
ed a
dver
tisi
ng-f
ree
chil
dren
’s t
elev
isio
nch
ann
els.
A c
hild
is
defi
ned
as y
oung
er t
han
16ye
ars
of a
ge.
Lat
in A
mer
ica
Reg
ula
tory
Au
tho
riti
esSe
lf-R
egu
lato
ry O
rgan
izat
ion
s
Arg
enti
naFe
dera
l re
gula
tion
sC
amar
a A
rgen
tina
de
Adv
erti
sing
dir
ecte
d at
chi
ldre
n an
d ad
oles
cent
sfo
r ad
vert
isin
gA
nunc
iant
es (
Arg
enti
nem
ust
adhe
re t
o es
tabl
ishe
d gu
idel
ines
.C
ham
ber
of A
dve r
tise
rs)
Ass
ocia
tion
of
Adv
e rti
sing
Age
ncie
s in
Arg
e nti
na,
Uni
fie d
Cod
e of
Eth
ics
ofth
e M
e rc o
sur
Bra
z il
Con
sum
e r D
e fe n
se C
ode
Ass
ocia
tion
of
Adv
e rti
sing
Adv
e rti
sing
dir
e cte
d at
chi
ldre
n an
d ad
ole s
c ent
sA
genc
ies
in B
raz i
l, U
nifi
e dm
ust
adhe
re t
o e s
tabl
ishe
d gu
ide l
ine s
.C
ode
of E
thic
s of
the
Me r
c osu
rSe
lf-r
e gul
atin
g A
dve r
tisi
ngC
ounc
il (
CO
NA
R)
c on
tin
ue s
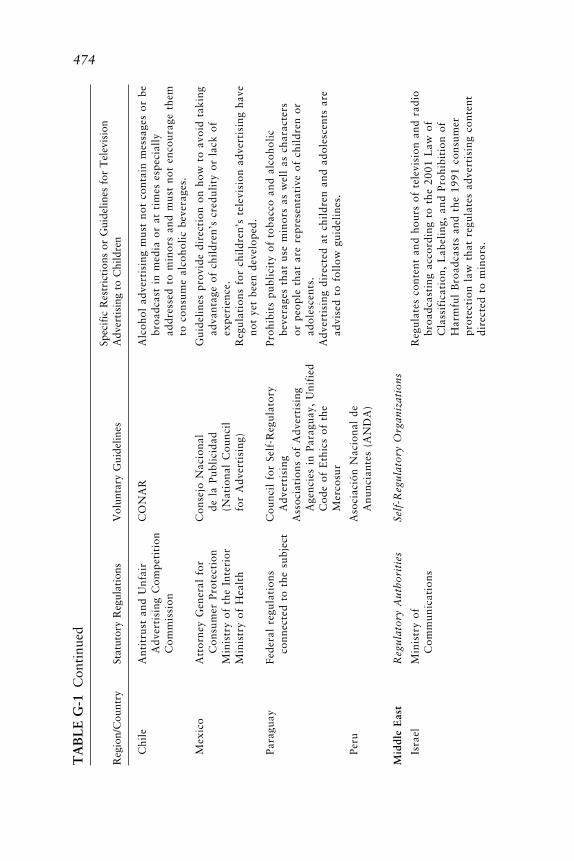
474
Chi
leA
ntit
rust
and
Unf
air
CO
NA
RA
lcoh
ol a
dver
tisi
ng m
ust
not
cont
ain
mes
sage
s or
be
Adv
erti
sing
Com
peti
tion
broa
dcas
t in
med
ia o
r at
tim
es e
spec
iall
yC
omm
issi
onad
dres
sed
to m
inor
s an
d m
ust
not
enco
urag
e th
emto
con
sum
e al
coho
lic
beve
rage
s.
Mex
ico
Att
orne
y G
ener
al f
orC
onse
jo N
acio
nal
Gui
deli
nes
prov
ide
dire
ctio
n on
how
to
avoi
d ta
king
Con
sum
er P
rote
ctio
nde
la
Publ
icid
adad
vant
age
of c
hild
ren’
s cr
edul
ity
or l
ack
ofM
inis
try
of t
he I
nter
ior
(Nat
iona
l C
ounc
ilex
per
ien
ce.
Min
istr
y of
Hea
lth
for
Adv
erti
sing
)R
egul
atio
ns f
or c
hild
ren’
s te
levi
sion
adv
erti
sing
hav
eno
t ye
t be
en d
evel
oped
.
Para
guay
Fede
ral
regu
lati
ons
Cou
ncil
for
Sel
f-R
egul
ator
yPr
ohib
its
publ
icit
y of
tob
acco
and
alc
ohol
icco
nnec
ted
to t
he s
ubje
ctA
dver
tisi
ngbe
vera
ges
that
use
min
ors
as w
ell
as c
hara
cter
sA
ssoc
iati
ons
of A
dver
tisi
ngor
peo
ple
that
are
rep
rese
ntat
ive
of c
hild
ren
orA
genc
ies
in P
arag
uay,
Uni
fied
ado
lesc
ents
.C
ode
of E
thic
s of
the
Adv
erti
sing
dir
ecte
d at
chi
ldre
n an
d ad
oles
cent
s ar
eM
erco
sur
advi
sed
to f
ollo
w g
uide
line
s.
Peru
Aso
c iac
ión
Nac
iona
l de
Anu
ncia
nte s
(A
ND
A)
Mid
dle
Eas
tR
egu
lato
ry A
uth
ori
tie s
Self
-Re g
ula
tory
Org
aniz
atio
ns
Isra
e lM
inis
try
ofR
e gul
ate s
con
tent
and
hou
rs o
f te
levi
sion
and
rad
ioC
omm
unic
atio
nsbr
oadc
asti
ng a
c cor
ding
to
the
2001
Law
of
Cla
ssif
icat
ion,
Lab
e lin
g, a
nd P
rohi
biti
on o
fH
arm
ful
Bro
adca
sts
and
the
1991
con
sum
e rpr
ote c
tion
law
tha
t re
gula
tes
adve
rtis
ing
c ont
e nt
dire
c te d
to
min
ors.
TA
BL
E G
-1C
onti
nued
Spec
ific
Res
tric
tion
s or
Gui
delin
es f
or T
elev
isio
nR
egio
n/C
ount
rySt
atut
ory
Reg
ulat
ions
Vol
unta
ry G
uide
lines
Adv
erti
sing
to
Chi
ldre
n
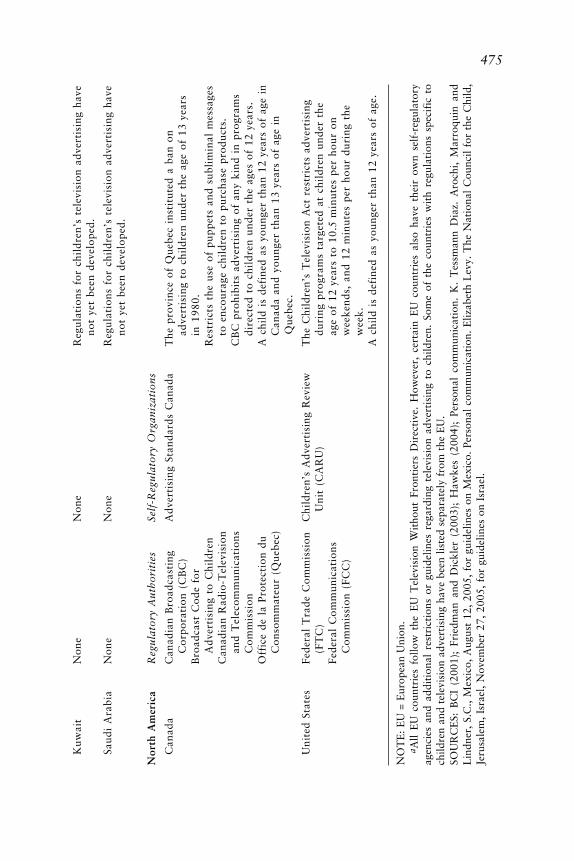
475K
uwai
tN
one
Non
eR
egul
atio
ns f
or c
hild
ren
’s t
elev
isio
n ad
vert
isin
g ha
veno
t ye
t be
en d
evel
oped
.
Saud
i A
rabi
aN
one
Non
eR
egul
atio
ns f
or c
hild
ren
’s t
elev
isio
n ad
vert
isin
g ha
veno
t ye
t be
en d
evel
oped
.
Nor
th A
mer
ica
Reg
ula
tory
Au
tho
riti
esSe
lf-R
egu
lato
ry O
rgan
izat
ion
s
Can
ada
Can
adia
n B
road
cast
ing
Adv
erti
sing
Sta
ndar
ds C
anad
aT
he p
rovi
nce
of Q
uebe
c in
stit
uted
a b
an o
nC
orpo
rati
on (
CB
C)
adve
rtis
ing
to c
hild
ren
unde
r th
e ag
e of
13
year
sB
road
cast
Cod
e fo
rin
198
0.A
dver
tisi
ng t
o C
hild
ren
Res
tric
ts t
he u
se o
f pu
ppet
s an
d su
blim
inal
mes
sage
sC
anad
ian
Rad
io-T
elev
isio
nto
enc
oura
ge c
hild
ren
to p
urch
ase
prod
ucts
.an
d T
elec
omm
unic
atio
nsC
BC
pro
hibi
ts a
dver
tisi
ng o
f an
y ki
nd i
n pr
ogra
ms
Com
mis
sion
dire
cted
to
chil
dren
und
er t
he a
ges
of 1
2ye
ars.
Off
ice
de l
a Pr
otec
tion
du
A c
hild
is
defi
ned
as y
oung
er t
han
12ye
ars
of a
ge i
nC
onso
mm
ateu
r (Q
uebe
c)C
anad
a an
d yo
unge
r th
an 1
3ye
ars
of a
ge i
nQ
uebe
c.
Uni
ted
Stat
esFe
dera
l T
rade
Com
mis
sion
Chi
ldre
n’s
Adv
erti
sing
Rev
iew
The
Chi
ldre
n’s
Tel
evis
ion
Act
res
tric
ts a
dver
tisi
ng(F
TC
)U
nit
(C
AR
U)
duri
ng p
rogr
ams
targ
eted
at
chil
dren
und
er t
heFe
dera
l C
omm
unic
atio
nsag
e of
12
year
s to
10.
5m
inut
es p
er h
our
onC
omm
issi
on (
FCC
)w
e eke
nds,
and
12
min
ute s
pe r
hou
r du
ring
the
we e
k.
A c
hild
is
defi
ned
as y
oung
e r t
han
12ye
ars
of a
ge.
NO
TE
: E
U =
Eur
opea
n U
nion
.a A
ll E
U c
ount
ries
fol
low
the
EU
Tel
evis
ion
Wit
hout
Fro
ntie
rs D
irec
tive
. H
owev
er,
cert
ain
EU
cou
ntri
es a
lso
have
the
ir o
wn
self
-reg
ulat
ory
agen
cies
and
add
itio
nal
rest
rict
ions
or
guid
elin
es r
egar
ding
tel
evis
ion
adve
rtis
ing
to c
hild
ren.
Som
e of
the
cou
ntri
es w
ith
regu
lati
ons
spec
ific
to
child
ren
and
tele
visi
on a
dver
tisi
ng h
ave
been
lis
ted
sepa
rate
ly f
rom
the
EU
.SO
UR
CE
S: B
CI
(200
1);
Frie
dman
and
Dic
kler
(20
03);
Haw
kes
(200
4);
Pers
onal
com
mun
icat
ion.
K.
Tes
sman
n D
iaz.
Aro
chi,
Mar
roqu
in a
ndL
indn
er,
S.C
., M
exic
o, A
ugus
t 12
, 20
05,
for
guid
elin
es o
n M
exic
o. P
erso
nal
com
mun
icat
ion.
Eliz
abet
h L
evy.
The
Nat
iona
l C
ounc
il fo
r th
e C
hild
,Je
rusa
lem
, Is
rael
, N
ovem
ber
27,
2005
, fo
r gu
idel
ines
on
Isra
el.

476T
AB
LE
G-2
Stat
utor
y or
Vol
unta
ry R
egul
atio
ns f
or M
arke
ting
App
roac
hes
Use
d fo
r Fo
od a
nd B
ever
age
Prom
otio
nto
Chi
ldre
n
Sele
cted
Reg
ion
orT
elev
isio
nIn
-Sch
ool
Prod
uct
Inte
rnet
Sale
sC
ount
ryA
dver
tisi
ngM
arke
ting
Spon
sors
hip
Plac
emen
taM
arke
ting
bPr
omot
ions
Afr
ica
Sout
h A
fric
aX
XA
sia Chi
naX
XX
Indi
aX
XJa
pan
XX
XR
ussi
an F
eder
atio
nX
Tha
ilan
dA
ustr
alas
ia a
nd P
acif
icA
ustr
alia
XX
XX
XN
ew Z
eala
ndX
XPh
ilip
pine
sX
XL
atin
Am
eric
aA
rgen
tina
XB
raz i
lX
XC
hile
XM
exic
oX
XE
urop
eA
ustr
iaX
XX
Be l
gium
XX
XX
Cz e
c h R
e pub
lic
XX
Den
mar
kX
XX
XFi
nlan
dX
XX
XX
XFr
anc e
XX
XX
Ge r
man
yX
XX
XG
ree c
eX
XX
X

477Ir
elan
dX
XX
XX
Ital
yX
XX
XN
ethe
rlan
dsX
XX
XX
Nor
way
XX
XX
Pola
ndX
Port
ugal
XX
XSp
ain
XX
XSw
eden
XX
XX
Swit
zerl
and
XX
Uni
ted
Kin
gdom
XX
XX
XM
iddl
e E
ast
Saud
i A
rabi
aX
Nor
th A
mer
ica
Can
ada
XX
XQ
uebe
cX
XU
nite
d St
ates
XX
XX
X
NO
TE
: The
fol
low
ing
defi
niti
ons
wer
e us
ed f
or t
he p
urpo
se o
f th
is t
able
and
may
dif
fer
from
ter
ms
used
thr
ough
out
the
repo
rt: t
elev
isio
n ad
vert
isin
gis
the
use
of
tele
visi
on a
s a
med
ium
to
prom
ote
a pr
oduc
t or
ser
vice
; in-
scho
ol m
arke
ting
is
a te
chni
que
used
to
spre
ad a
dver
tisi
ng m
essa
ges
targ
eted
at c
hild
ren
whi
le t
hey
are
in t
he s
choo
l en
viro
nmen
t; s
pons
orsh
ip i
s th
e pr
ovis
ion
of f
unds
and
oth
er r
esou
rces
to
an e
vent
or
acti
vity
in
retu
rn f
orac
cess
to
the
expl
oita
ble
com
mer
cial
pot
enti
al a
ssoc
iate
d w
ith
that
act
ivit
y; p
rodu
ct p
lace
men
t is
the
use
of
any
mes
sage
, lo
go,
obje
ct,
or p
rop
that
appe
ars
in a
vis
ual
or g
raph
ic i
n ex
chan
ge f
or p
aym
ent;
Int
erne
t m
arke
ting
is
a pr
omot
iona
l ac
tivi
ty o
n th
e In
tern
et t
o co
nnec
t co
nsum
ers
to a
mar
kete
r ’s
prod
ucts
; an
d sa
les
prom
otio
ns a
re m
arke
ting
too
ls u
sed
to c
reat
e an
inc
enti
ve t
o bu
y a
prod
uct
or s
ervi
ce a
t th
e po
int
of s
ale.
a Sta
tuto
ry r
estr
icti
ons
on p
rodu
ct p
lace
men
t in
tel
evis
ion
prog
ram
s on
ly;
prod
uct
plac
emen
t in
film
s is
not
sub
ject
to
stat
utor
y re
gula
tion
s.b R
egul
atio
ns o
n In
tern
et m
arke
ting
wit
h cl
ause
s sp
ecif
ic t
o ch
ildre
n.SO
UR
CE
: H
awke
s (2
004)
.

478 FOOD MARKETING TO CHILDREN AND YOUTH
REFERENCES
BCI (Broadcasting Commission of Ireland). 2001. Children’s Advertising Code. Dublin, Ire-land: BCI.
Friedman AE, Dickler H. 2003. International Advertising Clearance. Amsterdam, Nether-lands: Global Advertising Lawyers Alliance.
Hawkes C. 2004. Marketing Food to Children: The Global Regulatory Environment. Geneva:World Health Organization.
ENDNOTES FROM CHAPTER 6
1. Similarly, the court rejected the claim that McDonald’s had failed to warn consumersabout the unhealthy attributes of its food on the grounds that the plaintiffs had notshown that such products “were dangerous in any way other than that which was openand obvious to a reasonable consumer.” Id. at 541. The federal court also found that theplaintiffs had failed to “draw an adequate causal connection between their consumptionof McDonald’s food and their alleged injuries.” Pelman v. McDonald’s Corporation,2003 WL 22052778, at *11 (2003). Plaintiffs failed to answer “pertinent” questionsthat would help establish causation, including: What else did the plaintiffs eat? Howmuch did they exercise? Is there a family history of the diseases which are alleged to havebeen caused by McDonald’s products? Without this additional information, McDonald’sdoes not have sufficient information to determine if its foods are the cause of plaintiffs’obesity, or if instead McDonald’s foods are only a contributing factor. Id. at *11. Thedistrict court was recently reversed on the ground that the plaintiffs ought to be able topursue discovery on the issue of whether their obesity (and related medical conditions)were caused by McDonald’s deceptive practices. Pelman v. McDonald’s Corporation,No. 03-9010, slip op. at 6 (2d Cir. Jan. 25, 2005).
2. The FTC “will find deception if there is a representation, omission or practice that islikely to mislead the consumer acting reasonably in the circumstances, to the consumer’sdetriment.” Federal Trade Commission Policy Statement on Deception, appended toCliffdale Associates, Inc., 103 F.T.C. 110, 174 (1984). An “unfair” act or practice is onethat “causes or is likely to cause substantial injury to consumers which is not reasonablyavoidable by consumers themselves and not outweighed by countervailing benefits toconsumers or to competition.” 15 U.S.C. § 45(n), 2002.
3. The statute defines the term “false advertisement” to mean “an advertisement, otherthan labeling, which is misleading in a material respect; and in determining whether anyadvertisement is misleading, there shall be taken into account (among other things) notonly representations made or suggested by statement, word, design, device, sound, orany combination thereof, but also the extent to which the advertisement fails to revealfacts material in the light of such representations or material with respect to conse-quences which may result from the use of the commodity to which the advertisementrelates under the conditions prescribed in said advertisement, or under such conditionsas are customary or usual.” 15 U.S.C. § 55(a)(1), 2002.
4. See, e.g., 16 C.F.R. § 410.1, 2005, rule on deceptive advertising as to sizes of viewablepictures on television sets; 16 C.F.R. § 239.1-5, 2005, rule on deceptive advertising ofguarantees.
5. In assessing products liability claims involving children, for example, courts often distin-guish between what can be expected of a “reasonable child” and a “reasonable adult.”See, e.g., Swix v. Daisy Manufacturing Company, 2004 (holding, in a products liabilityaction, that the “reasonable child”—and not “reasonable adult”— standard should ap-ply when typical user of the product is a child); Bunch v. Hoffinger Industries, Inc.,
APPENDIX G 479
2004 (upholding a trial court’s application of the “reasonable child” standard in aproducts liability case. In explaining its decision, the court stated “a distinction must bemade between an adult’s ability to recognize and appreciate certain risks and a minor’scorresponding ability. Certain conditions considered harmless to adults may not be so tothe general class of children who, by reason of their immaturity, might be incapable ofappreciating the risk involved.”)
6. Codified as amended in scattered sections of 15 U.S.C. (2002).7. The Central Hudson test has been applied in very inconsistent ways by the Court itself.
Compare, e.g., Posadas de Puerto Rico Associates v. Tourism Company (1986), withRubin v. Coors Brewing Company (1995). More than a majority of the Justices haveindicated their dissatisfaction with the test. See 44 Liquormart, Inc. v. Rhode Island,(1996). Yet the Court has continued to apply the test, with increasing severity, despite itsdiscomforts. See, e.g., Greater New Orleans Broadcasting Association v. United States,1999; Lorillard Tobacco Company v. Reilly, 2001; Thompson v. Western States Medi-cal Center, 2002.
8. Peel v. Attorney Registration and Disciplinary Commission, 1990; In R.M.J., 455 U.S.191, 203 (1982) (“Truthful advertising related to lawful activities is entitled to theprotections of the First Amendment. But when the particular content or method of theadvertising suggests that it is inherently misleading or when experience has proved thatin fact such advertising is subject to abuse, the States may impose appropriate restric-tions. Misleading advertising may be prohibited entirely.)
9. In a pre-Central Hudson case, the Supreme Court suggested that certain marketing oradvertising practices aimed at children can be regulated by the FTC, even when no fraudor deception has occurred, because they target “children, too young to be capable ofexercising an intelligent judgment of the transaction” and such practices “exploit con-sumers . . . who are unable to protect themselves” (FTC v. R. F. Keppel & Brothers,Inc., 1934).
10. See Central Hudson Gas & Electric Company v. Public Service Commission, 1980;Rubin v. Coors Brewing Company (1995); United States v. Edge Broadcasting Com-pany, 1993.
11. Lorillard Tobacco Company v. Reilly, 2001, at 556 (quoting Fla. Bar v. Went For It,Inc., 515 U.S. 618, 632 (1995) (quoting Bd. of Trustees of State Univ. of N.Y. v. Fox,492 U.S. 469, 477 (1989).
12. “A commercial advertisement is constitutionally protected not so much because it per-tains to the seller’s business as because it furthers the societal interest in the ‘free flow ofcommercial information.’” (Quoting Virginia State Board of Pharmacy v. Virginia Citi-zens Consumer Council, Inc., 1976.)
13. “It is only when the decision to censor a school-sponsored [speech] . . . has no valideducational purpose that the First Amendment . . . require[s] judicial intervention toprotect students’ constitutional rights.” (Quotations omitted.) (Hazelwood School Dis-trict v. Kuhlmeier, 1988).
14. Red Lion Broadcasting Company v. FCC, at 376, 383, 389 (1969) (holding a broadcastlicensee can, consistent with the First Amendment, be required to serve “as a proxy orfiduciary with obligations to present those views and voices which are representative ofhis community and which would otherwise, by necessity, be barred from the airwaves”);see also Columbia Broadcasting System, Inc. v. Democratic National Committee, 1973.In most areas of First Amendment jurisprudence, the rights of speakers are paramount.In the context of the broadcast media, however, the Court has said, “[T]he people as awhole retain their interest in free speech by radio and their collective right to have themedium function consistently with the ends and purposes of the First Amendment. It isthe right of the viewers and listeners, not the right of the broadcasters, which is para-mount.” Red Lion Broadcasting Company v. FCC (1969).

480 FOOD MARKETING TO CHILDREN AND YOUTH
15. Codified as amended in scattered sections of 47 U.S.C. (2002).16. 47 U.S.C. § 303a(b) (2002). The Act applies to all television broadcasters including
cable operators, home shopping stations, and educational, and noncommercial broad-casters. Policies and Rules Concerning Children’s Television Programming (Memoran-dum Opinion and Order), 6 FCC Record 5093, paragraphs 4, 16, 44 (1991). The FCCexempts cable operators in circumstances where a “cable system’s passive retransmissionof a broadcast signal and its passive role with respect to access channel programming.”Id. at para. 6. The FCC also exempts noncommercial broadcasters from the “recordcompilation, filing and submission requirements.” Id. at para 45. Since March 2004, theAct has also applied to direct broadcast satellite (DBS). Implementation of Section 25 ofthe Cable Television Consumer Protection and Competition Act of 1992; Direct Broad-cast Satellite Public Interest Obligations, 19 FCC Record 5647, paragraph 48 (2004).
17. Policies and Rules Concerning Children’s Television Programming (Report and Order),6 FCC Record. 2111, paragraph 3 (1991).
18. 6 FCC Record 5093, paragraph 39.19. 6 FCC Record 2111, paragraph 44. The FTC also has promulgated rules regulating
program-length commercials. These rules mandate certain disclosure requirements forprogram-length commercials.
20. Congress enacted the Children’s Online Privacy Protection Act (COPPA) in 1998, andthe FTC rules implementing the Act went into effect in April 2000. Children’s OnlinePrivacy Protection Rule, 16 C.F.R. § 312.1 et seq. (2005) (implementing COPPA).
21. The FCC also regulates some uses of Internet-related advertising. Under rules promul-gated by the FCC, during television programming directed at children 12 years old andunder, Internet website addresses can be displayed only if the website offers a substantialamount of bona fide program-related or other noncommercial content, the website isnot primarily intended for commercial purposes (including either e-commerce or adver-tising), the website’s home page and other menu pages are clearly labeled to distinguishnoncommercial from commercial sections, and the page of the website to which viewersare directed by the website address is not used for e-commerce, advertising, or othercommercial purposes. 47 C.F.R. § 73.670(b) (2004). In addition, website addressescannot be displayed during a program or the commercials that air during that program ifthe website uses characters from the program to sell products or services.

481
H
Workshop Program
Marketing Strategies That Foster Healthy Food and BeverageChoices in Children and Youth
Workshop sponsored by theInstitute of Medicine
Committee on Food Marketing and the Diets of Children and Youth
January 27, 20058:30 am–5:00 pm
Keck Center of The National Academies500 Fifth Street, NW, Keck 100
Washington, DC 20001
Program
8:30 am Welcome, Introductions, and Overview of Open SessionJ. Michael McGinnis, Committee Chair
8:45 am Panel 1: Industry PerspectivesEllen Taaffe, M.S., Vice President, Health and Wellness
Marketing, PepsiCo Inc., Chicago, IL

482 FOOD MARKETING TO CHILDREN AND YOUTH
9:00 am Lance Friedmann, M.B.A., Senior Vice President, GlobalHealth and Wellness, Kraft Foods, Inc., Northfield, IL
9:15 am Marlena Peleo-Lazar, Chief Creative Officer and VicePresident, McDonald’s Corporation, Oak Brook, IL
9:30 am Ken Powell, M.B.A., Executive Vice President, General Mills,Inc., Minneapolis, MN
9:45 am Committee Discussion with Panelists
10:30 am Break
10:40 am Panel 2: Youth-Focused Media and Marketing PerspectivesMarva Smalls, M.P.A., Executive Vice President, Public Affairs
and Chief of Staff, Nickelodeon, TV Land, and Spike TV,New York, NY
11:00 am Bob McKinnon, Yellow Brick Road, New York, NY
11:20 am Morris Reid, Blue Fusion and Founding Partner and ManagingDirector, The Westin Rinehart Group, Washington, DC
11:40 am Committee Discussion with Panelists
12:30 pm Lunch
1:30 pm Panel 3: Research PerspectivesLeann Birch, Ph.D., Distinguished Professor, Department of
Human Development and Family Studies, The PennsylvaniaState University, University Park, PA
1:50 pm Elizabeth Moore, Ph.D., Associate Professor of Marketing,University of Notre Dame, IN
2:10 pm Victoria Rideout, M.A., Vice President and Director, Programfor the Study of Entertainment Media and Health, Henry J.Kaiser Family Foundation, Menlo Park, CA
2:30 pm Committee Discussion with Panelists
3:30 pm Break

APPENDIX H 483
3:45 pm Open ForumElizabeth Lascoutx, The Children’s Advertising Review UnitWilliam Cochran, Geisinger Clinic and American Academy of
Pediatrics (AAP) RepresentativeDavid McCarron, Shaping America’s YouthDavid Gipp, United Tribes Technical CollegeWarlene Gary, National PTAKeith Scarborough, Association of National AdvertisersSusan Laramee, American Dietetic AssociationDavid Katz, Partnership for Essential NutritionMargo Wootan, Center for Science in the Public InterestElizabeth Pivonka, Produce for Better Health FoundationRichard Martin, Grocery Manufacturers of AmericaPatti Miller, Children NowBill MacLeod, Collier Shannon Scott, PLLCWendy Miller, Beaumont Healthy Kids Program, William
Beaumont HospitalKaren Tucker, American Association of Family and Consumer
SciencesDiana Zuckerman, National Research Center for Women and
Families
5:00 pm Adjourn

484
I
Biographical Sketches ofCommittee Members and Staff
J. Michael McGinnis, M.D., M.P.P. (Chair), is a Senior Scholar at theInstitute of Medicine (IOM), The National Academies. He was previouslySenior Vice President and Counselor to the President at the Robert WoodJohnson Foundation. He holds degrees in political science, medicine, andpublic policy from University of California, Berkeley, University of Califor-nia, Los Angeles (UCLA), and Harvard University. For nearly three de-cades, he has been a participant in national prevention policy, including acontinuous appointment—Assistant Surgeon General and Deputy AssistantSecretary for Health—throughout the Carter, Reagan, Bush, and ClintonAdministrations, from 1977 to 1995, with responsibility for coordinatinghealth-promotion and disease-prevention activities. From 1978 to 1995, hewas Chairman of the Nutrition Policy Board at the U.S. Department ofHealth and Human Services (DHHS). Internationally, Dr. McGinnis heldleadership positions in 1974–1975 to eradicate smallpox in India, and in1995–1996 for the post-war reconstruction of the health sector in Bosnia.His academic work has included appointments as Scholar-in-Residence atthe National Academy of Sciences and to the faculties of George Washing-ton, Princeton, and Duke Universities. He has published numerous paperson health policy, public health, preventive medicine, nutrition, and to-bacco, and served on various journal, scientific, and community boards. Heis a member of the Institute of Medicine and a Fellow in the AmericanCollege of Epidemiology and the American College of Preventive Medicine,and has received various public service awards. Recent IOM committeework includes the IOM Committee on Establishing a National Cord Blood

APPENDIX I 485
Stem Cell Bank Program, and the IOM Roundtable on EnvironmentalHealth Sciences, Research, and Medicine. Earlier National Academies’ ser-vice includes the Food and Nutrition Board and the Committee on Agricul-tural Biotechnology, Health, and the Environment.
Daniel R. Anderson, Ph.D., is a Professor in the Department of Psychologyat the University of Massachusetts. He received his Ph.D. in psychologyfrom Brown University. Dr. Anderson’s research focuses on children andtelevision, particularly the cognitive and educational aspects. His publishedwork concerns attention, comprehension, viewing behavior, and the long-term impact of television on children’s development. Dr. Anderson’s cur-rent research interests include toddler understanding of television, the ef-fects of adult background television on infant and toddler behavior, andbrain activation during television viewing. He is currently on national advi-sory boards for PBS Ready to Learn, Children’s Digital Media Center(CDMC), and the Children’s Advertising Review Unit of the Council ofBetter Business Bureaus. Dr. Anderson has been involved in the develop-ment of many television programs, including Allegra’s Window, GullahGullah Island, Bear in the Big Blue House, Blue’s Clues, and Dora theExplorer. He was also an advisor to Captain Kangaroo, The WubbulousWorld of Dr. Seuss, Sesame Street, and Fimbles (BBC).
J. Howard Beales III, Ph.D., is an Associate Professor of Strategic Manage-ment and Public Policy at George Washington University in Washington,DC. From 2001 to early August 2004, Dr. Beales served as Director of theBureau of Consumer Protection at the Federal Trade Commission (FTC),where he was responsible for the development and implementation of theNational Do Not Call Registry. Dr. Beales received his Ph.D. in economicsfrom the University of Chicago and his B.A. in economics from GeorgetownUniversity. Dr. Beales began his career at the FTC in 1977 as an economistspecializing in consumer protection. In 1981, he was appointed Assistant tothe Director of the Bureau of Consumer Protection, the first economist tohold that position, and served as Associate Director for Policy and Evalua-tion in the Bureau from 1983 to 1987. He developed policy in a number ofkey areas, including the Commission’s Deception and Advertising Substan-tiation Policy Statements. Dr. Beales left the FTC in 1987 for a 1-yearappointment as Branch Chief in the Office of Management and Budget’sOffice of Information and Regulatory Affairs, where he managed the re-view of regulations proposed by the Departments of Labor, Health andHuman Services (DHHS), Housing and Urban Development, and Treasury.His areas of expertise include consumer research, contract law, economicsof commercial free speech, applied microeconomics, marketing and adver-tising, public policy toward business, and safety and health regulations.

486 FOOD MARKETING TO CHILDREN AND YOUTH
David V. B. Britt, M.P.A., is the retired President and Chief ExecutiveOfficer of the Sesame Workshop. Mr. Britt’s professional experience in-cludes executive positions with the U.S. Agency for International Develop-ment, Equal Employment Opportunity Commission, and the Overseas Pri-vate Investment Corporation. He has presented to various congressionalcommittees on media and informal education, federal support of educa-tional media, advertising limits, and mandatory educational programmingrequirements for commercial television. Since his retirement, Mr. Britt hasbeen engaged in consulting and leadership development for nonprofit orga-nizations. He is currently a Director of the Education Trust and BoardChair of Kids Voting USA. Mr. Britt is a member of the Council on ForeignRelations. He is also a member of the Board of Advisors for the Initiative onSocial Enterprise at the Harvard Business School, as well as the HauserCenter at the Kennedy School of Government at Harvard University. He isa former member of the Board on Children, Youth, and Families (BCYF).He received a B.A. from Wesleyan University and an M.P.A. from the JohnF. Kennedy School of Government at Harvard University.
Sandra L. Calvert, Ph.D., is a Professor of Psychology at Georgetown Uni-versity and the Director of the Children’s Digital Media Center (CDMC).She received her Ph.D. in developmental and child psychology from theUniversity of Kansas. Dr. Calvert’s interdisciplinary work, spanning thefields of psychology, communications, public policy, and education, seeksto improve the well-being of children and adolescents by bridging the gapbetween knowledge generation and knowledge application. She has exam-ined social policy issues revolving around the Children’s Television Act, inwhich broadcasters are legally required to provide educational and infor-mational television programs for children. She is currently examining therole that interactivity and identity play in children’s learning from enter-tainment media at the CDMC, a National Science Foundation-based re-search consortium at Georgetown University, the University of California,Riverside, the University of California, Los Angeles, Northwestern Univer-sity, and the University of Texas at Austin. She has received additionalsupport for the CDMC from the Stuart Family Foundation. Dr. Calvert is afellow of the American Psychological Association and a member of theSociety for Research in Child Development and the International Commu-nication Association. Dr. Calvert previously served on the National Acad-emy of Sciences Committee which assessed Tools and Strategies for Protect-ing Children from Pornography and Other Objectionable Content on theInternet. In 2005, she received the Applied or Public Research Award fromthe International Communication Association. Professor Calvert has con-sulted for Nickelodeon Online, Sesame Workshop, and Blue’s Clues to

APPENDIX I 487
influence the development of children’s television programs, computer andInternet software, and online educational games.
Keith T. Darcy, M.B.A., is the Executive Director of the Ethics OfficerAssociation in Waltham, MA. Previously, he served as Chairman andChief Executive Officer of Darcy Partners, Inc. (DPI). He has combined a30-year career in the financial services industry with his profession as aneducator and his long-term involvement in business ethics, corporate gov-ernance, and organizational leadership. DPI consults with boards and se-nior executives in the areas of leadership, ethics, governance, and reputa-tion risk, as well as the alignment of corporate culture, brand loyalty, andorganizational performance. Mr. Darcy currently serves on the boards ofdirectors of E*Trade Bank and New York National Bank, is Chairman ofthe Board of the Better Business Bureaus Foundation, and chairs its AuditCommittee. Additionally he is Director Emeritus of the Ethics Officer As-sociation. Mr. Darcy teaches Ethics & Leadership in the Executive Pro-grams at the Wharton School at the University of Pennsylvania. He is alsoExecutive-in-Residence at the University of Maryland University College;a Teaching Fellow at the R. H. Smith School of Business, University ofMaryland; and Executive-in-Residence at Manhattanville College, Pur-chase, NY. Mr. Darcy is an Executive Fellow and Vice Chairman of theCenter for Business Ethics at Bentley College in Waltham, MA. In addi-tion, he moderates programs for the Aspen Institute in Aspen, Colorado.He previously served as Associate Dean and Distinguished Professor ofBusiness at Georgetown University’s McDonough School of Business. Mr.Darcy holds a B.S. from Fordham University’s College of Business and anM.B.A. from the Hagan Graduate School of Business at Iona College, andhas completed additional post-graduate study at New York TheologicalSeminary.
Aimée Dorr, Ph.D., is the Dean of the UCLA Graduate School of Educationand Information Studies. She received her Ph.D. in developmental psychol-ogy from Stanford University. Her research interests include the role ofelectronic media in formal and informal education and socialization; pro-cesses by which young people make sense of, utilize, and are affected byelectronic media; and media literacy. Dr. Dorr’s professional membershipsinclude the American Educational Research Association, American LibraryAssociation, American Psychological Association, International Communi-cation Association, National Society for the Study of Education, and Soci-ety for Research in Child Development among others. She is the Co-chair ofEducational Outreach for UCLA. Dr. Dorr has been a consultant for nu-merous television and other media-related projects, most recently La
488 FOOD MARKETING TO CHILDREN AND YOUTH
Opinión, a Los Angeles Spanish-language daily newspaper for the LatinoParents Awareness Campaign, and a Spanish-language guide to K–12 stan-dards and college preparation. She is currently consulting for KCEd, aninitiative using public television and the Internet to educate and train childcaregivers, and she serves as a member of the Board of Educational Ad-visers for the Children’s Advertising Review Unit of the Better BusinessBureaus.
Lloyd J. Kolbe, Ph.D., has held appointments in academic, private-sector,and federal agencies, and is currently Professor of Applied Health Science atIndiana University. He received his Ph.D. from the University of Toledo.Dr. Kolbe has served as President of the American School Health Associa-tion, Vice President of the International Union for Health Promotion andEducation, Visiting Professor at Beijing Medical University, Lead for HealthPromotion within the U.S.–Russian Joint Commission on Economic andTechnological Cooperation, Chairman of the World Health OrganizationExpert Committee on School Health Programs, member of the U.S. SeniorBiomedical Research Service, and founding Director of the Division ofAdolescent and School Health at the U.S. Centers for Disease Control andPrevention. For his efforts to improve child and adolescent health, Dr. Kolbehas received awards given by the U.S. Public Health Service, the DHHS,and the International Union for Health Promotion and Education. Dr.Kolbe has authored more than 120 publications and he currently serves asVice Chair of the BCYF’s Committee on Adolescent Health and Develop-ment, a standing IOM committee.
Dale L. Kunkel, Ph.D., is a Professor of Communication at the University ofArizona in Tucson. He is the former Director of the University of California(UC) Santa Barbara Washington Program at the UC Washington Center inWashington, DC. He studies children and media issues from several diverseperspectives, including television effects research as well as assessments ofmedia industry content and practices. Dr. Kunkel received his Ph.D. fromthe Annenberg School of Communication at the University of SouthernCalifornia. He was awarded a Congressional Science Fellowship from theSociety for Research in Child Development. During that fellowship he servedas an advisor to Congress on children and media issues. Dr. Kunkel isconsidered an expert on children’s media policy and has delivered invitedtestimony at hearings before the U.S. Senate, the U.S. House of Representa-tives, and the Federal Communications Commission. He is a former Chairof the American Psychological Association’s Committee on Children, Youth,and Families, and was senior author on the scientific report of the APATask Force on Advertising and Children in 2003. He served as a PrincipalInvestigator on the National Television Violence Study (1994–98), and

APPENDIX I 489
more recently directed projects examining the V-chip program ratings andsexual socialization messages supported by the Henry J. Kaiser FamilyFoundation.
Paul Kurnit, M.A., is Founder and President of Kurnit Communicationsand KidShop, two marketing consulting firms in Chappaqua, New York,and a Clinical Professor of Marketing at Pace University’s Lubin School ofBusiness. He earned an M.A. in communication (theory and media) fromQueens College in New York City and a B.A. in communication (rhetoricand public address) from the University of Wisconsin. Mr. Kurnit hasbroad experience in marketing and communications, advertising, entertain-ment, brand strategy, new product development, and teaching with specialexpertise in youth and family marketing and cultural trends. He previouslyserved as President of Griffin Bacal, a DDB Worldwide advertising agency,where he had oversight for advertising, promotion, and public relations fora wide range of clients including Hasbro, PepsiCo, General Mills, Pillsbury,and Nestlé as well as assignments from Disney, McDonald’s, General Mills,Good Humor, Veryfine, Mead Johnson, and others. At Griffin Bacal, hecreated specialty business units to focus on a diverse range of marketingservices including youth trend tracking (Trend Walk™), youth consulting(Kid Think Inc.™), and online research (LiveWire: Today’s Families On-line™). He also served as Executive Vice President of Sunbow Entertain-ment, producers of hundreds of half hours of children’s television program-ming including, the Peabody Award receiving The Great Space Coaster,two after-school specials for CBS and ABC, and two network televisionseries for Fox and CBS. Mr. Kurnit is a member of the Advertising CouncilCreative Review Committee and serves on the advisory boards of theChildren’s Advertising Review Unit (CARU) and the board of the Advertis-ing Educational Foundation. Mr. Kurnit has contributed his expertise to anumber of social marketing initiatives to address youth cheating, teen smok-ing, bias and diversity, marijuana use, child abuse, gender, and nutrition.
Robert C. Post, Ph.D., J.D., is the David Boies Professor of Law at YaleLaw School in New Haven. He received his A.B. from Harvard College, hisPh.D. in the history of American civilization from Harvard University, andhis J.D. from Yale Law School. Dr. Post served as a Law Clerk to JusticeWilliam J. Brennan on the U.S. Supreme Court and to David Bazelon on theU.S. Court of Appeals for the District of Columbia Circuit. He was anassociate at the law firm of Williams & Connolly. For many years he wasthe Alexander F. and May T. Morrison Professor of Law at the Universityof California, Berkeley. Dr. Post’s expertise includes constitutional law(with particular emphasis on the First Amendment), legal history, and juris-prudence. He has authored or co-authored more than 60 articles and edited
490 FOOD MARKETING TO CHILDREN AND YOUTH
several books. Dr. Post is a Councilor of the American Academy of Artsand Sciences.
Richard Scheines, Ph.D., is a Professor of Philosophy at Carnegie MellonUniversity in Pittsburgh, and holds courtesy appointments in the Center forAutomated Learning and Discovery and the Human–Computer InteractionInstitute. He received his B.A. in history from Hobart College and joinedthe Carnegie Mellon faculty after receiving his Ph.D. in history and philoso-phy of science from the University of Pittsburgh in 1987. Dr. Scheines’research focuses on the connections between causal structure and data,especially social science and behavioral science data. He has collaboratedfor more than two decades with statisticians and computer scientists on aproject to characterize what can and cannot be learned about causal claimsfrom statistical data in a variety of empirical settings, and to develop andimplement algorithms for causal discovery. His research interests empha-size the problem of inferring the causal relations among latent variables,such as intelligence, which cannot be measured directly. He has applied thiswork to several policy areas, including estimating the effects of low-levelexposure to lead on the cognitive capacities of children, and determiningthe effects of welfare reform on single mothers and their ability to effec-tively parent. Dr. Scheines currently receives support from the McDonnellFoundation for developing online courseware in causal and statistical rea-soning. He has co-authored dozens of articles and three books on causalinference and causal discovery, and designed an online course in causal andstatistical reasoning.
Frances H. Seligson, Ph.D., R.D., is a Nutrition Consultant and AdjunctAssociate Professor in the Department of Nutrition at The PennsylvaniaState University. She is retired as the Associate Director of Nutrition atHershey Foods Corporation. During her tenure at Hershey Foods, she heldthe positions of Senior Manager of Nutrition and Food Safety, Manager ofNutrition and Food Safety, and Manager of Nutrition Affairs. She has alsoworked for The Procter & Gamble Company and was Assistant Professorof Nutrition at the University of North Carolina at Chapel Hill. Dr. Seligsonreceived her undergraduate degree in dietetics from Drexel University inPhiladelphia, completed a dietetic internship at the Massachusetts GeneralHospital in Boston, and earned a Ph.D. in nutrition from the University ofCalifornia, Berkeley. She has published extensively in the areas of nutritionand food consumption. Her professional memberships include the Ameri-can Society for Nutritional Sciences and the American Dietetic Association,and she has served on the IOM Committee on Use of Dietary ReferenceIntakes in Nutrition Labeling. Dr. Seligson is currently a consultant onscientific issues to Hershey Foods and has represented Hershey Foods on

APPENDIX I 491
International Life Sciences Institute technical committees on dietary lipids,carbohydrates, energy, and lifestyle and weight management. She also hasconsulted for the International Food Information Council Committee onDietary Sugars and previously was involved with its childhood obesityprevention initiative.
Mary Story, Ph.D., R.D., is a Professor in the Division of Epidemiology andAssociate Dean for Student and Academic Affairs in the School of PublicHealth at the University of Minnesota in Minneapolis. She is an AdjunctProfessor in the Department of Pediatrics, School of Medicine at the Uni-versity of Minnesota. Dr. Story received a Ph.D. in human nutrition sciencefrom Florida State University. Her M.S. is in food science. Dr. Story’sresearch focuses on understanding factors related to eating behaviors ofyouth, and community-, school-, and family-based interventions for obesityprevention, healthful eating, and physical activity among children, adoles-cents, and families. Several projects have focused on working with low-income communities and communities of color. Her research also focuseson environmental interventions to promote healthful food choices. Dr. Storyhas received awards for her work with child and adolescent nutrition andobesity prevention from the American Public Health Association, AmericanDietetic Association, Association of State and Territorial Public HealthNutrition Directors, Minnesota Department of Health and Department ofPediatrics at the University of Minnesota. She is active in national profes-sional associations and is the immediate past chair of the Food and Nutri-tion Section of the American Public Health Association. Dr. Story is cur-rently on the editorial board for the Journal of Adolescent Health and theJournal of the American Dietetic Association.
Ellen A. Wartella, Ph.D., is the Executive Vice Chancellor and Provost ofthe University of California, Riverside. She is a Distinguished Professor ofPsychology. Dr. Wartella received her Ph.D. in mass communications fromthe University of Minnesota. She studies the role of media in child develop-ment. Dr. Wartella was a co-principal investigator on the National TVViolence Study and is currently a co-principal investigator of the Children’sDigital Media Center. She is also serving on the Kraft Food Global Healthand Wellness Advisory Council, the Decade of Behavior National AdvisoryCommittee, the Board of Trustees of Sesame Workshop, and the NationalEducational Advisory Board for CARU. Dr. Wartella is a member of theAmerican Psychological Association and the Society for Research in ChildDevelopment and is the past President of the International CommunicationAssociation; she has recently been awarded the International Communica-tion Association’s Steven Chaffee Career Productivity Award. Dr. Wartellais a member of the Board on Children, Youth, and Families.

492 FOOD MARKETING TO CHILDREN AND YOUTH
Jerome D. Williams, Ph.D., is the F. J. Heyne Centennial Professor inCommunication in the Department of Advertising at the University ofTexas at Austin (UT). He also holds a joint appointment in the Center forAfrican and African American Studies. Prior to joining the UT faculty, hewas a faculty member in the Marketing Department in HowardUniversity’s School of Business, where he was also Director of the Centerfor Marketplace Diversity. Prior to his appointment at Howard, he was amember of the Pennsylvania State University Marketing Department fac-ulty for 14 years. During that period, he had a number of visiting appoint-ments nationally and internationally. He has also worked for GeneralElectric Company in Energy Systems Information and for the U.S. Depart-ment of Energy’s Solar Energy Research Institute. Dr. Williams’ researchinterests cover several areas in the business-to-business and consumer mar-keting domains, with emphasis on ethnic minority marketing. He has con-ducted research on long-term business relationships, industrial marketingcommunications and promotion, and consumer behavior involving mar-keting communications strategies. Dr. Williams has testified in a numberof court cases as an expert witness on consumer response to advertisingstrategies. Dr. Williams received his Ph.D. in business administration andmarketing from the University of Colorado.
FNB Liaison
Nancy F. Krebs, M.D., R.D., is an Associate Professor of Pediatrics andSection Head of Nutrition in the Department of Pediatrics at the Universityof Colorado School of Medicine. Dr. Krebs received her M.S. from theUniversity of Maryland and her M.D. from the University of ColoradoSchool of Medicine. Her expertise and research interests are in pediatricsand general nutrition, breast-feeding, nutrition support, and growth prob-lems. She is a member of the American Academy of Pediatrics, AmericanSociety for Clinical Nutrition (ASCN), American Society for NutritionalSciences, and American Dietetic Association. She has received numerousawards for excellence in teaching and was a recipient of the ASCN’s Physi-cian Nutrition Specialist Award.
IOM Staff
Rosemary Chalk is Director of the Board on Children, Youth, and Familieswithin the Division of Behavioral and Social Sciences and Education andthe Institute of Medicine within the National Academies. She has more than17 years of experience directing studies on vaccines and immunization fi-
APPENDIX I 493
nance, educational finance, family violence, child abuse and neglect, andresearch ethics. From 2000 to 2003, Ms. Chalk was a part-time StudyDirector at the IOM. She also directed the child abuse/family violenceresearch area at Child Trends, a nonprofit research center in Washington,DC, where she conducted studies on the development of child well-beingindicators for the child welfare system. As part of her work at Child Trendsand the National Academies, Ms. Chalk has directed a range of projectssponsored by the William T. Grant Foundation, Doris Duke CharitableFoundation, the Carnegie Corporation of New York, The David and LucilePackard Foundation, and various agencies within the DHHS, among oth-ers. Earlier in her career, Ms. Chalk was a consultant and writer for a broadarray of science and society research projects. She has authored publica-tions on issues related to child and family policy, science and social respon-sibility, research ethics, and child abuse and neglect. She was the firstProgram Head of the Committee on Scientific Freedom and Responsibilityof the American Association for the Advancement of Science from 1976 to1986 and is a former Section Officer for the same organization. She servedas a Science Policy Analyst for the Congressional Research Service at theLibrary of Congress from 1972 to 1975. She has a B.A. in foreign affairsfrom the University of Cincinnati.
Jennifer Appleton Gootman, M.A., is a Senior Program Officer in the Foodand Nutrition Board (FNB) at the IOM. She recently completed an IanAxford Fellowship in Public Policy, working and living in New Zealandwith the purpose of publishing a report on New Zealand’s national youthdevelopment strategy and related child and youth policies. Prior to thefellowship, she directed and disseminated two studies—Community Pro-grams to Promote Youth Development and Working Families and GrowingKids—for the IOM and National Research Council’s BCYF. She was previ-ously a Social Science Analyst for the Office of Planning and Evaluation inthe DHHS. Her work there focused on child and family policy for low-income families, including welfare reform, child care, child health, youthdevelopment, and teen pregnancy prevention issues. She has directed anumber of community youth programs in Los Angeles and New York City,involving young people in leadership development, job preparedness, andcommunity service. She received her B.A. in education and fine arts fromthe University of Southern California and her M.A. in public policy fromthe New School for Social Research.
Vivica I. Kraak, M.S., R.D., is a Senior Program Officer in the FNB at theIOM. In addition to staffing the congressionally mandated IOM study andsubsequent report, Preventing Childhood Obesity: Health in the Balance,she is also the Co-study Director for the IOM study on Progress in Prevent-

494 FOOD MARKETING TO CHILDREN AND YOUTH
ing Childhood Obesity. Prior to joining the IOM in 2002, she worked as aClinical Dietitian at Columbia–Presbyterian Medical Center and as a Pub-lic Health Nutritionist specializing in HIV disease in New York City. From1994 to 2000, she was a Research Nutritionist in the Division of Nutri-tional Sciences at Cornell University where she collaborated on severaldomestic and international food policy and community nutrition researchinitiatives. She has co-authored a variety of publications related to foodsecurity and community food systems, nutrition and HIV/AIDS, interna-tional food aid and food security, viewpoints about genetically engineeredfoods, use of dietary supplements, and the influence of commercialism onthe food and nutrition-related decisions and behaviors of children andyouth. She received her B.S. in nutritional sciences from Cornell Universityand completed a coordinated M.S. in nutrition and dietetic internship atCase Western Reserve University and the University Hospitals of Cleve-land. She is a member of the American Public Health Association and theAmerican Dietetic Association.
Linda D. Meyers, Ph.D., is Director of the FNB at the IOM, and has alsoserved as the Deputy Director and a Senior Program Officer in FNB. Priorto joining the IOM in 2001, she worked for 15 years in the Office ofDisease Prevention and Health Promotion in the DHHS where she was aSenior Nutrition Advisor, Deputy Director, and Acting Director. Dr. Meyershas received a number of awards for her contributions to public health,including the Secretary’s Distinguished Service Award for Healthy People2010 and the Surgeon General’s Medallion. Dr. Meyers has a B.A. in healthand physical education from Goshen College in Indiana, an M.S. in foodand nutrition from Colorado State University, and a Ph.D. in nutritionalsciences from Cornell University.
Leslie J. Sim is a Research Associate in the FNB at the IOM and alsoprovides Web support for all of the FNB activities. In 2003, she receivedrecognition within FNB as a recipient of an IOM inspirational staff award.Ms. Sim has previously worked both as a Teaching Assistant and Labora-tory Assistant for an undergraduate food science laboratory class. She isalso working on a military nutrition study to determine if modificationsare needed in the military ration composition to prevent possible adversehealth and performance consequences of consuming such rations while inshort-term high-stress situations. Previously, she has worked on other mili-tary nutrition reports including Caffeine for the Sustainment of MentalTask Performance; High-Energy, Nutrient-Dense Emergency Relief FoodProduct; Weight Management: State of the Science and Opportunities forMilitary Programs; Monitoring Metabolic Status: Predicting Decrements inPhysiological and Cognitive Performance; and most recently Nutritional

APPENDIX I 495
Needs for Short-Term, High-Stress Operations. Ms. Sim also provided re-search support for the IOM reports, Infant Formula: Evaluating the Safetyof New Ingredients and Dietary Reference Intakes: Applications in DietaryPlanning. She received a B.S. in biology with an emphasis on food sciencefrom Virginia Tech.
Shannon L. Wisham is a Research Associate in the FNB at the IOM whereshe staffed the congressionally mandated IOM study and subsequent re-port, Preventing Childhood Obesity: Health in the Balance. She has alsoworked on several National Research Council reports, including Partner-ships for Reducing Landslide Risk, Fair Weather: Effective Partnerships inWeather and Climate Services, and Resolving Conflicts Arising from thePrivatization of Environmental Data. She has been with the NationalAcademies since 2001. She holds a B.A. in environmental science fromLaSalle University in Philadelphia. Previously, she worked as a Researcherfor Booz-Allen & Hamilton in the Environmental Protection Agency’sRegion 3 Comprehensive Environmental Response, Compensation, andLiability Act/Superfund Records Center.

497
A
Acceptable Macronutrient DistributionRange, 47
Added sugars intakeassociated food and nutrient intakes,
64–65definition, 59ndental health and, 44dietary recommendations, 45, 59infant and toddler diets, 19, 74–75patterns and trends, 2, 18, 19, 59–60,
61, 62, 375as percentage of calorie intake, 59–60recommendations for food and beverage
companies, 11, 382regional variation, 81–82sources, 65, 66, 68television commercials and, 184trends, 61
Adequate intakeactual intakes and, 55–56definition, 46–47infant and toddler diets, 73
Adiposityage factors moderating influence of
marketing, 294–295definition, 231
evidence linking television viewing to,272, 273–278, 279–292
gender differences moderating influenceof marketing on, 298–299
influence of advertising, 9, 278–279,292–293, 308, 379–380
measurement, 275–276nonadvertising-related television viewing
effects, 284–289, 290–292as predictive of television viewing time,
273, 280–281See also Body weight and composition;
ObesityAdvergames, 186, 193–195, 350Advertising, generally
branded products, 4, 22, 191, 210branded spokescharacters, 170–171celebrity endorsements, 175cereal, 170–171, 175–176children’s cognitive capacity to recognize
and evaluate, 4, 5, 9, 20–21, 30,231, 295–298, 301, 305, 309, 343,380
definition, 26, 137distribution by food category, 164–165Federal Trade Commission regulation, 5,
29–30, 181, 182–183goals, 137
Index
498 INDEX
industry self-regulation, 198–201, 210industry spending, 4, 163–170, 377intensity, 164–165leading advertisers, 164marketing and, 21, 26, 137most famous advertising images, 171outdoor, 186–187rationale for regulating, 29, 32, 341,
344–345, 346–347vehicles and venues, 4–5, 21, 22–23,
167, 169, 186, 190–191See also Marketing of food and
beverages to youth; Televisionadvertising
Advertising Council, 209Age
categories and definitions, 25as moderator of marketing influence,
294–295, 309Agriculture production system, 120, 123,
351–352Alliance for American Advertising, 31, 209American Association of Diabetes
Educators, 209American Beverage Association, 188, 206–
207American Council for Fitness and Nutrition,
209American Dietetic Association, 209American Legacy Foundation, 336, 337American Marketing Association, 206Atherosclerosis, 43Australia, 33, 360
B
Balanced diet. See Healthful and balanceddiets and meals
Beliefs, food and beveragecultural transmission, 117as diet precursor, 230evidence of marketing effects on, 254,
258–259gender differences, 99health concerns, 99influence of advertising, 8, 260–261,
307, 379influence on preferences or behaviors,
117, 271–272taste related to healthfulness, 95–96
time constraints as obstacle to healthfuleating, 104, 150
See also Precursors, dietaryBenchmarks and baselines, 7Benefits of unregulated marketing, 31, 341Beverage consumption
bone health and, 44brand loyalty, 376calorie density, 63demographic patterns, 67infant and toddler diets, 74–75new product introductions, 146, 156, 158nutrient availability, 66–67patterns and trends, 44, 52, 61, 65–68,
146, 375quantity consumed per occasion, 71regional variation, 81–82research needs, 66settings for, 68as source of added sugars, 65, 66, 68See also Fruit juice consumption;
Marketing of food and beverages toyouth; Milk and milk consumption;Soft drink consumption
Beverage industry, 146. See also Companies,food and beverage
Billboards, 186–187Bitter tastes
genetic influence, 93–94vegetable consumption and, 94, 97
Blogs/blogging, 196Blood pressure, in metabolic syndrome, 43Body weight and composition
breakfast consumption and, 69, 375cultural values, 117–119gender differences in concerns about, 99,
117–119normal development, 45–46overweight classification, 17–18self esteem and, 118self-perception of, depression and, 100trends, 41, 42–43See also Adiposity; Obesity
Branded productsadvertising goals, 103–104, 120, 136,
210co-branding, 172, 173, 174nutrient content of, 22, 120online marketing, 191in television commercials, 22trends, 4, 210

INDEX 499
Brand recognition and preferenceadvertising goals, 103, 120, 136, 210advertising effects, 253behavioral branding, 336branded spokescharacters, 170–171children’s capacity for, 30–31, 103, 376children’s product requests, 102, 103–
104, 376consumer behavior, 137nonprocessed foods, 136, 137processed foods, 136–137top brands, 146See also Branded products; Product
placementBreakfast consumption
associated dietary patterns, 69body composition related to, 375economic status and, 79, 107fat content, 58food choices in, 69gender differences, 99infant and toddler diets, 75mother’s work status and, 106patterns and trends, 68–69, 163, 375perceived time constraints and, 104product innovations, 163regional variation, 82
Breast milk, 95British Medical Association, 33, 302, 357Buzz marketing, 196. See also Viral
marketing
C
Caffeine, 67Calcium intake
associated food and nutrient intakes,64–65
bone health and, 44breakfast consumption, 69economic status and, 80infant and toddler diets, 73obesity risk and, 53patterns and trends, 2, 18, 19, 50, 54,
55, 56, 82, 375regional variation, 81sources, 56, 67
Calorie intakefrom away-from-home foods, 19, 71–72,
113, 114, 151, 375
beverage sources, 65–68calorie density, 63current concerns, 1, 2, 18, 374eating locations and, 71–72economic status and, 79, 107food sources, 52–53, 61–65health promotion goals, 40high-calorie low-nutrient foods and
beverages in, 53, 63–64at home, 105of infants and toddlers, 19, 73–74, 375measurement, 50–51, 375neurobiological regulation, 92nutrient distribution, 52–61patterns and trends, 49–50, 52–53, 375possible adiposity–television viewing
linkage, 284recommendations for food and beverage
companies, 11, 382regional variation, 81in schools, 71–72, 112snacks as source of, 69–70sources, 19, 375See also Nutrient content
Calories Count campaign, 324Canada, 32–33, 354, 359–360Cancer, diet-related risk, 1–2, 18, 43Candy
availability in schools, 113calorie intake from, 52children’s product requests, 103drug store sales, 151marketing strategies, 140new product introductions, 156, 158purchasing power of children and youth,
155Carbohydrate intake
dietary recommendations and guidelines,47
infant and toddler diets, 73sources, 52–53taste influence, 94trends, 19, 53–54, 375
Cardiovascular disorders, 1–2, 18, 39, 43Carotene intake, regional variation, 81Catalog promotions, 187Causal inference validity, 240–242Celebrity endorsements, 175Cell phones, 22–23, 179, 196–197Centers for Disease Control and Prevention,
322, 325

500 INDEX
Central Hudson Gas & Electric Corporationv. Public Service Commission, 344–346
Cerealsadvertising spending, 170branded spokescharacters, 170–171children’s product requests, 102, 103diet correlations, 69infant and toddler diets, 74market size, 170new product introductions, 156portion size, 71premium offers, 175–176purchasing power of children and youth,
154regional variation in consumption, 81
Channel One, 188–190Character merchandising, 377
branded spokescharacters, 170–171definition, 172developmental considerations, 172–173goals, 172host-selling format, 294industry self-regulation, 198to promote healthful products, 173–174,
175, 377recommendations for, 12, 383uses of, 4, 175, 377
Child and Adult Care Food Program, 14,111–112, 121, 122, 328, 386
Child-care settings, 14, 111–112, 328, 386Child Nutrition and WIC Reauthorization
Act, 122, 326Child Nutrition Labeling Program, 328Child Nutrition Programs, 122, 321, 327Children’s Advertising Review Unit, 198–
201company compliance with guidelines of,
200current efforts, 378effectiveness, 200–201guidelines, 198–200organizational structure and function, 198purpose, 198, 378recommendations for, 12, 383
Children’s Online Privacy Act, 191, 349Children’s Television Act, 181, 348Cholesterol intake
dietary recommendations and guidelines,58
economic status and, 79
healthy and balanced diet, 45patterns and trends, 54, 58sources, 56
Circulatory disorders, 1–2Club sponsorship, 187Coalition for Healthy Children, 209Co-branding, 172, 173, 174Cognitive functioning
brand recognition, 30–31, 103, 376children’s capacity to recognize and
evaluate advertising, 4, 5, 9, 20–21,30, 231, 295–298, 301, 305, 309,343, 380
learning process, 20media literacy training, 326–327moderators of marketing influence, 231,
295–298nutrition knowledge and eating
behavior, 100research needs, 305See also Beliefs, food and beverage;
Consumer socializationCommercial speech, 344–345Committee on Food Marketing and the
Diets of Children and Youth, 6Community-based interventions,
recommendations for, 13, 384Companies, food and beverage
economic significance, 119educational materials sponsored by, 190,
326employment, 119food processing, 120food supply characteristics, 120, 351, 352health and wellness advisory groups,
208healthful product promotion, 10, 146–
150, 201–202, 374health promotion activities, 209, 210–
211, 378incentives for health promotion, 14, 385mergers and acquisitions, 146nutrition labeling requirements, 323–324recommendations for health promotion
activities, 10–11, 14, 382, 385revenues, 4, 144, 146, 156self-regulation of advertising, 198–201,
206–207, 355See also Marketing of food and
beverages to youth; Tradeassociations

INDEX 501
Computer use, 177–178. See also InternetConditioning, 98Consumer promotion, 137, 167Consumers, children as
purchasing power, 5, 21–22, 153–155social and cultural trends, 31
Consumer socializationchildren’s product requests, 102–104definition, 102media literacy education, 326–327process, 20skills, 4social benefits of marketing, 31
Containers, serving, 102Continuing Survey of Food Intakes by
Individuals, 50, 51Convenience, 104, 114, 150, 162–163Convenience stores, 151Cookies, Internet, 191Copper intake, 56Cost of food
food choices and, 104–105, 269–270growth, 144nas obstacle to healthier diets, 107–108research needs, 108
Cost of obesity-associated medical care, 41Coupons
event and loyalty marketing, 187industry spending, 169wireless, 197
Cross promotion, 172, 348
D
Dairy product consumptioneconomic status and, 107as nutrient source, 56parental, 109patterns and trends, 61–62, 63regional variation, 81strategies for improving youth health, 2See also Milk and milk consumption
Data sourcesaccess to industry research, 7, 15, 34,
143, 377, 387beverage consumption, 66evaluation methodology, 6, 33–34on marketing practices and trends, 24–
25, 33, 34, 133–134media use patterns, 176new product introductions, 156
nutrient and food intake information,50–61
shortcomings, 7for systematic evidence review, 227,
232–237, 243–247Demand for healthier food choices, 201, 204Denmark, 358Dental health, 39, 40, 44–45Department of Agriculture, U.S.
education and information programs,320–321, 322, 323, 326
food assistance programs, 121, 122–123recommendations for, 14, 15, 386–387
Department of Defense, U.S., 329Department of Education, U.S., 322, 325,
381Department of Health and Human Services,
U.S.Children’s Advertising Review Unit and,
200–201education and information programs,
320, 321, 322, 323recommendations for, 15, 16, 386–387,
387Depression, 78, 100Development, individual
beverage consumption patterns, 66, 67brand recognition, 103–104breakfast consumption patterns, 68character merchandising and, 172–173cognitive capacity to recognize and
evaluate advertising, 4, 5, 9, 20–21,30, 231, 295–298, 301, 305, 309,343, 380
definition of health, 19food preferences, 96, 97, 123–124, 305,
376normal weight gain, 45–46obesity risk, 18research needs, 305See also Consumer socialization
Diabetesassociated conditions, 41–42diet-related risk, 1, 18federal educational interventions to
prevent, 322metabolic syndrome and, 43trends, 1, 17, 39, 82
Diet. See Eating behavior and dietary intakeDietary Approaches to Stop Hypertension
Eating Plan, 48

502 INDEX
Dietary Guidelines for Americans, 47–48,49, 320
Dietary reference intakes, 46–47actual intakes and, 55–56
Dietary supplements. See Supplements,dietary
Dieting, 100–101Digital television, 195–196Dinner, children’s influence on food choices,
103Discretionary fat, 59nDrug stores, 151
E
Eating behavior and dietary intakeaccessibility of food and, 108age factors moderating influence of
marketing on, 294assessment methods, 50–51biological factors, 92–93in child-care settings, 111consumer socialization effects, 102–104cost factors, 104–105, 107–108data sources, 50, 230determinants of, 1, 2–4, 8, 19–20, 123,
373, 376, 379developmental change, 96–97, 305dietary recommendations and guidelines,
45, 46–49, 320–321dieting practices, 100–101diet precursors and, 261, 270–272eating occasions per day, 75, 79, 80ecological perspective in outcome
evaluation, 26–28, 91–92, 123evidence of marketing influence, 261–264family factors, 105–110food/beverage type, intake distribution
by, 52–53, 61–68, 74–75gender differences in, 98–99gender differences moderating influence
of marketing on, 298genetic factors, 93–94government policy effects, 123health outcomes, 2, 39–40, 374individual health concerns and, 99influence of marketing, 8–9, 265–272,
379mother’s work status and, 106–107neighborhood food retail outlets and,
115–116
normal development, 45–46nutrition knowledge and, 100parental, 109patterns and trends, 18, 19, 61–62, 375peer influence, 110–111portion size and, 101–102psychosocial factors, 97–100quantity consumed per eating occasion,
70–71regional variation, 81in restaurants, 113–115in schools, 112–113sensory influences, 94–96settings, 71–72, 105sociocultural factors, 116–119strategies for improving youth health, 2,
374time constraints and, 104, 150See also Breakfast consumption; Calorie
intake; Nutrient intake; Portion sizes;Precursors, dietary; Snacks andsnacking
Eating disorders, 100Eat Smart, Play Hard™ Campaign, 321Ecological perspective, 26–28, 91–92, 123Ecological validity, 242–243Educational interventions
effectiveness, 326, 361federal programs, 320, 321–323, 325–
326in food assistance programs, 121learning process, 20media literacy, 326–327MyPyramid, 48–49, 320–321nutrition labeling, 323–325recommendations for schools, 13–14,
385in schools, 325–327scope of, 361See also Social marketing
Electrolytes, 47Embedded marketing, 141Emotional appeals, 170Energy balance
current patterns, 19definition, 45nestimated energy requirements, 45
Entertainment industrycelebrity endorsements, 175children’s, 164interest in youth market, 23

INDEX 503
recommendations for, 12–13, 384self-regulation of marketing activities by,
207–208See also Character merchandising
Estimated average requirements, 46actual intakes and, 55
Estimated energy requirements, 45, 47actual intake and, 56calorie requirement calculations, 56–57infant and toddler intakes, 73
European Heart Network, 32, 301, 302,355
European Union, 355–356Event and loyalty marketing, 4, 169, 187Evolutionary theory, 93, 94Expanded Food and Nutrition Education
Program, 321
F
Fast food and quick serve restaurantsbranded spokescharacters, 171co-branding campaigns, 174–175consumer lawsuits against, 341–342consumer spending, 151definition, 31n, 151n, 406industry leaders, 151in-school sales, 188number of, 151nutrition labeling requirements for, 323–
324premium offers, 175–176promotion of healthful diets in, 204–205revenues, 151sociodemographic characteristics, 114–
115See also Restaurants
Fat, dietary intake ofin away-from-home meals, 114biological influences, 93, 94–95dietary recommendations and guidelines,
45, 47, 57, 58economic status and, 79, 80, 107in family meals, 109food assistance program meals, 328gender differences, 98health and nutrition attitudes as factors
in, 99infant and toddler diets, 73–74patterns and trends, 2, 19, 53, 54, 58,
62, 375
as percentage of caloric intake, 54school food choices and, 113social marketing programs to reduce,
335sources, 52–53, 56See also Saturated fats in youth diet;
Trans fats in youth dietFederal Advisory Committee Act, 7Federal Communications Commission, 181–
182, 348–349Federal Trade Commission
Internet regulation, 349recommendations for, 12, 15, 383, 386–
387regulatory role, 342–343rulemaking in 1970s, 5, 29–30, 342–344
Feeding Infants and Toddlers Study, 62, 73Fiber intake
breakfast consumption, 69current concerns, 2, 50, 82current patterns, 59dietary recommendations and guidelines,
58–59infant and toddler diets, 74mother’s work status and, 106overall diet quality and, 59regional variation, 81
Finland, 359First Amendment rights, 30, 31, 341, 344,
345, 346, 347–348, 349, 350Five a Day for Better Health, 322, 334–
335, 361Fluoride, 40, 44, 45Folate/folic acid
current concerns, 50current intake vs. dietary guidelines, 56regional variation, 81sources, 56
Food and Drug Administration, 323, 380Food Guide Pyramid, 48–49, 120
actual intake vs., 62–63Food insecurity
economic status and, 76–78obesity patterns and, 78psychosocial outcomes, 78
Food Products Association, 206Food Stamp Program, 41, 79, 121, 122,
123, 321Forbidden foods, 110France, 357, 358French fries, 52, 71, 74, 114

504 INDEX
Fruit and Vegetable Pilot Program, 122,123, 328–329
Fruit consumptionaccessibility as factor in home
consumption, 108, 271advertising intensity, 165away-from-home dining and, 115branding strategies to influence, 136,
137character merchandising to promote,
173–174children’s product requests, 103determinants of, 271development of food preferences, 22economic status and, 79, 107in family meals, 108–109healthy and balanced diet, 45infant and toddler diets, 74neighborhood retail outlets and, 115nutrition knowledge and, 100packaging innovations to encourage, 203parental, 109patterns and trends, 19, 61–62, 63, 375price factors, 105, 108recommendations for government to
improve access, 14, 386regional variation, 81school food choices and, 113school programs to promote, 122, 328–
329social marketing programs to promote,
334–335strategies for improving youth health, 2,
374Fruit juice consumption
infant and toddler diets, 62, 74marketing strategies, 140new product introductions, 156portion size, 71quantity consumed per occasion, 63, 71trends, 63, 65, 66, 67
G
Gender differencesaverage weight, 41beverage consumption, 67body image concerns, 99, 117–119breakfast consumption, 68current intake vs. dietary guidelines, 56,
57
diabetes risk trends, 39dieting behaviors, 100–101eating behaviors, 98–99food shopping, 150health and nutrition attitudes, 99in influence of marketing, 298–299micronutrient intake, 55, 376online use, 195
Genetic influence on eating behaviors, 93–94, 109
Geographic variation in nutrient and calorieintakes, 80–82
Germany, 358Global Strategy on Diet, Physical Activity
and Health, 32Glucose metabolism, in metabolic
syndrome, 43Greece, 358Grocery Manufacturers Association, 200,
205–206
H
Hamburgers, 71Head Start, 111, 323, 328Health, defined, 19Health, diet-related
associated diseases, 1–2, 18, 43beverages in, 65broad conclusions, 9, 374environmental influences on, 2–4, 6, 19–
20evidence of marketing linkage, 272–278food insecurity and, 78influence of marketing on, 8, 10, 278–
293, 308, 374, 379–380research methodology, 230–231trends, 1, 17, 39, 41, 82See also Adiposity; Diabetes; Obesity
Healthful and balanced diets and mealsagricultural policy and, 351–352consumer demand, 201, 204cost, 108definition, 2, 82, 374dietary recommendations and guidelines,
45, 46–49, 320–321federal educational programs, 320, 321–
323marketing of, 29, 143, 146–150, 173–
175, 324–325, 362, 378

INDEX 505
multisectoral involvement to promote,10, 124, 374
new product design for, 10, 156, 201–203, 210–211, 374
opportunities to improve food assistanceprograms, 122–123
recommendations for food and beveragecompanies, 10–11, 382
recommendations for media andentertainment industry, 12–13, 384
recommendations for parents andfamilies, 13, 384
recommendations for public policy, 14–15, 385–386
recommendations for restaurants, 11,382
recommendations for schools, 13–14,385
recommendations for trade associations,11–12, 383
research needs, 304social marketing programs to promote,
334–335, 340, 381time constraints as obstacles to, 104,
150youth attitudes toward, 95–96, 99See also Health promotion
HealthierUS School Challenge, 322, 361Health insurance, poverty and, 76Health promotion
broad conclusions, 9, 374cultural values and, 119goals, 39–40industry advisory groups for, 208international efforts, 32–33, 354–361multisectoral approach, 124outcomes of food assistance programs,
40–41public–private partnerships, 208–209school programs, 325–332social marketing campaigns, 334–338,
340, 381use of marketing techniques for, 29, 143See also Healthful and balanced diets
and mealsHealthy People 2010 initiative, 42Heart disease, 1–2, 18, 43. See also
Cardiovascular disordersHeight, 41Henry J. Kaiser Family Foundation, 335
High-calorie low-nutrient foods andbeverages
associated health risks, 1–2, 18consumption patterns and trends, 2, 19,
63–65, 375, 377development of food preferences, 22influence of television advertising on diet
precursors, 8, 307in-school marketing, 113, 190marketing strategies, 139–140marketing trends, 4, 377new product introductions, 158, 210as portion of total calorie intake, 53,
63–64predictors of consumption of, 64tax policy, 352–354television commercial content, 22, 184types of, 63
Host-selling format, 294Hungary, 358Hypermarkets, 150n
I
Immersive advertising, 195Infants and toddlers
brand marketing to, 194calorie and nutrient intakes, 19, 73–74,
375definition, 25dietary imbalances, 19, 376eating occasions per day, 75food/beverage type intake, 74–75, 375food preference formation, 96population size, 139taste preferences, 94, 95
Influence of marketingon adiposity, 9, 379–380age differences and, 294–295on beliefs about food and beverages, 8,
254, 256–257, 258–259, 379children’s cognitive capacity and, 4, 5, 9,
20–21, 30, 231, 295–298, 301, 305,309, 343, 380
on dietary intake, 8–9, 261–272, 308,379
on diet precursors, 8, 230, 232, 251–261, 307, 379
on diet-related health, 8, 9, 10, 308,374, 379–380

506 INDEX
on food and beverage preferences, 8, 21,22, 253, 256–258, 258, 261, 307,379
on food and beverage requests, 8, 253–254, 256–257, 307, 379
gender differences and, 298–299methodology for reviewing evidence of,
227–250moderator effects, 231, 293–294products other than food and beverage,
234–235racial/ethnic differences and, 299recommendations for research, 303–306research limitations, 302–303on short-term eating behavior, 308socioeconomic status as moderator of,
300on teen diet, 8–9, 96, 307, 308, 379
Interactive Healthy Eating Index, 49Interactive product placement, 195–196International Chamber of Commerce, 355International research and action, 32–33,
300–302, 354–361Internet
advertising trends, 4–5, 22–23, 194, 358children’s exposure to food and beverage
advertising, 194children’s use of, 4–5cognitive capacity to recognize and
evaluate advertising on, 296embedded commerce, 195–196interactive product placement, 195marketing strategies, 186, 190–191online gaming, 193–195product placement, 193regulation, 349–350, 359, 381use patterns, 177–178
Ireland, 356, 358, 359Iron intake
current concerns, 2, 50deficiency patterns, 80economic status and, 80infant and toddler diets, 73mother’s work status and, 106regional variation, 81sources, 56trends, 54, 55
J
Junk food, 31n. See also High-calorie low-nutrient foods and beverages
K
Kidvid, 30, 343–344
L
Labeling, nutrientconsumer use of, 324design and content, 323, 324effectiveness of, 324, 325, 380federal food assistance programs, 328goals, 323health claims, 324opportunities for improving, 324to promote healthful diet, 361recommendations for, 11, 382regulation, 323, 324, 325, 361research needs, 378restaurant requirements, 323–324shortcomings, 324–325use of proprietary logos and icons, 202–
203, 324–325, 378Learning process, 20
parental role-modeling, 109Legume intake, 2, 62Lipoprotein levels, in metabolic syndrome,
43Logos and icons, 202–203, 324–325, 378Low-income families
access to healthful foods and beverages,124
computer access and use, 177, 178dental health, 44–45diet characteristics, 107–108diet-related health risks, 2eating occasions per day among, 79, 80food assistance programs, 40–41, 121–
123, 327–328food insecurity risk, 76–78health insurance coverage, 76marketing influence moderated by
economic status, 300neighborhood grocery store
characteristics, 115–116

INDEX 507
neighborhood restaurant characteristics,115
nutrient intake patterns, 76, 79, 80, 376nutrition education programs, 321obesity patterns among, 76, 78–79prevalence, 75, 107
Lunchfat content, 58food assistance programs, 122, 326,
327–328infant and toddler diets, 75ready-to-eat meals, 163
Luxembourg, 358
M
Magazine advertising, 185–186Magnesium intake
current concerns, 2, 50, 82current intake vs. dietary guidelines, 56sources, 56trends, 54
Marketing of food and beverages to youth,209–210
assessing effectiveness of, 141–142audience fragmentation, 165, 186broad conclusions, 9, 374children’s exposure to, 4–5, 21, 120–121components of, 26, 28, 135consumer promotion, 137, 167in consumer socialization process, 20cross promotion, 172, 348cultural groups as target markets, 140–
141current concerns, 1, 5–6, 373current promotion of healthful diets in,
10, 201–209, 374data sources and research base, 6, 7, 23,
24–25, 30, 33, 34, 133–134, 302–303
definition, 25–26, 134–135diet mediators/precursors, 230ecological perspective in outcome
evaluation of, 26–28, 91–92economic significance, 119, 153, 156embedded marketing, 141emerging trends, 186, 190–198, 210event sponsorship, 4, 169, 187healthful products, 146–150, 173–174,
202, 362
for health promotion, 29, 143, 202historical development, 168–169industry spending, 4, 146, 163–164,
165–168, 169, 377international research and action, 5–6,
32–33, 300–302, 354–361marketing research, 135, 142–143, 190–
191, 233, 376–377parent-targeted advertising and, 169premium offers, 175–176public opinion on regulation of, 29recommendations for food and beverage
companies, 10–11, 382recommendations for practice standards,
11, 12, 383recommendations for research, 15, 386–
387regulation of, 29–32, 340–341, 342–
350, 354–361research goals, 23–24research methodology, 24–28in retail, 150in schools, 187–190, 377scope of activities in, 21, 22–23, 26social benefits of, 31, 341strategic elements, 135–136strategic trends in, 4, 21, 146target markets and market segmentation,
138–141trade association guidelines, 206trade promotion, 137–138youth market characteristics, 138–139See also Advertising, generally; Branded
products; Influence of marketing;New product introductions
Meat and protein consumptioninfant and toddler diets, 73patterns and trends, 52, 53, 61, 62, 63,
351portion sizes, 71as source of trans fatty acids, 58
Mediaadvertising vehicles, 4–5, 21, 22–23,
186, 190–191, 377character merchandising, 172children’s exposure to, 4–5, 120–121,
276–277co-branding campaigns, 174–175ideals of beauty, 118–119influence on dietary patterns, 2–4, 376in-school advertising, 188–190
508 INDEX
literacy, 326–327marketing trends, 4, 167, 191, 377measured/unmeasured, 141–142, 167print, 185–186product placement, 4, 141, 167–168,
192–195recommendations for industry, 12–13,
384self-regulation of youth marketing, 207–
208social marketing use of, 333use patterns, 176–179See also Television advertising
Menus, 11, 380, 382Metabolic syndrome
associated health risks, 43definition, 43prevalence, 39, 43risk factors, 43trends, 17
Micronutrients, intake ofassociated food and nutrient intakes,
64–65at-risk subgroups, 44, 80, 376current intake vs. dietary guidelines, 56–
57dietary recommendations and guidelines,
47dietary supplement use, 61health implications, 44past public health interventions, 40, 41trends, 54–55See also specific micronutrient
Milk and milk consumptionagricultural policy, 351–352celebrity endorsement advertising, 175demographic patterns, 67health outcomes, 44infant and toddler diets, 74patterns and trends, 19, 52, 61, 65–66,
67, 68, 375regional variation, 82See also Dairy product consumption
Milk Matters Calcium EducationCampaign, 322
Mineral supplements, 61Mobile phones, 179, 196–197Moderators of marketing influence, 293–
294, 308–309age differences, 294–295children’s cognitive capacity, 295–298
gender differences, 298–299racial/ethnic differences, 299significance of, 300socioeconomic status, 300
Monitoring progress in marketingbenchmarks and baselines, 7recommendations for, 15–16, 387
Mortality, 2, 39, 40Music, product placement in, 193MyPyramid, 48–49, 320–321, 361
N
National Advertising Review Council, 198National Children’s Study, 304–305National Governors Association, 14, 385National Health and Nutrition Examination
Surveys, 50, 51National Institute of Child Health and
Human Development, 322National Institutes of Health, 322–323National Parent Teacher Association, 14,
385National School Lunch Program, 14, 78–79,
112, 121, 122, 326, 327–328, 386National School Meals Program, 41National Science Foundation,
recommendations for, 15, 386–387National Youth Anti-Drug Media
Campaign, 337Nationwide Food Consumption Survey, 50,
51Neighborhood characteristics
food retail outlets, 115–116restaurants, 114–115
Netherlands, 358Neurobiology of eating, 92–93New product introductions
beverages, 146branding in product development, 136children and youth as targets of, 156–
158healthful products, 156market segmentation in product
development, 141product type distribution, 156, 158ready-to-eat meals, 163repackaging of classic products, 161–162trends, 4, 146, 156–158, 210
Niacin intake, 54–55Norway, 32–33, 354, 358
INDEX 509
Nutrient contentAmerican food supply, 120beverages, 65, 66–67food assistance program meals, 121–
123, 328of home-prepared vs. away-from-home
foods, 71–72neighborhood retail outlets and, 115, 116processed foods, 120recommendations for food and beverage
companies, 11, 382recommendations for labeling, 11, 382regulation of products available in
schools, 330–332See also High-calorie low-nutrient foods
and beverages; Labeling, nutrientNutrient intake
assessment methods, 50–51in child-care settings, 111–112dietary recommendations and guidelines,
45, 46–49, 320–321dietary supplement use, 61dieting behaviors and, 101economic status and, 76in family meals, 108–109fast food consumption and, 114goals of dietary guidance, 40, 45health and nutrition attitudes as factors
in, 99infants and toddlers, 73–74maternal employment and, 106patterns and trends, 19, 49–50, 52–61,
82–83, 375regional variation, 81See also Eating behavior and dietary
intake; Healthful and balanced dietsand meals; specific nutrient
Nutrition Labeling and Education Act, 323–324
O
Obesityassociated health risks, 41–42, 43at-risk population, 1, 41cultural values and, 117, 119definition and classification, 17–18, 39,
41economic status and, 76, 78–79federal educational interventions to
prevent, 322
food and beverage industry coalitions toaddress, 209
food insufficiency and, 78international research and intervention,
32, 33, 301–302lawsuits against food industry for
causing, 341–342metabolic syndrome risk, 43mother’s work status and, 106–107prevalence, 1, 42public opinion on causality, 29racial/ethnic risk, 76risk factors, 17, 18, 22, 53severe, 18social costs, 41strategies for preventing, 18, 24trends, 1, 5, 9, 17, 18, 39, 41, 42, 49–
50, 82, 378See also Adiposity; Body weight and
compositionOil, cooking, 58Older children, defined, 25Osteomalacia, 44Osteoporosis, 1–2, 18, 44Outdoor advertising, 186–187
P
Packagingconsumer response to products labeled
“healthy,” 169industry spending, 169logos and icons to identify healthy
products, 202–203, 324–325, 378recommendations for, 11, 382See also Labeling, nutrient
Pagers, 179Parents and families
accessibility of food in home, 108child feeding practices, 109–110, 305family meals, 108–109influence of children and youth on
purchasing, 21–22, 103, 155influences on eating behaviors of
children and youth, 105–110maternal employment, 106–107parents as eating behavior role models,
109parent-targeted marketing, 169, 172recommendations for health promotion
practices, 13, 384

510 INDEX
research needs, 305, 306in socialization process, 20
Partially hydrogenated vegetable oil, 58Partnership for a Drug-Free America, 337Pasta, 61Peer relationship
eating behaviors and, 110–111food preferences and, 98
Personal digital assistants, 179Phosphorus intake
current intake vs. dietary guidelines, 56trends, 54
Physical activityestimated energy requirement
calculations, 56–57health outcomes, 2, 24, 28, 39, 374health promotion strategy, 40obesity and, 16, 53, 388possible adiposity–television viewing
linkage, 273, 284, 288, 291research needs, 303social marketing programs to promote,
335–336Pizza, 52, 61, 71Portion sizes
eating behavior and, 101–102patterns and trends, 70–71, 101, 102, 376recommendations for research, 15, 386snacks, 69, 70
Portugal, 358Potassium intake
dietary recommendations, 60patterns, 2, 50, 60, 82sources, 56
Potatoes, 62, 115in away-from-home diets, 115consumption trends, 61, 62infant and toddler diets, 19, 74, 75, 376school food choices, 113
Pouring rights, 188, 329–332Powerful Bones, Powerful Girls™, 322Precursors, dietary
age factors moderating influence ofmarketing, 294
behavior and, 261, 270–272definition, 230evidence of marketing effects on, 251–
261influence of marketing, 8, 307, 379See also Beliefs, food and beverage;
Preferences, food and beverage;Requests, food and beverage
Preferences, food and beveragebiological predispositions, 93brand recognition and, 376capacity for change, 95, 97–98determinants of, 98, 260developmental factors, 96–97as diet precursor, 230effect of food reward systems, 98, 109–
110evidence of marketing effects on, 253,
256–258food behavior and, 270–271formation of, 22, 96, 97, 123–124, 376genetic factors, 93–94health and nutrition attitudes and, 99influence of advertising, 8, 21, 22, 258,
260–261, 307, 379neurobiological basis, 92–93parental, 109prenatal factors, 95psychosocial factors, 97–98taste factors, 94–96See also Eating behavior and dietary
intake; Precursors, dietaryPregnant women, 116Premium advertising, 175–176Preventing Childhood Obesity: Health in
the Balance, 20, 24Print media, 4, 185–186Privacy, regulation of online exchanges,
349–350Processed foods
branding, 136–137economic significance, 144nutrient content, 120
Produce for Better Health Foundation, 335Product placement, 4, 141, 167–168, 190,
192–195, 210, 267ProductScan®, 134, 156Project LEAN, 335Protein intake. See Meat and protein
consumptionPsychosocial functioning
food insecurity effects, 78food preferences, 97–98food reward systems, 98, 109–110influence on eating behavior, 100See also Beliefs, food and beverage;
Cognitive functioningPublic opinion
on obesity causes, 29regulation of advertising, 340

INDEX 511
Public policyagriculture supports and restrictions,
120, 123, 351–352current shortcomings, 10, 374diet behavior and, 123federal nutrition education programs,
320–325, 361food assistance programs, 40–41, 121–
123, 327–328goals, 14, 16, 24, 385, 388international marketing regulation, 354–
361opportunities for improving, 380–381public–private partnerships for health
promotion, 208–209recommendations for health promotion,
14–15, 385–386regulation of products available in
schools, 330–332school-based programs for health
promotion, 325–329significance of, in shaping nutritional
environment, 319, 361social marketing initiatives, 332–340tax law, 352–354See also Regulation
Public service announcements, 333Purchasing power of children and youth, 5,
21–22, 153–155
Q
Quick serve restaurants. See Fast food andquick serve restaurants
R
Race/ethnicitybeverage consumption patterns, 67body satisfaction and, 117–118breakfast consumption patterns, 68–69calorie intake data, 52computer access and use patterns, 177,
178dental health and, 45fast food/quick serve restaurant locations
and, 115fat intake patterns, 54, 58influence of marketing moderated by,
299
marketing trends, 140media use patterns, 178neighborhood grocery store
characteristics, 115, 116nutrient intake patterns, 81obesity and, 76poverty risk and, 75regional variation in diet, 81snacking behaviors, 69sociocultural diversity and, 117sodium intake and, 60target marketing, 139–141teen spending patterns, 154television advertising and, 185
Radio, 4, 181Recommended Dietary Allowances, 46Recommended energy allowances, 56, 62Regulation
arguments against, 31, 341, 344, 345current legal environment, 340–341Federal Trade Commission actions, 5,
29–30, 343–344of food and beverage products in
schools, 200, 203, 206–207, 330–332, 358
government authority for, 342–343indications for, 14–15, 381, 386industry compliance, 182–183industry self-regulation, 198–201, 203,
206–208, 210, 341, 355international practice, 354–361of marketing, 6, 14–15, 29–33, 340–
341, 342–350, 354–361, 381, 386media innovation and, 349–350, 358–
359, 381obesity-related lawsuits against food
industry, 341–342public opinion, 340rationale, 5, 29, 32, 341, 342, 344–345,
346–347Requests, food and beverage
for branded products, 376diet behavior and, 270as diet precursor, 230distribution by product type, 102–103earliest manifestations, 102evidence of marketing effects on, 253–
254, 256–257, 258influence of advertising, 8, 258, 260–
261, 307, 379See also Precursors, dietary
512 INDEX
Researchdietary assessment methods, 50–51ecological perspective, 26–28goals, 23–24on healthful diet promotion, 304international efforts, 32–33, 300–302on labeling to communicate nutritional
content, 378on marketing other than television, 302,
304on marketing products other than food
and beverage, 234–235marketing research by food and
beverage industry, 135, 142–143,190–191, 233, 376–377
on marketing to youth, 6, 23, 33–34, 380measurement issues, 303, 304, 309methodology, 24–28proprietary, 7, 15, 34, 143, 377, 387recommendations for, 15, 303–306, 309,
386–387shortcomings of, 7, 30, 302–303, 374–375for social marketing, 334, 339See also Data sources; Systematic
evidence reviewRestaurants
advertising spending, 164beverage consumption patterns in, 68brand loyalty, 104calorie intake from, 71–72, 113, 375consumption patterns and trends in,
113–115, 151diet quality in, 114neighborhood sociodemographic
characteristics and, 114–115nutrition labeling requirements for, 323–
324portion sizes, 71, 102promotion of healthful diets in, 10, 204–
205, 210–211, 374proximity to schools, 114recommendations for health promoting
practices, 11, 382regional variation in eating behaviors, 82sales, 113–114, 151See also Fast food and quick serve
restaurantsRetail outlets
children’s influence on food choices,103, 155
consumer behavior, 150, 151consumer use of food labels, 324
food sales, 144health promotion efforts, 205, 378in-store product requests, 102–104marketing strategies, 150neighborhood characteristics, 115–116product offerings, 146recommendations for product displays,
11–12, 383supermarket revenues, 150trade promotion in, 137–138trends, 151
Riboflavin intakecurrent sources, 56regional variation, 81trends, 54–55
Rice, 61Rickets, 44
S
Sales promotion, 137Salty taste, 94Saturated fats in youth diet
associated health risks, 1–2, 43current concerns, 2, 18dietary recommendations and guidelines,
57, 58economic status and, 80family meal contents, 109healthy and balanced diet, 45patterns, 19, 49, 57, 58, 82sources, 56
School Breakfast Program, 14, 78–79, 112,121, 122, 326, 328, 386
School Meals Initiative, 322Schools, 112–113
after-school programs, 14, 111, 386calorie intake in, 71–72, 112contracts for food and beverage sales,
188, 329–330food choices in, 112–113food programs, 14, 41, 64, 79, 111,
112, 121, 122, 327–328, 386industry self-regulation of marketing in,
200, 203, 206–207industry-sponsored educational
materials, 190, 326marketing practices and trends, 187–
190, 377media literacy training in, 326–327nutrition education interventions, 322,
323, 325–326

INDEX 513
promoting vegetable and fruitconsumption in, 328–329
quick serve restaurant locations, 114recommendations for health promotion
practices, 13–14, 14, 385, 386revenue from “pouring rights” contracts,
329snack food availability and
consumption, 95, 113, 329–331standards for product marketing in, 14,
188, 330–332, 358, 361–362, 381, 385SEMs, 190, 326Sensory system, 92–93, 94–96. See also TasteShopping malls, 155Single-parent households, 106Small Step program, 322, 361Snacks and snacking
calories from, 375children’s product requests, 102–103in home, 105infant and toddler diets, 75influence of children and youth on
purchasing, 155new product introductions, 158patterns and trends, 19, 69–70, 375portion of calorie intake from, 69–70possible adiposity–television viewing
linkage, 284preference factors, 95price factors, 105, 269–270product size, 69, 70purchasing power of children and youth,
21–22, 154, 155quantity consumed per eating occasion,
70–71regional variation, 81research needs, 305school food choices, 113, 329–331short-term influence of advertising, 263,
265Social and cultural norms
body image, 117–119children as consumers, 31ecological perspective in outcome
evaluation, 28food behavior and, 117–119food preferences and, 98gender identity, 118health promotion considerations, 119influence of, 116–117socialization process, 20target markets, 140–141
Socialization. See Consumer socializationSocial marketing
applications, 332conceptual basis, 332–333effectiveness, 338–340, 362, 381health promotion programs, 334–336marketing mix, 334outcome assessment, 339recommendations for health promotion,
13, 384to reduce tobacco and substance use,
337–338research for, 334, 339scope of program, 339strategies and goals, 333–334, 362target audiences, 333
Sodium intakeassociated health risks, 43biological influences, 94current concerns, 2, 18dietary recommendations, 60economic status and, 79, 80healthy and balanced diet, 45patterns and trends, 19, 49, 55, 60–61,
82, 375recommendations for food and beverage
companies, 11, 382Soft drink consumption
accessibility as factor in homeconsumption, 108
advertising intensity, 165age-related patterns, 66bone health and, 44brand loyalty, 104celebrity endorsement advertising, 175children’s product requests, 103demographic patterns, 67in fast food and quick serve restaurants,
114gender differences, 98industry leaders, 146industry self-regulation, 206–207infant and toddler diets, 74marketing expenditures, 146marketing strategies, 140nutrient content, 63parental, 109patterns and trends, 52, 53, 61, 63–64,
65, 66, 67, 375portion size, 71purchasing power of children and youth,
22, 154

514 INDEX
in schools, 113, 188, 206–207See also Added sugar intake; Beverage
consumptionSpecial Milk Program, 14, 386Special Supplemental Nutrition Program for
Women, Infants, and Children(WIC), 41, 79, 121–122, 321
Spendingadvertising and marketing, 4, 119, 146,
163–164, 377away-from-home food, 113–114, 119,
144, 151beverage marketing, 146on branded products, 137consumer trends, 144cost factors in eating behavior, 104–105ethnic marketing, 140federal nutrition education and
promotion, 321food assistance programs, 121household food expenditures, 144measured/unmeasured media, 141–142obesity-associated medical care, 41online promotions, 186portion of disposable income spent on
food, 119product placement, 192, 193purchasing power of children and youth,
5, 21–22, 153–155, 377retail food sales, 144in shopping malls, 155
Sponsored educational materials, 190, 326Sports drinks, 146, 163Standards
current Children’s Advertising ReviewUnit, 378
industry self-regulation in advertising,198–201, 210
nutrient labeling, 324, 325for products available in schools, 14,
188, 190, 330–332, 361–362, 381,385
recommendations for marketingpractice, 11, 12, 383
for wireless marketing, 196–197Stealth marketing, 196Stress, 100Stroke, diet-related risk, 1–2, 18, 43Substance use reduction programs, 337Sugar. See Added sugar intake; Soft drink
consumptionSummer Food Programs, 122
Supplements, dietary, 61infant and toddler diets, 73
Surgeon General, 323Sweden, 32–33, 354, 357–358Sweet taste, 94, 95Systematic evidence review
advantages, 228analytic framework, 228–232British study, 302causal inference validity rating, 240–
242, 243characteristics of, 227, 306characteristics of studies used in, 243–
247, 306–307coding of studies in, 33–34, 243consideration of moderator effects, 293–
300, 308–309criteria for evidence inclusion, 232–237dimensions of, 237–238ecological validity rating, 242–243evaluation of evidence relevance in, 239–
240findings on diet–marketing linkages,
261–272, 307, 308findings on diet precursor–marketing
linkages, 250–261, 307findings on diet-related health–
marketing linkages, 272–293, 307,308
identification of cause and effectvariables for, 238–239
interpretation methodology, 247–250measure quality rating, 242presentation of findings, 250research design types for, 239
T
Target markets, 138–141Taste
exposure to, and taste preference, 95,97–98
genetic predisposition, 93–94neurobiology, 92–93youth beliefs about healthfulness and,
95–96Tax policy, 352–354T-commerce, 195Teenagers
beliefs about food taste andhealthfulness, 95–96

INDEX 515
brand choice, 104cost considerations in food choices, 104–
105definition, 25food and beverage purchases, 22health and nutrition attitudes and
beliefs, 95–96, 99influence of advertising on dietary
patterns and outcomes, 8–9, 96, 258,259, 266–267, 268–272, 279, 307,308, 379
influence on family food purchases, 103,155
Internet use, 177magazine advertising for, 185–186media use patterns, 178–179nutritional needs, 46population size, 139purchasing power, 154shopping behavior, 155time pressures, 104word-of-mouth marketing, 196
Television advertisingage factors moderating influence of,
294–295children’s exposure to, 4–5, 176–177,
179–185, 234, 248–249, 272–273,276, 308
demographic variables in health linkage,289
entertainment industry self-regulation ofyouth marketing, 207–208
Federal Communications Commissionregulation, 348–349
Federal Trade Commission regulation, 5,29–30, 181, 342–344
food and beverage commercials, 22,181, 183–184, 185
gender factors moderating influence of,298–299
for healthful products, 377historical development, 180indications for legislative interventions
to promote health, 14–15, 381,386
industry and restaurant spending, 4,165–166, 167, 169
influence on dietary intake, 8–9, 265–272, 308, 379
influence on diet precursors, 8, 251–261,307, 379
influence on diet-related health, 9, 308,379–380
international research and action, 301–302, 354
length of commercials, 181nonadvertising-related television viewing
effects, 284–289, 290–292product appeals, 169–170product placement, 192–193racial/ethnic factors moderating
influence of, 299regulation, 6, 14–15, 30, 32–33, 182–
183, 343–344, 348–349, 354, 356,357–358, 359–360, 361, 381, 386
research needs, 15, 386research shortcomings, 7short-term eating behavior and, 8, 248,
263, 265, 266–267, 308, 379socioeconomic factors moderating
influence of, 300systematic evidence review, 233–234trends, 4, 165–166, 167, 210, 377See also Advertising, generally
Text messaging, 197Thiamin intake, 54Tobacco
advertising regulation, 29anti-smoking campaigns, 337–338, 353
Tolerable upper intake level, 47Toy co-branding, 174Trade associations, 153
current efforts to promote healthfuldiets, 205–207
recommendations for health promotingpractices, 11–12, 14, 383, 385
Trade promotion, 137–138, 166–167Trans fats in youth diet
associated health risks, 43current concerns, 18family meal contents, 109healthy and balanced diet, 45patterns and trends, 49, 58, 82sources, 58
Triglyceride levels, in metabolic syndrome,43
truth® campaign, 336, 337–338TV dinners, 162–163Tweens
definition, 25Internet use, 177population size, 139
516 INDEX
U
Underweight persons, 78United Kingdom, 6, 33, 300–301, 302,
356–357, 359
V
Vegetable consumptionaccessibility as factor in home
consumption, 108, 271advertising intensity, 165away-from-home dining and, 115branding strategies to influence, 136,
137children’s product requests, 103determinants of, 271development of food preferences, 22in family meals, 108–109food preference factors, 97healthy and balanced diet, 45infant and toddler diets, 19, 74, 376neighborhood retail outlets and, 115nutrition knowledge and, 100packaging innovations to encourage, 203parental, 109patterns and trends, 18, 19, 61–62, 63,
375price factors, 105, 108recommendations for government to
improve access, 14, 386regional variation, 81school food choices and, 113school programs to promote, 122, 328–
329social marketing programs to promote,
334–335strategies for improving youth health, 2,
374VERB™, 322, 335–336, 339Video games, 193–195, 207, 276Video news release, 191Viral marketing, 141, 190, 196, 210Vitamin A intake
current intake vs. dietary guidelines, 56infant and toddler diets, 73regional variation, 81sources, 56trends, 54
Vitamin B6 intakecurrent intake vs. dietary guidelines, 56
regional variation, 81trends, 55
Vitamin B12, 54Vitamin C intake
beverage sources, 67current intake vs. dietary guidelines, 56dietary supplement use, 61regional variation, 81trends, 54–55
Vitamin D, 44, 73Vitamin E intake
current concerns, 2, 50, 82current intake vs. dietary guidelines, 56infant and toddler diets, 73
Vitamin supplements, 61
W
Water, bottled, 146Water intake, 47, 74We Can!, 322–323, 361Whole grains intake
advertising intensity, 165current concerns, 2, 18, 374healthy and balanced diet, 45packaging innovations to encourage, 203patterns, 19, 62, 63, 375strategies for improving youth health, 2
WIC. See Special Supplemental NutritionProgram for Women, Infants, andChildren
Wireless communications devices, 179, 196–197
World Health Assembly, 6, 32World Health Organization, 32, 301, 354,
355
Y
Yogurt, 162Younger children, defined, 25
Z
Zinc intakecurrent intake vs. dietary guidelines, 56current sources, 56infant and toddler diets, 73