Food Hydrocolloids-2014-150.pdf
26
Establishing the function of proteins on the rheological and quality properties of 1 rice based gluten free muffins 2 María E. Matos 1,2 , Teresa Sanz 1 , Cristina M. Rosell 1 3 1 Institute of Agrochemistry and Food Technology (IATA-CSIC). Avenida Agustn 4 Escardino, 7. Paterna 46980. Valencia. Spain. 2 Instituto de Ciencia y Tecnologa de 5 Alimentos (ICTA). Universidad Central de Venezuela. Caracas, Venezuela. e-mail: 6 [email protected] 7 Abstract 8 The incorporation of proteins has been long established in the bakery industry to obtain 9 enriched products, but they also take active part on the making process of sweet baked 10 goods. This study was focused on assessing the role of proteins on the rheology and 11 quality of wheat free muffins by using rice flour. Six rice based formulations were used: 12 one without added protein (No-Protein) and five with different protein sources: soy 13 protein isolate (SPI), pea protein isolate (PPI), egg white protein (EWP), casein(C), and 14 for comparing purposes vital wheat gluten (VWG) was included. Proteins effects were 15 established by evaluating the rheological behaviour of batters measuring the storage 16 modulus (G¢) and the loss modulus (G²), and the technological characteristics of the 17 muffins obtained (specific volume, colour, and texture). The addition of SPI, PPI and C 18 significantly (P<0.05) increased G¢, but this was not modified in batters containing 19 EWP. Casein and EWP increased the specific volume of the muffins. SPI did not have 20 effect on hardness, springiness, cohesiveness, chewiness, and resilience of the muffin, 21 while PPI containing muffins were softer and springier. The overall results indicated 22 that both the rheological properties of the batters and the technological characteristics of 23 the muffin are dominated by the presence of the type of protein used in the 24 formulations. Therefore the source of protein included in the formulation is fundamental 25 to ensure the proper texture and other technological properties of these products. 26 Highlights 27 Rice based batter and muffins are evaluated by rheological and quality 28 parameters. 29 Protein source discriminates rice flour-based muffins 30
-
Upload
khangminh22 -
Category
Documents
-
view
0 -
download
0
Transcript of Food Hydrocolloids-2014-150.pdf

Establishing the function of proteins on the rheological and quality properties of 1
rice based gluten free muffins 2
María E. Matos 1,2, Teresa Sanz 1, Cristina M. Rosell 13
1Institute of Agrochemistry and Food Technology (IATA-CSIC). Avenida Agustín 4
Escardino, 7. Paterna 46980. Valencia. Spain. 2 Instituto de Ciencia y Tecnología de 5
Alimentos (ICTA). Universidad Central de Venezuela. Caracas, Venezuela. e-mail: 6
Abstract 8
The incorporation of proteins has been long established in the bakery industry to obtain 9
enriched products, but they also take active part on the making process of sweet baked 10
goods. This study was focused on assessing the role of proteins on the rheology and 11
quality of wheat free muffins by using rice flour. Six rice based formulations were used: 12
one without added protein (No-Protein) and five with different protein sources: soy 13
protein isolate (SPI), pea protein isolate (PPI), egg white protein (EWP), casein(C), and 14
for comparing purposes vital wheat gluten (VWG) was included. Proteins effects were 15
established by evaluating the rheological behaviour of batters measuring the storage 16
modulus (G′) and the loss modulus (G″), and the technological characteristics of the 17
muffins obtained (specific volume, colour, and texture). The addition of SPI, PPI and C 18
significantly (P<0.05) increased G′, but this was not modified in batters containing 19
EWP. Casein and EWP increased the specific volume of the muffins. SPI did not have 20
effect on hardness, springiness, cohesiveness, chewiness, and resilience of the muffin, 21
while PPI containing muffins were softer and springier. The overall results indicated 22
that both the rheological properties of the batters and the technological characteristics of 23
the muffin are dominated by the presence of the type of protein used in the 24
formulations. Therefore the source of protein included in the formulation is fundamental 25
to ensure the proper texture and other technological properties of these products. 26
Highlights 27
• Rice based batter and muffins are evaluated by rheological and quality 28
parameters. 29
• Protein source discriminates rice flour-based muffins 30

• Rheological characteristics of the batters are dominated by the type of protein. 31
Keywords: Muffins; Gluten-free; Rice flour; Protein sources; Batter, Rheology; 32
Quality. 33
34
1. Introduction 35
Muffin is a popular breakfast or afternoon snack food, which is sold in many bakeries. 36
Muffins are sweet, high-calorie baked products highly appreciated by consumers due to 37
their good taste and soft texture. Muffins batter is a complex fat-in-water emulsion 38
composed of an egg-sugar-water-fat mixture as the continuous phase and bubbles as the 39
discontinuous phase in which flour particles are dispersed. Muffins are characterized by 40
a typical porous structure and high volume, which confer a spongy texture. To obtain 41
such a final structure, a stable batter lodging many tiny air bubbles is required 42
(Martínez-Cervera, Sanz, Salvador, & Fiszman, 2012). Therefore, a large number of 43
small cells provide high volume if the continuous phase of the batter is capable of 44
retaining them during the baking process (Gómez, Ronda, Caballero, Blanco, & Rosell, 45
2007). 46
Traditionally, a muffin recipe is mainly composed of wheat flour, sugar, vegetal oil, egg 47
and milk (Sanz, Salvador, Baixauli, & Fiszman, 2009). For this reason, persons with 48
celiac disease (CD) are unable to consume this type of baked product since they are 49
made with wheat flour. Gluten-free products were initially designed for people who 50
have celiac disease. Today, there is an increasing number of people interested in wheat-51
free foods motivated by health concerns but also by the desire to avoid wheat in the diet 52
(Nachay, 2010). However, the manufacture of baked goods products without gluten 53
results in major technological problems for bakers. In fact, many gluten-free products 54
available on the market are often of poor technological quality, exhibiting low volume, 55
poor colour and crumbling crumb, besides great variation in the nutrient composition, 56
with low protein and high fat contents (Matos & Rosell, 2011), particularly when 57
compared to their wheat counterparts (Mariotti, Lucisano, Pagani, & Ng, 2009). Like 58
bread, gluten-free muffins, cakes and other gluten-free baked goods have been 59
commercially manufactured trying to resemble those made from wheat flour. However, 60

these types of gluten-free baked products often present quality defects and low 61
nutritional value. 62
Consumers adhered to gluten free products are increasingly demanding gluten free 63
foods equivalent to the traditional gluten ones. As consequence, in recent years, there 64
has been extensive research for the development of gluten-free sweet bakery products 65
aimed to improve the structure, mouth feel, acceptability, shelf-life and nutritional 66
quality of the finished products (Turabi, Sumnu, & Sahin, 2008a,b; Gularte, de la Hera, 67
Gómez, & Rosell, 2012a,b; Park, Ha, & Shin, 2012). Gluten-free muffins, cake or 68
cupcakes recipes contain rice flour as principal ingredient (Turabi et al., 2008a,b; 69
Gularte et al., 2012a,b; de la Hera, Martinez, Oliete, & Gómez, 2012; Park et al., 2012), 70
or different starches sources, such as rice, corn, potato and wheat (Ronda, Oliete, 71
Gómez, Caballero, & Pando, 2011). Additionally, other ingredients such as sugar, egg 72
white powder or egg white liquid, milk, baking powder, salt, vegetal oil, hydrocolloids 73
and emulsifiers, can be incorporated on their formulations to improve the final quality 74
product (Turabi et al., 2008a,b; Ronda et al., 2011; de la Hera et al., 2012; Park et al., 75
2012). The incorporation of dairy proteins has been long established in the bakery 76
industry, but legumes such as soybean, can be also a good supplement for cereal based 77
foods since they increased the protein content and complement the nutritional value of 78
cereal proteins (Mariotti et al., 2009; Ronda et al., 2011; Gularte et al., 2012b). 79
However, nutrition is not the only aim when adding proteins; they play a functional 80
role, especially in muffins. In fact, Geera, Reiling, Hutchison, Rybak, Santha and 81
Ratnayake (2011), when looking for egg replacers in wheat muffins, stated that egg is a 82
critical ingredient in the muffins formulation to obtain expected product quality 83
characteristics. Partial replacement of egg with commercial egg replacer changed 84
product characteristics altering moisture retention, bulk volume, colour, texture and 85
flavour, although those differences were not readily detected by sensory panellist. A 86
review of the literature indicate that there is only a few published studies focused on the 87
fundamental role of proteins in the technological properties of muffins (Ronda et al., 88
2011; Geera et al., 2011; Gularte et al., 2012b). . 89
The present study was focused on determining the role of proteins in the rheology and 90
quality of muffins by by using rice flour, with the view to gain a better understanding on 91
how to improve technological quality of gluten-free muffins. 92

93
2. Materials and Methods 94
2.1. Materials 95
Commercial rice flour was supplied by Harinera Derivats del Blat de Moro, S.L. (Parets 96
del Vallés, Spain) had moisture and protein of 12.19 g/100g and 7.22 g/100g, 97
respectively. Five commercial protein sources (all in dry powder form) were employed. 98
Soybean protein isolate (Vicoprot) was from Trade, S.A (Barcelona, Spain). The 99
soybean protein isolate had moisture and protein of 9.25 and 80.49 g/100g, respectively. 100
Pea protein isolate (Pisane C9) from Cosucra Group Warcoing (Warcoing, Belgium) 101
had moisture and protein of 4.45 g/100g and 77.85g/100g, respectively. Vital Wheat 102
Gluten from Roquette (Keokuk, IL) had moisture and protein of 9.23g/100g and 72.4 4 103
g/100g, respectively. Casein from Cargill (Spain) had moisture and protein of 104
5.43g/100g and 84.54 g/100g, respectively. Egg white protein (EWP) from EPSA 105
Aditivos Alimentarios (Valencia, Spain) had moisture and protein of 6.83 g/100g and 106
79.38 g/100g, respectively. Composition of the different ingredients was determined 107
following the AACCI Approved Methods (2000). Xanthan gum (Satiaxane CX-91) food 108
grade was supplied by Cargill (Spain). Sodium bicarbonate and citric acid were 109
purchased from Martínez SA (Valencia, Spain). Refined sunflower oil was acquired 110
from Coosur (Jaen, Spain). Sugar and salt were purchased from the local market. All 111
reagents were of analytical grade.112
Batters containing both rice flour and different vegetal protein sources (VPS): vital 113
wheat gluten (VWG), soy protein isolate (SPI) and pea protein isolate (PPI); and batters 114
containing rice flour and different animal protein sources (APS): egg white protein 115
(EWP), and casein(C) were prepared. 116
2.2 Methods 117
2.2.1 Batter preparation 118
Rice flour-based batters were prepared without adding any external protein source (No-119
Protein) or with one of the following five different protein sources: vital wheat gluten 120
(VWG), soy protein isolate (SPI), pea protein isolate (PPI), egg white protein (EWP), 121
and casein (C). The formulation of batters included 100g rice flour; 100g water; 17.3 g 122

protein added (75% protein); 75g sugar; 46g refined sunflower oil; 4g sodium 123
bicarbonate; 3g citric acid; 1.5g salt; 0.5g xanthan gum. The amount of added protein 124
(13%) was calculated based on the percentage of protein provided by both milk and egg 125
in a muffins formulation (Sanz et al. 2009). It was considered a contribution of 75% of 126
protein for the selected protein sources. In this way, the amount of protein that should 127
be added to each formulation was obtained [(13 x 100)/75 = 17.3 g]. In addition, this 128
amount of added protein kept the same solid content in all formulations. The samples 129
were identified as No-Protein (without exogenous protein added), VWG, SPI, PPI, 130
EWP, and C, according to the type of protein added. 131
The rice flour-based batters were prepared by the modified method of Sanz et al. (2009). 132
The batters were prepared in a mixer (Kenwood Major Classic Model KM800, UK), in 133
which the rice flour, protein (depending on the formulation), sodium bicarbonate, sugar,134
citric acid, salt and xanthan gum, were incorporated in the first place, and sunflower oil 135
was gradually dripped in; finally the water was added. The batter was beaten for 10 min 136
at speed 4 (380 rpm) until smooth. The batter was used for both the rheological test and 137
to prepare the gluten-free muffin. Each formulation was prepared twice (two replicates), 138
on different days. 139
2.2.2. Batter properties 140
The specific gravity (SG) of batter was measured as the ratio of the weight of a standard 141
container filled with batter (W2) to that of the same container filled with water (W1). 142
Two different batches were employed and each formulation was measured in triplicate. 143
The rheological behaviour of the batter was evaluated. Properties of the rice flour-based 144
batter were studied using an AR G2 controlled-stress rheometer (TA Instruments, 145
Crawley, UK). The batters were all kept at 25°C for 60 min after batter preparation 146
before the rheological test. Temperature was controlled by a Peltier system. The 147
samples were allowed to rest in the measurement cell for 5 min as stabilization time. 148
Parallel plate geometry (60 mm diameter) with 1 mm gap between the plates was 149
employed. 150
An oscillatory stress sweep was made at a constant frequency of 1 Hz over an 151
oscillatory stress range of 1.0x10⁻³ to 20 Pa for each batter sample. Frequency sweep 152
test was performed from 0.01 to 10 Hz at a constant oscillatory stress within the linear 153

viscoelastic range at 25°C. The oscillatory stress applied was selected to guarantee the 154
existence of a linear viscoelastic range of each batter sample. The applied oscillatory 155
stress varied among formulations and was between 0.12 and 0.32 Pa. To study the effect 156
of heating in the batter structure, temperature sweeps were performed from 25°C to 157
95°C at a heating rate of 1.0°C/min and a constant strain. The strain applied was 158
selected to guarantee the existence of linear viscoelasticity along the complete 159
temperature range according to previous stress sweeps. The applied strain varied from 160
1.0x10⁻⁴ to 3.8x10⁻⁴, depending on the specific batter sample. Vaseline oil (Panreac, 161
Spain) was applied to the exposed surfaces of all the samples, in order to prevent their 162
drying during the measurements. The storage modulus (G′), loss modulus (G″), phase 163
angle, and loss tangent (tanδ), were measured. Three replicates of each test were run 164
with samples prepared on different days. Results are means of three replications from 165
different batches of each formulation. 166
2.2.3. Rice flour-based muffins preparation 167
Rice flour-based muffins were prepared according to methods described by Sanz et al. 168
(2009). Muffins without added protein (No-Protein) and with different protein sources 169
(VWG, SPI, PPI, EWP, and C) were prepared from the gluten-free muffin batters. The 170
batter was poured into a dosing machine (Edhard Corp., Hackettstown, USA). Quantity 171
of batter dispensed was of 65.0±0.2 g in each 60 mm diameter and 36 mm muffin paper 172
cups. Twelve cups were arranged in three rows of four in a baking tray and baked for 173
20 min at 180 ºC in a conventional electric oven (Fagor Elegance 2H-114B, Guipúzcua, 174
Spain) that had been preheated to this temperature for 10 min. The oven, the tray and 175
the tray position in the oven were identical in each case. 176
The muffins were left to cool down at room temperature for 1h on rack. Then, they 177
were packed in polypropylene bags (O2 permeability at 23°C = 1650 cm3/m2.day; water 178
vapour permeability at 38°C and 90% humidity = 9 g/m2 day; thickness=65μm) 179
(HUECOGRABADO FINA, S.A., Valencia, Spain) and stored at 20ºC for 1day, until 180
determinations were conducted. The muffins from each formulation were prepared 181
twice, on different days, with 12 muffins in each batch. 182
2.2.4. Rice flour-based muffins properties 183

Samples were directly milled prior to analytical determinations. The moisture and 184
protein contents were determined according to ICC corresponding standard methods 185
(ICC, 1994). The muffins were weighed before baking (W3) and after baking and 1-h 186
cooling (W4). The weight loss upon baking was calculated (W3-W4). Height was 187
measured with a digital calliper from the highest point of the muffin to the bottom of the 188
paper cup after cooling for 1-h cooling at room temperature. Volume was determined by 189
rapeseed displacement. Specific volume of individual muffins was calculated by 190
dividing volume by weight. Images of the muffins were captured using a flatbed 191
scanner equipped with the software HP PrecisoScan Pro version 3.1 (HP Scanjet 4400C, 192
Hewlett–Packard, USA). Values were the mean of at least three replicates for each 193
formulation. 194
A Konica Minolta CM-3500 spectrocolorimeter was used to measure the crumb colour 195
parameters (L*, a*, b*) of the muffins. The results were expressed in accordance with 196
the CIELAB system (D65 illuminant and 10° viewing angle). The measurements were 197
made with a 30 mm diameter diaphragm inset with optical glass. The parameters 198
measured were L* (L*= 0 [black], L*=100[white] indicates lightness, a* indicates hue 199
on a green (-a*) to red (+a*) axis, and b* indicates hue on a blue (-b*) to yellow (+b*) 200
axis. Additionally, hue or hue angle (h) and Chroma (C*) values were obtained. Hue 201
angle is the angle for a point calculated from a* and b* coordinates in the colour space. 202
Chroma is the quantitative component of the colour, which reflected the purity of colour 203
in the CIELAB space (Kane, Lyon, Swanson, & Savage, 2003). The muffins were cut in 204
half on a plane parallel to its base and the colour of crumb was measured at several 205
points on the cut surface. Data from three slices per sample were averaged. 206
The instrumental texture measurements of the muffin samples were made with a 207
TA.XT.plus Texture Analyzer (Stable Microsystems, Godalming, UK) provided with 208
Texture expert software. The muffins were cut horizontally at the height of the cup, the 209
upper half was discarded and the 1.5 cm high lower halves were removed from the 210
paper cup. A double compression test (texture profile analysis) was performed with a 75 211
mm diameter flat-ended cylindrical probe (P/75) and compression to 50% of the initial 212
height at a speed of 1 mm/s with 5s waiting time between the two cycles. The 213
parameters obtained from the curves were hardness, springiness, cohesiveness, 214
chewiness, and resilience. Values were the mean of at least three replicates for each 215
formulation, which were prepared twice (two batch), on different days. 216

2.2.5. Statistical analysis 217
For each parameter evaluated, a one way analysis of variance (ANOVA) was applied 218
using Statgraphics Plus V 7.1 (Statistical Graphics Corporation, UK). Bonferroni's 219
multiple comparison procedure was used to assess significant differences (P<0.05) 220
among samples that might allow discrimination among them. 221
3. Results and Discussions 222
To determine the role of proteins in gluten free batters and muffins making, several 223
proteins from different sources were selected and wheat gluten was used for comparison 224
purposes. Overall the experimental results showed some common peculiarities within 225
vegetal proteins and the same within animal source proteins, because of that the 226
discussion of the results has been carried out grouping the proteins regarding their 227
vegetal or animal origin. 228
3.1. Effect of protein source on specific gravity, and dynamic viscoelastic 229
properties of rice flour-based batters. 230
According to the ANOVA results, it was observed that SG was significantly affected 231
(P<0.05) by the protein type (Table 1). The highest SG value was obtained in the batter 232
prepared with casein protein (C). On the contrary, batter in presence of egg white 233
protein (EWP) had the lowest SG, which showed that more air was incorporated and 234
retained during mixing (Turabi et al., 2008; Ronda et al., 2011; Martínez-Cervera et al., 235
2011). VWG, PPI and SPI, proteins from vegetable origin, showed similar effects on 236
SG. Conversely, EWP and C, from animal origin, did not have the same effect on SG. 237
Differences observed could be attributed to the functional properties of the proteins, like 238
emulsifying activity or foam stability. Egg albumen or whey proteins increased the 239
emulsifying activity of rice flour, while pea and soybean proteins hardly modified this 240
parameter, whereas the stability of the emulsion significantly decreased when egg 241
albumen and whey proteins were present (Marco & Rosell, 2008). 242
The viscoelastic properties of the rice-based muffins batter containing different protein 243
sources were studied by dynamic oscillatory test. The mechanical spectra of all the 244
batters (Figure 1 and 2) revealed the typical behaviour of soft gels with values of the 245
storage modulus (G′) higher than the values of loss modulus (G″) and slight dependence 246
of both moduli with frequency (Figure 1). Marco and Rosell (2008) reported that the 247

mechanical spectra of rice flour dough samples (without and with protein isolate) 248
showed G′ values higher than G″ at the frequency range tested (0.1-10 Hz), suggesting a 249
viscoelastic solid behaviour of the dough. 250
The addition of the proteins affected the batter viscoelastic behaviour and the extent of 251
the effect was protein source dependent. The presence of all vegetable proteins modified 252
the elastic and viscous component of the rice-based muffins batter, inducing a hardening 253
effect (increase in G′ and G″) on the batters. Batters containing PPI and SPI showed the 254
highest increase in G′ and G″ values, whereas VWG batter only showed values of G′ 255
and G″ slightly higher to those obtained with the No-Protein batter. Therefore, 256
leguminous proteins induced a major hardening effect on the batter structure. 257
The animal proteins also modified the dynamic mechanical spectra of the rice based 258
muffin batter, with a clear different trend between egg white powder and casein (Figure 259
2). The addition of casein induced a very noticeable change in the batter viscoelastic 260
behaviour. In C batter both moduli showed higher frequency dependence than in the 261
No-Protein and EWP batters. Also the predominance of G′ over G″ was lower in the C 262
batter indicating a more viscous and less elastic behaviour of this batter in comparison 263
to No-Protein and EWP. However, values of both moduli in the C batter were higher 264
than the No-Protein. 265
Viscoelastic data at a frequency of 1 Hz were submitted to analysis of variance to 266
determine the main effects of the protein isolates on viscoelastic properties of rice based 267
muffin batters (Table 1). The presence of the different protein types significantly 268
(P<0.05) changed the viscoelastic properties of the batter. As already mentioned, values 269
of G′ were always higher than values of G″. The presence of SPI, PPI and C, 270
significantly (P<0.05) increased the G′ modulus, and the other proteins tested did not 271
modify it. The extent of the effect of the added protein was greatly dependent on the 272
nature of the added protein. Batters containing vegetable proteins had higher G′ value, 273
although in the case of cereal protein it was not significant, indicating similarities 274
between the gluten protein and the rice proteins. The presence of leguminous proteins 275
induced a large increase of the G′ modulus, being higher with PPI. Those results agree 276
with those of Ronda et al. (2011) and Marco and Rosell (2008). 277
Regarding animal proteins, C induced a significant increase of G′, whereas this was not 278
significantly modified by EWP. The same trend was observed for the G″. Complex 279

modulus (G*) significantly increased due to the addition of proteins, and it showed the 280
same trend observed in G′, indicating low contribution of the viscous component (G″) to 281
the viscoelastic properties of the batter systems. 282
The loss tangent (tanδ) was also significantly (P<0.05) modified by the presence of the 283
protein isolates. Considering that all batter showed G′ >G″, the loss tangent was lower 284
than 1. Both animal proteins significantly decreased the batter viscoelasticity (values of 285
tanδ closer to 1), being the effect much more evident for casein. Contrarily, the 286
vegetable proteins, SPI and PPI induced a significant reduction in the loss tangent with 287
no significant differences between them. 288
Therefore, EWP and specially C led to structures with less solid like character than the 289
rice batter alone, whereas leguminous protein isolates led to more structured and solid 290
like (lower tanδ) batters. In cake batters made of wheat flour, also values of tanδ lower 291
than 1 has been reported (Baixauli, Sanz, Salvador, & Fiszman, 2007). The presence of 292
protein in layer cake batter decreased significantly the loss tangent, with a major 293
diminution when using the SPI than the wheat protein (Ronda et al., 2011). In all batters 294
evaluated, phase angle was lower than 45°, which indicates that the material behaves 295
more like a solid (Rosell & Foegeding, 2007). SPI and PPI batters showed the lowest 296
values of the phase angle, without significant differences between them. Nevertheless, 297
the presence of the other protein significantly (P<0.05) increased the phase angle, with a 298
major increase in the batter containing C (31.67), reflecting, as already mentioned that 299
in the presence of casein the rice based batter increases its viscous component. 300
3.2. Effect of protein source on the viscoelastic properties of batters during heating 301
In order to understand the effect of protein type in the changes occurred during the 302
thermal treatment of the rice-based batters, the viscoelastic properties were studied 303
during the application of a temperature sweep. The storage modulus (G′) values during 304
heating from 25 °C to 95°C are shown in Figures 3 and 4. 305
The presence of vegetable proteins produced changes in the slope of the heating curves 306
that have been associated with starch gelatinization and protein coagulation processes in 307
different muffin batter formulas (Martínez-Cervera et al., 2011; 2012). As expected, 308
No-Protein batter exhibited an early onset of starch gelatinization (61-78 °C), estimated 309
as the first increase in the elastic component when the temperature rises. A similar 310

behaviour was displayed by the batter containing gluten protein, but in this case the 311
onset of gelatinization was reached in the range 70 and 83°C. It is well known that the 312
gelatinization of rice starch occurs at around 70-71°C; while the protein denaturation 313
occurs at temperature above 60 °C, depending of each protein type. Rosell and 314
Foegeding (2007) reported that when heating gluten a decrease of G′ is produced, 315
reaching a minimum at 57°C, and further increase of the temperature induced the 316
formation of a more elastic gluten network, as indicated the increase of G′. These 317
authors explained that gluten proteins show a progressive loss of strength due to protein 318
unfolding, resulting in a decrease of the elastic modulus and undergoes a thermal 319
transition around 60°C. 320
In this study, the conformational changes experimented by both the rice starch and the 321
added proteins were largely responsible for the predominant elastic behaviour of the 322
batters. The addition of wheat proteins did not drastically affected the rheological 323
properties of the batter at temperatures lower than 70°C; however at higher 324
temperatures that batter showed less elastic behaviour, reflecting the development of 325
hindered rice starch three-dimensional internal structure. Additionally, the underlining 326
phenomena that determine the observed reduction in rigidity would be the dissociation 327
and denaturation of the proteins (Sorgentini, Wagner, Arrese, & Añón, 1991). The 328
starch dilution effect also would explain the storage modulus decrease of the batter 329
containing gluten protein. 330
SPI batter showed a progressive increase of G′ as the temperature rises, indicating the 331
formation of a more rigid network (Figure 3). In general, G′ increased with SPI, which 332
can be associated with the development of an internal SPI structure. The heating of SPI 333
dissociated the compact glycinin (11S) and β-conglycinin (7S) oligomers into 334
monomers and therefore, the hydrophobic group are exposed (Tseng, Xiong, & 335
Boatright, 2008), leading to an aggregation process and later the formation of a gel. 336
Particularly, in this curve was not detected any point of inflection, probably the 337
commercial SPI used could be greatly denatured, which allows greater capacity for 338
interaction within active groups that may be present in the system. 339
In regard to PPI batter, the thermal profile revealed different stages (Figure 3), in which 340
G′ upward or downward were detected along the temperature increase. The different 341
stages observed could be indicating the effect of the distinct protein fraction present in 342

the pea protein isolate, since they have different structures, molecular properties and 343
different functional properties. Pea proteins, similarly to soybean proteins, are mainly 344
storage proteins comprised of albumins and two globulins (11S and 7S). The globulins 345
(>80% of total proteins) consist of legumin, vicilin and convicilin (Choi & Han, 2001; 346
Andrade, Azevedo, Musampa, & Maia, 2010). Batter containing PPI showed a marked 347
inflection peak around 88°C, which could be associated with the pea protein 348
coagulation, which ranged from 88.9 to 94.5°C (Choi & Han, 2001). The results 349
indicate that the behaviour of batter containing mainly SPI and PPI is notably 350
dominated by the presence of the protein network. Though both SPI and PPI are 351
leguminous proteins, these proteins yielded different response on heating, likely due to 352
the distinct thermal stability of the protein fractions (Sorgentini et al., 1991; Sirtori, 353
Isak,, Resta, Boschin, & Arnoldi, 2012). 354
The animal proteins also influenced the development of storage modulus of the rice-355
based muffin batters (Figure 4). At 25°C only the batter containing casein, showed G′ 356
values higher than those obtained in the No-Protein batter. EWP containing batter 357
showed similar trend than No-Protein batter at temperature lower than 65°C and a rapid 358
increase was observed from 84°C until the end of the experiment, indicating the 359
formation of a more rigid network. This increase might result from the progressive 360
formation of higher molecular weight products (Kokini et al., 1994). The thermal profile 361
revealed that, again the process of protein denaturation governs the evolution of the 362
storage modulus. Egg white contains as many as 40 different proteins, among them; the 363
major proteins imparting functionality are ovalbumin (54%), conalbumin (12%), 364
ovomucoid (11%) and lysozyme (3.5%). It has been reported that, the denaturation 365
temperature of ovalbumin is close to 84°C, while conalbumin (ovotransferrin) 366
denaturation occurs about 60°C and the denaturation temperature of lysozyme is around 367
70-75°C (Arzeni, Pérez, & Pilosof, 2012). Therefore, the changes observed in G′ 368
behaviour clearly can be associated with the coagulation phenomena of the different egg 369
white proteins. Regarding to batter containing casein, it showed a completely different 370
behaviour than the EWP batter. As heating progresses, the storage modulus value rose 371
until approximately 70°C, where a maximum was detected, then decreased rapidly 372
indicating that the structure was highly prone to weakening, and no increase associated 373
to starch gelatinization was detected. Casein containing batter had very hard 374
consistency, indicating the great water absorption of this protein. In consequence, 375
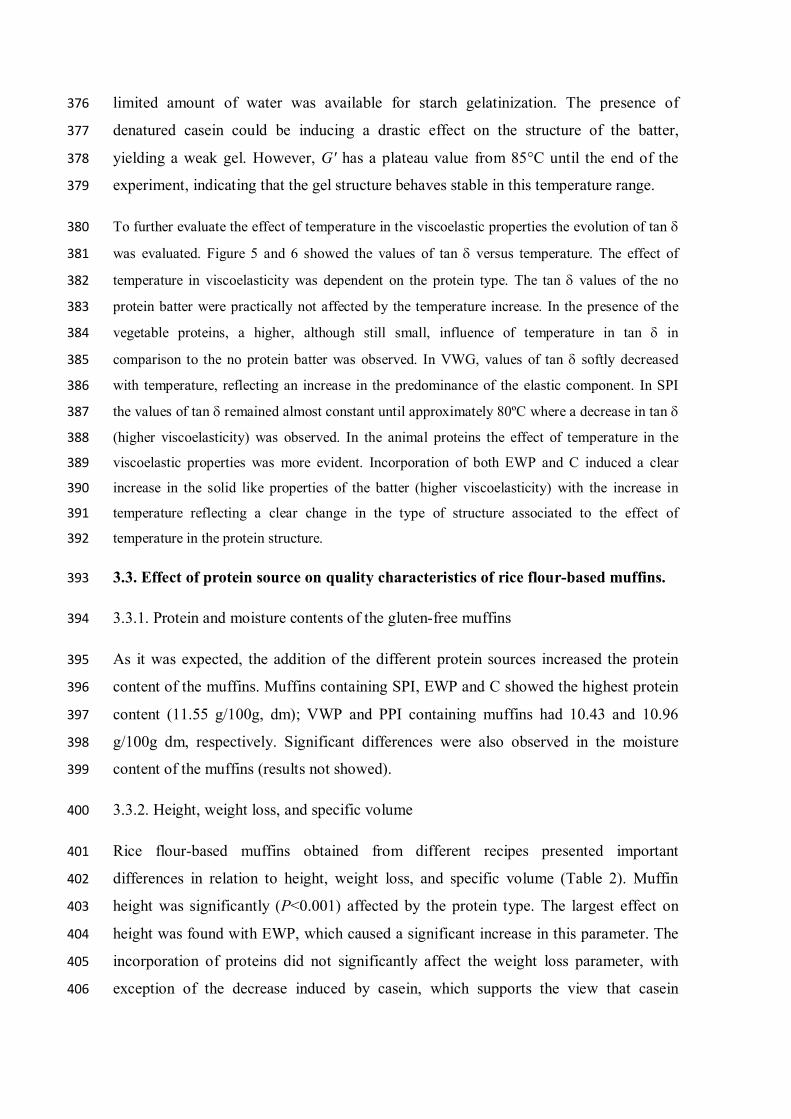
limited amount of water was available for starch gelatinization. The presence of 376
denatured casein could be inducing a drastic effect on the structure of the batter, 377
yielding a weak gel. However, G′ has a plateau value from 85°C until the end of the 378
experiment, indicating that the gel structure behaves stable in this temperature range. 379
To further evaluate the effect of temperature in the viscoelastic properties the evolution of tan 380
was evaluated. Figure 5 and 6 showed the values of tan versus temperature. The effect of 381
temperature in viscoelasticity was dependent on the protein type. The tan values of the no 382
protein batter were practically not affected by the temperature increase. In the presence of the 383
vegetable proteins, a higher, although still small, influence of temperature in tan in 384
comparison to the no protein batter was observed. In VWG, values of tan softly decreased 385
with temperature, reflecting an increase in the predominance of the elastic component. In SPI 386
the values of tan remained almost constant until approximately 80ºC where a decrease in tan 387
(higher viscoelasticity) was observed. In the animal proteins the effect of temperature in the 388
viscoelastic properties was more evident. Incorporation of both EWP and C induced a clear 389
increase in the solid like properties of the batter (higher viscoelasticity) with the increase in 390
temperature reflecting a clear change in the type of structure associated to the effect of 391
temperature in the protein structure.392
3.3. Effect of protein source on quality characteristics of rice flour-based muffins. 393
3.3.1. Protein and moisture contents of the gluten-free muffins 394
As it was expected, the addition of the different protein sources increased the protein 395
content of the muffins. Muffins containing SPI, EWP and C showed the highest protein 396
content (11.55 g/100g, dm); VWP and PPI containing muffins had 10.43 and 10.96 397
g/100g dm, respectively. Significant differences were also observed in the moisture 398
content of the muffins (results not showed). 399
3.3.2. Height, weight loss, and specific volume 400
Rice flour-based muffins obtained from different recipes presented important 401
differences in relation to height, weight loss, and specific volume (Table 2). Muffin 402
height was significantly (P<0.001) affected by the protein type. The largest effect on 403
height was found with EWP, which caused a significant increase in this parameter. The 404
incorporation of proteins did not significantly affect the weight loss parameter, with 405
exception of the decrease induced by casein, which supports the view that casein 406

containing muffin was more capable of binding water during cake making. The No-407
Protein sample and the muffins containing vegetal protein source (VWG, SPI and PPI) 408
did not differ significantly (P<0.01) in specific volume. Conversely, muffins with the 409
highest specific volume were those prepared with animal protein sources, and the 410
greatest effect was observed with EWP, likely due to that more air was incorporated and 411
retained during mixing and baking. Geera et al. (2011) reported that muffins made with 412
dry whole egg formulation had the highest height and volume and the lowest density. 413
Park et al. (2012) found that the specific volume of the rice cupcakes ranged from 2.97 414
to 3.25 mL/g; while Turabi et al. (2008a) found specific volume ranged from 1.08 to 415
1.66 mL/g in rice cake formulated with different gums and an emulsifier blend. In 416
another study, Gularte et al. (2012b) found that the incorporation of legume flour 417
(chickpea, pea, lentil and bean) did not significantly affect the weight loss of the cake; 418
but with the exception of chickpea cake, all legumes flour increased the specific 419
volume. Ronda et al. (2011) evaluated layer rice cake made with SPI and wheat protein 420
reporting that SPI did not modify volume but wheat proteins improved volume. 421
3.3.3. Colour parameters 422
Results from the crumb colour parameters are presented in Table 3. The L*, a* and b*423
values for crumb colour showed significant (P<0.05) differences among the different 424
protein enriched muffins. Lightness of muffin crumb was significantly (P<0.05) 425
decreased by VWG, SPI, PPI and C proteins; while the EWP addition increased L*426
value. The lowest L* was obtained for PPI containing muffin, which was due to the 427
darker colour of the protein isolate (data no showed). Consequently, the L* values can 428
be associated to the original colour of both rice flour and protein isolates. Colour in 429
baked goods could come from different sources: intrinsic colour imparted by individual 430
ingredients (Gularte et al., 2012b), developed colour resulting from the interaction of 431
ingredients (Acosta, Cavender, & Kerr, 2011), like Maillard or caramelization reactions, 432
besides processing changes associated to chemical or enzymatic reactions. Regarding a*433
values, all samples showed positive a* values, indicating hue on red axis, and all were 434
higher than those of the No-Protein, with the exception of EWP sample that showed 435
negative a*. The b* scale showed positive values (yellow hue) for all samples 436
evaluated. However, EWP muffin did not exhibited significant (P<0.05) differences 437
when compared to No-Protein sample. PPI, followed by SPI showed higher b* value 438
than the other samples, it could be derived from the original yellowish pigment of the 439

pea and soy protein powder added as ingredient in each formulation. Results agree with 440
previous studies (Gómez, Moraleja, Oliete, Ruiz, & Caballero, 2010 ; Gularte et al., 441
2012b). In relation to hue angle, h and chroma, C* colour attributes, great variation was 442
observed (Table 4). All the muffins presented positive hue angle values (81.64 - 92.29°) 443
reflecting their yellow-orange hue. Additionally, the PPI and SPI muffins increased 444
chroma compared with all other samples, which revealed their higher purity of colour 445
related to major intensity of the yellow component. 446
3.3.4. Global appearance of the muffins 447
Muffin images clearly revealed differences among crumb muffins samples, mainly 448
related to shape, crumb porosity, crumb colour and degree of collapse on surface of 449
muffins by effect of type of protein added (Figure 7). Great variation in the appearance 450
of the crumb structure between the samples was observed. No-Protein and VWG 451
containing muffin showed denser matrix, indicating more compact crumb than other 452
muffins samples. Contrarily, muffins containing EWP and C protein showed higher 453
number of air bubbles than No-Protein, showing more spongy and light structure. 454
Addition of casein produced muffins with stable network structure with homogeneous 455
air cell but showed higher degree of collapse on surface, in addition these muffins 456
showed a soft and humid appearance. SPI and PPI muffins did not show collapse during 457
baking, but presented compact crumb. 458
3.3.5. Instrumental texture 459
The effect of protein on the texture parameters of rice flour-based muffins is shown in 460
Table 4. According to ANOVA results, muffins differed significantly (P<0.05) in 461
crumb hardness, springiness, cohesiveness, chewiness and resilience. The incorporation 462
of protein sources increased significantly (P<0.05) springiness and cohesiveness of 463
muffins samples, except with addition of SPI, which showed the same values as the No-464
Protein sample. The hardness significantly (P<0.05) increased only in presence of 465
casein. It was also observed that hardness and chewiness showed similar trend for all 466
samples, with exception of muffins containing EWP, which had the highest chewiness 467
value. 468
In general, the addition of vegetal protein sources did not induce a clear tendency on 469
crumb hardness. However, PPI containing muffins showed the lowest hardness, and the 470

highest springiness value among the samples made from vegetable proteins. A 471
significant (P<0.05) increase in the springiness and cohesiveness was observed in VWG 472
and PPI containing muffins, while only the sample containing VWG showed a 473
significant (P<0.05) increase in the chewiness, indicating more difficulty in chewing the 474
sample. All muffins containing vegetal proteins showed low resilience value; however 475
no significant differences were observed in this parameter when compared with No-476
Protein. Dense masses with lower number of gas cell led to lower resilience values, 477
implying that it will take more time for the structure of the muffins to recover after 478
compression (Martínez-Cervera et al., 2011). It has been reported that the incorporation 479
of legumes flour (chickpea, pea, lentil and bean) significantly (P<0.05) increased the 480
hardness and chewiness in rice based cakes, except with the addition of lentil (Gularte et 481
al., 2012b). 482
Regarding the animal proteins, a significant (P<0.01) increase in the hardness was 483
observed in C containing muffins. Additionally, a significant (P<0.05) increase in the 484
springiness, cohesiveness, and resilience was observed in the presence of EWP and C 485
muffins, indicating more elasticity. The increase in springiness, cohesiveness and 486
resilience values could be also reflecting higher specific volume values, and more 487
aerated structure, which was found for these samples. It is known that, springiness is 488
associated to fresh, aerated and elastic product, and in the case of muffins high 489
springiness values are linked to high quality (Sanz et al., 2009). 490
In general, muffins made from animal proteins were springier, more cohesive and 491
chewy than those made from vegetal protein source. Results clearly revealed great 492
variability on texture quality of the rice-based muffins made from different protein 493
sources. 494
4. Conclusions 495
Results obtained allow concluding that both the rheological properties of the batters and 496
the technological characteristics of the muffins obtained are notably dominated by the 497
type of protein used in the formulations. All vegetal protein sources had similar effect 498
on specific gravity of the batters, while EWP decreased the specific gravity. The 499
presence of SPI, PPI and C significantly (P<0.05) increased the storage modulus. In 500
general, G′ showed large increase with the temperature when SPI, PPI and EWP were 501
added. These differences can be attributed to the nature and the denaturation pattern of 502

the protein fractions comprised within each protein isolate. Regarding the muffins 503
quality, EWG increases the height and specific volume, and muffins colour was 504
dominated by the colour of the added proteins. Concerning texture, PPI containing 505
muffins were the softest and springier than the No-Protein and casein gave the hardest 506
muffin. In general, muffins with best visual appearance were those containing egg white 507
protein or casein. 508
The development of sweet-baked gluten-free product is greatly dependent on the protein 509
source. The use of other proteins as egg and milk replacements, like soybean protein 510
isolate or pea protein isolate, affects texture of baked goods. Therefore, the optimization 511
of this type of formulations is fundamental to ensure the proper texture and good taste 512
of this type of products. Additionally, future studies will be undertaken to determine the 513
sensory quality and consumer acceptance of these gluten-free muffins. 514
Acknowledgements 515
The authors acknowledge the financial support of Spanish Scientific Research Council 516
(CSIC), the Spanish Ministry of Economy and Sustainability (Project AGL2011-517
23802), and the Generalitat Valenciana (Project Prometeo 2012/064). M.E. Matos 518
would like to thank predoctoral grant by the Council of Scientific and Humanistic 519
Development of University Central of Venezuela (Caracas, Venezuela) 520
References 521
AACCI Approved Methods. (2000). Approved methods, 11th edn. American 522
Association of Cereal Chemists International, St Paul. 523
Acosta, K., Cavender, G., & Kerr, W.L. (2011). Sensory and physical properties of 524
muffins made with waxy whole wheat flour. Journal of Food Quality, 34, 343–351. 525
Andrade, R.J., Azevedo, A.G., Musampa, R.M., & Maia, J.M. (2010). Thermo-526
rheological behavior of model protein–polysaccharide mixtures. Rheological Acta, 49, 527
401–410. DOI 10.1007/s00397-010-0431-3. 528
Arzeni, C., Pérez, O.E., & Pilosof, A. M.R. (2012). Functionality of egg white proteins 529
as affected by high intensity ultrasound. Food Hydrocolloids, 29, 308-316. 530
Baixauli, R., Sanz, T., Salvador, A., Fiszman, S.M. (2007). Influence of the dosing 531
process on rheological and microstructural properties of a bakery product. Food 532
Hydrocolloids, 21, 230-236. 533

Choi, W-S., & Han, J.H. (2001). Physical and Mechanical Properties of Pea-Protein-534
based Edible Films. Journal of Food Science, 66, 319-322. 535
de la Hera, E., Martinez, M., Oliete, B., & Gómez, M. (2012) Influence of Flour 536
Particle Size on Quality of Gluten-Free Rice Cakes. Food Bioprocess Technology. DOI 537
10.1007/s11947-012-0922-6. 538
Geera, B., Reiling, J.A., Hutchison, M.A., Rybak, D., Santha, B. & Ratnayake, W.S. 539
(2011). A comprehensive evaluation of egg and egg replacers on the product quality of 540
muffins. Journal of Food Quality, 34, 333–342. 541
Gómez, M., Moraleja, A., Oliete, B., Ruiz, E., & Caballero, P. A. (2010). Effect of fibre 542
size on the quality of fibre-enriched layer cakes. LWT - Food Science and Technology, 543
43, 33-38. 544
Gómez, M., Ronda, F., Caballero, P.A., Blanco, C.A., & Rosell, C.M. (2007). 545
Functionality of different hydrocolloids on the quality and shelf-life of yellow layer 546
cakes. Food Hydrocolloids, 21, 167–173. 547
Gularte, M.A., de la Hera, E., Gómez, M., & Rosell, C.M. (2012a). Effect of different 548
fibers on the enrichment of gluten-free layer cake. LWT - Food Science and Technology, 549
48, 209-214. 550
Gularte, M.A., Gómez, M., & Rosell, C.M. (2012b). Impact of legume flours on quality 551
and in vitro digestibility of starch and protein from gluten-free cakes. Food Bioprocess 552
Technology: An International Journal, 5, 3142-3150. 553
ICC (1994). Official Methods of Analysis. International Association for Cereal 554
Chemistry,Vienna. ICC Standard No. 105/2, 110/1. 555
Kane AM, Lyon BG, Swanson RB, Savage EM (2003) Comparison of two sensory and 556
two instrumental methods to evaluated cookie colour. J Food Sci 68:1831-1837. 557
Kokini, J.L., Cocero, A.M., Madeka, H., & de Graaf, E. (1994). The development of 558
state diagrams for cereal proteins. Trend in Food Science and Technology, 5, 281-288. 559
Marco, C., & Rosell, C.M. (2008). Functional and rheological properties of protein 560
enriched gluten-free composite flours. Journal of Food Engineering, 88, 94–103 561
Mariotti, M., Lucisano, M., Pagani, M.A., & Ng, P.K.W. (2009). The role of corn 562
starch, amaranth flour, pea isolate, and Psyllium flour on the rheological properties and 563
the ultrastructure of gluten-free doughs. Food Research International, 42, 963–975. 564

Martínez-Cervera, S., Salvador, A., Muguerza, B., Moulay, L., & Fiszman, S.M. (2011). 565
Cocoa fibre and its application as a fat replacer in chocolate muffins. LWT- Food 566
Science and Technology, 44, 729-736. 567
Martínez-Cervera, S., Sanz, T., Salvador, A., & Fiszman, S. M. (2012). Rheological, 568
textural and sensorial properties of low-sucrose muffins reformulated with 569
sucralose/polydextrose. LWT- Food Science and Technology, 45, 213–220. 570
Matos, M.E., & Rosell, C.M. (2011). Chemical composition and starch digestibility of 571
different gluten-free breads. Plant Food for Human Nutrition, 66, 224–230. 572
Nachay, K. (2010). Gluten-free offerings increase. Food Technology, 64, 13-14. 573
Park, S.J., Ha, Ki-Y., & Shin, M. (2012). Properties and Qualities of Rice Flours and 574
Gluten-free Cupcakes Made with Higher-yield Rice Varieties in Korea. Food Science 575
Biotechnology, 21, 365-372. DOI 10.1007/s10068-012-0048-7. 576
Ronda, F., Oliete, B., Gómez, M., Caballero, P.A., & Pando, V. (2011). Rheological 577
study of layer cake batters made with soybean protein isolate and different starch 578
sources. Journal of Food Engineering, 102, 272–277. 579
Rosell, C.M., & Foegeding, A. (2007). Interaction of hydroxypropylmethylcellulose 580
with gluten proteins: Small deformation properties during thermal treatment. Food 581
Hydrocolloids, 21, 1092–1100. 582
Sanz, T., Salvador, A., Baixauli, R., & Fiszman, S.M. (2009). Evaluation of four types 583
of resistant starch in muffins. II. Effects in texture, colour and consumer response. 584
European Food Research and Technology, 229, 197–204. DOI 10.1007/s00217-009-585
1040-1. 586
Sirtori, E., Isak, I., Resta, D., Boschin, G., & Arnoldi, A. (2012). Mechanical and 587
thermal processing effects on protein integrity and peptide fingerprint of pea protein 588
isolate. Food Chemistry, 134, 113–121. 589
Sorgentini, D.A., Wagne,r J.R., Arrese, E.L., & Añón, M.C. (1991). Water imbibing 590
capacity of soy protein isolates: Influence of protein denaturation. Journal of 591
Agricultural and Food Chemistry, 39, 1386-1391. 592
Tseng, Y-C., Xiong, Y.L., & Boatright, W.L. (2008.) Effects of inulin/oligofructose on 593
the thermal stability and acid-induced gelation of soy proteins. Journal of Food Science, 594
73, 44-50. 595
Turabi, E., Sumnu, G., Sahin, S. (2008a) Rheological properties and quality of rice 596
cakes formulated with different gums and an emulsifier blend. Food Hydrocolloids, 22, 597
305–312. 598

Turabi, E., Sumnu, G., & Sahin, S. (2008b). Optimization of baking of rice cakes in 599
infrared-microwave combination oven by response surface methodology. Food and 600
Bioprocess Technology, 1, 64–73. DOI: 10.1007/s11947-007-0003-4.601

FIGURE CAPTIONS 602
Figure 1. Dynamic mechanical spectra of different rice based batters. Without protein 603 (♦) and with various vegetal protein sources (▲VWG; ● SPI; and ■ PPI) measured 604 25°C. Closed symbols referred to storage modulus (G′ ) and open symbols designated 605 loss modulus (G″).606
Figure 2. Dynamic mechanical spectra of different rice based batters. Without protein 607 (♦) and with various animal protein sources (● EWP and ▲ C ) measured at 25°C. 608 Closed symbols referred to storage modulus (G′ ) and open symbols designated loss 609 modulus (G″). 610
Figure 3. Storage modulus (G′ ) as a fuction of increasing temperature in different rice 611 flour batters. Without protein (◊) and with various vegetal proteins (∆ VWG ;○ SPI; and 612 □ PPI). 613
Figure 4. Storage modulus (G′ ) as a fuction of increasing temperature in different rice 614 flour batters. Without protein (◊) and with various animal proteins (∆ EWP and □ C). 615
Figure 5. Loss tangent (tan ) as a fuction of increasing temperature in different rice 616 flour batters. Without protein (◊) and with various vegetal proteins (∆ VWG ;○ SPI; and 617 □ PPI). 618
Figure 6. Loss tangent (tan ) as a fuction of increasing temperature in different rice 619 flour batters. Without protein (◊) and with various animal proteins (∆ EWP and □ C). 620
621
622

Figure 1. 623
624
Figure 2.625
626
627
628
629
630
631

Figure 3. 632
633
634
635
Figure 4.636
637
638
639
640
641
642
643
644
645

Figure 5 646
647
648
Figure 6. 649
650
651 652

Table 1: Specific gravity (SG) and Viscoelastic parameters at 25ºC and 1 Hz (6.28 rad/s) of muffin batters prepared with different protein sources 653
Sample SG
(g/mL) G' (Pa)G''
(Pa) G*(Pa) Phase angle(°)
No-Protein 1.03 ± 0.01 b 290 ± 50 a 100 ± 20 a 310 ± 60 a 19.0 ± 0.6 bVWG 1.05 ± 0.01 c 580 ± 20 a 220 ± 10 ab 620 ± 20 a 20.5 ± 0.2 bSPI 1.04 ± 0.01 bc 1580 ± 100 b 450 ± 10 bc 1640 ± 100 b 15.9 ± 0.8 aPPI 1.04 ± 0.01 bc 2020 ± 105 bc 590 ± 25 c 2100 ± 110 bc 16.2 ± 0.2 aEWP 0.97 ± 0.00 a 230 ± 30 a 100 ± 20 a 250 ± 35 a 22.9 ± 0.7 cC 1.08 ± 0.00 d 2090 ± 350 c 1290 ± 190 d 2450 ± 390 c 31.7 ± 0.7 dP- value 0.0001 0.0001 0.0001 0.0001 0.0001
Means ± standard deviation values followed by different letters within a column denote significant differences (P<0.05) (n=4). 654 No-Protein: Without protein; VWG: vital wheat gluten; SPI: soy protein isolate; PPI: pea protein isolate; EWP: egg white protein; C: casein 655
656
Table 2. Physical characteristics of protein enriched muffin prepared with different protein sources 657
Sample Height (mm) Weight loss (g) Specific volume
(mL/g) No-Protein 37.1 ± 1.1 bc 7.5 ± 0.3 ab 1.56 ± 0.04 aVWG 38.2 ± 1.0 c 7.6 ± 0.2 b 1.54 ± 0.05 aSPI 35.2 ± 1.3 a 7.6 ± 0.3 ab 1.54 ± 0.04 aPPI 36.4 ± 0.9 ab 7.5 ± 0.2 ab 1.54 ± 0.05 aEWP 43.2 ± 2.2 d 7.4 ± 0.3 ab 2.19 ± 0.05 cC 36.7 ± 1.3 abc 7.2 ± 0.4 a 1.74 ± 0.05 bP- value 0.0001 0.0220 0.0001
Means ± standard deviation values followed by different letters within a column denote significant differences (P<0.05) (n=6) 658 No-Protein: Without protein; VWG: vital wheat gluten; SPI: soy protein isolate; PPI: pea protein isolate; EWP: egg white protein; C: casein 659
660

Table 3. Crumb colour parameters of protein enriched muffins. 661 662
Sample L* a* b* C* h(°) No-Protein 78.13 ± 0.59 d 0.38 ± 0.10 b 15.9 ± 0.4 a 15.9 ± 0.4 a 88.6 ± 0.3 e
VWG 73.82 ± 0.29 b 1.82 ± 0.08 d 20.3 ± 0.3 c 20.4 ± 0.3 c 84.9 ± 0.2 cSPI 73.27 ± 0.40 a 2.57 ± 0.12 e 21.4 ± 0.4 d 21.5 ± 0.4 d 83.1 ± 0.3 bPPI 72.83 ± 0.60 a 3.87 ± 0.30 f 26.3 ± 0.5 e 26.6 ± 0.6 e 81.6 ± 0.5 a
EWP 86.40 ± 0.30 e -0.60 ± 0.04 a 15.7 ± 0.3 a 15.7 ± 0.3 a 92.2 ± 0.2 fC 77.18 ± 0.48 c 0.66 ± 0.13 c 17.2 ± 0.5 b 17.2 ± 0.5 b 87.8 ± 0.4 d
P- value 0.0001 0.0001 0.0001 0.0001 0.0001 Means ± standard deviation values followed by different letters within a column denote significantly different levels (P<0.05) (n=9) 663 No-Protein: Without protein; VWG: vital wheat gluten; SPI: soy protein isolate; PPI: pea protein isolate; EWP: egg white protein; C: casein 664
665
Table 4. Texture parameters of protein enriched muffins prepared with different protein sources 666
TPA parameters Samples Hardness (N) Springiness Cohesiveness Chewiness (N) Resilience No-Protein 104 ± 11 a 0.564 ± 0.042 a 0.411 ± 0.009 a 24 ± 2 a 0.186 ± 0.006 ab
VWG 104 ± 8 a 0.644 ± 0.046 bc 0.457 ± 0.010 c 31 ± 4 a 0.193 ± 0.006 abSPI 114 ± 14 ab 0.573 ± 0.037 a 0.412 ± 0.008 ab 27 ± 5 a 0.179 ± 0.005 a PPI 97 ± 15 a 0.610 ± 0.029 ab 0.450 ± 0.025 abc 27 ± 4 a 0.191 ± 0.010 ab
EWP 114 ± 11 ab 0.818 ± 0.047 d 0.672 ± 0.063 d 63 ± 10 c 0.283 ± 0.040 c C 123 ± 5 b 0.686 ± 0.028 c 0.494 ± 0.005 c 42 ± 3 b 0.209 ± 0.003 b
P- value 0.0013 0.0001 0.0001 0.0001 0.0001Means ± standard deviation values followed by different letters within a column denote significant differences (P<0.05) (n=4)667 No-Protein: Without protein; VWG: vital wheat gluten; SPI: soy protein isolate; PPI: pea protein isolate; EWP: egg white protein; C: casein 668
669