Food Habits in Madras State, Part XI-B, Vol-IX - Linguistic ...
108
CENSUS OF INDIA 1961 VOLUME IX MADRAS PART XI-B FOOD HABITS IN MADRAS STATE P. K. NAMBIAR OF THE INDIAN ADMINISTRATIVE SERVICE SUPERINTENDE:-lT OF CENSUS OPERATIONS, MADRAS 1964
-
Upload
khangminh22 -
Category
Documents
-
view
1 -
download
0
Transcript of Food Habits in Madras State, Part XI-B, Vol-IX - Linguistic ...
CENSUS OF INDIA 1961 VOLUME IX
MADRAS
PART XI-B
FOOD HABITS IN MADRAS STATE
P. K. NAMBIAR
OF THE INDIAN ADMINISTRATIVE SERVICE
SUPERINTENDE:-lT OF CENSUS OPERATIONS,
MADRAS
1964
Par t I-A
I-B
'" I-C
* P ar t II-A
* II-B (I)
* II-B (II)
* II-C (l)
II-C (H)
Par t III
* Part IV-A
* IV--B
Pa rt V-A
V-B
V-C
V-D
V-E
.p art VI
* Par t VII-A
VII-B
*PartVIII-A
* VIII-B
Pa rt IX
Part X
Part XI
'" A
t B
C
D
'" E
F
Pa rt XII
CENSUS OF INDIA 1961
Census Report-Vol. IX will relate to Madras State only.
Under this series will be issued the following Publications.
General Report (2 Volumes)
Demography and Vital Statistics
Subsidiary Tables
General Population Tables
General Economic Tables B-1 to B-IV
General Economic Tables B-V to B-IX
Cultural Tables
Migration Tables
Household Economic Tables
Report on Housing and Establishments
Housing and Establishment Tables
Scheduled Castes and Tribes (Report & Tables)
Ethnographic Notes on Scheduled Tribes
Todas
Ethnographic Notes on Scheduled Castes
Ethnographic Notes on Denotified and Nomadic Tribes
Village Survey Monographs (40 Nos_)
Crafts and Artisans (9 Nos.)
Fairs and Festivals
Administration Report-EnumeratiOn}
Administration Report-Tabulation For oflicial use only
Atlas of the Madras State
Madras City (2 Volumes)
District Census Handbooks on twelve districts
Reports on Special Studies
Handlooms in Madras State
Food Habits in Madras State
Slums of Madras City
Temples of Madras State (5 Volumes)
Physically Handicapped of Madras State
Family Planning Attitudes: A Survey
Languages of Madras State
, ,_ ---------* ALREADY PUBLISHED tTHE PRESENT VOLUME

PREFACE
III his desire to enrich the Census literature, Sri A. Mitra, Registrar General. India. has followed a liberal policy of encouraging the Census Superintendents to take up special studies on any subject relating to their Stales. I have utilised his generosity and taken up some special studies on Madras State. I have already published two reports, one on Handlooms and the other on the Physically Handicapped. This is the third in the series which is on Food Habits in Madras State.
Food is a living problem, but it is also a controversial problem. As such, it is with some diffidence that I present this report to the reader. Sri Mitra has been good enough to read through the original draft and suggest to me a re-orientation in my approach, that is: from a sample study to a general study.
Sri T. B. Bharathi, Deputy Superintendent of Census Operations, who has \vorkcd with me for the last [our years has beel! in charge of this study. As an officer of (he Madras Civil Service, he had not only an opportunity to know the conditions in Madras State, but was also intimately connected with the foodgrain programmes of the Madras Government. His ~pccial knowledge was useful in the study. He has taken great pains in collecting a lot of valuable data from various sources. He has also made an intelligent and deep analysis of the data and given me a self-contained and useful draft.
1 have recorded a few conclusiolls~ but whatever be their merit, I have no doubt that the data contained in this book have great potential value.
Sri N. Rama Rao, Tabulation OffIcer, has been closely associated with the study as the Statistician. He has also taken pains in reading the proof and getting the volume printed quickly. I also wish to thank the United Printers, Madras for printing this volume in record time. The maps have been prepared by Sri M. Ganesh Lal, the Cartographer attached to my Ofi1ce.
P. K. N A M B I A R
CONTENTS
CHAPTER PAGE
I Introduction
II Cereal habits 7
III Level of consumption of cereals 16
IV Movement of cereals 21
V Projections of demand for and supply of cereals 25
VI Milk 31
VII Sugar and Jaggery 41
VIII Pulses 44
IX Non-vegetarian foods 48
X Other subsidiary items of food 53
XI General pattern of food 61
XlI Integrated approach to the problem of food production 64
Appendices (I to X) 69
MAPS
2
3
CHARTS
2
3
4
5
ILLUSTRATIONS
Cereal habits
Movements of paddy and rice in Madras State
Actual consumption in households and nutritional requirement
Distribution of rice eaters etc., in Madras State
Comparative position of production and consumptiell of cereals in the various districts
Trend in the growth of urban population
Lorenz and specific concentration curves (cereals) for rural areas
Lorenz and specific concentration curves (cereals) for urban areas
FACING PAGE
4
24
62
16
18
26
28
28

CHAPTER I
INTRODUCTION
Challenge of 1951 Census
1. In his able report on the Census of India 1951, Sri R. A. Gopalaswami, the then Registrar General, has recorded some thought-provoking and bold conclusions on the future of this country. One is that we cannot grow as much food as we shall need if we go on increasing in numbers as we do. It is possible to overcome the food shortage on a permanent basis by taking suitable measures over an extended period of 15 years. For this purpose, development of agricultural productivity on an even larger scale than that undertaken in the First Five Year Plan would be necessary. Secondly, births should be limited to approximate parity with death and a substantially stationary population achieved. This could be achieved if what is described as improvident maternity could be avoided by most married couples. Improvident maternity consists of all births occurring to mothers who have already had three or more children when at least one of them is alive. These two measures, according to him, are essential to raise the level of nutrition and the standard of living of the people and the improvement of public health and for securing for the citizens, men and women equally, the right to adequate means of livelihood. This bold challenge thrown to the nation has shaped the thinking of all planners including the Planning Commission. The attention of the country has been diverted to the improvement of agricultural productivity in all sectors and to a lesser extent for limiting the population of the country.
Its impact on Madras State
2. It is our purpose to examir.e in this report how far his observations are valid as far as Madras State is concerned. Actually, the population forecast made by Sri R. A. Gopalaswami for all-India has been exceeded by the actual count in 1961 Census. But in Madras the percentage increase in population during 1951-61 has fallen short of that of India, 11'8 as against 21'5. This trend is likely to be maintained and with the greater emphasis given to Family Planning, the food problem cannot be that serious in Madras State. As observed by Sri Gopalaswami, the high proportion of foodgrains especially cereals to all crops in our
cultivation reflects the high proportion of foodgrairis, especially cereals in our diet. If we are to have more vegetable oil and more ghee, more milk and butter milk, more vegetables and fruits, more sugar and spices in our food-more of these are badly needed if we are to have better nutrition-we have to increase the production of all food crops, rather than food grains.
It is, therefore, clear that in tackling any food problem, we have not only to examine the quantity of food, but also it~ quality. An attempt has been made in the food survey conducted by us to study the quality of food consumed by the people of Madras State, so that it will help us in understanding the nutritional food needs of the State. Agriculture in Madras State is more productive than in India as a whole; the yield of rice per acre in Madras State for an average year during the period 1956-58 was 1,272 pounds as against 1,160 pounds in all India. During the seven years 1949-50 to 1956-57 production of food grains in Madras State increased by 16'3 lakh tons or roughly 54%. This rise had one significant effect. It converted Madras from a net importer to a nearly self-sufficient State.
Food Problem in retrospect
3. From the 18th Century, Madras has been deficit in food supply. An English writer has recorded as follows: "Madras with most of other places on the coast of Coromondel (which is in general barren and does not produce grain enough for the subsistence of its inhabitants) is obliged to be yearly supplied from the more fertile coasts of Orissa and Bengal, with vast quantities of rice, which is the chief food of most of the people of the East Indies; so that an enemy that is superior at sea may easily distress them very much by taking the vessel laden with rice coming from the Northward." In the 18th and 19th Centuries, a policy of laissez jaire was followed by the British Government. It depended on foreign imports. But still famines occurred. A list of famines and scarcities which threatened Madras will be found in Appendix I. The attitude of the Government towards famine will be found in the Famine Code published by the Government of Madras: "The proximate cause of a famine in time
2 FOOD HABITS IN MADRAS STATE
of peace is the failure of crops resulting from insufficient or untimely rainfall...... In such circumstances, seeing that it has been recognised as incumbent on the State to take steps to avert the loss of human life which is likely to ensue if means of subsistence are not afforded to those affected, it becomes necessary to lay dOWIlt a plan of action beforehand, so that when famine is imminent, there may be no doubt or hesitation as to the measures to be adopted with the object of relieving them. In conducting a campaign against famine, it must be laid down as a first principle that the object of State intervention is to save life and that all other considerations should be subordinate to this. The succeS3 or otherwise of the relief methods at such a crisis cannot be subjected to a financial test, for the bills of mortality will furnish the only true criterion. If, however, it is necessary to set aside the financial considerations by which the scope of administration is usually regulated, it follows that official routine in all departments, whenever it may prove obstructive, should be similarly relaxed to meet the abnormal requirements of the situation. At the same time it must be remembered that, though the State is bound to protect the people from starvation in times of distress, it is no part of its duty to maintain them at their normal level of comfort or insure them against all suffering." This summarises the attitude of the British Government and no positive and practical step was taken to increase the agricultural output as a safeguard against the recurrence of famine.
India depended on import of foodgrains till 1939, but when Burma, the source of supply fell to the Japanese, the country faced an acute shortage of foodgrains, especially rice. A severe famine broke out in Bengal in 1943. Lack of transport and preference given to the movement of war supplies made it difficult for the Government to rush supplies to scarcity areas. During the war, there was a general rise in the price of foodgrains. After Independence, food deficit of India became larger as some of the surplus areas were transferred to Pakistan. It was thought that decontrol would meet the situation but still the price level went up. The Government reintroduced control within a few months but they could not check the rapid rise in prices. Any control based On rationing and procurement always resulted in blackmarketing. The remedy was to increase the supplies. So the Government imported large quantities of wheat from U. S. A., Canada and Australia. The import in 1951 was 4'7 million tons. It also coincided with a bumper
harvest in 1952-53. The lowest price level was r~corded in June 1953.
India has 14% of the world's population, but only 2% of the total land. It produced 54 million tons of foodgrains including pulses when its population was about 361 millions. In the First Five Year Plan, the Planning Commission wanted to raise the internal production to 61.6 million tons. But actually the target was exceeded, in that the production at the end of the First Five Year Plan stood at 65.8 million tons. There was a feeling that India had attained selfsufficiency. The popUlation of 1961 was then projected at the level of 407 millions. So a target of 75 million tons was fixed for the Second Five Year Plan with the hope that India would become surplUS. It produced 79.3 million tons, a little in excess of the target fixed, but it could not attain self-sufficiency because the population increase was more than what was expected.
Foodgrains Enquiry Committee
4. In 1961 the population of India stood at 440 millions, exeeding all projections made by demographers. Since the years 1956 and 1957 saw increase in the price level of foodgrains, the Government of India appointed a high power committee in 1957 with Sri Ashok Mehta as Chairman to investigate fully into the causes of rise in price. The terms of reference to the Committee were as follows ;-
1. To review the present food situation and to examine the causes of rising trend of foodgrains since about the middle of 1955.
2. To assess the likely trends in demand and availability of f00dgrains over the next few years taking into account;
(a) the steps taken and those proposed to be taken under the Second Five Year Plan by the Central and State Governments to increase food production;
(b) the impact of growing development expenditure, increase in population and urbanisation on the demand for marketable surpluses;
(c) availability of foodgrains from abroad in relation to requirements and in the light of foreign exchange position, and
INTRODUCTION
3. To make recommendations to ensure the level of prices which would provide necessary incentive to the producer with due regard to the interest of the consumer and the maintenance of a reasonable cost structure in the economy.
The conclusion of the Committee was that the food position would continue to be difficult. It emphasised the need for stablising the prices and control over trade in foodgrains and its nationalisation. It recommended increased production as well as family planning. The Government of India accepted the major recommendations of the Committee and on the advice of the National Deve10rment Council, controls were introduced in 1959. Fair price shops were opened and procurement of rice was also begun. The States were an unwilling party to this experiment. The procurement was made from the millers and wholesalers. In practice the wholesalers and millers conducted their trade in the name of agriculturists. Requisitioning of stocks from agriculturists was also resorted to. The producers and the consumers did not like any form of control; control was lifted in 1959 itself. As such, the recommendation of the Committee that control should be established over the trade in foodgrains could not be implemented in practice. It was, therefore, thought that the other recommendation could be implemented-stepping up of production and enforcement of family planning. So in the Third Five Year Plan the target of food production has been fixed at 100 million tons, i.e. 84 million tons of cereals and 16 million tons of pulses. It represents an increase of 30% in five years. An increase by 30% in the irrigated area was also contemplated.
The objective of self-sufficiency.
5. One of the five objectives of the Third Five Year Plan was to achieve self-sufficiency in foodgrains and increase agricultural production to meet the requirements of industry and exports. As an objective, it is good, but in practice it may be difficult to achieve. Sri P. P. I. Vaidyanathan, I. C. S., Commissioner for Food Production in Madras in an article "Towards self-sufficiency in food" has stated that during the last 15 years we have become sensitive to our food situation. Self-sufficiency in food has become an ideal and even a slogan. But like other ideals and slogans, self-sufficiency has remained extremely vague and elusive, so much so we may not even know when we have attained or passed the self-sufficiency mark. It is, therefore, necessary to estimate the production and
study the food habits of the people correctly. The quantity of food needed by a country cannot be fixed by the numbers of its population only. Food habIts play an important part. Again, the increasing tempo of industrialisation and urbanisation have tended to change the food habits of the people. The consumption level will depend on other factors like the purchasing capacity of the people. In an analysis on the food policy and economic development in India, Prof. S.C. Joseph has stated as follows: "The Government food policy was essentially a quantitative one and it failed to answer either the feeding or productive problems". He has suggested that a qua1itative approach to food production and food consumption would have been the best solution not only in the immediate future, but also in the distant future.
At this stage, it will be relevant to refer to the views of Sri S. Ranganathan who was connected with the Nutrition Research Laboratories at Coonoor. According to him, to ensure nutrition and health, greatest stress should be laid on the production of foods other than cereals. He has recommended a change in food habits. This view has been the subject of some controversy. But as it highlights one aspect of the food situation in Madras State which we have examined in the course of our study, we have reproduced in Appendix II his article and an editorial in The Hindu dated 29th August 1961.
Consumption pattern in the State
6. The pattern of food consumption in Madras is different from that in other States in India. But its problems regarding supply are similar to other States. Under the Constitution of India, food is in the concurrent list. The States do have some autonomy in distribution and enforcement of controls, but in practice they have to fall in line with the all-India policy. For instance, any control on the movement of foodgrains is welcomed by some States while it is resented by others. Madras is surrounded by the States of Kerala, Mysore and Andhra Pradesh. Kerala is highly deficit in food; Mysore can be treated as self-sufficient; Andhra Pradesh is surplus though the quantity which is found surplus has shown a tendency to fall. In quantity, Madras has attained self-sufficiency. As such, in theory it can follow a policy of living on the food it produces, but it cannot be done in practice. Certain sections of the population in Madras prefer to consume Molakolukulu raw rice of Nellore and finer Kichidi varieties of Bezwada and Hydrabad rice

4 FOOD HABITS IN MADRAS STATE
produced in Andhra Pradesh. Again a coarse variety of Kuruvai produced has to be exported to Kerala as it is not popular with the people of Madras State. As such, the food problem of Madras is inter-related with that of Kerala and Andhra Pradesh. It should aim to produce a surplus because there will be always a tendency for food to move towards deficit areas. Again, the primary producer in the State is interested in maintaining trade with the neighbouring States which will tend to increase the price he can get. Any complete control by the State Government will result in his being deprived of a reasonable level of price for the grain produced by him.
Again Madras State has its limitations in increasing the output of grains. The rainfall in the State shows marked fluctuations from year to year and is not uniformly distributed throughout the State. An attempt has been made to harness the water resources of the State to the maximum. The per capita production in the State is much higher than the all India figure. It, therefore, follows that on the law of diminishing returns, the scope for further improvement in production of cereals is limited and with somewhat precarious water resources, maximum effort is needed to keep the food production at a reasonable level. Along with this is the tendency for the State to get more and more industrialised which means the diversion of land intended for food crops to cash crops. Any pennanent solution to the food problem has, therefore, to be based not on a quantitative approach, but 011 a qualitative approach. Against this background, we will now make an effort to study the food habits of Madras State.
Sample survey
7. To make the study realistic, a sample survey was conducted in the State in 1961-62. Its aim was to ascertain the food habits of the people in different regions and to determine the level of consumption.
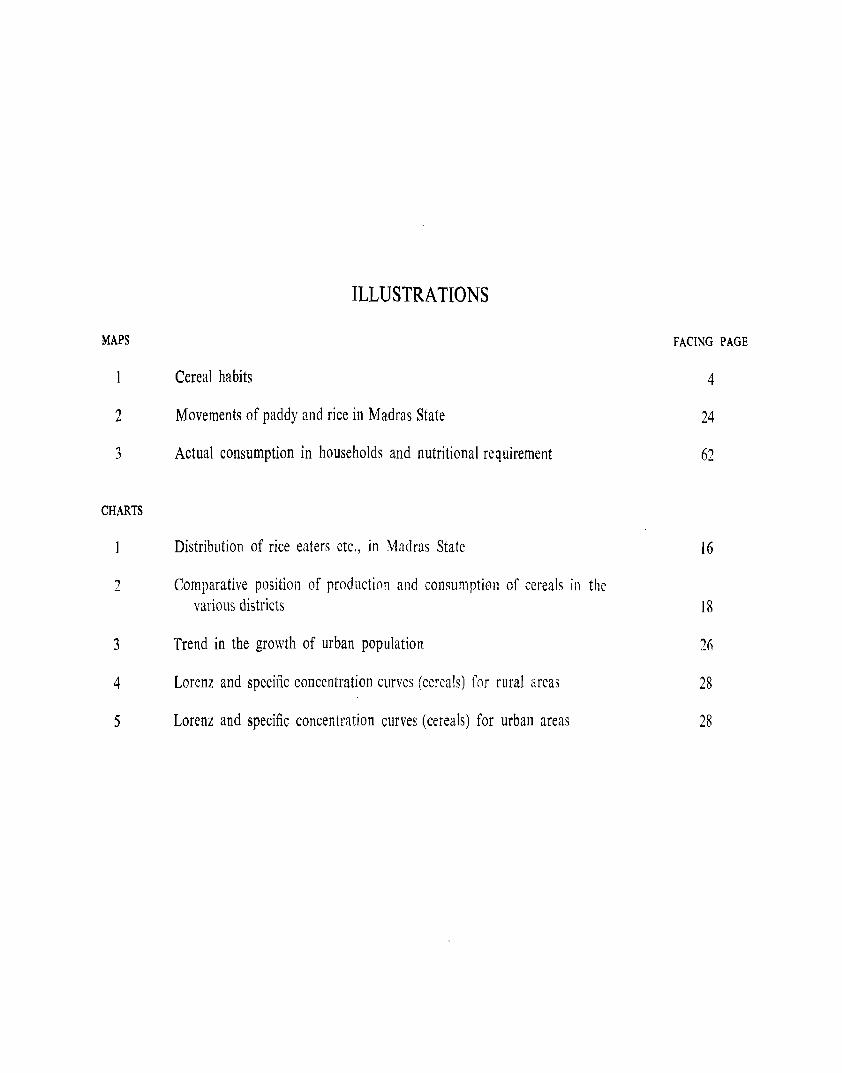
For this purpose, the State was divided into three zones-rice zone, mixed zone and millet zone. Rice zone consisted of all towns and villages in which the staple food was rice. Millet zone consisted of villages where the staple food was millet. The areas which took rice and millet in different proportions were classified as mixed zone. Map 1 will indicate the three zones as determined by us. This classification was done by Sri T. B. Bharathi, Deputy Superintendent of Census Operations who had a good knowledge of the
conditions in the State. He also toured the State and made detailed enquiries into the food habits of the people. The next stage was the sample selection of blocks. Census block formed for the 1961 Census had more or less well defined geographical boundaries and a population ranging from 600 to 800. It generally consisted of 120-150 households. One per cent of such blocks was selected on a random method for our survey. From each block 10% of the households in the mixed zone and 5% in the rice and millet zones \vere selected as sample households. The study is thus based on the household as a unit. By Census definition, a household is a group of persons living together not necessarily bound by ties of relationship and taking their meals from a common mess unless the exigencies of work prevent them from doing so. The areas comprising the zones in each district will be found in Appendix HI.
The State has been divided into 51,908 Census Blocks. Out of these, 510 were selected for our surveY-179 were in the rice zone, 327 in the mixed ZOne and 4 in the millet zone. A statement is given below indicating the number of households selected and the number contacted by our investigators.
Rice zone Mixed zone Millet zone
Households selected
1,286 4,522
27
Total 5,835
Households contacted
1,115 4,063
15
5,193
The field survey was conducted by six Investigators belonging to our office. In Coimbatore town and ta!uk, the survey was conducted by women students of Sri Avanashilingam Home Science College, attending the Post-Graduate Course in Home Science, as honorary workers. The field survey began in July 1961 and ended in April 1962. The schedules filled in will be found in Appendices IV and V.
Consumption units
8. No statistical study of food can be attempted unless a dependable consumption unit is worked out. The quantity of food consumed by a person will depend on his age. The variation, however, is more marked in the case of children. Generally the variation in the case of adults can be ignored, except among those who are engaged in manual labour. Woman, as a rule, consumes less than man though during pregnancy and lactation, she needs more food. The proportion of

MAP I
MADR S STAT ANDHRA PRADESH
CEREAL HABITS SCALE : :~>:-; .. : @::: .@:
. f~I"" @..J.. .. '()' . . "'-; .:::: ~):::: 'f}: :'·~~M~,DRA.SI
lO~H5~~I~c,~i 9ti~iiiiiii~;;:;2;!!!r i!!j:=~1;;:;;;:;;::;:iii~f Miles
Kilometres 20 ,0 0 ~ l 60 80 I~ " :._.;.r: ..... . @ ..
: : l:. : @: . C~I~G~E~U; : :
.~ t.No~:~~:T ::: ~):@: : :@: :
MYSORE .~ • 'iA; v: .• JHLJ~/ •• • •
KERALA
REFERENCE
Slate lIoundouy
DloIric\ Boundary
HABITS
Rice and Millet Eating Area
'Alce eatIng Area
MHlet E.tlng Area
::): : I::·.:::~:· '\.;_.'
.. _'," .... • nF<:~;· •• ~. '" .... ,£.,,: .......... . . ~ .. . , .
.... . ~ ... . : :~: :~:~: ~~<::::~ :~C~T:::~~ . • , 'p,' .. / .. ... ~~~ ... , .. 'l-,' . ......... . @ . .• .
. .. ·'0···r·······~······· .. . ..... ... .... , .~::::~: :@:~:::'.: : •.. . :: :~.: (:\.: :@;:'~:: . . . . . . . . . . . . %. . . . . ..• \ .... ""-'-"'_:'.:u:"'-1 .
e ~@ •• ~·1 •. ~ ... /· •••...• @ ••••••••. ~ . . . . . . . . . . . r'-":"':'"~ . ".,,~' .. '\. .. TlRUCHIRAPAlLl ~ ••
. COIM8ATO~E: : : : : ~ : : : : ~: : . . . . . . . '0 : : .. : : : : : : ..... : ::::~@~.j.? : : .. :~ : : : : : : : ~ ;'.fi. .:). ~") : :f: : : : : .~ ••• ~ .~ ......... ,,\.J •• v . ... . ("', ... ',1 .... . . . . . .~ ~ . ~: : : : : : : : : : : :'?': : : :
· t.f · @. . . . . . . . . . . . ,,- , . . . . .
• \: : : :0-_ : : : : : '@ : : : : (: :J.:\ : . . · .. ~ ....... ... ..... :<. "'0 J-.' .
'. :3 ~ : : : : : ~: : : : : : : : l?( 0 :t.;c : {® . ••• • ~ ••• H ... OURAI ••••• • ••• ''7 '(lJ" '~'\..:"0,~ • ••.....•.• '@ •. • . . 11?) • .••• ' il)' .0 . . '{ "Ii
@. : : : : : : : : : : : ~~: : : ;_.;': : : : : : @: : .~( : ........... ~'.J2...:...":;' .~.~ ...... .. "'.:
: ~ L;.~~~.l.:.f~ ;~ ~ ~; : ; : ~ : : :i/ . . ' . . 1/} ... ~ ... ·RAMAN .... iH,t\PU·RAi1 G . .tJ.
: :~ ~: : ~: : : : :~ : : : : : . . 0·
· : :.<~.~«. ~~;~::>~: : : .... ~ ..... ~ .. ... .. .
· ~ : " ............ '.
GUlr MANAAR
P,&\LK
CEYLON
tNtJiOOtJCTrON
cereats to the total quantity of food consumed increases with age upto a certain limit. To estimate the food requirements of any community, it has to be assumed that food has a set pattern based on age. Any variation based on occupation or industrial performance has to be ignored.
The average consumption of an adult male is treated as the standard and the adult male equivalent of the population is usually estimated. This number which will be normally less than the total population is known as consumption unit or briefly the C. U.
For any discussion on food, the appropriate consumption unit is first to be determined. For this purpose we have conducteu an experiment in selected sample households in the State in which cooked food (cereals) consumed by the members of the households was weighed. This practical experiment in the field has given us a realistic figure on which this study can be based. On the basis of the result, -we have worked out a series of coefficients with the help of which we have reduced ihe population of Madras State into effective consumption units. They are given below:
Age Coefficient. group
0-2 .2
3-7 .4
8-12 .6 13-17 .8
18 & above (females) .9 18 & above (males) 1.0
In this connection, it will be relevant fto consider what coefficients have been used in the past in connection with estimation of food req uirement. The western countries have treated the population of 100 as equivalent to a certain number of consumption units, say 82 or 83. Professor Lusk has used 83. Sri P. P. I. Vaidyanathan has adopted 84 in his book "Critical survey of food production programme in Madras State". Obviously this is too high for a country like India with its large component of younger population. A lower figure of 80 has been adopted by the Ministry of Food, Government of India. Still lower figures have been adopted by other authorities. Sri. C. R. Srinivasan for instance, has used 75 in his report on "Rice production and trade in Madras Presidency, 1934".
The coefficient for conversion will change from country to country and from State to State as the age
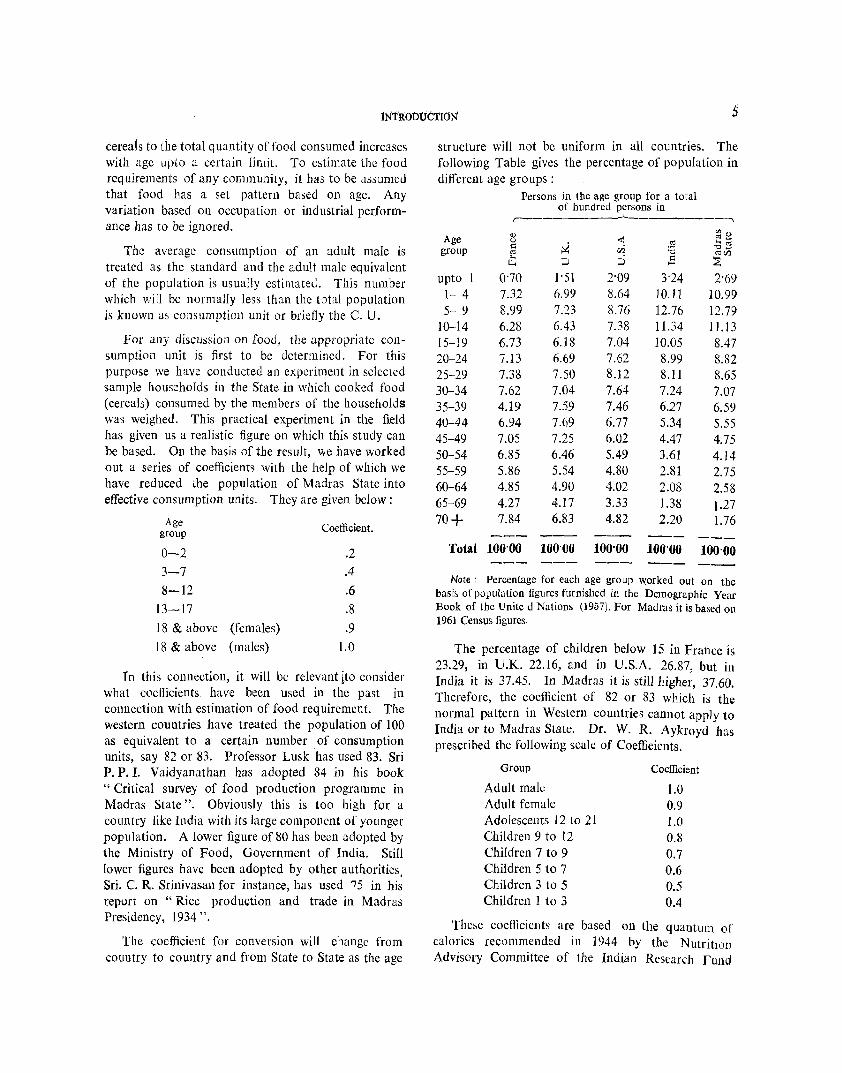
structure will not be uniform in all countries. The following Table gives the percentage of population in different age groups:
Persons in the age group for a total of hundred persons in
,----------~----------, <) "'0
Age u
i2 ~ ell ~~ (:; r.ti :a "0_ group til tIlCf.l ...,
;:J ;:) Q ~ ~ ,...,
upto 1 0'70 1'51 2'09 3'24 2'69 1- 4 7.32 6.99 8.64 10.11 10.99 5- 9 8.99 7.23 8.76 12.76 12.79
10-14 6.28 6.43 7.38 11.34 11.13 15-19 6.73 6.1 8 7.04 10.05 8.47 20-24 7.13 6.69 7.62 8.99 8.82 25-29 7.38 7.50 8.12 8.11 8.65 30-34 7.62 7.04 7.64 7.24 7.07 35-39 4.19 7.59 7.46 6.27 6.59 40-44 6.94 7.69 6.77 5.34 5.55 45-49 7.05 7.25 6.02 4.47 4.75 50-54 6.85 6.46 5.49 3.61 4.14 55-59 5.86 5.54 4.80 2.81 2.75 60-64 4.85 4.90 4.02 2.08 2.58 65-69 4.27 4.17 3.33 1.38 1.27 70+ 7.84 6.83 4.82 2.20 1.76
Total 100'00 100-00 100'00 100'00 100-00
Note; Percentage for each age group w.orked out on the basis of population figures furnished in the Demographic Year Book of the Unite d Nations (1957). For Madras it is based on 1961 Census figures.
The percentage of children below 15 in France is 23.29, in U.K. 22.16, and in U.S.A. 26.87, but in India it is 37.45. In Madras it is sti11l1igher, 37.60. Therefore, the coejficient of 82 or 83 which is the normal pattern in Western countries cannot apply to India or to Madras State. Dr. W. R. Aykroyd has prescribed the following scale of Coeffieients.
Group Coefficient
Adult malt: 1.0 Adult female 0.9 Adolescents 12 to 21 1.0 Children 9 to 12 0.8 Children 7 to 9 0.7 Children 5 to 7 0.6 Children 3 to 5 0.5 Children 1 to 3 0.4
These coefiicients are based on the quantum of calories recommended in 1944 by the NutritIOD Advisory Committee of the Indian Research Fund
6 FOOD HABITS IN MADRAS STATE
Association, now known as the Indian Cuncil of Medical Research. They represent the optimum level based on nutritional requirements rather than the actual quantity which is consumed by the society. When these coefficients are applied to the age groups of Madras State as revealed in 1961 Census, the adult population of the State comes to 28.18 millions that is 84% of the total population. This coefficient is higher than Lusk's coefficient of 83% and cannot prima fade be adopted for our study. No doubt we have adopted this coefficient in examining whether the effective needs of this country can be met by an adjustment of our food habits in the last chapter.
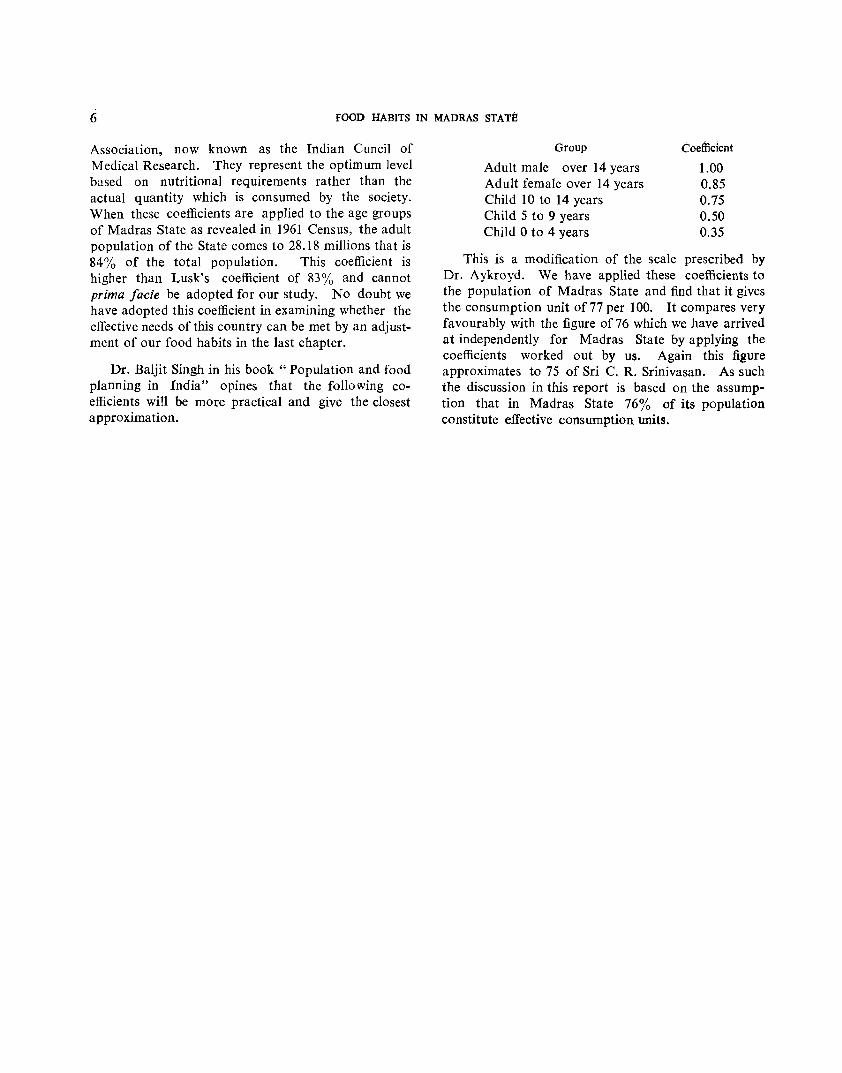
Dr. Baljit Singh in his book" Population and food planning in India" opines that the following coefficients will be more practical and give the closest approximation.
Group
Adult male over 14 years Adult female over 14 years Child 10 to 14 years Child 5 to 9 years Child 0 to 4 years
coefficient
1.00 0.85 0.75 0.50 0.35
This is a modification of the scale prescribed by Dr. Aykroyd. We have applied these coefficients to the population of Madras State and find that it gives the consumption unit of 77 per 100. It compares very favourably with the figure of76 which we have arrived at independently for Madras State by applying the coefficients worked out by us. Again this figure approximates to 75 of Sri C. R. Srinivasan. As such the discussion in this report is based on the assumption that in Madras State 76% of its population constitute effective consumption units.

CHAPTER II
CEREAL HABITS
Cereals in Indian diet
9. In any non-industrial country, the main items of food are cereals and pulses. Of these, cereals are more important. In Madras, cereals supply 70 to 80 percent of the energy requirements of the popUlation. The following figures for India and other countries indicating the quantum of cereals found in the diet will be of interest:
TABLE 2-1 Cereal equivalent
Food con- Cereal con- (of cereals, Country sumption sumption (in roots and
(I. Us.) kilograms) pulses in kilograms)
U. S.A. 186 72 88 Canada 160 68 88 Sweden 139 79 102 U. K. 153 92 117
Egypt 88 167 178 Ceylon 54 115 153
India 34 118 143 Source: Food Policy and Economic Development in India
(page 139) by S. C. Joseph.
The composition of the diet of an Indian varies considerably from those living in U. S. A., Canada or Sweden. To a large extent, it is due to the inability to pay for more costly food items. The cereals are the cheapest food available. Poorer people prefer less expensive millet to rice. The cereals grown and consumed in the State are rice and millets like Cholam (Jowar), Cumbu (Bajra) and Ragi. Wheat is not produced in any considerable measure in Madras. Naturally wheat was not consumed in this State until rationing was introduced in 1943. With a view to popularise wheat in Madras, elaborate propaganda was done by the Government. The total quantity consumed in the State is still negligible. As such for our discussion, we have only adopted three categories -rice eaters, mixed diet eaters and millet eaters.
Mode of consumption of cereals in the State
10. In understanding the food habits of the people, it is good to know how rice and millets, which form the major food items are consumed in the State. It is a traditional practice to store freshly harvested
paddy so that rice becomes matured. People prefer to consume rice prepared from paddy stored from 8 to 12 months. It used to be the general practice in Tanjore to eat only the rice of the previous season. However, because of the shortage of paddy in the country, and its easy marketability, newly harvested grains come to the market directly or are procured by the Government and sold.
Rice is consumed after it is hand-pounded or milled. Before the advent of power, the bran was separated from the grain by hand-pounding only. The existence of a net work of rice mills, small and big, throughout the State has put an end to the habit of taking hand-pounded rice among the poorer section. Even in rural areas, only a small quantity of rice is prepared by hand-pounding today. The rice intended for the market is generally produced by machine. According to nutritional experts, hand-pounded rice is superior to milled rice. The normal practice is to pound rice with a long wooden pestle in an iron stone or wooden mortar. The bran is not removed completely. During the World War II, the Government encouraged under-milling of rice with a view to increase the out-put. This produced rice of indifferent quality which did not cook well and could not be stocked.
In this State, a large quantity of paddy is parboiled. To parboil paddy, it is immersed in cold or warm water for different lengths of time and then steamed till the grain becomes soft and partly or wholly cooked. The surplus water is strained off and the paddy is then dried. Dried parboiled paddy when hulled, gives parboiled rice, a rice which has a slight colour and odour and is harder than raw rice. Though the method adopted for parboiling is the same in all districts, slight differences are observed in the duration of soaking, temperature of water used, changing of water, duration of steaming and drying in the sun.
A few communities like Brahmins, prefer raw milled rice. In some areas in the State, a general preference for raw rice is seen. This preference is based on habits which die hard. Parboiling is done on a large scale in the mills and on a small scale by the consumers. It is a household industry in rural areas.

8 FOOD HABITS IN MADRAS STATE
Cooking of rice into soft grains by using the right proportion of water is recognised as a culinary art. The rice is cleaned of broken grains and foreign matter. It is then washed repeatedly three or four times with plenty of water which is drained off. This water is given to the cattle. The wet rice is put into a pot containing water and the pot is heated. As the rice grain boils, it swells. The excess water is then drained off. This superfluous water called 'kanji' is consumed by certain sections of the people. It is more popular in Kanyakumari district. Rice is eaten with side dishes, the standard of which will reflect the status of the individual. Rice is also used in the preparation of well known dishes like "Iddly" and " Dosai".
Millets: The cleaning is done by the housewife. Husking of the millet is a tedious operation. All millets except Ragi can be boiled whole like rice or ground into a coarse powder and converted into porridge. Porridge is consumed after adding buttermilk and salt.
Ragi : The grain is first sifted and cleaned and dried so that it can easily be ground into powder using the grind stone. The usual practice is to grind a large quantity and keep it for ready use. There are two methods for cooking this grain.
The first preparation will be somewhat like arrowroot kanji and prepared as follows: Ragi powder is mixed with proportionate quantity of water and allowed to remain for 10 to 12 hours. It undergoes a slight fermentation which adds to its taste. The mixture is then boiled, and it becomes a gruel or kanji. Rice flour is added in small quantities while boiling and it be comes 'Kuzhu'. It is wholesome and digestible. It is allowed to cool into a jelly and then consumed. It is thus seen that the food that is to be consumed has to be prepared on the previous day. Some people prepare ' Kuzhu' by boiling the powder in sour kanji water and adding salt. At times, it is boiled in rice water which has undergone a slight fermentation.
The second method of cooking ragi is as follows: The powder is poured into boiling water contained in a vessel and rapidly stirred with a wooden spoon until it turns into a pudding. It is then removed from the fire and cooled. After this, it is rolled into balls and these balls are put into a vessel and boiling water just enough to cover them is poured. The vessel is then set aside for 10 to 12 hours after which the water
forms a pleasant and cooling drink. The ragi balls are eaten with sambar, curry, rasam, butter-milk or pickles and is known as 'Kali' or 'Kazhi '.
Cumbu : The mode of preparation of Cumbu is different from that of ragi. It is made slightly wet first and beaten in a wooden mortar so as to separate the husk from the grain. It is then sifted and pounded in the motar until it is reduced to a powder. The process of cooking is however similar to that of ragi. Cumbu can also be boiled to the consistency of cooked rice.
Cholam: Cholam is usually boiled like rice or made into cakes. While preparing the grain for cakes, it is powdered, mixed with water and baked. Before cooking like rice, the grain is pounded so as to loosen the bran. By tossing and winnowing, the bran is removed. The grain is cleaned with water and the wash water is drained off and the grain dried. It is then cooked in boiling water as rice. Cholam is also ~ooked into Kuzhu or Kanji.
Other Millets: The millets called Varagu and Samai are normally cooked like rice. All other millets are either made into Kanji or Kuzhu in the same manner as ragi. They are also cooked in the following manner: The powder is mixed with water and jaggery. The mixture is then cooked or baked in earthen vessels and made into cakes.
Food habits in the districts
11. Based on the data collected by this organisation, I will indicate briefly the salient features of the food habits obtaining in the different districts. Exceptions will, however, be found in many districts.
MADRAS CITY:-The bulk of the population eat rice. It is taken in the form of cooked food and items like Jddli and DosaL Tn general, people take coffee and tiffin in the morning. The noon meal consists of rice, sambar, rasam, vegetable curry, fish or mutton and butter-milk. Those who work at distant places in the City get their meal to the work-spot or carry it with them. The third meal is at night which is a repetition of the midday meal. Perhaps, one or two items will not be found in the night meal. Rice is a necessary ingredient of the meal, but other components depend on the income and the status of the person. The labouring class have cold rice and butter-milk as breakfast. People who cannot have breakfast at home take it in hotels, the poorer class depending on the vendors
CEREAL HABITS 9
and petty stalls at street corners. The tiffin, whether it is taken at home or outside, consists of items like lddli, Dosai, Vadai etc. No sweet is taken in the morning. People who take meals twice a day take only coffee in the morning and the first rice meal between 8-30 and 9-30 A.M. The second meal is at night. During midday, some light refreshments are taken. People who take meal once a day are limited in number. Those who cannot afford or those who for reasons of health do not wish to do so, fall under this category. Wheat is consumed only as part of tiffin.
CHINGLEPUT :-Millets are eaten by the labouring class and rice by all people. Ragi is the most popular millet in ~the district. Varagu, cumbu and cholam come next. People of the district prefer to take ragi and cumbu as diluted gruel. Hard working labourers engaged in agriculture or allied activities take gruel with pickles or chillies in the morning as well as at noon and a meal of rice and sambar in the night. At times, cold rice is taken for breakfast. The people who are better off take gruel in the morning and rice at noon and night.
NORTH ARCOT :-As in Chingleput, ragi is \'.idely consumed. Cholam, varagu, cumbu and samai are the other millets eaten by the people. Food habits are similar to those in Chingleput. Millets are taken in the gruel form. In the taluks of Tirupattur and Gudiyatham, people'prefer to take ragi in the form of a thick paste called Kazhi and cumbu and cholam in the form of cooked grain which also resembles Kazhi. In the hilly areas, millet is consumed. In the morning and noon, ragi or cumbu gruel or Kazhi is consumed and in the night, samai or cumbu is cooked like rice and eaten.
SOUTH ARCOT :-The chief millets grown in the district are varagu, ragi, cumbu and cholam. Though millets are generally eaten in gruel form, the people cook cholam and varagu in the same form as rice. This form of food is consumed mostly at night. Some people take ragi Koozh as a side dish in the night with cooked rice, varagu or cholam.
SALEM :-This district produces more millets than rice. Generally the intake of millet among the mixed diet eaters is much higher here. Cholam, ragi and cumbu are the chief millets consumed, samai and varagu coming next. People prefer to take millet in cooked solid form. Ragi and
2
cumbu are taken as Kazhi. Cholam, samai, varagu and cumbu are taken in the form of cooked grain. The labouring class take in the morning and noon, kazhi with pickles or sam bar and in the night take a meal of samai, cumbu or cholam cooked like rice with sambar or rasam. Richer people take cooked rice iQ. the night. Unlike his counterpart in North Arcot and Chingleput districts, the labourer in Salem has for his breakfast kazhi which represents the balance of the previous day's meal or which is prepared in the morning itself. Koozh is also prepared. Peogle take millets in the gruel form occasionally. But the "general preference is for the solid. Even well-to-do people take millet in the morning. One other peculiar feature in the northern taluks of Salem district is the preference shown for raw rice against boiled rice; the preference for raw rice is confined to certain orthodox communities in other areas.
COIMBATORE :-Cholam is produced on a large scale in this district, cumbu and ragi coming next. Millets are generally consumed in the cooked solid form. The food habits of the labouring class in Coimbatore and Salem districts are identical. It is, however, observed that the millet-eating people of Coimbatore take rice meal in the night unlike their counterparts in Salem district, who prefer ragi kazhi and cumbu kazhi. In Coimbatore district, millets are, therefore, eaten in day time. Again, unlike in Salem district, they supplement the cereal food with items like sam bar, rasam and vegetables in greater quantities and this is facilitated by the higher economic status of the people of Coimbatore.
NILGIRIS :-In plantation areas, labourers generally take rice. In other areas, ragi and samai are taken. The labouring class take ragi kazhi in the morning with pickles and chutney, boiled rice with sauce in the noon and ragi kazhi with pickles in the night. Some people substitute rice gruel or samai gruel for kazhi. Bread and coffee are consumed as breakfast by some people. The striking feature of the food habits in the district is that wheat is consumed more freely than in the plains. Wheat preparations in the form of chappatti are consumed in the noon by the millet-eating population. This is due to the influence of the cold climate.
MADURAI :-In Madurai district, cholam is the major millet. Cumbu, ragi, varagu and samai are the other millets which are produced in the district. The working class population take in the morning cooked

10 FOOD HABITS IN MADRAS ST ATE
choiam or cumbu with ku::hambu, in the noon again cholam and ku::hambu and in the night rice and ku:::hambu or raram. Some people take rice in the noon also. Breakfast consists of what is left of the previous night's. Though millets are taken in cooked solid form, consumption of gruel of ragi and cholam is not unknown.
TIRUCHIRAPALLI :-In areas other than the Cauvery delta, cholam, varagu, cumbu and ragi are consumed. Food habits in those areas are similar to the habits in Madurai district. In the delta tracts, the food habits are similar to those found in Thanjavur district.
THANJAVUR :-The majority of the people are rice eaters and Thanjavur stands first in paddy cultivation. Varagu and ragi are the millets consumed by the mixed diet eating population, maize and cholam coming next. Cold rice with pickles is the breakfast for the majority of the working class population. In the noon, a freshly cooked rice is taken. In the night, food prepared in the noon is consumed with fresh sam bar or rasam. Sometimes rice is cooked fresh for the night. The mixed diet eaters, who are essentially agricultural labourers, and artisans in Orthanad, Pattukottai and Arantangi taluks take for breakfast varagu or cholam cooked like rice or ragi kazhi with pickle or sambar. In the afternoon a millet meal is taken and in the night, rice meal with rasam or kuzhambu is taken.
RAMANATHAPURAM :-Millets widely consumed in the district are ragi, cumbu, varagu and cholam. They are taken both in solid and gruel forms. Labourers have for breakfast cold rice, cumbu, ragi or varagu with pickles or chutney. In the afternoon, people who can afford, take a rice meal and others a millet meal. In the night a rice meal is invariably taken.
TIRUNELVELI :-·Cumbu, cholam, ragi and varagu are the millets mainly consumed in the district. They are taken both in solid and gruel forms in Tenkasi, Tirunelveli and Nanguneri taluks. In Tiruchendur and Shencottah taluks, millet is taken in the gruel form. In Srivaikuntam, Koilpatti and Sankarankoil taluks where cumbu and cholam are widely eaten, the mode of consumption is in the form of kazhi for cumbu and cooked grain for cholam. In the morning, nOon and night, the labouring class consume cumbu kazhi rolled into balls or cholam with sambar or pickles. People who are rich, take a rice meal in the night.
KANYAKUMARI :--Only rice is consumed in the district. Owing to the low level of the economic condition, 19% of the households surveyed by us take rice meal only once a day. It is generally taken at night. In the morning and noon, tapioca tuber is taken. Out of the total population, 27% take two rice meals a day and 54% three rice meals a day. A remarkable feature in the food habits of Kanyakumari people is the large quantity of tapioca consumed by them. They generally supplement rice with tapioca and in certain cases it replaces almost completely the quantity of rice in the diet. The poorer class of people cook rice in the form of gruel and consume it with salt. The daily food habit among the working class is to take cold gruel or tapioca in the morning and noon and cooked rice with tapioca in the night. Fish is also eaten with rice and tapioca.
Factors governing food habits
12. From the foregoing survey, it will be seen that there is no large variation in the food habits of the people except that a preference is shown for rice by the economically sounder section of the population. Again the food habit is to a large extent determined by the cereal which is locally produced. The following are the factors which govern food habits of the people in this State :-
1. Local production
2. Purchasing capacity
3. Climate
4. Occupational status 5. Availability of time for processing and cooking
6. Traditional inertia.
Local production :-·Paddy is the most important crop grown in the State. It is an irrigated crop and grown with the aid of water from wells, irrigation tanks and river channels. In some places it is cultivated as a rain-fed crop, provided the rainfall is continuous for a period of three months. It is extensively grown in the delta tracts of Thanjavur, Tiruchirapalli and Tirunelveli and in the districts of Chingleput, North Arcot, South Arcot and Ramanathapuram. In those areas where it is grown extensively, agricultural labourers are paid in the form of paddy. In such places even labouring class eat rice though it is more expensive than millets. The table below gives the percentage of rice production to the total cereal production in each district and th~

CEREAL HABITS 11
percentage of ric.: meals to the total 11 umber llf mca Is. It indicates the influenec of local production on the food habits of the people.
TABLE 2-2
Percentage of rice Percentage of Name of district production to rice meal, (0
total ccreal total meals production taken
Madras 99
Chingleput 89 73 North Areot 72 51
South Arcot 73 58
Salem 35 42
Coimbatore 41 58
Nilgiris 66 57
Madurai 55 48
Tiruchira palli 52 57
Thanjavur 97 97
Ramanathapuram 59 65
Tirunelveli 76 75
Kanyakumari 100 100
State 68 64
This influence is however, not well marked in the districts of Chingleput, North Areot, South Arcot and Coimbatore. The agriculturists in these districts except Coimbatore prefer to sell paddy and eat millets as they are economically backward. In Coimbatorc district, though paddy is not grown extensively, a large number of rice mills are located which make rice easily available in all parts of the district. So they eat at least one rice meal a day. Among millet eaters, the millet grown extensively in the local area influences the habits of the people. In Hosur taluk, peopk have ragi as thcir staple food. The people of Koilpatti, Sankarankoil, Perambalur and Bhavani have cumbu as their staple food which is the millet grown extensively in these areas. People of Kanyakumari district take tapioca as their staple food as it is grown extensively in the district. The influence of local production is felt more on the rural people and less on the people in the urban pockets embedded in those areas. The food habits of urban people are governed by other considerations.
Purchasing capacity :~From Tables 2-3 and 2-4, we can sce the extent to which the purchasing capacity of the people can iufiuence a preference for rice as against millet.
I ncomc group (Rs. per mensem)
0-25 26-50 51-75 76-100
101-150 151-200 201-400 401 +
Income group (Rs. per mensem)
0-25 26-50 51-75 76-100
101-150 151-200 201-400 400+
TABLE :2-3
Consumption per e. u. of ,------~- ------~--.--.--....
rice millet and all cereals wheat
8'30 10'70 19'00 11'36 9'02 20'38 13'92 6'50 20'42 15'50 5'27 20'77 16'16 5'76 21 '92 19'04 4'31 23'35 17'44 3'05 20'49 19'20 0'66 19'86
TABLE ·2-4
Percentage Percentage Percentage of rice of mixed of millet caters diet caters caters
35 33 32 46 34 20 58 29 13 66 24 10 68 26 6 77 19 4 82 14 4 88 12
One can choose between millet and rice when both are freely available in the market. But even under such circumstances, lower income people have to prefer millet though they may relish rice better. The difference in cost between a millet meal and a rice meal is not only the difference in cost between millet and rice, but also the cost of the side dishes needed for such meals.
No side dish is normally consumed with the millet meal, but rice meal requires a ku::hambu, rasam or butter-milk. So the cost of rice meal is much more than that of a millet meal. This factor has influenced people in the lower income group in their food habits. Whenever their purchasing capacity improves, they prefer to go in for more and more rice. For millet eaters, rice is an item of luxury.
Climate :-People in colder climate need more calories. The coldest region in the State is Nilgiris. But they get their calories from cereals and potato which is grown locally. A larger consumption of cereals means a larger intake of carbohydrates which in turn means consumption of more food. Thus in the colder regions, people take more number of meals
ii FOOD HABITS IN MADRAS STATE
than in the plains. Table 2-5 gives the percentage of households taking meals once, twice, and three or more times a day.
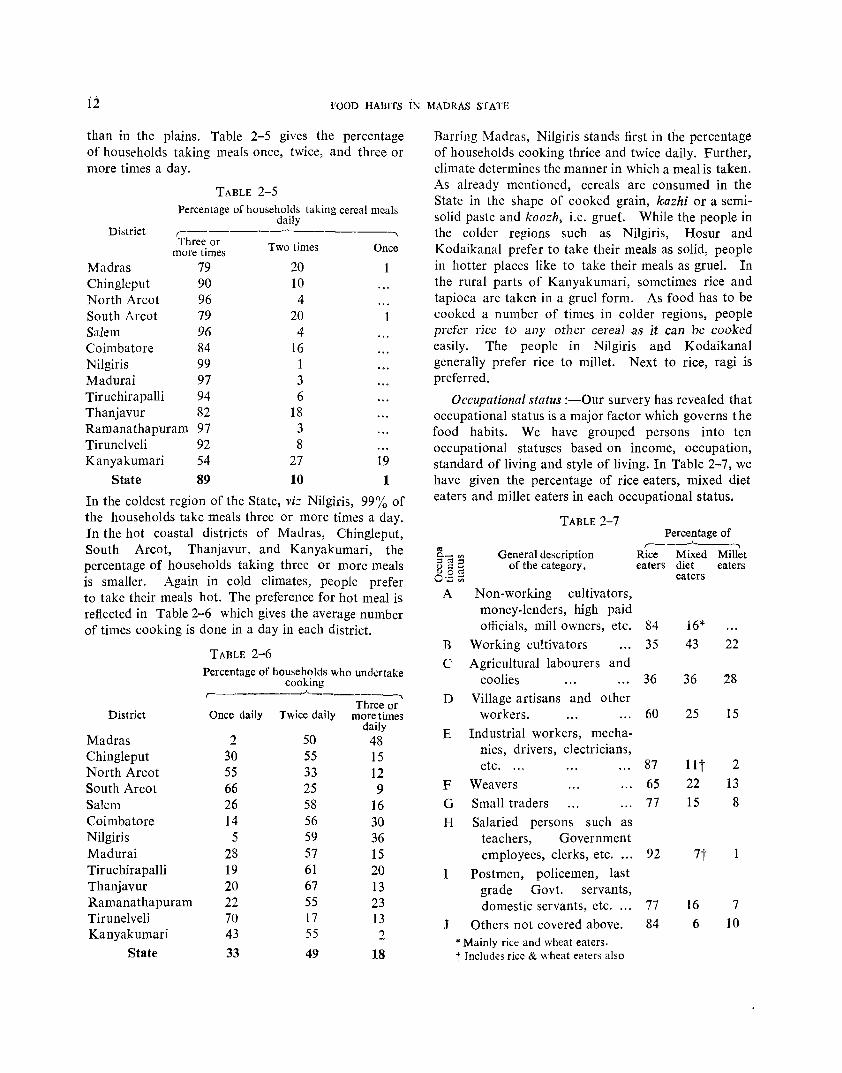
District
Madras Chingleput North Arcot South Arcot Salem Coimbatore Nilgiris Madurai Tiruchirapalli Thanjavur
TABLE 2-5 Percentage of households taking cereal meals
daily ,---_._-..)-------, Three or
more times 79 90 96 79 96 84 99 97 94 82
Two times Once
20 10 4
20 4
16 1 3 6
18 Ramanathapuram 97 3 Tirunelveli 92 8 Kanyakumari 54 27 19
State 89 10 1 In the coldest region of the State, viz Nilgiris, 99% of the households take meals three or more times a day. In the hot coastal districts of Madras, Chingleput, South Arcot, Thanjavur, and Kanyakumari, the percentage of households taking three or more meals is smaller. Again in cold climates, people prefer to take their meals hot. The preference for hot meal is reflected in Table 2-6 which gives the average number of times cooking is done in a day in each district.
TABLE 2-6 Percentage of households who undertake
cooking ,-------'- ,
Three or District Once daily Twice daily more times
daily Madras 2 50 48 Chingleput 30 55 15 North Arcot 55 33 12 South Arcot 66 25 9 Salem 26 58 16 Coimbatore 14 56 30 Nilgiris 5 59 36 Madurai 28 57 15 Tiruchirapalli 19 61 20 Thanjavur 20 67 13 Ramanathapuram 22 55 23 Tirunelveli 70 17 13 Kanyakumari 43 55 2
State 33 49 18
Barring Madras, Nilgiris stands first in the percentage of households cooking thrice and twice daily. Further, climate determines the manner in which a meal is taken. As already mentioned, cereals are consumed in the State in the shape of cooked grain, kazhi or a semisolid paste and koozh, i.e. gruel. While the people in the colder regions such as Nilgiris, Hosur and Kodaikanal prefer to take their meals as solid, people in hotter places like to take their meals as gruel. In the rural parts of Kanyakumari, sometimes rice and tapioca are taken in a gruel form. As food has to be cooked a number of times in colder regions, people prefer rice to any other cereal as it can be cooked easily. The people in Nilgiris and Kodaikanal generally prefer rice to millet. Next to rice, ragi is preferred.
Occupational status :-Our survery has revealed that occupational status is a major factor which governs the food habits. We have grouped persons into ten occupational statuses based on income, occupation, standard of living and style of living. In Table 2-7, we have given the percentage of rice eaters, mixed diet eaters and millet eaters in each occupational status.
TABLE 2-7 Percentage of
:'5._ '" General description f--__"__~
B g B of the category. uoro 0',;:::;;;
A Non-working cultivators, money-lenders, high paid officials, mill owners, etc.
E Working cultivators
C Agricultural labourers and coolies
D Village artisans and other workers.
E Industrial workers, mechanics, drivers, electricians, etc. ...
F Weavers
G Small traders
H Salaried persons such as teachers, Government
Rice Mixed eaters diet
eaters
84 16* 35 43
36 36
60 25
87 llt 65 22 77 15
employees, clerks, etc. ... 92 7t 1
J
Postmen, policemen, last grade Govt. servants, domestic servants, etc. ... 77
Others not covered above. 84 * Mainly rice and wheat eaters. t Includes rice & wheat eaters also
16 6
Millet eaters
22
28
15
2 13 8
7 10
CEREAL HABiTS
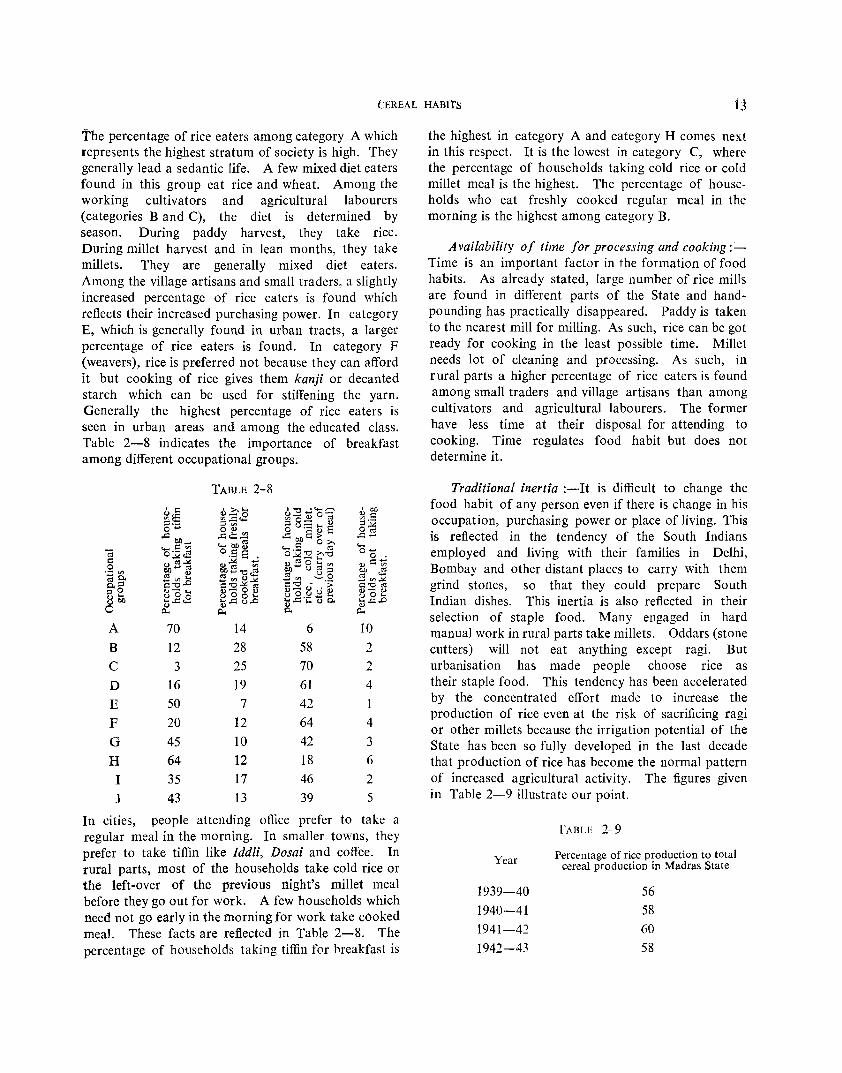
The percentage of rice eaters among category A which represents the highest stratum of society is high. They generally lead a sedantic life. A few mixed diet eaters found in this group eat rice and wheat. Among the working cultivators and agricultural labourers (categories B and C), the diet is determined by season. During paddy harvest, they take rice. During millet harvest and in lean months, they take millets. They are generally mixed diet eaters. Among the village artisans and small traders, a slightly increased percentage of rice eaters is found which reflects their increased purchasing power. In category E, which is generally found in urban tracts, a larger percentage of rice eaters is found. In category F (weavers), rice is preferred not because they can afford it but cooking of rice gives them kanji or decanted starch which can be used for stiffening the yarn. Generally the highest percentage of rice eaters is seen in urban areas and among the educated class. Table 2-8 indicates the importance of breakfast among different occupational groups.
TABLE 2-8
~@ , » ... I"O~~-- 'I:J)
&:a~ ~o~ °i ~.8 ;:l._ ;:lon 0 ..... o OJ o u:;:: ~ S o~
,..c;; lOll ..... ..c::c.!::~ ..c: lOllS ~ » ..c:Z! .... c::on '0 ~ ~ '0.5"0 » 01
.... -; 0:£<i.s 0 .....
:£<is ... ~_,-"O 0 c:: ",""~ ~s 8 a ~ (l)=~ 0 OJ"" '" lOll ..... "" ~"-"Oe.S lOll .s .- <Il C'\SVlf:! cO trJ ~ 5 ..... 0. ..s trJ o~ ..sCl)~
"";:l c"O.o 15 "0 .. ._
~£ C::"O~ "" (l)o 8 u G coo c<l .,- ... 0)- a !]) OJ- u ~_g..8 uOo ... uo .... 8 lOll ~..c:u.o ~..c'~ tl ~ ~.r.;.o
0 OJ ~ ~ 0. ~
A 70 14 6 10 B 12 28 58 2 C 3 25 70 2 D 16 19 61 4 E 50 7 42 1 F 20 12 64 4 G 45 10 42 3 H 64 12 18 6 I 35 17 46 2 J 43 13 39 5
In cities, people attending office prefer to take a regular meal in the morning. In smaller towns, they prefer to take tiffin like Iddli, Dosai and coffee. In rural parts, most of the households take cold rice or the left-over of the previous night's millet meal before they go out for work. A few households which need not go early in the morning for work take cooked meal. These facts are reflected in Table 2-8. The percentage of households taking tiffin for breakfast is
the highest in category A and category H comes next in this respect. It is the lowest in category C, where the percentage of households taking cold rice or cold millet meal is the highest. The percentage of households who eat freshly cooked regular meal in the morning is the highest among category B.
Availability of time for processing and cooking:~ Time is an important factor in the formation of food habits. As already stated, large number of rice mills are found in different parts of the State and handpounding has practically disappeared. Paddy is taken to the nearest mill for milling. As such, rice can be got ready for cooking in the least possible time. Millet needs lot of cleaning and processing. As such, in rural parts a higher percentage of rice eaters is feund among small traders and village artisans than among cultivators and agricultural labourers. The former have less time at their disposal for attending to cooking. Time regulates food habit but does not determine it.
Traditional inertia :-It is difficult to change the food habit of any person even if there is change in his occupation, purchasing power or place of living. This is reflected in the tendency of the South Indians employed and living with their families in Delhi, Bombay and other distant places to carry with them grind stones, so that they could prepare South Indian dishes. This inertia is also reflected in their selection of staple food. Many engaged in hard manual work in rural parts take millets. Oddars (stone cutters) will not eat anything except ragi. But urbanisation has made people choose rice as their staple food. This tendency has been accelerated by the concentrated effort made to increase the production of rice even at the risk of sacrificing ragi or other millets because the irrigation potential of the State has been so fully developed in the last decade that production of rice has become the normal pattern of increased agricultural activity. The figures given in Table 2-9 illustrate our point.
Year
1939-40 1940-41 1941-42 1942-43
TABLE 2--9
Percentage of rice production to total cereal production in Madras State
56 58 60 58

i4 FOOD HABITS IN MADRAS STATE
Year Percentage of rice production to total
cereal production in Madras State
1943-44 61
1944-45 62
1945-46 60
1946-47 65
1947-48 65
1948-49 59
1949-50 59
1950-51 63
1951-52 60
1952-53 64
1953-54 62
1954-55 61
1955-56 67
1956-57 69
1957 - 58 68
1958-59 67
1959-60 66
1960-61 68
Source :-Data collected from the Office of the Director of Statistics, Madras.
The quantity of wheat released by the Government of India for consumption in Madras State is indicated in Table 2-10.
TABLE 2-10
Quan lity issued to ,--------"--------,
Year Fair price shops and Roller Total retailers flour mills (in tons) ( in tons) (in tons)
1957 21,491 34,625 56,116
1958 25,301 68,005 93,306
1959 28,250 102,391 130,641
1960 29,024 131,346 160,370
1961 32,869 152,743 185.612
Source :-Data collected from the Office of the Regional Director (Food), Madras.
The unwillingness to change the staple diet can be seen from the fact that persons accustomed to raw rice do not wish to have boiled rice. Our survey gives the percentage distribution of households eating boiled rice and raw rice. These fjgures are given in Table 2-11.
TABLE 2-1 I
Percentage of households takmg r--------J ---_____ -....
District Boiled Boiled and Raw rice raw rice rice
Madras 81 10 9 Chingleput 96 2 2 North Arcot 98 2 South Areot 94 2 4 Salem 77 7 16* Coimbatorc 93 4 3 NiIgiris 94 3 3 Madurai 96 1 3 Tiruchirapalli 95 1 4 Thanjavur 92 6 2 Ramanathapuram 97 3 Tirunelveli 99 Kanyakumari 99
*This is mostly in Hosur, Krishnagiri, Dhannapuri aDd Harur taluks.
In Salem, Madras and Thanjavur, marked preference is shown for raw rice. While the preference for raw rice in Madras and Thanjavur can be explained by its use by certain communities which prefer vegetarian food, it is difficult to explain why raw rice should be popular in the northern taluks of Salem district.
A factor which can influence food habit is occupation. Though today occupational mobility is found to exist, in the past, occupation was determined on the basis of caste. Therefore, food habits came to be associated with certain castes. Notwithstanding the change in occupation, the food habits have not changed to any considerable extent. Table 2-12 gives the percentage of rice eaters, mixed diet eaters and millet eaters found among some castes.
TABLE 2-12
Percentage of households taking Caste
, ____ ......A-______ ,
Rice Mixed diet Millets
Asari (goldsmith, black- 67 23 10 smith, etc.)
Badaga 7 59* 34 Banajiga 100 Boyar (Oddar) 12 42 46 Brahmin 91 9t Chettiar 67 22 11
* Includes rice and wheat eaters. t Mainly rice and wheat eaters.

CEREAL HABITS 15
T '.fiLE 2-12-contd.
Percentage of households taking Caste ,------'-------
Rice Mixed diet Millets
Christian Devanga
72 81
Jains 50 J anguma Pandaram 50
Komati Chetti (Arya Vaysya) 80 Kshatriyas 50 Kurumba Gounder 50
Maharashtra 67
Malayali 88
Mannadiyar 86
Mukkulathore (Kallar,
Maravar & Agamudiyar) 44 Muslim 83
Muthuraja 61
Nadar (Shanar) 59 Naidu 57
Nattukottai Chettiar 100 Navithan 38
Okkaliga
Pillai 64
Reddiar 30 Saiva Pillai 84
Saurashtra 100
Scheduled Castes 44
Scheduled Tribes 8
Sengunthar 69
Sernbadavan 100
Solia Vellalas 100
t Mainly rice and wheat eaters.
16 16
Sot
20 25 17
12
3
50
25 33
11 22
8t 4
29
16t 26 26 30
41 71 21 50
11
32 30
25
14
27
13
15
13
21 29 15
20 5
24
62 6
TABLE 2-12-C0l1td.
Caste Percentage of households taking ,-------"----~·----1
Rice Mixed diet Millet
Thondamandala Vellalas 72 22 6 Thuluva Vellalas 17 33 50 Udaiyar 30 57 13
Uppiliyar 100 Valaiyan 12 12 76 Vannan 38 38 24 Vanniyar 31 45 24 V dlala Gounder 24 33 43
Vettuva Gounder 100 Yadhava 41 50 9
All castes have not been covered by our survey, but from the above table we can see that the percentage of rice eaters is high among the Saurashtras, Br<lhmins, Muslims, Christians, Devangas, etc. A majority of mixed diet eaters among Muslims, Brahmins and Badagas prefer rice and wheat. The percentage of millet eaters is high among the agricultural classes of Vellala Gounders, Moopars, Reddiars, Okkaligas, Vanniars, Thevars, etc. The various factors indicated above give a certain variety to the food habits found among the people of this State. It is relevant in this connection to quote an interesting passage found in Yojana. "Food habits die hard not in our family alone, but outside as well. South Indians who have migrated to the north penist in a passion for iddli, dosai and sambar, tastes that are un-accountable to the rest of the country ................. . ...... And so it is when we go abroad too. We take with us our own food habits, tastes and smells. In Rome we may do as the Romans do, but will not cat as they eat."
CHAPTER III
LEVEL OF CONSUMPTION OF CEREALS
Consumption in the past and the present
13. A number of surveys have been conducted on diet in Madras State during the last 18 years, The households covered by these surveys generally belong to the lower income group, They will, however, show the trend in the level of consumption in cereals, We give below a table showing the level of consumption of cereals in the income group Rs. 26-50 per month as revealed by some of the diet surveys reviewed by the Indian Council of Medical Research,
TABLE 3-1, ._ . , 0::; v
» ' Vi' '" ~ _t::u, ::; (l) '@.Q ~oo (l) 0
i5 u ..c; "00.0.8 c:: <Ii ;:l
._» (l) E.;!l § ':) Ocn o~ ~~a:lo (l) 'U ...: ..
~ 8 ;:;.5 bJJ '0 CIS ,::l c:: (l) 0(/1 ;:..Uc.J- ""
o~
>< Z ..: ~ Z
1945 2 16'18 11-25 48 1946 13 16'35 9-34 184 1947 32 15'58 8-26 496 1951 4 17'61 11-22 32 1952 11 16'48 9-27 70 1954 1 18'10 105 1955 1 16'90 30 1956 5 19'09 13-25 32
The treed in the level of consumption reflects the trend in the food situation of Madras State In 1945 when food rationing was in force. the consumption was 16'2 ounces per consumption unit (c, u), It rose to 19'1 ounces in 1956, It has fluctuated b::tween 15'58 and 19'09 ounces during the intervening period, Our survey has given the figure of 20'4 ounces per c,u, Before World War II, the consumption figure was assumed· to be 1'25 tlis, or 20 ounces. Sri C, R, Srinivasan in 1934 had fixed it between 19~ and 24t ounces, During the vvar period, the level fell in statutorily rationed areas in this State, Distribution was based on 10 ounces per adult, The increased food production after World War II has not only fed the increased population, but has also increased the level of consumption among the people,
It is interesting to examine the level of consumption of cereals in the households classified on the basis of occupational status, Tables 3-2 and 3-3 give the figures for the occupational status and the districts;
TABLE 3-2,
Occupational status. Daily consumption of cereals
per c,u. (in ounces), ,r _____ ...A... _____ ,
Code, Description. r-------- _).._--.----, Rice Millet. Wheat. Total.
A Non-working culti-vators, money-lenders, etc,
B Working cultivators,
C Agricultural labou
17'4
12'5
rers and coolies .. , 10'1
D Village artisans, etc, 12'8 E Industrial workers,
etc, 17'0
F Weavers 14'5 G Small traders 15'5 H Salaried persons
such as clerks, teachers, etc, 16'1
I Postmen, last grade Government servants, etc, 16'5
TABLE 3·-3,
0'5
18'7
22'2
19'1
18'0
19'3 18'3
18'3
17'2
19'7
District Daily consumption per c.u, (in ozs).
Madras '"
Chingleput
North Arcot
South Arcot
Salem
Coimbatore
Nilgiris
Madurai
Tiruchirapalli
Thanjavur
Ramanathapuram",
Tirunelveli
Kanyakumari
STATE
r--- .. ---- ---"--------, Rice. Millet. Wheat. Total of
cereals
17'1
16'9
12'5
12'3
8'6
11'2
8'1
11'7
12'0
20'2
13'8
16'3 13'8
3'9
8'0
6'2 12'6
8'0
4'1
11'3
9'8
0'6
6'9
5'2
17'4 20'8 20'6
18'6
21'3 19'5
13'8
23'0
21'8
20'8 20'8
21'6
13'8
13'44 6'84 0'13 20'41
\
CHART'
DISTRIBUTION OF RICE EATERS Etc. IN MADRAS STATE
Millet Eaters 181 0. )l'
Mixed Eaters 30 %
------------ - ----Rice Eaters 52%-------------------------------------------------'"1 ... -----------------------------------------.... _-------------------------------------'---------------------------'------------------------1--------- - - --- - - --

LEVEL OF CONSUMPTTON OF CEREALS
The percentage of rice eaters, mixed diet eaters and millet eaters varies from district to district. Table 3-4 shows the composition of these categories for each district.
TABLE 3-4.
Percentage of District. ,------_;....,--.... ----"\
Rice Mixed Millet eaters. eaters. eaters.
District
Nilgiris
Madurai
Tiruchirapalli
Thanjavur '" Ramanathapuram
Tirunelveli .. ,
Kanyakumari
17
Percentage of , -----'-------., Rice Mixed Millet
eaters eaters eaters
42
42
43
94
39
65
100
41
21
28
5
48
20
17
37
29
1
13
15
Madras
Chingleput ...
North Arcot
South Arcot
Salem
Coimbatore
98
51
23
38
27
52
2
47
67
47
36
21
2
10
15
37
27
The actual number of persons coming under each category is given in Appendix VI. Chart 1 shows the distribution of persons coming under these categories in the whole State. The levels of consumption in the three categories are given district-wise in Table 3-5.
District
(1)
Madras
Chingleput
North Arcot
South Arcot
Salem
Coimbatore
Nilgiris
Madurai
Tiruchirapalli
Thanjavur
Ramanathapuram
Tirunelveli
Kanyakumari
STATE
TABLE 3-5
Per C.U. ConsumptioD of Rice eaters (In Ozs.)
Per C.U. Consumption of Mixed eaters (In Ozs.) , ____ ..A..
.~ ~
(2)
16.32
19.04
19.52
17.76
18.72
20.96
14.08
20.32
19.68
20.64
20.00
17.92
13.76
18.88
~ ::E (3)
r- -"-------.,
g ~ .~
;w ~ _
~ ~ ~ ...... "0 ~ E-< ~ ~ ~ ~ (4) (5) (6) (7) (8) (9)
0.16 16.48 8.80 0.64 3.20 12.64
0.05 19.09 13.12 7.52 0.16 20.80
19.52 11.36 9.76 0.16 21.28
17.76 10.56 8.32
0.16 18.88
0.05 21.01
14.08
9.60 12.96
13.12 9.92
9.28 5.44
20.32 12.16 11.84
19.68 13.92 12.96
20.64 12.32 9.60
0.16 20.16 15.68 10.24
0.08 18.00 14.40 9.44
13.76
0.06 18.94 12.16 10.17
Rice
0.16 19.04
0.16 22.72
0.96 24.00
1.44 16.16
0.02 24.02
26.88
21.92
0.03 25.95
0.16 24.00
0.17 22.50
Millet
Wheat
Per C. U. Cunsumption of Millet eaters (In Ozs.)
.~ ~
(10) (11) (12)
"";;i -0 Eo-<
(13)
14.40 14.40
17.28 17.28
16.48
18.72
19.36
8.80
20.80
21.44
18.56
18.40
22.40
19.56
34.95 lakh tons
17.78 lakh tons
0.46 lakh tons
16.48
18.72
19.36
8.80
20.80
21.44
18.56
18.40
22.40
19.56
These figures are based on the actual level of consumption worked out as a result of the survey and not at the optimum level indicated by nutritional experts. A brief note on how we estimated the total annual consumption in each district is given in Appendix VII. The annual consumption according to our calculation for 1960-61 is as follows;
(excluding wheat flour)
Total cereals 53.19 lakh tons

18 FOOD HABITS IN MADRAS STATE
Trends in food production
14. It is difficult to estimate the actual quantity of foodgrains produced in Madras State every year. The production figures are published by the Director of Statistics every year. Ris figures are based on the records maintained by the Revenue Department of the State. For purposes of village accounts, the area of the crop and the yield are estimated by the Village Accountant or Karnam. He does not actually measure the field unless it is irrigated in which case water rate is leviable.· He generally estimates the area which is overchecked by higher officers of the Revenue Department. The figures for the State are compiled on the basis of
reliance can be placed on these figures. In estimating the yield the village accountant follows a crude method by estimating the quality of the crop visually. The normal crop is assumed to be a 12-anna crop. He decides whether it is a better or worse crop than the normal crop and his opinion is conclusive in the matter. No doubt, sometimes, his estimation has been subjected to a series of crop cutting experiments conducted in selected places and its reliability is determined by this method to a certain extent. For a study on the food production in Madras State, the figures compiled by the Director of Statistics will be sufficient, though it is not based on any scientific method.
figures given by the Karnam. Normally, there is The actual production figures of cereals from bound to be some approximation. The system 1950-51 are given in Table 3-6. These relate to of compilation is so firmly established that some Madras State as it is constituted to-day.
TABLE 3-6. Rice Millets
r -'--------~ r---__.._ Area Production Production
Year (acres) of paddy of rice (in tons) (in tons)
(1 ) (2) (3) (4)
1950-51 4,299,000 2.925,000 2,047,500 1951-52 4,420,000 3,142,500 2,199,750 1952-53 4,309,000 2,983,500 2,088,450 1953-54 5,143,000 3,808,500 2,665,950 1954-55 5,335,000 4,129,500 2,890,650 1955-56 5,456,000 4,409,800 3,086,860 1956-57 5,724,105 4,770,430 3,339,301 1957-58 5,600,252 4,853,385 3,397,370 1958-59 5,615,633 4,626,540 3,238,578 1959-60 5,721,007 4,920,705 3,444,494 1960-61 6,221,157 5,254,635 3,678,245
The output of rice from paddy is assumed to be 70% of the actual produce. Long term crops give 72% and short term crops like Kuruvai give 68% of boiled rice. The raw rice production in this State is negligible. As such, the outturn of rice from paddy is estimated at 70%.
Consequent on the implementation of Food Production Programmes in the First Five Year Plan, the production of cereals maintained a steady increase. It can be compared with the increase in the population in the State. Treating 1951 as the base year we have worked out the indices for increase in population and cereal production for the last 10 years which are given in Table 3-7,
Area (acres)
(5)
4,673,000 5,329,000 5,726,000 6,603,000 5,904,000 5,523,000 5,445,745 5,043,714 5,308,218 5,415,762 5,326,791
Year
1951 1952 1953 1954 1955 1956 1957 1958 1959 1960 1961
Production of millets (in tons)
(6)
1,144,000 ·1,369,000 1,113,000 1,567,000 1,776,000 1,466,000 1,482,650 1,526,730 1,554,150 1,718,400 1,679,440
TABLE 3-7.
Index of
Population
100 101 102 103 105 106 107 108 109 111 112
Total Cereal
Production (Rice and Millets)
(in tons) (7)
3,191,500 3,568,750 3,201,450 4,232,950 4,666,650 4,552,860 4,821,951 4,924,100 4,792,728 5,162,894 5,357,685
Index of production of rice and
millets
100 112 100 133 146 143 151 154 150 162 168

CHART 1.
COMPARATIVE POSITION OF PRODUCTION AND CONSUMPTION OF CEREALS IN THE VARIOUS DISTRICTS
IOr----------------------------------------------------------------,
9r--------------------------------------------4,'
8r----------------------------------------------4
7r---------------------~~------------------_,
... ...
0 ... ... ~ .... .... .... ~ w VI ::;( ::; '" ~ ::; (i
u ~ 0 0 LU a. (i ..J ~ « « Do. U 0 '" > W U ..J i5 « a. > :=:: LU '" a. .... ~ « VI ..J « « '" Co. ~ ..J ::> « « <II « ... « ..,
Do. LU I!> CD Z ~ Z :.t:
'" Z :I :I :=:: '" « « z « '" l- i :I ~ >-
~ .i a. .... 0 ::J: .... '" z ::> u ~ u 0 0 u ::> « i= « z VI a. Z '" i= ~ « '" CJ Production f:::::;:::::::;:::] Rice
CJ Consumption Mill ets
LEVEL OF CONSUMPTION OF CEREALS 19
ProductIon vis-a-vis consumption
15. Fifty three lath tons of cereals are available for consumption by the people in 1960-61 after meeting the seed requirments. On the basis of our survey, the total quantity of cereal consumption in the State is estimated at about 53 lakh tons. Thus the State has attained self-sufficiency in food even assuming that the consumption is at a rate of 20.4 ounces per c.u. But, in actual practice, the State imports some varieties of rice from Andhra Pradesh and exports other varieties to Kerala. The import provides better variety of rice to the consumer, while the export sustains the agricultural economy of the State.
While the State is, on the whole, self-sufficient, it is interesting to find out to what extent each district is self-sufficient. Chart 2 represents diagramatically the local production and the food requirements of each district. The actual figures of production and consumption in 1960-61 are given for each district in Appendix VIII. It will be seen that Thanjavur, Tiruchirapalli, ChingJeput, North Arcot, South Arcot and Kanyakumari districts are surplus in rice while others are deficit. In millets, the districts of Chingleput, North Arcot, Salem, Nilgiris, Madurai and Tirunelveli are deficit. If all cereals are considered together, the surplus districts are Chingleput, South Arcot, Tiruchirapalli and Thanjavur.
Imports and exports
16. Madras State is part of the Southern Zone in which the self-sufficient Mysore, highly deficit Kerala and surplus Andhra Pradesh are grouped together. General movement from one State to another is permitted. Madras imports rice and millets from Andhra Pradesh. A small quantity of cereals is moved f~om Mysore to Madras. The movement of paddy, nce and millet from Andhra Pradesh has been a normal feature from time immemorial. No record has been kept of the actual quantity so moved from Andhra Pradesh to Madras. For 1960-61, we have compiled figures from different sources. They are given below:
Import by rail as collected by the State Marketing Office ... Paddy 1·2 lakh tons
Rice 0·8 lakh tons Import by road as collected by
the Board of Revenue (Civil Supplies) Rice 0·2lakh tons
Import by canal as collected by the Board of Revenue Ri4:e 0·1 lakh tons
Thus, the total import is 1.2 lakh tons of paddy and 1.1 lakh tons of rice. The import from Mysore is mostly by road and from the records maintained by the Grain Purchase Officer, Tirupur, it is estimated at 0.3 lakh tons of paddy only. As regards millets imports from Andhra Pradesh and Mysore are both by rail and road (about 0.8 lakh tons). Added to these imports from Andhra Pradesh and Mysore, were the releases made by the Government of India directly from their godowns. In 1960-61, O.51akh tons of rice and 0.39 lakh tons of wheat were thus released. To counteract this there was a steady movement of foodgrains from this State; no millet is involved but only paddy and rice do move by rail and road. In 1959, border chowkies were established on the road leading to Kerala and thus figures could be collected. In 1960-61, the movement of rice by road was to the tune of 1.96 lakh tons and the movement of paddy by road was not appreciable. By rail 0.1 lakh tons of paddy and] .7 lakh tons of rice were moved to Kerala. There was some export to Pondicherry and Karaikal, but the quantity involved was not much and is not included in our discussion. Thus the State exported 0.1 lakh tons of paddy and 3.7 lakh tons of rice.
Overall position of demand and supply
17. From the figures of local production, imports, exports and consumption, we are now in a position to determine the overall demand-supply position for the State for 1960-61 for rice, millet and wheat.
Demand-supply position of rice for /960-6J (Fasli 1370) in Madras State (figures in lakh tons.)
Local production of paddy ...
Plus import of paddy by rail ...
Plus import of paddy by road
Less export of paddy to Kerala by rail ...
Less requirements for
Source
52.6 Director of Statistics.
1.2 From the record of the State Marketing Officer, Madras.
0.3 Records of the defunct office of the Grain
54.1
0.1
Purchase Tirupur.
Officer,
seed 1.1*
'" Seed requirements calculated at 40 Ibs. per acre for 6,l21,157 acres.

20 FOOD HABITS IN MADRAS STATE
Dema1ld-supply position of rice for 1960-61 (Fasli 1370) in Madras State (figures in lakh tons.) -(contd.)
Total paddy available for consumption in the State 52.9*
Source
or 37.0 (Rice).
Plus import of rice by rail
Plus import of rice by road
Plus import of rice by canal
Issues from Government of India Godowns
Total rice available ...
Less export of rice to Kerala by rail
Less export of rice to Kerala by road ...
Net quantity of rice
0.8 Records of Board of Revenue (Civil Supplies.)
0.2 Do.
0'1 Do.
0.5 Regional Director of Food, Madras.
38.6
1'7 Records of Civil
2.0
Supplies Department, Board of Revenue.
available 34.9
Consumption within the State 35.0
Net difference: - 0'1
* Outturn of rice calculated at 70 per cent of paddy.
Millets
Demand-supply positioll of millets in Madra$ State for 1960-61 (Fasli 1370) (ill lakh tons)
Local production ... 17'0 Average for '59-60 & 60-61.
Plus import by rail ... 0.4 Records of State Marketing Officer, Madras.
Plus import by road ... 0'4 Estimated quantity.
Total available 17'8
Less seed requirements 0.2 (at 8 lbs. per acre for
Net available 17.6 5,326,791 acres).
Consumption within the State. 17.8
Net difference. - 0.2
Demand-supply position of wheat ill Madras State for 1960-61 (Fasli 1370) (in lakh tons)
Local production ... 0.01
Supply of wheat to Fair Price Shops and Retailers by Govt. ofIndia 0.39 Average for 1960 & 61.
Samba and other vanetles received from other States ...
Issues of wheat flour for consumption within the State from the Roller Flour Mills
Household consumption of wheat according to our Survey
Consumption by insti· tutions, hotels, bakeries, etc.
Average for '58 & '59 furnished by State
0.06 Marketing Officer, Madra~.
0.46
0.39
0.32
0.14 of wheat and 0.39 of wheat flour.
The food position of Madras State is therefore, one of self-sufficiency, surplus and deficit being nominal. The surplus will always drain to Kerala. There is no attempt by anyone to accumulate stock of paddy and rice. The Reserve Bank of India has put a curb on advances on foodgrains and the variation between prices during harvest and non-harvest seasons is so low that there is no incentive for trading in foodgrains. The harvesting months are January-February for long term crops and August-September for short term crops. During non-harvesting months from May to July, and October-November, the prices tend to rise. Actually in July, the stocks held by producers, traders and millers may cover only one month's requirements, or about 4.35 lakh tons. Thus, the release from the buffer stock held by the Government of India has a salutory effect on the movement of grains as well as their price. Again, any shortfall in the quantity is made good by reducing the consumption level or by resorting to other items of food. The food position in Madras State does not however justify any complacent attitude. It does need constant watch and reasonable control. To what extent the production can keep pace with the increasing population and how the food production could be augumented by judicious. adjustment~ by the people will be discussed later.
t.liA.P1'Elt iv
MOVEMENT OF CEREALS
Factors determining movement
18. Foodgrains always tend to move from the producing areas to the consuming areas. The trend of movement of rice is more complex because the produce has to be processed and milled before it can be moved. The movement of rice is governed by the following factors :-
1. Local surplus and deficit.
2. Imports and exports.
3. Variation in harvest seasons.
4. Varying tastes of people and the consequent preference for different varieties by different sections of population.
5. Location of rice mills.
6. Transport.
7. Price.
I will now exmine the pattern of movement of rice and paddy based on these factors.
Local surplus and deficit
19. Table 4-1 gives the local production and consumption of rice for each district.
TABLE 4-1
Production of rice (after Consumption Surplus allowing for of rice or District seed require- (in lakll Deficit ments, in tons) (in lakh tons) lakh tons)
Madras 2.31 - 2.31 Chingleput 3.62 2.85 + 0.77 North Areot 3.48 2.98 + 0.50 South Areot 4.21 2.88 + 1.33 Salem 1.88 2.53 - 0.65 Coimbatore 1.92 3.11 - 1.19 Nilgiris 0.04 0.24 - 0.20 Madurai 2.60 2.88 - 0.28 Tiruchirapalli 3.12 2.99 + 0.13 Thanjavur 9.13 5.09 + 4.04 Ramanathapuram 1.92 2.58 - 0.66 Tirunelveli 3.00 3.45 - 0.45 Kanyakumari 1.09 1.05 + 0.04
0.01*
36.01 34.95 + 1.06
* Due to rounding off
Thanjavur is highly surplus in rice to the extent of 4.04 lakh tons. The surplus in South Arcot is more than one lakh. Chingleput and North Arcot have a surplus of more than half a lakh ton. The surplus in Tiruchirapalli and Kanyakumari is small. As against this, the highly deficit areas are Madras, Coimbatore and Nilgiris. Moderately deficit areas are Salem, Madurai, Ramanathapuram and Tirunelveli districts. It may appear that deficits of Madras and Salem districts can be met by the adjoining districts of Chingleput, North Arcot and South Arcot and deficits of the districts of Coimbatore, NiIgiris, Ramanathapuram, Madurai and Tirunelveli can be met from the surplus of Thanjavur and Tiruchirapalli. But the movement of grains does not follow this regular pattern in full. Madras, however, gets a part of its supplies from the adjoining Chingleput district. Salem gets a part of its supplies from the adjoining districts of North Arcot and South Arcot. Coimbatore gets its bulk supply from Tiruchirapalli and Thanjavur. A part of it is sent to Nilgiris. The southern districts of Madurai, Ramanathapuram and Tirunelveli get their supplies from Thanjavur district.
Of the two surplus areas in the State, the Cauvery delta is more compact and is being intensively cultivated. Whenever the Government want to control and regulate the prices and movement, they can cordon off the Cauvery delta. Such a policy is not liked by the growers and traders of Thanjavur delta. They think that there is discrimination against them in that the dealers in other areas are free to trade as they like. The movement from the northern surplus tracts of North Arcot, South Arcot and Chingleput will get intensified whenever control is imposed over Thanjavur. During normal times, however, the movement of rice and paddy from Thanjavur district will keep the movement from other surplus areas under check.
Imports from and exports to neighbouring States
20. The bulk of 1.5 lakh tons of paddy and l.l lakh tons of rice imported into the State is supplied by Andhra Pradesh. Small quantities come from Mysore State. Paddy and rice move by rail from places like Vijayawada, Tadepallegudam and Hyderabad in Andhra Pradesh. They are routed through established trade channels functioning at Madras, Salem, Erode

:ii FOOD HABITS IN MADRAS STATE
Til'upur, Coimbatore, Madurai and Tuticorin. The movements from comparatively nearer areas of Nellore and Guntur are partly by rail and partly by road and canaL The movement from Mysore is mostly by road and is received by some millers and manufacturers of puffed rice belonging to Salem and Coimbatore districts. On account of imports from Andhra Pradesh and Mysore State, milling centres have been established in these districts which function as supply centres to other deficit areas.
Madras State gets its quota out of imports by the Government of India from other countries. The imported foodgrains brought by ships are unloaded at the ports of Vishakapatnam, Kakinada, Cochin, Cali cut, Madras and Turicorin and sent by rail to the Government of India storage godowns located at various centres in South India. At times, grains unloaded at Madras are sent to Mysore and grains unloaded at Cochin are sent to Coimbatore. In Madras State, the storage godowns of the Government of India are located at the following centres (as in January 1961).
Sl. Name of Centre Number of Effective capacity No. god owns (in tons)
1. Madras Harbour 18 26,159 2. Madras City 36 33,543 3. Avadi 45 90,272 4. Coimbatore 34 27,574 5. TiruchirapaUi 2 5,200 6. Cuddalore 5 3,742 7. Tuticorin 5 5,064 8. Salem 2 1,610 9. Katpadi 3 2,083
Total 150 195,247
Source: Data collected from the Office of the Regional Dirtx:tor of Food, Madras.
Whenever releases of these stocks are ordered to Fair Price Shops, Flour Mills or big institutions, movements begin from these centres, mostly by road and sometimes by raiL
Different seasons of harvest
21. Harvest takes place at different places and in different months thereby creating places of temporary deficit. Though the main harvest is in JanuaryFebruary in the case of long term crops, and in August-September in the case of short term crops, off-season harvests occur in certain areas. Parts of Chingleput and North Arcot districts have an early
harvest in November. Some places in Coimbatore, Madurai and TiruneIveli districts have a late harvest in March. These off-season harvests stimulate movements of paddy and rice to deficit areas. Later in the year, reverse movement takes place. Thus early in December, one can see movement of rice from north to south, from places like Kancheepuram etc. to Manachanallur, Karur, Tirupur and Salem. A month later when harvest in Tiruchirapalli and Thanjavur takes place, the movement is from south to north. Likewise certain places like Madurai and Tirunelveli which get paddy from Thanjavur send paddy towards north in March and April. Because of these inter-district and off-season movements, artificial shortages can be created even in surplus areas like Thanjavur. The basic point to be remembered is that paddy harvested at any point of time is not consumed locally. It moves rather uneconomically to other areas due to one reason or other. No self-sufficiency in grains is practicable in any district.
Varying tastes
22. Several distinct botanical varieties of paddy are grown in this State. Many other varieties are imported from the neighbouring States. The cultivators decide on the actual variety to be grown in their fields OR the basis of factors like nature of soil, availability of water, duration of availability of water, season of cultivation, susceptibility to diseases and market preference. But in the mode of consumption, preferences of the higher classes are based on habit and the preferences of lower classes on price. Many rice-eaters have developed a special taste for a particular rice and they prefer to use that variety only. Such a variety may not be grown locally and this gives rise to cross-movements. Some of the rich landowner:'. of Thanjavur prefer to buy Molakolukulu raw rice from Nellore. The higher classes in Coimbatore district prefer finer varieties of Kitchidi, Chinna Samba, and Karthigai Samba grown in Chingleput and North Arcot districts and the Dobbi Samba grown in Palani and Dindigul taluks of Madurai district. The people of Kerala consume double-parboiled Co 25 variety and the rose-coloured kuruvai variety grown mostly in Thanjavur. These two varieties are not preferred by the people of Madras State except for use in the preparation of lddlies and Dosais. A preference is shown to TKM 6 by the middle class families in Madras city. Madras city imports the coarser variety grown in Thanjavur.
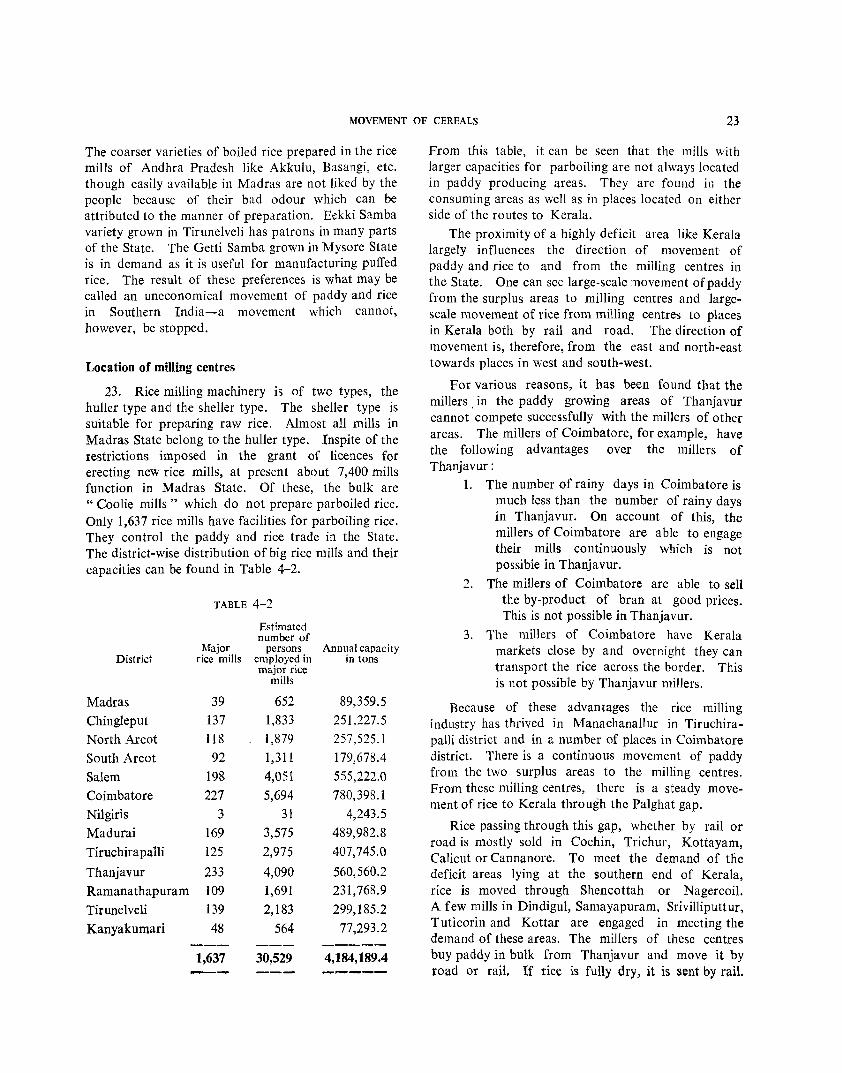
MOVEMENT OF CEREALS 23
The coarser varieties of boiled rice prepared in the rice mills of Andhra Pradesh like Akkulu, Basangi, etc. though easily available in Madras are not liked by the people because of their bad odour which can be attributed to the manner of preparation. Eekki Samba variety grown in Tirunelveli has patrons in many parts of the State. The Getti Samba grown in Mysore State is in demand as it is useful for manufacturing puffed rice. The result of these preferences is what may be called an uneconomical movement of paddy and rice in Southern India-a movement which cannot, however, be stopped.
Location of milling centres
23. Rice milling machinery is of two types, the huller type and the sheller type. The sheller type is suitable for preparing raw rice. Almost all mills in Madras State belong to the huller type. Inspite of the restrictions imposed in the grant of licences for erecting new rice mills, at present about 7,400 mills function in Madras State. Of these, the bulk are "Coolie mills" which do not prepare parboiled rice. Only 1,637 rice mills have facilities for parboiling rice. They control the paddy and rice trade in the State. The district-wise distribution of big rice mills and their capacities can be found in Table 4-2.
TABLE 4-2
Estimated number of
Major persons Annual capacity District rice mills employed in in tons
Madras 39
Chingleput 137
North Arcot 118
South Arcot 92
Salem 198
Coimbatore 227
Nilgiris 3 Madurai 169
Tiruchirapalli 125
Thanjavur 233
Ramanathapuram 109
Tirunelveli 139
Kanyakumari 48
1,637
major rice mills
652
1,833
1,879
1,311
4,051
5,694
31
3,575
2,975
4,090
1,691
2,183
564
30,529
89,359.5
251,227.5
257,525.1
179,678.4
555,222.0
780,398.1
4,243.5
489,982.8
407,745.0
560,560.2
231,768.9
299,185.2
77,293.2
4,184,189.4
From this table, it can be seen that the mills with larger capacities for parboiling are not always located in paddy producing areas. They are found in the consuming areas as well as in places located on either side of the routes to Kerala.
The proximity of a highly deficit area like Kerala largely influences the direction of movement of paddy and rice to and from the milling centres in the State. One can see large-scale movement of paddy from the surplus areas to milling centres and largescale movement of rice from milling centres to places in Kerala both by rail and road. The direction of movement is, therefore, from the east and north-east towards places in west and south-west.
For various reasons, it has been found that the millers: in the paddy growing areas of Thanjavur cannot compete successfully with the millers of other areas. The millers of Coimbatore, for example, have the following advantages over the millers of Thanjavur:
1. The number of rainy days in Coimbatore is much less than the number of rainy days in Thanjavur. On account of this, the millers of Coimbatore are able to engage their mills continuously which is not possible in Thanjavur.
2. The millers of Coimbatore are able to sell the by-product of bran at good prices. This is not possible in Thanjavur.
3. The millers of Coimbatore have Kerala markets close by and overnight they can transport the rice across the border. This is not possible by Thanjavur millers.
Because of these advantages the rice milling industry has thrived in Manachanallur in Tiruchirapalli district and in a number of places in Coimbatore district. There is a continuous movement of paddy from the two surplus areas to the milling centres. From these milling centres, there is a steady movement of rice to Kerala through the Pal ghat gap.
Rice passing through this gap, whether by rail or road is mostly sold in Cochin, Trichur, Kottayam, Calicut or Cannan ore. To meet the demand of the deficit areas lying at the southern end of Kerala, rice is moved through Shencottah or Nagercoil. A few mills in Dindigul, Samayapuram, Srivilliputtur, Tuticorin and Kottar are engaged in meeting the demand of these areas. The millers of these centres buy paddy in bulk from Thanjavur and move it by road or rail. If rice is fully dry, it is sent by rail.

24 FOOD HABITS IN MADRAS STATE
If it is not fully dry, it is sent by lorry. As the distance is considerable, the movement to south is not so appreciable as movement to west. A few mills are found in Salem and Tiruchengode which buy paddy from Chidambaram taluk and send rice to Kerala.
The millers in Arni, Ranipet, Karunguzhi, Tindivanam and Kallakurichi have also taken to the preparation of rice suitable to Kerala people. But their despatches are not steady. This rice is mostly marketed at Coimbatore where a number of dealers and commission agents could be found acting for the merchants of Kerala. Coimbatore thus serves as an important trading centre for rice across the State border.
Transport
24. When the harvest is in full swing in Thanjavur there is considerable bottleneck in rail movement. The despatches to Erode, Tirupur, etc. have to undergo transhipment at Tiruchirapalli junction from metre gauge to broad gauge. As the rail movement involves delay, the traders prefer to move paddy by road in lorries though it costs them a little more. They can be certain of reaching the market in time and before the rice, which is usually not fully dry, gets spoiled. As road movement is preferred, the rice mills engaged in preparing rice for consumption in Kerala, lie along road routes from the paddy producing areas to the consumption areas in Kerala. They do not necessarily lie on the shortest routes; they are also found in interior places. These movements are controlled ultimately by the price level in Kerala.
Price 25. Kerala is always short of rice. The price there
is, therefore, advantageous to any miller engaged in rice trading. The margin of profit is quite attractive. Even for internal movement within the State, the guiding factor is price and not distance. Occasionally it so happens that due 10 high prices, too much of rice may be moved to a particular place resulting in a glut. In such cases, reverse move~ ment has to take place and stocks diverted to places where better prices prevail.
While rivers in the State flow from west to east, the bulk of the rice-flow is from east to west. In Map 2, I have indicated the paddy producing areas, the assembling centres, the milling centres and the pattern of movement taking place in paddy and rice.
Movement of millets
26. MilIets form about one-third of the cereals produced in the State. No appreciab!e movement of millets takes place from district to district. Millet is generally consumed in the house or paid as wages to farm labourers. The requirement of any village is generally met by production within the village itself. Whatever surplus is produced is sold in the weekly markets. Actually, only a few tracts are surplus in millets. The important millet centres in the State and the kinds of millets marketed are as follows:-
Name of the centre
Madurai Theni Koilpatti Dindigul Pollachi Salem Vellore Tiruvannamalai Kancheepuram Villupuram
Name of millet
White and yellow cholam Cholam and Ragi Cumbu and Cholam Cholam Cholam Cholam and Ragi Ragi Ragi Ragi Ragi
Table 4-3 gives the extent to which each district is surplus or deficit in millet.
TABLE 4-3
Production of millets (after allowing for Consumption Surplus or
District seed require- of millets Deficit ments, in (in lakh tons)
lakh tons)
Madras
Chingleput 0.44 0.66 - 0.22
North Arcot 1.28 1.92 - 0.64
South Arcot 1.51 1.46 + 0.05 Salem 3.41 3.64 - 0.23
Coimbatore 2.62 2.23 + 0.39
Nilgiris 0.02 0.13 - 0.11
Madurai 2.07 2.79 - 0.72 Tiruchirapalli ... 2.78 2.42 + 0.36
Thanjavur 0.24 0.15 + 0.09 Ramanathapuram 1.32 1.28 +0.04
Tirunelveli 0.92 1.10 - 0.18
Kanyakumari ... ----
Total 16.61 17.78 -1.17 ----
From this it can be seen that there is not much scope for any large-scale inter-district movement of millet.
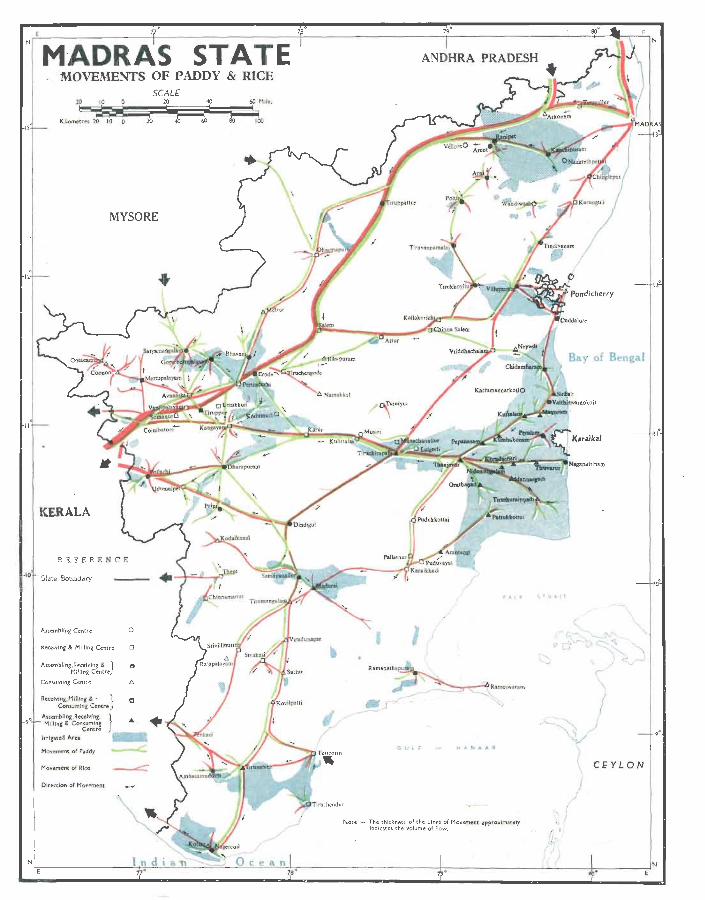
79· Nr-----------------~r---------------------~f---------------------~~----------------------~~.-~~N
M-ADRAS STATE
-10
..
MOVEMENTS OF PADDY & RICE SCALf
MYSORE
KERALA
REFERENCE
State Boundary
Assembling Centre 0
Keedv,n, & Millin, Centra 0
Assembling.Recelvlng ~ 1 ., MPHng Centre
Consuming Cent~e A
Recelving,MUling & • } to Cons"mlng Centre
Assembling, Receiving • Milling & Consuming
Centre Irrigated Aru
Movement of Paddy
Movement Qr RIce
Orren/on of Movement
ANDHRA PRADESH
/ 1/
G U l F
r /
I
MANA""
PAL K S T R A I T
9·
CEYLON
CHAPTER V
PROJECTIONS OF DEMAND FOR AND SUPPI,Y OF CEREALS
Usefulness of the projections
27. The present food position of Madras State can be considered to be satisfactory since the State has reached the level of self-sufficiency. I propose to examine whether this can be maintained in the light of increase in population and increase in per capita income. Dr. P. S. Lokanathan, DirectorGeneral of the National Council of Applied Economic Research has stated as follows: "A realistic appraisal of the magnitudes of long term demand for different commodities would provide guidelines to the planners in resource allocation. Likewise, a realistic assessment of the production possibilities would indicate the extent and the direction in which the imbalances are likely to arise in a possible crisis in the proper functioning of the economy". * As cereal is the basic food of this State, a study on the demand for and supply of cereal for the future is of some significance.
The National Council of Applied Economic Research has made projections of the demand and supply of foodgrains for the entire country. They are useful for future planning. But conditions in Madras State differ from those in India as a whole, in population increase, food habits and food production. The rate of increase in the per capita income in this State is not the same as the rate of increase of per capita income in India. Therefore, the supply and demand position has to be projected for Madras State on somewhat different lines. As already observed, Madras State is situated between the surplus State of Andhra Pradesh and the deficit State of Kerala. While the total food production in Andhra Pradesh is bound to increase in the next decade, Kerala with its rapidly increasing population is likely to face greater deficit. On the whole, the zonal deficit may, therefore, remain steady. It is, at the same time, of interest to examine whether Madras State while maintaining the existing export to Kerala can sustain its increasing population. Of the 53 lakh tons of cereals consumed, 35 lakh tons are in the form of rice. The balance is made up of millet except for 0.46 lakh tons of wheat which is a negligible quantity in the overall picture. The consumption of millet is more or less constant because the total
* " Long Term Projections of Demand for and Supply of Selected Agricultural CommOdities "-NCAER, New Delhi,
4
production has not shown any tendency to increase. The millet production ranges from 15 lakh tons to 18 lakh tons. Though improved methods of millet cultivation may result in greater yield, this is counterbalanced by a steady fall in the area under millet due to diversion of such areas to paddy and cash crops. Again, there is a tendency for millet-eating people to take to rice. There is no export of millet VI Kcrala and import from Andhra Pradesh is negligible. So, any additional demand on cereals has to be met in the form of rice.
Demand projection
28. The demand projection is made under certain assumptions relating to factors like per capita income, relative price level and growth of population. The projection will also be affected by deflation and inflation. But, in our estimate, we have assumed that prices will continue at the present level.
The people in urban areas consume more of subsidiary food and as such the level of consumption of cereals will vary in the urban and rural sectors. Again, with an increase in income the tendency to eat more cereals will be greater in rural areas than in urban areas. It has, therefore, become necessary to make separate projections for rural and urban areas using different coefficients of income elasticities of demand for cereals. For calculating the future demand. I propose to use
the equation 1=100 ~(1+a)lJ -I} where I is the percentage increase in the average expenditure on cereals per household, a is the proportion of increase in the average income of a household with reference to the income in the base year and lJ is the coefficient of income elasticity of demand for cereals. As I have assumed constant price level for the future years, the percentage increase in the average expenditure on cereals per household will be eq ual to the percentage increase in the average consumption per household. So, for determining the value of I which is equivalent to the percentage increase in the average consumption per household, we have to know the values of a and 17.
As regards a no separate estimate of household income for Madras State is available. As such, the rate of change of per capita income is taken as the rate of chan~e of hous~hold income,
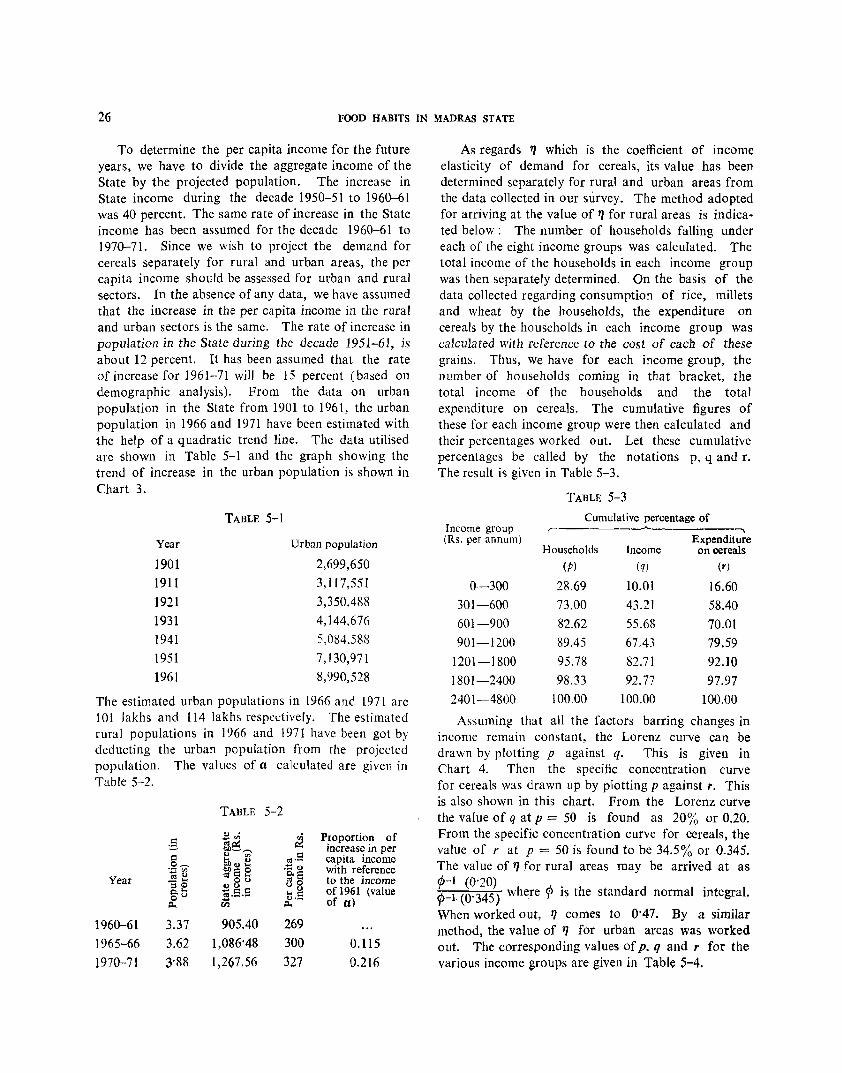
26 FOOD HABITS IN MADRAS STATE
To determine the per capita income for the future years, we have to divide the aggregate income of the State by the projected population. The increase in State income during the decade 1950-51 to 1960-61 was 40 percent. The same rate of increase in the State income has been assumed for the decade 1960-61 to 1970-71. Since we wish to project the demand for cereals separately for rural and urban areas, the per capita income should be assessed for urban and rural sectors. In the absence of any data, we have assumed that the increase in the per capita income in the rural and urban sectors is the same. The rate of increase in population in the State during the decade 1951-61, is about 12 percent. It has been assumed that the rate of increase for 1961-71 will be 15 percent (based on demographic analysis). From the data on urban population in the State from 1901 to 1961, the urban population in 1966 and 1971 have been estimated with the help of a quadratic trend line. The data utilised are shown in Table 5-1 and the graph showing the trend of increase in the urban population is shown in Chart 3.
TABLE 5-1
Year Urban population
1901 2,699,650
1911 3,117,551
1921 3,350,488
1931 4,144,676
1941 5,084.588
1951 7,130,971
1961 8,990,528
The estimated urban populations in 1966 and 1971 are JOl lakhs and 114 lakhs respectively. The estimated rural populations in 1966 and 1971 have been got by deducting the urban population from the projected population. The values of a calculated are given in Table 5-2.
TABLE 5-2
'" . en Proportion of :§_ ... Vl
"'~ ~ increase in per 0lJ~,-..
I'l '" Vl oj.S capita income ... v o~ 01)", ...
.~ ~ blle O .~ !l) with reference Poe Year olot &0 to the income '30 ~gr:: Po ... 0 ofl961 (value
0 0 ~.- • .-I "'r:: iii
",.- of a) p.. p..
1960-61 3.37 905.40 269
J965-66 3.62 1,086'48 300 0.115
1970-71 3'88 1,267.56 327 0.216
As regards 1] which is the coefficient of income elasticity of demand for cereals, its value has been determined separately for rural and urban areas from the data collected in our survey. The method adopted for arriving at the value of 1J for rural areas is indicated below: The number of households falling under each of the eight income groups was calculated. The total income of the households in each income group was then separately determined. On the basis of the data collected regarding consumption of rice, millets and wheat by the households, the expenditure on cereals by the households in each income group was calculated with reference to the cost of each of these grains. Thus, we have for each income group, the number of households coming in that bracket, the total income of the households and the total expenditure on cereals. The cumulative figures of these for each income group were then calculated and their percentages worked out. Let these cumulative percentages be called by the notations p, q and r. The result i5 given in Table 5-3.
TABLE 5-3
Cumulative percentage of Income group r-------'------, (Rs. per annum) Expenditure
Households Income on oereals
(Pl (q) (t')
0-300 28.69 10.01 16.60 301-600 73.00 43.21 58.40 601-900 82.62 55.68 70.01
901-1200 89.45 67.43 79.59
1201-1800 95.78 82.71 92.10
1801--2400 98.33 92.77 97.97
2401-4800 100.00 100.00 100.00
Assuming that all the factors barring changes in income remain constant, the Lorenz curve can be drawn by plotting p against q. This is given in Chart 4. Then the specific concentration curve for cereals was drawn up by plotting p against r. This is also shown in this chart. From the Lorenz curve the value of q at p = 50 is found as 20% or 0.20. From the specific concentration curve for cereals, the value of r at p = 50 is found to be 34.5% or 0.345. The value of 1] for rural areas may be arrived at as 1>-1 (0'20) ¢-l (0'345) where ¢ is the standard normal integral.
When worked out, 1J comes to 0'47. By a similar method, the value of 1] for urban areas was worked out. The corresponding values of p, q and r for the various income groups are given in Table 5-4.
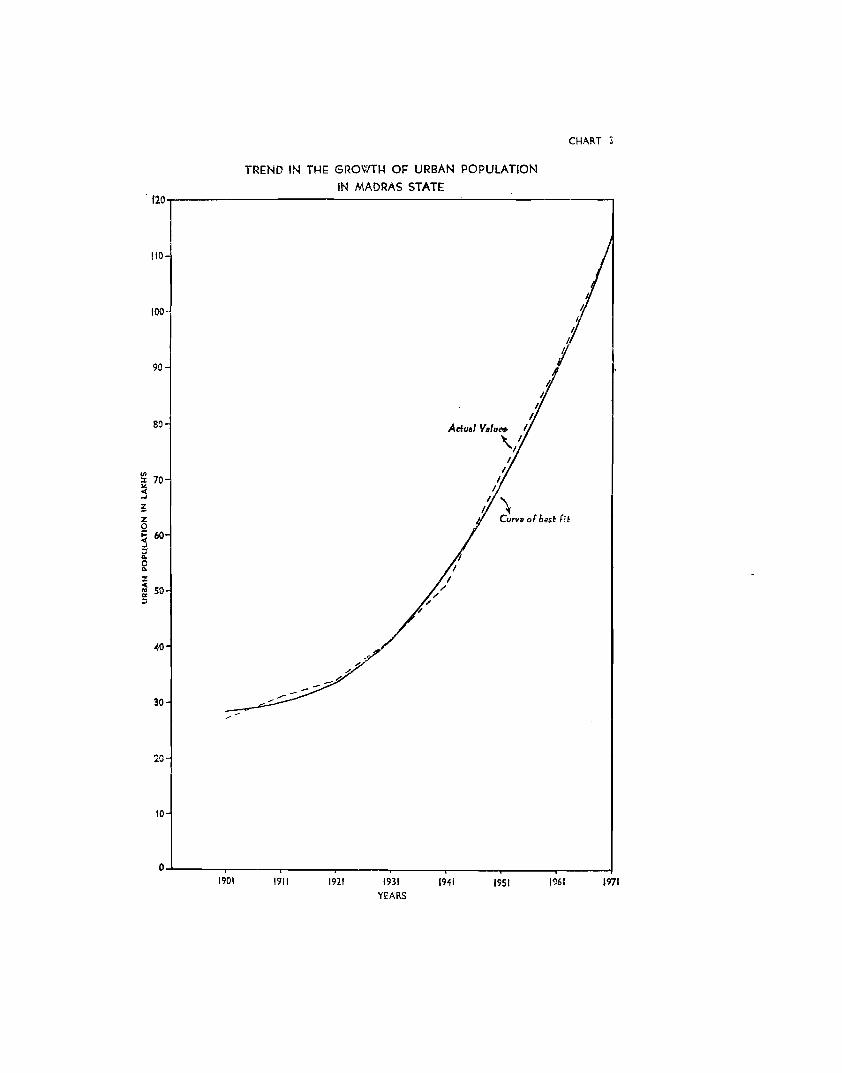
TRI:ND IN TI-l!: GROWTI-I OF URBAN POPULATION
IN MADRAS STATE
CHART
120..------------------~----------,
110
100
90
so
~ 70 >< « ... ! % 0
~ ... ;;1
~ ... z ..: '" .. ;;J
60
50
40 -~
30
10
10
o~--~ ____ ~ __ ~----~--__,~--~--~--~ 1901 1911 1921 1931
YEARS 1941 1951 1961 1971
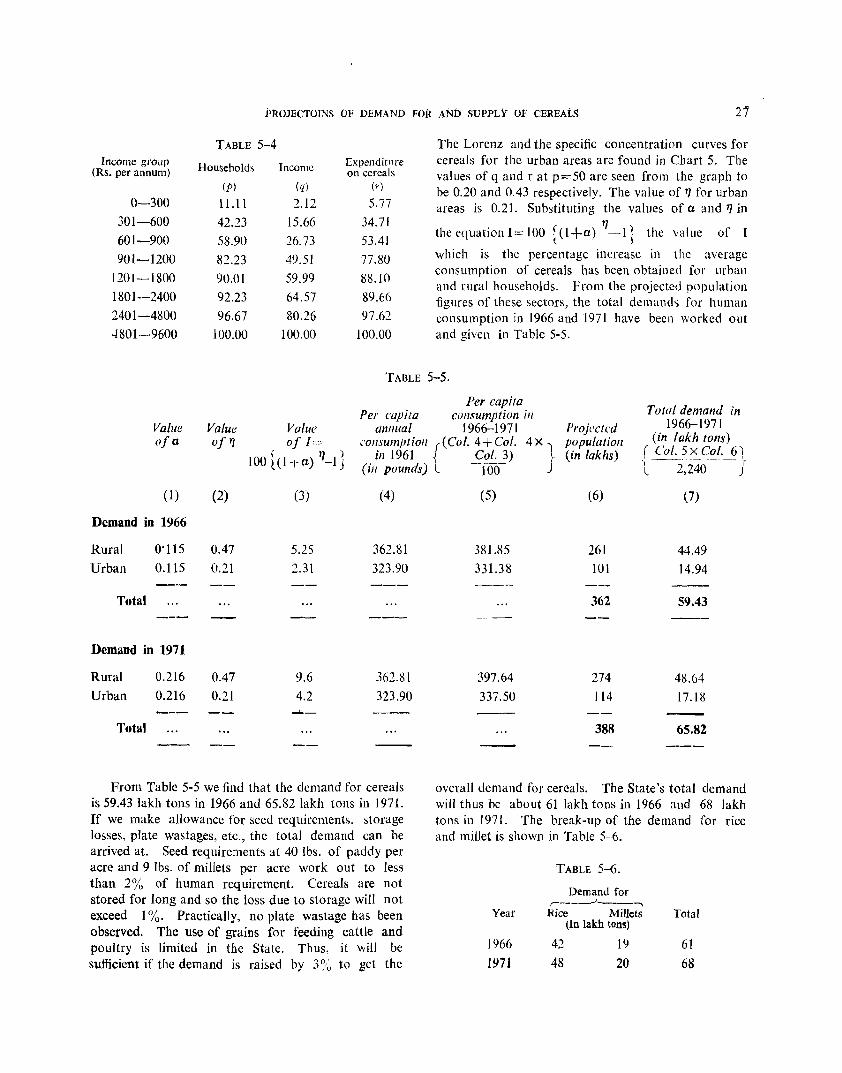
l>lWJECTOINS 0.1' DEMAND FOR AND SUPPLY OF CEREAtS 21
Income group (Rs. per annum)
0-300
301-600
601-900
901-1200
1201-1800
1801-2400
2401-4800
-1801-9600
TABLE 5-4
Households
(P)
11.11
42.23
58.90
82.23
90.01
92.23
96.67
100.00
Income
(q)
2.12
15.66
26.73
49.51
59.99
64.57
80.26
100.00
Expendit ll re on cereals
(y)
5.77
34.71
53.41
77.80
88.10
89.66
97.62
100.00
The Lorenz and the specific concentration curves for cereals for the urban areas are found in Chart 5. The values of q and r at p=50 are seen from the graph to be 0.20 and 0.43 respectively. The value of 1] for urban areas is 0.21. Substituting the values of a and 1] in
theeauationI=IOO (1+0,) 1]_1( the value of I • t· j
which is the percentage increasc in the average consumption of cereals has been obtained for urban and rural households. From the projected population figures of these sectors, the total demands for human consumption in 1966 and 1971 have been worked out and given in Table 5-5.
TABLE 5-5.
Per capita Per capita consumptiun ill Total demand in
1966-1971 Value ufo,
(1)
Demand in 1966
Rural
Urban
Total
0'115
0.115
Demand in 1971
Rural
Urban
Total
0.216
0.216
Value off}
(2)
0.47
0.21
0.47
0.21
Value of 1=
( 1]) l00t(l+a) -15
(3)
5.25
2.31
9.6
4.2 ..... -
annual 1966-1971 consumptioll ((Col. 4+Col.
in 1961 -{ Col. 3) (ill puunds) l 100
(4)
362.81
323.90
362.81
323.90
(5)
381.85
331.38
397.64
337.50
Projected 4 x") pupulatiol!
} (in lakhs)
(6)
261 101
362
274 114
388
(in lakh tOilS)
( Col. 5 x Col. 61 ) -_-- --~--~-.- I~
l 2,240 j
(7)
44.49
14.94
59.43
48.64
17.18
65.82
From Table 5-5 we find that the demand for cereals is 59.43 lakh tons in 1966 and 65.82 lakh tons in 1971. If we make allowance for seed requirements. storage losses, plate wastages, etc., the total demand can be arrived at. Seed requirements at 40 Ibs. of paddy per acre and 9 lbs. of millets per acre work out to less than 2% of human requirement. Cereals are not stored for long and so the loss due to storage will not exceed I %. Practically, no plate wastage has been observed. The use of grains for feeding cattle and poultry is limited in the State. Thus, it will be sufficient if the demand is raised by 3% to get the
overall demand for cereals. The State's total demand will thus be about 61 lakh tons in 1966 and 68 lakh tons in 1971. The break-up of the demand for rice and millet is shown in Table 5-6.
TABLE 5-6.
Demand for r--_;'_---~
Year Nice Millets Total lin lakh tons)
1966 42 19 61 1971 48 20 68
FOOD HABITS IN MADRAS STATE
Assuming that 76% of the population constitute the consumption units or adult units, the daily consumption per consumption unit will be as shown in Table 5-7.
TABLE 5-7. Daily consumption (in ounces) of cereals per
consumption unit in {.----------.._------..----~
Rural and Year Rural areas Urban :lreas Urban
1961 1966 1971
20.9 2,2.1 22.9
Estimates of production
18.7 19.0 19.5
areas
20.4 21.3 21.9
29. In 1960-61, against a total demand of 54.2 lakh tons of cereals (including seed requirement) the internal production stood at the level of 53.6 lakh tons. During the First Five Year Plan, the food production in Madras State increased from 38 lakh tons to 44 lakh tons. For the Second Five Year Plan the target of additional production was fixed at 12.79 lakh tons, but actually the achievement was only 8.65 lakh tons. The target for the Third Five Year Plan has been fixed at 16.50 lakh tons of additional production, so that the total production in 1965-66 will be 70 lakh tons. I will first examine whether this target will be reached in 1965-66. The break-up of the additional production targeted for and achieved in the first two Five Year Plans is given in Table 5-8.
Heads
Major irrigation ... Minor irrigation '" Chemical fertilizers Local manures Improved seeds
Land improvement and soil conservation
Japanese method of cultivation, etc ....
Deduct for overlapping
Total
TABLE 5-8
"'~ i5l:;k.- c:l
0:: .,._ 0:: eIJ.. <u p:: <U<u>- ",0:; ;>,.c'Uc: .~- > C'J c:l~ ..c:::: C::::'-- 00:: u·-ll.~ u_
<I: <U CI.l
1.18 0.90 1.66 1.10 0.89 3.30 1.01 2.76 0.25 3.90
0.30 0.53
0.53 0.30
5.82 12.79
c:l '" <tI
<.> i: E !l: .Qo:: ., ;;p:: E -0
tU<.>i: ._ '" ;..<= 0 ~ .... tU_u <u._ ._ <U
0Il.Q '5.S CI.l ~I-< <I: .... 1.00 1.04 1.06 1.83 0.98 7.90 2.04 3.71 2.59 1.36
0.26 0.66
0.72 1.72
1. 72
8.65 16.50
Major irrigation :-At the beginning of the First Five Year Plan, the extent under major irrigation was 21.95 lakh acres. The extents added during the First and Second Plans were 1.32 lakh acres and 2 lakh acres respectively. So, the gross area under major irrigation at the beginning of the Third Plan was 25.27 lakh acres. Out of the irrigation potential created by the execution of major irrigation works during the first two Plans, an extent of 0.52 lakh acres still remains undeveloped. It can be expected that at least an extent of 0.40 lakh acres will be developed during the Third Plan period. Further, the irrigation potential which will be created by the execution of new major schemes like the Parambikulam-Aliyar Project, the Sathanur Project Stage II, the PaJar Allicut and Channel Improvements, etc. is 3.2 lakh acres. Out of this, 50% can normally be expected to be developed during the Plan period. Thus, the additional area that will come under major irrigation will be two lakh acres bringing in an additional production of about one lakh tons of foodgrains. The target of 1.04 lakh tons set for the Third Plan can, therefore, be achieved. For the Fourth Plan period, no new major irrigation scheme can be implemented because the waters of the rivers flowing through the State have been fully utilised. Thus, the additional food production that can be expected is by the use of undeveloped potential created in the earlier Plans. This will be 1. 72 lakh acres yielding an additional food production of 0.86 lakh tons.
Minor irrigation :-During the first two plan periods. a good deal of improvements have been carried out to the existing minor irrigation works in thc State. So, further improvement in this direction has its limitation. No new minor irrigation tank can be constructed. In the Third Plan, a sum of rupees eight crores has been set apart for renovating 3,415 minor irrigation sources. These improvements are expected to yield 82,500 tons of grains. In the Fourth Plan, the scope for improvement is bound to be much less. As such, an additional production of 40,000 tons of foodgrains can be expected. In the Third Plan, a sum of Rs. 0.80 crore is proposed to be spent in desiltingcum~reclamation of 80 tanks. They are expected to improve the capacities of the tanks, especially those in the coastal districts of ChingJcput, South Arcot and Ramanathapuram where the silting of the tanks is high. The expected food production potential of 6,000 tons by the desilting operations in the Third ~lal1 can certainly be reached. In the Fourth Plan perIOd,

LORI;NZ AND SPECIFIC CONCENTRATION CURVES (Cereals)
RURAL AREA CHART 4 100
I 90 1/
I I
80 I I I I
e / I 70 \J;,;
(,,~ I .o~ I
60 Y.~ '/ !I,\} I
c,~/ I
SO eli ·h ~ III .~/"/ ~~, .J I (" '( C,~e , I/o"" III 40 a: 1/ ... t l III U Y / z
30 /, / 0 / / w / I / IX
i2 20 ;" )" Ci " ,/ ./ I z ., III ,/ '" Q. 10 ... ~
" z: 0 '(
~ 0 10 20 30 40 SO 60 7{) SO 90 100
0 CUMULATIVE PERCENTAGE OF f.lOUSEI.IOLDS U ~
uRBAN AREA CHART 5 u. 0 100 w I/)
"" I- 90 z: w U r::: w 80 I I CI.
w / I > I i= 70- I '( 4} ...
t-~ :l / :e :l 60 .;_,o{'/ I u
~\'1>/, /
50 c,e{'/ 4e/ <.,0<'1 ("v>
I/'
40 ·~'(,1 e<i<"'/ ,y/ ,i/
c,4} I ;"
30 / I /'
/ ;"
/ I " 20 / )/ / /'1
;" ,; I
10 / '" '" / .,., I ,/ ...... ....... _- ,
0 0 10 20 30 40 51) 60 70 80 90 100
CUMULATIVE "ER~TAGE OF HOUSEJ.IOLDS
PROJECTIONS OF DEMAND FOR AND SUl'PLY OF CEREALS
the scope for extending irrigation by improvements to the tanks will be much less. It will be, therefore, futile to expect more than 40,000 tons by additional production under this head. In desilting operations, however, if the tempo is kept up, an additional production of 10,000 tons can be reached. Under extension of irrigation by sinking more wells, the Third Plan aims to spend a sum of rupees one crore. In some districts like Coimbatore and south Salem, the sub· soil water is utilised to a large extent and sinking of more wells may not increase the area under well irrigation. In the coastal districts, however, sinking of new wells has great potentiality, in that a second crop can be raised during the non-l11onsoon period. The target of 3,000 tOilS of additional production under the scheme is possible of attainment. If the programme is continued, a similar achievement can be made in the Fourth Plan also. In the Third Plan, an outlay of Rs. 94 lakhs has heen programmed for sinking 500 artesian wells and 150 deep tube wells. At 100 acres a well, the total additional area expected to be brought under irrigation will be 65,000 acres with an additional food production of 0.32 lakh tons. But in the first two years of the Plan, the physical achievement was only 50 wells. In the entire Third Plan period, the physical achievement will not be more than 125 wells and will create a production potential of 6,000 tons only. A similar increase in production can be expected in the Fourth Plan period also. Another scheme included in the Third Plan is advancing loans to the tune of Rs. 50 lakhs for sinking 2,500 bore wells. The scheme is progressing well. The additional food production expected is 0.10 lakh tons. The scheme is likely to be extended to the Fourth Plan. A sum of Rs. 50 lakhs is proposed to be spent on sinking about 2,000 filter points ncar river beds in the Third Plan. This will benefit 10,000 acres and res ult in an additional production of 5,000 tons annually. This may also extend to the Fourth Plan period. In all, under minor irrigation, the possible achievement~ in the Third and Fourth Plans are as shown in Table 5-9.
TABLE 5-9
Scheme
Improvements to minor irrigation tanks
Desilting Well sinking
Possible achievement in
the Third Plan period
(in lakh tons)
0.82
0.06 0.03
Possible achievement in
the Fourth Plan period
(in lakh tons)
0.40
0.10 0.03
TABLE 5-9-collt.
Possible achievement in
Scheme the Third
Deep tube and artesian well
Plan period (in lakh tons)
sinking 0.06
Sinking of bore wells 0.10
Filter points 0.05
Other schemes like utilisa-tion of drainage water, etc. 0.10
Possible achievement in
the Fourth Plan period
(in lakh tOilS)
0.06
0.10
0.05
(J.20
1.22 0.94
Chemical Jerlili::ers :-Chemical fertilizers can be applied only in irrigated lands. Six lakh tons of fertilizers are needed to completely cover the irrigated lands. But the average supply in the Second Plan period was J .25 lakh tons. In the Third Plan, the target fixed for chemical fertilizers is four lakh tons annually. But actually, the supply for the first two years in the Third Plan was two lakh tons only. In the next three years, an increased supply cannot be expected because the fertilizer supply position in the whole country cannot be improved with rapidity. As such, by any pwctical test, the target of 7.90 lakh tons of additional production by increased use of chemical fertilizers cannot be accomplished. It can be assumed that 50'.1/0 of the target may be reached. This will come to 4.00 lakh tons. In the Fourth Plal1 period with the prospect of the fertilizer plant at Neyveli meeting the demand, the supply po~ition of chemical fertilizers may improve to 4 to 5 lakh tons and the additional food production will be 4.5 lakh tons over what was produced in the Third Plan.
Local manures :-The Third Plan aims at al:hieving an additional production of 3.71akh tons under this head. The important schemes are, (I) to supply green manure seeds at subsidised rates to cover the entire 60 lakh acres of irrigated areas; (2) to aid the increase of rural compost output from IS to 50 lakh tons; and (3) to increase the urban compost supply from 4 to 6 lakh tons. It is difficult to evaluate the achievements under the first two heads. It can however be assumed that 3.7 lakh tons of additional prod uction will be reached in the Third Plan. There is not much scope to increase production in the Fourth Plan. However, the average additional production of foodgrains in the Fourth Plan can be assumed at one lakh tons only.
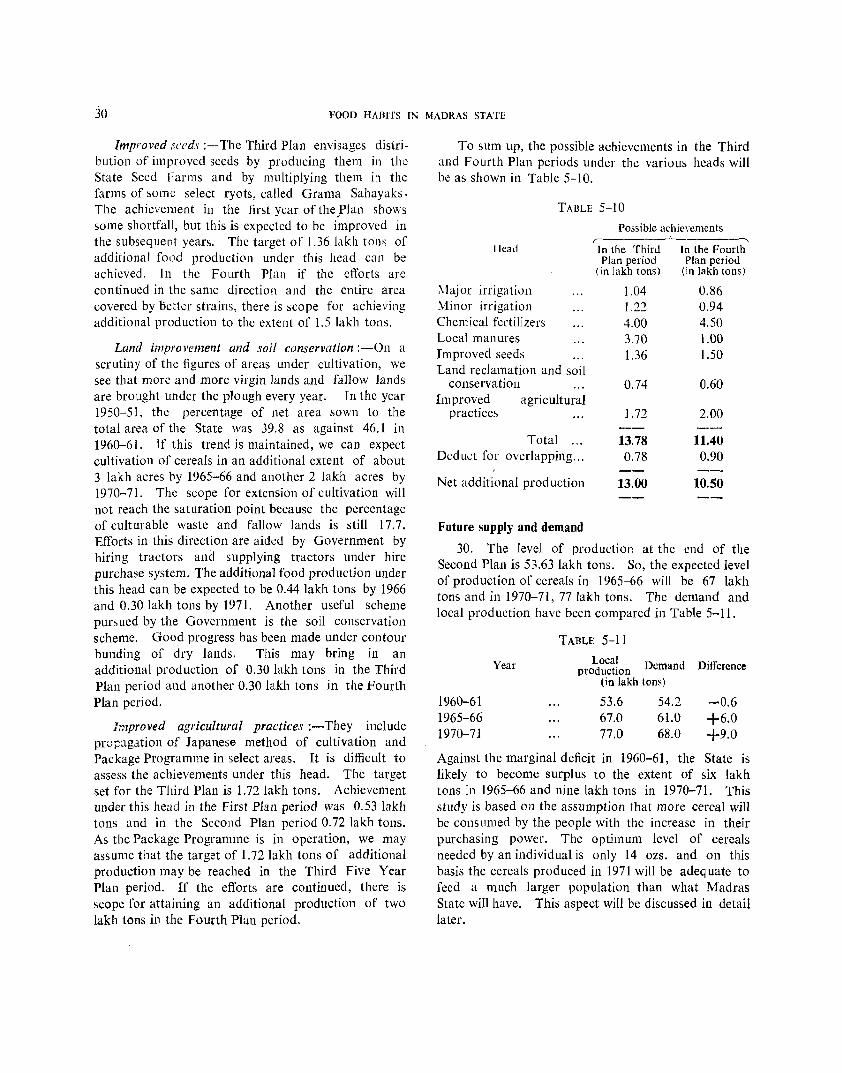
30 FOOD HAlllfS IN MADRAS STATE
Improved seedl' ;-The Third Plan envisages distribution of improved seeds by producing them in the State Seed Farms and by multiplying them in thc farms of some select ryots, called Grama Sahayaks. The achievement in the first year of the Plan shows some shortfall, but this is expected to be i~1proved in the subsequent years. The target of 1.36 lakh tons of additional food production under this head can be achieved. In the Fourth Plan if the efforts are continued in the same direction and the entire area covered by better strains, there is scope for achieving additional production to the extent of 1.5 lakh tOilS.
Land improvement and soil conservation :-On a scrutiny of the figures of areas under cultivation, we sec that more and more virgin lands and fallow lands are brought under the plough every year. In the year 1950-51, the percentage of net area sown to the total area of the State was 39.8 as against 46.1 in 1960-61. If this trend is maintained, we can expect cultivation of cereals in an additional extent of about 3 lakh acres by 1965-66 and another 2 lakh acres by 1970-71. The scope for extension of cultivation will not reach the saturation point because the percentage of culturable waste and fallow lands is still 17.7. Efforts in this direction are aided by Government by hiring tractors and supplying tractors under hire purchase system. The additional food production under this head can be expected to be 0.44 lakh tons by 1966 and 0.30 lakh tons by 1971. Another useful scheme pursued by the Government is the soil conservation scheme. Good progress has been made under contour bunding of dry lands. This may bring in an additional production of 0.30 lakh tons in the Third Plan period and another 0.30 lakh tons in the Fourth Plan period.
Improved agricultural practices :-They include propagation of Japanese method of cultivation and Package Programme in select areas. It is difficult to assess the achievements under this head. The target set for the Third Plan is 1.72 lakh tons. Achievement under this head in the First Plan period was 0.53 lakh tons and in the Second Plan period 0.72 lakh tons. As the Package Programme is in operation, we may assume that the target of 1. 72 lakh tons of additional production may be reached in the Third Five Year Plan period. If the efrorts are continued, there is scope for attaining an additional production of two lakh tons in the Fourth Plan period.
To sum up, the possible achievements in the Third and Fourth Plan periods under the various heads will he as shown in Table 5-10.
TABLE 5-10
IleaL!
Maj or irrigation Minor irrigation Chemical fertilizers Local manures Improved seeds Land reclamation and soil
conservation Improved agricultural
practices
Total ... Deduct for overlapping, ..
Net additional production
Future supply and demand
Possible achievements ,.-----' In the Third Plan period
(in lakh tons)
1.04 1.22 4.00 3,70 1.36
0,74
1.72
13.78 0.78
13.00
-..., In the Fourth Plan period
(in lakh tons)
0.86 0.94 4.50 1.00 1.50
0.60
2.00
11.40 0.90
10.50
30. The level of production at the end of the Second Plan is 53.63 lakh tons. So, the expected level of production of cereals in 1965-66 will be 67 lakh tons and in 1970-71, 77 lakh tons. The demand and local production have been compared in Table 5-11.
1960-61 1965-66 1970-71
Year
TABLE 5-11
Local D d production em an
(in lakh tons)
53.6 67.0 77.0
54.2-61.0 68.0
Difference
·-0.6 +6.0 +9.0
Against the marginal deficit in 1960-61, the State is likely to become surplus to the extent of six lakh tons in 1965-66 and nine Iakh tons in 1970-71. This study is based on the assumption that more cereal will be cons limed by the people with the increase in their purchasing power. The optimum level of cereals needed by an individual is only 14 ozs. and on this basis the cereals produced in 1971 will be adequate to feed a mueh larger population than what Madras State will have. This aspect will be discussed in detail later.

CHAPTER VI
MILK
Importance of milk
31. Milk is a vital constituent of food. In its natural state, it proximates to what constitutes an ideal diet. It contains easily assimilable fat, sugar, minerals, vitamins and enzymes in proper proportions and these constituents have definite functions in the human system. It can be easily digested. It is also a source of animal protein and as such is important to the population who live 011
vegetarian food. The people are getting used to tea or coffee, especially in the urban areas with the result that milk is an important item in allY household. In cities, one-third of the milk available is used in hotels and tea shops.
Production and consumption of milk
32. While in the past, milk was consumed as such or as dairy products, the present tendency is to use it in the preparation of tea, coffee, etc. The diversion in the use of milk has resulted in increased price, par~icutarly in urban areas. The production has failed to keep pace with the demand. Again, because of the high prices prevailing in urban areas, the tendency is to move milk from rural to the urban sector. The quantity of milk available for consumption in rural part has, therefore, fallen. In the case of milk, consumption per head per day (per capita and not per c. u.) has been calculated.
Table 6-1 gives the per capita daily consumption of milk in the various types of households surveyed.
TARLE 6-1
... Households in which beverages Per capita .,
-.0 consumption .:!! 8 are taken
I:; ;::l in ounces 1Zl!::
1. Twice in a day (B") 4.8
2. Once in a day (B 1 ) 2.5
3. From Hotel (B H) 0.7
4. Not even once in a day (Bo) 0.3
Difference between the per capita consumption in Be and B households is 2.3 ozs. The per capita
1 •
consumption in Bo is 0.3 oz. Generally, a quantity of 1.5 ozs. of milk is consumed every time a beverage
is taken. Normally, one oHock of milk (8 ozs.) is what is needed for five cups of beverages. So, out of the per capita consumption of 4.8 ozs. in Be households, 3 ozs. are consumed with beverages and the balance is used for either drinking as such or for converting into curd, ghee and buttermilk. Again, in a B[ househol d, out of 2.5 ozs. of milk, 1.5 ozs. are taken with beverages and the balance is used either as drink or for the preparation of dairy products. In BH and Bo households, the entire quantity of milk is consumed either as drink or in the form of dairy products. The per capita consumption of milk in a form other than beverage decreases gradually from B2 to Bo households. It is normal to expect this because the economic status of the household is usually indicated by the number of times coffee or tea is taken.
Table 6-2 gives the per capita consumption of milk in different types of households in the districts.
District
Madras
Chingleput
North Arcot
South Arcot
Salem
Coimbatore
Nilgiris
Madurai
Tiruchirapalli
Thanjavur
Ramanathapuram ...
Tirunelveli
Kanyakumari
State
* Th is is a rare case
TABLE 6-2
4.1
4.5
5.5
4.7
6.4
6.3
2.9 4.8
4.2
4.6
4.2
3.7 3.7
4.8
1.4
3.1 0.3
2.8 0.5
3.9
3.5 0.6
2.9 1.2 0.2
1.6 14.4*
3.0 1.4
2.9 0.6 1.5 0.6
1'3
1.7
2.5 0.7
0.3
0.1
0.4
0.8
1.0
0.2 0.6
0.2
0.3
1.1
0.1
0.3
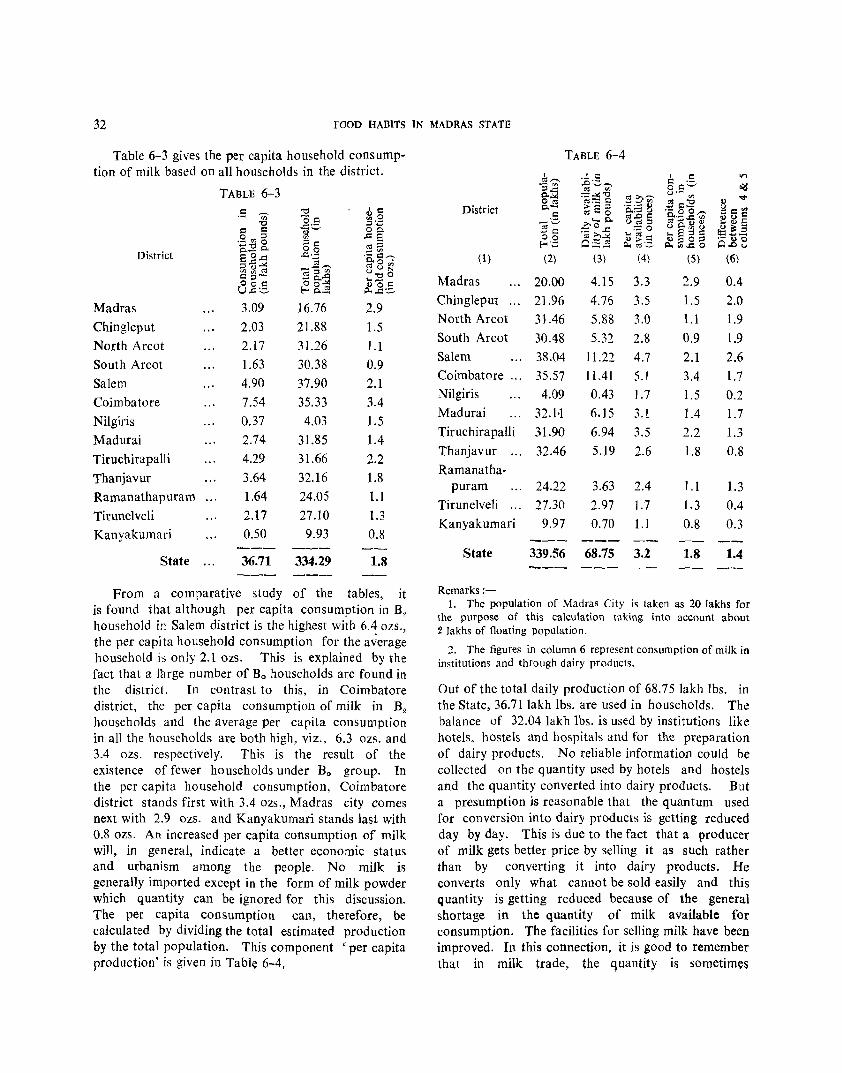
32 FOOD HABITS IN MADRAS STATE
Table 6-3 gives the per capita household consumption of milk based on all households in the district.
District
Madras
Chingleput
North Arcot
South Arcot
Salem
Coimbatore
Nilgiris
Madurai
Tiruchirapalli
Thanjavur
Ramanathapuram
Tirunelveli
Kanyakumari
State
TABLE 6-3
.5 ~ '0
$:l $:l
.g '" 5 a:9 ce°.<:: ;;;]~ Q;:IOOQ U.<:::.:::.
3.09
2.03
2.17
1.63
4.90
7.54
0.37
2.74
4.29 3.64
1.64
2.17
0.50
36.71
16.76
21.88
31.26
30.38
37.90
35.33
4.03
31.85
31.66
32.16
24.05
27.10
9.93
334.29
2.9 1.5
l.I 0.9
2.1
3.4
1.5
1.4
2.2
1.8
1.1
1.3
0.8
1.8
From a comparative study of the tables, it is found that although per capita consumption in B" household in Salem district is the highest with 6.4 OZS.,
the per capita household consumption for the average household is only 2.1 ozs. This is explained by the fact that a Huge number of Bo households are found in the district. In contrast to this, in Coimbatore district, the per capita consumption of milk in B2 households and the average per capita consumption in all the households are both high, viz., 6.3 OZ5. and 3.4 ozs. respectively. This is the result of the existence of fewer households under Bo group. In the per capita household consumption, Coimbatore district stands first with 3.4 ozs., Madras city comes next with 2.9 ozs. and Kanyakumari stands last with 0.8 ozs. An increased per capita consumption of milk will, in general, indicate a better economic status and urbanism among the people. No milk is generally imported except in the form of milk powder which quantity can be ignored for this discussion. The per capita consumption can, therefore, be calculated by dividing the total estimated production by the total population. This component 'per capita production' is given in Table 6-4,
District
(1 )
Madras
Chingleput
North Arcot
South Arcot
Salem
Coimbatore ...
Nilgiris
Madurai
Tiruchirapalli
Thanjavur '"
Ramanatha-puram
Tirunelveli " .
Kanyakumari
State
Remarks :-
TABLE 6-4
(2)
20.00
21.96 31.46
30.48
38.04
35.57
4.09
32.H
31.90
32.46
24.22
27.30 9.97
(3)
4.15
4.76
5.88
5.32
11.22 ll.4l
0.43
6.15
6.94
5.19
3.63
2.97
0.70
(4)
3.3
3.5
3.0
2.8
4.7
5.t
1.7
3.t
3.5
2.6
2.4
1.7
1.1
339.56 68.75 3.2
,!:: .5 OJ::'"'' U'''-' rn
.5~~ 's,.!2 ,g 'W' ~A~8 ... S::lj:: ~e;,gg
(5)
2.9 1.5
1.1
0.9
2.1
3.4
1.5
1.4
2.2
1.8
1.1
1.3
0.8
1.8
I/')
~ '<t'
gQ'" <I)"Q .... !Va ~~.= ;5.88
(6)
0.4
2.0
1.9
1.9
2.6 1.7 0.2
1.7
1.3
0.8
1.3
0.4
0.3
1.4
1. The population of Madras City is taken as 20 lakhs for the purpose of this calculation taking into account about 2 lakhs of floating population.
2. The figures in column 6 represent consumption of milk in institutions and through dairy products.
Out of the total daily production of 68.75 lakh Ibs. in the State, 36.711akh lbs. are used in households. The balance of 32.04 lakh Ibs. is used by institutions like hotels, hostels and hospitals and for the preparation of dairy products. No reliable information could be collected on the quantity used by hotels and hostels and the quantity converted into dairy products. But a presumption is reasonable that the quantum used for conversion into dairy products is getting reduced day by day. This is due to the fact that a producer of milk gets better price by selling it as such rather than by converting it into dairy products. He converts only what cannot be sold easily and this quantity is getting reduced because of the general shortage in the quantity of milk available for consumption. The facilities for selling milk have been improved. In this connection, it is good to remember that in milk trade, the quantity is sometimes

increased by the addition of water, notwithstanding the measures taken by the Government of Madras to check adulteration. Milk cannot always be purchased in its pure form in the city of Madras. According to a report of the Public Analyst, Corporation of Madras, over 65% of the samples of buffalo milk analysed were found adulterated, the percentage of added water varying upto 80%. The Public Health Department of the Government of Madras collected 6,275 samples of milk from two municipalities in Kanyakumari district and 19 panchayats in other districts. Of this, 2,690 samples, i.e., 42.9% were found adulterated. We have made a small allowance for this in our tables.
Dr. N. C. Agarwal has observed as follows: "Of all the statistics, the statistics of the trend of milk production in any part of the Indian Union, much less for the whole country are the most difficult to be obtained. Though the first All India Census of livestock was taken in 1919-20 yet even the last livestock Census of 1956 did not cover the whole country. Another great difficulty in knowing the trend of production of milk is that even if the exact number of cattle is known, we do not know exactly whether the yield per animal has either improved or remained stationary or diminished during the same period ". We will, however, make an attempt to estimate the milk production in the State in 1961. According to the livestock census of 1961, there are 3.65 million cows and 1.29 million she-buffaloes aged 3 years and above and 3.43 million goats in Madras State intended for breeding and production of milk. Cows and she-buffaloes form the chief source of milk in Madras State. As goats contribute a small percentage only, it has been omitted for the purpose of calculating milk production. No reliable data are available on the yield per animal in different regions. The State Animal Husbandry Department has calculated the total production by adopting the annual yield of a cow at 401 lbs.
MILK 33
and that of a she-buffalo at 5671bs. The National Council of Applied Economic Research in the , Economic Atlas of Madras State', has worked out the yield by assuming certain figures for each district. We do not know whether these figures are based on any sample test. We have, therefore, attempted to contact a number of persons working in the field and make local enquiries, so that the average yield per milch cow or she-buffalo in the district could be estimated. Table 6-5 is the result of our effort in this direction.
District
Madras Chingleput North Arcot South Arcot Salem Coimbatore Nilgiris Madurai TiruchirapaIIi Thanjavur Ramanathapuram Tirunelveli Kanyakumari
State
TABLE 6-5 ., ...... ~<2t8 ..= ...... ... O' ... bI)
~~ 0.8 0", '0 .,,,,~ ., -=~:-=~ ~ ;>., 8.0 u 21,557
341,996 465,407 554,977 819,280 555,200
35,194 499,197 506,828 540,988 294,443 265,554
41,890 -----4,942,511 -----
... o~ ., 0'" 0. 0 >, . .= "8 "'00 ~gg ~ -- "0 'g 0. ;>'-'"
~l5.~ _0l'O OlSO Ol~.!'! ::s.- ::s 000 ~;,::: c oro 0. ;.. S·-< < ._.
2,000 1.18 775 7.23 500 6.38 350 5.32 500 11.22 750 11.41 450 0.43 450 6.15 500 6.94 350 5.19 450 3.63 450 3.27 350 0.40
503 68.75
According to this table, Coimbatore district stands first with local daily production of 11.41 lakh Ibs. Salem follows with 11.22 lakh Ibs. Kanyakumari and Nilgiris have the lowest production capacities. Table 6-6 gives the demand and availability of milk in each district.
TABLE 6-6
District
(I)
Madras
Chingleput
North Areot
Daily produc-tion by milch Daily Total daily Daily household Daily Daily institutional
cattle inflow availability . consumption outflow consumption (Figures in lakh pounds)
(2) (3) (4) (5) (6) (7)
1.18 2.97* 4.15 3.09 1.00
7.23 4.76 2.03 2.47 1.75
6.38 5.88 2.17 0.50 2.00
"Includes milk supplied by Government and cooperatives.
Milk utilised for dairy Total milk products consumed
(8) (9)
0.06 4.15
0.98 4.76
1.71 5.88
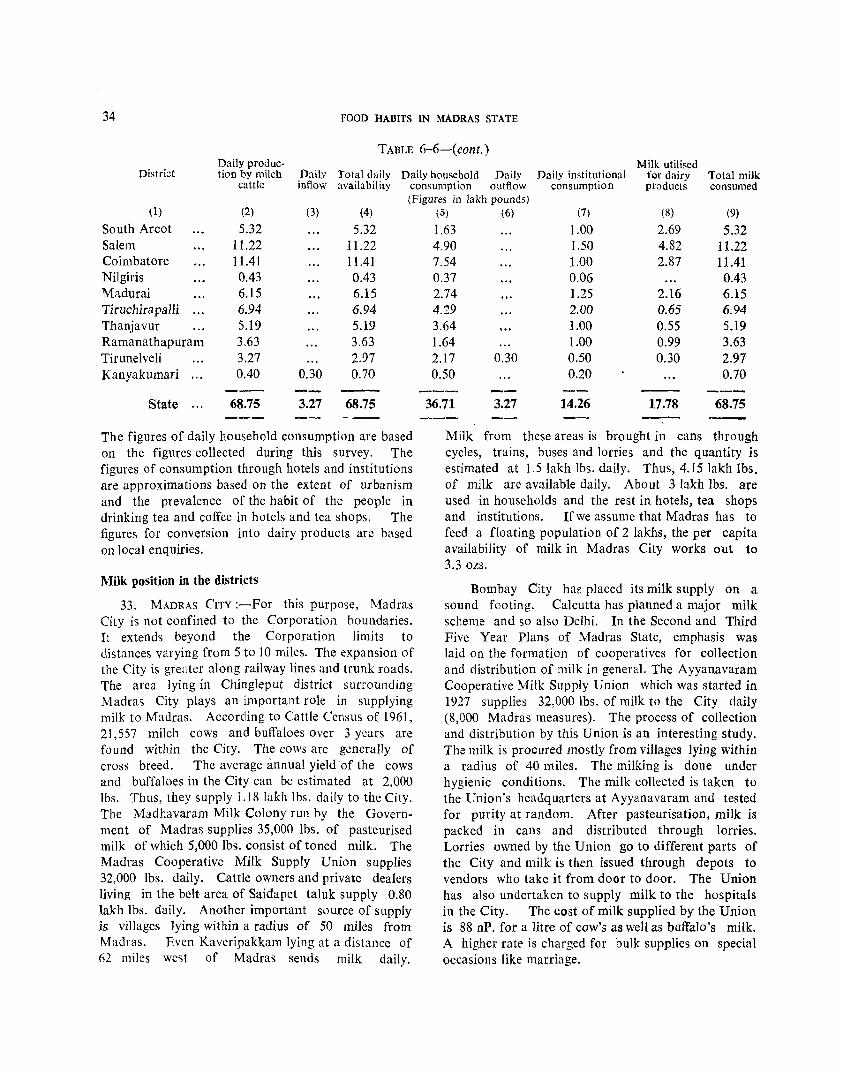
34 FOOD HABITS IN MADRAS STATE
TABLE 6-6-(cont.) Daily produc- Milk utilised
District tion by milch Daily Total daily Daily household Daily Daily institutional for dairy Total milk cattle inflow availability consumption outflow consumption products consumed
(Figures in lakh pounds) (1) (2) (3) (4)
South Arcot 5.32 5.32 Salem 11.22 11.22 Coimbatore 11.41 11.41 Nilgiris 0.43 0.43 Madurai 6.15 6.15 Tiruchira palli 6.94 6.94 Thanjavur 5.19 5.19 Ramanathapuram 3.63 3.63 Tirunelveli 3.27 2.97 Kanyakumari 0.40 0.30 0.70
State 68.75 3.27 68.75
The figures of daily household consumption are based on the figures collected during this survey. The figures of consumption through hotels and institutions are approximations based on the extent of urbanism and the prevalence of the habit of the people in drinking tea and coffee in hotels and tea shops. The figures for conversion into dairy products are based on local enquiries.
Milk position in the districts
33. MADRAS CITy:-For this purpose, Madras City is not confined to the Corporation boundaries. It extends beyond the Corporation limits to distances varying from 5 to 10 miles. The expansion of the City is greater along railway lines and trunk roads. The area lying in Chingleput district surrounding Madra,> City plays an important role in supplying milk to Madras. According to Cattle Census of 1961, 21,557 milch cows and buffaloes over 3 years are found within the City. The cows are generally of cross breed. The average annual yield of the cows and buffaloes in the City can be estimated at 2,000 lbs. Thus, they supply I.l8 lakh Ibs. daily to the City. The Madhavaram Milk Colony run by the Government of Madras supplies 35,000 lbs. of pasteurised milk of which 5,000 lbs. consist of toned milk. The Madras Cooperative Milk Supply Union supplies 32,000 Ibs. daily. Cattle owners and private dealers living in the belt area of Saidapet taluk supply 0.80 lakh lbs. daily. Another important source of supply is villages lying within a radius of 50 miles frolll Madras. Even Kaveripakkam lying at a distance of fi2 miles west of Madras sends milk daily.
(5) (6) (7) (8) (9)
1.63 1.00 2.69 5.32 4.90 1.50 4.82 11.22 7.54 1.00 2.87 11.41 0.37 0.06 0.43 2.74 1.25 2.16 6.15 4.29 2.00 0.65 6.94 3.64 1.00 0.55 5.19 1.64 1.00 0.99 3.63 2.17 0.30 0.50 0.30 2.97 0.50 0.20 0.70
36.71 3.27 14.26 17.78 68.75
Milk from these areas is brought in cans through cycles, trains, buses and lorries and the quantity is estimated at 1.5 lakh lbs. daily. Thus, 4.15 lakh lbs. of milk are available daily. About 3 lakh lbs. are used in households and the rest in hotels, tea shops and institutions. If we assume that Madras has to feed a floating population of 2 lakhs, the per capita availability of milk in Madras City works out to 3.3 ozs.
Bombay City ha~ placed its milk supply on a sound footing. Calcutta has planned a major milk scheme and so also Delhi. In the Second and Third Five Year Plans of Madras State, emphasis was laid on the formation of cooperatives for collection and distribution of milk in general. The Ayyanavaram Cooperative Milk Supply Union which was started in 1927 supplies 32,000 lbs. of milk to the City daily (8,000 Madras measures). The process of collection and distribution by this Union is an interesting study. The milk is procured mostly from villages lying within a radius of 40 miles. The milking is done under hygienic conditions. The milk collected is taken to the Union's headquarters at Ayyanavaram and tested for purity at random. After pasteurisation, milk is packed in cans and distributed through lorries. Lorries owned by the Union go to different parts of the City and milk is then issued through depots to vendors who take it from door to door. The Union has also undertaken to supply milk to the hospitals in the City. The cost of milk supplied by the Union is 88 nP. for a litre of cow's as well as buffalo's milk. A higher rate is charged for bulk supplies on special occasions like marriage.

MILK
With a view to improve the milk supply to the City, the Government of Madras have started a milk colony on a 630 acre plot in Madhavaram village, 7 miles north of the City. The object is to evacuate 4,000 heads of cattle from the City and settle them in the colony. 2,500 animals have already been moved. The cattle are housed in Government stalls. Free veterinary aid is given. The cattle owners live in houses built by the Government in the colony and pay a nominal rent. Green fodder required by the cattle is produced by the Corporation Sewage Farm near the colony at Kodingiyur. The Government have also developed a grass farm within the colony. The Government Milk Factory at Teynampet pasteurises the milk received from Madhavaram Colony and other rural areas. They also produce toned milk. This is bottled and distributed to the consumers in the City through a number of depots called kiosks located in important centres. This milk is sold at 76 nP. and 84 nP. per litre of cow's milk and buffalo's milk respectively. Toned milk is sold at 56 nP. per litre. A Central Dairy Plant is under erection at Madhavaram with aid from New Zealand. It is designed to handle 1.5 lakh lbs. of milk a day. To begin with, 40,000 lbs. of milk will be available for pasteurisation and later, this quantity will be increased to about 75,000 lbs. There is demand for getting supplies from the Government Milk Supply Project because of the consistency in quality. It will, therefore, be a happy day for Madras if the Government could eliminate all private milk vendors and be in a position to meet the entire demand of the City without any fall in standard. For this, they should double the capacity of Madhavaram farm and start two farms, one in the south and another in the west. In this connection, it is worth quoting the following recommendation of Dr. A. Lakshmanaswami Mudaliar Committee in 1953: "It is felt that in the first instance it is very urgent to see to it that cattle in areas in George Town, Washermanpet and Choolai and round about which are extremely congested are removed. Likewise the areas in Triplicane, Royapettah and surroundings are extremely congested. Roughly speaking, therefore, the colonies that are to be established at the outskirts of the City would be one in the Borth of Madras for the areas mentioned and one towards the south for the areas mentioned in the south. Later perhaps it may be necessary to have two more colonies in the outskirts of the City, for parts of the City round about Egmore, Komalees\varanpet, Mylapore, T. Nagar, etc." The
35
solution for the milk problem in Madras lies in increasing the production potential in the proximity of Madras rather than getting supplies from distant places like Erode and Ootacamund. It can never be held that tile per capita consumption in those places is satisfactory. The quantity of milk produced in Erode and Ootacamund is much needed by the local people. Those areas do not produce any surplus which can be exported to Madras. Thus, the basic approach to the problem should be not to divert milk from other areas, but to increase the local production. As an interim measure, till more farms are established on the lines of Madhavaram, production of toned milk can be increased. Toned milk is pure fresh buffalo milk, to which is added a certain quantity of skimmed milk with a view to reduce the percentage of fat content to about 3%, the other constituents of milk remaining the same. It is not quite popular in Madras City. It is used in large quantities by the Defence Department. It is popular in Bombay City where the intake of toned milk is 2 lakh lbs. a day. All the Government hospitals in Madras, Bombay and Calcutta use toned milk. It is a good substitute for cow's milk. In a tropical country like ours, there is not so much shortage of fat as of protein; toned milk thus provides a well balanced diet. Even in countries where milk is produced and consumed in large quantities, the percentage of fat is standardised. Denmark and Holland reduce the fat percentage in milk to 3.5 to 2.5%. In India it is not advisable to standardise the percentage of fat in all the milk produced, but there cannot be any objection in selling low fat milk as well as fresh cow's and buffalo's milk. The only precaution needed is that the production and distribution of toned milk should be under strict supervision; otherwise there will be great scope for adulteration. If this is done, toned milk can be expected to command a good market in Madt as City.
CH1NGLEPUT :-This district practically surrounding Madras supplies the bulk of the requirments of the City. Saidapet taluk produces enough milk net only for its suburban and industrial popUlation, but also for Madras City. The density of milch cattle over three years per 100 persons in the district is 16 and the yield per animal is comparatively high being 775 lbs. annually. In spite of the fairly high production in the district, the per capita household consumption is as low as 1.5 ozs. This is because

36 FOOD HABITS IN MADRAS STATE
of the fact that prices in Madras are so attractive that the owners of milch cattle prefer to send a considerable quantity to Madras rather than sell any portion of it in the local market. The district has plenty of grazing facilities and there is great scope for developing further the dairy industry. The milk trade is mostly handled by private persons. The milk cooperatives in this district handle only 7,000Ibs. daily. This is the lowest for all the districts except the smaller districts of Nilgiris and Kanyakumari.
NORTH ARCOT :-The density of milch cattle is 15 per 100 persons and the yield per animal is 500 Ibs. Although the total daily production is 6.38 lakh Ibs. about 2.17 lakh Ibs. are utilised in households, the per capita daily household consumption being as low as 1.1 ozs. A large section of the popUlation take their coffee or tea in shops. Approximately 2 lakh lbs. are used by hotels and tea shops. 50,000 Ibs. are sent to Madras. The balance is converted into dairy products. Milk cooperatives handle 25,000 lbs. daily. With large areas available for grazing, the scope for developing the milk industry in this district is immense. It needs improvement of the stock of milch animals.
SOUTH ARCOT:-Though South Arcot stands second in the State in density of milch cattle (18), the annual yield per animal in the district is the lowest (350 Ibs.). A quantity of 5.32 lakh Ibs. is produced daily of which only 1.63 lakh Ibs. are consumed in households. The per capita household consumption is as low as 0.9 oz. About one lakh Ibs. are utilised by hotels and other institutions and 2.69 lakh lbs. are converted into dairy products. Milk cooperatives handle 25,480 lbs. dailY·
SALEM :-Salem which produces 11.22 lakh Ibs .. daily stands second among the districts in the State in milk production. As regards density of milch cattle, the district comes first (22). The average annual yield per milch animal is 500 lbs. The per capita household consumption is 2.1 ozs. About 4.90 lakh Ibs. are used in households, 1.50 lakh lbs. in hotels and institutions and the balance of 4.82 lakh Ibs. are converted into dairy products. Manufacture of ghee is a thriving industry in the district. The Cooperative Societies handle 14,580 Ibs. of milk daily. Milk production can be improved considerably in the hilly areas like Yercaud and Kollimalai where there is plenty of grass and the climate is salubrious and
congenial for increasing the milk yield of cows and buffaloes. It is rather paradoxical to find that Yercaud with all its vast potentialities depends to a great extent on Salem town for its supply of milk.
COIMBATORE:- Next to Madras, Coimbatore district has got fairly good type of cattle. The average annual yield per milch animal in the district is 7501bs. The density of milch cattle is 16. This district which produces 11.41 lakh lbs. daily stands first in milk production. The per capita consumption of milk in households is 3.4 ozs. which is the highest in the State. This is due to the general high standard of living in the district coupled with the easy availability of milk. As much as 7.54 lakh lbs. are consumed in households, about one lakh lbs. by hotels and institutions and 2.87 lakh Ibs. by the manufacturers of dairy products. Coimbatore district is famous for its good quality ghee and Tirupur is a big centre for marketing these products. A quantity of 28,500 lbs. is handled by Cooperative Unions and Societies.
NILGIRIS :- This district produces 0.43 lakh lbs. of milk daily of which 0.37 lakh Ibs. are consumed by households and the rest by hotels and institutions. The per capita consumption of milk in households works out to 1.5 ozs. The density of milch cattle in the district which stands at 9 is rather poor. The average yield per milch cow (450 lbs.) is also poor. Actually, the climate of Nilgiris is ideally suited for the cows of the English type. The Cooperative Society at Ootacamund now handles 5,080 lbs. a day. If under the scheme formulated by the State Government, the intention is to bring milk to Madras from Ootacamund the production of milk in the district should necessarily be increased, so that the local population can have adequate supply of milk.
MADURAI :-In Madurai district, the density of milch cattle is 16 and annual average yield per animal is 450 lbs. Out of 6.151akh lbs. produced daily, 2.74 lakh lbs. are used in households, 1.25 lakh lbs. in hotels and institutions and the balance of 2.16 lakh lbs. for the manufacture of dairy products. The per capita consumption in households is 1.4 ozs. As in Nilgiris, milk production can easilY·be increased in Kodaikanal area. The Cooperative Union and Societies in the district handle daily about 26,100 lbs. In Madurai City, 13,800 lbs. of milk are supplied by the Madurai Cooperative Milk Supply Union. It
has 80 milk production centres from where milk is collected twice a day and pooled and transported to the City for distribution.
MILK
TIRUCHIRAPALLI :-This district produces 6.94 lakh lbs. of milk daily of which 4.29 lakh Ibs. are consumed in households, 2 lakh lbs. by institutions and the rest converted into dairy products. The per capita household consumption is 2.2 ozs. The density of milch cattle in the district is 16 and the annual yield per animal is 500 lbs. A quantity of 23,520 lbs. is handled by Milk Supply Cooperatives. There is much scope for improving the dairy industry in this district.
THANJAVVR :-In this district, the density of milch
cattle is 17 and annual yield per animal is 350 Ibs. A quantity of 5.19 lakh lbs. is produced daily of which 3.64 lakh Ibs. are utilised in households. About one lakh Ibs. are used by institutions and hotels and 0.55 lakh Ibs. for the manufacture of dairy products. Mayuram is noted for its quality ghee. The per capita consumption of milk in households is 1.8 ozs. The quantity of milk handled by the Cooperative Societies is 24,740 lbs. a day.
RAMANATHAPURAM :-The total quantity of milk produced daily in the district is 3.63 lakh lbs. The per capita consumption of milk in households is 1.1 ozs. The quantity of milk utilised in the households is 1.64 lakh lbs. About one lakh lbs. are used in hotels and institutions and the balance for converting into dairy products. The density of milch cattle in the district is 12 and the annual yield per milch animal is 450 lbs. The quantity handled by the cooperatives is 40,720 lbs. daily. This is the largest quantity handled by the Cooperative Societies in any district.
TIRUNELVELI :-Out of 3.27 lakh lbs. produced daily, 2.17 lakh lbs. are consumed by households. The per capita consumption of milk in households is 1.3 ozs. About 30,000 lbs. are transported from Tirunelveli and surrounding areas to Nagercoil and Cape Comorin which are deficit in milk. The density of milch cattle is 10 and the average annual yield per milch animal is 450 lbs. The high per capita
31
consumption, despite low production, shows that the people of this region have the desire and the purchasing power to consume milk. It is, therefore, necessary to see that steps are taken to improve the milking strain of animals and the density of milch cattle. The Cooperative Unions and Societies handle daily 28,360 lbs. of milk.
KANYAKUMARI :-Barring Madras City, Kanyakumari district has got the lowest density of milch cattle (4) in the whole State. The average yield per animal is also low (350 lbs.). The total quantity of milk produced in the district is only 40,000 lbs. whereas the daily household consumption is 50,000 lbs. The district gets about 30,000 lbs. of milk from Tirunelveli to meet the household and institutional consumption. The per capita consumption in households which is 0.8 oz. is the lowest in the State. A quantity of 20,000 lbs. IS used in hotels and institutions. The Cooperative Societies handle daily 5,240Ibs.
The need for increasing consumption
34. The per capita availability of milk and its products in India is 6 ozs. per head. It is stil1lower in Madras, 3.20zs. According to our survey, the per capita consumption in households is only 1.8 ozs. The per capita consumption of milk in the European and American countries ranges from 33 to 56 ozs. The low consumption of milk in India in general and in Madras in particular, is due to the low yield of milch cows. Actually, India has a third of the world's cattle population, but the average annual yield of an Indian cow is 400 lbs. as against a yield of 3,000 to 7,500 lbs. in foreign countries. With a view to expand dairying and milk supply, some schemes have been implemented in the First and Second Five Year Plans. Under the Third Plan, a provision of Rs. 275 lakhs has been made for dairying and milk supply in Madras State. The outlay in the Second Plan under this head was Rs. 117.4 Iakhs. The details of the outlay and physical targets proposed for the Third Plan are given in Table 6-7.

38 FOOD HABITS IN MADRAS STATE
TABLE 6-7
Physical targets ,---------~---------~
Name of Scheme
(1)
I. Madras Dairy and Milk Project (spill over scheme)
2. Expansion of Madras Dairy and Milk Project
3. Loans [or purchase of milch animals-
(a) Madras Project
(b) Co-operative Sector
4. New Milk Schemes-(a) Tiruchirapalli and ')
h . I
T anJavur ~
(b) Madurai Milk Scheme I (UNICEF Project). J
5. Expansion of existing milk supply societies
6. Establishment of Co· operative Salvage Farms
7. Establishment of Butter-cummilk powder factory
8. Establishment of cattle feed manufactu~ing centres
9. Removal of milch animals from urban areas ,
10. Rural Dairy extension services
11. Training of dairy personnel
12. Dairy development staff and Milk Board
13. Survey, Statistics and Research.
14. Outlay on schemes included in the Second Plan but not continued in the Third Plan
67.21
30.38
3.04
16.71
59.17
40.00
10.00
59.50
53.30
8.79
5.53
15.00
5.71
1.00
10.00111
2.00
4.00
1.00
Total 117.40 275.00
r Units --{ Cows L Central Diary r Chilling Plants I Milk depots
Unit
(4)
I Insulated vans i Rearing of calves I Milk collection centres L Milk from Erode (lbs. per day) ... r Societies I Unions
i Average production of milk L per day in Madras measures
')
I r Plants
J ( Vans I Chilling plants ! Plants for by products
-< Drop in milk coolers I Milk Testing Units I Lambrettas/Three Wheelers L Sterilisation units
Farms
Factory
Centres
Colony
'" Includes provision for establishment of propaganda unit.
Second Plan
achievements
(5)
4 2,000
1
287 2
60,000
3 1
10
12
4
Third Plan
targets (6)
4 2,000
10 400
25 2,000
50 50,000
150
90,000
3
2 5 1 1 5 1 5
8

One important scheme under the Second and the Third Plans is the milk supply scheme for the City under which the Madhavarm Milk Project was developed. In the Third Plan, 400 milk depots will be established in the City for the distribution of milk produced by the Central Dairy which will have a capacity of 1.5 lakh lbs. of milk a day. As a subsidiary to Madras Milk Project, the following schemes are to be undertaken during the Third Plan period.
(1) In order to enable collection, processing and transport of 50,000 lbs. of milk from Erode to the City, a processing plant is to be erected at Erode. The plant and the rail tankers are expected to cost Rs. 30 lakhs.
(2) Fifty milk collection centres are proposed to be established in the rural areas adjoining Madras City at an overall cost of Rs. 10 lakhs.
(3) A provision of Rs. 10 lakhs has been made for giving loan assistance to the cattle owners in the Madhavaram Colony and the producer members in the Milk Supply Cooperatives.
Milk Supply Cooperatives are the chief agencies which organise supply of milk in areas outside the City. At the end of March 1961, 915 Cooperatives and 21 Unions functioned in the State of which 287 Cooperative Societies and 2 Unions were established during the Second Plan period. The Third Plan has programmed to organise an additional 150 milk supply societies in the State. Already, there are 1,172 societies which indicates that the target of the plan in the formation of milk supply societies has been achieved. A scheme has been drawn up to grant medium term loans to the members of Milk Cooperative Societies for the purchase of pure breed heifers. A sum of Rs. 8.79 lakhs has been allotted for giving assistance to the existing societies for expanding their activities. Two pasteurisation plants have been installed during the Second Plan period, one by the Kodaikanal and the other by Coimbatore Milk Supply Unions. During the Third Plan, two more such plants will be set up by the Milk Supply Unions at Tiruchirapalli and Thanjavur. In addition to these, with the assistance from UNICEF, a pasteurisation plant will be installed by the Madurai Milk Supply Union at a cost of Rs. 48 lakhs. The total outlay of this scheme will be Rs. 53.30 lakhs. The Third Plan has fixed a target of 90,000 Madras measures per day as the average production of milk in the State through cooperatives.
MILK
District
Madras Chingleput
North Arcot
South Arcot
Salem
Coimbatore Nilgiris
TABLE 6-S
Madurai
Tiruchira palli
Thanjavur
Ramanathapuram
Tirunelveli
Kanyakumari
State
Quantity (in Madras Measures)
7,000
1,750
6,250
6,370
3,645 7,125
1,270
6,525
5,880
6,185
10,180 7,090
1,310
10,580
39
As may be seen from Table 6-8, the production by the end of June 1962 has reached nearly 71,000 Madras measures. Provision has also been made in the Third Plan for establishing salvage farms, fodder farms, cattle feed manufacturing centres, butter-cum-milk powder factory, rural dairy extension services, training of dairying personnel, dairy development staff and milk board, survey, statistics and research. It is also proposed to establish colonies on the outskirts of each major town. Steps should also be taken to improve the stock of milch animals. As early as 1950, Captain U.K. Menon, the then Dairy Development Officer, Madras, had observed as follows: "Another peculiar feature of this province is that all its existing breeds of cattle were bred for work and not for milk. Centuries of a breeding policy adopted to produce better type work cattle have no doubt resulted in producing some of the finest draught and work animals in the world, but only at the expense of the milk capacity of the heifers". This observation will hold good even today. With Madras State standing first in rural electrification, almost all the irrigation wells are either fitted with electric pump sets or can be fitted in due course. Mechanised ploughing and lorry traction are also becoming more popular. 80 the use of draught animals in future agricultural practices can be reduced. It is, therefore, appropriate to think of schemes for improving the stock of milch animals on an extensive scale.

40 FOOD HABITS IN MADRAS STATE
According to nutritional experts, 100zs. of milk per adult per day constitute the minimum needed in a normal diet of an individual. At this rate, Madras State wlll require about 160 lakh lbs. of milk daily for its present population. The level of production is only 68.75 lakh lbs. This additional production will involve intensive planning followed by speedy implementation. The Madras Government has laid down that each Tamil New Year's day is to be observed as More Milk Day. Free distribution of milk to children is arranged on these days. This step is intended to induce people to drink more milk. But its utility is limited unless milk is produced in adequate quantities. Dr. W. R. Aykroyd and Sri B. G. Krishnan who conducted a survey in South Indian villages during the pre-Independence days had observed that out of 44 households, 31 households did not consume any milk. The position has not improved since that survey. In the present survey we have observed that 71 % of the households do not take any milk. This is attributed to two factors-the low purchasing capacity of the people and the poor availability of milk. While the purchasing capacity of the people can be increased by raising the standard of living through the Five Year Plans, the availability of milk should be augmented by the following measures.
(1) Eliminating all useless, decrepit animals which are only a liability on the farmers rather than an asset.
(2) Increasing the milk yield of the animals by a bold policy of extensive select breeding and better feeding of the animals.
(3) Devoting more Key Village Centres to development of milch animals in preference to development of draught animals.
(4) Making the dairy industry sufficiently remunerative.
(5) Organising better and quicker distribution of unadulterated milk through Government and cooperative agencies.
(6) Preventing the attempt to augment supply by the universal method of adding water, by sterner administration of adulteration laws.
(7) Erecting a larger number of pasteurisation plants in suitable centres.
It should also be realised that milk is a necessity and not a luxury and much headway has to be made in Madras State because the availability of milk is 3.20zs. per capita or 3.85 ozs. per adult as against the optimum desired level of 10 ozs. per adult.

CHAPTER vIr
SUGAR AND JAGGERY
Use of sweet products
35. Ancient Tamil literature has classified food tastes into six categories, of which sweetness is considered the best. The people of Madras State, however, prepare sweet dishes only on festive occasions. Sweets do not form part of the daily food ~ven in high class families. In rural Madras, Pongal festival is perhaps the only occasion when sweets are prepared. As such, a sweet dish is an item of luxury. The per capita consumption of sugar and jaggery in Madras State is therefore, much lower than in North India. In recent years, however, people have been taking tea and coffee in larger quantities with the result that the per capita consumption is increasing in this State. Refined sugar and cane-jaggery are made from sugarcane and palm-gur from the palm trees of coconut, palmyra and to a small extent from date-palms. In olden days, sugar-cane grown in the State was used either for chewing in its raw state or for the preparation of jaggery. With the establishment of sugar mills in Nellikuppam, Pugalore and other places, a small part of the sugar-cane is used for the manufacture of sugar. Today, eight mills are working in the State, the maximum capacity of production heing two lakh tons of sugar. They utilise 20~:) of the sugar-cane produced.
Production of sugar-cane
36. The area under sugar-cane production
and the quantities of canc produced for the year
1960-61 in the districts of Madras State are given
in Tahle 7-1.
TABLE 7-1
Area under Quantity of sugar-District sugar-cane cane produced
(acres) (in ton~)
Madras
Chingleput 3,474 108,090
North Arcot 39,284 1,154,950
South Arcot 34,234 1,072,160
Salem 23,076 654,390
6
TABLE 7-1--(cont.)
Area under District sugar-cane
(acres)
Coimbatore 43,097
Nilgiris 4
Madurai 12,643
Tiruchirapalli 26,140
Thanjavur 9,274
Ramunathapuram 8,161
Tinmelveli 1,068
Kanyakumari
State 200,455
Quantity of sugarcane produced
(in tons)
1,528.540
80
381,550
820,400
227,970
232,590
30,760
6,211,480
The total prod uction of sugar-cane is 62 lakh tons. About 14 lakh tons are utilised by the sugar factories; 5 lakh tons are used for eating and as seedlings. The balance of 43 lakh tons is utilised by people for manufacturing 4.5 lakh tons of jaggery.
Manufacture of jaggery and sugar
37. Preparation of jaggery from sugar-cane juice is a time-honoured cottage industry still in vogue. The Kandasari method of preparation of sugar was introduced in recent years, but it has not made much headway _ It is estimated that 2 lakhs of people arc engaged in jaggery manufacture. The total production of cane jaggery in the State in 1960-61 was 4.5 lakh tons. A quantity of 1.5 lakh tons was exported to other countries like Ceylon, Singapore and Malaya. Three lakh tons are used mainly by the lower income groups which work out to a per capita consumption of 0.87 ounces. It is used for sweetening beverages like coffee and tca and for making typical South Indian dishes like Panga!, Sweet Appalam, Puttu, Kacchayam, Payasam, etc. Though white sugar is slightly costlier than jaggery it is replacing the latter in many homes. This is the consequence of the tendency of people to take to tea and coffee. The production of white sugar has also increased as can be seen from Table 7-2.

42 FOOD HABITS IN MADRAS STATE
TABLE 7-2
Year
1957-58
1958-59
1959-60
1960-61
1961-62
Production of white sugar (in tons)
67,961
73,621
84,141
129,394
118,840
The fall in production in 1961-62 is due to a 10% cut imposed on sugar factories during that year. The production in the State cannot, however, govern the internal consumption because the issues from sugar mills are controlled by the Government of India and periodical releases only are permitted. About 20,000 tons of sugar produced in this State are diverted to Kerala and in turn, Madras gets about 45,000 tons from North India, and also Andhra and Mysore States.
Consumption of sugar
38. The internal consumption in the State (based on the average releases made during the period July to September 1961) is in the order of 1.42 lakh tons annually. Our survey has revealed that household consumption in the State is 66,826 tons. The district-wise break-up of this figure is given in Table 7-3.
TABLE 7-3
District
Madras
Chingleput
North Arcot
South Arcot
Salem
Coimbatore
Nilgiris
Madurai
Tiruchirapalli
Thanjavur
Ramanathapuram
Tirunelveli
Kanyakumari
or roughly
Annual household consumption
(in tons)
11,453
5,141
4,652
4,867
5,562
13,414
104
4,829
5,624
3,870
2,586
3,968
756
66,826
0.67 lakh.
The balance of 0.75 lakh tons is apparently used by hotels, coffee and tea shops, hostels, confectioneries and bakeries. It is not possible to determine the quantity consumed by each of them.
In our survey, data were collected oniy on white sugar. As in the case of milk, consumption per head per day (per capita and not per c.u.) has been calculated. The per capita household consumption in the various districts is given in Table 7-4.
TABLE 7-4
District Per capita household consumption of sugar
(in ounces)
Madras Chingleput North Arcot South Arcot Salem Coimbatore Nilgiris Madurai Tiruchira palli Thanjavur Ramanathapuram Tirunelveli Kanyakumari
State
0.7 0.2 0.1 0.2 0.1 0.4 0.03 0.1 0.2 0.1 0.1 0.1 0.1
0.2
It varies significantly from district to district. It was found that the intake of white sugar depended upon status. Classified by occupational statuses, the per capita consumption is as shown in Table 7-5.
TABLE 7-5
'"@
.S . Type of households coming '(;j ~ under the category c. .... :::I~ u .... u Vl
o A Nen-working cultivators, money-
lenders, etc. B Working cultivators C Agricultural labourers and coolies ... o Village artisans, etc. E Industrial workers, etc .... F Weavers G Small traders H Salaried persons like teachers. clerks,
etc. I Peons, postmen, etc. . .. J Others not covered above
1.3 0.1 0.03 0.1 0.4 0.1 0.3
0.6 0.2 0.6

SUGAR AND JAGGERY 43
From the above, it will be seen that the per capita consumption among category A is the highest with 1.3 ounces; among the agricultural labourers, it is the lowest with 0.03 ounce. The per capita consumption among the salaried class of clerks, etc., is next to category A and that of industrial workers is fairly appreciable. The per capita consumption on the basis of incomc groups is given in Table 7-6.
TABLE 7-6
Income group (monthly) Rs.
0- 25 26- 50 51- 75 76-100
101-150 151-200 201-400 401 and above Not stated
Daily per capita consumption of sugar
(in ounces)
0.03 0.07 0.14 0.31 0.41 0.58 0.68 1.65 0.05
The survey also revealed that the regular use of white sugar was confined to only 24% of the households in the State. The percentages of households using sugar in the various districts are given in Table 7-7.
District
Madras Chingleput North Arcot South Arcot Salem Coimbatore Nilgiris
TABLE 7-7
Madurai Tiruchira palli Thanjavur Ramanathapuram Tirunelveli Kanyakumari
State
Percentages of households using sugar
56 30 27 21 22 36 4
17 25 18 13 19 16
24
The use of white sugar in the households is generally for sweetening beverages like coffee and tea. This is reflected in the increased per capita consumption in the households which take beverages like coffee, twice or once everyday.
TABLE 7-8
Category
Be Households which take beverages twice daily 0.67
B j Households \\hich take beverages once daily 0.22
Bo Households which do not take beverages even once 0.02
BII Households which take beverages in hotels 0.07
Palm-gur
39. Besides sugar and jaggery, palm-gur is used on a limited scale, mostly in rural parts. After the introduction of prohibition in the State, extraction of Neera from palm trees is controlled and is confined mostly to palmyra trees. The extent covered by palmyra is approximately 57,520 acres. The manufacture of palm-gur is the monopoly of the co-operative sector. The quantity manufactured for the last 5 years is shown in Table 7-9.
Year
1956-57 1957-58 1958-59 1959-60 1960-61
TABLE 7-9 Production
(in lakh pounds)
614 649 651 611 643
On an average, 28,000 tons of palm-gur are produced every year in Madras State. Out of this, 1,000 tons are exported in the form of jaggery powder, palm-candy, molasses, etc., to Ceylon and Malaya. About 4,500 tons are annually imported from Kerala and Andhra Pradesh. Out of this imported quantity, 3,000 tons are utilised for industrial purposes like tobacco curing, oil pressing, etc. Thus, about 28,000 tons are used by the people as food which works out to a per capita consumption of 0.08 ounce per head.
The per capita consumption of sugar, cane-jaggery and palm-gur in Madras State works out to 1.35 ounces against the optimum level of 1.52 ounces (i.e., 2 ounces per adult). It is possible to provide sugar in quantities needed for an adequate and balanced diet.

CHAPTER VIII
PULSES
Nutritional value of pulses
40. Dhal which is commonly known as Paruppu is an important ingredient of food in Madras State. Whether the people know its nutritional value or not, they have given it an important place in their daily diet. Actually, no feast will be given in Madras State without dhal. According to experts in nutrition, dhal contains a high proportion of proteins. Dr. W. R. Aykroyd records in the Health Bulletin No. 23, that proteins present in the
various food differ in their amino-acid composition; amino acids are the bricks with which tissue protein is built and replaced, and the more closely the aminoacid make-up of a protein resembles that of the tissues, the greater is its value. The efficiency with which tissues can be replaced by food protein is termed the biological value of the food protein. Pulses are in practice a substitute for meat. Table 8-1 gives the food value of important pulses and for mutton which is the most common form in which flesh is taken.
TABLE 8-1
Protein
Items contents Fat (percent) (percent)
(1) (2) (3)
Red gram 22.3 1.7
Bengal gram 17.1 5.3
Black gram 24.0 1.4
Green gram 24.0 1.3
Field beans 24.9 0.8
Horse gram 22.0 0.5
Mutton 18.5 13.3
For protein contents, pulses are superior to mutton. But actually, the proteins derived from vegetable foods are of less value to the human body than those derived from animal foods, because the digestibility of the latter is more. A diet should, therefore, consist of a mixture of vegetable and animal proteins. The nutritional experts have recommended that 3 ounces of pulses and 3 ounces of flesh should be taken for a balanced diet.
Poor consumption in the State
41. According to our present survey, the level of daily consumption of pulses is 1.67 ounces per c. u. among vegetarians and 1.20 ounces among nonvegetarians. The average level of consumption is, however, 1.28 ounces per c. u. By any standard, the level of consumption of pulses in Madras State is low. Even within India, the people in the north consume pulses in larger quantities than the people in this State. Low consumption of pulses in this
Mineral Biological Digestibility matter Carbohydrates value of coefficien t
(percent) (percent) protein (percent) (percent)
(4) (5) (6) (7)
3.6 57.2 72 75
2.7 61.2 74 82
3.4 60.3 63 80 3.6 56.6 54 85
3.2 60.1 49 70
3.1 57.3 59 not known
1.3 60 100
State in ~pite of its importance in feasts can be attributed to inadequate production of pulses.
Production of pulses
42. The extent cultivated and the quantity of pulses produced in the State during 1960-61 are given in Table 8-2.
TABLE 8-2
Pulses Extent Yield (in acres) (in tons)
Bengal gram 3,328 720 Green gram 117,777 11,750
Red gram 138,798 25,170
Black gram 103,085 13,450
Horse gram 529,794 46,540
Other pulses 161,026 13,400 ----- _----
Total 1,053,808 111,030 ---- ----
PULSES 45
The other pulses consist mostly of field beans (mochai), flat gram (thattai pay;r) and dew gram (nari payir). As thcse pulses are grown as rain-fed crops in different types of soils, ger,erally mixed with others, the yield is comparatively low. Thus, the State is highly deficit in pu1ses. It imports large quantities of pulses like bengal gram, red gram, black gram, peas and their products from other States of India-Rajasthan, Punjab, Madhya Pradesh, Uttar Pradesh, Maharashtra, Mysore and Andhra Pradesh. Against a local production of 1.11 lakh tons, the State has to import every year 4 lakh tons of pulses to meet its total requirements.
Mode of consumption of pulses
43. Before we attempt a determination of the State's requirements of pulses at the present level of consumption, it may oe desirable to indicate how the pulses are consumed by the people of this State.
Red gram :-This is a popular variety used by the higher classes. The whole gram is converted into dhal before it is used. Dhal is prepared by wet or soaking process. There is a tendency to split the dhal in the raw stage. This is cheaper. The prejudice against using raw split dhal is disappearing. The important centres in which processing is conducted are Madras, Tuticorin, Virudhunagar, Madurai, Tiruchirapalli, Coimbatore, Salem, Tiruppattur, Vellore and Vallam. The preparations made out of red gram dhal or Tool' dhal as it is commonly called, form a delicious addition to rice. This variety is therefore, consumed by rice-eaters. The dhal is first cooked for a long time in sufficient quantity of water. When the boiled grains begin to crumble and dissolve, the water containing all the soluble vitamins in the dhal, is decanted and used for making rasam. Thc cooked dhal is used for preparing sambaI' or is taken as paruppu. At times Toor dhal is ground into a paste 'With spices after wetting it and vadais or cutlets are prepared.
B.?nga/ gram :-It is produced only in small quantities in Madras State. The demand for its products is, however, so great that it forms 60% of the imports into the Slate. Bulk of the gram imported is converted into parched (split) gram. A small portion is converted into raw dhal. A portion of raw dhal is converted into flour. It is also consumed as whole gram. It is used in making sausages with vegetables. Bengal gram dhal is used for side-dishes
as well as for making cutlets. It is largely used in the preparation of sweetmeats and savouries, mostly in hotels, coffee-clubs and restaurants. The parched (split) gram is eaten with puffed rice by the poorer classes. It is also used for making chutney or for preparation of cutlets. Manufacture of parched gram is an important cottage industry in places like Karur, Erode, Tiruchirapalli, Virudhunagar, Salem, etc.
Black gram :-It is split and de husked before consumption. It is a necessary ingredient in the preparation of /ddlies and Dosais which are quite popular in the State. Its flour is used in the preparation of Appalams. The paste prepared out of this dhal is used for making Vadais and lelabis. The dhal is used in small quantities for flavouring savoury preparations along with mustard seeds.
Green gram :-It is cooked either as whole gram or used as dhal in making side-dishes. Though its preparations are tasty, they are not so much in use as red gram in high class families. Fried green gram dhal is used in a delicious preparation called Payasam.
Mochai or field beans:-When it is green, it is used as vegetable. Ripe beans are eaten after boiling and spicing.
Horse gram :-The use of this gram is mostly in rural parts. Dishes made out of this could be combined with millet meals. A small portion is used to feed horses after boiling.
Consum pHon level
44. From the above discussion, it will be seen that except parched gram which is used both by rich and poor, red gram, black gram and bengal gram are used mostly by people in high income groups and the other varieties by people of low income groups. Varieties of pulses with protein contents of high biological value are mostly used by people in high income groups and consequently, pulses with protein contents of low biological value are only used by those in low income groups.
Apart from this, the level of consumption is also high among high income groups than the low income groups. Table 8-3 gives the consumption of pulses per consumption unit in the various income groups.

46 FOOD HABITS IN MADRAS ST ATE
TABLE 8-3
Income group (Monthly)
Rs.
0-25
26-50
51-75
76-100
101-150
151-200
201-400
401 and above
Not stated
Daily consumption of pulses per consumption
unit (in ounces)
0.92
1.06
1.31 1.58
1.52
1.53
1.92
2.01
1.17
Just as there is variation in the quantity of pulses consumed by persons in different income groups, the level of consumption is found to differ appreciably from district to district. Table 8-4 shows the level of consumption in the households as revealed by our survey.
TABLE 8-4
District
Madras
Chingleput
North Arcot
South Arcot
Salem
Coimbatore
Nilgiris
Madurai
Tiruchirapalli .,.
Thanjavur
Daily household consump
tion per consumption
unit (in ounces)
1.4
1.1
1.2
0.6
1.9
2.2
0.7
1.5
1.3 1.0
Ramanathapuram 0.9
Tirunelveli 1.2
Kanyakumari ... 0.6
State 1.3
Total annual consumption
in households
(in 000 tons)
18.14
18.04
27.30
13.65
53.78
61.78
2.00
37.13
30.88
24.03
16.08
25.27
4.22
332.30
Local production
(in 000 tons as in 1960-
1961)
1.45
12.82
5.98
28.46
20.09
6.31
9.95
7.62
5.61
11.81
0.93
111.03
This table indicates the extent to which each district is deficit in pulses as far as household consumption is concerned. In addition to this, districts should have sufficient supplies for meeting the demand in hotels and coffee-clubs and of parched
gram manufacturers_ The State Marketing Officer has estimated that approximately 1.2 lakh tons of bengal graJIl are used in the State for the manufacture of parched gram.
Supply and consumption
45. We may now indicate the overall position of pulses in the State.
TABLE 8-5
Quantity Source of Availability (in lakh information
tons)
1. Local production 1.11 Season & Crop Report, 1960-61.
2. Import by rail 4.07 State Marketing Officer, Madras.
3. Import by coastal shipping. 0.02 do
5.20
4. Less export by rail to other States. 0.24 do
5. Less seed req uire-ments. 0.06
6. Net quantity available for consumption within the State. 4.90
Consumption
1. By households. 3.32 Survey results.
2. By hotels, coffee-clubs, etc. 0.38
3. By manufacturers of parched (split) gram. 1.20
4.90
Estimate.
State Marketing Officer, Madras.
Whereas the level of consumption in the households is 1.3 ounces per consumption unit, the availability is 1.9 ounces per consumption unit, provided the imports are maintained at the level found in 1957-58 to 1959-60. The following table gives the quantities of different pulses imported, States from where imported and the season of import:

PULSES 47
TABLE 8-6. TABLE 8-6-(cont.)
Approximate States from Approximate states from Variety quantity where Season of Variety quantity where Season of
imported imported import imported imported import (in tons) (in tons)
1. Bengal 169,000 Andhra Pradesh March to 4. Green 3,500 Madhya Pradesh, March to gram and Madhya May. gram. Uttar Pradesh, June.
Pradesh. Maharashtra
2. Red gram 48,000 Uttar Pradesh, February and Andhra
Maharashtra, and March. Pradesh.
Madhya Pradesh, and Andhra Pradesh.
3. Black 55,000 Uttar Pradesh, January and gram Madhya Pradesh. April to ----
and Andhra June. Total 275,500 Pradesh. ----

CHAPTER IX
NON-VEGETARIAN FOODS
Vegetarianism
46. In India, vegetarianism is generally associated with caste system. But, no general rule exists to regulate food among different castes. It has changed from time to time and from locality to locality. While Brahmins in some parts of North India eat meat and Brahmins of Bengal and Kongan eat fish, Brahmins of South India are strict vegetarians. Again, nonBrahmins belonging to the Saivite cult in South India have been zealous vegetarians from ancient times. It is even believed that the cult of vegetarianism is Dravidian in origin and has been practised by the Brahmins of South India only after coming to south. A few other non-Brahmin castes do practise strict vegetarianism to indicate superiority over other castes.
The western countries generally regard India as a stronghold of vegetarianism in the world. To my mind, the positi'Jn is somewhat exaggerated. Only a small minority in India are strict vegetarians. The late Shri R. K. Golikere in his hook "Vegetarianism Vs. Non-Vegetarianism" has estimated the proportion of vegetarians at less than 15%. It is a general belief that South India, especially Madras State has more vegetarians than other States in the north. Our sample survey reveals that in Madras State, the proportion of vegetarians is only 7%. Even among this 7%, some take eggs. It does not refer to those who are in practice non-vegetarians but are known as vegetarians. Perhaps, the percentage of vegetarians in the whole ofIndia cannot be as high as 15.
Percentage of vegetarians
47. In Madras State, the 7% of vegetarians consist of the Brahmins (who form 3% of the population) the Jains, the Thondamandala Vellalas, the Saiva PiIIaimars of Tirunelveli, the Karkatha Vellalas, the Arya Vaisyas and a few Chettiars. There are also some households who profess vegetarianism by choice. Toda is the only tribe practising vegetarianism. All Scheduled Castes are non-vegetarians. Districtwise, the percentage of vegetarians in the State is given in Table 9-1,
TABLE 9-1
District Percentage of vegetarians
Madras
Chingleput
North Arcot
South Arcot
Salem
Coimbatore
Nilgiris
Madurai
Tiruchirapalli
Thanjavur
Ramanathapuram
Tirunelveli
Kanyakumari
State
14
8
10
6
G
5
3
5 8
5
11 3
7
The percentage of vegetarians in the various communities covered by our survey is given in Table 9-2.
TABLE 9-2
Community Percentage of Percentage of
Non-vegetarians Vegetarians
Asari 89 11 Badaga 100 Banajiga 100 Boyar (Oddar) 100 Brahmin 100 Chettiar other than
Komutti Chettiar and Nattukottai Chettiar 90 10
Christian 100 Devanga 97 3 Jain 100 Janguma Pandaram 100
Komutti Chettiar (Aryl), Vaisya) 100
Kshatriyas 100 Kurumba Gounder 100 Maharashtra 78 22 Mannadiyar IOO
NON-VEGETARIAN FOODS 49
TABLE 9-2-(cont.)
Community Percentage of Percentage of Non-vegetarians Vegetarians
Mukkulathor 97 3 Muslim 100 Muthuraja 100
Nadar (Shanar) 98 2 Naidu 98 2 Nattukottai Chettiar 71 29 Navithan 98 2 Okkaliga 100 Pillai 100 Reddiar 92 8 Saiva Pillai 100 Saurashtra 76 24 Scheduled Castes 99 Scheduled Tribes 100 Sengunthar 98 2 Sembadavan 100 Soli a Vellala 100 Thondamandala Vellala 100 Thuluva Vellala 100 Udaiyar 96 4 Uppiliyar 100 Valaiyan 100 Vannan 100 Vanniyar 98 2 Vellala Gounder 96 4 Vettuva Gounder 100
Yadhava 97 3
In spite of these facts, the belief is widespread that there is a large percentage of vegetarians in Madras State. It may be due to the fact that the mobile and intelligent sections of the communities of this State who are known outside the State are vegetarians. A number of non-meat days and non-meat months are practised by many Hindu non-vegetarian communities on grounds of religious and social restrictions. The general absence of good non-vegetarian hotels in the south can give a visitor the impression that only vegetarian food is consumed in Madras. State. The intake of protein, especially animal protein is low in India as can be seen from Table 9-3. Protein contents of pre-war and post-war national average food supplies (per head per day at the retail level) are given in this table,
7
TABLE 9-3 Countries Animal Protein Vcgutahle Protein
,----..._---~ r------'----, 1934-38 1949-50 1934-38 194,)-5U
Australia 67 65 36 30 Argentina 62 66 37 36 Denmark 54 55 34 44 U.S.A. 50 60 39 30 Canada 48 57 37 35 U.K. 45 49 37 43 Chile 21 23 48 49 Italy 20 20 62 55 U.S. S. R. 17 25 71 72 Iran 10 9 55 49 Japan 10 8 54 45 Mauritius 9 9 37 37 India 8 6 46 38
In this survey, data on the quantities of nonvegetarian food consumed by the households have not been collected. As such, this observation is based on the data collected from other sources. The consumption per head is comparatively far below the optimum level in Madras State. The Brahmins, the Thondamandala Mudaliars and the Saiva Pillaimars represent the intelligent and mobile sections of the population. They are pure vegetarians as is well known in other parts of the country.
Frequency of non-vegetarian diet
48. In the Tamil month of Purattasi many nonvegetarian castes do not take meat. Some non-vegetarian castes do not take meat in the Tamil months of Adi, Karthigai and Marga:::hi. Mondays, Fridays and Saturdays are non-meat days; Ekadasi and Krithigai are also observed as non-meat days. On important occasions like marriage, betrothal and death anniversary, meat cannot be served in households which practise religious rites scrupulously. The number of days on which meat can be taken is limited. The frequency of meat days has been classified on the basis of income in Table 9-4.
Income group (Rs. per mensem)
0-25 26-50 51-75 76-100
101-150 151-200 201-400 401 and flbov~
TABLE 9-4 Average number of meat
days in a year 36 66 60 69 71 90 97
147

50 FOOD HABITS IN MADRAS STATE
The frequency of non-vegetarian diet increases with the income; but it cannot be sai9 that income alone determines it.
Variety in non-vegetarian food
49. The non-vegetarian food can be had in the following forms :
(a) Eggs
(b) Fish which includes prawns
(c) Flesh food of
1. Poultry including fowls, ducks and pigeons;
2. Mutton from goats and sheep;
3. Beef from bulls and buffaloes;
4. Pork from pigs; and
5. Flesh from other animals and birds caught by hunting and snaring.
Eggs :-Bulk of the eggs in the market is from fowls.
Small quantities of duck eggs are also marketed.
The bulk of the fowls consists of indigenous
country-type, while leghorns can be also seen in
appreciable numbers. But, other improved varietie~
like Rhode Island, Little Sussex and Black Minorca
are scarce. The Community Development Programme
has popularised the white leghorns and their cross
breed with country~types in the State. Pure white
leghorns lay 150 to 200 eggs per annum, while the
country hens can lay only 55 eggs. The average
production will be 60 eggs per annum. According to
the 1961 Cattle Census, the poultry population is
about 113 lakhs. Assuming that half the number can
lay eggs, the annual production in the State will be
3,390 lakh eggs. About 10% will be used for hatching
and the balance left is 3,051Iakhs. If it is assumed that
51 lakhs will be spoiled during storage and transit,
the quantity available for consumption will be 3,000
lakhs. The Director of Statistics has estimated the
production of eggs in the State at 3,1521akhs in 1959-60.
The State also imports large quantities of eggs from
Kerala. They are received by rail in basket containers.
According to information gathered from the trade
circles, two lakh eggs are received daily at the centres
shown in Table 9-5.
TABLE 9-5
Number of egg baskets received Number of eggs Centre (each basket contains about received
300 eggs)
Madras 250 75,000 Madurai 75 22,500 TiruchirapaUi 75 22,500 Kodaikanal 25 7,500 Ootacamund 75 22,500 Coimbatore 75 22,500 Thanjavur 4 1,200 Virudhunagar 25 7,500 Chingleput 10 3,000 Other centres 50 15,000
----Total 664 199,200
----The State also receives small quantities from
Andhra Pradesh during the months of March to September. During the winter months, eggs move towards north from Andhra Pradesh. Madras State imports annually 750 lakhs of eggs. A small quantity of duck eggs is exported, but it is negligible. The net annual consumption in the State is 3,750 lakh eggs and this works out to 0.04 egg per day per c. u. The requirement of eggs in the State at the rate of on e per adult per diem is 93,000 lakhs. The State is, therefore, deficit by 89,250 lakhs of eggs. It is indeed a very high target to achieve.
Fish :-Madras State has a sea coast of about 620 miles. In the inland, many reservoirs, lakes, rivers and channels are found. With such natural resources, one would normally expect the level of consumption of fish, which is an item relished by many persons, to be high. The average annual production and availability in the State is worked out as follows on the basis of data collected from the Fisheries Department :._-
Tons I. Marine fish:
(a) Total production (estimated) 89,500
(b) Quantity consumed in fresh condi-tion in the State 38,000
(c) Quantity exported in fresh condition to other States 500
(d) .Quantity utilised f01" curing or drying 51,000
(e) Quantity of cured fish production in the State 29,000
(f) Quantity of cured fish consumed in the State 8,000

NON-VEGETARIAN FOODS 51
Tons
I. Marine fish-(cont.)
(g) Quantity of cured fish exported to other States 2,000
(h) Quantity of cured fish exported to foreign countries 19,000
(i) Total quantity of fish consumed in the State (dry fish expressed in terms of fresh fish) 52,000
1 f. Inland fish:
(j) Total production (estimated) 43,000
(k) Quantity consumed in the State (fresh or dry) 41,000
(/) Quantity exported to other States... 2,000
(m) Quantity exported to foreign countries Nil
Ill. Fish imported:
(n) Fish (fresh and cured from Andhra Pradesh, Mysore and Kerala States and foreign countries) 19,000
IV. Fish consumption:
(0) Total quantity consumed in the State [I(i) + II(k) + 11I(n) ] 112,000
The consumption of fish works out to 0.43 ounce per c. u. per diem. The consumption in the coastal areas will be more than in the interior places. The level of consumption in Kanyakumari district is high where people take fish daily as a supplement to tapioca or rice gruel. For marine fishing, the centres are at Madras, Thanjavur, Ramanathapuram, Tirunelveli and Kanyakumari districts. For inland fishing, the important districts are Thanjavur, Tiruchirapalli and Salem. In Coimbatore district, Bhavanisagar is being developed as a fishing centre. Though enormous facilities exist for increased landing of marine and inland fishes, they have not been properly utilised. With improved methods like mechanised deep-sea fishing, development of fishing ports and provision of cold storage facilities, the level of consumption of fish can be substantially increased.
Flesh food :-Of the poultry population of 113 lakhs, half is killed annually and consumed. This yields 4,000 tons per year. Though poultry meat is more popular, it is costlier than mutton. The only community which considers poultry rearing as a taboo is the Kotas, a hill tribe of the Nilgiris. In rural parts,
the peasants eliminate unwanted cocks by offering them as sacrifices to local deities and eat them. Fowl rearing is practised in drier interior places and duck rearing in wet districts.
Mutton :-This is the most popular flesh food in the State. No non-vegetarian caste considers mutton as a taboo. The meat of goat is preferred to that of sheep. Though goats are more prolific and their rearing comparatively remunerative, the restrictions imposed on their rearing in areas bordering reserve forests have resulted in the decrease of their population. The sheep reared in the State are fit only for eating and are useless for wool. Only 15% of the sheep give wool. The skin of the goat and sheep is exported in large quantities and as such the price of mutton has varied from time to time. In olden days, animal sacrifice was made in the shape of goats and sheep, but this is now prohibited by law. Large sheep rearing areas are found in the districts of Salem, North Arcot, Coimbatore and Tiruchirapalli. With vast arable lands available for pasture in the districts of Chingleput, South Arcot, Salem, Tiruchirapalli, Ramanathapuram and Tirunelveli, there is great scope for increasing the sheep wealth in the State. According to the Cattle Census of 1961, the populations of goats and sheep in the State are 3,428,847 and 7,159,956 respectively. The numbers slaughtered in the registered slaughter houses in 1960-61 are 729,770 goats and 1,532,640 sheep (vide Appendix IX). The number slaughtered outside the slaughter-houses has been estimated by the Animal Husbandry Department to be not more than 25% of the number brought to the slaughter-houses. The average weight of mutton from a sheep or goat has been estimated at 20 pounds. Thus, the quantity of mutton available through slaughter houses is approximately 452 lakh pounds or 20,000 tons. The total quantity of mutton consumed in the State will be 25,000 tons annually.
Beef:-Beef is not eaten by the Hindus. Some of the Scheduled Castes and Muslims consume it. In rural sectors, some of the Scheduled Castes still eat the beef of dead animals. The number of bovine cattle brought to the slaughter-houses in 196Q-61 is 88,290 yielding approximately 6,000 tons of meat. An equal quantity will be slaughtered in rural parts. On the whole, a quantity of 12,000 tons of beef is consumed annually in the State.
Pork :-Pigs are reared by a few Scheduled Caste people like Dombars, Panniandies, Pagadais and Pallars and by the Scheduled Tribe of Malayalees.

52 FOOD HAims rN MADRAS STATE
They are reared in unhygenic conditions. The flesh of tlle pig is eaten by some of the agricultural castes also. It is held as taboo by Muslims. Pigs are prolific and in many places they are killed and eaten just before the agricultural season starts so that they may not damage crops. The number of pigs brought to the slaughterhouses in 1960-61 is 5,868; but about thrice this number is killed outside the slaughter-houses. The annual quantity of pork consumed in the State is about 300 tons.
Flesh of animals and birds not reared:-Under this heading will come the flesh of animals and birds hunted, snared or otherwise caught. As regards hunted animals, eating of the venison of deer and sambur, the pork of wild boar and the flesh of rabbits is considered unobjectionable by most non-vegetarians. Among the birds, wild pigeons, partridges, snipes, wild fowls and cuckoos are eaten freely. Even rats, snakes and crows are caught and eaten by certain castes. The flesh of bison is eaten by a few hill tribes. The flesh of langur, bats and crocodiles is eaten as a cure for
ailments. Though many species of animals and birds are hunted and consumed as food, the total quantity available is negligible and is hence ignored.
Average consumption level
50. The total quantity of flesh food consumed is as follows :-
Kind of meat
1. Poultry 2. Mutton 3. Beef 4. Pork
Total
Annual consumption in the State
4,000 tons 25,000 tons 12,000 tons
300 tons
41,300 tons
The consumption per c. u. per diem works out to 0.16 ounce. Including fish, the total quantity consumed is only 0.59 ounce as against the optimum level of 3 ounces. As Madras State is essentially a non-vegetarian State, the increased production of fish and flesh food will not only reduce the pressure on cereals but also give a balanced diet to the citizens.

CHAPTER X
OTHER SUBSIDIARY ITEMS OF FOOD
Importance of subsidiary foods
51. The chief source of carbohydrates for an average citizen of Madras State is cereal. For proteins, he depends on pulses and to a small extent on meat. For fat, he depends upon butter, including ghee, vegetable oil and animal fat. For vitamins, the chief source is fruits and vegetables. They also contain minerals like iron, phosphor0us, calcium and iodine. Salt is taken in the form of common salt. All these items, other than cereals, constitute subsidiary items of food which are as essential as cereals for a balanced diet.
Vegetables
S2. Vegetables form an important ingredient of food. They consist of root vegetables, leafy vegetables and other types of vegetables. Fpr the purpose of our study, we have attempted to classify them into these three categories. The important vegetables grown and consumed in this State under these categories are :-
(a) Root vegetables:
(1) (2) (3) (4) (S) (6) (7) (8) (9)
(10) (11 )
Carrot (Daucus carota) Colocasia (C%casia esculellta) Onion, big (Alliulll cepa) Onion, small (Allium cepa) Potato (Solanum luberosum) Radish, pink (Raphanus sativus) Radish, white (Raphanus sativus) Sweet potato (Impomeoa batatas) Tapioca (Manihot csculenta) Yam, ordinary (T)jJhonium trilobatum) Elephant yam (Amorphophallus
campallulatus)
(b) Le(lf)' vegetables:
(1) Agathi (Sesballia grandijfora) (2) Amaranth, tender (Amaranthus tricolor) (3) Cabbage (Brassica cleracea-capitata) (4) Coriander (Coriandrum sativum) (5) Curry leaves (Murraya koenigii) (6) Drumstick (Morillga oleifera) (7) Fenugreek (Trigone/la foenumgraecum) (8) Manathakkalai (Solanum nigrum)
(b) Leafy vegetables :-(cont.)
(9) Mint (Mentha spicata) (10) Ponnanganni (Alternanthera amoel/a) (11) Spinach (Spillacia oleracea) (12) Sirukeerai (13) Arakeerai (14) Pulichakeerai (1S) Mull ukeerai
(c) Other vegetables:
(1) Amaranth, stem (Amarallthlls gangeticus) (2) Ash gourd (Benincasa hispida) (3) Bitter gourd (Mol1lordica charantia) (4) Brinjal (Solanul/l Melollgella) (S) Broad beans (Vicia faba) (6) Calabash cucumber (Lagenaria
siceraria) <. 7) Cluster beans (CyaJJ1opsis tetragollo{o{Ja) (8) Cucumber (Cucumis sativus) (9) Drumstick (Moringa oleifera)
(10) Jack tender (Artoca/jJus heterophyllus) (11) Jack fruit seeds (Artocarpus
heterop/zy/lus) (12) Kandan kathiri (Solanum xalltllOcaljJulll) (13) Kovai fruit, tender (Coccillia cordifalia) (14) Ladies finger (Abelll1oschus esculentus) (1S) Mango, green (Mangifera indica) (16) Nellikai, amI a (Phyllanthus emblica) (17) Peas, English (Pisum sativum) (18) Plantain flower (Musa sapientllll1) (19) Plantain green (Musa sapien tum) (20) Plantain stem (Musa sapientum) (21) Pumpkin (Cucurbita maxima) (22) Ridge gourd (Luga acu/al/gllla) (23) Snake-gourd (Tric/lOsantiles anguina) (24) Sundaka, dry (Solanum torvum) (2S) Sword beans (Canal'a/ia gladiata) (26) Tomato green (Lycoperiscon escu{ef1(ul1l)
English vegetables:
(1) Beet root
(2) Knul khol
(3) Chow chow
(4) Tomato
(5) Cauliflower
54 FOOD HABITS IN MADRAS STATE
Apart from their nutritive value, vegetables make the food more palatable and tasty. It may be grown anywhere. Our survey has ho\Vcver, shown that an average citizen does not take vegetables reg.darly. Table 10-1 gives the percentage of households using vegetables regularly and the level of consumption pcr c. u. in the districts.
Table 10-1
Percentage of Consumption District households taking per c u. in
vegetables the households at least once daily (in ounces)
Madras 91 4.9
Chingleput 64 3.5
North Arcot 61 3.7
South Arcot 48 2.3
Salem 64 2.1
Coimbatore 68 4.5
Nilgiris 40 0.8
Madurai 67 3.0
Tiruchirapalli 78 2.7
Thanjavur 33 1.2
Ramanathapuram 53 2.4
Tirunelveli 73 2.4
Kanyakumari 16 1.0
State 61 2.8
In Madras, Tiruchirapalli and Tirunelveli districts the percentage of households taking vegetables is high. A low percentage is recorded in Kanyakumari district. In Thanjavur and Niigiris, less than 50% of the households use vegetables. The level of consumption of vegetables is the highest in Madras with 4.9 ounces followed by Coimbatore with 4.5 ounces. The lowest figure is recorded by Nilgiris, 0.8 ounce. Kanyakumari and Thanjavur have also recorded low figures of 1.0 and 1.2 ounces. Again, Tiruchirapalli and Tirunelveli which have high percentages of households taking vegetables have low percentages in actual quantity of vegetables consumed. It can, therefore, be said that in only two districts, Madras and Coimbatore, an adequate percentage of vegetables is consumed as part of the food. Perhaps, the low consumption in other districts has something to do with the poverty of the people living in those districts.
More is the income, more vegetable is consumed, and this is illustrated by Table 10-2.
Income group (Rs. per mensem)
0-25 26-50 51-75 76-100
101-150 151-200 201-400 401 and above
Table 10-2
Daily consumption per c. u. in ounces
1.7 2.0 2.3 3.8 4.3 4.1 4.5 8.6
The consumption in the income groups between Rs. 76 and Rs. 400 is fairly steady, while in the income above Rs. 401 it doubles itself. In actual fact, the income of low income groups is spent mostly in the purchase of cereals and nothing is left for purchasing subsidiary items of food like vegetables.
We do not have any estimates on the quantities of vegetables produced in the State. The Director of Statistics makes an estimate of the total area in which vegetable is grown from year to year. But, it does not include the vegetables grown in backyards and kitchen gardens. The yields will fluctuate greatly depending on rains, seasonal conditions and intensiveness of pests. It is, therefore, difficult to make any estimate of the total quantity of vegetables grown in the State. According to our survey, we have estimated the total quantity consumed in different districts. The quantity consumed in each district is given in Table 10-3.
Table 10-3
District
Madras Chingleput North Arcot South Arcot Salem Coimbatore Nilgiris Madurai Tiruchirapalli Thanjavur Ramanathapuram Tirunelveli Kanyakumari
State
Quantity of vegetables consumed per annum
(in tons)
64,174 58,904 88,010 54,512 60,249
123,259 2,549
72,779 66,594 30,098 43,736 50,978
7,272
723,114
OTHER SUBSIDIARY ITEMS OF FOOD 55
These do not include the quantities consumed in hotels, hostels, j ails and other institutions.
The following are the important vegetables grown in the State.
Potatoes:-Potato is a popular vegetable consumed by both vegetarians and non-vegetarians. It is available throughout the year. Orthodox people do not use it during religious and ceremonial functions. It is grown in the Nilgiris, Kodaikanal hills in Madurai district and in the Shevaroy hills in Salem district. In 1960-61, the extent cultivated and the yields were as follows:-
TABLE 10-4
District Extent cultivated Yield (in acres) (in tons)
Salem 307 910 Madurai 2,127 5,800 Nilgiris 23,440 72,750
---- ----Total 25,874 79,460
---- ---_ Normally, the State had a surplus and used to send potatoes to places like Calcutta in the north. But, in the last three or four years, pests like Late-blight affected the crops and the State had to import small quantities from Bangalore and Uttar Pradesh.
Tapioca :-It is grown in Kanyakumari and Salem districts. In Kanyakumari, it is grown in an extent of 40,000 acres and the yield is 1.5 lakh tons. In that district, it is used as a staple food. In other districts poorer sections use it once in a way. In Sale~ district, the bulk of the produce is used in the manufacture of Sago (Javvarisi) which has a great demand in Calcutta and Bombay.
Sweet Potatoes :-The extent of cultivation in 1960-61 was 9,210 acres which yielded 30,000 tons. It is grown in the loamy soil of Tirunelveli and Tiruchirapalli districts as an irrigated garden crop. It is used as a vegetable by the higher classes but forms almost a staple food for the poorer classes.
Tubers :-The forests abound in many varieties of edible tubers which form the staple food of tribes. Sixteen such tubers are used by the hill tribes of Anaimalai hills.
Leafy vegetables :-According to. nutritional experts, it is desirable to take 4 ounces of leafy vegetables every day. Their use in urban households is limited. The common leafy vegetable is Amaranth.
Next is Agathi, invariably used in religious feasts. In rural parts, a large number of unspecified greens which grow wild are collected by poor people and eaten. Murungai keerai is also popular in rural parts.
Other vegetables :-Generally, farmers take up large-scale cultivation only when they have facilities for easy marketing. A ready market can always be found in important towns. The areas bordering places like Madras, Coimbatore and Madurai have taken to large-scale cultivation of vegetables. The vegetables grown in interior places are also taken to the cities for sale. Brinjals and pumpkins are two important items. Other vegetables are grown from season to season, but only in small quantities. Vegetables like bitter-gourd, snake-gourd and avarai can be grown from September to December. Bottlegourd is not taken by orthodox familes. Brinjah are not used during ceremonial occasions.
English vegetables :-They are grown in higher altitudes like the Nilgiris, Shevaroy hills and Kodaikanal hills. During the cold season they are grown in small quantities in the plains also. The State imports small quantities from Bangalore. These vegetables are mostly consumed in urban areas.
Vegetables used for flavouring :--Onions, chillies, coriander leaves and curry leaves and coconuts can be classified under this head.
Onion is an important ingredient in many South Indian dishes. It is used with chillies. In respect of onions, Madras State is surplus. The following are the areas under onions and the quantities produced in 1960-61 :-
TABLE 10-5
District Area in Production in acres tons
Chingleput 78 300 North Arcot 1,224 4,370 South Arcot 878 5,760 Salem 2,254 9,560 Coimbatore 7,623 36,730 Nilgiris 64 90 Madurai 12,470 78,490 Tiruchirapalli 3,142 13,330 Thanjavur 254 840 Ramanathapuram 3,482 8,580 Tirunelveli 4,231 19,950 Kanyakumari 39 180
---- ----State 35,739 178,180
---- ----
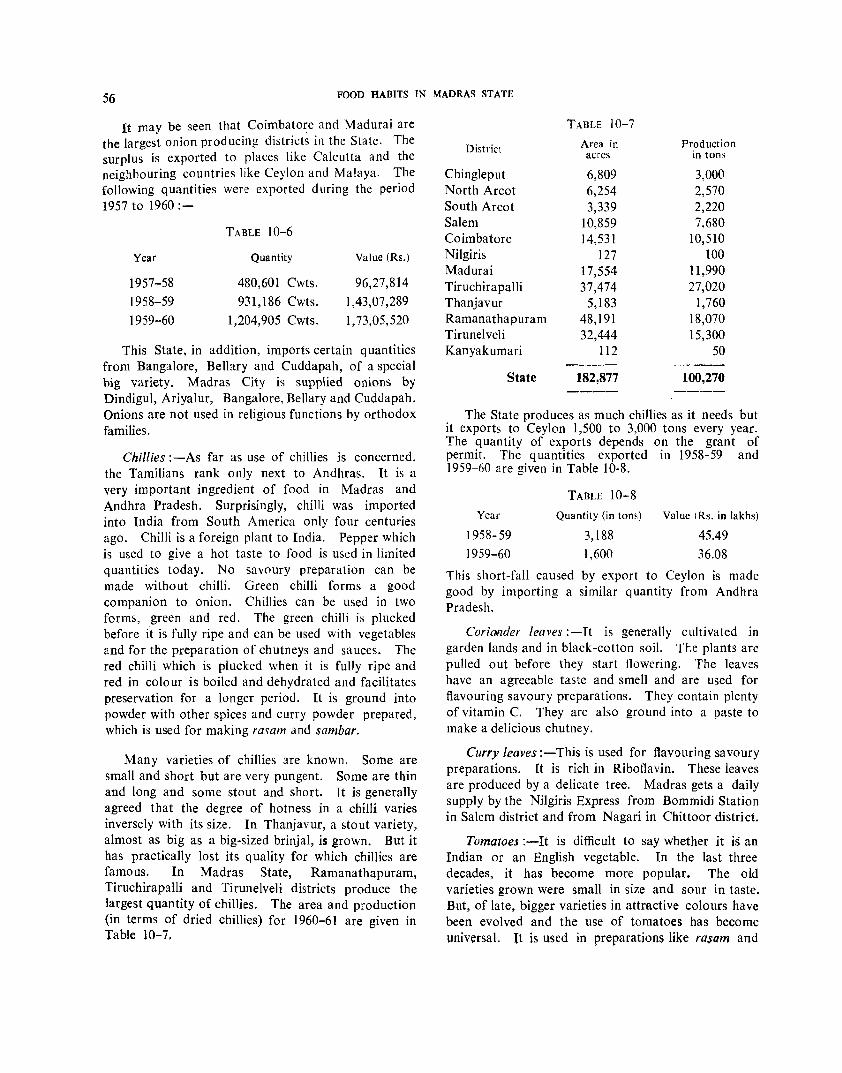
56 FOOD HABITS IN MADRAS STATE
It may be seen that Coimbatore and Madurai are the largest onion producing districts in the State. The surplus is exported to places like Calcutta and the neighbouring countries like Ceylon and Malaya. The following quantities were exported during the period 1957 to 1960 :-
Year
1957-58
1958-59
1959-60
TABLE 10-6
Quantity
480,601 Cwts.
931,186 Cwts.
1,204,905 Cwts.
Value (Rs.)
96,27,814
1,43,07,289
1,73,05,520
This State, in addition, imports certain quantities from Bangalore, Bellary and Cuddapah, of a special big variety. Madras City is supplied onions by Dindigul, Ariyalur, Bangalore, Bellary and Cuddapah. Onions are not used in religious functions by orthodox families.
Chillies :-As far as use of chillies is concerned, the Tamilians rank only next to Andhras. It is a very important ingredient of food in Madras and Andhra Pradesh. Surprisingly, chilli was imported into India from South America only four centuries ago. Chilli is a foreign plant to India. Pepper which is used to give a hot taste to food is used in limited quantities today. No savoury preparation can be made without chilli. Green chilli forms a good companion to onion. Chillies can be used in two forms, green and red. The green chilli is plucked before it is fully ripe and can be used with vegetables and for the preparation of chutneys and sauces. The red chilli which is plucked when it is fully ripe and red in colour is boiled and dehydrated and facilitates preservation for a longer period. It is ground into powder with other spices and curry powder prepared, which is used for making rasam and sambar.
Many varieties of chillies are known. Some are small and short but are very pungent. Some are thin and long and some stout and short. It is generally agreed that the degree of hotness in a chilli varies inversely with its size. In Thanjavur, a stout variety, almost as big as a big-sized brinjal, is grown. But it has practically lost its quality for which chillies are famous. In Madras State, Ramanathapuram, TiruchirapaUi and Tirunelvelj districts produce the largest quantity of chillies. The area and production (in terms of dried chillies) for 1960-61 are given in Table 10-7.
TABLE 10-7
District Area in Production acres in tons
Chingleput 6,809 3,000 North Arcot 6,254 2,570 South Arcot 3,339 2,220 Salem 10,859 7,680 Coimbatore 14,531 10,510 Nilgiris 127 100 Madurai 17,554 11,990 Tiruchirapalli 37,474 27,020 Thanjavur 5,183 1,760 Ramanathapuram 48,191 18,070 Tirunelveli 32,444 15,300 Kanyakumari 112 50
---- -----
State 182,877 100,270 ---- ----
The State produces as much chillies as it needs but it exports to Ceylon 1,500 to 3,000 tons every year. The quantity of exports depends on the grant of permit. The quantities exported in 1958-59 and 1959-60 are given in Table 10-8.
Year
1958-59
1959-60
TABLE 10-8
Quantity (in tons) Value I Rs. in lakhs)
3,188 45.49
1,600 36.08
This short-fall caused by export to Ceylon is made good by importing a similar quantity from Andhra Pradesh.
Corionder leaves :-It is generally cultivated in garden lands and in black-cotton soil. Tr.e plants are pulled out before they start flowering. The leaves have an agreeable taste and smell and are used for flavouring savoury preparations. They contain plenty of vitamin C. They are also ground into a paste to make a delicious chutney.
Curry leaves :-This is used for flavouring savoury preparations. It is rich in Riboflavin. These leaves are produced by a delicate tree. Madras gets a daily supply by the Nilgiris Express from Bommidi Station in Salem district and from Nagari in Chittoor district.
Tomatoes :-It is difficult to say whether it is an Indian or an English vegetable. In the last three de-cades, it has become more popular. The old varieties grown were small in size and sour in taste. But, of late, bigger varieties in attractive colours have been evolved and the use of tomatoes has become universal. It is used in preparations like rasom and
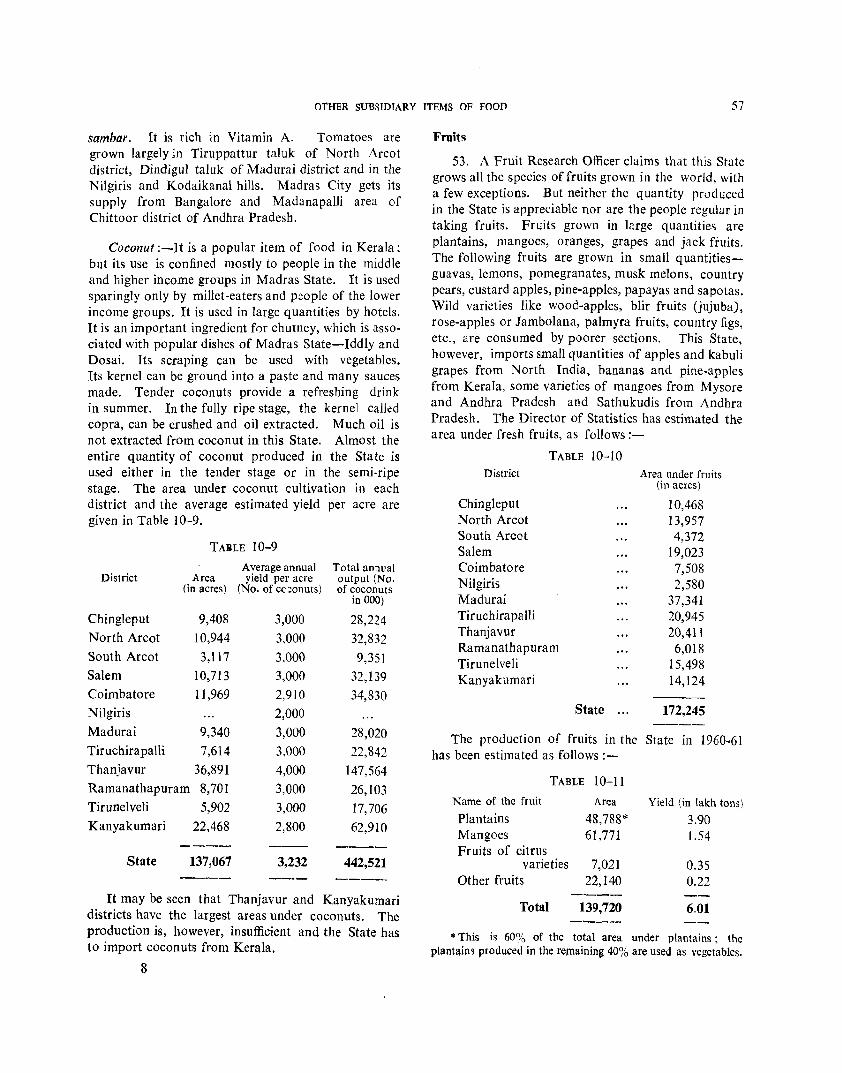
OTHER SUBSIDIARY ITEMS OF FOOD 57
sambar. It is rich in Vitamin A. Tomatoes are grown largely in Tiruppattur tuluk of North Arcot district, Dindigul taluk of Madurai district and in the Nilgiris and Kodaikanal hills. Madras City gets its supply from Bangalore and MadanapalJi area of Chitto or district of Andhra Pradesh.
Coconut :-It is a popular item of food in Kerala; but its use is confined mostly to people in the middle and higher income groups in Madras State. It is used sparingly only by millet-eaters and people of the lower income groups. It is used in large quantities by hotels. It is an important ingredient fl)r chutney, which is associated with popular dishes of Madras State-Iddly and Dosai. Its scraping can be used with vegetables. Its kernel can be ground into a paste and many sauces made. Tender coconuts provide a refreshing drink in summer. In the fully ripe stage, the kernel called copra, can be crushed and oil extracted. Much oil is not extracted from coconut in this State. Almost the entire quantity of coconut produced in the State is used either in the tender stage or in the semi'ripe stage. The area under coconut cultivation in each district and the average estimated yield per acre are given in Table 10-9.
TABLE 10-9
Average annual Total annual District Area yield per acre output (No.
(in acres) (No. of c,,:onuts) of coconuts in 000)
Chingleput 9,408 3,000 28,224
North Arcot 10,944 3,000 32,832
South Arcot 3,117 3,000 9,351 Salem 10,713 3,000 32,139 Coimbatore 1 },969 2,910 34,830 Nilgiris 2,000
Madurai 9,340 3,000 28,020 Tiruchirapalli 7,614 3,000 22,842
Thanjavur 36,891 4,000 147,564 Ramanathapuram 8,701 3,000 26,103 Tirunelveli 5,902 3,000 17,706 Kanyakumari 22,468 2,800 62,910
---- ----State 137,067 3,232 442,521
---- ----It may be seen that Thanjavur and Kanyakumari
districts have the largest areas under coconuts. The production is, however, insufficient and the State has to import coconuts from Kerala.
8
Fruits
53. A Fruit Research Officer claims that this State grows all the species of fruits grown in the world, with a few exceptions. But neither the quantity produced in the State is appreciable nor are the people regular in taking fruits. Fruits grown in large quantities are plantains, mangoes, oranges, grapes and jack fruits. The following fruits are grown in small quantltiesguavas, lemons, pomegranates, musk melons, country pears, custard apples, pine-apples, papayas and sapotas. Wild varieties like wood-apples, blir fruits (jujuba), rose-apples or Jambolana, palmyra fruits, country figs, etc., are consumed by poorer sections. This State. however, imports small quantities of apples and kabuli grapes from North India, bananas and pine-apples from Kerala, some varieties of mangoes from Mysore and Andhra Pradesh and Sathukudis from Andhra Pradesh. The Director of Statistics has estimated the area under fresh fruits, as follows:-
District
Chingleput North Arcot South Arcot Salem Coimbatore Nilgiris
TABLE 10-10
Madurai Tiruchirapalli Thanjavur Ramanathapuram Tirunelveli Kanyakumari
Area under fruits (in acres)
10,468 13,957 4,372
19,023 7,508 2,580
37,341 20,945 20,411 6,018
15,498 14,124
State 172,245
The production of fruits in the State in 1960-61 has been estimated as follows :-
TABLE 10-11
Name of the fruit
Plantains Mangoes Fruits of citrus
varieties Other fruits
Total
Area
48,788* 61,771
7,021 22,140
139,720
Yield (in lakh tons)
3.90 1.54
0.35 0.22
6.01
* This is 60% of the total area under plantains' the plantain~ produced in the remaining 40% are used as Veget~bles.
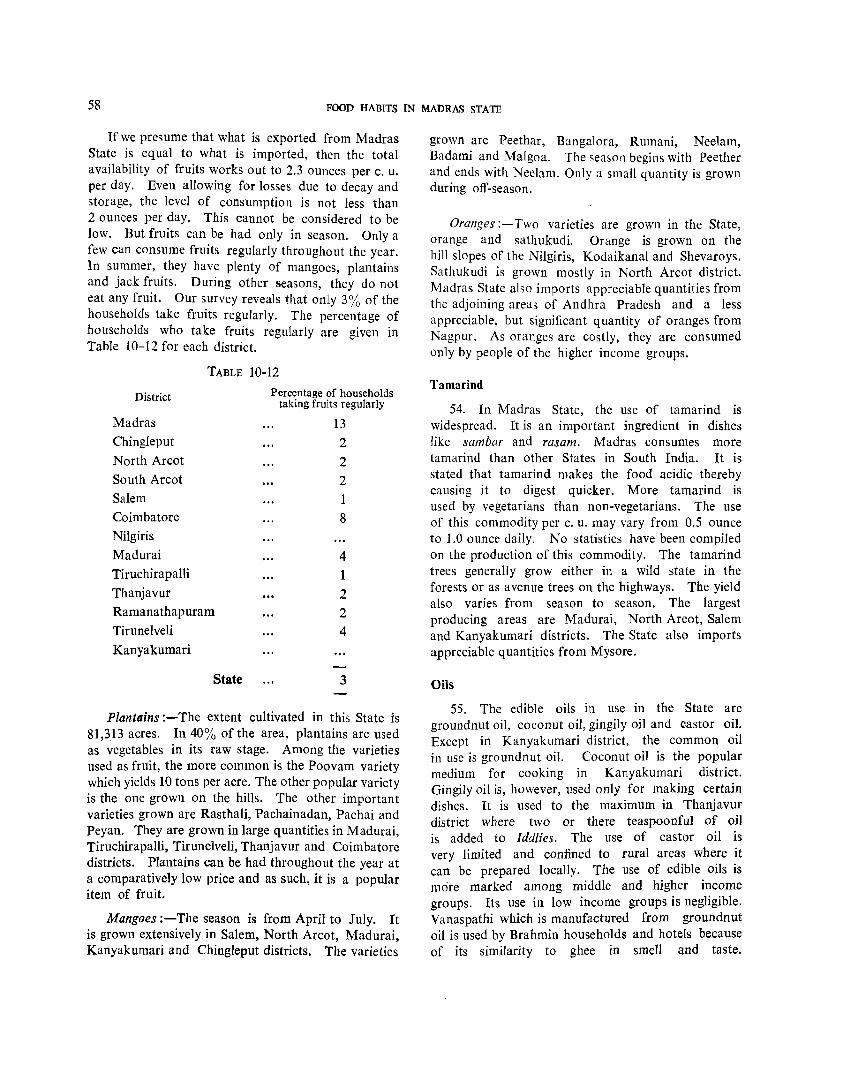
58 FOOD HABITS IN MADRAS STATE
If we presume that what is exported from Madras State is equal to what is imported, then the total availability of fruits works out to 2.3 ounces per c. u. per day. Even allowing for losses due to decay and storage, the level of consumption is not less than 2 ounces per day. This cannot be considered to be low. But fruits can be had only in season. Only a few can consume fruits regularly throughout the year. In summer, they have plenty of mangoes, plantains and jack fruits. During other seasons, they do not eat any fruit. Our survey reveals that only 3% of the households take fruits regUlarly. The percentage of households who take fruits regularly are given in Table 10-12 for each district.
TABLE 10-12
District
Madras
Chingleput
North Arcot
South Arcot
Salem
Coimbatore
Nilgiris
Madurai
Tiruchirapalli
Thanjavur
Ramanathapuram
Tirunelveli
Kanyakumari
State
Percentage of households taking fruits regularly
13
2
2
2
1 8
4
1 2
2 4
3
Pianteins :-The extent cultivated in this State is 81,313 acres. In 40% of the area, plantains are used as vegetables in its raw stage. Among the varieties used as fruit, the more common is the Poovam variety which yields 10 tons per acre. The other popular variety is the one grown on the hills. The other important varieties grown are Rasthali, Pachainadan, Pachai and Peyan. They are grown in large quantities in Madurai, Tiruchirapalli, Tirunelveli, Thanjavur and Coimbatore districts. Plantains can be had throughout the year at a comparatively low price and as such, it is a popular item of fruit.
Mangoes :-The season is from April to July. It is grown extensively in Salem, North Arcot, Madurai, Kanyakumari and Chingleput districts. The varieties
grown are Peethar, Bangalora, Rumani, Neelam, Badami and MaIgoa. The season begins with Peether and ends with Neelam. Only a small quantity is grown during off-season.
Oranges :-Two varieties are grown in the State, orange and sathukudi. Orange is grown on the hill slopes of the Nilgiris, Kodaikanal and Shevaroys. Sathukudi is grown mostly in North Arcot district. Madras State also imports appreciable quantities from the adjoining areas of Andhra Pradesh and a less appreciable, but Significant quantity of oranges from Nagpur. As oranges are costly, they are consumed only by people of the higher income groups.
Tamarind
54. In Madras State, the use of tamarind is widespread. It is an important ingredient in dishes like sambar and rasam. Madras consumes more tamarind than other States in South India. It is stated that tamarind makes the food acidic thereby causing it to digest quicker. More tamarind is used by vegetarians than non-vegetarians. The use of this commodity per c. u. may vary from 0.5 ounce to 1.0 ounce daily. No statistics have been compiled on the production of this commodity. The tamarind trees generally grow either in a wild state in the forests or as avenue trees on the highways. The yield also varies from season to season. The largest producing areas are Madurai, North Areot, Salem and Kanyakumari districts. The State also imports appreciable quantities from Mysore.
Oils
55. The edible oils in use in the State are groundnut oil, coconut oil, gingily oil and castor oi~. Except in Kanyakumari district, the common 011 in use is groundnut oil. Coconut oil is the popular medium for cooking in Kanyakumari district. Gingily oil is, however, used only for making certain dishes. It is used to the maximum in Thanjavur district where two or there teaspoonful of oil is added to Iddlies. The use of castor oil is very limited and confined to rural areas where it can be prepared locally. The use of edible oils is more marked among middle and higher income groups. Its use in low income groups is negligible. Vanaspathi which is manufactured from groundnut oil is used by Brahmin households and hotels because of its similarity to ghee in smell and taste.

OTHER SUBSIDIARY ITEMS OF FOOD 59
It is also being used for preparing sweets and other edibles. The average annual production of groundnut oil is estimated at 2.50 lakh tons and that of gingily oil at 0.25 lakh tons. The State may be slightly surplus in ground nut oil, but because of inter-State movement and controlled export, it is difficult to determine the extent of local consumption.
Salt
56. It is an important ingredient in our food. According to a Tamil proverb, any preparation made without salt should be thrown in the garbage. As Madras State has a tropical climate and loss of salt through perspiration is more, the people are accustomed to eat more salt preparations than sweet. In our survey, we have not estimated the actual intake of salt; but there are reasons to believe that the consumption level of salt in South India is higher than in North India. In many Muslim households, rice is cooked with salt. Generally, households do not keep salt in large quantities as it can absorb moisture from the air. So, they purchase it in small quantities. They also use poorer varieties of salt which are light and greyish.
Salt is produced in the State by solar evaporation of brine. Next to Bombay, Madras produces the maximum quantity of salt. In this State, the areas of production have been divided into 4 circles and the production during the 4 years ending 1961 is as shown in Table 10-13.
TABLE 10-13
Name of Circle Production in ~ _______ .J ________ ......,
1958 1959 1960 1961 (in tons)
Madras 114,147 80,905 122,964 96,741
Cuddalore 76,725 122,984 116,541 104,598
Tuticorin 303,710 250,230 292,973 301,714
Nagercoil 51,284 37,244 32,705 23,277
State 545,866 491,363 565,183 526,330
The entire ql'antity is not consumed in the St'lte itself. It is exported to Mysore, Kerala, Andhra Pradesh, Orissa, Bihar, West Bengal, Uttar Pradesh, Madhya Pradesh and Assam States, and to Ceylon also. The movement within the country is by rail, road and canal. The quantity issued within the State for local use during 1961 was 4.34 lakh tons. Out of this, 0.72 lakh tons were used for industrial purposes like
tanning. The balance was consumed by people for their food. This works out to 1.39 ounces per c. u. per diem.
Spices
57. Generally, the people in this State use plenty of spices. The use is greater in non-vegetarian households. The spices mostly used by the vegetarian and non-vegetarian households are as follows :-
Vegetarian households
Cardamom Pepper Chilli Clove Coriander Ginger Mace Mustard Nutmeg Cashewnut Asafoetida Saffron Cumin Omum Fenugreek seed Turmeric
Non-vegetarian households
All the items shown against vegetarians plus the following:
Garlic Bark of clove Poppy Anise seed
Some of the spices used by the non-vegetarians are disliked by the vegetarians.
Beverages
58. Coffee and tea are the two beverages consumed in Madras State. Coffee is, however, more popular. But as a result of the intensive propaganda of the Tea Expansion Board, the consumption of tea has increased, more so among the working class. Tea shops can be found in almost all villages and at junctions of more than two roads. People of the middle and higher income groups, however, prefer coffee to tea. In our survey, we have estimated the number of times beverages are taken by every household. It is found that 61 % of the households do not prepare and consume any beverage at all; 16% take beverages once daily and 19% more than once daily. In the remaining 4%, some elders consume beverages in hotels or tea-shops. In some households, coffee is drunk without milk. The habit of drinking coffee or tea is more prevalent among well-to-do families, industrial workers, business-men and office-going people (i.e., in A,E,G and H categories). The l1umber

60 rOOD HABITS IN MADRAS STATb
of times beverages are taken by households has been classified by occupational status and communities and presented in Tables 10-14 and 10-15.
TABLE 10-14
Percentage of households in ,-__ --...J ____
Occupational status
A High paid officials, etc. 84 B Working cultivators 15 C Agriculturallabourers 5 D Village artisans 18 E Industrial workers 36 F Weavers G Small traders H Clerks, etc.
Peons, etc. I J Others not covered
19 37 71 33 40
above
TABLE 10-15
11 21 8
16 26 24 22 14 24 16
5 62 84 61 32 48 34 12 40 39
2 3 5 6 9 7 3 3 5
Percentage of households in Community ,-------~-------,
B2 BI Bo BH
Asari 17 Badaga 48 Banajiga Boyar (Oddar) 3 Brahmin 92 Chettiar 27 Christian 32 Devanga Jain Janguma Pandaram Komutti Chettiar Kshatriya Kurumba Gounder Maharashtra Malayali Mannadiyar Mukkulathore
32 50
60 25 17 56 39 50 11
Muslim 39 Muthuraja 10 Nadar (Shanar) 13 Naidu 39 Nattukottai Chettiar 22 Navithan 16
25 48 20 12 7
18 11 39 20 50
33
33 36 17 32 15 18 22 64 10
54
80 76
1 48 55 24 30 50 40 75 50 44 14 14 63 22 68 67 39
71
4 4
9
7 2 5
14
9 7 7 2
14 3
TABLE 10-15-(cont.)
Percentage of households- in Community ,-------'------___.,
B2 BI Bo BH
Okkaliga 14 Pillai 27 Reddiar 20 Saiva Pillai 56 Saurashtra 30 Scheduled Castes 6 Scheduled Tribes Sengunthar 37 Sembadavan Solia VeIl ala 100 Thondamanda la
Vellala 42 Thuluva Vellala 17 Udaiyar 9 Uppiliyar Valaiyan 4 Van nan 13 Vanniyar 10 Vellala Go under 16 Vettuva Gounder 5 Yadhava 16
57 22 25 15 24 9 2
15
11
18
10 12 18 14 25
29 46 55 26 46 80 92 41
100
47 83 70
100 96 77 77 64 71 57
5
3
5 6 7
3
1 2
10 2
Coffee :-In the year 1960-61, 55,290 acres were under coffee plantations in this State. They were in Nilgiris, Shevaroy hills, Anaimalai hills, Kodaikanal hills and Papanasam hills. The annual yield was estimated at 5,100 tons. The consumption is not regulated by the production, because the Coffee Board pools the entire production and releases it periodically at various centres throughout India.
Tea :-The area under tea III the State is as follows :-
District
Coimbatore (Anaimalai hills)
Madurai (Kodaikanal hills)
Nilgiris
Kanyakumari
Total
Acres (in 1960-61)
25,350 2,264
44,223 1,115
72,952
The . total production of tea in the State has been estimated at 27,000 tons. Bulk of the superior varieties grown at a high altitude is exported to western countries. The extent of local production does not govern local consumption.
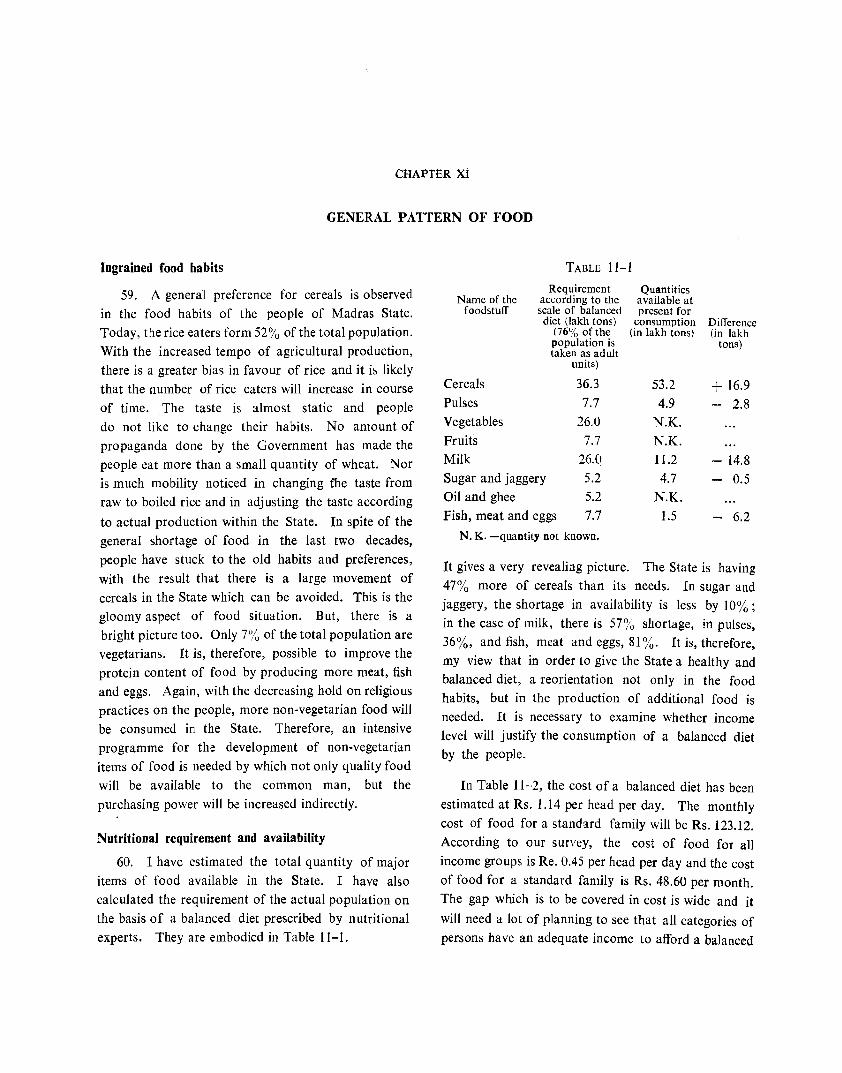
CHAPTER Xl
GENERAL PATTERN OF FOOD
Ingrained food habits
59. A general preference for cereals is observed
in the food habits of the people of Madras State.
Today, the rice eaters form 52 % of the total population.
With the increased tempo of agricultural production,
there is a greater bias in favour of rice and it is likely
that the number of rice eaters will increase in course
of time. The taste is almost static and people
do not like to change their habits. No amount of
propaganda done by the Government has made the
people eat more than a small quantity of wheat. Nor
is much mobility noticed in changing the taste from
raw to boiled rice and in adjusting the taste according
to actual production within the State. In spite of the
general shortage of food in the last two decades,
people have stuck to the old habits and preferences,
with the result that there is a large movement of
cereals in the State which can be avoided. This is the
gloomy aspect of food situation. But, there is a
bright picture too. Only 7% of the total population are
vegetarians. It is, therefore, possible to improve the
protein content of food by producing more meat, fish
and eggs. Again, with the decreasing hold on religious
practices on the people, more non-vegetarian food will
be consumed in the State. Therefore, an intensive
programme for the development of non-vegetarian
items of food is needed by which not only quality food
will be available to the common man, but the
purchasing power will be increased indirectly.
Nutritional requirement and availability
60. I have estimated the total quantity of major
items of food available in the State. I have also
calculated the requirement of the actual population on
the basis of a balanced diet prescribed by nutritional
experts. They are embodied in Table 11-1.
TABLE 11-1
Requirement Quantities Name of the according to the available at
foodstuff scale of balanced present for diet (lakh tons) consumption Difference
(76% of the (in lakh tons) (in lakh population is tons) taken as adult
units)
Cereals 36.3 53.2 + 16.9 Pulses 7.7 4.9 - 2.8 Vegetables 26.0 N.K.
Fruits 7.7 N.K.
Milk 26.0 11.2 - 14.8 Sugar and jaggery 5.2 4.7 - 0.5 Oil and ghee 5.2 N.K.
Fish, meat and eggs 7.7 1.5 - 6.2
N. K. -quantity not known.
It gives a very revealing picture. The State is having
47% more of cereals than its needs. In sugar and
jaggery, the shortage in availability is less by 10% ;
in the case of milk, there is 57% shortage, in pulses,
36%, and fish, meat and eggs, 81 %. It is, therefore,
my view that in order to give the State a healthy and
balanced diet, a reorientation not only in the food
habits, but in the production of additional food is
needed. It is necessary to examine whether income
level will justify the consumption of a balanced diet
by the people.
In Table 11-2, the cost of a balanced diet has been
estimated at Rs. 1.14 per head per day. The monthly
cost of food for a standard family will be Rs. 123.12.
According to our survey, the cost of food for all
income groups is Re. 0.45 per head per day and the cost
of food for a standard family is Rs. 48.60 per month.
The gap which is to be covered in cost is wide and it
will need a lot of planning to see that all categories of
persons have an adequate income to afford a balanced

62 FOOD HABITS IN MADRAS STATE
TABLE 11-2
Average consumption and cost per c.u. in households with income ~------------------~-------------------, Rs. Rs. Rs. Rs. Rs.
0-25 p. m. 26-50 p. m. 51-75 p. m. 76-100 p. m. 101-150 p.m. S. No. Items of food
,..----_}.._~----..... ,-__ _.A._ __ ~ ,..----'------.,. ,..---..)......--, ,..-----'--,
Qty. Cost Qty. Cost Qty. Cost Qty. Cost Qty. Cost (in oz.) (n.p.) (in oz.) (n.p.) (in oz.) (n.p.) (in oz.) (n.p.) (in oz.) (n.p.) (1) (2) (3) (4) (5) (6) (7) (8) (9) (10)
1. Cereals 19.0 22 20.4 24 20.4 33 20.8 35 21.9 37 2. Pulses 0.9 1 1.1 1.3 1.6 2 1.5 2 3. Vegetables ~ 1.7 2 2.0 .., 2.3 2 3.8 6 4.3 6 ""' 4. Fruits ) 1.0 2.0 2.0 2.0 4 2.0 4 5. Milk 0.7 1.1 1.8 2 3.2 7 4.1 9 6. Sugar and jaggery 1.0 1.5 2 2.0 2 2.0 2 2.0 2 7. Vegetable oil, ghee, etc. 0.4 2 0.4 2 0.5 3 0.9 5 8. Fish/Meat 1 0.4 0.4 0.8 3 0.8 3 1.0 4 9. Egg (in No.) )
10. Approximate calorific value ... 2,100 2,400 2,500 2,700 2,900
11. Total cost per c. u. per day ... 28 33 46 62 69
Average consumption and cost per c.u. in households with income ,..-- ~------------------, Rs. Rs. Rs. All Income Balanced
151-200 p. m. 201-400 p.m. 401 and above p.m. Groups Diet
S. No. Items of food ~--'-----., ,..----'-~, ,..--_..A.._, ,..----'-----, ,--J<..-, Qty. Cost Qty. Cost Qty. Cost Qty. . Cost Qty. Cost
(in oz.) (n.p.) (in oz.) (n.p.) (in oz.) (n.p.) (in oz.) (n.p.) (in oz.) (n.p.)
(11) (12) (13) (14) (15) (16) (17) (18) (19) (20)
1. Cereals 23.4 41 20.5 38 19.9 37 20.4 29 14.0 22
2. Pulses 1.5 2 1.9 3 2.0 3 1.3 1 3.0 4
3. Vegetables I. 4.1 6 4.5 7 8.6 13 2.8 3 10.0 10
4. Fruits ) 2.5 5 3.0 6 5.0 10 2.0 2 3.0 8
5. Milk 5.8 13 7.8 18 15.5 36 2.4 4 10.0 21
6. Sugar and jaggery 2.5 3 3.0 4 3.0 5 1.8 2 2.0 3
7. Vegetable oil, ghee, etc. 1.0 6 1.0 6 1.0 6 0.4 2 2.0 10
S. Fish/Meat 1 1.0 4 1.1 4 1.2 5 0.6 2 3.0 . 16
9. Egg (in No.) 20
10. Approximate calorific value ... 3,100 3,100 3,200 2,500 2,700
11. Total cost per c. u. per day ... 80 86 Rs. 1.15 45 Rs. 1.14
Note :-1. Details against items 4, 7 and 8 are estimates not based on survey results. 2. The costs relate to the year 1960-61.

MADRAs STATE ACTUAL CONSUMPTION IN HOUSEHOLDS AND
NUTRITIONAL REQUIREMENT (in Ounces per Adult) SCALE
20 10 0 20 40 o 13-
I ti~~!~~!~~ ~iiii Kilometres 20 10 0 20 40 60 80
MYSORE
o 12-15
10
5
o
o 11-
KERALA
o IO-State Boundary
District Boundary _ . _ . _
Cereals
f1 11 1c
Pulses
A
B
C
.0 Vegetables n 9-
Actual Consumptlon_
B C D I 0
T1
I \ 25
"-\ 20
,- . 10 :~ C' . ../.'
C .-ff2 .~ ) I 25.1 .... . _. .5
! L...
25
20
15
10
o
MAP 3
7.90 20 I
ANDHRA PRADESH 25 15
20
D
-I
Bay of Bengal
..... / r IS
D
MADRAS STATE
Pal k Strait
.-:: ...... ~ .". ~.
0°
o -II
o -10
-9
CE nON

GENERAL PATIERN OF FOOD 63
diet. Let us examine this aspect further. In only one group, viz., Rs. 401 and above, the cost of actual diet approximates to the balanced diet. In the pay group Rs. 0-25, it is 28 nP. and in the pay group Rs. 26-50, it is 33 nP. and in the case of Rs. 51-75 group, it is 46 nP. Middle income groups of Rs. 101-150, Rs. 151-200 and Rs. 201-400 spend 69, 80 and 86 nP. respectively. But, for a balanced diet, the income of the middle groups should rise considerably. The cost of food in a family takes away a substantial portion of its income in all pay groups except Rs. 401 and above. Therefore, the capacity of an average family in India to purchase good quality food is limited by the consideration of cost. Again, it will be seen from Table 11-2, balanced diet will supply 2,700 calories.
The food consumed in Madras gives 2,500 calories. It may appear to us to be a satisfactory position, but actual analysis will show that the calorific content of the food consumed by people of the lower income groups Rs. 0-25 and Rs. 26-50 is as low as 2, 100 and 2,400. In the groups Rs. 101-150, Rs. 151-200 and Rs. 201-400, there is a larger calorific intake. Thi; is necessary for a balanced diet. The conclusion is, therefore, that while there is a shortage of calories in the lower income groups, the calories in middle and
higher income groups are adequate and what is needed to improve the quality of food consumed is to increase the income of the lower groups, as observed earlier, which will result in more intake thereby increasing the calorific content of the food. So, in providing a balanced food to the people of this State, we come across two basic difficulties-firstly,adequate quantities of food giving proteins and vitamins are not produced in the State and secondly, the income of the majority of the people is not such that they can afford a balanced diet. Analysing this further, in protein value, the intake of an average man is much lower than the desired level by 25%. In animal protein, the deficiency is of the order of 80%. In a recent article "The World has a big food potential", Mr. Byron T. Shaw, Administrator, U. S. Department has stated thus: "At no time in history have all people everywhere been adequately nourished. Yet the world has the soil, water and sunshine to produce much more food than is being produced today. We recognise, however, that it takes more' than these physical resources alone to provide nutritious diets for everyone. Putting food on the world's dinner table requires the efforts of hundreds of millions of people, concerned not only with production, but also with processing, distribution and consumption of food ".

CHAPTER XII
INTEGRATED APPROACH TO THE PROBLEM OF FOOD PRODUCTION
Ideal requirement
61. Different views have been expressed by the nutritionists and planners. Nutritionists are of the view that to ensure better nutrition and health, more stress should be laid on the production of food other than cereals. But the planners seem to be inclined to the view that in a country where the primary duty is to provide one meal for the majority of the people, a balanced diet for all the people is not practical politics. Again, the forecasts of the demographers about the future popUlation increase of this country have made the planners feel that unless more cereals are produced, the nation will starve and perish. While examining
the validity of this apprehension as far as this State is concerned in our present survey, we have calculated the consumption of cereals on the basis of 76 c.u. per 100 persons and have come to the conclusion that the average intake of a citizen is 20 ozs. of cereals. According to Dr. Aykroyd, only 14 ozs. of cereals are needed by an individual for a balanced food. I have calculated theoretically the quantity of cereals required to feed the popUlation of Madras State on the basis of a balanced diet. In making this calculation, about 84 c. u. per 100 have been assumed in accordance with the scale of coefficients prescribed by Dr. Aykroyd. According to Tables 12-1 and 12-2, Madras State today produces cereals to feed an additional 32 % of
TABLE 12-1
Population that can be Excess Percentage Consumption units sustained at 14 ozs. Actual population of excess
Year Availability that can be sustained per C. U. per day population that can be population' (in lakh tons) at 14 ozs. per C.U. (836 C.U. = 100 existing sustained to actual
per day (in lakhs) population)(in lakhs) (lakhs) (Iakhs) population (1) (2) (3) (4) (5) (6) (7)
1961 53 371.7 444.6 336.9 107.7 32 1966 67 469.9 562.1 362.0* 200.1 55 1971 77 540.1 646.1 388.0* 258.1 67
* Estimates.
TABLE 12-2
Cereal requirement Quantity Percentage of Population Consumption Units at 14 ozs. per adult Actual rendered surplus to
Year (in lakhs) (at 83.6 percent of per day a vail a bility surplus availa@ility population (in Jakhs) (lakh tons) (lakh tons) (lakh ton~)
(1) (2) (3) (4) (5) (6) (7)
1961 336.9 281.6 40.2 53.0 12.8 24
1966 362.0 302.6 43.2 67.0* 23.8 36
197] 388.0 324.4 46.3 77.0* 30.7 40
* Estimates.
the population. It will feed 55% additional population in 1966 and 67% additional population in 1971. Considering the controlled birth rates and death rates and the widespread practice of birth control methods, the percentage of population increase is not likely to be quite different from what it is today for the next 50 years. As such, Madras State can
easily produce more than sufficient quantities of cereals required by the population if they are in a position to consume a balanced diet. Table 12-2 will indicate that based on balanced diet, the percentage of surplus quantity of cereals to total availability will be 24 in 196], 36 in 1966 and 40 in 1971. If these large quantities of cereals
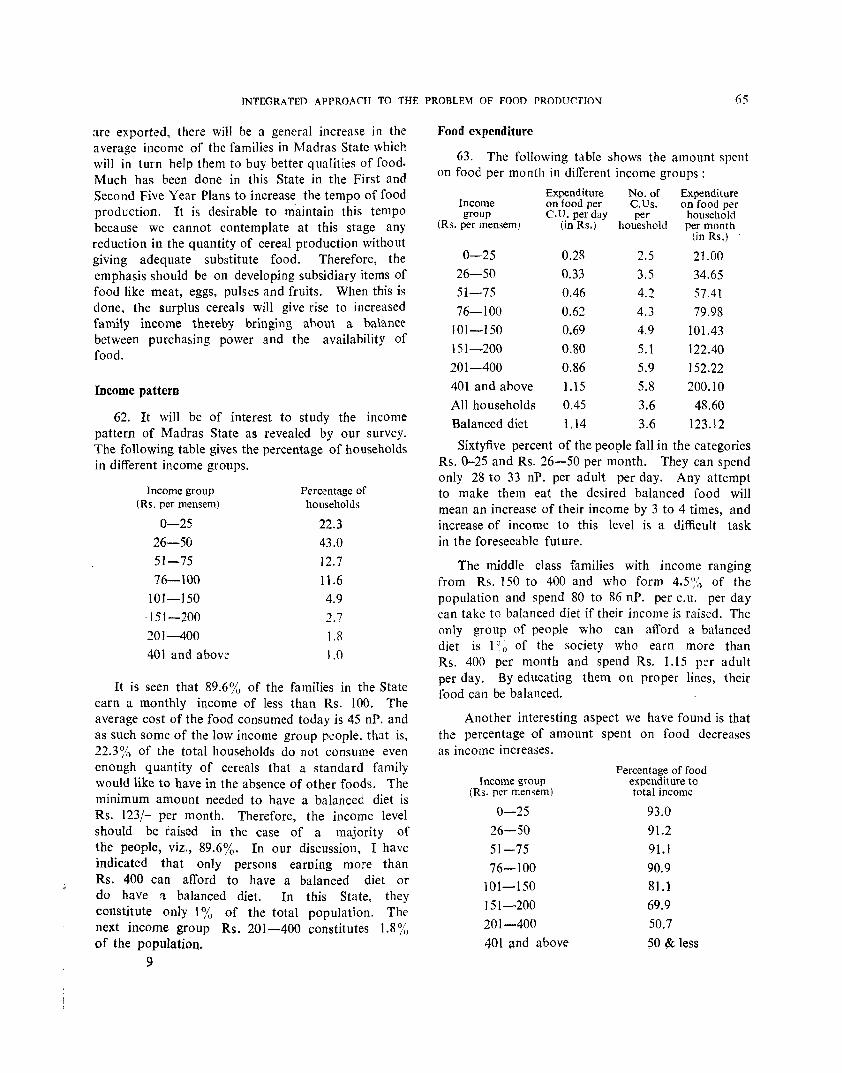
JNTEGRA TED APPROACH 1'0 THE PROBLEM OF FOOD PROnUCTlO:\f 65
are exported, there will be a general increase in the average income of the families in Madras State which will in turn help them to buy better qualities of food. Much has been done in this State in the First and Second Five Year Plans to increase the tempo of food production. It is desirable to m'aintain this tempo because we cannot contemplate at this stage any reduction in the quantity of cereal production without giving adequate substitute food. Therefore, the emphasis should be on developing subsidiary items of food like meat, eggs, pulses and fruits. When this is done, the surplus cereals will give rise to increased family income thereby bringing about a balance between purchasing power and the availability of food.
Income pattern
62. It will be of interest to study the income pattern of Madras State as revealed by our survey. The following table gives the percentage of households in different income groups.
Income group Percentage of (Rs. per mensem) households
0-25 22.3 26-50 43.0 51-75 12.7 76-100 11.6
101-150 4.9 ·151-200 2.7
201-400 l.R 401 and above 1.0
It is seen that 89.6% of the families in the State earn a monthly income of less than Rs. 100. The average cost of the food consumed today is 45 nP. and as such some of the low income group people, that is, 22.3% of the total households do not consume even enough quantity of cereals that a standard family would like to have in the absence of other foods. The minimum amount needed to have a balanced diet is Rs. 123/- per month. Therefore, the income level should be raised in the case of a majority of the people, viz., 89.6%. In our discussion, I have indicated that only persons earning more than Rs. 400 can afford to have a balanced diet or do have ft balanced diet. In this State, they constitute only 1 % of the total population. The next income group Rs. 201-400 constitutes 1.8% of the population.
9
Food expenditure
63. The following table shows the amount spent on food per month in different income groups:
Expenditure No. of Expenditure Income on food per C.Us. on food per group C.n. per day per household
(Rs. per mensem) (in Rs.) houeshold per month (in Rs.)
0-25 0.28 2.5 21.00 26--50 0.33 3.5 34.65 51-75 0.46 4.2 57.41 76-100 0.62 4.3 79.98
101-150 0.69 4.9 101.43 151-200 0.80 5.1 122.40 201-400 0.86 5.9 152.22 401 and above 1.15 5.8 200.10 All households 0.45 3.6 48.60 Balanced diet 1.14 3.6 123.12
Sixtyfive percent of the people fall in the categories Rs. 0-25 and Rs. 26-50 per month. They can spend only 28 to 33 nP. per adult per day. Any attempt to make them eat the desired balanced food will mean an increase of their income by 3 to 4 times, and increase of income to this level is a difficult task in the foreseeable future.
The middle class families with income ranging from Rs. 150 to 400 and who form 4.5 % of the population and spend 80 to 86 nP. per c. u. per day can take to balanced diet if their income is raised. The only group of people who can afford a balanced diet is 1 ~ ~ of the society who earn more than Rs. 400 per month and spend Rs. 1.15 per adult per day. Byeducating them on proper lines, their food can be balanced.
Another interesting aspect we have found is that the percentage of amount spent on food decreases as income increases.
Percentage of food Income group expenditure to
(Rs. per mensem) total income
0-25 93.0 26-50 91.2 51-75 91.1 76-100 90.9
101-150 81.1
151-200 69.9
201-400 50.7
401 and abOve 50 & less

66 FOOD HABITS IN MADRAS STATE
Upto the income level of Rs. 100/- per month, people spend little on items other than food, i.e., 10% of their total income. Persons getting Rs. 100 to 200 spend 20 to 30% of their total income for other items. People earning more than Rs. 200 but who form only 2.8% of the population spend 50% of their income on other items.
Problems and solutions
64. As such, two problems have to be facedone to increase the total production of subsidiary food items and the other to increase the purchasing power of the pepole. Both are inter-linked. Unless a programme is drawn up to increase subsidiary foodstuffs, it will not be possible to increase the income of the people and unless the income is increased, the bulk of the people will not be able to have a balanced diet. In this connection, we may refer to another important factor, that in the case of subsidiary food items, the bulk is even today imported from outside the State.
The policy of the Government has been to regulate the food prices which is more to the advantage of urban land-owners than the rural. The economy of Madras State is purely agrarian and any restriction in the price level of food has an indirect effect on the income level of the land-owners. Cereal is an item which agriculturists need not purcha~e by payment of money and as such any fall in the income will result in the denial of vital items of food to the poorer sections of the population. Again, the trend is for subsidiary items of food to be diverted to the urban sector because of the high price they will fetch. For instance, a large quantity of milk produced in the rural sector is today diverted to the urban sector and no surplus is found in the rural areas because of the price level. This tendency is reflected also in the schemes drawn up by the Government for the development of milk industry in the State. This is an unfortunate situation for vital items of food like meat, eggs, fish, vegetables and fruit are diverted to the urban sector thereby denying them to the rural folk. As it stands today a balanced diet is a luxury which only a few can afford. So, our aim should be to induce people to produce more and more of subsidiary items of food. The Third Plan has emphasised the importance of mixed farming so that even in villages, every encouragement will be given to the growing of vegetables and fruits and production of milk for use of the lower income groups. A lot of emphasis has
been given to the development of agriculture in the Community Development and National Extension Programmes, but due emphasis has not been given to the diversification of agriculture. In the Panchayat Raj Scheme of Madras State which is perhaps considered a model for other States, the responsibility of implementing food production schemes is normally on the Blocks except for the execution of major irrigation projects. From distribution of improved seeds to the execution of minor irrigation works all items of activities like distribution of fertilizers, pesticides and improved implements and training in techniques are the responsibility of the officials of the Blocks.
The following is the programme for Panchayat staff in the field of agriculture. (i) To utilise the potential released by irrigation projects in construction of field channels and maintaining .them in an efficient manner. (ii) Maintenance of minor irrigation works including tube-wells and excavation and maintenance of field channels have been made the responsibility of the village. (iii) Works relating to the dry farming and maintenance of bunds should be undertaken in each village. There should be laws defining the responsibility of beneficiaries for constructing and maintaining bunds on their holdings and for meeting the proportionate cost of common works. (iv) Every village should adopt improved and scientific methods of agriculture that involve (a) the production, as a permanent arrangement in the village of all the seeds and organic and green manures needed; arrangement for supply of these in kind and on credit to those who cannot pay in cash, recoveries being made after the harvest. (b) arrangement for the distribution of fertilizers received for the villager and their supply to small-holders on credit. (c) promotion of Japanese methods of paddy cultivation in all areas suitable for it; adoption of other advanced techinques for wheat and similar crops in accordance with suggestions offered by the technical departments and in other ways working for the diversification of agricultural economy. (d) development of animal husbandry, dairy farming and fisheries programme. The programme has been defined in clear terms. To what extent it has been implemented is a matter for separate study. But, definite integrated programmes are yet to be evolved to fulfil the objectives laid down for the Panchayat Raj.
The first specific scheme to teach the villagers the importance of a balanced food is an Expanded Nutrition Programme launched by the Government of
iNTEGRATED APPROACH TO THE PROBLEM OF FOOD PRODUCTION 61
Madras with the assistance of the UNICEF. The object of the programme is to encourage village communities to adopt practices in production and consumption of protective food and to stimulate through the programmes, self-help in this respect. The programme also aims at expanding the training of village level workers in human nutrition and operating viable nutritional programmes in the various centres selected and providing the required experience for trainees and starting refresher courses for graduates. The centres selected are the seven rural extension centres of Krishnagiri, Bhavanisagar, S.V. Nagaram, T. Kallupatti, Aduthurai, Koilpatti and Pattukottai; the three Home Science wings connected with S. V. Nagaram, T. Kallupatti and Bhavanisagar, and the seven blocks of Krishnagiri, Bhavanisagar, Ami, Kallupatti, Tiruvadimarudur, Pattukottai and Koilpatti attached to the training centres. The Government of Madras have constituted a working committee at the State level to guide the implementation of the programme. At the village level, the Panchayat establishment is in charge of the programme and the Panchayat Union at the block level. To secure coordination between the Panchayat, the project staff and the training centres, coordinating centres are to be set up at the block level. The project has been taken up with the technical approval of the Food and Agriculture Organisation and the World Health Organisation. As the work progresses, technical problems will be referred for their advice. The UNICEF will also provide technical supplies and equipment and official assistance for the training programmes. The programme aims specifically at improving teaching facilities, providing practical and field training and mobilising the primary producers for participation in increased production. The foods which are still to be increased include eggs, fish, vegetables, poultry and fruits. The programme aliO contemplates increased production of fodder and better animal husbandry practices, so that more milk will be produced. The Government have also decided to appoint a project nutrition officer to devote his full time for the work in the State. The plan of operation laid down details the training and other work to be done at the various levels. They include starting of poultry units at Block headquarters and village panchayat units for every 2,000 popUlation and provision of incubators and brooders. The available water ponds are to be stocked with fish.
Panchayats will be required to supply to 50 expectant and nursing mothers and 100 pre-school children
in each 1,000 popUlation with 1000 lbs. of fish a year. Each adult will receive a total of 6 ozs. and each child 3 ozs. School gardens are to be developed under the programme. Panchayats shall provide a garden upto one acre for 2,000 population. In these and other places where schools already own lands, gardens will be started to produce vegetables and fruits of high nutritional value. The produce from these gardens will be utilised in school feeding programmes. A short term training for school teachers is also contemplated as well as mobilising local youth clubs for this work. Wherever possible, the Panchayat will make
. available at least 5 acres of land for production of fodder, vegetables, etc. The object of this programme is to provide at least one acre for vegetables and fruits for school lunch if there is no separate school garden. The programme will be started in all the villages of each block. It will be first confined to selected areas of certain districts and it is meant to cover the whole State in the long run. The programme aims at an ideal state and the implementation in selected centres however will not solve the problem. This programme on less emphasised lines should be implemented in all blocks of the State, more as the programme of the people to increase the food production than as a programme imposed from above. Madras State has a solid achievement to its credit, i.e., it has raised the production of paddy in the last decade. It is, therefore, within human possibility to develop vegetable and fruit gardens and dairy farms.
The major problem facing the State is malnutrition. It is generally attributed to the rising population, high prices and low purchasing power of the people. To this is added the imbalance in the agricultural planning which has tended to emphasise the production of cereals a little too much and failed to give equal importance to raise the output of protective foods like milk, vegetables, eggs, fruit and fish.
It will be seen from Table 12-2 that 12.8 lakh tons in 1961, 23.8 lakh tons in 1966 and about 30.7 lakh tons in 1971 will be rendered surplus if the people stick to the recommended allowance. These quantities expressed in monetary terms amount to 102, 190 and 245 crores of rupees respectively. This amount can definitely raise the standard of living in Madras State. What is needed is a systematic and gigantic effort on the part of the Government and the people to concentrate on the producion of other
68 t'OOD HABITS IN MADRAS STATE
protective foods. Again, the law of diminishing returns is likely to operate in the production of cereals. Therefore, a diversification of agricultural practices will be a necessary step.
It is usual to blame the traditional habits of food as a bar to our progress. By a process of trial and error, the traditional pattern of diet has been evolved in the past to suit the local climate and occupation of the people. But this pattern has been modified by adoption of milling of grains, failure to produce supplemental food and high price level caused by food shortages. We have, therefore, considered the question of consuming a balanced food rather than a rich food.
Improvident maternity is not such a serious problem in this State. Even the limitation of a family on the scientific basis will not lead to the solution of a more basic problem we are facing today, viz., that more than 99% eat an imbalanced diet and 99% cannot afford to buy a balanced diet; diversified agricultural production alone can provide better food to the citizen and at the same time increase his purchasing power.
Our economy is agrarian and will continue to be so for many decades and as such due emphasis on agricultural production and increasing dairy farming are proper solutions for our problem.

Year
1782-83
1806-07
1812-13
1876-77
1877-78
1899-1900
1903-04
1904-05
1905-06
1906-07
1907-0l)
1939-40
F
F
S
F
F
S
S
S
S
S
S
F
APPENDIX I
List of Famines and Scarcities
Area affected
Madras City and its environs
Central Madras
Part of the Province of Madrah
Madras
Madras
Part of Madras
Coimbatore and Chingleput Districts
do
do
do
do
Coimbatore District
F=Famine
S=Scarcity
(Source: Census of India, 1951-Volume I, Part I-B)
Conversion Table
One Ounce = 0.0283495 Kilograms
One Pound = 0.4535924 "
One Cwt 50.802 "
One Ton = 1,016.05 "
One Maund= 37.3242 "
One Ton 1.01605 Tonnes

APPENDIX II
Extract from" The Hindu" dated August 29, 196 j
A Nutritionist's View of Third Plan
[Hunger may be prevented by the attainment of the
target of 100 million tons of foodgrains by the
end of the Third Plan, but to ensure nutrition and
health greater stress should be laid on the
production of food other than cereals, according
to the writer who was connected with the
Nutrition Laboratories at Coonoor.]
By S. RANGANATHAN
The final draft of the Third Five Year Plan has been approved by the Lok Sabha. It has aimed at a 32 per cent increase in the production of foodgrains from the current level of 76 million tons (1960-61) to 100 million tons in 1965-66. While an increased production of an essential commodity like food grains is no doubt welcome, especially in the context of the country's accelerating growth of population, it is relevant to consider whether such an increase is necessary or desirable or even justifiable on nutritional grounds. It is imperative that every endeavour should be made to produce sufficient food within the country to feed adequately the entire popUlation. Internal production must be augmented not only to eliminate imports but also to build in comfort buffer stocks to tide over lea.n years and natural calamities. It is therefore, natural that production of enough food must have precedence over the quality of food. Once this prime necessity of sufficiency is satisfied, other consideration like quality should claim equal, if not more, attention.
.Judged by the standard of sufficiency, the current production of 76 millions tons would provide over 17 ounces per head of the population, man, woman, young and old alike. This will work out to more than 20 ounces per "consumption unit" or " adult man value", computed on the basis of 1 00 of the population being equivalent to 83 "consumption units". The import of foodgrains to the tune of three million tons annually is not reckoned in this calculation. Such a provision of food should normally
be deemed satisfactory, providing as it does, about 1,700 calories; it would definitely ward off hunger. But the paramount duty of a Welfare State lies in not merely preventing hunger but in providing also a well balanced diet to every citizen so that he or she may be enabled to lead a healthy and gainful life and effectively contribute to national prosperity.
In spite of the apparently comfortable pOSitIOn with regard to cereal, the accent in agricultural policy still continues to be on more and yet more cereals. The target at the end of the Third Plan of 100 million tons may afford some solace to the common man who may be groaning under semistarvation or subsisting on marginal levels of food intake for far too long, or even to the agricultural economist. But, certainly, it will not enthuse the nutritionist who is already visibly agitated over the heavily lopsided cereal diet of a vast majority of the population. Hunger may be prevented, but nutrition and health will not be ensured. Not much will be gained by merely preventing hunger now, if only to subject the population later to numerous preventable deficiency diseases. This does not imply that sufficient importance should not be paid to the prevention of hunger; it should, in fact, receive the topmost priority in any scheme of national development. But for a planned integrated agricultural policy, the present situation calls for a greater stress on the production of foods other than cereals, particularly the protective foods like pulses, milk, vegetables and fruits now that the country has reached a comfortable position with regard to cereals. There can be no doubt that such a policy will yield rich dividends in the shape of a healthier community.
That some substantial progress in agricultural production including the production of protective foodstuffs, has been recorded is undeniable. It is equally undeniable that much leeway still remains to be covered before the population gets anywhere near a reasonably balanced diet, even on the modest scale recommended by the Nutrition Advisory Committee of the Indian Council of Medical Research. The amounts of the various foodstuffs needed for ensuring such a balanced diet to the present popUlation are given below:
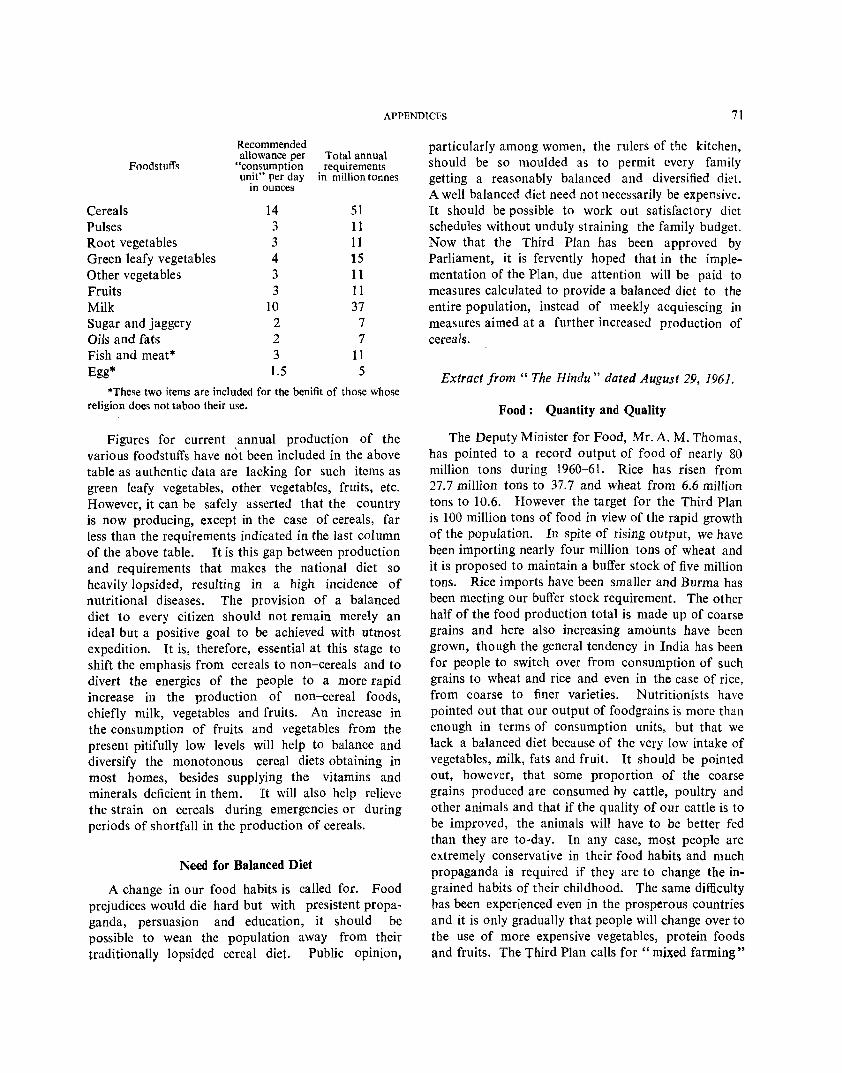
APPENDICES 71
Recommended allowance per Total annual
Foodstuffs "consumption requirements unit" per day in million tonnes
in ounces
Cereals 14 51 Pulses 3 11 Root vegetables 3 11 Green leafy vegetables 4 15 Other vegetables 3 11 Fruits 3 11 Milk 10 37 Sugar and jaggery 2 7 Oils and fats 2 7 Fish and meat* 3 11 Egg* 1.5 5
*These two items are included for the benifit of those whose religion does not taboo their use.
Figures for current annual production of the various foodstuffs have not been included in the above table as authentic data are lacking for such items as green leafy vegetables, other vegetables, fruits, etc. However, it can be safely asserted that the country is now producing, except in the case of cereals, far less than the requirements indicated in the last column of the above table. It is this gap between production and requirements that makes the national diet so heavily lopsided, resulting in a high incidence of nutritional diseases. The provision of a balanced diet to every citizen should not remain merely an ideal but a positive goal to be achieved with utmost expedition. It is, therefore, essential at this stage to shift the emphasis from cereals to non-cereals and to divert the energies of the people to a more rapid increase in the production of non-cereal foods, chiefly milk, vegetables and fruits. An increase in the consumption of fruits and vegetables from the present pitifully low levels will help to balance and diversify the monotonous cereal diets obtaining in most homes, besides suppJying the vitamins and minerals deficient in them. It will also help relieve the strain on cereals during emergencies or during periods of shortfall in the production of cereals.
Need for Balanced Diet
A change in our food habits is called for. Food prejudices would die hard but with presistent propaganda, persuasion and education, it should be possible to wean the population away from their traditionally lopsided cereal diet. Public opinion,
particularly among women, the rulers of the kitchen, should be so moulded as to permit every family getting a reasonably balanced and diversified diet. A well balanced diet need not necessarily be expensive. It should be possible to work out satisfactory diet schedules without unduly straining the family budget. Now that the Third Plan has been approved by Parliament, it is fervently hoped that in the implementation of the Plan, due attention will be paid to measures calculated to provide a balanced diet to the entire population, instead of meekly acquiescing in measures aimed at a further increased production of cereals.
Extract from" The Hindu" dated August 29, 1961.
Food: Quantity and Quality
The Deputy Minister for Food, Mr. A. M. Thomas, has pointed to a record output of food of nearly 80 million tons during 1960-61. Rice has risen from 27.7 million tons to 37.7 and wheat from 6.6 million tons to 10.6. However the target for the Third Plan is 100 million tons of food in view of the rapid growth of the population. In spite of rising output, we have been importing nearly four million tons of wheat and it is proposed to maintain a buffer stock of five million tons. Rice imports have been smaller and Burma has been meeting our buffer stock requirement. The other half of the food production total is made up of coarse grains and here also increasing amounts have been grown, though the general tendency in India has been for people to switch over from consumption of such grains to wheat and rice and even in the case of rice, from coarse to finer varieties. Nutritionists have pointed out that our output of foodgrains is more than enough in terms of consumption units, but that we lack a balanced diet because of the very low intake of vegetables, milk, fats and fruit. It should be pointed out, however, that some proportion of the coarse grains produced are consumed by cattle, poultry and other animals and that if the quality of our cattle is to be improved, the animals will have to be better fed than they are to-day. In any case, most people are extremely conservative in their food habits and much propaganda is required if they are to change the ingrained habits of their childhood. The same difficulty has been experienced even in the prosperous countries and it is only gradually that people will change over to the use of more expensive vegetables, protein foods and fruits. The Third Plan caUs for" mixed farming"
72 FOOD HABITS IN MADRAS STATE
so that even in villages. every encouragement will be given tl) the growing of vegetables and fruit and the producrion of milk for the use of mothers and children.
In this connection, we may turn to the experience of the various State Governments which have been trying to improve both the quantity and quality of foodgrains by distributing improved seed among the farmers. The recent report of the programme evaluation organisation of the Planning Commission on this subject of improved seed, shows what has been done and what remains to be done. At the beginning of the First Plan, improved seed distribution had largely been confined to commercial crops like tea, jute, sugarcane, groundnut, etc., and only a few progressive farmers in India had begun to use improved seed for foodgrains. The method used to popularise improved seed was to
set up seed farm,> in each Block or district where the improved varieties obtained from the research station were sown in order to raise "foundation seed". During the past decade nearly 380 different varieties of improved paddy seed were on the recommended list of ten States of India. The main advantages of such seed include higher yield, resistance to pests and
diseases, period of maturity and quality. Most States were inclined to recommend the higher yielding types, though they might be coarser, have less market value or be more susceptible to the diseases that afflict plants. A really scientific approach to the problem would require the distribution of seed according to soil requirements, irrigation facilities, local history of plant infections and market demand. We are still very far from having achieved anything like this partly because many of our farmers are not progressive and partly because we lack the technical men who can give the correct advice and grow the improved seed according to scientific principles. However, considerable progress has been registered and it should be remembered that the State seed farms are new ventures which cannot be expected to succeed in a few years. In view of the nutritional experts' criticism that there should not be too much concentration on cereals, the seed farms will have to be extended to the growing of seeds for vegetables, pulses and fruit also. Scientific horticulture has been somewhat neglected and is an extremely complex affair. If" mixed farming" is to succeed we will need a large number of trained horticulturists as well as agricultural graduates and diploma-holders.

District Taluk
(1) (2)
Madras
Chingleput Ponneri
10
APPENDIX III
Areas comprising the zones Places in
r-------------'---------- ----'"""'" Rice zone Mixedjzone Millet zone
(3) (4) (5)
Entire City Ponneri Minjur Arani Perumbedu Kattoor Orakkadu Sholavaram Medur Pulicat Avoor Parnambedu Kilikodi Kattavoor Erisivan Eliambedu Pondavakkam Madhavaram Sothuperumbedu Karanodai Athur Malliankuppam Chinnambedu Natham Bandikavanoor Jagannathapuram Panjetti Andarcuppam Amoor Sennivakkam Sayanavaram Kodur Devadanam Kaniambakkam Voyalur Kattupalli Vannipakkam Nayar Nerkundram Alamadhi Nallur Perungavoor Melmudalambedu New Gummidipoondi Old Gummidipoondi Enadhimelpakkam
Rest of the taluk

74 FOOD HAllITS IN MADRAS STATE
District Taluk Places in
:~----------~--------------~ Rice zone Mixed zone Millet zone
(I) (.2-) (3) (4) (5) Chingleput-(cont.) Ponneri-(cont.) Rettambedu
Athupakkam Valudalambedu Ayanallur Puduvoyal Peruvoyal Madarpakkam Manellore Amirthamangalam Poovalambedu Mukkarambakkam Erukkuvoy Palavakkam Pallavada Nelvoy Mangalam & Karani
Tiruvellore Tiruvellore Municipality Rest of the taluk Tiruttani Entire taluk Sriperumbudur Poonamallee and Avadi Rest of the taluk
Panchayat areas Saidapet Aminjikarai firka Rest of the taluk
Pallikaranai firka Villivakkam firka Saidapet firka Madavaram firka
Chingleput Chingleput town Rest of the taluk Kanchipuram Kanchipuram Municipality Rest of the taluk
Walajabad Panchayat Madurantakam Madurantakam Rest of the taluk
North Arcot Arkonam Arkonam Muncipal area Rest of the taluk Walajapet Entire taluk Gudiyattam Gudiyattam Municipal area Rest of the taluk
Darapadavedu Panchayat Katpadi Panchayat Pernampet Panchayat
Tiruppattur Tiruppattur Municipaljty Rest of the taluk Bheemakulam Vaniyambadi Municipality Naickanur
Elagiri Hills Pungampattu-
madu Vellore Vellore MUllcipality Rest of the taluk Alleri
Ambur Municipality J arthankollen Thorapadi Panchayat Naickeneri
Puducuppam and Pinjimoodai Elupparai Peria pana parai
and Mullavady

APPENDICES 75
Places in District Taluk ,- ..;._ -,
Rice zone Mixed zone Millet zone
(1) (2) (3) (4) (5)
North Areot-(eo1lt.) Ami Ami firka Rest of the taluk Agarapalayam firka Kannamangalam firka Vinnamangalam firka S. V. Nagaram firka Kasthambadi firka
Cheyyar Entire taluk Wandiwash Entire taluk Polur Rest of the taluk Veerappanur
Nammiyampattu Kannamalai Kovilur Kuttakarai
Chengam Rest of the taluk Pelamarathur and Vannananakuttai
Melsilambadi Padapanjamara-
thur Puliyur Perumuttan Melpattu ChinnakiI pa tt u Kilpattu Attipattu NeUivoy Melthattipattu Kilthattipattu Bhimarapatti Mel mala chi Akkarapatti Semmambatti
Tiruvannamalai Entire taluk
South Areot Gingee Entire taluk Tindivanam Tindivanam Municipality Rest of the taluk Villupuram Villupuram Panehayat and Rest of the taluk
Valavanur Panchayat areas Tirukkoilur TIrukkoilur Panchayat Rest of the taluk
and Tiruvennainallur Panchayat areas
Kallakuruchi Entire taluk V ridhachalam Tittagudi Rest of the taluk
Vasishtapuram Perumalai Pulivalam Sirumalai Pudukulam Vaiyankudi Kiliyur
76
District Taluk
(1) (2)
South Arcot-(cont.) Vridhachalam(cont.)
Cuddalore
Chidambaram
FOOD HABITS IN MADRAS STATE
Places in r--------------'-------___ , """ Rice zone Mixed zone Millet zone
(3)
Avinagudi Thoravalore M ugundanall ur Melpathi-Sathukudal Kilpathi-Sathukudal Budanur Alichikudi Ka. Elamangalam Paravalur Vayalur Vridhachalam T. V. Puthur Vannankudikadu Vettakudi Rajendrapattanam Chinnathukurichi Gudalur Kodikkalam Thiruvattath urai Eraiyur Pennadam Kothattai Theevalur Kavanur Dharmanall ur Neyveli
(4)
Cuddalore Municipality Rest of the taluk Nellikuppam Major Pan-
chayat Panrutti Major Panchayat Neyveli Township included
in 163 Velayudanpattu 206 Velunkuppam and
161 Perumathur Rest of the taluk Palanchanallur
Veeranandapuram Karungudi Kanjankollai Kiliyanoor Saliyantope Agaraputhur Vanamadevi Kanur Karunakaranathut Kavalakudi Gudayalathur Kokkarasanpettai Anandakudi
(5)
APPENDICES 77
Places in District Taluk r--------------~--------------~
Rice zone Mixed zone Millet zone (I) (2) (3) (4) (5)
South Arcot-(cont.) Chidambaram- Kozhai (cont.) Konamangalam
Sri Sathamangalam Madakalira-
manickam Mala varayanallur Komarakudi Mamangalam Kondasamudram M udikandanallur Nangudi Kothandavilagam Sri Nedunjeri Nagarappadi Palayancottai Mel Palayancottai Kil Perur Sriputhur Kallipady Ayenkilpuliyangudi Solathiram Pudaiyan Srimushnam Melapuliyangudi Thethampattu Sri Vakkaramari
. Sri Adivarahanallur Valasakadu Kurinikudi Vatthaur Naddeswara-
mangalam Vadakkupalayam Ramapuram Shro Thornkuppam Sathavattam Kil Puliyangudi Sithamalli Alichigudi Sathamangalam Sethiyatope Anaivari Thatchakadu Therkuttittai Vadakuttittai ViIliyanali ur
Salem Hosur Entire taluk (except AndevanapaUi the villages men- Salivaram tioned under col. 5) Kunducottai
78
District
(1)
Saiem-( coni.)
Taluk
(2)
Hosur-(cont.)
Krishnagin
Harur Dharmapuri Omalur Yereaud
Salem
Sankari Tiruehengode
Rasipuram
Attur
Namakkal
FOOD HABITS IN MADRAS STATE
Places in ,---------------~--------------~
Rice zone Mixed zone Millet zone
(3)
Krishnagiri and Kaveripatnam panchayats
Mettur Township Ycrcaud town (Shevaroys
Panchayat) Salem town Suramangaiam
Kondalampatti
Tiruehengode Pallipalayam Komarapalayam Paneha-
yats
(4)
Rest of the taluk
Entire taluk Entire tal uk Rest of the taluk Rest of tke taluk
Rest of the taluk
Entire taluk Rest of the taluk
(5)
Madakkal fhagatti Natrampaiayam Thoddamanchi Uri gam Kottaiyur ManchukondapaJli
Arunooth umalai Periyakuthi-
maduvu Puzh uthikuttai Zarugumalai Thekkalpatti Thumbalpatti Kammalapatti Kuralnatham Jambuthumalai Adimalaipatti
Entire taluk except Alathurnad the villages men- Thiruppulinad tioned in column 5 Gundunninad
Entire taluk except the villages mentioned in column 5
Entire taluk except the vilages mentioned in column 5
Edappulinad Bilenad Perakkarainad Sithurnad Periyakalrayan Chinnakalrayan Pachamalai Pappanaikanpatti Thinnonoornad Devanur Nad Gundur Nad Valappur Nad Ariyur Nad Selyur Nad Valavandi Nad

APPENDICES 79
Places in District Taluk r--------------~--------------,
Rice zone Mixed zone Millet zone
(I) (2) (3) (4) (5)
Coimbatore Bhavani Bhavani and Andhiur and Rest of the taluk Bargur Kavandapadi Panchayat
areas Gobichetti- Gobi town and Bhavani- Rest of the taluk Gu thiala th ur
palayam sagar Koothampalayam· Hasanur
Erode Erode Municipal town Rest of the taluk B. P. Agraharam Perundurai Panchayat Chennimalai Panchayat Kodumudi Panchayat
Dharapuram Dharapuram Town Rest of the taluk Palladam Tiruppur Municipal area Rest of the taluk Avanashi Avanashi Rest of the taluk Kallar R. F.
Annur Panchayat area Pillur Slope Mettupalayam Municipal Unjalkaraikombai
area Marikode Gopanarai R.F. KilpiIIur RF.
Coimbatore Coimbatore Municipal Rest of the taluk area
Madukkarai Peelamedu Singanallur (Podanur and
Kurichi) Pollachi Pollachi Municipal area Rest of the taluk
Anamalai (P) area Valparai Township
Udumalpet Udumalpet town Rest of the taluk Kaniyur K umaralingam Karatholuvu
Nilgins Gudalur Gudalur Rest of the tal uk Ootacamund Ootacamund Town Rest of the taluk Coonoor Coonoor Town Rest of the taluk
Kotagiri Arvangadu Wellington
Madurai Dindigul Dindigul town Rest of the taluk Palani Pal ani Municipality Rest of the taluk
Ayakudi Panchayat and Neikkarapatti village
Kodaikanal KookkaI Rest of the tal uk Vilpatti Poombarai Mannananoor Poondi Vellakavi
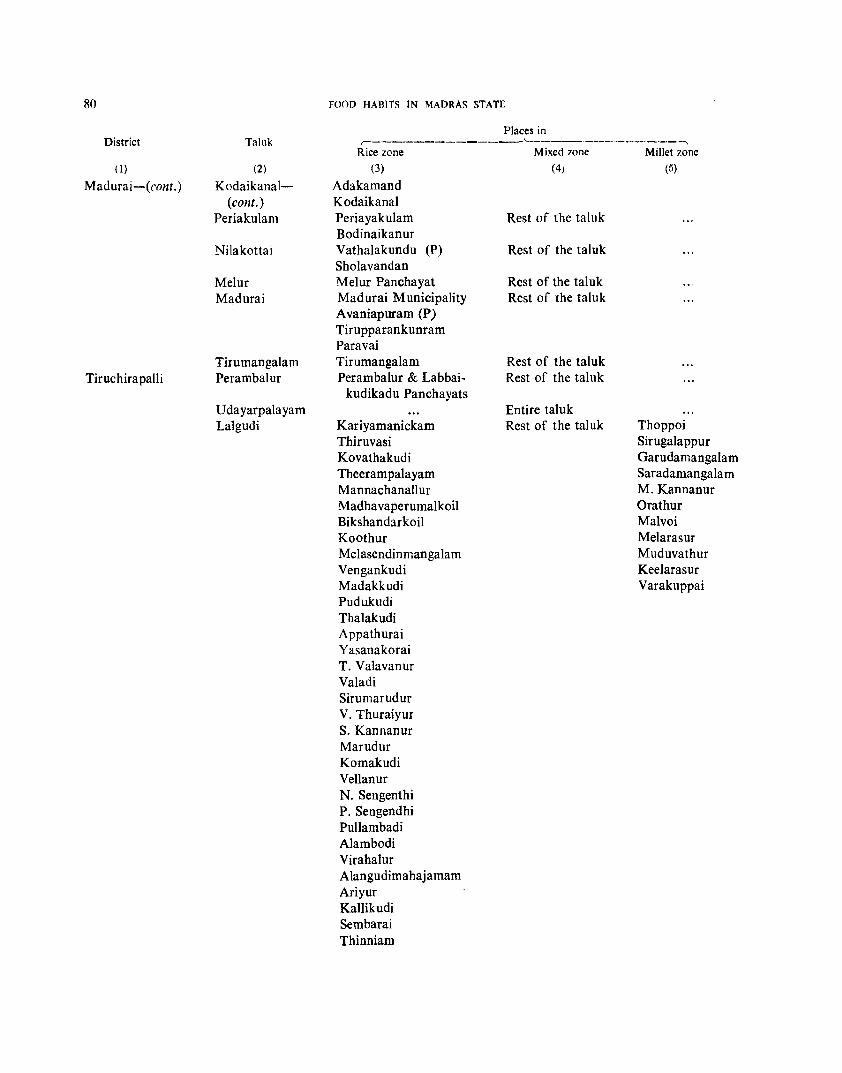
80
District
(1)
Madurai-(cont.)
Tiruchirapalli
Taluk
(2)
Kodaikanal(cont.)
Periakulam
Nilakottai
Melur Madurai
Tirumangalam Perambalur
Udayarpalayam Lalgudi
FOOD HABITS IN MADRAS STATE
Places in r-----------------'-----~~--------__.,
Rice zone
(3)
Adakamand Kodaikanal Periayakulam Bodinaikanur Vathalakundu (P) Sholavandan Melur Panchayat Madurai Municipality Avaniapuram (P) Tirupparankunram Paravai Tirumangalam Perambalur & Labbai-
kudikadu Panchayats
Kariyamanickam Thiruvasi Kovathakudi Theerampalayam Mannachanallur Madhavaperumalkoil Bikshandarkoil Koothur Melasendinmangalam Vengankudi Madakkudi Pudukudi Thalakudi Appathurai Yasanakorai T. Valavanur Valadi Sirumarudur V. Thuraiyur S. Kannanur Marudur Komakudi Vellanur N. Sengenthi P. Sengendhi Pullambadi Alambodi Virahalur Alangudimahajamam Ariyur Kallikudi Sembarai Thinniam
Mixed zone
(4)
Rest of the taluk
Rest of the taluk
Rest of the taluk Rest of the taluk
Rest of the taluk Rest of the tal uk
Entire taluk Rest of the taluk
Millet zone
(5)
Thoppoi Sirugalappur Garudamangalam Saradamangalam M. Kannanur Orathur Malvoi Melarasur Muduvathur Keelarasur Varakuppai
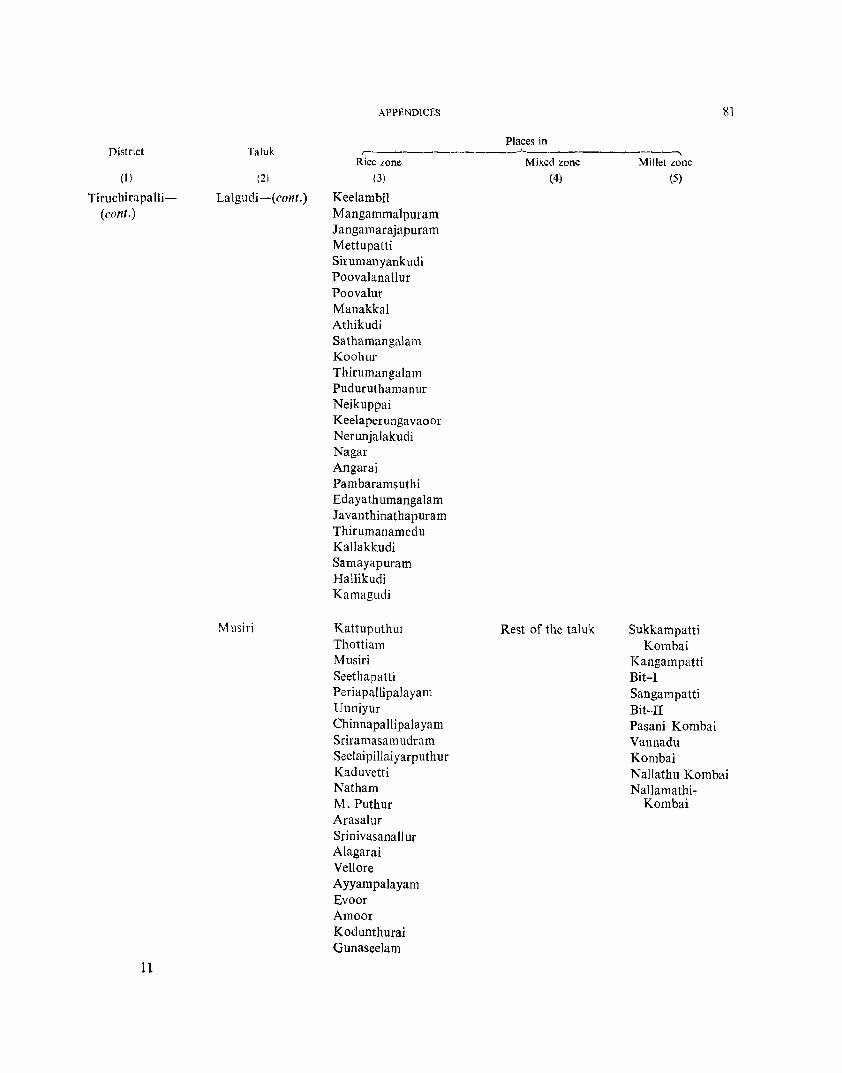
APPEND1CES R]
Places in District Taluk ,--------------"-------------,
Rice zone Mixcd zone Millet zone (1 ) (2) (3) (4) (5)
Tiruchirapalli- Lalgudi-(cont.) Keelambil (cont.) Mangammalpuram
Jangamarajapuram Mettupatti Sirumanyankudi Poovalanall ur Poovalur ManakkaI Athikudi Sathamangalam Koohur Thirumangalam Puduruthamal1ur Neikuppai Keelaperungavaoor N erunjalakudi Nagar Angarai Pambaramsuthi Edayathumangalam J avanthinathapuram Thirumanamedu Kallakkudi Samayapuram Hallikudi Kamagudi
Musiri Kattuputhur Rest of the taluk Sukkampatti Thottiam Kombai Musiri Kangampatti Seethapatti Bit-I PeriapaUipaJayam Sangampatti Unniyur Bit-II ChinnapaIlipaJa yam Pasani Kombai Sriramasam udram Vannadu Seelaipillaiyarputhur Kombai Kaduvetti Nallathu Kombai Natham Nallamathi-M. Puthur Kombai Arasalur Srinivasanallur Alagarai Vellore Ayyampalayam Evoor Amoor Kodunthurai Gunaseelam
11

82 FOOD HAnITS TN MADRAS STATE
Places in District Taluk
, __________ ..A.. __________ -......
Rice zone Mixed zone Millet zone (1) (2) (3) (4) (5)
Tiruchirapalli- Karur Karur Municipality Rest of the taluk (COil!.) Pallipattu
Aravakurichi and Pugalur Panchayat areas
Kulithalai Tirukkampuliyur Rest of the villages in Krishnarayapuram the taluk Kammanallur Magadanapuram·-North Chintalavadi Sithalavoy Pilla pala yam Kallappalli Karuppattur K. Pettai Vathiam Manathattai Kulithalai (Urban) Rajendram Marudur-North Marudur-South Kumaramangalam Poyyamani Nangavaram-North Sooriyanoor Mudalaipatti Cheplapatti Neithaloor Inangoor Thimmampatti Inam Sivayam Inam Komalipparai lnam Sathiamangalam
Tiruchirapalli Trichy Municipality Rest of the taluk
Srirangam Municipality Golden Rock Railway
Colony Golden Rock Panchayat Abishegapuram Andanallur firka villages Srirangam firka villages Trichy firka villages Manikandam firka villages
Kulathur Entire taluk
Alangudi Pudukottai Municipality Rest of the taluk Alangudi and Karambak-
kudi Panchayat areas
Tirumayam Entire taluk

District
(1)
Thanjavur
Taluk
(2)
Arantangi
APPENDICES
Places in ,-----------"----------___.._
Rice zOne Mixed zone Millet zOne
(3)
Neivathali Sathanendal Neivelinathapuram Vembangudi Merpanaikadu Balakrishnapuram Ayingudi Vallavarai Sethurayanendal Arasarkulam Ramanujapuram S ubramania puram Arunachalapuram Chittakanni Chidambarapuram Seenamangalam Darmarajanvayal Pillayarendal Koohanur Nagudi Karavayal Thedakki and Poonavan·
gundu Pooanvayal Adalaikalabaira vapuram Karakadu Athani Ochakudi Enadi Kalakkamangalam Omakkanavayal Kambarkoil N emmelikad u Egaperumalur Eginivayal Koompallam Rendani Ukkadai Reghunathapuram Kokkumuttai Kandichankadu Kadiedayathur Edayathur Solani Silathani Maivayal Brahmanavayal Manavanallur Ammanjakki
(4) (5)
Rest of the taluk
83
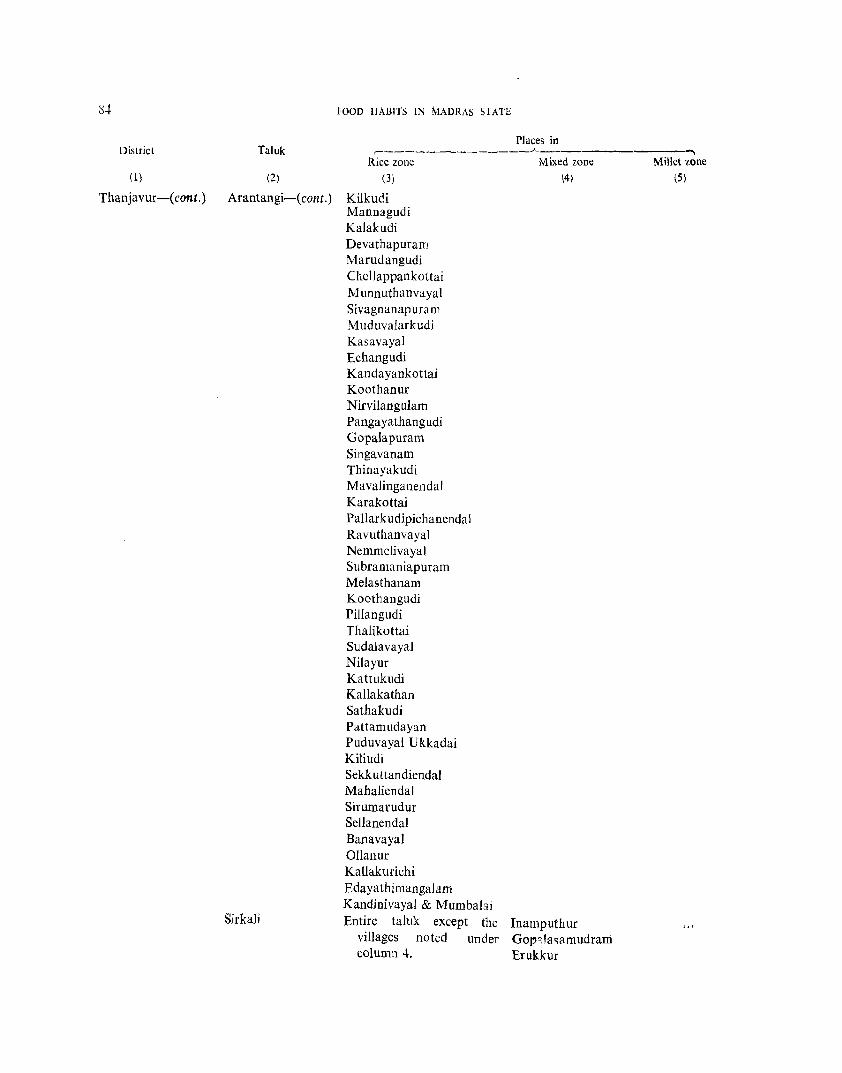
~q tOOD HAlliTS IN MADRAS STATE
Places in District Taluk r--------------~
Rice zone Mixed zone Millet zone (1) (2) (3) \4) (5)
Thanjavur-(cont.) Arantangi-( cont.) Kilkudi Mannagudi Kalakudi Devathapuram Marudangudi Chellappankottai Munnuthanvayal Sivagnanapuram Muduvalarkudi Kasavayal Echangudi Kandayankottai Koothanur Nirvilangulam Pangayathangudi Gopalapuram Singavanam Thinayakudi Mavalinganendal Karakottai Pallar kudipichanenda I Ravuthanvayal Nemmelivayal Subramaniapuram Melasthanam Koothangudi Pillangudi Thalikottai Sudalavayal Nilayur KattuktJdi Kallakathan Sathakudi Pattamudayan Puduvayal Ukkadai Kiliudi Sekkuttandiendal Mahaliendal Sirumarudur Sellanendal Banavayal OUanur Kallakurichi EdayathimangaJam KandinivayaJ & Mumbalai
Sirkall Entire taluk except the Inamputhur villages noted under Gop11a<;amudram column 4. Erukkur

APPENDICES 85
Places in District Taluk ,..--.-- _;.,_----~ ---------""\
Rice zone Mixed zone Millet zone (1) (2) (3) (4) (5)
Thanjavur-(cont.) Sirkali-(cont.) A. Makaranchatiram Koothiyampettai Palayampalayam N allanayakapuram ArappaUam Agaravattaram Mudalaimedu Thandavankulam Madanam Puthupattinam Maharajapuram MahendrapaHi Kattur Vettangudi Radhanallur (69) Thennampattinam Perunthottam Agara Perunthottam Keelaiyur
Mayuram Entire taluk
Kumbakonam Entire taluk
Nannilam Entire taluk
Papanasam Entire taluk
Thanjavur Tirukattupalli Nandavanapatti Tiruvaiyaru Punganur Naducaveri A varampatti Sengipatti and Tanjore- Sellappanpettai
firkas Veeramarasampettal Pudupatti Sengipatti Achampatti Palayapatti South Palayapatti North Pudukudi Thenpathi Manayeripatti Sanurapatti M uth uveerakandi-
yampatti Pudukudi Vadapathi Madigai firka Vallam firka villages
Orthanad Villages in Orthanad firka Villages in Gandar-vakottai firka
Eachankottai firka Kavalipatti Kavalipatti firka Pannikondamviduthi Ulur firka Kad uvettividuthi

86
District
(1)
Thanjavur-( COllt.)
FOOD HABITS IN MADRAS STATE
Places in Taluk (-------------~--------------~
Rice zone Mixed zone Millet zone (2) (3) (4) (5)
Orthanad-(cont.) Sillathur firka Thondarampet tirka
Neivelivadapathi Senniyaviduthi Krishnapuram Kallakottai firka villages
Mannargudi
Nagapattinam
Thiruthuraipoondi
Pattukkottai
Entire taluk except the villages noted under column 4.
Entire ialuk
Entire taluk
Entire taluk except the villages noted under column 4.
Moovarkottai Vaduvur Vadapathi Edamalayur Vaduvur Thenpathi Inam Karakottai Peraiyur Serumangalam Inam Athikottai Edakeelayur Thiruppalakudi Ullikottai Inam Ullipettai Inam Mohanasahib
Thottam Mahadevapatnam Inam Navasahib-
Thottam Nemmeli Karavakurichi Vaduvur Melpathi Thalikottai Neduvakottai Rajasambalpuram Inam Paravakottai Koopachikottai
Keeramangalam Sendangudi Nagaram Kothamangalam Kolamangalam Panangulam Anabayal Andavarayapuram Pulichangadu Lakshminarasimha-
puram Zamin Serialur Neduvasal West
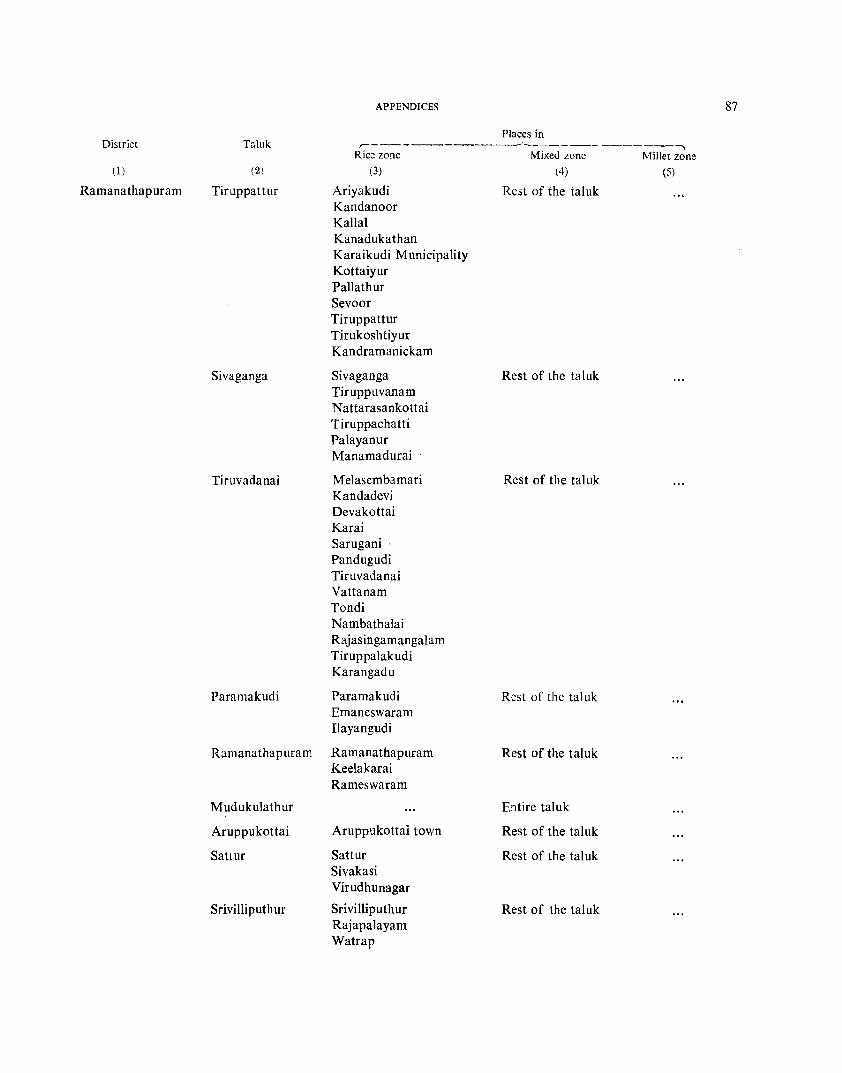
APPENDICES 87
Places in District Taluk r-------------'-------- --------,
Rice zone Mixed zone Millet zone (I) (2) (3) (4) (5)
Ramanathapuram Tiruppattur Ariyakudi Rest of the taluk Kandanoor Kallal Kanadukathan Karaikudi Municipality Kottaiyur Pallathur Sevoor Tiruppattur Tirukoshtiyur K andramanickam
Sivaganga Sivaganga Rest of the taluk Tiruppuvanam Nattarasankottai Tiruppachatti Palayanur Manamadurai
Tiruvadanai Melasembamari Rest of the taluk Kandadevi Devakottai Karai Sarugani ' Pandugudi Tiruvadanai Vattanam Tondi Nambathalai Rajasingamangalam Tiruppalakudi Karangadu
Paramakudi Paramakudi Rest of the taluk Emaneswaram Ilayangudi
Ramanathapuram Ramanathapuram Rest of the taluk Keelakarai Rameswaram
Mudukulathur Entire taluk
Aruppukottai Aruppukottai town Rest of the tal uk
Sattur Sattur Rest of the taluk Sivakasi Virudhunagar
Srivilliputhur Srivilliputhur Rest of the taluk Rajapalayam Watrap
88
District
(l)
Tirunelveli
TaJuk
(2)
Sankaranayanarkoil
Koilpatti
Srivaikuntam
Tirunelveli
Tenkasi
FOOD HABITS IN MADRAS STATE
Places in ,--------------"'------------,
Rice zone Mixed zone Millet zone
(3)
Sankaranayanarkoil Panchayat area
Koilpatti town
Entire taluk except the villages noted under column 4.
Entire taluk except Madavakurichi and Gangaikondan firkas
Thenkasi Town Kadayanallur Panchayat Courtallam Township
(4)
Rest of the taluk
Rest of the taluk
Allikulam Kila thatia par ai Umarikottai Melathattaparai Ramanathapuram Varthaga Reddipatti Thimmarajapuram Dalavoipuram Ramaswamipuram Peruvani Vadakktlsilukkanpatti Ayyanadaippu Therkusilukkanpatti Maravanmadam Kumaragiri Servaikaranmadam Mappilaiurani Palipanjambulam Muthusamipuram Senthilampannai Koottudangadu Kulayankarisal Kattulankulam M udithanendal Aniaparanallur Inam Melapuram Blanda Manakarai Pamalkadu Poovani Sekkarakudi Ulagudi Singathakurichi Ukaraseri Dinachilapuram Settimulampatti Ellanaikenpatti Thamoothu
Madevakurichi and Gangaikondan firkas
Rest of the taluk
(5)
District. Taluk
(1) (2)
Tirunelveli-(lont.} Shencottah
lZ
Ambasamudram
Nanguneri
Tiruchendur
APJ1ENDICES
Places in , --"-_------------""""'" Rice zone
(3)
Mixed zone Millet zone
(4)
Entire taluk
Entire tal uk except the Pudupatti villages noted under Edakkal column 4. Pappakudi
Malavarayanatham Athinathapuram Alwarthirunagari Alwarthirunagari (Rural) Alagiamanavalapuram Thirukkalur Canbellabad Tirunauirudayapuram Theinangulam Kadayanodai Nazereth Mukkupperi Kachanavilai Thenthiruperai Mavidupannai Rajapathi Kurukkattur Angamangulam Poranur Nalonauady Inam Alagappapuram Sethukkuvaithan Sugantala Serandamangalam Punnakayal Authur Cusba Mela Authur Kayalpatnam (North) Nallur Veeramanickam Ammanpuram Mulakarai Kanam Nathaikulam Pallipattu Arumuganeri Kayalpattinam (Rural) Veerapandipatnam (rural) Veerapandip.atnam
Kuthapanjam Kadayanperunbathur Venkadamba tti Madathur
Entire taluk
Udayarkulam Kurippankulam Meenakulam Sri Venkataswara-
puram Kattarimanga1am Vellamadam Pidaneri Eluvarainokki Chettikulam Inam Karuvelampadu Karungadal Komaneri Kombankulam Nedungulam Amuthavannakudi Pannambarai Semmarikulam Kudirainoli Paramankurichi Megnanapuram Nangaimozhi Sattangulam Pudukulam loam Tachamozhi Subbarayapuram Lakshmipuram Manaduthandapathu Inam Nainapathu Inam Vagaivilai Chettiapathu Mudalur Sastavinallur Narduvakurichi Inam Tamaraimoli Arasoor Thiruppaniputhan Tharuvai
(5)
R9

90 FOOD HABITS IN MADRAS STATE
Places in District Taluk ~-------------~ ,
Rice zone Mixed zone Millet zone (1) (2) (3) \4) (5)
Tirunelveli-(cont .) Tiruchendur- Kayamoli Kommadikottai (cont.) Melatiruchendur Pallakurichi
Tiruchendur Venkataramanuja-puram
Udangudi Udangudi (Rural) Kulasekarapatnam
(Rural) Kulasekarapatnam Madavankurichi Alagappapuram Periathalai Padugapattu Adiyakurichi
Kanyakumari Vilavancode Entire taluk
Kalkulam Entire taluk
Thovala Entire taluk except villages Chembakaramam-noted under column 4. pudur
Thovala
Agastheeswaram Entire taluk

1. GENERAL:
APPENDIX IV
Schedule I
SURVEY OF FOOD HABITS
Code No. ___________ _
Community
Approximate annual income of the household Rs.-------·
Names of the inmates in the household Sex Age
(1) (2) (3)
II. FOOD REQUIREMENTS:
Annual requirements
Occupation
(4)
Commodity. Actually purcha~ed (Madras measures) I Otherwise obtained (Madras measures)
1. Raw rice
2. Boiled rice
3. Cholam
4. Cumbu
5. Ragi
6. Other millets
7. Wheat
8. Pulses
92 fOOD HABITS IN MADRAS STATb
III. FOOD ROUTINE (on non-festival days) :
Quantity taken for cooking
Time of the day Items in the meal Rice Wheat Millet
-----------'---------------'----------- ---'----------------;.______ Morning-
Noon-
2 3
4 5
I 1
\2 3 4 5
I ! I I
I I
Evening- I !
2 , I
3 I ,
4 I 5 I
Night- . '1 - ,.~
I 2 3 4 5 I
IV. OTHER INFORMATION OF INTEREST:
1. Is the household a non-vegetarian one '! If so, for how many days in a week is meat taken?
2. What is the quantity of milk consumed daily in the household in terms of Madras measures?
3. If beverages are taken, for how many times in a day?
4. What are the fruits regularly taken and what is the daily consumption?
5. Are vegetables regularly used, and if so, what is the quantity taken per day? (in terms of viss)
6. Is sugar regularly purchased and cort ~ sumed and if so, what is the quantity consumed per month?
!
I
.
, , I
Super visur.
APPENDtX v
Schedule II
CONSUMPTION OF FOOD
Location Code No.
Name of the head of the household:
Community:
Occupation:
Annual income:
Name of the cereal cooked .................•...... Time of the meaL .................. .
Serial number
(1)
1.
2.
3.
4.
5.
6.
Working Sheet-
Name of the member
(2)
Weight of the cooked cereal with pot:
Weight after the first mp,mber takes food.
Weight after the second member takes food:
Weight after the last member takes food:
Weight of the balance left:
Weight of the pot alone:
Sex Age
(3) (4)
Weight of the cooked cereal
consumed (5)
Remarks
(6)
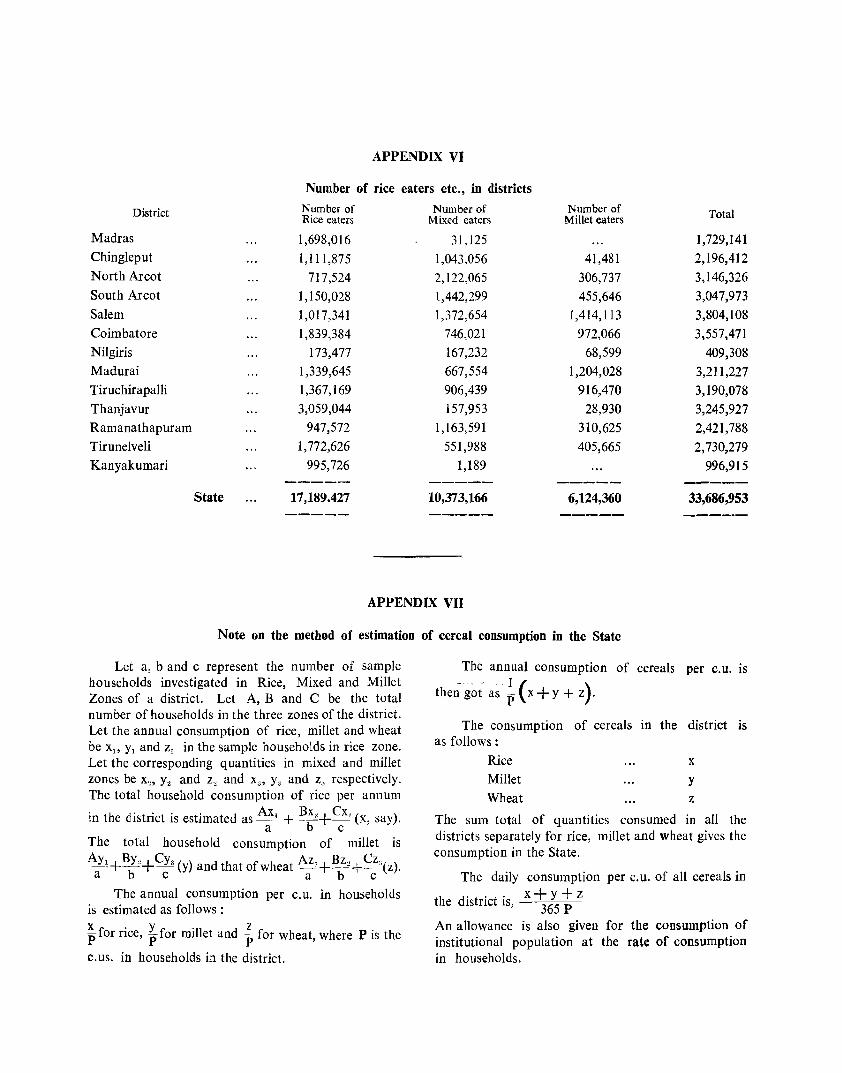
APPENDIX VI
Number of rice eaters etc., in districts
District Number of Number of Number of Total Rice eaters Mixed eaters Millet eaters
Madras 1,698,016 31,125 1,729,141 Chingleput 1,111,875 1,043,056 41,481 2,196,412
North Arcot 717,524 2,122,065 306,737 3,146,326
South Arcot 1,150,028 1,442,299 455,646 3,047,973
Salem 1,017,341 1,372,654 1,414,113 3,804,108
Coimbatore 1,839,384 746,021 972,066 3,557,471
Nilgiris 173,477 167,232 68,599 409,308
Madurai 1,339,645 667,554 1,204,028 3,211,227
Tiruchirapalli 1,367,169 906,439 916,470 3,190,078
Thanjavur 3,059,044 157,953 28,930 3,245,927
Ramanathapuram 947,572 1,163,591 310,625 2,421,788
Tirunelveli 1,772,626 551,988 405,665 2,730,279
Kanyakumari 995,726 1,189 996,915 ----- ----- ----- -----
State 17,189.427 10,373,166 6,124,360 33,686,953 ----- ----- ----- ------
APPENDIX VII
Note on the method of estimation of cereal consumption in the State
Let a, band c represent the number of sample households investigated in Rice, Mixed and Millet Zones of a district. Let A, Band C be the total number of households in the three zones of the district. Let the annual consumption of rice, millet and wheat be Xl> Yl and z, in the sample households in rice zone. Let the corresponding quantities in mixed and millet zones be X" Y2 and z, and X3, Y3 and Z3 respectively. The total household consumption of rice per annum
. th d' t' t' . d Ax, Bx,,+Cx,( ) III e IS nc IS estImate as - + -b" _-" x, say. a c
The total household consumption of millet is
AYl+ By~+ CY3 (y) and that of wheat Az,+.1!~+ Cz3(z). abc abc
The annual consumption per c. u. in households is estimated as follows:
~for rice, ~for millet and ~ for wheat, where P is the
c. us. in households in the district.
The annual consumption of cereals per c.u. is
then-gotO
as ~(x+y + z). The consumption of cereals in the district is
as follows:
Rice x
Millet Y Wheat z
The sum total of quantities consumed in all the districts separately for rice, millet and wheat gives the consumption in the State.
The daily consumption per c.u. of all cereals in
h d · . . x+ Y + z t e Istnct IS, --365 P
An allowance is also given for the consumption of institutional population at the rate of consumption in households.

APPENDIX VITI
Production and consumption of cereals
Production (in lakh tons) Consumption District (after allowing for seed requirements) (in lakh tons) Remarks,
,-------~-------, ,-------~-------, Rice Millet Wheat Total Rice Millets Wheat Total
(1\ (2) (3) (4\ (5) (6) (7) (8) (9) (10)
Madras 2'31 0'05 2'36 Chingleput 3'62 0'44 4'06 2'85 0'66 0'01 3'52
North Arcot 3'48 1'28 4'76 2'98 1'92 0'03 4'93 Production of wheat in
South Areot 4'21 1'51 5'72 2'88 1'46 0'02 4'36 the State is very small, Salem )'88 3'41 5'29 2'53 3'64 0'03 6'20 Coimbatore 1'92 2'62 4'54 3'11 2'23 0'08 5'42 Nilgiris 0'04 0'02 0'06 0'24 0'13 0'05 0'42 Madurai 2'60 2'07 4'67 2'88 2'79 5'67 Tiruchirapalli 3'12 2'78 5'90 2'99 2'42 5'41 Thanjavur 9'13 0'24 9'37 5'09 0'15 5'24 Ramanathapuram ... 1'92 1'32 3'24 2-58 1'28 0'01 3'87 Tirunelveli 3'00 0'92 3'92 3'45 1'10 0'03 4'58 Kanyakumari 1'09 1'09 1'05 1'05 * Due to rounding off
0'01* 0'01* 0'02
State 36'01 16'61 52'62 34'95 17'78 0'32 53'05
Note: Consumption of wheat in hotels etc, has not been included,
APPENDIX IX
Number of slaughtered animals in Madras at recognised slaughter houses
Year Cows Bulls and Calves He-buffaloes She-buffaloes Sheep Goats Pigs Others Bullocks
(1) (2) (3) (4) (5) (6) (7) (8) (9) (10)
1956-57 3,859 5,531 4,157 2,519 231,443 142,215 528 1957-58 17,421 33,148 2,509 282 896,042 520,243 343 1958-59 6,594 23,790 1,459 114 605,896 384,908 1,454 1959-60 22,940 50,811 1,870 1,367 1,171,289 646,741 5,279 1%0-61 19,350 49,987 10,690 8,263 1,532,640 729,770 5,868
SOUlce: Animal Husbandry Department, Madras,

APPENDIX X
GLOSSARY
Sl. No.
Term
1. Akkulu, Basangi, Eekki Samba, Getti Samba, Chinna Samba, Karthigai Samba, Dobbi Samba, Kichidi and Molakolukulu
2. Appalam
3. Chappathi
4. Cholam
5. Cumbu
6. Curry
7. Dosai
8. Ekadasi
9. Iddli
10. Javvarisi
11. Jelabi
12. Kacchayam
13. Kali or Kazhi
14. Kanji
15. Krithigai
16. Kuruvai
17. Kuzhu or Koozh
18. Neera
19. Paruppu
20. Payasam
21. Pongal
22. Pongal festival
23. Puttu
24. Rasam
25. Samai and Varagu
26. Sambar/Kuzhambu
27. Vadai
Description
Varieties of rice.
A disc-like preparation made out of black gram dhal to be fried in oil.
Unleavened bread made out of wheat.
A kind of millet (Jowar)
A kind of millet (Bajra)
Cooked vegetables used as side dish.
A popular South Indian dish made out of rice flOUT and dhal.
The eleventh phasis of the moon.
A popular South Indian dish made out of rice flour and black gram dhal.
Sago.
A sweet dish prepared out of black gram dhal.
A bun made out of jaggery and rice flour.
A semi-solid paste.
Rice gruel.
A lunar asterism.
A short term crop.
Porridge.
Unfermented toddy.
Dhal.
A sweet porridge prepared on ceremonial occasions.
A sweet dish prepared out of rice.
A Tamil festival celebrated in the middle of January.
Sweet preparation made out of rice flour and jaggery/sugar.
Broth with pepper or dhal.
Varieties of millets.
Sauce made with dhal and vegetables.
A fried preparation made out of dhal.