Food for work vs. cash for work: emergency assistance
23
1 Preliminary draft: please do not quote Food for work vs. cash for work: emergency assistance in Palestine (May 2003) Marco Missaglia (University of Pavia and EcoMod Network) Paul de Boer (Erasmus University Rotterdam and EcoMod Network)
Transcript of Food for work vs. cash for work: emergency assistance

1
Preliminary draft: please do not quote
Food for work vs. cash for work: emergency assistance
in Palestine (May 2003)
Marco Missaglia
(University of Pavia and EcoMod Network)
Paul de Boer (Erasmus University Rotterdam and EcoMod Network)

2
1. Introduction The last years of the Palestinian history, those of the second intifada and the so called
"closure" - i.e. the Government of Israel's imposition of restrictions on the movement of
Palestinians goods and people across borders and within the West Bank and Gaza (WBG) -
witnessed a dramatic decline in all Palestinian economic and social indicators. Since
October 2000, when the violent confrontations started, conditions for a normal life have
nearly disappeared and economic situation has steadily disintegrated. Table 1 illustrates the
declining performance of the Palestinian economy over the last four years.
Table 1: West Bank and Gaza Macro Economic Trends and Projections 1999 2000 2001 2002 Gross National Income (GNI), US$ mill. 5,166 5,419 4,501 3,273 Gross Domestic Product (GDI), US$ mill. 4,289 4,607 4,012 2,951 Real annual change GNI per capita 3.9% -7.5% -23.2% -26.4% GDP per capita 3.1% -5.3% -19.5% -25.5% Private Consumption 7.5% -5.6% -15.5% -17% Public Consumption 20.3% 31.0% -2.1% -7.7% Total Fixed Investment -8.3% -28.3% -76.9% -84.2% Export 2.3% -8.8% -13.4% -34.8% Import 5.4% -16.2% -29% -17.3% Other items Poverty, share of population below the poverty line
20.1% 30.7% 45.7% 60.0%
NIS/US$, annual average 4.14 4.08 4.21 4.75 CPI, annual change 5.5% 2.7% 2.1% 7.6% Population, mid-year (1,000) 2,842 2,966 3,096 3,231 All data excludes East Jerusalem. Sources: World Bank Staff Estimates and PCBS Among these impressive data, the most impressive concerns poverty. Using a poverty line
of US$2 per day, the World Bank (WB) estimated that 60 percent of the population were
poor in 2002, a share which is three times as high as it was on the eve of the intifada. Many
discussions are ongoing on the so called "final status", or Phase III of the recently proposed
Road Map. These discussions are mainly concerned with the regulation of those issues that
can only be regulated once a permanent, two-state solution (or in any case a solution
whatsoever) is finally agreed upon, namely the regulation of trade regime, labour flows,
investment support, etc.. In this paper we do not want to add to this already very rich

3
debate1. Rather, we want to analyse a somewhat more urgent problem, the provision of
emergency assistance to a country whose economy has been decimated since the start of
the second intifada.
Emergency assistance may take a number of forms: budget support, food assistance, cash
transfers, employment programs. The latter, in turn, may be organised as Food-for-Work
(FFW) or Cash-For-Work (CFW) programs. In this paper we want to analyse the different
potential effects brought about by these different relief policies and, especially, to draw
some policy lessons concerning the FFW vs. CFW debate: should the workers participating
in an employment program be paid in cash or in food and other essentials? We are perfectly
aware this is not a purely economic issue: psychological benefits or damages are clearly to
be considered for an overall assessment of such policy measures (for instance, people may
dislike getting a voucher rather than a cash transfer), and the political preferences of the
donors should be put into the picture as well (for instance, the donors - due to internal
reasons of political economy (farmers' support and similia) - could dispose of excess food
and then prefer to fund a FFW rather than a CFW program). However, in this paper we will
disregard these non-economic (or non purely economic) aspects and concentrate on the
economic dimensions of emergency relief provision.
In order to simulate the effects associated with different policies we use a CGE (Computable
General Equilibrium) model. The idea of looking at the FFW vs. CFW issue as a general
equilibrium topic was originally developed by Basu (1996). In his paper, Basu underlines the
circumstances that can make the FFW a better option than the CFW. In particular, he claims
that cash payments (as well as pure cash distribution) exert a stronger upward pressure on
the price of foodstuff and, through this channel, makes those poor who are left out of the
CFW program worse off. This way, he weakens the traditional arguments in favour of CFW
schemes. We will briefly come back to this point in section 4.
We will proceed as follows. Section 2 clarifies some aspects of the SAM (Social Accounting
Matrix) for 1998 which has been used to calibrate the model and illustrates how a
counterfactual SAM is obtained to get a more realistic picture of the Palestinian economy
after a couple of years of violent confrontation and economic destruction. In section 4,
starting from this modified database, the results of some relevant policy experiments are
presented. Section 5 concludes and points to some possible extension of the model.
1 Trade options for the future are analysed at length by Astrup and Dessus (2001) and the WB (2002b). Labour policy options are investigated by Ruppert Bulmer (2001).

4
2. The 1998 Social Accounting Matrix and the counterfactual SAM 2.1. The 1998 SAM The CGE model used in this paper is calibrated around the SAM provided by the PCBS
(Palestinian Central Bureau of Statistics) for 1998 (a reduced SAM is reported in Appendix
1). Compared to this original version, we aggregate the several sectors and sub-sectors
included in it into eight main sectors: Food, Other Agriculture, Manufacture, Constructions,
Transport, Commerce, Private Services and Public Services, each of them producing one
good. The food sector is an aggregation of the food producing agricultural activities and of
those activities that, however belonging to the manufacture sector in the PCBS SAM,
produce food items as well (for instance the "food and beverages" activity). Clearly, this is a
way of producing a database well suited for simulating a FFW intervention.
The data in the PCBS SAM are organised in a way that implicitly separate the role of the PA
as a consumer from its role as a producer. More precisely, in the SAM the PA does not buy
intermediate goods, labour and capital services. It only buys consumption goods. The role of
the PA as a producer is captured by the sector "Public Services", which is considered in the
SAM as any other producing sector of the economy. In the model, we follow this convention2
and the reader must be therefore aware that this is not a way of disregarding the
overwhelmingly important role of the PA as a producer and, above all, labour demander. If
one looks at the "Public Services" column of the SAM, it will be immediately apparent the
extremely important role the PA plays as a producer.
Our model is a standard one, where each producing sector maximises its profits under a
technological constraint (see section 3.2). This assumption might seem inadequate to
describe the behaviour of the "Public Services" sectors, i.e. of the PA as a producer. Indeed,
it is inadequate. If the Palestinian economy still functions and did not collapse after the
tremendous shocks of the last three or four years, one of the key reasons lies in the fact that
the PA, thanks to donors' budget support, has been regularly paying salaries and providing
basic services to the population. It is very difficult to label this behaviour as "profit
maximisation": the PA hired (or did not fired) people in order to provide a sort of social
insurance. To overcome this problem - the inadequacy of the profit maximisation assumption
fo the "Public Services" sector - we simply assume that the "PA as a consumer", i.e. the
government collecting taxes and receiving donors' support, pays labour subsidies to the "PA
2 In Figure 3 (see below), for ease of exposition, the roles of consumer and producer of the PA are treated simultaneously. In the equations of the model, however, they are kept separated.

5
as a producer", i.e. the "Public Services" sector. This way, we can rationalise the
employment level in this sector as being mainly determined by socio-political reasons.
2.2. The counterfactual SAM As already stated, the objective of this paper is to simulate the effects on the Palestinian
economy of alternative policies of emergency relief provision. To this purpose, we cannot
take the 1998 SAM as a credible base for running our simulations. In general, four years are
a rather short period for an economy: its structure changes slowly and using a four years old
SAM maybe justifiable. In our case, however, the four years 1998-2002 cannot be
considered a "short period" at all. Everything has changed: the capital stock has markedly
declined, people are not allowed anymore to get a job on a regular basis in Israel or in the
settlements and those lucky enough to get it are most probably attaching a higher risk
premium to the same job; donors' intervention, however mostly welcome, is significantly
increasing the already high dependency of the Palestinian economy on the vagaries of
external, international factors; the Israeli demand for Palestinian products has collapsed due
to the crisis that Israel is suffering as well; etc. etc..
These are the reasons why we want to make our exercise of policy simulations starting from
a different, more "realistic" picture than that offered by the 1998 SAM. But the latter is the
most recent available SAM for Palestine. For this reason, we built a "counterfactual" SAM,
by giving a big, "Intifada shock", to the 1998 benchmark. What are the ingredients of this
Intifada Shock?
a) A reduction in the capital stock. According to the World Bank (2003), physical damages
resulting from the conflict (private and public buildings, infrastructure, productive trees
and soils, etc.) amounted by the end of August 2002 to 14% of 1998 GNI (Gross
National Income). Assuming, according to a well established practice3, an ICOR
(Incremental Capital Output Ratio) of 4, this means that 3.5% of 1998 capital stock has
been destroyed over the last years. Of course, this is not the whole story. What we are
mainly interested in is the reduction in capital incomes rather than in the capital stock.
The reduction in capital incomes may be thought of as the sum of the variation in the
rate of return to capital and in the capital stock. The latter has been already dealt with,
the former is difficult to evaluate because we do not dispose of any estimate. Indirectly,
however, we can guess that the return on capital has lowered, since, due to the rapidly
rising unemployment level and, the labour-capital ratio has declined. According to our
calculations, capital incomes lowered by at least 30% during the last three years.
3 See for instance Easterly (2002), especially chapter 2.

6
b) A dramatic fall in the level of labour income earned in Israel and the settlements. If one
should look at the official figures4, it would make sense to assume a 75% reduction in
this source of income, but, taking into consideration the quite large number of
Palestinians who manage to cross illegally into Israel, we give this variable a 50% shock.
c) An increase in donors' disbursements, that more than doubled over the period 1998-
2002. According to World Bank staff calculations (2003), total disbursements increased
from around US$400 million to around US$1 billion.
d) A sharp reduction in the propensity to save of the Palestinians. As it can be seen in
Table 1, the reduction in per capita GNI has been always outpacing the reduction in
private consumption, which is a normal and predictable reaction to a negative shock.
e) A reduction in government saving, defined as the difference between revenues
(including donors' assistance) and expenditures.
f) An increase in the transfers paid by the PA to the households and in the labour
subsidies handed out to the "Public Services" sector. More precisely, we assumed that
the bulk of the increase in foreign aid was used by the PA to fund social transfers to the
households, whereas the remaining fraction was devoted to the payment of labour
subsidies. As discussed in section 2.1, these subsidies are a convenient way of
modelling the intervention of the PA aimed at absorbing, however partially, the labour
market shock suffered by the Palestinian economy.
g) An increase in the labour force. The rise of the population between 1998 and 2002 was
almost 15%, but, according to the PCBS data (www.pcbs.org), the labour force growth
was around 8%, a fact that witnesses the sharp increase of the dependency ratio.
h) An increase in b. This parameter (its inverse), as explained in section 3.3, is a measure
of both the probability of getting a job in Palestine and the transaction and psychological
costs associated with a job in Israel and the settlements. It makes sense, looking at the
data on unemployment in West Bank and Gaza, to assume that over the last years the
probability of getting a job in Palestine has remarkably fallen. This decline is likely to be
more important in the minds of the Palestinians workers than the increase in transaction
and psychological costs of looking for a job or working in Israel. To put it in other words:
however sad, one must recognise that Palestinians workers are getting used to these
risks, as witnessed by the growing number of people trying to cross illegally into Israel.
The combined effect of all this shock, as predicted by our model, is summarised in Table 25. 4 According to the World Bank (2003), from September 2000 to the end of 2002 the number of permits reduced from 128,000 to 32,000. 5 All the set of elasticities used in our simulation can be obtained by the authors upon request. Here, we just remark that sensitivity analysis shows that the sign and order of magnitude of our results are robust.

7
Table 2: The economic effects of violent confrontation (simulation; 1998 = 100) Selected indicators DOM.
PROD: CON EXP IMP GNI UNEMP UNEMP
(rate) TAX REV:
WELF
70.65 219.76 35.6 99.374 91.39 Food 91.30 95.26 64.87 106.37 Ot. Agr. 83.90 98.52 96.52 75.77 Manuf. 83.15 90.92 65.90 88.76 Const. 80.47 94.91 76.10 89.15 Comm. 79.05 95.20 77.77 81.84 Transp. 88.632 90.36 81.29 94.81 Prv. Svc. 84.407 79.42 75.43 90.74 Pub.Svc. 114.77 99.10 120.35 111.14 All the variables in the table are measure in real terms. The figures in Table 2 deserve some comment. First of all, real production declines in each
sector of the economy but in the "Public Services" sector. The reason is that in our
simulation of the "Intifada shock" a portion of the increase in donors' assistance is used to
subsidise labour input in that sector. As already explained, this is a way of capturing the
political choice of the PA to support employment and provide a sort of insurance against the
increasing risk of being unemployed. The consumption of Public Services decreases less
than other items; this time, the reason is demand-driven: the income elasticity for these
services is low and one could even legitimately take a negative value for it, i.e. treat them as
an inferior good.
The simulated value for the unemployment rate, 35.6 percent, is very reasonable, even
prudent. Indeed, according to the most recent World Bank study on Palestine (World Bank,
2003), the current unemployment rate is estimated at 42 percent, whereas the PCBS put it
at a lower level (36.8 percent).
The reduction in the level of GNI is more optimistic than the World Bank estimate (minus 30
percent instead of 40). The reason could be found in our relatively optimistic assumption
concerning the fall in the labour income earned by the commutants (Palestinians working in
Israel or the settlements and living in the Territories). Obviously, a tougher shock could
easily reproduce the World Bank result.
Again, it is worth noticing that the surge in foreign aid less than compensates the fall in other
revenue sources for the PA and the overall tax revenue decreases, which is consistent with
the available data.
These data, together with all the remaining figures we omit for brevity, are put together in
our counterfactual SAM, the base on which we build our simulations of the different policies
of emergency assistance. Before turning to them, let us have a closer look to the CGE
model employed in this paper.

8
3. Description of the model 3.1. Introduction In the model we have five economic agents: n firms, one household, a bank that allocates
savings over investments, the Palestinian Authority (PA) and the rest of the world. In each
sub-section we summarize the behavioral assumptions of each of the agents6.
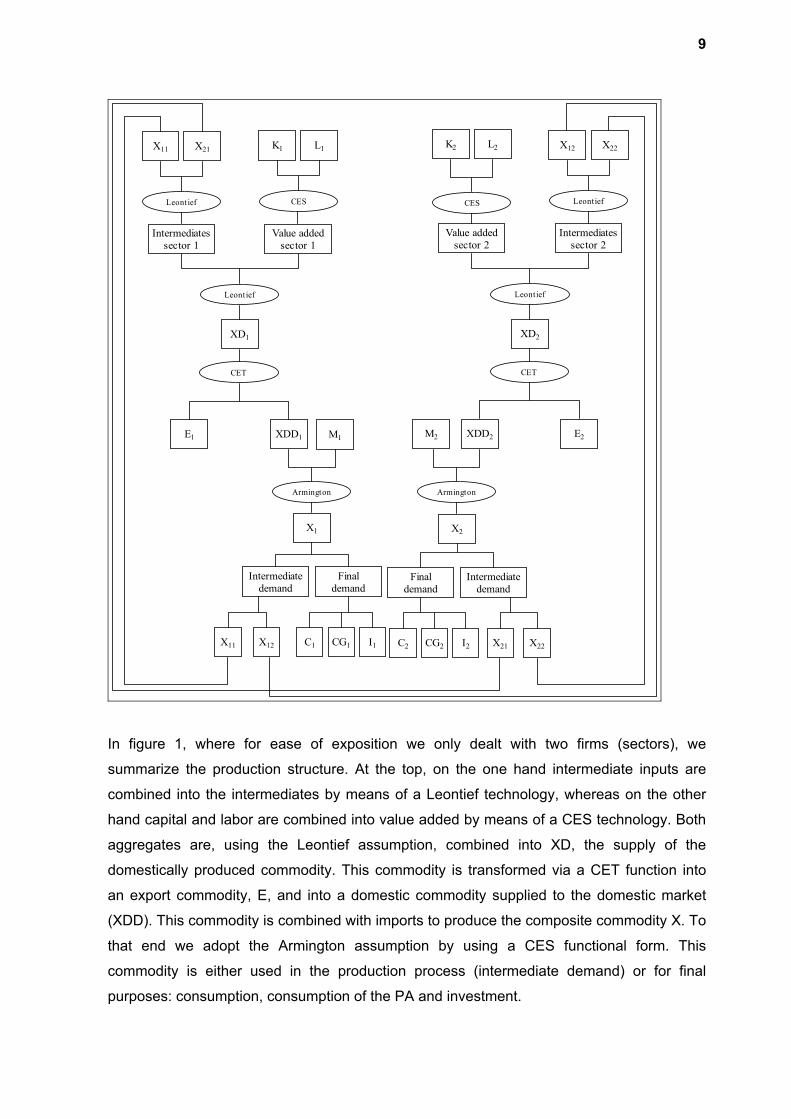
3.2. The firms Figure1. Production of the domestic commodity, domestic supply, production of the composite commodity and domestic demand
6 The equations of the model, as well as the glossary of symbols can be obtained from the authors upon request ([email protected]).
9
X11 X21 K1 L1
Leontief CES
Intermediatessector 1
Value addedsector 1
Leontief
XD1
CET
E1 XDD1 M1
X1
Armington
K2 L2 X12 X22
CES Leontief
Value addedsector 2
Intermediatessector 2
Leontief
XD2
CET
XDD2 E2M2
X2
Armington
Intermediatedemand
Finaldemand
Finaldemand
Intermediatedemand
X12X11 I1CG1C1 I2CG2C2 X22X21
In figure 1, where for ease of exposition we only dealt with two firms (sectors), we
summarize the production structure. At the top, on the one hand intermediate inputs are
combined into the intermediates by means of a Leontief technology, whereas on the other
hand capital and labor are combined into value added by means of a CES technology. Both
aggregates are, using the Leontief assumption, combined into XD, the supply of the
domestically produced commodity. This commodity is transformed via a CET function into
an export commodity, E, and into a domestic commodity supplied to the domestic market
(XDD). This commodity is combined with imports to produce the composite commodity X. To
that end we adopt the Armington assumption by using a CES functional form. This
commodity is either used in the production process (intermediate demand) or for final
purposes: consumption, consumption of the PA and investment.

10
3.3. The household Figure 2. The decisions of the Household
KS TRF TS
Leisure (C3)LS
Income fromtransfers
Income fromcapital
Domesticlabor demand
Labor demandIsrael
Income fromlaborRemittances
Income (Y)
TaxesSavings
Expenditure oncommodity 2
Expenditure oncommodity 1
Income fromleisure
CBUD
FTRF
Foreigntransfers
UNEMP
CEBUD
The household owns the capital (KS), receives transfers from the PA (TRF) and from the
rest of the world (FTRF), and it disposes of a time endowment (TS). The household is
assumed to maximize its utility in two stages: in the first one it allocates its time endowment
over labor supply (LS) and leisure ( C ). We allow for unemployment so that the labor
demand is smaller than the labor supply. We assume that the unemployed do not receive
unemployment benefits.
3
In the model we use the unemployment theory delineated in the migration literature by
Harris and Todaro (1970) to describe the wage gap between rural and urban jobs.
Compared to the modified version proposed by Ruppert Bulmer (2001), we stay closer to
the original Harris-Todaro model. The core of the theory is described by the following
arbitrage condition (acting as a wage curve):

11
PLFERb
LFUNEMPLFPL ..).(
+=
The wage rate paid by Palestinian firms to Palestinian workers, PL, must be equal, in
equilibrium, to the expected wage rate of the Palestinian workers employed in Israel or in
the settlements. The latter is equal to the wage rate prevailing in Israel and the settlements,
ER.PLF (ER being the exchange rate7), multiplied by the probability of getting a job in Israel
(the bracketed term) and a factor, b, whose meaning will be immediately clarified. The
probability of getting a job in Israel or the settlements is simply given by the ratio of the
Palestinian workers actually employed in Israel or the settlements (LF) to the workers who
look for a job there: those who manage (LF) and those who do not (UNEMP). The factor b
can be given different interpretations. It could be thought of either as the inverse of the
probability of getting a job in Palestine (and in this case the arbitrage condition states
nothing but the equality between two expected wages) or as a premium attached by
Palestinians workers to a job in Israel: the higher the transaction and psychological costs
associated with such a job, the lower b. In other words: for each given level of the wage in
Israel and the settlements, the Palestinian workers accept a lower wage at home when the
risk of closure, the social stigma exerted by the settlers, the difficulties of reaching the
workplace in Israel, etc. increase. The overall effect of the intifada shock on be is therefore
uncertain: on the one hand, getting a job in Palestine is more unlikely than before (b
increases); on the other, transaction and psychological costs are clearly on the rise (b
decreases).
All five sources of income together yield the household income (Y).
It pays income taxes and saves a fixed fraction out of its net income. Subtracting taxes and
savings from income yields the budget (CBUD) that it devotes to the purchase of
commodities 1 and 2. In the second stage the consumer maximizes a utility function, with
the consumption of these commodities as arguments, subject to its budget constraint.
For both stages we use a Linear Expenditure System (LES). This is equivalent to the
maximization of an Extended LES utility function, with the consumption of the two
commodities, and of leisure as arguments, subject to the extended budget, in which the
income for leisure is included (CEBUD).
7 Of course in the model we fixed ER = 1, since Palestine and Israel have the same currency and we do not consider the Palestinians working in foreign countries different from Israel.

12
3.4. The Palestinian Authority (PA) The PA derives its revenues from two sources: taxes (on imports, capital, labour,
consumption commodities and on household’s income) and foreign aid8. These revenues
are spent on transfers, savings and on other expenditures. With respect to the latter we
assume that the PA maximises a Cobb-Douglas utility function with its purchases of
commodities ( and ) as arguments subject to the expenditure constraint. As to its
demand for capital and labour, KG and LG, figure 3 treats simultaneously the role of the PA
as a consumer (collecting taxes and using this revenue to save and buy consumption
goods) and its role as a producer (buying intermediate goods and production factors);
however, as already explained in section 2.1, in the PCBS SAM and consequently in the
equations of the model these roles are kept distinct.
1CG 2CG
Obviously, and , i.e. individual final government consumption (schools, clinics,
etc.) and collective final consumption (defence, security, public administration) are not
included as arguments in the household utility function, since these items are not chosen by
private consumers. However, private consumers do benefit from them. Hence, the welfare
index calculated in the model takes them into account.
1CG 2CG
8 Rising unemployment, reduced demand and the withholding by the Government of Israel of taxes collected on the PA's behalf made the total tax revenue fall by over 300 percent in less than two years, from late 2000 to mid-2002. In the model, the de facto power of Israel to withhold taxes that de jure should accrue to the PA is captured by attaching an exogenous (politically determined), multiplicative factor to the import duties revenue of the PA.

13
Figure 3. The decisions of the Palestinian National Authority
Taxes onimports
Taxes onlabor
Taxes oncapital
Consumptiontaxes Income tax
Tax revenues
PNA savings
Other PNAexpenditures
CG2 LGKG
Transfers
Foreign aid
PNA revenues
CG1
3.5. The bank In figure 4 we summarize the decisions of the bank. Figure 4. The decisions of the bank
Householdsavings
PNA savings
Foreignsavings
Demand forinvestment
commodity 1
Savings
Demand forinvestment
commodity 2
The household savings (SH), the PNA savings (SG) and the foreign savings (SF) are
allocated over the investment demand for commodities 1 and 2. To that end the bank is

14
assumed to maximise a Cobb-Douglas utility function with arguments and subject to
the constraint that savings are equal to total investments.
1I 2I
A word of caution is needed. Since here we are interested in a short run issue, the provision
of emergency assistance to Palestine, our model is a static CGE model; however,
investment decisions are intrinsically dynamic, dictated by expectations on the future and
some process of intertemporal maximisation. So, as in any other static model, the only
meaningful reason for incorporating investments is basically accountancy: the SAM
reproduces a picture of a given economy in a given point of time and, looking at that picture,
one sees that people save and invest. But the reader must warned that a static model has
nothing to say as to the effects of any policy simulation on the level and composition of
investments. This is the reason why in the next sections we will not consider these effects at
all, concentrating on what a static model can seriously say.
3.6. The rest of the world In figure 5, finally, we summarise the RoW. Before briefly illustrating figure 5, let us say that
when one considers the Palestinian economy, the RoW basically coincides with Israel, at
least as far as commercial exchanges are considered. In 1998, 76 percent of imports and 96
percent of exports came from and were directed toward Israel (Astrup and Dessus, 2001).
Obviously, the picture is different if one looks at foreign aid disbursements. For instance, out
of a total of US$1.1 billion by the end of 2002, US$840 million came from Arab League
countries and US$230 million from the EU (WB, 2003).
In figure 5, Palestine earns revenue from the RoW via exports and other sources: foreign aid
(FAID) accruing to the PA, remittances from the workers employed in Israel and the
settlements (RE), foreign transfers directly accruing to the households (FTRF) and foreign
savings (FS), i.e the deficit in the current account balance. These revenues are spent on
imports of goods 1 and 2. Imports and exports are treated in a rather standard way, through,
respectively, an Armington-CES and a CET assumption. In this analytical framework an
external demand shock (for instance a reduction in the Israeli demand for Palestinian
products prompted by the economic contraction Israel is suffering) may be modelled by
changing the elasticities of transformation and making more difficult to transform domestic
production delivered to the domestic market into exports. Alternatively, one could use a
standard export demand instead of the CET assumption.

15
Figure 5. The rest of the world
Exports ofcommodity 1
Exports ofcommodity 2
Exports revenues
Spending onimports
Imports ofcommodity 1
Imports ofcommodity 2
O ther foreignrevenues
FAID FTRFRE FS
4. FFW vs. CFW 4.1. A methodological note Our empirical investigation reaches three main conclusions. Two of them are well known
results in economics – first: cash and food payments are basically equivalent when they are
funded from monetary assistance from abroad; second: they are not equivalent when food
payments are funded out of food aid from abroad – whereas our third result has not received
much attention: food-for-work and cash-for work should be regarded and evaluated not just
on the “food” or “cash” side, but on the “work” one as well. Food for which work? Cash for
which work?
Before looking in more detail at these results, let us briefly illustrate a methodological point.
In order to run our FFW and CFW simulations, the model has been slightly modified with
respect to the basic version presented in section 3. In particular, the consumption variable
was replaced by two new variables for each good: desired consumption (DC in diagram
1)and actual consumption (AC in diagram 1). When people are given too much food (with
respect to their desired consumption: in diagram 1 they are given OF, but they would like to
consume OC), either they are allowed to sell the food in excess (the market for the
vouchers) or, if they are not, they simply have to use their vouchers. In this latter case, given
the monetary value of their income (in cash and in food), they will also have to reduce
correspondingly their expenditure devoted to other items. There will be therefore a gap, for
each good, between what they wish to consume and what they actually consume.

16
Potentially, this gap could prompt serious general equilibrium consequences, via its
influence on the price system.
Other items DC AC O C F Food Diagram 1: the economics of in-kind transfers In our simulations we assumed away the possibility for people to re-sell their vouchers.
Indeed, in the model there is just one representative consumer9, and it’s difficult to think she
can re-sell her vouchers to the government or abroad.
4.2. Simulation results
4.2.1. FFW vs. CFW: monetary assistance from abroad According to the World Bank (World Bank 2003), out of US$1.1 billion of predictable donors’
assistance for 2003, US$ 375 million are needed for emergency and humanitarian
programs. Hence, starting from our counterfactual SAM, we give the model the following
shocks:
FFW shock:
- further increase in the level of foreign aid, so as to reach the WB predicted assistance
- separation of foreign aid into two items: general budget support for the PA and FFW
programs (US$ 375 million)
- FFW programs are modelled as follows: the government pays a uniform labour subsidy
(the same subsidy rate) to each sector in the economy. Workers must spend the amount
of the subsidy on food items and are not allowed to re-sell their vouchers.
CFW shock:
9 A two-consumer version of the model is forthcoming, where people below and above the poverty line are considered.

17
- further increase in the level of foreign aid, so as to reach the WB predicted assistance
- separation of foreign aid into two items: general budget support for the PA and CFW
programs (US$ 375 million)
- CFW programs are modelled as follows: the government pays a uniform labour subsidy
(the same subsidy rate) to each sector in the economy.
As shown in Table 3, the two programs produce the same outcomes. This is not surprising
at all. We do not fall into the case described in section 2.1 because the size of the FFW
program, however relavant, is barely enough to restore the pre-intifada level of food
consumption. In the case of Palestine, the interesting case described in section 4.1 remains
purely theoretical.
Table 3: FFW = CFW, selected indicators (counterfactual SAM = 100)
DOM. PROD:
CON GNI UNEMP UNEMP (rate)
PRICE INDEX:
WELF
111.90 89.10 31.4 100.09 109.77 Food 101.87 106.53 Ot. Agr. 112.59 106.07 Manuf. 100.50 113.80 Const. 99.59 104.64 Comm. 102.21 109.02 Transp. 107.96 113.99 Prv. Svc. 108.39 118.67 Pub.Svc. 97.08 98.05 The meaning of these results will be clarified in the next sub-section. Here, let us remind
Basu’s argument: in some circumstances FFW is to be preferred because CFW exerts a
stronger upward pressure on the price level and thus people left out on the emergency
scheme can suffer a loss. Our model is not perfectly suited to analyze the point, but we can
guess that in the Palestinian context this argument does not apply. Who are, in our model,
those “left out” of the relief scheme? Basically, those who remain unemployed. Well, in our
FFW and CFW simulations we kept fixed the amount of real transfers to the consumers
(from the PA and from abroad), be them employed or unemployed. Given that real transfers
(a portion of them) coincide with the real income of the unemployed and that the reduction in
the unemployment rate under the two schemes is the same, we are inclined to conclude that
the unemployed should be indifferent between them. Again, the reason is apparent from
diagram 1: if a FFW scheme does not force the consumer to relocate her choice from C to
AC, there is no reason to think CFW as a more inflationary scheme than FFW.

18
4.2.2 FFW vs. CFW: food aid from abroad Here we want to compare an experiment of CFW along the lines already described with a
different experiment of FFW. This time, food itself come from abroad in the form of food aid.
In order to make this FFW experiment comparable with the previous FFW and CFW
“monetary” experiments, it must be ensured that the size of the program is the same
(US$375 million). This kind of FFW program may be conceptualised as follows:
- the level of foreign aid falls by US$ 375 million
- this amount of money is used by the donors to pay a fraction of the world price of food to
the world producers. Only the remaining fraction is paid by Palestinians importers
- as before, the PA pays a uniform labour subsidy (the same subsidy rate) to each sector
in the economy. Workers must spend the amount of the subsidy on food items and are
not allowed to re-sell their vouchers
The main results of the experiment are summarised in Table 4 Table 4: FFW , food aid from abroad. Selected indicators (counterfactual SAM = 100)
DOM. PROD:
CON GNI UNEMP UNEMP (rate)
PRICE INDEX:
WELF
104.88 94.37 32.9 90.5 113.9 Food 86.54 118.56 Ot. Agr. 100.04 106.26 Manuf. 102.99 112.03 Const. 101.58 104.65 Comm. 100.932 111.92 Transp. 106.30 113.04 Prv. Svc. 105.95 119.79 Pub.Svc. 83.47 92.03 Comparing Table 3 and Table 4 one can see that the main difference is the reaction of
domestic food production. Under the “FFW-food aid” program it falls significantly, which is
exactly what is expected by such a program: people simply substitute domestic production
with cheaper, imported food. However, it is worth stressing that other responses of the
economy are less obvious and nevertheless they should be carefully considered when
taking into account the relativ merits of different emergency program. Notably, food
production (in the extended but more realistic definition we adopted for this sector, see
section 2.1) accounts for almost 20% of the economy, it is a large sector. The decline in its
production level is therefore the main reason behind the smaller increase of GNI under the
“FFW-food aid” program (around 5%) than under the pure FFW or CFW programs (12%; by
“pure” CFW or FFW programs, we mean lack of food aid from abroad).
In turn, this is the reason why, despite the relevant reduction in the price level prompted by a
“FFW-food aid” program, real consumption does not grow faster under such a program. The

19
only item whose consumption grow faster is food, and this is obvious: the reduction in the
world price of food paid by the Palestinians importers produces a standard substitution
effect.
Why does the price level fall under a “FFW-food aid” program whereas it is basically stable
under pure FFW or CFW programs(which is the reason why the welfare index improves with
a “FFW-food aid” scheme? Because food products are not only a relevant portion of the
consumption basket, but also an important input in the production process of those goods
and services that are largely consumed by the households (see the benchmark SAM in
Appendix 1).
And why does the production level of the “Public Services” sector contract so heavily under
a “FFW-food aid” scheme? However obvious, the reason is often forgotten by the
proponents of food aid schemes. If the donors spend their money to subsidize world food
producers, the government of the beneficiary country can get less for budget support. This
simple trade-off must be kept in mind and to us it constitutes a further valid argument
against these emergency schemes. In an economy whose productive base has been
eroded by a conflict, an emergency program should never let the producers pay the price of
an increasing welfare to the advantage of the consumers: it would be a short-sighted
strategy.
Again on Basu’s point. It is true that food aid from abroad can make the unemployed (those
left out of the relief schemes) better off, since the fall in the general price level would make it
possible to increase the real transfers to them (in the simulations, this is done by fixing the
nominal instead of the real transfers). But, as usual, there is no free lunch. This choice
would erode the real fiscal position of the PA and consequently it would negatively affect the
production level of the “Public Services” sector, by far the most labor intensive.
4.3. For which work? If we exclude the case for “FFW-food aid” schemes, especially for their negative impact on
agricultural GDP, we are left with pure FFW and CFW programs. But for which work? This
kind of programs are generally thought of as social instruments; basically, it is believed that
the ultimate beneficiary should be the consumer and the problem is to provide her with
some income. In our view this is the reason why in the economic literature there are plenty
of contributions on the issue of in-kind versus cash transfers, whereas much less attention
has been paid on the “for-work” side of the story.
Here, to conclude our paper, we want to present the results of a simulation that clearly
points to the "“for-work” side as a crucial one.

20
In this simulation we basically consider the same programs already illustrated in section
4.2.1, with only one, relevant difference. We assume away the hypothesis of a uniform labor
subsidy paid to each sector of the economy and, keeping fixed the size of the program
(US$375 million), we try different possible allocations of these funds following two criteria.
On the one hand, it could be argued that in a relief program the sectors to be privileged (to
be given the largest amount of subsidy) are those producing the goods that dominate the
consumption basket of people. This could be labeled as a “welfare-oriented” approach. On
the other side, one could legitimately think that the sectors to be preferred are the most
labor-intensive, those which are in a good position to absorb as much unemployed as
possible. Let us call this view the “labor-oriented approach”.
According to the Palestinian data, adopting a welfare-oriented entails a privilege for the
sectors “Food”, “Private Services”, “Manufactures” and “Public Services”. A labor-oriented
approach would accord a preference to the sectors “Public Sectors”, “Commerce”,
“Transports” and “Construction”. Tables 5 and 6 summarises the results.
Table 5: The Labor-Oriented Approach. Selected indicators (counterfactual SAM = 100)
DOM. PROD:
CON GNI UNEMP UNEMP (rate)
PRICE INDEX:
WELF
109.59 90.96 32.0 101.4 107.16 Food 103.02 105.85 Ot. Agr. 92.010 102.67 Manuf. 98.283 11.68 Const. 101.51 105.01 Comm. 103.64 111.81 Transp. 115.44 116.54 Prv. Svc. 100.89 107.75 Pub.Svc. 105.87 108.45 Table 6: The Welfare-Oriented Approach. Selected indicators (counterfactual SAM = 100)
DOM. PROD:
CON GNI UNEMP UNEMP (rate)
PRICE INDEX:
WELF
110.788 88.52 31.2 100.6 109.02 Food 97.67 105.45 Ot. Agr. 89.99 102.52 Manuf. 102.93 112.62 Const. 98.11 103.08 Comm. 99.82 102.91 Transp. 98.19 107.31 Prv. Svc. 110.88 121.6 Pub.Svc. 101.86 109.57

21
The results are as expected. Under the welfare-oriented approach the performance of the
different sectoral GDP is , on average, a bit more disappointing10. However, the consumers
are better off. It is worth noticing that unemployment falls faster under the welfare-oriented
approach: firms are producing less but, due to the upward pressures on the price of capital
(see footnote 10), with less capital and more labor.
What is the “optimum”? Of course, it is very difficult to say. But, as already stressed, we
believe that in an economy almost disintegrated by a violent and persistent conflict, the re-
building of the productive capacity is an absolute priority. Pursuing a route where firms
produce less with less capital in the name of a “plus one percent” in the welfare index could
be a dangerous mistake. Emergency assistance should never compromise development
perspectives. All the more so when a labor-oriented approach is in any case a way of
increasing the current welfare level of Palestinian population.
10 The reason why GNI growth is higher under the welfare-oriented approach lies in the behaviour of the price of capital (the rental rate of capital). Indeed, when labour subsidies are paid to some relatively capital-intensive sectors, as it is the case in this simulation, their expansion causes a pressure on the given capital stock and then increases its price.

22
References Astrup, C. and S. Dessus, Trade Options for the Palestinian Economy. Some Orders of Magnitude, Middle East and North Africa Working Paper Series, No.21, The World Bank, March 2001 Balian, O., War and Peace: a CGE Analysis of the Economic Effects of the Israeli-Palestinian Conflict, mimeo, 2002 Basu, K., Relief Programs: When it May be Better to Give Food Instead of Cash, World Development, Vol.24, No.1, pp.91-96, 1996; Easterly, W., The Elusive Quest for Growth. Economists' Adventures and Misadventures in the Tropics, The MIT Press, Cambridge, MA., 2002 Harris, J. And M.Todaro, Migration, Unemployment and Development: A Two-Sector Analysis", The American Economic Review, Vol. 60(1), pp. 126-142, 1970 Ruppert Bulmer, E., The Impact of Future Labour Policy Options on the Palestinian Labour Market, Middle East and North Africa Working Paper Series, No.21, The World Bank, June 2001 World Bank, Fifteen Months - Intifada, Closures and Palestinian Economic Crisis. An Assessment, The World Bank, 2002a (available on the web: www.worldbank.org) World Bank, Long Term Policy Options for the Palestinian Economy, The World Bank, 2002b (available on the web: www.worldbank.org) World Bank, Two years of Intifada, Closures and Palestinian Economic Crisis. An Assessment, The World Bank, 2003 (summary available on the web: www.worldbank.org)

23
APPENDIX 1: The Palestinian SAM for 1998 Input-output structure and primary income (US$, million) Food Oth.
Agric Manuf. Const Comm. Transp. Priv.
Serv. Pub. Serv.
Food 195 6 23 0 229 0 0 4 Oth Agr 46 1 28 0 0 0 0 0 Manuf 489 23 445 829 78 73 84 135 Const 4 0 6 113 7 0 22 36 Comm 507 0 512 3 263 9 13 58 Trans. 21 4 25 4 45 7 14 40 Priv. Svc
61 8 39 20 119 19 225 67
Pub Svc 0 0 0 0 0 0 15 0 Lab 89 38 205 179 473 103 426 349 Capit 177 4 321 245 214 80 546 18 Imports and final demand (US$, million) Import Private Cons Govt Cons Invest Export Food 1736 0 117 219 Other Agr 40 0 0 8 Manuf 821 0 382 450 Const 61 0 1108 38 Comm 126 0 1 10 Transp 249 0 33 1 Private Svc 84 215 33 2 Public Svc 7 761 1 1 Foreign aid 390 Factor payments from abroad 779 Transfers from abroad 140 Foreign Saving 1015