Agency Problem and Hedging in Agri-Food Chains: Model and Application
Upload
khangminh22Category
view
0download
0
December 2020
Food and You 2: Wave 1 Technical Report David Candy, Patten Smith, Kathryn Gallop, Charlie Peto
Contents 1 Introduction ............................................................................................................................ 2
1.1 Survey Background ...................................................................................................... 2 1.2 Summary of the survey ................................................................................................. 3
2 Questionnaire development and pilot .................................................................................. 8 2.1 Questionnaire design .................................................................................................... 8 2.2 Design of questions ...................................................................................................... 9 2.3 Cognitive testing ........................................................................................................... 9 2.4 Survey mailings ........................................................................................................... 12 2.5 Postal questionnaire design and modular approach ............................................... 13 2.6 Overview of survey content........................................................................................ 13
3 Sampling ............................................................................................................................... 17 3.1 Sample design ............................................................................................................. 17 3.2 Household sample design .......................................................................................... 18
4 Fieldwork & Response Rates .............................................................................................. 21 4.1 Letters and reminders ................................................................................................. 21 4.2 Online questionnaire ................................................................................................... 23 4.3 Postal questionnaire ................................................................................................... 24 4.4 Vouchers for participants ........................................................................................... 25 4.5 Handling queries ......................................................................................................... 26 4.6 Response rates ............................................................................................................ 26 4.7 Profile of achieved sample ......................................................................................... 28
5 Weighting ............................................................................................................................. 31 5.1 Overview of weighting ................................................................................................ 31 5.2 Calculation of selection weights ................................................................................ 32 5.3 Calibration to country population values .................................................................. 32
6 Experiments ......................................................................................................................... 41 7 Data validation and management ....................................................................................... 45
7.1 Overview ...................................................................................................................... 45 7.2 Data editing .................................................................................................................. 45 7.3 Coding .......................................................................................................................... 46 7.4 Data checks ................................................................................................................. 49
Appendices ............................................................................................................................... 51 Food and You 2 Wave 1 online questionnaire ................................................................... 53
Ipsos MORI’s standards and accreditations .......................................................................... 95
List of tables Table 1.1 Showing the questionnaire modules in each version of the questionnaire ......... 5 Table 3.1 Sample sizes and assumptions for each country ................................................. 17 Table 4.1 The number of returns for each version of the postal questionnaire ................. 25 Table 4.2 Response rates by region and country ................................................................. 27 Table 4.3 Demographic profile of survey responders........................................................... 28 Table 5.1 Population totals for age within gender in England ............................................. 33 Table 5.2 Population totals for age within gender in Wales ................................................. 33 Table 5.3 Population totals for age within gender in Northern Ireland ................................ 34 Table 5.4 Population totals for regions in England ............................................................... 34 Table 5.5 Population totals for regions in Wales .................................................................. 35 Table 5.6 Population totals for regions in Northern Ireland ................................................. 35 Table 5.7 Population totals for deprivation quintile in England ........................................... 35 Table 5.8 Population totals for deprivation quintiles in Wales ............................................ 36 Table 5.9 Population totals for deprivation quintile in England ........................................... 36 Table 5.10 Showing when to use each weight ....................................................................... 39 Table 6.1 A table showing the experimental conditions ....................................................... 42 Table 6.2 Address response rates by experimental condition ............................................. 42 Table 6.3 Questionnaire return rates per 1,000 issued addresses ...................................... 43 Table 6.4 Returned questionnaires ........................................................................................ 43
01 Introduction
1 Introduction 1.1 Survey Background The Food and You 2 Survey was commissioned by the Food Standards Agency (FSA) in September 2019. Data collection for Wave 1 was conducted between July and October 2020 among a cross-section of approximately 9,300 adults (aged 16 years or over) living in households in England, Wales and Northern Ireland. Adults invited to take part in the survey were selected from a sample of the Royal Mail’s Postcode Address File (PAF) using a random probability sampling methodology. The survey was conducted using a push-to-web methodology1 and explored participants’ food-related knowledge, behaviours and attitudes.
1.1.1 About the Food Standards Agency The Food Standards Agency (FSA)2 is an independent Government department working to protect public health and consumers’ wider interests in relation to food in England, Wales, and Northern Ireland. The FSA’s overarching mission is “food we can trust”. The goal and vision of the FSA is to ensure food is safe, food is what it says it is, consumers can make informed choices about what to eat, and consumers have access to an affordable diet, now and in the future. As such, understanding consumers’ attitudes, knowledge and behaviour in relation to food is of vital importance to the FSA.
Food and You 2 is the FSA’s principle source of methodologically robust and representative evidence regarding consumers’ attitudes, knowledge and behaviour in relation to food. This survey has an important role in measuring the FSA’s progress towards its strategic objectives, providing evidence to support its communication campaigns and other activities, and identifying topics for further research or action.
1.1.2 History of Food and You Since its inception in 2000, the FSA has commissioned surveys to collect quantitative data on the public’s reported behaviour, attitudes and knowledge relating to food. Between 2000 and 2007 the FSA conducted an annual Consumer Attitudes Survey (CAS). In 2010, this was replaced by the more rigorous ‘Food and You’, a biennial survey conducted face-to-face. Food and You became the FSA’s flagship social survey. In addition, the FSA conducted regular tracking surveys including the bi-annual Public Attitudes Tracker and annual Food Hygiene Rating Scheme (FHRS)3 Consumer Attitudes Tracker.
1 Push-to-web is a quantitative data collection method in which participants are contacted using an offline means of contact and asked to complete an online survey. In this survey, participants were contacted by letter, with those who chose not to complete the online survey, after the initial reminder, subsequently sent a postal version. 2 For more information on the FSA please visit the FSA website. 3 This scheme helps consumers choose where to eat out or shop for food by giving clear information about the businesses’ hygiene standards. The scheme is run in partnership with local authorities in England, Wales and Northern Ireland. For more information on the FHRS please visit the Food Hygiene Rating Scheme page on the FSA website.
In 2018, the FSA’s Advisory Committee for Social Science (ACSS)4 recommended that Food and You and the Public Attitudes Tracker were replaced with a new ‘push-to-web’ survey. Food and You 2 was commissioned in 2019 with data collection commencing in July 2020. Due to differences in the survey methodologies, comparisons cannot be made between Food and You or the Public Attitudes Tracker and Food and You 2, therefore 2020 will be the start of a new data time series. Data will be collected through Food and You 2 on a bi-annual basis.
1.2 Summary of the survey
1.2.1 Design The research was conducted using a push-to-web methodology with households selected to take part in the survey receiving a letter that invited them to complete the Food and You 2 survey online. Up to two adults in each household could take part. Fieldwork was conducted from 29th July 2020 to 6th October 2020. It is important to note that restrictions were in place, in all three nations, during the fieldwork period due to the Covid-19 pandemic. This included restrictions on how often people could leave their residence, the types of food businesses that were open, and who you could eat out with. Restrictions may have impacted on some participant’s behaviours relating to food, and in turn may have impacted on how participants answered certain questions and how many people responded to the survey.
In this study, the fieldwork was structured around four mailings:
Mailing 1: Initial invitation letter inviting up to two individuals per household to complete the Food and You 2 survey online
Mailing 2: Reminder letter
Mailing 3: Second reminder, which included up to two versions of a postal questionnaire
Mailing 4: Final reminder letter
Mailings 2, 3 and 4 were sent only to those who had not completed the survey since the previous mailing, and households where there was a known second participant who was eligible to take part but had not yet completed the questionnaire.5
1.2.2 Questionnaire The survey included an online version of the questionnaire and two postal versions. On all versions there were slight differences between the questionnaires in England, Wales and
4 For more information on the ACSS please visit the ACSS website. 5 There was a question in Food and You 2: Wave 1 which asked for the number of adults in a household. If one person responded in a household and they stated that there was only one adult in their household, they would not be sent a reminder letter. If they stated that more than one adult was present in their household then that household would be sent a reminder, unless both adults had completed the survey.
Northern Ireland, reflecting the different regional government bodies, their roles and responsibilities. For participants in Wales, both the online and postal surveys were offered in Welsh and English. Participants could take part in Food and You 2 via the online survey or using a postal survey.
The online questionnaire was formed of a series of modules covering key areas of interest to the FSA. Most questions were behavioural, asking participants to state their usual activities or to recall recent actions.6 A smaller number of questions were attitudinal, asking participants to state their opinions on various subjects, or knowledge-based, for example asking participants what they think the temperature inside their fridge should be. The questionnaire included demographic questions to allow the FSA to conduct subgroup analysis on the data.
Due to the length and complexity of the online questionnaire it was not possible to include all questions in the postal version of the questionnaire. The postal version of the questionnaire needed to be shorter and less complex to encourage a high response rate.
To make the postal version of the questionnaire shorter and less complex, two versions were produced. Key modules (e.g. About You) were asked in both versions of the postal survey and either had questions relating to food poisoning or food safety. Details of which modules were included in each postal version are outlined below (see Table 1.1).
6 When analysing data from Food and You 2: Wave 1 it is important to note that behaviours are self-reported and therefore may not reflect actual observable behaviour. Measures were taken to minimise the impact of social desirability (for instance, stating that results were reported anonymously) and to increase accuracy (including time frames), but there is likely to be some difference in self-reported and actual observable measures.
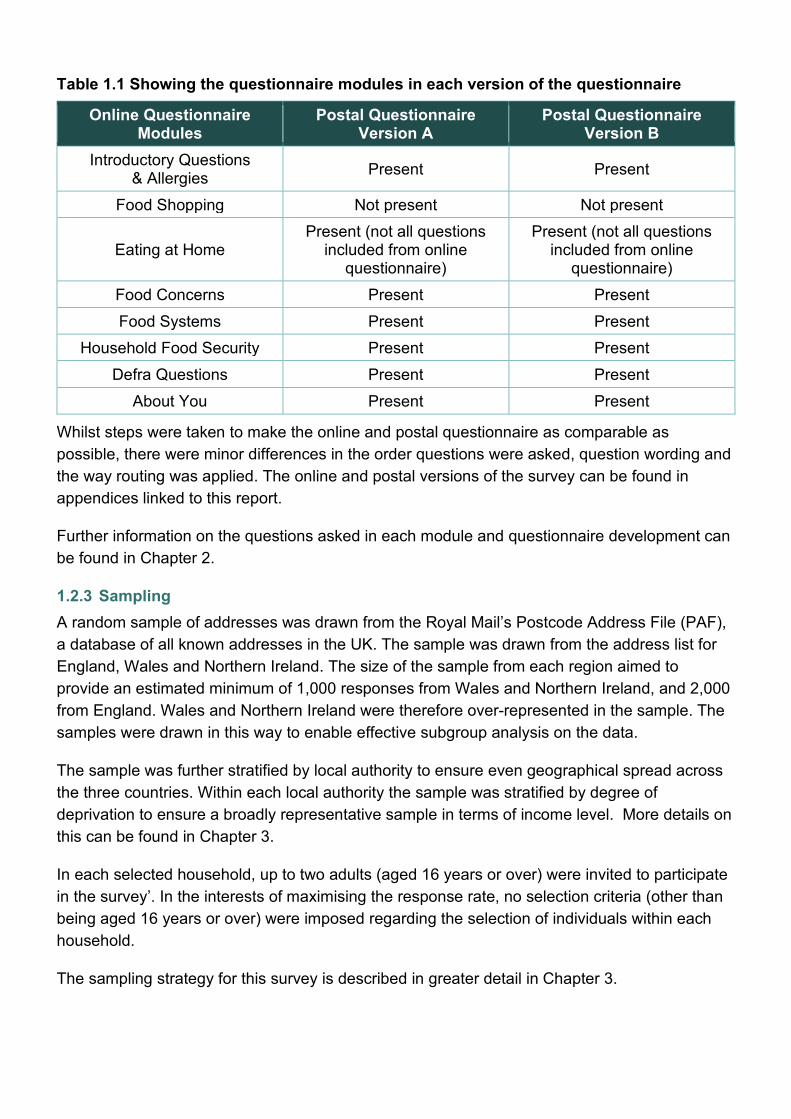
Table 1.1 Showing the questionnaire modules in each version of the questionnaire
Online Questionnaire Modules
Postal Questionnaire Version A
Postal Questionnaire Version B
Introductory Questions & Allergies Present Present
Food Shopping Not present Not present
Eating at Home Present (not all questions
included from online questionnaire)
Present (not all questions included from online
questionnaire) Food Concerns Present Present Food Systems Present Present
Household Food Security Present Present Defra Questions Present Present
About You Present Present
Whilst steps were taken to make the online and postal questionnaire as comparable as possible, there were minor differences in the order questions were asked, question wording and the way routing was applied. The online and postal versions of the survey can be found in appendices linked to this report.
Further information on the questions asked in each module and questionnaire development can be found in Chapter 2.
1.2.3 Sampling A random sample of addresses was drawn from the Royal Mail’s Postcode Address File (PAF), a database of all known addresses in the UK. The sample was drawn from the address list for England, Wales and Northern Ireland. The size of the sample from each region aimed to provide an estimated minimum of 1,000 responses from Wales and Northern Ireland, and 2,000 from England. Wales and Northern Ireland were therefore over-represented in the sample. The samples were drawn in this way to enable effective subgroup analysis on the data.
The sample was further stratified by local authority to ensure even geographical spread across the three countries. Within each local authority the sample was stratified by degree of deprivation to ensure a broadly representative sample in terms of income level. More details on this can be found in Chapter 3.
In each selected household, up to two adults (aged 16 years or over) were invited to participate in the survey’. In the interests of maximising the response rate, no selection criteria (other than being aged 16 years or over) were imposed regarding the selection of individuals within each household.
The sampling strategy for this survey is described in greater detail in Chapter 3.
1.2.4 Weighting Weighting is a process by which a dataset is adjusted to account for any demographic discrepancies between the sample who completed a survey and the desired survey population. In this instance, weighting meant adjusting the data to make it closer to the populations of England, Wales and Northern Ireland.
Following data collection, the data was weighted according to certain criteria. First, selection weights were calculated for each country individually, and then the weights were calibrated to the country population totals, which were taken from mid-year ONS estimates. Following this, weights were created for use in combined-country analyses by scaling the country sample sizes to be proportional to their corresponding country population values. Since participants did not all answer the same questions (due to the postal / online discrepancies and the postal Version A / postal Version B discrepancies), four separate question-type weights were calculated in each country and in the combined-country sample.
Following this, a further ‘Welsh-England’ weight was calculated to permit comparisons to be made between England (excluding London) and Wales after controlling for differences in age, gender, ethnic group, household size, and urban-rural mix.
Further details on weighting for this survey are described in greater detail in Chapter 5.
Further details on weighting for this survey are described in greater detail in Chapter 5.
02 Questionnaire development and pilot
2 Questionnaire development and pilot
This section covers the various stages of questionnaire development that occurred prior to fieldwork.
2.1 Questionnaire design Food and You 2 is the FSA’s flagship social survey. It collects data on consumers’ self-reported knowledge, behaviour and attitudes relating to a range of topics relating to food.
Food and You 2 uses a sequential mixed-mode approach involving an initial online stage, with non-respondents then followed up using a postal questionnaire. Therefore the questionnaire was designed in such a way that it could be presented online and on paper. Like many other push-to-web surveys, the online version of the questionnaire is too long and complex to translate into an equivalent self-completion questionnaire suitable for postal administration. This meant there were some differences between the online and postal questionnaires. To help address this limitation, two versions of the postal questionnaire were developed, thereby enabling more questions to be asked across the sample as a whole. However, even with two versions of the postal questionnaire, there was insufficient space to include some of the online questions.
Given the wide range of topic areas that the FSA and external stakeholders were interested in investigating, the issue of questionnaire length was considered throughout the questionnaire development period. Ipsos MORI recommended that, in the interest of reducing drop-out rates, the online questionnaire should not take longer than 30 minutes for the average participant to complete and the postal questionnaires should not be more than 16 pages in length (this was latterly extended to 20 pages to increase coverage of key survey questions to enable greater analysis). This time limit for the online survey and page limit for the postal survey were recommended to minimise the risk of participants not completing the survey, and to minimise the risk of straight-lining (i.e. selecting the same answer consistently) when going through the survey.
A modular approach was required for Food and You 2 to keep the length of the survey to a maximum of 30 minutes, and to minimise the likelihood of participants starting but not completing the survey. It also maximised coverage of topics and allows for new modules or questions to be added on emerging topic areas. The topic areas were grouped into broad ‘modules’ (such as food shopping, food concerns or eating at home). These modules were then assessed for frequency of fielding (6 months, 12 months or 24 months). For instance, attitudinal questions that are used to measure the FSA’s performance (e.g. trust in the FSA) or where fluctuations over time are more likely (e.g. concerns with food) were considered to be ‘core’ and therefore collected every 6 months. Whereas behavioural questions (e.g. on food practices in the home) that were relatively stable over time in previous studies were deemed to be appropriate for fielding less frequently.
The development of the questionnaire included three primary phases. The first phase began with two questionnaire development workshops, followed by the development of a draft questionnaire. The second phase involved testing the draft questionnaire using cognitive interviews. The third phase consisted of a pilot and usability tests to test the functionality of the online questionnaire on various devices (namely smartphones, tablets and computers) and to assess the length of the online questionnaire. Each phase is described in more detail below.
2.2 Design of questions The content and nature of the questions was informed by previous research conducted by the FSA, the FSA and stakeholders’ research priorities, and by Ipsos MORI’s prior experience in survey research.
During the first phase of questionnaire development, Ipsos MORI and the FSA discussed the aims and objectives of the study. Given the number and range of interested parties, two workshops were arranged to discuss the questionnaire. The first with the Food and You 2 advisory group,7 and the second with key internal stakeholders to discuss their priorities for the questionnaire and provide Ipsos MORI with direction regarding questionnaire content.
In the first workshop with the advisory group, the Food and You Wave 5 questionnaire was reviewed in detail. In the second workshop key stakeholders were asked what their evidence requirements were; these were then grouped into themes. In consultation with the core FSA research team and drawing on the key themes chosen, Ipsos MORI then identified the relevant questions from previous research studies (Food and You, and Public Attitudes tracker) and compiled them into a draft questionnaire. Numerous alterations to the wording, ordering, format and content of the questions were made in the process based on survey design best practice.
For instance, the questions that had previously been asked by an interviewer in a face-to-face interviewer-led survey were adapted so that they were suitable for both online and postal methodologies (self-completion), where the participant guides themself through the survey.
2.3 Cognitive testing In social and market research, cognitive testing refers to a form of qualitative data collection in which participants are asked by an interviewer to examine a set of materials and explain their understanding of them. In questionnaire development, cognitive testing interviews are used to evaluate how participants approach a questionnaire so that any issues regarding participant comprehension may be highlighted.
Following the completion of the first questionnaire draft, a series of cognitive testing interviews were arranged in April and May 2020 to test a sub-set of questions from the questionnaire. The cognitive testing was intended to aid the development of the questionnaire by allowing Ipsos MORI and the FSA to identify questions requiring further development. A total of 26 interviews were conducted with members of the public. Four of the interviews were conducted in the Welsh
7 The advisory group was composed of members of the FSA’s Advisory Committee for Social Science and members of the Food and You Working Group
language. During recruitment participants were screened on age, ethnicity, income, whether or not they get any benefits, diet type and whether or not they suffered from food allergies or intolerances. This ensured we spoke to people with different food behaviours and habits, which was important for assessing the questions.
Key aims of the cognitive testing included:
To gauge the simplicity of questions and participant comprehension of key terms;
To note any room for ambiguity in the interpretation of the questions; and
To identify any questions that may not produce meaningful data.
The Welsh language interviews, also aimed to evaluate the accuracy and clarity of the translations.
Each cognitive interview was undertaken with a single participant, lasted approximately one hour, and was conducted over the internet by a moderator using online video conferencing software (the Covid-19 pandemic having precluded face-to-face interviews). During each interview, the moderator recorded the participant’s answers and noted further observations regarding how the participant interpreted the questionnaire, with attention paid to any problems encountered. The English language interviews were conducted by moderators from Ipsos MORI, while the Welsh language interviews were conducted by a trusted external qualitative researcher. Some of the interviews were conducted in the (virtual) presence of an observer from the FSA.
Following completion of the interviews, Ipsos MORI submitted a written report to the FSA detailing the findings. An extended meeting was subsequently held to discuss the findings and agree on further edits to the questionnaire.
2.3.1 Usability testing Following the cognitive testing phase, a usability testing phase was arranged to further aid the development of the questionnaire by allowing Ipsos MORI and the FSA to identify areas where improvements could be made in form and format of the questions. As the questionnaire had already undergone revision following the cognitive testing phase, further significant changes to questionnaire design were not anticipated. Instead, the interviews were intended to shed light on the online survey’s versatility across the various devices commonly used to access the internet (i.e. smartphones, computers, and tablets) and allow minor adjustments to be made where necessary to enhance this versatility. The usability tests were additionally used to investigate perceptions of the draft invitation letter that would be sent to households invited to participate.
Interviews were conducted with eleven members of the public. Participants were recruited by ithoughtresearch, an external recruitment agency, and screened on the same criteria that was used for the cognitive testing. Each usability testing interview was undertaken with a single participant, lasted approximately one and a half hours, and was conducted over the internet by
a moderator using online video conferencing software (the Covid-19 pandemic having precluded face-to-face interviews). The interviews were conducted by moderators from Ipsos MORI, in some cases in the (virtual) presence of an observer from the FSA.
A usability testing script, which included all the questions planned for Wave 1 of the survey, was developed in advance of the interviews. Prior to the interview, each participant was invited to use a specific device for the interviews. One group of participants was asked to use a smartphone, a second group was asked to use a tablet, and a further group was invited to use a computer. This was done so that any formatting issues that may be specific to a certain device could be highlighted at the time. During each interview, the participant was first asked to provide their thoughts on the invitation letter (which was emailed to the participant in advance), focusing on legibility, layout and the clarity of the information provided. Then the participant was invited to open the survey on their device and answer the questions, with the moderator paying particular attention to any problems encountered with formatting and layout.
2.3.2 Pilot Prior to fieldwork, a pilot was arranged to measure the time it took to complete the entire online questionnaire as well as individual modules. The questionnaire was designed to take an average of 25-30 minutes. Additionally, the pilot checked routing applied to the online questionnaire, checked that all answer options were being used and looked at how participants answered the open-ended questions.
The pilot ran on the Ipsos MORI access panel in June 2020. During fieldwork, 390 participants in England, Wales and Northern Ireland answered the full version of the online survey. Though no hard quotas were set, appropriate efforts were made to ensure that participants were broadly representative.
Once the full version of the Food and You 2 Wave 1 online questionnaire had been finalised, members of the Ipsos MORI access panel were sent an email inviting them to complete the survey. Fieldwork took place over a period of four days. Prior to the launch of the pilot survey, the ‘recontact’ and ‘voucher’ questions were removed from the end of the pilot survey as they conflicted with IIS (Ipsos MORI’s online access panel provider) data policies.8
To assess the length of different modules and the survey overall, timestamps were inserted into the online questionnaire in the background to record how long each participant had taken to complete each module. Once the fieldwork was complete, these timestamps were assessed to understand survey length. Checks were carried out on the data to ensure that the routing was correct.
The findings of the usability tests and the pilot were compiled and summarised in a report delivered to the FSA in June 2020. The usability tests found a number of issues regarding
8 These polices preclude any contact details being collected of panel members. Additionally, IIS have a system setup to incentivise panellists and so they did not need to be provided an additional incentive.
survey format on the relevant devices. The pilot showed that the average time taken to complete the survey was under the maximum practical time of 30 minutes (the mean time of completion in the pilot survey was 26 minutes and 48 seconds). However, it was envisaged that average completion time would be longer during the fieldwork period due to two factors: the inclusion of the recontact and voucher questions; and the fact that pilot participants were “professional” participants who regularly completed surveys and would therefore be more familiar with surveys than ordinary members of the public.
Recommendations were made in the report to remedy these issues. Changes to question layout and presentation were suggested to make the survey easier to complete online. On the issue of questionnaire length, the report recommended that no further changes would be required, advising that the improvements in question layout and presentation would be sufficient to keep average survey completion time under 30 minutes.
2.4 Survey mailings The survey was conducted in England, Wales and Northern Ireland using a push-to-web methodology. As noted, push-to-web is a quantitative data collection method in which offline contact modes are used to encourage sample members to go online and complete an online questionnaire.
The push-to-web methodology used in this survey mirrored a tried-and-tested methodology used by Ipsos MORI in previous studies; a sequential mixed-mode approach in which participants are at first asked to complete an online survey, with non-respondents then followed up using a postal questionnaire at the third mailing. The rationale behind this methodology is that it brings the benefits of encouraging online survey completion while avoiding the exclusion of those who do not have access to the internet and/or have low levels of digital literacy.
In this study, the methodology consisted of a series of four mailings sent to selected households. The second, third, and fourth mailings were only sent to households who had not responded to the survey since the previous mailing. The schedule is outlined below:
Mailing 1: Initial invitation letter
Mailing 2: First reminder letter
Mailing 3: Postal questionnaire and second reminder letter
Mailing 4: Final reminder
The first mailing invited recipients to complete the survey online. The letter invited two adults from each household to participate. Each participant was provided with a unique passcode allowing them to complete the questionnaire on the survey website. Those who did not complete the survey following receipt of the initial invitation letter were sent a reminder letter a few weeks following the mailout of the invitation.
The second mailing took the form of a reminder letter, again inviting participants to complete the online survey. In the third mailing, copies of the postal version of the questionnaire were sent alongside a letter instructing recipients how to complete and send back the postal questionnaire. Lastly, a final reminder letter was sent. Each mailing was separated by an interval of a few weeks.
2.5 Postal questionnaire design and modular approach The postal questionnaires consisted of a selection of questions from the online survey. The full questionnaire was not included in the postal versions due to concerns regarding questionnaire length. Instead, two versions of the postal questionnaire were created to cover different sections of the full online survey (which have been discussed earlier in this chapter). In the third mailing, each household received one of the two versions of the postal questionnaire.
Questions were selected for inclusion in the postal questionnaire based on a number of factors. For instance questions that were a key strategic measure for the FSA (e.g. trust in the FSA) were included to provide the FSA with robust data. Questions were also included to maximise the base sizes for specific groups of interest (e.g participants with food allergies). Finally, questions where the mode of delivery and sample profile may have impacted on the data collected, for example questions on food security. It was important to include the majority of the demographic questions in the postal survey to enable subgroup analysis.
As with the online questionnaire, there were minor differences between England, Wales and Northern Ireland in the wording of a small number of questions. Participants in Wales were sent one copy of the questionnaire in English and one in Welsh.
As noted, the survey was conducted using a modular approach. Certain ‘core’ modules were included in each biannual survey wave, while others were rotated every 12 or 24 months. The content of the survey for this wave is detailed in the section below.
2.6 Overview of survey content Introductory Questions
In the online survey, this module began with a question asking for confirmation of age (as those under 16 years were not eligible to participate). This was followed by a small number of questions asking participants for some basic information about themselves and their household, such as their gender identity, and the number and age of any other household members. The module also asked participants whether they had a food allergy, food intolerance or Coeliac disease so that the questionnaire could be tailored to individuals.
Food Shopping
In this module, participants were asked about their food shopping activities, including: where and how often they shopped for food, whether they check food labels when shopping, and whether they check for food and allergy alerts.
Eating at Home
This module was intended to gauge participant knowledge of and adherence to the FSA food safety and hygiene guidelines. Participants were asked about the ways in which they store, prepare, and consume food in the home.
Food Concerns
In this module, participants were asked whether they had any concerns with the food they ate, followed by a spontaneous question asking them to give details on these. This was followed by questions which listed specific food concerns, prompting participants on the food concerns they may have.
Food System
This module gauged participant confidence in the food supply chain (including in farmers, food manufacturers, and shops) and asked participants questions relating to the FSA, and trust in its ability to fulfil its key responsibilities.
Household Food Security
This module incorporated the USDA 10-item US Adult Food Security module,9 a standardised measure that uses indicator questions to assess different levels of food security experienced by participants and their households. It asked a series of questions regarding participants’ ability to afford food over the previous 12 months. It also asked about changes participants had made to their eating habits in the last 12 months, and the reason for these changes (e.g. financial reasons, health reasons).
Due to the sensitive nature of the topic area, all questions in this section were optional and included a ‘Prefer not to say’ option, in addition to ‘Don’t know’ or ‘Not stated’ options. Any questions that had any of these three responses, or that were left blank, were treated as ‘missing’, with no data imputed. In total 313 respondents had missing responses to the first three questions and so their overall food security status was set to missing.
Defra Questions
This module included questions requested by the Department for Environment, Food and Rural Affairs10 (who made a small financial contribution to the study).
It asked questions about participants’ food-buying activities. This included questions relating to environmental concerns, provenance and what influences purchasing choices.
Open ended questions were analysed in R by Defra.
9 The USDA has published the most up to date guidance, including how to calculate food security scores. For more detail information please visit the guidebook. 10 For more information about Defra please visit the DEFRA website.

About You and Your Household
This final module asked participants various questions about their personal circumstances and those of their household, including age, marital status and working status. The inclusion of these questions was primarily intended to enable demographic subgroup analysis of the data.
03 Sampling
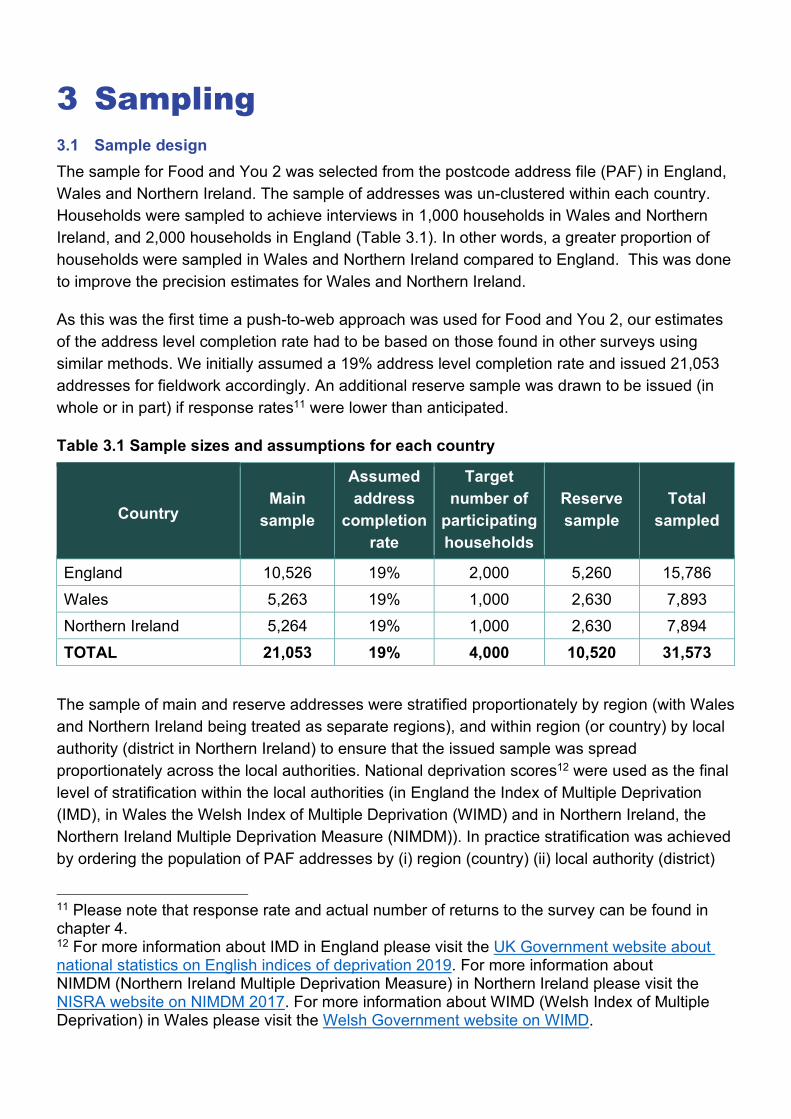
3 Sampling 3.1 Sample design The sample for Food and You 2 was selected from the postcode address file (PAF) in England, Wales and Northern Ireland. The sample of addresses was un-clustered within each country. Households were sampled to achieve interviews in 1,000 households in Wales and Northern Ireland, and 2,000 households in England (Table 3.1). In other words, a greater proportion of households were sampled in Wales and Northern Ireland compared to England. This was done to improve the precision estimates for Wales and Northern Ireland.
As this was the first time a push-to-web approach was used for Food and You 2, our estimates of the address level completion rate had to be based on those found in other surveys using similar methods. We initially assumed a 19% address level completion rate and issued 21,053 addresses for fieldwork accordingly. An additional reserve sample was drawn to be issued (in whole or in part) if response rates11 were lower than anticipated.
Table 3.1 Sample sizes and assumptions for each country
Country Main
sample
Assumed address
completion rate
Target number of
participating households
Reserve sample
Total sampled
England 10,526 19% 2,000 5,260 15,786 Wales 5,263 19% 1,000 2,630 7,893 Northern Ireland 5,264 19% 1,000 2,630 7,894 TOTAL 21,053 19% 4,000 10,520 31,573
The sample of main and reserve addresses were stratified proportionately by region (with Wales and Northern Ireland being treated as separate regions), and within region (or country) by local authority (district in Northern Ireland) to ensure that the issued sample was spread proportionately across the local authorities. National deprivation scores12 were used as the final level of stratification within the local authorities (in England the Index of Multiple Deprivation (IMD), in Wales the Welsh Index of Multiple Deprivation (WIMD) and in Northern Ireland, the Northern Ireland Multiple Deprivation Measure (NIMDM)). In practice stratification was achieved by ordering the population of PAF addresses by (i) region (country) (ii) local authority (district)
11 Please note that response rate and actual number of returns to the survey can be found in chapter 4. 12 For more information about IMD in England please visit the UK Government website about national statistics on English indices of deprivation 2019. For more information about NIMDM (Northern Ireland Multiple Deprivation Measure) in Northern Ireland please visit the NISRA website on NIMDM 2017. For more information about WIMD (Welsh Index of Multiple Deprivation) in Wales please visit the Welsh Government website on WIMD.
within region and (iii) national derivation score of LSOA (OA on Northern Ireland) within local authority (district), and then selecting addresses by the method of random start and fixed interval. The steps for sampling that were taken were:
1. Order the address list by region (for England only) 2. Within each English region / Wales / Northern Ireland, order addresses by local authority
(district in Northern Ireland) 3. Within local authority / district, order addresses by IMD of LSOA in England, WIMD of
LSOA in Wales, and NIMDM of SOA in Northern Ireland 4. Select numbers of addresses shown in table 3.1 by method of random start and fixed
interval from these ordered lists 5. Divide stratum-ordered selections into successive groups of 3 selections 6. Within each group of 3, randomly allocate 2 cases to the main sample, and one case to
the reserve sample.
3.2 Household sample design Addresses were selected from the Postcode Address File (PAF) systematically using the random start and fixed interval method to take part in the Food and You 2 survey. At each address, up to two adults were invited to take part in the survey. Two unique login codes for the online survey were provided on each invitation, and at the postal questionnaire mailing (M3), and up to two questionnaires were sent (if one adult in a household had already completed the questionnaire online, then only the unused password and one questionnaire were sent in reminders). Each adult who completed the questionnaire received either a £15 online voucher, £10 online/paper voucher and £5 online/paper voucher, depending on when they took part and what experimental group they were part of. Further information on the experiments can be found in Chapter 6.
3.2.1 Process for selecting adults within a household There are many approaches that could have been used for selecting adults within households. For instance, the two adults with the most recent birthdays or the adults with the two next birthdays could be selected. These are commonly referred to as quasi-random approaches, as they are roughly equivalent to a fully random approach. While this would have randomised the selection process to a degree in households where there were more than two adults, in self-administered surveys it adds another barrier to completing the survey and has shown to not be carried out correctly in about 20% to 25% of cases13,14.
13 TNS BMRB (2013). Community Life Survey: Summary of web experiments. Report prepared for the Cabinet Office. 14 Olson, Kristen, and Jolene D. Smyth. 2014. “Accuracy of Within-Household Selection in Web and Mail Surveys of the General Population.” Field Methods 26:56–69.
With this previous point in mind, it was decided not to apply any selection criteria for taking part in the survey. Instead, any two members of the household (aged 16 years or over) could take part. Under this approach, it is estimated that 93% of the sample were the ones that would be selected using a quasi-random approach (compared to 57% of the sample if only one adult was selected).
3.2.2 Impact of up to two adults per household taking part in the survey There is a small impact on data from obtaining more than one response per household, which results from the increased clustering effects – we would expect people in the same household to have, on average, similar food shopping, cooking, food preparation and eating habits, which would result in a small loss of precision. However, this loss in precision is likely to be more than outweighed by the gain in precision from the resulting less variable within-household selection weights. Furthermore, for any estimates that are reported by sex, the clustering effect within the household will be more or less negligible as for the vast majority of households with more than one participant, one will be male and one female.
.
04 Fieldwork
4 Fieldwork & Response Rates 4.1 Letters and reminders
4.1.1 Letters and reminder strategy The mailing approach followed Ipsos MORI’s standard push-to-web methodology:
1. An initial invitation letter was issued to all sampled addresses inviting up to two adults to go online and complete the online questionnaire. This letter was mailed on the 27th July 2020 and began to arrive at sampled addresses on the 29th July 2020.
2. The first reminder letter was issued on the 7th August 2020 and began to arrive at sampled addresses on 11th August 2020. Reminder invitations were sent to non-responding addresses and addresses where one adult had completed the online questionnaire but not a second adult (the presence of an eligible second adult was determined in the first questionnaire).
3. The second reminder letter was issued on the 1st September 2020 and began to arrive at sampled addresses on 3rd September 2020. This was sent to non-responding addresses and addresses where one adult has completed the online questionnaire but not a second adult; all of these letters were accompanied by one or two postal questionnaires, to allow those who could not access the internet, and those who are less comfortable completing online questionnaires, to take part. Version A and Version B were assigned to person one and person two in the household on a quasi-random basis. This means that if one adult had already completed the survey in a household the other adult would have been randomly allocated either of the versions.
Those in Wales received one questionnaire in English and one in Welsh.
4. A final reminder letter was issued on 10th September 2020 and began to arrive at sampled addresses on 12th September 2020. Non-responding addresses and addresses where one adult had completed the online questionnaire but not a second adult. All non-responding addresses in Wales and Northern Ireland were issued the final reminder, with only 50% of non-responding addresses sent a final reminder in England (this was due to greater than the target number of returns in England having already been received). The survey remained open until 6th October 2020.
4.1.2 Letter design The principles for designing the invitation and reminder letters were based on the Tailored Design Method,15 along with a host of literature and best practice based on previous studies (mainly the Active Lives survey and Labour Force Survey). The main aim of the letters was to
15 Dillman, DA. Smyth, JD. Christian, LM. Internet, Phone, Mail and Mixed-Mode Surveys: The Tailored Design Method (2014). Wiley.
provide all the relevant information a participant requires to complete the survey, and to answer immediate questions which they may have.
Our guiding principles for designing the letters were:
Use simple and easy to understand language, with no unnecessary complicated text
To cover key messages that needed to be conveyed in the letters including:
(a) Importance
(b) Motivators for taking part
(c) How to take part
(d) Your personal data are safe
a) Importance was conveyed in all four letters in the following ways:
- FSA and Defra logos were prominent
- Visual clutter which could distract from the logos and the importance of the survey
was avoided
- Professional letter format with address of recipient and full date
- Signed by someone with authority (signified by their job title and organisation
details)
- Highlighted key messages in the text; using these to break up the text made it
easier to read
b) The main motivational statements varied across the four letters, with the aim of increasing the likelihood of converting non-respondents:
- 1st letter: It’s easy to take part and why take part
- 2nd letter: Taking part will benefit you and your community
- 3rd letter: We want to hear from as many people as possible
- 4th letter: This is the last chance to have your say
- In addition, all letters placed a degree of emphasis on the financial motivator for
taking part – receiving a £5, £10 or £15 gift voucher (the amount depended on the
experimental group participants were part of and when they completed the survey,
as detailed in Chapter 6)
In addition to this the letters also provided key information about Ipsos MORI and the Food Standards Agency and contact details for Ipsos MORI should the participant have any queries about the survey.
4.2 Online questionnaire The Food and You 2 Wave 1 survey was hosted using Ipsos MORI’s global Dimensions platform in Rackspace, a managed hosting facility and Europe’s most successful managed hosting company. The security features offered by Rackspace, and Ipsos MORI are listed below:
At Rackspace:
Rackspace has SAS 70 type II and Safe Harbor certifications;
The servers and network infrastructure are physically located in England;
The servers and network components are fully redundant;
Rackspace guarantees recovery of hardware failures within one hour.
At Ipsos MORI:
All access to Dimensions’ questionnaires and data was password protected. Only a small number of online survey experts had access.
Survey data and any participants personal information were stored in separate databases. Penetration testing was carried out on our installation to check that there were no problems.
4.2.1 Survey URL
We used the URL www.foodandyou2.org for the Food and You 2 Wave 1 survey. When deciding on the URL we wanted to choose an address that was short enough for participants to remember and one which would not easily be mis-typed. It also needed to give some indication of survey content.
4.2.2 Online questionnaire accessibility The online questionnaire was made to be as accessible as possible to participants. Key to this was offering the survey in Welsh (as per Welsh government guidelines) so those in Wales could complete the survey in Welsh. While we cannot be certain how many participants completed the survey in Welsh, 306 participants (around 5% of all online participants), viewed at least one page in Welsh. Participants could request to complete the survey in another language by calling the Food and You 2 survey helpline, or by asking someone to complete it on their behalf.
The Food and You 2 survey was designed to be accessed using a range of devices, including desktop computers, laptops, tablets and smart phones. The survey was designed with a ‘mobile first’16 approach to minimise drops offs and improve response rates. Additionally, the online questionnaire was designed in a way that made it easy for people to adjust colour contrasts and increase font size.
4.2.3 Break offs and questionnaire length Only 6.9% of all participants (441) who started the survey did not complete it, and the median completion time of those who did complete it was 29 minutes and 58 seconds.
4.3 Postal questionnaire At the second reminder (M3) non-responding households were sent postal questionnaires. Households in England and Northern Ireland where one adult had completed the questionnaire and in which a second adult had been identified were sent one postal questionnaire, otherwise non-responding households were sent two postal questionnaires in these countries. All non-responding households in Wales were sent two postal questionnaires – one in English and one in Welsh.
Each household that received two postal questionnaires received one Version A and one Version B postal questionnaire. Households that were sent one postal questionnaire received only one of these versions. In total 3,383 participants completed the postal questionnaire with 1,712 completing Version A and 1,672 completing Version B. There were 37 participants in Wales who completed the Welsh language postal questionnaire. The number of returns for each individual version of the postal questionnaire is detailed in Table 4.1.
16 A ‘mobile first’ approach means that the online questionnaire was designed with smart phone users in mind initially, as this is increasingly how participants choose to access online questionnaires. For more information on this please look at Ipsos MORI’s mobile first best practice guide.
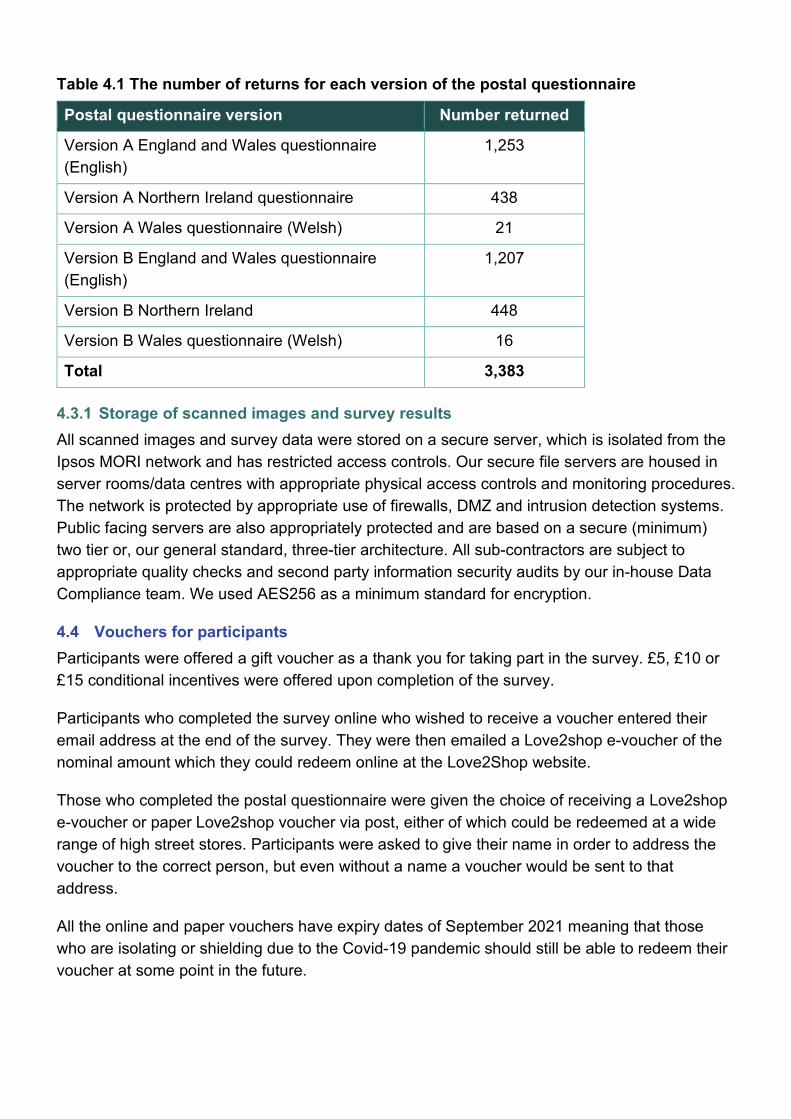
Table 4.1 The number of returns for each version of the postal questionnaire
Postal questionnaire version Number returned
Version A England and Wales questionnaire (English)
1,253
Version A Northern Ireland questionnaire 438
Version A Wales questionnaire (Welsh) 21
Version B England and Wales questionnaire (English)
1,207
Version B Northern Ireland 448
Version B Wales questionnaire (Welsh) 16
Total 3,383
4.3.1 Storage of scanned images and survey results All scanned images and survey data were stored on a secure server, which is isolated from the Ipsos MORI network and has restricted access controls. Our secure file servers are housed in server rooms/data centres with appropriate physical access controls and monitoring procedures. The network is protected by appropriate use of firewalls, DMZ and intrusion detection systems. Public facing servers are also appropriately protected and are based on a secure (minimum) two tier or, our general standard, three-tier architecture. All sub-contractors are subject to appropriate quality checks and second party information security audits by our in-house Data Compliance team. We used AES256 as a minimum standard for encryption.
4.4 Vouchers for participants Participants were offered a gift voucher as a thank you for taking part in the survey. £5, £10 or £15 conditional incentives were offered upon completion of the survey.
Participants who completed the survey online who wished to receive a voucher entered their email address at the end of the survey. They were then emailed a Love2shop e-voucher of the nominal amount which they could redeem online at the Love2Shop website.
Those who completed the postal questionnaire were given the choice of receiving a Love2shop e-voucher or paper Love2shop voucher via post, either of which could be redeemed at a wide range of high street stores. Participants were asked to give their name in order to address the voucher to the correct person, but even without a name a voucher would be sent to that address.
All the online and paper vouchers have expiry dates of September 2021 meaning that those who are isolating or shielding due to the Covid-19 pandemic should still be able to redeem their voucher at some point in the future.
4.5 Handling queries The survey website provided information about the survey and included a list of FAQs which had been developed based on similar studies.
Additionally, a dedicated telephone helpline and email address ([email protected]) were set up allowing participants to contact Ipsos MORI if they had any queries about the survey. Telephone queries were first recorded by an answer machine and a member of the research team returned the call when they had identified an appropriate solution. Emails sent to the Food and You 2 survey inbox were first answered with automatic responses, which included the commonly asked questions and answers. Each query was then followed up individually within five working days.
There were around 500 queries in the first wave, the majority of which were regarding when participants would receive their voucher. The letters and FAQs were subsequently updated for Wave 2 to make it clearer when participants could expect to receive their voucher.
Other queries included participants requesting a postal questionnaire, wishing to opt out of the survey or experiencing difficulties accessing the online survey.
4.6 Response rates The overall response rate for Food and You 2 Wave 1 was 30.4%, with 1.45 adults participating per household. Of the surveys completed, 63.7% were online and 36.3% were postal questionnaires. Response rates did vary by region and by experimental group.17 The table below shows the variation in response rate by region and country.
17 Details of the response rate for each experimental condition can be found in chapter six.
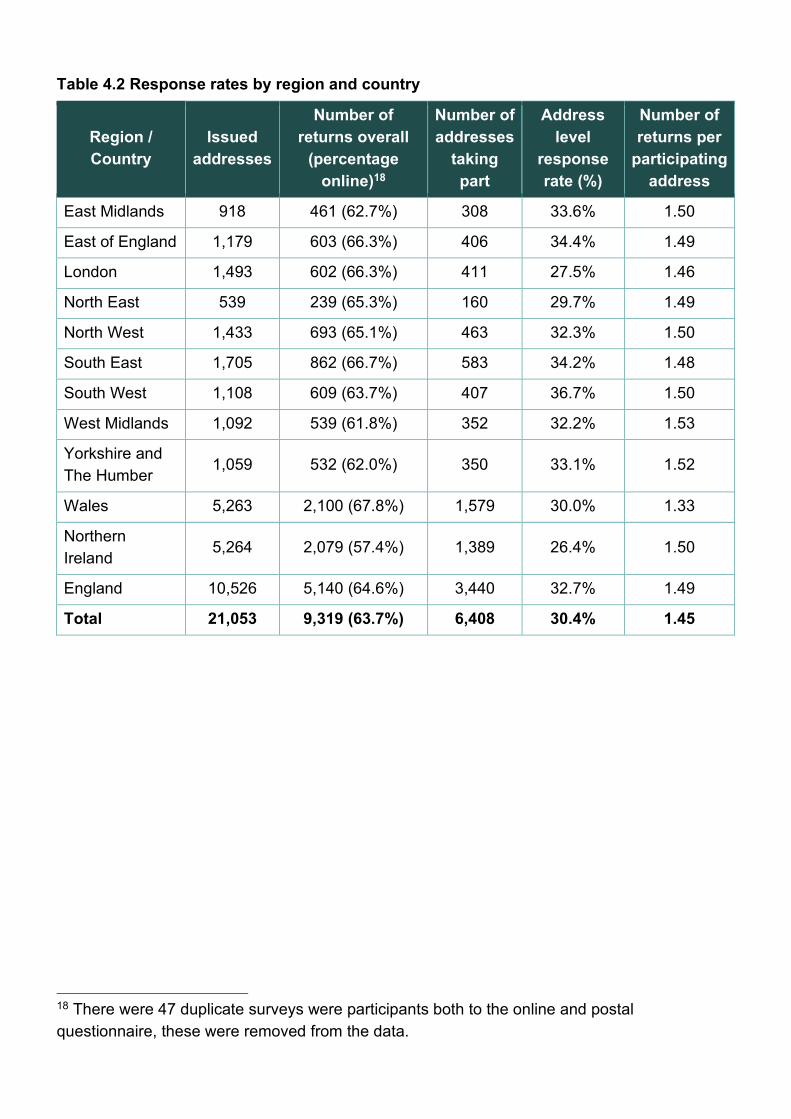
Table 4.2 Response rates by region and country
Region / Country
Issued addresses
Number of returns overall
(percentage online)18
Number of addresses
taking part
Address level
response rate (%)
Number of returns per
participating address
East Midlands 918 461 (62.7%) 308 33.6% 1.50
East of England 1,179 603 (66.3%) 406 34.4% 1.49
London 1,493 602 (66.3%) 411 27.5% 1.46
North East 539 239 (65.3%) 160 29.7% 1.49
North West 1,433 693 (65.1%) 463 32.3% 1.50
South East 1,705 862 (66.7%) 583 34.2% 1.48
South West 1,108 609 (63.7%) 407 36.7% 1.50
West Midlands 1,092 539 (61.8%) 352 32.2% 1.53
Yorkshire and The Humber
1,059 532 (62.0%) 350 33.1% 1.52
Wales 5,263 2,100 (67.8%) 1,579 30.0% 1.33
Northern Ireland
5,264 2,079 (57.4%) 1,389 26.4% 1.50
England 10,526 5,140 (64.6%) 3,440 32.7% 1.49
Total 21,053 9,319 (63.7%) 6,408 30.4% 1.45
18 There were 47 duplicate surveys were participants both to the online and postal questionnaire, these were removed from the data.
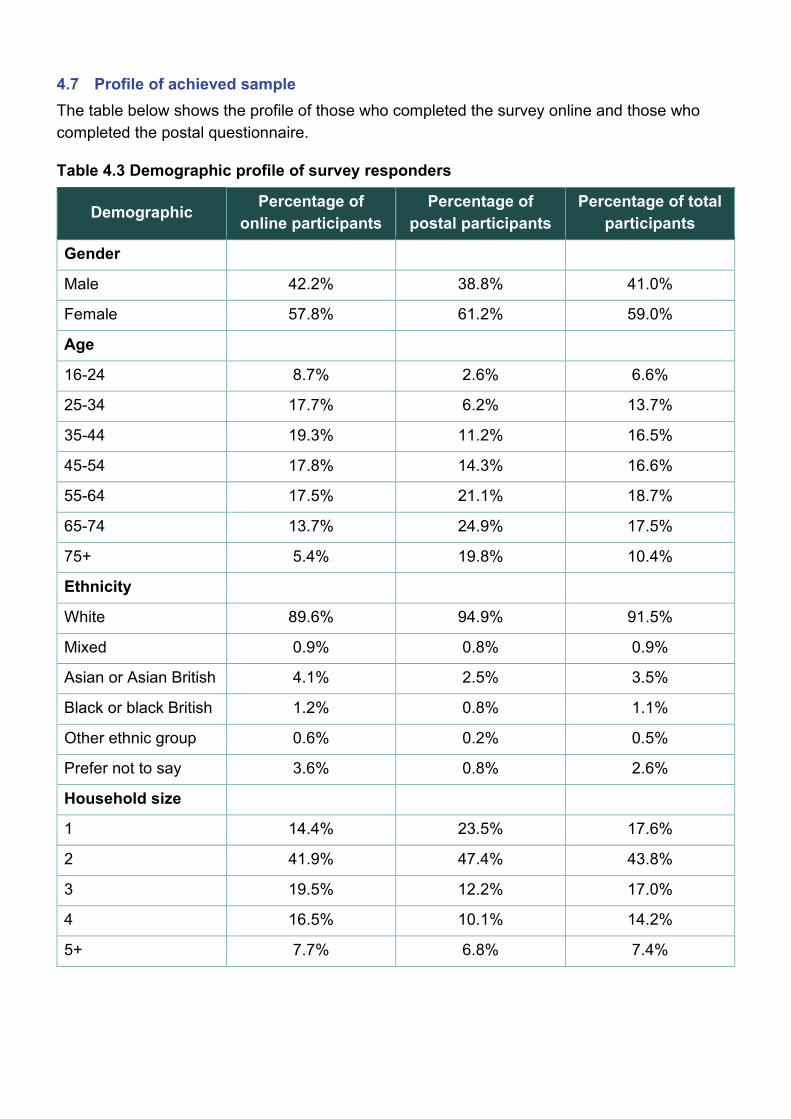
4.7 Profile of achieved sample The table below shows the profile of those who completed the survey online and those who completed the postal questionnaire.
Table 4.3 Demographic profile of survey responders
Demographic Percentage of online participants
Percentage of postal participants
Percentage of total participants
Gender
Male 42.2% 38.8% 41.0%
Female 57.8% 61.2% 59.0%
Age
16-24 8.7% 2.6% 6.6%
25-34 17.7% 6.2% 13.7%
35-44 19.3% 11.2% 16.5%
45-54 17.8% 14.3% 16.6%
55-64 17.5% 21.1% 18.7%
65-74 13.7% 24.9% 17.5%
75+ 5.4% 19.8% 10.4%
Ethnicity
White 89.6% 94.9% 91.5%
Mixed 0.9% 0.8% 0.9%
Asian or Asian British 4.1% 2.5% 3.5%
Black or black British 1.2% 0.8% 1.1%
Other ethnic group 0.6% 0.2% 0.5%
Prefer not to say 3.6% 0.8% 2.6%
Household size
1 14.4% 23.5% 17.6%
2 41.9% 47.4% 43.8%
3 19.5% 12.2% 17.0%
4 16.5% 10.1% 14.2%
5+ 7.7% 6.8% 7.4%

Table 4.3 shows that those who are 45 or younger are more likely to complete the online questionnaire than the postal questionnaire, with the opposite true for those over 55. Those from a non-white ethnic background were more likely to complete online questionnaire with the opposite true for those who were white.
05 Weighting
5 Weighting 5.1 Overview of weighting Weights were initially calculated separately for each country in two stages:
1. Calculation of selection weights (described in section 5.2)
2. Calibration to country population totals (described in section 5.3)
Next, weights were created for use in analyses of combined-country data by scaling the weighted country sample sizes to be proportional to the corresponding aged 16 years or over country population values.
Because it was not possible to include all questions in all questionnaires (see chapter 2), four separate question-type weights were calculated in each country, and in the combined all-country sample. These four question-type weights were designed to be used as follows:
1. All-questionnaire weights to be used for questions asked of all sample members in all online and postal questionnaires
2. Online questionnaire weights to be used for questions asked only of online participants (i.e., questions not asked in the postal questionnaires)
3. Online + postal version A weights to be used for questions asked of online participants and postal questionnaire participants who completed version A but not version B of the postal questionnaire
4. Online + postal version B weights to be used for questions asked of online participants and postal questionnaire participants who completed version B but not version A of the postal questionnaire
Once the main weights were calculated as described above, supplementary ‘Welsh-England’ (excluding London) weights were calculated. These were designed to allow comparisons to be made between Wales and England after controlling for country profile differences in age within gender, ethnic group, number of adults per household, and urban-rural mix.
5.2 Calculation of selection weights Selection weights were created to compensate for (i) variations in within-household individual selection probabilities and response propensities19 and (ii) the fact that, by design, some questions were each asked only of half the postal questionnaire participants. They were calculated as follows:
All-questionnaire selection weight = (number of eligible people aged 16 years or over in the household)/(number of participants in the household).
Online questionnaire selection weight = (number of eligible people aged 16 years or over in the household)/(number of online participants in the household).
All-questionnaire and online selection weights were capped to the range 1-3 to restrict variance inflation.
Online and postal questionnaire Version A weights were calculated by multiplying the all-questionnaire selection weight by a factor of 2 for the postal questionnaire participants. This was done because only half the postal survey participants had been sent Version A (the other half having been sent Version B). Online and postal questionnaire version B weights were calculated in the same way.
5.3 Calibration to country population values Next, selection weights were applied to the individual country samples and each was calibrated to the corresponding country population values for the number of adults aged 16 or over for (i) age band within gender (ii) geographic area (defined separately for each country) and (iii) deprivation quintile (calculated using each country’s multiple deprivation index). These weighting variables are often used as standard in social surveys because they correlate reliably with both response propensity and a wide range of survey variables. We note that in previous rounds of the Food and You survey working status was used as a weighting variable instead of deprivation quintile. It was decided to drop this variable from the weighting matrix, because survey fieldwork took place during the Covid-19 pandemic during which rates of employment were likely to be unstable. Deprivation quintile was identified as a suitable substitute indicator of general economic prosperity.
Weighting targets are shown below.20
19 As a maximum of two eligible adults were interviewed per household, adults in larger households are less likely to be included in the survey. So without this weight, individuals living in households in which households where some eligible adults were not interviewed would be underrepresented relative to individuals living in households in which all eligible adults were interviewed. 20 Sources: ONS Mid 2019 Population Estimates and NISRA Mid 2019 Population Estimates.
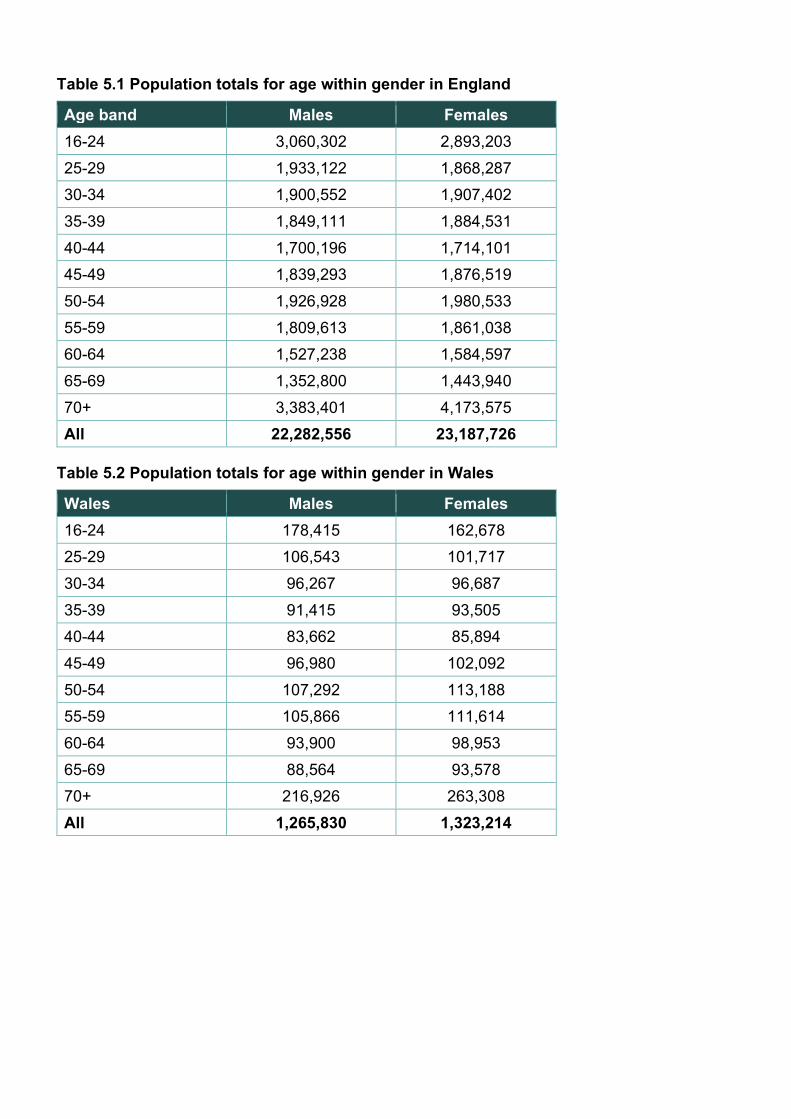
Table 5.1 Population totals for age within gender in England
Age band Males Females 16-24 3,060,302 2,893,203 25-29 1,933,122 1,868,287 30-34 1,900,552 1,907,402 35-39 1,849,111 1,884,531 40-44 1,700,196 1,714,101 45-49 1,839,293 1,876,519 50-54 1,926,928 1,980,533 55-59 1,809,613 1,861,038 60-64 1,527,238 1,584,597 65-69 1,352,800 1,443,940 70+ 3,383,401 4,173,575 All 22,282,556 23,187,726
Table 5.2 Population totals for age within gender in Wales
Wales Males Females 16-24 178,415 162,678 25-29 106,543 101,717 30-34 96,267 96,687 35-39 91,415 93,505 40-44 83,662 85,894 45-49 96,980 102,092 50-54 107,292 113,188 55-59 105,866 111,614 60-64 93,900 98,953 65-69 88,564 93,578 70+ 216,926 263,308 All 1,265,830 1,323,214
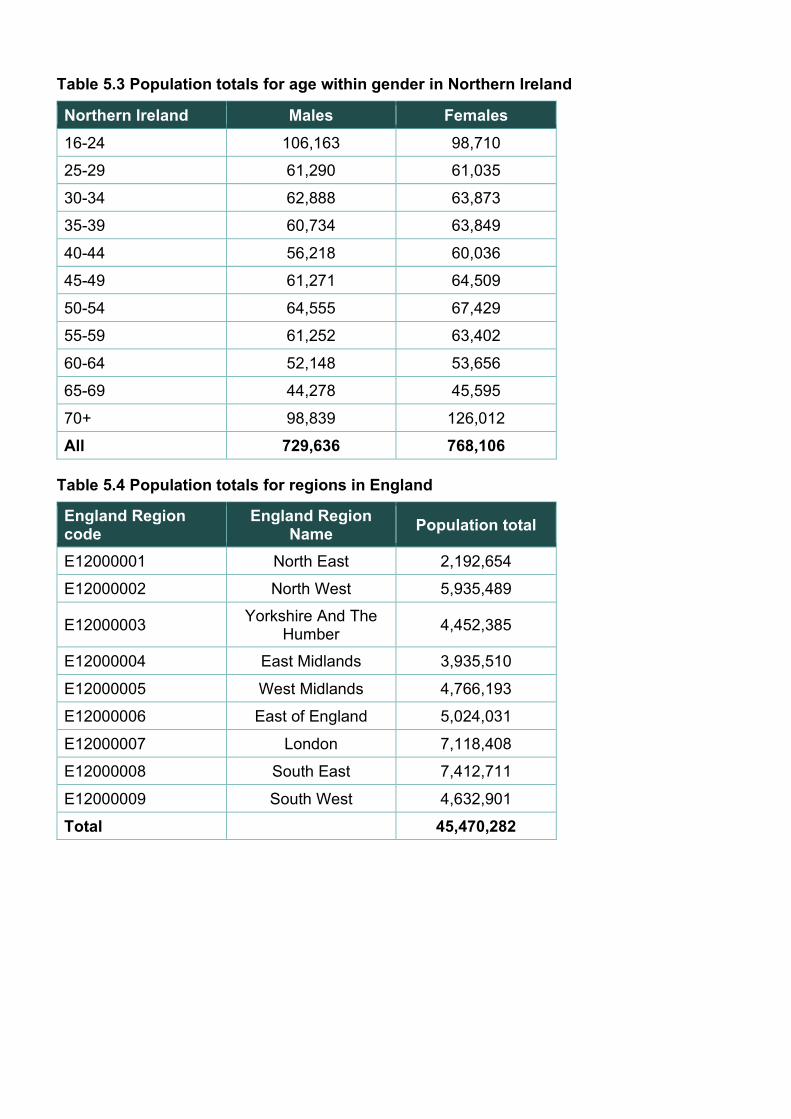
Table 5.3 Population totals for age within gender in Northern Ireland
Northern Ireland Males Females 16-24 106,163 98,710 25-29 61,290 61,035 30-34 62,888 63,873 35-39 60,734 63,849 40-44 56,218 60,036 45-49 61,271 64,509 50-54 64,555 67,429 55-59 61,252 63,402 60-64 52,148 53,656 65-69 44,278 45,595 70+ 98,839 126,012 All 729,636 768,106
Table 5.4 Population totals for regions in England
England Region code
England Region Name Population total
E12000001 North East 2,192,654 E12000002 North West 5,935,489
E12000003 Yorkshire And The Humber 4,452,385
E12000004 East Midlands 3,935,510 E12000005 West Midlands 4,766,193 E12000006 East of England 5,024,031 E12000007 London 7,118,408 E12000008 South East 7,412,711 E12000009 South West 4,632,901 Total 45,470,282
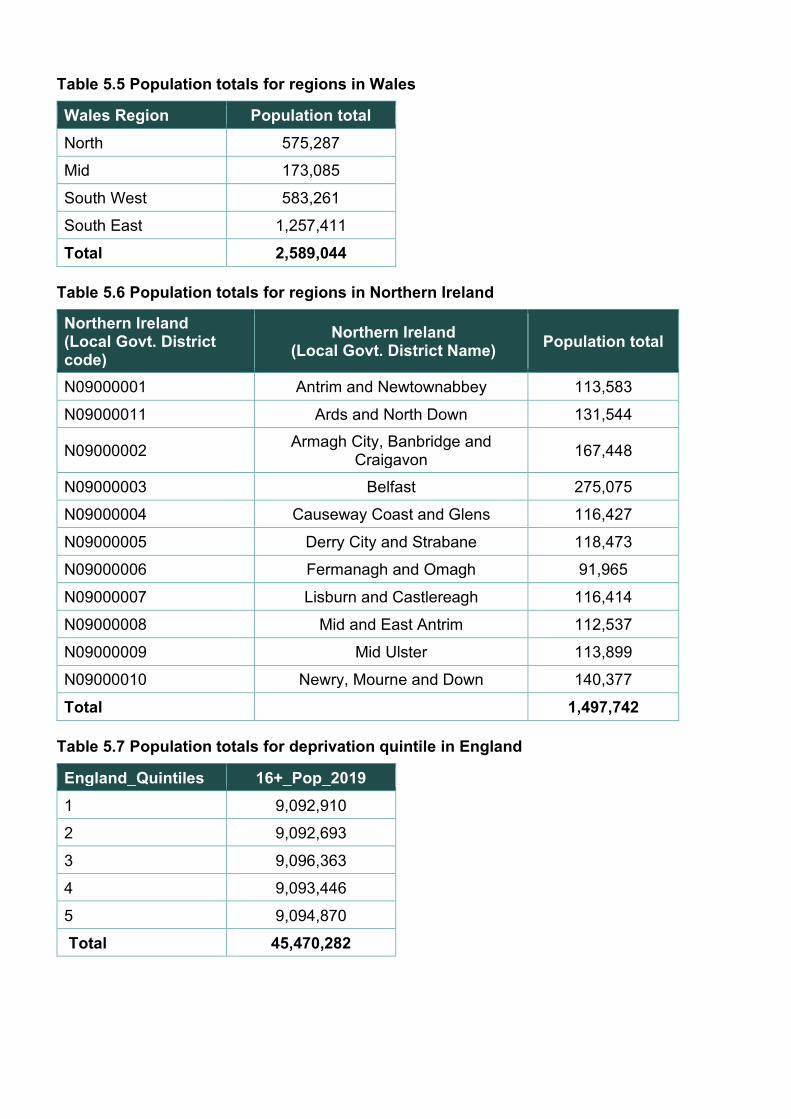
Table 5.5 Population totals for regions in Wales
Wales Region Population total North 575,287
Mid 173,085
South West 583,261
South East 1,257,411
Total 2,589,044
Table 5.6 Population totals for regions in Northern Ireland
Northern Ireland (Local Govt. District code)
Northern Ireland (Local Govt. District Name) Population total
N09000001 Antrim and Newtownabbey 113,583 N09000011 Ards and North Down 131,544
N09000002 Armagh City, Banbridge and Craigavon 167,448
N09000003 Belfast 275,075 N09000004 Causeway Coast and Glens 116,427 N09000005 Derry City and Strabane 118,473 N09000006 Fermanagh and Omagh 91,965 N09000007 Lisburn and Castlereagh 116,414 N09000008 Mid and East Antrim 112,537 N09000009 Mid Ulster 113,899
N09000010 Newry, Mourne and Down 140,377
Total 1,497,742
Table 5.7 Population totals for deprivation quintile in England
England_Quintiles 16+_Pop_2019 1 9,092,910 2 9,092,693
3 9,096,363
4 9,093,446
5 9,094,870
Total 45,470,282
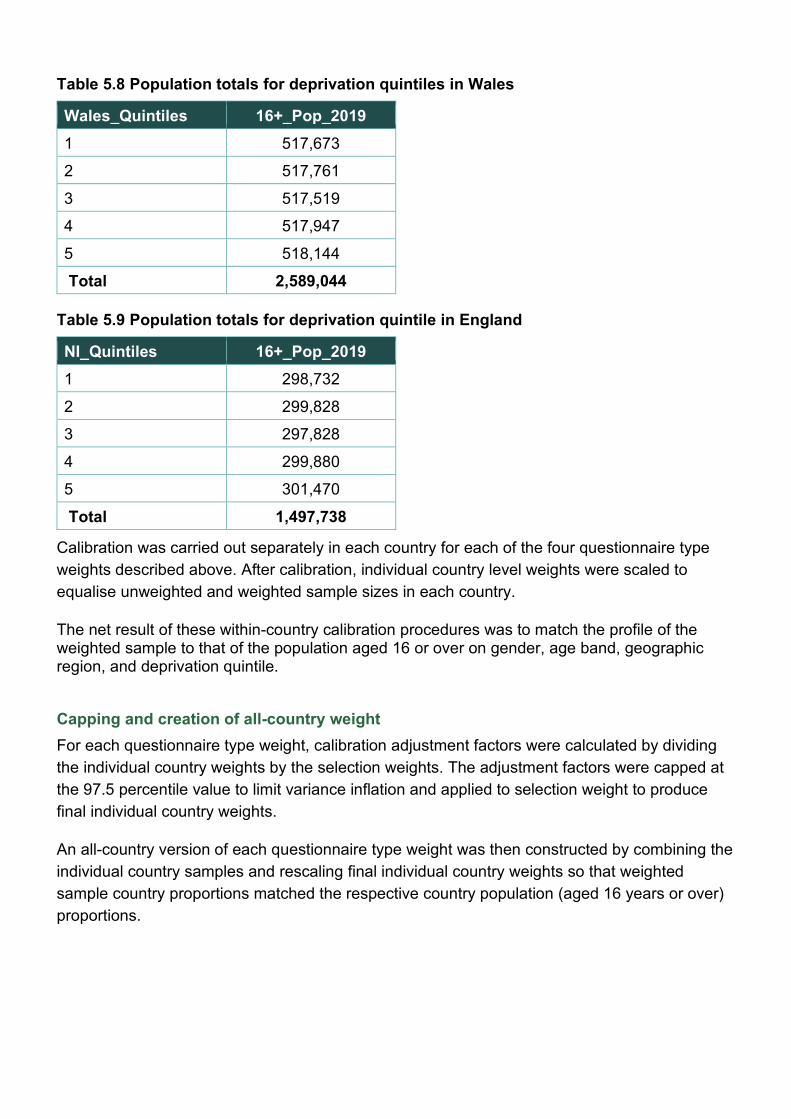
Table 5.8 Population totals for deprivation quintiles in Wales
Wales_Quintiles 16+_Pop_2019 1 517,673 2 517,761
3 517,519
4 517,947
5 518,144
Total 2,589,044
Table 5.9 Population totals for deprivation quintile in England
NI_Quintiles 16+_Pop_2019 1 298,732
2 299,828
3 297,828
4 299,880
5 301,470
Total 1,497,738
Calibration was carried out separately in each country for each of the four questionnaire type weights described above. After calibration, individual country level weights were scaled to equalise unweighted and weighted sample sizes in each country.
The net result of these within-country calibration procedures was to match the profile of the weighted sample to that of the population aged 16 or over on gender, age band, geographic region, and deprivation quintile.
Capping and creation of all-country weight For each questionnaire type weight, calibration adjustment factors were calculated by dividing the individual country weights by the selection weights. The adjustment factors were capped at the 97.5 percentile value to limit variance inflation and applied to selection weight to produce final individual country weights.
An all-country version of each questionnaire type weight was then constructed by combining the individual country samples and rescaling final individual country weights so that weighted sample country proportions matched the respective country population (aged 16 years or over) proportions.
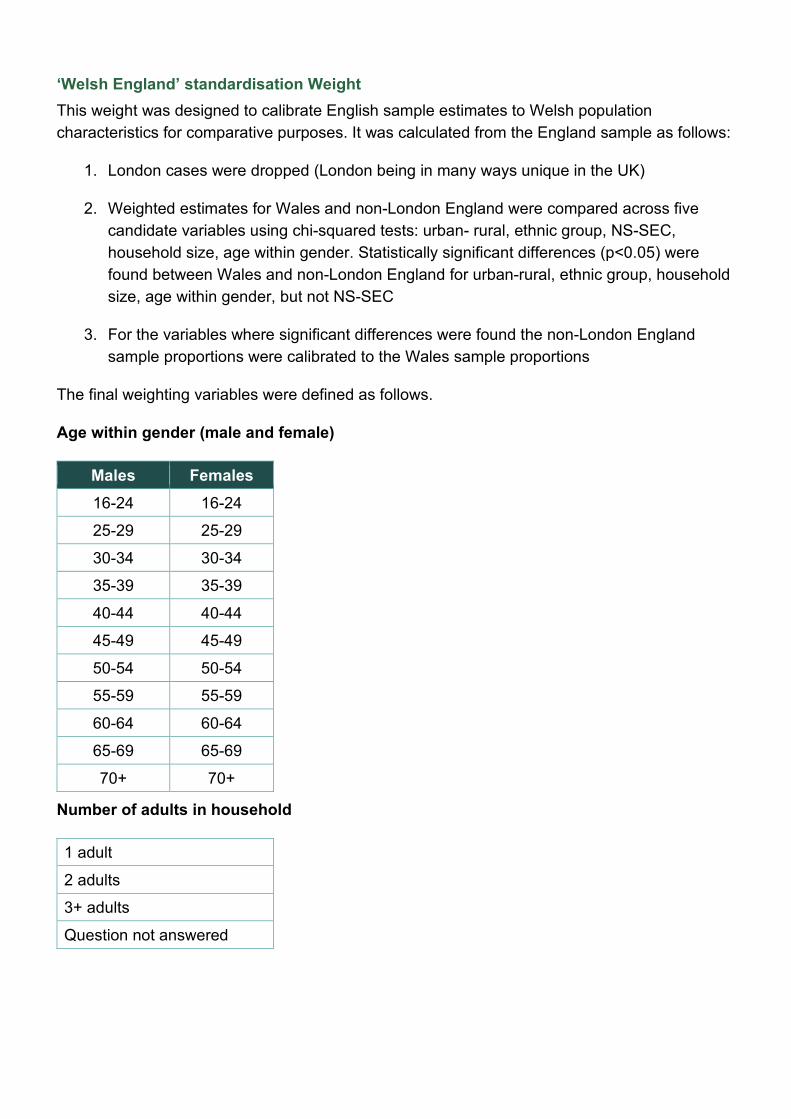
‘Welsh England’ standardisation Weight This weight was designed to calibrate English sample estimates to Welsh population characteristics for comparative purposes. It was calculated from the England sample as follows:
1. London cases were dropped (London being in many ways unique in the UK)
2. Weighted estimates for Wales and non-London England were compared across five candidate variables using chi-squared tests: urban- rural, ethnic group, NS-SEC, household size, age within gender. Statistically significant differences (p<0.05) were found between Wales and non-London England for urban-rural, ethnic group, household size, age within gender, but not NS-SEC
3. For the variables where significant differences were found the non-London England sample proportions were calibrated to the Wales sample proportions
The final weighting variables were defined as follows.
Age within gender (male and female)
Males Females 16-24 16-24
25-29 25-29
30-34 30-34
35-39 35-39
40-44 40-44
45-49 45-49 50-54 50-54
55-59 55-59
60-64 60-64
65-69 65-69
70+ 70+
Number of adults in household
1 adult
2 adults
3+ adults
Question not answered
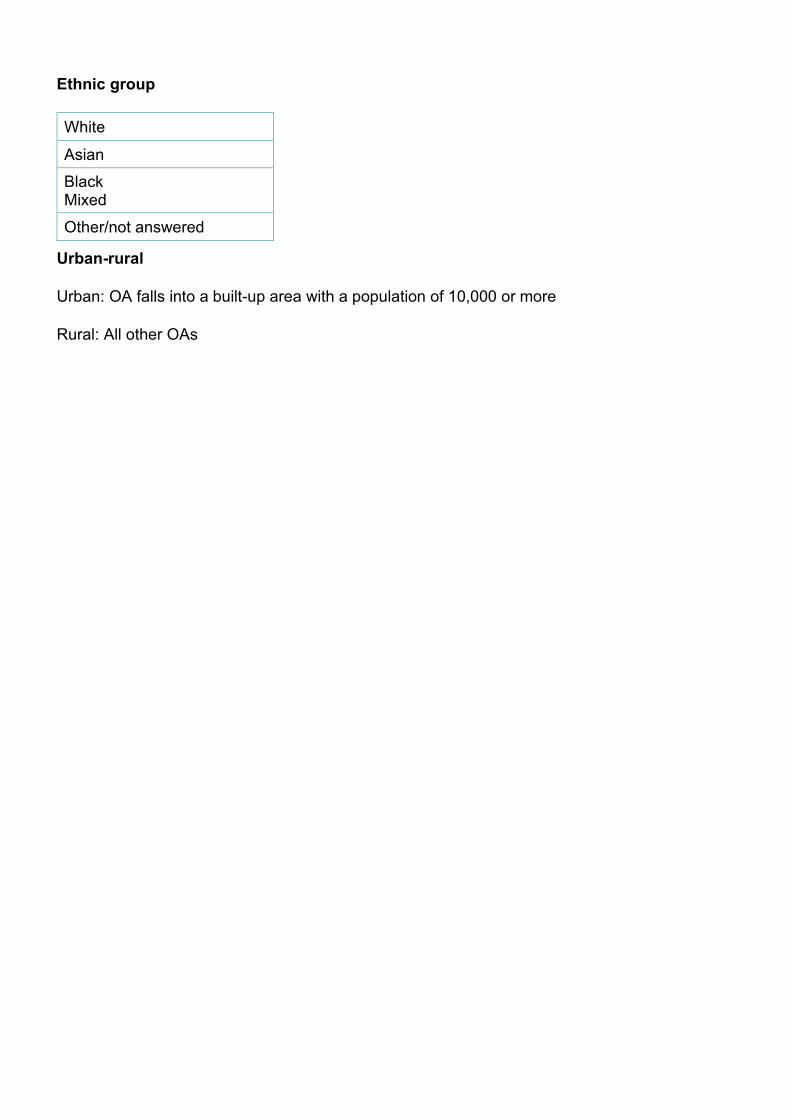
Ethnic group
White
Asian Black Mixed Other/not answered
Urban-rural
Urban: OA falls into a built-up area with a population of 10,000 or more
Rural: All other OAs
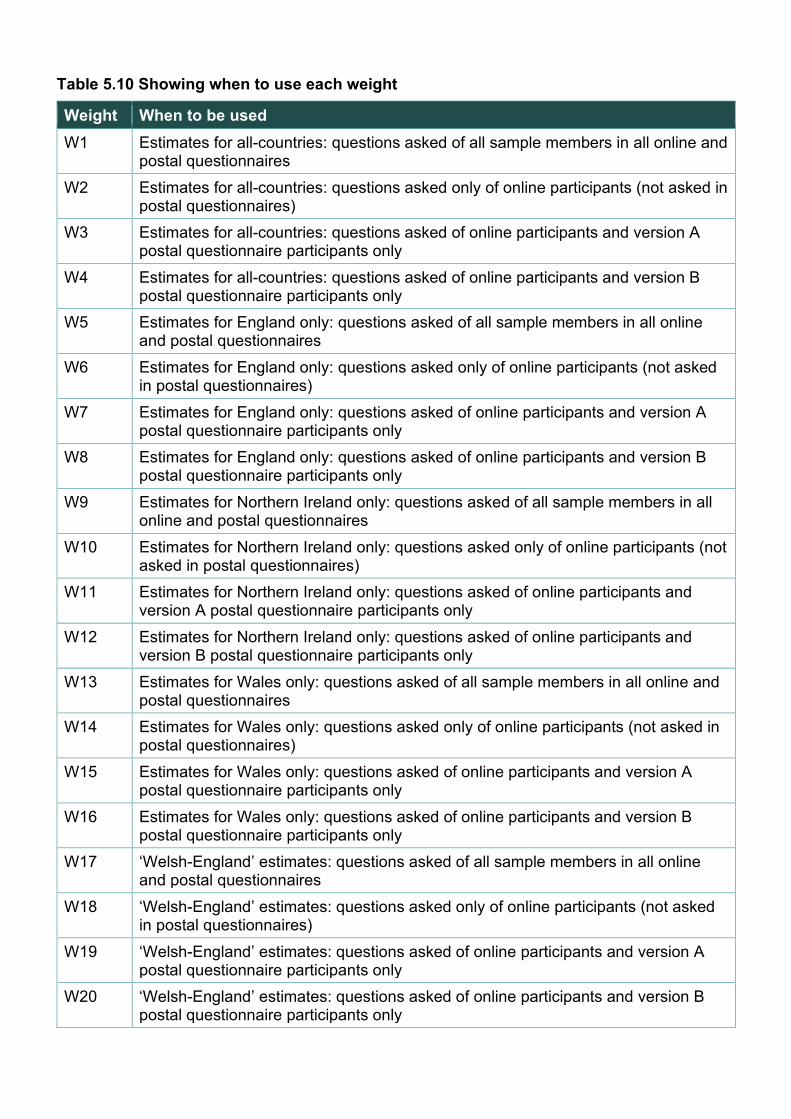
Table 5.10 Showing when to use each weight
Weight When to be used W1 Estimates for all-countries: questions asked of all sample members in all online and
postal questionnaires W2 Estimates for all-countries: questions asked only of online participants (not asked in
postal questionnaires) W3 Estimates for all-countries: questions asked of online participants and version A
postal questionnaire participants only W4 Estimates for all-countries: questions asked of online participants and version B
postal questionnaire participants only W5 Estimates for England only: questions asked of all sample members in all online
and postal questionnaires W6 Estimates for England only: questions asked only of online participants (not asked
in postal questionnaires) W7 Estimates for England only: questions asked of online participants and version A
postal questionnaire participants only W8 Estimates for England only: questions asked of online participants and version B
postal questionnaire participants only W9 Estimates for Northern Ireland only: questions asked of all sample members in all
online and postal questionnaires W10 Estimates for Northern Ireland only: questions asked only of online participants (not
asked in postal questionnaires) W11 Estimates for Northern Ireland only: questions asked of online participants and
version A postal questionnaire participants only W12 Estimates for Northern Ireland only: questions asked of online participants and
version B postal questionnaire participants only W13 Estimates for Wales only: questions asked of all sample members in all online and
postal questionnaires W14 Estimates for Wales only: questions asked only of online participants (not asked in
postal questionnaires) W15 Estimates for Wales only: questions asked of online participants and version A
postal questionnaire participants only W16 Estimates for Wales only: questions asked of online participants and version B
postal questionnaire participants only W17 ‘Welsh-England’ estimates: questions asked of all sample members in all online
and postal questionnaires W18 ‘Welsh-England’ estimates: questions asked only of online participants (not asked
in postal questionnaires) W19 ‘Welsh-England’ estimates: questions asked of online participants and version A
postal questionnaire participants only W20 ‘Welsh-England’ estimates: questions asked of online participants and version B
postal questionnaire participants only
06 Experiments
6 Experiments 6.1 Early completion incentive experiment
6.1.1 Introduction In the Food and You 2 Survey, like many other web-push surveys, the online version of the questionnaire is too long and complex to translate into an equivalent postal self-completion questionnaire suitable for postal administration. To help address this limitation, two versions of the postal questionnaire were developed thereby enabling more questions to be asked across the sample as a whole. However, even with two versions of the postal questionnaire, there was insufficient space to include some of the online questions. Postal questionnaires are also more prone than online questionnaires to participant error (e.g. errors in routing, compliance with answering instructions, etc.).
It is therefore advantageous to persuade participants to use the online questionnaire rather than the postal one. This seems a realistic aspiration: it is likely that many who respond by mail questionnaire do so because it is less burdensome (not requiring URL and password entry, etc.), and might be persuaded to respond online. For this reason, an experiment was designed to investigate the extent to which potential participants can be persuaded to change response mode by offering them additional incentives.
Two recent pieces of UK methodological work suggest that an effective way of achieving this is to use the initial invitation letter to offer an additional incentive for completing the online questionnaire before they are mailed the postal questionnaire. In the three-mode Next Steps age 25 survey, an experimental group was offered a £20 incentive for online completion in the first 3 weeks of fieldwork and £10 if they responded later than that.21 The remainder of the sample were offered a £10 conditional incentive throughout and served as a control group. The early completion incentive increased the short-term response rates but not the final ones. However, by the end of fieldwork the online questionnaire response rate remained significantly higher for those who had been offered the early completion incentive. Similarly, in non-experimental methodological work in the Understanding Society longitudinal survey, a £10 bonus conditional on completing an online questionnaire within two weeks appeared to raise the whole household online completion response rate from 19% to 26%.22
21 Peycheva, D., Calderwood, L., and Wong, E.R. (2019). Effects of a time-limited incentive in a mixed- mode longitudinal study of young adults. Unpublished manuscript. 22 Details for the non- experimental research in the Understanding Society longitudinal survey can be found in their report on Adaptive push-to-web: experiments in a household panel study.
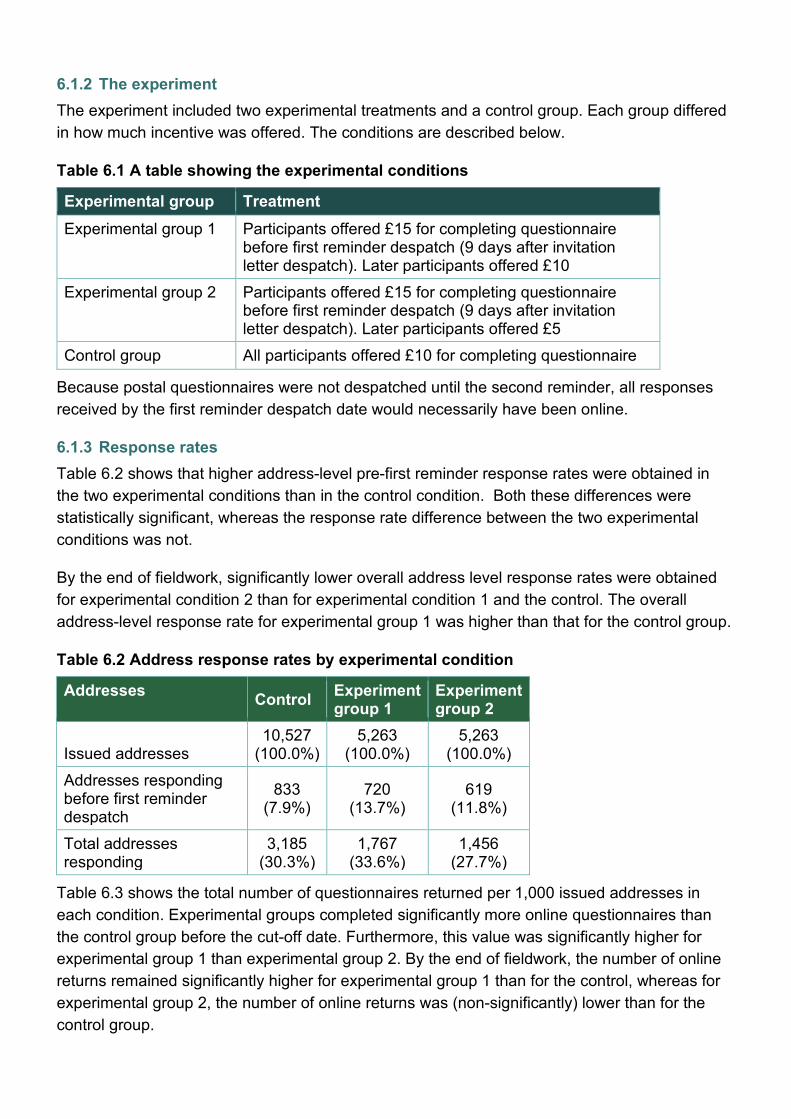
6.1.2 The experiment The experiment included two experimental treatments and a control group. Each group differed in how much incentive was offered. The conditions are described below.
Table 6.1 A table showing the experimental conditions
Experimental group Treatment Experimental group 1 Participants offered £15 for completing questionnaire
before first reminder despatch (9 days after invitation letter despatch). Later participants offered £10
Experimental group 2 Participants offered £15 for completing questionnaire before first reminder despatch (9 days after invitation letter despatch). Later participants offered £5
Control group All participants offered £10 for completing questionnaire
Because postal questionnaires were not despatched until the second reminder, all responses received by the first reminder despatch date would necessarily have been online.
6.1.3 Response rates Table 6.2 shows that higher address-level pre-first reminder response rates were obtained in the two experimental conditions than in the control condition. Both these differences were statistically significant, whereas the response rate difference between the two experimental conditions was not.
By the end of fieldwork, significantly lower overall address level response rates were obtained for experimental condition 2 than for experimental condition 1 and the control. The overall address-level response rate for experimental group 1 was higher than that for the control group.
Table 6.2 Address response rates by experimental condition
Addresses Control Experiment group 1
Experiment group 2
Issued addresses 10,527
(100.0%) 5,263
(100.0%) 5,263
(100.0%) Addresses responding before first reminder despatch
833 (7.9%)
720 (13.7%)
619 (11.8%)
Total addresses responding
3,185 (30.3%)
1,767 (33.6%)
1,456 (27.7%)
Table 6.3 shows the total number of questionnaires returned per 1,000 issued addresses in each condition. Experimental groups completed significantly more online questionnaires than the control group before the cut-off date. Furthermore, this value was significantly higher for experimental group 1 than experimental group 2. By the end of fieldwork, the number of online returns remained significantly higher for experimental group 1 than for the control, whereas for experimental group 2, the number of online returns was (non-significantly) lower than for the control group.
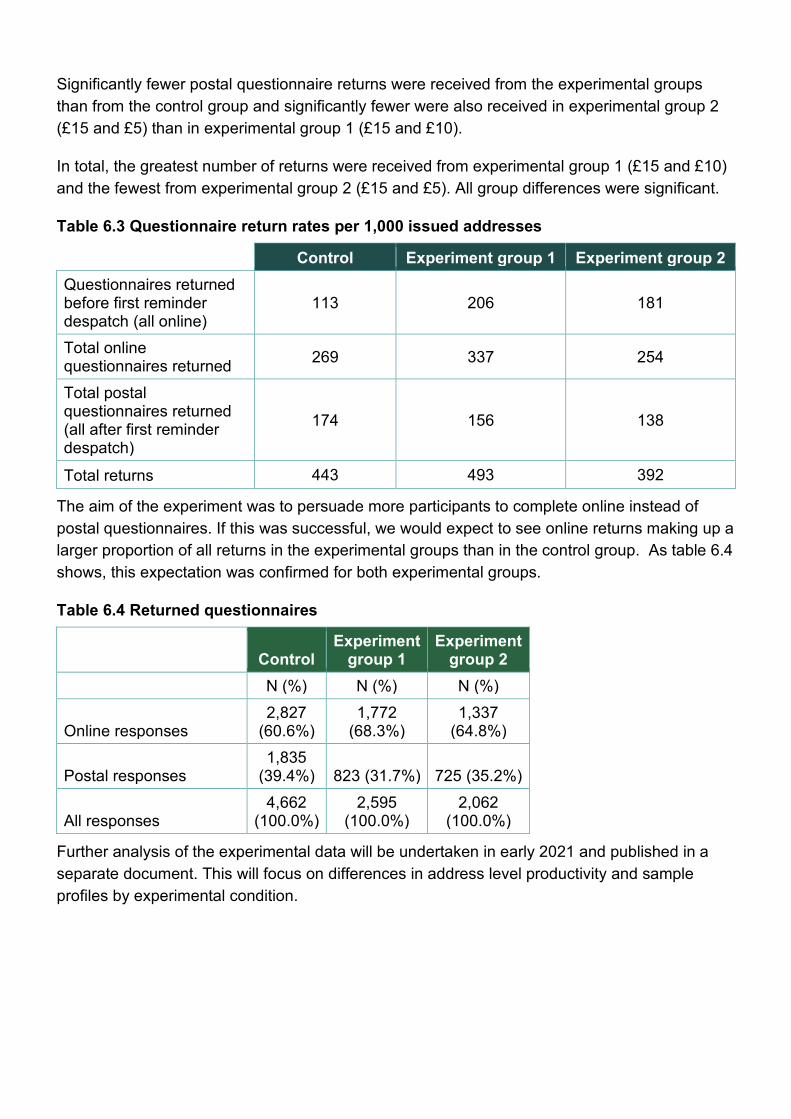
Significantly fewer postal questionnaire returns were received from the experimental groups than from the control group and significantly fewer were also received in experimental group 2 (£15 and £5) than in experimental group 1 (£15 and £10).
In total, the greatest number of returns were received from experimental group 1 (£15 and £10) and the fewest from experimental group 2 (£15 and £5). All group differences were significant.
Table 6.3 Questionnaire return rates per 1,000 issued addresses
Control Experiment group 1 Experiment group 2 Questionnaires returned before first reminder despatch (all online)
113 206 181
Total online questionnaires returned 269 337 254
Total postal questionnaires returned (all after first reminder despatch)
174 156 138
Total returns 443 493 392
The aim of the experiment was to persuade more participants to complete online instead of postal questionnaires. If this was successful, we would expect to see online returns making up a larger proportion of all returns in the experimental groups than in the control group. As table 6.4 shows, this expectation was confirmed for both experimental groups.
Table 6.4 Returned questionnaires
Control
Experiment group 1
Experiment group 2
N (%) N (%) N (%)
Online responses 2,827
(60.6%) 1,772
(68.3%) 1,337
(64.8%)
Postal responses 1,835
(39.4%) 823 (31.7%) 725 (35.2%)
All responses 4,662
(100.0%) 2,595
(100.0%) 2,062
(100.0%)
Further analysis of the experimental data will be undertaken in early 2021 and published in a separate document. This will focus on differences in address level productivity and sample profiles by experimental condition.
07 Data Validation and management
7 Data validation and management 7.1 Overview
7.1.1 Questionnaire versions As described in earlier sections, the data have been collected from two sources: an online questionnaire and a postal questionnaire. The online questionnaire includes some built-in routing and checks within it, whereas the postal questionnaire relied on correct navigation by participants and there is no constraint on the answers they can give.
In addition, the online data were available immediately in their raw form, however the postal questionnaire data must be scanned and keyed as part of a separate process. Tick box answers were captured by scanning, and numbers and other verbatim answers were captured by keying, with the data then coded in an ascii text string.
In line with standard procedures on a mixed mode survey such as this, the online questionnaire was taken as the basis for data processing. Once that was processed then a data map/dictionary was used to match the data from both postal questionnaire versions with the online data.
A wide range of edits were carried out on the data followed by numerous checks. These have been detailed throughout this chapter.
7.2 Data editing
7.2.1 Postal data – forced edits The postal data was subject to errors introduced by participants and subsequently edits were required for this data. There are five key principles to editing postal data which were drawn upon for this:
1. Back editing a filtered question if the filter is a single coded possibility. This meant that
if a filtered question was answered but the filter origin question contradicted that
answer (blank or different), then the origin question was changed to be the answer for
the filter question.
2. There were no back edits if the filter had more than one possibility (for example,
questions relating to how much participants knew about the FSA), in which case a
forward edit was applied (deleted answers from filtered questions).
3. There were no back edits if the only answer was a ‘negative’ response (‘none’, DK).
Forward edits applied to these questions.
4. If a positive answer was given alongside a negative one (a reason + None/DK) – then
the negative answers were removed.
5. If a question was incorrectly answered as a multi-code question when only one
answer should have been selected, then a digit from the participant ID was used to
randomly select an answer.
7.2.2 Edits to numeric answers Edits were made on a handful of questions where the answer was deemed to be improbable or unlikely. These are detailed below:
Age: There were twelve participants who selected an age of over 100. Nine of these participants selected an answer of over 120, it was deemed highly unlikely that the answer was correct and therefore the values for these participants were set to missing in the data. The three participants who stated their age was between 100-120 were not set to missing. Checks were added to the online script in Wave 2 to ensure participants could not enter an age of less than 16 or higher than 120.
Number of adults and number of children in the household: A number of participants stated that they had a large number of adults and children in their household. While theoretically there is no limit on the number of adults and children in a survey, a cap of 15 adults and 15 children was placed on participants. If the number of adults was greater than 15 then it was blanked “not stated”. This only affected five participants, who all stated they had more than 15 adults in their household.
7.2.3 Duplicate responses Some cases were removed from the data if the participant completed both the online and the postal survey. In these instances, the online questionnaires were prioritised as that represents a more complete set of data23.
7.2.4 Questions not included in the data tables Due to a routing error in the online questionnaire not all respondents who should have answered FOODBANK and the follow up FBANKFREQ did so (please see the online questionnaire document in the appendices for details). Therefore it was decided to exclude these questions from the data tables and SPSS data set. These questions were repeated in Food and You 2 Wave 2 and will be reported then.
7.3 Coding Coding was carried out on four open ended questions (DEFRA1, DEFRA6, DEFRA7 and FOODISSA2). Coding is the process of analysing the content of each response based on a system where unique summary ‘codes’ are applied to specific words or phrases contained in the text of the response. The application of these summary codes and sub-codes to the content of the responses allows systematic analysis of the data.
23 47 duplicates were removed from the data
Ipsos MORI were responsible for coding the FOODISSA2 and Defra conducted the coding on their questions. Details of how each organisation coded these questions have been outlined below.
7.3.1 Translation of verbatims in Welsh Participants were able to complete the survey in English and in Welsh. A number of participants chose to complete the survey in Welsh and provided verbatim text. These verbatims were translated by the FSA’s Welsh Language Unit before being coded, alongside the responses, by Defra and Ipsos MORI.
7.3.2 Ipsos MORI Coding Ipsos MORI used the codeframe from Wave 17 of the Public Attitudes Tracker, for Q.1a. (What food issues, if any, are you concerned about?), as a basis for the codeframe for the FOODISSA2 open-ended question (What are your concerns about the food you eat?). This coding framework was then updated throughout the analysis process to ensure that any newly emerging themes were captured. Developing the coding framework in this way ensured that it would provide an accurate representation of what participants said.
After the initial codeframe was developed it was then reviewed by the FSA and Ipsos MORI research teams with queries subsequently addressed by the coding team. The codes were then grouped into broader themes such as ‘concerns about food quality’ and ‘concerns about Covid-19’ after the codeframe was finalised. After this it was then appended to the datasets.
Ipsos MORI used a web-based system called Ascribe to manage the coding of all the text in the responses. Ascribe is a system which has been used on numerous large-scale consultation projects. Responses were uploaded into the Ascribe system, where members of the Ipsos MORI coding team then worked systematically through the comments and applied a code to each relevant piece of text.
The Ascribe system allowed for detailed monitoring of coding progress, and the organic development of the coding framework (i.e. the addition of new codes to new comments). A team of coders worked to review all the responses after they were uploaded on Ascribe, with checks carried out on 5% of responses.
7.3.3 Defra Coding Defra included three questions with an open text response option (questions DEFRA1, DEFRA6, and DEFRA7 of the Defra funded questions). These questions had open text boxes where up to three pieces of information or answers were requested per response. Defra used a qualitative coding approach to categorise the answers submitted in these responses. The steps in this approach are detailed below:
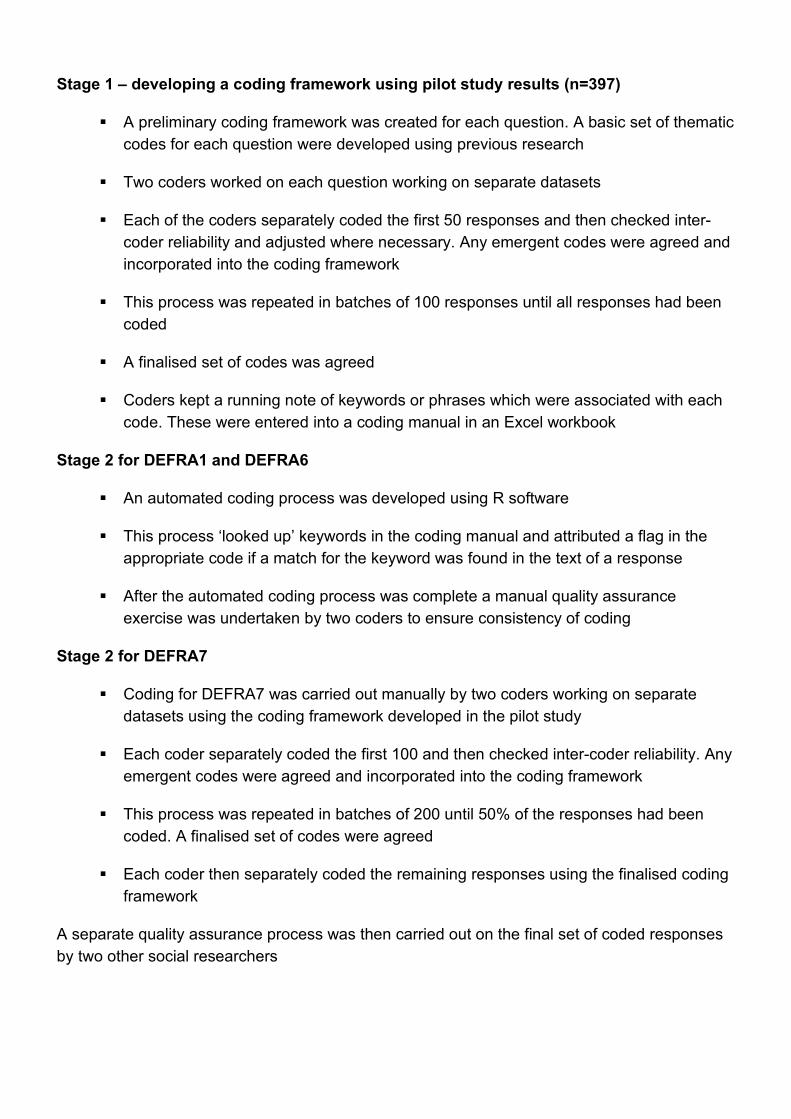
Stage 1 – developing a coding framework using pilot study results (n=397)
A preliminary coding framework was created for each question. A basic set of thematic codes for each question were developed using previous research
Two coders worked on each question working on separate datasets
Each of the coders separately coded the first 50 responses and then checked inter-coder reliability and adjusted where necessary. Any emergent codes were agreed and incorporated into the coding framework
This process was repeated in batches of 100 responses until all responses had been coded
A finalised set of codes was agreed
Coders kept a running note of keywords or phrases which were associated with each code. These were entered into a coding manual in an Excel workbook
Stage 2 for DEFRA1 and DEFRA6
An automated coding process was developed using R software
This process ‘looked up’ keywords in the coding manual and attributed a flag in the appropriate code if a match for the keyword was found in the text of a response
After the automated coding process was complete a manual quality assurance exercise was undertaken by two coders to ensure consistency of coding
Stage 2 for DEFRA7
Coding for DEFRA7 was carried out manually by two coders working on separate datasets using the coding framework developed in the pilot study
Each coder separately coded the first 100 and then checked inter-coder reliability. Any emergent codes were agreed and incorporated into the coding framework
This process was repeated in batches of 200 until 50% of the responses had been coded. A finalised set of codes were agreed
Each coder then separately coded the remaining responses using the finalised coding framework
A separate quality assurance process was then carried out on the final set of coded responses by two other social researchers
7.4 Data checks
7.4.1 Checks on data tables Ipsos MORI checked the data tables against the table specification, ensuring all questions were included, that down-breaks included all categories from the question, that base sizes were correct (e.g. for filtered questions), base text was right, cross-breaks add up and were using the right categories, nets were summed using the correct codes, and that summary and recoded tables were included. Weighting of the tables was also checked by applying the correct weight on the SPSS file then running descriptives and cross-break tabulations to check that this matched up with the values on the tables.
If any errors were spotted in the data, these were then specified to the data processing team in a change request form. The data processing team then amended the tables based on this and the tables were rechecked after the changes were made. Checking it is an iterative process and if errors were spotted on the SPSS file or data tables then both the SPSS file and data tables were re-run. The data checks were carried out by a team of six people at Ipsos MORI, with any given change checked by at least three different people.
7.4.2 Checks on SPSS files On the SPSS dataset we ran basic descriptives on all variables to check the variable names, labels and value labels and overall cell counts. We also aimed to check around 50% of routed questions using crosstabs where the logic checks are more complicated. The aim of these checks was to pick up errors in the data processing. For instance, where the data specification was mis-interpreted, the incorrect logic was applied or where the data was simply processed incorrectly.
7.4.3 Checks on derived variables Derived variables were created based on the table specification. Some derived variables were based on one question (for instance age) and these were checked by running tabulations on SPSS from the question they were derived, to check that the codes fed into the groups on the cross-breaks. If the derived variables were more complex and based on more than one question, e.g. NS-SEC, more thorough checks were carried out. For example, the NS-SEC variable was created independently – the questions are in line with other surveys, so an independent check was carried out to ensure that the syntax was correctly created. The checker also ran the syntax themselves to check that they could replicate the results in the data.
7.4.4 Checks on straight-lining The data for the quickest participants in Wave 1, who completed the survey in approximately five minutes, were checked to see if they were straight-lining through the survey. All of these participants did answer at least some questions in a positive way rather than selecting ‘negative answers’ and all did provide some demographic data, so we did not feel the need to exclude these participants.

Appendices
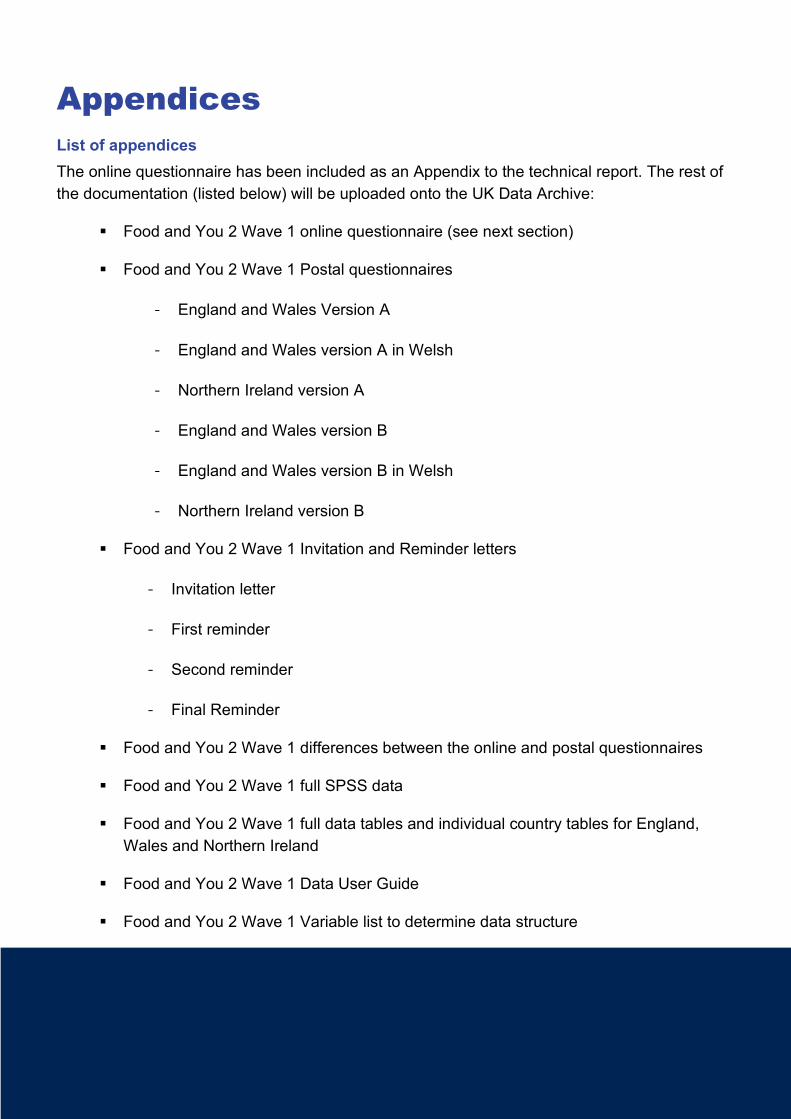
Appendices List of appendices The online questionnaire has been included as an Appendix to the technical report. The rest of the documentation (listed below) will be uploaded onto the UK Data Archive:
Food and You 2 Wave 1 online questionnaire (see next section)
Food and You 2 Wave 1 Postal questionnaires
- England and Wales Version A
- England and Wales version A in Welsh
- Northern Ireland version A
- England and Wales version B
- England and Wales version B in Welsh
- Northern Ireland version B
Food and You 2 Wave 1 Invitation and Reminder letters
- Invitation letter
- First reminder
- Second reminder
- Final Reminder
Food and You 2 Wave 1 differences between the online and postal questionnaires
Food and You 2 Wave 1 full SPSS data
Food and You 2 Wave 1 full data tables and individual country tables for England, Wales and Northern Ireland
Food and You 2 Wave 1 Data User Guide
Food and You 2 Wave 1 Variable list to determine data structure

Food and You 2 Wave 1 online questionnaire
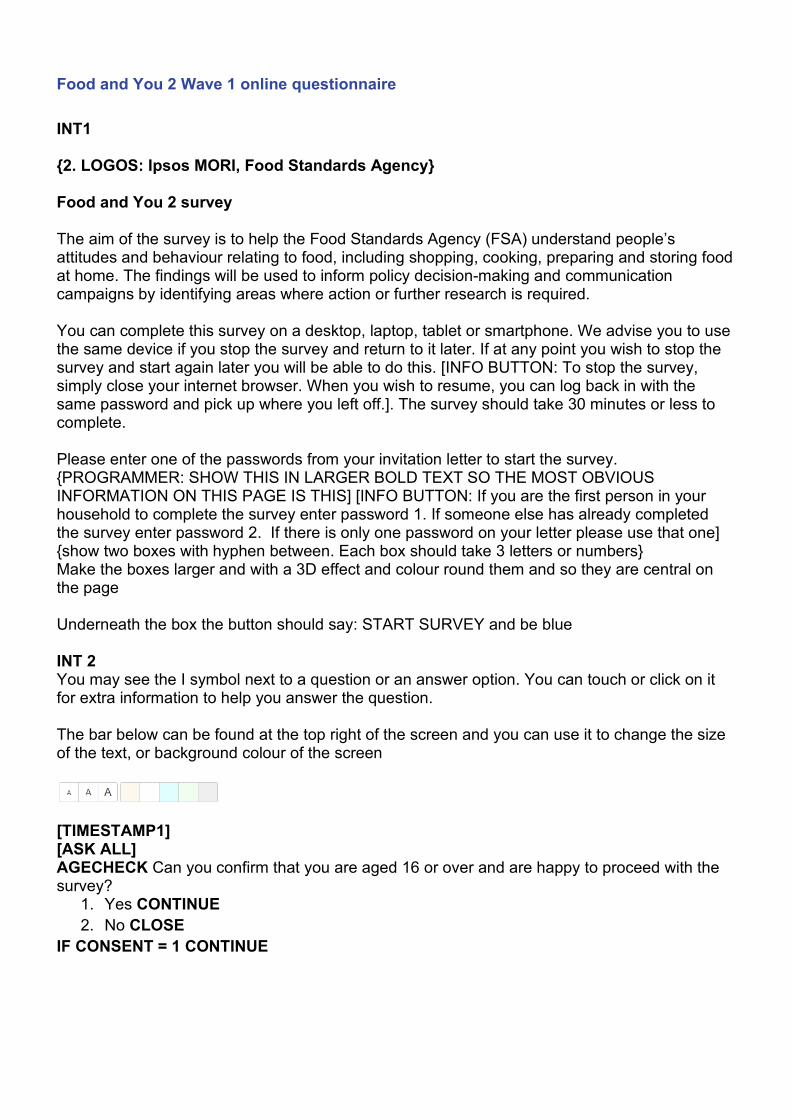
Food and You 2 Wave 1 online questionnaire INT1 {2. LOGOS: Ipsos MORI, Food Standards Agency} Food and You 2 survey The aim of the survey is to help the Food Standards Agency (FSA) understand people’s attitudes and behaviour relating to food, including shopping, cooking, preparing and storing food at home. The findings will be used to inform policy decision-making and communication campaigns by identifying areas where action or further research is required. You can complete this survey on a desktop, laptop, tablet or smartphone. We advise you to use the same device if you stop the survey and return to it later. If at any point you wish to stop the survey and start again later you will be able to do this. [INFO BUTTON: To stop the survey, simply close your internet browser. When you wish to resume, you can log back in with the same password and pick up where you left off.]. The survey should take 30 minutes or less to complete. Please enter one of the passwords from your invitation letter to start the survey. {PROGRAMMER: SHOW THIS IN LARGER BOLD TEXT SO THE MOST OBVIOUS INFORMATION ON THIS PAGE IS THIS] [INFO BUTTON: If you are the first person in your household to complete the survey enter password 1. If someone else has already completed the survey enter password 2. If there is only one password on your letter please use that one] {show two boxes with hyphen between. Each box should take 3 letters or numbers} Make the boxes larger and with a 3D effect and colour round them and so they are central on the page Underneath the box the button should say: START SURVEY and be blue INT 2 You may see the I symbol next to a question or an answer option. You can touch or click on it for extra information to help you answer the question. The bar below can be found at the top right of the screen and you can use it to change the size of the text, or background colour of the screen
[TIMESTAMP1] [ASK ALL] AGECHECK Can you confirm that you are aged 16 or over and are happy to proceed with the survey?
1. Yes CONTINUE 2. No CLOSE
IF CONSENT = 1 CONTINUE
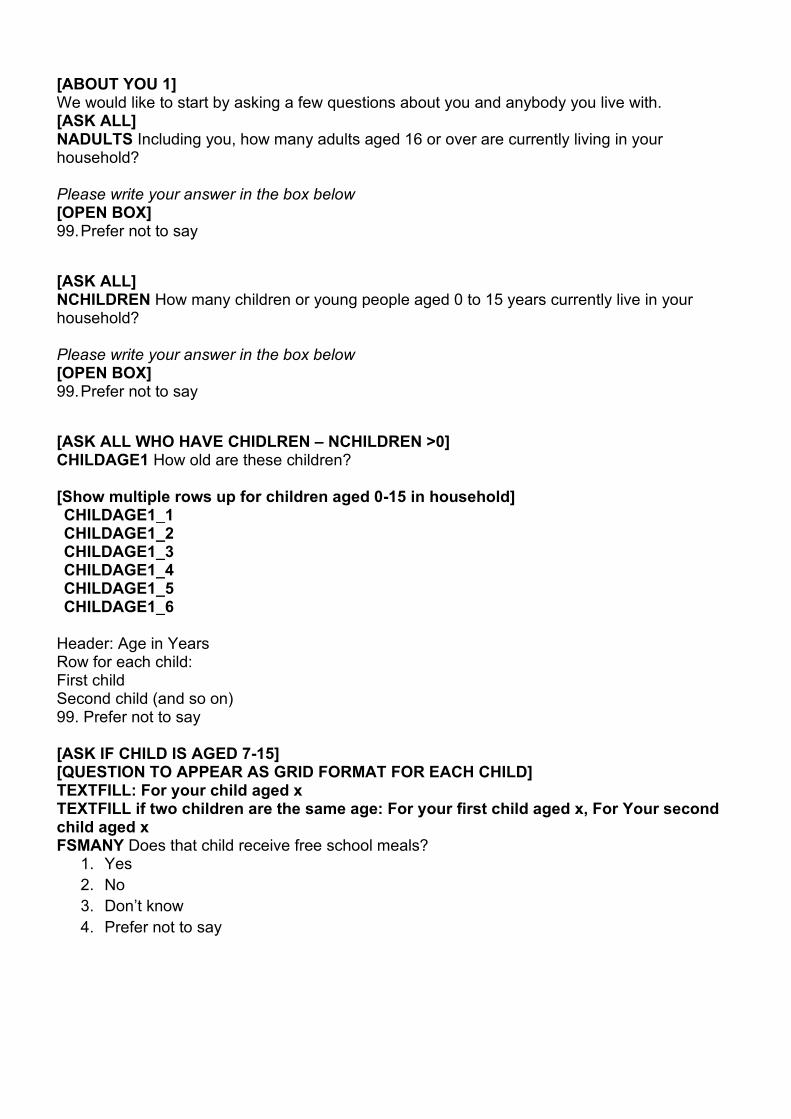
[ABOUT YOU 1] We would like to start by asking a few questions about you and anybody you live with. [ASK ALL] NADULTS Including you, how many adults aged 16 or over are currently living in your household? Please write your answer in the box below [OPEN BOX] 99. Prefer not to say
[ASK ALL] NCHILDREN How many children or young people aged 0 to 15 years currently live in your household? Please write your answer in the box below [OPEN BOX] 99. Prefer not to say
[ASK ALL WHO HAVE CHIDLREN – NCHILDREN >0] CHILDAGE1 How old are these children? [Show multiple rows up for children aged 0-15 in household] CHILDAGE1_1 CHILDAGE1_2 CHILDAGE1_3 CHILDAGE1_4 CHILDAGE1_5 CHILDAGE1_6
Header: Age in Years Row for each child: First child Second child (and so on) 99. Prefer not to say [ASK IF CHILD IS AGED 7-15] [QUESTION TO APPEAR AS GRID FORMAT FOR EACH CHILD] TEXTFILL: For your child aged x TEXTFILL if two children are the same age: For your first child aged x, For Your second child aged x FSMANY Does that child receive free school meals?
1. Yes 2. No 3. Don’t know 4. Prefer not to say
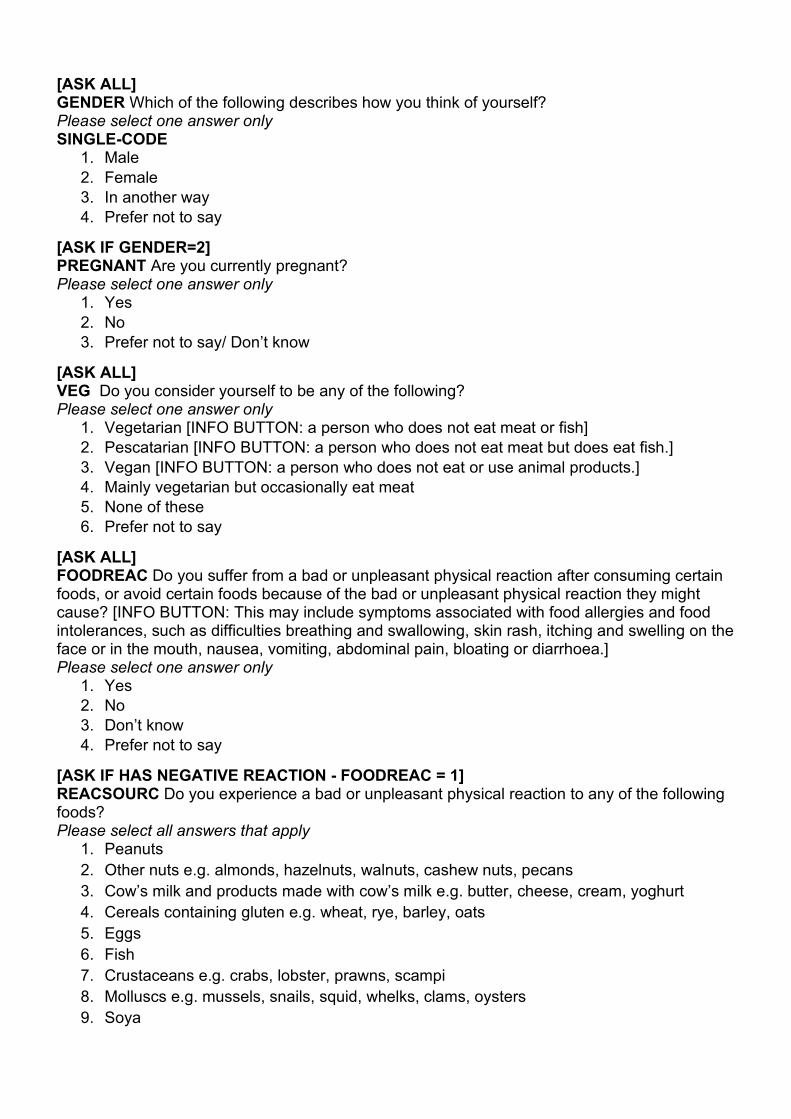
[ASK ALL] GENDER Which of the following describes how you think of yourself? Please select one answer only SINGLE-CODE
1. Male 2. Female 3. In another way 4. Prefer not to say
[ASK IF GENDER=2] PREGNANT Are you currently pregnant? Please select one answer only
1. Yes 2. No 3. Prefer not to say/ Don’t know
[ASK ALL] VEG Do you consider yourself to be any of the following? Please select one answer only
1. Vegetarian [INFO BUTTON: a person who does not eat meat or fish] 2. Pescatarian [INFO BUTTON: a person who does not eat meat but does eat fish.] 3. Vegan [INFO BUTTON: a person who does not eat or use animal products.] 4. Mainly vegetarian but occasionally eat meat 5. None of these 6. Prefer not to say
[ASK ALL] FOODREAC Do you suffer from a bad or unpleasant physical reaction after consuming certain foods, or avoid certain foods because of the bad or unpleasant physical reaction they might cause? [INFO BUTTON: This may include symptoms associated with food allergies and food intolerances, such as difficulties breathing and swallowing, skin rash, itching and swelling on the face or in the mouth, nausea, vomiting, abdominal pain, bloating or diarrhoea.] Please select one answer only
1. Yes 2. No 3. Don’t know 4. Prefer not to say
[ASK IF HAS NEGATIVE REACTION - FOODREAC = 1] REACSOURC Do you experience a bad or unpleasant physical reaction to any of the following foods? Please select all answers that apply
1. Peanuts 2. Other nuts e.g. almonds, hazelnuts, walnuts, cashew nuts, pecans 3. Cow’s milk and products made with cow’s milk e.g. butter, cheese, cream, yoghurt 4. Cereals containing gluten e.g. wheat, rye, barley, oats 5. Eggs 6. Fish 7. Crustaceans e.g. crabs, lobster, prawns, scampi 8. Molluscs e.g. mussels, snails, squid, whelks, clams, oysters 9. Soya
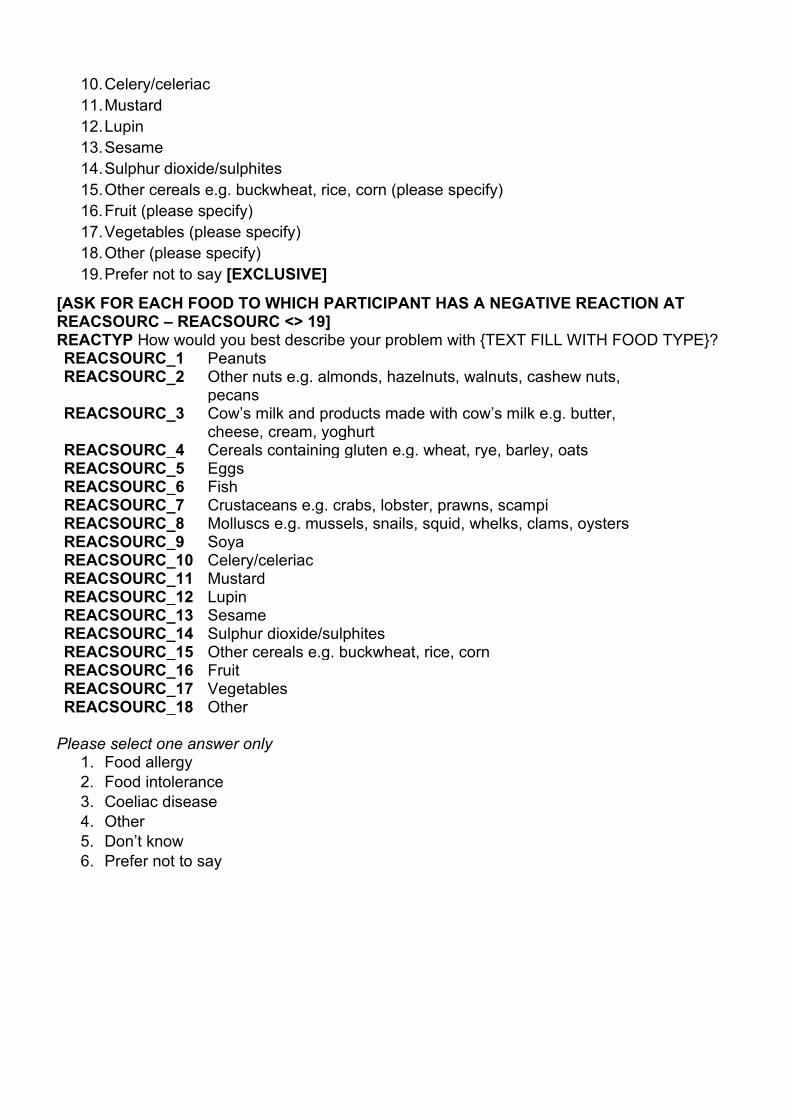
10. Celery/celeriac 11. Mustard 12. Lupin 13. Sesame 14. Sulphur dioxide/sulphites 15. Other cereals e.g. buckwheat, rice, corn (please specify) 16. Fruit (please specify) 17. Vegetables (please specify) 18. Other (please specify) 19. Prefer not to say [EXCLUSIVE]
[ASK FOR EACH FOOD TO WHICH PARTICIPANT HAS A NEGATIVE REACTION AT REACSOURC – REACSOURC <> 19] REACTYP How would you best describe your problem with {TEXT FILL WITH FOOD TYPE}? REACSOURC_1 Peanuts REACSOURC_2 Other nuts e.g. almonds, hazelnuts, walnuts, cashew nuts,
pecans REACSOURC_3 Cow’s milk and products made with cow’s milk e.g. butter,
cheese, cream, yoghurt REACSOURC_4 Cereals containing gluten e.g. wheat, rye, barley, oats REACSOURC_5 Eggs REACSOURC_6 Fish REACSOURC_7 Crustaceans e.g. crabs, lobster, prawns, scampi REACSOURC_8 Molluscs e.g. mussels, snails, squid, whelks, clams, oysters REACSOURC_9 Soya REACSOURC_10 Celery/celeriac REACSOURC_11 Mustard REACSOURC_12 Lupin REACSOURC_13 Sesame REACSOURC_14 Sulphur dioxide/sulphites REACSOURC_15 Other cereals e.g. buckwheat, rice, corn REACSOURC_16 Fruit REACSOURC_17 Vegetables REACSOURC_18 Other
Please select one answer only
1. Food allergy 2. Food intolerance 3. Coeliac disease 4. Other 5. Don’t know 6. Prefer not to say
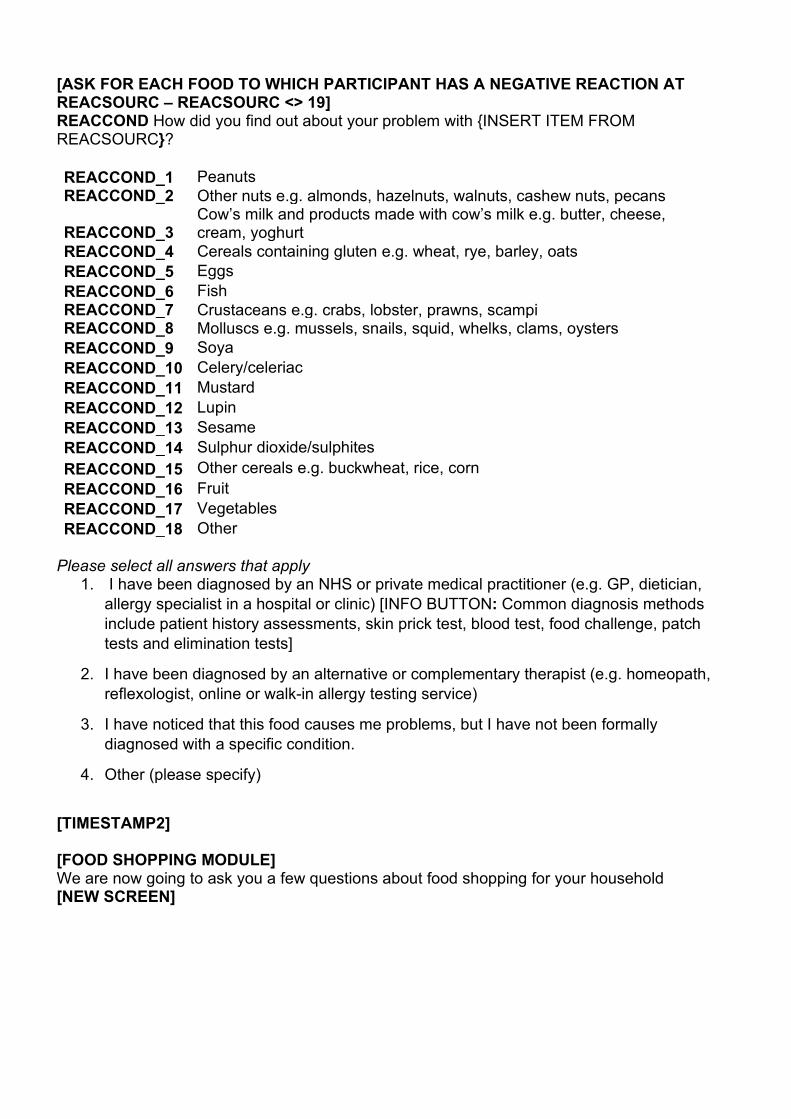
[ASK FOR EACH FOOD TO WHICH PARTICIPANT HAS A NEGATIVE REACTION AT REACSOURC – REACSOURC <> 19] REACCOND How did you find out about your problem with {INSERT ITEM FROM REACSOURC}? REACCOND_1 Peanuts REACCOND_2 Other nuts e.g. almonds, hazelnuts, walnuts, cashew nuts, pecans
REACCOND_3 Cow’s milk and products made with cow’s milk e.g. butter, cheese, cream, yoghurt
REACCOND_4 Cereals containing gluten e.g. wheat, rye, barley, oats REACCOND_5 Eggs REACCOND_6 Fish REACCOND_7 Crustaceans e.g. crabs, lobster, prawns, scampi REACCOND_8 Molluscs e.g. mussels, snails, squid, whelks, clams, oysters REACCOND_9 Soya REACCOND_10 Celery/celeriac REACCOND_11 Mustard REACCOND_12 Lupin REACCOND_13 Sesame REACCOND_14 Sulphur dioxide/sulphites REACCOND_15 Other cereals e.g. buckwheat, rice, corn REACCOND_16 Fruit REACCOND_17 Vegetables REACCOND_18 Other
Please select all answers that apply
1. I have been diagnosed by an NHS or private medical practitioner (e.g. GP, dietician, allergy specialist in a hospital or clinic) [INFO BUTTON: Common diagnosis methods include patient history assessments, skin prick test, blood test, food challenge, patch tests and elimination tests]
2. I have been diagnosed by an alternative or complementary therapist (e.g. homeopath, reflexologist, online or walk-in allergy testing service)
3. I have noticed that this food causes me problems, but I have not been formally diagnosed with a specific condition.
4. Other (please specify)
[TIMESTAMP2] [FOOD SHOPPING MODULE] We are now going to ask you a few questions about food shopping for your household [NEW SCREEN]
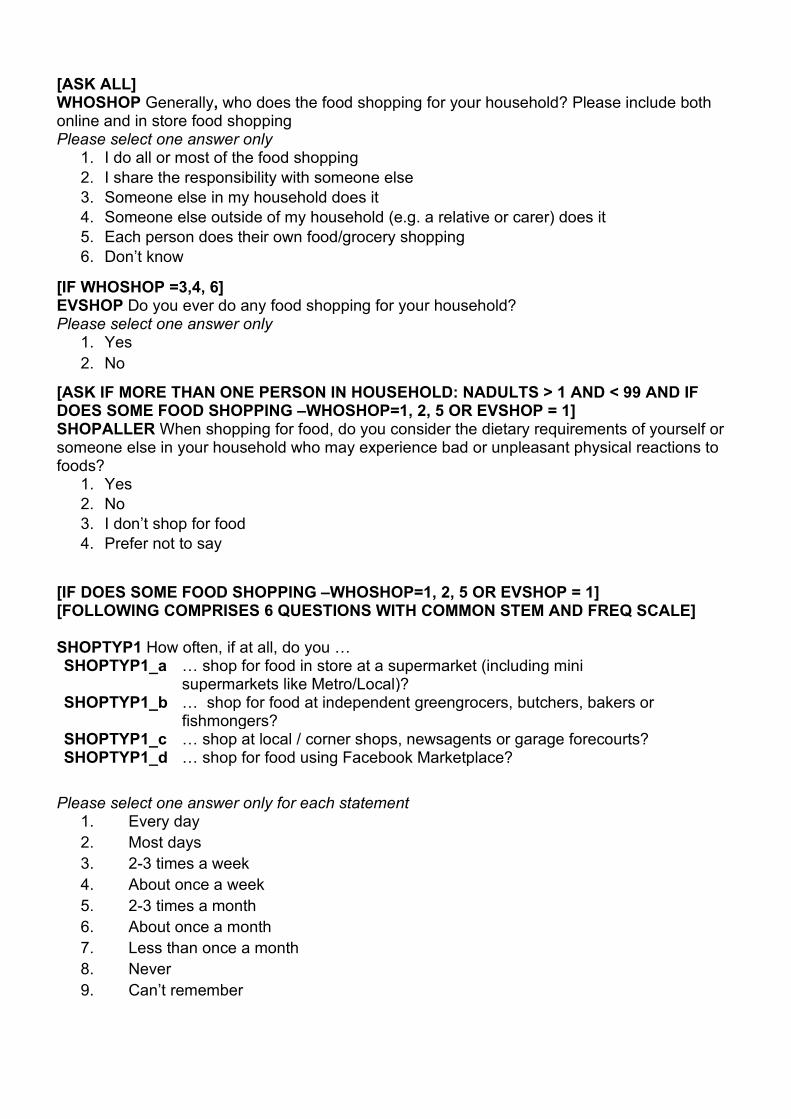
[ASK ALL] WHOSHOP Generally, who does the food shopping for your household? Please include both online and in store food shopping Please select one answer only
1. I do all or most of the food shopping 2. I share the responsibility with someone else 3. Someone else in my household does it 4. Someone else outside of my household (e.g. a relative or carer) does it 5. Each person does their own food/grocery shopping 6. Don’t know
[IF WHOSHOP =3,4, 6] EVSHOP Do you ever do any food shopping for your household? Please select one answer only
1. Yes 2. No
[ASK IF MORE THAN ONE PERSON IN HOUSEHOLD: NADULTS > 1 AND < 99 AND IF DOES SOME FOOD SHOPPING –WHOSHOP=1, 2, 5 OR EVSHOP = 1] SHOPALLER When shopping for food, do you consider the dietary requirements of yourself or someone else in your household who may experience bad or unpleasant physical reactions to foods?
1. Yes 2. No 3. I don’t shop for food 4. Prefer not to say
[IF DOES SOME FOOD SHOPPING –WHOSHOP=1, 2, 5 OR EVSHOP = 1] [FOLLOWING COMPRISES 6 QUESTIONS WITH COMMON STEM AND FREQ SCALE] SHOPTYP1 How often, if at all, do you … SHOPTYP1_a … shop for food in store at a supermarket (including mini
supermarkets like Metro/Local)? SHOPTYP1_b … shop for food at independent greengrocers, butchers, bakers or
fishmongers? SHOPTYP1_c … shop at local / corner shops, newsagents or garage forecourts? SHOPTYP1_d … shop for food using Facebook Marketplace?
Please select one answer only for each statement
1. Every day 2. Most days 3. 2-3 times a week 4. About once a week 5. 2-3 times a month 6. About once a month 7. Less than once a month 8. Never 9. Can’t remember
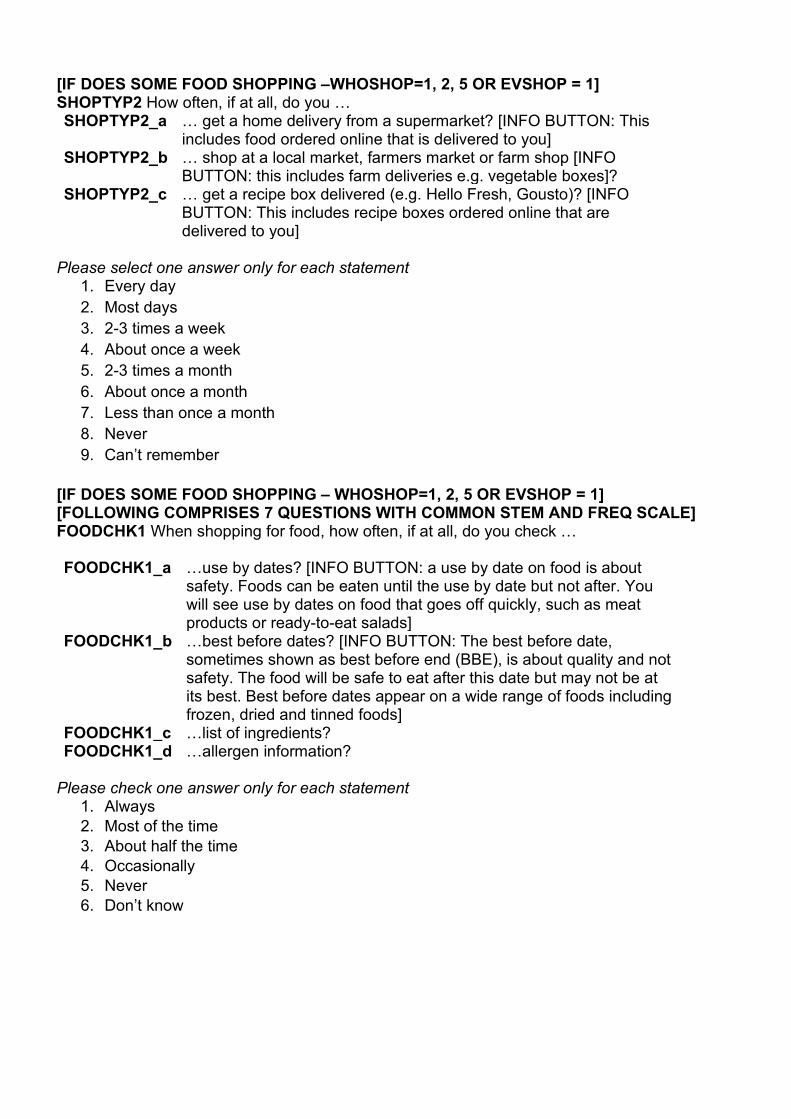
[IF DOES SOME FOOD SHOPPING –WHOSHOP=1, 2, 5 OR EVSHOP = 1] SHOPTYP2 How often, if at all, do you … SHOPTYP2_a … get a home delivery from a supermarket? [INFO BUTTON: This
includes food ordered online that is delivered to you] SHOPTYP2_b … shop at a local market, farmers market or farm shop [INFO
BUTTON: this includes farm deliveries e.g. vegetable boxes]? SHOPTYP2_c … get a recipe box delivered (e.g. Hello Fresh, Gousto)? [INFO
BUTTON: This includes recipe boxes ordered online that are delivered to you]
Please select one answer only for each statement
1. Every day 2. Most days 3. 2-3 times a week 4. About once a week 5. 2-3 times a month 6. About once a month 7. Less than once a month 8. Never 9. Can’t remember
[IF DOES SOME FOOD SHOPPING – WHOSHOP=1, 2, 5 OR EVSHOP = 1] [FOLLOWING COMPRISES 7 QUESTIONS WITH COMMON STEM AND FREQ SCALE] FOODCHK1 When shopping for food, how often, if at all, do you check … FOODCHK1_a
…use by dates? [INFO BUTTON: a use by date on food is about safety. Foods can be eaten until the use by date but not after. You will see use by dates on food that goes off quickly, such as meat products or ready-to-eat salads]
FOODCHK1_b
…best before dates? [INFO BUTTON: The best before date, sometimes shown as best before end (BBE), is about quality and not safety. The food will be safe to eat after this date but may not be at its best. Best before dates appear on a wide range of foods including frozen, dried and tinned foods]
FOODCHK1_c …list of ingredients? FOODCHK1_d …allergen information?
Please check one answer only for each statement
1. Always 2. Most of the time 3. About half the time 4. Occasionally 5. Never 6. Don’t know
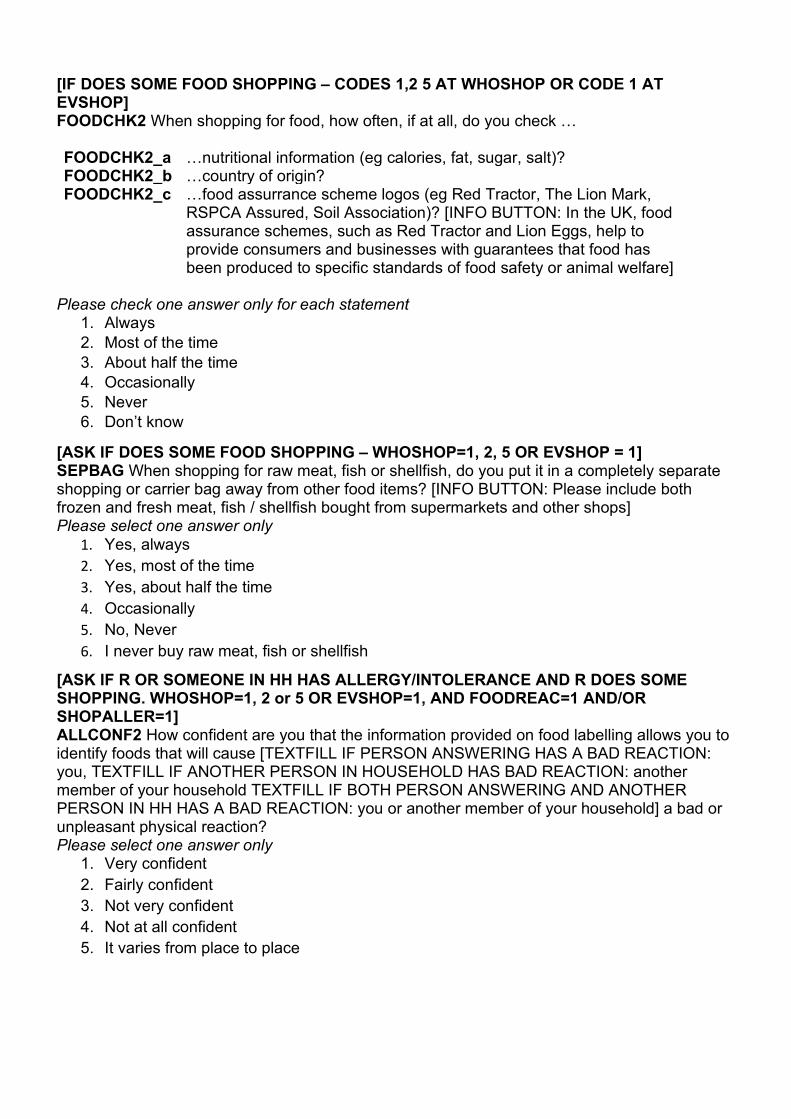
[IF DOES SOME FOOD SHOPPING – CODES 1,2 5 AT WHOSHOP OR CODE 1 AT EVSHOP] FOODCHK2 When shopping for food, how often, if at all, do you check … FOODCHK2_a …nutritional information (eg calories, fat, sugar, salt)? FOODCHK2_b …country of origin? FOODCHK2_c …food assurrance scheme logos (eg Red Tractor, The Lion Mark,
RSPCA Assured, Soil Association)? [INFO BUTTON: In the UK, food assurance schemes, such as Red Tractor and Lion Eggs, help to provide consumers and businesses with guarantees that food has been produced to specific standards of food safety or animal welfare]
Please check one answer only for each statement 1. Always 2. Most of the time 3. About half the time 4. Occasionally 5. Never 6. Don’t know
[ASK IF DOES SOME FOOD SHOPPING – WHOSHOP=1, 2, 5 OR EVSHOP = 1] SEPBAG When shopping for raw meat, fish or shellfish, do you put it in a completely separate shopping or carrier bag away from other food items? [INFO BUTTON: Please include both frozen and fresh meat, fish / shellfish bought from supermarkets and other shops] Please select one answer only
1. Yes, always 2. Yes, most of the time 3. Yes, about half the time 4. Occasionally 5. No, Never 6. I never buy raw meat, fish or shellfish
[ASK IF R OR SOMEONE IN HH HAS ALLERGY/INTOLERANCE AND R DOES SOME SHOPPING. WHOSHOP=1, 2 or 5 OR EVSHOP=1, AND FOODREAC=1 AND/OR SHOPALLER=1] ALLCONF2 How confident are you that the information provided on food labelling allows you to identify foods that will cause [TEXTFILL IF PERSON ANSWERING HAS A BAD REACTION: you, TEXTFILL IF ANOTHER PERSON IN HOUSEHOLD HAS BAD REACTION: another member of your household TEXTFILL IF BOTH PERSON ANSWERING AND ANOTHER PERSON IN HH HAS A BAD REACTION: you or another member of your household] a bad or unpleasant physical reaction? Please select one answer only
1. Very confident 2. Fairly confident 3. Not very confident 4. Not at all confident 5. It varies from place to place
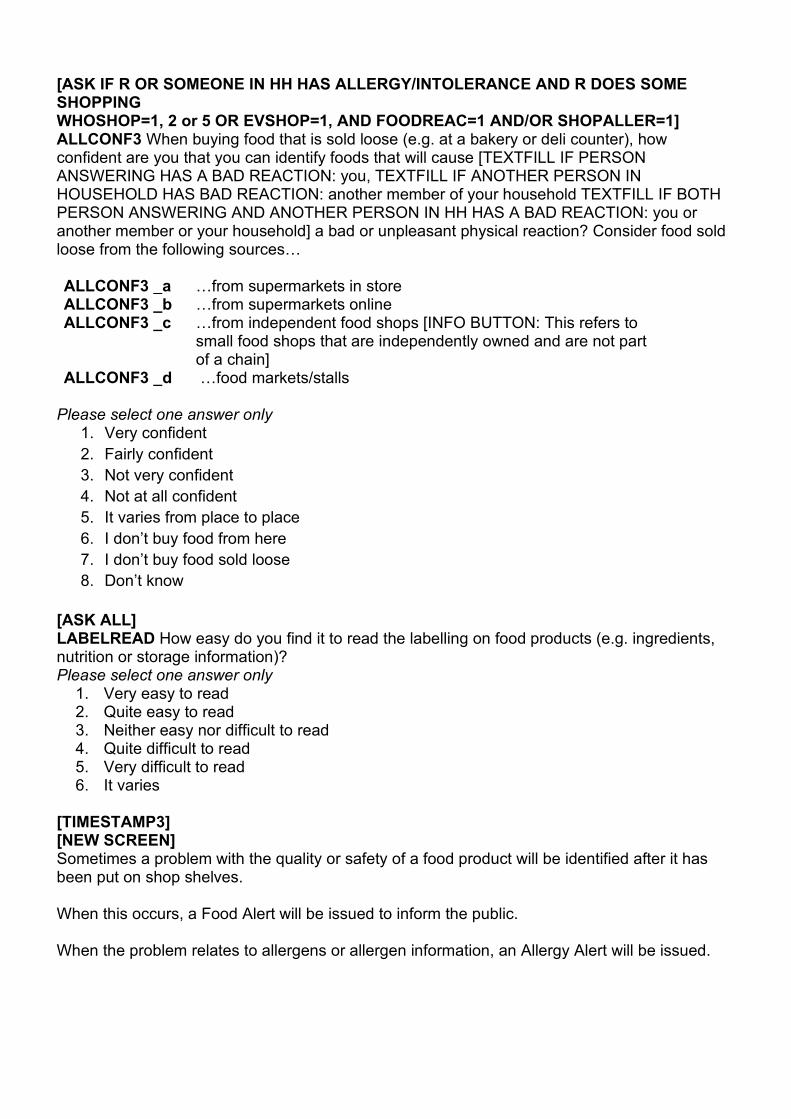
[ASK IF R OR SOMEONE IN HH HAS ALLERGY/INTOLERANCE AND R DOES SOME SHOPPING WHOSHOP=1, 2 or 5 OR EVSHOP=1, AND FOODREAC=1 AND/OR SHOPALLER=1] ALLCONF3 When buying food that is sold loose (e.g. at a bakery or deli counter), how confident are you that you can identify foods that will cause [TEXTFILL IF PERSON ANSWERING HAS A BAD REACTION: you, TEXTFILL IF ANOTHER PERSON IN HOUSEHOLD HAS BAD REACTION: another member of your household TEXTFILL IF BOTH PERSON ANSWERING AND ANOTHER PERSON IN HH HAS A BAD REACTION: you or another member or your household] a bad or unpleasant physical reaction? Consider food sold loose from the following sources… ALLCONF3 _a …from supermarkets in store ALLCONF3 _b …from supermarkets online ALLCONF3 _c …from independent food shops [INFO BUTTON: This refers to
small food shops that are independently owned and are not part of a chain]
ALLCONF3 _d …food markets/stalls Please select one answer only
1. Very confident 2. Fairly confident 3. Not very confident 4. Not at all confident 5. It varies from place to place 6. I don’t buy food from here 7. I don’t buy food sold loose 8. Don’t know
[ASK ALL] LABELREAD How easy do you find it to read the labelling on food products (e.g. ingredients, nutrition or storage information)? Please select one answer only
1. Very easy to read 2. Quite easy to read 3. Neither easy nor difficult to read 4. Quite difficult to read 5. Very difficult to read 6. It varies
[TIMESTAMP3] [NEW SCREEN] Sometimes a problem with the quality or safety of a food product will be identified after it has been put on shop shelves. When this occurs, a Food Alert will be issued to inform the public. When the problem relates to allergens or allergen information, an Allergy Alert will be issued.
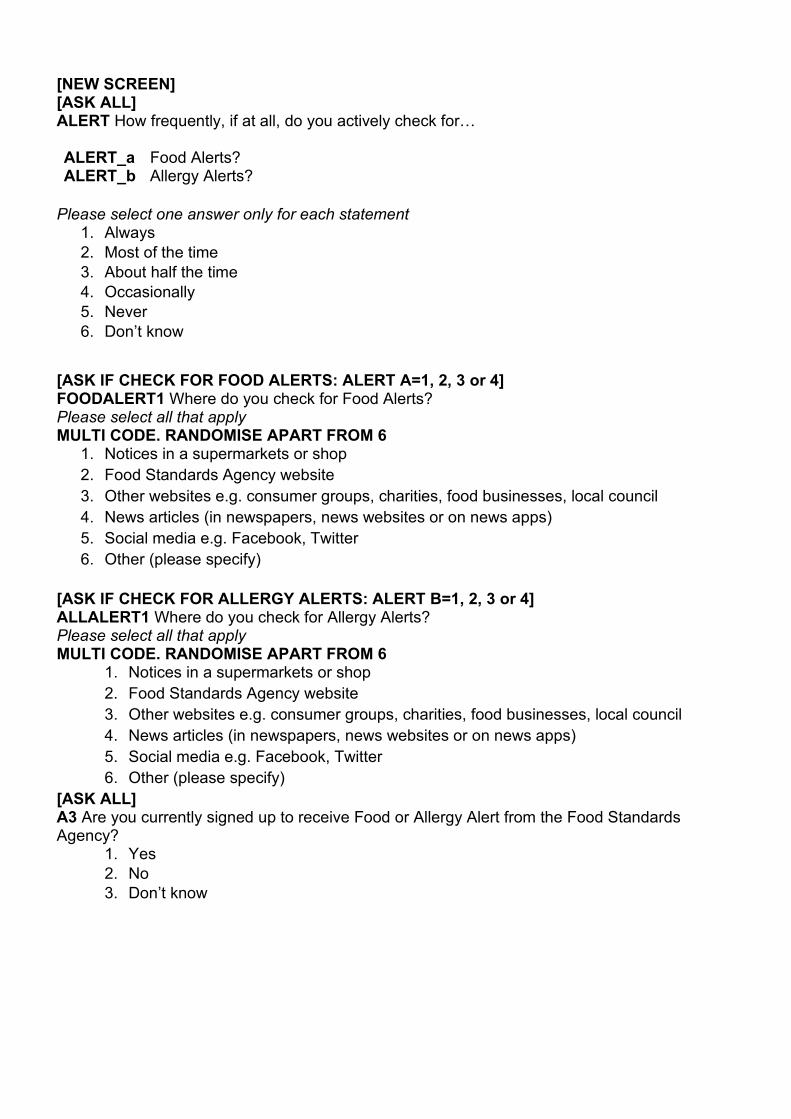
[NEW SCREEN] [ASK ALL] ALERT How frequently, if at all, do you actively check for… ALERT_a Food Alerts? ALERT_b Allergy Alerts?
Please select one answer only for each statement
1. Always 2. Most of the time 3. About half the time 4. Occasionally 5. Never 6. Don’t know
[ASK IF CHECK FOR FOOD ALERTS: ALERT A=1, 2, 3 or 4] FOODALERT1 Where do you check for Food Alerts? Please select all that apply MULTI CODE. RANDOMISE APART FROM 6
1. Notices in a supermarkets or shop 2. Food Standards Agency website 3. Other websites e.g. consumer groups, charities, food businesses, local council 4. News articles (in newspapers, news websites or on news apps) 5. Social media e.g. Facebook, Twitter 6. Other (please specify)
[ASK IF CHECK FOR ALLERGY ALERTS: ALERT B=1, 2, 3 or 4] ALLALERT1 Where do you check for Allergy Alerts? Please select all that apply MULTI CODE. RANDOMISE APART FROM 6
1. Notices in a supermarkets or shop 2. Food Standards Agency website 3. Other websites e.g. consumer groups, charities, food businesses, local council 4. News articles (in newspapers, news websites or on news apps) 5. Social media e.g. Facebook, Twitter 6. Other (please specify)
[ASK ALL] A3 Are you currently signed up to receive Food or Allergy Alert from the Food Standards Agency?
1. Yes 2. No 3. Don’t know
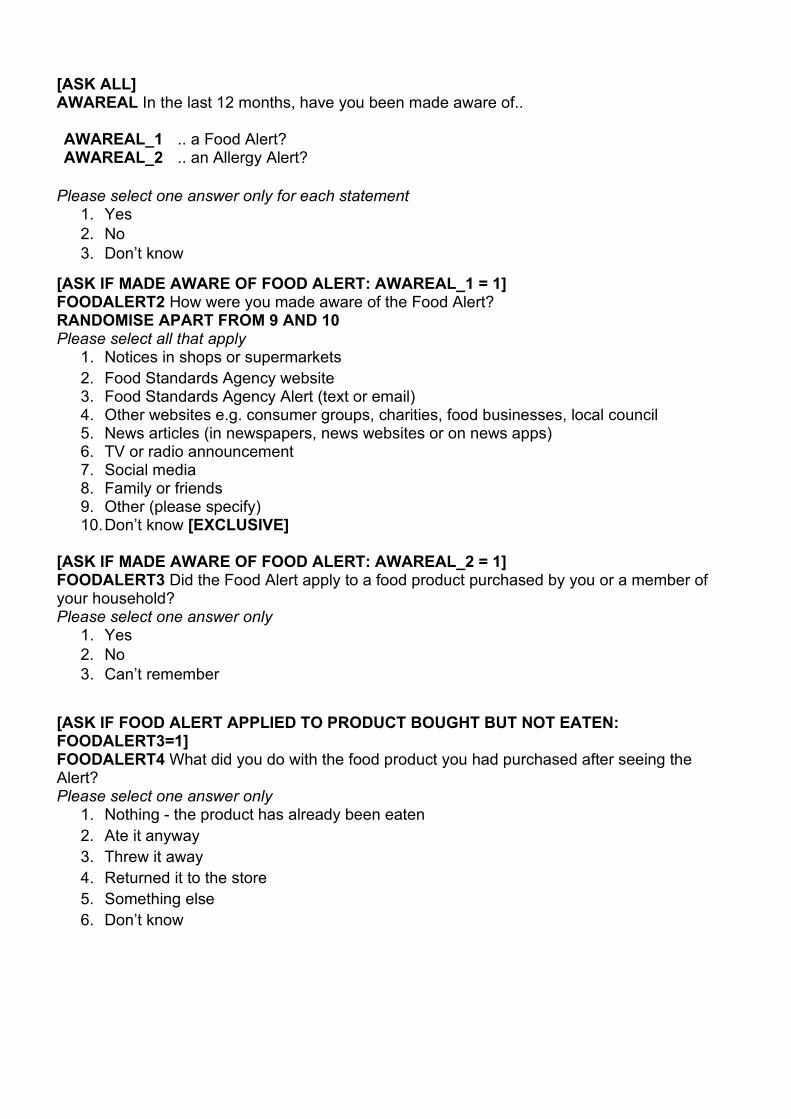
[ASK ALL] AWAREAL In the last 12 months, have you been made aware of.. AWAREAL_1 .. a Food Alert? AWAREAL_2 .. an Allergy Alert?
Please select one answer only for each statement
1. Yes 2. No 3. Don’t know
[ASK IF MADE AWARE OF FOOD ALERT: AWAREAL_1 = 1] FOODALERT2 How were you made aware of the Food Alert? RANDOMISE APART FROM 9 AND 10 Please select all that apply
1. Notices in shops or supermarkets 2. Food Standards Agency website 3. Food Standards Agency Alert (text or email) 4. Other websites e.g. consumer groups, charities, food businesses, local council 5. News articles (in newspapers, news websites or on news apps) 6. TV or radio announcement 7. Social media 8. Family or friends 9. Other (please specify) 10. Don’t know [EXCLUSIVE]
[ASK IF MADE AWARE OF FOOD ALERT: AWAREAL_2 = 1] FOODALERT3 Did the Food Alert apply to a food product purchased by you or a member of your household? Please select one answer only
1. Yes 2. No 3. Can’t remember
[ASK IF FOOD ALERT APPLIED TO PRODUCT BOUGHT BUT NOT EATEN: FOODALERT3=1] FOODALERT4 What did you do with the food product you had purchased after seeing the Alert? Please select one answer only
1. Nothing - the product has already been eaten 2. Ate it anyway 3. Threw it away 4. Returned it to the store 5. Something else 6. Don’t know
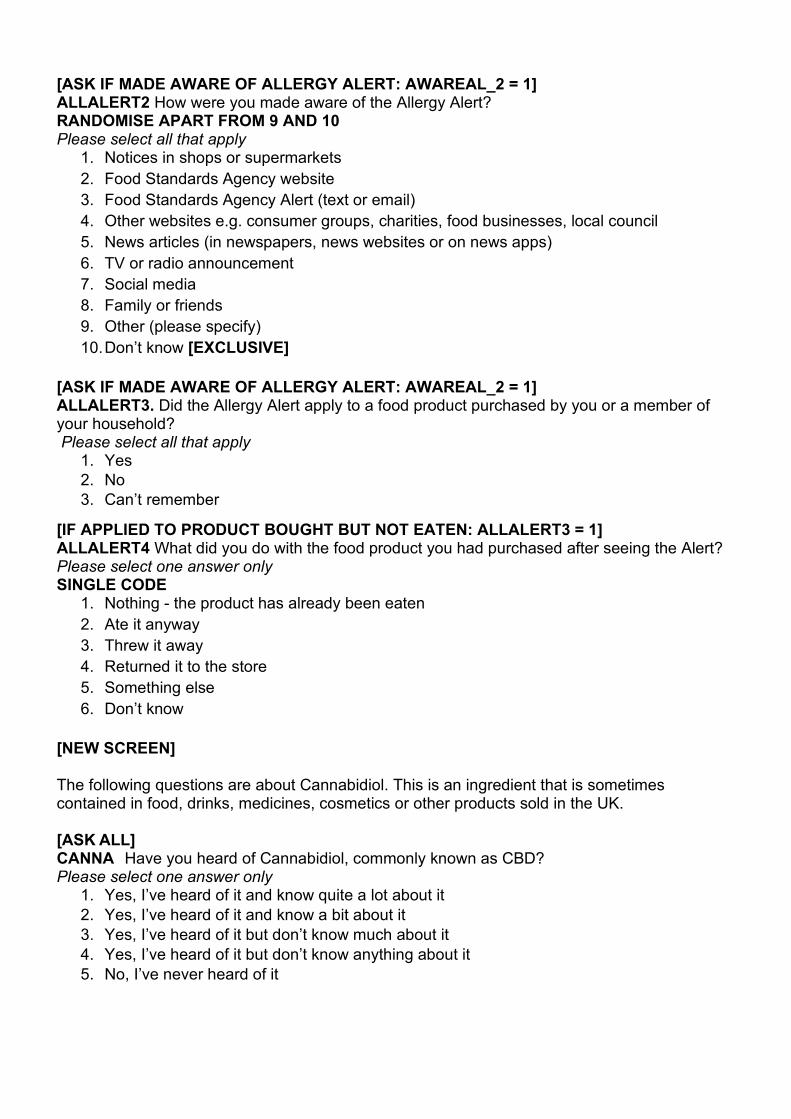
[ASK IF MADE AWARE OF ALLERGY ALERT: AWAREAL_2 = 1] ALLALERT2 How were you made aware of the Allergy Alert? RANDOMISE APART FROM 9 AND 10 Please select all that apply
1. Notices in shops or supermarkets 2. Food Standards Agency website 3. Food Standards Agency Alert (text or email) 4. Other websites e.g. consumer groups, charities, food businesses, local council 5. News articles (in newspapers, news websites or on news apps) 6. TV or radio announcement 7. Social media 8. Family or friends 9. Other (please specify) 10. Don’t know [EXCLUSIVE]
[ASK IF MADE AWARE OF ALLERGY ALERT: AWAREAL_2 = 1] ALLALERT3. Did the Allergy Alert apply to a food product purchased by you or a member of your household? Please select all that apply
1. Yes 2. No 3. Can’t remember
[IF APPLIED TO PRODUCT BOUGHT BUT NOT EATEN: ALLALERT3 = 1] ALLALERT4 What did you do with the food product you had purchased after seeing the Alert? Please select one answer only SINGLE CODE
1. Nothing - the product has already been eaten 2. Ate it anyway 3. Threw it away 4. Returned it to the store 5. Something else 6. Don’t know
[NEW SCREEN] The following questions are about Cannabidiol. This is an ingredient that is sometimes contained in food, drinks, medicines, cosmetics or other products sold in the UK. [ASK ALL] CANNA Have you heard of Cannabidiol, commonly known as CBD? Please select one answer only
1. Yes, I’ve heard of it and know quite a lot about it 2. Yes, I’ve heard of it and know a bit about it 3. Yes, I’ve heard of it but don’t know much about it 4. Yes, I’ve heard of it but don’t know anything about it 5. No, I’ve never heard of it
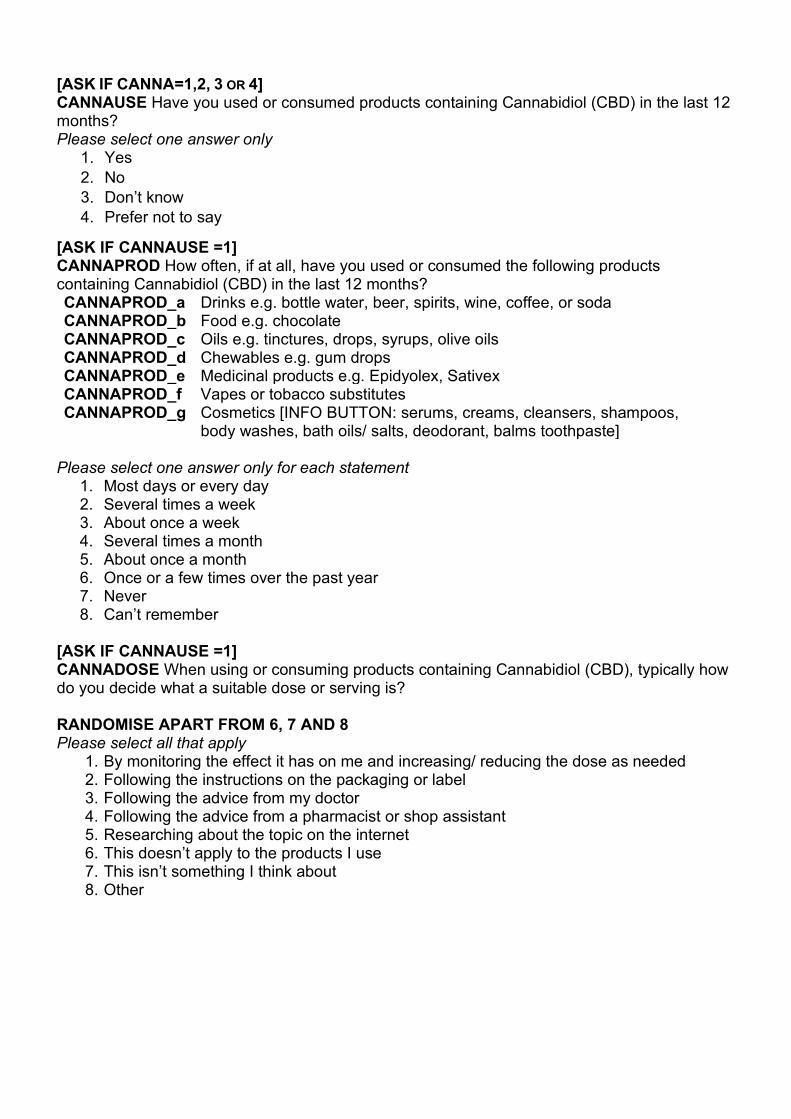
[ASK IF CANNA=1,2, 3 OR 4] CANNAUSE Have you used or consumed products containing Cannabidiol (CBD) in the last 12 months? Please select one answer only
1. Yes 2. No 3. Don’t know 4. Prefer not to say
[ASK IF CANNAUSE =1] CANNAPROD How often, if at all, have you used or consumed the following products containing Cannabidiol (CBD) in the last 12 months? CANNAPROD_a Drinks e.g. bottle water, beer, spirits, wine, coffee, or soda CANNAPROD_b Food e.g. chocolate CANNAPROD_c Oils e.g. tinctures, drops, syrups, olive oils CANNAPROD_d Chewables e.g. gum drops CANNAPROD_e Medicinal products e.g. Epidyolex, Sativex CANNAPROD_f Vapes or tobacco substitutes CANNAPROD_g Cosmetics [INFO BUTTON: serums, creams, cleansers, shampoos,
body washes, bath oils/ salts, deodorant, balms toothpaste] Please select one answer only for each statement
1. Most days or every day 2. Several times a week 3. About once a week 4. Several times a month 5. About once a month 6. Once or a few times over the past year 7. Never 8. Can’t remember
[ASK IF CANNAUSE =1] CANNADOSE When using or consuming products containing Cannabidiol (CBD), typically how do you decide what a suitable dose or serving is? RANDOMISE APART FROM 6, 7 AND 8 Please select all that apply
1. By monitoring the effect it has on me and increasing/ reducing the dose as needed 2. Following the instructions on the packaging or label 3. Following the advice from my doctor 4. Following the advice from a pharmacist or shop assistant 5. Researching about the topic on the internet 6. This doesn’t apply to the products I use 7. This isn’t something I think about 8. Other
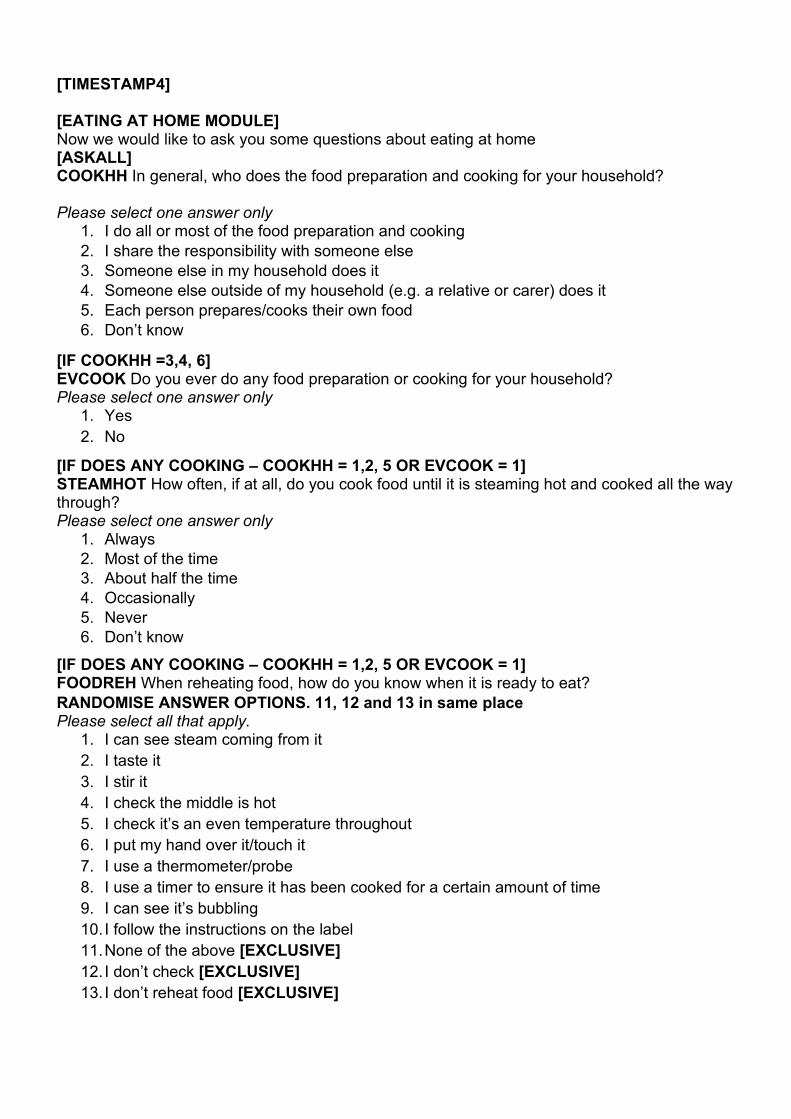
[TIMESTAMP4] [EATING AT HOME MODULE] Now we would like to ask you some questions about eating at home [ASKALL] COOKHH In general, who does the food preparation and cooking for your household? Please select one answer only
1. I do all or most of the food preparation and cooking 2. I share the responsibility with someone else 3. Someone else in my household does it 4. Someone else outside of my household (e.g. a relative or carer) does it 5. Each person prepares/cooks their own food 6. Don’t know
[IF COOKHH =3,4, 6] EVCOOK Do you ever do any food preparation or cooking for your household? Please select one answer only
1. Yes 2. No
[IF DOES ANY COOKING – COOKHH = 1,2, 5 OR EVCOOK = 1] STEAMHOT How often, if at all, do you cook food until it is steaming hot and cooked all the way through? Please select one answer only
1. Always 2. Most of the time 3. About half the time 4. Occasionally 5. Never 6. Don’t know
[IF DOES ANY COOKING – COOKHH = 1,2, 5 OR EVCOOK = 1] FOODREH When reheating food, how do you know when it is ready to eat? RANDOMISE ANSWER OPTIONS. 11, 12 and 13 in same place Please select all that apply.
1. I can see steam coming from it 2. I taste it 3. I stir it 4. I check the middle is hot 5. I check it’s an even temperature throughout 6. I put my hand over it/touch it 7. I use a thermometer/probe 8. I use a timer to ensure it has been cooked for a certain amount of time 9. I can see it’s bubbling 10. I follow the instructions on the label 11. None of the above [EXCLUSIVE] 12. I don’t check [EXCLUSIVE] 13. I don’t reheat food [EXCLUSIVE]
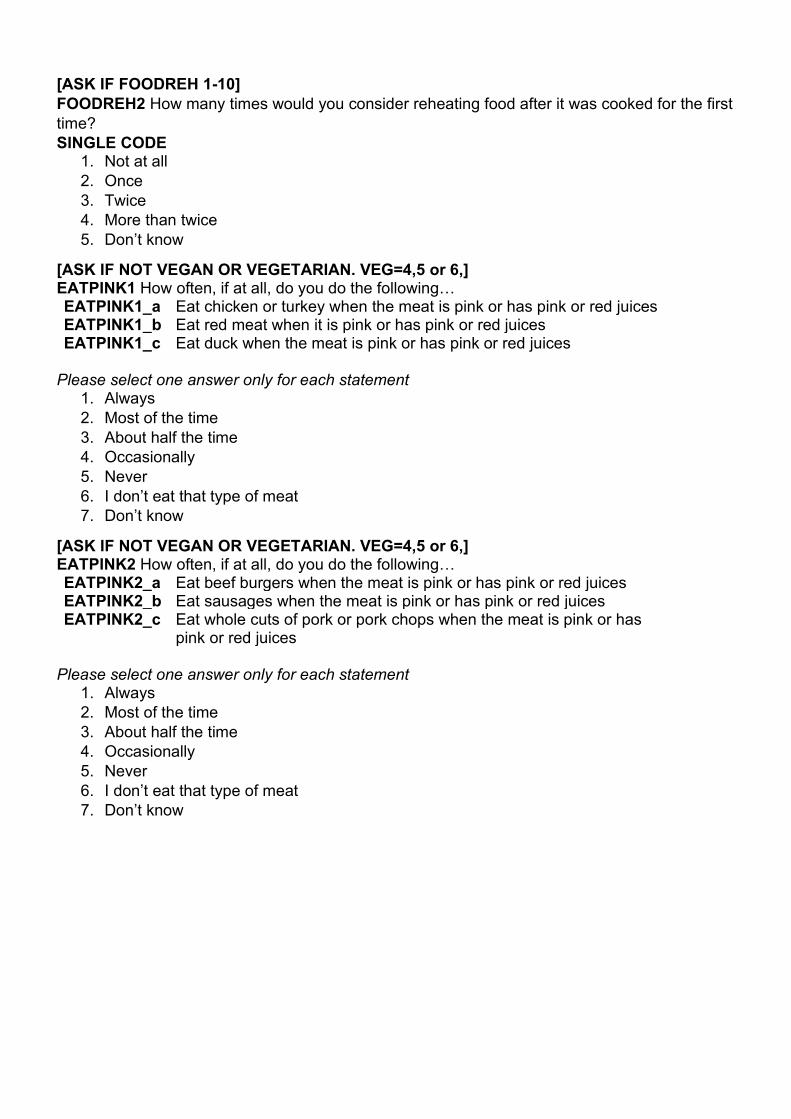
[ASK IF FOODREH 1-10] FOODREH2 How many times would you consider reheating food after it was cooked for the first time? SINGLE CODE
1. Not at all 2. Once 3. Twice 4. More than twice 5. Don’t know
[ASK IF NOT VEGAN OR VEGETARIAN. VEG=4,5 or 6,] EATPINK1 How often, if at all, do you do the following… EATPINK1_a Eat chicken or turkey when the meat is pink or has pink or red juices EATPINK1_b Eat red meat when it is pink or has pink or red juices EATPINK1_c Eat duck when the meat is pink or has pink or red juices
Please select one answer only for each statement
1. Always 2. Most of the time 3. About half the time 4. Occasionally 5. Never 6. I don’t eat that type of meat 7. Don’t know
[ASK IF NOT VEGAN OR VEGETARIAN. VEG=4,5 or 6,] EATPINK2 How often, if at all, do you do the following… EATPINK2_a Eat beef burgers when the meat is pink or has pink or red juices EATPINK2_b Eat sausages when the meat is pink or has pink or red juices EATPINK2_c Eat whole cuts of pork or pork chops when the meat is pink or has
pink or red juices Please select one answer only for each statement
1. Always 2. Most of the time 3. About half the time 4. Occasionally 5. Never 6. I don’t eat that type of meat 7. Don’t know
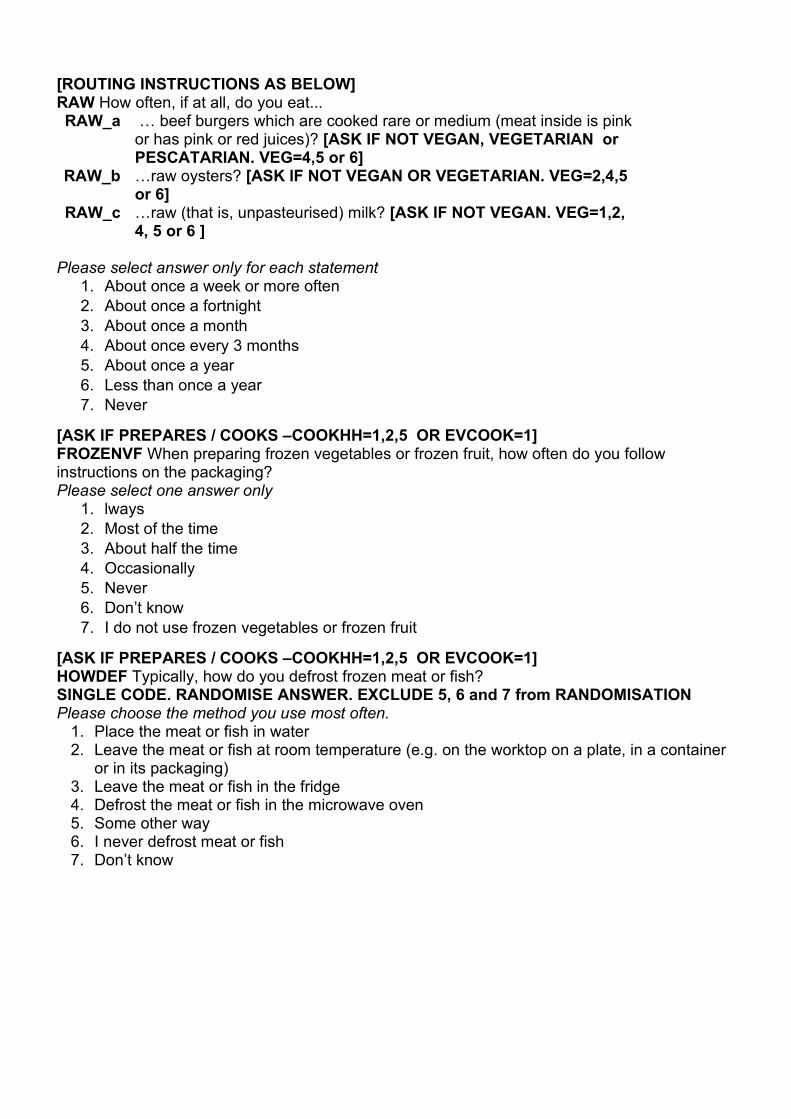
[ROUTING INSTRUCTIONS AS BELOW] RAW How often, if at all, do you eat... RAW_a … beef burgers which are cooked rare or medium (meat inside is pink
or has pink or red juices)? [ASK IF NOT VEGAN, VEGETARIAN or PESCATARIAN. VEG=4,5 or 6]
RAW_b …raw oysters? [ASK IF NOT VEGAN OR VEGETARIAN. VEG=2,4,5 or 6]
RAW_c …raw (that is, unpasteurised) milk? [ASK IF NOT VEGAN. VEG=1,2, 4, 5 or 6 ]
Please select answer only for each statement
1. About once a week or more often 2. About once a fortnight 3. About once a month 4. About once every 3 months 5. About once a year 6. Less than once a year 7. Never
[ASK IF PREPARES / COOKS –COOKHH=1,2,5 OR EVCOOK=1] FROZENVF When preparing frozen vegetables or frozen fruit, how often do you follow instructions on the packaging? Please select one answer only
1. lways 2. Most of the time 3. About half the time 4. Occasionally 5. Never 6. Don’t know 7. I do not use frozen vegetables or frozen fruit
[ASK IF PREPARES / COOKS –COOKHH=1,2,5 OR EVCOOK=1] HOWDEF Typically, how do you defrost frozen meat or fish? SINGLE CODE. RANDOMISE ANSWER. EXCLUDE 5, 6 and 7 from RANDOMISATION Please choose the method you use most often.
1. Place the meat or fish in water 2. Leave the meat or fish at room temperature (e.g. on the worktop on a plate, in a container
or in its packaging) 3. Leave the meat or fish in the fridge 4. Defrost the meat or fish in the microwave oven 5. Some other way 6. I never defrost meat or fish 7. Don’t know
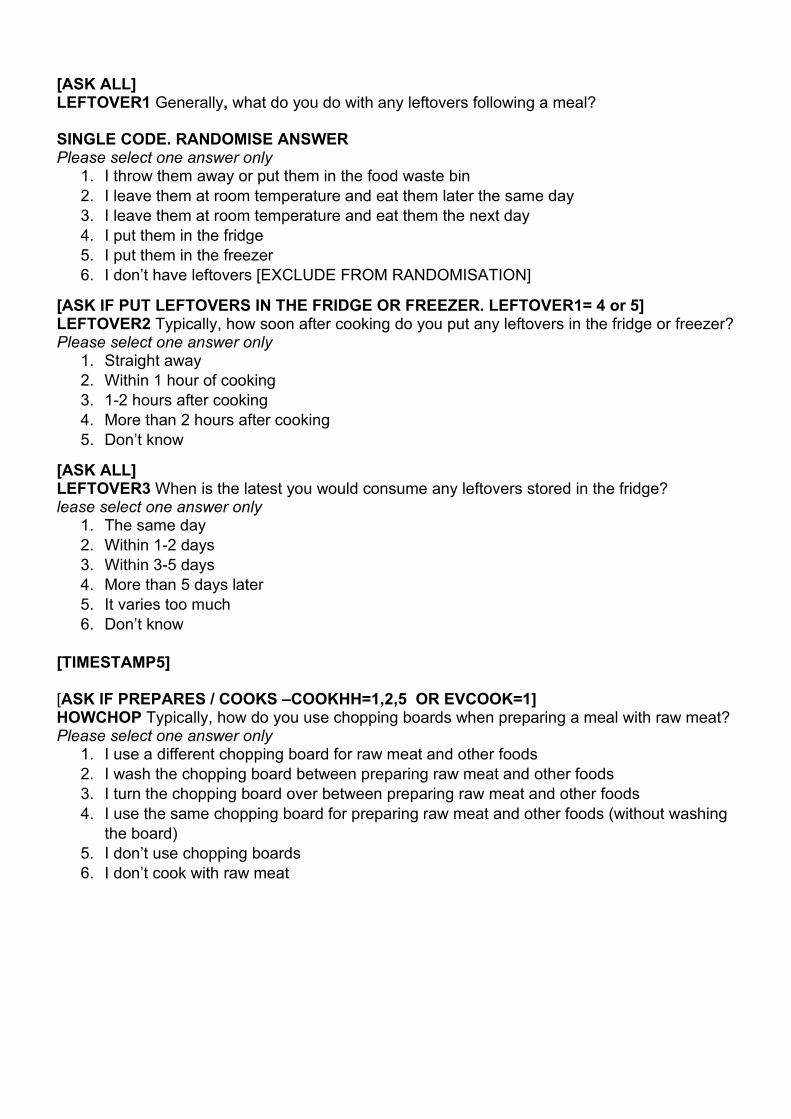
[ASK ALL] LEFTOVER1 Generally, what do you do with any leftovers following a meal? SINGLE CODE. RANDOMISE ANSWER Please select one answer only
1. I throw them away or put them in the food waste bin 2. I leave them at room temperature and eat them later the same day 3. I leave them at room temperature and eat them the next day 4. I put them in the fridge 5. I put them in the freezer 6. I don’t have leftovers [EXCLUDE FROM RANDOMISATION]
[ASK IF PUT LEFTOVERS IN THE FRIDGE OR FREEZER. LEFTOVER1= 4 or 5] LEFTOVER2 Typically, how soon after cooking do you put any leftovers in the fridge or freezer? Please select one answer only
1. Straight away 2. Within 1 hour of cooking 3. 1-2 hours after cooking 4. More than 2 hours after cooking 5. Don’t know
[ASK ALL] LEFTOVER3 When is the latest you would consume any leftovers stored in the fridge? lease select one answer only
1. The same day 2. Within 1-2 days 3. Within 3-5 days 4. More than 5 days later 5. It varies too much 6. Don’t know
[TIMESTAMP5] [ASK IF PREPARES / COOKS –COOKHH=1,2,5 OR EVCOOK=1] HOWCHOP Typically, how do you use chopping boards when preparing a meal with raw meat? Please select one answer only
1. I use a different chopping board for raw meat and other foods 2. I wash the chopping board between preparing raw meat and other foods 3. I turn the chopping board over between preparing raw meat and other foods 4. I use the same chopping board for preparing raw meat and other foods (without washing
the board) 5. I don’t use chopping boards 6. I don’t cook with raw meat
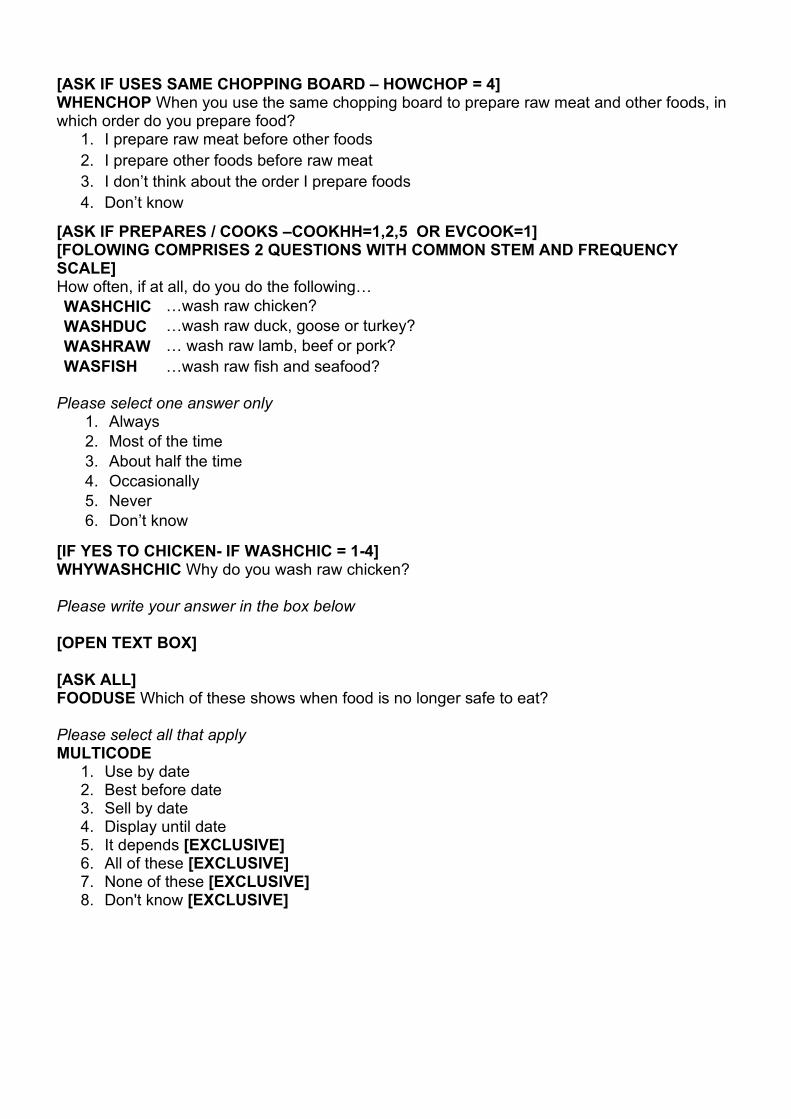
[ASK IF USES SAME CHOPPING BOARD – HOWCHOP = 4] WHENCHOP When you use the same chopping board to prepare raw meat and other foods, in which order do you prepare food?
1. I prepare raw meat before other foods 2. I prepare other foods before raw meat 3. I don’t think about the order I prepare foods 4. Don’t know
[ASK IF PREPARES / COOKS –COOKHH=1,2,5 OR EVCOOK=1] [FOLOWING COMPRISES 2 QUESTIONS WITH COMMON STEM AND FREQUENCY SCALE] How often, if at all, do you do the following… WASHCHIC …wash raw chicken? WASHDUC …wash raw duck, goose or turkey? WASHRAW … wash raw lamb, beef or pork? WASFISH …wash raw fish and seafood?
Please select one answer only
1. Always 2. Most of the time 3. About half the time 4. Occasionally 5. Never 6. Don’t know
[IF YES TO CHICKEN- IF WASHCHIC = 1-4] WHYWASHCHIC Why do you wash raw chicken? Please write your answer in the box below [OPEN TEXT BOX]
[ASK ALL] FOODUSE Which of these shows when food is no longer safe to eat? Please select all that apply MULTICODE
1. Use by date 2. Best before date 3. Sell by date 4. Display until date 5. It depends [EXCLUSIVE] 6. All of these [EXCLUSIVE] 7. None of these [EXCLUSIVE] 8. Don't know [EXCLUSIVE]
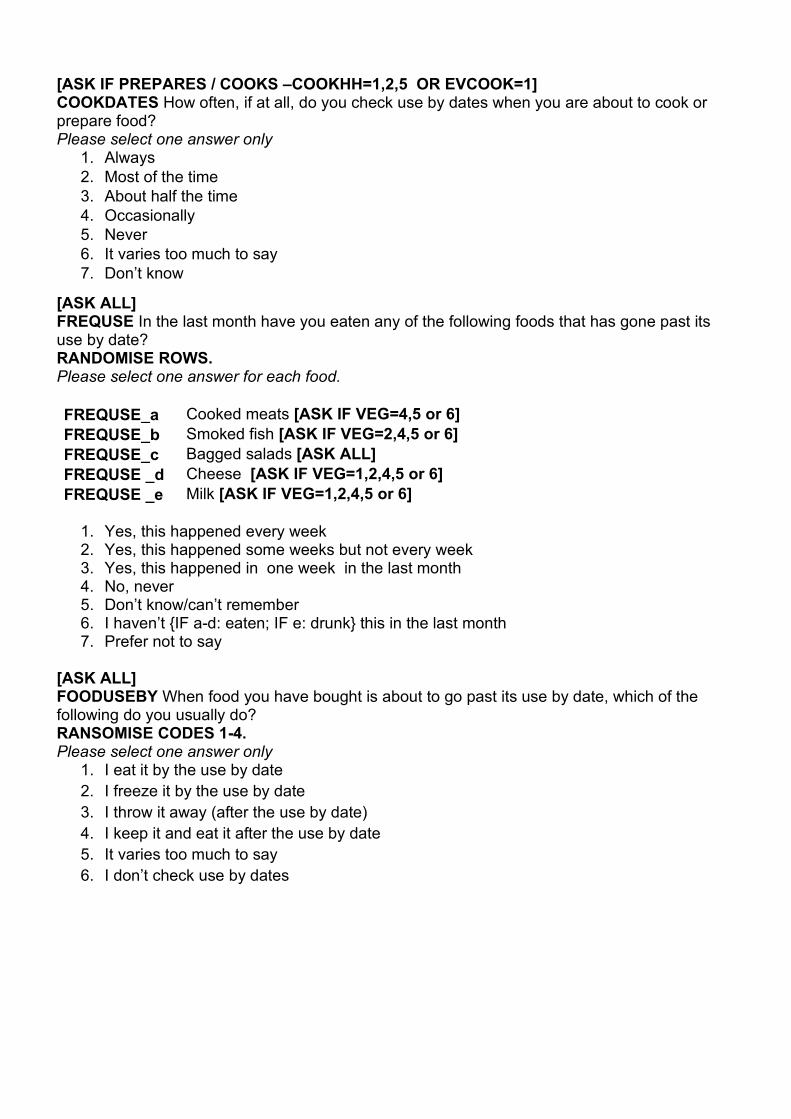
[ASK IF PREPARES / COOKS –COOKHH=1,2,5 OR EVCOOK=1] COOKDATES How often, if at all, do you check use by dates when you are about to cook or prepare food? Please select one answer only
1. Always 2. Most of the time 3. About half the time 4. Occasionally 5. Never 6. It varies too much to say 7. Don’t know
[ASK ALL] FREQUSE In the last month have you eaten any of the following foods that has gone past its use by date? RANDOMISE ROWS. Please select one answer for each food. FREQUSE_a Cooked meats [ASK IF VEG=4,5 or 6] FREQUSE_b Smoked fish [ASK IF VEG=2,4,5 or 6] FREQUSE_c Bagged salads [ASK ALL] FREQUSE _d Cheese [ASK IF VEG=1,2,4,5 or 6] FREQUSE _e Milk [ASK IF VEG=1,2,4,5 or 6]
1. Yes, this happened every week 2. Yes, this happened some weeks but not every week 3. Yes, this happened in one week in the last month 4. No, never 5. Don’t know/can’t remember 6. I haven’t {IF a-d: eaten; IF e: drunk} this in the last month 7. Prefer not to say
[ASK ALL] FOODUSEBY When food you have bought is about to go past its use by date, which of the following do you usually do? RANSOMISE CODES 1-4. Please select one answer only
1. I eat it by the use by date 2. I freeze it by the use by date 3. I throw it away (after the use by date) 4. I keep it and eat it after the use by date 5. It varies too much to say 6. I don’t check use by dates
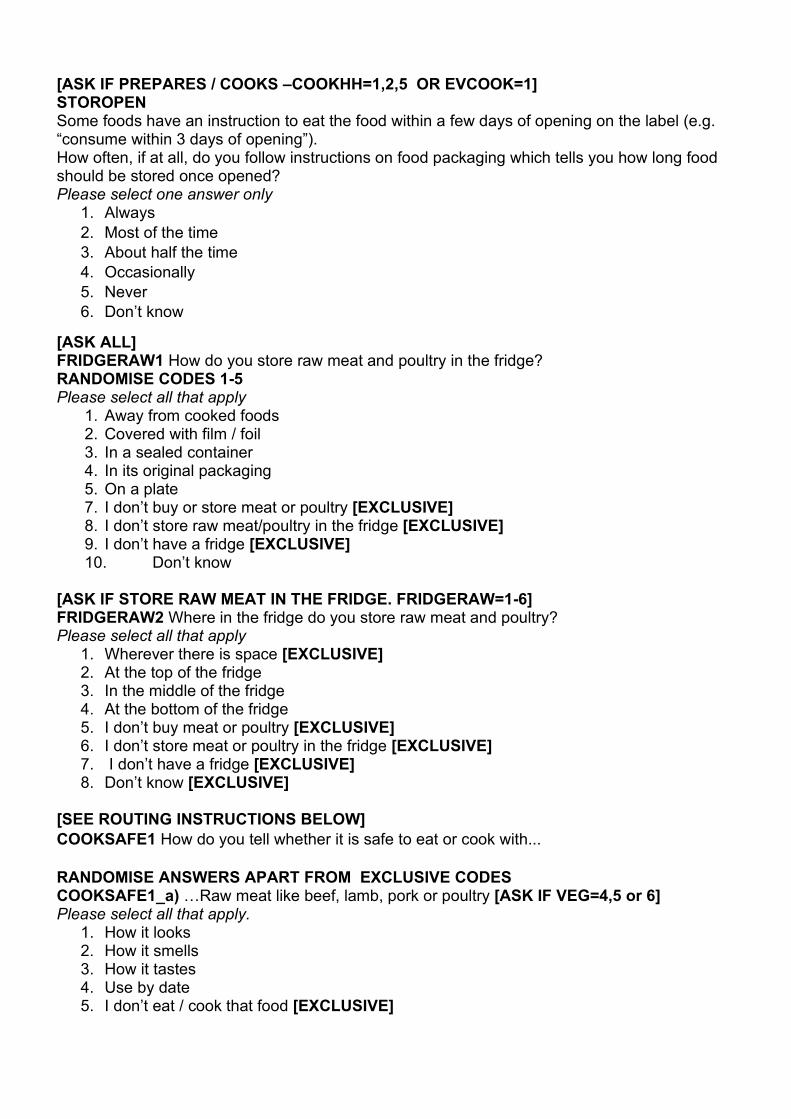
[ASK IF PREPARES / COOKS –COOKHH=1,2,5 OR EVCOOK=1] STOROPEN Some foods have an instruction to eat the food within a few days of opening on the label (e.g. “consume within 3 days of opening”). How often, if at all, do you follow instructions on food packaging which tells you how long food should be stored once opened? Please select one answer only
1. Always 2. Most of the time 3. About half the time 4. Occasionally 5. Never 6. Don’t know
[ASK ALL] FRIDGERAW1 How do you store raw meat and poultry in the fridge? RANDOMISE CODES 1-5 Please select all that apply
1. Away from cooked foods 2. Covered with film / foil 3. In a sealed container 4. In its original packaging 5. On a plate 7. I don’t buy or store meat or poultry [EXCLUSIVE] 8. I don’t store raw meat/poultry in the fridge [EXCLUSIVE] 9. I don’t have a fridge [EXCLUSIVE] 10. Don’t know
[ASK IF STORE RAW MEAT IN THE FRIDGE. FRIDGERAW=1-6] FRIDGERAW2 Where in the fridge do you store raw meat and poultry? Please select all that apply
1. Wherever there is space [EXCLUSIVE] 2. At the top of the fridge 3. In the middle of the fridge 4. At the bottom of the fridge 5. I don’t buy meat or poultry [EXCLUSIVE] 6. I don’t store meat or poultry in the fridge [EXCLUSIVE] 7. I don’t have a fridge [EXCLUSIVE] 8. Don’t know [EXCLUSIVE]
[SEE ROUTING INSTRUCTIONS BELOW] COOKSAFE1 How do you tell whether it is safe to eat or cook with... RANDOMISE ANSWERS APART FROM EXCLUSIVE CODES COOKSAFE1_a) …Raw meat like beef, lamb, pork or poultry [ASK IF VEG=4,5 or 6] Please select all that apply.
1. How it looks 2. How it smells 3. How it tastes 4. Use by date 5. I don’t eat / cook that food [EXCLUSIVE]
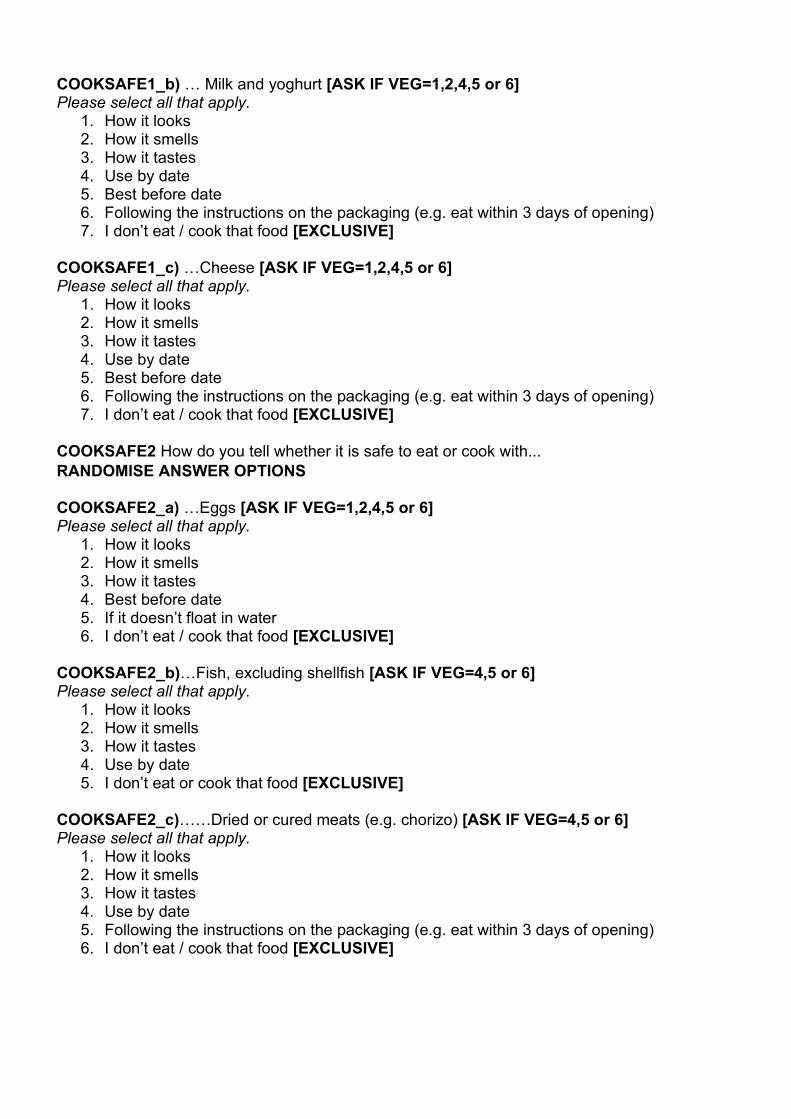
COOKSAFE1_b) … Milk and yoghurt [ASK IF VEG=1,2,4,5 or 6] Please select all that apply.
1. How it looks 2. How it smells 3. How it tastes 4. Use by date 5. Best before date 6. Following the instructions on the packaging (e.g. eat within 3 days of opening) 7. I don’t eat / cook that food [EXCLUSIVE]
COOKSAFE1_c) …Cheese [ASK IF VEG=1,2,4,5 or 6] Please select all that apply.
1. How it looks 2. How it smells 3. How it tastes 4. Use by date 5. Best before date 6. Following the instructions on the packaging (e.g. eat within 3 days of opening) 7. I don’t eat / cook that food [EXCLUSIVE]
COOKSAFE2 How do you tell whether it is safe to eat or cook with... RANDOMISE ANSWER OPTIONS COOKSAFE2_a) …Eggs [ASK IF VEG=1,2,4,5 or 6] Please select all that apply.
1. How it looks 2. How it smells 3. How it tastes 4. Best before date 5. If it doesn’t float in water 6. I don’t eat / cook that food [EXCLUSIVE]
COOKSAFE2_b)…Fish, excluding shellfish [ASK IF VEG=4,5 or 6] Please select all that apply.
1. How it looks 2. How it smells 3. How it tastes 4. Use by date 5. I don’t eat or cook that food [EXCLUSIVE]
COOKSAFE2_c)……Dried or cured meats (e.g. chorizo) [ASK IF VEG=4,5 or 6] Please select all that apply.
1. How it looks 2. How it smells 3. How it tastes 4. Use by date 5. Following the instructions on the packaging (e.g. eat within 3 days of opening) 6. I don’t eat / cook that food [EXCLUSIVE]
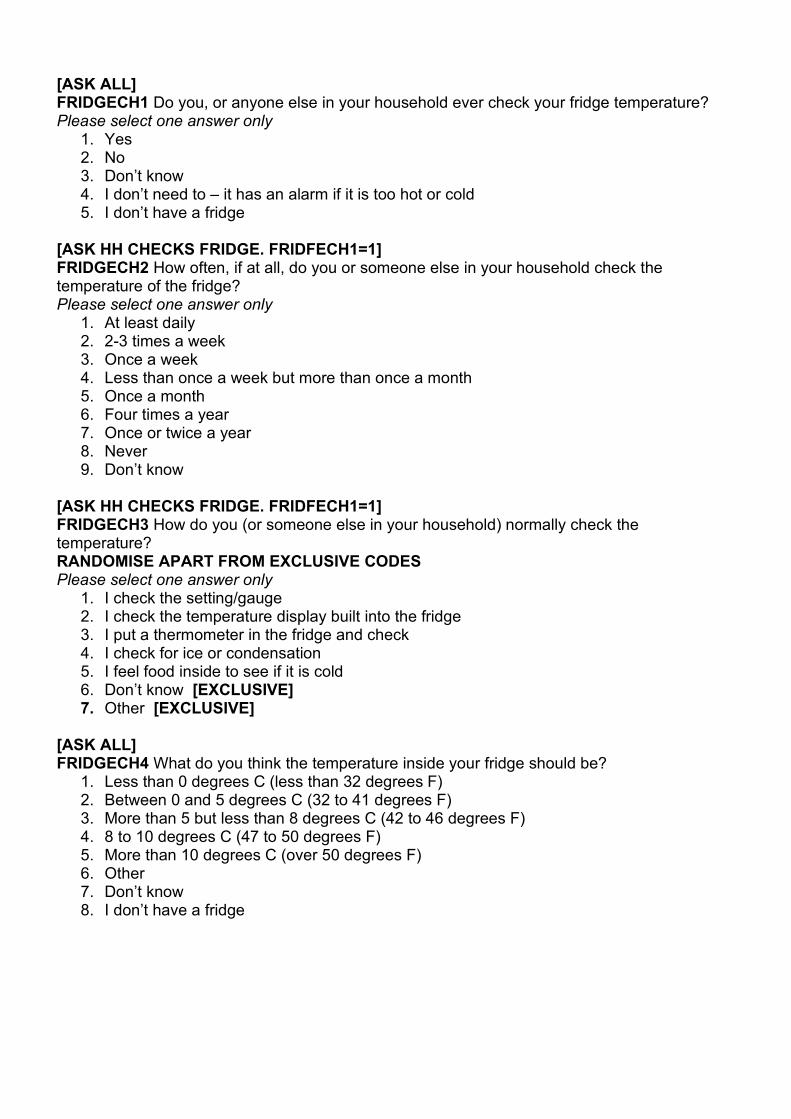
[ASK ALL] FRIDGECH1 Do you, or anyone else in your household ever check your fridge temperature? Please select one answer only
1. Yes 2. No 3. Don’t know 4. I don’t need to – it has an alarm if it is too hot or cold 5. I don’t have a fridge
[ASK HH CHECKS FRIDGE. FRIDFECH1=1] FRIDGECH2 How often, if at all, do you or someone else in your household check the temperature of the fridge? Please select one answer only
1. At least daily 2. 2-3 times a week 3. Once a week 4. Less than once a week but more than once a month 5. Once a month 6. Four times a year 7. Once or twice a year 8. Never 9. Don’t know
[ASK HH CHECKS FRIDGE. FRIDFECH1=1] FRIDGECH3 How do you (or someone else in your household) normally check the temperature? RANDOMISE APART FROM EXCLUSIVE CODES Please select one answer only
1. I check the setting/gauge 2. I check the temperature display built into the fridge 3. I put a thermometer in the fridge and check 4. I check for ice or condensation 5. I feel food inside to see if it is cold 6. Don’t know [EXCLUSIVE] 7. Other [EXCLUSIVE]
[ASK ALL] FRIDGECH4 What do you think the temperature inside your fridge should be?
1. Less than 0 degrees C (less than 32 degrees F) 2. Between 0 and 5 degrees C (32 to 41 degrees F) 3. More than 5 but less than 8 degrees C (42 to 46 degrees F) 4. 8 to 10 degrees C (47 to 50 degrees F) 5. More than 10 degrees C (over 50 degrees F) 6. Other 7. Don’t know 8. I don’t have a fridge
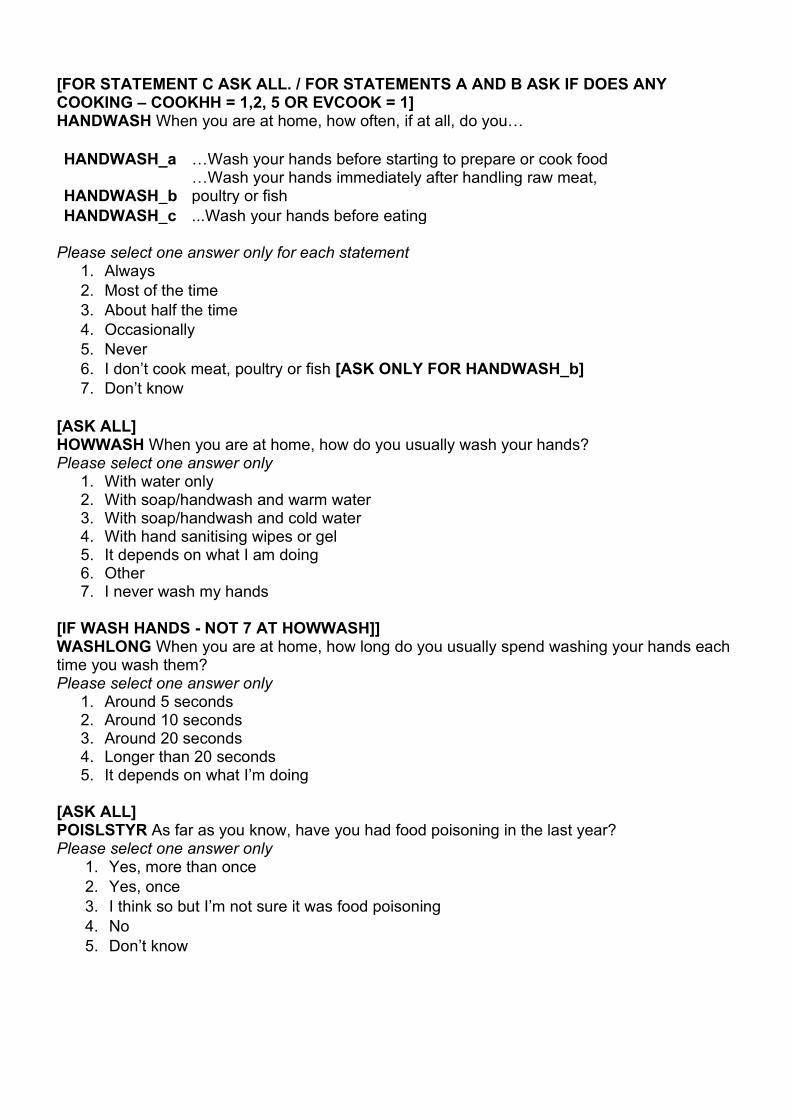
[FOR STATEMENT C ASK ALL. / FOR STATEMENTS A AND B ASK IF DOES ANY COOKING – COOKHH = 1,2, 5 OR EVCOOK = 1] HANDWASH When you are at home, how often, if at all, do you… HANDWASH_a …Wash your hands before starting to prepare or cook food
HANDWASH_b …Wash your hands immediately after handling raw meat, poultry or fish
HANDWASH_c ...Wash your hands before eating Please select one answer only for each statement
1. Always 2. Most of the time 3. About half the time 4. Occasionally 5. Never 6. I don’t cook meat, poultry or fish [ASK ONLY FOR HANDWASH_b] 7. Don’t know
[ASK ALL] HOWWASH When you are at home, how do you usually wash your hands? Please select one answer only
1. With water only 2. With soap/handwash and warm water 3. With soap/handwash and cold water 4. With hand sanitising wipes or gel 5. It depends on what I am doing 6. Other 7. I never wash my hands
[IF WASH HANDS - NOT 7 AT HOWWASH]] WASHLONG When you are at home, how long do you usually spend washing your hands each time you wash them? Please select one answer only
1. Around 5 seconds 2. Around 10 seconds 3. Around 20 seconds 4. Longer than 20 seconds 5. It depends on what I’m doing
[ASK ALL] POISLSTYR As far as you know, have you had food poisoning in the last year? Please select one answer only
1. Yes, more than once 2. Yes, once 3. I think so but I’m not sure it was food poisoning 4. No 5. Don’t know
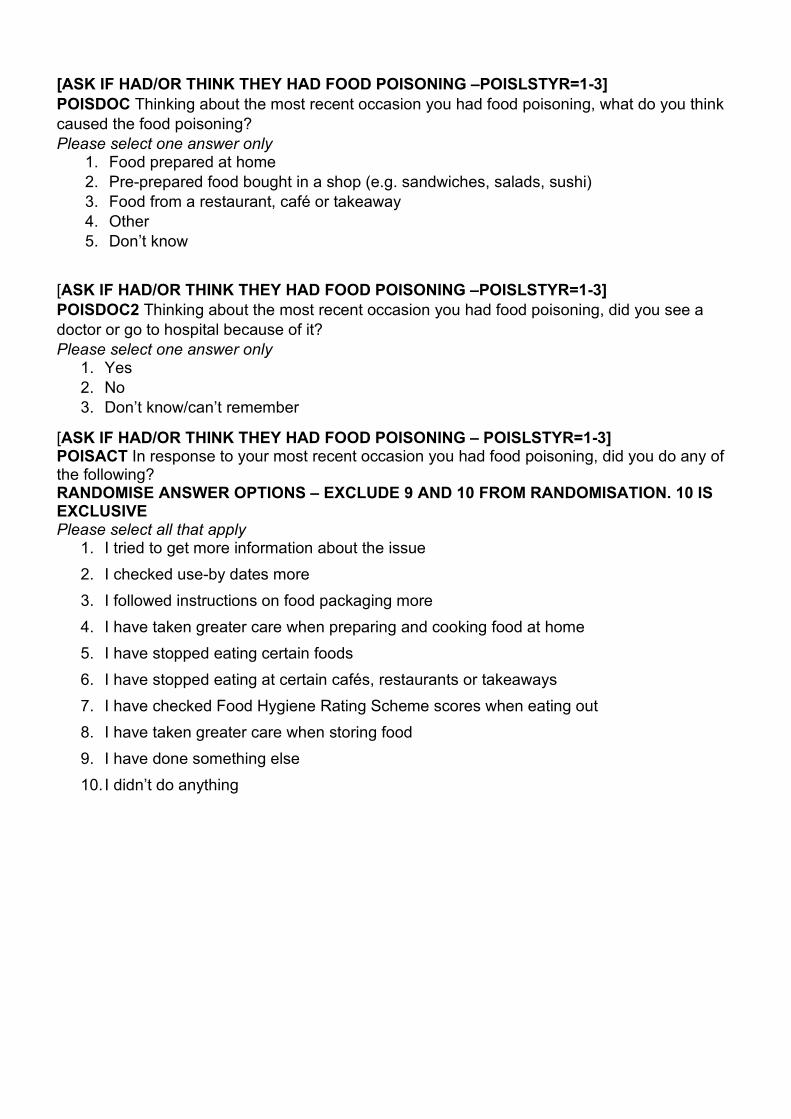
[ASK IF HAD/OR THINK THEY HAD FOOD POISONING –POISLSTYR=1-3] POISDOC Thinking about the most recent occasion you had food poisoning, what do you think caused the food poisoning? Please select one answer only
1. Food prepared at home 2. Pre-prepared food bought in a shop (e.g. sandwiches, salads, sushi) 3. Food from a restaurant, café or takeaway 4. Other 5. Don’t know
[ASK IF HAD/OR THINK THEY HAD FOOD POISONING –POISLSTYR=1-3] POISDOC2 Thinking about the most recent occasion you had food poisoning, did you see a doctor or go to hospital because of it? Please select one answer only
1. Yes 2. No 3. Don’t know/can’t remember
[ASK IF HAD/OR THINK THEY HAD FOOD POISONING – POISLSTYR=1-3] POISACT In response to your most recent occasion you had food poisoning, did you do any of the following? RANDOMISE ANSWER OPTIONS – EXCLUDE 9 AND 10 FROM RANDOMISATION. 10 IS EXCLUSIVE Please select all that apply
1. I tried to get more information about the issue 2. I checked use-by dates more 3. I followed instructions on food packaging more 4. I have taken greater care when preparing and cooking food at home 5. I have stopped eating certain foods 6. I have stopped eating at certain cafés, restaurants or takeaways 7. I have checked Food Hygiene Rating Scheme scores when eating out 8. I have taken greater care when storing food 9. I have done something else 10. I didn’t do anything
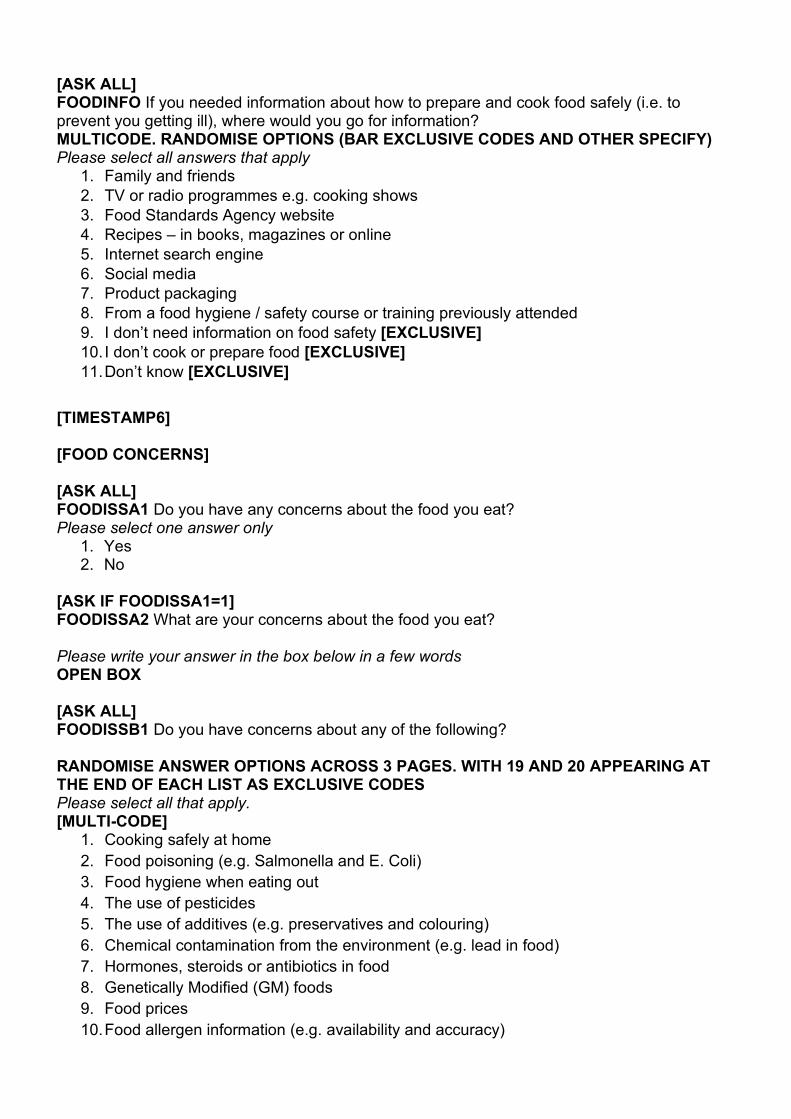
[ASK ALL] FOODINFO If you needed information about how to prepare and cook food safely (i.e. to prevent you getting ill), where would you go for information? MULTICODE. RANDOMISE OPTIONS (BAR EXCLUSIVE CODES AND OTHER SPECIFY) Please select all answers that apply
1. Family and friends 2. TV or radio programmes e.g. cooking shows 3. Food Standards Agency website 4. Recipes – in books, magazines or online 5. Internet search engine 6. Social media 7. Product packaging 8. From a food hygiene / safety course or training previously attended 9. I don’t need information on food safety [EXCLUSIVE] 10. I don’t cook or prepare food [EXCLUSIVE] 11. Don’t know [EXCLUSIVE]
[TIMESTAMP6] [FOOD CONCERNS] [ASK ALL] FOODISSA1 Do you have any concerns about the food you eat? Please select one answer only
1. Yes 2. No
[ASK IF FOODISSA1=1] FOODISSA2 What are your concerns about the food you eat? Please write your answer in the box below in a few words OPEN BOX [ASK ALL] FOODISSB1 Do you have concerns about any of the following? RANDOMISE ANSWER OPTIONS ACROSS 3 PAGES. WITH 19 AND 20 APPEARING AT THE END OF EACH LIST AS EXCLUSIVE CODES Please select all that apply. [MULTI-CODE]
1. Cooking safely at home 2. Food poisoning (e.g. Salmonella and E. Coli) 3. Food hygiene when eating out 4. The use of pesticides 5. The use of additives (e.g. preservatives and colouring) 6. Chemical contamination from the environment (e.g. lead in food) 7. Hormones, steroids or antibiotics in food 8. Genetically Modified (GM) foods 9. Food prices 10. Food allergen information (e.g. availability and accuracy)
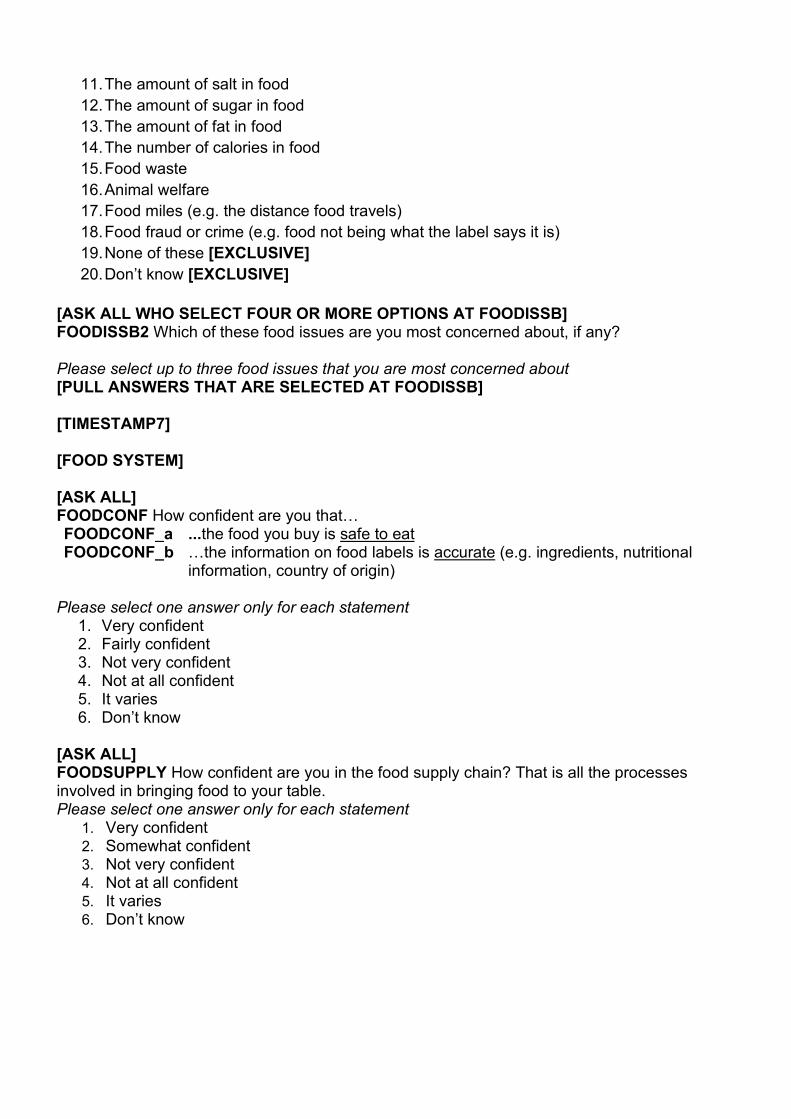
11. The amount of salt in food 12. The amount of sugar in food 13. The amount of fat in food 14. The number of calories in food 15. Food waste 16. Animal welfare 17. Food miles (e.g. the distance food travels) 18. Food fraud or crime (e.g. food not being what the label says it is) 19. None of these [EXCLUSIVE] 20. Don’t know [EXCLUSIVE]
[ASK ALL WHO SELECT FOUR OR MORE OPTIONS AT FOODISSB] FOODISSB2 Which of these food issues are you most concerned about, if any? Please select up to three food issues that you are most concerned about [PULL ANSWERS THAT ARE SELECTED AT FOODISSB] [TIMESTAMP7] [FOOD SYSTEM] [ASK ALL] FOODCONF How confident are you that… FOODCONF_a ...the food you buy is safe to eat FOODCONF_b …the information on food labels is accurate (e.g. ingredients, nutritional
information, country of origin)
Please select one answer only for each statement 1. Very confident 2. Fairly confident 3. Not very confident 4. Not at all confident 5. It varies 6. Don’t know
[ASK ALL] FOODSUPPLY How confident are you in the food supply chain? That is all the processes involved in bringing food to your table. Please select one answer only for each statement
1. Very confident 2. Somewhat confident 3. Not very confident 4. Not at all confident 5. It varies 6. Don’t know
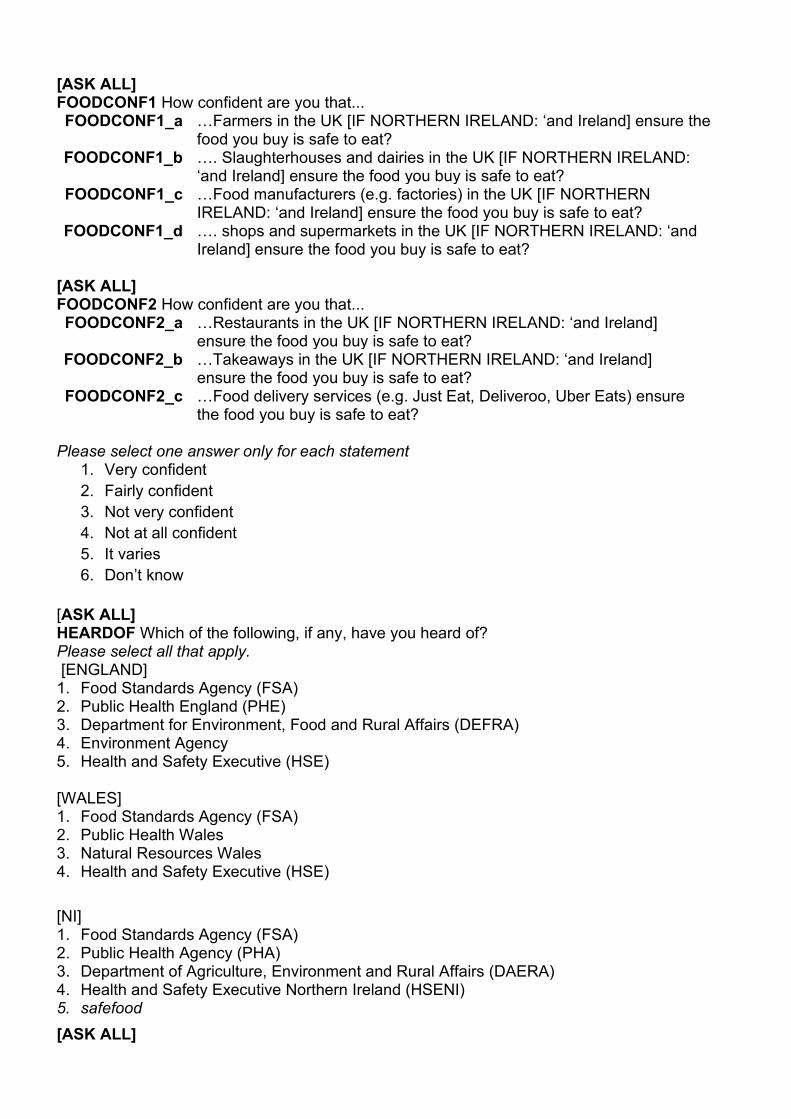
[ASK ALL] FOODCONF1 How confident are you that... FOODCONF1_a …Farmers in the UK [IF NORTHERN IRELAND: ‘and Ireland] ensure the
food you buy is safe to eat? FOODCONF1_b …. Slaughterhouses and dairies in the UK [IF NORTHERN IRELAND:
‘and Ireland] ensure the food you buy is safe to eat? FOODCONF1_c …Food manufacturers (e.g. factories) in the UK [IF NORTHERN
IRELAND: ‘and Ireland] ensure the food you buy is safe to eat? FOODCONF1_d …. shops and supermarkets in the UK [IF NORTHERN IRELAND: ‘and
Ireland] ensure the food you buy is safe to eat? [ASK ALL] FOODCONF2 How confident are you that... FOODCONF2_a …Restaurants in the UK [IF NORTHERN IRELAND: ‘and Ireland]
ensure the food you buy is safe to eat? FOODCONF2_b …Takeaways in the UK [IF NORTHERN IRELAND: ‘and Ireland]
ensure the food you buy is safe to eat? FOODCONF2_c …Food delivery services (e.g. Just Eat, Deliveroo, Uber Eats) ensure
the food you buy is safe to eat? Please select one answer only for each statement
1. Very confident 2. Fairly confident 3. Not very confident 4. Not at all confident 5. It varies 6. Don’t know
[ASK ALL] HEARDOF Which of the following, if any, have you heard of? Please select all that apply. [ENGLAND] 1. Food Standards Agency (FSA) 2. Public Health England (PHE) 3. Department for Environment, Food and Rural Affairs (DEFRA) 4. Environment Agency 5. Health and Safety Executive (HSE)
[WALES] 1. Food Standards Agency (FSA) 2. Public Health Wales 3. Natural Resources Wales 4. Health and Safety Executive (HSE)
[NI] 1. Food Standards Agency (FSA) 2. Public Health Agency (PHA) 3. Department of Agriculture, Environment and Rural Affairs (DAERA) 4. Health and Safety Executive Northern Ireland (HSENI) 5. safefood [ASK ALL]
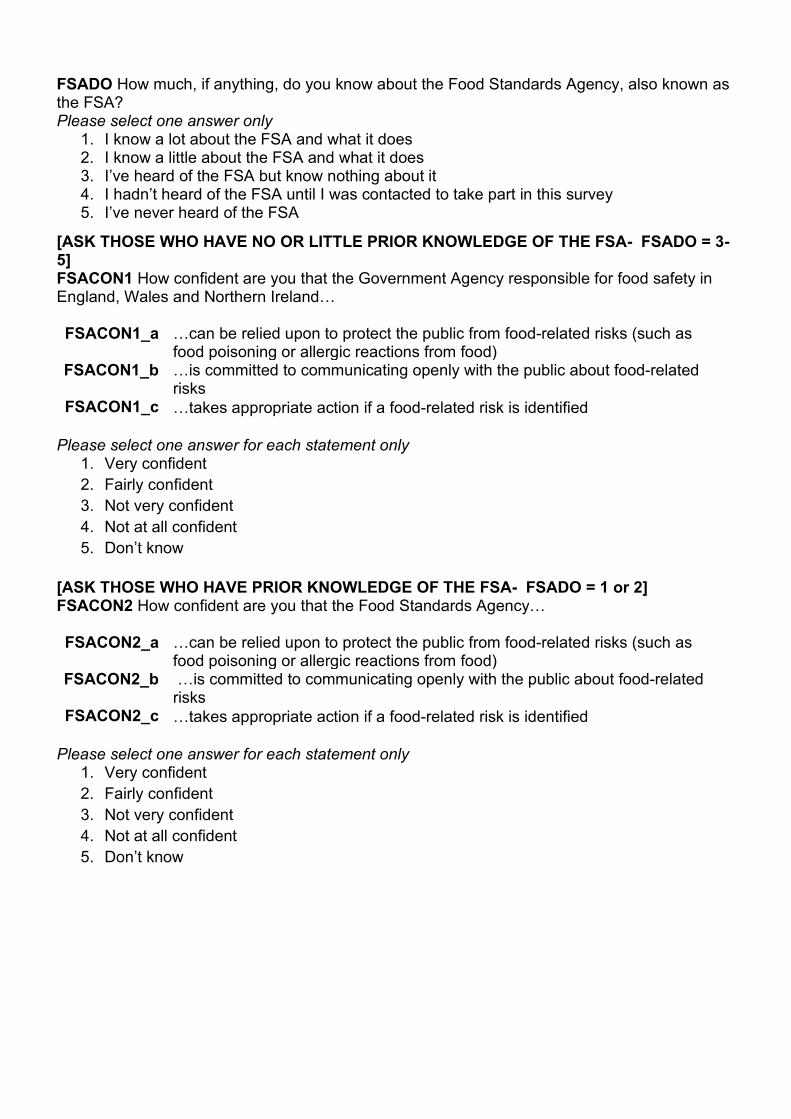
FSADO How much, if anything, do you know about the Food Standards Agency, also known as the FSA? Please select one answer only
1. I know a lot about the FSA and what it does 2. I know a little about the FSA and what it does 3. I’ve heard of the FSA but know nothing about it 4. I hadn’t heard of the FSA until I was contacted to take part in this survey 5. I’ve never heard of the FSA
[ASK THOSE WHO HAVE NO OR LITTLE PRIOR KNOWLEDGE OF THE FSA- FSADO = 3-5] FSACON1 How confident are you that the Government Agency responsible for food safety in England, Wales and Northern Ireland… FSACON1_a …can be relied upon to protect the public from food-related risks (such as
food poisoning or allergic reactions from food) FSACON1_b …is committed to communicating openly with the public about food-related
risks FSACON1_c …takes appropriate action if a food-related risk is identified
Please select one answer for each statement only
1. Very confident 2. Fairly confident 3. Not very confident 4. Not at all confident 5. Don’t know
[ASK THOSE WHO HAVE PRIOR KNOWLEDGE OF THE FSA- FSADO = 1 or 2] FSACON2 How confident are you that the Food Standards Agency… FSACON2_a …can be relied upon to protect the public from food-related risks (such as
food poisoning or allergic reactions from food) FSACON2_b …is committed to communicating openly with the public about food-related
risks FSACON2_c …takes appropriate action if a food-related risk is identified
Please select one answer for each statement only
1. Very confident 2. Fairly confident 3. Not very confident 4. Not at all confident 5. Don’t know
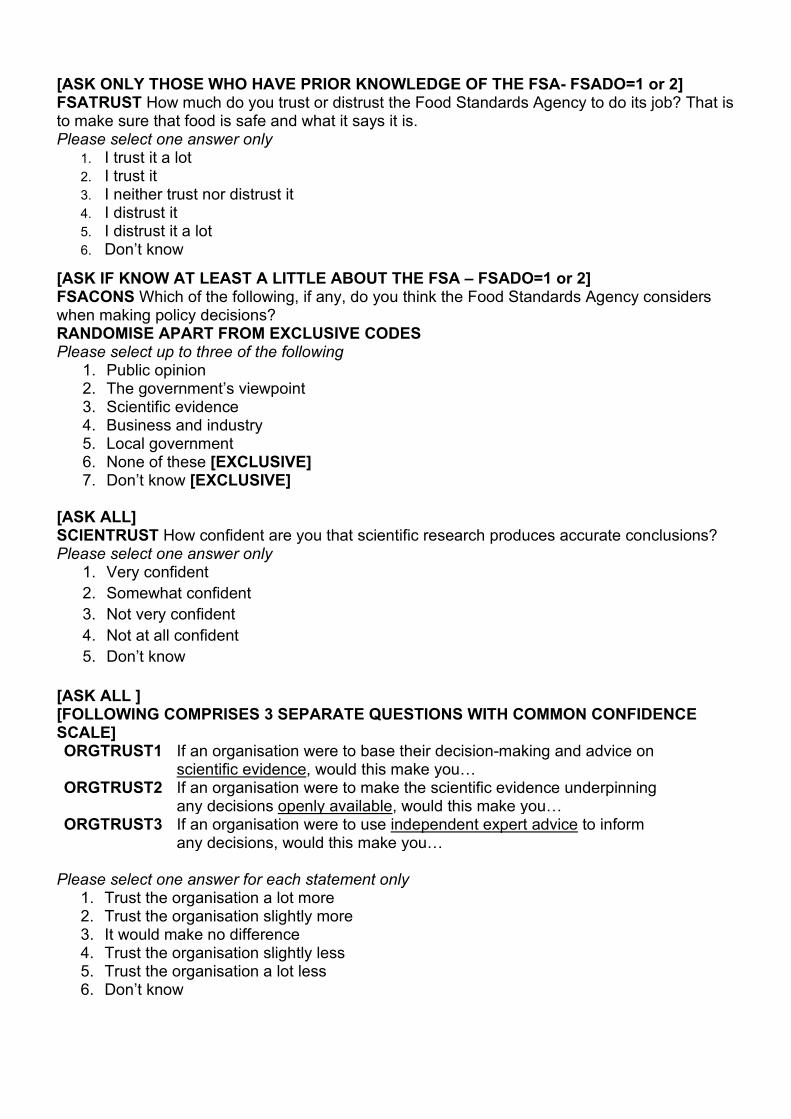
[ASK ONLY THOSE WHO HAVE PRIOR KNOWLEDGE OF THE FSA- FSADO=1 or 2] FSATRUST How much do you trust or distrust the Food Standards Agency to do its job? That is to make sure that food is safe and what it says it is. Please select one answer only
1. I trust it a lot 2. I trust it 3. I neither trust nor distrust it 4. I distrust it 5. I distrust it a lot 6. Don’t know
[ASK IF KNOW AT LEAST A LITTLE ABOUT THE FSA – FSADO=1 or 2] FSACONS Which of the following, if any, do you think the Food Standards Agency considers when making policy decisions? RANDOMISE APART FROM EXCLUSIVE CODES Please select up to three of the following
1. Public opinion 2. The government’s viewpoint 3. Scientific evidence 4. Business and industry 5. Local government 6. None of these [EXCLUSIVE] 7. Don’t know [EXCLUSIVE]
[ASK ALL] SCIENTRUST How confident are you that scientific research produces accurate conclusions? Please select one answer only
1. Very confident 2. Somewhat confident 3. Not very confident 4. Not at all confident 5. Don’t know
[ASK ALL ] [FOLLOWING COMPRISES 3 SEPARATE QUESTIONS WITH COMMON CONFIDENCE SCALE] ORGTRUST1 If an organisation were to base their decision-making and advice on
scientific evidence, would this make you… ORGTRUST2 If an organisation were to make the scientific evidence underpinning
any decisions openly available, would this make you… ORGTRUST3
If an organisation were to use independent expert advice to inform any decisions, would this make you…
Please select one answer for each statement only
1. Trust the organisation a lot more 2. Trust the organisation slightly more 3. It would make no difference 4. Trust the organisation slightly less 5. Trust the organisation a lot less 6. Don’t know
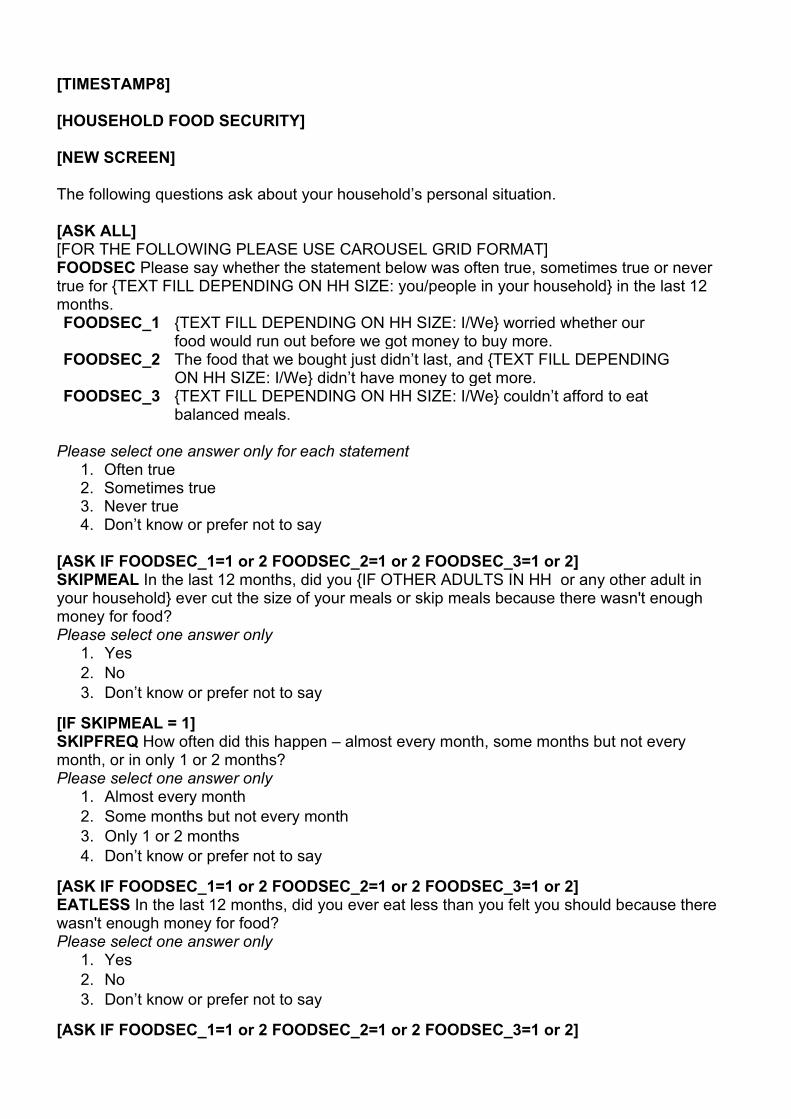
[TIMESTAMP8] [HOUSEHOLD FOOD SECURITY] [NEW SCREEN] The following questions ask about your household’s personal situation. [ASK ALL] [FOR THE FOLLOWING PLEASE USE CAROUSEL GRID FORMAT] FOODSEC Please say whether the statement below was often true, sometimes true or never true for {TEXT FILL DEPENDING ON HH SIZE: you/people in your household} in the last 12 months. FOODSEC_1 {TEXT FILL DEPENDING ON HH SIZE: I/We} worried whether our
food would run out before we got money to buy more. FOODSEC_2
The food that we bought just didn’t last, and {TEXT FILL DEPENDING ON HH SIZE: I/We} didn’t have money to get more.
FOODSEC_3
{TEXT FILL DEPENDING ON HH SIZE: I/We} couldn’t afford to eat balanced meals.
Please select one answer only for each statement
1. Often true 2. Sometimes true 3. Never true 4. Don’t know or prefer not to say
[ASK IF FOODSEC_1=1 or 2 FOODSEC_2=1 or 2 FOODSEC_3=1 or 2] SKIPMEAL In the last 12 months, did you {IF OTHER ADULTS IN HH or any other adult in your household} ever cut the size of your meals or skip meals because there wasn't enough money for food? Please select one answer only
1. Yes 2. No 3. Don’t know or prefer not to say
[IF SKIPMEAL = 1] SKIPFREQ How often did this happen – almost every month, some months but not every month, or in only 1 or 2 months? Please select one answer only
1. Almost every month 2. Some months but not every month 3. Only 1 or 2 months 4. Don’t know or prefer not to say
[ASK IF FOODSEC_1=1 or 2 FOODSEC_2=1 or 2 FOODSEC_3=1 or 2] EATLESS In the last 12 months, did you ever eat less than you felt you should because there wasn't enough money for food? Please select one answer only
1. Yes 2. No 3. Don’t know or prefer not to say
[ASK IF FOODSEC_1=1 or 2 FOODSEC_2=1 or 2 FOODSEC_3=1 or 2]
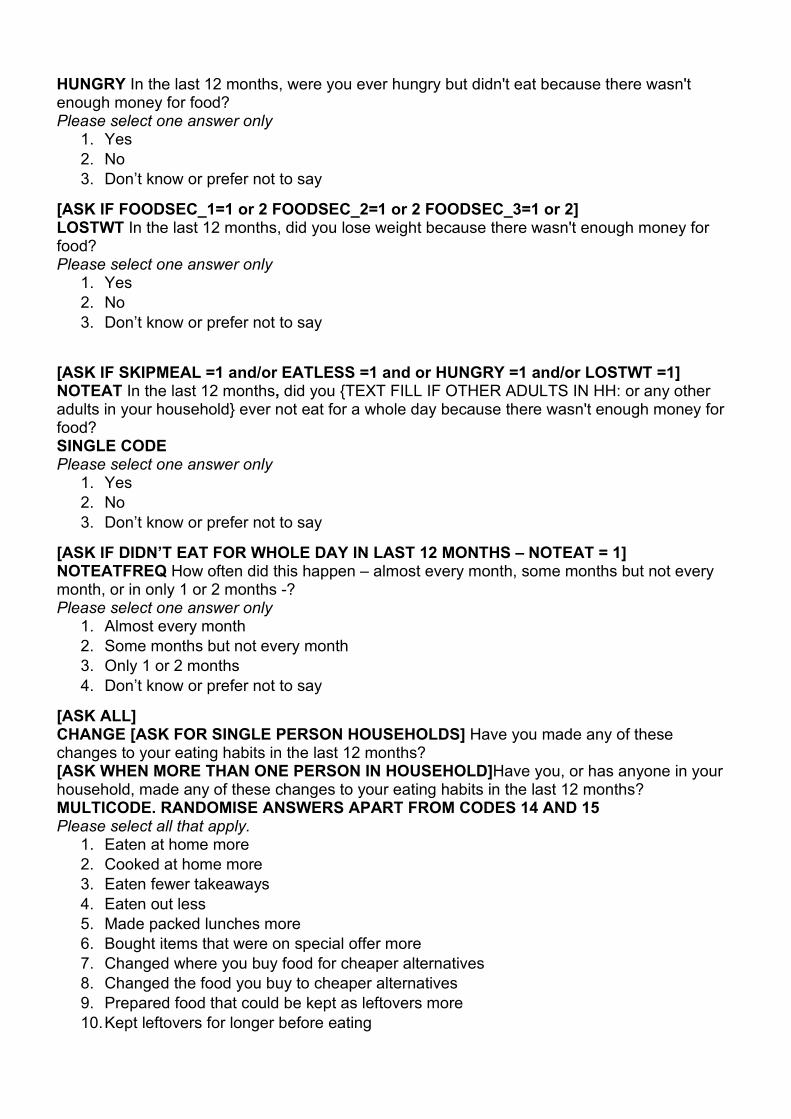
HUNGRY In the last 12 months, were you ever hungry but didn't eat because there wasn't enough money for food? Please select one answer only
1. Yes 2. No 3. Don’t know or prefer not to say
[ASK IF FOODSEC_1=1 or 2 FOODSEC_2=1 or 2 FOODSEC_3=1 or 2] LOSTWT In the last 12 months, did you lose weight because there wasn't enough money for food? Please select one answer only
1. Yes 2. No 3. Don’t know or prefer not to say
[ASK IF SKIPMEAL =1 and/or EATLESS =1 and or HUNGRY =1 and/or LOSTWT =1] NOTEAT In the last 12 months, did you {TEXT FILL IF OTHER ADULTS IN HH: or any other adults in your household} ever not eat for a whole day because there wasn't enough money for food? SINGLE CODE Please select one answer only
1. Yes 2. No 3. Don’t know or prefer not to say
[ASK IF DIDN’T EAT FOR WHOLE DAY IN LAST 12 MONTHS – NOTEAT = 1] NOTEATFREQ How often did this happen – almost every month, some months but not every month, or in only 1 or 2 months -? Please select one answer only
1. Almost every month 2. Some months but not every month 3. Only 1 or 2 months 4. Don’t know or prefer not to say
[ASK ALL] CHANGE [ASK FOR SINGLE PERSON HOUSEHOLDS] Have you made any of these changes to your eating habits in the last 12 months? [ASK WHEN MORE THAN ONE PERSON IN HOUSEHOLD]Have you, or has anyone in your household, made any of these changes to your eating habits in the last 12 months? MULTICODE. RANDOMISE ANSWERS APART FROM CODES 14 AND 15 Please select all that apply.
1. Eaten at home more 2. Cooked at home more 3. Eaten fewer takeaways 4. Eaten out less 5. Made packed lunches more 6. Bought items that were on special offer more 7. Changed where you buy food for cheaper alternatives 8. Changed the food you buy to cheaper alternatives 9. Prepared food that could be kept as leftovers more 10. Kept leftovers for longer before eating
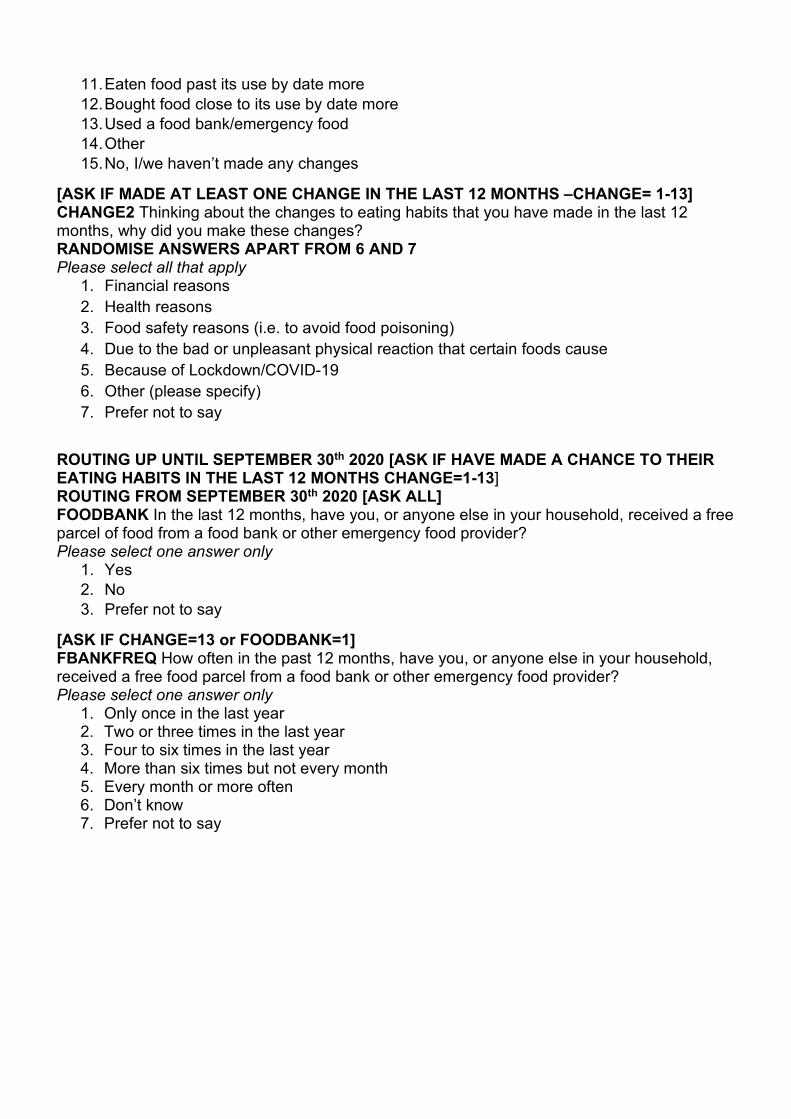
11. Eaten food past its use by date more 12. Bought food close to its use by date more 13. Used a food bank/emergency food 14. Other 15. No, I/we haven’t made any changes
[ASK IF MADE AT LEAST ONE CHANGE IN THE LAST 12 MONTHS –CHANGE= 1-13] CHANGE2 Thinking about the changes to eating habits that you have made in the last 12 months, why did you make these changes? RANDOMISE ANSWERS APART FROM 6 AND 7 Please select all that apply
1. Financial reasons 2. Health reasons 3. Food safety reasons (i.e. to avoid food poisoning) 4. Due to the bad or unpleasant physical reaction that certain foods cause 5. Because of Lockdown/COVID-19 6. Other (please specify) 7. Prefer not to say
ROUTING UP UNTIL SEPTEMBER 30th 2020 [ASK IF HAVE MADE A CHANCE TO THEIR EATING HABITS IN THE LAST 12 MONTHS CHANGE=1-13] ROUTING FROM SEPTEMBER 30th 2020 [ASK ALL] FOODBANK In the last 12 months, have you, or anyone else in your household, received a free parcel of food from a food bank or other emergency food provider? Please select one answer only
1. Yes 2. No 3. Prefer not to say
[ASK IF CHANGE=13 or FOODBANK=1] FBANKFREQ How often in the past 12 months, have you, or anyone else in your household, received a free food parcel from a food bank or other emergency food provider? Please select one answer only
1. Only once in the last year 2. Two or three times in the last year 3. Four to six times in the last year 4. More than six times but not every month 5. Every month or more often 6. Don’t know 7. Prefer not to say
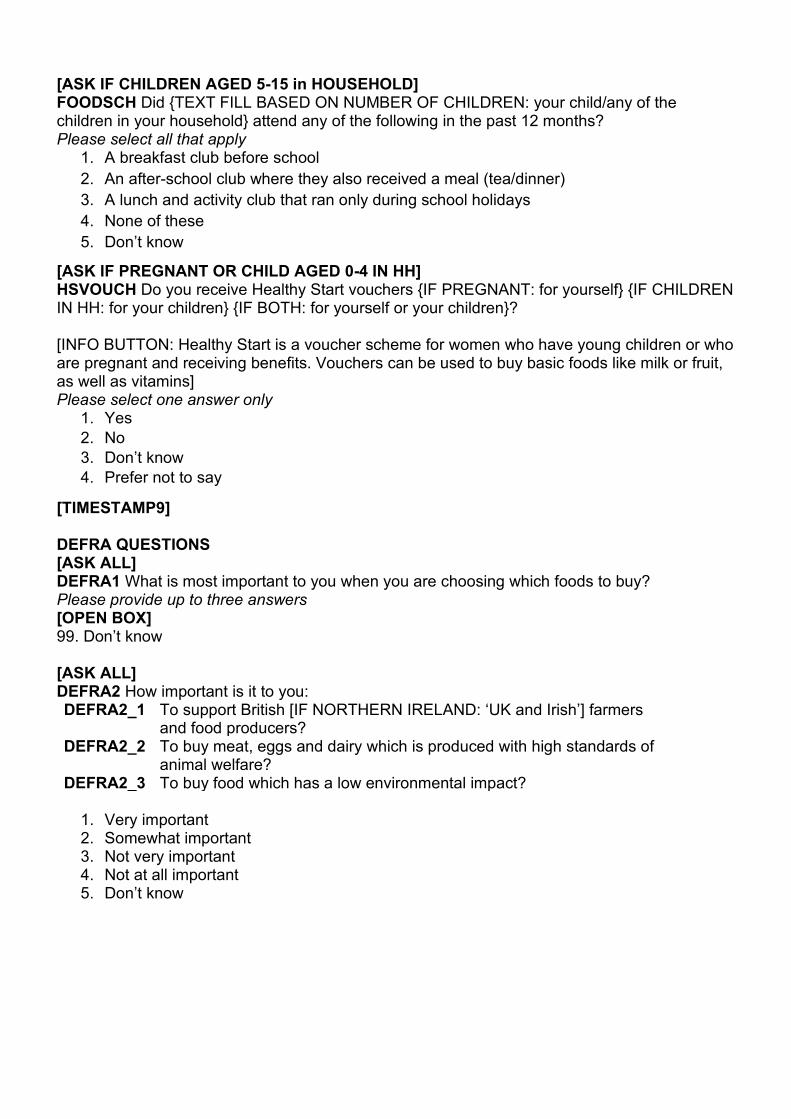
[ASK IF CHILDREN AGED 5-15 in HOUSEHOLD] FOODSCH Did {TEXT FILL BASED ON NUMBER OF CHILDREN: your child/any of the children in your household} attend any of the following in the past 12 months? Please select all that apply
1. A breakfast club before school 2. An after-school club where they also received a meal (tea/dinner) 3. A lunch and activity club that ran only during school holidays 4. None of these 5. Don’t know
[ASK IF PREGNANT OR CHILD AGED 0-4 IN HH] HSVOUCH Do you receive Healthy Start vouchers {IF PREGNANT: for yourself} {IF CHILDREN IN HH: for your children} {IF BOTH: for yourself or your children}? [INFO BUTTON: Healthy Start is a voucher scheme for women who have young children or who are pregnant and receiving benefits. Vouchers can be used to buy basic foods like milk or fruit, as well as vitamins] Please select one answer only
1. Yes 2. No 3. Don’t know 4. Prefer not to say
[TIMESTAMP9] DEFRA QUESTIONS [ASK ALL] DEFRA1 What is most important to you when you are choosing which foods to buy? Please provide up to three answers [OPEN BOX] 99. Don’t know [ASK ALL] DEFRA2 How important is it to you: DEFRA2_1 To support British [IF NORTHERN IRELAND: ‘UK and Irish’] farmers
and food producers? DEFRA2_2 To buy meat, eggs and dairy which is produced with high standards of
animal welfare? DEFRA2_3 To buy food which has a low environmental impact?
1. Very important 2. Somewhat important 3. Not very important 4. Not at all important 5. Don’t know
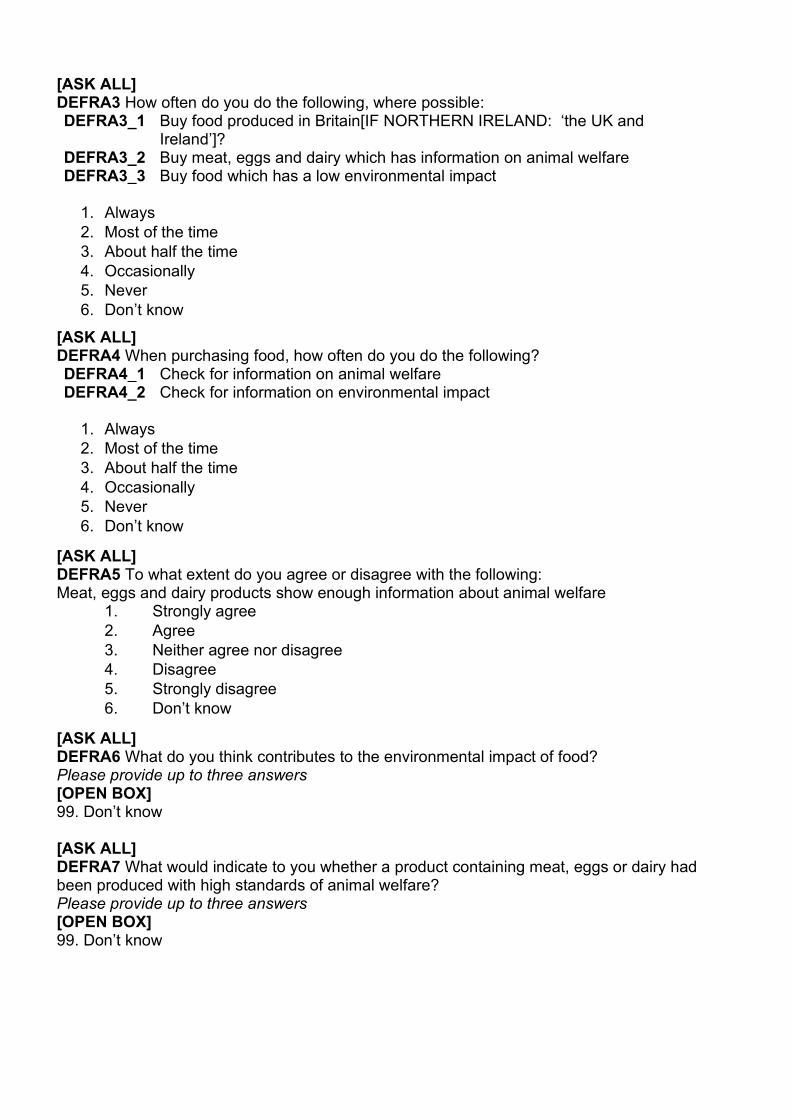
[ASK ALL] DEFRA3 How often do you do the following, where possible: DEFRA3_1 Buy food produced in Britain[IF NORTHERN IRELAND: ‘the UK and
Ireland’]? DEFRA3_2 Buy meat, eggs and dairy which has information on animal welfare DEFRA3_3 Buy food which has a low environmental impact
1. Always 2. Most of the time 3. About half the time 4. Occasionally 5. Never 6. Don’t know
[ASK ALL] DEFRA4 When purchasing food, how often do you do the following? DEFRA4_1 Check for information on animal welfare DEFRA4_2 Check for information on environmental impact
1. Always 2. Most of the time 3. About half the time 4. Occasionally 5. Never 6. Don’t know
[ASK ALL] DEFRA5 To what extent do you agree or disagree with the following: Meat, eggs and dairy products show enough information about animal welfare
1. Strongly agree 2. Agree 3. Neither agree nor disagree 4. Disagree 5. Strongly disagree 6. Don’t know
[ASK ALL] DEFRA6 What do you think contributes to the environmental impact of food? Please provide up to three answers [OPEN BOX] 99. Don’t know [ASK ALL] DEFRA7 What would indicate to you whether a product containing meat, eggs or dairy had been produced with high standards of animal welfare? Please provide up to three answers [OPEN BOX] 99. Don’t know
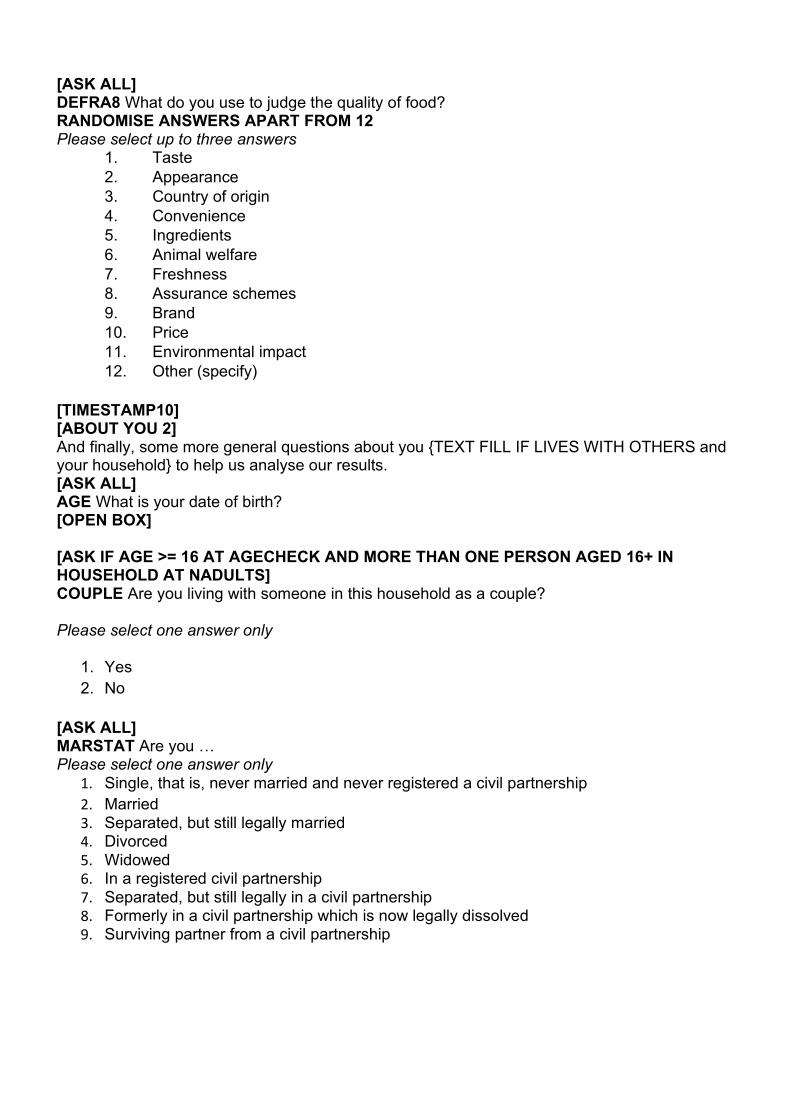
[ASK ALL] DEFRA8 What do you use to judge the quality of food? RANDOMISE ANSWERS APART FROM 12 Please select up to three answers
1. Taste 2. Appearance 3. Country of origin 4. Convenience 5. Ingredients 6. Animal welfare 7. Freshness 8. Assurance schemes 9. Brand 10. Price 11. Environmental impact 12. Other (specify)
[TIMESTAMP10] [ABOUT YOU 2] And finally, some more general questions about you {TEXT FILL IF LIVES WITH OTHERS and your household} to help us analyse our results. [ASK ALL] AGE What is your date of birth? [OPEN BOX] [ASK IF AGE >= 16 AT AGECHECK AND MORE THAN ONE PERSON AGED 16+ IN HOUSEHOLD AT NADULTS] COUPLE Are you living with someone in this household as a couple? Please select one answer only
1. Yes 2. No
[ASK ALL] MARSTAT Are you … Please select one answer only
1. Single, that is, never married and never registered a civil partnership 2. Married 3. Separated, but still legally married 4. Divorced 5. Widowed 6. In a registered civil partnership 7. Separated, but still legally in a civil partnership 8. Formerly in a civil partnership which is now legally dissolved 9. Surviving partner from a civil partnership
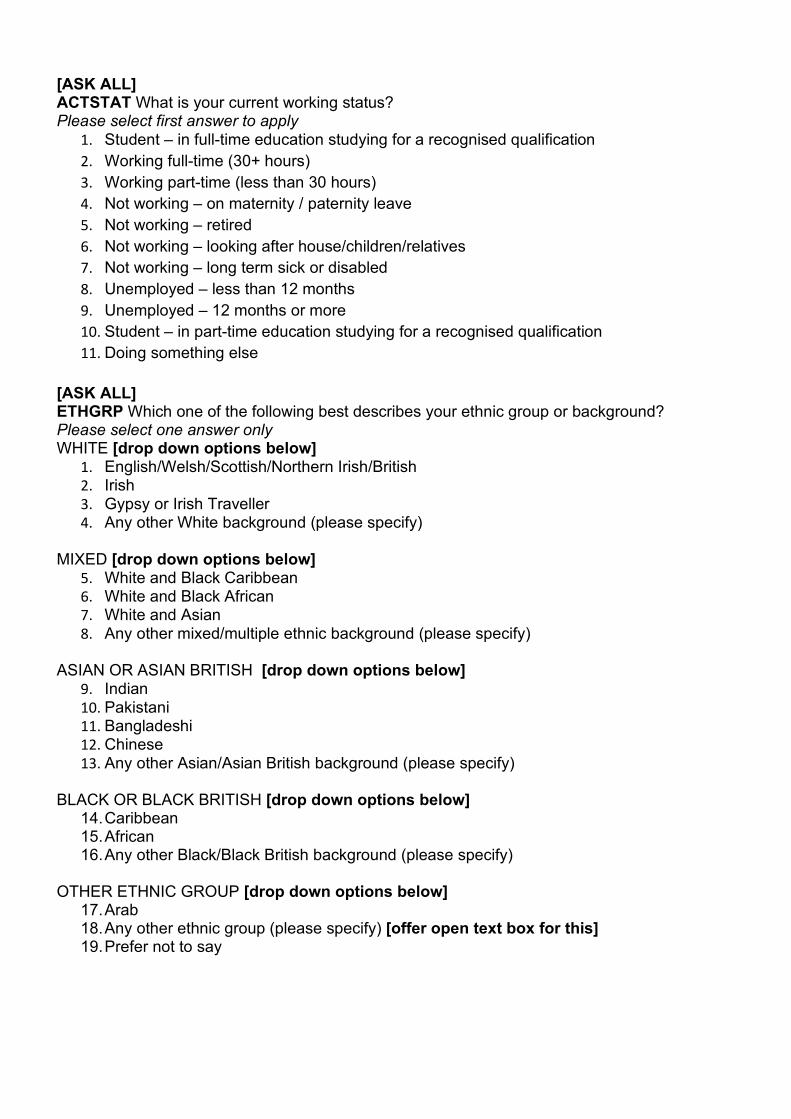
[ASK ALL] ACTSTAT What is your current working status? Please select first answer to apply
1. Student – in full-time education studying for a recognised qualification 2. Working full-time (30+ hours) 3. Working part-time (less than 30 hours) 4. Not working – on maternity / paternity leave 5. Not working – retired 6. Not working – looking after house/children/relatives 7. Not working – long term sick or disabled 8. Unemployed – less than 12 months 9. Unemployed – 12 months or more 10. Student – in part-time education studying for a recognised qualification 11. Doing something else
[ASK ALL] ETHGRP Which one of the following best describes your ethnic group or background? Please select one answer only WHITE [drop down options below]
1. English/Welsh/Scottish/Northern Irish/British 2. Irish 3. Gypsy or Irish Traveller 4. Any other White background (please specify)
MIXED [drop down options below] 5. White and Black Caribbean 6. White and Black African 7. White and Asian 8. Any other mixed/multiple ethnic background (please specify)
ASIAN OR ASIAN BRITISH [drop down options below]
9. Indian 10. Pakistani 11. Bangladeshi 12. Chinese 13. Any other Asian/Asian British background (please specify)
BLACK OR BLACK BRITISH [drop down options below]
14. Caribbean 15. African 16. Any other Black/Black British background (please specify)
OTHER ETHNIC GROUP [drop down options below]
17. Arab 18. Any other ethnic group (please specify) [offer open text box for this] 19. Prefer not to say
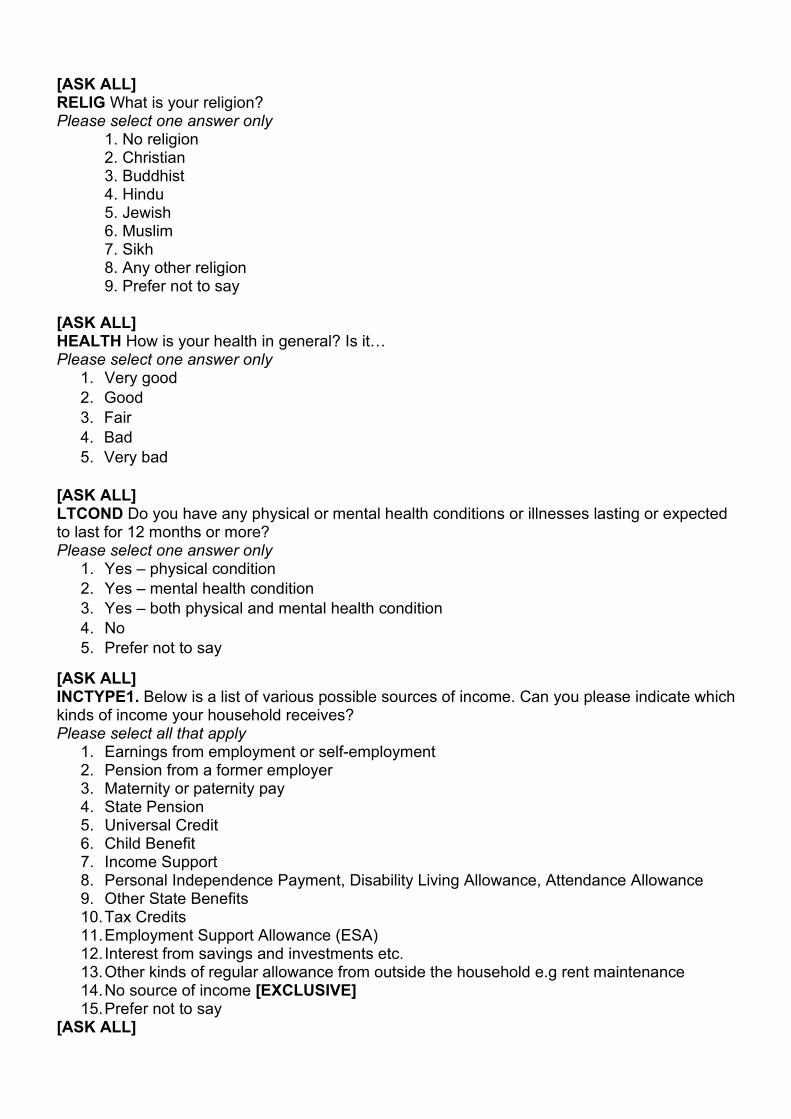
[ASK ALL] RELIG What is your religion? Please select one answer only
1. No religion 2. Christian 3. Buddhist 4. Hindu 5. Jewish 6. Muslim 7. Sikh 8. Any other religion 9. Prefer not to say
[ASK ALL] HEALTH How is your health in general? Is it… Please select one answer only
1. Very good 2. Good 3. Fair 4. Bad 5. Very bad
[ASK ALL] LTCOND Do you have any physical or mental health conditions or illnesses lasting or expected to last for 12 months or more? Please select one answer only
1. Yes – physical condition 2. Yes – mental health condition 3. Yes – both physical and mental health condition 4. No 5. Prefer not to say
[ASK ALL] INCTYPE1. Below is a list of various possible sources of income. Can you please indicate which kinds of income your household receives? Please select all that apply
1. Earnings from employment or self-employment 2. Pension from a former employer 3. Maternity or paternity pay 4. State Pension 5. Universal Credit 6. Child Benefit 7. Income Support 8. Personal Independence Payment, Disability Living Allowance, Attendance Allowance 9. Other State Benefits 10. Tax Credits 11. Employment Support Allowance (ESA) 12. Interest from savings and investments etc. 13. Other kinds of regular allowance from outside the household e.g rent maintenance 14. No source of income [EXCLUSIVE] 15. Prefer not to say
[ASK ALL]
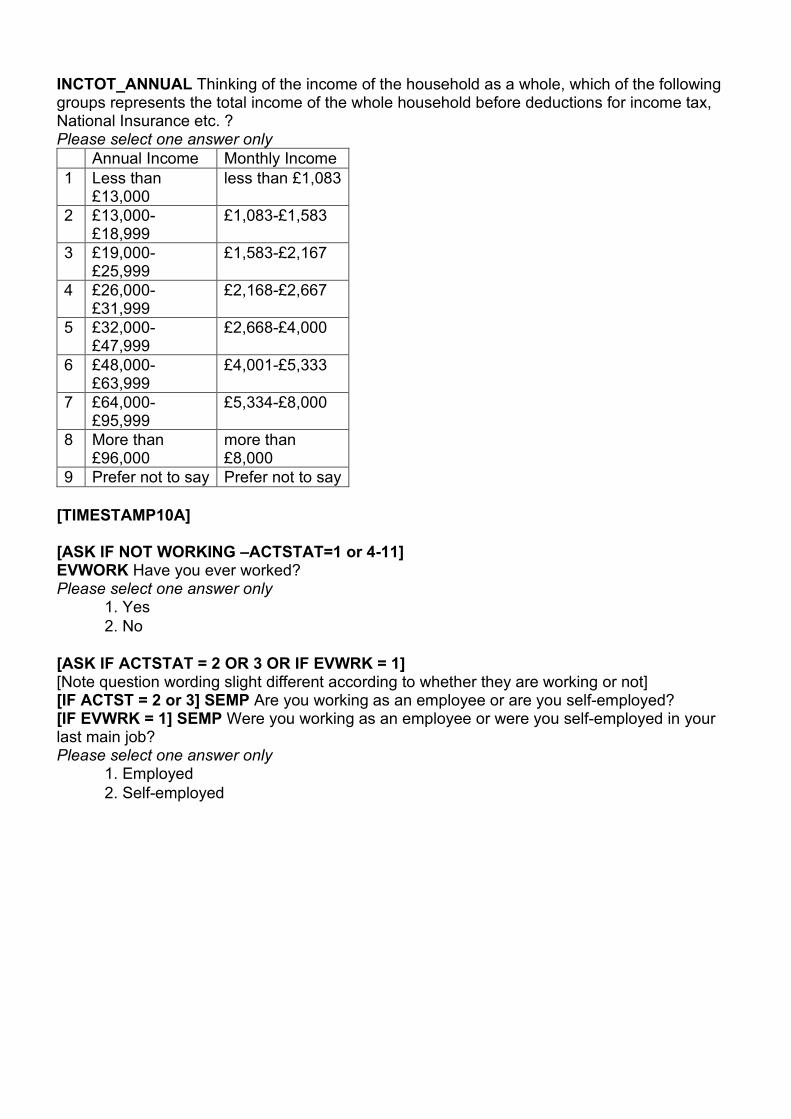
INCTOT_ANNUAL Thinking of the income of the household as a whole, which of the following groups represents the total income of the whole household before deductions for income tax, National Insurance etc. ? Please select one answer only Annual Income Monthly Income 1 Less than
£13,000 less than £1,083
2 £13,000-£18,999
£1,083-£1,583
3 £19,000-£25,999
£1,583-£2,167
4 £26,000-£31,999
£2,168-£2,667
5 £32,000-£47,999
£2,668-£4,000
6 £48,000-£63,999
£4,001-£5,333
7 £64,000-£95,999
£5,334-£8,000
8 More than £96,000
more than £8,000
9 Prefer not to say Prefer not to say [TIMESTAMP10A] [ASK IF NOT WORKING –ACTSTAT=1 or 4-11] EVWORK Have you ever worked? Please select one answer only
1. Yes 2. No
[ASK IF ACTSTAT = 2 OR 3 OR IF EVWRK = 1] [Note question wording slight different according to whether they are working or not] [IF ACTST = 2 or 3] SEMP Are you working as an employee or are you self-employed? [IF EVWRK = 1] SEMP Were you working as an employee or were you self-employed in your last main job? Please select one answer only
1. Employed 2. Self-employed
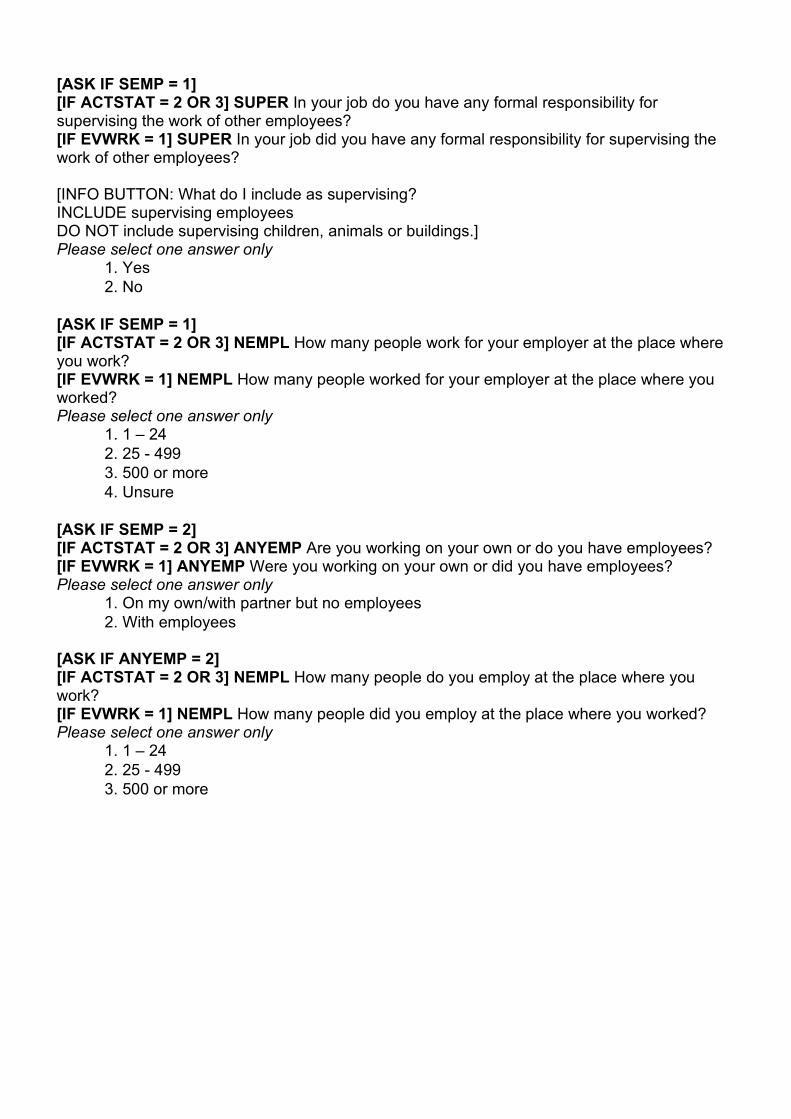
[ASK IF SEMP = 1] [IF ACTSTAT = 2 OR 3] SUPER In your job do you have any formal responsibility for supervising the work of other employees? [IF EVWRK = 1] SUPER In your job did you have any formal responsibility for supervising the work of other employees? [INFO BUTTON: What do I include as supervising? INCLUDE supervising employees DO NOT include supervising children, animals or buildings.] Please select one answer only
1. Yes 2. No
[ASK IF SEMP = 1] [IF ACTSTAT = 2 OR 3] NEMPL How many people work for your employer at the place where you work? [IF EVWRK = 1] NEMPL How many people worked for your employer at the place where you worked? Please select one answer only
1. 1 – 24 2. 25 - 499 3. 500 or more 4. Unsure
[ASK IF SEMP = 2] [IF ACTSTAT = 2 OR 3] ANYEMP Are you working on your own or do you have employees? [IF EVWRK = 1] ANYEMP Were you working on your own or did you have employees? Please select one answer only
1. On my own/with partner but no employees 2. With employees
[ASK IF ANYEMP = 2] [IF ACTSTAT = 2 OR 3] NEMPL How many people do you employ at the place where you work? [IF EVWRK = 1] NEMPL How many people did you employ at the place where you worked? Please select one answer only
1. 1 – 24 2. 25 - 499 3. 500 or more
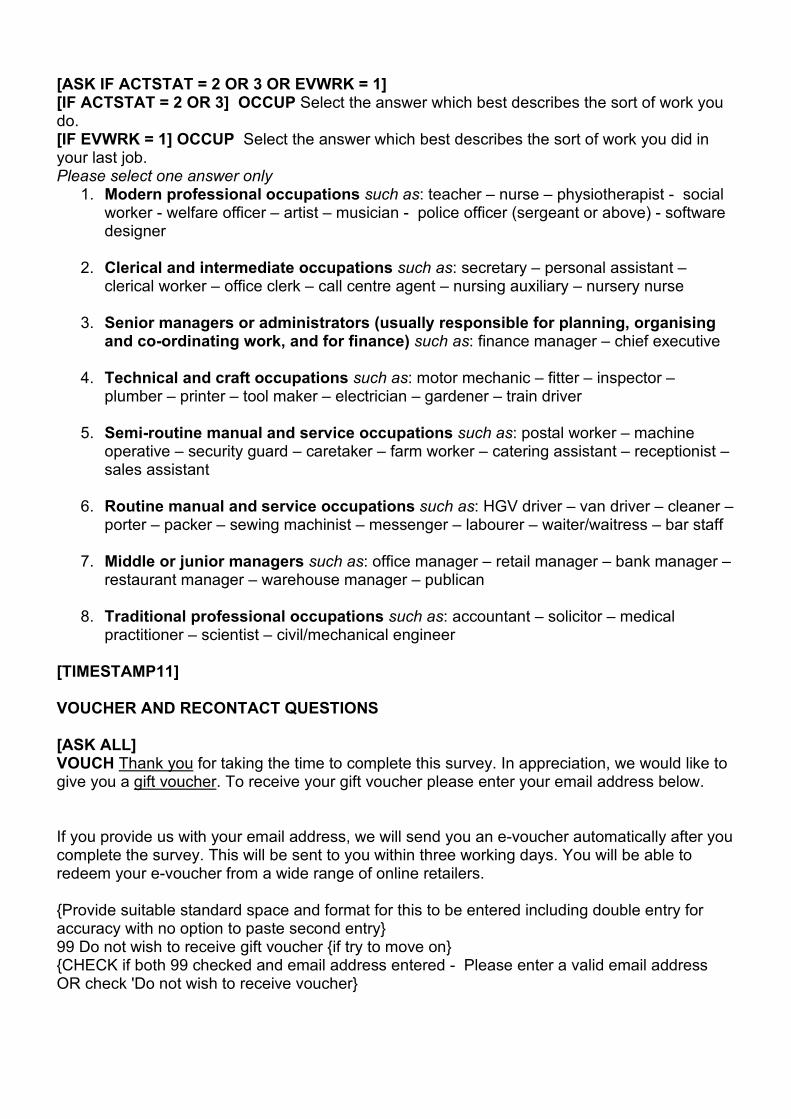
[ASK IF ACTSTAT = 2 OR 3 OR EVWRK = 1] [IF ACTSTAT = 2 OR 3] OCCUP Select the answer which best describes the sort of work you do. [IF EVWRK = 1] OCCUP Select the answer which best describes the sort of work you did in your last job. Please select one answer only
1. Modern professional occupations such as: teacher – nurse – physiotherapist - social worker - welfare officer – artist – musician - police officer (sergeant or above) - software designer
2. Clerical and intermediate occupations such as: secretary – personal assistant –
clerical worker – office clerk – call centre agent – nursing auxiliary – nursery nurse
3. Senior managers or administrators (usually responsible for planning, organising and co-ordinating work, and for finance) such as: finance manager – chief executive
4. Technical and craft occupations such as: motor mechanic – fitter – inspector –
plumber – printer – tool maker – electrician – gardener – train driver
5. Semi-routine manual and service occupations such as: postal worker – machine operative – security guard – caretaker – farm worker – catering assistant – receptionist – sales assistant
6. Routine manual and service occupations such as: HGV driver – van driver – cleaner –
porter – packer – sewing machinist – messenger – labourer – waiter/waitress – bar staff
7. Middle or junior managers such as: office manager – retail manager – bank manager – restaurant manager – warehouse manager – publican
8. Traditional professional occupations such as: accountant – solicitor – medical
practitioner – scientist – civil/mechanical engineer [TIMESTAMP11] VOUCHER AND RECONTACT QUESTIONS [ASK ALL] VOUCH Thank you for taking the time to complete this survey. In appreciation, we would like to give you a gift voucher. To receive your gift voucher please enter your email address below.
If you provide us with your email address, we will send you an e-voucher automatically after you complete the survey. This will be sent to you within three working days. You will be able to redeem your e-voucher from a wide range of online retailers. {Provide suitable standard space and format for this to be entered including double entry for accuracy with no option to paste second entry} 99 Do not wish to receive gift voucher {if try to move on} {CHECK if both 99 checked and email address entered - Please enter a valid email address OR check 'Do not wish to receive voucher}
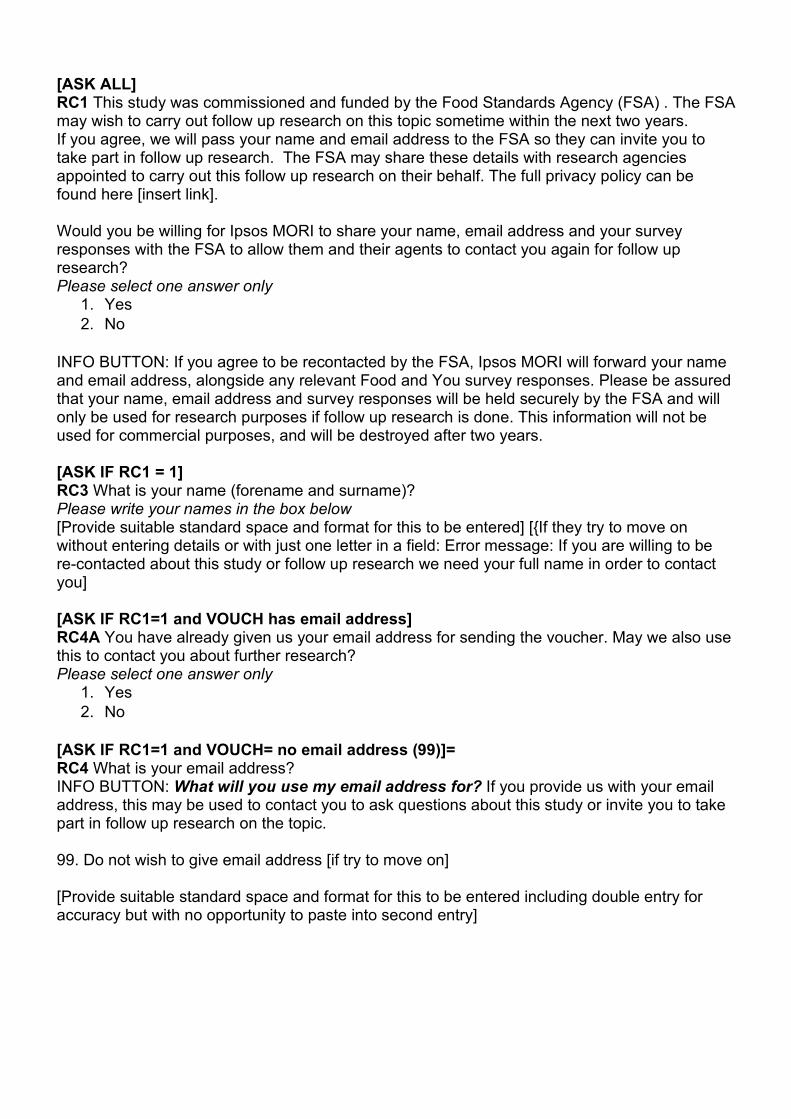
[ASK ALL] RC1 This study was commissioned and funded by the Food Standards Agency (FSA) . The FSA may wish to carry out follow up research on this topic sometime within the next two years. If you agree, we will pass your name and email address to the FSA so they can invite you to take part in follow up research. The FSA may share these details with research agencies appointed to carry out this follow up research on their behalf. The full privacy policy can be found here [insert link]. Would you be willing for Ipsos MORI to share your name, email address and your survey responses with the FSA to allow them and their agents to contact you again for follow up research? Please select one answer only
1. Yes 2. No
INFO BUTTON: If you agree to be recontacted by the FSA, Ipsos MORI will forward your name and email address, alongside any relevant Food and You survey responses. Please be assured that your name, email address and survey responses will be held securely by the FSA and will only be used for research purposes if follow up research is done. This information will not be used for commercial purposes, and will be destroyed after two years. [ASK IF RC1 = 1] RC3 What is your name (forename and surname)? Please write your names in the box below [Provide suitable standard space and format for this to be entered] [{If they try to move on without entering details or with just one letter in a field: Error message: If you are willing to be re-contacted about this study or follow up research we need your full name in order to contact you] [ASK IF RC1=1 and VOUCH has email address] RC4A You have already given us your email address for sending the voucher. May we also use this to contact you about further research? Please select one answer only
1. Yes 2. No
[ASK IF RC1=1 and VOUCH= no email address (99)]= RC4 What is your email address? INFO BUTTON: What will you use my email address for? If you provide us with your email address, this may be used to contact you to ask questions about this study or invite you to take part in follow up research on the topic. 99. Do not wish to give email address [if try to move on] [Provide suitable standard space and format for this to be entered including double entry for accuracy but with no opportunity to paste into second entry]
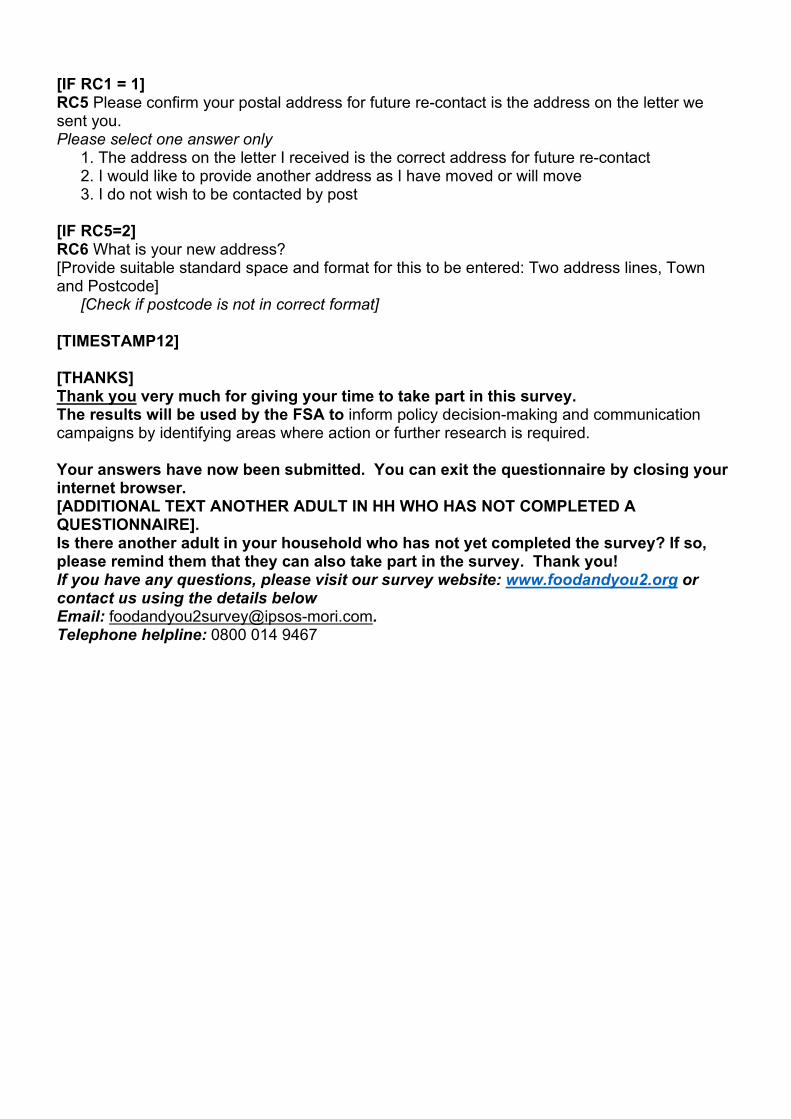
[IF RC1 = 1] RC5 Please confirm your postal address for future re-contact is the address on the letter we sent you. Please select one answer only
1. The address on the letter I received is the correct address for future re-contact 2. I would like to provide another address as I have moved or will move 3. I do not wish to be contacted by post
[IF RC5=2] RC6 What is your new address? [Provide suitable standard space and format for this to be entered: Two address lines, Town and Postcode]
[Check if postcode is not in correct format]
[TIMESTAMP12] [THANKS] Thank you very much for giving your time to take part in this survey. The results will be used by the FSA to inform policy decision-making and communication campaigns by identifying areas where action or further research is required. Your answers have now been submitted. You can exit the questionnaire by closing your internet browser. [ADDITIONAL TEXT ANOTHER ADULT IN HH WHO HAS NOT COMPLETED A QUESTIONNAIRE]. Is there another adult in your household who has not yet completed the survey? If so, please remind them that they can also take part in the survey. Thank you! If you have any questions, please visit our survey website: www.foodandyou2.org or contact us using the details below Email: [email protected]. Telephone helpline: 0800 014 9467
Ipsos MORI’s standards and accreditations Ipsos MORI’s standards and accreditations provide our clients with the peace of mind that they can always depend on us to deliver reliable, sustainable findings. Our focus on quality and continuous improvement means we have embedded a ‘right first time’ approach throughout our organisation.
ISO 20252 This is the international market research specific standard that supersedes BS 7911/MRQSA and incorporates IQCS (Interviewer Quality Control Scheme). It covers the five stages of a Market Research project. Ipsos MORI was the first company in the world to gain this accreditation.
ISO 27001 This is the international standard for information security designed to ensure the selection of adequate and proportionate security controls. Ipsos MORI was the first research company in the UK to be awarded this in August 2008.
ISO 9001 This is the international general company standard with a focus on continual improvement through quality management systems. In 1994, we became one of the early adopters of the ISO 9001 business standard.
Market Research Society (MRS) Company Partnership By being an MRS Company Partner, Ipsos MORI endorses and supports the core MRS brand values of professionalism, research excellence and business effectiveness, and commits to comply with the MRS Code of Conduct throughout the organisation.
Data Protection Act 2018 Ipsos MORI is required to comply with the Data Protection Act 2018. It covers the processing of personal data and the protection of privacy.
For more information 3 Thomas More Square London E1W 1YW
t: +44 (0)20 3059 5000
Visit Ipsos MORI’s website Visit Ipsos MORI on twitter
About Ipsos MORI Public Affairs Ipsos MORI Public Affairs works closely with national governments, local public services and the not-for-profit sector. Its c.200 research staff focus on public service and policy issues. Each has expertise in a particular part of the public sector, ensuring we have a detailed understanding of specific sectors and policy challenges. Combined with our methods and communications expertise, this helps ensure that our research makes a difference for decision makers and communities.
Copyright © 2022 FDOKUMEN