Follow-Up Study to Assess the Use and Performance of Household Filters in Zambia
10
PELETZ AND OTHERS FOLLOW-UP OF HOUSEHOLD FILTER RCT IN ZAMBIA Follow-Up Study to Assess the Use and Performance of Household Filters in Zambia Rachel Peletz,* Michelo Simuyandi, Martin Simunyama, Kelvin Sarenje, Paul Kelly, and Thomas Clasen London School of Hygiene and Tropical Medicine, London, United Kingdom; Tropical Gastroenterology and Nutrition Group, University Teaching Hospital, Lusaka, Zambia; Barts and The London School of Medicine, Queen Mary, University of London, London, United Kingdom * Address correspondence to Rachel Peletz, London School of Hygiene and Tropical Medicine, Keppel Street, London WC1E 7HT, United Kingdom. E-mail: [email protected] Abstract. Effective household water treatment can improve drinking water quality and prevent disease if used correctly and consistently over time. One year after completion of a randomized controlled study of water filters among households in Zambia with children < 2 years old and mothers who were human immunodeficiency virus-positive, we conducted a follow-up study to assess use and performance of new filters distributed at the conclusion of the study; 90% of participating households met the criteria for current users, and 75% of participating households had stored water with lower levels of fecal contamination than source water. Microbiologically, the filters continued to perform well, removing an average of 99.0% of fecal indicator bacteria. Although this study provides some encouraging evidence about the potential to maintain high uptake and filter performance, even in the absence of regular household visits, additional research is necessary to assess whether these results can be achieved over longer periods and with larger populations. INTRODUCTION Unsafe drinking water is a major cause of diarrheal death and disease, especially for young children in low-income countries and people living with human immunodeficiency virus (HIV)/acquired immunodeficiency syndrome (PLHIV). 1,2 Diarrheal disease and unsafe drinking water may be particularly debilitating for young children born to HIV-positive mothers. 3–5 Our previous research in Zambia found that children < 2 years old born to HIV-positive mothers are particularly at risk of diarrheal disease. 6 Improving household drinking water quality through household water treatment and safe storage (HWTS) has been shown to have the potential to significantly reduce diarrheal disease. 7–9 However, although research has shown the need for consistent use of these interventions, 10,11 there are questions about whether HWTS interventions are used correctly and consistently over an extended period of time. 12,13 Overall, there is limited follow-up data on randomized controlled trials (RCTs), and existing evidence suggests that HWTS use and health impact may decline over time. 7,14 We previously undertook a 1-year RCT in Chongwe District, Zambia, to assess the HWTS filtration technology LifeStraw Family Filter combined with two 5-L local jerry cans for safe storage. 15 In the RCT, filter use was high, with 96% of household visits meeting the criteria for users. The filters were also microbiologically effective, reducing thermotolerant coliforms (TTCs; a fecal indicator) by 99.4% and providing intervention households with significantly improved water quality compared with control households (geometric mean of 3 versus 181 TTC per 100 mL, respectively; P < 0.001). At the end of the RCT in August of 2011, the control group received filters In order to provide our readers with timely access to new content, papers accepted by the American Journal of Tropical Medicine and Hygiene are posted online ahead of print publication. Papers that have been accepted for publication are peer-reviewed and copy edited but do not incorporate all corrections or constitute the final versions that will appear in the Journal. Final, corrected papers will be published online concurrent with the release of the print issue. http://ajtmh.org/cgi/doi/10.4269/ajtmh.13-0054 The latest version is at Accepted for Publication, Published online October 7, 2013; doi:10.4269/ajtmh.13-0054. Copyright 2013 by the American Society of Tropical Medicine and Hygiene
Transcript of Follow-Up Study to Assess the Use and Performance of Household Filters in Zambia
PELETZ AND OTHERS
FOLLOW-UP OF HOUSEHOLD FILTER RCT IN ZAMBIA
Follow-Up Study to Assess the Use and Performance of Household
Filters in Zambia
Rachel Peletz,* Michelo Simuyandi, Martin Simunyama, Kelvin Sarenje, Paul Kelly,
and Thomas Clasen
London School of Hygiene and Tropical Medicine, London, United Kingdom; Tropical
Gastroenterology and Nutrition Group, University Teaching Hospital, Lusaka, Zambia; Barts and The
London School of Medicine, Queen Mary, University of London, London, United Kingdom
* Address correspondence to Rachel Peletz, London School of Hygiene and Tropical Medicine, Keppel Street,
London WC1E 7HT, United Kingdom. E-mail: [email protected]
Abstract.
Effective household water treatment can improve drinking water quality and prevent disease if used
correctly and consistently over time. One year after completion of a randomized controlled study of
water filters among households in Zambia with children < 2 years old and mothers who were human
immunodeficiency virus-positive, we conducted a follow-up study to assess use and performance of
new filters distributed at the conclusion of the study; 90% of participating households met the criteria
for current users, and 75% of participating households had stored water with lower levels of fecal
contamination than source water. Microbiologically, the filters continued to perform well, removing an
average of 99.0% of fecal indicator bacteria. Although this study provides some encouraging evidence
about the potential to maintain high uptake and filter performance, even in the absence of regular
household visits, additional research is necessary to assess whether these results can be achieved over
longer periods and with larger populations.
INTRODUCTION
Unsafe drinking water is a major cause of diarrheal death and disease, especially
for young children in low-income countries and people living with human
immunodeficiency virus (HIV)/acquired immunodeficiency syndrome (PLHIV).1,2
Diarrheal disease and unsafe drinking water may be particularly debilitating for young
children born to HIV-positive mothers.3–5
Our previous research in Zambia found that
children < 2 years old born to HIV-positive mothers are particularly at risk of
diarrheal disease.6
Improving household drinking water quality through household water treatment
and safe storage (HWTS) has been shown to have the potential to significantly reduce
diarrheal disease.7–9
However, although research has shown the need for consistent
use of these interventions,10,11
there are questions about whether HWTS interventions
are used correctly and consistently over an extended period of time.12,13
Overall, there
is limited follow-up data on randomized controlled trials (RCTs), and existing
evidence suggests that HWTS use and health impact may decline over time.7,14
We previously undertook a 1-year RCT in Chongwe District, Zambia, to assess
the HWTS filtration technology LifeStraw Family Filter combined with two 5-L local
jerry cans for safe storage.15
In the RCT, filter use was high, with 96% of household
visits meeting the criteria for users. The filters were also microbiologically effective,
reducing thermotolerant coliforms (TTCs; a fecal indicator) by 99.4% and providing
intervention households with significantly improved water quality compared with
control households (geometric mean of 3 versus 181 TTC per 100 mL, respectively; P
< 0.001). At the end of the RCT in August of 2011, the control group received filters
In order to provide our readers with timely access to new content, papers accepted by the American Journal of Tropical Medicine and Hygiene are posted online ahead of print publication. Papers that have been accepted for publication are peer-reviewed and copy edited but do not incorporate all corrections or constitute the final versions that will appear in the Journal. Final, corrected papers will be published online concurrent with the release of the print issue.
http://ajtmh.org/cgi/doi/10.4269/ajtmh.13-0054The latest version is at Accepted for Publication, Published online October 7, 2013; doi:10.4269/ajtmh.13-0054.
Copyright 2013 by the American Society of Tropical Medicine and Hygiene
and storage containers along with the manufacturer’s instructions for use and
maintenance; the intervention group was also given the option to have their filter
replaced with a new one, and all but two households chose to receive new filters.
We undertook this follow-up study to assess filter use and microbiological
performance 1 year after completion of the study.
METHODS
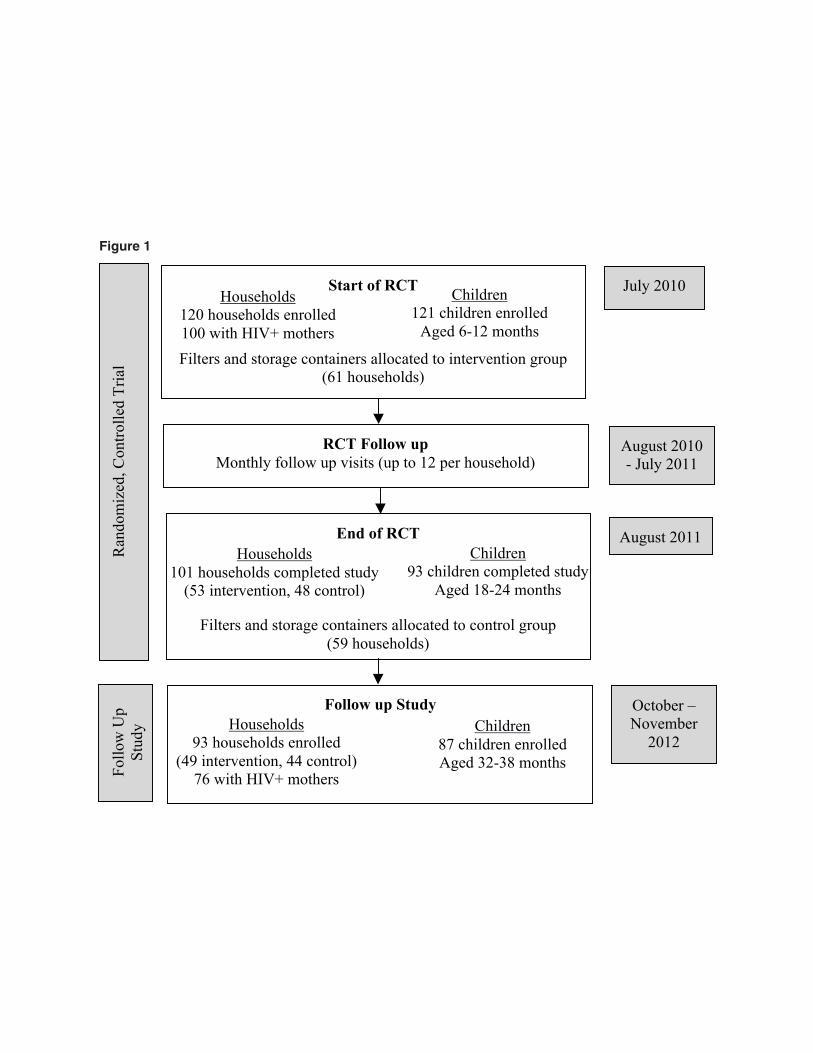
Study population and recruitment.
All 101 study households that completed the RCT were eligible to participate in
the follow-up study. We recruited participants by visiting the households previously
enrolled in the RCT, providing complete details regarding the follow-up study, and
asking for written consent. Participating households received one unannounced visit
during October and November of 2012 (Figure 1), just over 1 year after completion of
the RCT. Neither the research team nor to our knowledge, anyone else had any other
contact with study participants concerning filter use during this 1-year period,
although some of the RCT fieldworkers continued to reside and work in the project
area after the project was terminated.
Filter use and acceptability.
Filter use and acceptability were assessed using household questionnaires and
observations similar to those household questionnaires and observations used in the
RCT. Households were classified as reported users if all three of the following
conditions were met: (1) the filter was observed in the household at the time of visit,
(2) the storage vessel contained water reported to be treated at the time of visit, and
(3) the respondent reported using the filter on the day of or day before the day of visit.
Households were classified as confirmed users if, in addition to these three criteria,
there was at least a 1 log10 (90%) improvement in TTC in their stored household
water over their unfiltered water or stored water quality was < 10 TTC/100 mL.
Exclusive users were those users who did not drinking any unfiltered water the day of
and day before the visit, which was reported by the mother. We used 2 tests to
examine associations between household use and demographics, including
socioeconomic status, household size, mother’s education, mother’s age, mother’s
marital status, mother on antiretroviral therapy, water source, sanitation facility, and
soap present (cofactors were defined as previously described15
).
Flow rate.
We also measured flow rate from the filters to see if they had been impacted by
use over time. Flow rate was assessed by filling the filter to the fill line, opening the
tap, and measuring the time that it took to yield 100 mL. The design rate is 150
mL/minute (9.0 L/hour). Previous laboratory testing showed a mean flow rate of 146
mL/minute (8.8 L/hour) over 20,000 L.16
Microbiological performance.
Filter performance was evaluated through bacteriological water testing using the
same sampling and analytical methods used in the RCT. For each household, samples
were collected of (1) unfiltered water stored in the home (influent water), (2) filtered
water immediately after filtration (effluent water), and (3) stored water that the
household reported to be filtered, if available. For 4.1% (11/267) of plates that were
too numerous to count (TNTC), we ascribed a value of 500 coliform-forming units
(CFUs) per 100 mL (the upper detection limit).
Data analysis.
Data was entered into Excel and analyzed using Stata12. To assess filter use, data
were tabulated by RCT group to examine whether there was a difference between our
original control and intervention households. To assess filter performance, TTC
counts were normalized with log10 transformations; a value of one was added to all
TTC levels before transformation to account for samples with TTC values of zero
(log10 [TTC level + 1]). Microbiological filter performance was calculated as the
difference of the log10 of the influent concentration and log10 of the effluent
concentration. Differences in mean TTC counts and use by RCT group were assessed
for significance using paired Student t tests.
Ethics.
Ethical approval for this follow-up study was obtained from the Ethics Committee
of the University of Zambia. Ethical approval from London School of Hygiene and
Tropical Medicine was covered under our RCT ethical approval. Informed written
consent was obtained from all participants.
RESULTS
Study population.
Of 101 possible households that completed the RCT, 93 (92%) households
participated in the follow-up study. Six former participants had moved, one mother
had died, and one mother refused. In total, 93 households included 495 individuals, 76
households with HIV-positive mothers, and 87 children from the original RCT (age
32–38 months at the time of follow-up). Participating households included 49 of 53
potential households from the RCT intervention group and 44 of 48 potential
households from the control group. Details on demographics are reported with the
RCT results.15
The follow-up study cohort was comparable with the RCT cohort on
demographic characteristics; however, the follow-up study cohort had a larger
percentage of households using unprotected dug wells (72.2% versus 51.7%). Water
sources were primarily unprotected dug wells (72.2%, 65/90), although other sources
included public taps (17.8%, 16/90), boreholes (8.9%, 8/90), and private taps (1.1%,
1/90; data missing for three households). New filters had been received by 97.8%
(91/93) of households in August of 2011 at the end of the RCT (Figure 1). Two
households in the intervention group elected to keep the filter that they used during
the trial rather than have it replaced (received July of 2010).
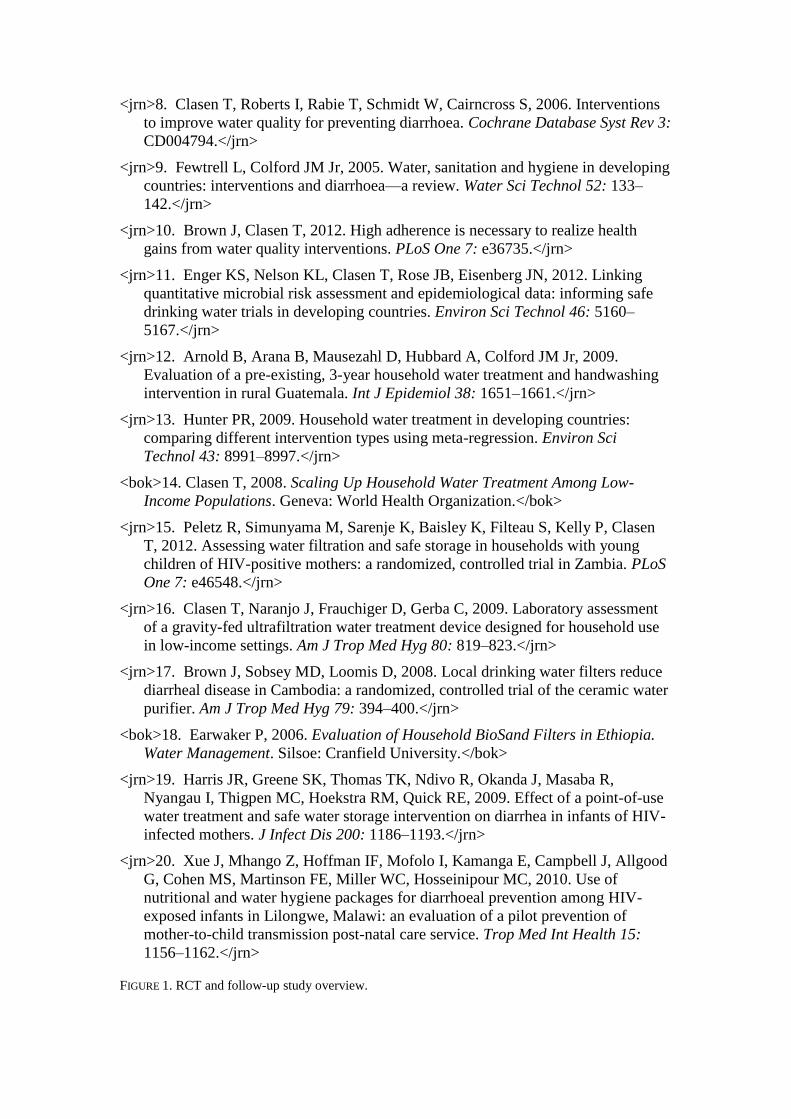
Filter use and acceptability and flow rate.
Most households were using the filters (Table 1). Reported use did not vary
significantly between the RCT intervention and control groups (P = 0.40), although
confirmed use was of borderline significance (P = 0.08). Overall, 90.3% (84/93) of
households were classified as reported users, and 72.0% (67/93) of households were
classified as confirmed users. If we restrict our definition of confirmed users to only
those users who had at least 1 log10 removal, 64.5% (60/93) of households would still
be considered confirmed users. For households that did not meet the criteria of

confirmed users, 10.8% (10/93) of households had stored water of somewhat better
water quality compared with unfiltered water (< 1 log10).
Five households (5.4%) did not have the filter set up for use at the time of visit;
two households reported that they did not have time to filter, one household head
reported that she had been away from home, one filter was rendered inoperable by
rats, and one household head had given the filter to a neighbor for safe keeping. With
the exception of these five households, all reported that everyone drinks filtered water
when at home. Only 2 (2.2%) of 93 filters had problems. Both had parts that were
eaten by rats, although one filter was still functional. No households reported
clogging problems.
Exclusive use was reported by 87.1% (81/93) of mothers, and exclusive use was
reported for 86.2% (75/87) of children. Reasons for drinking unfiltered water were
that they were away from home (eight households), they did not have time to filter
(three households), or the filter was not working (one household). Only 3.2% (3/93)
of households reported that anyone in the household took water to school or work.
The storage containers provided during the RCT were used in 70.5% (65/93) of
households; however, they were capped in only 52.7% (49/93) of households. Capped
storage containers were less common in households that had the containers for 2 years
(45% in the RCT intervention group) compared with households that had the
containers for 1 year (61% in the RCT control group; P = 0.11). Reported reasons for
not using the storage containers were that the container was stolen (12 households),
was broken (8 households), did not provide enough water (2 households), was used
for other purposes (1 household), was lent to neighbor/family (1 household), was
eaten by rats (1 household), and was lost (1 household; data missing for 2
households). All 28 households not using the provided storage containers were storing
water in buckets and obtaining water by dipping cups.
When examining cofactors associated with use, larger households (more than six
members) were more likely to be reported users (100% [36/36], P = 0.008) and
confirmed users (86.1% [31/36], P = 0.011) compared with smaller households
(82.5% [47/57] and 61.4% [35/57], respectively). Households with unimproved water
sources were more likely to be confirmed users (76.9% [50/65] versus 52% [13/25], P
= 0.021) but not reported users (P = 0.36). Mother’s education level was borderline
significant with capped storage container use (P = 0.065).
The flow rate was an average (median) of 87 mL/minute (5.2 L/hour) and ranged
from 35 mL/minute (2.1 L/hour) to 285 mL/minute (17.1 L/hour).
Water quality.
Unfiltered water samples were collected in all households; filtered samples and
stored filtered samples were each collected in 93.5% (87/93) of households. Water
quality did not vary significantly between RCT intervention and control groups for
unfiltered water (P = 0.26), filtered water (P = 0.54), or stored filtered water (P =
0.15); therefore, combined results are presented (Table 2).
Overall, 75.3% (70/93) of households had stored water of somewhat better water
quality compared with unfiltered water. Water quality was significantly better in
filtered samples (geometric mean of 1.7 TTC/100 mL, P < 0.0001) and stored filtered
samples (geometric mean of 6.1 TTC/100 mL, P < 0.0001) compared with unfiltered
samples (geometric mean of 166 TTC/100 mL). However, stored filtered samples
were significantly more contaminated compared with filtered samples (geometric
mean of 6.1 versus 1.7 TTC/100 mL, respectively; P < 0.0001). The geometric mean
removal from influent (unfiltered) to effluent (filtered) was 2.0 log10 TTC/100 mL
(95% confidence interval [95% CI] = 1.8–2.2 log10 TTC/100 mL), corresponding to a
99.0% (95% CI = 98.3%–99.4%) reduction.
DISCUSSION
In a follow-up study among households that received water filters more than 1
year before participation in an RCT, 9 of 10 households were using the filters, and 7
of 10 households benefited from improved drinking quality. More than 8 in 10 of
mothers reported that they and their children drank treated water exclusively,
although this measure had no objective indicator and is subject to reporting bias.
These rates are comparable with the rates observed among the intervention
households in the RCT, despite the lack of the regular household visits by
investigators that took place during the trial.15
We found no difference in filter use or
performance among members of RCT study arms, suggesting that uptake was strong,
even among households using filters for more than 2 years. However, confirmed use
was lower in the RCT intervention arm, although results were of borderline
significance (P = 0.08). Although flow rates suggest that filters were still capable of
meeting the volume requirements for household drinking water, flow rates were lower
than design or laboratory results, a possible indication of suboptimal backwashing or
partial clogging in some cases. Microbiologically, the filters continued to perform
well, removing an average of 99.0% of fecal indicator bacteria compared with 99.4%
of fecal indicator bacteria in the RCT.
Larger households (more than six members) were more likely to be users; it is
possible that larger households had more people to contribute to the activity of
filtering water. Households with unimproved water sources were more likely to be
confirmed users but not reported users; however, this finding may be because
households with poorer water quality were more likely to meet the criterion of at least
a 1 log10 (90%) improvement in TTC in their stored household water over their
unfiltered water.
There was a decline in storage container use compared with results during the
RCT; 71% of households reported using the provided storage containers, and only
53% of households capped the provided containers (100% and 98% at the final RCT
visit, respectively). Because safe storage is essential to maintain the microbiological
quality of filter water that does not have a residual disinfectant, it is possible that
some households that were using the filter did not meet the water quality criterion for
confirmed users. The lower use of capped containers in the RCT intervention group
compared with the RCT control group indicates a decline in use over time.
Other HWTS programs have found a decline in use over time. An evaluation of a
household chlorination intervention found that reporting household water treatment
dropped from 70% at the end of the intervention to 37% 6 months later.12
However,
there is some evidence that use is particularly high for filtration compared with other
HWTS technologies13,17
; in a follow-up project of biosand filters at least 5 years old,
use was found to be 70%.18
Furthermore, use may be particularly high among HIV-
positive mothers with young children because of increased concern and awareness of
health; chlorination use has been found to be high among similar populations.19,20
It is
also possible that filter use was higher, because local health staff used during the RCT
continued to reside and work in the project areas after that RCT terminated.
Evidence suggests that the potential health benefits offered by effective HWTS
are not possible in the absence of correct, consistent, and sustained use of HWTS.
This follow-up study provides some encouraging evidence about the potential to
maintain high uptake and filter performance, even in the absence of regular household
contact by researchers or implementers. Because the filters were designed to be used
for at least 3 years, it would be valuable to conduct additional follow-up studies of
this population. Additional research is necessary to assess whether these results can be
achieved over longer periods and with larger populations.
Received January 27, 2013.
Accepted for publication August 29, 2013.
Acknowledgments:
The authors thank Ngwerere and Kasisi health clinics for their assistance in locating the participants.
We also thank Agatha Muyenga for her project accounting and logistical support. This project would
not have been possible without the women and children who contributed to this study.
Financial support: This research was funded in part by Vestergaard-Frandsen SA, the manufacturer of
the LifeStraw Family Filter used in the intervention.
Disclaimer: R.P. and T.C. have performed research and consulting services for Vestergaard-Frandsen.
Vestergaard-Frandsen had no role in study design, data collection and analysis, decision to publish, or
preparation of the manuscript.
Authors’ addresses: Rachel Peletz, London School of Hygiene and Tropical Medicine, London, United
Kingdom, E-mail: [email protected]. Michelo Simuyandi, Martin Simunyama, Kelvin Sarenje,
Paul Kelly, and Thomas Clasen, XXXXXX.
REFERENCES
<jrn>1. Mermin J, Lule J, Ekwaru JP, Malamba S, Downing R, Ransom R, Kaharuza
F, Culver D, Kizito F, Bunnell R, Kigozi A, Nakanjako D, Wafula W, Quick R,
2004. Effect of co-trimoxazole prophylaxis on morbidity, mortality, CD4-cell
count, and viral load in HIV infection in rural Uganda. Lancet 364: 1428–
1434.</jrn>
<jrn>2. Stark D, Barratt JL, van Hal S, Marriott D, Harkness J, Ellis JT, 2009.
Clinical significance of enteric protozoa in the immunosuppressed human
population. Clin Microbiol Rev 22: 634–650.</jrn>
<jrn>3. Filteau S, 2009. The HIV-exposed, uninfected African child. Trop Med Int
Health 14: 276–287.</jrn>
<jrn>4. Makasa M, Kasonka L, Chisenga M, Sinkala M, Chintu C, Tomkins A,
Filteau S, 2007. Early growth of infants of HIV-infected and uninfected Zambian
women. Trop Med Int Health 12: 594–602.</jrn>
<jrn>5. Omari AA, Luo C, Kankasa C, Bhat GJ, Bunn J, 2003. Infant-feeding
practices of mothers of known HIV status in Lusaka, Zambia. Health Policy Plan
18: 156–162.</jrn>
<jrn>6. Peletz R, Simuyandi M, Sarenje K, Baisley K, Kelly P, Filteau S, Clasen T,
2011. Drinking water quality, feeding practices, and diarrhea among children
under 2 years of HIV-positive mothers in peri-urban Zambia. Am J Trop Med Hyg
85: 318–326.</jrn>
<jrn>7. Waddington H, Snilstveit B, 2009. Effectiveness and sustainability of water,
sanitation, and hygiene interventions in combating diarrhoea. J Dev Effect 1: 295–
335.</jrn>
<jrn>8. Clasen T, Roberts I, Rabie T, Schmidt W, Cairncross S, 2006. Interventions
to improve water quality for preventing diarrhoea. Cochrane Database Syst Rev 3:
CD004794.</jrn>
<jrn>9. Fewtrell L, Colford JM Jr, 2005. Water, sanitation and hygiene in developing
countries: interventions and diarrhoea—a review. Water Sci Technol 52: 133–
142.</jrn>
<jrn>10. Brown J, Clasen T, 2012. High adherence is necessary to realize health
gains from water quality interventions. PLoS One 7: e36735.</jrn>
<jrn>11. Enger KS, Nelson KL, Clasen T, Rose JB, Eisenberg JN, 2012. Linking
quantitative microbial risk assessment and epidemiological data: informing safe
drinking water trials in developing countries. Environ Sci Technol 46: 5160–
5167.</jrn>
<jrn>12. Arnold B, Arana B, Mausezahl D, Hubbard A, Colford JM Jr, 2009.
Evaluation of a pre-existing, 3-year household water treatment and handwashing
intervention in rural Guatemala. Int J Epidemiol 38: 1651–1661.</jrn>
<jrn>13. Hunter PR, 2009. Household water treatment in developing countries:
comparing different intervention types using meta-regression. Environ Sci
Technol 43: 8991–8997.</jrn>
<bok>14. Clasen T, 2008. Scaling Up Household Water Treatment Among Low-
Income Populations. Geneva: World Health Organization.</bok>
<jrn>15. Peletz R, Simunyama M, Sarenje K, Baisley K, Filteau S, Kelly P, Clasen
T, 2012. Assessing water filtration and safe storage in households with young
children of HIV-positive mothers: a randomized, controlled trial in Zambia. PLoS
One 7: e46548.</jrn>
<jrn>16. Clasen T, Naranjo J, Frauchiger D, Gerba C, 2009. Laboratory assessment
of a gravity-fed ultrafiltration water treatment device designed for household use
in low-income settings. Am J Trop Med Hyg 80: 819–823.</jrn>
<jrn>17. Brown J, Sobsey MD, Loomis D, 2008. Local drinking water filters reduce
diarrheal disease in Cambodia: a randomized, controlled trial of the ceramic water
purifier. Am J Trop Med Hyg 79: 394–400.</jrn>
<bok>18. Earwaker P, 2006. Evaluation of Household BioSand Filters in Ethiopia.
Water Management. Silsoe: Cranfield University.</bok>
<jrn>19. Harris JR, Greene SK, Thomas TK, Ndivo R, Okanda J, Masaba R,
Nyangau I, Thigpen MC, Hoekstra RM, Quick RE, 2009. Effect of a point-of-use
water treatment and safe water storage intervention on diarrhea in infants of HIV-
infected mothers. J Infect Dis 200: 1186–1193.</jrn>
<jrn>20. Xue J, Mhango Z, Hoffman IF, Mofolo I, Kamanga E, Campbell J, Allgood
G, Cohen MS, Martinson FE, Miller WC, Hosseinipour MC, 2010. Use of
nutritional and water hygiene packages for diarrhoeal prevention among HIV-
exposed infants in Lilongwe, Malawi: an evaluation of a pilot prevention of
mother-to-child transmission post-natal care service. Trop Med Int Health 15:
1156–1162.</jrn>
FIGURE 1. RCT and follow-up study overview.
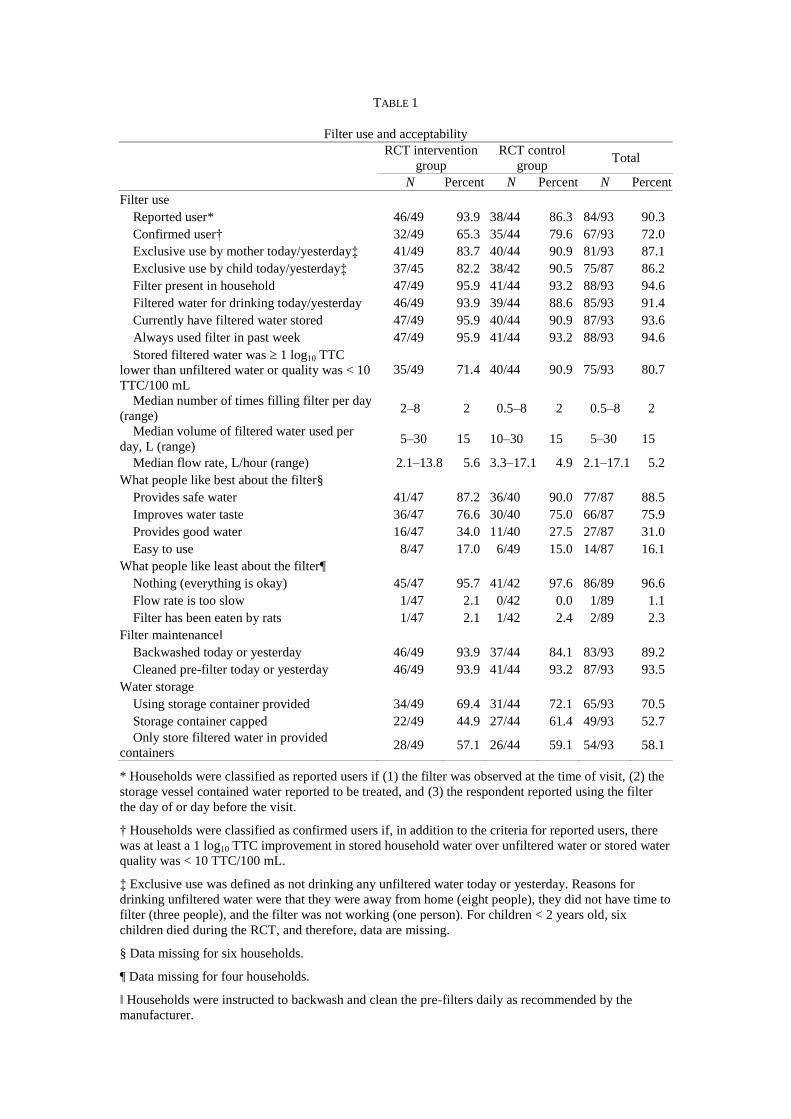
TABLE 1
Filter use and acceptability
RCT intervention
group
RCT control
group Total
N Percent N Percent N Percent
Filter use
Reported user* 46/49 93.9 38/44 86.3 84/93 90.3
Confirmed user† 32/49 65.3 35/44 79.6 67/93 72.0
Exclusive use by mother today/yesterday‡
41/49 83.7 40/44 90.9 81/93 87.1
Exclusive use by child today/yesterday‡ 37/45 82.2 38/42 90.5 75/87 86.2
Filter present in household 47/49 95.9 41/44 93.2 88/93 94.6
Filtered water for drinking today/yesterday 46/49 93.9 39/44 88.6 85/93 91.4
Currently have filtered water stored 47/49 95.9 40/44 90.9 87/93 93.6
Always used filter in past week 47/49 95.9 41/44 93.2 88/93 94.6
Stored filtered water was 1 log10 TTC
lower than unfiltered water or quality was < 10
TTC/100 mL
35/49 71.4 40/44 90.9 75/93 80.7
Median number of times filling filter per day
(range) 2–8 2 0.5–8 2 0.5–8 2
Median volume of filtered water used per
day, L (range) 5–30 15 10–30 15 5–30 15
Median flow rate, L/hour (range) 2.1–13.8 5.6 3.3–17.1 4.9 2.1–17.1 5.2
What people like best about the filter§
Provides safe water 41/47 87.2 36/40 90.0 77/87 88.5
Improves water taste 36/47 76.6 30/40 75.0 66/87 75.9
Provides good water 16/47 34.0 11/40 27.5 27/87 31.0
Easy to use 8/47 17.0 6/49 15.0 14/87 16.1
What people like least about the filter¶
Nothing (everything is okay) 45/47 95.7 41/42 97.6 86/89 96.6
Flow rate is too slow 1/47 2.1 0/42 0.0 1/89 1.1
Filter has been eaten by rats 1/47 2.1 1/42 2.4 2/89 2.3
Filter maintenance‖
Backwashed today or yesterday 46/49 93.9 37/44 84.1 83/93 89.2
Cleaned pre-filter today or yesterday 46/49 93.9 41/44 93.2 87/93 93.5
Water storage
Using storage container provided 34/49 69.4 31/44 72.1 65/93 70.5
Storage container capped 22/49 44.9 27/44 61.4 49/93 52.7
Only store filtered water in provided
containers 28/49 57.1 26/44 59.1 54/93 58.1
* Households were classified as reported users if (1) the filter was observed at the time of visit, (2) the
storage vessel contained water reported to be treated, and (3) the respondent reported using the filter
the day of or day before the visit.
† Households were classified as confirmed users if, in addition to the criteria for reported users, there
was at least a 1 log10 TTC improvement in stored household water over unfiltered water or stored water
quality was < 10 TTC/100 mL.
‡ Exclusive use was defined as not drinking any unfiltered water today or yesterday. Reasons for
drinking unfiltered water were that they were away from home (eight people), they did not have time to
filter (three people), and the filter was not working (one person). For children < 2 years old, six
children died during the RCT, and therefore, data are missing.
§ Data missing for six households.
¶ Data missing for four households.
‖ Households were instructed to backwash and clean the pre-filters daily as recommended by the
manufacturer.
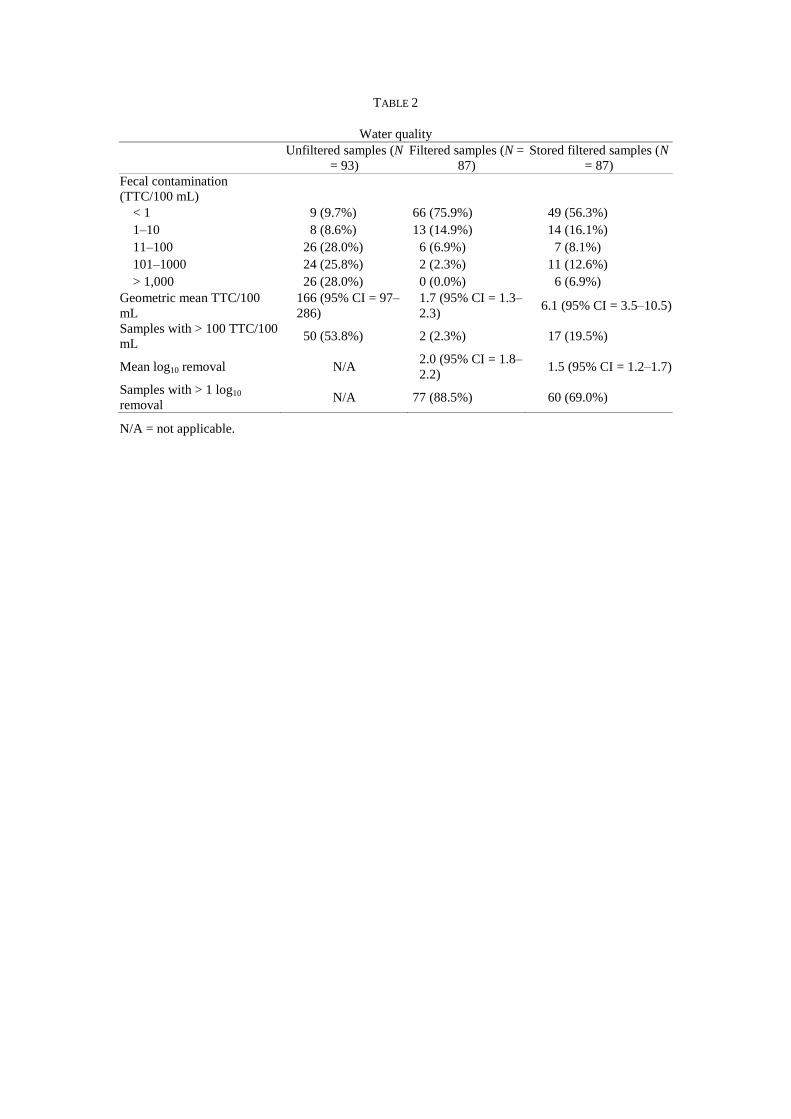
TABLE 2
Water quality
Unfiltered samples (N
= 93)
Filtered samples (N =
87)
Stored filtered samples (N
= 87)
Fecal contamination
(TTC/100 mL)
< 1 9 (9.7%) 66 (75.9%) 49 (56.3%)
1–10 8 (8.6%) 13 (14.9%) 14 (16.1%)
11–100 26 (28.0%) 6 (6.9%) 7 (8.1%)
101–1000 24 (25.8%) 2 (2.3%) 11 (12.6%)
> 1,000 26 (28.0%) 0 (0.0%) 6 (6.9%)
Geometric mean TTC/100
mL
166 (95% CI = 97–
286)
1.7 (95% CI = 1.3–
2.3) 6.1 (95% CI = 3.5–10.5)
Samples with > 100 TTC/100
mL 50 (53.8%) 2 (2.3%) 17 (19.5%)
Mean log10 removal N/A 2.0 (95% CI = 1.8–
2.2) 1.5 (95% CI = 1.2–1.7)
Samples with > 1 log10
removal N/A 77 (88.5%) 60 (69.0%)
N/A = not applicable.
Ran
dom
ized
, Con
trolle
d Tr
ial
Follo
w U
p St
udy
Start of RCT Filters and storage containers allocated to intervention group
(61 households)
RCT Follow up Monthly follow up visits (up to 12 per household)
End of RCT
Filters and storage containers allocated to control group
(59 households)
July 2010
August 2010 - July 2011
August 2011
October – November
2012
Households 120 households enrolled 100 with HIV+ mothers
Children 121 children enrolled
Aged 6-12 months
Children 93 children completed study
Aged 18-24 months
Follow up Study
Households
93 households enrolled (49 intervention, 44 control)
76 with HIV+ mothers
Children 87 children enrolled Aged 32-38 months
Households 101 households completed study
(53 intervention, 48 control)
Figure 1